Elfrida, AZ Map & Demographics
Elfrida Map
Elfrida Overview
$17,027
PER CAPITA INCOME
$62,578
AVG FAMILY INCOME
$26,250
AVG HOUSEHOLD INCOME
0.53
INEQUALITY / GINI INDEX
288
TOTAL POPULATION
76
MALE POPULATION
212
FEMALE POPULATION
35.85
MALES / 100 FEMALES
278.95
FEMALES / 100 MALES
43.4
MEDIAN AGE
3.6
AVG FAMILY SIZE
2.6
AVG HOUSEHOLD SIZE
101
LABOR FORCE [ PEOPLE ]
43.7%
PERCENT IN LABOR FORCE
5.0%
UNEMPLOYMENT RATE
Elfrida Zip Codes
Elfrida Area Codes
Income in Elfrida
Income Overview in Elfrida
Per Capita Income in Elfrida is $17,027, while median incomes of families and households are $62,578 and $26,250 respectively.
| Characteristic | Number | Measure |
| Per Capita Income | 288 | $17,027 |
| Median Family Income | 65 | $62,578 |
| Mean Family Income | 65 | $59,234 |
| Median Household Income | 112 | $26,250 |
| Mean Household Income | 112 | $42,679 |
| Income Deficit | 65 | $0 |
| Wage / Income Gap (%) | 288 | 0.00% |
| Wage / Income Gap ($) | 288 | 100.00¢ per $1 |
| Gini / Inequality Index | 288 | 0.53 |
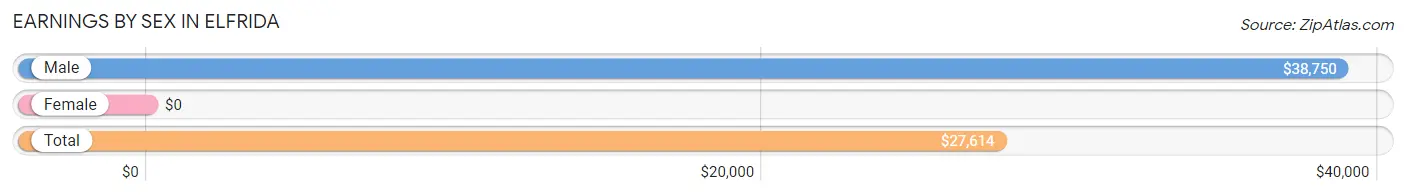
Earnings by Sex in Elfrida
| Sex | Number | Average Earnings |
| Male | 53 (52.5%) | $38,750 |
| Female | 48 (47.5%) | $0 |
| Total | 101 (100.0%) | $27,614 |
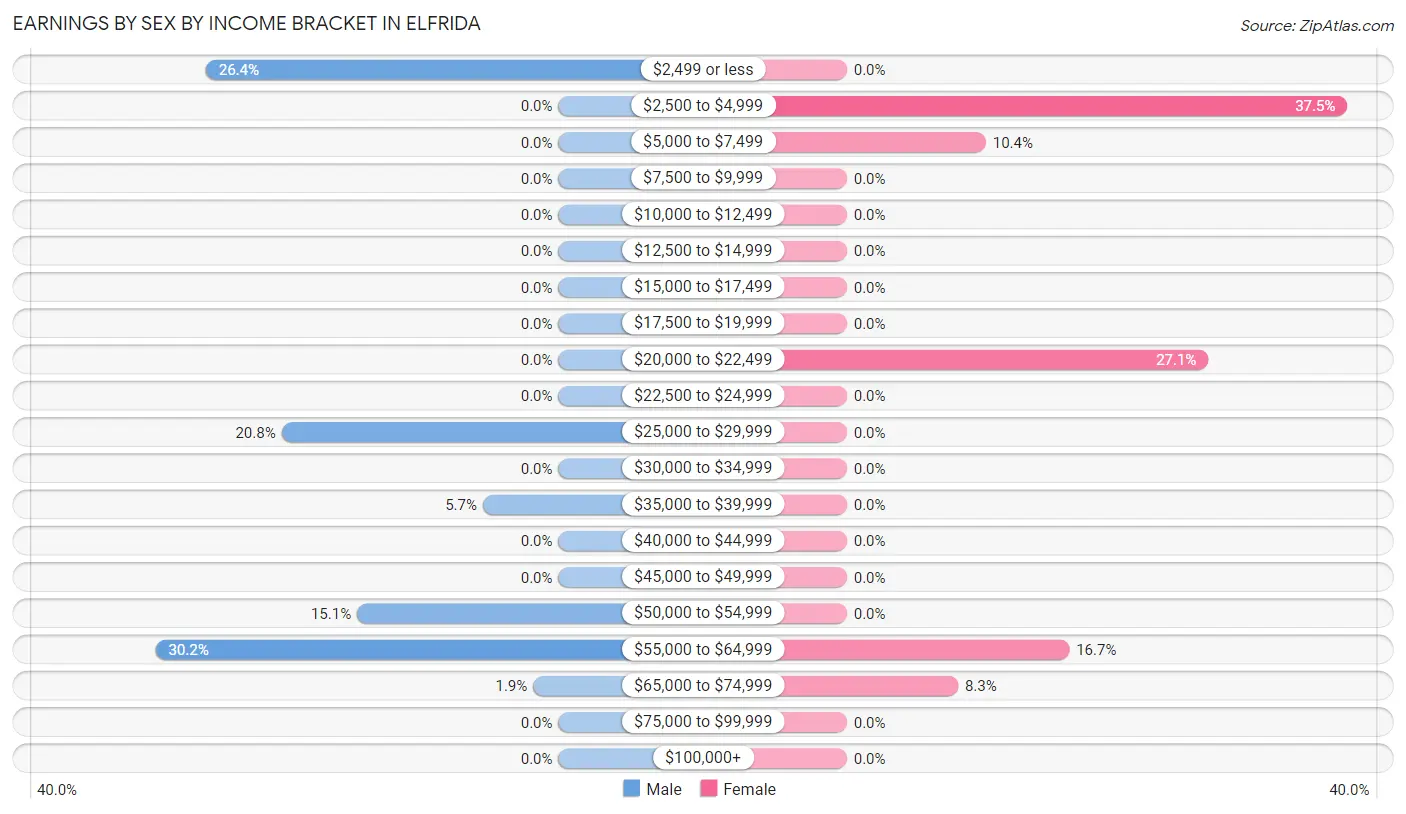
Earnings by Sex by Income Bracket in Elfrida
The most common earnings brackets in Elfrida are $55,000 to $64,999 for men (16 | 30.2%) and $2,500 to $4,999 for women (18 | 37.5%).
| Income | Male | Female |
| $2,499 or less | 14 (26.4%) | 0 (0.0%) |
| $2,500 to $4,999 | 0 (0.0%) | 18 (37.5%) |
| $5,000 to $7,499 | 0 (0.0%) | 5 (10.4%) |
| $7,500 to $9,999 | 0 (0.0%) | 0 (0.0%) |
| $10,000 to $12,499 | 0 (0.0%) | 0 (0.0%) |
| $12,500 to $14,999 | 0 (0.0%) | 0 (0.0%) |
| $15,000 to $17,499 | 0 (0.0%) | 0 (0.0%) |
| $17,500 to $19,999 | 0 (0.0%) | 0 (0.0%) |
| $20,000 to $22,499 | 0 (0.0%) | 13 (27.1%) |
| $22,500 to $24,999 | 0 (0.0%) | 0 (0.0%) |
| $25,000 to $29,999 | 11 (20.7%) | 0 (0.0%) |
| $30,000 to $34,999 | 0 (0.0%) | 0 (0.0%) |
| $35,000 to $39,999 | 3 (5.7%) | 0 (0.0%) |
| $40,000 to $44,999 | 0 (0.0%) | 0 (0.0%) |
| $45,000 to $49,999 | 0 (0.0%) | 0 (0.0%) |
| $50,000 to $54,999 | 8 (15.1%) | 0 (0.0%) |
| $55,000 to $64,999 | 16 (30.2%) | 8 (16.7%) |
| $65,000 to $74,999 | 1 (1.9%) | 4 (8.3%) |
| $75,000 to $99,999 | 0 (0.0%) | 0 (0.0%) |
| $100,000+ | 0 (0.0%) | 0 (0.0%) |
| Total | 53 (100.0%) | 48 (100.0%) |
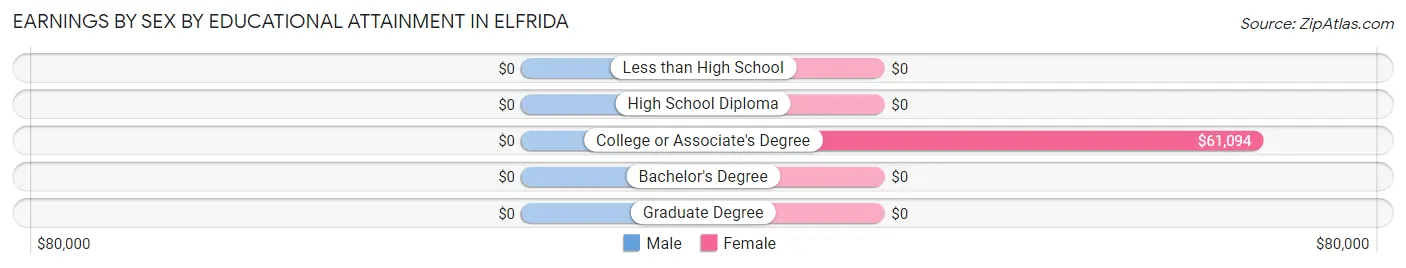
Earnings by Sex by Educational Attainment in Elfrida
| Educational Attainment | Male Income | Female Income |
| Less than High School | - | - |
| High School Diploma | - | - |
| College or Associate's Degree | - | - |
| Bachelor's Degree | - | - |
| Graduate Degree | - | - |
| Total | $57,734 | $61,094 |
Family Income in Elfrida
Family Income Brackets in Elfrida
According to the Elfrida family income data, there are 16 families falling into the $50,000 to $74,999 income range, which is the most common income bracket and makes up 24.6% of all families.
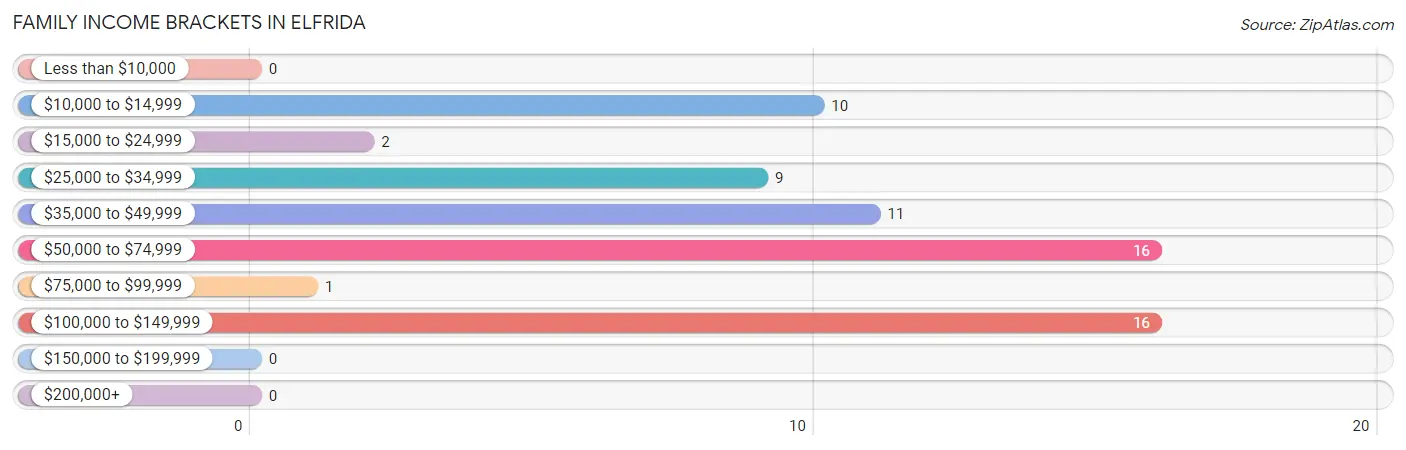
| Income Bracket | # Families | % Families |
| Less than $10,000 | 0 | 0.0% |
| $10,000 to $14,999 | 10 | 15.4% |
| $15,000 to $24,999 | 2 | 3.1% |
| $25,000 to $34,999 | 9 | 13.8% |
| $35,000 to $49,999 | 11 | 16.9% |
| $50,000 to $74,999 | 16 | 24.6% |
| $75,000 to $99,999 | 1 | 1.5% |
| $100,000 to $149,999 | 16 | 24.6% |
| $150,000 to $199,999 | 0 | 0.0% |
| $200,000+ | 0 | 0.0% |
Family Income by Famaliy Size in Elfrida
2-person families (41 | 63.1%) account for the highest median family income in Elfrida with $29,861 per family, while 2-person families (41 | 63.1%) have the highest median income of $14,930 per family member.
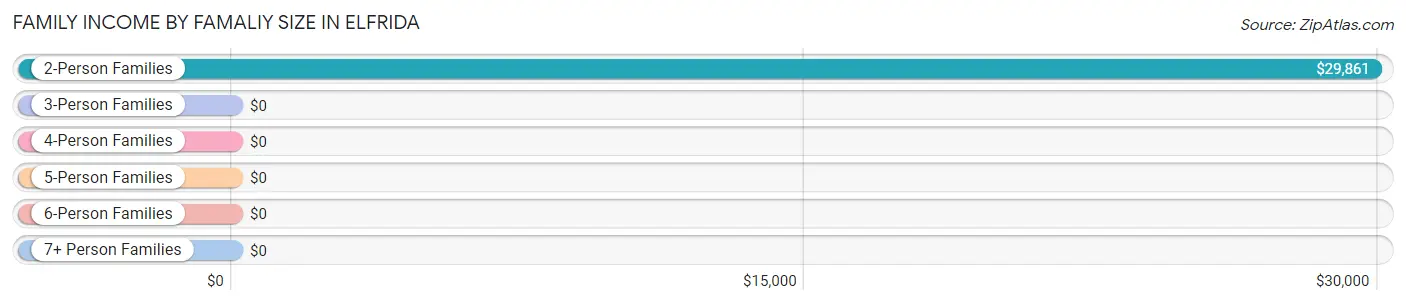
| Income Bracket | # Families | Median Income |
| 2-Person Families | 41 (63.1%) | $29,861 |
| 3-Person Families | 8 (12.3%) | $0 |
| 4-Person Families | 0 (0.0%) | $0 |
| 5-Person Families | 0 (0.0%) | $0 |
| 6-Person Families | 16 (24.6%) | $0 |
| 7+ Person Families | 0 (0.0%) | $0 |
| Total | 65 (100.0%) | $62,578 |
Family Income by Number of Earners in Elfrida
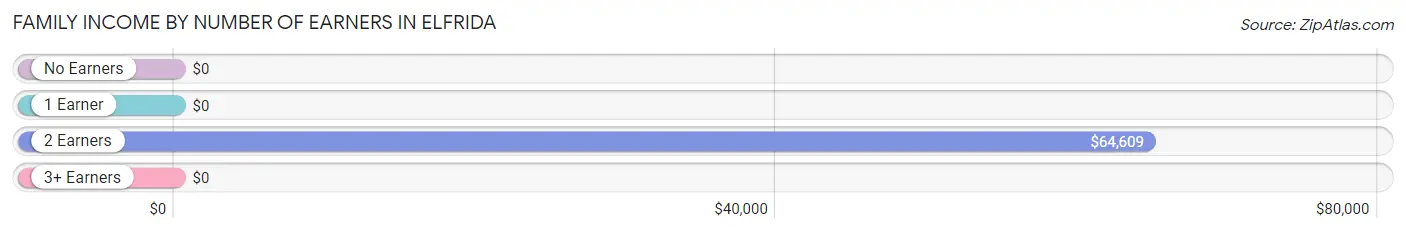
| Number of Earners | # Families | Median Income |
| No Earners | 16 (24.6%) | $0 |
| 1 Earner | 22 (33.9%) | $0 |
| 2 Earners | 27 (41.5%) | $64,609 |
| 3+ Earners | 0 (0.0%) | $0 |
| Total | 65 (100.0%) | $62,578 |
Household Income in Elfrida
Household Income Brackets in Elfrida
With 29 households falling in the category, the less than $10,000 income range is the most frequent in Elfrida, accounting for 25.9% of all households.
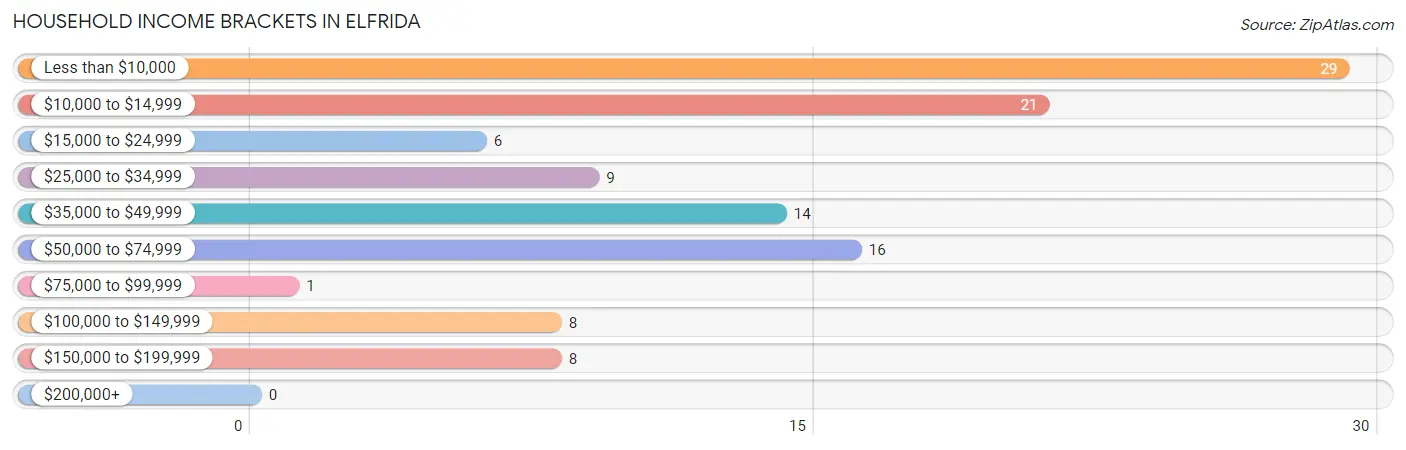
| Income Bracket | # Households | % Households |
| Less than $10,000 | 29 | 25.9% |
| $10,000 to $14,999 | 21 | 18.8% |
| $15,000 to $24,999 | 6 | 5.4% |
| $25,000 to $34,999 | 9 | 8.0% |
| $35,000 to $49,999 | 14 | 12.5% |
| $50,000 to $74,999 | 16 | 14.3% |
| $75,000 to $99,999 | 1 | 0.9% |
| $100,000 to $149,999 | 8 | 7.1% |
| $150,000 to $199,999 | 8 | 7.1% |
| $200,000+ | 0 | 0.0% |
Household Income by Householder Age in Elfrida
The median household income in Elfrida is $26,250, with the highest median household income of $24,167 found in the 65+ years age bracket for the primary householder. A total of 38 households (33.9%) fall into this category.
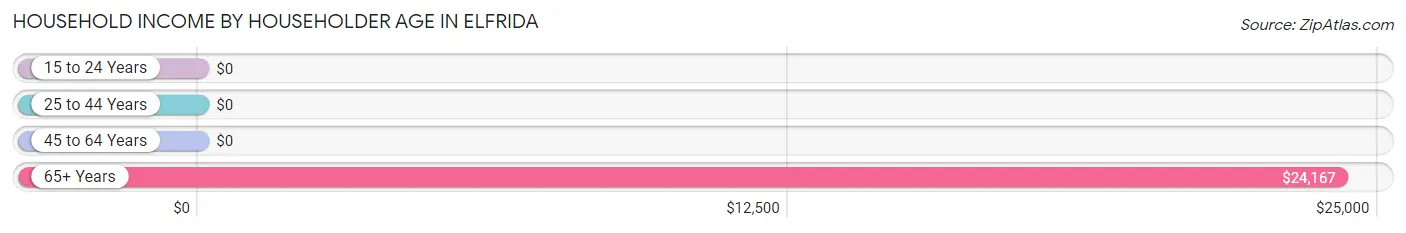
| Income Bracket | # Households | Median Income |
| 15 to 24 Years | 0 (0.0%) | $0 |
| 25 to 44 Years | 13 (11.6%) | $0 |
| 45 to 64 Years | 61 (54.5%) | $0 |
| 65+ Years | 38 (33.9%) | $24,167 |
| Total | 112 (100.0%) | $26,250 |
Poverty in Elfrida
Income Below Poverty by Sex and Age in Elfrida
With 18.4% poverty level for males and 23.6% for females among the residents of Elfrida, 18 to 24 year old males and 55 to 64 year old females are the most vulnerable to poverty, with 14 males (63.6%) and 25 females (92.6%) in their respective age groups living below the poverty level.
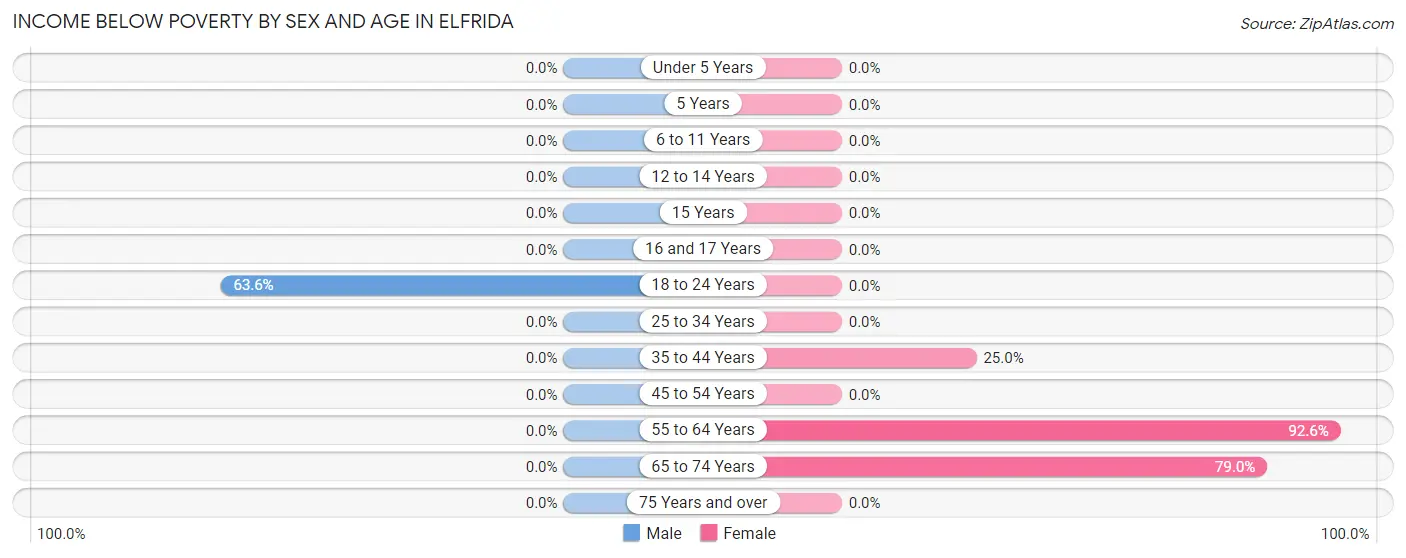
| Age Bracket | Male | Female |
| Under 5 Years | 0 (0.0%) | 0 (0.0%) |
| 5 Years | 0 (0.0%) | 0 (0.0%) |
| 6 to 11 Years | 0 (0.0%) | 0 (0.0%) |
| 12 to 14 Years | 0 (0.0%) | 0 (0.0%) |
| 15 Years | 0 (0.0%) | 0 (0.0%) |
| 16 and 17 Years | 0 (0.0%) | 0 (0.0%) |
| 18 to 24 Years | 14 (63.6%) | 0 (0.0%) |
| 25 to 34 Years | 0 (0.0%) | 0 (0.0%) |
| 35 to 44 Years | 0 (0.0%) | 10 (25.0%) |
| 45 to 54 Years | 0 (0.0%) | 0 (0.0%) |
| 55 to 64 Years | 0 (0.0%) | 25 (92.6%) |
| 65 to 74 Years | 0 (0.0%) | 15 (78.9%) |
| 75 Years and over | 0 (0.0%) | 0 (0.0%) |
| Total | 14 (18.4%) | 50 (23.6%) |
Income Above Poverty by Sex and Age in Elfrida
According to the poverty statistics in Elfrida, males aged 35 to 44 years and females aged under 5 years are the age groups that are most secure financially, with 100.0% of males and 100.0% of females in these age groups living above the poverty line.
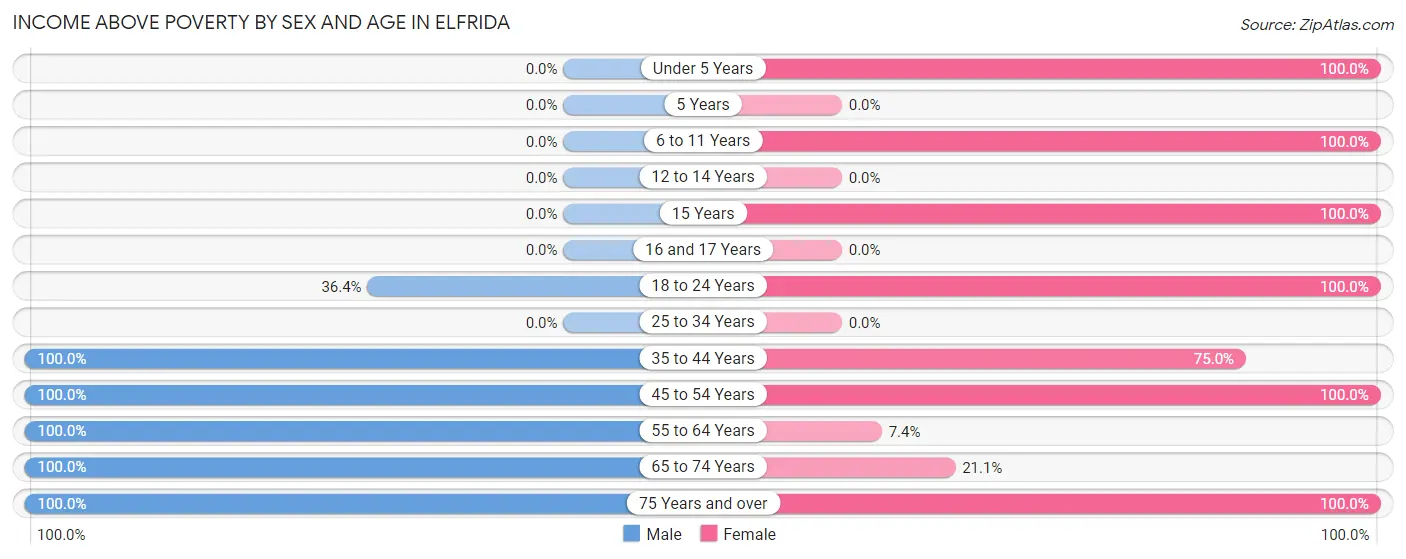
| Age Bracket | Male | Female |
| Under 5 Years | 0 (0.0%) | 21 (100.0%) |
| 5 Years | 0 (0.0%) | 0 (0.0%) |
| 6 to 11 Years | 0 (0.0%) | 19 (100.0%) |
| 12 to 14 Years | 0 (0.0%) | 0 (0.0%) |
| 15 Years | 0 (0.0%) | 17 (100.0%) |
| 16 and 17 Years | 0 (0.0%) | 0 (0.0%) |
| 18 to 24 Years | 8 (36.4%) | 31 (100.0%) |
| 25 to 34 Years | 0 (0.0%) | 0 (0.0%) |
| 35 to 44 Years | 3 (100.0%) | 30 (75.0%) |
| 45 to 54 Years | 16 (100.0%) | 22 (100.0%) |
| 55 to 64 Years | 12 (100.0%) | 2 (7.4%) |
| 65 to 74 Years | 14 (100.0%) | 4 (21.0%) |
| 75 Years and over | 9 (100.0%) | 16 (100.0%) |
| Total | 62 (81.6%) | 162 (76.4%) |
Income Below Poverty Among Married-Couple Families in Elfrida
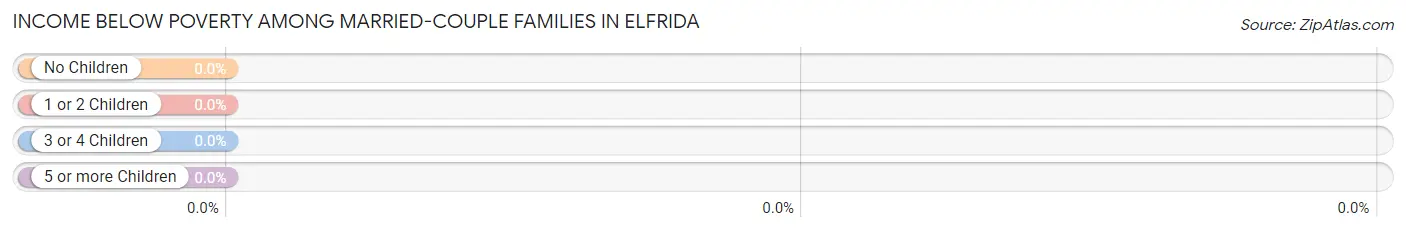
| Children | Above Poverty | Below Poverty |
| No Children | 39 (100.0%) | 0 (0.0%) |
| 1 or 2 Children | 0 (0.0%) | 0 (0.0%) |
| 3 or 4 Children | 16 (100.0%) | 0 (0.0%) |
| 5 or more Children | 0 (0.0%) | 0 (0.0%) |
| Total | 55 (100.0%) | 0 (0.0%) |
Income Below Poverty Among Single-Parent Households in Elfrida
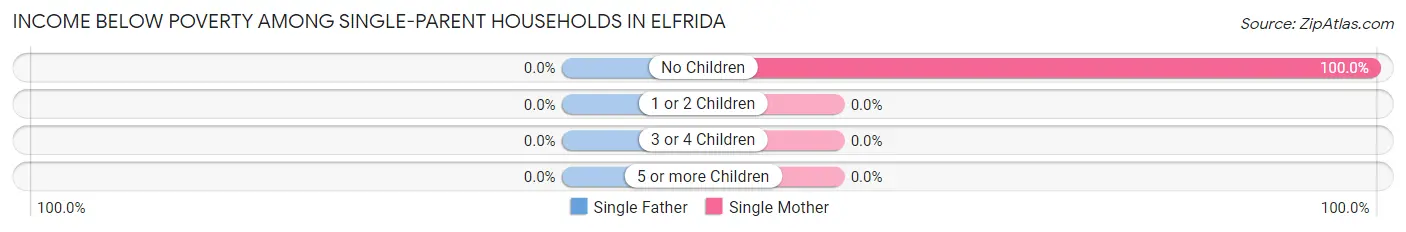
| Children | Single Father | Single Mother |
| No Children | 0 (0.0%) | 10 (100.0%) |
| 1 or 2 Children | 0 (0.0%) | 0 (0.0%) |
| 3 or 4 Children | 0 (0.0%) | 0 (0.0%) |
| 5 or more Children | 0 (0.0%) | 0 (0.0%) |
| Total | 0 (0.0%) | 10 (100.0%) |
Income Below Poverty Among Married-Couple vs Single-Parent Households in Elfrida
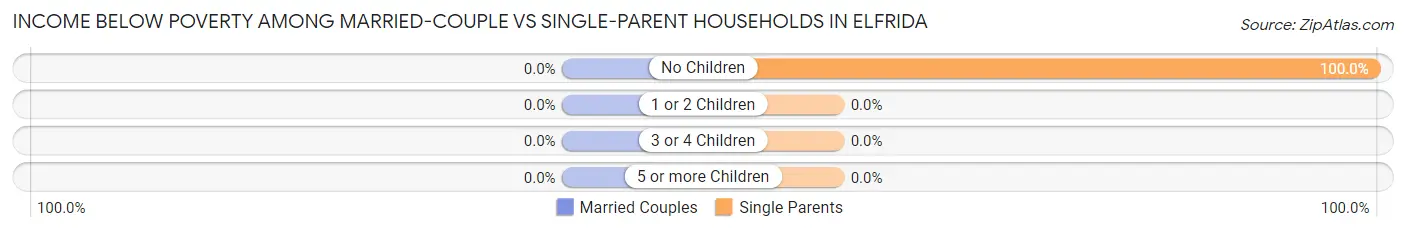
| Children | Married-Couple Families | Single-Parent Households |
| No Children | 0 (0.0%) | 10 (100.0%) |
| 1 or 2 Children | 0 (0.0%) | 0 (0.0%) |
| 3 or 4 Children | 0 (0.0%) | 0 (0.0%) |
| 5 or more Children | 0 (0.0%) | 0 (0.0%) |
| Total | 0 (0.0%) | 10 (100.0%) |
Race in Elfrida
The most populous races in Elfrida are White / Caucasian (261 | 90.6%), Hispanic or Latino (169 | 58.7%), and Two or more Races (27 | 9.4%).
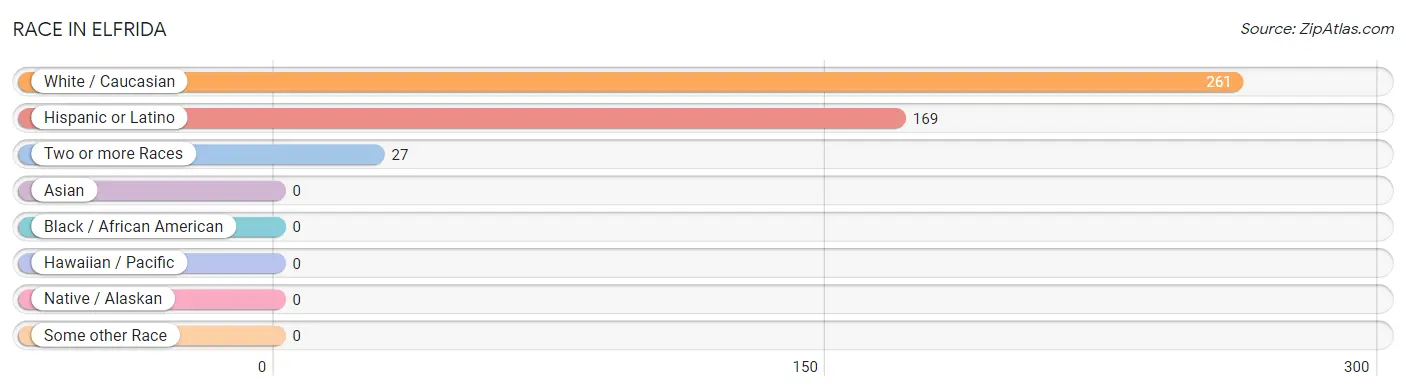
| Race | # Population | % Population |
| Asian | 0 | 0.0% |
| Black / African American | 0 | 0.0% |
| Hawaiian / Pacific | 0 | 0.0% |
| Hispanic or Latino | 169 | 58.7% |
| Native / Alaskan | 0 | 0.0% |
| White / Caucasian | 261 | 90.6% |
| Two or more Races | 27 | 9.4% |
| Some other Race | 0 | 0.0% |
| Total | 288 | 100.0% |
Ancestry in Elfrida
The most populous ancestries reported in Elfrida are Mexican (169 | 58.7%), American (16 | 5.6%), German (12 | 4.2%), Irish (3 | 1.0%), and Polish (3 | 1.0%), together accounting for 70.5% of all Elfrida residents.
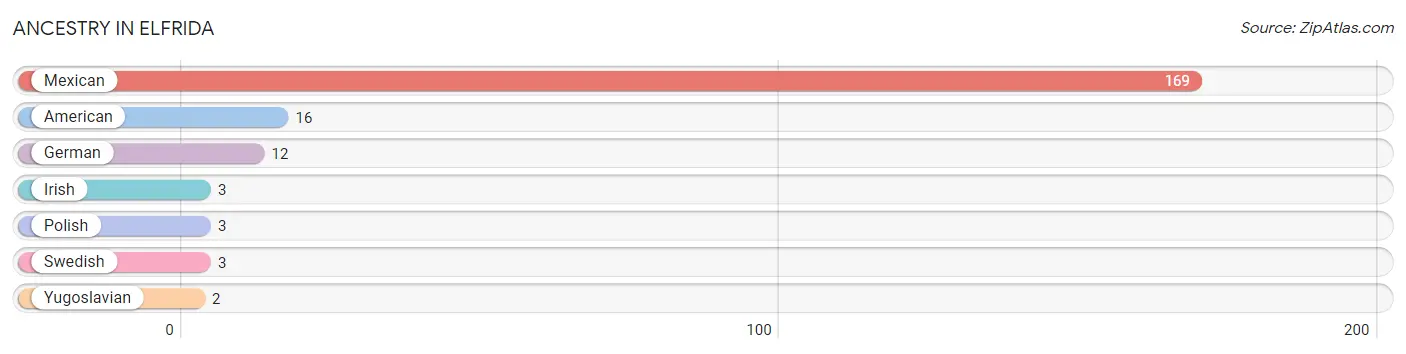
| Ancestry | # Population | % Population |
| American | 16 | 5.6% |
| German | 12 | 4.2% |
| Irish | 3 | 1.0% |
| Mexican | 169 | 58.7% |
| Polish | 3 | 1.0% |
| Swedish | 3 | 1.0% |
| Yugoslavian | 2 | 0.7% | View All 7 Rows |
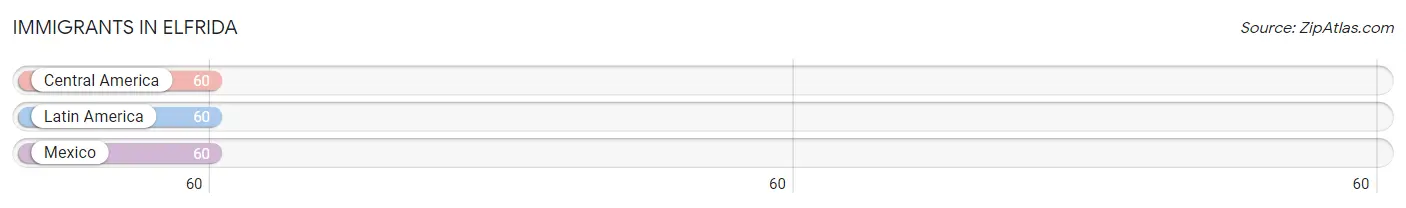
Immigrants in Elfrida
The most numerous immigrant groups reported in Elfrida came from Central America (60 | 20.8%), Latin America (60 | 20.8%), and Mexico (60 | 20.8%), together accounting for 62.5% of all Elfrida residents.
| Immigration Origin | # Population | % Population |
| Central America | 60 | 20.8% |
| Latin America | 60 | 20.8% |
| Mexico | 60 | 20.8% | View All 3 Rows |
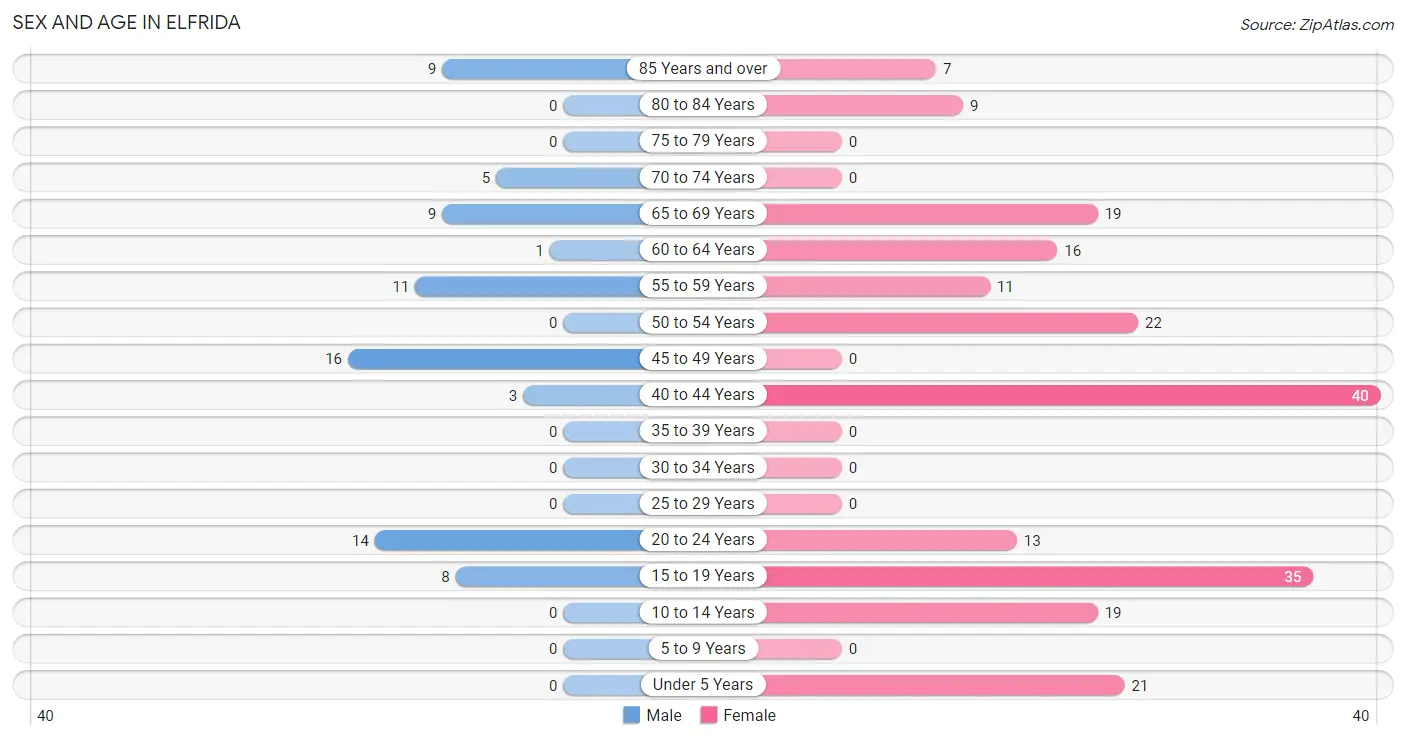
Sex and Age in Elfrida
Sex and Age in Elfrida
The most populous age groups in Elfrida are 45 to 49 Years (16 | 21.0%) for men and 40 to 44 Years (40 | 18.9%) for women.
| Age Bracket | Male | Female |
| Under 5 Years | 0 (0.0%) | 21 (9.9%) |
| 5 to 9 Years | 0 (0.0%) | 0 (0.0%) |
| 10 to 14 Years | 0 (0.0%) | 19 (9.0%) |
| 15 to 19 Years | 8 (10.5%) | 35 (16.5%) |
| 20 to 24 Years | 14 (18.4%) | 13 (6.1%) |
| 25 to 29 Years | 0 (0.0%) | 0 (0.0%) |
| 30 to 34 Years | 0 (0.0%) | 0 (0.0%) |
| 35 to 39 Years | 0 (0.0%) | 0 (0.0%) |
| 40 to 44 Years | 3 (4.0%) | 40 (18.9%) |
| 45 to 49 Years | 16 (21.0%) | 0 (0.0%) |
| 50 to 54 Years | 0 (0.0%) | 22 (10.4%) |
| 55 to 59 Years | 11 (14.5%) | 11 (5.2%) |
| 60 to 64 Years | 1 (1.3%) | 16 (7.5%) |
| 65 to 69 Years | 9 (11.8%) | 19 (9.0%) |
| 70 to 74 Years | 5 (6.6%) | 0 (0.0%) |
| 75 to 79 Years | 0 (0.0%) | 0 (0.0%) |
| 80 to 84 Years | 0 (0.0%) | 9 (4.3%) |
| 85 Years and over | 9 (11.8%) | 7 (3.3%) |
| Total | 76 (100.0%) | 212 (100.0%) |
Families and Households in Elfrida
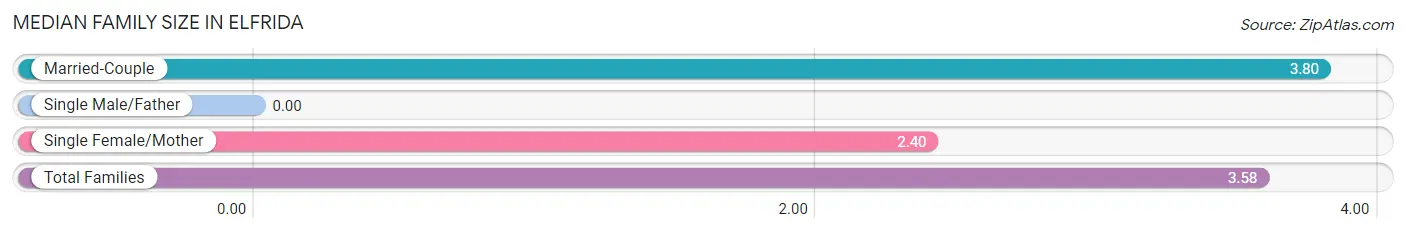
Median Family Size in Elfrida
| Family Type | # Families | Family Size |
| Married-Couple | 55 (84.6%) | 3.80 |
| Single Male/Father | 0 (0.0%) | - |
| Single Female/Mother | 10 (15.4%) | 2.40 |
| Total Families | 65 (100.0%) | 3.58 |
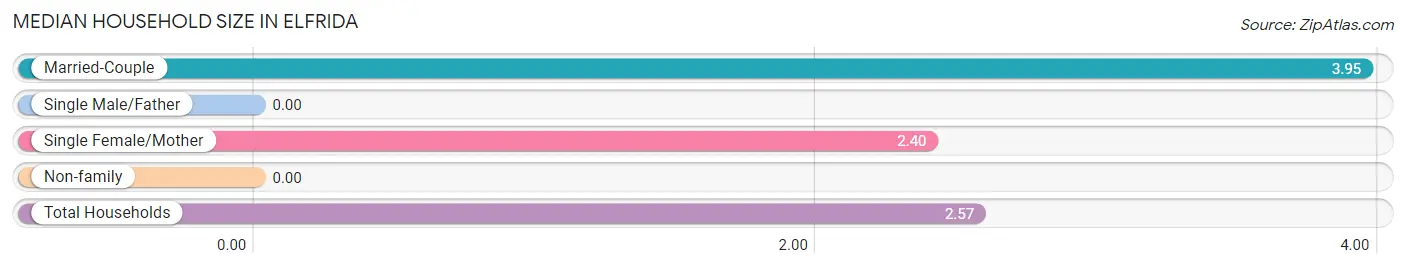
Median Household Size in Elfrida
| Household Type | # Households | Household Size |
| Married-Couple | 55 (49.1%) | 3.95 |
| Single Male/Father | 0 (0.0%) | - |
| Single Female/Mother | 10 (8.9%) | 2.40 |
| Non-family | 47 (42.0%) | - |
| Total Households | 112 (100.0%) | 2.57 |
Household Size by Marriage Status in Elfrida
Out of a total of 112 households in Elfrida, 65 (58.0%) are family households, while 47 (42.0%) are nonfamily households. The most numerous type of family households are 2-person households, comprising 41, and the most common type of nonfamily households are 1-person households, comprising 47.
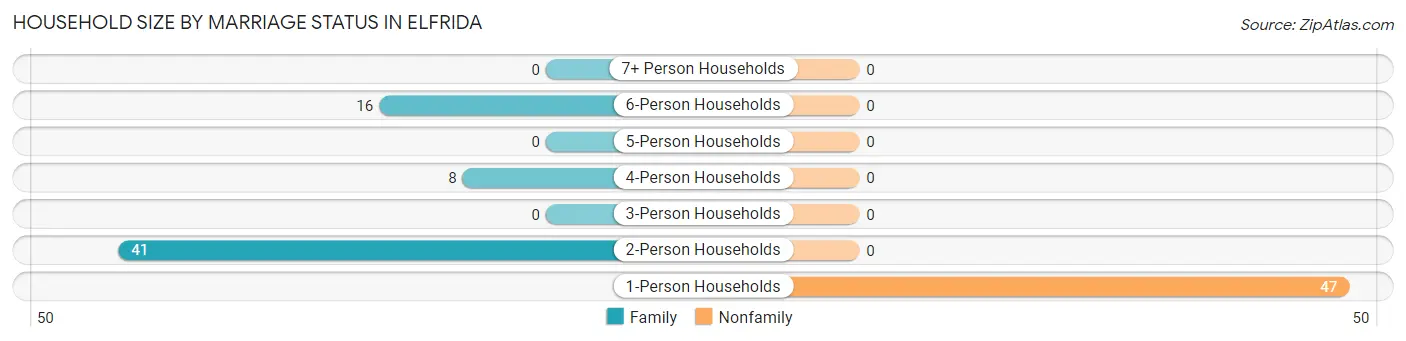
| Household Size | Family Households | Nonfamily Households |
| 1-Person Households | - | 47 (42.0%) |
| 2-Person Households | 41 (36.6%) | 0 (0.0%) |
| 3-Person Households | 0 (0.0%) | 0 (0.0%) |
| 4-Person Households | 8 (7.1%) | 0 (0.0%) |
| 5-Person Households | 0 (0.0%) | 0 (0.0%) |
| 6-Person Households | 16 (14.3%) | 0 (0.0%) |
| 7+ Person Households | 0 (0.0%) | 0 (0.0%) |
| Total | 65 (58.0%) | 47 (42.0%) |
Female Fertility in Elfrida
Fertility by Age in Elfrida
| Age Bracket | Women with Births | Births / 1,000 Women |
| 15 to 19 years | 0 (0.0%) | 0.0 |
| 20 to 34 years | 0 (0.0%) | 0.0 |
| 35 to 50 years | 0 (0.0%) | 0.0 |
| Total | 0 (0.0%) | 0.0 |
Fertility by Age by Marriage Status in Elfrida
| Age Bracket | Married | Unmarried |
| 15 to 19 years | 0 (0.0%) | 0 (0.0%) |
| 20 to 34 years | 0 (0.0%) | 0 (0.0%) |
| 35 to 50 years | 0 (0.0%) | 0 (0.0%) |
| Total | 0 (0.0%) | 0 (0.0%) |
Fertility by Education in Elfrida
| Educational Attainment | Women with Births | Births / 1,000 Women |
| Less than High School | 0 (0.0%) | 0.0 |
| High School Diploma | 0 (0.0%) | 0.0 |
| College or Associate's Degree | 0 (0.0%) | 0.0 |
| Bachelor's Degree | 0 (0.0%) | 0.0 |
| Graduate Degree | 0 (0.0%) | 0.0 |
| Total | 0 (0.0%) | 0.0 |
Fertility by Education by Marriage Status in Elfrida
| Educational Attainment | Married | Unmarried |
| Less than High School | 0 (0.0%) | 0 (0.0%) |
| High School Diploma | 0 (0.0%) | 0 (0.0%) |
| College or Associate's Degree | 0 (0.0%) | 0 (0.0%) |
| Bachelor's Degree | 0 (0.0%) | 0 (0.0%) |
| Graduate Degree | 0 (0.0%) | 0 (0.0%) |
| Total | 0 (0.0%) | 0 (0.0%) |
Employment Characteristics in Elfrida
Employment by Class of Employer in Elfrida
Among the 96 employed individuals in Elfrida, private company employees (70 | 72.9%), and state government employees (26 | 27.1%) make up the most common classes of employment.
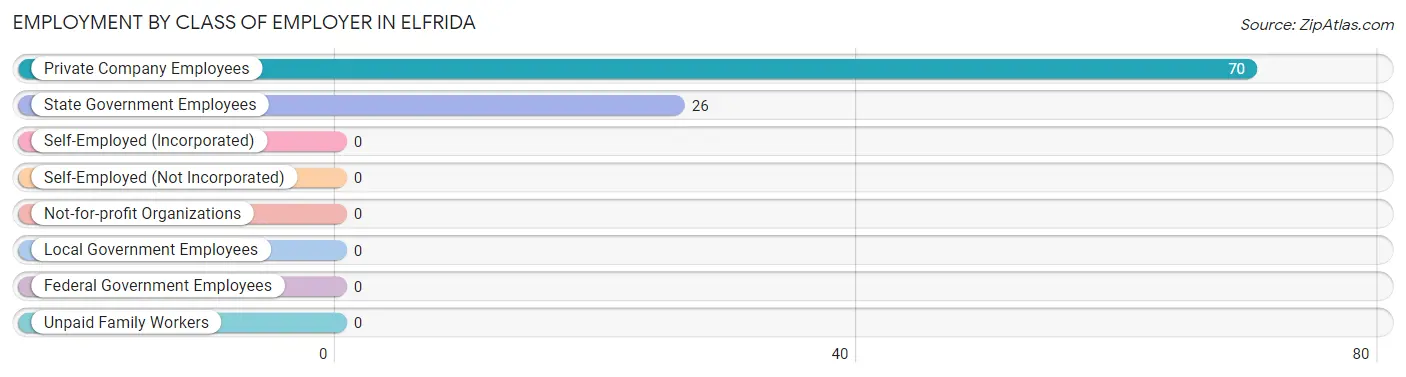
| Employer Class | # Employees | % Employees |
| Private Company Employees | 70 | 72.9% |
| Self-Employed (Incorporated) | 0 | 0.0% |
| Self-Employed (Not Incorporated) | 0 | 0.0% |
| Not-for-profit Organizations | 0 | 0.0% |
| Local Government Employees | 0 | 0.0% |
| State Government Employees | 26 | 27.1% |
| Federal Government Employees | 0 | 0.0% |
| Unpaid Family Workers | 0 | 0.0% |
| Total | 96 | 100.0% |
Employment Status by Age in Elfrida
According to the labor force statistics for Elfrida, out of the total population over 16 years of age (231), 43.7% or 101 individuals are in the labor force, with 5.0% or 5 of them unemployed. The age group with the highest labor force participation rate is 16 to 19 years, with 100.0% or 26 individuals in the labor force. Within the labor force, the 60 to 64 years age range has the highest percentage of unemployed individuals, with 83.3% or 5 of them being unemployed.
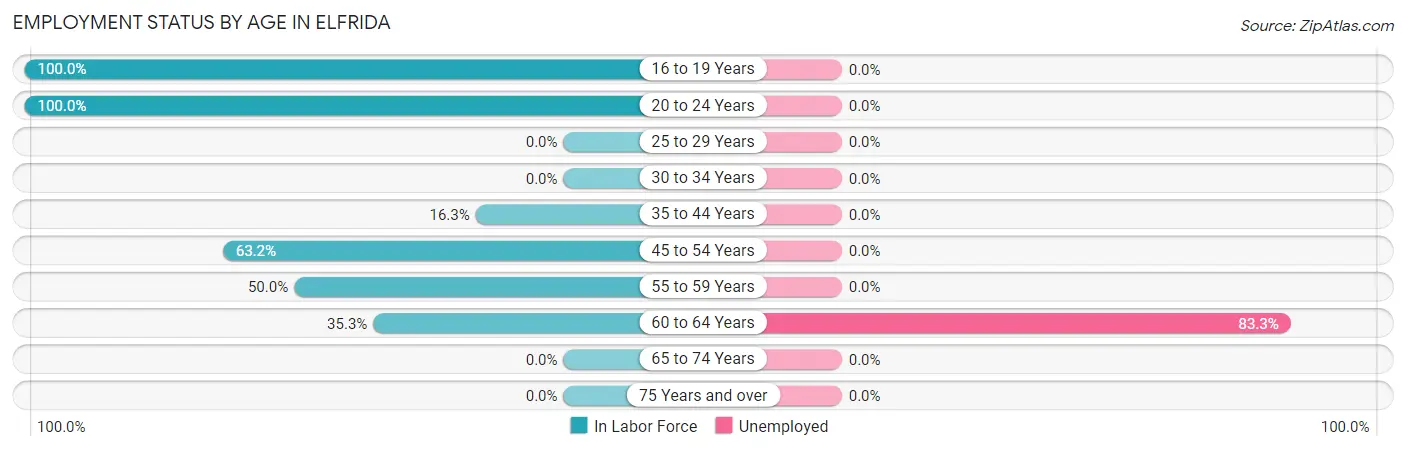
| Age Bracket | In Labor Force | Unemployed |
| 16 to 19 Years | 26 (100.0%) | 0 (0.0%) |
| 20 to 24 Years | 27 (100.0%) | 0 (0.0%) |
| 25 to 29 Years | 0 (0.0%) | 0 (0.0%) |
| 30 to 34 Years | 0 (0.0%) | 0 (0.0%) |
| 35 to 44 Years | 7 (16.3%) | 0 (0.0%) |
| 45 to 54 Years | 24 (63.2%) | 0 (0.0%) |
| 55 to 59 Years | 11 (50.0%) | 0 (0.0%) |
| 60 to 64 Years | 6 (35.3%) | 5 (83.3%) |
| 65 to 74 Years | 0 (0.0%) | 0 (0.0%) |
| 75 Years and over | 0 (0.0%) | 0 (0.0%) |
| Total | 101 (43.7%) | 5 (5.0%) |
Employment Status by Educational Attainment in Elfrida
According to labor force statistics for Elfrida, 40.0% of individuals (48) out of the total population between 25 and 64 years of age (120) are in the labor force, with 10.4% or 5 of them being unemployed. The group with the highest labor force participation rate are those with the educational attainment of college / associate degree, with 78.3% or 36 individuals in the labor force. Within the labor force, individuals with college / associate degree education have the highest percentage of unemployment, with 13.9% or 5 of them being unemployed.
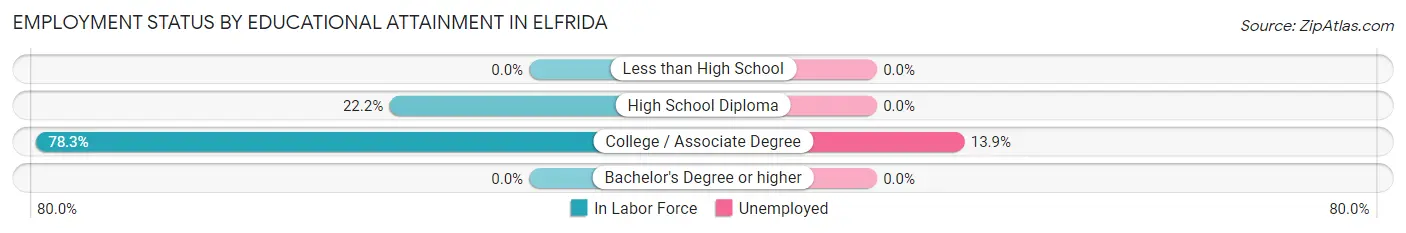
| Educational Attainment | In Labor Force | Unemployed |
| Less than High School | 0 (0.0%) | 0 (0.0%) |
| High School Diploma | 12 (22.2%) | 0 (0.0%) |
| College / Associate Degree | 36 (78.3%) | 6 (13.9%) |
| Bachelor's Degree or higher | 0 (0.0%) | 0 (0.0%) |
| Total | 48 (40.0%) | 12 (10.4%) |
Employment Occupations by Sex in Elfrida
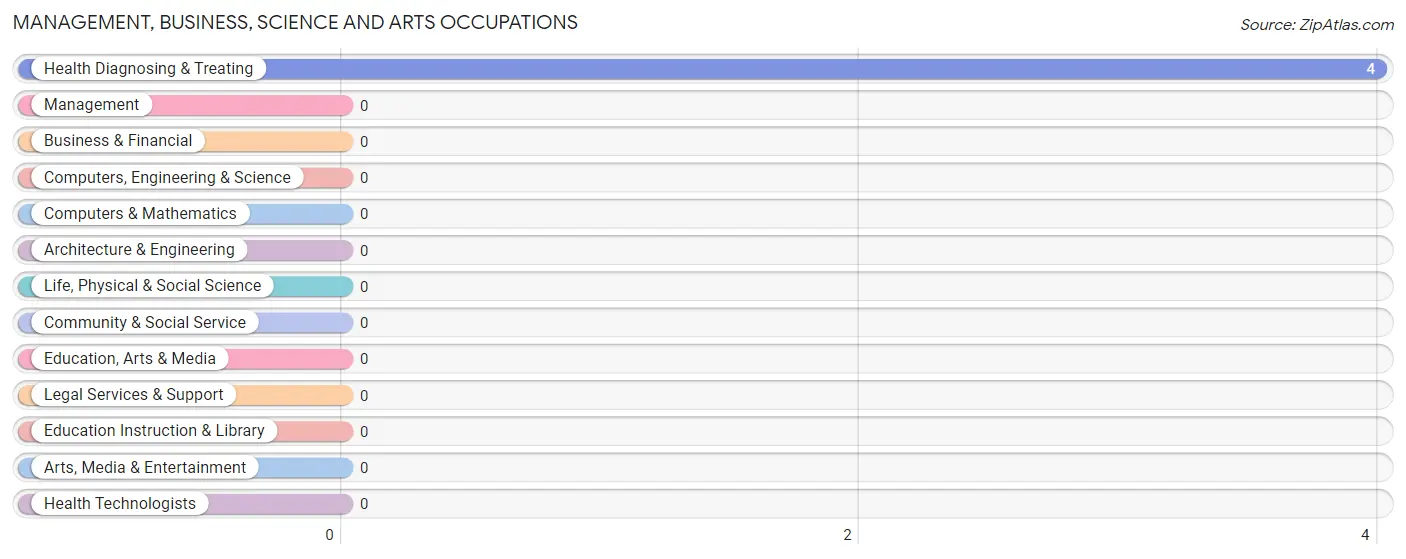
Management, Business, Science and Arts Occupations
The most common Management, Business, Science and Arts occupations in Elfrida are , and Health Diagnosing & Treating (4 | 4.2%).
Management, Business, Science and Arts Occupations by Sex
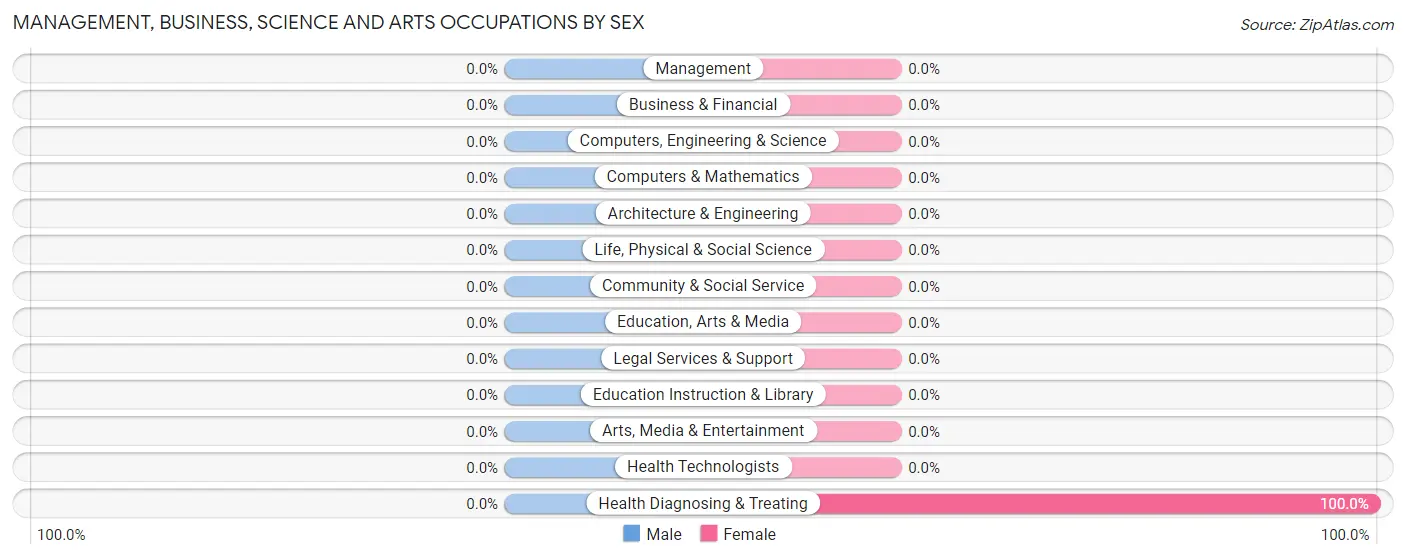
| Occupation | Male | Female |
| Management | 0 (0.0%) | 0 (0.0%) |
| Business & Financial | 0 (0.0%) | 0 (0.0%) |
| Computers, Engineering & Science | 0 (0.0%) | 0 (0.0%) |
| Computers & Mathematics | 0 (0.0%) | 0 (0.0%) |
| Architecture & Engineering | 0 (0.0%) | 0 (0.0%) |
| Life, Physical & Social Science | 0 (0.0%) | 0 (0.0%) |
| Community & Social Service | 0 (0.0%) | 0 (0.0%) |
| Education, Arts & Media | 0 (0.0%) | 0 (0.0%) |
| Legal Services & Support | 0 (0.0%) | 0 (0.0%) |
| Education Instruction & Library | 0 (0.0%) | 0 (0.0%) |
| Arts, Media & Entertainment | 0 (0.0%) | 0 (0.0%) |
| Health Diagnosing & Treating | 0 (0.0%) | 4 (100.0%) |
| Health Technologists | 0 (0.0%) | 0 (0.0%) |
| Total (Category) | 0 (0.0%) | 4 (100.0%) |
| Total (Overall) | 53 (55.2%) | 43 (44.8%) |
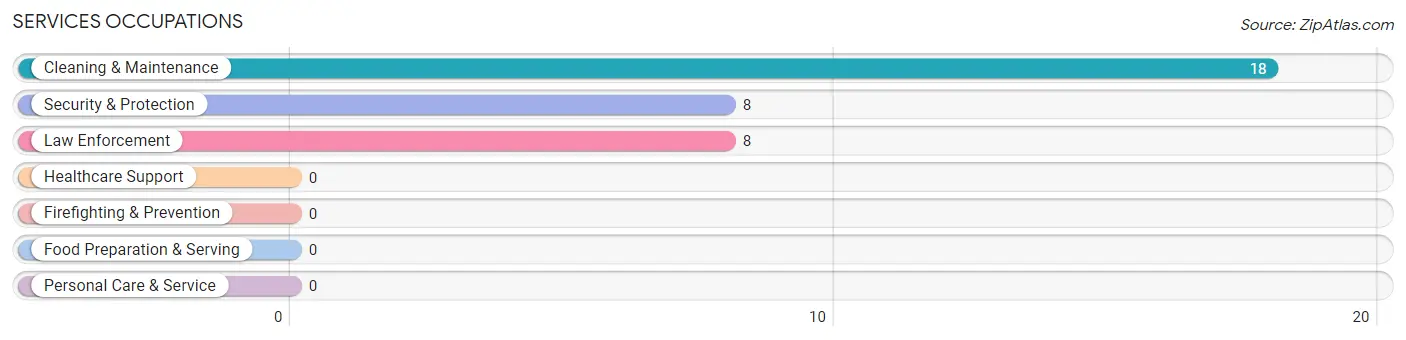
Services Occupations
The most common Services occupations in Elfrida are Cleaning & Maintenance (18 | 18.8%), Security & Protection (8 | 8.3%), and Law Enforcement (8 | 8.3%).
Services Occupations by Sex
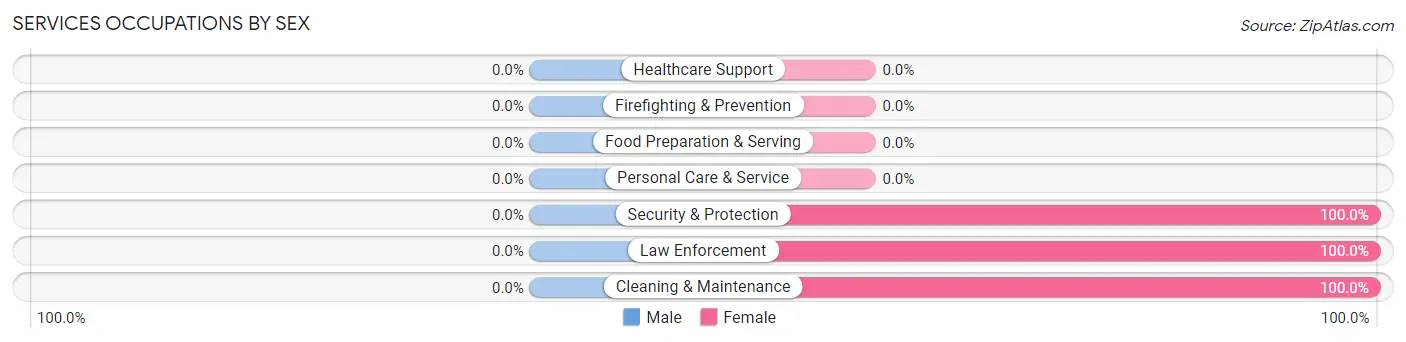
| Occupation | Male | Female |
| Healthcare Support | 0 (0.0%) | 0 (0.0%) |
| Security & Protection | 0 (0.0%) | 8 (100.0%) |
| Firefighting & Prevention | 0 (0.0%) | 0 (0.0%) |
| Law Enforcement | 0 (0.0%) | 8 (100.0%) |
| Food Preparation & Serving | 0 (0.0%) | 0 (0.0%) |
| Cleaning & Maintenance | 0 (0.0%) | 18 (100.0%) |
| Personal Care & Service | 0 (0.0%) | 0 (0.0%) |
| Total (Category) | 0 (0.0%) | 26 (100.0%) |
| Total (Overall) | 53 (55.2%) | 43 (44.8%) |
Sales and Office Occupations
The most common Sales and Office occupations in Elfrida are , and Office & Administration (21 | 21.9%).

Sales and Office Occupations by Sex

| Occupation | Male | Female |
| Sales & Related | 0 (0.0%) | 0 (0.0%) |
| Office & Administration | 8 (38.1%) | 13 (61.9%) |
| Total (Category) | 8 (38.1%) | 13 (61.9%) |
| Total (Overall) | 53 (55.2%) | 43 (44.8%) |
Natural Resources, Construction and Maintenance Occupations
The most common Natural Resources, Construction and Maintenance occupations in Elfrida are , and Construction & Extraction (14 | 14.6%).
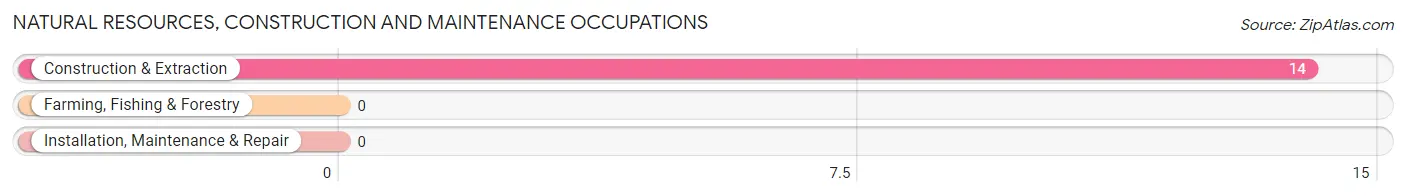
Natural Resources, Construction and Maintenance Occupations by Sex
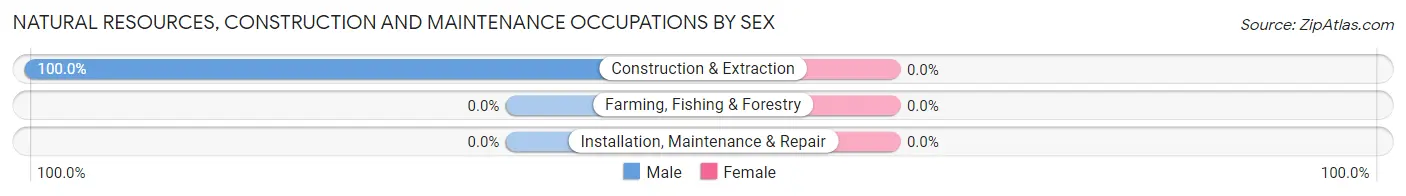
| Occupation | Male | Female |
| Farming, Fishing & Forestry | 0 (0.0%) | 0 (0.0%) |
| Construction & Extraction | 14 (100.0%) | 0 (0.0%) |
| Installation, Maintenance & Repair | 0 (0.0%) | 0 (0.0%) |
| Total (Category) | 14 (100.0%) | 0 (0.0%) |
| Total (Overall) | 53 (55.2%) | 43 (44.8%) |
Production, Transportation and Moving Occupations
The most common Production, Transportation and Moving occupations in Elfrida are Transportation (17 | 17.7%), Production (11 | 11.5%), and Material Moving (3 | 3.1%).
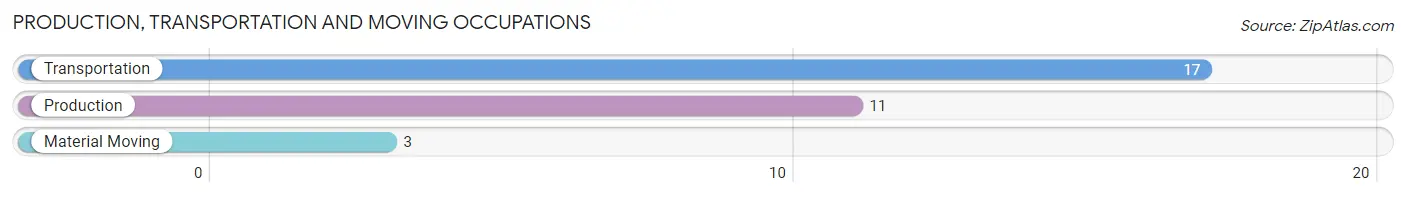
Production, Transportation and Moving Occupations by Sex
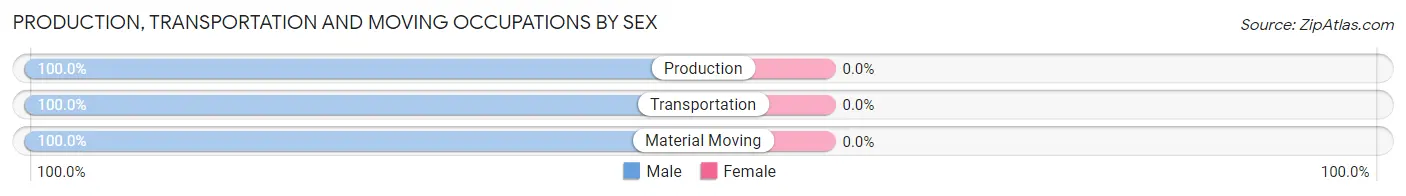
| Occupation | Male | Female |
| Production | 11 (100.0%) | 0 (0.0%) |
| Transportation | 17 (100.0%) | 0 (0.0%) |
| Material Moving | 3 (100.0%) | 0 (0.0%) |
| Total (Category) | 31 (100.0%) | 0 (0.0%) |
| Total (Overall) | 53 (55.2%) | 43 (44.8%) |
Employment Industries by Sex in Elfrida
Employment Industries in Elfrida
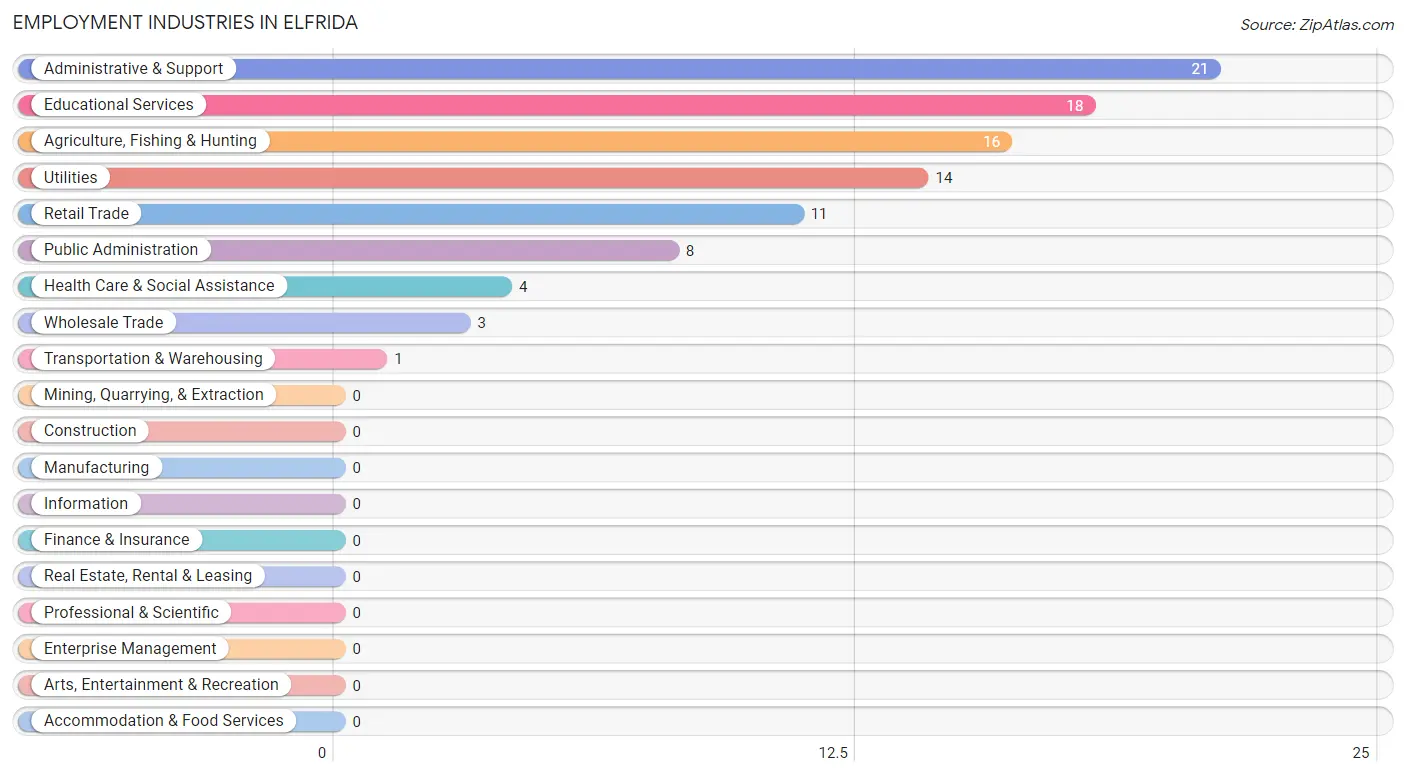
The major employment industries in Elfrida include Administrative & Support (21 | 21.9%), Educational Services (18 | 18.8%), Agriculture, Fishing & Hunting (16 | 16.7%), Utilities (14 | 14.6%), and Retail Trade (11 | 11.5%).
Employment Industries by Sex in Elfrida
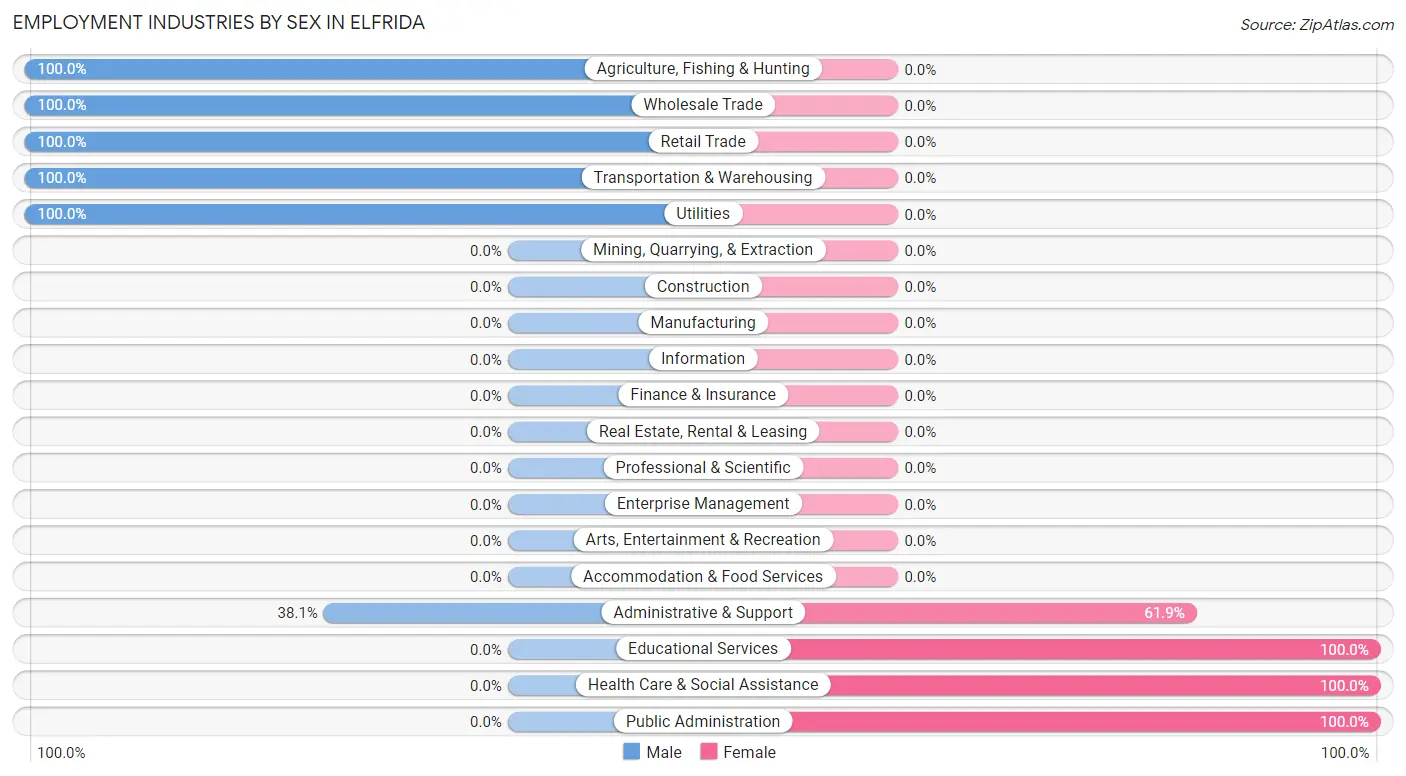
The Elfrida industries that see more men than women are Agriculture, Fishing & Hunting (100.0%), Wholesale Trade (100.0%), and Retail Trade (100.0%), whereas the industries that tend to have a higher number of women are Educational Services (100.0%), Health Care & Social Assistance (100.0%), and Public Administration (100.0%).
| Industry | Male | Female |
| Agriculture, Fishing & Hunting | 16 (100.0%) | 0 (0.0%) |
| Mining, Quarrying, & Extraction | 0 (0.0%) | 0 (0.0%) |
| Construction | 0 (0.0%) | 0 (0.0%) |
| Manufacturing | 0 (0.0%) | 0 (0.0%) |
| Wholesale Trade | 3 (100.0%) | 0 (0.0%) |
| Retail Trade | 11 (100.0%) | 0 (0.0%) |
| Transportation & Warehousing | 1 (100.0%) | 0 (0.0%) |
| Utilities | 14 (100.0%) | 0 (0.0%) |
| Information | 0 (0.0%) | 0 (0.0%) |
| Finance & Insurance | 0 (0.0%) | 0 (0.0%) |
| Real Estate, Rental & Leasing | 0 (0.0%) | 0 (0.0%) |
| Professional & Scientific | 0 (0.0%) | 0 (0.0%) |
| Enterprise Management | 0 (0.0%) | 0 (0.0%) |
| Administrative & Support | 8 (38.1%) | 13 (61.9%) |
| Educational Services | 0 (0.0%) | 18 (100.0%) |
| Health Care & Social Assistance | 0 (0.0%) | 4 (100.0%) |
| Arts, Entertainment & Recreation | 0 (0.0%) | 0 (0.0%) |
| Accommodation & Food Services | 0 (0.0%) | 0 (0.0%) |
| Public Administration | 0 (0.0%) | 8 (100.0%) |
| Total | 53 (55.2%) | 43 (44.8%) |
Education in Elfrida
School Enrollment in Elfrida
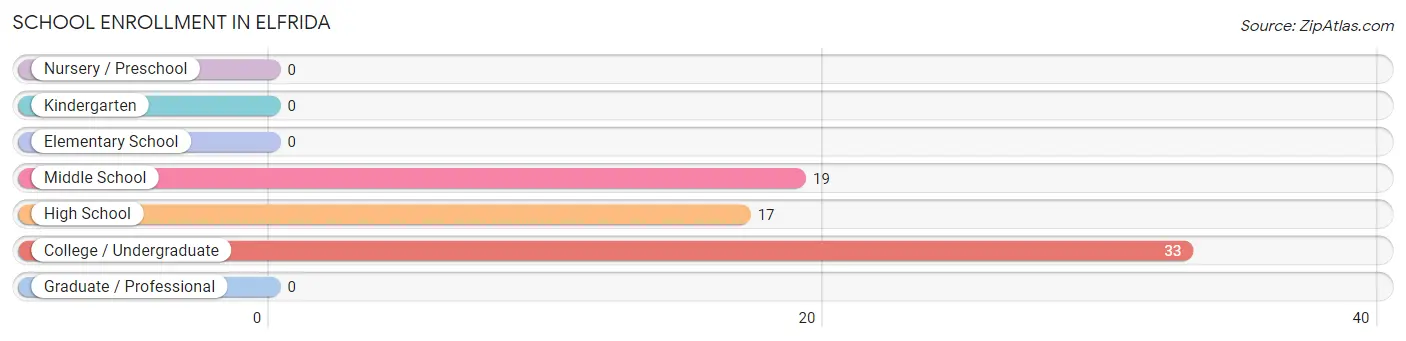
The most common levels of schooling among the 69 students in Elfrida are college / undergraduate (33 | 47.8%), middle school (19 | 27.5%), and high school (17 | 24.6%).
| School Level | # Students | % Students |
| Nursery / Preschool | 0 | 0.0% |
| Kindergarten | 0 | 0.0% |
| Elementary School | 0 | 0.0% |
| Middle School | 19 | 27.5% |
| High School | 17 | 24.6% |
| College / Undergraduate | 33 | 47.8% |
| Graduate / Professional | 0 | 0.0% |
| Total | 69 | 100.0% |
School Enrollment by Age by Funding Source in Elfrida
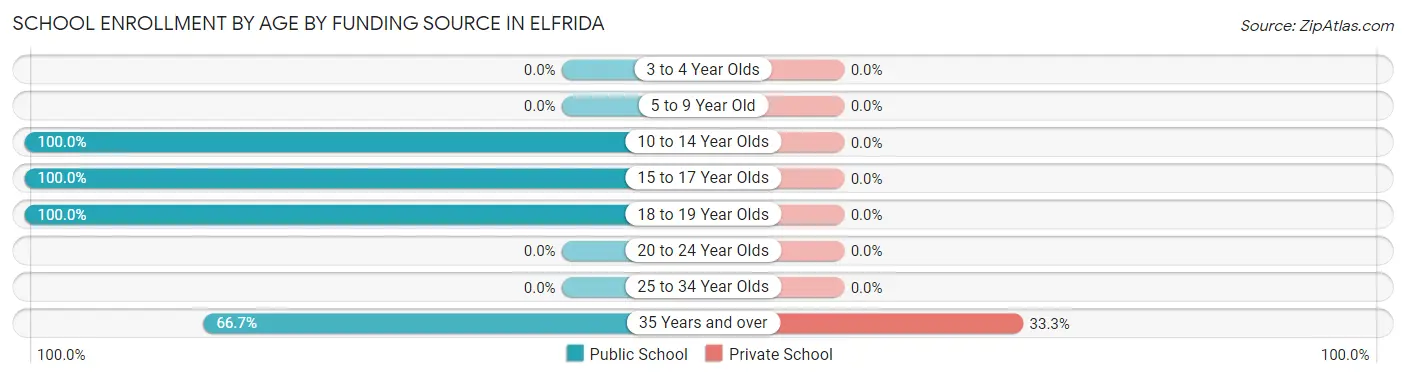
Out of a total of 69 students who are enrolled in schools in Elfrida, 5 (7.2%) attend a private institution, while the remaining 64 (92.8%) are enrolled in public schools. The age group of 35 years and over has the highest likelihood of being enrolled in private schools, with 5 (33.3% in the age bracket) enrolled. Conversely, the age group of 10 to 14 year olds has the lowest likelihood of being enrolled in a private school, with 19 (100.0% in the age bracket) attending a public institution.
| Age Bracket | Public School | Private School |
| 3 to 4 Year Olds | 0 (0.0%) | 0 (0.0%) |
| 5 to 9 Year Old | 0 (0.0%) | 0 (0.0%) |
| 10 to 14 Year Olds | 19 (100.0%) | 0 (0.0%) |
| 15 to 17 Year Olds | 17 (100.0%) | 0 (0.0%) |
| 18 to 19 Year Olds | 18 (100.0%) | 0 (0.0%) |
| 20 to 24 Year Olds | 0 (0.0%) | 0 (0.0%) |
| 25 to 34 Year Olds | 0 (0.0%) | 0 (0.0%) |
| 35 Years and over | 10 (66.7%) | 5 (33.3%) |
| Total | 64 (92.8%) | 5 (7.2%) |
Educational Attainment by Field of Study in Elfrida
Social sciences (11 | 55.0%), and arts & humanities (9 | 45.0%) are the most common fields of study among 20 individuals in Elfrida who have obtained a bachelor's degree or higher.
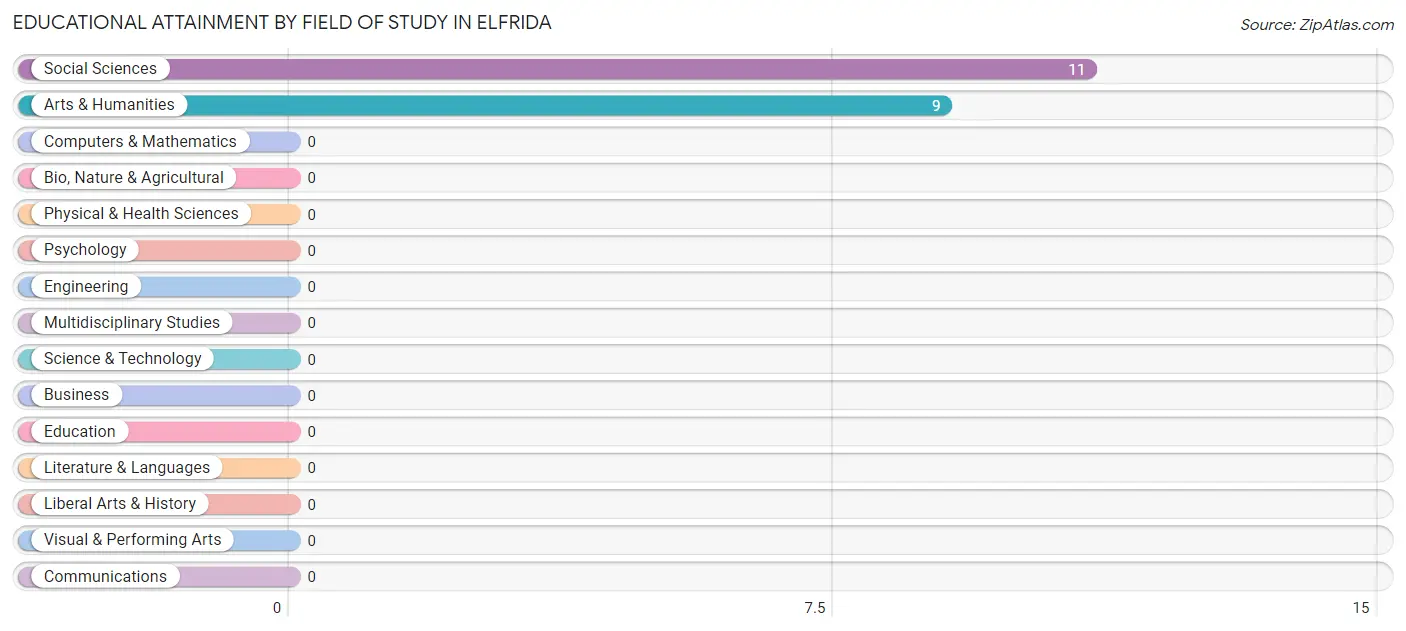
| Field of Study | # Graduates | % Graduates |
| Computers & Mathematics | 0 | 0.0% |
| Bio, Nature & Agricultural | 0 | 0.0% |
| Physical & Health Sciences | 0 | 0.0% |
| Psychology | 0 | 0.0% |
| Social Sciences | 11 | 55.0% |
| Engineering | 0 | 0.0% |
| Multidisciplinary Studies | 0 | 0.0% |
| Science & Technology | 0 | 0.0% |
| Business | 0 | 0.0% |
| Education | 0 | 0.0% |
| Literature & Languages | 0 | 0.0% |
| Liberal Arts & History | 0 | 0.0% |
| Visual & Performing Arts | 0 | 0.0% |
| Communications | 0 | 0.0% |
| Arts & Humanities | 9 | 45.0% |
| Total | 20 | 100.0% |
Transportation & Commute in Elfrida
Vehicle Availability by Sex in Elfrida
The most prevalent vehicle ownership categories in Elfrida are males with 3 vehicles (41, accounting for 77.4%) and females with 3 vehicles (18, making up 95.4%).
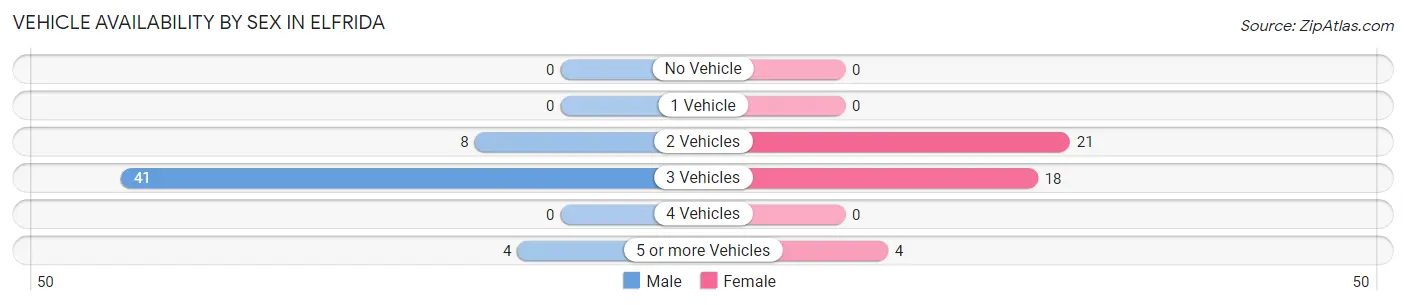
| Vehicles Available | Male | Female |
| No Vehicle | 0 (0.0%) | 0 (0.0%) |
| 1 Vehicle | 0 (0.0%) | 0 (0.0%) |
| 2 Vehicles | 8 (15.1%) | 21 (48.8%) |
| 3 Vehicles | 41 (77.4%) | 18 (41.9%) |
| 4 Vehicles | 0 (0.0%) | 0 (0.0%) |
| 5 or more Vehicles | 4 (7.5%) | 4 (9.3%) |
| Total | 53 (100.0%) | 43 (100.0%) |
Commute Time in Elfrida
The most frequently occuring commute durations in Elfrida are 60 to 89 minutes (25 commuters, 26.0%), 5 to 9 minutes (18 commuters, 18.8%), and less than 5 minutes (16 commuters, 16.7%).
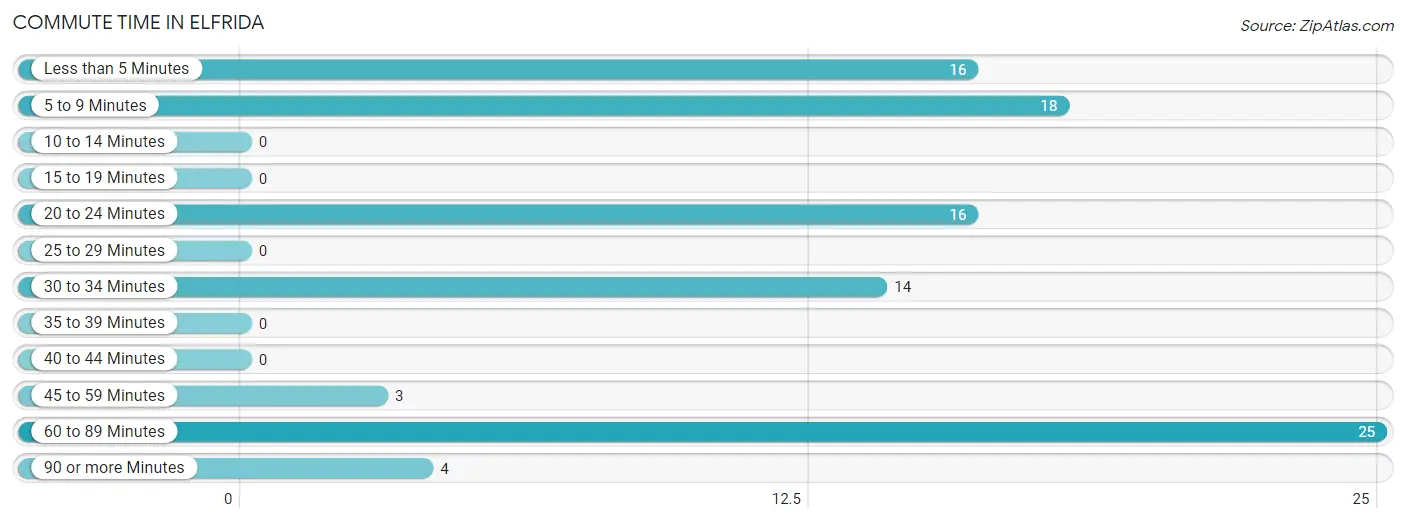
| Commute Time | # Commuters | % Commuters |
| Less than 5 Minutes | 16 | 16.7% |
| 5 to 9 Minutes | 18 | 18.8% |
| 10 to 14 Minutes | 0 | 0.0% |
| 15 to 19 Minutes | 0 | 0.0% |
| 20 to 24 Minutes | 16 | 16.7% |
| 25 to 29 Minutes | 0 | 0.0% |
| 30 to 34 Minutes | 14 | 14.6% |
| 35 to 39 Minutes | 0 | 0.0% |
| 40 to 44 Minutes | 0 | 0.0% |
| 45 to 59 Minutes | 3 | 3.1% |
| 60 to 89 Minutes | 25 | 26.0% |
| 90 or more Minutes | 4 | 4.2% |
Commute Time by Sex in Elfrida
The most common commute times in Elfrida are 60 to 89 minutes (25 commuters, 47.2%) for males and 5 to 9 minutes (18 commuters, 41.9%) for females.
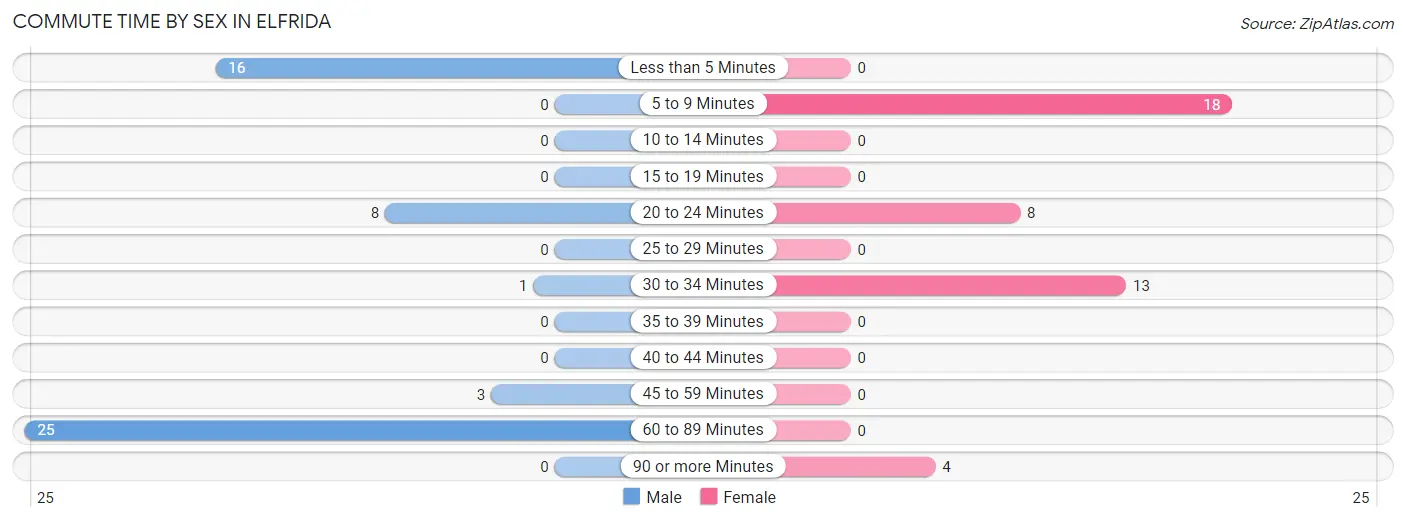
| Commute Time | Male | Female |
| Less than 5 Minutes | 16 (30.2%) | 0 (0.0%) |
| 5 to 9 Minutes | 0 (0.0%) | 18 (41.9%) |
| 10 to 14 Minutes | 0 (0.0%) | 0 (0.0%) |
| 15 to 19 Minutes | 0 (0.0%) | 0 (0.0%) |
| 20 to 24 Minutes | 8 (15.1%) | 8 (18.6%) |
| 25 to 29 Minutes | 0 (0.0%) | 0 (0.0%) |
| 30 to 34 Minutes | 1 (1.9%) | 13 (30.2%) |
| 35 to 39 Minutes | 0 (0.0%) | 0 (0.0%) |
| 40 to 44 Minutes | 0 (0.0%) | 0 (0.0%) |
| 45 to 59 Minutes | 3 (5.7%) | 0 (0.0%) |
| 60 to 89 Minutes | 25 (47.2%) | 0 (0.0%) |
| 90 or more Minutes | 0 (0.0%) | 4 (9.3%) |
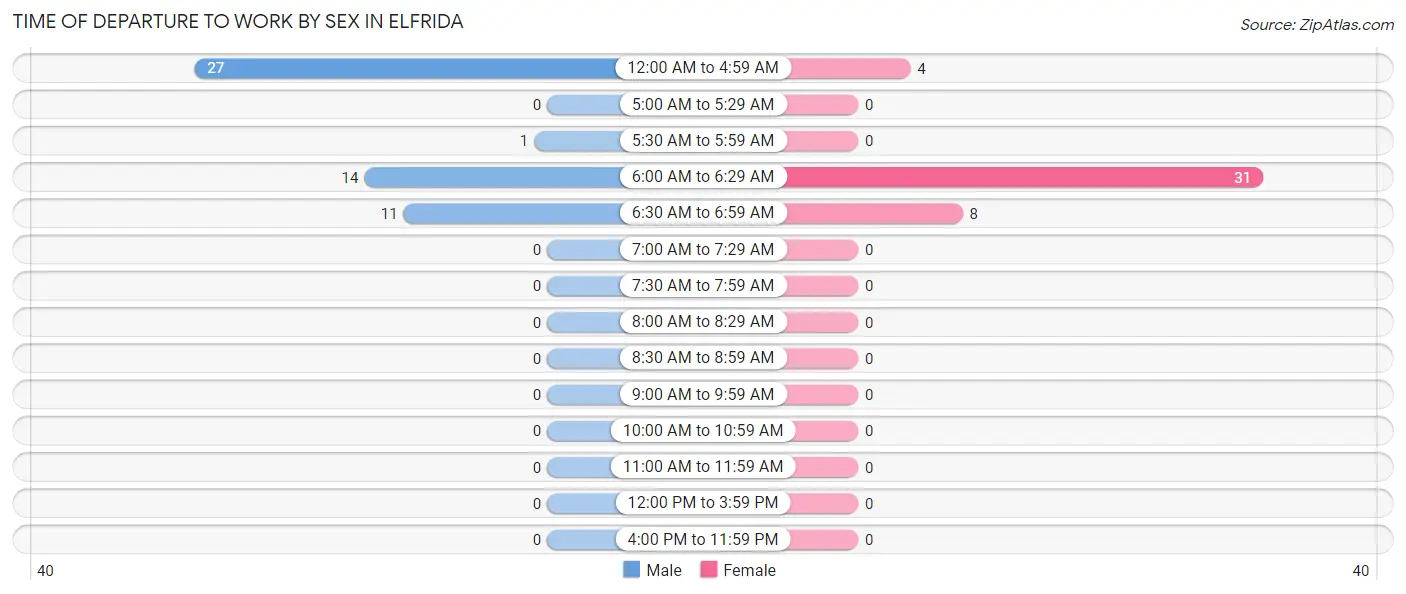
Time of Departure to Work by Sex in Elfrida
The most frequent times of departure to work in Elfrida are 12:00 AM to 4:59 AM (27, 50.9%) for males and 6:00 AM to 6:29 AM (31, 72.1%) for females.
| Time of Departure | Male | Female |
| 12:00 AM to 4:59 AM | 27 (50.9%) | 4 (9.3%) |
| 5:00 AM to 5:29 AM | 0 (0.0%) | 0 (0.0%) |
| 5:30 AM to 5:59 AM | 1 (1.9%) | 0 (0.0%) |
| 6:00 AM to 6:29 AM | 14 (26.4%) | 31 (72.1%) |
| 6:30 AM to 6:59 AM | 11 (20.7%) | 8 (18.6%) |
| 7:00 AM to 7:29 AM | 0 (0.0%) | 0 (0.0%) |
| 7:30 AM to 7:59 AM | 0 (0.0%) | 0 (0.0%) |
| 8:00 AM to 8:29 AM | 0 (0.0%) | 0 (0.0%) |
| 8:30 AM to 8:59 AM | 0 (0.0%) | 0 (0.0%) |
| 9:00 AM to 9:59 AM | 0 (0.0%) | 0 (0.0%) |
| 10:00 AM to 10:59 AM | 0 (0.0%) | 0 (0.0%) |
| 11:00 AM to 11:59 AM | 0 (0.0%) | 0 (0.0%) |
| 12:00 PM to 3:59 PM | 0 (0.0%) | 0 (0.0%) |
| 4:00 PM to 11:59 PM | 0 (0.0%) | 0 (0.0%) |
| Total | 53 (100.0%) | 43 (100.0%) |
Housing Occupancy in Elfrida
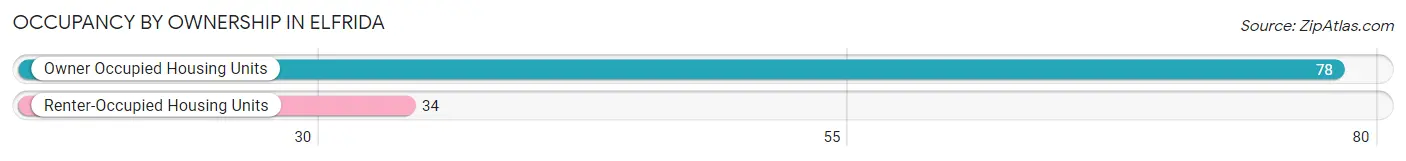
Occupancy by Ownership in Elfrida
Of the total 112 dwellings in Elfrida, owner-occupied units account for 78 (69.6%), while renter-occupied units make up 34 (30.4%).
| Occupancy | # Housing Units | % Housing Units |
| Owner Occupied Housing Units | 78 | 69.6% |
| Renter-Occupied Housing Units | 34 | 30.4% |
| Total Occupied Housing Units | 112 | 100.0% |
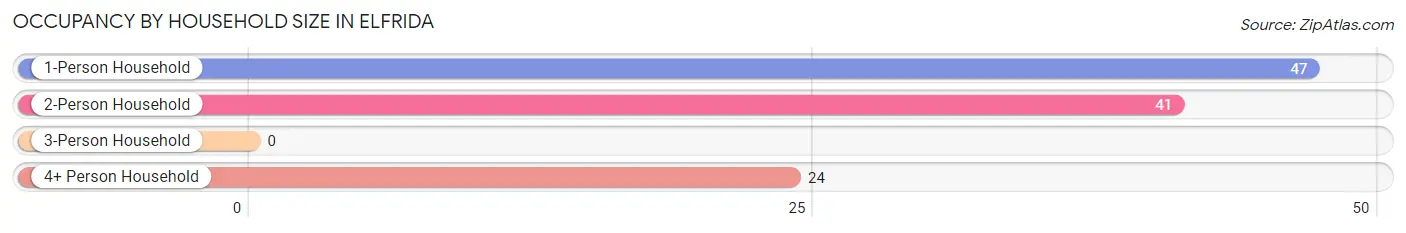
Occupancy by Household Size in Elfrida
| Household Size | # Housing Units | % Housing Units |
| 1-Person Household | 47 | 42.0% |
| 2-Person Household | 41 | 36.6% |
| 3-Person Household | 0 | 0.0% |
| 4+ Person Household | 24 | 21.4% |
| Total Housing Units | 112 | 100.0% |
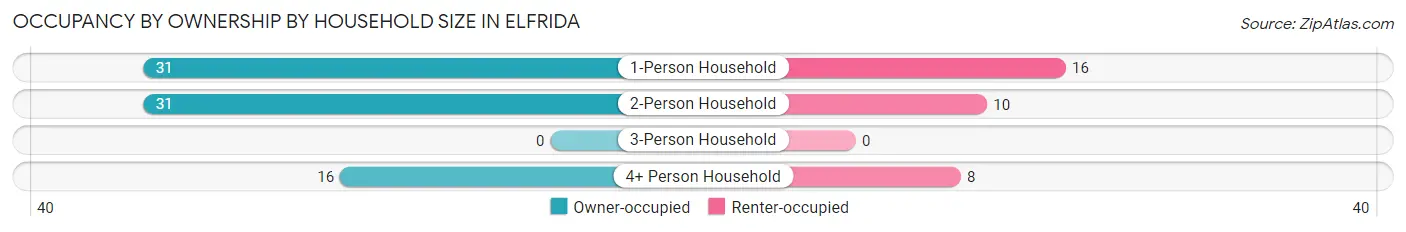
Occupancy by Ownership by Household Size in Elfrida
| Household Size | Owner-occupied | Renter-occupied |
| 1-Person Household | 31 (66.0%) | 16 (34.0%) |
| 2-Person Household | 31 (75.6%) | 10 (24.4%) |
| 3-Person Household | 0 (0.0%) | 0 (0.0%) |
| 4+ Person Household | 16 (66.7%) | 8 (33.3%) |
| Total Housing Units | 78 (69.6%) | 34 (30.4%) |
Occupancy by Educational Attainment in Elfrida
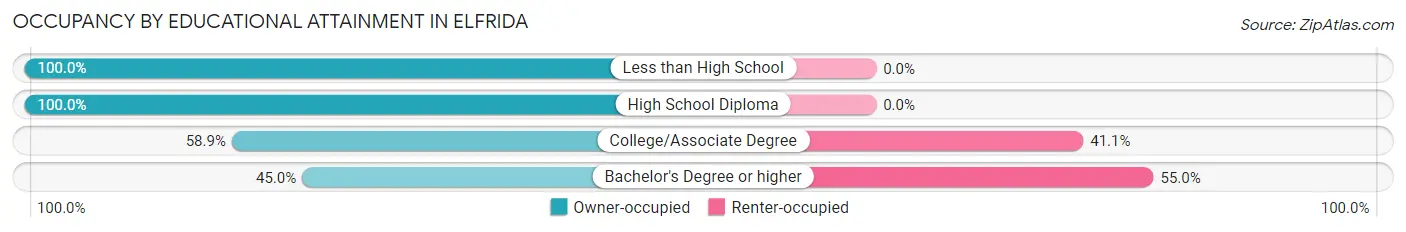
| Household Size | Owner-occupied | Renter-occupied |
| Less than High School | 21 (100.0%) | 0 (0.0%) |
| High School Diploma | 15 (100.0%) | 0 (0.0%) |
| College/Associate Degree | 33 (58.9%) | 23 (41.1%) |
| Bachelor's Degree or higher | 9 (45.0%) | 11 (55.0%) |
Occupancy by Age of Householder in Elfrida
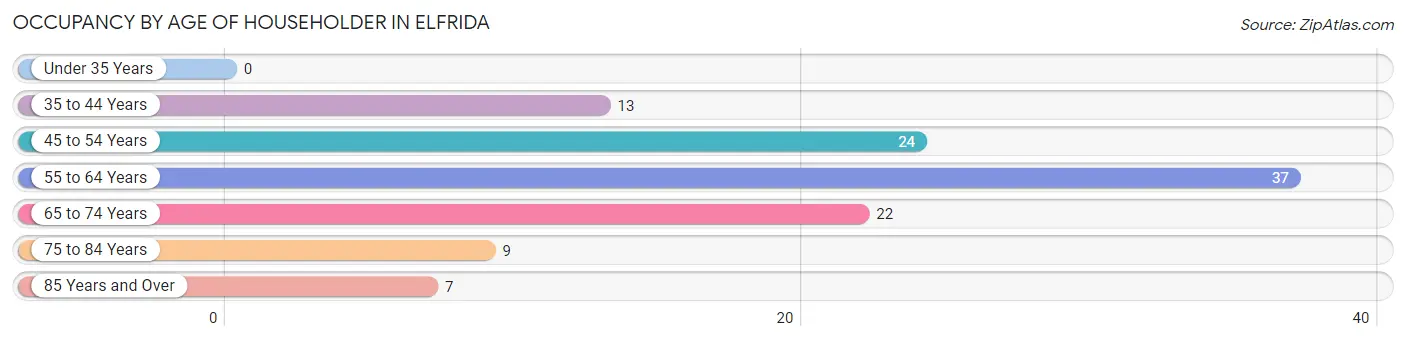
| Age Bracket | # Households | % Households |
| Under 35 Years | 0 | 0.0% |
| 35 to 44 Years | 13 | 11.6% |
| 45 to 54 Years | 24 | 21.4% |
| 55 to 64 Years | 37 | 33.0% |
| 65 to 74 Years | 22 | 19.6% |
| 75 to 84 Years | 9 | 8.0% |
| 85 Years and Over | 7 | 6.2% |
| Total | 112 | 100.0% |
Housing Finances in Elfrida
Median Income by Occupancy in Elfrida
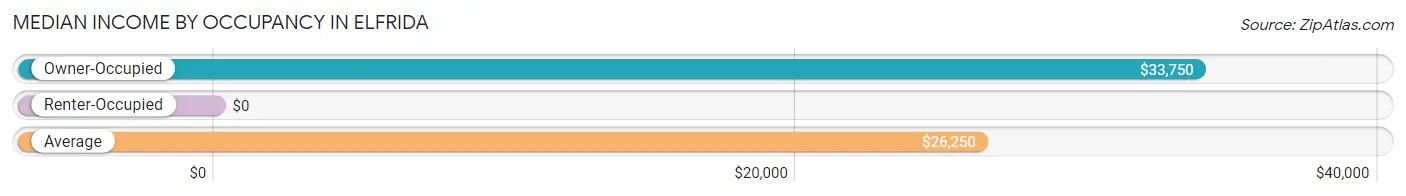
| Occupancy Type | # Households | Median Income |
| Owner-Occupied | 78 (69.6%) | $33,750 |
| Renter-Occupied | 34 (30.4%) | $0 |
| Average | 112 (100.0%) | $26,250 |
Occupancy by Householder Income Bracket in Elfrida
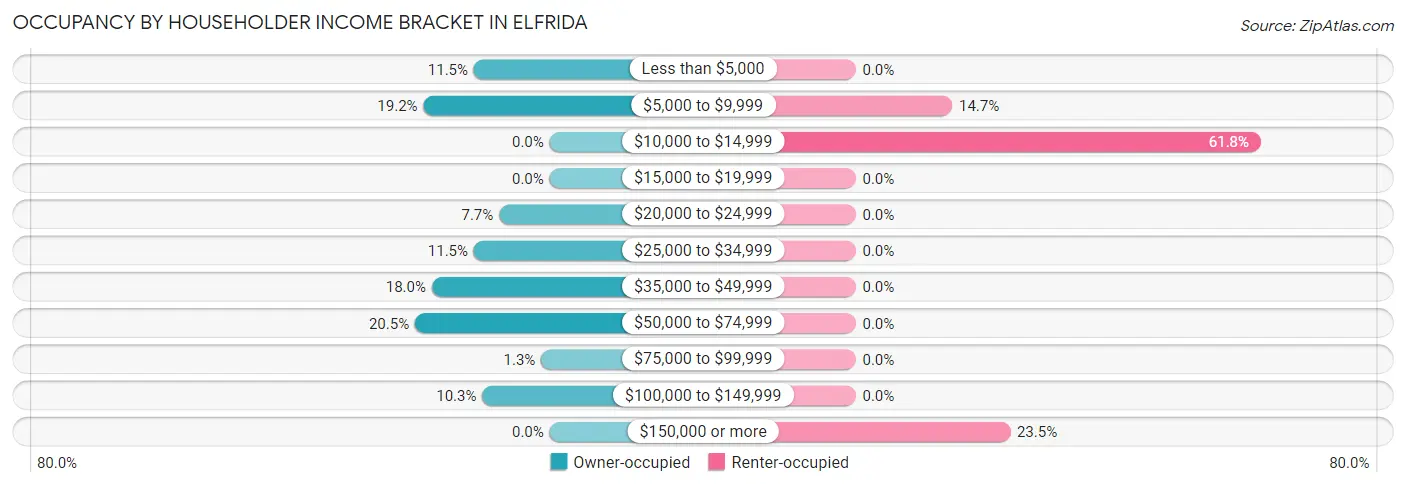
| Income Bracket | Owner-occupied | Renter-occupied |
| Less than $5,000 | 9 (11.5%) | 0 (0.0%) |
| $5,000 to $9,999 | 15 (19.2%) | 5 (14.7%) |
| $10,000 to $14,999 | 0 (0.0%) | 21 (61.8%) |
| $15,000 to $19,999 | 0 (0.0%) | 0 (0.0%) |
| $20,000 to $24,999 | 6 (7.7%) | 0 (0.0%) |
| $25,000 to $34,999 | 9 (11.5%) | 0 (0.0%) |
| $35,000 to $49,999 | 14 (17.9%) | 0 (0.0%) |
| $50,000 to $74,999 | 16 (20.5%) | 0 (0.0%) |
| $75,000 to $99,999 | 1 (1.3%) | 0 (0.0%) |
| $100,000 to $149,999 | 8 (10.3%) | 0 (0.0%) |
| $150,000 or more | 0 (0.0%) | 8 (23.5%) |
| Total | 78 (100.0%) | 34 (100.0%) |
Monthly Housing Cost Tiers in Elfrida
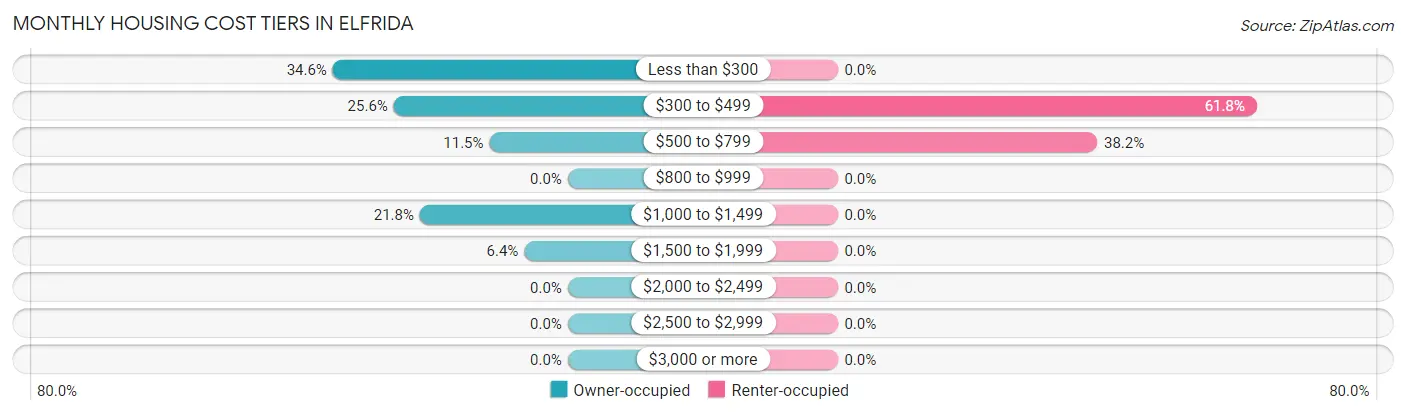
| Monthly Cost | Owner-occupied | Renter-occupied |
| Less than $300 | 27 (34.6%) | 0 (0.0%) |
| $300 to $499 | 20 (25.6%) | 21 (61.8%) |
| $500 to $799 | 9 (11.5%) | 13 (38.2%) |
| $800 to $999 | 0 (0.0%) | 0 (0.0%) |
| $1,000 to $1,499 | 17 (21.8%) | 0 (0.0%) |
| $1,500 to $1,999 | 5 (6.4%) | 0 (0.0%) |
| $2,000 to $2,499 | 0 (0.0%) | 0 (0.0%) |
| $2,500 to $2,999 | 0 (0.0%) | 0 (0.0%) |
| $3,000 or more | 0 (0.0%) | 0 (0.0%) |
| Total | 78 (100.0%) | 34 (100.0%) |
Physical Housing Characteristics in Elfrida
Housing Structures in Elfrida
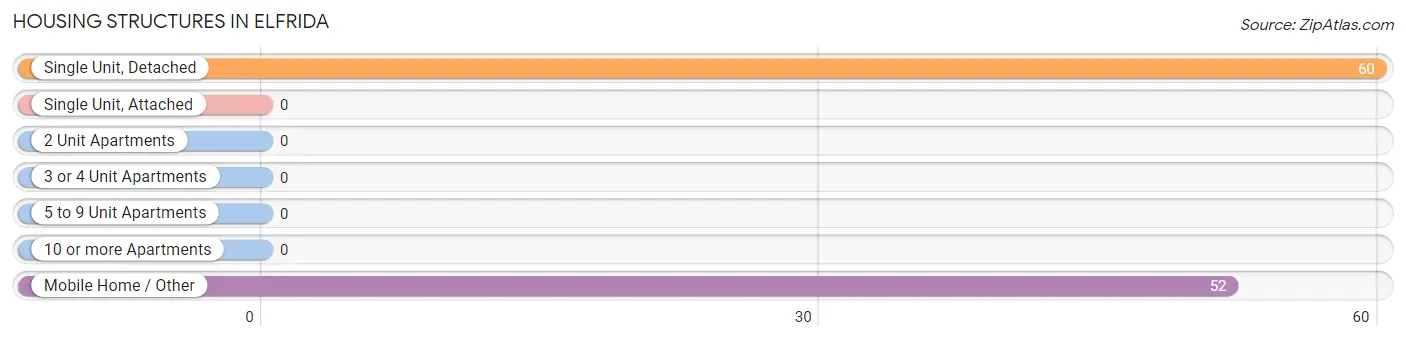
| Structure Type | # Housing Units | % Housing Units |
| Single Unit, Detached | 60 | 53.6% |
| Single Unit, Attached | 0 | 0.0% |
| 2 Unit Apartments | 0 | 0.0% |
| 3 or 4 Unit Apartments | 0 | 0.0% |
| 5 to 9 Unit Apartments | 0 | 0.0% |
| 10 or more Apartments | 0 | 0.0% |
| Mobile Home / Other | 52 | 46.4% |
| Total | 112 | 100.0% |
Housing Structures by Occupancy in Elfrida
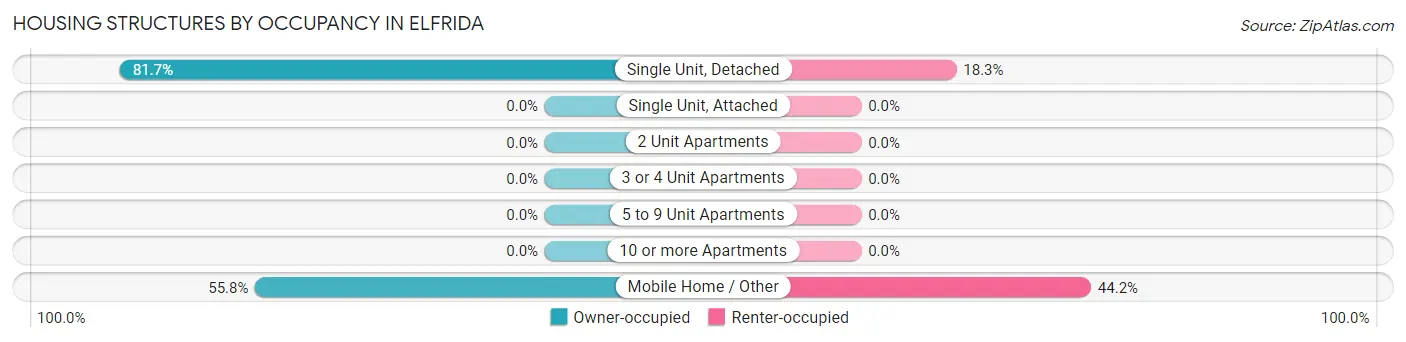
| Structure Type | Owner-occupied | Renter-occupied |
| Single Unit, Detached | 49 (81.7%) | 11 (18.3%) |
| Single Unit, Attached | 0 (0.0%) | 0 (0.0%) |
| 2 Unit Apartments | 0 (0.0%) | 0 (0.0%) |
| 3 or 4 Unit Apartments | 0 (0.0%) | 0 (0.0%) |
| 5 to 9 Unit Apartments | 0 (0.0%) | 0 (0.0%) |
| 10 or more Apartments | 0 (0.0%) | 0 (0.0%) |
| Mobile Home / Other | 29 (55.8%) | 23 (44.2%) |
| Total | 78 (69.6%) | 34 (30.4%) |
Housing Structures by Number of Rooms in Elfrida
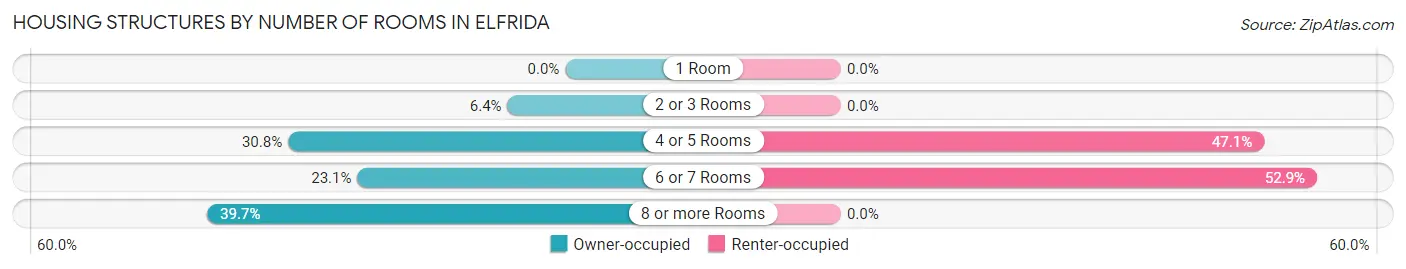
| Number of Rooms | Owner-occupied | Renter-occupied |
| 1 Room | 0 (0.0%) | 0 (0.0%) |
| 2 or 3 Rooms | 5 (6.4%) | 0 (0.0%) |
| 4 or 5 Rooms | 24 (30.8%) | 16 (47.1%) |
| 6 or 7 Rooms | 18 (23.1%) | 18 (52.9%) |
| 8 or more Rooms | 31 (39.7%) | 0 (0.0%) |
| Total | 78 (100.0%) | 34 (100.0%) |
Housing Structure by Heating Type in Elfrida
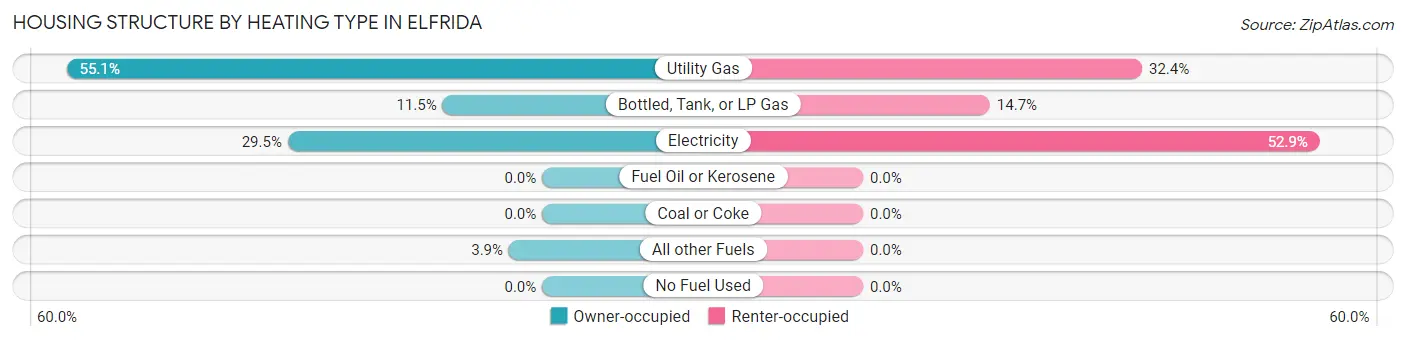
| Heating Type | Owner-occupied | Renter-occupied |
| Utility Gas | 43 (55.1%) | 11 (32.4%) |
| Bottled, Tank, or LP Gas | 9 (11.5%) | 5 (14.7%) |
| Electricity | 23 (29.5%) | 18 (52.9%) |
| Fuel Oil or Kerosene | 0 (0.0%) | 0 (0.0%) |
| Coal or Coke | 0 (0.0%) | 0 (0.0%) |
| All other Fuels | 3 (3.8%) | 0 (0.0%) |
| No Fuel Used | 0 (0.0%) | 0 (0.0%) |
| Total | 78 (100.0%) | 34 (100.0%) |
Household Vehicle Usage in Elfrida
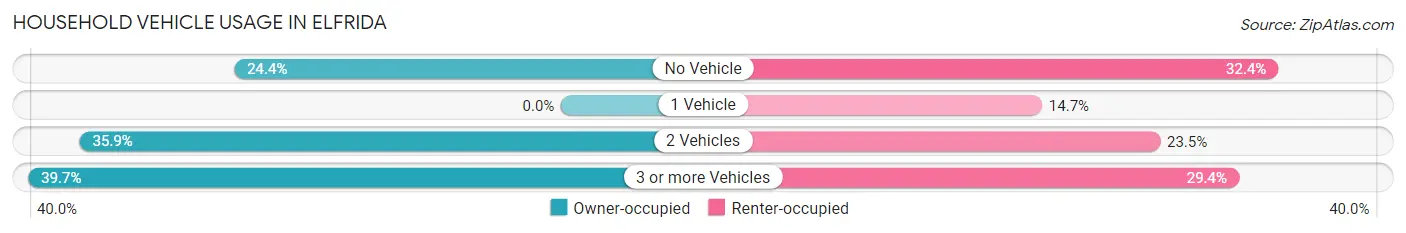
| Vehicles per Household | Owner-occupied | Renter-occupied |
| No Vehicle | 19 (24.4%) | 11 (32.4%) |
| 1 Vehicle | 0 (0.0%) | 5 (14.7%) |
| 2 Vehicles | 28 (35.9%) | 8 (23.5%) |
| 3 or more Vehicles | 31 (39.7%) | 10 (29.4%) |
| Total | 78 (100.0%) | 34 (100.0%) |
Real Estate & Mortgages in Elfrida
Real Estate and Mortgage Overview in Elfrida
| Characteristic | Without Mortgage | With Mortgage |
| Housing Units | 47 | 31 |
| Median Property Value | - | - |
| Median Household Income | $28,194 | $0 |
| Monthly Housing Costs | $289 | $0 |
| Real Estate Taxes | $911 | $0 |
Property Value by Mortgage Status in Elfrida
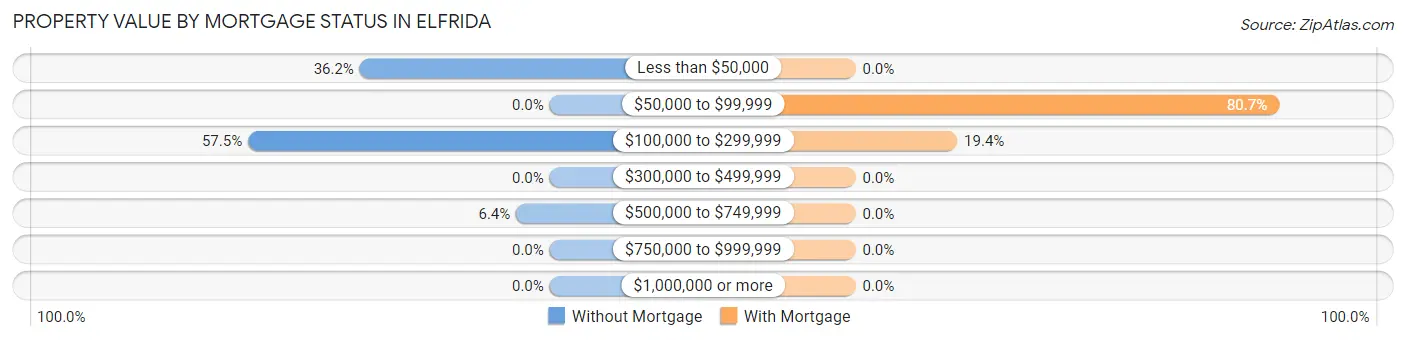
| Property Value | Without Mortgage | With Mortgage |
| Less than $50,000 | 17 (36.2%) | 0 (0.0%) |
| $50,000 to $99,999 | 0 (0.0%) | 25 (80.6%) |
| $100,000 to $299,999 | 27 (57.5%) | 6 (19.4%) |
| $300,000 to $499,999 | 0 (0.0%) | 0 (0.0%) |
| $500,000 to $749,999 | 3 (6.4%) | 0 (0.0%) |
| $750,000 to $999,999 | 0 (0.0%) | 0 (0.0%) |
| $1,000,000 or more | 0 (0.0%) | 0 (0.0%) |
| Total | 47 (100.0%) | 31 (100.0%) |
Household Income by Mortgage Status in Elfrida
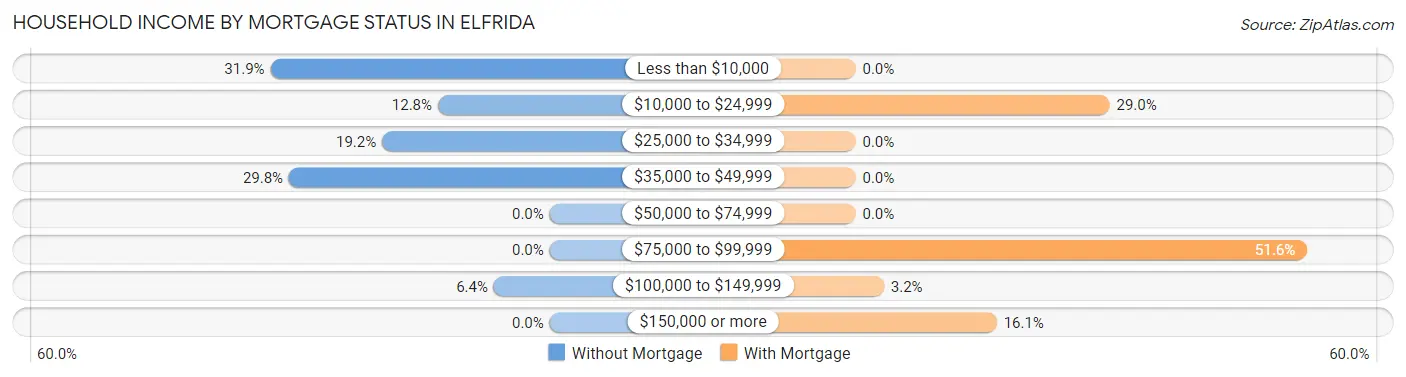
| Household Income | Without Mortgage | With Mortgage |
| Less than $10,000 | 15 (31.9%) | 0 (0.0%) |
| $10,000 to $24,999 | 6 (12.8%) | 9 (29.0%) |
| $25,000 to $34,999 | 9 (19.2%) | 0 (0.0%) |
| $35,000 to $49,999 | 14 (29.8%) | 0 (0.0%) |
| $50,000 to $74,999 | 0 (0.0%) | 0 (0.0%) |
| $75,000 to $99,999 | 0 (0.0%) | 16 (51.6%) |
| $100,000 to $149,999 | 3 (6.4%) | 1 (3.2%) |
| $150,000 or more | 0 (0.0%) | 5 (16.1%) |
| Total | 47 (100.0%) | 31 (100.0%) |
Property Value to Household Income Ratio in Elfrida
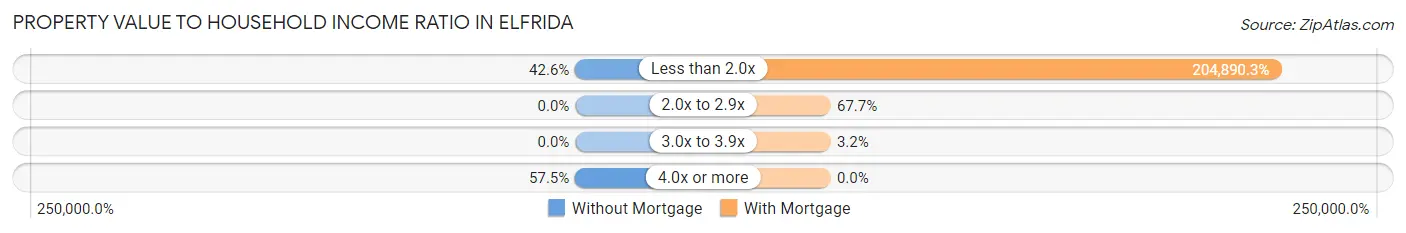
| Value-to-Income Ratio | Without Mortgage | With Mortgage |
| Less than 2.0x | 20 (42.5%) | 63,516 (204,890.3%) |
| 2.0x to 2.9x | 0 (0.0%) | 21 (67.7%) |
| 3.0x to 3.9x | 0 (0.0%) | 1 (3.2%) |
| 4.0x or more | 27 (57.5%) | 0 (0.0%) |
| Total | 47 (100.0%) | 31 (100.0%) |
Real Estate Taxes by Mortgage Status in Elfrida
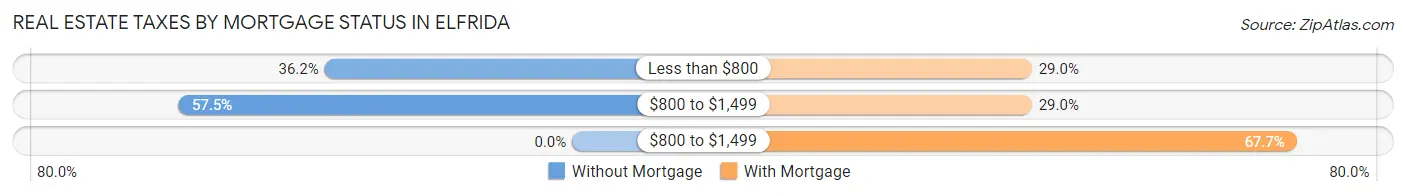
| Property Taxes | Without Mortgage | With Mortgage |
| Less than $800 | 17 (36.2%) | 9 (29.0%) |
| $800 to $1,499 | 27 (57.5%) | 9 (29.0%) |
| $800 to $1,499 | 0 (0.0%) | 21 (67.7%) |
| Total | 47 (100.0%) | 31 (100.0%) |
Health & Disability in Elfrida
Health Insurance Coverage by Age in Elfrida
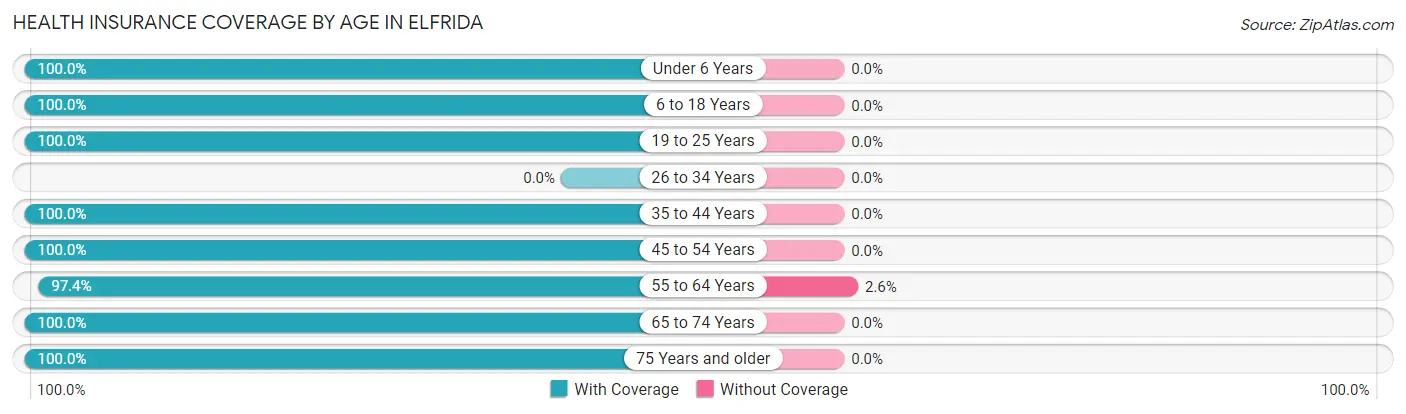
| Age Bracket | With Coverage | Without Coverage |
| Under 6 Years | 21 (100.0%) | 0 (0.0%) |
| 6 to 18 Years | 36 (100.0%) | 0 (0.0%) |
| 19 to 25 Years | 53 (100.0%) | 0 (0.0%) |
| 26 to 34 Years | 0 (0.0%) | 0 (0.0%) |
| 35 to 44 Years | 43 (100.0%) | 0 (0.0%) |
| 45 to 54 Years | 38 (100.0%) | 0 (0.0%) |
| 55 to 64 Years | 38 (97.4%) | 1 (2.6%) |
| 65 to 74 Years | 33 (100.0%) | 0 (0.0%) |
| 75 Years and older | 25 (100.0%) | 0 (0.0%) |
| Total | 287 (99.7%) | 1 (0.4%) |
Health Insurance Coverage by Citizenship Status in Elfrida

| Citizenship Status | With Coverage | Without Coverage |
| Native Born | 21 (100.0%) | 0 (0.0%) |
| Foreign Born, Citizen | 36 (100.0%) | 0 (0.0%) |
| Foreign Born, not a Citizen | 53 (100.0%) | 0 (0.0%) |
Health Insurance Coverage by Household Income in Elfrida
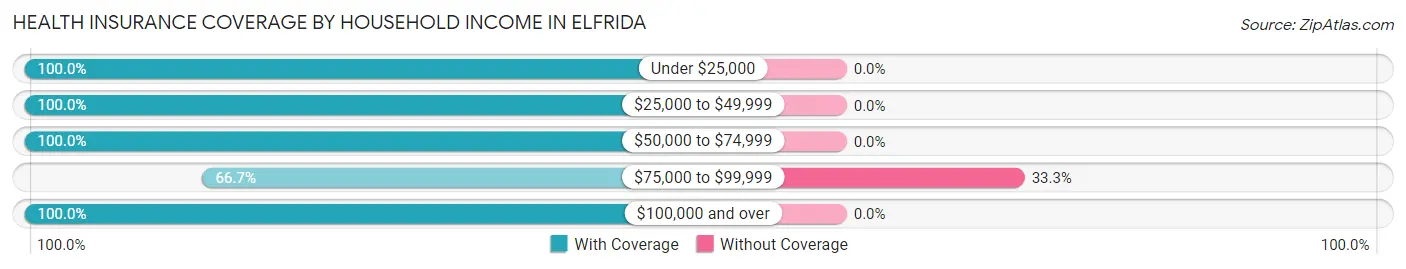
| Household Income | With Coverage | Without Coverage |
| Under $25,000 | 71 (100.0%) | 0 (0.0%) |
| $25,000 to $49,999 | 46 (100.0%) | 0 (0.0%) |
| $50,000 to $74,999 | 117 (100.0%) | 0 (0.0%) |
| $75,000 to $99,999 | 2 (66.7%) | 1 (33.3%) |
| $100,000 and over | 51 (100.0%) | 0 (0.0%) |
Public vs Private Health Insurance Coverage by Age in Elfrida
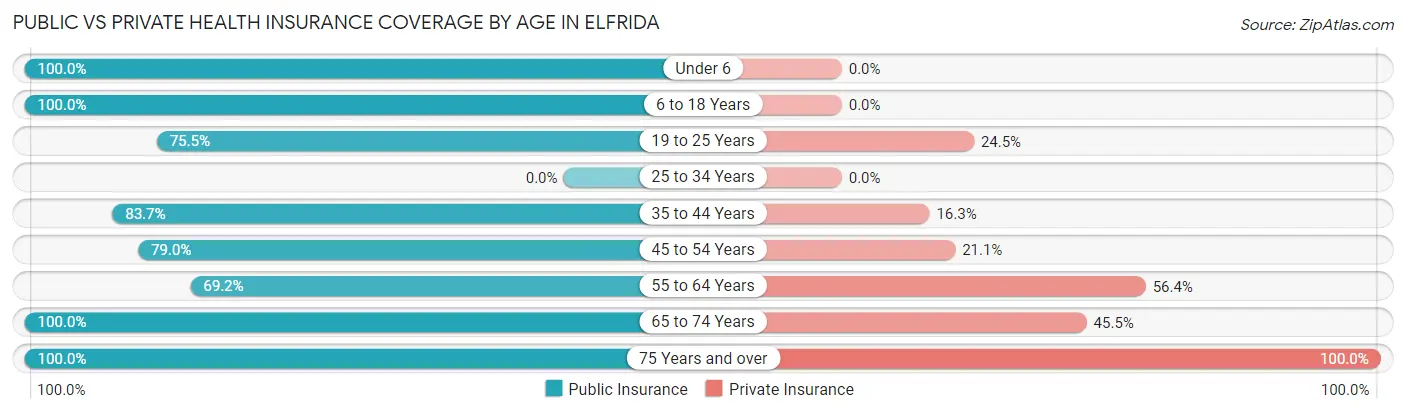
| Age Bracket | Public Insurance | Private Insurance |
| Under 6 | 21 (100.0%) | 0 (0.0%) |
| 6 to 18 Years | 36 (100.0%) | 0 (0.0%) |
| 19 to 25 Years | 40 (75.5%) | 13 (24.5%) |
| 25 to 34 Years | 0 (0.0%) | 0 (0.0%) |
| 35 to 44 Years | 36 (83.7%) | 7 (16.3%) |
| 45 to 54 Years | 30 (78.9%) | 8 (21.0%) |
| 55 to 64 Years | 27 (69.2%) | 22 (56.4%) |
| 65 to 74 Years | 33 (100.0%) | 15 (45.5%) |
| 75 Years and over | 25 (100.0%) | 25 (100.0%) |
| Total | 248 (86.1%) | 90 (31.2%) |
Disability Status by Sex by Age in Elfrida
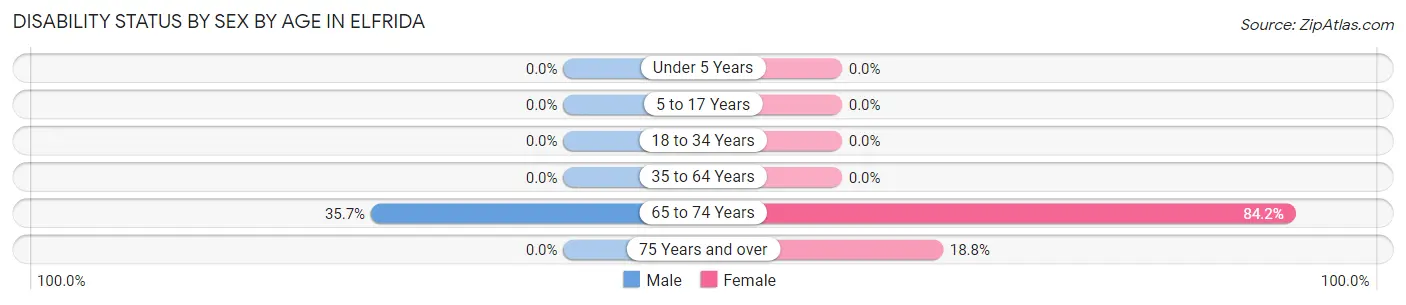
| Age Bracket | Male | Female |
| Under 5 Years | 0 (0.0%) | 0 (0.0%) |
| 5 to 17 Years | 0 (0.0%) | 0 (0.0%) |
| 18 to 34 Years | 0 (0.0%) | 0 (0.0%) |
| 35 to 64 Years | 0 (0.0%) | 0 (0.0%) |
| 65 to 74 Years | 5 (35.7%) | 16 (84.2%) |
| 75 Years and over | 0 (0.0%) | 3 (18.8%) |
Disability Class by Sex by Age in Elfrida
Disability Class: Hearing Difficulty
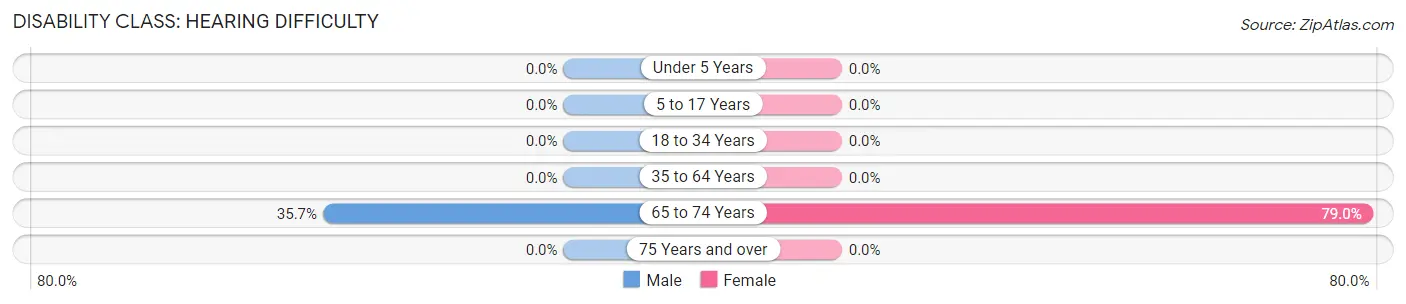
| Age Bracket | Male | Female |
| Under 5 Years | 0 (0.0%) | 0 (0.0%) |
| 5 to 17 Years | 0 (0.0%) | 0 (0.0%) |
| 18 to 34 Years | 0 (0.0%) | 0 (0.0%) |
| 35 to 64 Years | 0 (0.0%) | 0 (0.0%) |
| 65 to 74 Years | 5 (35.7%) | 15 (78.9%) |
| 75 Years and over | 0 (0.0%) | 0 (0.0%) |
Disability Class: Vision Difficulty
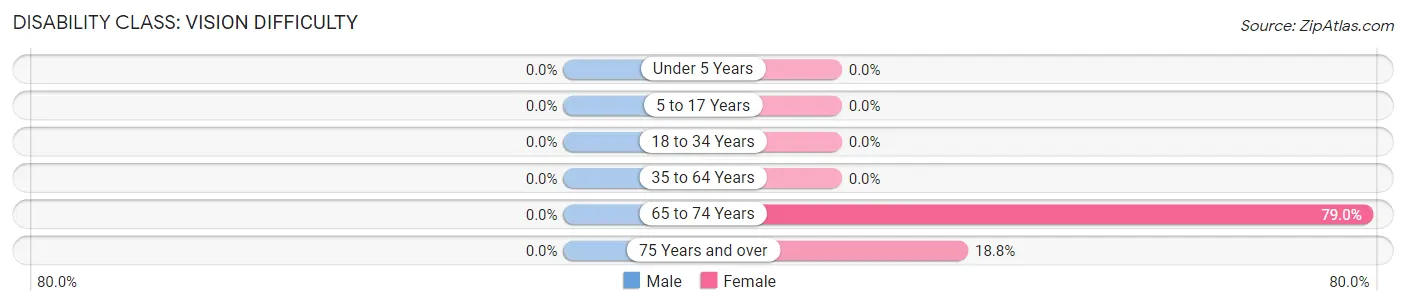
| Age Bracket | Male | Female |
| Under 5 Years | 0 (0.0%) | 0 (0.0%) |
| 5 to 17 Years | 0 (0.0%) | 0 (0.0%) |
| 18 to 34 Years | 0 (0.0%) | 0 (0.0%) |
| 35 to 64 Years | 0 (0.0%) | 0 (0.0%) |
| 65 to 74 Years | 0 (0.0%) | 15 (78.9%) |
| 75 Years and over | 0 (0.0%) | 3 (18.8%) |
Disability Class: Cognitive Difficulty
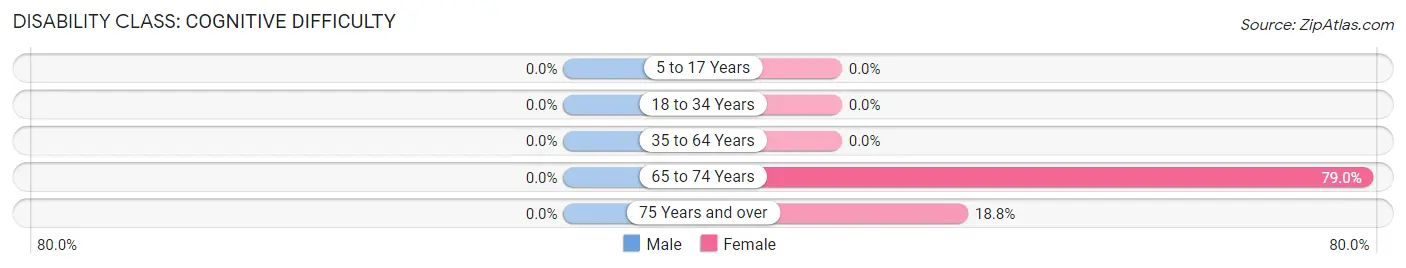
| Age Bracket | Male | Female |
| 5 to 17 Years | 0 (0.0%) | 0 (0.0%) |
| 18 to 34 Years | 0 (0.0%) | 0 (0.0%) |
| 35 to 64 Years | 0 (0.0%) | 0 (0.0%) |
| 65 to 74 Years | 0 (0.0%) | 15 (78.9%) |
| 75 Years and over | 0 (0.0%) | 3 (18.8%) |
Disability Class: Ambulatory Difficulty
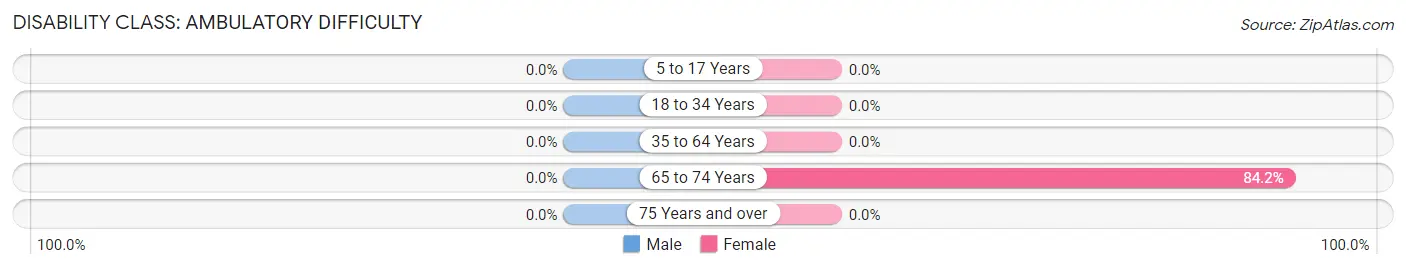
| Age Bracket | Male | Female |
| 5 to 17 Years | 0 (0.0%) | 0 (0.0%) |
| 18 to 34 Years | 0 (0.0%) | 0 (0.0%) |
| 35 to 64 Years | 0 (0.0%) | 0 (0.0%) |
| 65 to 74 Years | 0 (0.0%) | 16 (84.2%) |
| 75 Years and over | 0 (0.0%) | 0 (0.0%) |
Disability Class: Self-Care Difficulty
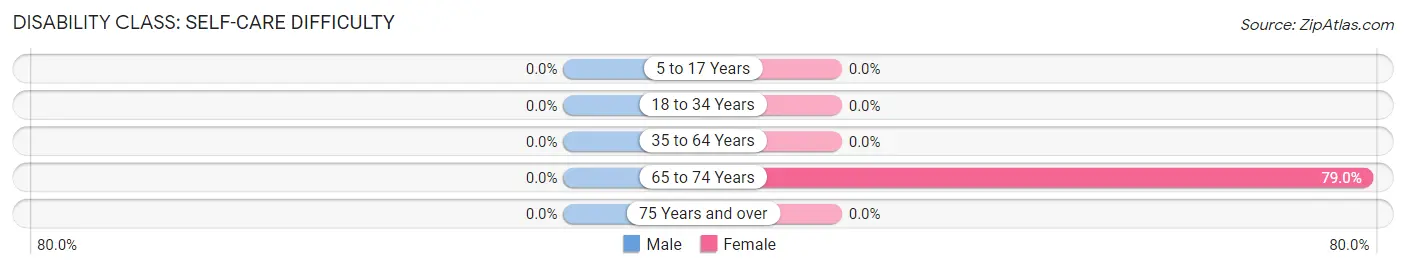
| Age Bracket | Male | Female |
| 5 to 17 Years | 0 (0.0%) | 0 (0.0%) |
| 18 to 34 Years | 0 (0.0%) | 0 (0.0%) |
| 35 to 64 Years | 0 (0.0%) | 0 (0.0%) |
| 65 to 74 Years | 0 (0.0%) | 15 (78.9%) |
| 75 Years and over | 0 (0.0%) | 0 (0.0%) |
Technology Access in Elfrida
Computing Device Access in Elfrida
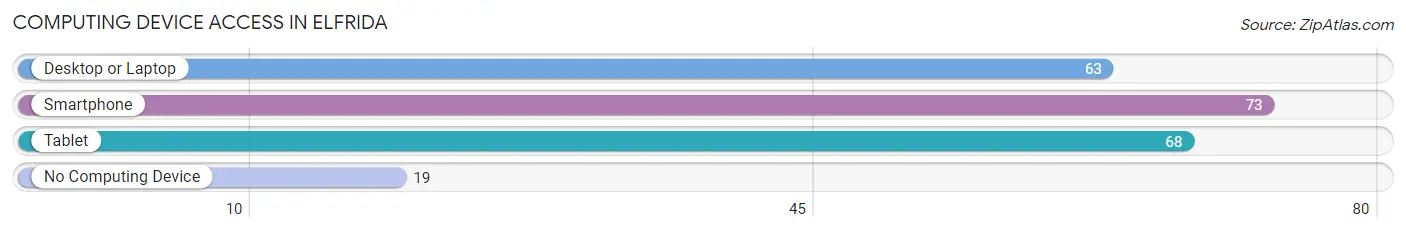
| Device Type | # Households | % Households |
| Desktop or Laptop | 63 | 56.2% |
| Smartphone | 73 | 65.2% |
| Tablet | 68 | 60.7% |
| No Computing Device | 19 | 17.0% |
| Total | 112 | 100.0% |
Internet Access in Elfrida
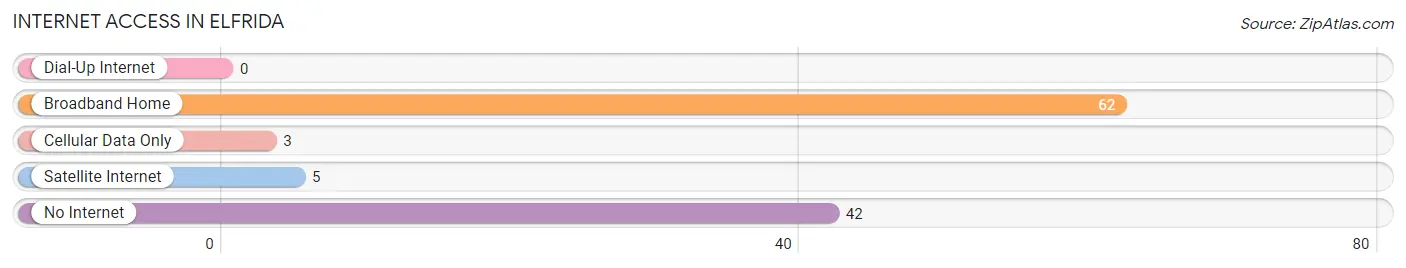
| Internet Type | # Households | % Households |
| Dial-Up Internet | 0 | 0.0% |
| Broadband Home | 62 | 55.4% |
| Cellular Data Only | 3 | 2.7% |
| Satellite Internet | 5 | 4.5% |
| No Internet | 42 | 37.5% |
| Total | 112 | 100.0% |
Elfrida Summary
Elfrida is a small unincorporated community located in Cochise County, Arizona. It is situated in the Sulphur Springs Valley, approximately 25 miles east of Douglas and 25 miles west of Willcox. The population of Elfrida was estimated to be 1,072 in 2019.
History
Elfrida was founded in 1881 by a group of settlers from Missouri. The town was named after Elfrida, the daughter of one of the settlers. The town was originally a farming community, but it soon became a stop on the Southern Pacific Railroad. In the early 1900s, Elfrida was a bustling town with a post office, a school, a hotel, a general store, and a saloon.
In the 1920s, Elfrida began to decline as the railroad moved away and the population decreased. The town was nearly abandoned by the 1940s, but it was revived in the 1950s when the nearby copper mines opened. The town has since become a bedroom community for the copper mines and other nearby industries.
Geography
Elfrida is located in the Sulphur Springs Valley, which is part of the Chihuahuan Desert. The valley is surrounded by the Chiricahua Mountains to the east and the Dragoon Mountains to the west. The valley is known for its hot, dry climate and its sandy soil.
The town of Elfrida is situated at an elevation of 3,945 feet. The town is located on the banks of the San Pedro River, which is a major tributary of the Gila River. The San Pedro River is a popular destination for bird watching and fishing.
Economy
The economy of Elfrida is largely based on the nearby copper mines. The town is also home to a number of small businesses, including a grocery store, a gas station, and a few restaurants.
The town is also home to a number of agricultural operations, including cattle ranches and farms. The area is known for its production of alfalfa, cotton, and pecans.
Demographics
The population of Elfrida was estimated to be 1,072 in 2019. The town is predominantly white, with a small Hispanic population. The median household income in Elfrida is $37,000, and the median home value is $90,000.
The town is served by the Elfrida Elementary School District, which includes one elementary school and one middle school. The town is also home to a number of churches, including the Church of Jesus Christ of Latter-day Saints, the United Methodist Church, and the Church of the Nazarene.
Conclusion
Elfrida is a small unincorporated community located in Cochise County, Arizona. It is situated in the Sulphur Springs Valley, approximately 25 miles east of Douglas and 25 miles west of Willcox. The population of Elfrida was estimated to be 1,072 in 2019. The town is predominantly white, with a small Hispanic population. The economy of Elfrida is largely based on the nearby copper mines, and the town is also home to a number of small businesses and agricultural operations. Elfrida is served by the Elfrida Elementary School District, and the town is also home to a number of churches.
Common Questions
What is Per Capita Income in Elfrida?
Per Capita income in Elfrida is $17,027.
What is the Median Family Income in Elfrida?
Median Family Income in Elfrida is $62,578.
What is the Median Household income in Elfrida?
Median Household Income in Elfrida is $26,250.
What is Inequality or Gini Index in Elfrida?
Inequality or Gini Index in Elfrida is 0.53.
What is the Total Population of Elfrida?
Total Population of Elfrida is 288.
What is the Total Male Population of Elfrida?
Total Male Population of Elfrida is 76.
What is the Total Female Population of Elfrida?
Total Female Population of Elfrida is 212.
What is the Ratio of Males per 100 Females in Elfrida?
There are 35.85 Males per 100 Females in Elfrida.
What is the Ratio of Females per 100 Males in Elfrida?
There are 278.95 Females per 100 Males in Elfrida.
What is the Median Population Age in Elfrida?
Median Population Age in Elfrida is 43.4 Years.
What is the Average Family Size in Elfrida
Average Family Size in Elfrida is 3.6 People.
What is the Average Household Size in Elfrida
Average Household Size in Elfrida is 2.6 People.
How Large is the Labor Force in Elfrida?
There are 101 People in the Labor Forcein in Elfrida.
What is the Percentage of People in the Labor Force in Elfrida?
43.7% of People are in the Labor Force in Elfrida.
What is the Unemployment Rate in Elfrida?
Unemployment Rate in Elfrida is 5.0%.