Cornville, AZ Map & Demographics
Cornville Map
Cornville Overview
$34,110
PER CAPITA INCOME
$75,250
AVG FAMILY INCOME
$68,929
AVG HOUSEHOLD INCOME
12.3%
WAGE / INCOME GAP [ % ]
87.7¢/ $1
WAGE / INCOME GAP [ $ ]
0.38
INEQUALITY / GINI INDEX
3,582
TOTAL POPULATION
1,949
MALE POPULATION
1,633
FEMALE POPULATION
119.35
MALES / 100 FEMALES
83.79
FEMALES / 100 MALES
53.0
MEDIAN AGE
2.9
AVG FAMILY SIZE
2.3
AVG HOUSEHOLD SIZE
2,252
LABOR FORCE [ PEOPLE ]
70.0%
PERCENT IN LABOR FORCE
10.2%
UNEMPLOYMENT RATE
Cornville Zip Codes
Income in Cornville
Income Overview in Cornville
Per Capita Income in Cornville is $34,110, while median incomes of families and households are $75,250 and $68,929 respectively.
| Characteristic | Number | Measure |
| Per Capita Income | 3,582 | $34,110 |
| Median Family Income | 864 | $75,250 |
| Mean Family Income | 864 | $96,898 |
| Median Household Income | 1,558 | $68,929 |
| Mean Household Income | 1,558 | $79,283 |
| Income Deficit | 864 | $0 |
| Wage / Income Gap (%) | 3,582 | 12.32% |
| Wage / Income Gap ($) | 3,582 | 87.68¢ per $1 |
| Gini / Inequality Index | 3,582 | 0.38 |
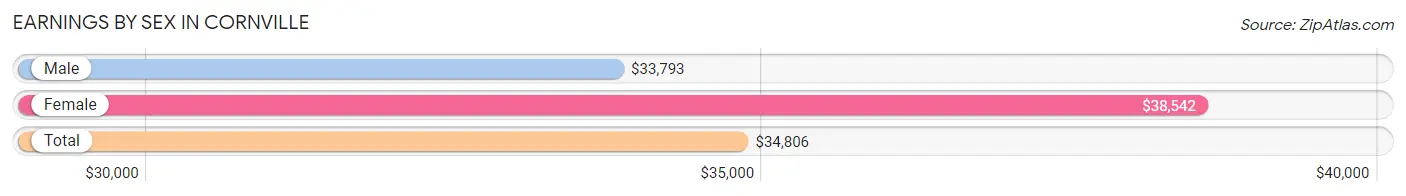
Earnings by Sex in Cornville
Average Earnings in Cornville are $34,806, $33,793 for men and $38,542 for women, a difference of 12.3%.
| Sex | Number | Average Earnings |
| Male | 1,280 (56.2%) | $33,793 |
| Female | 999 (43.8%) | $38,542 |
| Total | 2,279 (100.0%) | $34,806 |
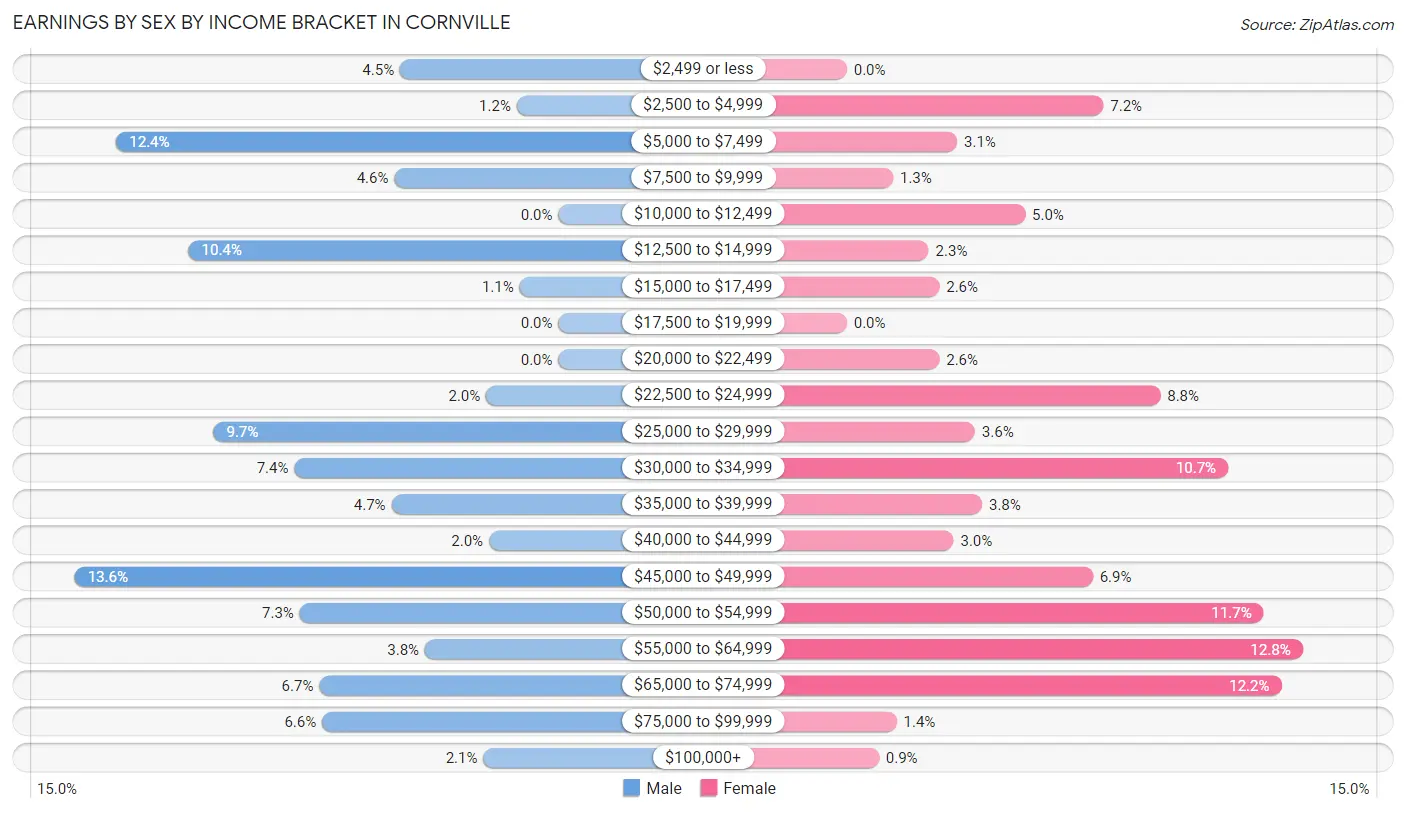
Earnings by Sex by Income Bracket in Cornville
The most common earnings brackets in Cornville are $45,000 to $49,999 for men (174 | 13.6%) and $55,000 to $64,999 for women (128 | 12.8%).
| Income | Male | Female |
| $2,499 or less | 57 (4.4%) | 0 (0.0%) |
| $2,500 to $4,999 | 15 (1.2%) | 72 (7.2%) |
| $5,000 to $7,499 | 159 (12.4%) | 31 (3.1%) |
| $7,500 to $9,999 | 59 (4.6%) | 13 (1.3%) |
| $10,000 to $12,499 | 0 (0.0%) | 50 (5.0%) |
| $12,500 to $14,999 | 133 (10.4%) | 23 (2.3%) |
| $15,000 to $17,499 | 14 (1.1%) | 26 (2.6%) |
| $17,500 to $19,999 | 0 (0.0%) | 0 (0.0%) |
| $20,000 to $22,499 | 0 (0.0%) | 26 (2.6%) |
| $22,500 to $24,999 | 26 (2.0%) | 88 (8.8%) |
| $25,000 to $29,999 | 124 (9.7%) | 36 (3.6%) |
| $30,000 to $34,999 | 95 (7.4%) | 107 (10.7%) |
| $35,000 to $39,999 | 60 (4.7%) | 38 (3.8%) |
| $40,000 to $44,999 | 25 (1.9%) | 30 (3.0%) |
| $45,000 to $49,999 | 174 (13.6%) | 69 (6.9%) |
| $50,000 to $54,999 | 93 (7.3%) | 117 (11.7%) |
| $55,000 to $64,999 | 48 (3.7%) | 128 (12.8%) |
| $65,000 to $74,999 | 86 (6.7%) | 122 (12.2%) |
| $75,000 to $99,999 | 85 (6.6%) | 14 (1.4%) |
| $100,000+ | 27 (2.1%) | 9 (0.9%) |
| Total | 1,280 (100.0%) | 999 (100.0%) |
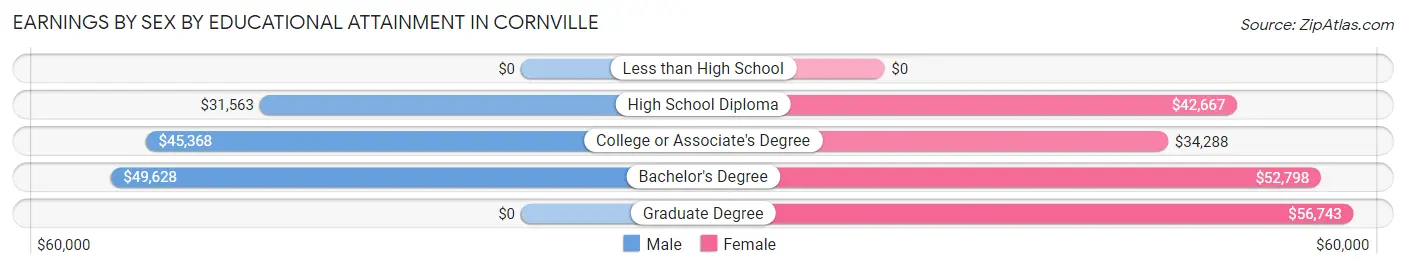
Earnings by Sex by Educational Attainment in Cornville
Average earnings in Cornville are $45,734 for men and $42,708 for women, a difference of 6.6%. Men with an educational attainment of bachelor's degree enjoy the highest average annual earnings of $49,628, while those with high school diploma education earn the least with $31,563. Women with an educational attainment of graduate degree earn the most with the average annual earnings of $56,743, while those with college or associate's degree education have the smallest earnings of $34,288.
| Educational Attainment | Male Income | Female Income |
| Less than High School | - | - |
| High School Diploma | $31,563 | $42,667 |
| College or Associate's Degree | $45,368 | $34,288 |
| Bachelor's Degree | $49,628 | $52,798 |
| Graduate Degree | - | - |
| Total | $45,734 | $42,708 |
Family Income in Cornville
Family Income Brackets in Cornville
According to the Cornville family income data, there are 184 families falling into the $50,000 to $74,999 income range, which is the most common income bracket and makes up 21.3% of all families.
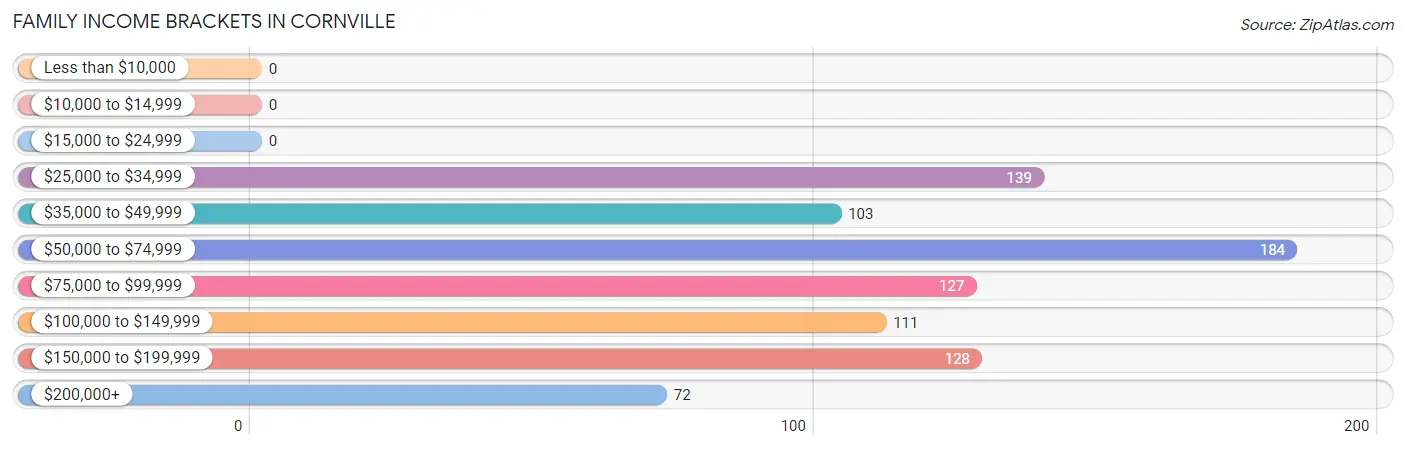
| Income Bracket | # Families | % Families |
| Less than $10,000 | 0 | 0.0% |
| $10,000 to $14,999 | 0 | 0.0% |
| $15,000 to $24,999 | 0 | 0.0% |
| $25,000 to $34,999 | 139 | 16.1% |
| $35,000 to $49,999 | 103 | 11.9% |
| $50,000 to $74,999 | 184 | 21.3% |
| $75,000 to $99,999 | 127 | 14.7% |
| $100,000 to $149,999 | 111 | 12.8% |
| $150,000 to $199,999 | 128 | 14.8% |
| $200,000+ | 72 | 8.3% |
Family Income by Famaliy Size in Cornville
4-person families (140 | 16.2%) account for the highest median family income in Cornville with $165,256 per family, while 4-person families (140 | 16.2%) have the highest median income of $41,314 per family member.
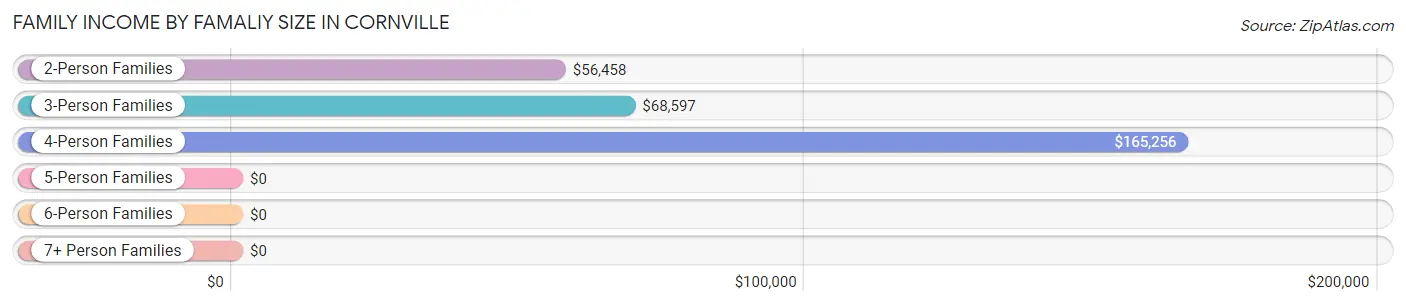
| Income Bracket | # Families | Median Income |
| 2-Person Families | 438 (50.7%) | $56,458 |
| 3-Person Families | 181 (20.9%) | $68,597 |
| 4-Person Families | 140 (16.2%) | $165,256 |
| 5-Person Families | 105 (12.1%) | $0 |
| 6-Person Families | 0 (0.0%) | $0 |
| 7+ Person Families | 0 (0.0%) | $0 |
| Total | 864 (100.0%) | $75,250 |
Family Income by Number of Earners in Cornville
The median family income in Cornville is $75,250, with families comprising 3+ earners (218) having the highest median family income of $165,641, while families with no earners (117) have the lowest median family income of $56,806, accounting for 25.2% and 13.5% of families, respectively.
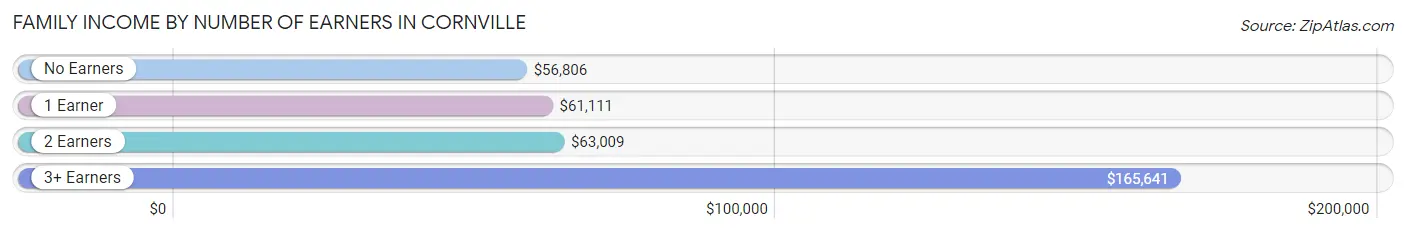
| Number of Earners | # Families | Median Income |
| No Earners | 117 (13.5%) | $56,806 |
| 1 Earner | 298 (34.5%) | $61,111 |
| 2 Earners | 231 (26.7%) | $63,009 |
| 3+ Earners | 218 (25.2%) | $165,641 |
| Total | 864 (100.0%) | $75,250 |
Household Income in Cornville
Household Income Brackets in Cornville
With 361 households falling in the category, the $50,000 to $74,999 income range is the most frequent in Cornville, accounting for 23.2% of all households. In contrast, only 20 households (1.3%) fall into the $15,000 to $24,999 income bracket, making it the least populous group.
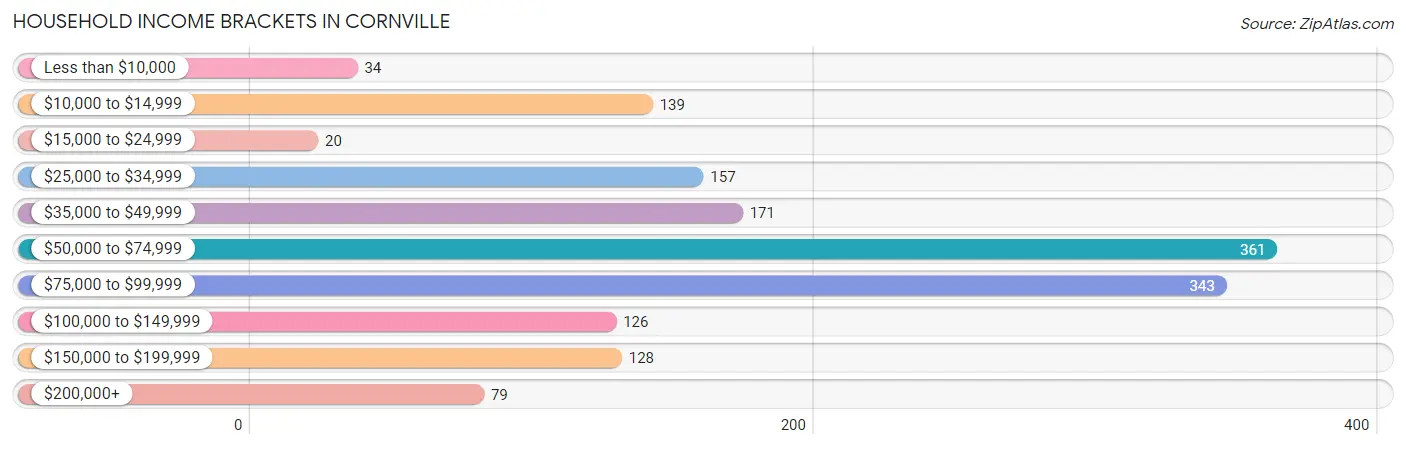
| Income Bracket | # Households | % Households |
| Less than $10,000 | 34 | 2.2% |
| $10,000 to $14,999 | 139 | 8.9% |
| $15,000 to $24,999 | 20 | 1.3% |
| $25,000 to $34,999 | 157 | 10.1% |
| $35,000 to $49,999 | 171 | 11.0% |
| $50,000 to $74,999 | 361 | 23.2% |
| $75,000 to $99,999 | 343 | 22.0% |
| $100,000 to $149,999 | 126 | 8.1% |
| $150,000 to $199,999 | 128 | 8.2% |
| $200,000+ | 79 | 5.1% |
Household Income by Householder Age in Cornville
The median household income in Cornville is $68,929, with the highest median household income of $77,061 found in the 45 to 64 years age bracket for the primary householder. A total of 802 households (51.5%) fall into this category. Meanwhile, the 15 to 24 years age bracket for the primary householder has the lowest median household income of $0, with 57 households (3.7%) in this group.
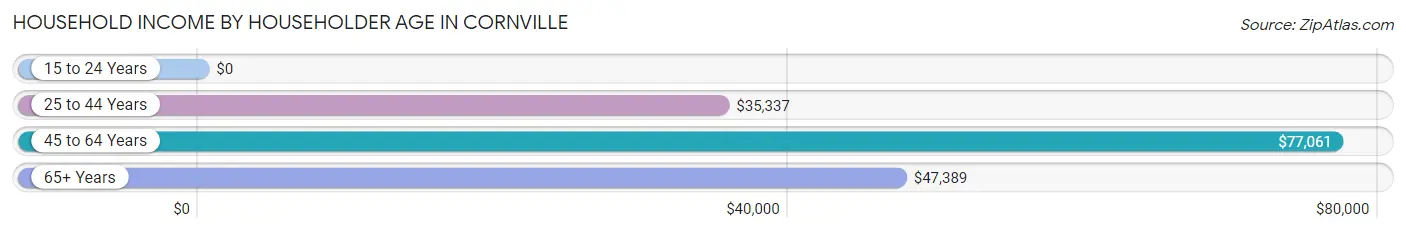
| Income Bracket | # Households | Median Income |
| 15 to 24 Years | 57 (3.7%) | $0 |
| 25 to 44 Years | 241 (15.5%) | $35,337 |
| 45 to 64 Years | 802 (51.5%) | $77,061 |
| 65+ Years | 458 (29.4%) | $47,389 |
| Total | 1,558 (100.0%) | $68,929 |
Poverty in Cornville
Income Below Poverty by Sex and Age in Cornville
With 14.9% poverty level for males and 8.4% for females among the residents of Cornville, 12 to 14 year old males and 15 year old females are the most vulnerable to poverty, with 25 males (100.0%) and 29 females (100.0%) in their respective age groups living below the poverty level.
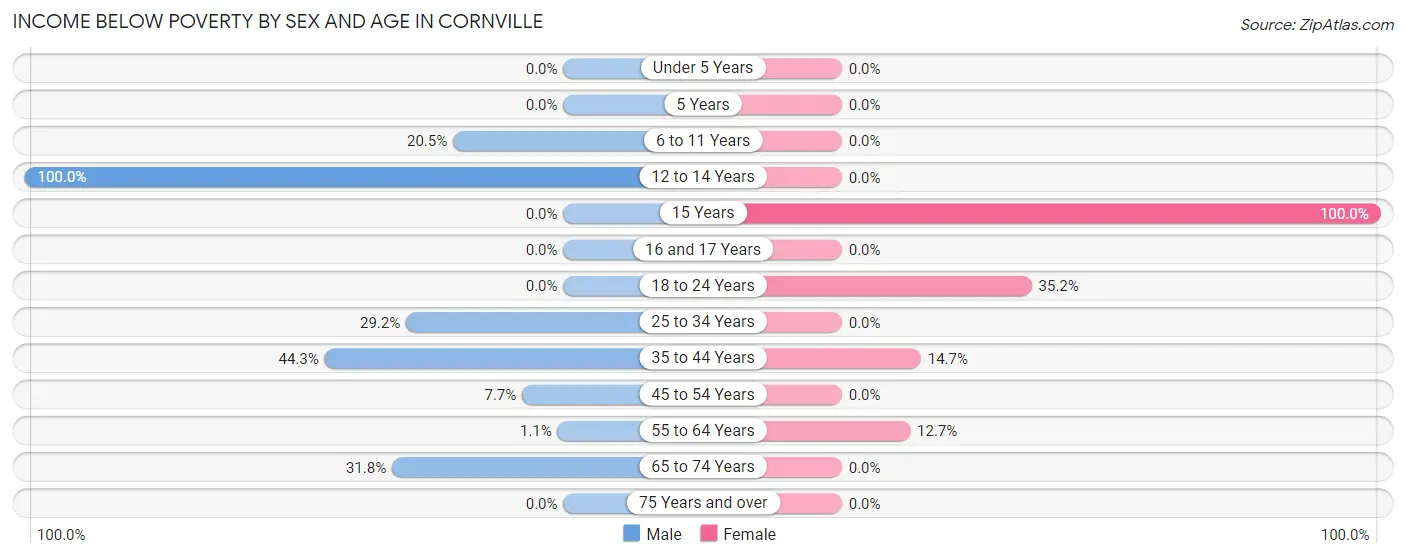
| Age Bracket | Male | Female |
| Under 5 Years | 0 (0.0%) | 0 (0.0%) |
| 5 Years | 0 (0.0%) | 0 (0.0%) |
| 6 to 11 Years | 26 (20.5%) | 0 (0.0%) |
| 12 to 14 Years | 25 (100.0%) | 0 (0.0%) |
| 15 Years | 0 (0.0%) | 29 (100.0%) |
| 16 and 17 Years | 0 (0.0%) | 0 (0.0%) |
| 18 to 24 Years | 0 (0.0%) | 31 (35.2%) |
| 25 to 34 Years | 33 (29.2%) | 0 (0.0%) |
| 35 to 44 Years | 117 (44.3%) | 22 (14.7%) |
| 45 to 54 Years | 15 (7.6%) | 0 (0.0%) |
| 55 to 64 Years | 5 (1.1%) | 54 (12.7%) |
| 65 to 74 Years | 69 (31.8%) | 0 (0.0%) |
| 75 Years and over | 0 (0.0%) | 0 (0.0%) |
| Total | 290 (14.9%) | 136 (8.4%) |
Income Above Poverty by Sex and Age in Cornville
According to the poverty statistics in Cornville, males aged under 5 years and females aged under 5 years are the age groups that are most secure financially, with 100.0% of males and 100.0% of females in these age groups living above the poverty line.
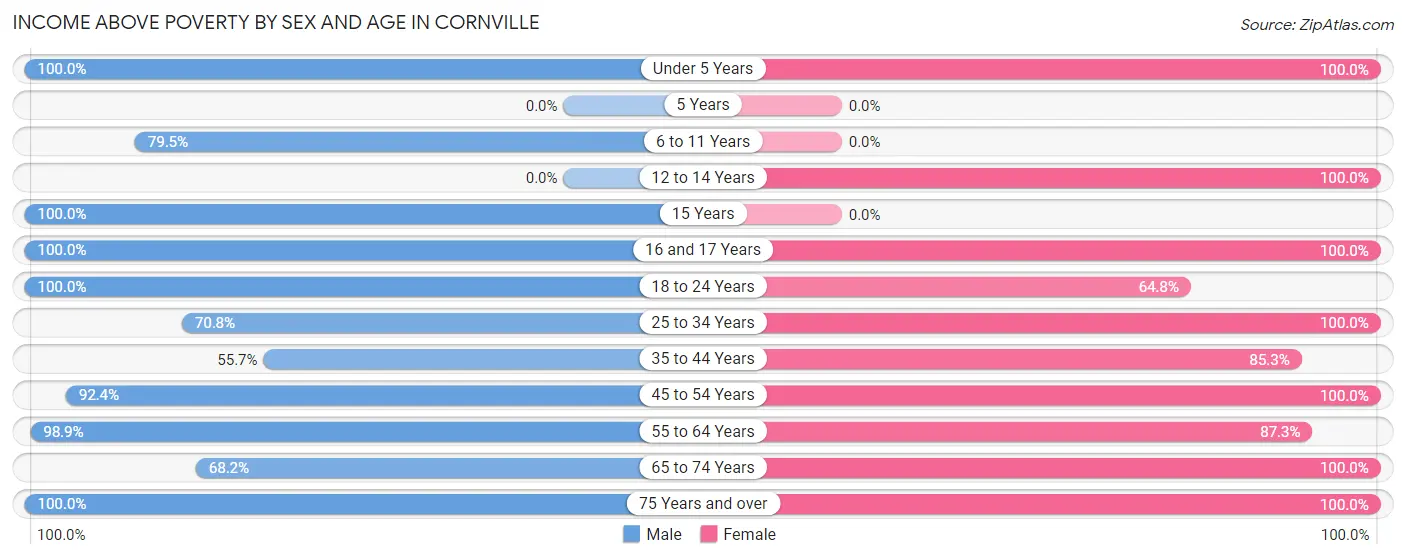
| Age Bracket | Male | Female |
| Under 5 Years | 29 (100.0%) | 45 (100.0%) |
| 5 Years | 0 (0.0%) | 0 (0.0%) |
| 6 to 11 Years | 101 (79.5%) | 0 (0.0%) |
| 12 to 14 Years | 0 (0.0%) | 36 (100.0%) |
| 15 Years | 52 (100.0%) | 0 (0.0%) |
| 16 and 17 Years | 110 (100.0%) | 49 (100.0%) |
| 18 to 24 Years | 236 (100.0%) | 57 (64.8%) |
| 25 to 34 Years | 80 (70.8%) | 93 (100.0%) |
| 35 to 44 Years | 147 (55.7%) | 128 (85.3%) |
| 45 to 54 Years | 181 (92.3%) | 315 (100.0%) |
| 55 to 64 Years | 465 (98.9%) | 372 (87.3%) |
| 65 to 74 Years | 148 (68.2%) | 155 (100.0%) |
| 75 Years and over | 107 (100.0%) | 225 (100.0%) |
| Total | 1,656 (85.1%) | 1,475 (91.6%) |
Income Below Poverty Among Married-Couple Families in Cornville
The poverty statistics for married-couple families in Cornville show that 4.0% or 28 of the total 702 families live below the poverty line. Families with 3 or 4 children have the highest poverty rate of 100.0%, comprising of 28 families. On the other hand, families with no children have the lowest poverty rate of 0.0%, which includes 0 families.
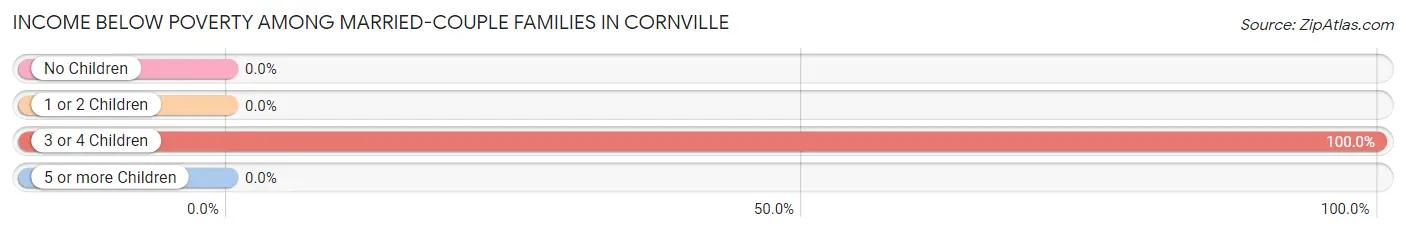
| Children | Above Poverty | Below Poverty |
| No Children | 366 (100.0%) | 0 (0.0%) |
| 1 or 2 Children | 308 (100.0%) | 0 (0.0%) |
| 3 or 4 Children | 0 (0.0%) | 28 (100.0%) |
| 5 or more Children | 0 (0.0%) | 0 (0.0%) |
| Total | 674 (96.0%) | 28 (4.0%) |
Income Below Poverty Among Single-Parent Households in Cornville
| Children | Single Father | Single Mother |
| No Children | 0 (0.0%) | 0 (0.0%) |
| 1 or 2 Children | 0 (0.0%) | 0 (0.0%) |
| 3 or 4 Children | 0 (0.0%) | 0 (0.0%) |
| 5 or more Children | 0 (0.0%) | 0 (0.0%) |
| Total | 0 (0.0%) | 0 (0.0%) |
Income Below Poverty Among Married-Couple vs Single-Parent Households in Cornville
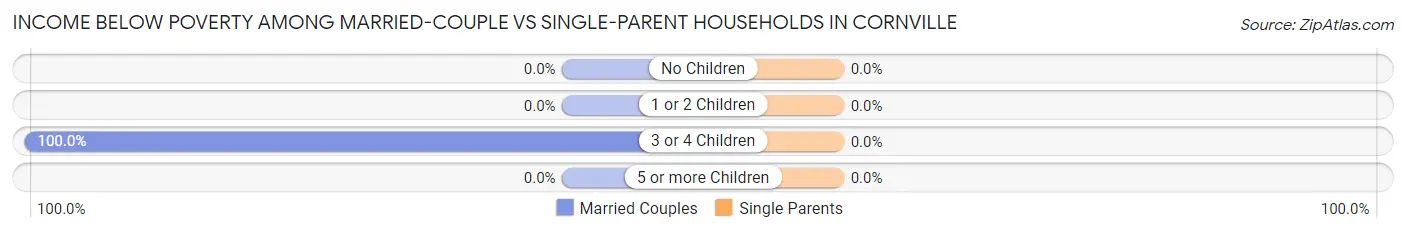
| Children | Married-Couple Families | Single-Parent Households |
| No Children | 0 (0.0%) | 0 (0.0%) |
| 1 or 2 Children | 0 (0.0%) | 0 (0.0%) |
| 3 or 4 Children | 28 (100.0%) | 0 (0.0%) |
| 5 or more Children | 0 (0.0%) | 0 (0.0%) |
| Total | 28 (4.0%) | 0 (0.0%) |
Race in Cornville
The most populous races in Cornville are White / Caucasian (2,989 | 83.5%), Hispanic or Latino (530 | 14.8%), and Some other Race (293 | 8.2%).
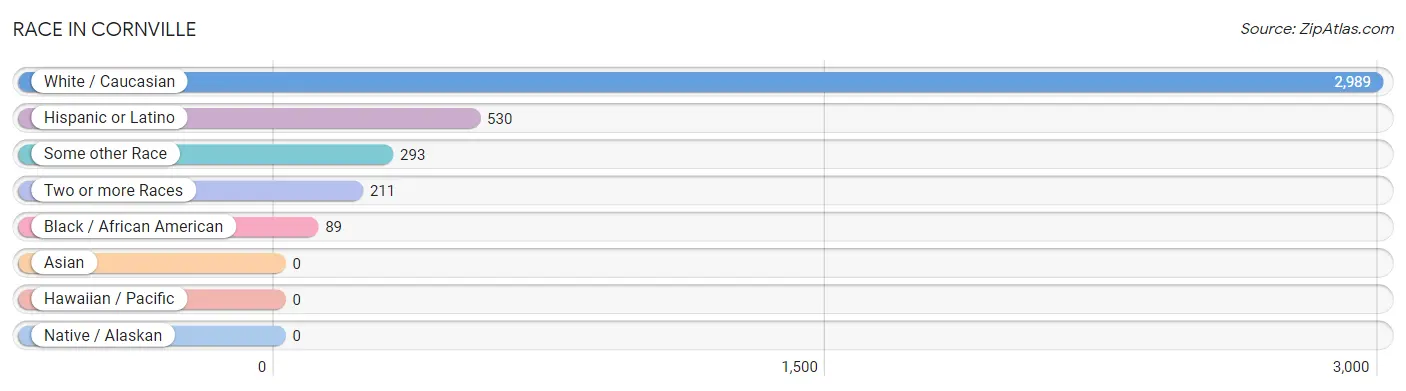
| Race | # Population | % Population |
| Asian | 0 | 0.0% |
| Black / African American | 89 | 2.5% |
| Hawaiian / Pacific | 0 | 0.0% |
| Hispanic or Latino | 530 | 14.8% |
| Native / Alaskan | 0 | 0.0% |
| White / Caucasian | 2,989 | 83.5% |
| Two or more Races | 211 | 5.9% |
| Some other Race | 293 | 8.2% |
| Total | 3,582 | 100.0% |
Ancestry in Cornville
The most populous ancestries reported in Cornville are English (618 | 17.2%), Irish (486 | 13.6%), Mexican (486 | 13.6%), German (417 | 11.6%), and Polish (241 | 6.7%), together accounting for 62.8% of all Cornville residents.
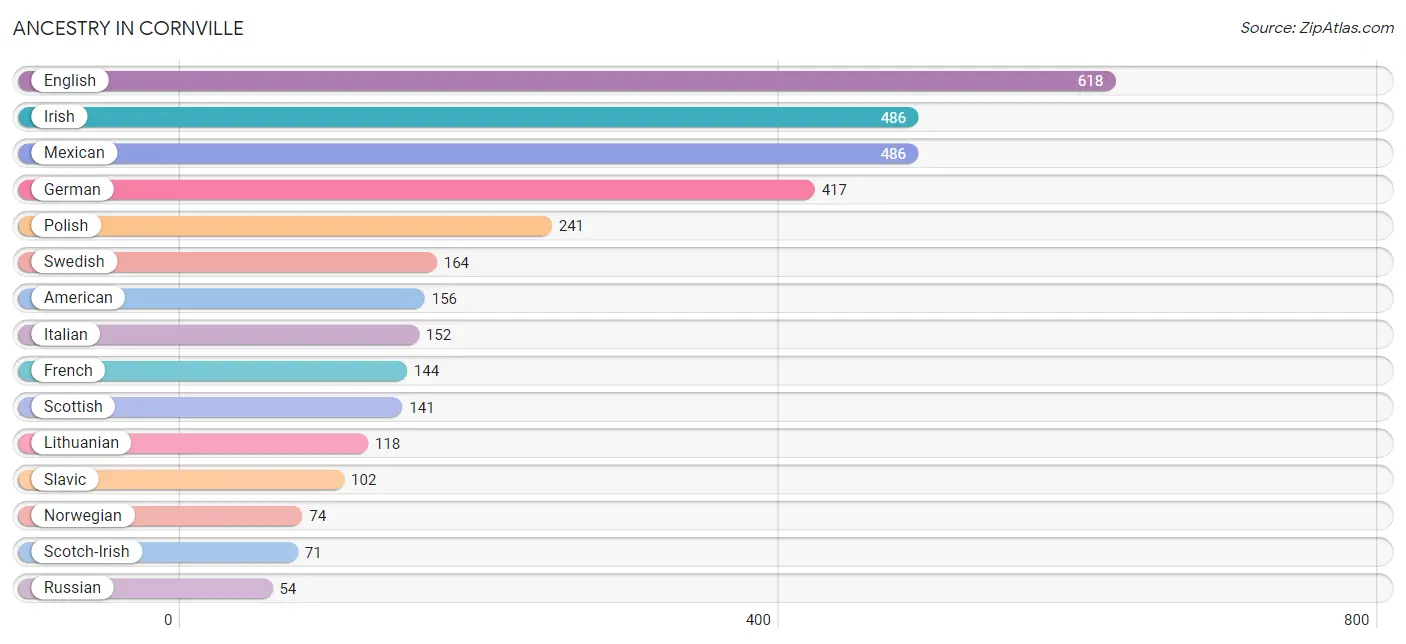
| Ancestry | # Population | % Population |
| American | 156 | 4.4% |
| British | 30 | 0.8% |
| Canadian | 18 | 0.5% |
| Cherokee | 35 | 1.0% |
| Croatian | 6 | 0.2% |
| Czech | 15 | 0.4% |
| Czechoslovakian | 51 | 1.4% |
| Dutch | 17 | 0.5% |
| English | 618 | 17.2% |
| European | 23 | 0.6% |
| French | 144 | 4.0% |
| French Canadian | 46 | 1.3% |
| German | 417 | 11.6% |
| Greek | 49 | 1.4% |
| Hungarian | 31 | 0.9% |
| Irish | 486 | 13.6% |
| Italian | 152 | 4.2% |
| Lithuanian | 118 | 3.3% |
| Mexican | 486 | 13.6% |
| Norwegian | 74 | 2.1% |
| Polish | 241 | 6.7% |
| Puerto Rican | 44 | 1.2% |
| Russian | 54 | 1.5% |
| Scotch-Irish | 71 | 2.0% |
| Scottish | 141 | 3.9% |
| Slavic | 102 | 2.9% |
| Slovak | 25 | 0.7% |
| Slovene | 6 | 0.2% |
| Swedish | 164 | 4.6% |
| Swiss | 40 | 1.1% |
| Welsh | 28 | 0.8% |
| Yugoslavian | 27 | 0.7% | View All 32 Rows |
Immigrants in Cornville
The most numerous immigrant groups reported in Cornville came from Latin America (112 | 3.1%), Europe (104 | 2.9%), Central America (82 | 2.3%), Mexico (82 | 2.3%), and Western Europe (63 | 1.8%), together accounting for 12.4% of all Cornville residents.
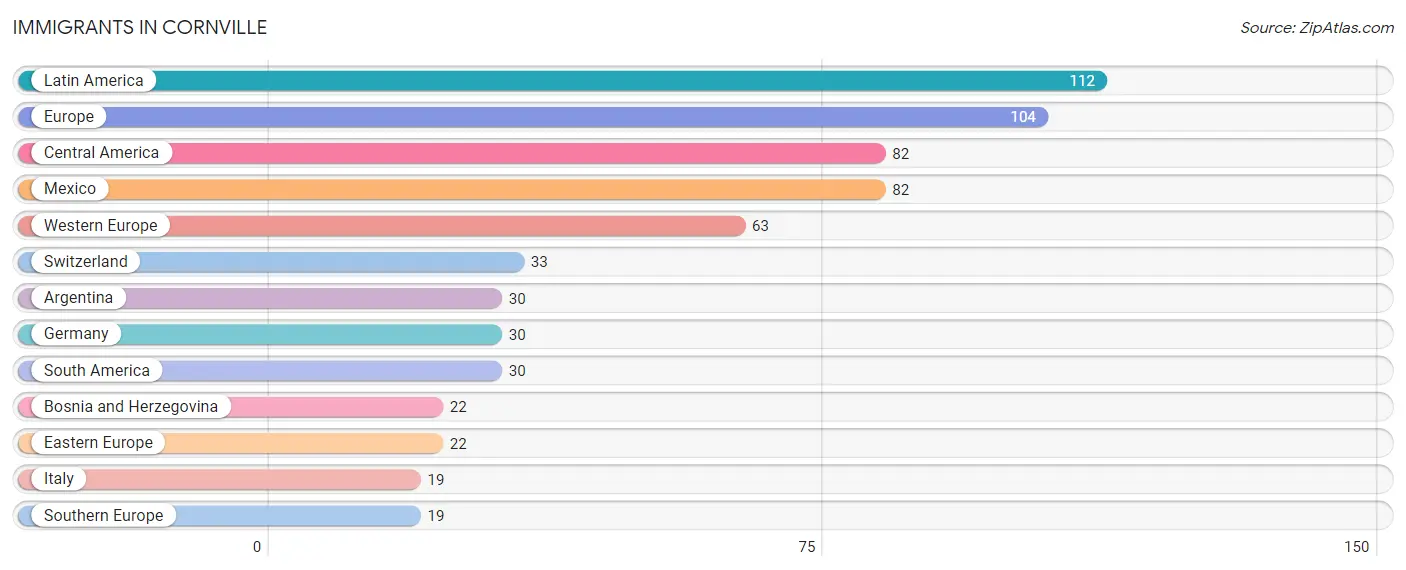
| Immigration Origin | # Population | % Population |
| Argentina | 30 | 0.8% |
| Bosnia and Herzegovina | 22 | 0.6% |
| Central America | 82 | 2.3% |
| Eastern Europe | 22 | 0.6% |
| Europe | 104 | 2.9% |
| Germany | 30 | 0.8% |
| Italy | 19 | 0.5% |
| Latin America | 112 | 3.1% |
| Mexico | 82 | 2.3% |
| South America | 30 | 0.8% |
| Southern Europe | 19 | 0.5% |
| Switzerland | 33 | 0.9% |
| Western Europe | 63 | 1.8% | View All 13 Rows |
Sex and Age in Cornville
Sex and Age in Cornville
The most populous age groups in Cornville are 55 to 59 Years (259 | 13.3%) for men and 50 to 54 Years (297 | 18.2%) for women.
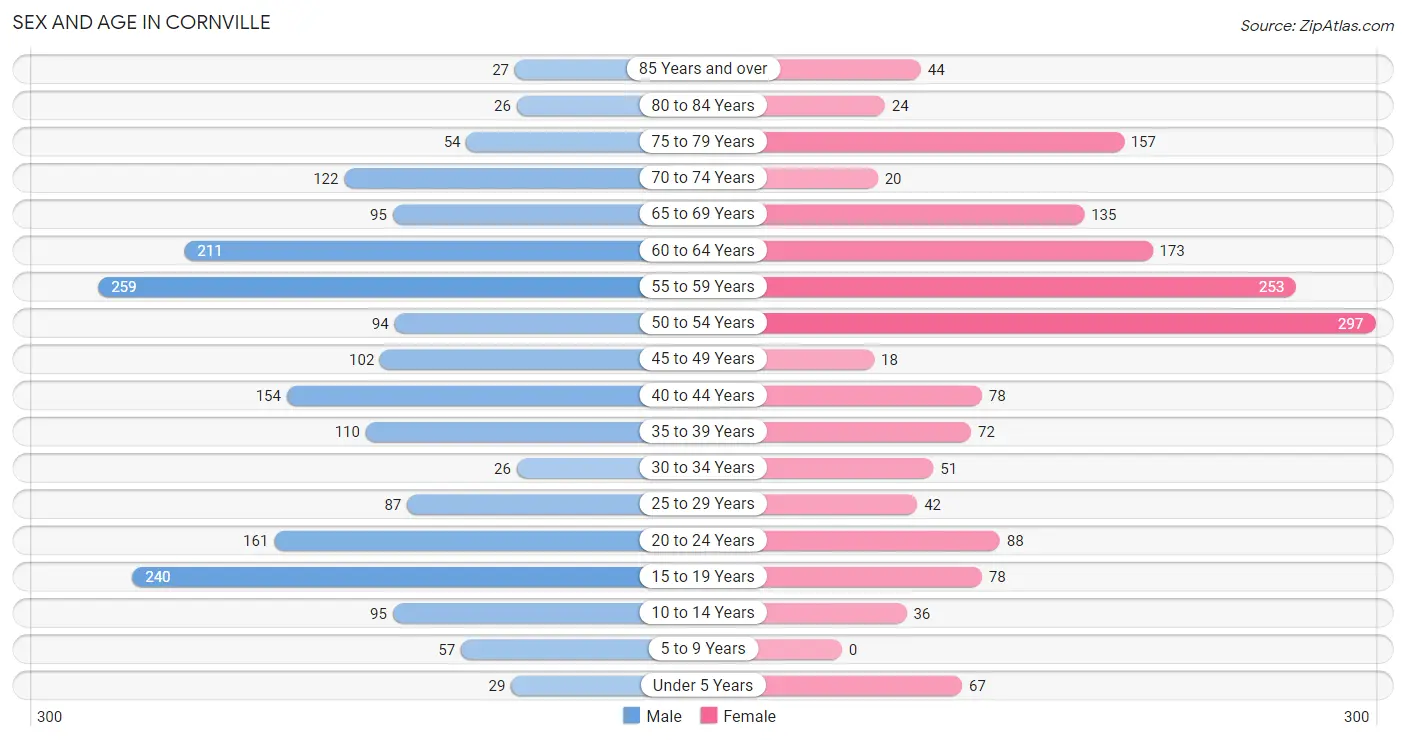
| Age Bracket | Male | Female |
| Under 5 Years | 29 (1.5%) | 67 (4.1%) |
| 5 to 9 Years | 57 (2.9%) | 0 (0.0%) |
| 10 to 14 Years | 95 (4.9%) | 36 (2.2%) |
| 15 to 19 Years | 240 (12.3%) | 78 (4.8%) |
| 20 to 24 Years | 161 (8.3%) | 88 (5.4%) |
| 25 to 29 Years | 87 (4.5%) | 42 (2.6%) |
| 30 to 34 Years | 26 (1.3%) | 51 (3.1%) |
| 35 to 39 Years | 110 (5.6%) | 72 (4.4%) |
| 40 to 44 Years | 154 (7.9%) | 78 (4.8%) |
| 45 to 49 Years | 102 (5.2%) | 18 (1.1%) |
| 50 to 54 Years | 94 (4.8%) | 297 (18.2%) |
| 55 to 59 Years | 259 (13.3%) | 253 (15.5%) |
| 60 to 64 Years | 211 (10.8%) | 173 (10.6%) |
| 65 to 69 Years | 95 (4.9%) | 135 (8.3%) |
| 70 to 74 Years | 122 (6.3%) | 20 (1.2%) |
| 75 to 79 Years | 54 (2.8%) | 157 (9.6%) |
| 80 to 84 Years | 26 (1.3%) | 24 (1.5%) |
| 85 Years and over | 27 (1.4%) | 44 (2.7%) |
| Total | 1,949 (100.0%) | 1,633 (100.0%) |
Families and Households in Cornville
Median Family Size in Cornville
The median family size in Cornville is 2.86 persons per family, with married-couple families (702 | 81.2%) accounting for the largest median family size of 2.93 persons per family. On the other hand, single male/father families (71 | 8.2%) represent the smallest median family size with 2.08 persons per family.
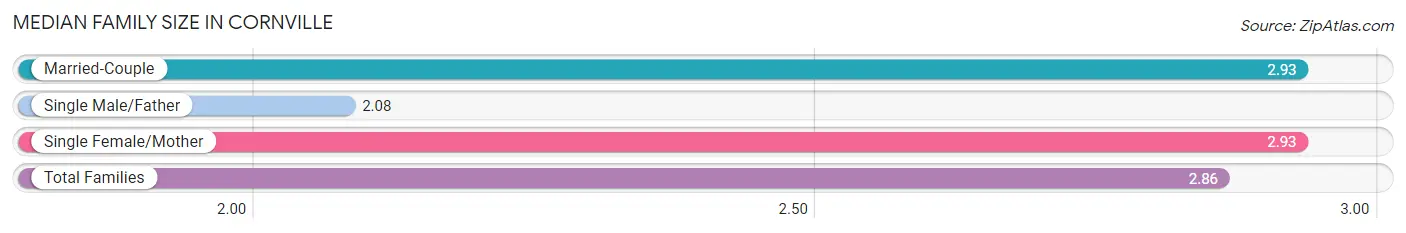
| Family Type | # Families | Family Size |
| Married-Couple | 702 (81.2%) | 2.93 |
| Single Male/Father | 71 (8.2%) | 2.08 |
| Single Female/Mother | 91 (10.5%) | 2.93 |
| Total Families | 864 (100.0%) | 2.86 |
Median Household Size in Cornville
The median household size in Cornville is 2.29 persons per household, with single female/mother households (91 | 5.8%) accounting for the largest median household size of 3.31 persons per household. non-family households (694 | 44.5%) represent the smallest median household size with 1.37 persons per household.
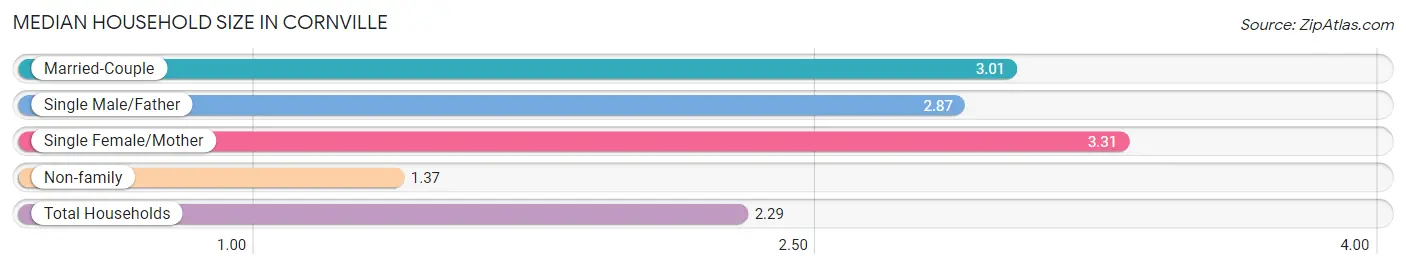
| Household Type | # Households | Household Size |
| Married-Couple | 702 (45.1%) | 3.01 |
| Single Male/Father | 71 (4.6%) | 2.87 |
| Single Female/Mother | 91 (5.8%) | 3.31 |
| Non-family | 694 (44.5%) | 1.37 |
| Total Households | 1,558 (100.0%) | 2.29 |
Household Size by Marriage Status in Cornville
Out of a total of 1,558 households in Cornville, 864 (55.5%) are family households, while 694 (44.5%) are nonfamily households. The most numerous type of family households are 2-person households, comprising 343, and the most common type of nonfamily households are 1-person households, comprising 452.
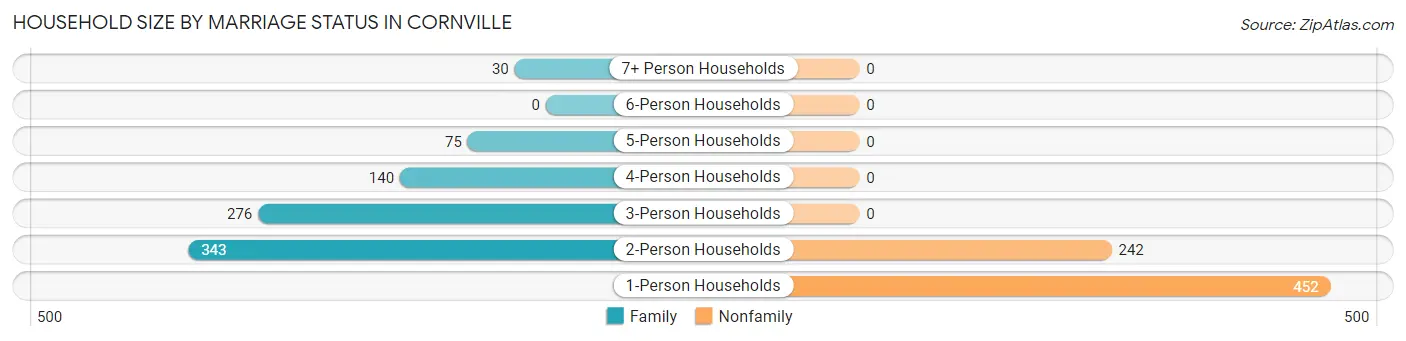
| Household Size | Family Households | Nonfamily Households |
| 1-Person Households | - | 452 (29.0%) |
| 2-Person Households | 343 (22.0%) | 242 (15.5%) |
| 3-Person Households | 276 (17.7%) | 0 (0.0%) |
| 4-Person Households | 140 (9.0%) | 0 (0.0%) |
| 5-Person Households | 75 (4.8%) | 0 (0.0%) |
| 6-Person Households | 0 (0.0%) | 0 (0.0%) |
| 7+ Person Households | 30 (1.9%) | 0 (0.0%) |
| Total | 864 (55.5%) | 694 (44.5%) |
Female Fertility in Cornville
Fertility by Age in Cornville
| Age Bracket | Women with Births | Births / 1,000 Women |
| 15 to 19 years | 0 (0.0%) | 0.0 |
| 20 to 34 years | 0 (0.0%) | 0.0 |
| 35 to 50 years | 0 (0.0%) | 0.0 |
| Total | 0 (0.0%) | 0.0 |
Fertility by Age by Marriage Status in Cornville
| Age Bracket | Married | Unmarried |
| 15 to 19 years | 0 (0.0%) | 0 (0.0%) |
| 20 to 34 years | 0 (0.0%) | 0 (0.0%) |
| 35 to 50 years | 0 (0.0%) | 0 (0.0%) |
| Total | 0 (0.0%) | 0 (0.0%) |
Fertility by Education in Cornville
| Educational Attainment | Women with Births | Births / 1,000 Women |
| Less than High School | 0 (0.0%) | 0.0 |
| High School Diploma | 0 (0.0%) | 0.0 |
| College or Associate's Degree | 0 (0.0%) | 0.0 |
| Bachelor's Degree | 0 (0.0%) | 0.0 |
| Graduate Degree | 0 (0.0%) | 0.0 |
| Total | 0 (0.0%) | 0.0 |
Fertility by Education by Marriage Status in Cornville
| Educational Attainment | Married | Unmarried |
| Less than High School | 0 (0.0%) | 0 (0.0%) |
| High School Diploma | 0 (0.0%) | 0 (0.0%) |
| College or Associate's Degree | 0 (0.0%) | 0 (0.0%) |
| Bachelor's Degree | 0 (0.0%) | 0 (0.0%) |
| Graduate Degree | 0 (0.0%) | 0 (0.0%) |
| Total | 0 (0.0%) | 0 (0.0%) |
Employment Characteristics in Cornville
Employment by Class of Employer in Cornville
Among the 2,021 employed individuals in Cornville, private company employees (1,243 | 61.5%), self-employed (not incorporated) (334 | 16.5%), and local government employees (199 | 9.9%) make up the most common classes of employment.
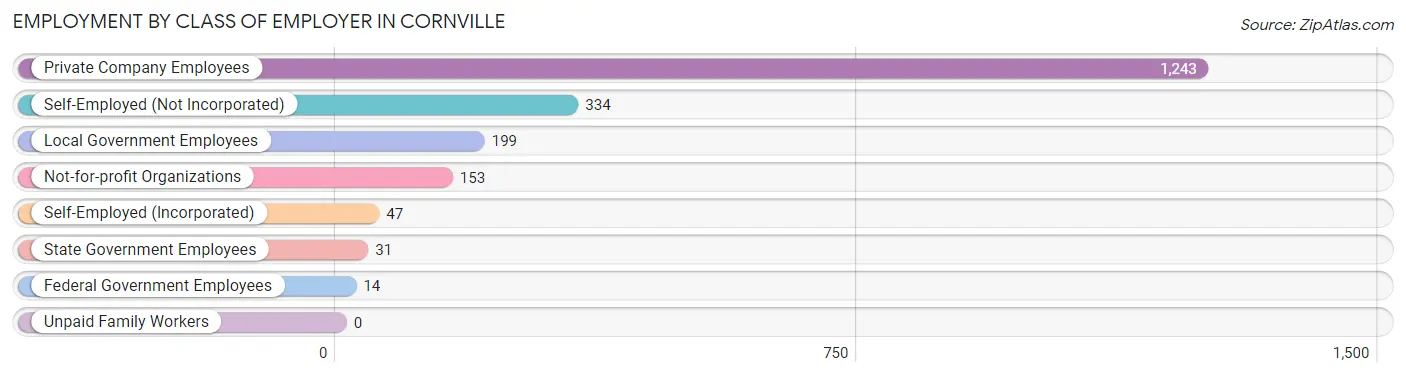
| Employer Class | # Employees | % Employees |
| Private Company Employees | 1,243 | 61.5% |
| Self-Employed (Incorporated) | 47 | 2.3% |
| Self-Employed (Not Incorporated) | 334 | 16.5% |
| Not-for-profit Organizations | 153 | 7.6% |
| Local Government Employees | 199 | 9.9% |
| State Government Employees | 31 | 1.5% |
| Federal Government Employees | 14 | 0.7% |
| Unpaid Family Workers | 0 | 0.0% |
| Total | 2,021 | 100.0% |
Employment Status by Age in Cornville
According to the labor force statistics for Cornville, out of the total population over 16 years of age (3,217), 70.0% or 2,252 individuals are in the labor force, with 10.2% or 230 of them unemployed. The age group with the highest labor force participation rate is 25 to 29 years, with 100.0% or 129 individuals in the labor force. Within the labor force, the 16 to 19 years age range has the highest percentage of unemployed individuals, with 67.2% or 88 of them being unemployed.
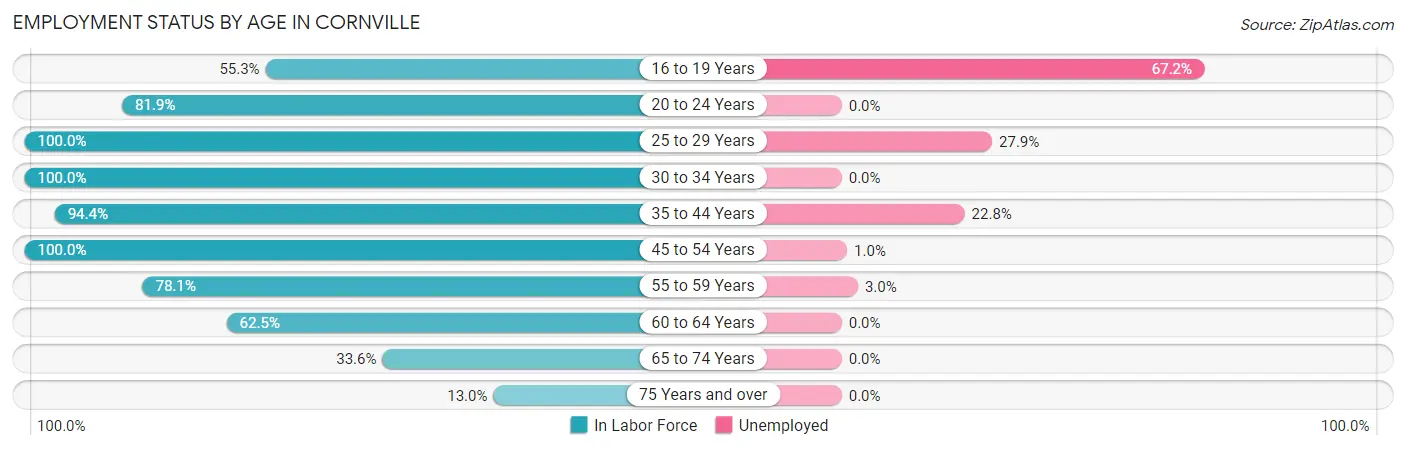
| Age Bracket | In Labor Force | Unemployed |
| 16 to 19 Years | 131 (55.3%) | 88 (67.2%) |
| 20 to 24 Years | 204 (81.9%) | 0 (0.0%) |
| 25 to 29 Years | 129 (100.0%) | 36 (27.9%) |
| 30 to 34 Years | 77 (100.0%) | 0 (0.0%) |
| 35 to 44 Years | 391 (94.4%) | 89 (22.8%) |
| 45 to 54 Years | 511 (100.0%) | 5 (1.0%) |
| 55 to 59 Years | 400 (78.1%) | 12 (3.0%) |
| 60 to 64 Years | 240 (62.5%) | 0 (0.0%) |
| 65 to 74 Years | 125 (33.6%) | 0 (0.0%) |
| 75 Years and over | 43 (13.0%) | 0 (0.0%) |
| Total | 2,252 (70.0%) | 230 (10.2%) |
Employment Status by Educational Attainment in Cornville
According to labor force statistics for Cornville, 86.2% of individuals (1,747) out of the total population between 25 and 64 years of age (2,027) are in the labor force, with 8.1% or 142 of them being unemployed. The group with the highest labor force participation rate are those with the educational attainment of less than high school, with 100.0% or 74 individuals in the labor force. Within the labor force, individuals with less than high school education have the highest percentage of unemployment, with 48.6% or 36 of them being unemployed.
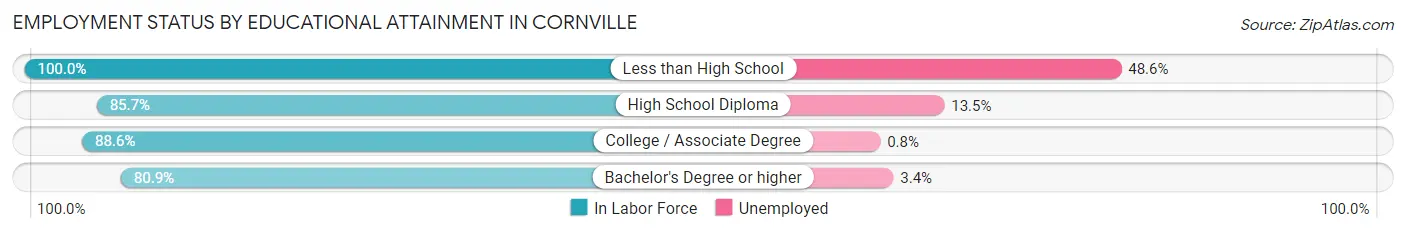
| Educational Attainment | In Labor Force | Unemployed |
| Less than High School | 74 (100.0%) | 36 (48.6%) |
| High School Diploma | 657 (85.7%) | 104 (13.5%) |
| College / Associate Degree | 666 (88.6%) | 6 (0.8%) |
| Bachelor's Degree or higher | 351 (80.9%) | 15 (3.4%) |
| Total | 1,747 (86.2%) | 164 (8.1%) |
Employment Occupations by Sex in Cornville
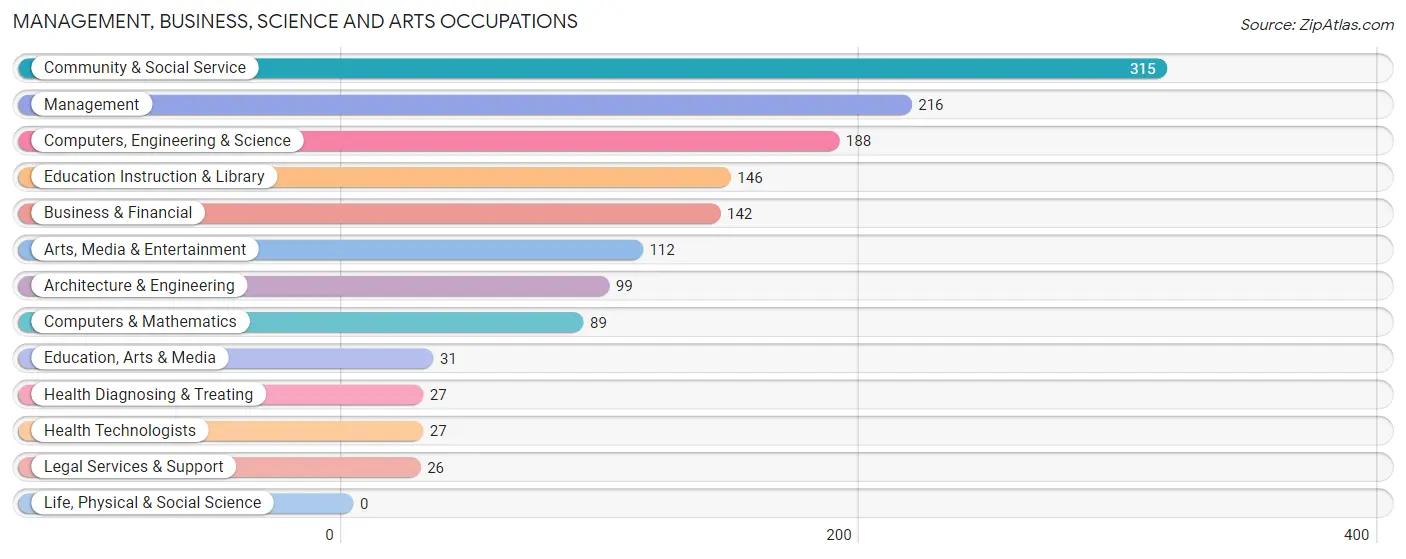
Management, Business, Science and Arts Occupations
The most common Management, Business, Science and Arts occupations in Cornville are Community & Social Service (315 | 15.6%), Management (216 | 10.7%), Computers, Engineering & Science (188 | 9.3%), Education Instruction & Library (146 | 7.2%), and Business & Financial (142 | 7.0%).
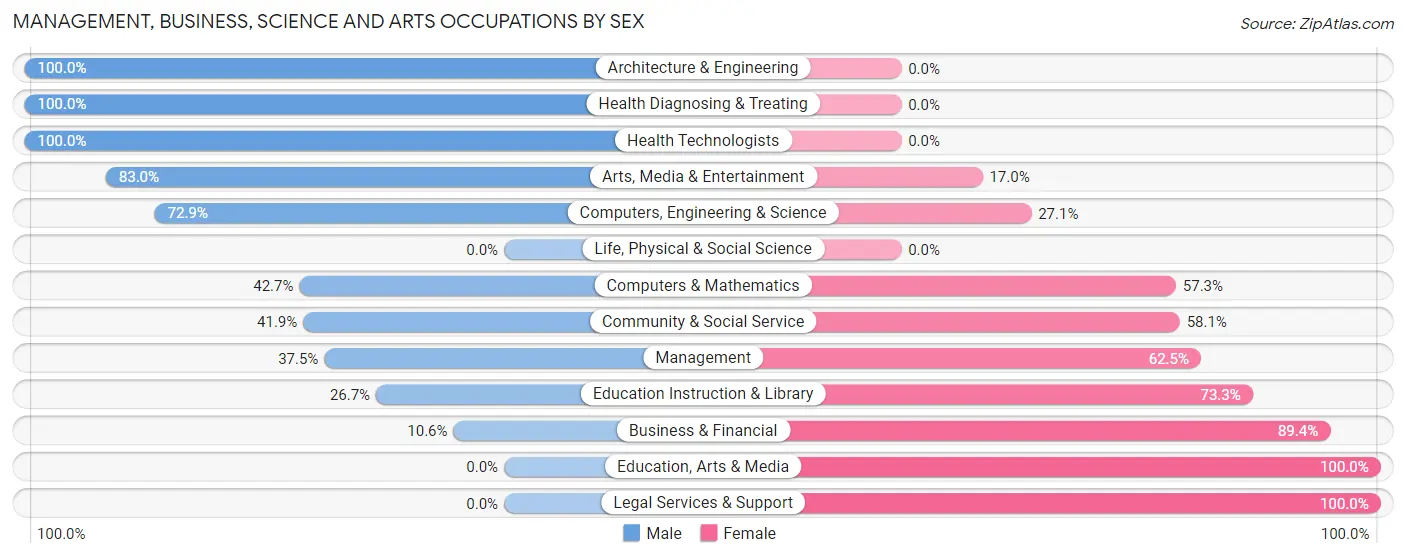
Management, Business, Science and Arts Occupations by Sex
Within the Management, Business, Science and Arts occupations in Cornville, the most male-oriented occupations are Architecture & Engineering (100.0%), Health Diagnosing & Treating (100.0%), and Health Technologists (100.0%), while the most female-oriented occupations are Education, Arts & Media (100.0%), Legal Services & Support (100.0%), and Business & Financial (89.4%).
| Occupation | Male | Female |
| Management | 81 (37.5%) | 135 (62.5%) |
| Business & Financial | 15 (10.6%) | 127 (89.4%) |
| Computers, Engineering & Science | 137 (72.9%) | 51 (27.1%) |
| Computers & Mathematics | 38 (42.7%) | 51 (57.3%) |
| Architecture & Engineering | 99 (100.0%) | 0 (0.0%) |
| Life, Physical & Social Science | 0 (0.0%) | 0 (0.0%) |
| Community & Social Service | 132 (41.9%) | 183 (58.1%) |
| Education, Arts & Media | 0 (0.0%) | 31 (100.0%) |
| Legal Services & Support | 0 (0.0%) | 26 (100.0%) |
| Education Instruction & Library | 39 (26.7%) | 107 (73.3%) |
| Arts, Media & Entertainment | 93 (83.0%) | 19 (17.0%) |
| Health Diagnosing & Treating | 27 (100.0%) | 0 (0.0%) |
| Health Technologists | 27 (100.0%) | 0 (0.0%) |
| Total (Category) | 392 (44.1%) | 496 (55.9%) |
| Total (Overall) | 1,029 (50.9%) | 992 (49.1%) |
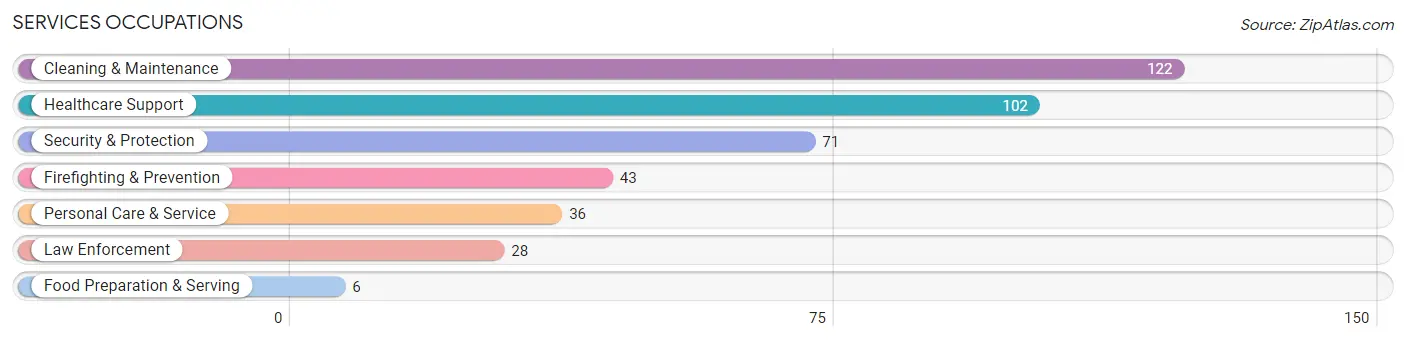
Services Occupations
The most common Services occupations in Cornville are Cleaning & Maintenance (122 | 6.0%), Healthcare Support (102 | 5.1%), Security & Protection (71 | 3.5%), Firefighting & Prevention (43 | 2.1%), and Personal Care & Service (36 | 1.8%).
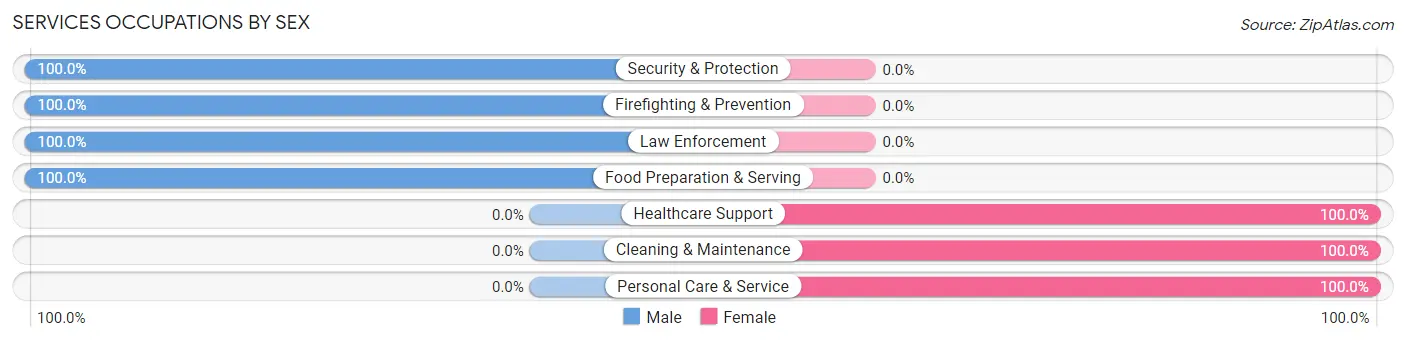
Services Occupations by Sex
Within the Services occupations in Cornville, the most male-oriented occupations are Security & Protection (100.0%), Firefighting & Prevention (100.0%), and Law Enforcement (100.0%), while the most female-oriented occupations are Healthcare Support (100.0%), Cleaning & Maintenance (100.0%), and Personal Care & Service (100.0%).
| Occupation | Male | Female |
| Healthcare Support | 0 (0.0%) | 102 (100.0%) |
| Security & Protection | 71 (100.0%) | 0 (0.0%) |
| Firefighting & Prevention | 43 (100.0%) | 0 (0.0%) |
| Law Enforcement | 28 (100.0%) | 0 (0.0%) |
| Food Preparation & Serving | 6 (100.0%) | 0 (0.0%) |
| Cleaning & Maintenance | 0 (0.0%) | 122 (100.0%) |
| Personal Care & Service | 0 (0.0%) | 36 (100.0%) |
| Total (Category) | 77 (22.9%) | 260 (77.1%) |
| Total (Overall) | 1,029 (50.9%) | 992 (49.1%) |
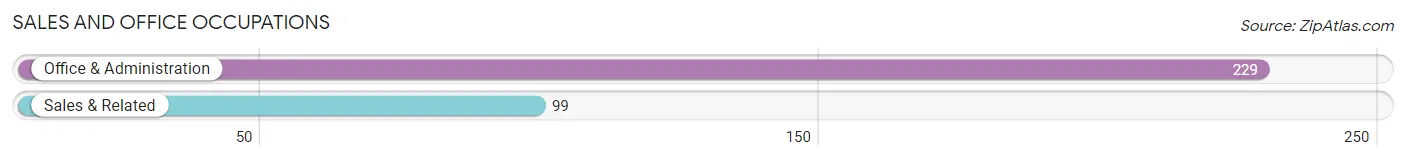
Sales and Office Occupations
The most common Sales and Office occupations in Cornville are Office & Administration (229 | 11.3%), and Sales & Related (99 | 4.9%).
Sales and Office Occupations by Sex
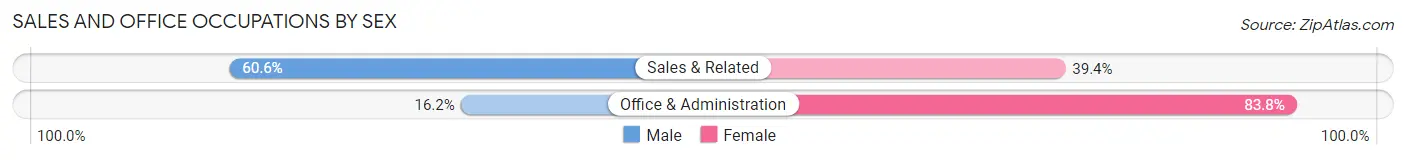
| Occupation | Male | Female |
| Sales & Related | 60 (60.6%) | 39 (39.4%) |
| Office & Administration | 37 (16.2%) | 192 (83.8%) |
| Total (Category) | 97 (29.6%) | 231 (70.4%) |
| Total (Overall) | 1,029 (50.9%) | 992 (49.1%) |
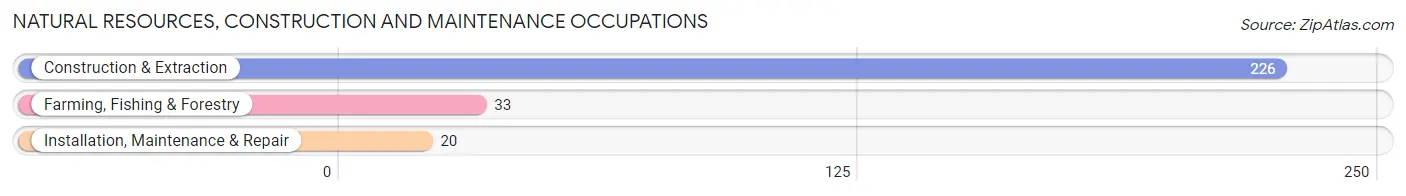
Natural Resources, Construction and Maintenance Occupations
The most common Natural Resources, Construction and Maintenance occupations in Cornville are Construction & Extraction (226 | 11.2%), Farming, Fishing & Forestry (33 | 1.6%), and Installation, Maintenance & Repair (20 | 1.0%).
Natural Resources, Construction and Maintenance Occupations by Sex
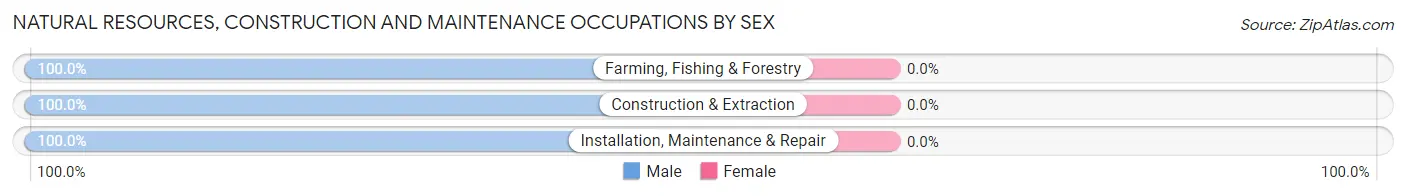
| Occupation | Male | Female |
| Farming, Fishing & Forestry | 33 (100.0%) | 0 (0.0%) |
| Construction & Extraction | 226 (100.0%) | 0 (0.0%) |
| Installation, Maintenance & Repair | 20 (100.0%) | 0 (0.0%) |
| Total (Category) | 279 (100.0%) | 0 (0.0%) |
| Total (Overall) | 1,029 (50.9%) | 992 (49.1%) |
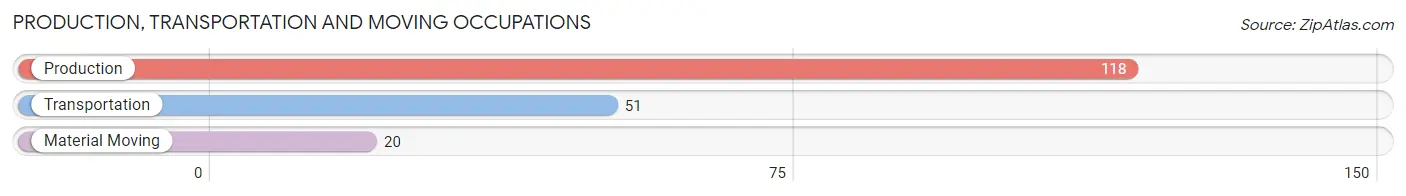
Production, Transportation and Moving Occupations
The most common Production, Transportation and Moving occupations in Cornville are Production (118 | 5.8%), Transportation (51 | 2.5%), and Material Moving (20 | 1.0%).
Production, Transportation and Moving Occupations by Sex
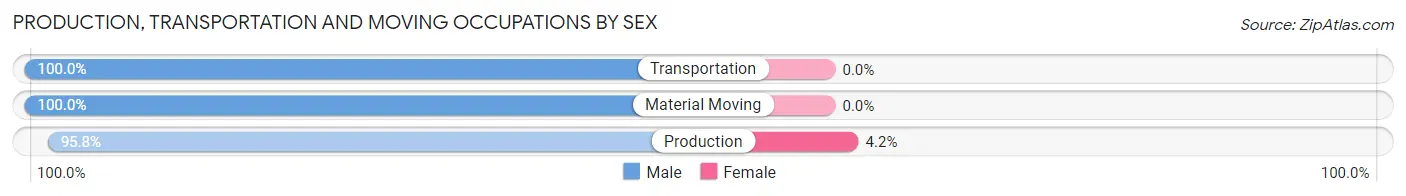
| Occupation | Male | Female |
| Production | 113 (95.8%) | 5 (4.2%) |
| Transportation | 51 (100.0%) | 0 (0.0%) |
| Material Moving | 20 (100.0%) | 0 (0.0%) |
| Total (Category) | 184 (97.4%) | 5 (2.6%) |
| Total (Overall) | 1,029 (50.9%) | 992 (49.1%) |
Employment Industries by Sex in Cornville
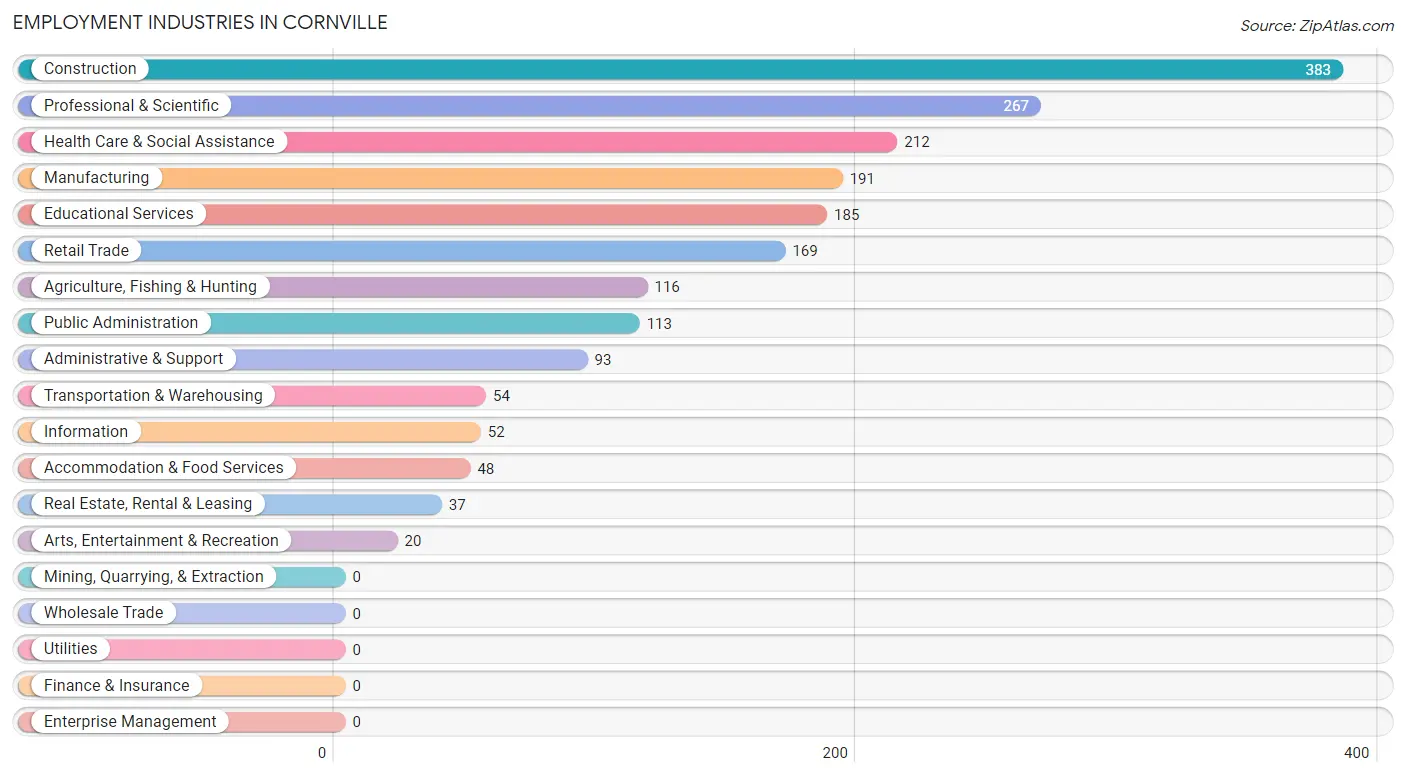
Employment Industries in Cornville
The major employment industries in Cornville include Construction (383 | 19.0%), Professional & Scientific (267 | 13.2%), Health Care & Social Assistance (212 | 10.5%), Manufacturing (191 | 9.5%), and Educational Services (185 | 9.1%).
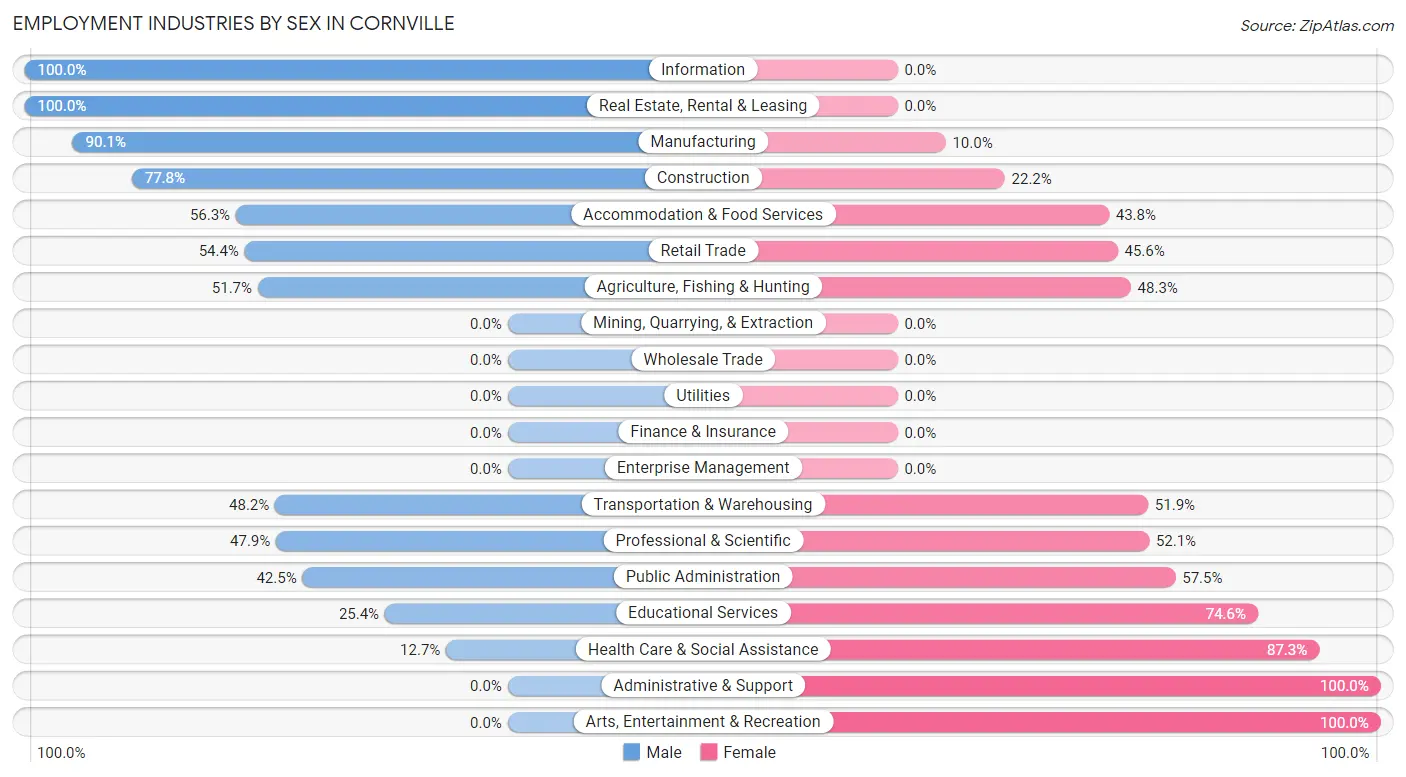
Employment Industries by Sex in Cornville
The Cornville industries that see more men than women are Information (100.0%), Real Estate, Rental & Leasing (100.0%), and Manufacturing (90.0%), whereas the industries that tend to have a higher number of women are Administrative & Support (100.0%), Arts, Entertainment & Recreation (100.0%), and Health Care & Social Assistance (87.3%).
| Industry | Male | Female |
| Agriculture, Fishing & Hunting | 60 (51.7%) | 56 (48.3%) |
| Mining, Quarrying, & Extraction | 0 (0.0%) | 0 (0.0%) |
| Construction | 298 (77.8%) | 85 (22.2%) |
| Manufacturing | 172 (90.0%) | 19 (10.0%) |
| Wholesale Trade | 0 (0.0%) | 0 (0.0%) |
| Retail Trade | 92 (54.4%) | 77 (45.6%) |
| Transportation & Warehousing | 26 (48.1%) | 28 (51.8%) |
| Utilities | 0 (0.0%) | 0 (0.0%) |
| Information | 52 (100.0%) | 0 (0.0%) |
| Finance & Insurance | 0 (0.0%) | 0 (0.0%) |
| Real Estate, Rental & Leasing | 37 (100.0%) | 0 (0.0%) |
| Professional & Scientific | 128 (47.9%) | 139 (52.1%) |
| Enterprise Management | 0 (0.0%) | 0 (0.0%) |
| Administrative & Support | 0 (0.0%) | 93 (100.0%) |
| Educational Services | 47 (25.4%) | 138 (74.6%) |
| Health Care & Social Assistance | 27 (12.7%) | 185 (87.3%) |
| Arts, Entertainment & Recreation | 0 (0.0%) | 20 (100.0%) |
| Accommodation & Food Services | 27 (56.2%) | 21 (43.8%) |
| Public Administration | 48 (42.5%) | 65 (57.5%) |
| Total | 1,029 (50.9%) | 992 (49.1%) |
Education in Cornville
School Enrollment in Cornville
The most common levels of schooling among the 740 students in Cornville are high school (304 | 41.1%), college / undergraduate (243 | 32.8%), and middle school (113 | 15.3%).
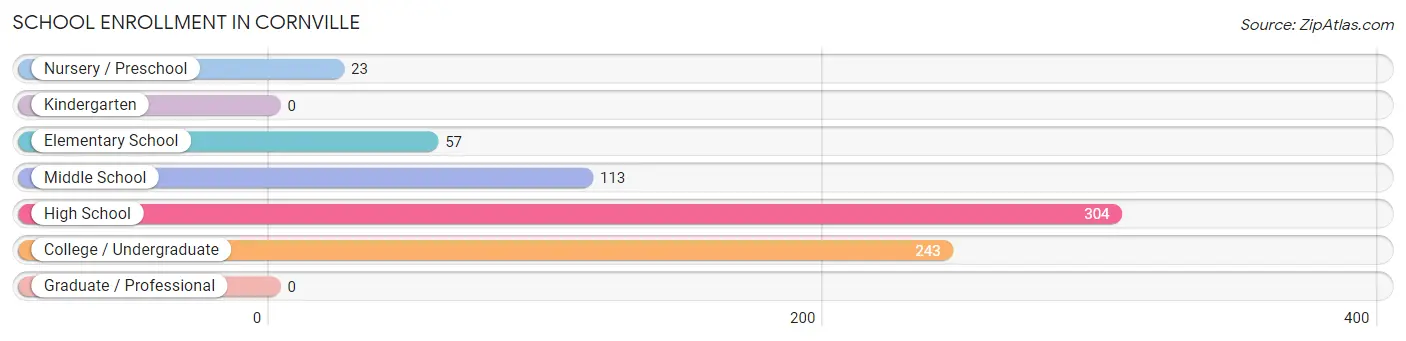
| School Level | # Students | % Students |
| Nursery / Preschool | 23 | 3.1% |
| Kindergarten | 0 | 0.0% |
| Elementary School | 57 | 7.7% |
| Middle School | 113 | 15.3% |
| High School | 304 | 41.1% |
| College / Undergraduate | 243 | 32.8% |
| Graduate / Professional | 0 | 0.0% |
| Total | 740 | 100.0% |
School Enrollment by Age by Funding Source in Cornville
Out of a total of 740 students who are enrolled in schools in Cornville, 184 (24.9%) attend a private institution, while the remaining 556 (75.1%) are enrolled in public schools. The age group of 3 to 4 year olds has the highest likelihood of being enrolled in private schools, with 23 (100.0% in the age bracket) enrolled. Conversely, the age group of 5 to 9 year old has the lowest likelihood of being enrolled in a private school, with 57 (100.0% in the age bracket) attending a public institution.
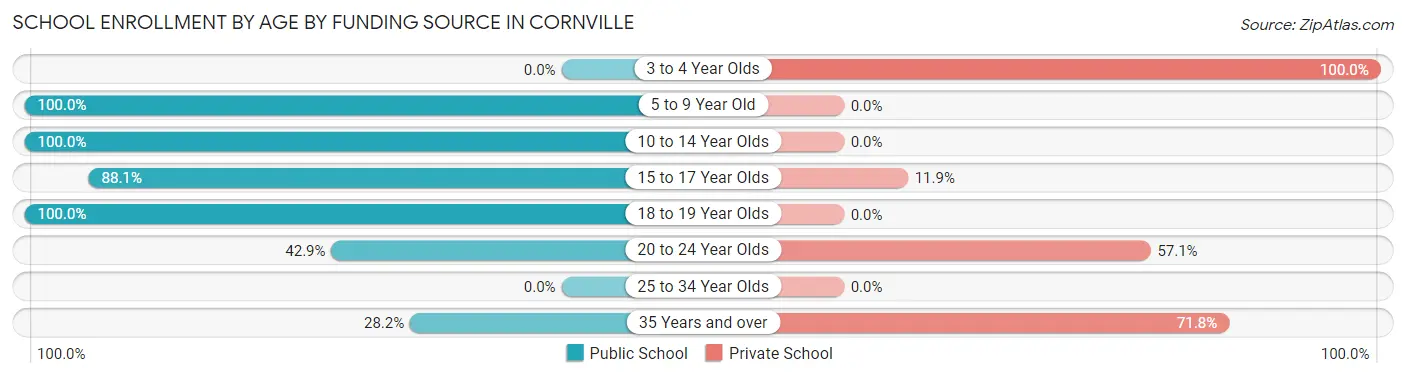
| Age Bracket | Public School | Private School |
| 3 to 4 Year Olds | 0 (0.0%) | 23 (100.0%) |
| 5 to 9 Year Old | 57 (100.0%) | 0 (0.0%) |
| 10 to 14 Year Olds | 131 (100.0%) | 0 (0.0%) |
| 15 to 17 Year Olds | 214 (88.1%) | 29 (11.9%) |
| 18 to 19 Year Olds | 75 (100.0%) | 0 (0.0%) |
| 20 to 24 Year Olds | 57 (42.9%) | 76 (57.1%) |
| 25 to 34 Year Olds | 0 (0.0%) | 0 (0.0%) |
| 35 Years and over | 22 (28.2%) | 56 (71.8%) |
| Total | 556 (75.1%) | 184 (24.9%) |
Educational Attainment by Field of Study in Cornville
Social sciences (91 | 12.3%), bio, nature & agricultural (87 | 11.7%), arts & humanities (85 | 11.5%), education (84 | 11.3%), and science & technology (70 | 9.4%) are the most common fields of study among 742 individuals in Cornville who have obtained a bachelor's degree or higher.
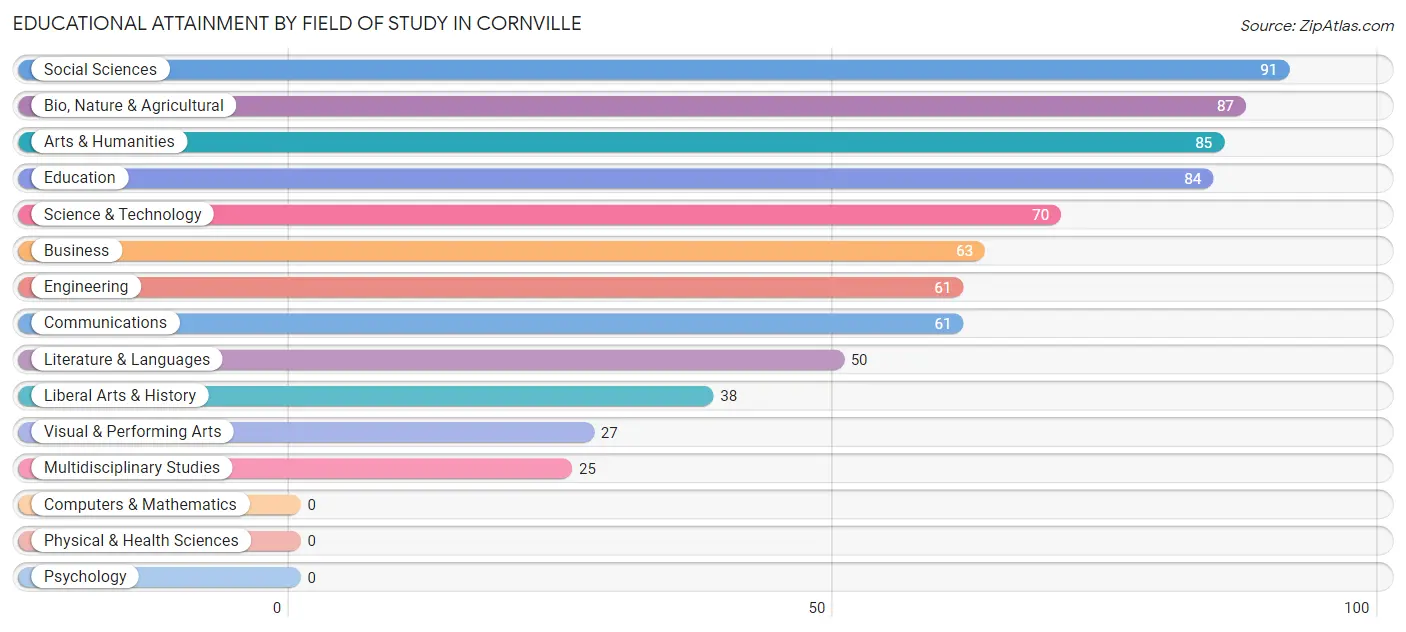
| Field of Study | # Graduates | % Graduates |
| Computers & Mathematics | 0 | 0.0% |
| Bio, Nature & Agricultural | 87 | 11.7% |
| Physical & Health Sciences | 0 | 0.0% |
| Psychology | 0 | 0.0% |
| Social Sciences | 91 | 12.3% |
| Engineering | 61 | 8.2% |
| Multidisciplinary Studies | 25 | 3.4% |
| Science & Technology | 70 | 9.4% |
| Business | 63 | 8.5% |
| Education | 84 | 11.3% |
| Literature & Languages | 50 | 6.7% |
| Liberal Arts & History | 38 | 5.1% |
| Visual & Performing Arts | 27 | 3.6% |
| Communications | 61 | 8.2% |
| Arts & Humanities | 85 | 11.5% |
| Total | 742 | 100.0% |
Transportation & Commute in Cornville
Vehicle Availability by Sex in Cornville
The most prevalent vehicle ownership categories in Cornville are males with 2 vehicles (352, accounting for 34.2%) and females with 2 vehicles (369, making up 35.5%).
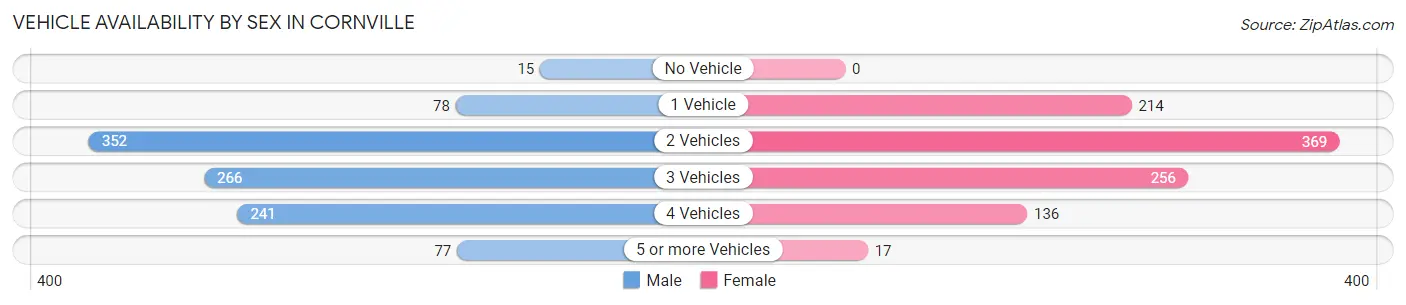
| Vehicles Available | Male | Female |
| No Vehicle | 15 (1.5%) | 0 (0.0%) |
| 1 Vehicle | 78 (7.6%) | 214 (21.6%) |
| 2 Vehicles | 352 (34.2%) | 369 (37.2%) |
| 3 Vehicles | 266 (25.9%) | 256 (25.8%) |
| 4 Vehicles | 241 (23.4%) | 136 (13.7%) |
| 5 or more Vehicles | 77 (7.5%) | 17 (1.7%) |
| Total | 1,029 (100.0%) | 992 (100.0%) |
Commute Time in Cornville
The most frequently occuring commute durations in Cornville are 20 to 24 minutes (501 commuters, 28.9%), 30 to 34 minutes (473 commuters, 27.3%), and 15 to 19 minutes (208 commuters, 12.0%).
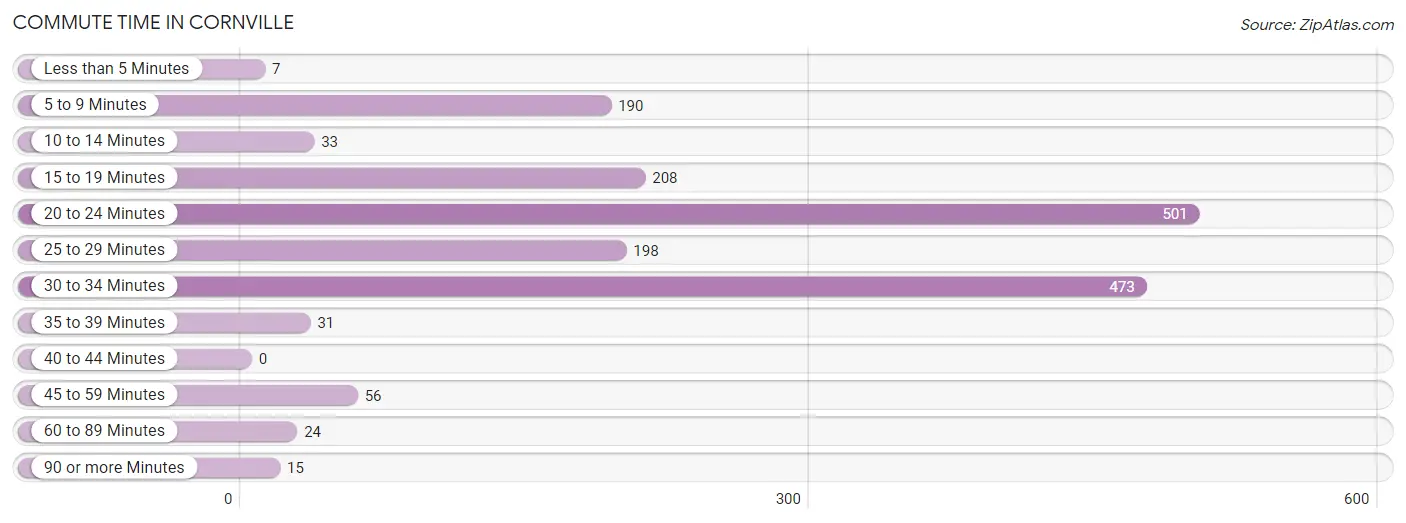
| Commute Time | # Commuters | % Commuters |
| Less than 5 Minutes | 7 | 0.4% |
| 5 to 9 Minutes | 190 | 10.9% |
| 10 to 14 Minutes | 33 | 1.9% |
| 15 to 19 Minutes | 208 | 12.0% |
| 20 to 24 Minutes | 501 | 28.9% |
| 25 to 29 Minutes | 198 | 11.4% |
| 30 to 34 Minutes | 473 | 27.3% |
| 35 to 39 Minutes | 31 | 1.8% |
| 40 to 44 Minutes | 0 | 0.0% |
| 45 to 59 Minutes | 56 | 3.2% |
| 60 to 89 Minutes | 24 | 1.4% |
| 90 or more Minutes | 15 | 0.9% |
Commute Time by Sex in Cornville
The most common commute times in Cornville are 20 to 24 minutes (279 commuters, 31.2%) for males and 30 to 34 minutes (322 commuters, 38.2%) for females.
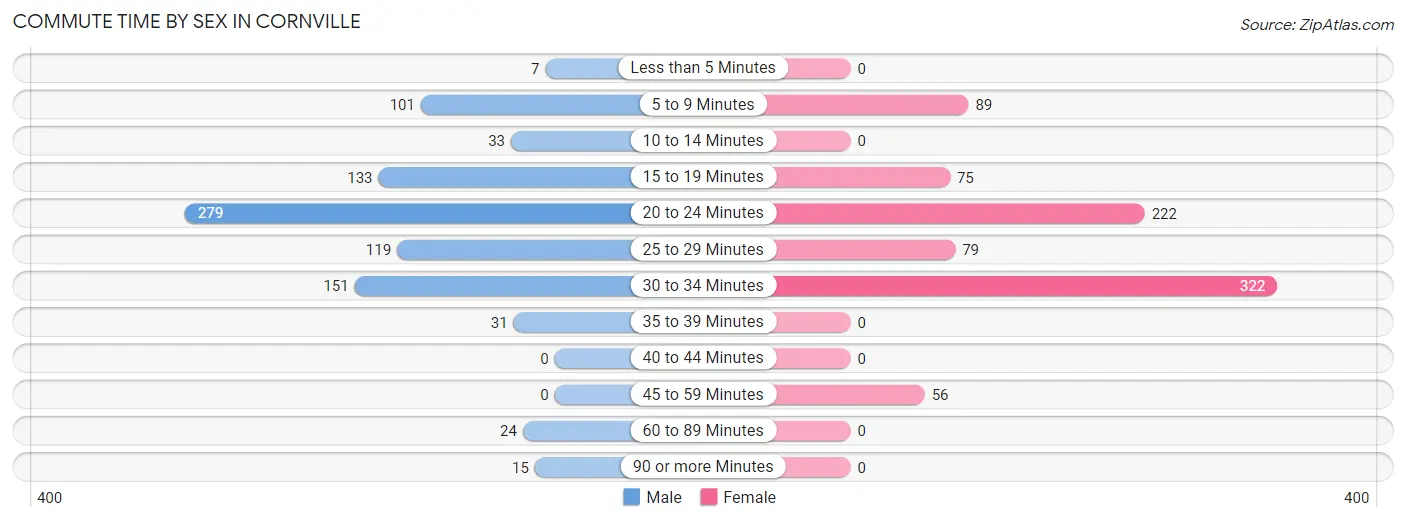
| Commute Time | Male | Female |
| Less than 5 Minutes | 7 (0.8%) | 0 (0.0%) |
| 5 to 9 Minutes | 101 (11.3%) | 89 (10.6%) |
| 10 to 14 Minutes | 33 (3.7%) | 0 (0.0%) |
| 15 to 19 Minutes | 133 (14.9%) | 75 (8.9%) |
| 20 to 24 Minutes | 279 (31.2%) | 222 (26.3%) |
| 25 to 29 Minutes | 119 (13.3%) | 79 (9.4%) |
| 30 to 34 Minutes | 151 (16.9%) | 322 (38.2%) |
| 35 to 39 Minutes | 31 (3.5%) | 0 (0.0%) |
| 40 to 44 Minutes | 0 (0.0%) | 0 (0.0%) |
| 45 to 59 Minutes | 0 (0.0%) | 56 (6.6%) |
| 60 to 89 Minutes | 24 (2.7%) | 0 (0.0%) |
| 90 or more Minutes | 15 (1.7%) | 0 (0.0%) |
Time of Departure to Work by Sex in Cornville
The most frequent times of departure to work in Cornville are 7:30 AM to 7:59 AM (237, 26.5%) for males and 7:00 AM to 7:29 AM (236, 28.0%) for females.
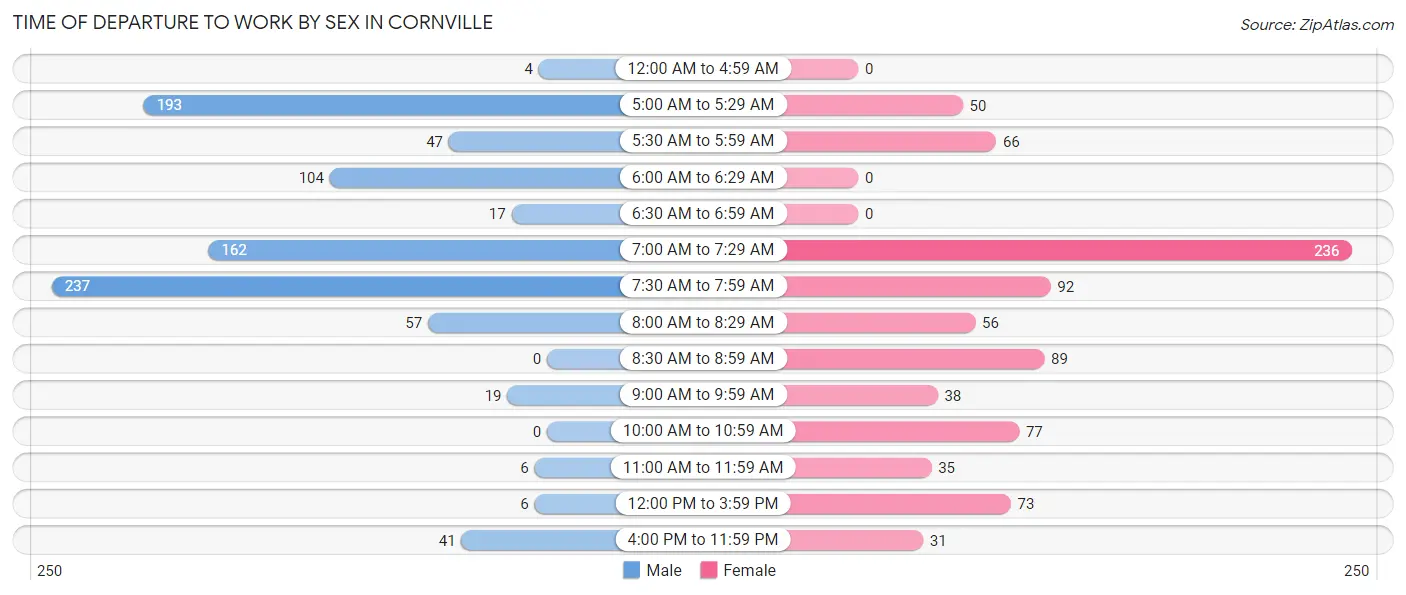
| Time of Departure | Male | Female |
| 12:00 AM to 4:59 AM | 4 (0.4%) | 0 (0.0%) |
| 5:00 AM to 5:29 AM | 193 (21.6%) | 50 (5.9%) |
| 5:30 AM to 5:59 AM | 47 (5.3%) | 66 (7.8%) |
| 6:00 AM to 6:29 AM | 104 (11.7%) | 0 (0.0%) |
| 6:30 AM to 6:59 AM | 17 (1.9%) | 0 (0.0%) |
| 7:00 AM to 7:29 AM | 162 (18.1%) | 236 (28.0%) |
| 7:30 AM to 7:59 AM | 237 (26.5%) | 92 (10.9%) |
| 8:00 AM to 8:29 AM | 57 (6.4%) | 56 (6.6%) |
| 8:30 AM to 8:59 AM | 0 (0.0%) | 89 (10.6%) |
| 9:00 AM to 9:59 AM | 19 (2.1%) | 38 (4.5%) |
| 10:00 AM to 10:59 AM | 0 (0.0%) | 77 (9.1%) |
| 11:00 AM to 11:59 AM | 6 (0.7%) | 35 (4.2%) |
| 12:00 PM to 3:59 PM | 6 (0.7%) | 73 (8.7%) |
| 4:00 PM to 11:59 PM | 41 (4.6%) | 31 (3.7%) |
| Total | 893 (100.0%) | 843 (100.0%) |
Housing Occupancy in Cornville
Occupancy by Ownership in Cornville
Of the total 1,558 dwellings in Cornville, owner-occupied units account for 1,166 (74.8%), while renter-occupied units make up 392 (25.2%).
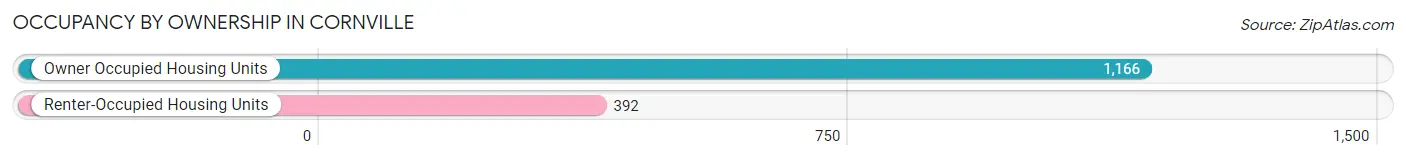
| Occupancy | # Housing Units | % Housing Units |
| Owner Occupied Housing Units | 1,166 | 74.8% |
| Renter-Occupied Housing Units | 392 | 25.2% |
| Total Occupied Housing Units | 1,558 | 100.0% |
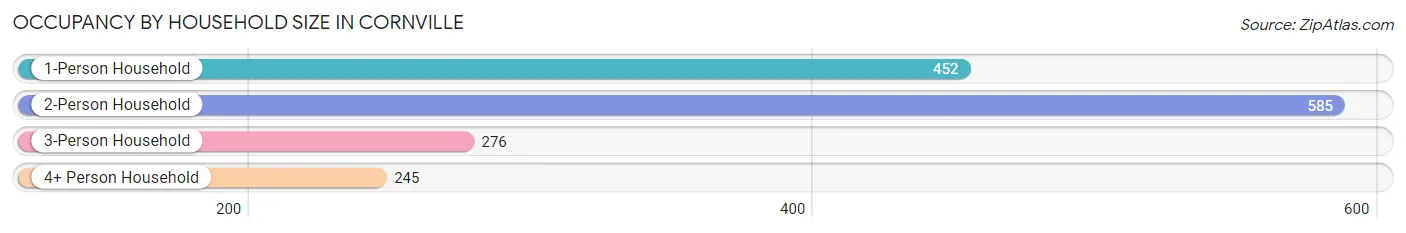
Occupancy by Household Size in Cornville
| Household Size | # Housing Units | % Housing Units |
| 1-Person Household | 452 | 29.0% |
| 2-Person Household | 585 | 37.6% |
| 3-Person Household | 276 | 17.7% |
| 4+ Person Household | 245 | 15.7% |
| Total Housing Units | 1,558 | 100.0% |
Occupancy by Ownership by Household Size in Cornville
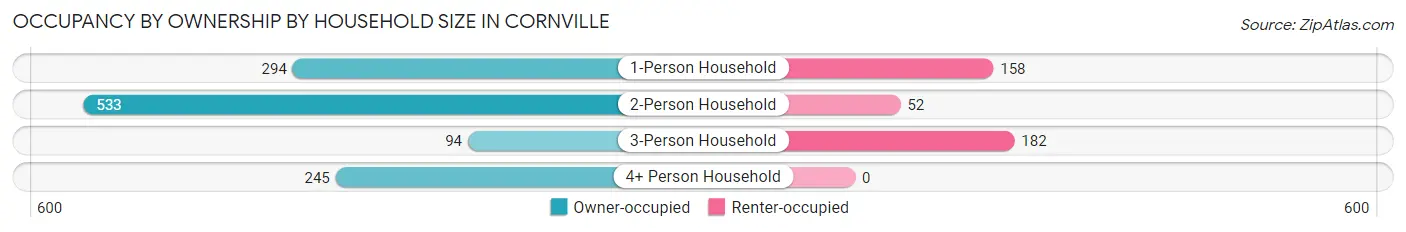
| Household Size | Owner-occupied | Renter-occupied |
| 1-Person Household | 294 (65.0%) | 158 (35.0%) |
| 2-Person Household | 533 (91.1%) | 52 (8.9%) |
| 3-Person Household | 94 (34.1%) | 182 (65.9%) |
| 4+ Person Household | 245 (100.0%) | 0 (0.0%) |
| Total Housing Units | 1,166 (74.8%) | 392 (25.2%) |
Occupancy by Educational Attainment in Cornville
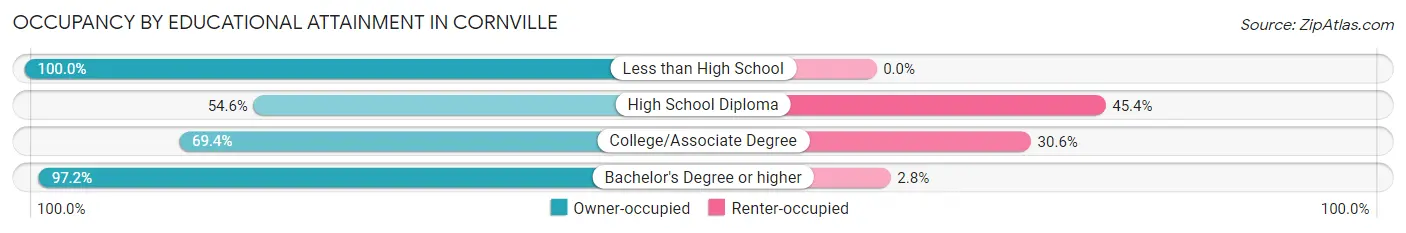
| Household Size | Owner-occupied | Renter-occupied |
| Less than High School | 102 (100.0%) | 0 (0.0%) |
| High School Diploma | 274 (54.6%) | 228 (45.4%) |
| College/Associate Degree | 342 (69.4%) | 151 (30.6%) |
| Bachelor's Degree or higher | 448 (97.2%) | 13 (2.8%) |
Occupancy by Age of Householder in Cornville
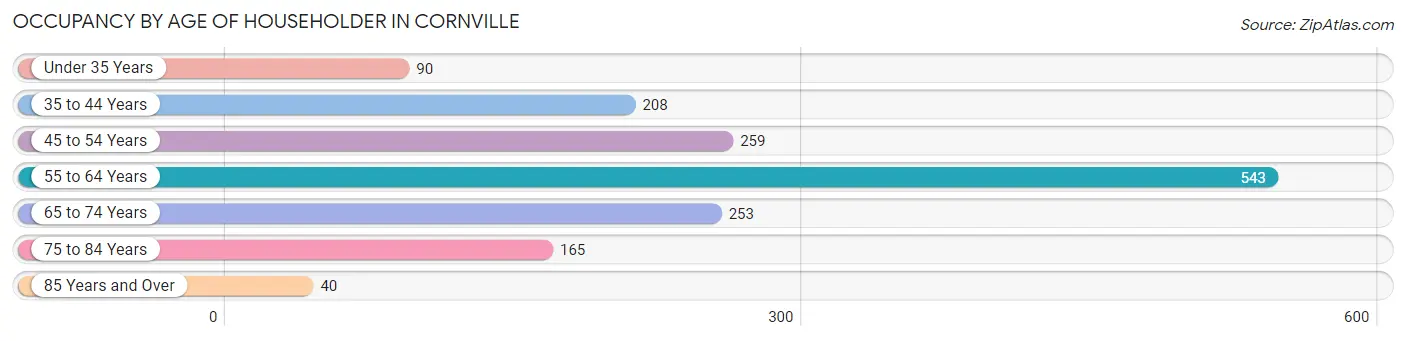
| Age Bracket | # Households | % Households |
| Under 35 Years | 90 | 5.8% |
| 35 to 44 Years | 208 | 13.4% |
| 45 to 54 Years | 259 | 16.6% |
| 55 to 64 Years | 543 | 34.8% |
| 65 to 74 Years | 253 | 16.2% |
| 75 to 84 Years | 165 | 10.6% |
| 85 Years and Over | 40 | 2.6% |
| Total | 1,558 | 100.0% |
Housing Finances in Cornville
Median Income by Occupancy in Cornville
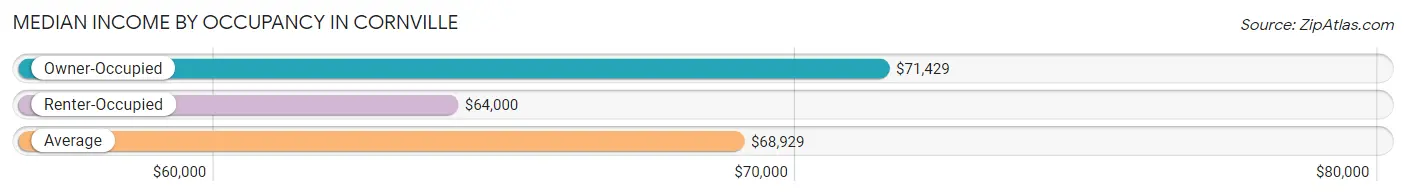
| Occupancy Type | # Households | Median Income |
| Owner-Occupied | 1,166 (74.8%) | $71,429 |
| Renter-Occupied | 392 (25.2%) | $64,000 |
| Average | 1,558 (100.0%) | $68,929 |
Occupancy by Householder Income Bracket in Cornville
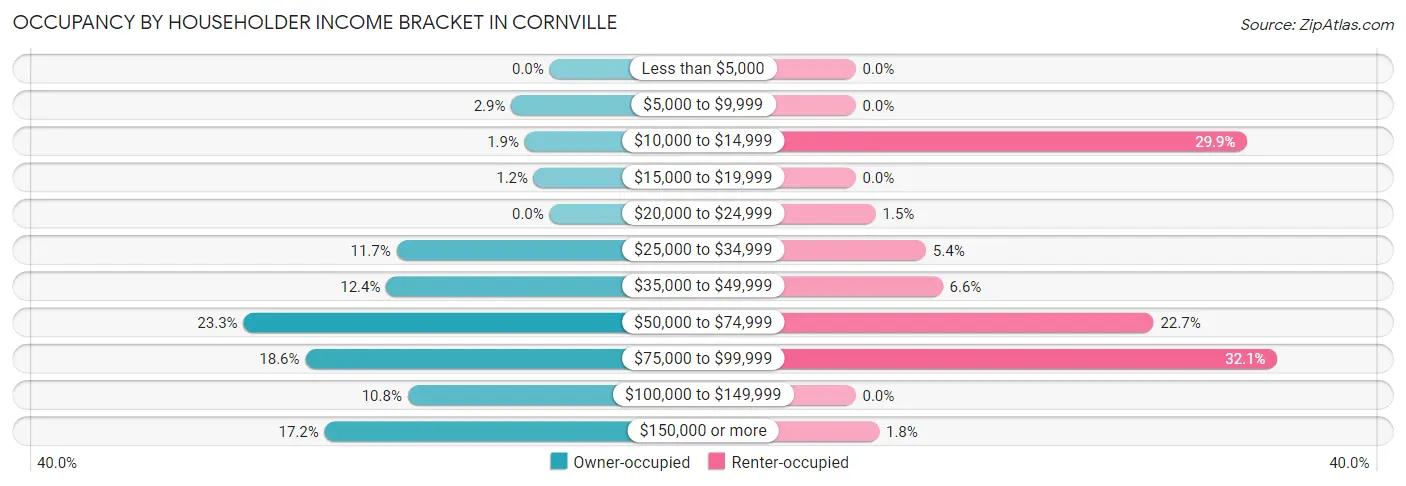
| Income Bracket | Owner-occupied | Renter-occupied |
| Less than $5,000 | 0 (0.0%) | 0 (0.0%) |
| $5,000 to $9,999 | 34 (2.9%) | 0 (0.0%) |
| $10,000 to $14,999 | 22 (1.9%) | 117 (29.8%) |
| $15,000 to $19,999 | 14 (1.2%) | 0 (0.0%) |
| $20,000 to $24,999 | 0 (0.0%) | 6 (1.5%) |
| $25,000 to $34,999 | 136 (11.7%) | 21 (5.4%) |
| $35,000 to $49,999 | 145 (12.4%) | 26 (6.6%) |
| $50,000 to $74,999 | 272 (23.3%) | 89 (22.7%) |
| $75,000 to $99,999 | 217 (18.6%) | 126 (32.1%) |
| $100,000 to $149,999 | 126 (10.8%) | 0 (0.0%) |
| $150,000 or more | 200 (17.2%) | 7 (1.8%) |
| Total | 1,166 (100.0%) | 392 (100.0%) |
Monthly Housing Cost Tiers in Cornville
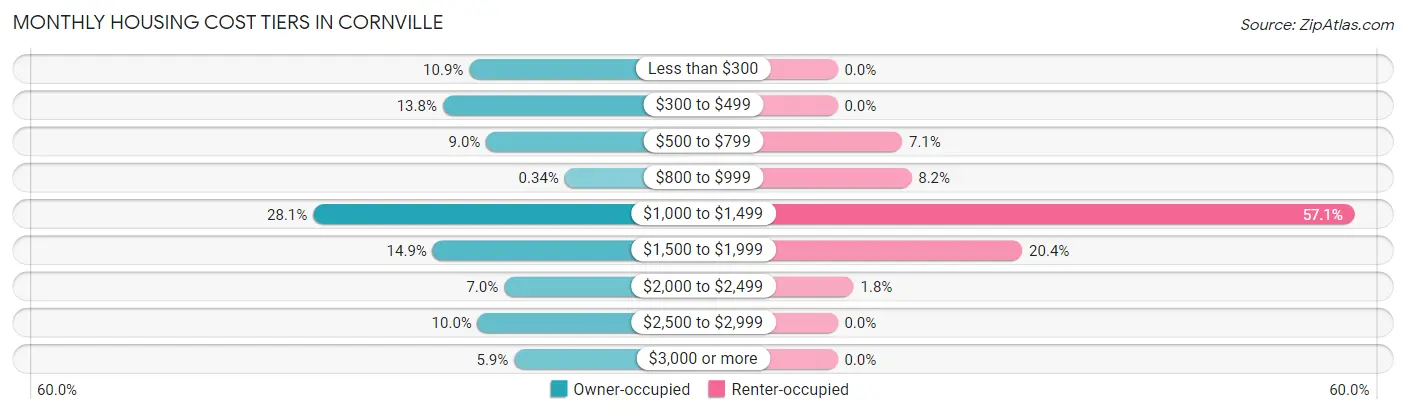
| Monthly Cost | Owner-occupied | Renter-occupied |
| Less than $300 | 127 (10.9%) | 0 (0.0%) |
| $300 to $499 | 161 (13.8%) | 0 (0.0%) |
| $500 to $799 | 105 (9.0%) | 28 (7.1%) |
| $800 to $999 | 4 (0.3%) | 32 (8.2%) |
| $1,000 to $1,499 | 328 (28.1%) | 224 (57.1%) |
| $1,500 to $1,999 | 174 (14.9%) | 80 (20.4%) |
| $2,000 to $2,499 | 82 (7.0%) | 7 (1.8%) |
| $2,500 to $2,999 | 116 (10.0%) | 0 (0.0%) |
| $3,000 or more | 69 (5.9%) | 0 (0.0%) |
| Total | 1,166 (100.0%) | 392 (100.0%) |
Physical Housing Characteristics in Cornville
Housing Structures in Cornville
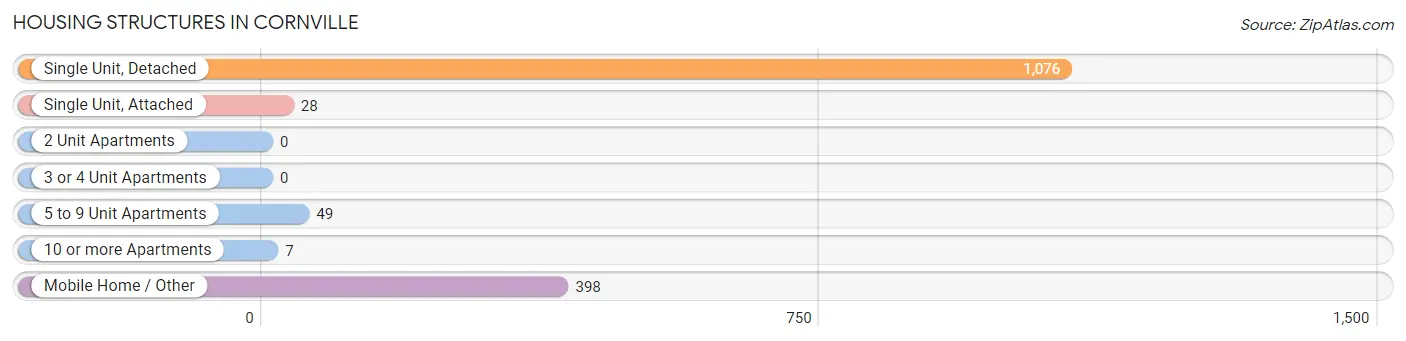
| Structure Type | # Housing Units | % Housing Units |
| Single Unit, Detached | 1,076 | 69.1% |
| Single Unit, Attached | 28 | 1.8% |
| 2 Unit Apartments | 0 | 0.0% |
| 3 or 4 Unit Apartments | 0 | 0.0% |
| 5 to 9 Unit Apartments | 49 | 3.2% |
| 10 or more Apartments | 7 | 0.4% |
| Mobile Home / Other | 398 | 25.6% |
| Total | 1,558 | 100.0% |
Housing Structures by Occupancy in Cornville
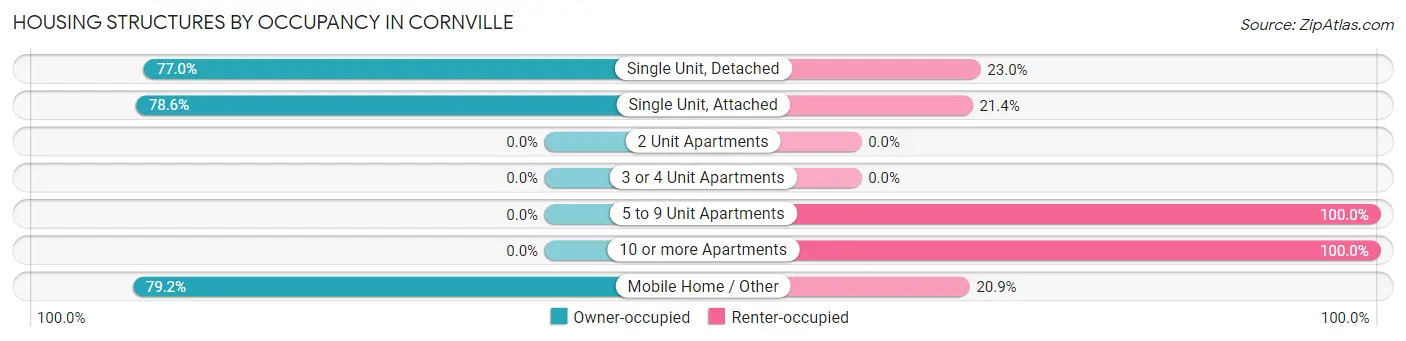
| Structure Type | Owner-occupied | Renter-occupied |
| Single Unit, Detached | 829 (77.0%) | 247 (23.0%) |
| Single Unit, Attached | 22 (78.6%) | 6 (21.4%) |
| 2 Unit Apartments | 0 (0.0%) | 0 (0.0%) |
| 3 or 4 Unit Apartments | 0 (0.0%) | 0 (0.0%) |
| 5 to 9 Unit Apartments | 0 (0.0%) | 49 (100.0%) |
| 10 or more Apartments | 0 (0.0%) | 7 (100.0%) |
| Mobile Home / Other | 315 (79.1%) | 83 (20.8%) |
| Total | 1,166 (74.8%) | 392 (25.2%) |
Housing Structures by Number of Rooms in Cornville
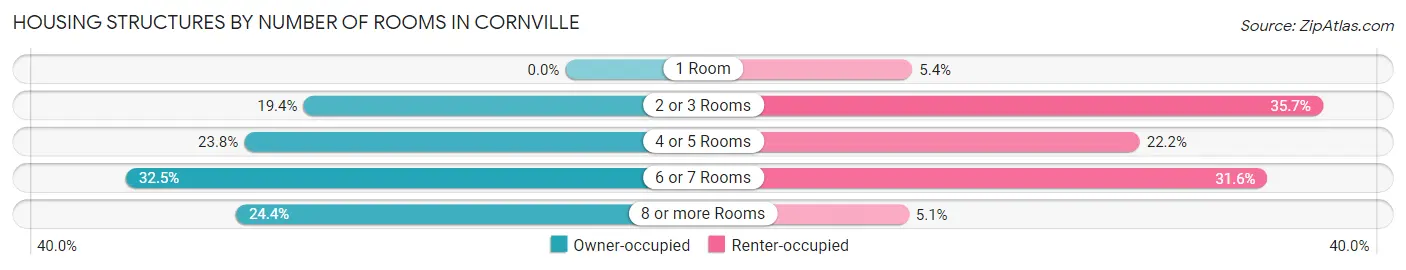
| Number of Rooms | Owner-occupied | Renter-occupied |
| 1 Room | 0 (0.0%) | 21 (5.4%) |
| 2 or 3 Rooms | 226 (19.4%) | 140 (35.7%) |
| 4 or 5 Rooms | 277 (23.8%) | 87 (22.2%) |
| 6 or 7 Rooms | 379 (32.5%) | 124 (31.6%) |
| 8 or more Rooms | 284 (24.4%) | 20 (5.1%) |
| Total | 1,166 (100.0%) | 392 (100.0%) |
Housing Structure by Heating Type in Cornville
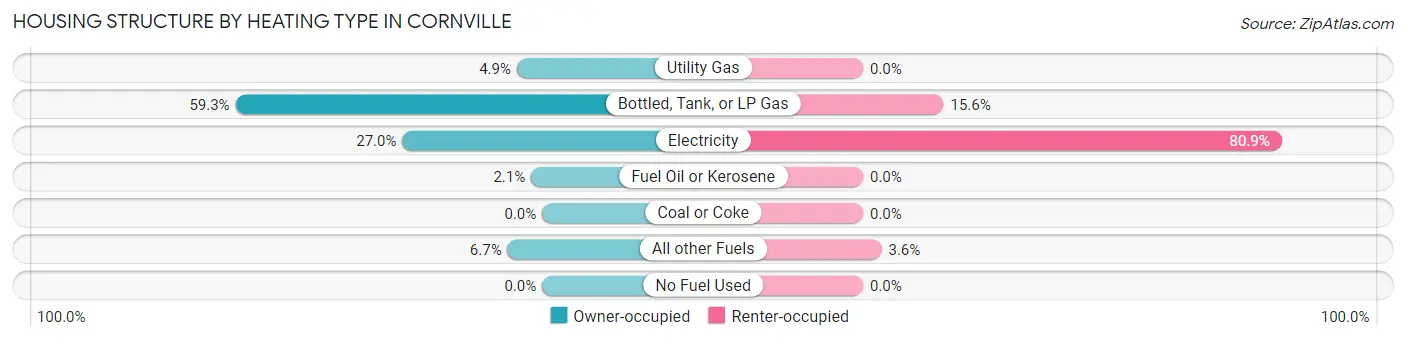
| Heating Type | Owner-occupied | Renter-occupied |
| Utility Gas | 57 (4.9%) | 0 (0.0%) |
| Bottled, Tank, or LP Gas | 691 (59.3%) | 61 (15.6%) |
| Electricity | 315 (27.0%) | 317 (80.9%) |
| Fuel Oil or Kerosene | 25 (2.1%) | 0 (0.0%) |
| Coal or Coke | 0 (0.0%) | 0 (0.0%) |
| All other Fuels | 78 (6.7%) | 14 (3.6%) |
| No Fuel Used | 0 (0.0%) | 0 (0.0%) |
| Total | 1,166 (100.0%) | 392 (100.0%) |
Household Vehicle Usage in Cornville
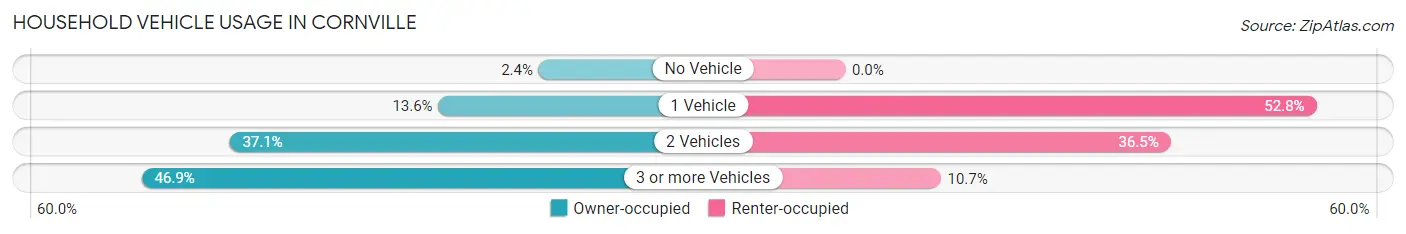
| Vehicles per Household | Owner-occupied | Renter-occupied |
| No Vehicle | 28 (2.4%) | 0 (0.0%) |
| 1 Vehicle | 159 (13.6%) | 207 (52.8%) |
| 2 Vehicles | 432 (37.0%) | 143 (36.5%) |
| 3 or more Vehicles | 547 (46.9%) | 42 (10.7%) |
| Total | 1,166 (100.0%) | 392 (100.0%) |
Real Estate & Mortgages in Cornville
Real Estate and Mortgage Overview in Cornville
| Characteristic | Without Mortgage | With Mortgage |
| Housing Units | 418 | 748 |
| Median Property Value | $280,000 | $326,600 |
| Median Household Income | $50,625 | $175 |
| Monthly Housing Costs | $371 | $69 |
| Real Estate Taxes | $1,649 | $0 |
Property Value by Mortgage Status in Cornville
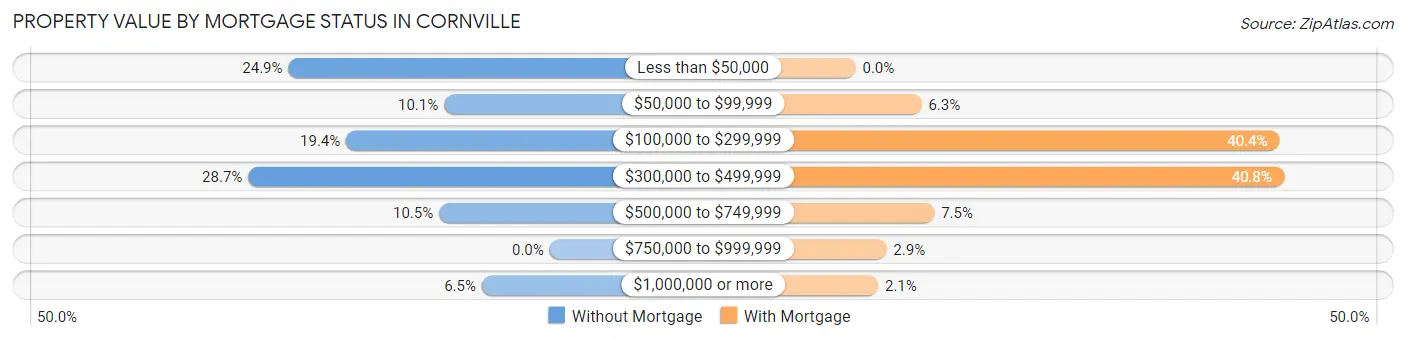
| Property Value | Without Mortgage | With Mortgage |
| Less than $50,000 | 104 (24.9%) | 0 (0.0%) |
| $50,000 to $99,999 | 42 (10.1%) | 47 (6.3%) |
| $100,000 to $299,999 | 81 (19.4%) | 302 (40.4%) |
| $300,000 to $499,999 | 120 (28.7%) | 305 (40.8%) |
| $500,000 to $749,999 | 44 (10.5%) | 56 (7.5%) |
| $750,000 to $999,999 | 0 (0.0%) | 22 (2.9%) |
| $1,000,000 or more | 27 (6.5%) | 16 (2.1%) |
| Total | 418 (100.0%) | 748 (100.0%) |
Household Income by Mortgage Status in Cornville
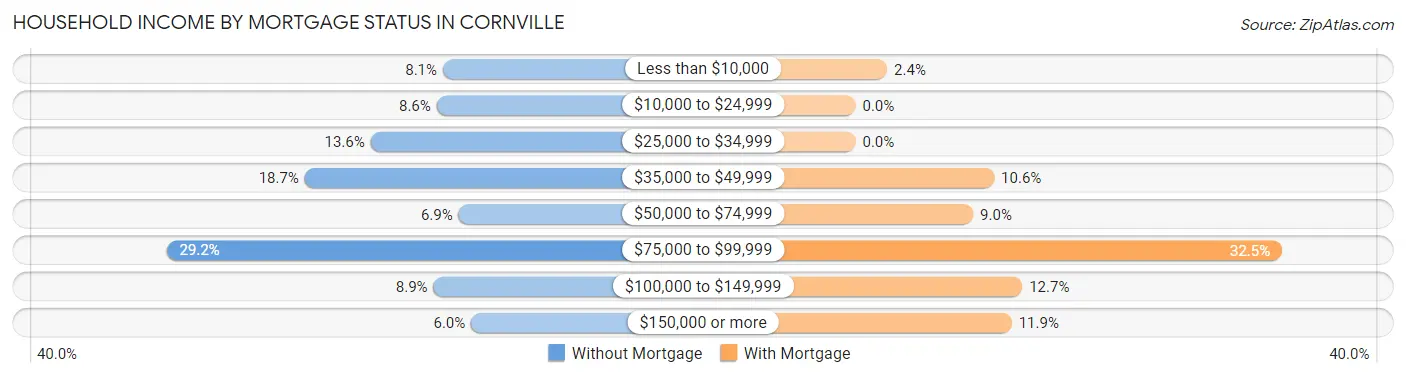
| Household Income | Without Mortgage | With Mortgage |
| Less than $10,000 | 34 (8.1%) | 18 (2.4%) |
| $10,000 to $24,999 | 36 (8.6%) | 0 (0.0%) |
| $25,000 to $34,999 | 57 (13.6%) | 0 (0.0%) |
| $35,000 to $49,999 | 78 (18.7%) | 79 (10.6%) |
| $50,000 to $74,999 | 29 (6.9%) | 67 (9.0%) |
| $75,000 to $99,999 | 122 (29.2%) | 243 (32.5%) |
| $100,000 to $149,999 | 37 (8.8%) | 95 (12.7%) |
| $150,000 or more | 25 (6.0%) | 89 (11.9%) |
| Total | 418 (100.0%) | 748 (100.0%) |
Property Value to Household Income Ratio in Cornville
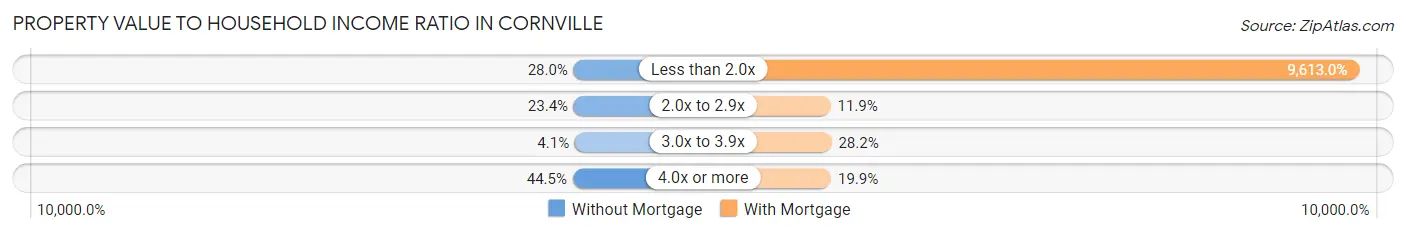
| Value-to-Income Ratio | Without Mortgage | With Mortgage |
| Less than 2.0x | 117 (28.0%) | 71,905 (9,613.0%) |
| 2.0x to 2.9x | 98 (23.4%) | 89 (11.9%) |
| 3.0x to 3.9x | 17 (4.1%) | 211 (28.2%) |
| 4.0x or more | 186 (44.5%) | 149 (19.9%) |
| Total | 418 (100.0%) | 748 (100.0%) |
Real Estate Taxes by Mortgage Status in Cornville
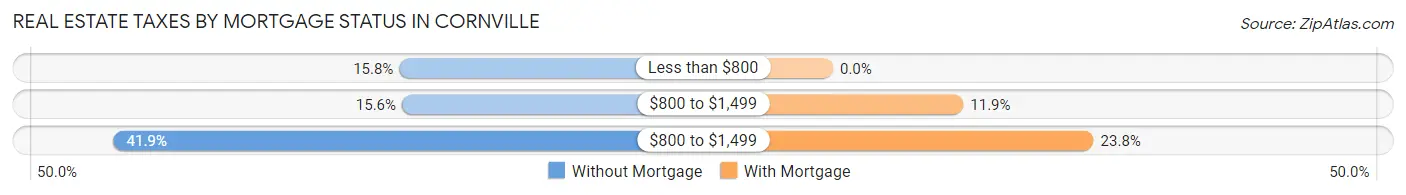
| Property Taxes | Without Mortgage | With Mortgage |
| Less than $800 | 66 (15.8%) | 0 (0.0%) |
| $800 to $1,499 | 65 (15.5%) | 89 (11.9%) |
| $800 to $1,499 | 175 (41.9%) | 178 (23.8%) |
| Total | 418 (100.0%) | 748 (100.0%) |
Health & Disability in Cornville
Health Insurance Coverage by Age in Cornville
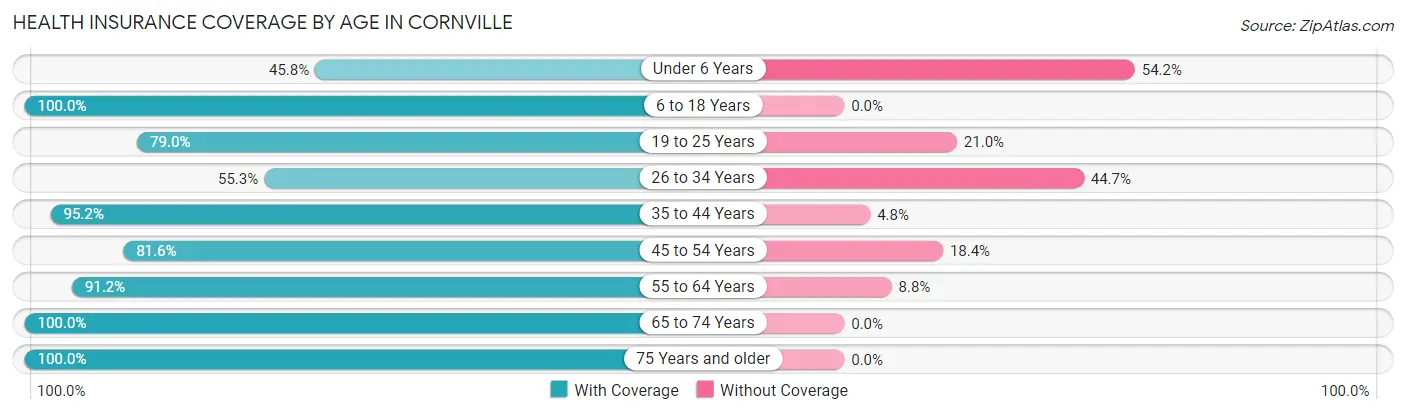
| Age Bracket | With Coverage | Without Coverage |
| Under 6 Years | 44 (45.8%) | 52 (54.2%) |
| 6 to 18 Years | 471 (100.0%) | 0 (0.0%) |
| 19 to 25 Years | 222 (79.0%) | 59 (21.0%) |
| 26 to 34 Years | 114 (55.3%) | 92 (44.7%) |
| 35 to 44 Years | 394 (95.2%) | 20 (4.8%) |
| 45 to 54 Years | 417 (81.6%) | 94 (18.4%) |
| 55 to 64 Years | 817 (91.2%) | 79 (8.8%) |
| 65 to 74 Years | 372 (100.0%) | 0 (0.0%) |
| 75 Years and older | 332 (100.0%) | 0 (0.0%) |
| Total | 3,183 (88.9%) | 396 (11.1%) |
Health Insurance Coverage by Citizenship Status in Cornville
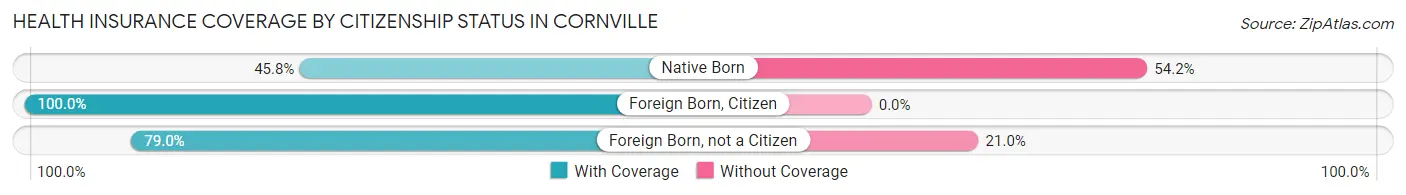
| Citizenship Status | With Coverage | Without Coverage |
| Native Born | 44 (45.8%) | 52 (54.2%) |
| Foreign Born, Citizen | 471 (100.0%) | 0 (0.0%) |
| Foreign Born, not a Citizen | 222 (79.0%) | 59 (21.0%) |
Health Insurance Coverage by Household Income in Cornville
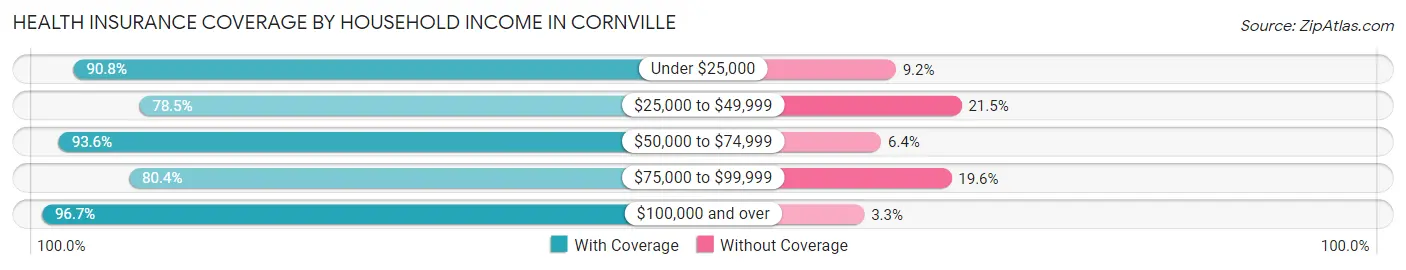
| Household Income | With Coverage | Without Coverage |
| Under $25,000 | 208 (90.8%) | 21 (9.2%) |
| $25,000 to $49,999 | 537 (78.5%) | 147 (21.5%) |
| $50,000 to $74,999 | 685 (93.6%) | 47 (6.4%) |
| $75,000 to $99,999 | 583 (80.4%) | 142 (19.6%) |
| $100,000 and over | 1,158 (96.7%) | 39 (3.3%) |
Public vs Private Health Insurance Coverage by Age in Cornville
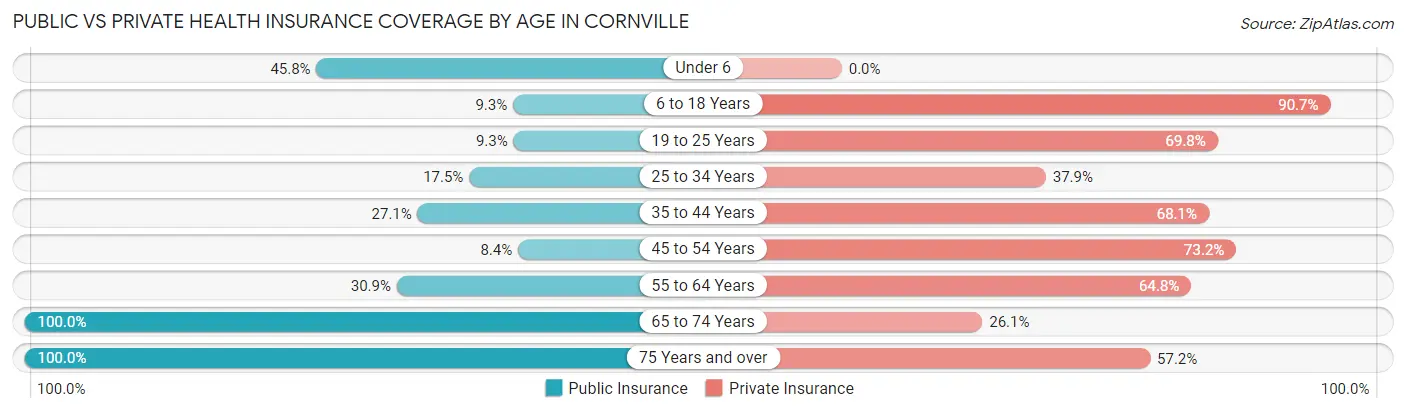
| Age Bracket | Public Insurance | Private Insurance |
| Under 6 | 44 (45.8%) | 0 (0.0%) |
| 6 to 18 Years | 44 (9.3%) | 427 (90.7%) |
| 19 to 25 Years | 26 (9.2%) | 196 (69.8%) |
| 25 to 34 Years | 36 (17.5%) | 78 (37.9%) |
| 35 to 44 Years | 112 (27.1%) | 282 (68.1%) |
| 45 to 54 Years | 43 (8.4%) | 374 (73.2%) |
| 55 to 64 Years | 277 (30.9%) | 581 (64.8%) |
| 65 to 74 Years | 372 (100.0%) | 97 (26.1%) |
| 75 Years and over | 332 (100.0%) | 190 (57.2%) |
| Total | 1,286 (35.9%) | 2,225 (62.2%) |
Disability Status by Sex by Age in Cornville
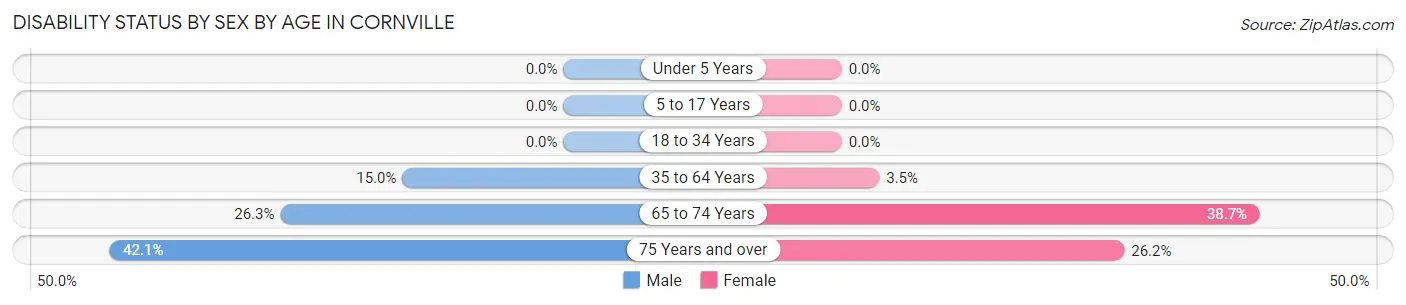
| Age Bracket | Male | Female |
| Under 5 Years | 0 (0.0%) | 0 (0.0%) |
| 5 to 17 Years | 0 (0.0%) | 0 (0.0%) |
| 18 to 34 Years | 0 (0.0%) | 0 (0.0%) |
| 35 to 64 Years | 139 (14.9%) | 31 (3.5%) |
| 65 to 74 Years | 57 (26.3%) | 60 (38.7%) |
| 75 Years and over | 45 (42.1%) | 59 (26.2%) |
Disability Class by Sex by Age in Cornville
Disability Class: Hearing Difficulty
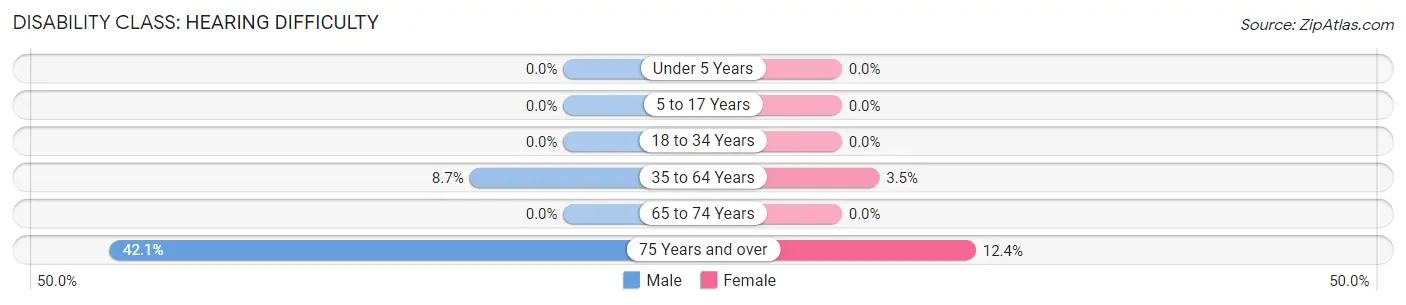
| Age Bracket | Male | Female |
| Under 5 Years | 0 (0.0%) | 0 (0.0%) |
| 5 to 17 Years | 0 (0.0%) | 0 (0.0%) |
| 18 to 34 Years | 0 (0.0%) | 0 (0.0%) |
| 35 to 64 Years | 81 (8.7%) | 31 (3.5%) |
| 65 to 74 Years | 0 (0.0%) | 0 (0.0%) |
| 75 Years and over | 45 (42.1%) | 28 (12.4%) |
Disability Class: Vision Difficulty
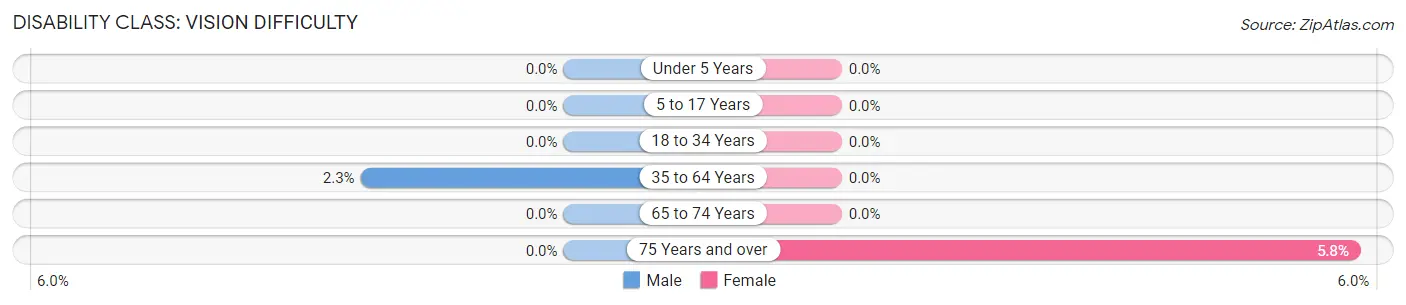
| Age Bracket | Male | Female |
| Under 5 Years | 0 (0.0%) | 0 (0.0%) |
| 5 to 17 Years | 0 (0.0%) | 0 (0.0%) |
| 18 to 34 Years | 0 (0.0%) | 0 (0.0%) |
| 35 to 64 Years | 21 (2.3%) | 0 (0.0%) |
| 65 to 74 Years | 0 (0.0%) | 0 (0.0%) |
| 75 Years and over | 0 (0.0%) | 13 (5.8%) |
Disability Class: Cognitive Difficulty
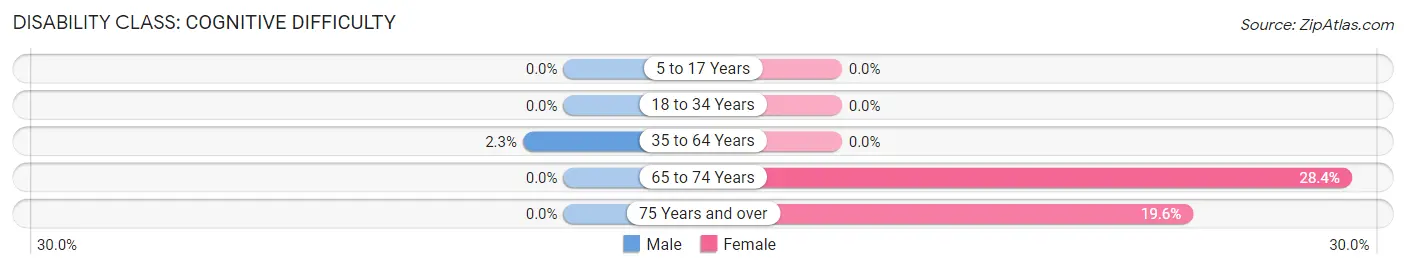
| Age Bracket | Male | Female |
| 5 to 17 Years | 0 (0.0%) | 0 (0.0%) |
| 18 to 34 Years | 0 (0.0%) | 0 (0.0%) |
| 35 to 64 Years | 21 (2.3%) | 0 (0.0%) |
| 65 to 74 Years | 0 (0.0%) | 44 (28.4%) |
| 75 Years and over | 0 (0.0%) | 44 (19.6%) |
Disability Class: Ambulatory Difficulty
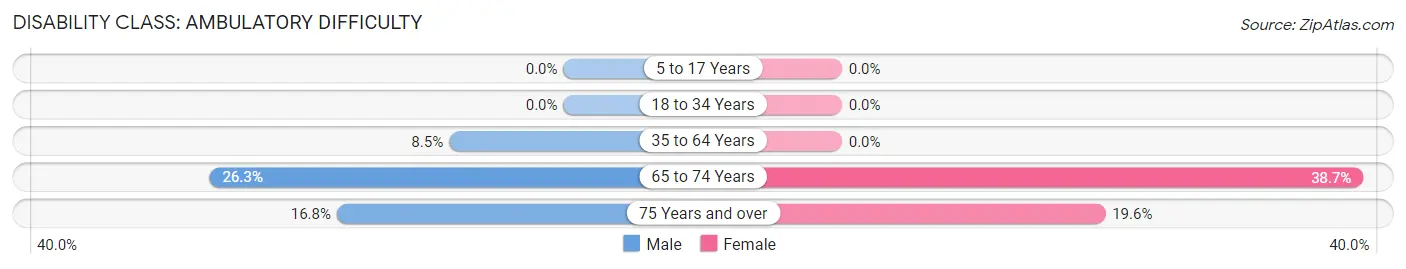
| Age Bracket | Male | Female |
| 5 to 17 Years | 0 (0.0%) | 0 (0.0%) |
| 18 to 34 Years | 0 (0.0%) | 0 (0.0%) |
| 35 to 64 Years | 79 (8.5%) | 0 (0.0%) |
| 65 to 74 Years | 57 (26.3%) | 60 (38.7%) |
| 75 Years and over | 18 (16.8%) | 44 (19.6%) |
Disability Class: Self-Care Difficulty
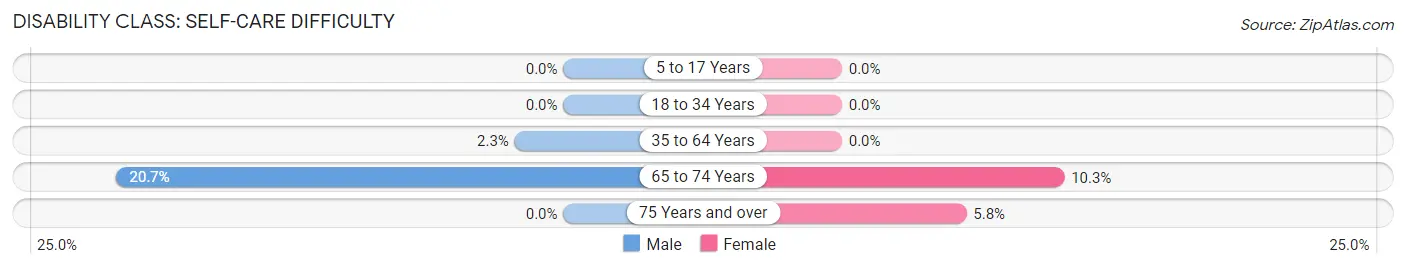
| Age Bracket | Male | Female |
| 5 to 17 Years | 0 (0.0%) | 0 (0.0%) |
| 18 to 34 Years | 0 (0.0%) | 0 (0.0%) |
| 35 to 64 Years | 21 (2.3%) | 0 (0.0%) |
| 65 to 74 Years | 45 (20.7%) | 16 (10.3%) |
| 75 Years and over | 0 (0.0%) | 13 (5.8%) |
Technology Access in Cornville
Computing Device Access in Cornville
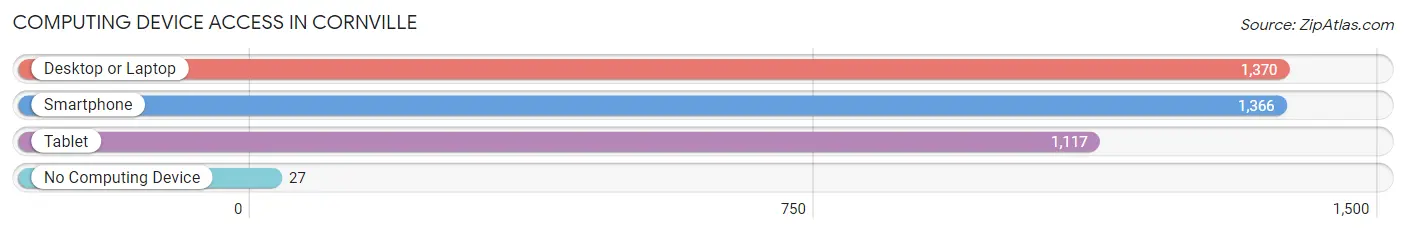
| Device Type | # Households | % Households |
| Desktop or Laptop | 1,370 | 87.9% |
| Smartphone | 1,366 | 87.7% |
| Tablet | 1,117 | 71.7% |
| No Computing Device | 27 | 1.7% |
| Total | 1,558 | 100.0% |
Internet Access in Cornville
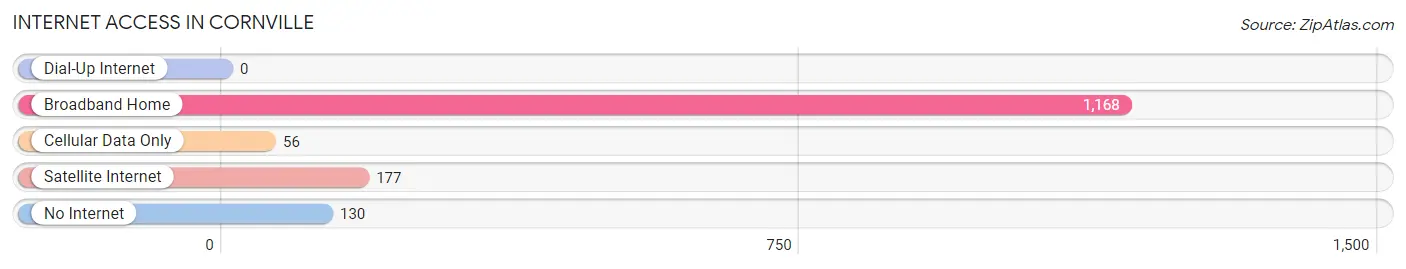
| Internet Type | # Households | % Households |
| Dial-Up Internet | 0 | 0.0% |
| Broadband Home | 1,168 | 75.0% |
| Cellular Data Only | 56 | 3.6% |
| Satellite Internet | 177 | 11.4% |
| No Internet | 130 | 8.3% |
| Total | 1,558 | 100.0% |
Cornville Summary
Cornville, Arizona is a small unincorporated community located in Yavapai County, Arizona. It is situated in the Verde Valley, approximately 10 miles south of the city of Sedona. The population of Cornville was estimated to be 1,845 in 2019.
History
The area that is now Cornville was originally inhabited by the Yavapai people. The first non-native settlers arrived in the area in the late 1800s. The first post office in the area was established in 1883 and was named Cornville after the abundance of corn grown in the area. The town was officially incorporated in 1910.
In the early 1900s, Cornville was a thriving agricultural community. The main crops grown in the area were corn, cotton, and alfalfa. The town also had a few small businesses, including a general store, a blacksmith shop, and a saloon.
In the 1950s, the town began to decline as many of the residents moved away in search of better economic opportunities. The town was eventually disincorporated in the 1970s.
Geography
Cornville is located in the Verde Valley, which is part of the Colorado Plateau. The town is situated at an elevation of 3,400 feet and is surrounded by the Coconino National Forest. The town is located approximately 10 miles south of the city of Sedona and is bordered by the Verde River to the east.
The climate in Cornville is semi-arid, with hot summers and mild winters. The average annual temperature is around 70 degrees Fahrenheit. The average annual precipitation is around 12 inches.
Economy
The economy of Cornville is largely based on tourism. The town is located near several popular tourist attractions, including the Grand Canyon, Sedona, and the Verde River. The town also has several wineries and vineyards, as well as a few small businesses.
Demographics
As of 2019, the population of Cornville was estimated to be 1,845. The racial makeup of the town was 94.3% White, 0.7% African American, 0.7% Native American, 0.7% Asian, 0.3% Pacific Islander, and 2.7% from other races. The median household income was $45,000. The median age was 48.7 years.
Conclusion
Cornville, Arizona is a small unincorporated community located in Yavapai County, Arizona. It is situated in the Verde Valley, approximately 10 miles south of the city of Sedona. The population of Cornville was estimated to be 1,845 in 2019. The town has a rich history, with the first non-native settlers arriving in the late 1800s. The economy of Cornville is largely based on tourism, with the town being located near several popular tourist attractions. The racial makeup of the town was 94.3% White, 0.7% African American, 0.7% Native American, 0.7% Asian, 0.3% Pacific Islander, and 2.7% from other races. The median household income was $45,000 and the median age was 48.7 years.
Common Questions
What is Per Capita Income in Cornville?
Per Capita income in Cornville is $34,110.
What is the Median Family Income in Cornville?
Median Family Income in Cornville is $75,250.
What is the Median Household income in Cornville?
Median Household Income in Cornville is $68,929.
What is Income or Wage Gap in Cornville?
Income or Wage Gap in Cornville is 12.3%.
Women in Cornville earn 87.7 cents for every dollar earned by a man.
What is Inequality or Gini Index in Cornville?
Inequality or Gini Index in Cornville is 0.38.
What is the Total Population of Cornville?
Total Population of Cornville is 3,582.
What is the Total Male Population of Cornville?
Total Male Population of Cornville is 1,949.
What is the Total Female Population of Cornville?
Total Female Population of Cornville is 1,633.
What is the Ratio of Males per 100 Females in Cornville?
There are 119.35 Males per 100 Females in Cornville.
What is the Ratio of Females per 100 Males in Cornville?
There are 83.79 Females per 100 Males in Cornville.
What is the Median Population Age in Cornville?
Median Population Age in Cornville is 53.0 Years.
What is the Average Family Size in Cornville
Average Family Size in Cornville is 2.9 People.
What is the Average Household Size in Cornville
Average Household Size in Cornville is 2.3 People.
How Large is the Labor Force in Cornville?
There are 2,252 People in the Labor Forcein in Cornville.
What is the Percentage of People in the Labor Force in Cornville?
70.0% of People are in the Labor Force in Cornville.
What is the Unemployment Rate in Cornville?
Unemployment Rate in Cornville is 10.2%.