Yuma County, AZ Map & Demographics
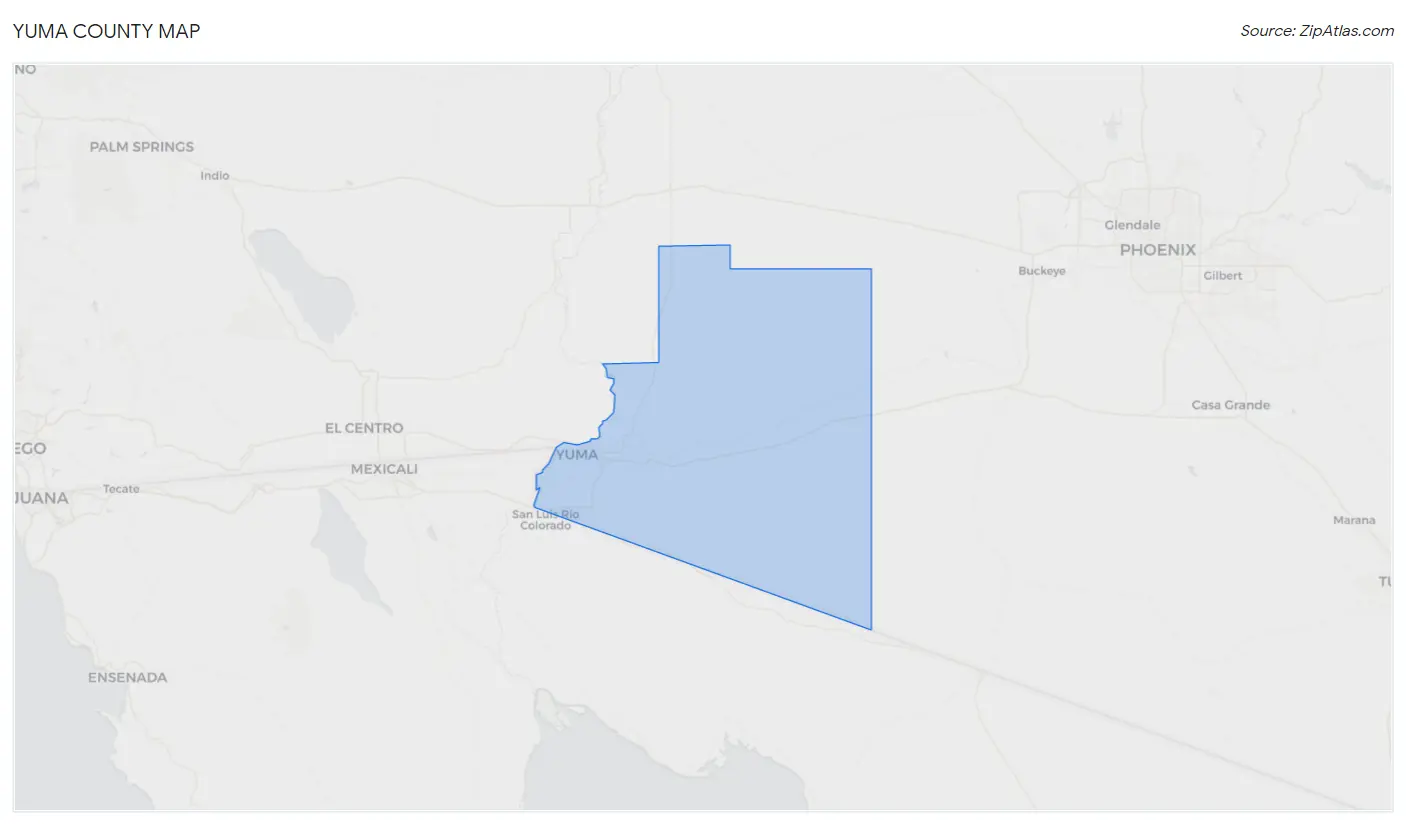
Yuma County Map
Yuma County Overview
$27,516
PER CAPITA INCOME
$61,867
AVG FAMILY INCOME
$56,439
AVG HOUSEHOLD INCOME
31.2%
WAGE / INCOME GAP [ % ]
68.8¢/ $1
WAGE / INCOME GAP [ $ ]
$12,124
FAMILY INCOME DEFICIT
0.46
INEQUALITY / GINI INDEX
204,374
TOTAL POPULATION
105,162
MALE POPULATION
99,212
FEMALE POPULATION
106.00
MALES / 100 FEMALES
94.34
FEMALES / 100 MALES
35.3
MEDIAN AGE
3.1
AVG FAMILY SIZE
2.6
AVG HOUSEHOLD SIZE
85,630
LABOR FORCE [ PEOPLE ]
53.9%
PERCENT IN LABOR FORCE
8.3%
UNEMPLOYMENT RATE
Income in Yuma County
Income Overview in Yuma County
Per Capita Income in Yuma County is $27,516, while median incomes of families and households are $61,867 and $56,439 respectively.
| Characteristic | Number | Measure |
| Per Capita Income | 204,374 | $27,516 |
| Median Family Income | 54,314 | $61,867 |
| Mean Family Income | 54,314 | $80,183 |
| Median Household Income | 74,678 | $56,439 |
| Mean Household Income | 74,678 | $74,377 |
| Income Deficit | 54,314 | $12,124 |
| Wage / Income Gap (%) | 204,374 | 31.22% |
| Wage / Income Gap ($) | 204,374 | 68.78¢ per $1 |
| Gini / Inequality Index | 204,374 | 0.46 |
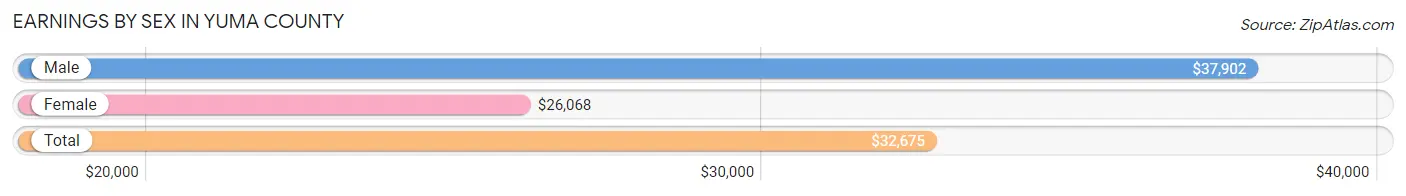
Earnings by Sex in Yuma County
Average Earnings in Yuma County are $32,675, $37,902 for men and $26,068 for women, a difference of 31.2%.
| Sex | Number | Average Earnings |
| Male | 52,479 (57.2%) | $37,902 |
| Female | 39,283 (42.8%) | $26,068 |
| Total | 91,762 (100.0%) | $32,675 |
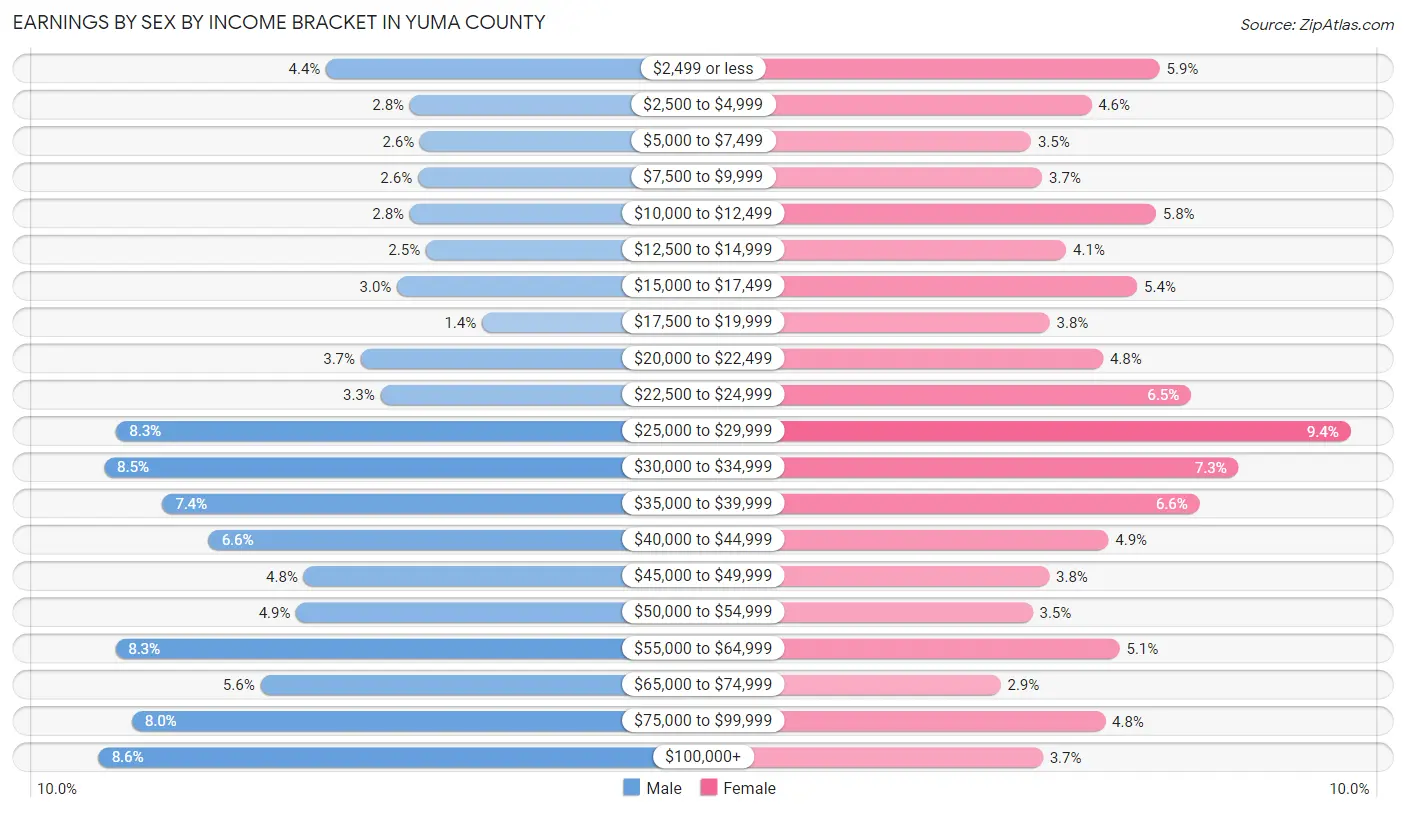
Earnings by Sex by Income Bracket in Yuma County
The most common earnings brackets in Yuma County are $100,000+ for men (4,519 | 8.6%) and $25,000 to $29,999 for women (3,707 | 9.4%).
| Income | Male | Female |
| $2,499 or less | 2,281 (4.3%) | 2,302 (5.9%) |
| $2,500 to $4,999 | 1,459 (2.8%) | 1,799 (4.6%) |
| $5,000 to $7,499 | 1,357 (2.6%) | 1,357 (3.5%) |
| $7,500 to $9,999 | 1,379 (2.6%) | 1,437 (3.7%) |
| $10,000 to $12,499 | 1,458 (2.8%) | 2,276 (5.8%) |
| $12,500 to $14,999 | 1,302 (2.5%) | 1,616 (4.1%) |
| $15,000 to $17,499 | 1,585 (3.0%) | 2,137 (5.4%) |
| $17,500 to $19,999 | 750 (1.4%) | 1,491 (3.8%) |
| $20,000 to $22,499 | 1,944 (3.7%) | 1,884 (4.8%) |
| $22,500 to $24,999 | 1,750 (3.3%) | 2,535 (6.5%) |
| $25,000 to $29,999 | 4,344 (8.3%) | 3,707 (9.4%) |
| $30,000 to $34,999 | 4,467 (8.5%) | 2,885 (7.3%) |
| $35,000 to $39,999 | 3,892 (7.4%) | 2,598 (6.6%) |
| $40,000 to $44,999 | 3,439 (6.6%) | 1,923 (4.9%) |
| $45,000 to $49,999 | 2,501 (4.8%) | 1,489 (3.8%) |
| $50,000 to $54,999 | 2,577 (4.9%) | 1,368 (3.5%) |
| $55,000 to $64,999 | 4,355 (8.3%) | 2,006 (5.1%) |
| $65,000 to $74,999 | 2,926 (5.6%) | 1,130 (2.9%) |
| $75,000 to $99,999 | 4,194 (8.0%) | 1,900 (4.8%) |
| $100,000+ | 4,519 (8.6%) | 1,443 (3.7%) |
| Total | 52,479 (100.0%) | 39,283 (100.0%) |
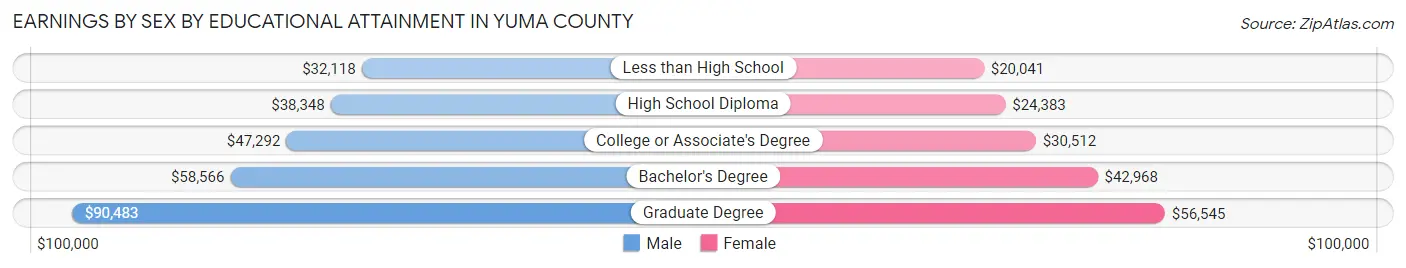
Earnings by Sex by Educational Attainment in Yuma County
Average earnings in Yuma County are $42,958 for men and $28,973 for women, a difference of 32.6%. Men with an educational attainment of graduate degree enjoy the highest average annual earnings of $90,483, while those with less than high school education earn the least with $32,118. Women with an educational attainment of graduate degree earn the most with the average annual earnings of $56,545, while those with less than high school education have the smallest earnings of $20,041.
| Educational Attainment | Male Income | Female Income |
| Less than High School | $32,118 | $20,041 |
| High School Diploma | $38,348 | $24,383 |
| College or Associate's Degree | $47,292 | $30,512 |
| Bachelor's Degree | $58,566 | $42,968 |
| Graduate Degree | $90,483 | $56,545 |
| Total | $42,958 | $28,973 |
Family Income in Yuma County
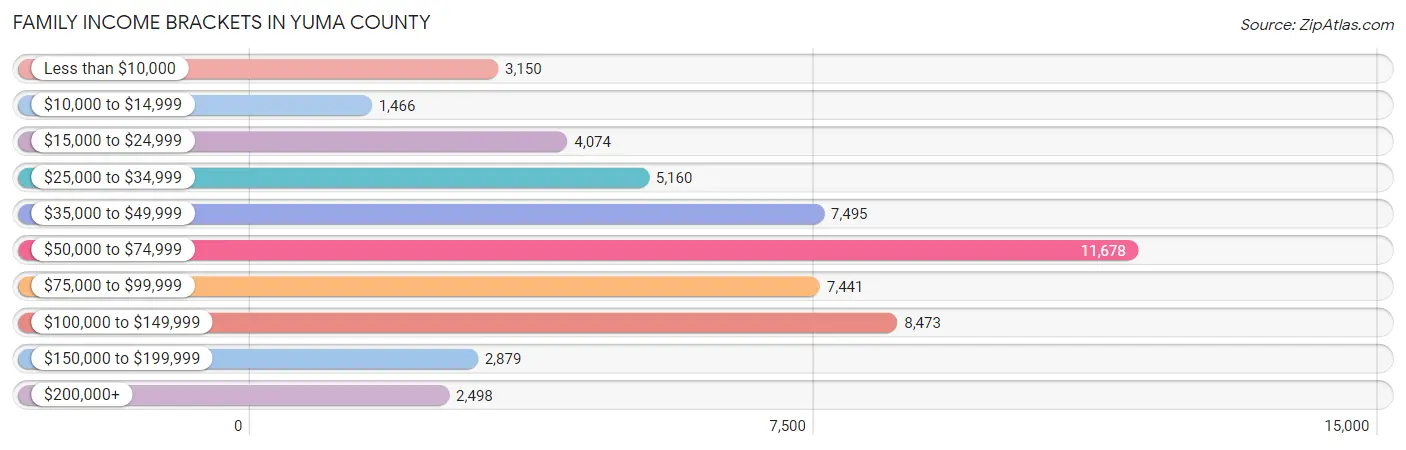
Family Income Brackets in Yuma County
According to the Yuma County family income data, there are 11,678 families falling into the $50,000 to $74,999 income range, which is the most common income bracket and makes up 21.5% of all families. Conversely, the $10,000 to $14,999 income bracket is the least frequent group with only 1,466 families (2.7%) belonging to this category.
| Income Bracket | # Families | % Families |
| Less than $10,000 | 3,150 | 5.8% |
| $10,000 to $14,999 | 1,466 | 2.7% |
| $15,000 to $24,999 | 4,074 | 7.5% |
| $25,000 to $34,999 | 5,160 | 9.5% |
| $35,000 to $49,999 | 7,495 | 13.8% |
| $50,000 to $74,999 | 11,678 | 21.5% |
| $75,000 to $99,999 | 7,441 | 13.7% |
| $100,000 to $149,999 | 8,473 | 15.6% |
| $150,000 to $199,999 | 2,879 | 5.3% |
| $200,000+ | 2,498 | 4.6% |
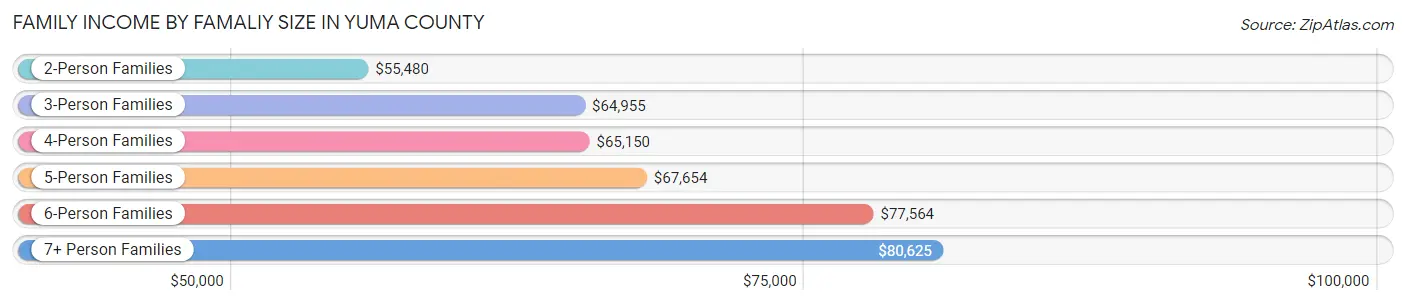
Family Income by Famaliy Size in Yuma County
7+ person families (1,384 | 2.5%) account for the highest median family income in Yuma County with $80,625 per family, while 2-person families (24,472 | 45.1%) have the highest median income of $27,740 per family member.
| Income Bracket | # Families | Median Income |
| 2-Person Families | 24,472 (45.1%) | $55,480 |
| 3-Person Families | 10,351 (19.1%) | $64,955 |
| 4-Person Families | 9,478 (17.4%) | $65,150 |
| 5-Person Families | 6,378 (11.7%) | $67,654 |
| 6-Person Families | 2,251 (4.1%) | $77,564 |
| 7+ Person Families | 1,384 (2.5%) | $80,625 |
| Total | 54,314 (100.0%) | $61,867 |
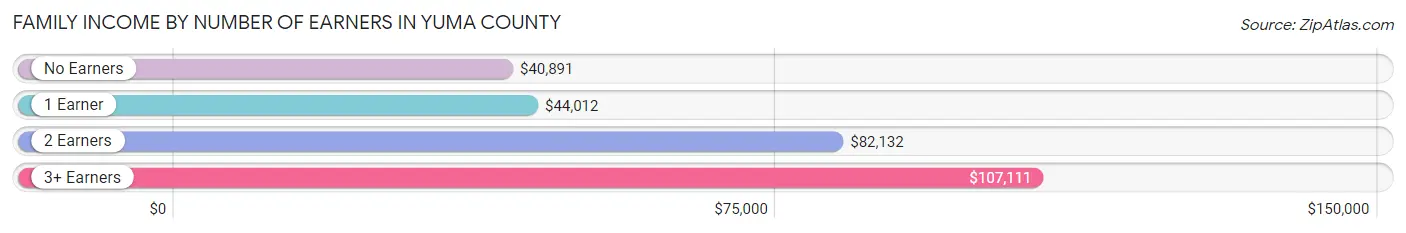
Family Income by Number of Earners in Yuma County
The median family income in Yuma County is $61,867, with families comprising 3+ earners (6,050) having the highest median family income of $107,111, while families with no earners (12,264) have the lowest median family income of $40,891, accounting for 11.1% and 22.6% of families, respectively.
| Number of Earners | # Families | Median Income |
| No Earners | 12,264 (22.6%) | $40,891 |
| 1 Earner | 18,637 (34.3%) | $44,012 |
| 2 Earners | 17,363 (32.0%) | $82,132 |
| 3+ Earners | 6,050 (11.1%) | $107,111 |
| Total | 54,314 (100.0%) | $61,867 |
Household Income in Yuma County
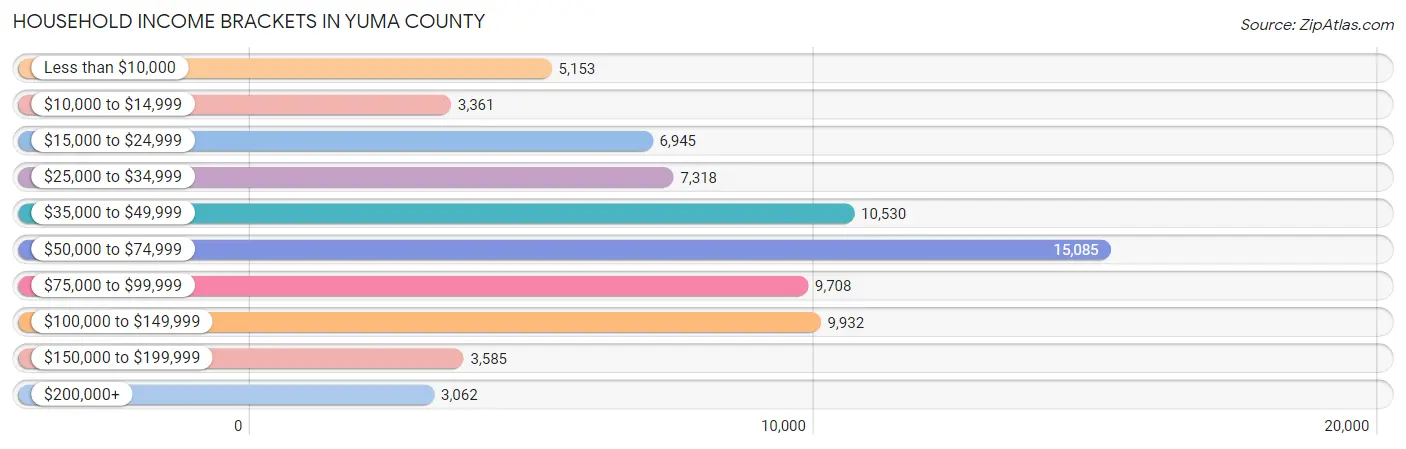
Household Income Brackets in Yuma County
With 15,085 households falling in the category, the $50,000 to $74,999 income range is the most frequent in Yuma County, accounting for 20.2% of all households. In contrast, only 3,062 households (4.1%) fall into the $200,000+ income bracket, making it the least populous group.
| Income Bracket | # Households | % Households |
| Less than $10,000 | 5,153 | 6.9% |
| $10,000 to $14,999 | 3,361 | 4.5% |
| $15,000 to $24,999 | 6,945 | 9.3% |
| $25,000 to $34,999 | 7,318 | 9.8% |
| $35,000 to $49,999 | 10,530 | 14.1% |
| $50,000 to $74,999 | 15,085 | 20.2% |
| $75,000 to $99,999 | 9,708 | 13.0% |
| $100,000 to $149,999 | 9,932 | 13.3% |
| $150,000 to $199,999 | 3,585 | 4.8% |
| $200,000+ | 3,062 | 4.1% |
Household Income by Householder Age in Yuma County
The median household income in Yuma County is $56,439, with the highest median household income of $68,332 found in the 45 to 64 years age bracket for the primary householder. A total of 21,885 households (29.3%) fall into this category. Meanwhile, the 65+ years age bracket for the primary householder has the lowest median household income of $43,011, with 24,678 households (33.1%) in this group.
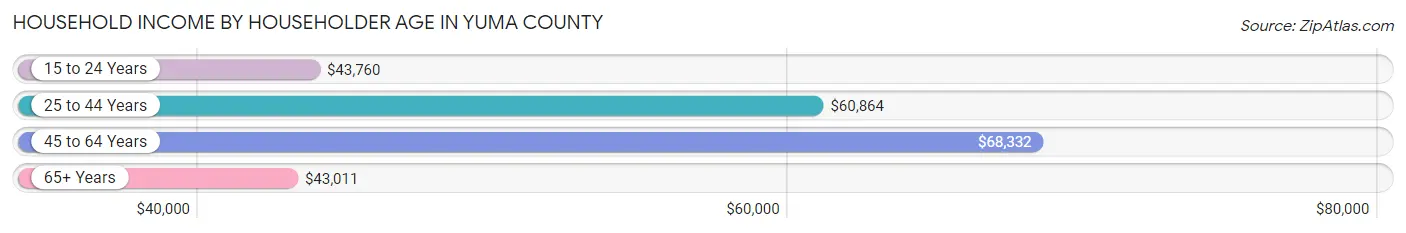
| Income Bracket | # Households | Median Income |
| 15 to 24 Years | 4,280 (5.7%) | $43,760 |
| 25 to 44 Years | 23,835 (31.9%) | $60,864 |
| 45 to 64 Years | 21,885 (29.3%) | $68,332 |
| 65+ Years | 24,678 (33.1%) | $43,011 |
| Total | 74,678 (100.0%) | $56,439 |
Poverty in Yuma County
Income Below Poverty by Sex and Age in Yuma County
With 15.6% poverty level for males and 19.5% for females among the residents of Yuma County, 15 year old males and under 5 year old females are the most vulnerable to poverty, with 564 males (36.0%) and 1,942 females (28.4%) in their respective age groups living below the poverty level.
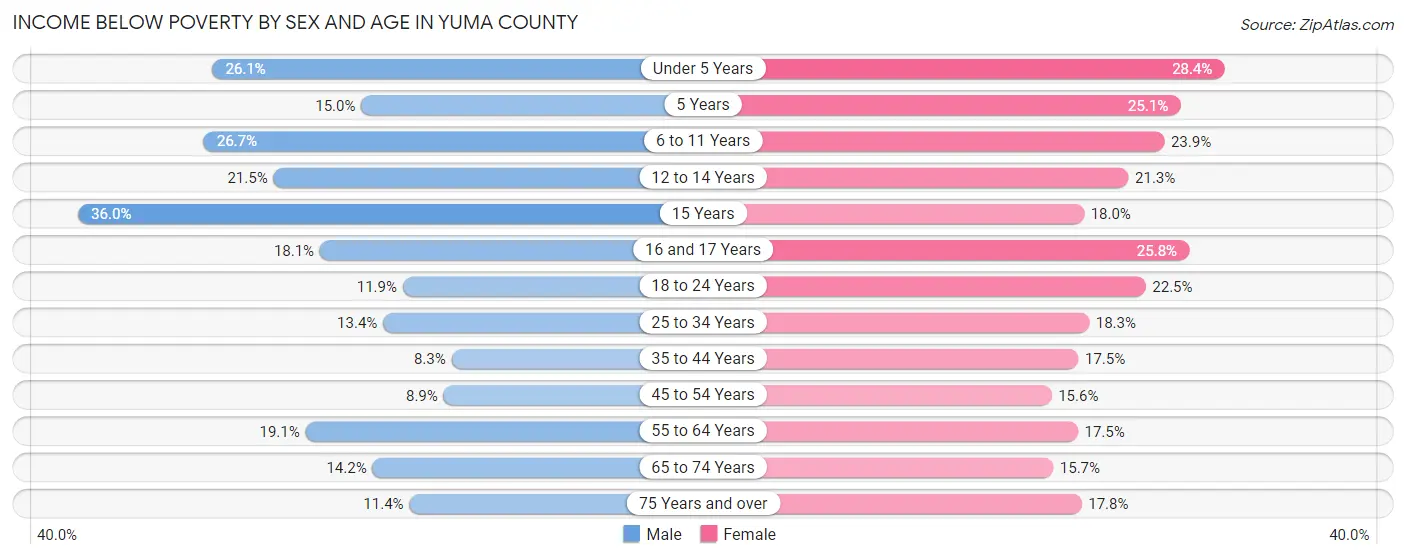
| Age Bracket | Male | Female |
| Under 5 Years | 1,826 (26.1%) | 1,942 (28.4%) |
| 5 Years | 216 (15.0%) | 303 (25.1%) |
| 6 to 11 Years | 2,251 (26.7%) | 1,978 (23.9%) |
| 12 to 14 Years | 982 (21.5%) | 889 (21.3%) |
| 15 Years | 564 (36.0%) | 224 (18.0%) |
| 16 and 17 Years | 518 (18.1%) | 764 (25.8%) |
| 18 to 24 Years | 1,303 (11.9%) | 2,042 (22.5%) |
| 25 to 34 Years | 1,897 (13.4%) | 2,357 (18.3%) |
| 35 to 44 Years | 915 (8.3%) | 1,859 (17.5%) |
| 45 to 54 Years | 815 (8.9%) | 1,572 (15.5%) |
| 55 to 64 Years | 1,780 (19.1%) | 1,766 (17.5%) |
| 65 to 74 Years | 1,317 (14.2%) | 1,627 (15.7%) |
| 75 Years and over | 1,121 (11.4%) | 1,826 (17.8%) |
| Total | 15,505 (15.6%) | 19,149 (19.5%) |
Income Above Poverty by Sex and Age in Yuma County
According to the poverty statistics in Yuma County, males aged 35 to 44 years and females aged 45 to 54 years are the age groups that are most secure financially, with 91.7% of males and 84.5% of females in these age groups living above the poverty line.
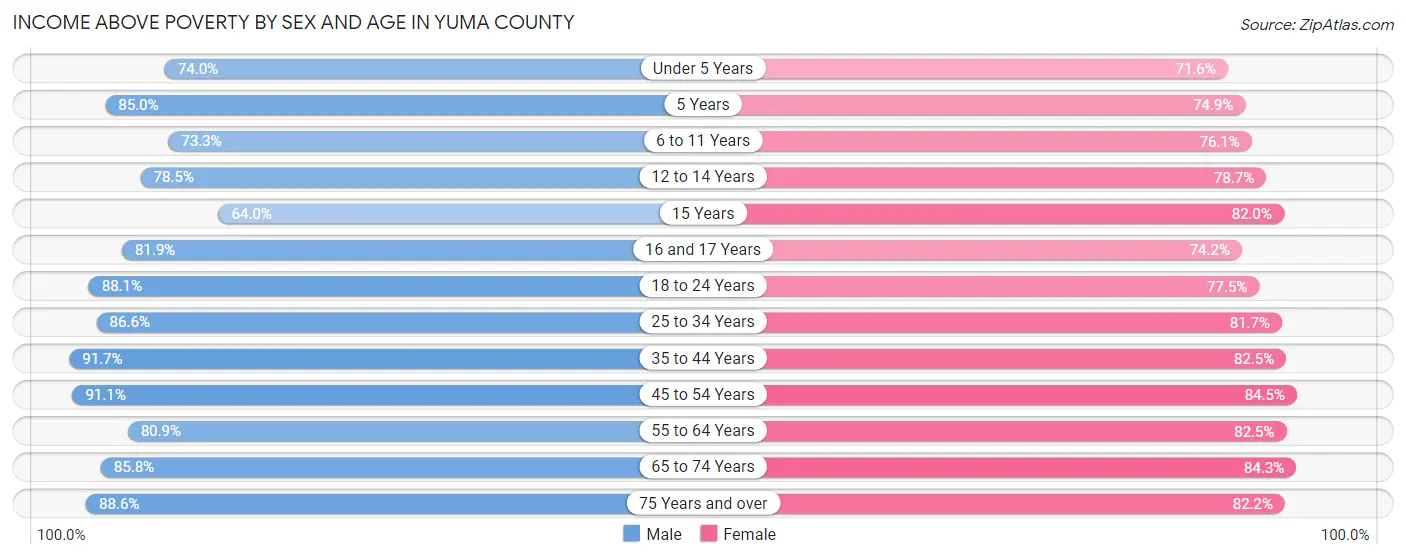
| Age Bracket | Male | Female |
| Under 5 Years | 5,184 (74.0%) | 4,899 (71.6%) |
| 5 Years | 1,224 (85.0%) | 903 (74.9%) |
| 6 to 11 Years | 6,182 (73.3%) | 6,290 (76.1%) |
| 12 to 14 Years | 3,582 (78.5%) | 3,292 (78.7%) |
| 15 Years | 1,002 (64.0%) | 1,023 (82.0%) |
| 16 and 17 Years | 2,349 (81.9%) | 2,201 (74.2%) |
| 18 to 24 Years | 9,625 (88.1%) | 7,018 (77.5%) |
| 25 to 34 Years | 12,281 (86.6%) | 10,496 (81.7%) |
| 35 to 44 Years | 10,112 (91.7%) | 8,740 (82.5%) |
| 45 to 54 Years | 8,348 (91.1%) | 8,535 (84.5%) |
| 55 to 64 Years | 7,520 (80.9%) | 8,325 (82.5%) |
| 65 to 74 Years | 7,977 (85.8%) | 8,755 (84.3%) |
| 75 Years and over | 8,684 (88.6%) | 8,445 (82.2%) |
| Total | 84,070 (84.4%) | 78,922 (80.5%) |
Income Below Poverty Among Married-Couple Families in Yuma County
The poverty statistics for married-couple families in Yuma County show that 8.8% or 3,359 of the total 38,208 families live below the poverty line. Families with 5 or more children have the highest poverty rate of 30.0%, comprising of 104 families. On the other hand, families with 1 or 2 children have the lowest poverty rate of 6.0%, which includes 689 families.
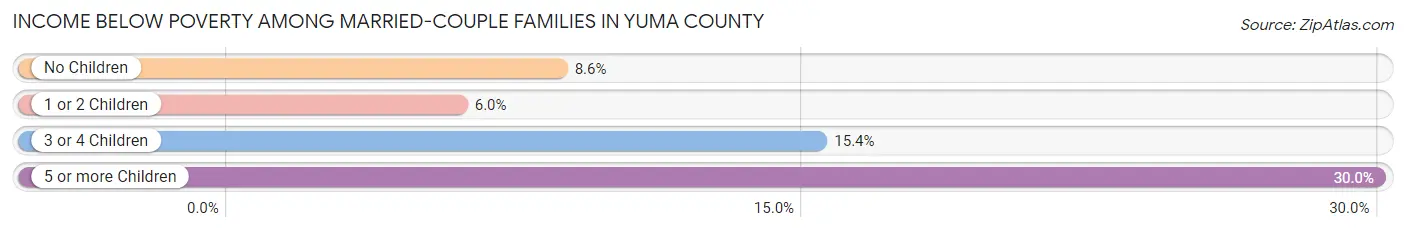
| Children | Above Poverty | Below Poverty |
| No Children | 20,148 (91.4%) | 1,899 (8.6%) |
| 1 or 2 Children | 10,792 (94.0%) | 689 (6.0%) |
| 3 or 4 Children | 3,666 (84.6%) | 667 (15.4%) |
| 5 or more Children | 243 (70.0%) | 104 (30.0%) |
| Total | 34,849 (91.2%) | 3,359 (8.8%) |
Income Below Poverty Among Single-Parent Households in Yuma County
According to the poverty data in Yuma County, 22.3% or 1,063 single-father households and 31.7% or 3,595 single-mother households are living below the poverty line. Among single-father households, those with 3 or 4 children have the highest poverty rate, with 245 households (54.6%) experiencing poverty. Likewise, among single-mother households, those with 5 or more children have the highest poverty rate, with 105 households (68.2%) falling below the poverty line.
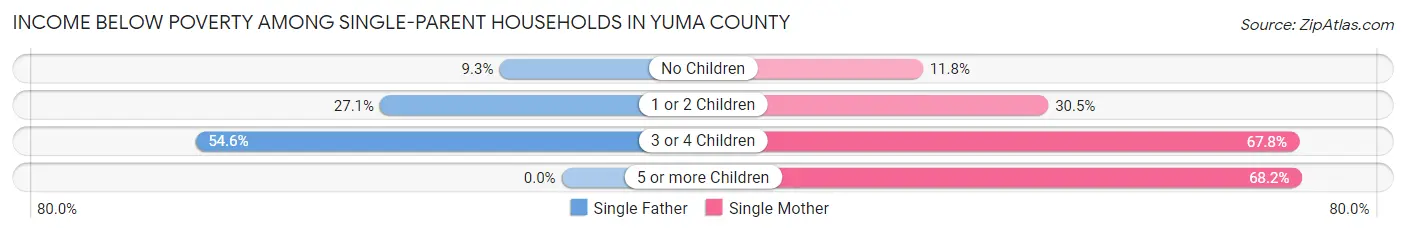
| Children | Single Father | Single Mother |
| No Children | 180 (9.3%) | 397 (11.8%) |
| 1 or 2 Children | 638 (27.1%) | 1,799 (30.5%) |
| 3 or 4 Children | 245 (54.6%) | 1,294 (67.8%) |
| 5 or more Children | 0 (0.0%) | 105 (68.2%) |
| Total | 1,063 (22.3%) | 3,595 (31.7%) |
Income Below Poverty Among Married-Couple vs Single-Parent Households in Yuma County
The poverty data for Yuma County shows that 3,359 of the married-couple family households (8.8%) and 4,658 of the single-parent households (28.9%) are living below the poverty level. Within the married-couple family households, those with 5 or more children have the highest poverty rate, with 104 households (30.0%) falling below the poverty line. Among the single-parent households, those with 3 or 4 children have the highest poverty rate, with 1,539 household (65.3%) living below poverty.
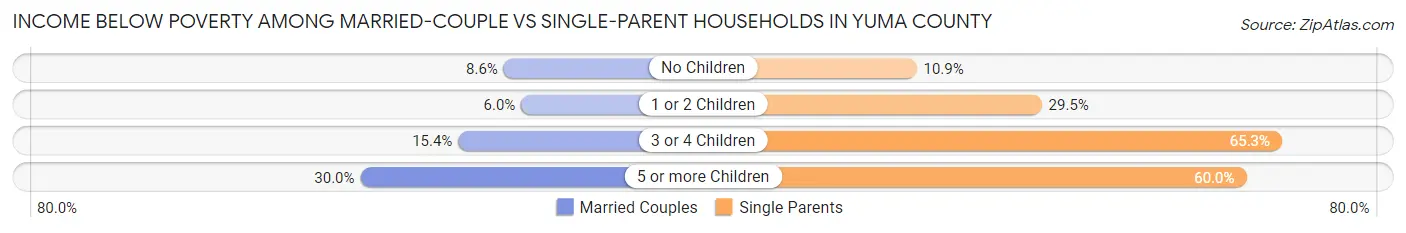
| Children | Married-Couple Families | Single-Parent Households |
| No Children | 1,899 (8.6%) | 577 (10.9%) |
| 1 or 2 Children | 689 (6.0%) | 2,437 (29.5%) |
| 3 or 4 Children | 667 (15.4%) | 1,539 (65.3%) |
| 5 or more Children | 104 (30.0%) | 105 (60.0%) |
| Total | 3,359 (8.8%) | 4,658 (28.9%) |
Race in Yuma County
The most populous races in Yuma County are Hispanic or Latino (133,381 | 65.3%), White / Caucasian (118,769 | 58.1%), and Two or more Races (52,679 | 25.8%).
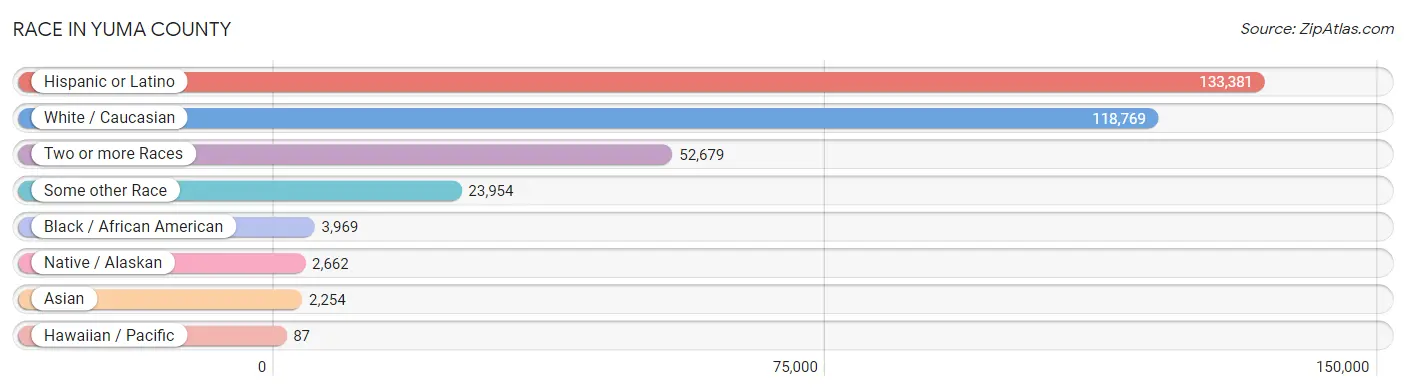
| Race | # Population | % Population |
| Asian | 2,254 | 1.1% |
| Black / African American | 3,969 | 1.9% |
| Hawaiian / Pacific | 87 | 0.0% |
| Hispanic or Latino | 133,381 | 65.3% |
| Native / Alaskan | 2,662 | 1.3% |
| White / Caucasian | 118,769 | 58.1% |
| Two or more Races | 52,679 | 25.8% |
| Some other Race | 23,954 | 11.7% |
| Total | 204,374 | 100.0% |
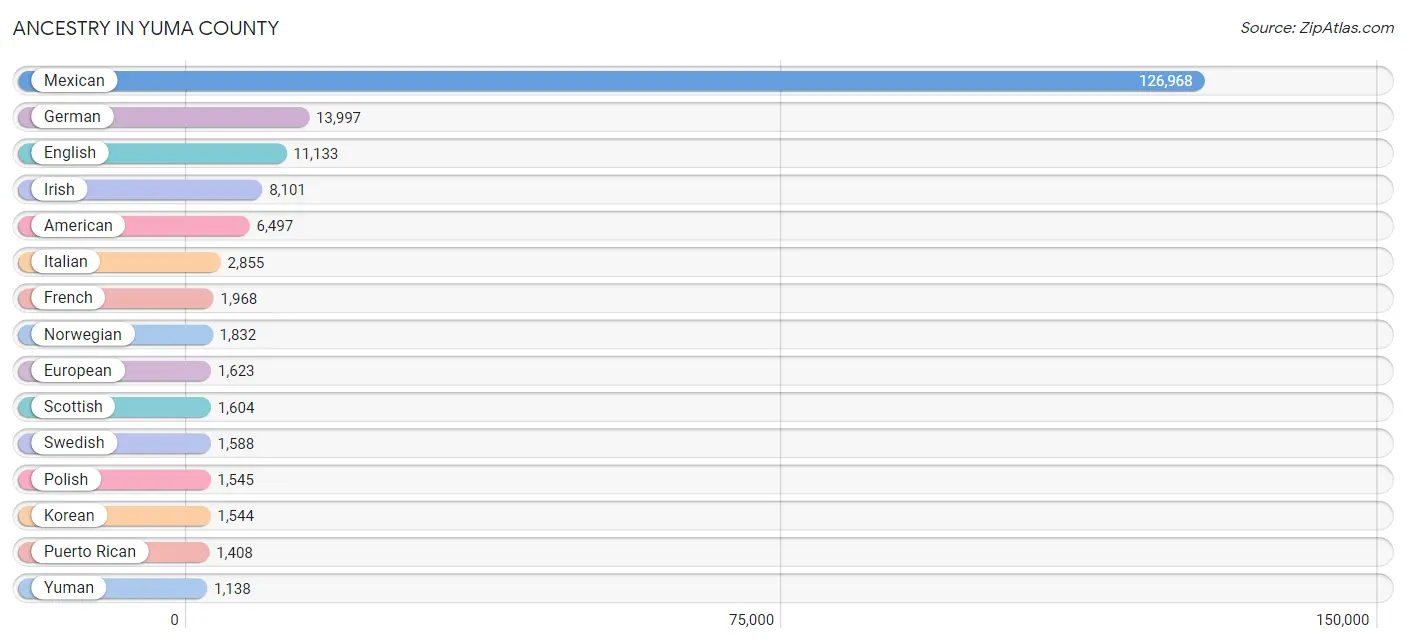
Ancestry in Yuma County
The most populous ancestries reported in Yuma County are Mexican (126,968 | 62.1%), German (13,997 | 6.9%), English (11,133 | 5.4%), Irish (8,101 | 4.0%), and American (6,497 | 3.2%), together accounting for 81.6% of all Yuma County residents.
| Ancestry | # Population | % Population |
| African | 485 | 0.2% |
| Alaskan Athabascan | 33 | 0.0% |
| Alsatian | 2 | 0.0% |
| American | 6,497 | 3.2% |
| Apache | 177 | 0.1% |
| Arab | 265 | 0.1% |
| Armenian | 17 | 0.0% |
| Australian | 20 | 0.0% |
| Austrian | 130 | 0.1% |
| Bangladeshi | 22 | 0.0% |
| Basque | 70 | 0.0% |
| Belgian | 67 | 0.0% |
| Belizean | 34 | 0.0% |
| Bhutanese | 484 | 0.2% |
| Blackfeet | 180 | 0.1% |
| Bolivian | 10 | 0.0% |
| Brazilian | 72 | 0.0% |
| British | 518 | 0.3% |
| British West Indian | 26 | 0.0% |
| Bulgarian | 18 | 0.0% |
| Burmese | 328 | 0.2% |
| Cajun | 10 | 0.0% |
| Canadian | 701 | 0.3% |
| Celtic | 12 | 0.0% |
| Central American | 955 | 0.5% |
| Central American Indian | 255 | 0.1% |
| Cherokee | 556 | 0.3% |
| Chickasaw | 10 | 0.0% |
| Chinese | 20 | 0.0% |
| Chippewa | 35 | 0.0% |
| Choctaw | 105 | 0.1% |
| Colombian | 135 | 0.1% |
| Comanche | 51 | 0.0% |
| Costa Rican | 109 | 0.1% |
| Creek | 43 | 0.0% |
| Croatian | 119 | 0.1% |
| Cuban | 254 | 0.1% |
| Czech | 258 | 0.1% |
| Czechoslovakian | 22 | 0.0% |
| Danish | 745 | 0.4% |
| Dominican | 227 | 0.1% |
| Dutch | 1,112 | 0.5% |
| Eastern European | 65 | 0.0% |
| Ecuadorian | 121 | 0.1% |
| English | 11,133 | 5.4% |
| European | 1,623 | 0.8% |
| Finnish | 304 | 0.2% |
| French | 1,968 | 1.0% |
| French American Indian | 17 | 0.0% |
| French Canadian | 369 | 0.2% |
| German | 13,997 | 6.9% |
| German Russian | 1 | 0.0% |
| Ghanaian | 10 | 0.0% |
| Greek | 308 | 0.2% |
| Guamanian / Chamorro | 49 | 0.0% |
| Guatemalan | 362 | 0.2% |
| Honduran | 65 | 0.0% |
| Hungarian | 264 | 0.1% |
| Icelander | 6 | 0.0% |
| Indian (Asian) | 423 | 0.2% |
| Iranian | 30 | 0.0% |
| Iraqi | 39 | 0.0% |
| Irish | 8,101 | 4.0% |
| Iroquois | 33 | 0.0% |
| Italian | 2,855 | 1.4% |
| Jamaican | 93 | 0.1% |
| Japanese | 66 | 0.0% |
| Jordanian | 33 | 0.0% |
| Korean | 1,544 | 0.8% |
| Laotian | 8 | 0.0% |
| Latvian | 31 | 0.0% |
| Lebanese | 109 | 0.1% |
| Lithuanian | 64 | 0.0% |
| Luxembourger | 15 | 0.0% |
| Mexican | 126,968 | 62.1% |
| Mexican American Indian | 645 | 0.3% |
| Mongolian | 12 | 0.0% |
| Moroccan | 15 | 0.0% |
| Native Hawaiian | 149 | 0.1% |
| Navajo | 426 | 0.2% |
| New Zealander | 25 | 0.0% |
| Nicaraguan | 7 | 0.0% |
| Nigerian | 47 | 0.0% |
| Northern European | 68 | 0.0% |
| Norwegian | 1,832 | 0.9% |
| Ottawa | 5 | 0.0% |
| Pakistani | 30 | 0.0% |
| Palestinian | 24 | 0.0% |
| Panamanian | 46 | 0.0% |
| Pennsylvania German | 26 | 0.0% |
| Peruvian | 151 | 0.1% |
| Pima | 66 | 0.0% |
| Polish | 1,545 | 0.8% |
| Portuguese | 408 | 0.2% |
| Potawatomi | 10 | 0.0% |
| Puerto Rican | 1,408 | 0.7% |
| Puget Sound Salish | 4 | 0.0% |
| Romanian | 198 | 0.1% |
| Russian | 251 | 0.1% |
| Salvadoran | 366 | 0.2% |
| Samoan | 46 | 0.0% |
| Scandinavian | 407 | 0.2% |
| Scotch-Irish | 863 | 0.4% |
| Scottish | 1,604 | 0.8% |
| Serbian | 1 | 0.0% |
| Shoshone | 16 | 0.0% |
| Sioux | 151 | 0.1% |
| Slavic | 31 | 0.0% |
| Slovak | 26 | 0.0% |
| Slovene | 12 | 0.0% |
| South African | 10 | 0.0% |
| South American | 557 | 0.3% |
| South American Indian | 32 | 0.0% |
| Spaniard | 567 | 0.3% |
| Spanish | 503 | 0.3% |
| Spanish American | 11 | 0.0% |
| Spanish American Indian | 21 | 0.0% |
| Sri Lankan | 324 | 0.2% |
| Subsaharan African | 613 | 0.3% |
| Sudanese | 9 | 0.0% |
| Swedish | 1,588 | 0.8% |
| Swiss | 243 | 0.1% |
| Taiwanese | 98 | 0.1% |
| Thai | 281 | 0.1% |
| Tohono O'Odham | 191 | 0.1% |
| Tongan | 88 | 0.0% |
| Trinidadian and Tobagonian | 123 | 0.1% |
| U.S. Virgin Islander | 9 | 0.0% |
| Ukrainian | 316 | 0.2% |
| Uruguayan | 33 | 0.0% |
| Venezuelan | 89 | 0.0% |
| Welsh | 408 | 0.2% |
| West Indian | 56 | 0.0% |
| Yakama | 20 | 0.0% |
| Yaqui | 391 | 0.2% |
| Yugoslavian | 60 | 0.0% |
| Yuman | 1,138 | 0.6% | View All 137 Rows |
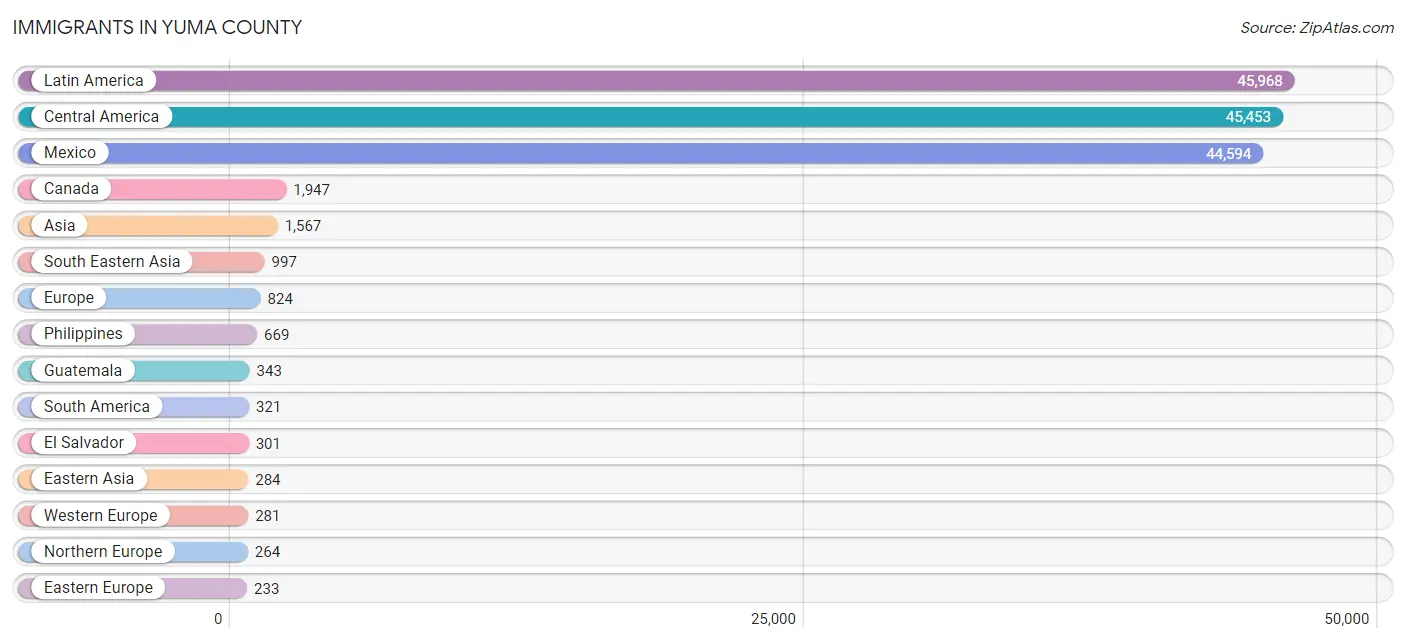
Immigrants in Yuma County
The most numerous immigrant groups reported in Yuma County came from Latin America (45,968 | 22.5%), Central America (45,453 | 22.2%), Mexico (44,594 | 21.8%), Canada (1,947 | 0.9%), and Asia (1,567 | 0.8%), together accounting for 68.3% of all Yuma County residents.
| Immigration Origin | # Population | % Population |
| Africa | 162 | 0.1% |
| Asia | 1,567 | 0.8% |
| Australia | 12 | 0.0% |
| Bahamas | 35 | 0.0% |
| Bangladesh | 30 | 0.0% |
| Belize | 9 | 0.0% |
| Bolivia | 10 | 0.0% |
| Bosnia and Herzegovina | 5 | 0.0% |
| Brazil | 36 | 0.0% |
| Bulgaria | 16 | 0.0% |
| Cambodia | 38 | 0.0% |
| Canada | 1,947 | 0.9% |
| Caribbean | 194 | 0.1% |
| Central America | 45,453 | 22.2% |
| China | 39 | 0.0% |
| Colombia | 54 | 0.0% |
| Costa Rica | 122 | 0.1% |
| Cuba | 60 | 0.0% |
| Czechoslovakia | 9 | 0.0% |
| Denmark | 12 | 0.0% |
| Eastern Asia | 284 | 0.1% |
| Eastern Europe | 233 | 0.1% |
| Ecuador | 96 | 0.1% |
| El Salvador | 301 | 0.2% |
| England | 124 | 0.1% |
| Europe | 824 | 0.4% |
| Germany | 217 | 0.1% |
| Ghana | 10 | 0.0% |
| Guatemala | 343 | 0.2% |
| Haiti | 6 | 0.0% |
| Honduras | 53 | 0.0% |
| Hong Kong | 8 | 0.0% |
| India | 129 | 0.1% |
| Iraq | 28 | 0.0% |
| Ireland | 10 | 0.0% |
| Italy | 27 | 0.0% |
| Jamaica | 71 | 0.0% |
| Japan | 109 | 0.1% |
| Jordan | 33 | 0.0% |
| Korea | 136 | 0.1% |
| Latin America | 45,968 | 22.5% |
| Lebanon | 10 | 0.0% |
| Malaysia | 12 | 0.0% |
| Mexico | 44,594 | 21.8% |
| Middle Africa | 11 | 0.0% |
| Netherlands | 64 | 0.0% |
| Nigeria | 40 | 0.0% |
| Northern Africa | 15 | 0.0% |
| Northern Europe | 264 | 0.1% |
| Oceania | 68 | 0.0% |
| Pakistan | 5 | 0.0% |
| Panama | 31 | 0.0% |
| Peru | 26 | 0.0% |
| Philippines | 669 | 0.3% |
| Poland | 46 | 0.0% |
| Portugal | 6 | 0.0% |
| Romania | 13 | 0.0% |
| Russia | 30 | 0.0% |
| Scotland | 24 | 0.0% |
| South Africa | 48 | 0.0% |
| South America | 321 | 0.2% |
| South Central Asia | 190 | 0.1% |
| South Eastern Asia | 997 | 0.5% |
| Southern Europe | 46 | 0.0% |
| Spain | 13 | 0.0% |
| Sri Lanka | 26 | 0.0% |
| Sweden | 36 | 0.0% |
| Thailand | 117 | 0.1% |
| Trinidad and Tobago | 22 | 0.0% |
| Ukraine | 74 | 0.0% |
| Uruguay | 33 | 0.0% |
| Venezuela | 52 | 0.0% |
| Vietnam | 151 | 0.1% |
| Western Africa | 63 | 0.0% |
| Western Asia | 96 | 0.1% |
| Western Europe | 281 | 0.1% |
| Zaire | 11 | 0.0% | View All 77 Rows |
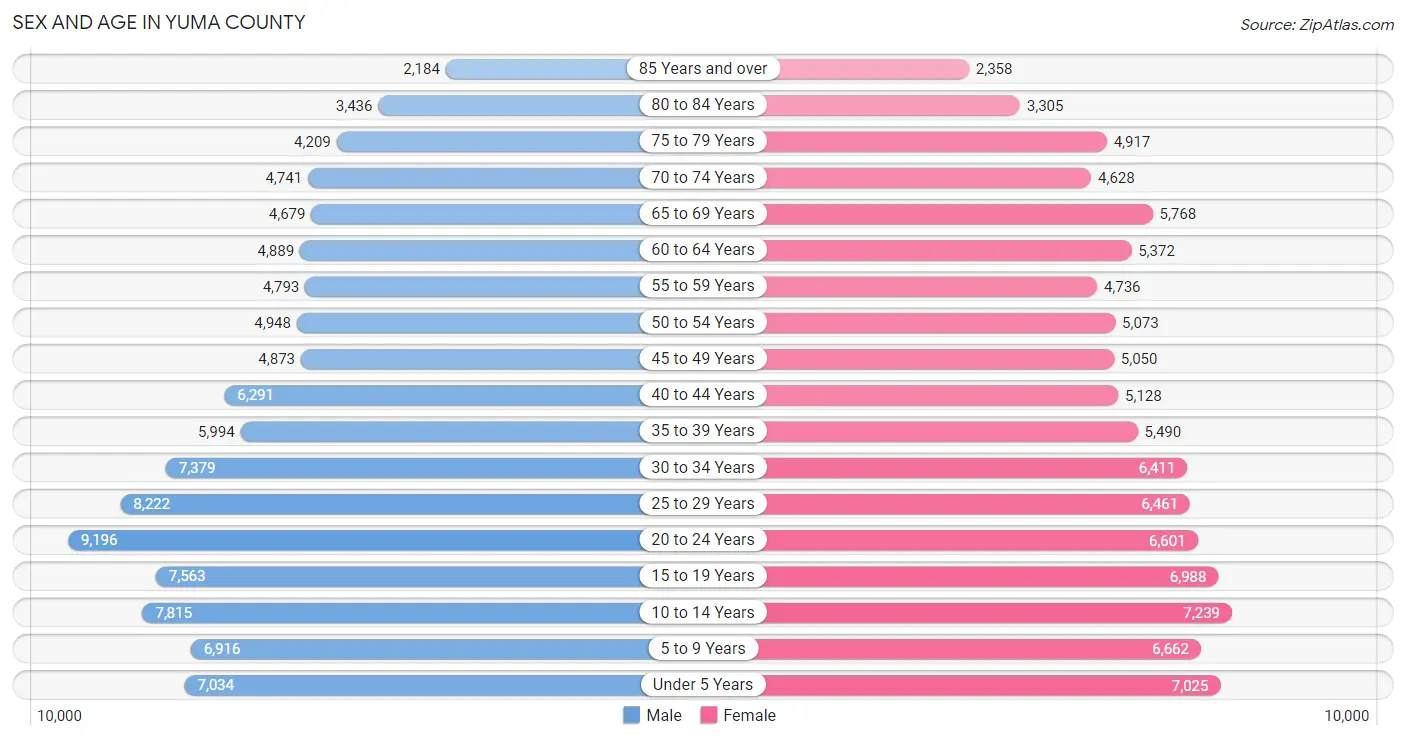
Sex and Age in Yuma County
Sex and Age in Yuma County
The most populous age groups in Yuma County are 20 to 24 Years (9,196 | 8.7%) for men and 10 to 14 Years (7,239 | 7.3%) for women.
| Age Bracket | Male | Female |
| Under 5 Years | 7,034 (6.7%) | 7,025 (7.1%) |
| 5 to 9 Years | 6,916 (6.6%) | 6,662 (6.7%) |
| 10 to 14 Years | 7,815 (7.4%) | 7,239 (7.3%) |
| 15 to 19 Years | 7,563 (7.2%) | 6,988 (7.0%) |
| 20 to 24 Years | 9,196 (8.7%) | 6,601 (6.7%) |
| 25 to 29 Years | 8,222 (7.8%) | 6,461 (6.5%) |
| 30 to 34 Years | 7,379 (7.0%) | 6,411 (6.5%) |
| 35 to 39 Years | 5,994 (5.7%) | 5,490 (5.5%) |
| 40 to 44 Years | 6,291 (6.0%) | 5,128 (5.2%) |
| 45 to 49 Years | 4,873 (4.6%) | 5,050 (5.1%) |
| 50 to 54 Years | 4,948 (4.7%) | 5,073 (5.1%) |
| 55 to 59 Years | 4,793 (4.6%) | 4,736 (4.8%) |
| 60 to 64 Years | 4,889 (4.6%) | 5,372 (5.4%) |
| 65 to 69 Years | 4,679 (4.4%) | 5,768 (5.8%) |
| 70 to 74 Years | 4,741 (4.5%) | 4,628 (4.7%) |
| 75 to 79 Years | 4,209 (4.0%) | 4,917 (5.0%) |
| 80 to 84 Years | 3,436 (3.3%) | 3,305 (3.3%) |
| 85 Years and over | 2,184 (2.1%) | 2,358 (2.4%) |
| Total | 105,162 (100.0%) | 99,212 (100.0%) |
Families and Households in Yuma County
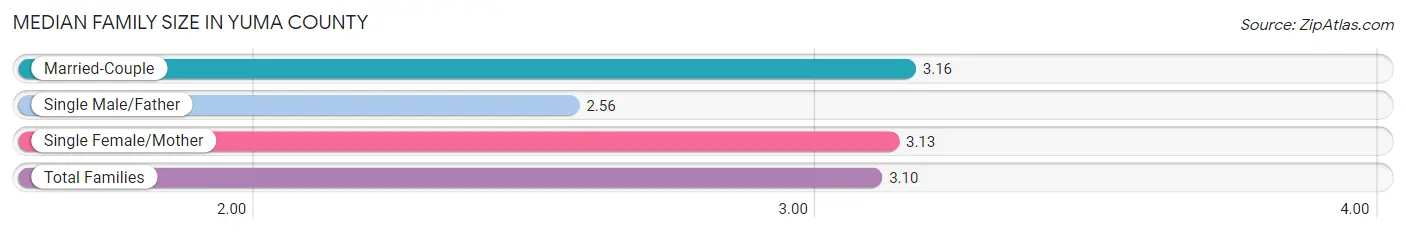
Median Family Size in Yuma County
The median family size in Yuma County is 3.10 persons per family, with married-couple families (38,208 | 70.4%) accounting for the largest median family size of 3.16 persons per family. On the other hand, single male/father families (4,770 | 8.8%) represent the smallest median family size with 2.56 persons per family.
| Family Type | # Families | Family Size |
| Married-Couple | 38,208 (70.4%) | 3.16 |
| Single Male/Father | 4,770 (8.8%) | 2.56 |
| Single Female/Mother | 11,336 (20.9%) | 3.13 |
| Total Families | 54,314 (100.0%) | 3.10 |
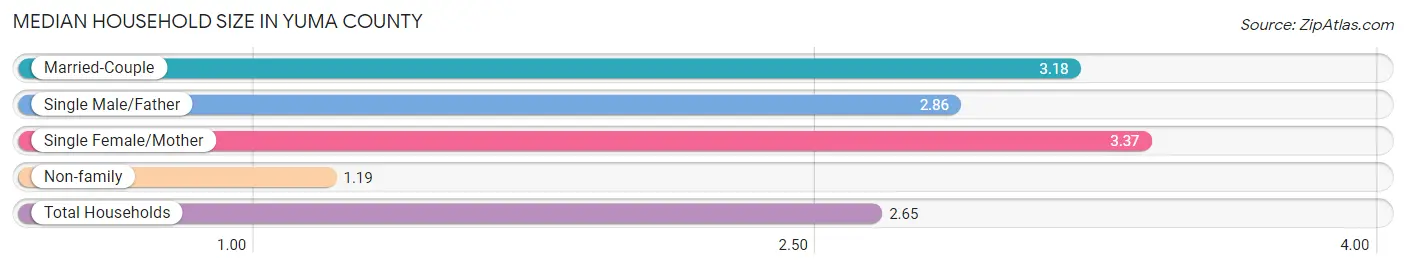
Median Household Size in Yuma County
The median household size in Yuma County is 2.65 persons per household, with single female/mother households (11,336 | 15.2%) accounting for the largest median household size of 3.37 persons per household. non-family households (20,364 | 27.3%) represent the smallest median household size with 1.19 persons per household.
| Household Type | # Households | Household Size |
| Married-Couple | 38,208 (51.2%) | 3.18 |
| Single Male/Father | 4,770 (6.4%) | 2.86 |
| Single Female/Mother | 11,336 (15.2%) | 3.37 |
| Non-family | 20,364 (27.3%) | 1.19 |
| Total Households | 74,678 (100.0%) | 2.65 |
Household Size by Marriage Status in Yuma County
Out of a total of 74,678 households in Yuma County, 54,314 (72.7%) are family households, while 20,364 (27.3%) are nonfamily households. The most numerous type of family households are 2-person households, comprising 22,840, and the most common type of nonfamily households are 1-person households, comprising 16,505.
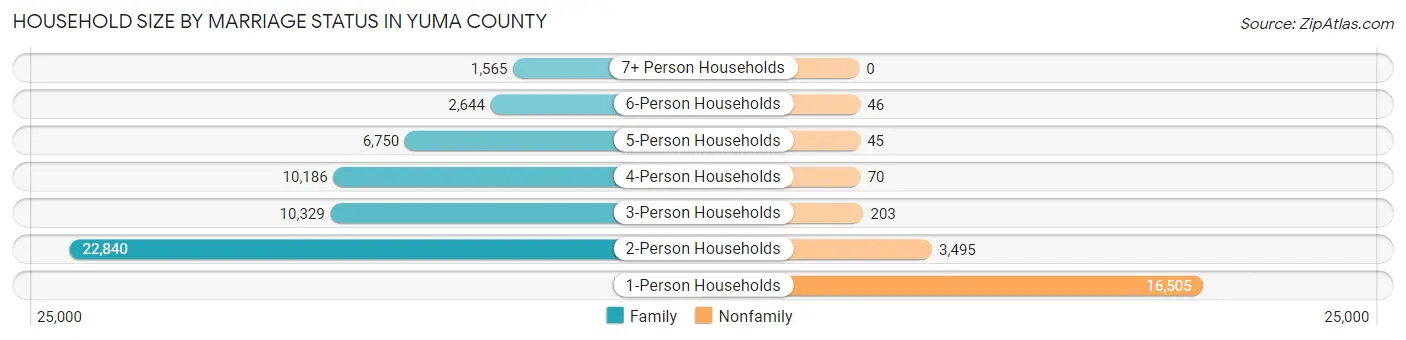
| Household Size | Family Households | Nonfamily Households |
| 1-Person Households | - | 16,505 (22.1%) |
| 2-Person Households | 22,840 (30.6%) | 3,495 (4.7%) |
| 3-Person Households | 10,329 (13.8%) | 203 (0.3%) |
| 4-Person Households | 10,186 (13.6%) | 70 (0.1%) |
| 5-Person Households | 6,750 (9.0%) | 45 (0.1%) |
| 6-Person Households | 2,644 (3.5%) | 46 (0.1%) |
| 7+ Person Households | 1,565 (2.1%) | 0 (0.0%) |
| Total | 54,314 (72.7%) | 20,364 (27.3%) |
Female Fertility in Yuma County
Fertility by Age in Yuma County
Average fertility rate in Yuma County is 70.0 births per 1,000 women. Women in the age bracket of 20 to 34 years have the highest fertility rate with 116.0 births per 1,000 women. Women in the age bracket of 20 to 34 years acount for 74.6% of all women with births.
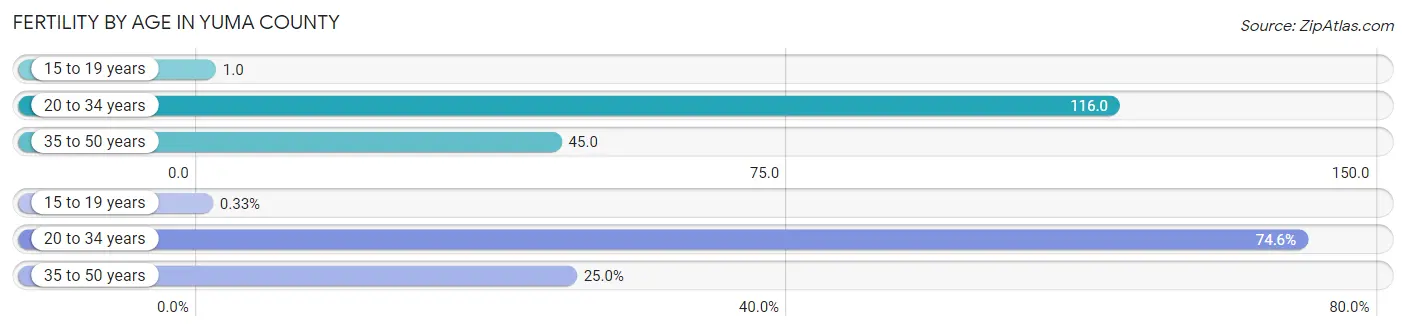
| Age Bracket | Women with Births | Births / 1,000 Women |
| 15 to 19 years | 10 (0.3%) | 1.0 |
| 20 to 34 years | 2,255 (74.6%) | 116.0 |
| 35 to 50 years | 756 (25.0%) | 45.0 |
| Total | 3,021 (100.0%) | 70.0 |
Fertility by Age by Marriage Status in Yuma County
61.2% of women with births (3,021) in Yuma County are married. The highest percentage of unmarried women with births falls into 15 to 19 years age bracket with 100.0% of them unmarried at the time of birth, while the lowest percentage of unmarried women with births belong to 35 to 50 years age bracket with 31.4% of them unmarried.
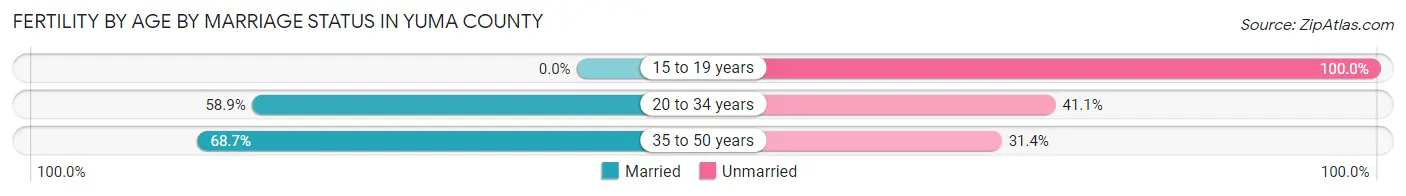
| Age Bracket | Married | Unmarried |
| 15 to 19 years | 0 (0.0%) | 10 (100.0%) |
| 20 to 34 years | 1,328 (58.9%) | 927 (41.1%) |
| 35 to 50 years | 519 (68.6%) | 237 (31.4%) |
| Total | 1,849 (61.2%) | 1,172 (38.8%) |
Fertility by Education in Yuma County
Average fertility rate in Yuma County is 70.0 births per 1,000 women. Women with the education attainment of high school diploma have the highest fertility rate of 101.0 births per 1,000 women, while women with the education attainment of less than high school have the lowest fertility at 42.0 births per 1,000 women. Women with the education attainment of college or associate's degree represent 36.1% of all women with births.
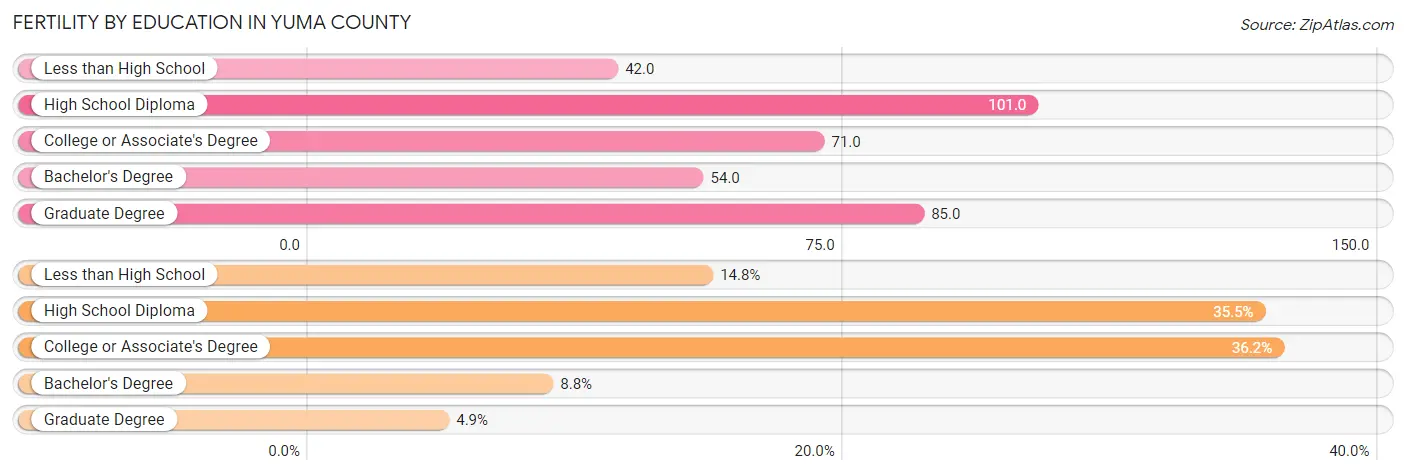
| Educational Attainment | Women with Births | Births / 1,000 Women |
| Less than High School | 446 (14.8%) | 42.0 |
| High School Diploma | 1,071 (35.4%) | 101.0 |
| College or Associate's Degree | 1,092 (36.1%) | 71.0 |
| Bachelor's Degree | 265 (8.8%) | 54.0 |
| Graduate Degree | 147 (4.9%) | 85.0 |
| Total | 3,021 (100.0%) | 70.0 |
Fertility by Education by Marriage Status in Yuma County
38.8% of women with births in Yuma County are unmarried. Women with the educational attainment of bachelor's degree are most likely to be married with 78.5% of them married at childbirth, while women with the educational attainment of high school diploma are least likely to be married with 49.3% of them unmarried at childbirth.
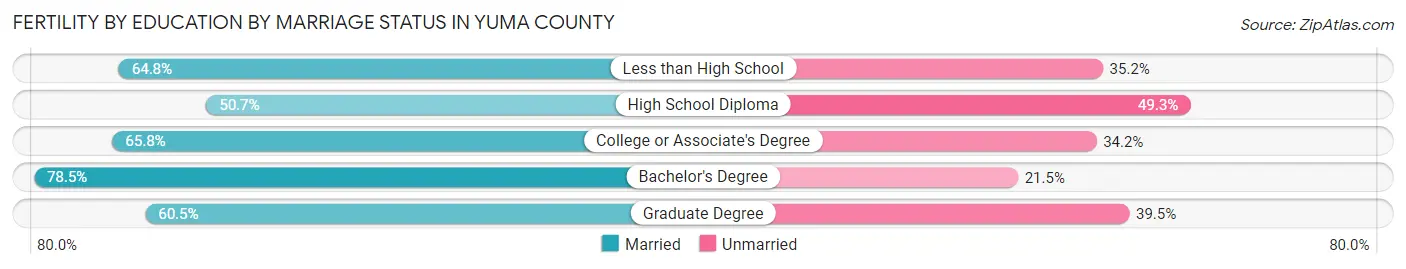
| Educational Attainment | Married | Unmarried |
| Less than High School | 289 (64.8%) | 157 (35.2%) |
| High School Diploma | 543 (50.7%) | 528 (49.3%) |
| College or Associate's Degree | 719 (65.8%) | 373 (34.2%) |
| Bachelor's Degree | 208 (78.5%) | 57 (21.5%) |
| Graduate Degree | 89 (60.5%) | 58 (39.5%) |
| Total | 1,849 (61.2%) | 1,172 (38.8%) |
Employment Characteristics in Yuma County
Employment by Class of Employer in Yuma County
Among the 77,216 employed individuals in Yuma County, private company employees (47,728 | 61.8%), federal government employees (8,786 | 11.4%), and local government employees (5,988 | 7.7%) make up the most common classes of employment.
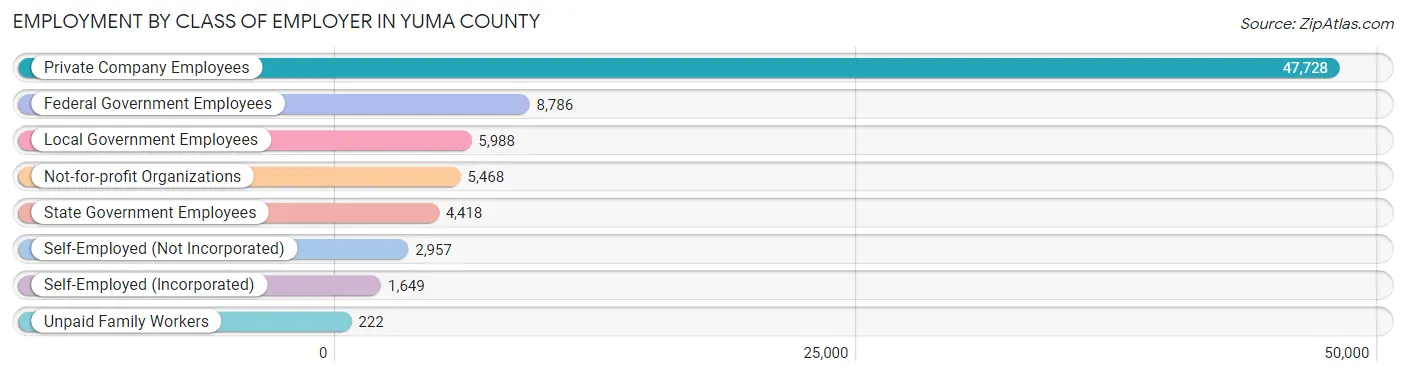
| Employer Class | # Employees | % Employees |
| Private Company Employees | 47,728 | 61.8% |
| Self-Employed (Incorporated) | 1,649 | 2.1% |
| Self-Employed (Not Incorporated) | 2,957 | 3.8% |
| Not-for-profit Organizations | 5,468 | 7.1% |
| Local Government Employees | 5,988 | 7.7% |
| State Government Employees | 4,418 | 5.7% |
| Federal Government Employees | 8,786 | 11.4% |
| Unpaid Family Workers | 222 | 0.3% |
| Total | 77,216 | 100.0% |
Employment Status by Age in Yuma County
According to the labor force statistics for Yuma County, out of the total population over 16 years of age (158,869), 53.9% or 85,630 individuals are in the labor force, with 8.3% or 7,107 of them unemployed. The age group with the highest labor force participation rate is 25 to 29 years, with 81.5% or 11,967 individuals in the labor force. Within the labor force, the 16 to 19 years age range has the highest percentage of unemployed individuals, with 27.3% or 958 of them being unemployed.
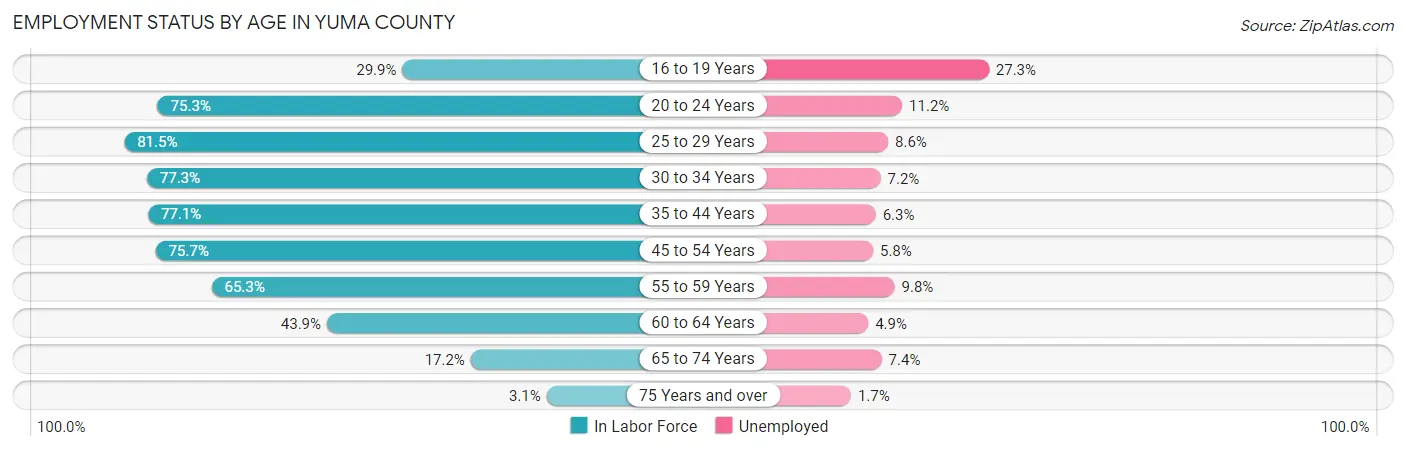
| Age Bracket | In Labor Force | Unemployed |
| 16 to 19 Years | 3,509 (29.9%) | 958 (27.3%) |
| 20 to 24 Years | 11,895 (75.3%) | 1,332 (11.2%) |
| 25 to 29 Years | 11,967 (81.5%) | 1,029 (8.6%) |
| 30 to 34 Years | 10,660 (77.3%) | 768 (7.2%) |
| 35 to 44 Years | 17,658 (77.1%) | 1,112 (6.3%) |
| 45 to 54 Years | 15,098 (75.7%) | 876 (5.8%) |
| 55 to 59 Years | 6,222 (65.3%) | 610 (9.8%) |
| 60 to 64 Years | 4,505 (43.9%) | 221 (4.9%) |
| 65 to 74 Years | 3,408 (17.2%) | 252 (7.4%) |
| 75 Years and over | 633 (3.1%) | 11 (1.7%) |
| Total | 85,630 (53.9%) | 7,107 (8.3%) |
Employment Status by Educational Attainment in Yuma County
According to labor force statistics for Yuma County, 72.6% of individuals (66,146) out of the total population between 25 and 64 years of age (91,110) are in the labor force, with 7.0% or 4,630 of them being unemployed. The group with the highest labor force participation rate are those with the educational attainment of bachelor's degree or higher, with 84.0% or 13,441 individuals in the labor force. Within the labor force, individuals with less than high school education have the highest percentage of unemployment, with 12.0% or 1,448 of them being unemployed.
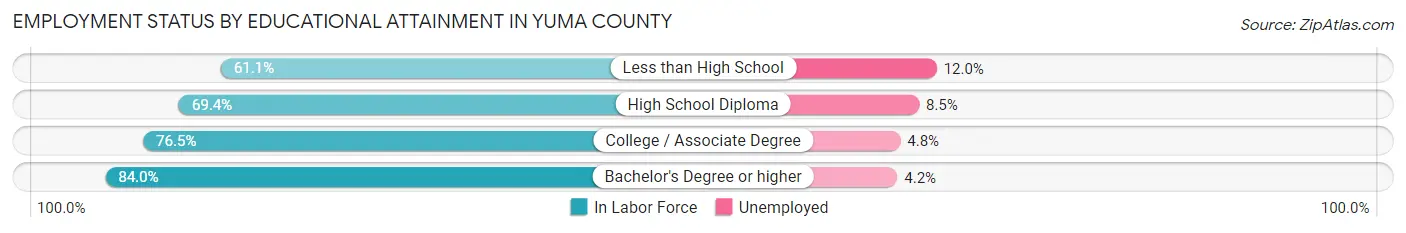
| Educational Attainment | In Labor Force | Unemployed |
| Less than High School | 12,069 (61.1%) | 2,370 (12.0%) |
| High School Diploma | 16,789 (69.4%) | 2,056 (8.5%) |
| College / Associate Degree | 23,841 (76.5%) | 1,496 (4.8%) |
| Bachelor's Degree or higher | 13,441 (84.0%) | 672 (4.2%) |
| Total | 66,146 (72.6%) | 6,378 (7.0%) |
Employment Occupations by Sex in Yuma County
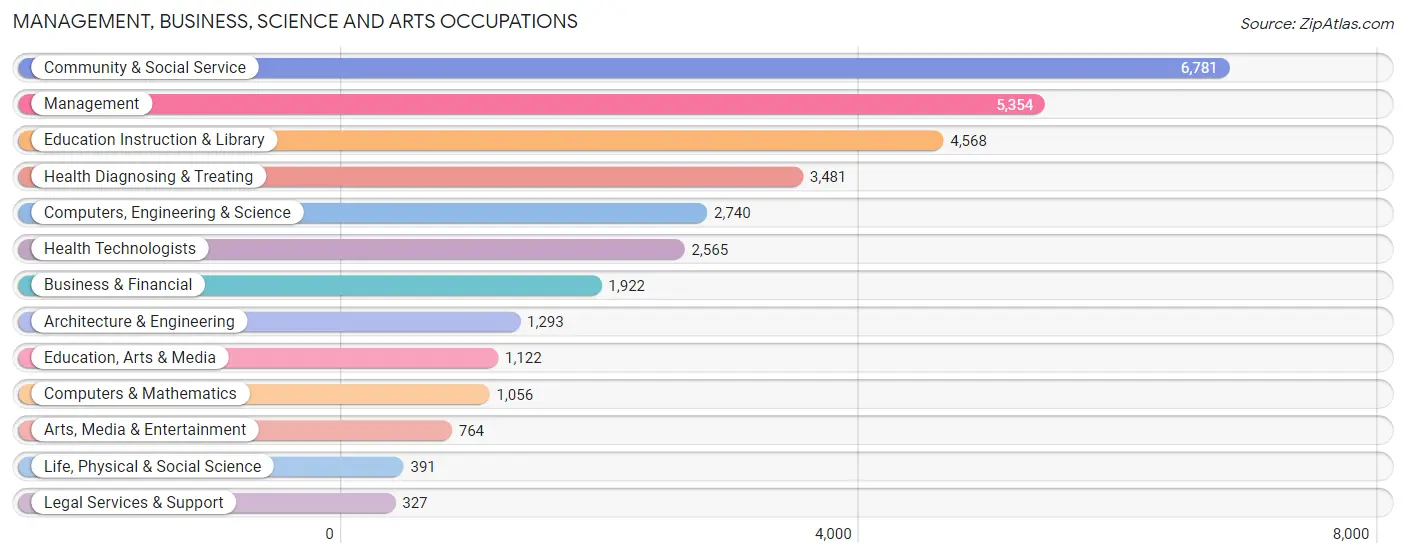
Management, Business, Science and Arts Occupations
The most common Management, Business, Science and Arts occupations in Yuma County are Community & Social Service (6,781 | 9.1%), Management (5,354 | 7.1%), Education Instruction & Library (4,568 | 6.1%), Health Diagnosing & Treating (3,481 | 4.6%), and Computers, Engineering & Science (2,740 | 3.7%).
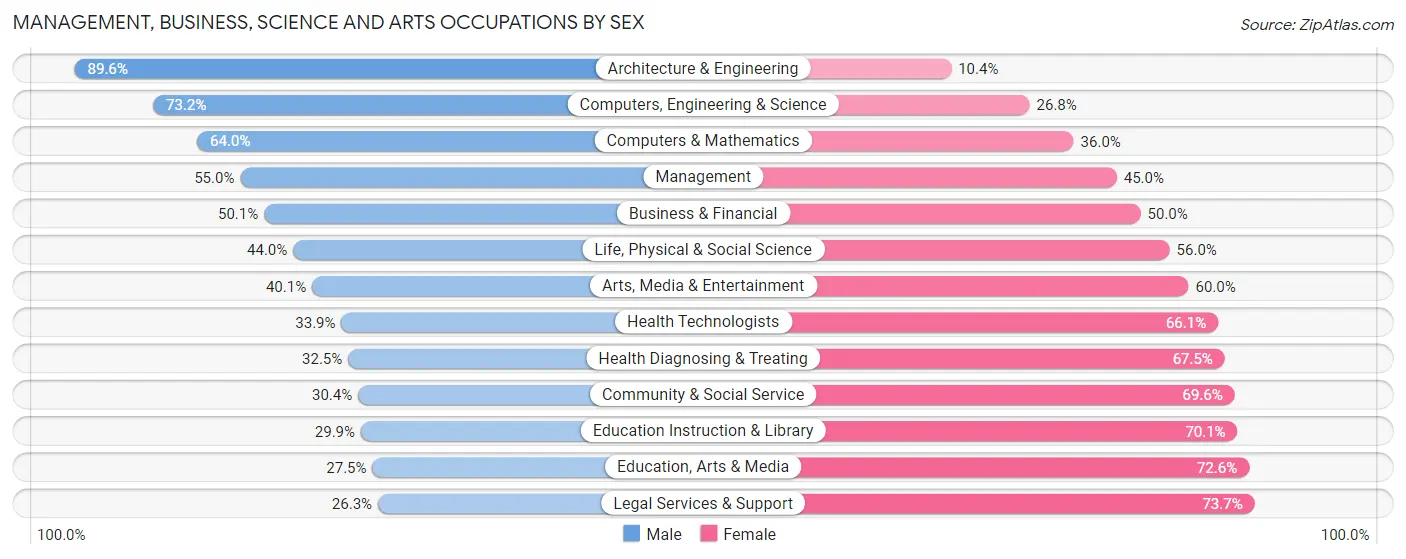
Management, Business, Science and Arts Occupations by Sex
Within the Management, Business, Science and Arts occupations in Yuma County, the most male-oriented occupations are Architecture & Engineering (89.6%), Computers, Engineering & Science (73.2%), and Computers & Mathematics (64.0%), while the most female-oriented occupations are Legal Services & Support (73.7%), Education, Arts & Media (72.6%), and Education Instruction & Library (70.1%).
| Occupation | Male | Female |
| Management | 2,946 (55.0%) | 2,408 (45.0%) |
| Business & Financial | 962 (50.0%) | 960 (49.9%) |
| Computers, Engineering & Science | 2,006 (73.2%) | 734 (26.8%) |
| Computers & Mathematics | 676 (64.0%) | 380 (36.0%) |
| Architecture & Engineering | 1,158 (89.6%) | 135 (10.4%) |
| Life, Physical & Social Science | 172 (44.0%) | 219 (56.0%) |
| Community & Social Service | 2,064 (30.4%) | 4,717 (69.6%) |
| Education, Arts & Media | 308 (27.5%) | 814 (72.6%) |
| Legal Services & Support | 86 (26.3%) | 241 (73.7%) |
| Education Instruction & Library | 1,364 (29.9%) | 3,204 (70.1%) |
| Arts, Media & Entertainment | 306 (40.1%) | 458 (60.0%) |
| Health Diagnosing & Treating | 1,132 (32.5%) | 2,349 (67.5%) |
| Health Technologists | 870 (33.9%) | 1,695 (66.1%) |
| Total (Category) | 9,110 (44.9%) | 11,168 (55.1%) |
| Total (Overall) | 41,624 (55.6%) | 33,244 (44.4%) |
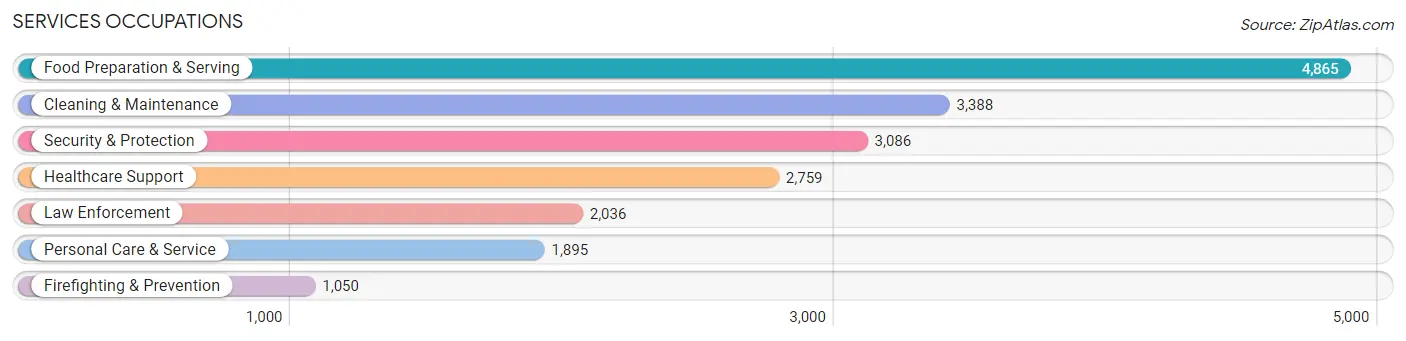
Services Occupations
The most common Services occupations in Yuma County are Food Preparation & Serving (4,865 | 6.5%), Cleaning & Maintenance (3,388 | 4.5%), Security & Protection (3,086 | 4.1%), Healthcare Support (2,759 | 3.7%), and Law Enforcement (2,036 | 2.7%).
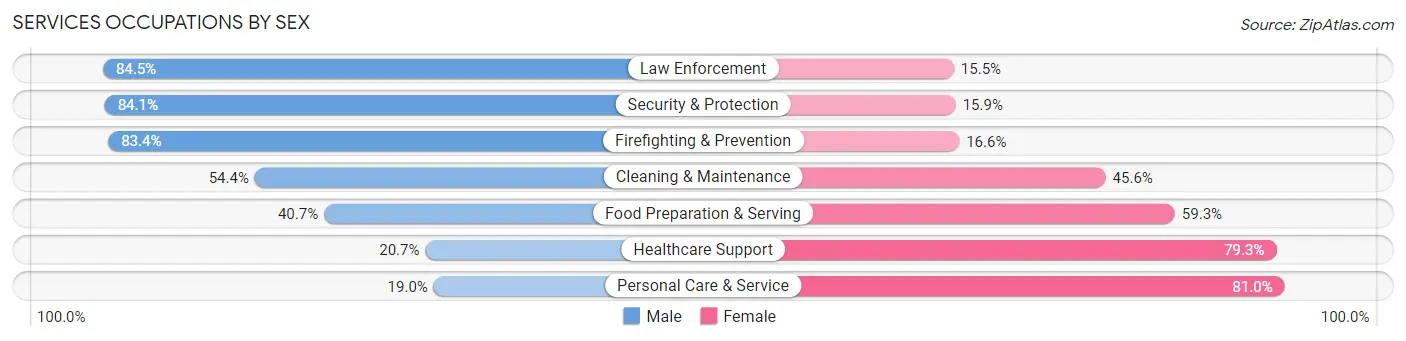
Services Occupations by Sex
Within the Services occupations in Yuma County, the most male-oriented occupations are Law Enforcement (84.5%), Security & Protection (84.1%), and Firefighting & Prevention (83.4%), while the most female-oriented occupations are Personal Care & Service (81.0%), Healthcare Support (79.3%), and Food Preparation & Serving (59.3%).
| Occupation | Male | Female |
| Healthcare Support | 570 (20.7%) | 2,189 (79.3%) |
| Security & Protection | 2,596 (84.1%) | 490 (15.9%) |
| Firefighting & Prevention | 876 (83.4%) | 174 (16.6%) |
| Law Enforcement | 1,720 (84.5%) | 316 (15.5%) |
| Food Preparation & Serving | 1,981 (40.7%) | 2,884 (59.3%) |
| Cleaning & Maintenance | 1,844 (54.4%) | 1,544 (45.6%) |
| Personal Care & Service | 360 (19.0%) | 1,535 (81.0%) |
| Total (Category) | 7,351 (46.0%) | 8,642 (54.0%) |
| Total (Overall) | 41,624 (55.6%) | 33,244 (44.4%) |
Sales and Office Occupations
The most common Sales and Office occupations in Yuma County are Office & Administration (8,916 | 11.9%), and Sales & Related (6,131 | 8.2%).

Sales and Office Occupations by Sex
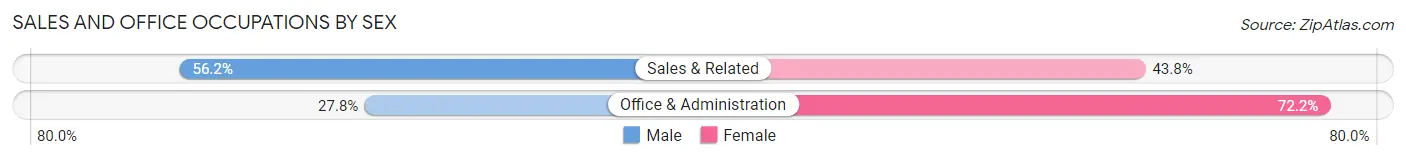
| Occupation | Male | Female |
| Sales & Related | 3,443 (56.2%) | 2,688 (43.8%) |
| Office & Administration | 2,475 (27.8%) | 6,441 (72.2%) |
| Total (Category) | 5,918 (39.3%) | 9,129 (60.7%) |
| Total (Overall) | 41,624 (55.6%) | 33,244 (44.4%) |
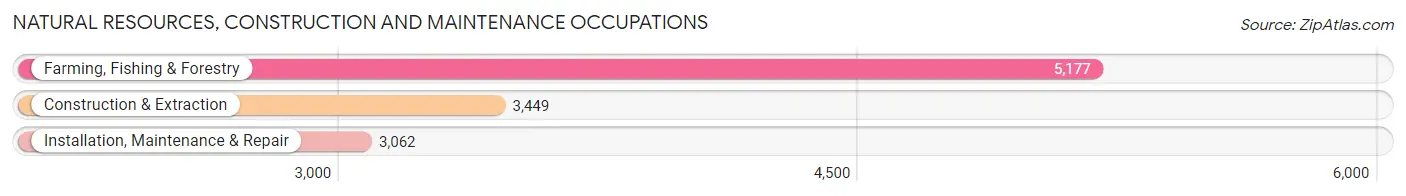
Natural Resources, Construction and Maintenance Occupations
The most common Natural Resources, Construction and Maintenance occupations in Yuma County are Farming, Fishing & Forestry (5,177 | 6.9%), Construction & Extraction (3,449 | 4.6%), and Installation, Maintenance & Repair (3,062 | 4.1%).
Natural Resources, Construction and Maintenance Occupations by Sex
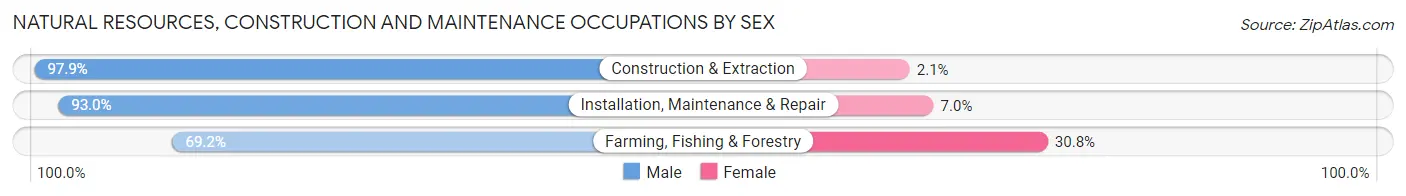
| Occupation | Male | Female |
| Farming, Fishing & Forestry | 3,583 (69.2%) | 1,594 (30.8%) |
| Construction & Extraction | 3,378 (97.9%) | 71 (2.1%) |
| Installation, Maintenance & Repair | 2,847 (93.0%) | 215 (7.0%) |
| Total (Category) | 9,808 (83.9%) | 1,880 (16.1%) |
| Total (Overall) | 41,624 (55.6%) | 33,244 (44.4%) |
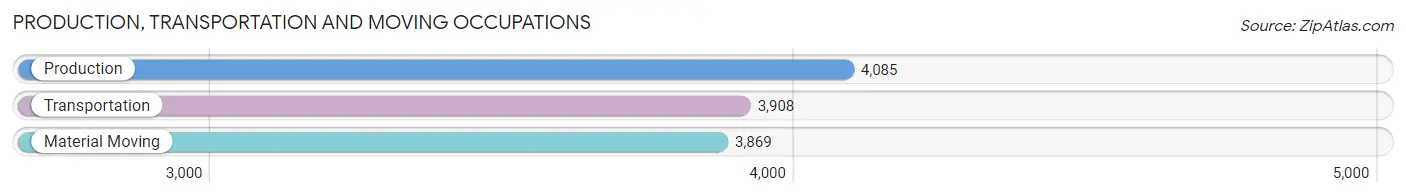
Production, Transportation and Moving Occupations
The most common Production, Transportation and Moving occupations in Yuma County are Production (4,085 | 5.5%), Transportation (3,908 | 5.2%), and Material Moving (3,869 | 5.2%).
Production, Transportation and Moving Occupations by Sex
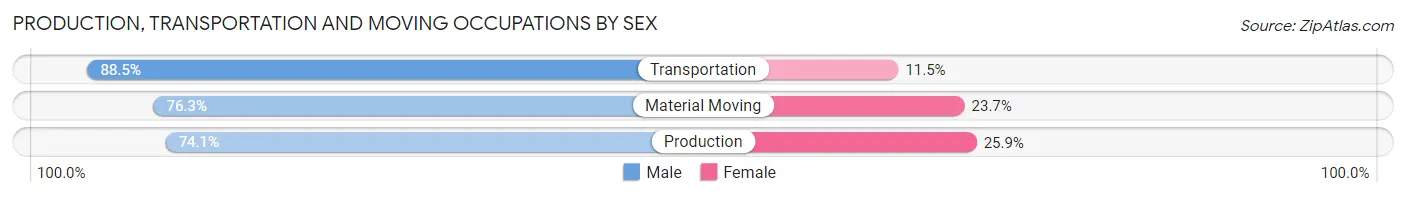
| Occupation | Male | Female |
| Production | 3,027 (74.1%) | 1,058 (25.9%) |
| Transportation | 3,457 (88.5%) | 451 (11.5%) |
| Material Moving | 2,953 (76.3%) | 916 (23.7%) |
| Total (Category) | 9,437 (79.6%) | 2,425 (20.4%) |
| Total (Overall) | 41,624 (55.6%) | 33,244 (44.4%) |
Employment Industries by Sex in Yuma County
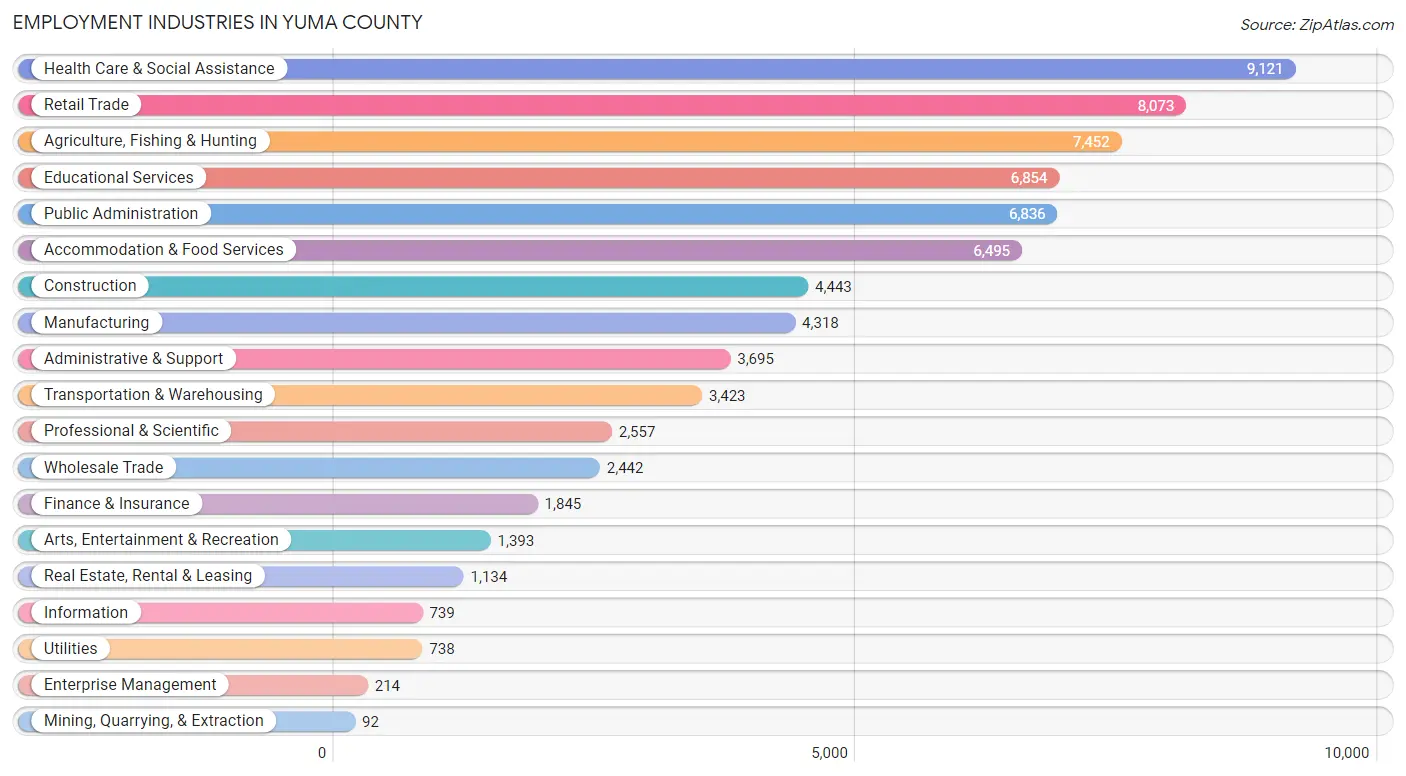
Employment Industries in Yuma County
The major employment industries in Yuma County include Health Care & Social Assistance (9,121 | 12.2%), Retail Trade (8,073 | 10.8%), Agriculture, Fishing & Hunting (7,452 | 10.0%), Educational Services (6,854 | 9.1%), and Public Administration (6,836 | 9.1%).
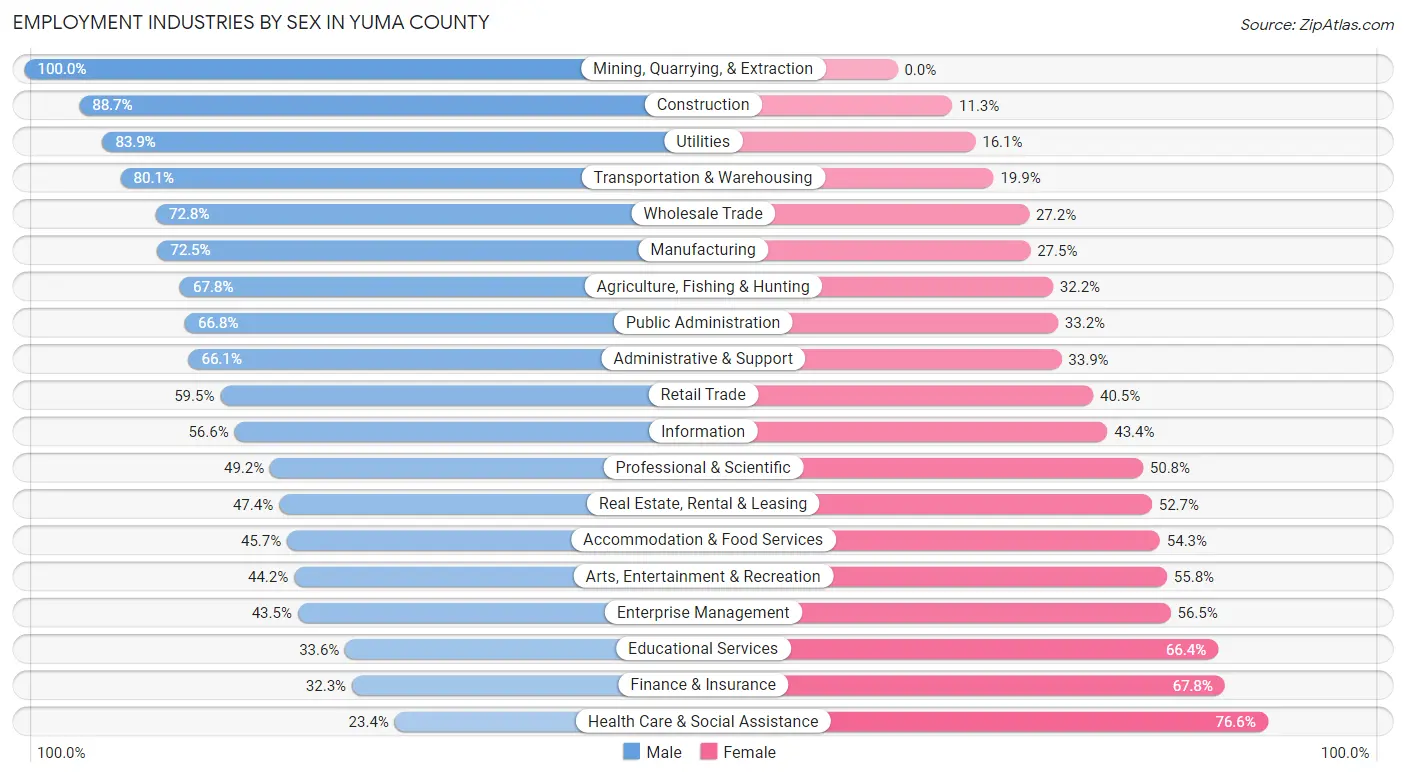
Employment Industries by Sex in Yuma County
The Yuma County industries that see more men than women are Mining, Quarrying, & Extraction (100.0%), Construction (88.7%), and Utilities (83.9%), whereas the industries that tend to have a higher number of women are Health Care & Social Assistance (76.6%), Finance & Insurance (67.7%), and Educational Services (66.4%).
| Industry | Male | Female |
| Agriculture, Fishing & Hunting | 5,054 (67.8%) | 2,398 (32.2%) |
| Mining, Quarrying, & Extraction | 92 (100.0%) | 0 (0.0%) |
| Construction | 3,940 (88.7%) | 503 (11.3%) |
| Manufacturing | 3,131 (72.5%) | 1,187 (27.5%) |
| Wholesale Trade | 1,777 (72.8%) | 665 (27.2%) |
| Retail Trade | 4,804 (59.5%) | 3,269 (40.5%) |
| Transportation & Warehousing | 2,742 (80.1%) | 681 (19.9%) |
| Utilities | 619 (83.9%) | 119 (16.1%) |
| Information | 418 (56.6%) | 321 (43.4%) |
| Finance & Insurance | 595 (32.3%) | 1,250 (67.7%) |
| Real Estate, Rental & Leasing | 537 (47.3%) | 597 (52.6%) |
| Professional & Scientific | 1,258 (49.2%) | 1,299 (50.8%) |
| Enterprise Management | 93 (43.5%) | 121 (56.5%) |
| Administrative & Support | 2,441 (66.1%) | 1,254 (33.9%) |
| Educational Services | 2,306 (33.6%) | 4,548 (66.4%) |
| Health Care & Social Assistance | 2,134 (23.4%) | 6,987 (76.6%) |
| Arts, Entertainment & Recreation | 616 (44.2%) | 777 (55.8%) |
| Accommodation & Food Services | 2,967 (45.7%) | 3,528 (54.3%) |
| Public Administration | 4,565 (66.8%) | 2,271 (33.2%) |
| Total | 41,624 (55.6%) | 33,244 (44.4%) |
Education in Yuma County
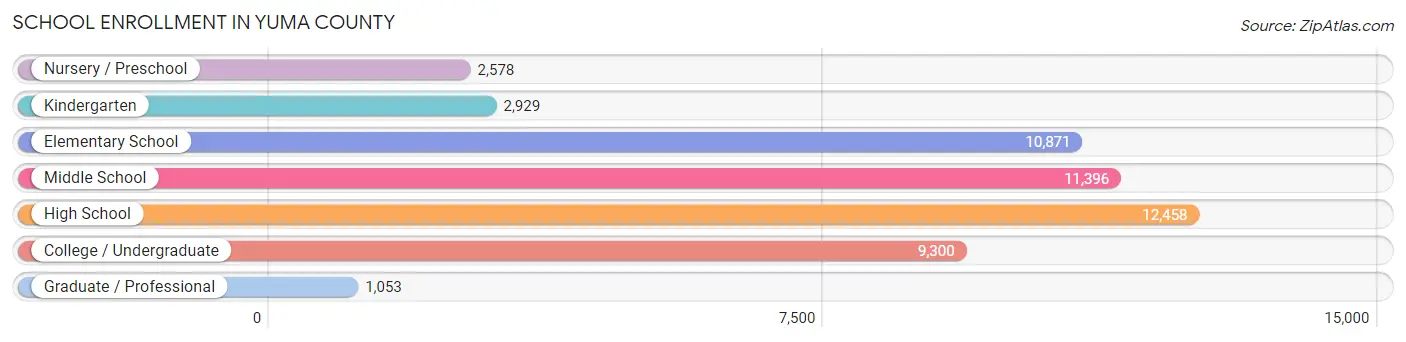
School Enrollment in Yuma County
The most common levels of schooling among the 50,585 students in Yuma County are high school (12,458 | 24.6%), middle school (11,396 | 22.5%), and elementary school (10,871 | 21.5%).
| School Level | # Students | % Students |
| Nursery / Preschool | 2,578 | 5.1% |
| Kindergarten | 2,929 | 5.8% |
| Elementary School | 10,871 | 21.5% |
| Middle School | 11,396 | 22.5% |
| High School | 12,458 | 24.6% |
| College / Undergraduate | 9,300 | 18.4% |
| Graduate / Professional | 1,053 | 2.1% |
| Total | 50,585 | 100.0% |
School Enrollment by Age by Funding Source in Yuma County
Out of a total of 50,585 students who are enrolled in schools in Yuma County, 3,339 (6.6%) attend a private institution, while the remaining 47,246 (93.4%) are enrolled in public schools. The age group of 35 years and over has the highest likelihood of being enrolled in private schools, with 557 (25.5% in the age bracket) enrolled. Conversely, the age group of 18 to 19 year olds has the lowest likelihood of being enrolled in a private school, with 3,755 (98.6% in the age bracket) attending a public institution.
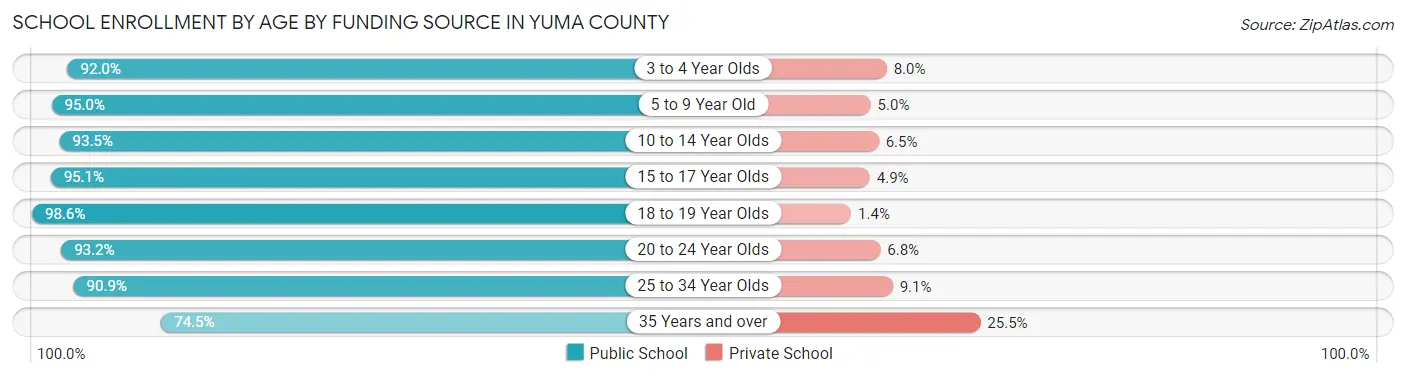
| Age Bracket | Public School | Private School |
| 3 to 4 Year Olds | 2,213 (92.0%) | 193 (8.0%) |
| 5 to 9 Year Old | 12,032 (95.0%) | 637 (5.0%) |
| 10 to 14 Year Olds | 13,551 (93.5%) | 947 (6.5%) |
| 15 to 17 Year Olds | 7,832 (95.1%) | 401 (4.9%) |
| 18 to 19 Year Olds | 3,755 (98.6%) | 53 (1.4%) |
| 20 to 24 Year Olds | 3,549 (93.2%) | 260 (6.8%) |
| 25 to 34 Year Olds | 2,703 (90.9%) | 272 (9.1%) |
| 35 Years and over | 1,630 (74.5%) | 557 (25.5%) |
| Total | 47,246 (93.4%) | 3,339 (6.6%) |
Educational Attainment by Field of Study in Yuma County
Education (4,586 | 19.8%), business (4,234 | 18.3%), science & technology (2,339 | 10.1%), arts & humanities (2,258 | 9.7%), and bio, nature & agricultural (1,535 | 6.6%) are the most common fields of study among 23,184 individuals in Yuma County who have obtained a bachelor's degree or higher.
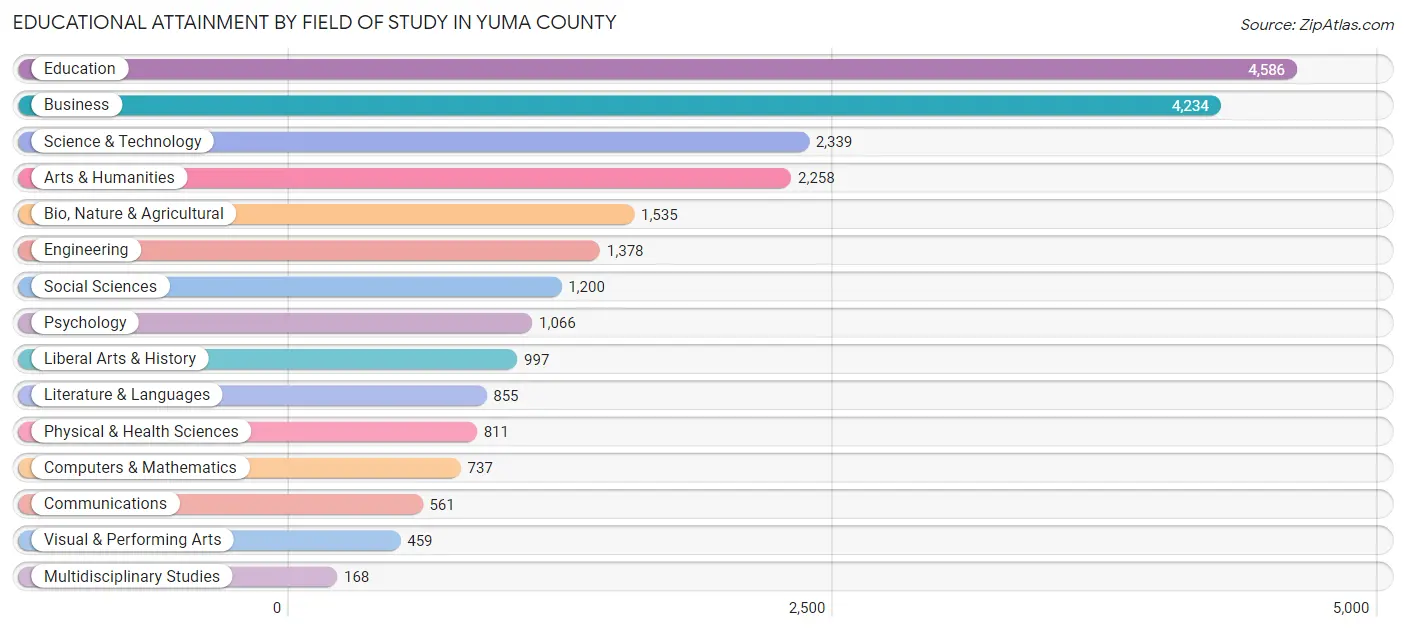
| Field of Study | # Graduates | % Graduates |
| Computers & Mathematics | 737 | 3.2% |
| Bio, Nature & Agricultural | 1,535 | 6.6% |
| Physical & Health Sciences | 811 | 3.5% |
| Psychology | 1,066 | 4.6% |
| Social Sciences | 1,200 | 5.2% |
| Engineering | 1,378 | 5.9% |
| Multidisciplinary Studies | 168 | 0.7% |
| Science & Technology | 2,339 | 10.1% |
| Business | 4,234 | 18.3% |
| Education | 4,586 | 19.8% |
| Literature & Languages | 855 | 3.7% |
| Liberal Arts & History | 997 | 4.3% |
| Visual & Performing Arts | 459 | 2.0% |
| Communications | 561 | 2.4% |
| Arts & Humanities | 2,258 | 9.7% |
| Total | 23,184 | 100.0% |
Transportation & Commute in Yuma County
Vehicle Availability by Sex in Yuma County
The most prevalent vehicle ownership categories in Yuma County are males with 2 vehicles (17,433, accounting for 40.4%) and females with 2 vehicles (12,348, making up 53.8%).
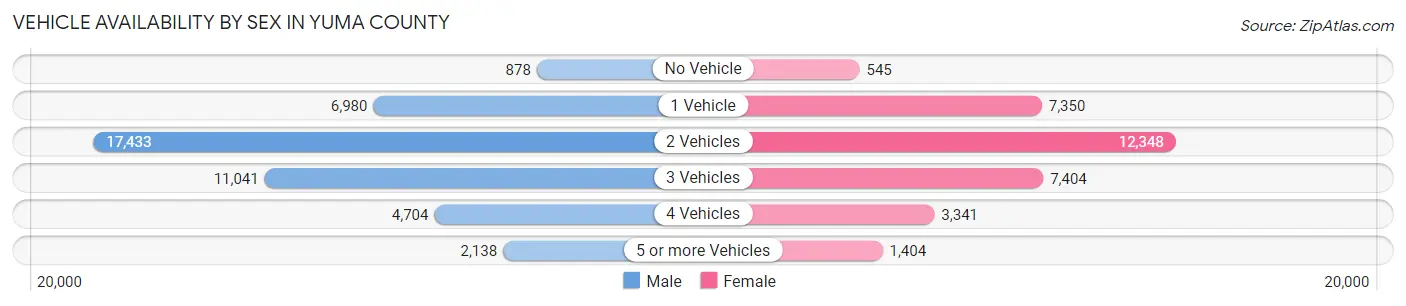
| Vehicles Available | Male | Female |
| No Vehicle | 878 (2.0%) | 545 (1.7%) |
| 1 Vehicle | 6,980 (16.2%) | 7,350 (22.7%) |
| 2 Vehicles | 17,433 (40.4%) | 12,348 (38.1%) |
| 3 Vehicles | 11,041 (25.6%) | 7,404 (22.9%) |
| 4 Vehicles | 4,704 (10.9%) | 3,341 (10.3%) |
| 5 or more Vehicles | 2,138 (5.0%) | 1,404 (4.3%) |
| Total | 43,174 (100.0%) | 32,392 (100.0%) |
Commute Time in Yuma County
The most frequently occuring commute durations in Yuma County are 15 to 19 minutes (13,913 commuters, 19.1%), 10 to 14 minutes (11,831 commuters, 16.3%), and 20 to 24 minutes (11,133 commuters, 15.3%).
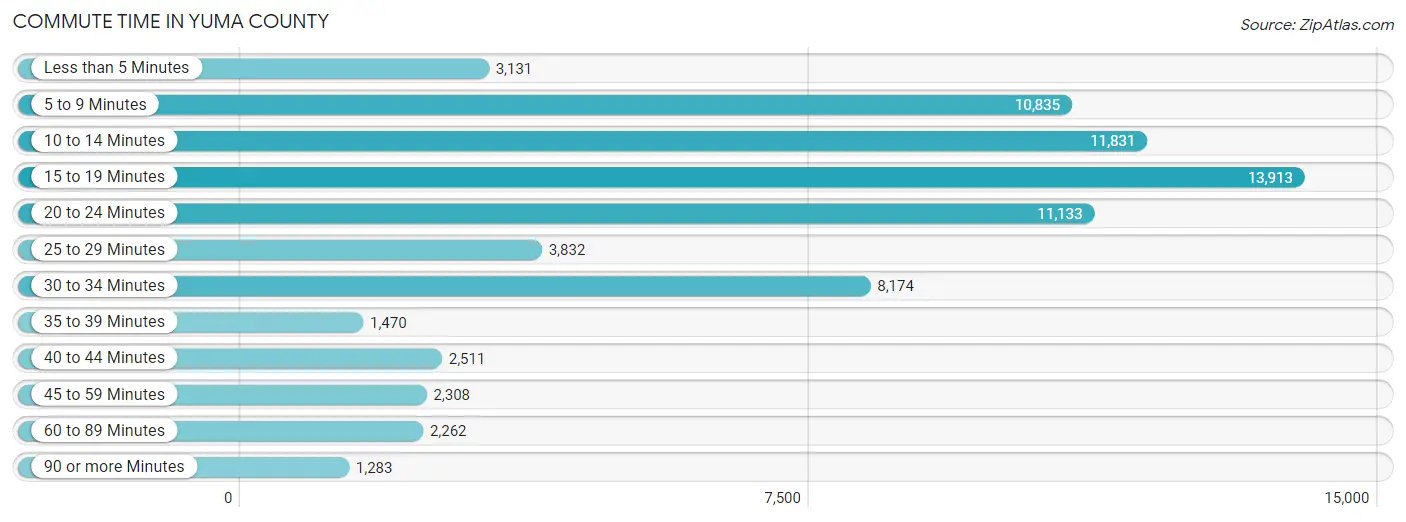
| Commute Time | # Commuters | % Commuters |
| Less than 5 Minutes | 3,131 | 4.3% |
| 5 to 9 Minutes | 10,835 | 14.9% |
| 10 to 14 Minutes | 11,831 | 16.3% |
| 15 to 19 Minutes | 13,913 | 19.1% |
| 20 to 24 Minutes | 11,133 | 15.3% |
| 25 to 29 Minutes | 3,832 | 5.3% |
| 30 to 34 Minutes | 8,174 | 11.3% |
| 35 to 39 Minutes | 1,470 | 2.0% |
| 40 to 44 Minutes | 2,511 | 3.5% |
| 45 to 59 Minutes | 2,308 | 3.2% |
| 60 to 89 Minutes | 2,262 | 3.1% |
| 90 or more Minutes | 1,283 | 1.8% |
Commute Time by Sex in Yuma County
The most common commute times in Yuma County are 15 to 19 minutes (8,128 commuters, 19.0%) for males and 15 to 19 minutes (5,785 commuters, 19.4%) for females.
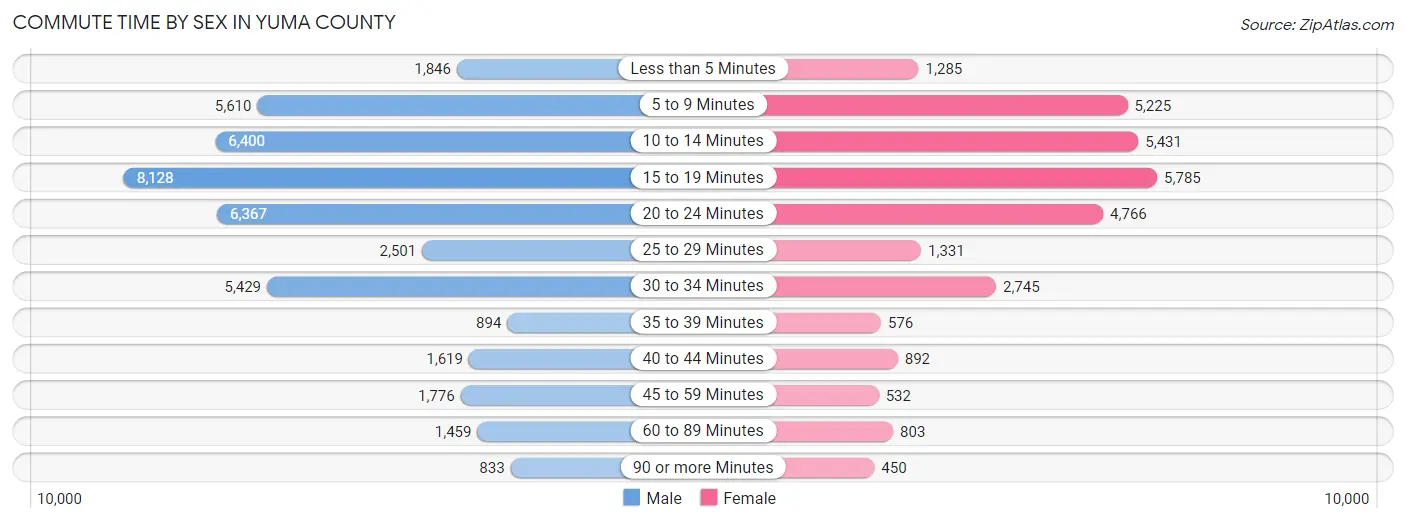
| Commute Time | Male | Female |
| Less than 5 Minutes | 1,846 (4.3%) | 1,285 (4.3%) |
| 5 to 9 Minutes | 5,610 (13.1%) | 5,225 (17.5%) |
| 10 to 14 Minutes | 6,400 (14.9%) | 5,431 (18.2%) |
| 15 to 19 Minutes | 8,128 (19.0%) | 5,785 (19.4%) |
| 20 to 24 Minutes | 6,367 (14.8%) | 4,766 (16.0%) |
| 25 to 29 Minutes | 2,501 (5.8%) | 1,331 (4.5%) |
| 30 to 34 Minutes | 5,429 (12.7%) | 2,745 (9.2%) |
| 35 to 39 Minutes | 894 (2.1%) | 576 (1.9%) |
| 40 to 44 Minutes | 1,619 (3.8%) | 892 (3.0%) |
| 45 to 59 Minutes | 1,776 (4.1%) | 532 (1.8%) |
| 60 to 89 Minutes | 1,459 (3.4%) | 803 (2.7%) |
| 90 or more Minutes | 833 (1.9%) | 450 (1.5%) |
Time of Departure to Work by Sex in Yuma County
The most frequent times of departure to work in Yuma County are 12:00 AM to 4:59 AM (5,750, 13.4%) for males and 7:30 AM to 7:59 AM (4,782, 16.0%) for females.
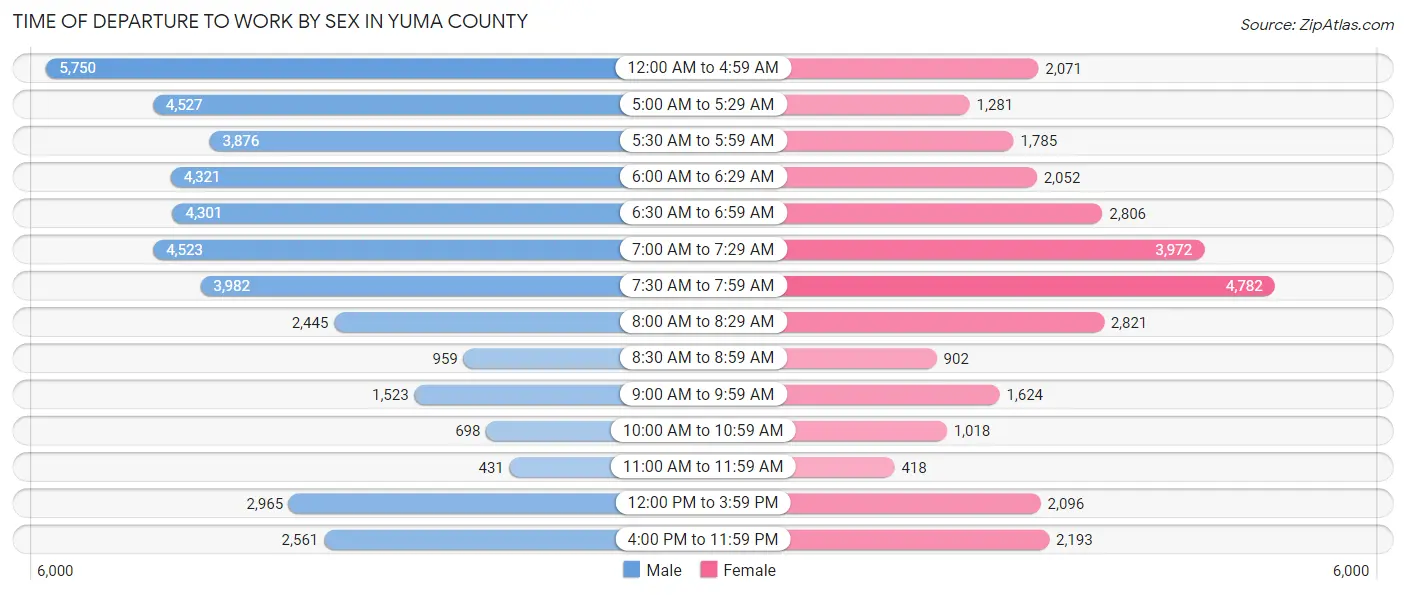
| Time of Departure | Male | Female |
| 12:00 AM to 4:59 AM | 5,750 (13.4%) | 2,071 (6.9%) |
| 5:00 AM to 5:29 AM | 4,527 (10.6%) | 1,281 (4.3%) |
| 5:30 AM to 5:59 AM | 3,876 (9.0%) | 1,785 (6.0%) |
| 6:00 AM to 6:29 AM | 4,321 (10.1%) | 2,052 (6.9%) |
| 6:30 AM to 6:59 AM | 4,301 (10.0%) | 2,806 (9.4%) |
| 7:00 AM to 7:29 AM | 4,523 (10.5%) | 3,972 (13.3%) |
| 7:30 AM to 7:59 AM | 3,982 (9.3%) | 4,782 (16.0%) |
| 8:00 AM to 8:29 AM | 2,445 (5.7%) | 2,821 (9.5%) |
| 8:30 AM to 8:59 AM | 959 (2.2%) | 902 (3.0%) |
| 9:00 AM to 9:59 AM | 1,523 (3.5%) | 1,624 (5.4%) |
| 10:00 AM to 10:59 AM | 698 (1.6%) | 1,018 (3.4%) |
| 11:00 AM to 11:59 AM | 431 (1.0%) | 418 (1.4%) |
| 12:00 PM to 3:59 PM | 2,965 (6.9%) | 2,096 (7.0%) |
| 4:00 PM to 11:59 PM | 2,561 (6.0%) | 2,193 (7.3%) |
| Total | 42,862 (100.0%) | 29,821 (100.0%) |
Housing Occupancy in Yuma County
Occupancy by Ownership in Yuma County
Of the total 74,678 dwellings in Yuma County, owner-occupied units account for 51,575 (69.1%), while renter-occupied units make up 23,103 (30.9%).
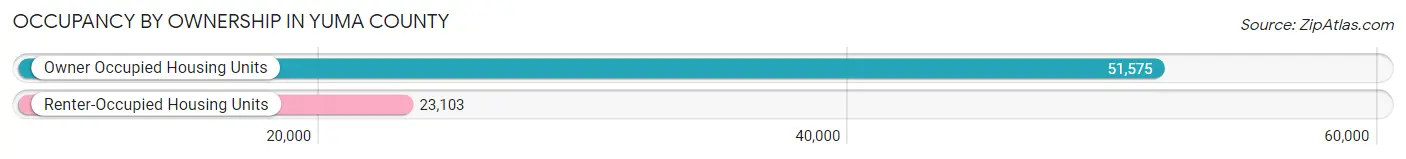
| Occupancy | # Housing Units | % Housing Units |
| Owner Occupied Housing Units | 51,575 | 69.1% |
| Renter-Occupied Housing Units | 23,103 | 30.9% |
| Total Occupied Housing Units | 74,678 | 100.0% |
Occupancy by Household Size in Yuma County
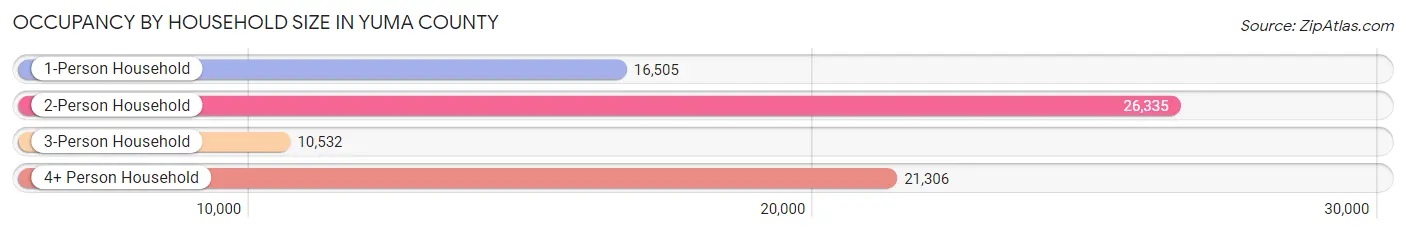
| Household Size | # Housing Units | % Housing Units |
| 1-Person Household | 16,505 | 22.1% |
| 2-Person Household | 26,335 | 35.3% |
| 3-Person Household | 10,532 | 14.1% |
| 4+ Person Household | 21,306 | 28.5% |
| Total Housing Units | 74,678 | 100.0% |
Occupancy by Ownership by Household Size in Yuma County
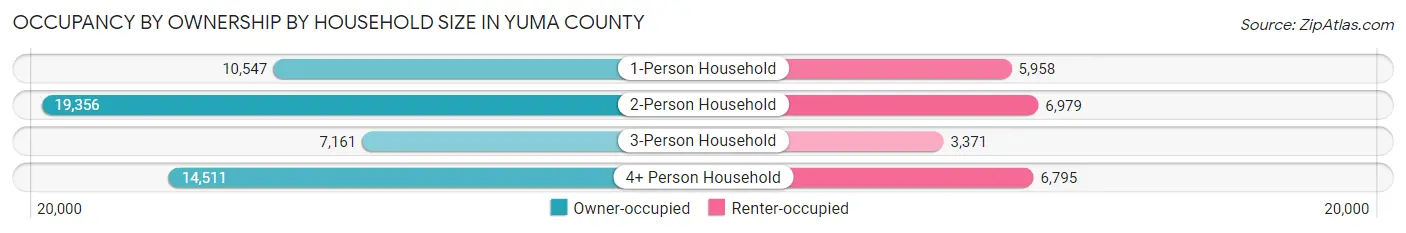
| Household Size | Owner-occupied | Renter-occupied |
| 1-Person Household | 10,547 (63.9%) | 5,958 (36.1%) |
| 2-Person Household | 19,356 (73.5%) | 6,979 (26.5%) |
| 3-Person Household | 7,161 (68.0%) | 3,371 (32.0%) |
| 4+ Person Household | 14,511 (68.1%) | 6,795 (31.9%) |
| Total Housing Units | 51,575 (69.1%) | 23,103 (30.9%) |
Occupancy by Educational Attainment in Yuma County
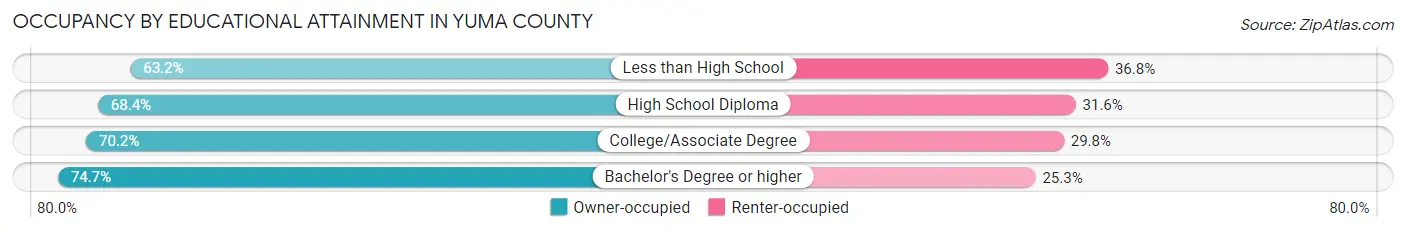
| Household Size | Owner-occupied | Renter-occupied |
| Less than High School | 10,388 (63.2%) | 6,042 (36.8%) |
| High School Diploma | 11,877 (68.4%) | 5,495 (31.6%) |
| College/Associate Degree | 19,333 (70.2%) | 8,193 (29.8%) |
| Bachelor's Degree or higher | 9,977 (74.7%) | 3,373 (25.3%) |
Occupancy by Age of Householder in Yuma County
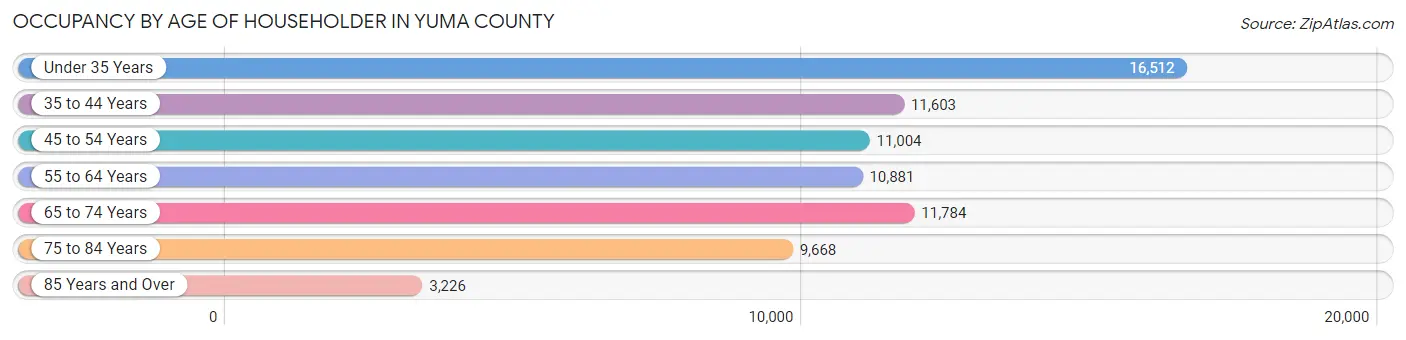
| Age Bracket | # Households | % Households |
| Under 35 Years | 16,512 | 22.1% |
| 35 to 44 Years | 11,603 | 15.5% |
| 45 to 54 Years | 11,004 | 14.7% |
| 55 to 64 Years | 10,881 | 14.6% |
| 65 to 74 Years | 11,784 | 15.8% |
| 75 to 84 Years | 9,668 | 13.0% |
| 85 Years and Over | 3,226 | 4.3% |
| Total | 74,678 | 100.0% |
Housing Finances in Yuma County
Median Income by Occupancy in Yuma County
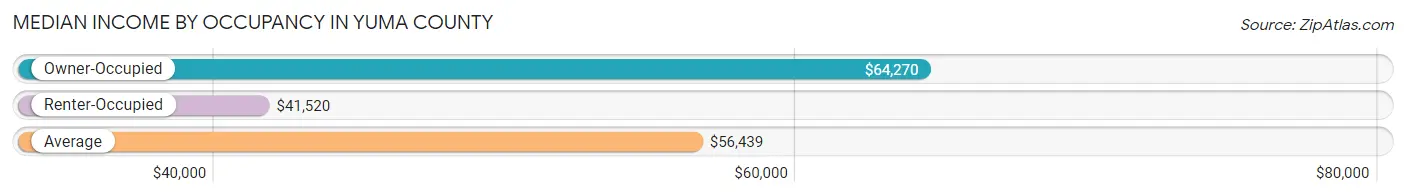
| Occupancy Type | # Households | Median Income |
| Owner-Occupied | 51,575 (69.1%) | $64,270 |
| Renter-Occupied | 23,103 (30.9%) | $41,520 |
| Average | 74,678 (100.0%) | $56,439 |
Occupancy by Householder Income Bracket in Yuma County
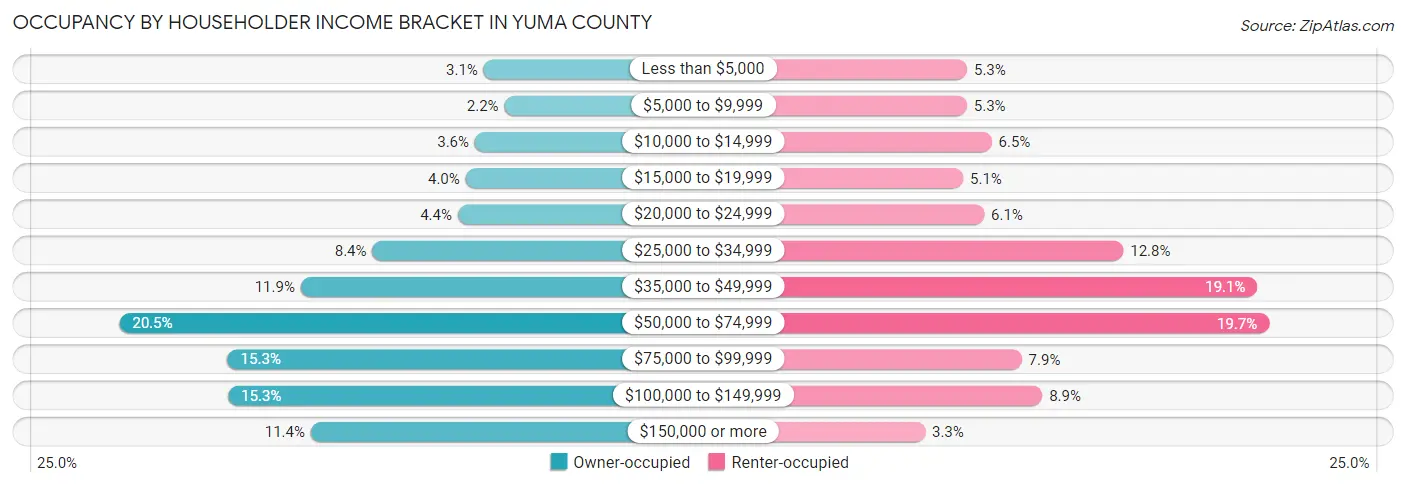
| Income Bracket | Owner-occupied | Renter-occupied |
| Less than $5,000 | 1,617 (3.1%) | 1,227 (5.3%) |
| $5,000 to $9,999 | 1,109 (2.1%) | 1,224 (5.3%) |
| $10,000 to $14,999 | 1,836 (3.6%) | 1,498 (6.5%) |
| $15,000 to $19,999 | 2,062 (4.0%) | 1,182 (5.1%) |
| $20,000 to $24,999 | 2,256 (4.4%) | 1,414 (6.1%) |
| $25,000 to $34,999 | 4,351 (8.4%) | 2,946 (12.8%) |
| $35,000 to $49,999 | 6,112 (11.8%) | 4,419 (19.1%) |
| $50,000 to $74,999 | 10,567 (20.5%) | 4,548 (19.7%) |
| $75,000 to $99,999 | 7,904 (15.3%) | 1,827 (7.9%) |
| $100,000 to $149,999 | 7,897 (15.3%) | 2,054 (8.9%) |
| $150,000 or more | 5,864 (11.4%) | 764 (3.3%) |
| Total | 51,575 (100.0%) | 23,103 (100.0%) |
Monthly Housing Cost Tiers in Yuma County
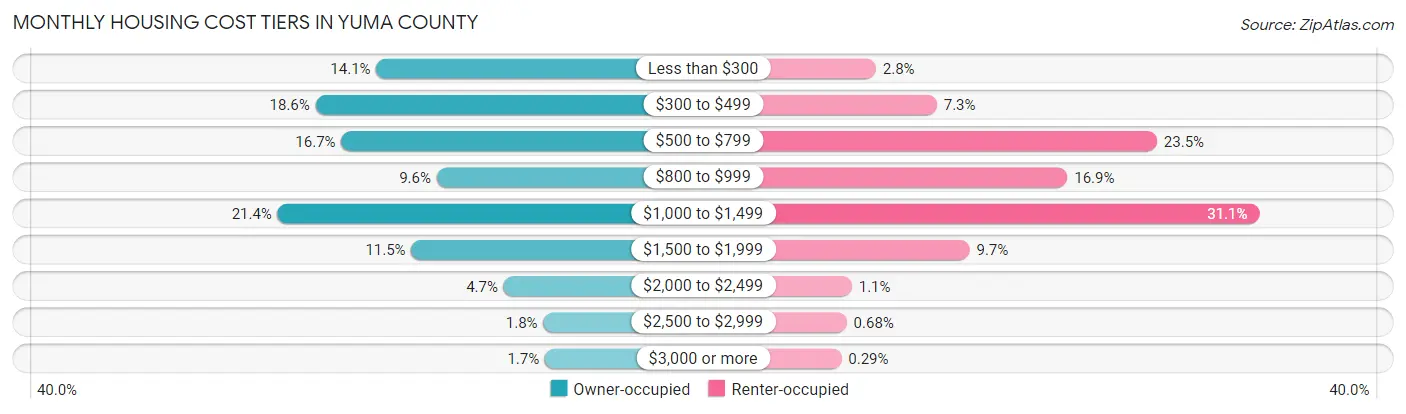
| Monthly Cost | Owner-occupied | Renter-occupied |
| Less than $300 | 7,267 (14.1%) | 654 (2.8%) |
| $300 to $499 | 9,578 (18.6%) | 1,690 (7.3%) |
| $500 to $799 | 8,598 (16.7%) | 5,436 (23.5%) |
| $800 to $999 | 4,971 (9.6%) | 3,911 (16.9%) |
| $1,000 to $1,499 | 11,016 (21.4%) | 7,177 (31.1%) |
| $1,500 to $1,999 | 5,935 (11.5%) | 2,248 (9.7%) |
| $2,000 to $2,499 | 2,430 (4.7%) | 244 (1.1%) |
| $2,500 to $2,999 | 921 (1.8%) | 157 (0.7%) |
| $3,000 or more | 859 (1.7%) | 66 (0.3%) |
| Total | 51,575 (100.0%) | 23,103 (100.0%) |
Physical Housing Characteristics in Yuma County
Housing Structures in Yuma County
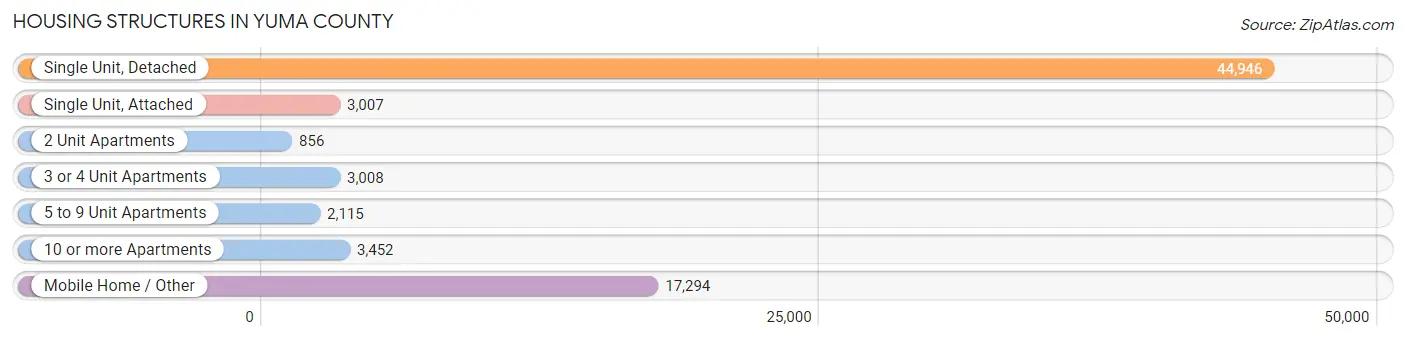
| Structure Type | # Housing Units | % Housing Units |
| Single Unit, Detached | 44,946 | 60.2% |
| Single Unit, Attached | 3,007 | 4.0% |
| 2 Unit Apartments | 856 | 1.1% |
| 3 or 4 Unit Apartments | 3,008 | 4.0% |
| 5 to 9 Unit Apartments | 2,115 | 2.8% |
| 10 or more Apartments | 3,452 | 4.6% |
| Mobile Home / Other | 17,294 | 23.2% |
| Total | 74,678 | 100.0% |
Housing Structures by Occupancy in Yuma County
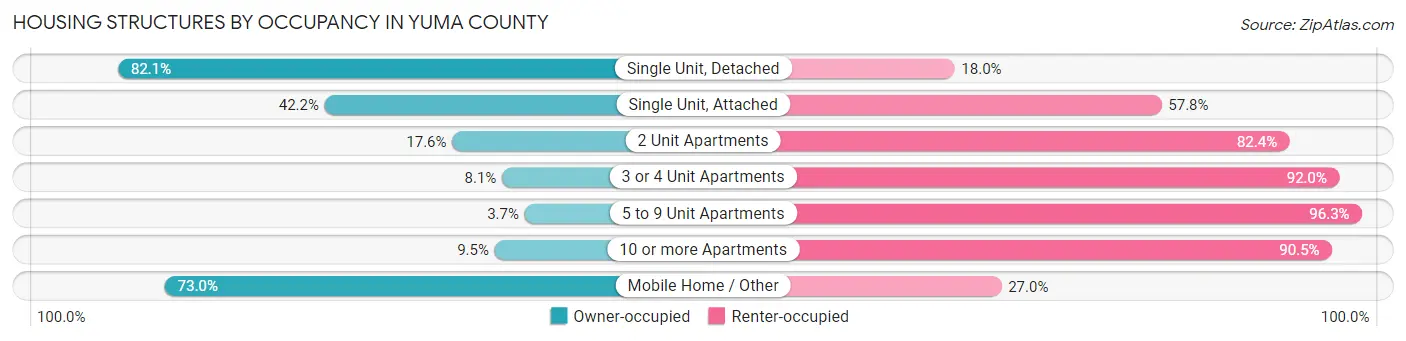
| Structure Type | Owner-occupied | Renter-occupied |
| Single Unit, Detached | 36,879 (82.1%) | 8,067 (17.9%) |
| Single Unit, Attached | 1,269 (42.2%) | 1,738 (57.8%) |
| 2 Unit Apartments | 151 (17.6%) | 705 (82.4%) |
| 3 or 4 Unit Apartments | 242 (8.1%) | 2,766 (91.9%) |
| 5 to 9 Unit Apartments | 78 (3.7%) | 2,037 (96.3%) |
| 10 or more Apartments | 327 (9.5%) | 3,125 (90.5%) |
| Mobile Home / Other | 12,629 (73.0%) | 4,665 (27.0%) |
| Total | 51,575 (69.1%) | 23,103 (30.9%) |
Housing Structures by Number of Rooms in Yuma County
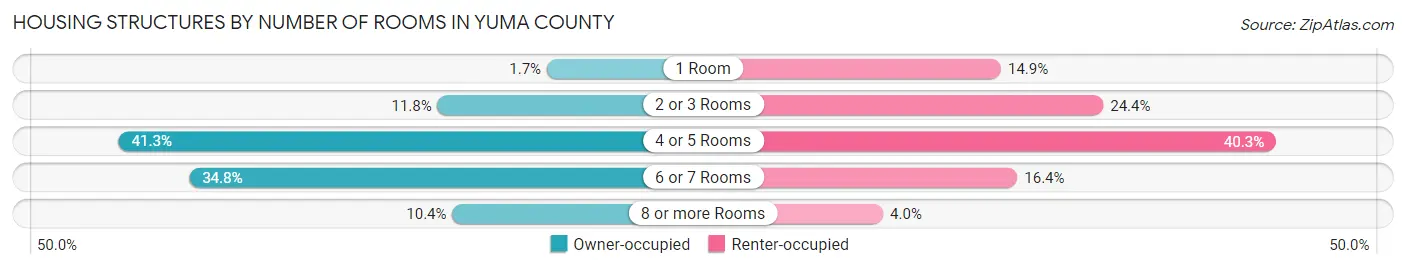
| Number of Rooms | Owner-occupied | Renter-occupied |
| 1 Room | 871 (1.7%) | 3,443 (14.9%) |
| 2 or 3 Rooms | 6,091 (11.8%) | 5,627 (24.4%) |
| 4 or 5 Rooms | 21,299 (41.3%) | 9,318 (40.3%) |
| 6 or 7 Rooms | 17,932 (34.8%) | 3,791 (16.4%) |
| 8 or more Rooms | 5,382 (10.4%) | 924 (4.0%) |
| Total | 51,575 (100.0%) | 23,103 (100.0%) |
Housing Structure by Heating Type in Yuma County
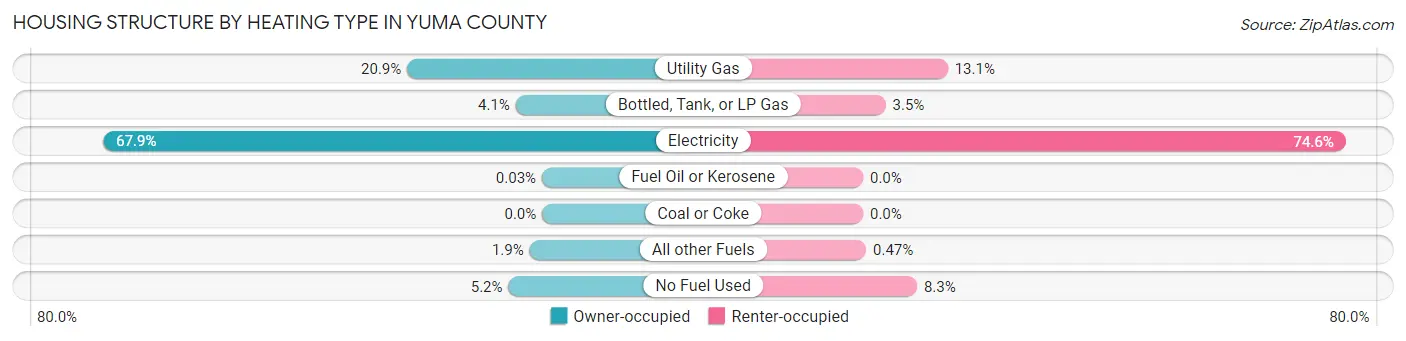
| Heating Type | Owner-occupied | Renter-occupied |
| Utility Gas | 10,762 (20.9%) | 3,025 (13.1%) |
| Bottled, Tank, or LP Gas | 2,105 (4.1%) | 807 (3.5%) |
| Electricity | 35,002 (67.9%) | 17,235 (74.6%) |
| Fuel Oil or Kerosene | 15 (0.0%) | 0 (0.0%) |
| Coal or Coke | 0 (0.0%) | 0 (0.0%) |
| All other Fuels | 1,000 (1.9%) | 109 (0.5%) |
| No Fuel Used | 2,691 (5.2%) | 1,927 (8.3%) |
| Total | 51,575 (100.0%) | 23,103 (100.0%) |
Household Vehicle Usage in Yuma County
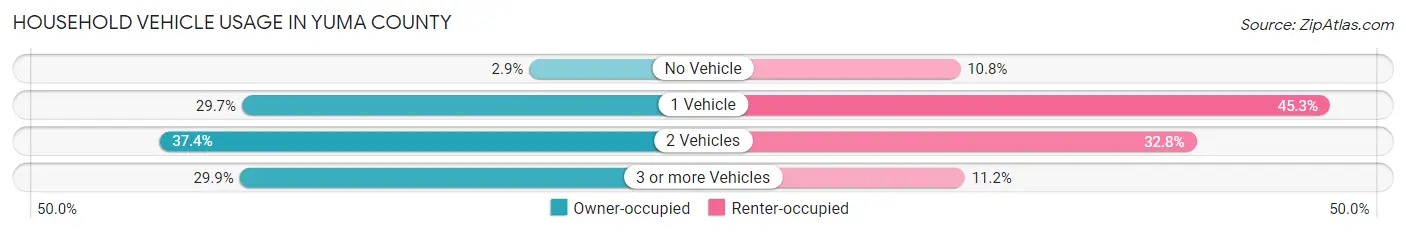
| Vehicles per Household | Owner-occupied | Renter-occupied |
| No Vehicle | 1,497 (2.9%) | 2,486 (10.8%) |
| 1 Vehicle | 15,330 (29.7%) | 10,457 (45.3%) |
| 2 Vehicles | 19,306 (37.4%) | 7,576 (32.8%) |
| 3 or more Vehicles | 15,442 (29.9%) | 2,584 (11.2%) |
| Total | 51,575 (100.0%) | 23,103 (100.0%) |
Real Estate & Mortgages in Yuma County
Real Estate and Mortgage Overview in Yuma County
| Characteristic | Without Mortgage | With Mortgage |
| Housing Units | 23,205 | 28,370 |
| Median Property Value | $128,300 | $203,200 |
| Median Household Income | $51,360 | $4,299 |
| Monthly Housing Costs | $390 | $820 |
| Real Estate Taxes | $981 | $942 |
Property Value by Mortgage Status in Yuma County
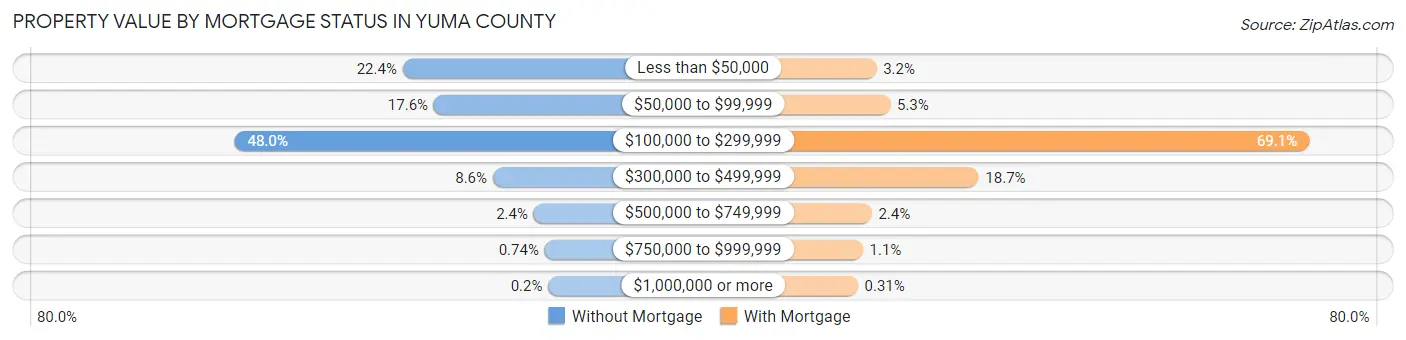
| Property Value | Without Mortgage | With Mortgage |
| Less than $50,000 | 5,194 (22.4%) | 893 (3.2%) |
| $50,000 to $99,999 | 4,090 (17.6%) | 1,489 (5.2%) |
| $100,000 to $299,999 | 11,139 (48.0%) | 19,600 (69.1%) |
| $300,000 to $499,999 | 2,004 (8.6%) | 5,311 (18.7%) |
| $500,000 to $749,999 | 560 (2.4%) | 687 (2.4%) |
| $750,000 to $999,999 | 172 (0.7%) | 303 (1.1%) |
| $1,000,000 or more | 46 (0.2%) | 87 (0.3%) |
| Total | 23,205 (100.0%) | 28,370 (100.0%) |
Household Income by Mortgage Status in Yuma County
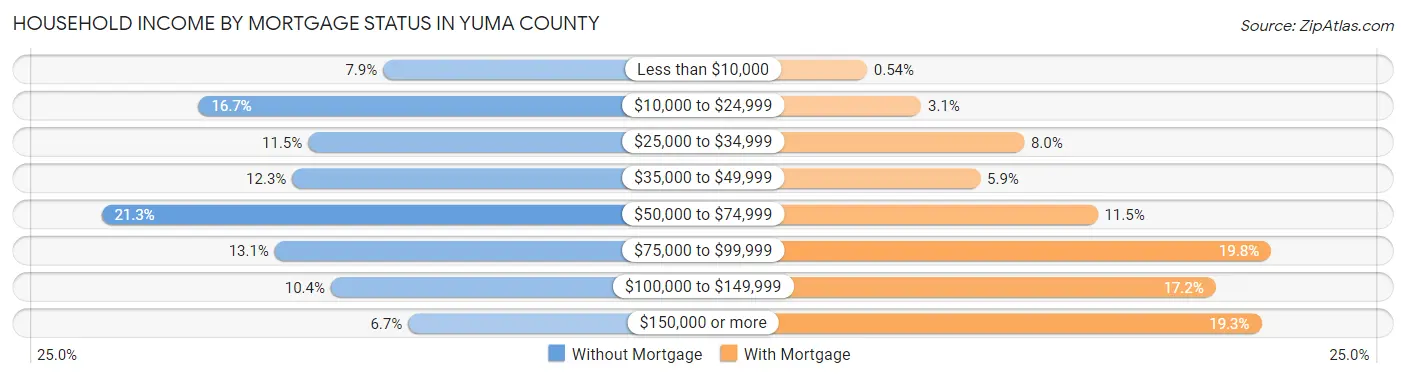
| Household Income | Without Mortgage | With Mortgage |
| Less than $10,000 | 1,840 (7.9%) | 153 (0.5%) |
| $10,000 to $24,999 | 3,879 (16.7%) | 886 (3.1%) |
| $25,000 to $34,999 | 2,669 (11.5%) | 2,275 (8.0%) |
| $35,000 to $49,999 | 2,844 (12.3%) | 1,682 (5.9%) |
| $50,000 to $74,999 | 4,953 (21.3%) | 3,268 (11.5%) |
| $75,000 to $99,999 | 3,038 (13.1%) | 5,614 (19.8%) |
| $100,000 to $149,999 | 2,417 (10.4%) | 4,866 (17.2%) |
| $150,000 or more | 1,565 (6.7%) | 5,480 (19.3%) |
| Total | 23,205 (100.0%) | 28,370 (100.0%) |
Property Value to Household Income Ratio in Yuma County
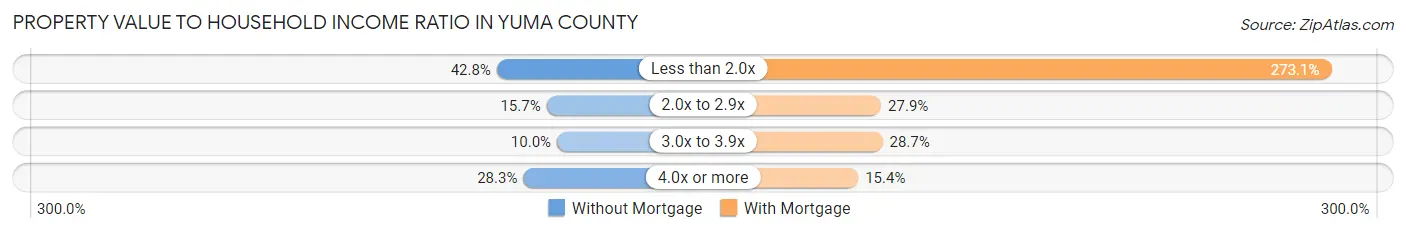
| Value-to-Income Ratio | Without Mortgage | With Mortgage |
| Less than 2.0x | 9,930 (42.8%) | 77,489 (273.1%) |
| 2.0x to 2.9x | 3,636 (15.7%) | 7,919 (27.9%) |
| 3.0x to 3.9x | 2,319 (10.0%) | 8,136 (28.7%) |
| 4.0x or more | 6,575 (28.3%) | 4,375 (15.4%) |
| Total | 23,205 (100.0%) | 28,370 (100.0%) |
Real Estate Taxes by Mortgage Status in Yuma County
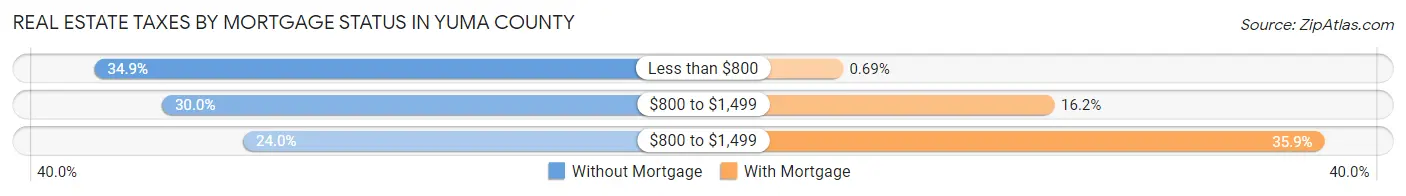
| Property Taxes | Without Mortgage | With Mortgage |
| Less than $800 | 8,094 (34.9%) | 195 (0.7%) |
| $800 to $1,499 | 6,953 (30.0%) | 4,581 (16.2%) |
| $800 to $1,499 | 5,576 (24.0%) | 10,184 (35.9%) |
| Total | 23,205 (100.0%) | 28,370 (100.0%) |
Health & Disability in Yuma County
Health Insurance Coverage by Age in Yuma County
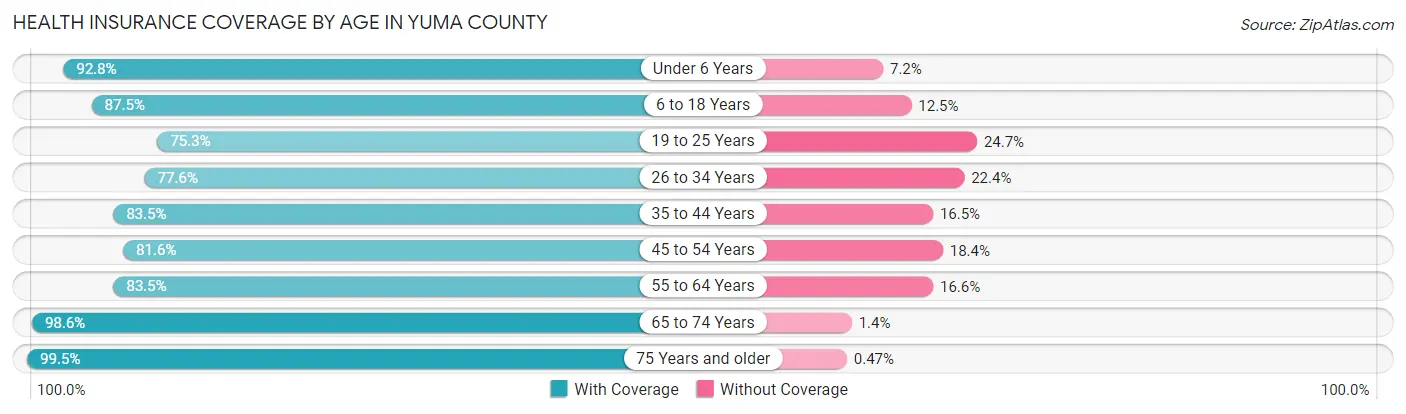
| Age Bracket | With Coverage | Without Coverage |
| Under 6 Years | 15,516 (92.8%) | 1,208 (7.2%) |
| 6 to 18 Years | 32,904 (87.5%) | 4,707 (12.5%) |
| 19 to 25 Years | 14,396 (75.3%) | 4,732 (24.7%) |
| 26 to 34 Years | 17,984 (77.6%) | 5,183 (22.4%) |
| 35 to 44 Years | 17,601 (83.5%) | 3,486 (16.5%) |
| 45 to 54 Years | 15,676 (81.6%) | 3,527 (18.4%) |
| 55 to 64 Years | 16,181 (83.5%) | 3,210 (16.6%) |
| 65 to 74 Years | 19,404 (98.6%) | 272 (1.4%) |
| 75 Years and older | 19,981 (99.5%) | 95 (0.5%) |
| Total | 169,643 (86.5%) | 26,420 (13.5%) |
Health Insurance Coverage by Citizenship Status in Yuma County
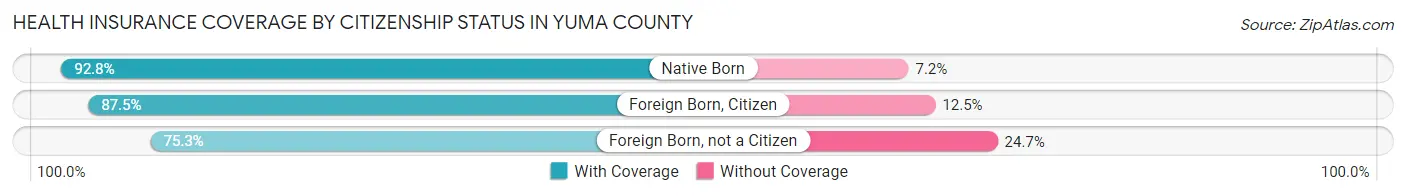
| Citizenship Status | With Coverage | Without Coverage |
| Native Born | 15,516 (92.8%) | 1,208 (7.2%) |
| Foreign Born, Citizen | 32,904 (87.5%) | 4,707 (12.5%) |
| Foreign Born, not a Citizen | 14,396 (75.3%) | 4,732 (24.7%) |
Health Insurance Coverage by Household Income in Yuma County
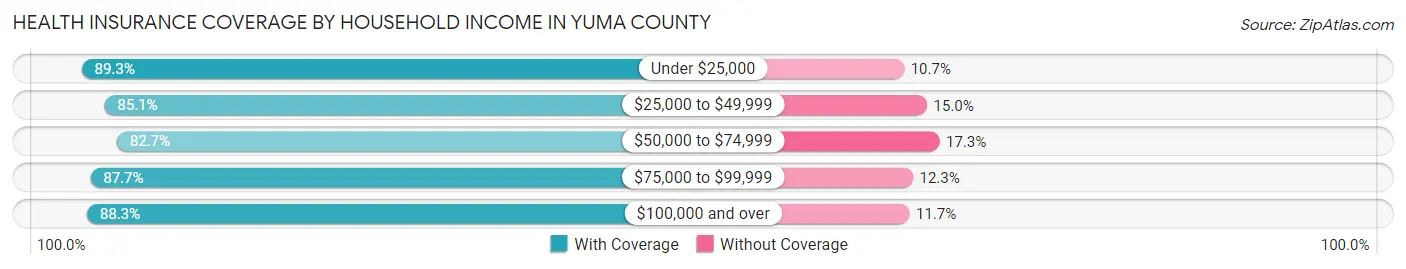
| Household Income | With Coverage | Without Coverage |
| Under $25,000 | 27,022 (89.3%) | 3,228 (10.7%) |
| $25,000 to $49,999 | 36,090 (85.1%) | 6,343 (14.9%) |
| $50,000 to $74,999 | 34,562 (82.7%) | 7,219 (17.3%) |
| $75,000 to $99,999 | 23,476 (87.7%) | 3,298 (12.3%) |
| $100,000 and over | 47,553 (88.3%) | 6,285 (11.7%) |
Public vs Private Health Insurance Coverage by Age in Yuma County
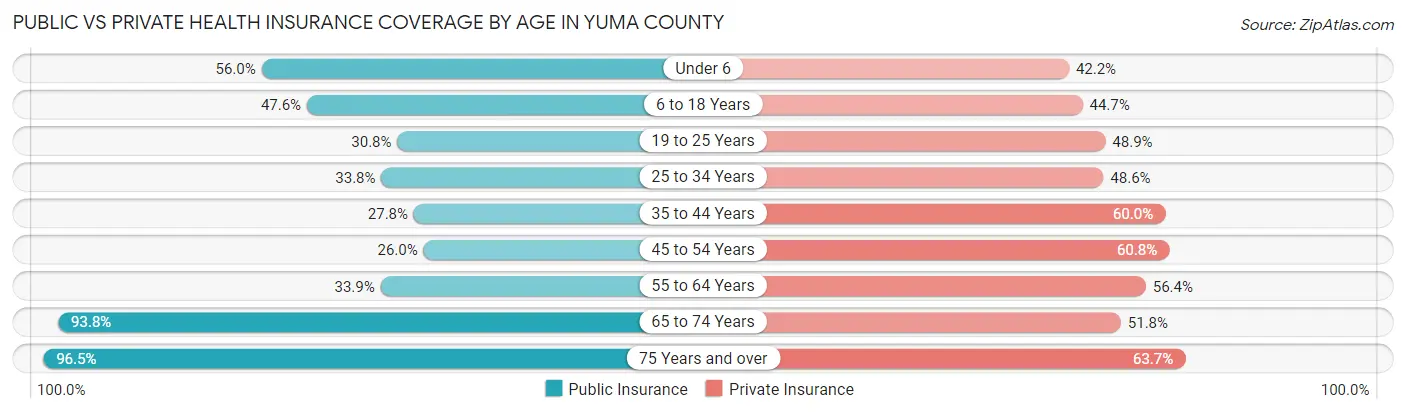
| Age Bracket | Public Insurance | Private Insurance |
| Under 6 | 9,369 (56.0%) | 7,051 (42.2%) |
| 6 to 18 Years | 17,898 (47.6%) | 16,804 (44.7%) |
| 19 to 25 Years | 5,893 (30.8%) | 9,359 (48.9%) |
| 25 to 34 Years | 7,826 (33.8%) | 11,251 (48.6%) |
| 35 to 44 Years | 5,851 (27.8%) | 12,653 (60.0%) |
| 45 to 54 Years | 4,983 (26.0%) | 11,666 (60.8%) |
| 55 to 64 Years | 6,579 (33.9%) | 10,942 (56.4%) |
| 65 to 74 Years | 18,459 (93.8%) | 10,193 (51.8%) |
| 75 Years and over | 19,381 (96.5%) | 12,789 (63.7%) |
| Total | 96,239 (49.1%) | 102,708 (52.4%) |
Disability Status by Sex by Age in Yuma County
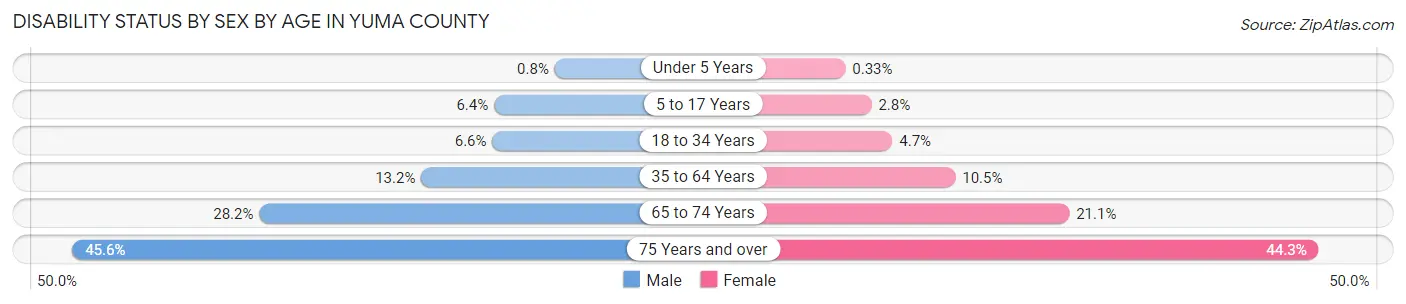
| Age Bracket | Male | Female |
| Under 5 Years | 56 (0.8%) | 23 (0.3%) |
| 5 to 17 Years | 1,232 (6.4%) | 499 (2.8%) |
| 18 to 34 Years | 1,530 (6.6%) | 1,035 (4.7%) |
| 35 to 64 Years | 3,815 (13.2%) | 3,239 (10.5%) |
| 65 to 74 Years | 2,623 (28.2%) | 2,192 (21.1%) |
| 75 Years and over | 4,469 (45.6%) | 4,545 (44.3%) |
Disability Class by Sex by Age in Yuma County
Disability Class: Hearing Difficulty
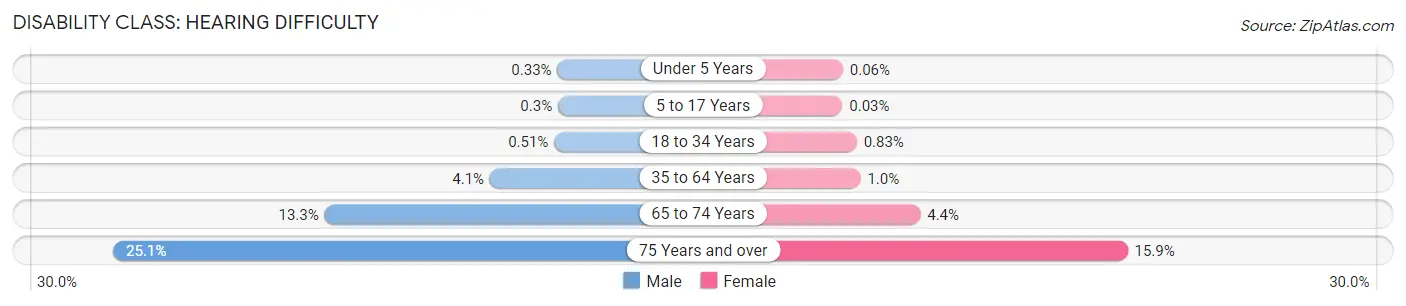
| Age Bracket | Male | Female |
| Under 5 Years | 23 (0.3%) | 4 (0.1%) |
| 5 to 17 Years | 58 (0.3%) | 6 (0.0%) |
| 18 to 34 Years | 118 (0.5%) | 183 (0.8%) |
| 35 to 64 Years | 1,183 (4.1%) | 320 (1.0%) |
| 65 to 74 Years | 1,236 (13.3%) | 454 (4.4%) |
| 75 Years and over | 2,458 (25.1%) | 1,634 (15.9%) |
Disability Class: Vision Difficulty
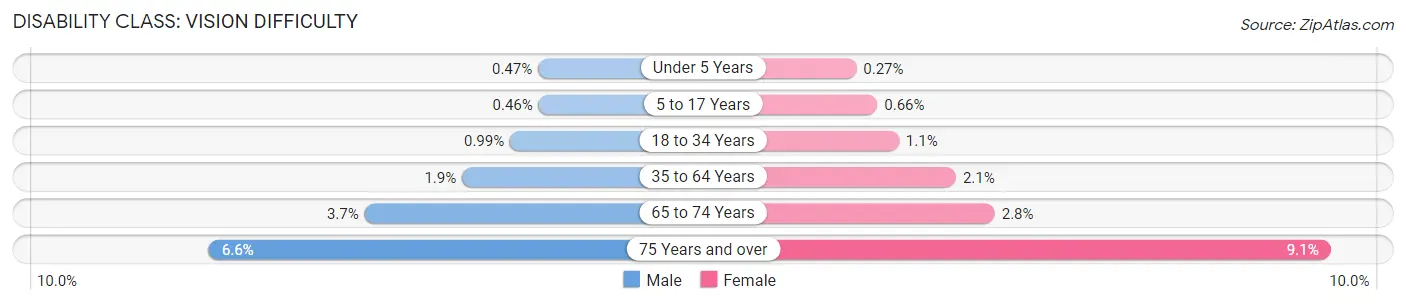
| Age Bracket | Male | Female |
| Under 5 Years | 33 (0.5%) | 19 (0.3%) |
| 5 to 17 Years | 89 (0.5%) | 119 (0.7%) |
| 18 to 34 Years | 231 (1.0%) | 235 (1.1%) |
| 35 to 64 Years | 544 (1.9%) | 651 (2.1%) |
| 65 to 74 Years | 343 (3.7%) | 295 (2.8%) |
| 75 Years and over | 645 (6.6%) | 932 (9.1%) |
Disability Class: Cognitive Difficulty
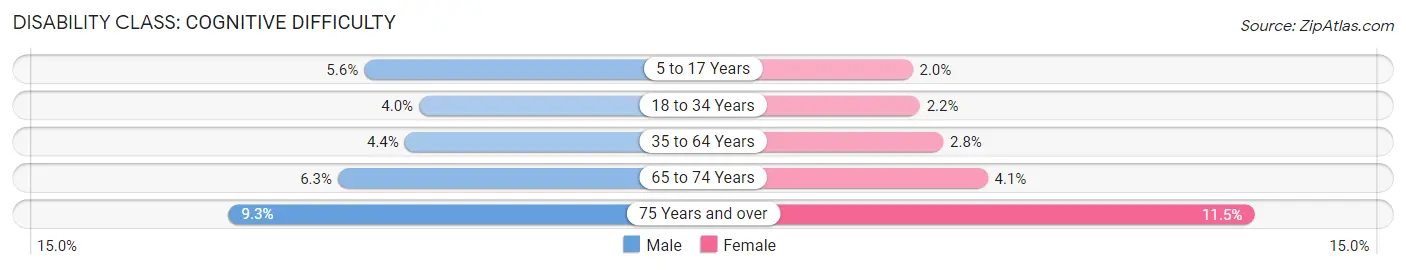
| Age Bracket | Male | Female |
| 5 to 17 Years | 1,064 (5.6%) | 357 (2.0%) |
| 18 to 34 Years | 934 (4.0%) | 478 (2.2%) |
| 35 to 64 Years | 1,279 (4.4%) | 866 (2.8%) |
| 65 to 74 Years | 584 (6.3%) | 421 (4.1%) |
| 75 Years and over | 914 (9.3%) | 1,179 (11.5%) |
Disability Class: Ambulatory Difficulty

| Age Bracket | Male | Female |
| 5 to 17 Years | 42 (0.2%) | 38 (0.2%) |
| 18 to 34 Years | 208 (0.9%) | 282 (1.3%) |
| 35 to 64 Years | 2,284 (7.9%) | 2,170 (7.1%) |
| 65 to 74 Years | 1,472 (15.8%) | 1,542 (14.8%) |
| 75 Years and over | 2,256 (23.0%) | 3,412 (33.2%) |
Disability Class: Self-Care Difficulty
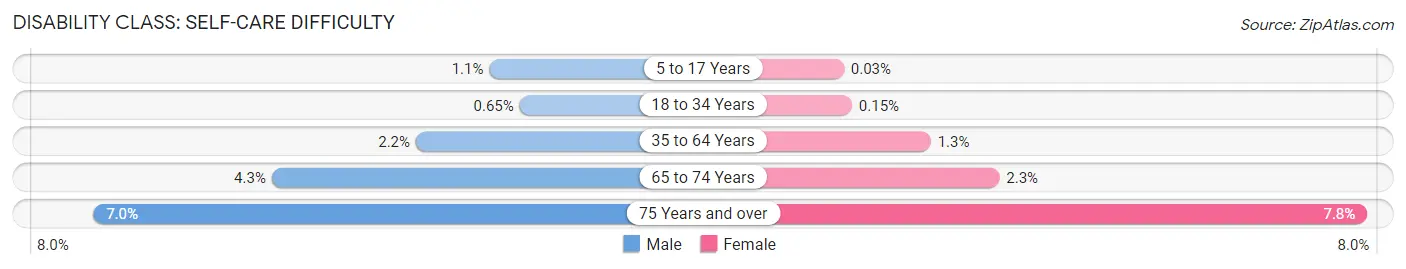
| Age Bracket | Male | Female |
| 5 to 17 Years | 210 (1.1%) | 6 (0.0%) |
| 18 to 34 Years | 152 (0.6%) | 34 (0.2%) |
| 35 to 64 Years | 633 (2.2%) | 405 (1.3%) |
| 65 to 74 Years | 402 (4.3%) | 243 (2.3%) |
| 75 Years and over | 684 (7.0%) | 801 (7.8%) |
Technology Access in Yuma County
Computing Device Access in Yuma County
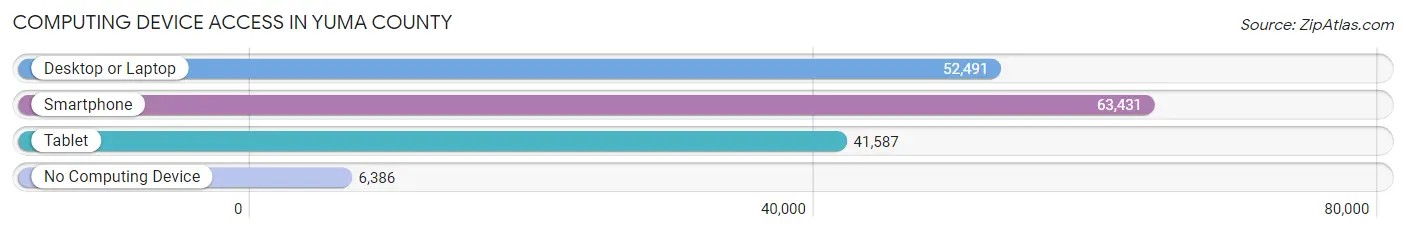
| Device Type | # Households | % Households |
| Desktop or Laptop | 52,491 | 70.3% |
| Smartphone | 63,431 | 84.9% |
| Tablet | 41,587 | 55.7% |
| No Computing Device | 6,386 | 8.6% |
| Total | 74,678 | 100.0% |
Internet Access in Yuma County
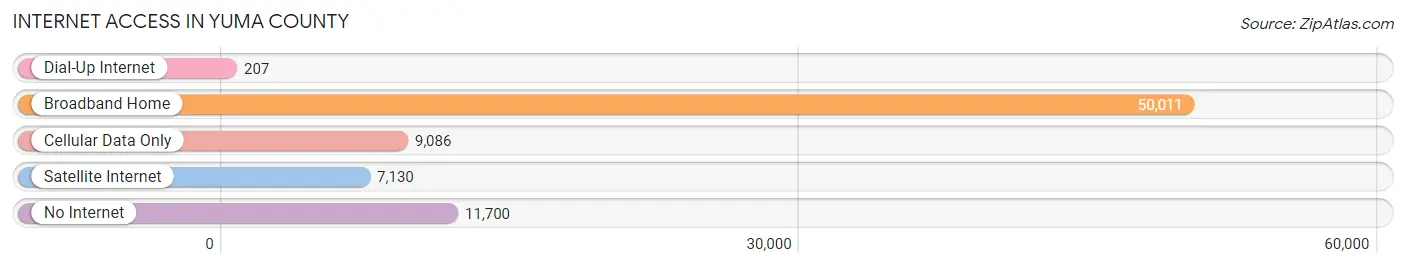
| Internet Type | # Households | % Households |
| Dial-Up Internet | 207 | 0.3% |
| Broadband Home | 50,011 | 67.0% |
| Cellular Data Only | 9,086 | 12.2% |
| Satellite Internet | 7,130 | 9.6% |
| No Internet | 11,700 | 15.7% |
| Total | 74,678 | 100.0% |
Yuma County Summary
Yuma County is located in the southwestern corner of Arizona, along the Colorado River. It is bordered by California to the west, La Paz County to the east, and Maricopa County to the north. Yuma County is the fourth largest county in Arizona, covering an area of 5,519 square miles.
Geography
Yuma County is located in the Sonoran Desert, and is characterized by hot, dry summers and mild winters. The county is home to the Yuma Desert, which is the driest desert in North America. The desert is home to a variety of wildlife, including coyotes, bobcats, and roadrunners. The county is also home to the Colorado River, which provides irrigation for the area's agricultural industry.
The county is divided into two distinct regions: the Yuma Valley and the Yuma Foothills. The Yuma Valley is located in the western part of the county and is characterized by flat, sandy terrain. The Yuma Foothills are located in the eastern part of the county and are characterized by rugged, mountainous terrain.
Economy
Yuma County is home to a diverse economy. Agriculture is the county's largest industry, with crops such as cotton, alfalfa, and wheat being grown in the area. The county is also home to a thriving tourism industry, with visitors coming to the area to enjoy the desert scenery and outdoor activities.
The county is also home to a number of military installations, including the Marine Corps Air Station Yuma and the Yuma Proving Ground. These installations provide jobs for many of the county's residents.
Demographics
As of the 2010 census, Yuma County had a population of 195,751. The population is predominantly Hispanic, with over 70% of the population identifying as Hispanic or Latino. The median household income in the county is $41,945, and the median age is 33.
Conclusion
Yuma County is a diverse and vibrant county located in the southwestern corner of Arizona. The county is home to a thriving agricultural industry, a thriving tourism industry, and a number of military installations. The population is predominantly Hispanic, and the median household income is $41,945. Yuma County is an important part of the state of Arizona, and its economy and population continue to grow.
Common Questions
What is Per Capita Income in Yuma County?
Per Capita income in Yuma County is $27,516.
What is the Median Family Income in Yuma County?
Median Family Income in Yuma County is $61,867.
What is the Median Household income in Yuma County?
Median Household Income in Yuma County is $56,439.
What is Income or Wage Gap in Yuma County?
Income or Wage Gap in Yuma County is 31.2%.
Women in Yuma County earn 68.8 cents for every dollar earned by a man.
What is Family Income Deficit in Yuma County?
Family Income Deficit in Yuma County is $12,124.
Families that are below poverty line in Yuma County earn $12,124 less on average than the poverty threshold level.
What is Inequality or Gini Index in Yuma County?
Inequality or Gini Index in Yuma County is 0.46.
What is the Total Population of Yuma County?
Total Population of Yuma County is 204,374.
What is the Total Male Population of Yuma County?
Total Male Population of Yuma County is 105,162.
What is the Total Female Population of Yuma County?
Total Female Population of Yuma County is 99,212.
What is the Ratio of Males per 100 Females in Yuma County?
There are 106.00 Males per 100 Females in Yuma County.
What is the Ratio of Females per 100 Males in Yuma County?
There are 94.34 Females per 100 Males in Yuma County.
What is the Median Population Age in Yuma County?
Median Population Age in Yuma County is 35.3 Years.
What is the Average Family Size in Yuma County
Average Family Size in Yuma County is 3.1 People.
What is the Average Household Size in Yuma County
Average Household Size in Yuma County is 2.6 People.
How Large is the Labor Force in Yuma County?
There are 85,630 People in the Labor Forcein in Yuma County.
What is the Percentage of People in the Labor Force in Yuma County?
53.9% of People are in the Labor Force in Yuma County.
What is the Unemployment Rate in Yuma County?
Unemployment Rate in Yuma County is 8.3%.