Santa Cruz County, AZ Map & Demographics
Santa Cruz County Map
Santa Cruz County Overview
$25,619
PER CAPITA INCOME
$59,444
AVG FAMILY INCOME
$51,885
AVG HOUSEHOLD INCOME
13.4%
WAGE / INCOME GAP [ % ]
86.6¢/ $1
WAGE / INCOME GAP [ $ ]
$9,744
FAMILY INCOME DEFICIT
0.46
INEQUALITY / GINI INDEX
47,838
TOTAL POPULATION
23,193
MALE POPULATION
24,645
FEMALE POPULATION
94.11
MALES / 100 FEMALES
106.26
FEMALES / 100 MALES
37.3
MEDIAN AGE
3.4
AVG FAMILY SIZE
2.9
AVG HOUSEHOLD SIZE
21,111
LABOR FORCE [ PEOPLE ]
57.2%
PERCENT IN LABOR FORCE
9.8%
UNEMPLOYMENT RATE
Santa Cruz County Area Codes
Income in Santa Cruz County
Income Overview in Santa Cruz County
Per Capita Income in Santa Cruz County is $25,619, while median incomes of families and households are $59,444 and $51,885 respectively.
| Characteristic | Number | Measure |
| Per Capita Income | 47,838 | $25,619 |
| Median Family Income | 12,141 | $59,444 |
| Mean Family Income | 12,141 | $79,866 |
| Median Household Income | 16,651 | $51,885 |
| Mean Household Income | 16,651 | $71,305 |
| Income Deficit | 12,141 | $9,744 |
| Wage / Income Gap (%) | 47,838 | 13.42% |
| Wage / Income Gap ($) | 47,838 | 86.58¢ per $1 |
| Gini / Inequality Index | 47,838 | 0.46 |
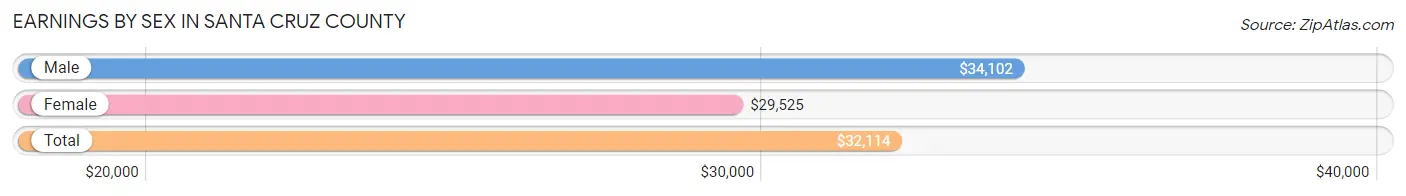
Earnings by Sex in Santa Cruz County
Average Earnings in Santa Cruz County are $32,114, $34,102 for men and $29,525 for women, a difference of 13.4%.
| Sex | Number | Average Earnings |
| Male | 11,624 (54.7%) | $34,102 |
| Female | 9,610 (45.3%) | $29,525 |
| Total | 21,234 (100.0%) | $32,114 |
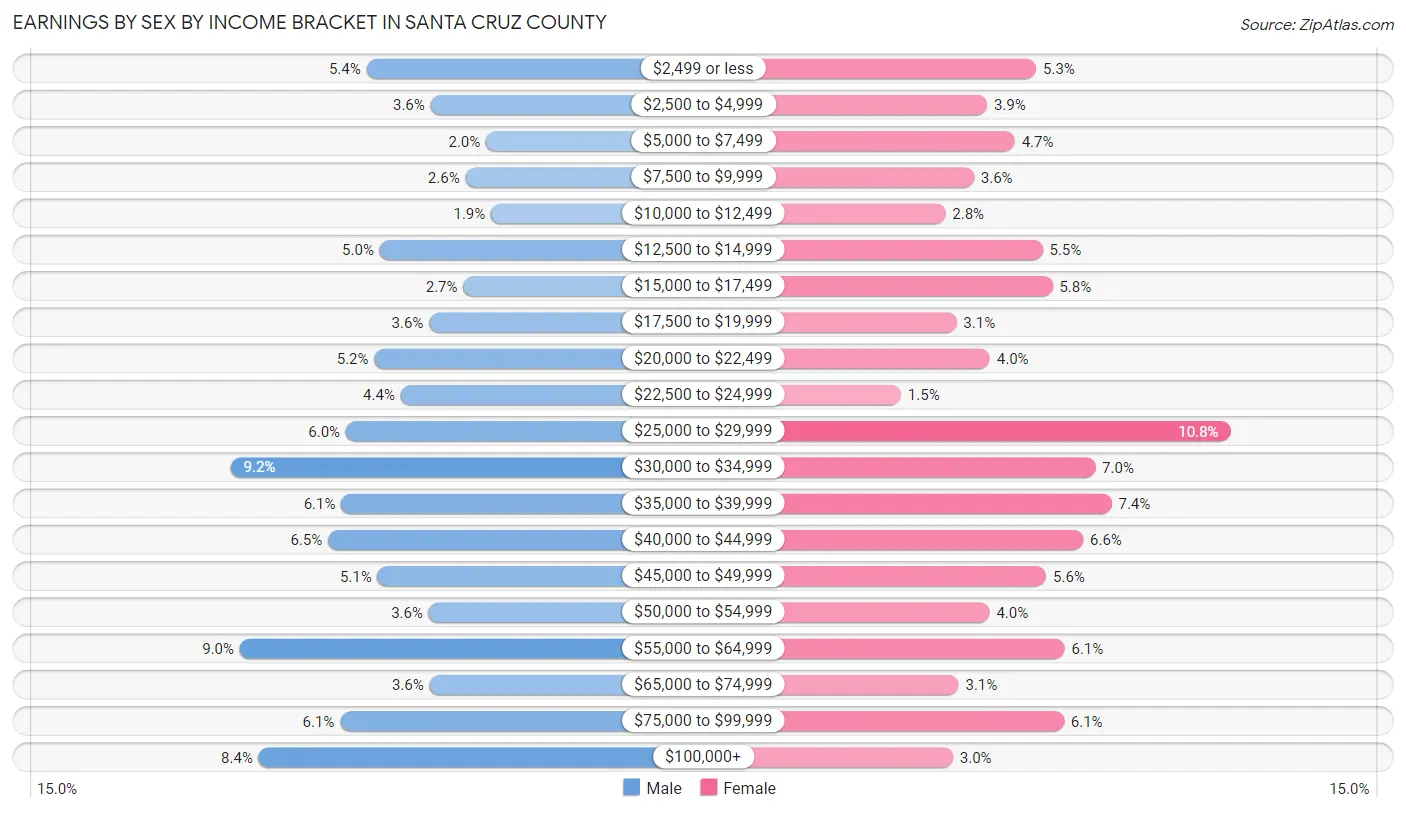
Earnings by Sex by Income Bracket in Santa Cruz County
The most common earnings brackets in Santa Cruz County are $30,000 to $34,999 for men (1,070 | 9.2%) and $25,000 to $29,999 for women (1,036 | 10.8%).
| Income | Male | Female |
| $2,499 or less | 626 (5.4%) | 511 (5.3%) |
| $2,500 to $4,999 | 417 (3.6%) | 379 (3.9%) |
| $5,000 to $7,499 | 236 (2.0%) | 454 (4.7%) |
| $7,500 to $9,999 | 303 (2.6%) | 343 (3.6%) |
| $10,000 to $12,499 | 220 (1.9%) | 266 (2.8%) |
| $12,500 to $14,999 | 583 (5.0%) | 529 (5.5%) |
| $15,000 to $17,499 | 310 (2.7%) | 555 (5.8%) |
| $17,500 to $19,999 | 422 (3.6%) | 296 (3.1%) |
| $20,000 to $22,499 | 601 (5.2%) | 386 (4.0%) |
| $22,500 to $24,999 | 515 (4.4%) | 146 (1.5%) |
| $25,000 to $29,999 | 694 (6.0%) | 1,036 (10.8%) |
| $30,000 to $34,999 | 1,070 (9.2%) | 671 (7.0%) |
| $35,000 to $39,999 | 709 (6.1%) | 715 (7.4%) |
| $40,000 to $44,999 | 752 (6.5%) | 638 (6.6%) |
| $45,000 to $49,999 | 590 (5.1%) | 538 (5.6%) |
| $50,000 to $54,999 | 423 (3.6%) | 385 (4.0%) |
| $55,000 to $64,999 | 1,040 (8.9%) | 588 (6.1%) |
| $65,000 to $74,999 | 421 (3.6%) | 302 (3.1%) |
| $75,000 to $99,999 | 713 (6.1%) | 586 (6.1%) |
| $100,000+ | 979 (8.4%) | 286 (3.0%) |
| Total | 11,624 (100.0%) | 9,610 (100.0%) |
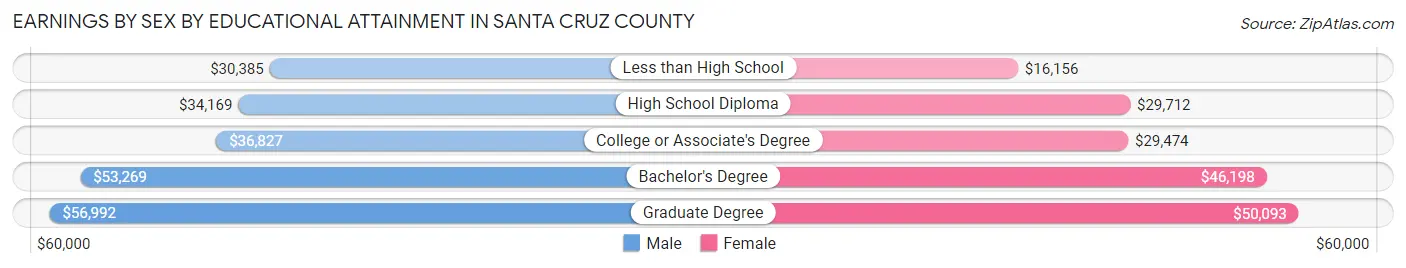
Earnings by Sex by Educational Attainment in Santa Cruz County
Average earnings in Santa Cruz County are $37,843 for men and $32,573 for women, a difference of 13.9%. Men with an educational attainment of graduate degree enjoy the highest average annual earnings of $56,992, while those with less than high school education earn the least with $30,385. Women with an educational attainment of graduate degree earn the most with the average annual earnings of $50,093, while those with less than high school education have the smallest earnings of $16,156.
| Educational Attainment | Male Income | Female Income |
| Less than High School | $30,385 | $16,156 |
| High School Diploma | $34,169 | $29,712 |
| College or Associate's Degree | $36,827 | $29,474 |
| Bachelor's Degree | $53,269 | $46,198 |
| Graduate Degree | $56,992 | $50,093 |
| Total | $37,843 | $32,573 |
Family Income in Santa Cruz County
Family Income Brackets in Santa Cruz County
According to the Santa Cruz County family income data, there are 2,404 families falling into the $50,000 to $74,999 income range, which is the most common income bracket and makes up 19.8% of all families. Conversely, the $10,000 to $14,999 income bracket is the least frequent group with only 328 families (2.7%) belonging to this category.
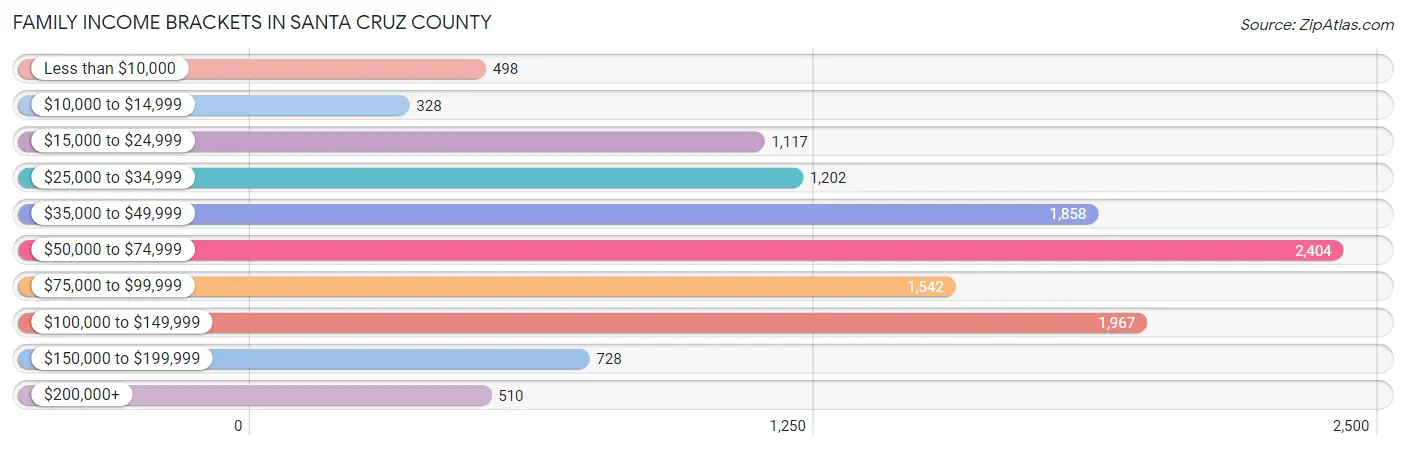
| Income Bracket | # Families | % Families |
| Less than $10,000 | 498 | 4.1% |
| $10,000 to $14,999 | 328 | 2.7% |
| $15,000 to $24,999 | 1,117 | 9.2% |
| $25,000 to $34,999 | 1,202 | 9.9% |
| $35,000 to $49,999 | 1,858 | 15.3% |
| $50,000 to $74,999 | 2,404 | 19.8% |
| $75,000 to $99,999 | 1,542 | 12.7% |
| $100,000 to $149,999 | 1,967 | 16.2% |
| $150,000 to $199,999 | 728 | 6.0% |
| $200,000+ | 510 | 4.2% |
Family Income by Famaliy Size in Santa Cruz County
6-person families (658 | 5.4%) account for the highest median family income in Santa Cruz County with $93,184 per family, while 2-person families (4,779 | 39.4%) have the highest median income of $27,048 per family member.
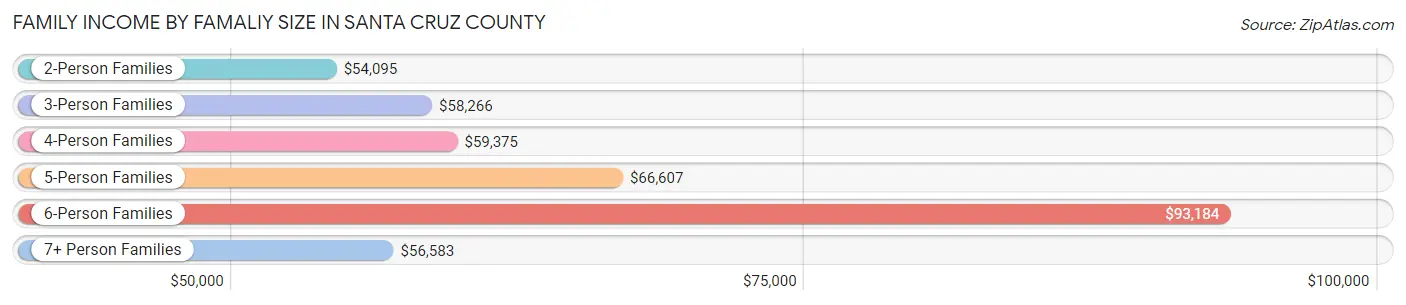
| Income Bracket | # Families | Median Income |
| 2-Person Families | 4,779 (39.4%) | $54,095 |
| 3-Person Families | 2,964 (24.4%) | $58,266 |
| 4-Person Families | 2,192 (18.0%) | $59,375 |
| 5-Person Families | 1,261 (10.4%) | $66,607 |
| 6-Person Families | 658 (5.4%) | $93,184 |
| 7+ Person Families | 287 (2.4%) | $56,583 |
| Total | 12,141 (100.0%) | $59,444 |
Family Income by Number of Earners in Santa Cruz County
The median family income in Santa Cruz County is $59,444, with families comprising 3+ earners (1,002) having the highest median family income of $104,035, while families with 1 earner (4,813) have the lowest median family income of $43,004, accounting for 8.3% and 39.6% of families, respectively.
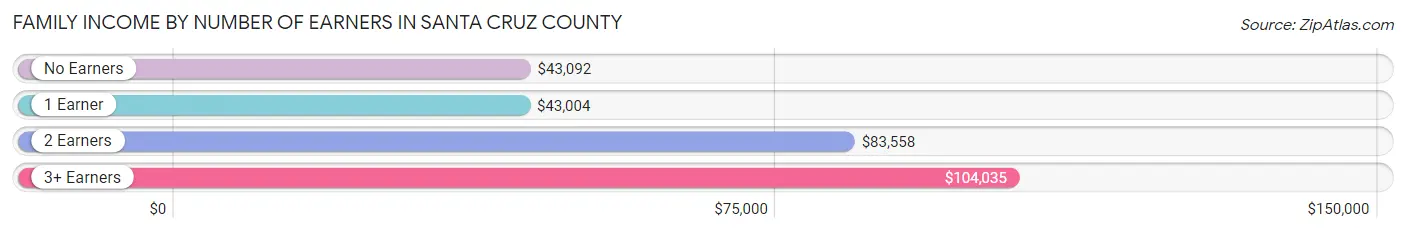
| Number of Earners | # Families | Median Income |
| No Earners | 2,004 (16.5%) | $43,092 |
| 1 Earner | 4,813 (39.6%) | $43,004 |
| 2 Earners | 4,322 (35.6%) | $83,558 |
| 3+ Earners | 1,002 (8.3%) | $104,035 |
| Total | 12,141 (100.0%) | $59,444 |
Household Income in Santa Cruz County
Household Income Brackets in Santa Cruz County
With 3,097 households falling in the category, the $50,000 to $74,999 income range is the most frequent in Santa Cruz County, accounting for 18.6% of all households. In contrast, only 633 households (3.8%) fall into the $200,000+ income bracket, making it the least populous group.
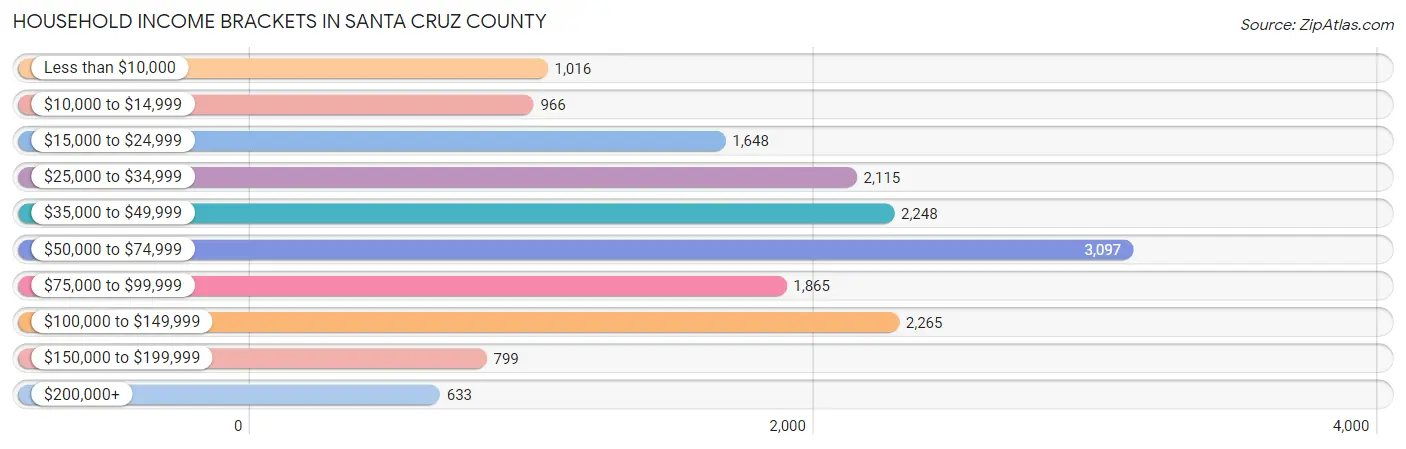
| Income Bracket | # Households | % Households |
| Less than $10,000 | 1,016 | 6.1% |
| $10,000 to $14,999 | 966 | 5.8% |
| $15,000 to $24,999 | 1,648 | 9.9% |
| $25,000 to $34,999 | 2,115 | 12.7% |
| $35,000 to $49,999 | 2,248 | 13.5% |
| $50,000 to $74,999 | 3,097 | 18.6% |
| $75,000 to $99,999 | 1,865 | 11.2% |
| $100,000 to $149,999 | 2,265 | 13.6% |
| $150,000 to $199,999 | 799 | 4.8% |
| $200,000+ | 633 | 3.8% |
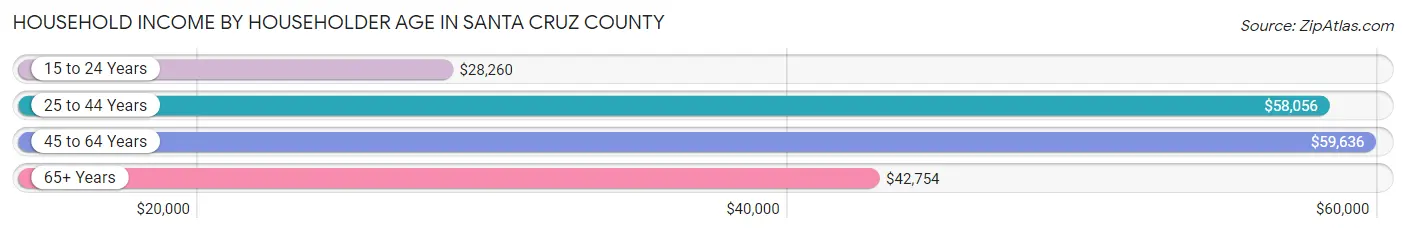
Household Income by Householder Age in Santa Cruz County
The median household income in Santa Cruz County is $51,885, with the highest median household income of $59,636 found in the 45 to 64 years age bracket for the primary householder. A total of 6,266 households (37.6%) fall into this category. Meanwhile, the 15 to 24 years age bracket for the primary householder has the lowest median household income of $28,260, with 639 households (3.8%) in this group.
| Income Bracket | # Households | Median Income |
| 15 to 24 Years | 639 (3.8%) | $28,260 |
| 25 to 44 Years | 4,498 (27.0%) | $58,056 |
| 45 to 64 Years | 6,266 (37.6%) | $59,636 |
| 65+ Years | 5,248 (31.5%) | $42,754 |
| Total | 16,651 (100.0%) | $51,885 |
Poverty in Santa Cruz County
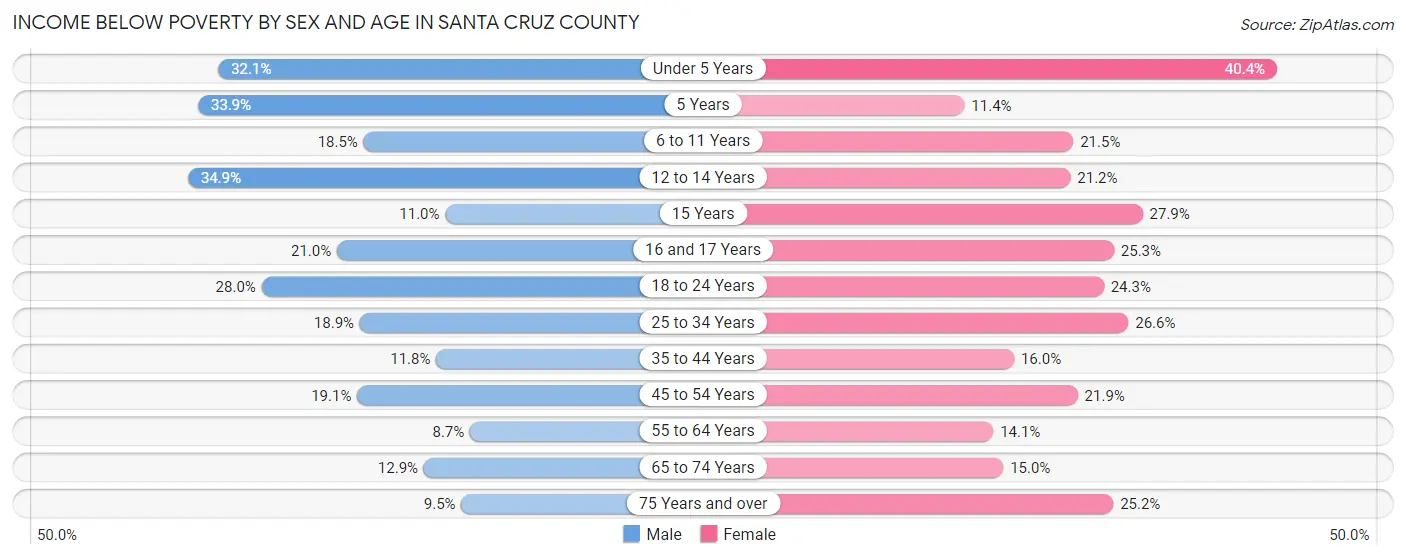
Income Below Poverty by Sex and Age in Santa Cruz County
With 18.9% poverty level for males and 21.5% for females among the residents of Santa Cruz County, 12 to 14 year old males and under 5 year old females are the most vulnerable to poverty, with 613 males (34.8%) and 598 females (40.4%) in their respective age groups living below the poverty level.
| Age Bracket | Male | Female |
| Under 5 Years | 524 (32.1%) | 598 (40.4%) |
| 5 Years | 77 (33.9%) | 70 (11.4%) |
| 6 to 11 Years | 294 (18.5%) | 444 (21.5%) |
| 12 to 14 Years | 613 (34.8%) | 196 (21.2%) |
| 15 Years | 30 (11.0%) | 86 (27.9%) |
| 16 and 17 Years | 180 (21.0%) | 204 (25.3%) |
| 18 to 24 Years | 635 (28.0%) | 530 (24.3%) |
| 25 to 34 Years | 529 (18.9%) | 739 (26.6%) |
| 35 to 44 Years | 280 (11.8%) | 463 (16.0%) |
| 45 to 54 Years | 482 (19.1%) | 612 (21.9%) |
| 55 to 64 Years | 228 (8.6%) | 419 (14.1%) |
| 65 to 74 Years | 311 (12.9%) | 413 (15.0%) |
| 75 Years and over | 157 (9.5%) | 508 (25.2%) |
| Total | 4,340 (18.9%) | 5,282 (21.5%) |
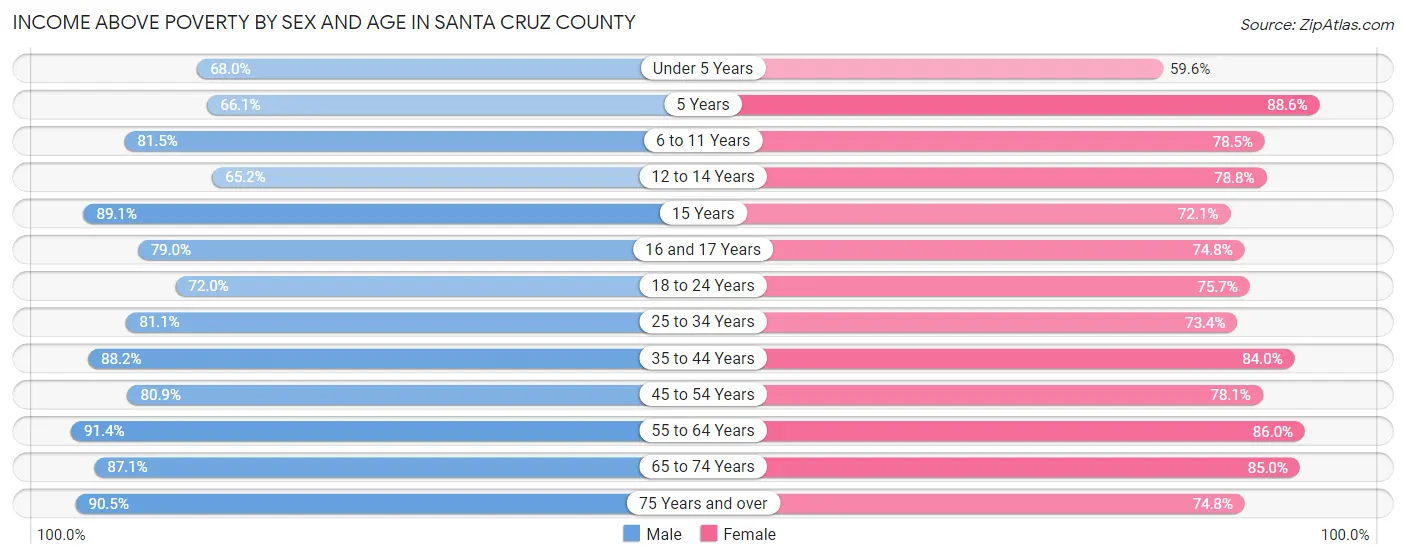
Income Above Poverty by Sex and Age in Santa Cruz County
According to the poverty statistics in Santa Cruz County, males aged 55 to 64 years and females aged 5 years are the age groups that are most secure financially, with 91.3% of males and 88.6% of females in these age groups living above the poverty line.
| Age Bracket | Male | Female |
| Under 5 Years | 1,111 (67.9%) | 883 (59.6%) |
| 5 Years | 150 (66.1%) | 545 (88.6%) |
| 6 to 11 Years | 1,293 (81.5%) | 1,623 (78.5%) |
| 12 to 14 Years | 1,146 (65.1%) | 728 (78.8%) |
| 15 Years | 244 (89.0%) | 222 (72.1%) |
| 16 and 17 Years | 677 (79.0%) | 604 (74.8%) |
| 18 to 24 Years | 1,633 (72.0%) | 1,650 (75.7%) |
| 25 to 34 Years | 2,273 (81.1%) | 2,040 (73.4%) |
| 35 to 44 Years | 2,094 (88.2%) | 2,435 (84.0%) |
| 45 to 54 Years | 2,037 (80.9%) | 2,184 (78.1%) |
| 55 to 64 Years | 2,408 (91.3%) | 2,564 (86.0%) |
| 65 to 74 Years | 2,092 (87.1%) | 2,344 (85.0%) |
| 75 Years and over | 1,503 (90.5%) | 1,509 (74.8%) |
| Total | 18,661 (81.1%) | 19,331 (78.5%) |
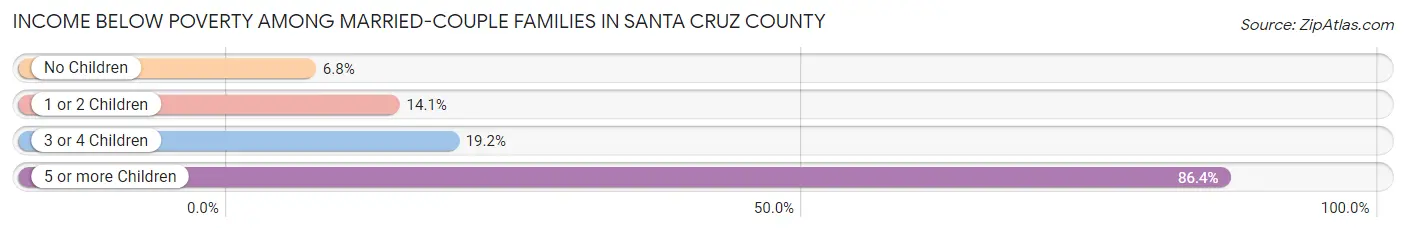
Income Below Poverty Among Married-Couple Families in Santa Cruz County
The poverty statistics for married-couple families in Santa Cruz County show that 10.9% or 928 of the total 8,490 families live below the poverty line. Families with 5 or more children have the highest poverty rate of 86.4%, comprising of 19 families. On the other hand, families with no children have the lowest poverty rate of 6.8%, which includes 306 families.
| Children | Above Poverty | Below Poverty |
| No Children | 4,208 (93.2%) | 306 (6.8%) |
| 1 or 2 Children | 2,619 (85.9%) | 429 (14.1%) |
| 3 or 4 Children | 732 (80.8%) | 174 (19.2%) |
| 5 or more Children | 3 (13.6%) | 19 (86.4%) |
| Total | 7,562 (89.1%) | 928 (10.9%) |
Income Below Poverty Among Single-Parent Households in Santa Cruz County
According to the poverty data in Santa Cruz County, 16.3% or 144 single-father households and 33.5% or 927 single-mother households are living below the poverty line. Among single-father households, those with 1 or 2 children have the highest poverty rate, with 111 households (22.8%) experiencing poverty. Likewise, among single-mother households, those with 5 or more children have the highest poverty rate, with 48 households (100.0%) falling below the poverty line.
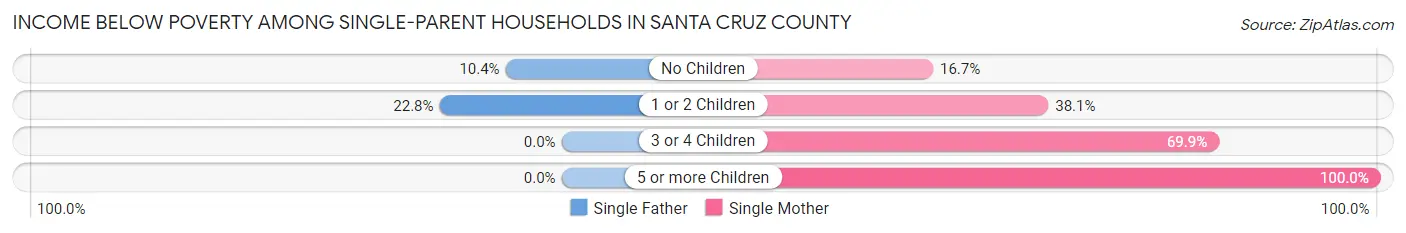
| Children | Single Father | Single Mother |
| No Children | 33 (10.4%) | 216 (16.7%) |
| 1 or 2 Children | 111 (22.8%) | 396 (38.1%) |
| 3 or 4 Children | 0 (0.0%) | 267 (69.9%) |
| 5 or more Children | 0 (0.0%) | 48 (100.0%) |
| Total | 144 (16.3%) | 927 (33.5%) |
Income Below Poverty Among Married-Couple vs Single-Parent Households in Santa Cruz County
The poverty data for Santa Cruz County shows that 928 of the married-couple family households (10.9%) and 1,071 of the single-parent households (29.3%) are living below the poverty level. Within the married-couple family households, those with 5 or more children have the highest poverty rate, with 19 households (86.4%) falling below the poverty line. Among the single-parent households, those with 5 or more children have the highest poverty rate, with 48 household (100.0%) living below poverty.
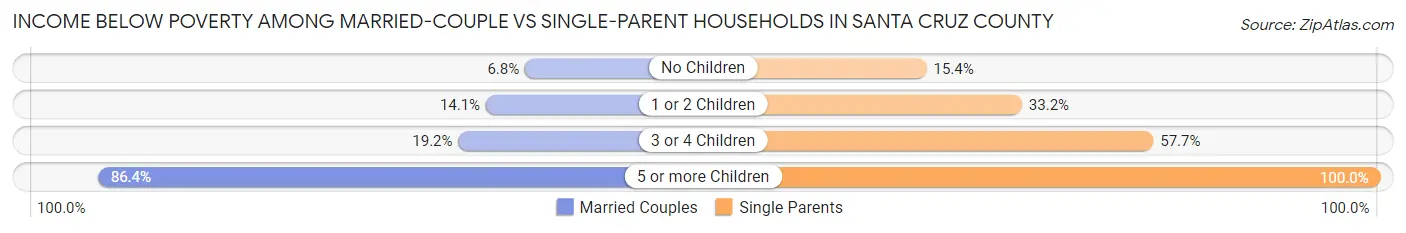
| Children | Married-Couple Families | Single-Parent Households |
| No Children | 306 (6.8%) | 249 (15.4%) |
| 1 or 2 Children | 429 (14.1%) | 507 (33.2%) |
| 3 or 4 Children | 174 (19.2%) | 267 (57.7%) |
| 5 or more Children | 19 (86.4%) | 48 (100.0%) |
| Total | 928 (10.9%) | 1,071 (29.3%) |
Race in Santa Cruz County
The most populous races in Santa Cruz County are Hispanic or Latino (39,732 | 83.1%), White / Caucasian (24,750 | 51.7%), and Two or more Races (17,298 | 36.2%).
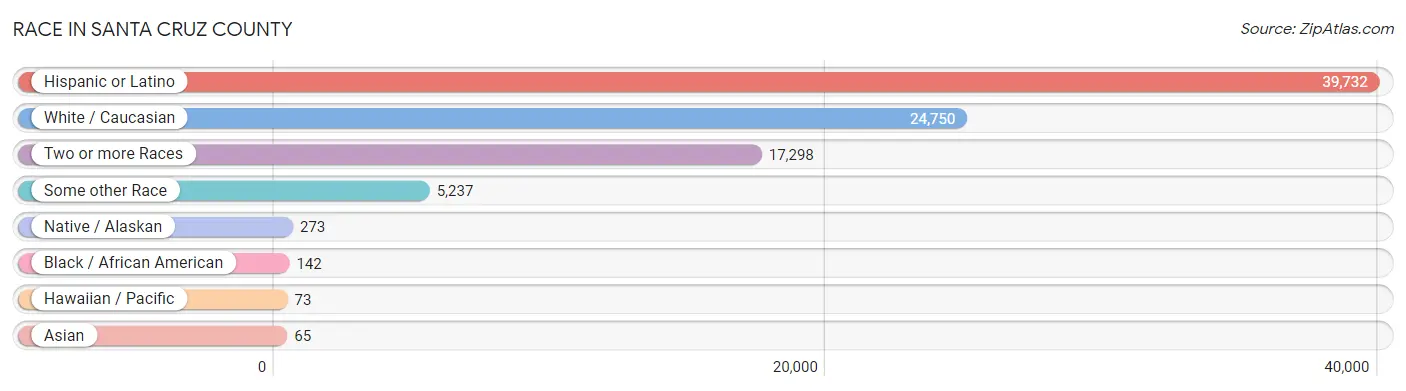
| Race | # Population | % Population |
| Asian | 65 | 0.1% |
| Black / African American | 142 | 0.3% |
| Hawaiian / Pacific | 73 | 0.2% |
| Hispanic or Latino | 39,732 | 83.1% |
| Native / Alaskan | 273 | 0.6% |
| White / Caucasian | 24,750 | 51.7% |
| Two or more Races | 17,298 | 36.2% |
| Some other Race | 5,237 | 11.0% |
| Total | 47,838 | 100.0% |
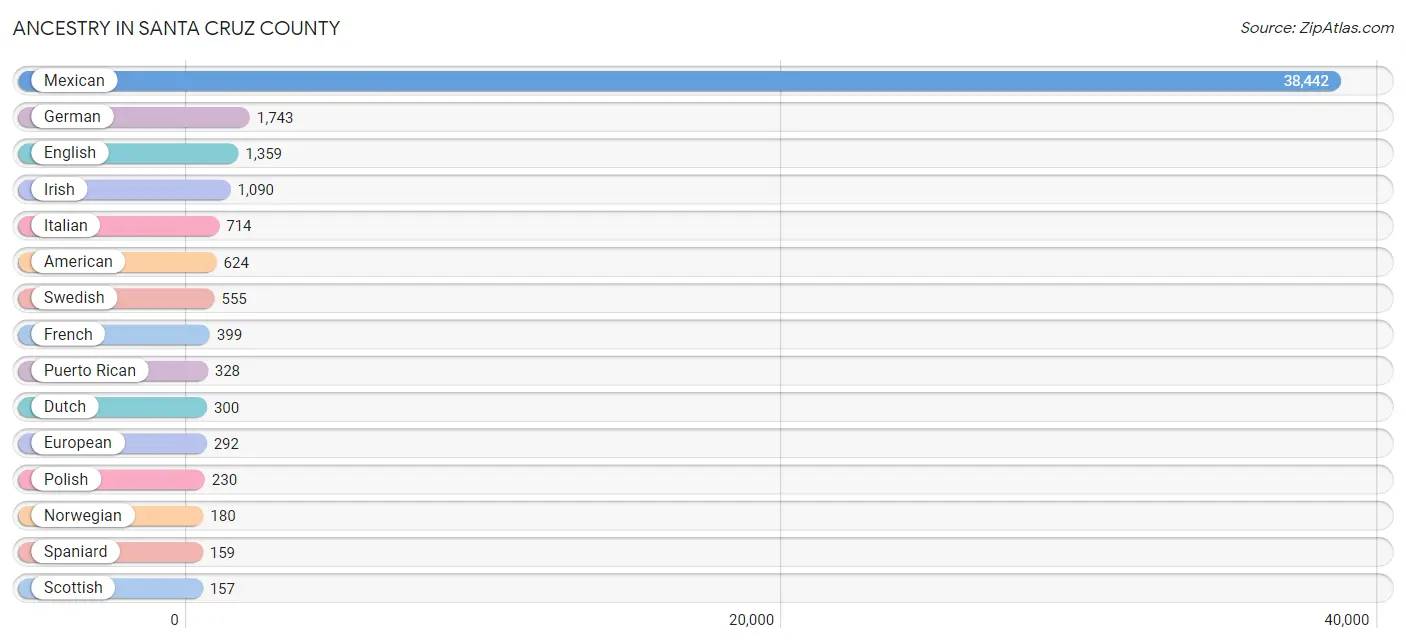
Ancestry in Santa Cruz County
The most populous ancestries reported in Santa Cruz County are Mexican (38,442 | 80.4%), German (1,743 | 3.6%), English (1,359 | 2.8%), Irish (1,090 | 2.3%), and Italian (714 | 1.5%), together accounting for 90.6% of all Santa Cruz County residents.
| Ancestry | # Population | % Population |
| American | 624 | 1.3% |
| Apache | 24 | 0.1% |
| Arab | 49 | 0.1% |
| Armenian | 9 | 0.0% |
| Belgian | 14 | 0.0% |
| Bhutanese | 23 | 0.1% |
| Brazilian | 7 | 0.0% |
| British | 60 | 0.1% |
| Burmese | 1 | 0.0% |
| Canadian | 20 | 0.0% |
| Central American | 21 | 0.0% |
| Central American Indian | 32 | 0.1% |
| Cherokee | 92 | 0.2% |
| Chickasaw | 80 | 0.2% |
| Choctaw | 18 | 0.0% |
| Colombian | 43 | 0.1% |
| Croatian | 15 | 0.0% |
| Cuban | 99 | 0.2% |
| Czech | 38 | 0.1% |
| Danish | 66 | 0.1% |
| Dominican | 20 | 0.0% |
| Dutch | 300 | 0.6% |
| Eastern European | 70 | 0.2% |
| Egyptian | 23 | 0.1% |
| English | 1,359 | 2.8% |
| European | 292 | 0.6% |
| Finnish | 54 | 0.1% |
| French | 399 | 0.8% |
| French American Indian | 11 | 0.0% |
| French Canadian | 37 | 0.1% |
| German | 1,743 | 3.6% |
| Greek | 79 | 0.2% |
| Guatemalan | 16 | 0.0% |
| Hungarian | 31 | 0.1% |
| Indian (Asian) | 19 | 0.0% |
| Iranian | 18 | 0.0% |
| Irish | 1,090 | 2.3% |
| Iroquois | 20 | 0.0% |
| Italian | 714 | 1.5% |
| Korean | 30 | 0.1% |
| Laotian | 22 | 0.1% |
| Latvian | 17 | 0.0% |
| Lebanese | 15 | 0.0% |
| Lithuanian | 39 | 0.1% |
| Mexican | 38,442 | 80.4% |
| Native Hawaiian | 73 | 0.2% |
| Navajo | 22 | 0.1% |
| Nicaraguan | 5 | 0.0% |
| Nigerian | 14 | 0.0% |
| Northern European | 37 | 0.1% |
| Norwegian | 180 | 0.4% |
| Pakistani | 22 | 0.1% |
| Paraguayan | 6 | 0.0% |
| Peruvian | 11 | 0.0% |
| Polish | 230 | 0.5% |
| Portuguese | 27 | 0.1% |
| Potawatomi | 29 | 0.1% |
| Puerto Rican | 328 | 0.7% |
| Russian | 77 | 0.2% |
| Samoan | 125 | 0.3% |
| Scandinavian | 13 | 0.0% |
| Scotch-Irish | 70 | 0.2% |
| Scottish | 157 | 0.3% |
| Serbian | 84 | 0.2% |
| Sioux | 10 | 0.0% |
| South American | 60 | 0.1% |
| Spaniard | 159 | 0.3% |
| Spanish | 23 | 0.1% |
| Subsaharan African | 14 | 0.0% |
| Swedish | 555 | 1.2% |
| Swiss | 23 | 0.1% |
| Thai | 3 | 0.0% |
| Ukrainian | 25 | 0.1% |
| Welsh | 23 | 0.1% |
| West Indian | 12 | 0.0% |
| Yaqui | 19 | 0.0% |
| Yugoslavian | 31 | 0.1% | View All 77 Rows |
Immigrants in Santa Cruz County
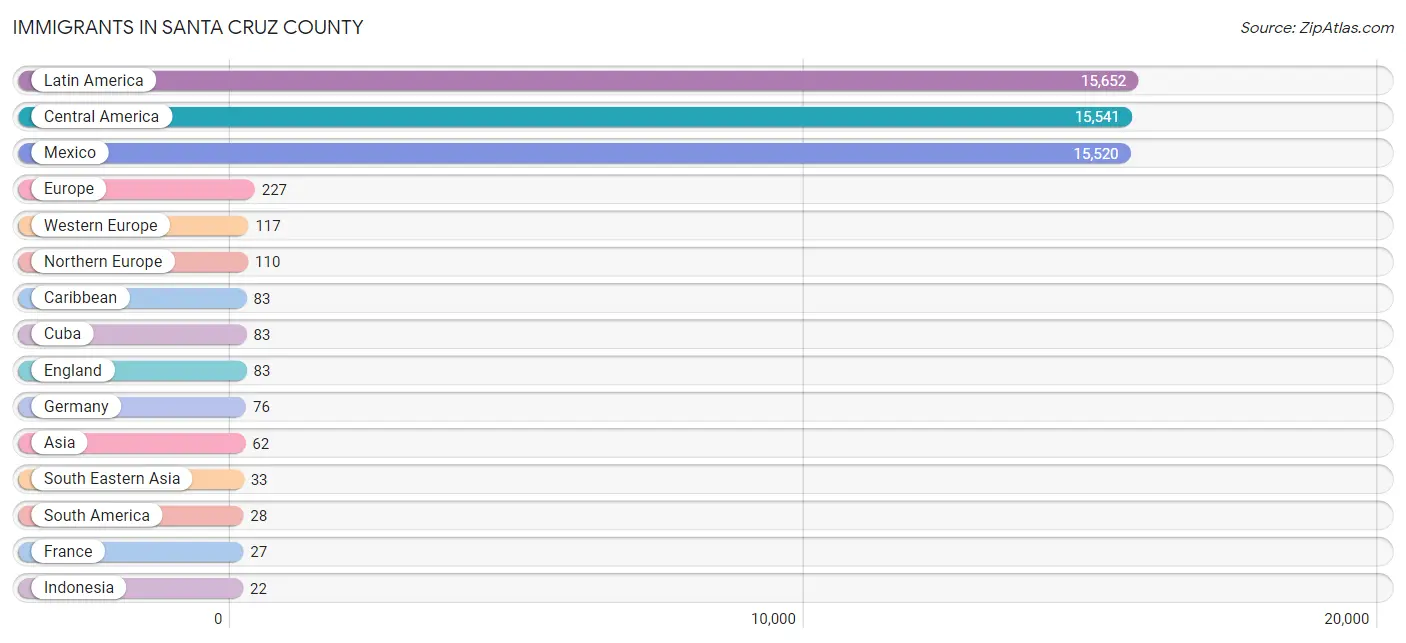
The most numerous immigrant groups reported in Santa Cruz County came from Latin America (15,652 | 32.7%), Central America (15,541 | 32.5%), Mexico (15,520 | 32.4%), Europe (227 | 0.5%), and Western Europe (117 | 0.2%), together accounting for 98.4% of all Santa Cruz County residents.
| Immigration Origin | # Population | % Population |
| Africa | 8 | 0.0% |
| Asia | 62 | 0.1% |
| Belgium | 14 | 0.0% |
| Bolivia | 5 | 0.0% |
| Brazil | 12 | 0.0% |
| Canada | 13 | 0.0% |
| Caribbean | 83 | 0.2% |
| Central America | 15,541 | 32.5% |
| China | 8 | 0.0% |
| Cuba | 83 | 0.2% |
| Eastern Africa | 5 | 0.0% |
| Eastern Asia | 9 | 0.0% |
| England | 83 | 0.2% |
| Ethiopia | 5 | 0.0% |
| Europe | 227 | 0.5% |
| France | 27 | 0.1% |
| Germany | 76 | 0.2% |
| Guatemala | 16 | 0.0% |
| India | 12 | 0.0% |
| Indonesia | 22 | 0.1% |
| Iran | 8 | 0.0% |
| Korea | 1 | 0.0% |
| Laos | 10 | 0.0% |
| Latin America | 15,652 | 32.7% |
| Mexico | 15,520 | 32.4% |
| Nicaragua | 5 | 0.0% |
| Northern Europe | 110 | 0.2% |
| Peru | 11 | 0.0% |
| Philippines | 1 | 0.0% |
| South Africa | 3 | 0.0% |
| South America | 28 | 0.1% |
| South Central Asia | 20 | 0.0% |
| South Eastern Asia | 33 | 0.1% |
| Western Europe | 117 | 0.2% | View All 34 Rows |
Sex and Age in Santa Cruz County
Sex and Age in Santa Cruz County
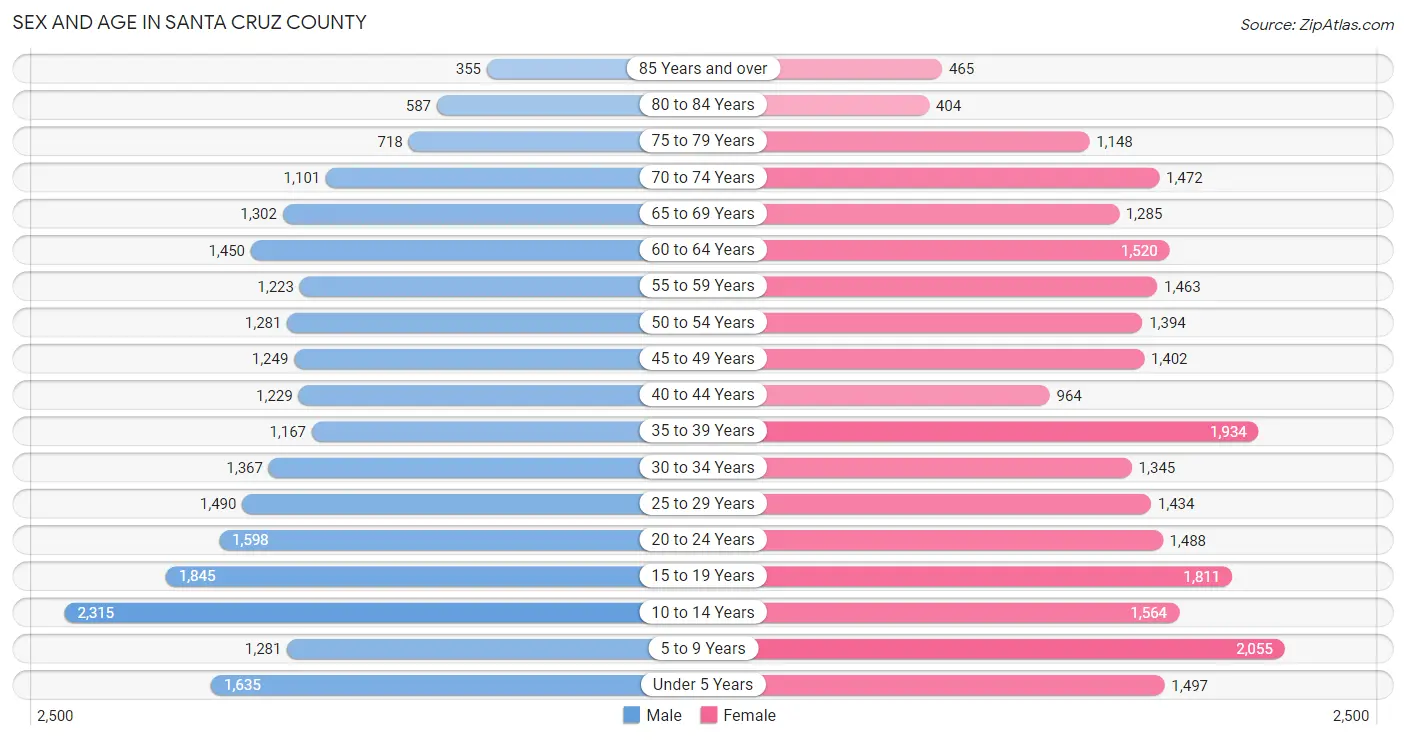
The most populous age groups in Santa Cruz County are 10 to 14 Years (2,315 | 10.0%) for men and 5 to 9 Years (2,055 | 8.3%) for women.
| Age Bracket | Male | Female |
| Under 5 Years | 1,635 (7.0%) | 1,497 (6.1%) |
| 5 to 9 Years | 1,281 (5.5%) | 2,055 (8.3%) |
| 10 to 14 Years | 2,315 (10.0%) | 1,564 (6.4%) |
| 15 to 19 Years | 1,845 (8.0%) | 1,811 (7.3%) |
| 20 to 24 Years | 1,598 (6.9%) | 1,488 (6.0%) |
| 25 to 29 Years | 1,490 (6.4%) | 1,434 (5.8%) |
| 30 to 34 Years | 1,367 (5.9%) | 1,345 (5.5%) |
| 35 to 39 Years | 1,167 (5.0%) | 1,934 (7.9%) |
| 40 to 44 Years | 1,229 (5.3%) | 964 (3.9%) |
| 45 to 49 Years | 1,249 (5.4%) | 1,402 (5.7%) |
| 50 to 54 Years | 1,281 (5.5%) | 1,394 (5.7%) |
| 55 to 59 Years | 1,223 (5.3%) | 1,463 (5.9%) |
| 60 to 64 Years | 1,450 (6.2%) | 1,520 (6.2%) |
| 65 to 69 Years | 1,302 (5.6%) | 1,285 (5.2%) |
| 70 to 74 Years | 1,101 (4.8%) | 1,472 (6.0%) |
| 75 to 79 Years | 718 (3.1%) | 1,148 (4.7%) |
| 80 to 84 Years | 587 (2.5%) | 404 (1.6%) |
| 85 Years and over | 355 (1.5%) | 465 (1.9%) |
| Total | 23,193 (100.0%) | 24,645 (100.0%) |
Families and Households in Santa Cruz County
Median Family Size in Santa Cruz County
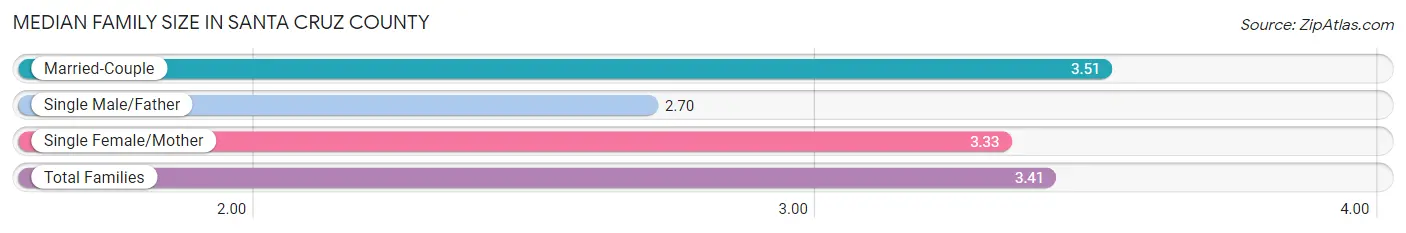
The median family size in Santa Cruz County is 3.41 persons per family, with married-couple families (8,490 | 69.9%) accounting for the largest median family size of 3.51 persons per family. On the other hand, single male/father families (885 | 7.3%) represent the smallest median family size with 2.70 persons per family.
| Family Type | # Families | Family Size |
| Married-Couple | 8,490 (69.9%) | 3.51 |
| Single Male/Father | 885 (7.3%) | 2.70 |
| Single Female/Mother | 2,766 (22.8%) | 3.33 |
| Total Families | 12,141 (100.0%) | 3.41 |
Median Household Size in Santa Cruz County
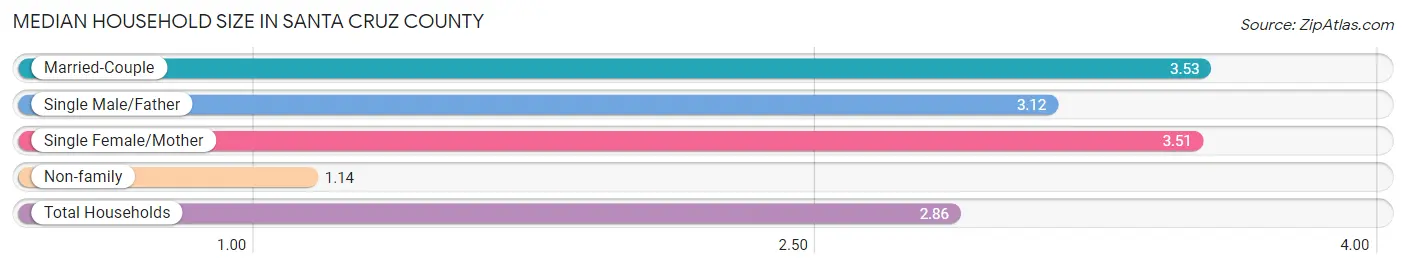
The median household size in Santa Cruz County is 2.86 persons per household, with married-couple households (8,490 | 51.0%) accounting for the largest median household size of 3.53 persons per household. non-family households (4,510 | 27.1%) represent the smallest median household size with 1.14 persons per household.
| Household Type | # Households | Household Size |
| Married-Couple | 8,490 (51.0%) | 3.53 |
| Single Male/Father | 885 (5.3%) | 3.12 |
| Single Female/Mother | 2,766 (16.6%) | 3.51 |
| Non-family | 4,510 (27.1%) | 1.14 |
| Total Households | 16,651 (100.0%) | 2.86 |
Household Size by Marriage Status in Santa Cruz County
Out of a total of 16,651 households in Santa Cruz County, 12,141 (72.9%) are family households, while 4,510 (27.1%) are nonfamily households. The most numerous type of family households are 2-person households, comprising 4,477, and the most common type of nonfamily households are 1-person households, comprising 3,927.
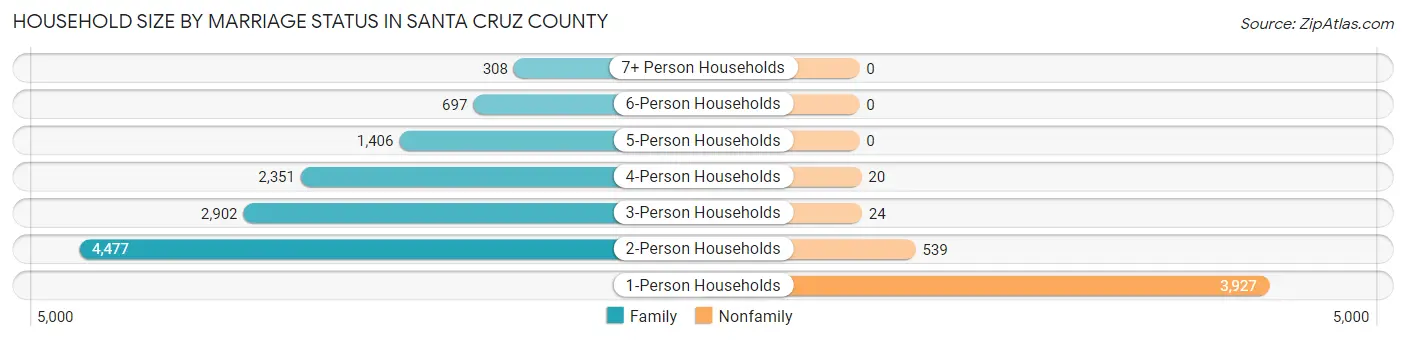
| Household Size | Family Households | Nonfamily Households |
| 1-Person Households | - | 3,927 (23.6%) |
| 2-Person Households | 4,477 (26.9%) | 539 (3.2%) |
| 3-Person Households | 2,902 (17.4%) | 24 (0.1%) |
| 4-Person Households | 2,351 (14.1%) | 20 (0.1%) |
| 5-Person Households | 1,406 (8.4%) | 0 (0.0%) |
| 6-Person Households | 697 (4.2%) | 0 (0.0%) |
| 7+ Person Households | 308 (1.8%) | 0 (0.0%) |
| Total | 12,141 (72.9%) | 4,510 (27.1%) |
Female Fertility in Santa Cruz County
Fertility by Age in Santa Cruz County
Average fertility rate in Santa Cruz County is 54.0 births per 1,000 women. Women in the age bracket of 20 to 34 years have the highest fertility rate with 120.0 births per 1,000 women. Women in the age bracket of 20 to 34 years acount for 88.9% of all women with births.
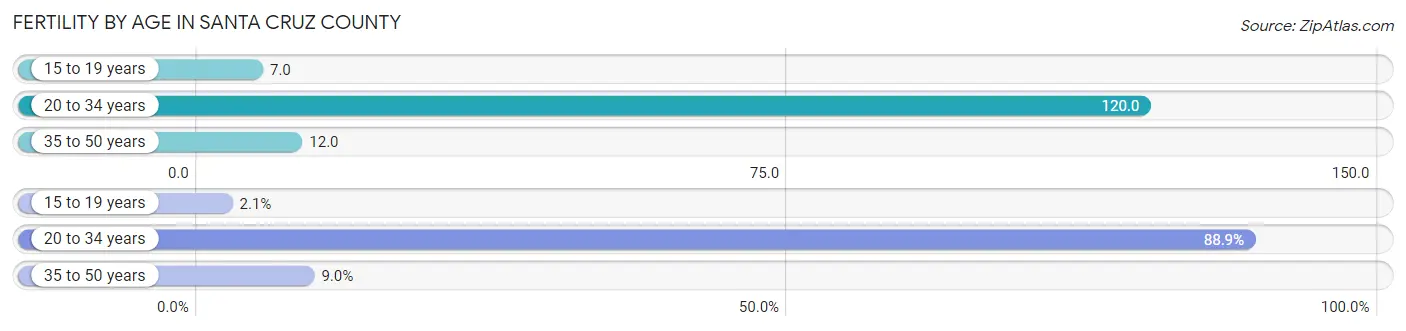
| Age Bracket | Women with Births | Births / 1,000 Women |
| 15 to 19 years | 12 (2.1%) | 7.0 |
| 20 to 34 years | 512 (88.9%) | 120.0 |
| 35 to 50 years | 52 (9.0%) | 12.0 |
| Total | 576 (100.0%) | 54.0 |
Fertility by Age by Marriage Status in Santa Cruz County
45.7% of women with births (576) in Santa Cruz County are married. The highest percentage of unmarried women with births falls into 20 to 34 years age bracket with 61.1% of them unmarried at the time of birth, while the lowest percentage of unmarried women with births belong to 15 to 19 years age bracket with 0.0% of them unmarried.
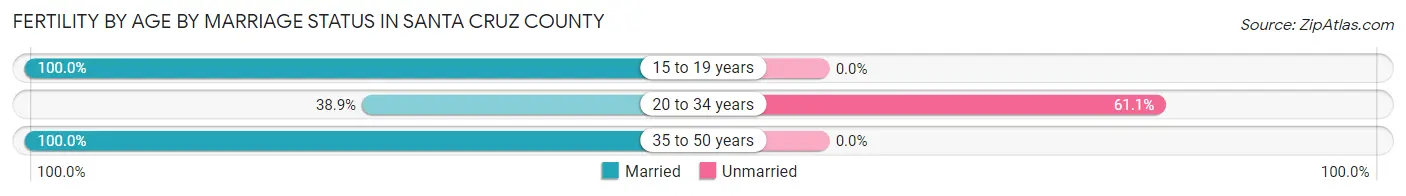
| Age Bracket | Married | Unmarried |
| 15 to 19 years | 12 (100.0%) | 0 (0.0%) |
| 20 to 34 years | 199 (38.9%) | 313 (61.1%) |
| 35 to 50 years | 52 (100.0%) | 0 (0.0%) |
| Total | 263 (45.7%) | 313 (54.3%) |
Fertility by Education in Santa Cruz County
Average fertility rate in Santa Cruz County is 54.0 births per 1,000 women. Women with the education attainment of college or associate's degree have the highest fertility rate of 99.0 births per 1,000 women, while women with the education attainment of high school diploma have the lowest fertility at 28.0 births per 1,000 women. Women with the education attainment of college or associate's degree represent 60.4% of all women with births.
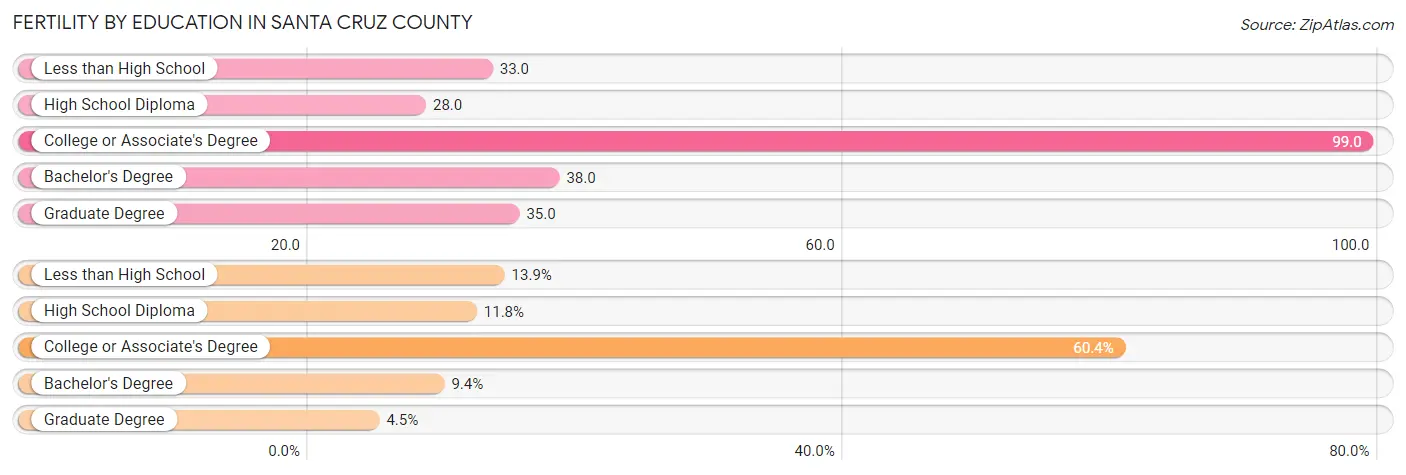
| Educational Attainment | Women with Births | Births / 1,000 Women |
| Less than High School | 80 (13.9%) | 33.0 |
| High School Diploma | 68 (11.8%) | 28.0 |
| College or Associate's Degree | 348 (60.4%) | 99.0 |
| Bachelor's Degree | 54 (9.4%) | 38.0 |
| Graduate Degree | 26 (4.5%) | 35.0 |
| Total | 576 (100.0%) | 54.0 |
Fertility by Education by Marriage Status in Santa Cruz County
54.3% of women with births in Santa Cruz County are unmarried. Women with the educational attainment of bachelor's degree are most likely to be married with 100.0% of them married at childbirth, while women with the educational attainment of high school diploma are least likely to be married with 94.1% of them unmarried at childbirth.
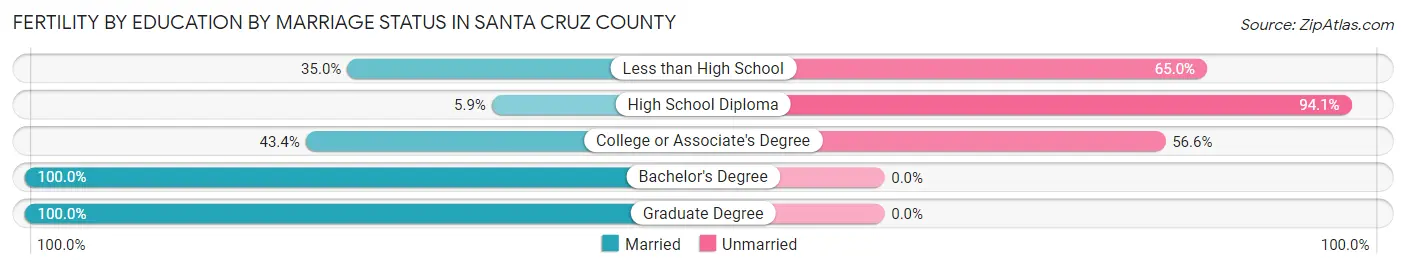
| Educational Attainment | Married | Unmarried |
| Less than High School | 28 (35.0%) | 52 (65.0%) |
| High School Diploma | 4 (5.9%) | 64 (94.1%) |
| College or Associate's Degree | 151 (43.4%) | 197 (56.6%) |
| Bachelor's Degree | 54 (100.0%) | 0 (0.0%) |
| Graduate Degree | 26 (100.0%) | 0 (0.0%) |
| Total | 263 (45.7%) | 313 (54.3%) |
Employment Characteristics in Santa Cruz County
Employment by Class of Employer in Santa Cruz County
Among the 18,616 employed individuals in Santa Cruz County, private company employees (10,786 | 57.9%), local government employees (2,015 | 10.8%), and not-for-profit organizations (1,901 | 10.2%) make up the most common classes of employment.
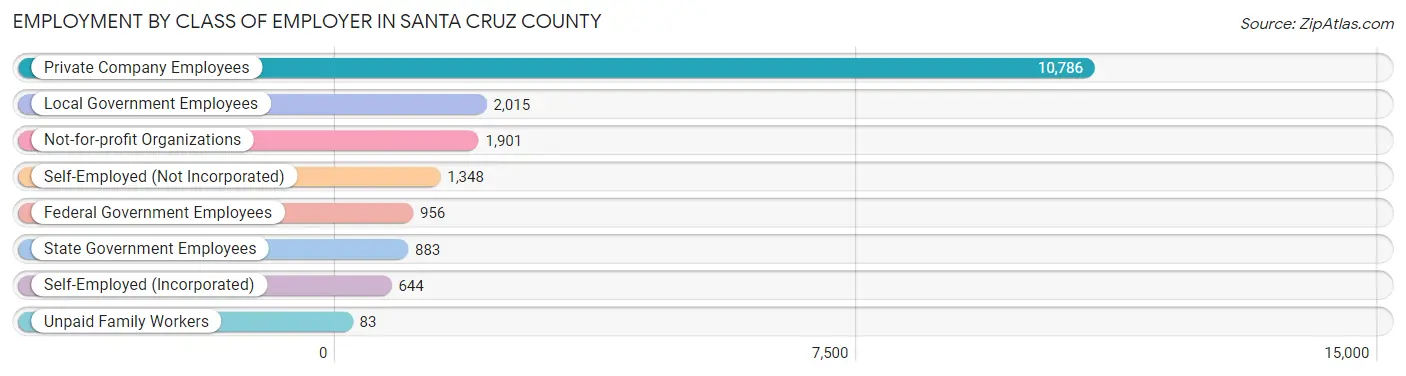
| Employer Class | # Employees | % Employees |
| Private Company Employees | 10,786 | 57.9% |
| Self-Employed (Incorporated) | 644 | 3.5% |
| Self-Employed (Not Incorporated) | 1,348 | 7.2% |
| Not-for-profit Organizations | 1,901 | 10.2% |
| Local Government Employees | 2,015 | 10.8% |
| State Government Employees | 883 | 4.7% |
| Federal Government Employees | 956 | 5.1% |
| Unpaid Family Workers | 83 | 0.4% |
| Total | 18,616 | 100.0% |
Employment Status by Age in Santa Cruz County
According to the labor force statistics for Santa Cruz County, out of the total population over 16 years of age (36,907), 57.2% or 21,111 individuals are in the labor force, with 9.8% or 2,069 of them unemployed. The age group with the highest labor force participation rate is 25 to 29 years, with 78.8% or 2,304 individuals in the labor force. Within the labor force, the 16 to 19 years age range has the highest percentage of unemployed individuals, with 37.9% or 390 of them being unemployed.
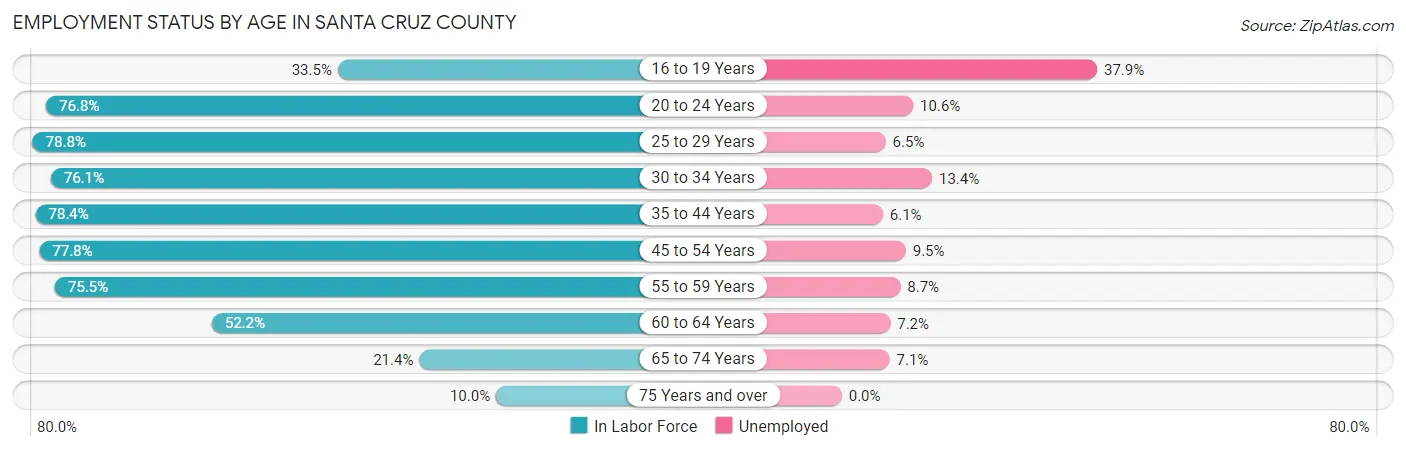
| Age Bracket | In Labor Force | Unemployed |
| 16 to 19 Years | 1,029 (33.5%) | 390 (37.9%) |
| 20 to 24 Years | 2,370 (76.8%) | 251 (10.6%) |
| 25 to 29 Years | 2,304 (78.8%) | 150 (6.5%) |
| 30 to 34 Years | 2,064 (76.1%) | 277 (13.4%) |
| 35 to 44 Years | 4,150 (78.4%) | 253 (6.1%) |
| 45 to 54 Years | 4,144 (77.8%) | 394 (9.5%) |
| 55 to 59 Years | 2,028 (75.5%) | 176 (8.7%) |
| 60 to 64 Years | 1,550 (52.2%) | 112 (7.2%) |
| 65 to 74 Years | 1,104 (21.4%) | 78 (7.1%) |
| 75 Years and over | 368 (10.0%) | 0 (0.0%) |
| Total | 21,111 (57.2%) | 2,069 (9.8%) |
Employment Status by Educational Attainment in Santa Cruz County
According to labor force statistics for Santa Cruz County, 74.1% of individuals (16,237) out of the total population between 25 and 64 years of age (21,912) are in the labor force, with 8.4% or 1,364 of them being unemployed. The group with the highest labor force participation rate are those with the educational attainment of bachelor's degree or higher, with 81.8% or 4,047 individuals in the labor force. Within the labor force, individuals with high school diploma education have the highest percentage of unemployment, with 14.1% or 652 of them being unemployed.
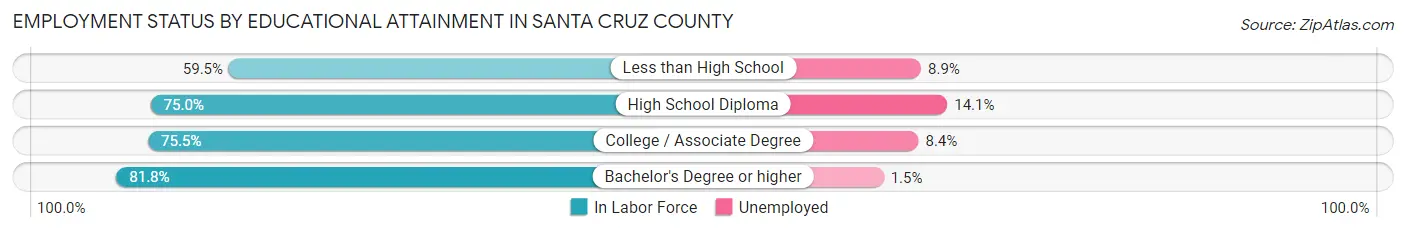
| Educational Attainment | In Labor Force | Unemployed |
| Less than High School | 2,182 (59.5%) | 326 (8.9%) |
| High School Diploma | 4,622 (75.0%) | 869 (14.1%) |
| College / Associate Degree | 5,387 (75.5%) | 599 (8.4%) |
| Bachelor's Degree or higher | 4,047 (81.8%) | 74 (1.5%) |
| Total | 16,237 (74.1%) | 1,841 (8.4%) |
Employment Occupations by Sex in Santa Cruz County
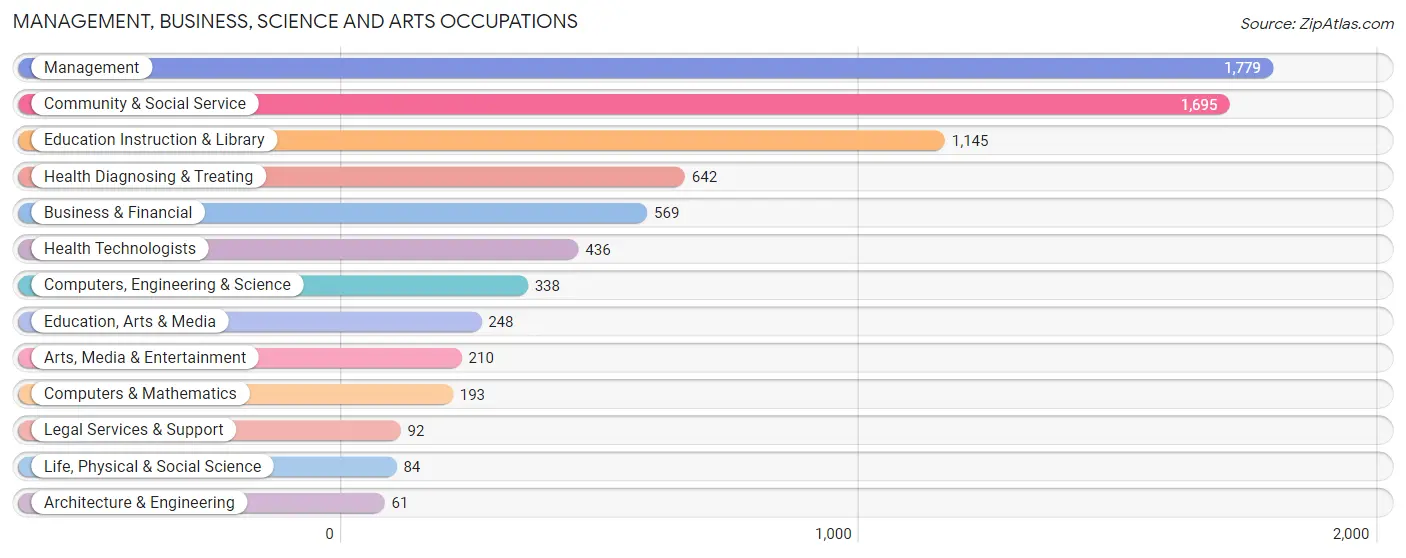
Management, Business, Science and Arts Occupations
The most common Management, Business, Science and Arts occupations in Santa Cruz County are Management (1,779 | 9.4%), Community & Social Service (1,695 | 8.9%), Education Instruction & Library (1,145 | 6.0%), Health Diagnosing & Treating (642 | 3.4%), and Business & Financial (569 | 3.0%).
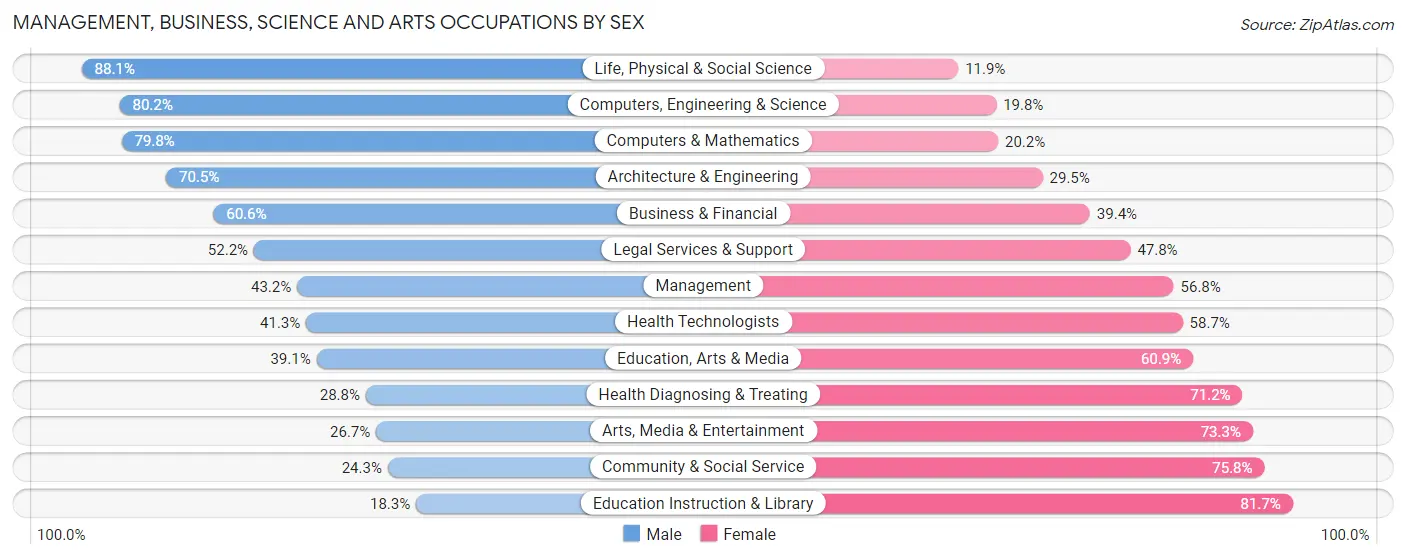
Management, Business, Science and Arts Occupations by Sex
Within the Management, Business, Science and Arts occupations in Santa Cruz County, the most male-oriented occupations are Life, Physical & Social Science (88.1%), Computers, Engineering & Science (80.2%), and Computers & Mathematics (79.8%), while the most female-oriented occupations are Education Instruction & Library (81.7%), Community & Social Service (75.7%), and Arts, Media & Entertainment (73.3%).
| Occupation | Male | Female |
| Management | 768 (43.2%) | 1,011 (56.8%) |
| Business & Financial | 345 (60.6%) | 224 (39.4%) |
| Computers, Engineering & Science | 271 (80.2%) | 67 (19.8%) |
| Computers & Mathematics | 154 (79.8%) | 39 (20.2%) |
| Architecture & Engineering | 43 (70.5%) | 18 (29.5%) |
| Life, Physical & Social Science | 74 (88.1%) | 10 (11.9%) |
| Community & Social Service | 411 (24.2%) | 1,284 (75.7%) |
| Education, Arts & Media | 97 (39.1%) | 151 (60.9%) |
| Legal Services & Support | 48 (52.2%) | 44 (47.8%) |
| Education Instruction & Library | 210 (18.3%) | 935 (81.7%) |
| Arts, Media & Entertainment | 56 (26.7%) | 154 (73.3%) |
| Health Diagnosing & Treating | 185 (28.8%) | 457 (71.2%) |
| Health Technologists | 180 (41.3%) | 256 (58.7%) |
| Total (Category) | 1,980 (39.4%) | 3,043 (60.6%) |
| Total (Overall) | 10,248 (54.0%) | 8,742 (46.0%) |
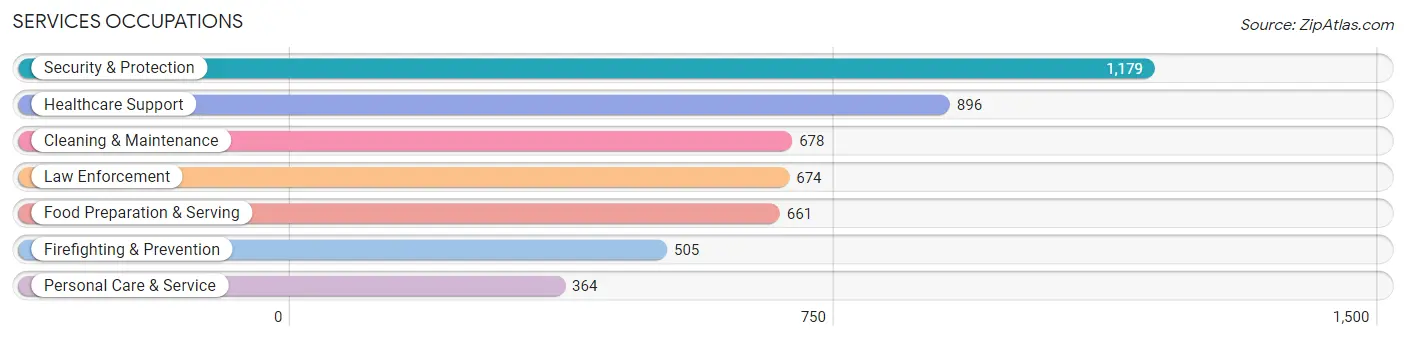
Services Occupations
The most common Services occupations in Santa Cruz County are Security & Protection (1,179 | 6.2%), Healthcare Support (896 | 4.7%), Cleaning & Maintenance (678 | 3.6%), Law Enforcement (674 | 3.5%), and Food Preparation & Serving (661 | 3.5%).
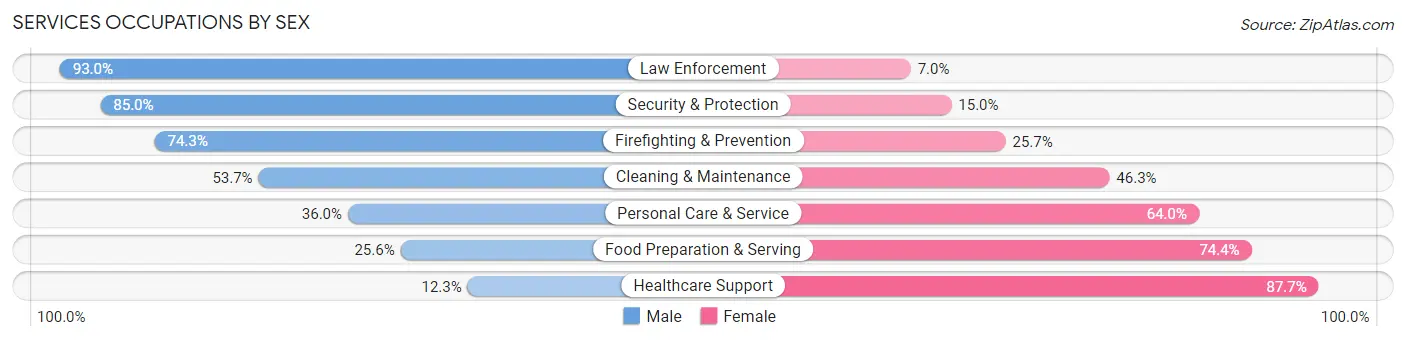
Services Occupations by Sex
Within the Services occupations in Santa Cruz County, the most male-oriented occupations are Law Enforcement (93.0%), Security & Protection (85.0%), and Firefighting & Prevention (74.3%), while the most female-oriented occupations are Healthcare Support (87.7%), Food Preparation & Serving (74.4%), and Personal Care & Service (64.0%).
| Occupation | Male | Female |
| Healthcare Support | 110 (12.3%) | 786 (87.7%) |
| Security & Protection | 1,002 (85.0%) | 177 (15.0%) |
| Firefighting & Prevention | 375 (74.3%) | 130 (25.7%) |
| Law Enforcement | 627 (93.0%) | 47 (7.0%) |
| Food Preparation & Serving | 169 (25.6%) | 492 (74.4%) |
| Cleaning & Maintenance | 364 (53.7%) | 314 (46.3%) |
| Personal Care & Service | 131 (36.0%) | 233 (64.0%) |
| Total (Category) | 1,776 (47.0%) | 2,002 (53.0%) |
| Total (Overall) | 10,248 (54.0%) | 8,742 (46.0%) |
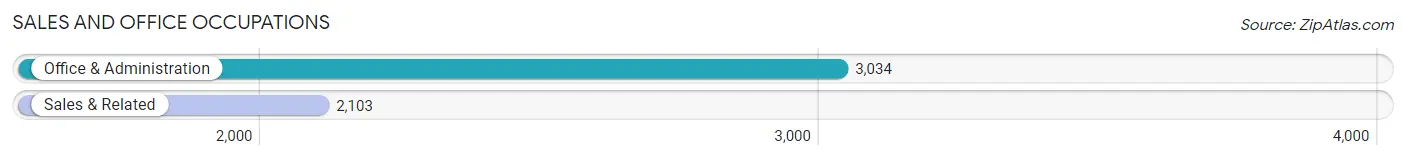
Sales and Office Occupations
The most common Sales and Office occupations in Santa Cruz County are Office & Administration (3,034 | 16.0%), and Sales & Related (2,103 | 11.1%).
Sales and Office Occupations by Sex
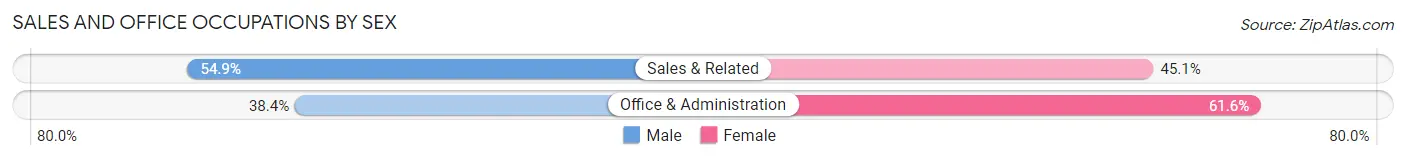
| Occupation | Male | Female |
| Sales & Related | 1,155 (54.9%) | 948 (45.1%) |
| Office & Administration | 1,165 (38.4%) | 1,869 (61.6%) |
| Total (Category) | 2,320 (45.2%) | 2,817 (54.8%) |
| Total (Overall) | 10,248 (54.0%) | 8,742 (46.0%) |
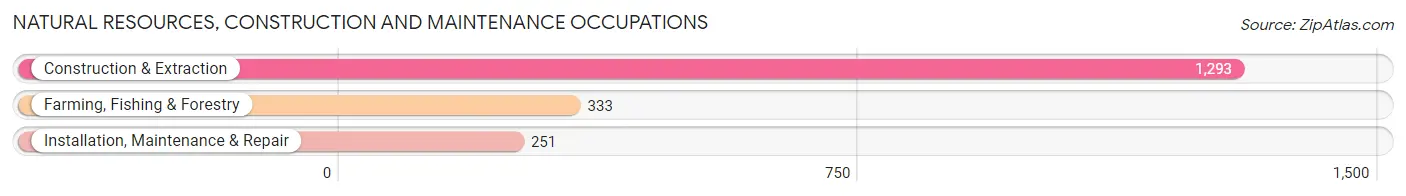
Natural Resources, Construction and Maintenance Occupations
The most common Natural Resources, Construction and Maintenance occupations in Santa Cruz County are Construction & Extraction (1,293 | 6.8%), Farming, Fishing & Forestry (333 | 1.8%), and Installation, Maintenance & Repair (251 | 1.3%).
Natural Resources, Construction and Maintenance Occupations by Sex
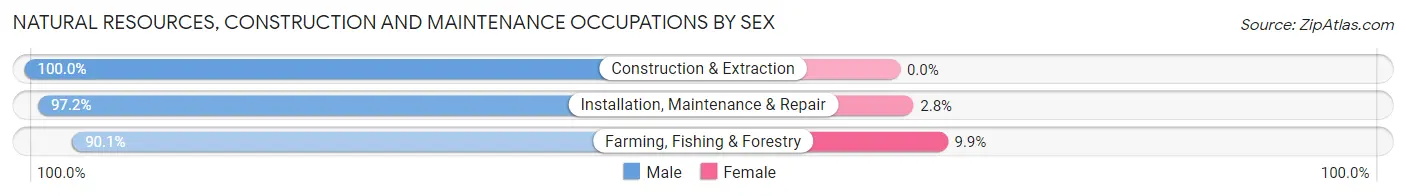
| Occupation | Male | Female |
| Farming, Fishing & Forestry | 300 (90.1%) | 33 (9.9%) |
| Construction & Extraction | 1,293 (100.0%) | 0 (0.0%) |
| Installation, Maintenance & Repair | 244 (97.2%) | 7 (2.8%) |
| Total (Category) | 1,837 (97.9%) | 40 (2.1%) |
| Total (Overall) | 10,248 (54.0%) | 8,742 (46.0%) |
Production, Transportation and Moving Occupations
The most common Production, Transportation and Moving occupations in Santa Cruz County are Material Moving (1,494 | 7.9%), Transportation (1,156 | 6.1%), and Production (525 | 2.8%).
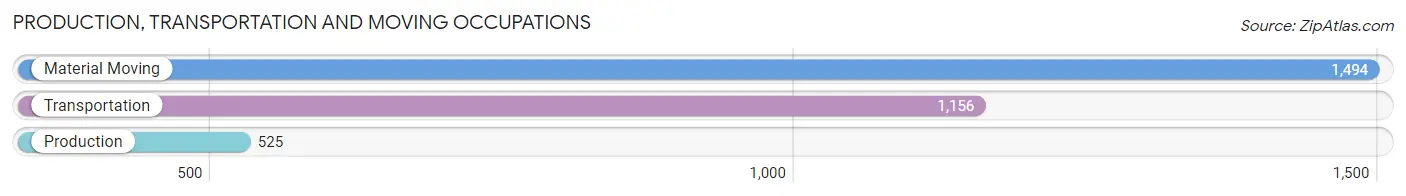
Production, Transportation and Moving Occupations by Sex
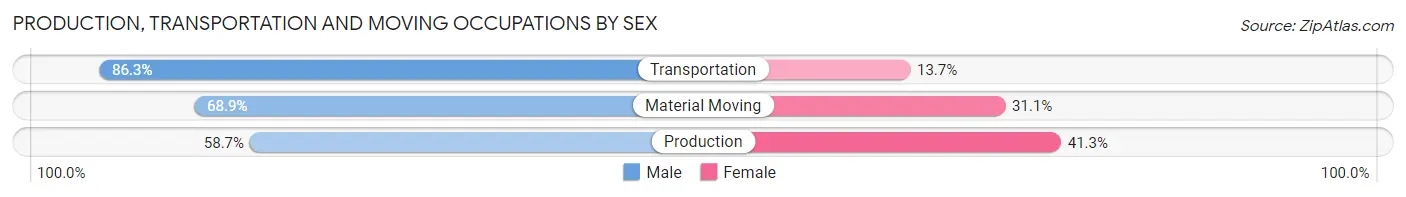
| Occupation | Male | Female |
| Production | 308 (58.7%) | 217 (41.3%) |
| Transportation | 998 (86.3%) | 158 (13.7%) |
| Material Moving | 1,029 (68.9%) | 465 (31.1%) |
| Total (Category) | 2,335 (73.5%) | 840 (26.5%) |
| Total (Overall) | 10,248 (54.0%) | 8,742 (46.0%) |
Employment Industries by Sex in Santa Cruz County
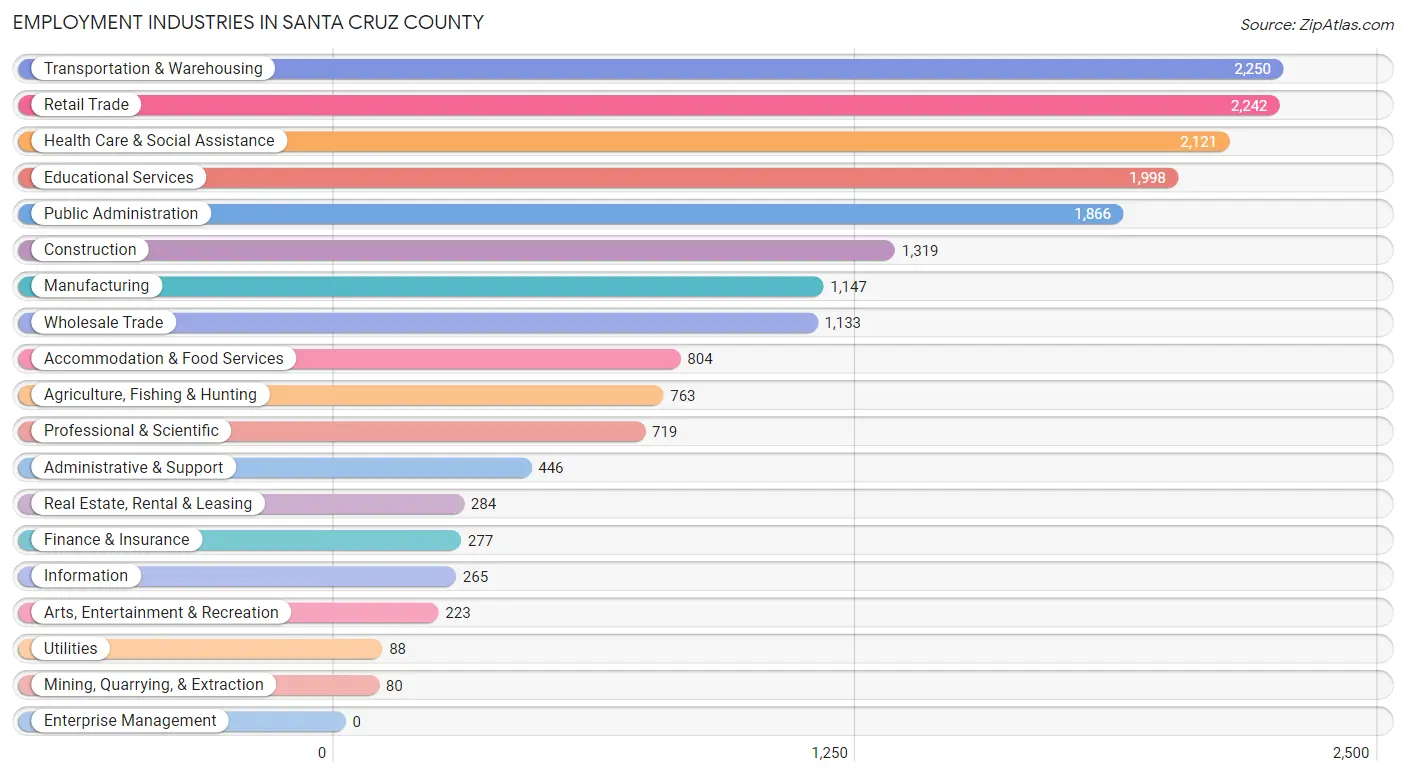
Employment Industries in Santa Cruz County
The major employment industries in Santa Cruz County include Transportation & Warehousing (2,250 | 11.8%), Retail Trade (2,242 | 11.8%), Health Care & Social Assistance (2,121 | 11.2%), Educational Services (1,998 | 10.5%), and Public Administration (1,866 | 9.8%).
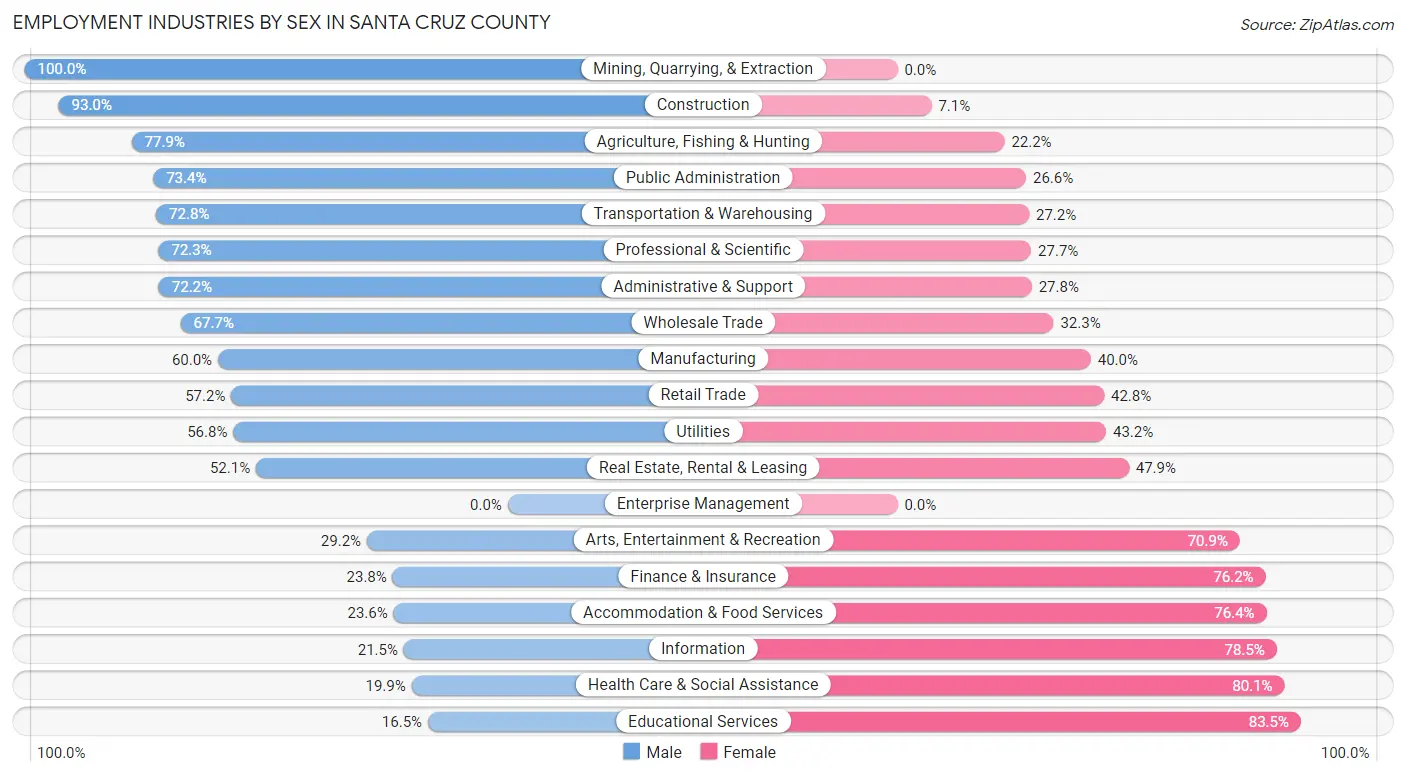
Employment Industries by Sex in Santa Cruz County
The Santa Cruz County industries that see more men than women are Mining, Quarrying, & Extraction (100.0%), Construction (92.9%), and Agriculture, Fishing & Hunting (77.8%), whereas the industries that tend to have a higher number of women are Educational Services (83.5%), Health Care & Social Assistance (80.1%), and Information (78.5%).
| Industry | Male | Female |
| Agriculture, Fishing & Hunting | 594 (77.8%) | 169 (22.2%) |
| Mining, Quarrying, & Extraction | 80 (100.0%) | 0 (0.0%) |
| Construction | 1,226 (92.9%) | 93 (7.0%) |
| Manufacturing | 688 (60.0%) | 459 (40.0%) |
| Wholesale Trade | 767 (67.7%) | 366 (32.3%) |
| Retail Trade | 1,283 (57.2%) | 959 (42.8%) |
| Transportation & Warehousing | 1,637 (72.8%) | 613 (27.2%) |
| Utilities | 50 (56.8%) | 38 (43.2%) |
| Information | 57 (21.5%) | 208 (78.5%) |
| Finance & Insurance | 66 (23.8%) | 211 (76.2%) |
| Real Estate, Rental & Leasing | 148 (52.1%) | 136 (47.9%) |
| Professional & Scientific | 520 (72.3%) | 199 (27.7%) |
| Enterprise Management | 0 (0.0%) | 0 (0.0%) |
| Administrative & Support | 322 (72.2%) | 124 (27.8%) |
| Educational Services | 330 (16.5%) | 1,668 (83.5%) |
| Health Care & Social Assistance | 422 (19.9%) | 1,699 (80.1%) |
| Arts, Entertainment & Recreation | 65 (29.1%) | 158 (70.9%) |
| Accommodation & Food Services | 190 (23.6%) | 614 (76.4%) |
| Public Administration | 1,369 (73.4%) | 497 (26.6%) |
| Total | 10,248 (54.0%) | 8,742 (46.0%) |
Education in Santa Cruz County
School Enrollment in Santa Cruz County
The most common levels of schooling among the 11,484 students in Santa Cruz County are middle school (3,179 | 27.7%), high school (3,013 | 26.2%), and elementary school (2,124 | 18.5%).
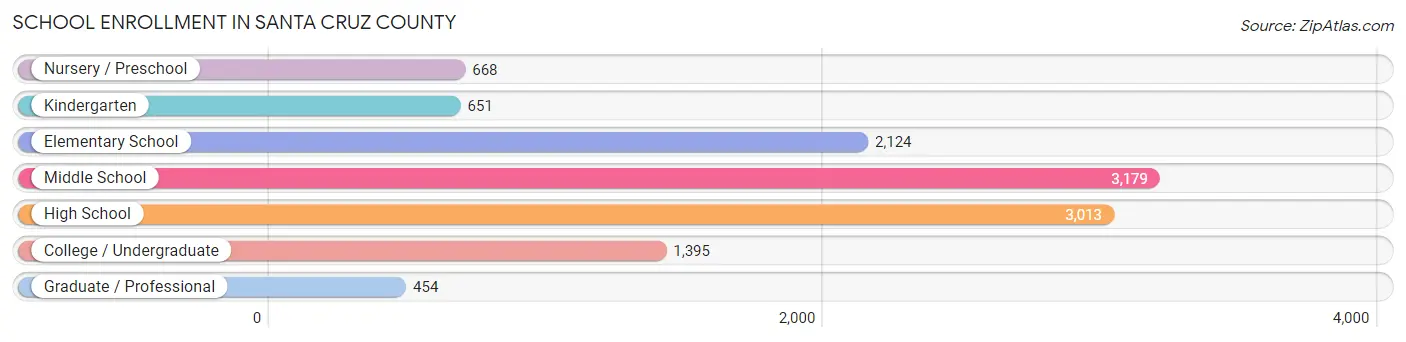
| School Level | # Students | % Students |
| Nursery / Preschool | 668 | 5.8% |
| Kindergarten | 651 | 5.7% |
| Elementary School | 2,124 | 18.5% |
| Middle School | 3,179 | 27.7% |
| High School | 3,013 | 26.2% |
| College / Undergraduate | 1,395 | 12.1% |
| Graduate / Professional | 454 | 4.0% |
| Total | 11,484 | 100.0% |
School Enrollment by Age by Funding Source in Santa Cruz County
Out of a total of 11,484 students who are enrolled in schools in Santa Cruz County, 988 (8.6%) attend a private institution, while the remaining 10,496 (91.4%) are enrolled in public schools. The age group of 3 to 4 year olds has the highest likelihood of being enrolled in private schools, with 163 (56.6% in the age bracket) enrolled. Conversely, the age group of 15 to 17 year olds has the lowest likelihood of being enrolled in a private school, with 2,107 (98.3% in the age bracket) attending a public institution.
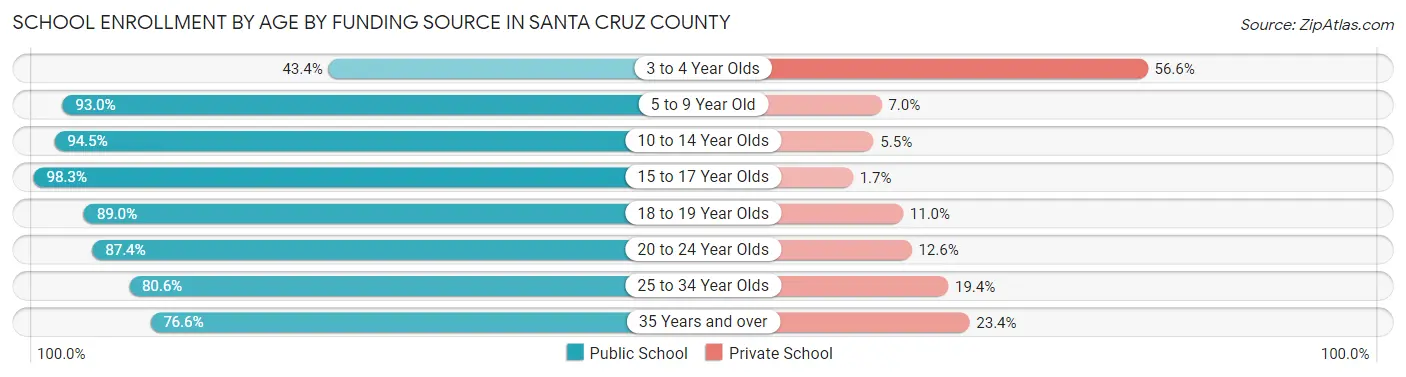
| Age Bracket | Public School | Private School |
| 3 to 4 Year Olds | 125 (43.4%) | 163 (56.6%) |
| 5 to 9 Year Old | 2,867 (93.0%) | 217 (7.0%) |
| 10 to 14 Year Olds | 3,374 (94.5%) | 198 (5.5%) |
| 15 to 17 Year Olds | 2,107 (98.3%) | 36 (1.7%) |
| 18 to 19 Year Olds | 750 (89.0%) | 93 (11.0%) |
| 20 to 24 Year Olds | 567 (87.4%) | 82 (12.6%) |
| 25 to 34 Year Olds | 261 (80.6%) | 63 (19.4%) |
| 35 Years and over | 445 (76.6%) | 136 (23.4%) |
| Total | 10,496 (91.4%) | 988 (8.6%) |
Educational Attainment by Field of Study in Santa Cruz County
Business (1,645 | 21.6%), education (1,430 | 18.8%), science & technology (664 | 8.7%), engineering (659 | 8.7%), and liberal arts & history (628 | 8.3%) are the most common fields of study among 7,602 individuals in Santa Cruz County who have obtained a bachelor's degree or higher.
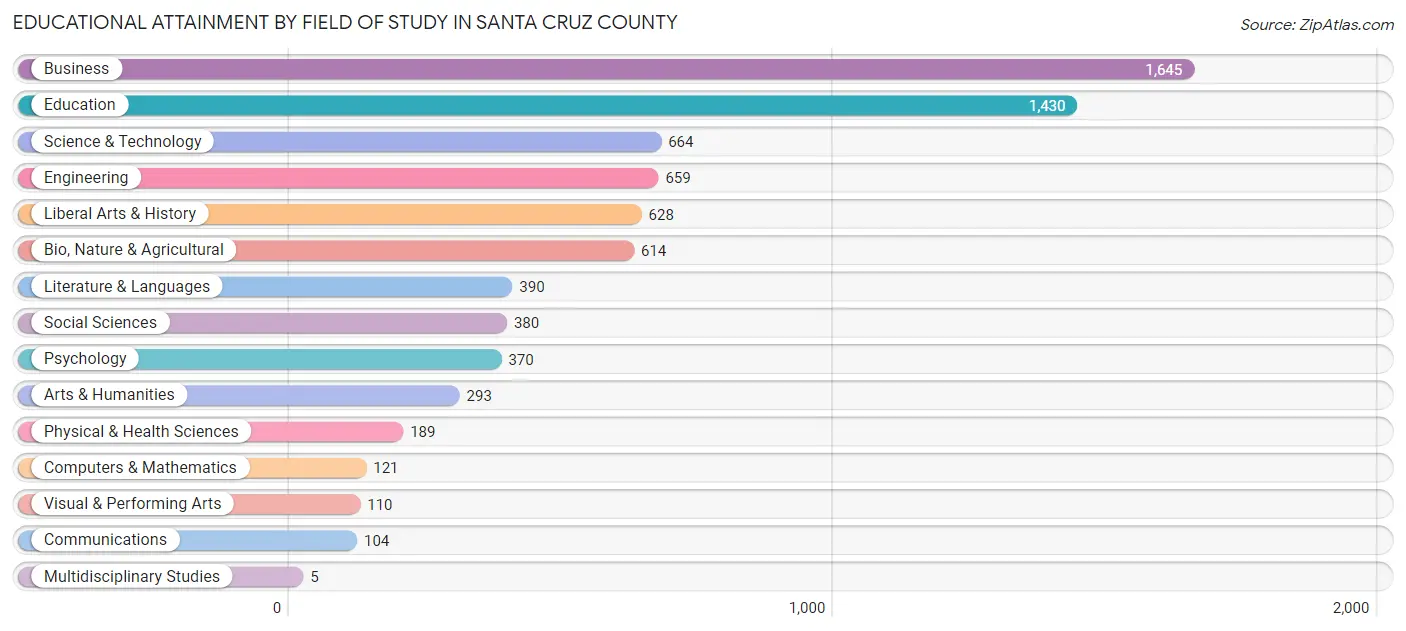
| Field of Study | # Graduates | % Graduates |
| Computers & Mathematics | 121 | 1.6% |
| Bio, Nature & Agricultural | 614 | 8.1% |
| Physical & Health Sciences | 189 | 2.5% |
| Psychology | 370 | 4.9% |
| Social Sciences | 380 | 5.0% |
| Engineering | 659 | 8.7% |
| Multidisciplinary Studies | 5 | 0.1% |
| Science & Technology | 664 | 8.7% |
| Business | 1,645 | 21.6% |
| Education | 1,430 | 18.8% |
| Literature & Languages | 390 | 5.1% |
| Liberal Arts & History | 628 | 8.3% |
| Visual & Performing Arts | 110 | 1.5% |
| Communications | 104 | 1.4% |
| Arts & Humanities | 293 | 3.8% |
| Total | 7,602 | 100.0% |
Transportation & Commute in Santa Cruz County
Vehicle Availability by Sex in Santa Cruz County
The most prevalent vehicle ownership categories in Santa Cruz County are males with 2 vehicles (3,526, accounting for 34.9%) and females with 2 vehicles (3,110, making up 41.7%).
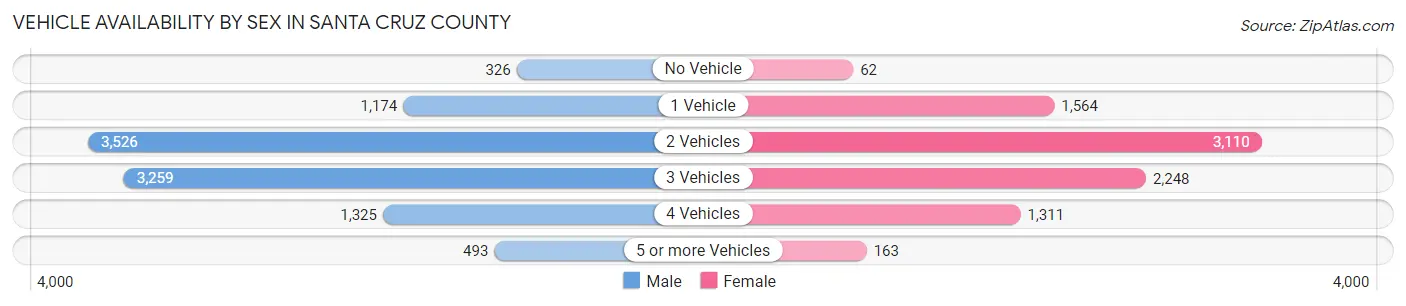
| Vehicles Available | Male | Female |
| No Vehicle | 326 (3.2%) | 62 (0.7%) |
| 1 Vehicle | 1,174 (11.6%) | 1,564 (18.5%) |
| 2 Vehicles | 3,526 (34.9%) | 3,110 (36.8%) |
| 3 Vehicles | 3,259 (32.3%) | 2,248 (26.6%) |
| 4 Vehicles | 1,325 (13.1%) | 1,311 (15.5%) |
| 5 or more Vehicles | 493 (4.9%) | 163 (1.9%) |
| Total | 10,103 (100.0%) | 8,458 (100.0%) |
Commute Time in Santa Cruz County
The most frequently occuring commute durations in Santa Cruz County are 15 to 19 minutes (4,302 commuters, 24.5%), 10 to 14 minutes (3,697 commuters, 21.1%), and 20 to 24 minutes (2,746 commuters, 15.7%).
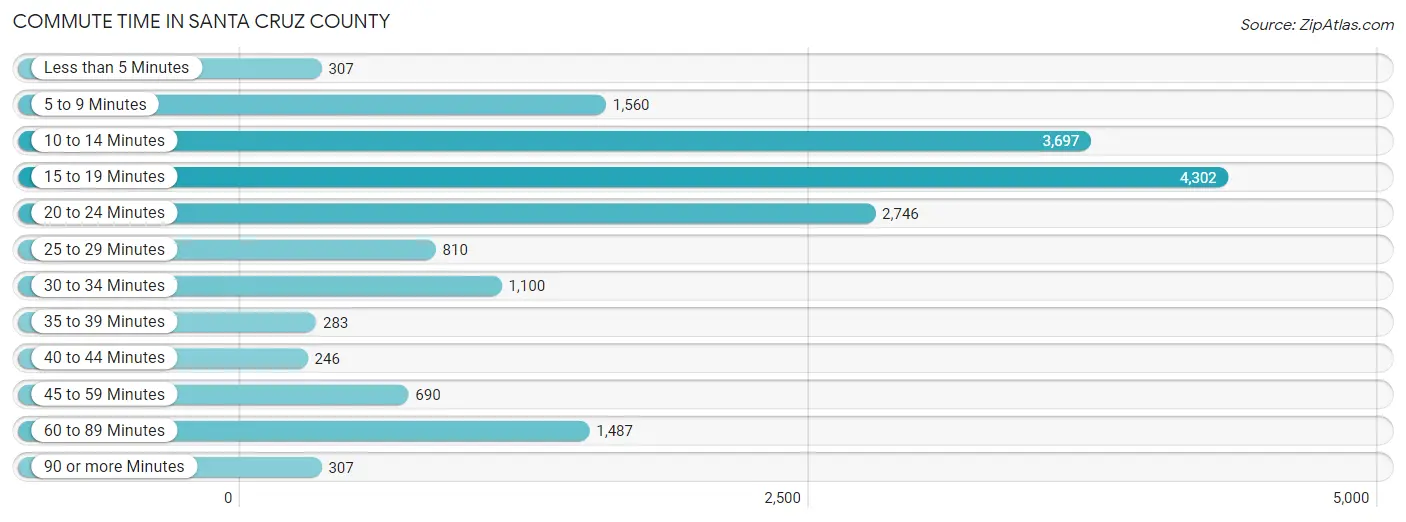
| Commute Time | # Commuters | % Commuters |
| Less than 5 Minutes | 307 | 1.8% |
| 5 to 9 Minutes | 1,560 | 8.9% |
| 10 to 14 Minutes | 3,697 | 21.1% |
| 15 to 19 Minutes | 4,302 | 24.5% |
| 20 to 24 Minutes | 2,746 | 15.7% |
| 25 to 29 Minutes | 810 | 4.6% |
| 30 to 34 Minutes | 1,100 | 6.3% |
| 35 to 39 Minutes | 283 | 1.6% |
| 40 to 44 Minutes | 246 | 1.4% |
| 45 to 59 Minutes | 690 | 3.9% |
| 60 to 89 Minutes | 1,487 | 8.5% |
| 90 or more Minutes | 307 | 1.8% |
Commute Time by Sex in Santa Cruz County
The most common commute times in Santa Cruz County are 15 to 19 minutes (2,238 commuters, 22.9%) for males and 15 to 19 minutes (2,064 commuters, 26.5%) for females.
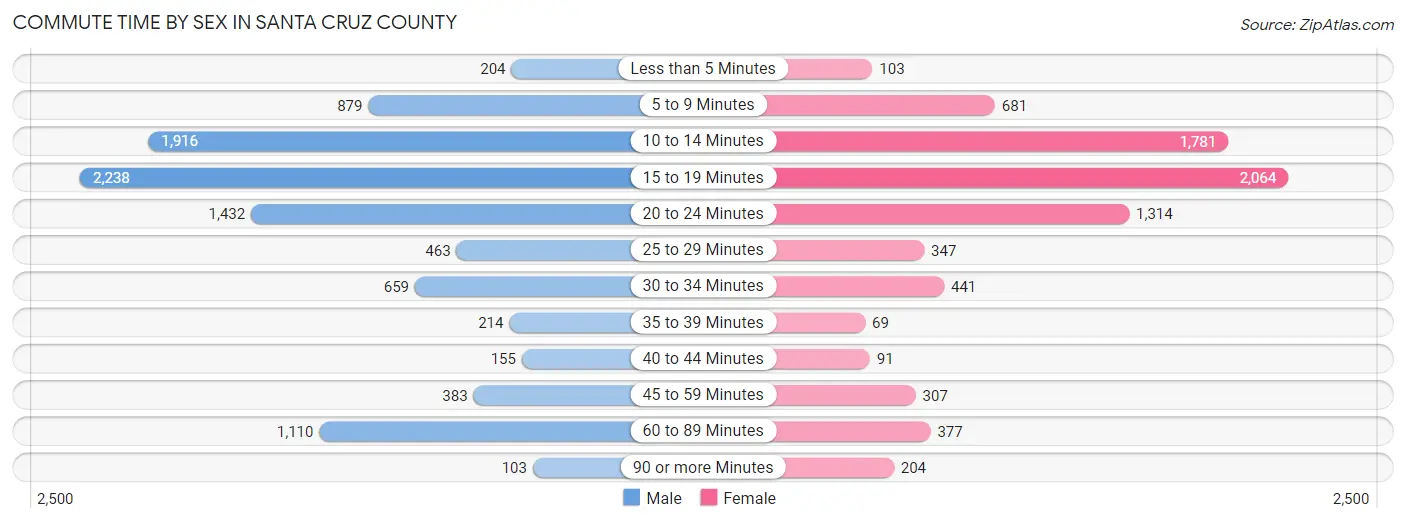
| Commute Time | Male | Female |
| Less than 5 Minutes | 204 (2.1%) | 103 (1.3%) |
| 5 to 9 Minutes | 879 (9.0%) | 681 (8.7%) |
| 10 to 14 Minutes | 1,916 (19.6%) | 1,781 (22.9%) |
| 15 to 19 Minutes | 2,238 (22.9%) | 2,064 (26.5%) |
| 20 to 24 Minutes | 1,432 (14.7%) | 1,314 (16.9%) |
| 25 to 29 Minutes | 463 (4.8%) | 347 (4.5%) |
| 30 to 34 Minutes | 659 (6.8%) | 441 (5.7%) |
| 35 to 39 Minutes | 214 (2.2%) | 69 (0.9%) |
| 40 to 44 Minutes | 155 (1.6%) | 91 (1.2%) |
| 45 to 59 Minutes | 383 (3.9%) | 307 (4.0%) |
| 60 to 89 Minutes | 1,110 (11.4%) | 377 (4.9%) |
| 90 or more Minutes | 103 (1.1%) | 204 (2.6%) |
Time of Departure to Work by Sex in Santa Cruz County
The most frequent times of departure to work in Santa Cruz County are 7:30 AM to 7:59 AM (1,113, 11.4%) for males and 7:00 AM to 7:29 AM (1,368, 17.6%) for females.
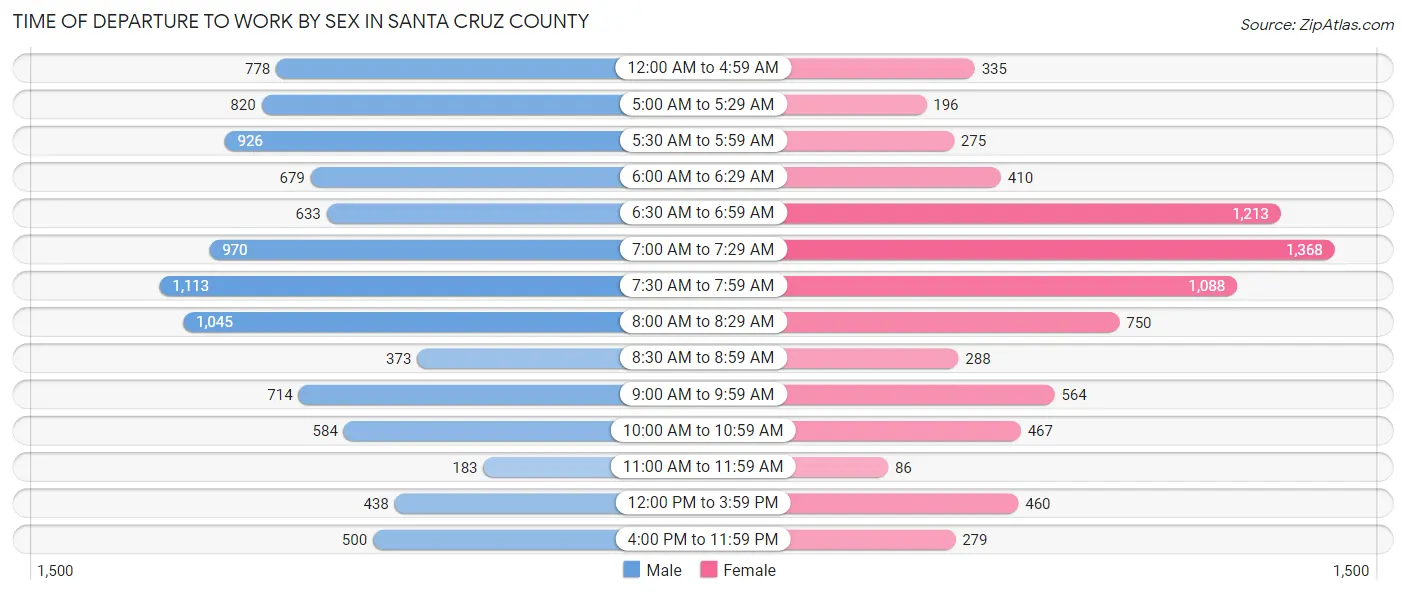
| Time of Departure | Male | Female |
| 12:00 AM to 4:59 AM | 778 (8.0%) | 335 (4.3%) |
| 5:00 AM to 5:29 AM | 820 (8.4%) | 196 (2.5%) |
| 5:30 AM to 5:59 AM | 926 (9.5%) | 275 (3.5%) |
| 6:00 AM to 6:29 AM | 679 (7.0%) | 410 (5.3%) |
| 6:30 AM to 6:59 AM | 633 (6.5%) | 1,213 (15.6%) |
| 7:00 AM to 7:29 AM | 970 (9.9%) | 1,368 (17.6%) |
| 7:30 AM to 7:59 AM | 1,113 (11.4%) | 1,088 (14.0%) |
| 8:00 AM to 8:29 AM | 1,045 (10.7%) | 750 (9.6%) |
| 8:30 AM to 8:59 AM | 373 (3.8%) | 288 (3.7%) |
| 9:00 AM to 9:59 AM | 714 (7.3%) | 564 (7.2%) |
| 10:00 AM to 10:59 AM | 584 (6.0%) | 467 (6.0%) |
| 11:00 AM to 11:59 AM | 183 (1.9%) | 86 (1.1%) |
| 12:00 PM to 3:59 PM | 438 (4.5%) | 460 (5.9%) |
| 4:00 PM to 11:59 PM | 500 (5.1%) | 279 (3.6%) |
| Total | 9,756 (100.0%) | 7,779 (100.0%) |
Housing Occupancy in Santa Cruz County
Occupancy by Ownership in Santa Cruz County
Of the total 16,651 dwellings in Santa Cruz County, owner-occupied units account for 11,190 (67.2%), while renter-occupied units make up 5,461 (32.8%).
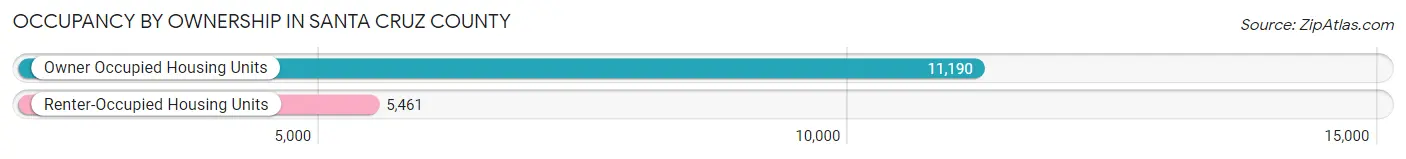
| Occupancy | # Housing Units | % Housing Units |
| Owner Occupied Housing Units | 11,190 | 67.2% |
| Renter-Occupied Housing Units | 5,461 | 32.8% |
| Total Occupied Housing Units | 16,651 | 100.0% |
Occupancy by Household Size in Santa Cruz County
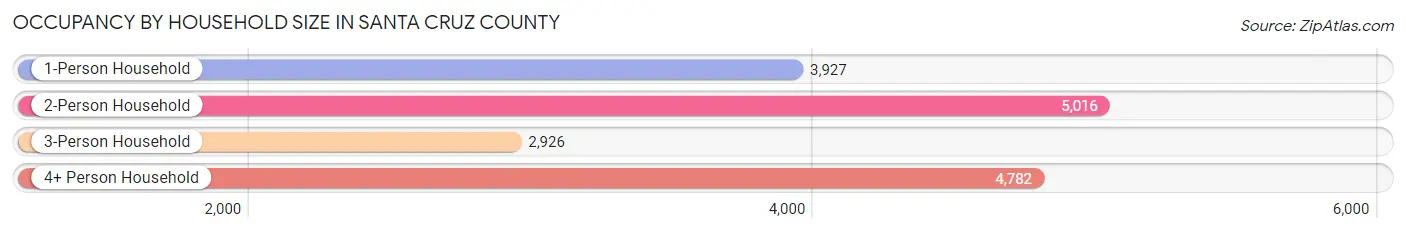
| Household Size | # Housing Units | % Housing Units |
| 1-Person Household | 3,927 | 23.6% |
| 2-Person Household | 5,016 | 30.1% |
| 3-Person Household | 2,926 | 17.6% |
| 4+ Person Household | 4,782 | 28.7% |
| Total Housing Units | 16,651 | 100.0% |
Occupancy by Ownership by Household Size in Santa Cruz County
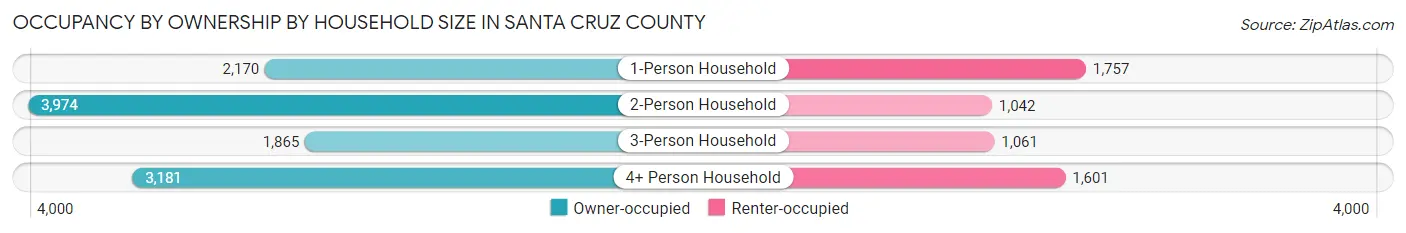
| Household Size | Owner-occupied | Renter-occupied |
| 1-Person Household | 2,170 (55.3%) | 1,757 (44.7%) |
| 2-Person Household | 3,974 (79.2%) | 1,042 (20.8%) |
| 3-Person Household | 1,865 (63.7%) | 1,061 (36.3%) |
| 4+ Person Household | 3,181 (66.5%) | 1,601 (33.5%) |
| Total Housing Units | 11,190 (67.2%) | 5,461 (32.8%) |
Occupancy by Educational Attainment in Santa Cruz County
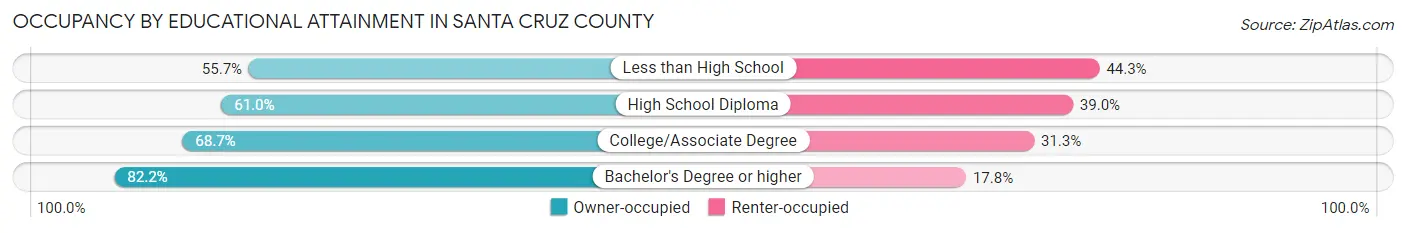
| Household Size | Owner-occupied | Renter-occupied |
| Less than High School | 2,092 (55.7%) | 1,662 (44.3%) |
| High School Diploma | 2,428 (61.0%) | 1,553 (39.0%) |
| College/Associate Degree | 3,351 (68.7%) | 1,527 (31.3%) |
| Bachelor's Degree or higher | 3,319 (82.2%) | 719 (17.8%) |
Occupancy by Age of Householder in Santa Cruz County
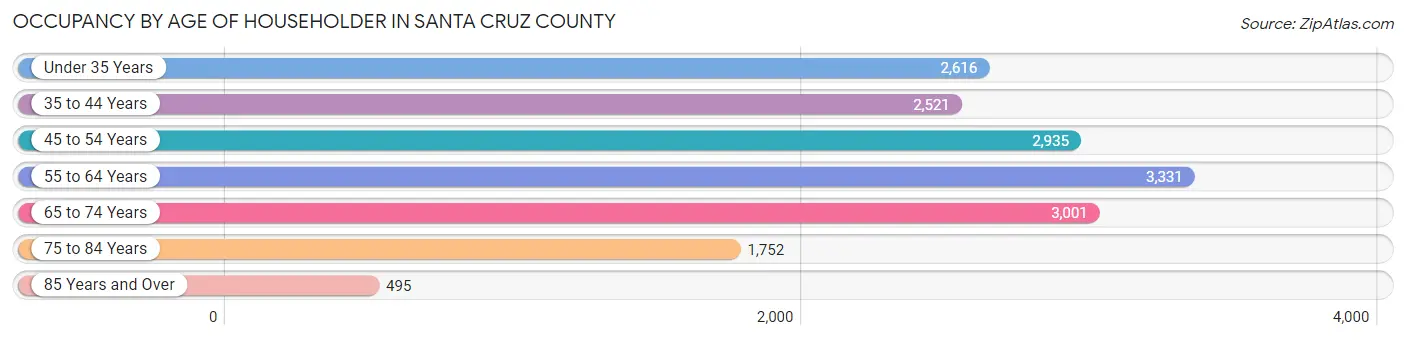
| Age Bracket | # Households | % Households |
| Under 35 Years | 2,616 | 15.7% |
| 35 to 44 Years | 2,521 | 15.1% |
| 45 to 54 Years | 2,935 | 17.6% |
| 55 to 64 Years | 3,331 | 20.0% |
| 65 to 74 Years | 3,001 | 18.0% |
| 75 to 84 Years | 1,752 | 10.5% |
| 85 Years and Over | 495 | 3.0% |
| Total | 16,651 | 100.0% |
Housing Finances in Santa Cruz County
Median Income by Occupancy in Santa Cruz County
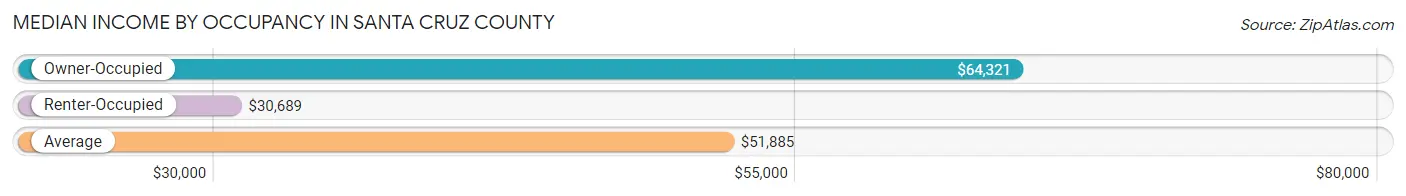
| Occupancy Type | # Households | Median Income |
| Owner-Occupied | 11,190 (67.2%) | $64,321 |
| Renter-Occupied | 5,461 (32.8%) | $30,689 |
| Average | 16,651 (100.0%) | $51,885 |
Occupancy by Householder Income Bracket in Santa Cruz County
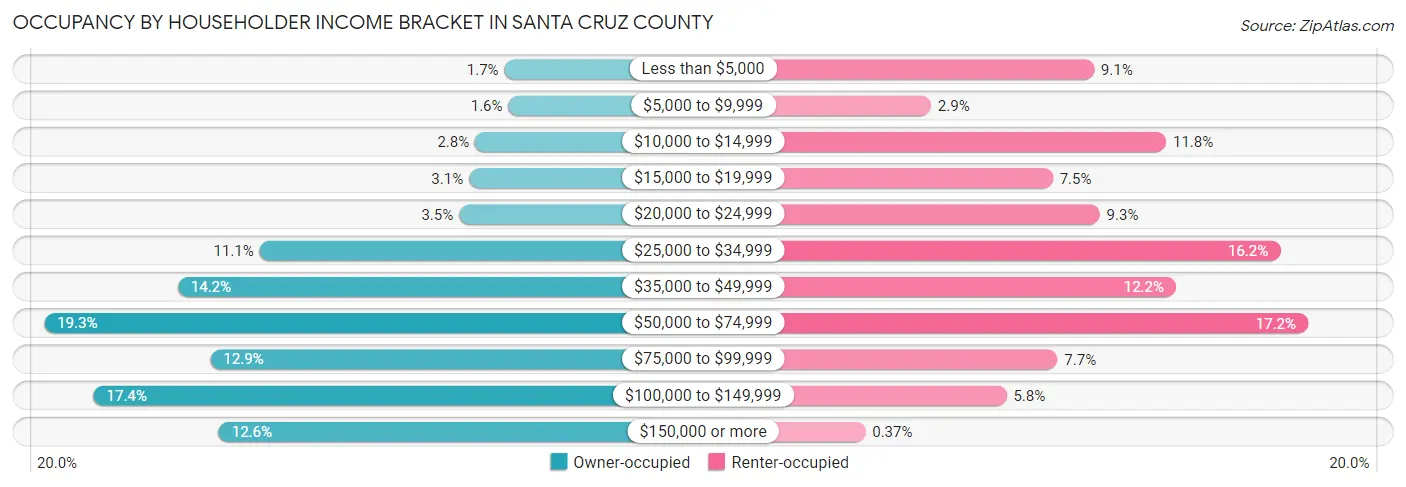
| Income Bracket | Owner-occupied | Renter-occupied |
| Less than $5,000 | 192 (1.7%) | 496 (9.1%) |
| $5,000 to $9,999 | 176 (1.6%) | 157 (2.9%) |
| $10,000 to $14,999 | 318 (2.8%) | 646 (11.8%) |
| $15,000 to $19,999 | 343 (3.1%) | 410 (7.5%) |
| $20,000 to $24,999 | 386 (3.5%) | 508 (9.3%) |
| $25,000 to $34,999 | 1,236 (11.1%) | 883 (16.2%) |
| $35,000 to $49,999 | 1,585 (14.2%) | 666 (12.2%) |
| $50,000 to $74,999 | 2,154 (19.3%) | 941 (17.2%) |
| $75,000 to $99,999 | 1,446 (12.9%) | 420 (7.7%) |
| $100,000 to $149,999 | 1,944 (17.4%) | 314 (5.8%) |
| $150,000 or more | 1,410 (12.6%) | 20 (0.4%) |
| Total | 11,190 (100.0%) | 5,461 (100.0%) |
Monthly Housing Cost Tiers in Santa Cruz County
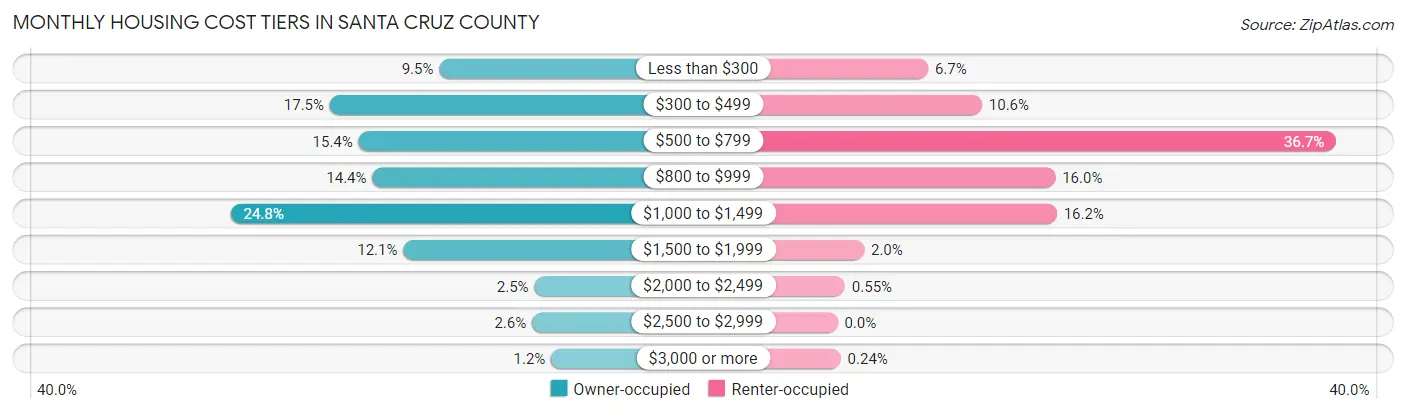
| Monthly Cost | Owner-occupied | Renter-occupied |
| Less than $300 | 1,059 (9.5%) | 364 (6.7%) |
| $300 to $499 | 1,960 (17.5%) | 581 (10.6%) |
| $500 to $799 | 1,723 (15.4%) | 2,006 (36.7%) |
| $800 to $999 | 1,610 (14.4%) | 876 (16.0%) |
| $1,000 to $1,499 | 2,778 (24.8%) | 882 (16.2%) |
| $1,500 to $1,999 | 1,355 (12.1%) | 107 (2.0%) |
| $2,000 to $2,499 | 274 (2.5%) | 30 (0.5%) |
| $2,500 to $2,999 | 294 (2.6%) | 0 (0.0%) |
| $3,000 or more | 137 (1.2%) | 13 (0.2%) |
| Total | 11,190 (100.0%) | 5,461 (100.0%) |
Physical Housing Characteristics in Santa Cruz County
Housing Structures in Santa Cruz County
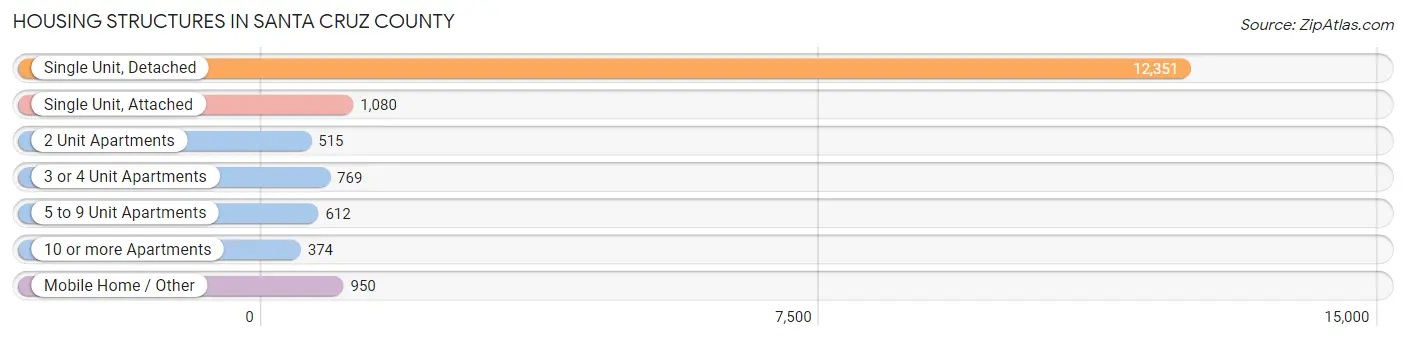
| Structure Type | # Housing Units | % Housing Units |
| Single Unit, Detached | 12,351 | 74.2% |
| Single Unit, Attached | 1,080 | 6.5% |
| 2 Unit Apartments | 515 | 3.1% |
| 3 or 4 Unit Apartments | 769 | 4.6% |
| 5 to 9 Unit Apartments | 612 | 3.7% |
| 10 or more Apartments | 374 | 2.2% |
| Mobile Home / Other | 950 | 5.7% |
| Total | 16,651 | 100.0% |
Housing Structures by Occupancy in Santa Cruz County
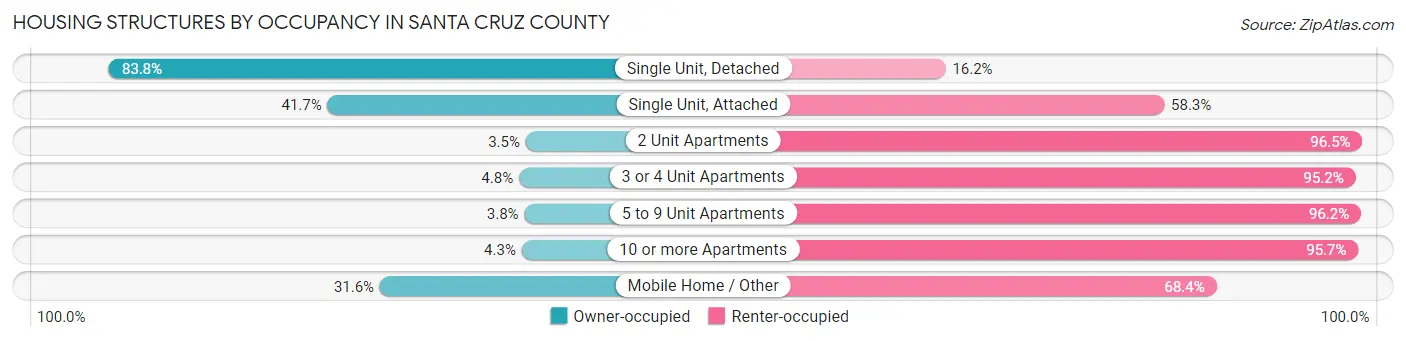
| Structure Type | Owner-occupied | Renter-occupied |
| Single Unit, Detached | 10,346 (83.8%) | 2,005 (16.2%) |
| Single Unit, Attached | 450 (41.7%) | 630 (58.3%) |
| 2 Unit Apartments | 18 (3.5%) | 497 (96.5%) |
| 3 or 4 Unit Apartments | 37 (4.8%) | 732 (95.2%) |
| 5 to 9 Unit Apartments | 23 (3.8%) | 589 (96.2%) |
| 10 or more Apartments | 16 (4.3%) | 358 (95.7%) |
| Mobile Home / Other | 300 (31.6%) | 650 (68.4%) |
| Total | 11,190 (67.2%) | 5,461 (32.8%) |
Housing Structures by Number of Rooms in Santa Cruz County
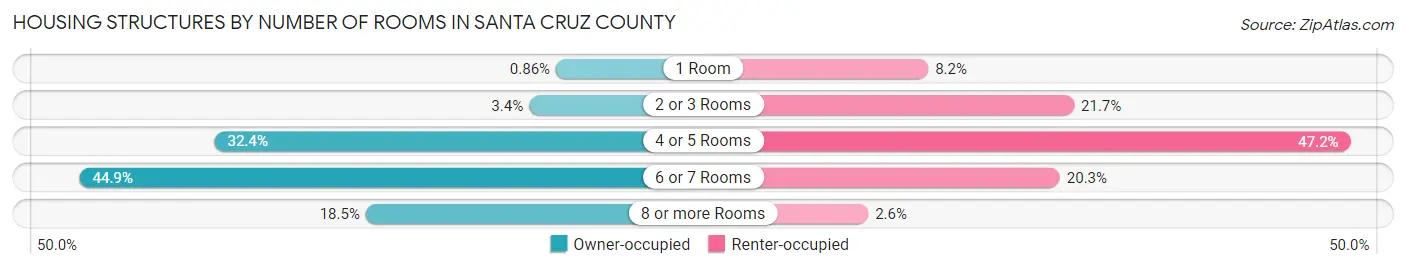
| Number of Rooms | Owner-occupied | Renter-occupied |
| 1 Room | 96 (0.9%) | 446 (8.2%) |
| 2 or 3 Rooms | 375 (3.4%) | 1,183 (21.7%) |
| 4 or 5 Rooms | 3,629 (32.4%) | 2,578 (47.2%) |
| 6 or 7 Rooms | 5,025 (44.9%) | 1,111 (20.3%) |
| 8 or more Rooms | 2,065 (18.4%) | 143 (2.6%) |
| Total | 11,190 (100.0%) | 5,461 (100.0%) |
Housing Structure by Heating Type in Santa Cruz County
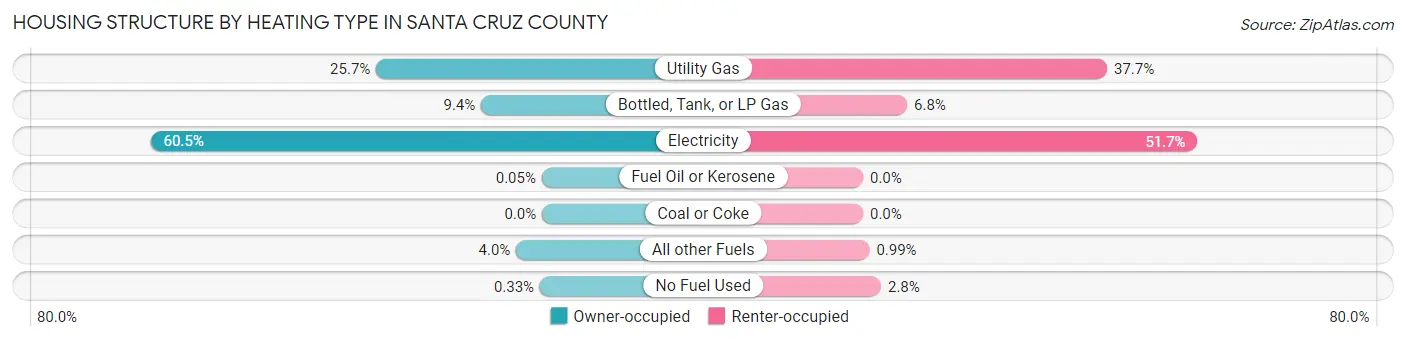
| Heating Type | Owner-occupied | Renter-occupied |
| Utility Gas | 2,870 (25.7%) | 2,060 (37.7%) |
| Bottled, Tank, or LP Gas | 1,055 (9.4%) | 372 (6.8%) |
| Electricity | 6,773 (60.5%) | 2,823 (51.7%) |
| Fuel Oil or Kerosene | 6 (0.1%) | 0 (0.0%) |
| Coal or Coke | 0 (0.0%) | 0 (0.0%) |
| All other Fuels | 449 (4.0%) | 54 (1.0%) |
| No Fuel Used | 37 (0.3%) | 152 (2.8%) |
| Total | 11,190 (100.0%) | 5,461 (100.0%) |
Household Vehicle Usage in Santa Cruz County
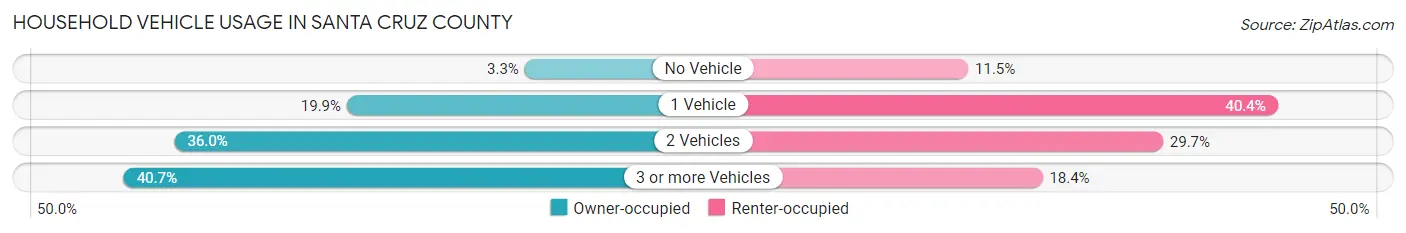
| Vehicles per Household | Owner-occupied | Renter-occupied |
| No Vehicle | 372 (3.3%) | 628 (11.5%) |
| 1 Vehicle | 2,229 (19.9%) | 2,205 (40.4%) |
| 2 Vehicles | 4,030 (36.0%) | 1,621 (29.7%) |
| 3 or more Vehicles | 4,559 (40.7%) | 1,007 (18.4%) |
| Total | 11,190 (100.0%) | 5,461 (100.0%) |
Real Estate & Mortgages in Santa Cruz County
Real Estate and Mortgage Overview in Santa Cruz County
| Characteristic | Without Mortgage | With Mortgage |
| Housing Units | 4,293 | 6,897 |
| Median Property Value | $177,200 | $204,300 |
| Median Household Income | $51,430 | $953 |
| Monthly Housing Costs | $395 | $131 |
| Real Estate Taxes | $1,318 | $110 |
Property Value by Mortgage Status in Santa Cruz County
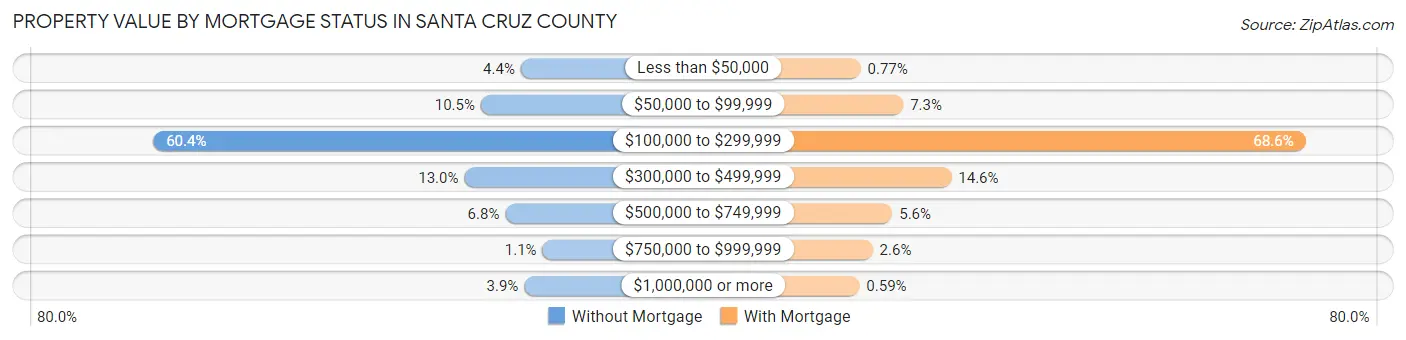
| Property Value | Without Mortgage | With Mortgage |
| Less than $50,000 | 189 (4.4%) | 53 (0.8%) |
| $50,000 to $99,999 | 450 (10.5%) | 501 (7.3%) |
| $100,000 to $299,999 | 2,593 (60.4%) | 4,729 (68.6%) |
| $300,000 to $499,999 | 558 (13.0%) | 1,007 (14.6%) |
| $500,000 to $749,999 | 290 (6.8%) | 386 (5.6%) |
| $750,000 to $999,999 | 47 (1.1%) | 180 (2.6%) |
| $1,000,000 or more | 166 (3.9%) | 41 (0.6%) |
| Total | 4,293 (100.0%) | 6,897 (100.0%) |
Household Income by Mortgage Status in Santa Cruz County
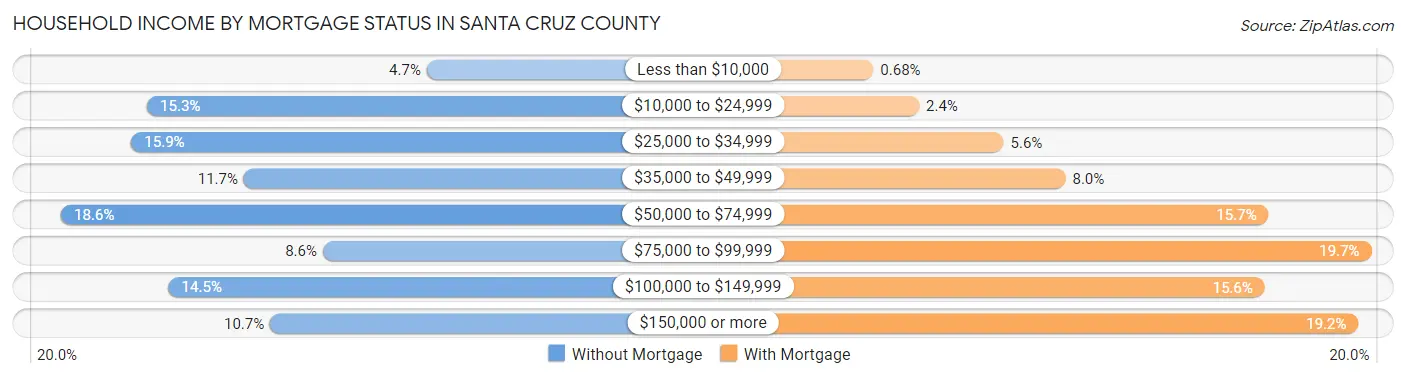
| Household Income | Without Mortgage | With Mortgage |
| Less than $10,000 | 201 (4.7%) | 47 (0.7%) |
| $10,000 to $24,999 | 658 (15.3%) | 167 (2.4%) |
| $25,000 to $34,999 | 684 (15.9%) | 389 (5.6%) |
| $35,000 to $49,999 | 500 (11.7%) | 552 (8.0%) |
| $50,000 to $74,999 | 799 (18.6%) | 1,085 (15.7%) |
| $75,000 to $99,999 | 371 (8.6%) | 1,355 (19.7%) |
| $100,000 to $149,999 | 623 (14.5%) | 1,075 (15.6%) |
| $150,000 or more | 457 (10.6%) | 1,321 (19.2%) |
| Total | 4,293 (100.0%) | 6,897 (100.0%) |
Property Value to Household Income Ratio in Santa Cruz County
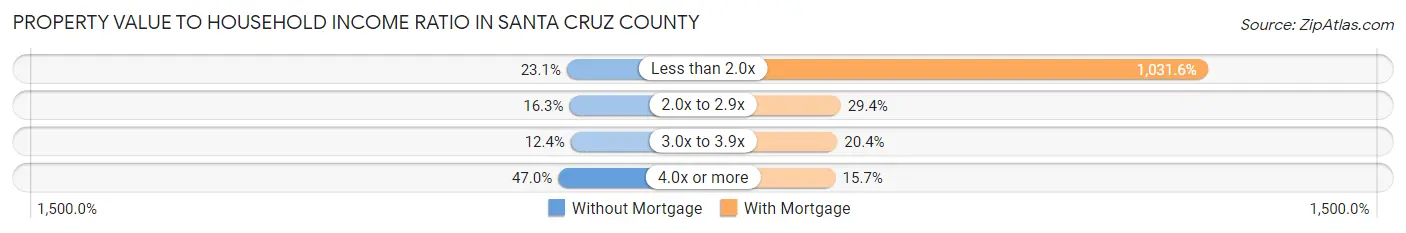
| Value-to-Income Ratio | Without Mortgage | With Mortgage |
| Less than 2.0x | 993 (23.1%) | 71,150 (1,031.6%) |
| 2.0x to 2.9x | 699 (16.3%) | 2,027 (29.4%) |
| 3.0x to 3.9x | 530 (12.3%) | 1,404 (20.4%) |
| 4.0x or more | 2,017 (47.0%) | 1,081 (15.7%) |
| Total | 4,293 (100.0%) | 6,897 (100.0%) |
Real Estate Taxes by Mortgage Status in Santa Cruz County
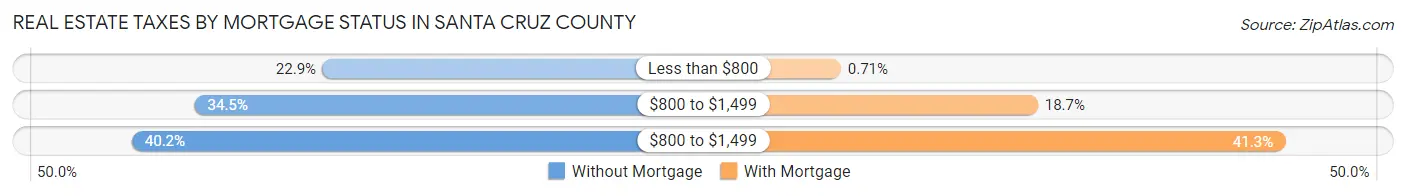
| Property Taxes | Without Mortgage | With Mortgage |
| Less than $800 | 981 (22.9%) | 49 (0.7%) |
| $800 to $1,499 | 1,480 (34.5%) | 1,290 (18.7%) |
| $800 to $1,499 | 1,726 (40.2%) | 2,847 (41.3%) |
| Total | 4,293 (100.0%) | 6,897 (100.0%) |
Health & Disability in Santa Cruz County
Health Insurance Coverage by Age in Santa Cruz County
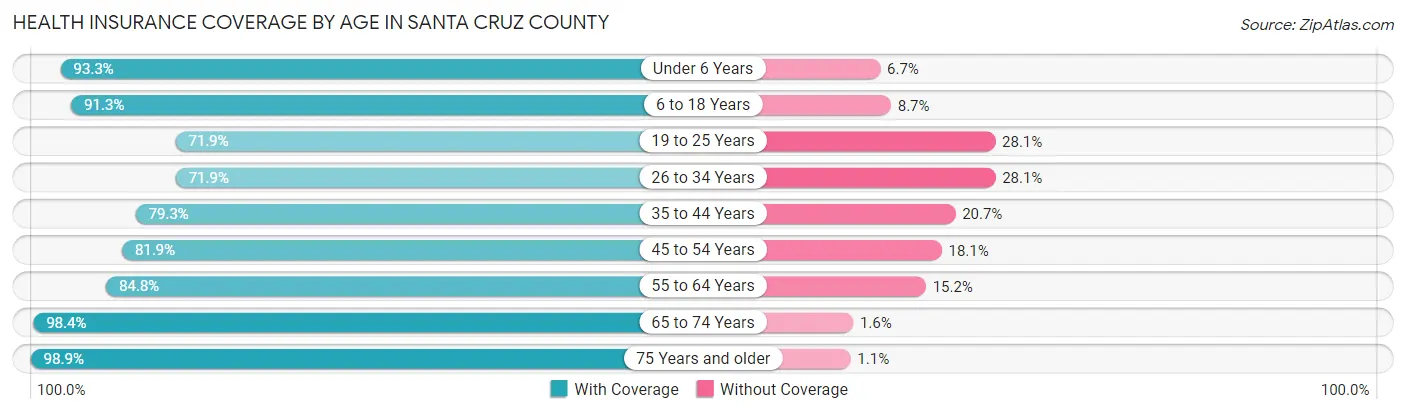
| Age Bracket | With Coverage | Without Coverage |
| Under 6 Years | 3,715 (93.3%) | 266 (6.7%) |
| 6 to 18 Years | 8,718 (91.3%) | 828 (8.7%) |
| 19 to 25 Years | 2,927 (71.9%) | 1,145 (28.1%) |
| 26 to 34 Years | 3,588 (71.9%) | 1,405 (28.1%) |
| 35 to 44 Years | 4,178 (79.3%) | 1,089 (20.7%) |
| 45 to 54 Years | 4,351 (81.9%) | 964 (18.1%) |
| 55 to 64 Years | 4,766 (84.8%) | 853 (15.2%) |
| 65 to 74 Years | 5,077 (98.4%) | 83 (1.6%) |
| 75 Years and older | 3,635 (98.9%) | 42 (1.1%) |
| Total | 40,955 (86.0%) | 6,675 (14.0%) |
Health Insurance Coverage by Citizenship Status in Santa Cruz County
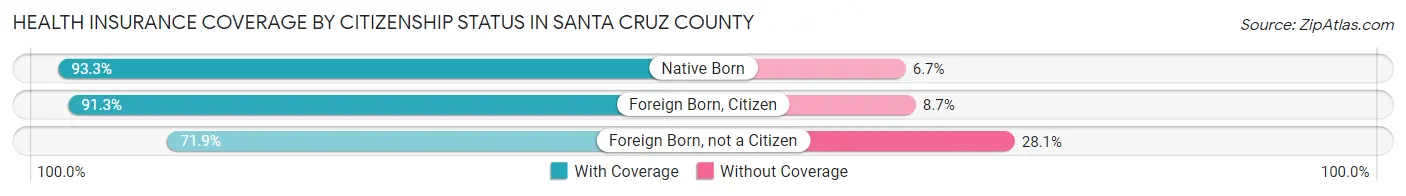
| Citizenship Status | With Coverage | Without Coverage |
| Native Born | 3,715 (93.3%) | 266 (6.7%) |
| Foreign Born, Citizen | 8,718 (91.3%) | 828 (8.7%) |
| Foreign Born, not a Citizen | 2,927 (71.9%) | 1,145 (28.1%) |
Health Insurance Coverage by Household Income in Santa Cruz County
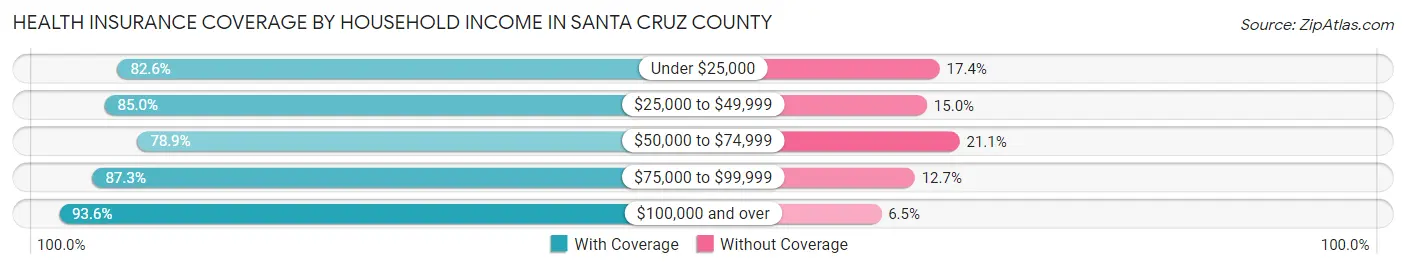
| Household Income | With Coverage | Without Coverage |
| Under $25,000 | 6,063 (82.6%) | 1,277 (17.4%) |
| $25,000 to $49,999 | 10,645 (85.0%) | 1,880 (15.0%) |
| $50,000 to $74,999 | 6,749 (78.9%) | 1,808 (21.1%) |
| $75,000 to $99,999 | 5,986 (87.3%) | 873 (12.7%) |
| $100,000 and over | 11,451 (93.5%) | 789 (6.5%) |
Public vs Private Health Insurance Coverage by Age in Santa Cruz County
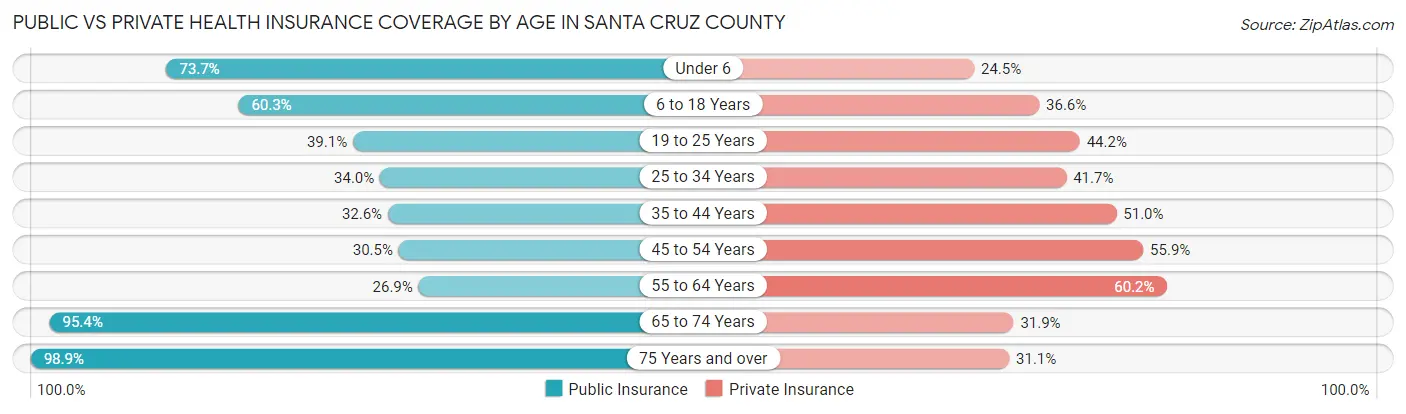
| Age Bracket | Public Insurance | Private Insurance |
| Under 6 | 2,933 (73.7%) | 977 (24.5%) |
| 6 to 18 Years | 5,756 (60.3%) | 3,496 (36.6%) |
| 19 to 25 Years | 1,590 (39.1%) | 1,798 (44.2%) |
| 25 to 34 Years | 1,698 (34.0%) | 2,080 (41.7%) |
| 35 to 44 Years | 1,715 (32.6%) | 2,684 (51.0%) |
| 45 to 54 Years | 1,623 (30.5%) | 2,973 (55.9%) |
| 55 to 64 Years | 1,509 (26.9%) | 3,385 (60.2%) |
| 65 to 74 Years | 4,921 (95.4%) | 1,644 (31.9%) |
| 75 Years and over | 3,635 (98.9%) | 1,142 (31.1%) |
| Total | 25,380 (53.3%) | 20,179 (42.4%) |
Disability Status by Sex by Age in Santa Cruz County
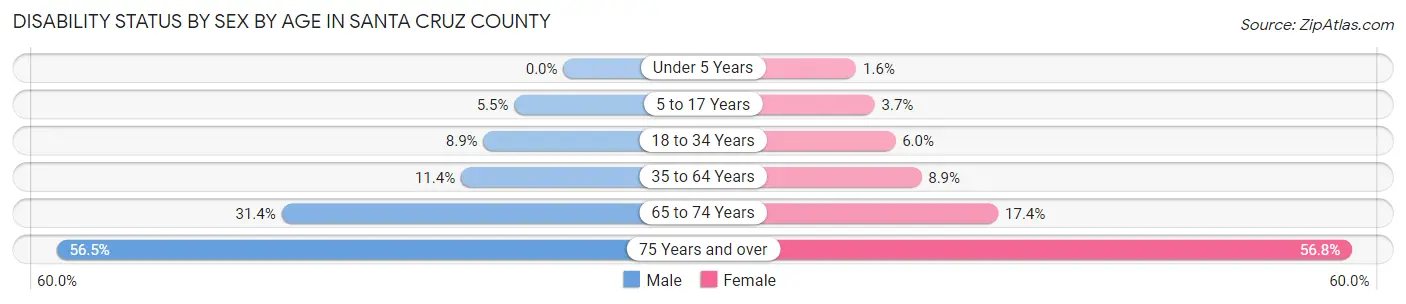
| Age Bracket | Male | Female |
| Under 5 Years | 0 (0.0%) | 24 (1.6%) |
| 5 to 17 Years | 258 (5.5%) | 173 (3.6%) |
| 18 to 34 Years | 448 (8.9%) | 295 (5.9%) |
| 35 to 64 Years | 858 (11.4%) | 768 (8.8%) |
| 65 to 74 Years | 754 (31.4%) | 480 (17.4%) |
| 75 Years and over | 937 (56.5%) | 1,146 (56.8%) |
Disability Class by Sex by Age in Santa Cruz County
Disability Class: Hearing Difficulty
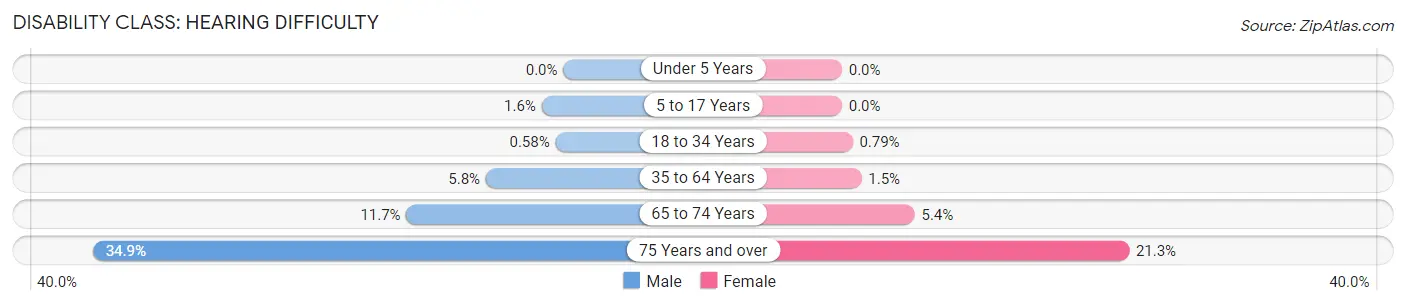
| Age Bracket | Male | Female |
| Under 5 Years | 0 (0.0%) | 0 (0.0%) |
| 5 to 17 Years | 76 (1.6%) | 0 (0.0%) |
| 18 to 34 Years | 29 (0.6%) | 39 (0.8%) |
| 35 to 64 Years | 433 (5.8%) | 126 (1.5%) |
| 65 to 74 Years | 280 (11.7%) | 149 (5.4%) |
| 75 Years and over | 580 (34.9%) | 430 (21.3%) |
Disability Class: Vision Difficulty
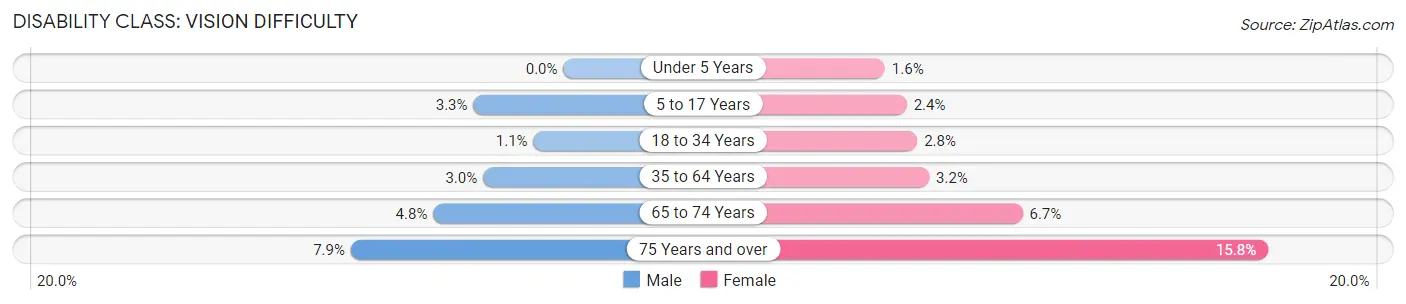
| Age Bracket | Male | Female |
| Under 5 Years | 0 (0.0%) | 24 (1.6%) |
| 5 to 17 Years | 158 (3.3%) | 114 (2.4%) |
| 18 to 34 Years | 56 (1.1%) | 139 (2.8%) |
| 35 to 64 Years | 224 (3.0%) | 281 (3.2%) |
| 65 to 74 Years | 116 (4.8%) | 185 (6.7%) |
| 75 Years and over | 131 (7.9%) | 319 (15.8%) |
Disability Class: Cognitive Difficulty
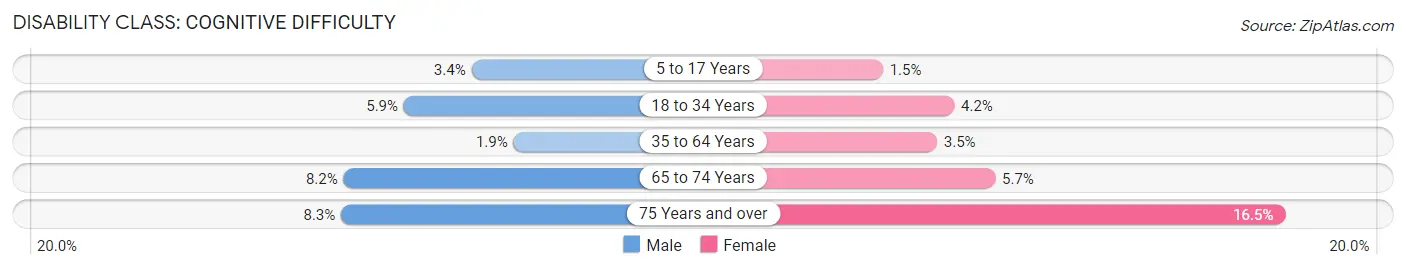
| Age Bracket | Male | Female |
| 5 to 17 Years | 161 (3.4%) | 72 (1.5%) |
| 18 to 34 Years | 298 (5.9%) | 207 (4.2%) |
| 35 to 64 Years | 139 (1.8%) | 306 (3.5%) |
| 65 to 74 Years | 196 (8.2%) | 157 (5.7%) |
| 75 Years and over | 137 (8.3%) | 332 (16.5%) |
Disability Class: Ambulatory Difficulty
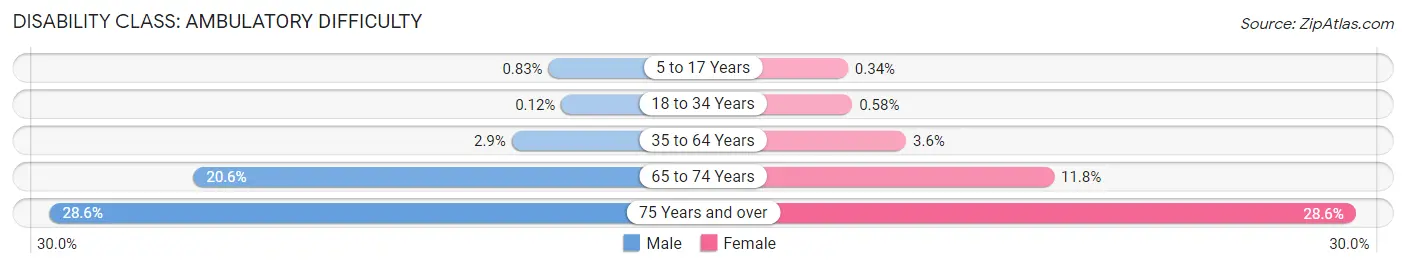
| Age Bracket | Male | Female |
| 5 to 17 Years | 39 (0.8%) | 16 (0.3%) |
| 18 to 34 Years | 6 (0.1%) | 29 (0.6%) |
| 35 to 64 Years | 217 (2.9%) | 311 (3.6%) |
| 65 to 74 Years | 495 (20.6%) | 326 (11.8%) |
| 75 Years and over | 475 (28.6%) | 577 (28.6%) |
Disability Class: Self-Care Difficulty
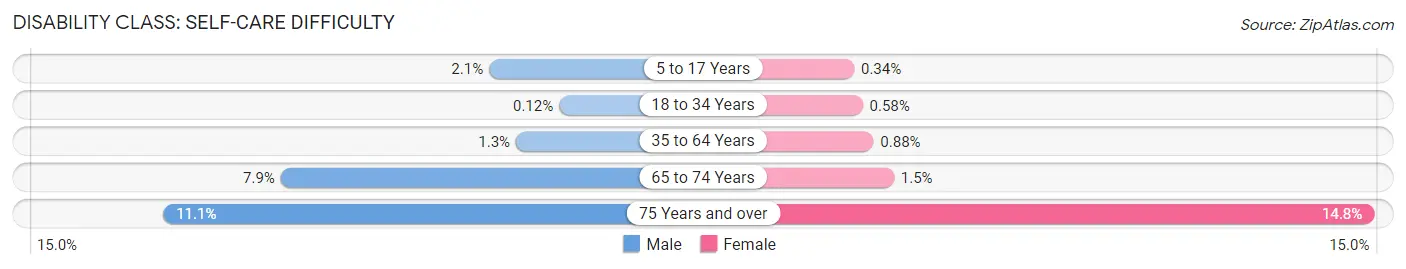
| Age Bracket | Male | Female |
| 5 to 17 Years | 98 (2.1%) | 16 (0.3%) |
| 18 to 34 Years | 6 (0.1%) | 29 (0.6%) |
| 35 to 64 Years | 99 (1.3%) | 76 (0.9%) |
| 65 to 74 Years | 189 (7.9%) | 40 (1.5%) |
| 75 Years and over | 185 (11.1%) | 299 (14.8%) |
Technology Access in Santa Cruz County
Computing Device Access in Santa Cruz County
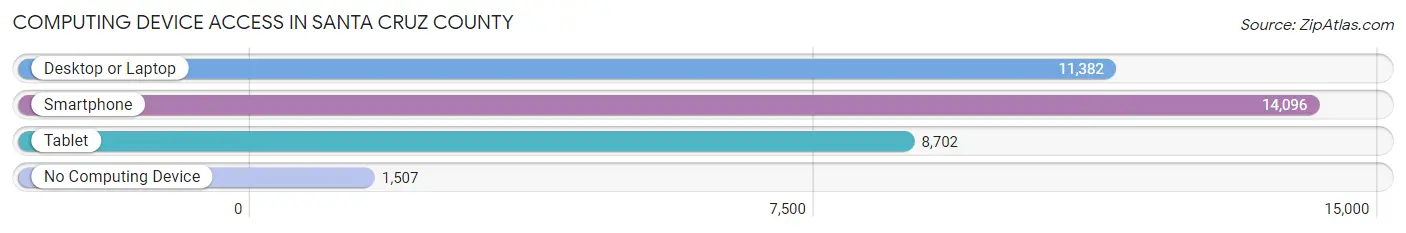
| Device Type | # Households | % Households |
| Desktop or Laptop | 11,382 | 68.4% |
| Smartphone | 14,096 | 84.7% |
| Tablet | 8,702 | 52.3% |
| No Computing Device | 1,507 | 9.0% |
| Total | 16,651 | 100.0% |
Internet Access in Santa Cruz County
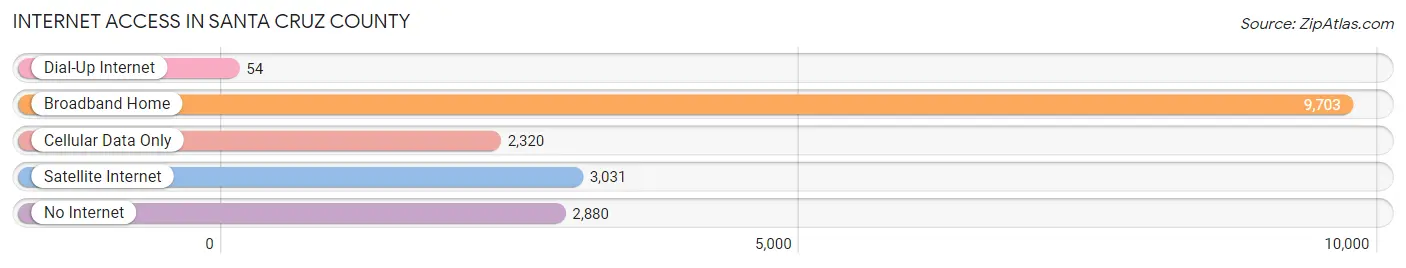
| Internet Type | # Households | % Households |
| Dial-Up Internet | 54 | 0.3% |
| Broadband Home | 9,703 | 58.3% |
| Cellular Data Only | 2,320 | 13.9% |
| Satellite Internet | 3,031 | 18.2% |
| No Internet | 2,880 | 17.3% |
| Total | 16,651 | 100.0% |
Santa Cruz County Summary
Santa Cruz County, Arizona is located in the southern part of the state, bordering Mexico and the Gulf of California. It is the second-smallest county in Arizona, with an area of 1,238 square miles. The county seat is Nogales, and the population was 47,420 as of the 2010 census.
History
Santa Cruz County was established in 1899, and was named after the Santa Cruz River, which flows through the county. The area was originally inhabited by the O'odham people, who were later joined by the Apache and Yaqui tribes. The first Europeans to settle in the area were Spanish missionaries, who established missions in the late 1700s.
In the mid-1800s, the area was part of the Gadsden Purchase, which was a treaty between the United States and Mexico that allowed the US to purchase land in what is now southern Arizona and New Mexico. After the purchase, the area was divided into four counties, including Santa Cruz.
Geography
Santa Cruz County is located in the southern part of Arizona, and is bordered by Mexico and the Gulf of California. The county is mostly flat, with an average elevation of 2,500 feet. The Santa Cruz River runs through the county, and is the main source of water for the area. The county is also home to several mountain ranges, including the Santa Rita Mountains, the Patagonia Mountains, and the Tumacacori Mountains.
The climate in Santa Cruz County is arid, with hot summers and mild winters. The average annual temperature is 70°F, and the average annual precipitation is 11.5 inches.
Economy
The economy of Santa Cruz County is largely based on agriculture and tourism. The county is home to several large farms, which produce a variety of crops, including cotton, alfalfa, and wheat. The county is also home to several wineries, which produce a variety of wines.
Tourism is also an important part of the economy. The county is home to several popular attractions, including the Tumacacori National Historical Park, the San Rafael Valley, and the Coronado National Forest.
Demographics
As of the 2010 census, the population of Santa Cruz County was 47,420. The population is largely Hispanic, with 78.3% of the population identifying as Hispanic or Latino. The median household income is $37,845, and the median age is 33.5.
Conclusion
Santa Cruz County, Arizona is a small county located in the southern part of the state. It is home to a diverse population, and the economy is largely based on agriculture and tourism. The county is home to several popular attractions, and is a popular destination for visitors from around the world.
Common Questions
What is Per Capita Income in Santa Cruz County?
Per Capita income in Santa Cruz County is $25,619.
What is the Median Family Income in Santa Cruz County?
Median Family Income in Santa Cruz County is $59,444.
What is the Median Household income in Santa Cruz County?
Median Household Income in Santa Cruz County is $51,885.
What is Income or Wage Gap in Santa Cruz County?
Income or Wage Gap in Santa Cruz County is 13.4%.
Women in Santa Cruz County earn 86.6 cents for every dollar earned by a man.
What is Family Income Deficit in Santa Cruz County?
Family Income Deficit in Santa Cruz County is $9,744.
Families that are below poverty line in Santa Cruz County earn $9,744 less on average than the poverty threshold level.
What is Inequality or Gini Index in Santa Cruz County?
Inequality or Gini Index in Santa Cruz County is 0.46.
What is the Total Population of Santa Cruz County?
Total Population of Santa Cruz County is 47,838.
What is the Total Male Population of Santa Cruz County?
Total Male Population of Santa Cruz County is 23,193.
What is the Total Female Population of Santa Cruz County?
Total Female Population of Santa Cruz County is 24,645.
What is the Ratio of Males per 100 Females in Santa Cruz County?
There are 94.11 Males per 100 Females in Santa Cruz County.
What is the Ratio of Females per 100 Males in Santa Cruz County?
There are 106.26 Females per 100 Males in Santa Cruz County.
What is the Median Population Age in Santa Cruz County?
Median Population Age in Santa Cruz County is 37.3 Years.
What is the Average Family Size in Santa Cruz County
Average Family Size in Santa Cruz County is 3.4 People.
What is the Average Household Size in Santa Cruz County
Average Household Size in Santa Cruz County is 2.9 People.
How Large is the Labor Force in Santa Cruz County?
There are 21,111 People in the Labor Forcein in Santa Cruz County.
What is the Percentage of People in the Labor Force in Santa Cruz County?
57.2% of People are in the Labor Force in Santa Cruz County.
What is the Unemployment Rate in Santa Cruz County?
Unemployment Rate in Santa Cruz County is 9.8%.