Pinal County, AZ Map & Demographics
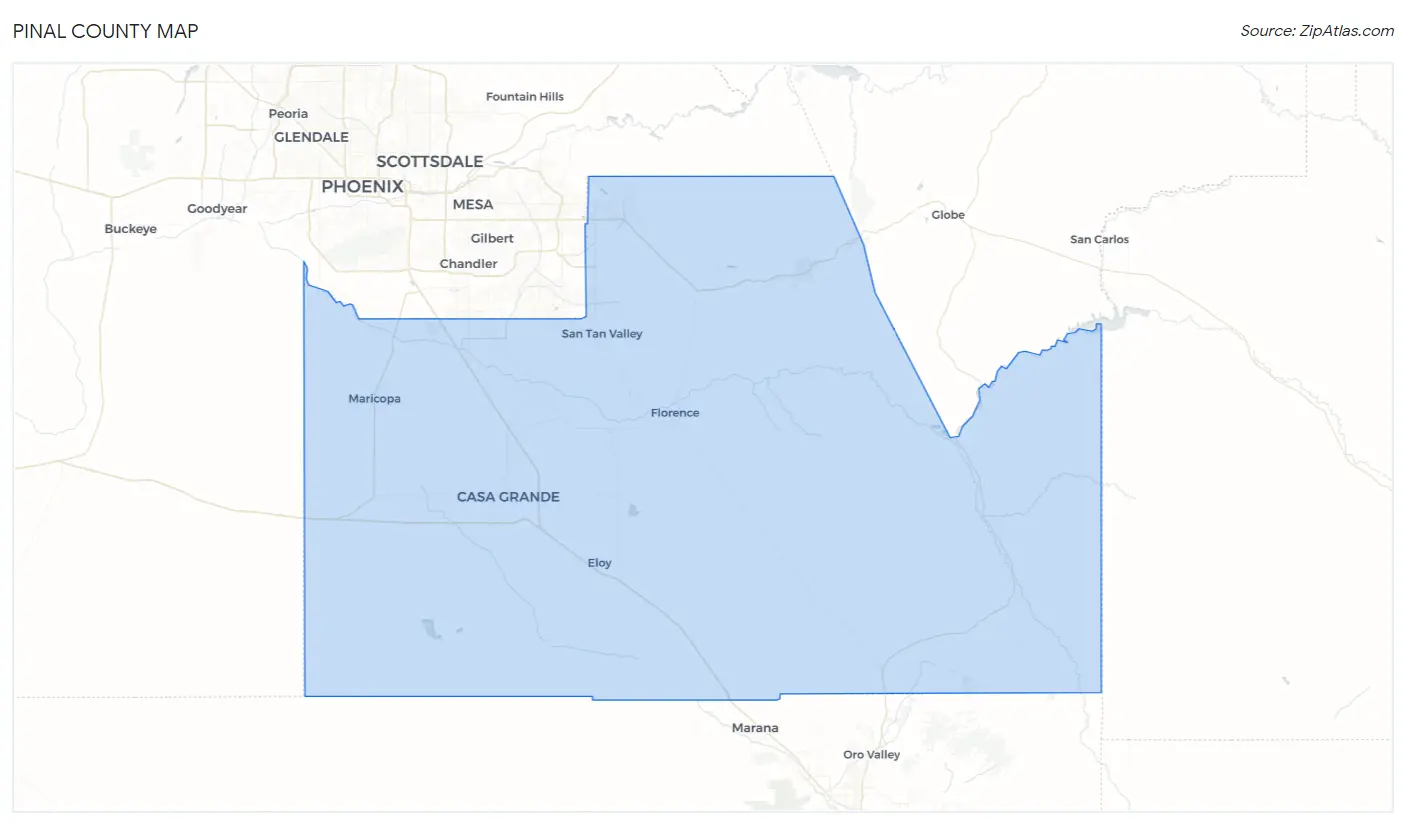
Pinal County Map
Pinal County Overview
$33,158
PER CAPITA INCOME
$80,809
AVG FAMILY INCOME
$73,313
AVG HOUSEHOLD INCOME
23.9%
WAGE / INCOME GAP [ % ]
76.1¢/ $1
WAGE / INCOME GAP [ $ ]
$11,490
FAMILY INCOME DEFICIT
0.42
INEQUALITY / GINI INDEX
433,338
TOTAL POPULATION
226,232
MALE POPULATION
207,106
FEMALE POPULATION
109.23
MALES / 100 FEMALES
91.55
FEMALES / 100 MALES
39.8
MEDIAN AGE
3.1
AVG FAMILY SIZE
2.7
AVG HOUSEHOLD SIZE
183,364
LABOR FORCE [ PEOPLE ]
52.6%
PERCENT IN LABOR FORCE
6.4%
UNEMPLOYMENT RATE
Income in Pinal County
Income Overview in Pinal County
Per Capita Income in Pinal County is $33,158, while median incomes of families and households are $80,809 and $73,313 respectively.
| Characteristic | Number | Measure |
| Per Capita Income | 433,338 | $33,158 |
| Median Family Income | 110,056 | $80,809 |
| Mean Family Income | 110,056 | $99,666 |
| Median Household Income | 151,490 | $73,313 |
| Mean Household Income | 151,490 | $92,354 |
| Income Deficit | 110,056 | $11,490 |
| Wage / Income Gap (%) | 433,338 | 23.92% |
| Wage / Income Gap ($) | 433,338 | 76.08¢ per $1 |
| Gini / Inequality Index | 433,338 | 0.42 |
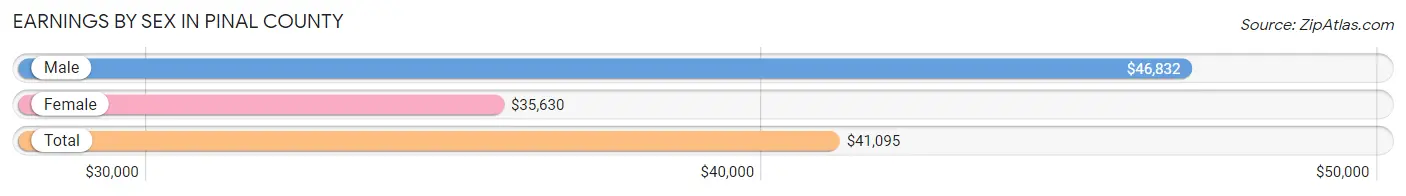
Earnings by Sex in Pinal County
Average Earnings in Pinal County are $41,095, $46,832 for men and $35,630 for women, a difference of 23.9%.
| Sex | Number | Average Earnings |
| Male | 106,879 (55.8%) | $46,832 |
| Female | 84,788 (44.2%) | $35,630 |
| Total | 191,667 (100.0%) | $41,095 |
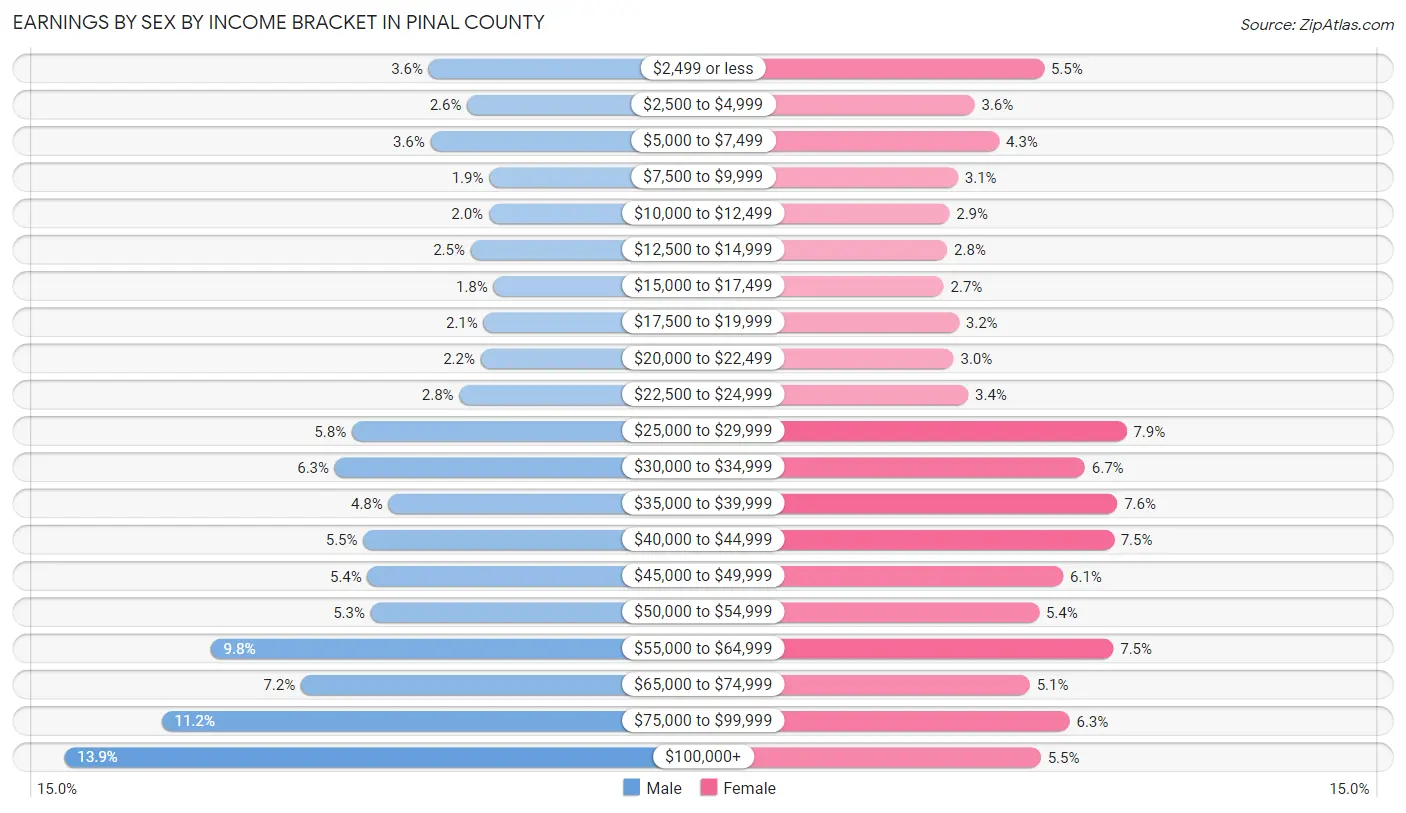
Earnings by Sex by Income Bracket in Pinal County
The most common earnings brackets in Pinal County are $100,000+ for men (14,834 | 13.9%) and $25,000 to $29,999 for women (6,665 | 7.9%).
| Income | Male | Female |
| $2,499 or less | 3,891 (3.6%) | 4,700 (5.5%) |
| $2,500 to $4,999 | 2,734 (2.6%) | 3,046 (3.6%) |
| $5,000 to $7,499 | 3,832 (3.6%) | 3,631 (4.3%) |
| $7,500 to $9,999 | 2,074 (1.9%) | 2,647 (3.1%) |
| $10,000 to $12,499 | 2,087 (1.9%) | 2,443 (2.9%) |
| $12,500 to $14,999 | 2,626 (2.5%) | 2,388 (2.8%) |
| $15,000 to $17,499 | 1,943 (1.8%) | 2,307 (2.7%) |
| $17,500 to $19,999 | 2,240 (2.1%) | 2,675 (3.2%) |
| $20,000 to $22,499 | 2,330 (2.2%) | 2,545 (3.0%) |
| $22,500 to $24,999 | 2,968 (2.8%) | 2,893 (3.4%) |
| $25,000 to $29,999 | 6,195 (5.8%) | 6,665 (7.9%) |
| $30,000 to $34,999 | 6,714 (6.3%) | 5,675 (6.7%) |
| $35,000 to $39,999 | 5,100 (4.8%) | 6,440 (7.6%) |
| $40,000 to $44,999 | 5,859 (5.5%) | 6,356 (7.5%) |
| $45,000 to $49,999 | 5,731 (5.4%) | 5,156 (6.1%) |
| $50,000 to $54,999 | 5,636 (5.3%) | 4,577 (5.4%) |
| $55,000 to $64,999 | 10,437 (9.8%) | 6,354 (7.5%) |
| $65,000 to $74,999 | 7,726 (7.2%) | 4,357 (5.1%) |
| $75,000 to $99,999 | 11,922 (11.2%) | 5,310 (6.3%) |
| $100,000+ | 14,834 (13.9%) | 4,623 (5.4%) |
| Total | 106,879 (100.0%) | 84,788 (100.0%) |
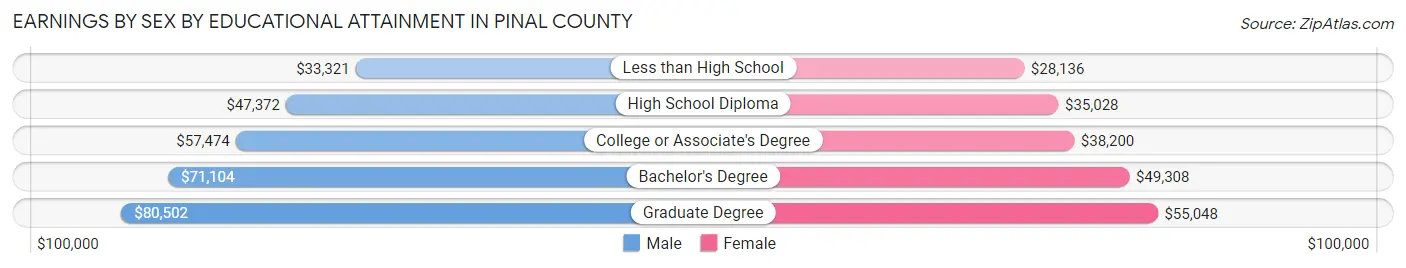
Earnings by Sex by Educational Attainment in Pinal County
Average earnings in Pinal County are $53,151 for men and $39,357 for women, a difference of 26.0%. Men with an educational attainment of graduate degree enjoy the highest average annual earnings of $80,502, while those with less than high school education earn the least with $33,321. Women with an educational attainment of graduate degree earn the most with the average annual earnings of $55,048, while those with less than high school education have the smallest earnings of $28,136.
| Educational Attainment | Male Income | Female Income |
| Less than High School | $33,321 | $28,136 |
| High School Diploma | $47,372 | $35,028 |
| College or Associate's Degree | $57,474 | $38,200 |
| Bachelor's Degree | $71,104 | $49,308 |
| Graduate Degree | $80,502 | $55,048 |
| Total | $53,151 | $39,357 |
Family Income in Pinal County
Family Income Brackets in Pinal County
According to the Pinal County family income data, there are 24,653 families falling into the $100,000 to $149,999 income range, which is the most common income bracket and makes up 22.4% of all families. Conversely, the $10,000 to $14,999 income bracket is the least frequent group with only 1,211 families (1.1%) belonging to this category.
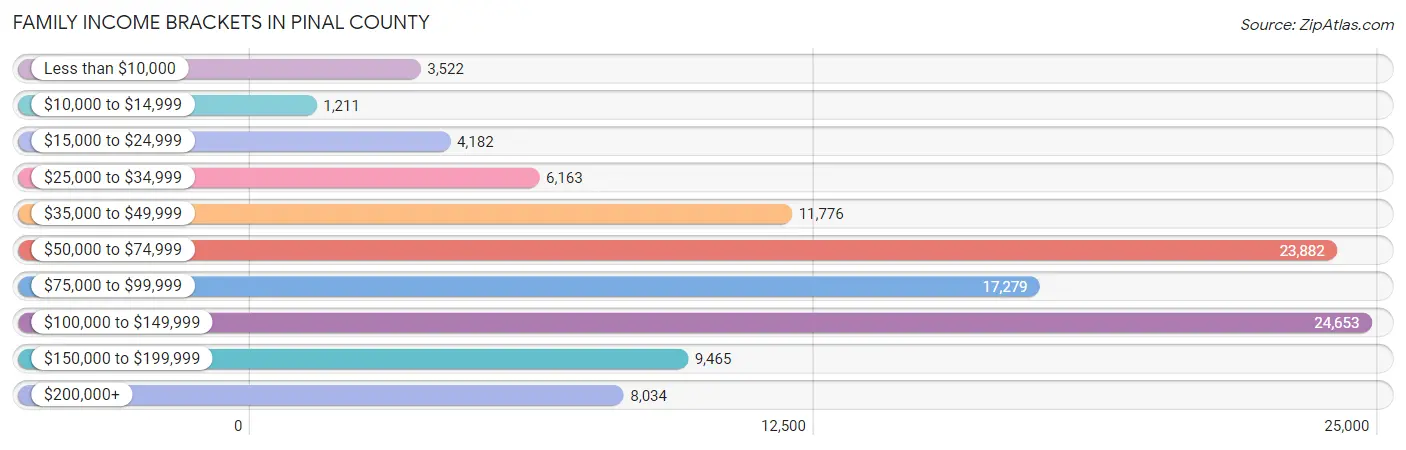
| Income Bracket | # Families | % Families |
| Less than $10,000 | 3,522 | 3.2% |
| $10,000 to $14,999 | 1,211 | 1.1% |
| $15,000 to $24,999 | 4,182 | 3.8% |
| $25,000 to $34,999 | 6,163 | 5.6% |
| $35,000 to $49,999 | 11,776 | 10.7% |
| $50,000 to $74,999 | 23,882 | 21.7% |
| $75,000 to $99,999 | 17,279 | 15.7% |
| $100,000 to $149,999 | 24,653 | 22.4% |
| $150,000 to $199,999 | 9,465 | 8.6% |
| $200,000+ | 8,034 | 7.3% |
Family Income by Famaliy Size in Pinal County
7+ person families (3,922 | 3.6%) account for the highest median family income in Pinal County with $107,333 per family, while 2-person families (54,657 | 49.7%) have the highest median income of $37,076 per family member.
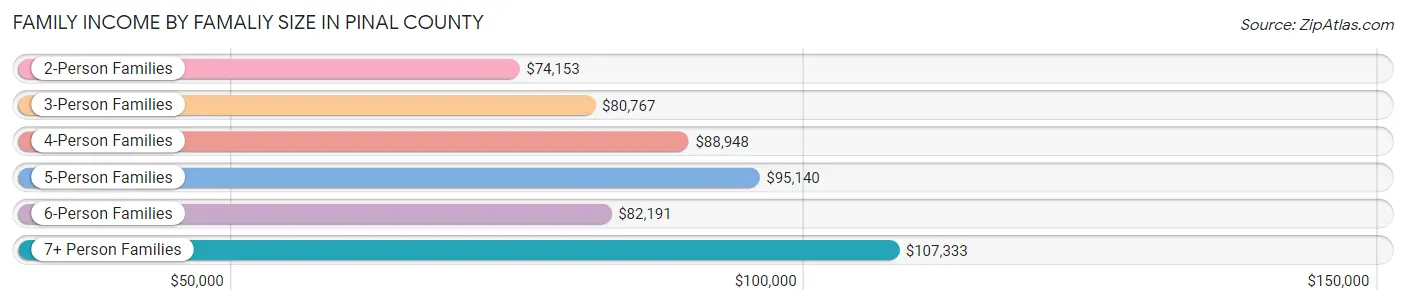
| Income Bracket | # Families | Median Income |
| 2-Person Families | 54,657 (49.7%) | $74,153 |
| 3-Person Families | 18,961 (17.2%) | $80,767 |
| 4-Person Families | 16,158 (14.7%) | $88,948 |
| 5-Person Families | 10,800 (9.8%) | $95,140 |
| 6-Person Families | 5,558 (5.1%) | $82,191 |
| 7+ Person Families | 3,922 (3.6%) | $107,333 |
| Total | 110,056 (100.0%) | $80,809 |
Family Income by Number of Earners in Pinal County
The median family income in Pinal County is $80,809, with families comprising 3+ earners (11,528) having the highest median family income of $126,004, while families with no earners (27,094) have the lowest median family income of $58,055, accounting for 10.5% and 24.6% of families, respectively.
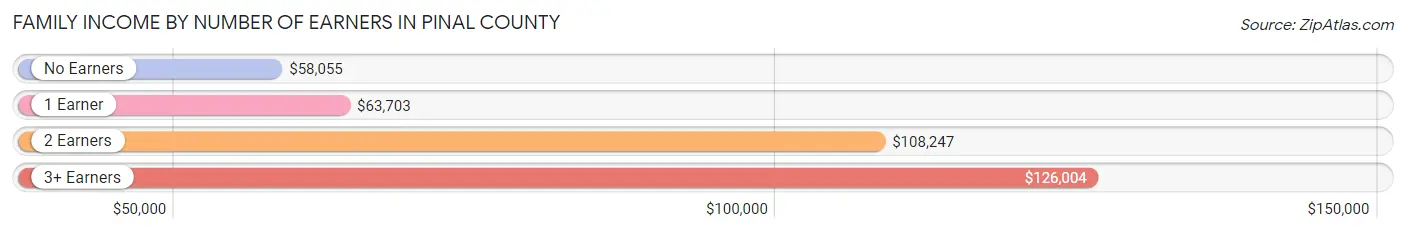
| Number of Earners | # Families | Median Income |
| No Earners | 27,094 (24.6%) | $58,055 |
| 1 Earner | 36,653 (33.3%) | $63,703 |
| 2 Earners | 34,781 (31.6%) | $108,247 |
| 3+ Earners | 11,528 (10.5%) | $126,004 |
| Total | 110,056 (100.0%) | $80,809 |
Household Income in Pinal County
Household Income Brackets in Pinal County
With 30,601 households falling in the category, the $50,000 to $74,999 income range is the most frequent in Pinal County, accounting for 20.2% of all households. In contrast, only 3,333 households (2.2%) fall into the $10,000 to $14,999 income bracket, making it the least populous group.
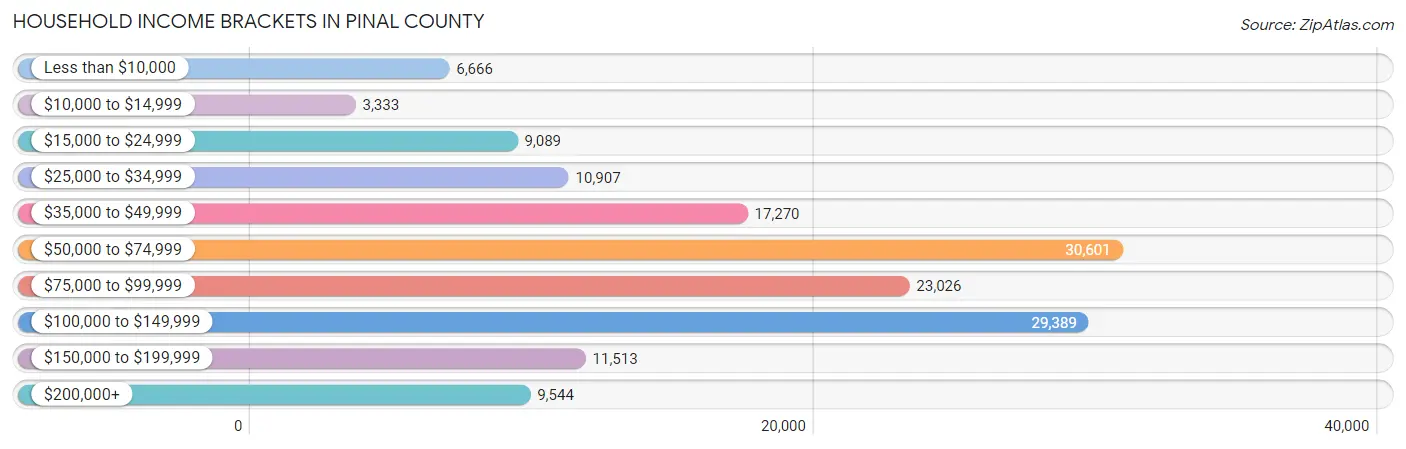
| Income Bracket | # Households | % Households |
| Less than $10,000 | 6,666 | 4.4% |
| $10,000 to $14,999 | 3,333 | 2.2% |
| $15,000 to $24,999 | 9,089 | 6.0% |
| $25,000 to $34,999 | 10,907 | 7.2% |
| $35,000 to $49,999 | 17,270 | 11.4% |
| $50,000 to $74,999 | 30,601 | 20.2% |
| $75,000 to $99,999 | 23,026 | 15.2% |
| $100,000 to $149,999 | 29,389 | 19.4% |
| $150,000 to $199,999 | 11,513 | 7.6% |
| $200,000+ | 9,544 | 6.3% |
Household Income by Householder Age in Pinal County
The median household income in Pinal County is $73,313, with the highest median household income of $84,783 found in the 25 to 44 years age bracket for the primary householder. A total of 44,813 households (29.6%) fall into this category. Meanwhile, the 15 to 24 years age bracket for the primary householder has the lowest median household income of $50,722, with 4,134 households (2.7%) in this group.
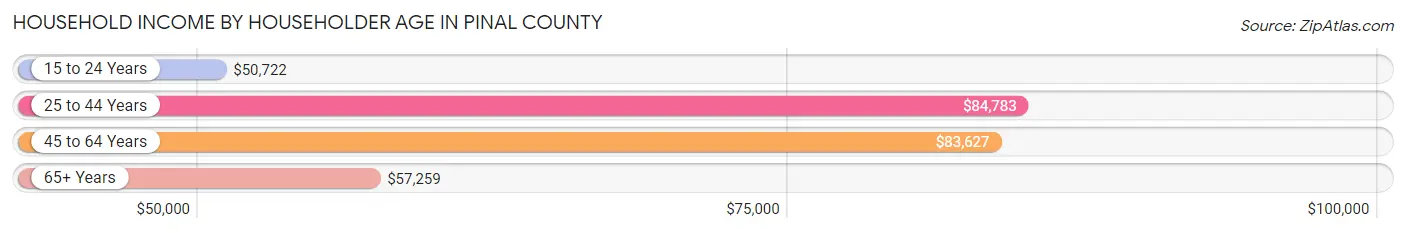
| Income Bracket | # Households | Median Income |
| 15 to 24 Years | 4,134 (2.7%) | $50,722 |
| 25 to 44 Years | 44,813 (29.6%) | $84,783 |
| 45 to 64 Years | 49,969 (33.0%) | $83,627 |
| 65+ Years | 52,574 (34.7%) | $57,259 |
| Total | 151,490 (100.0%) | $73,313 |
Poverty in Pinal County
Income Below Poverty by Sex and Age in Pinal County
With 10.5% poverty level for males and 12.0% for females among the residents of Pinal County, under 5 year old males and 6 to 11 year old females are the most vulnerable to poverty, with 2,178 males (19.1%) and 2,876 females (18.1%) in their respective age groups living below the poverty level.
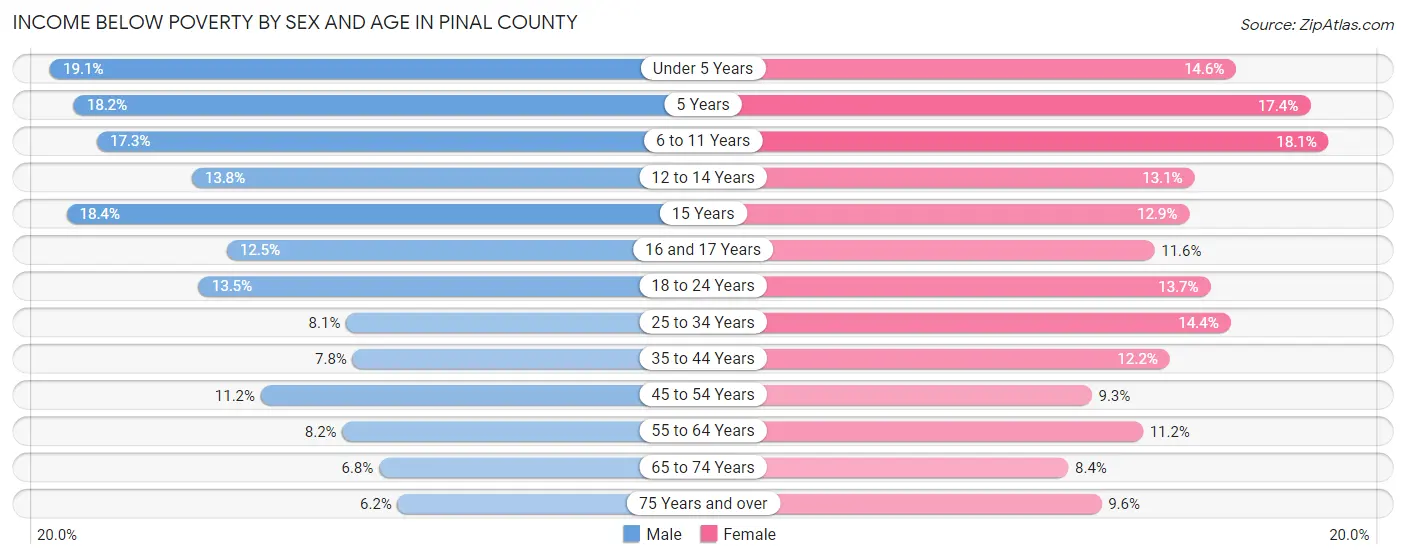
| Age Bracket | Male | Female |
| Under 5 Years | 2,178 (19.1%) | 1,608 (14.6%) |
| 5 Years | 469 (18.2%) | 400 (17.4%) |
| 6 to 11 Years | 2,805 (17.3%) | 2,876 (18.1%) |
| 12 to 14 Years | 1,195 (13.8%) | 1,127 (13.1%) |
| 15 Years | 494 (18.4%) | 409 (12.9%) |
| 16 and 17 Years | 712 (12.5%) | 565 (11.6%) |
| 18 to 24 Years | 2,456 (13.5%) | 2,055 (13.7%) |
| 25 to 34 Years | 2,118 (8.1%) | 3,517 (14.4%) |
| 35 to 44 Years | 2,039 (7.8%) | 3,083 (12.2%) |
| 45 to 54 Years | 2,636 (11.2%) | 2,076 (9.3%) |
| 55 to 64 Years | 1,812 (8.2%) | 2,878 (11.2%) |
| 65 to 74 Years | 1,668 (6.8%) | 2,354 (8.4%) |
| 75 Years and over | 1,096 (6.1%) | 1,798 (9.6%) |
| Total | 21,678 (10.5%) | 24,746 (12.0%) |
Income Above Poverty by Sex and Age in Pinal County
According to the poverty statistics in Pinal County, males aged 75 years and over and females aged 65 to 74 years are the age groups that are most secure financially, with 93.9% of males and 91.6% of females in these age groups living above the poverty line.
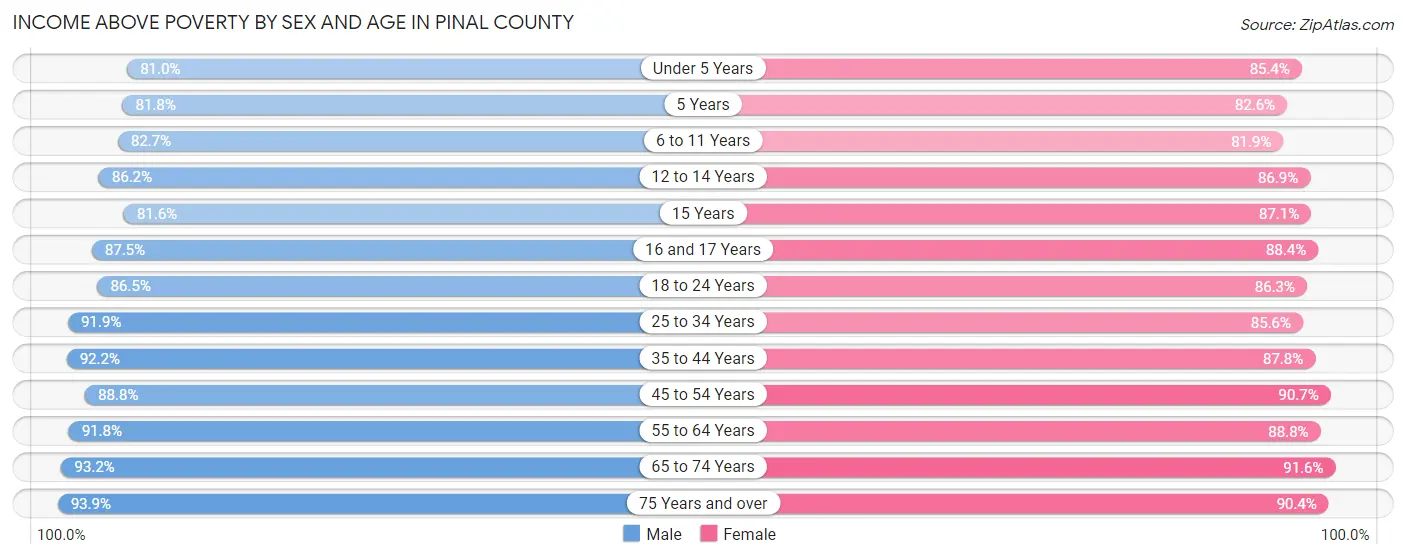
| Age Bracket | Male | Female |
| Under 5 Years | 9,254 (80.9%) | 9,375 (85.4%) |
| 5 Years | 2,112 (81.8%) | 1,902 (82.6%) |
| 6 to 11 Years | 13,398 (82.7%) | 13,044 (81.9%) |
| 12 to 14 Years | 7,470 (86.2%) | 7,485 (86.9%) |
| 15 Years | 2,185 (81.6%) | 2,761 (87.1%) |
| 16 and 17 Years | 4,989 (87.5%) | 4,304 (88.4%) |
| 18 to 24 Years | 15,690 (86.5%) | 12,968 (86.3%) |
| 25 to 34 Years | 24,168 (91.9%) | 20,859 (85.6%) |
| 35 to 44 Years | 24,035 (92.2%) | 22,248 (87.8%) |
| 45 to 54 Years | 20,833 (88.8%) | 20,320 (90.7%) |
| 55 to 64 Years | 20,295 (91.8%) | 22,896 (88.8%) |
| 65 to 74 Years | 22,709 (93.2%) | 25,686 (91.6%) |
| 75 Years and over | 16,715 (93.9%) | 16,882 (90.4%) |
| Total | 183,853 (89.4%) | 180,730 (88.0%) |
Income Below Poverty Among Married-Couple Families in Pinal County
The poverty statistics for married-couple families in Pinal County show that 4.7% or 3,956 of the total 84,411 families live below the poverty line. Families with 5 or more children have the highest poverty rate of 19.9%, comprising of 288 families. On the other hand, families with no children have the lowest poverty rate of 3.4%, which includes 1,739 families.

| Children | Above Poverty | Below Poverty |
| No Children | 50,236 (96.7%) | 1,739 (3.4%) |
| 1 or 2 Children | 20,101 (95.8%) | 891 (4.2%) |
| 3 or 4 Children | 8,955 (89.6%) | 1,038 (10.4%) |
| 5 or more Children | 1,163 (80.1%) | 288 (19.9%) |
| Total | 80,455 (95.3%) | 3,956 (4.7%) |
Income Below Poverty Among Single-Parent Households in Pinal County
According to the poverty data in Pinal County, 14.7% or 1,264 single-father households and 22.3% or 3,797 single-mother households are living below the poverty line. Among single-father households, those with 3 or 4 children have the highest poverty rate, with 306 households (36.5%) experiencing poverty. Likewise, among single-mother households, those with 5 or more children have the highest poverty rate, with 251 households (84.0%) falling below the poverty line.
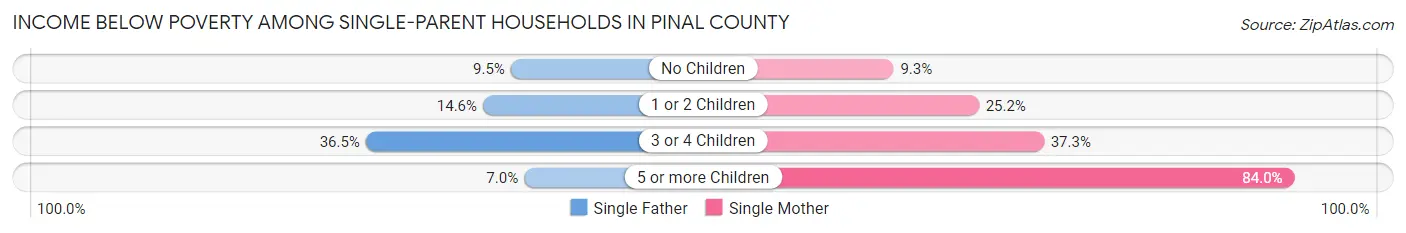
| Children | Single Father | Single Mother |
| No Children | 297 (9.5%) | 587 (9.3%) |
| 1 or 2 Children | 649 (14.6%) | 1,924 (25.2%) |
| 3 or 4 Children | 306 (36.5%) | 1,035 (37.3%) |
| 5 or more Children | 12 (7.0%) | 251 (84.0%) |
| Total | 1,264 (14.7%) | 3,797 (22.3%) |
Income Below Poverty Among Married-Couple vs Single-Parent Households in Pinal County
The poverty data for Pinal County shows that 3,956 of the married-couple family households (4.7%) and 5,061 of the single-parent households (19.7%) are living below the poverty level. Within the married-couple family households, those with 5 or more children have the highest poverty rate, with 288 households (19.9%) falling below the poverty line. Among the single-parent households, those with 5 or more children have the highest poverty rate, with 263 household (55.8%) living below poverty.
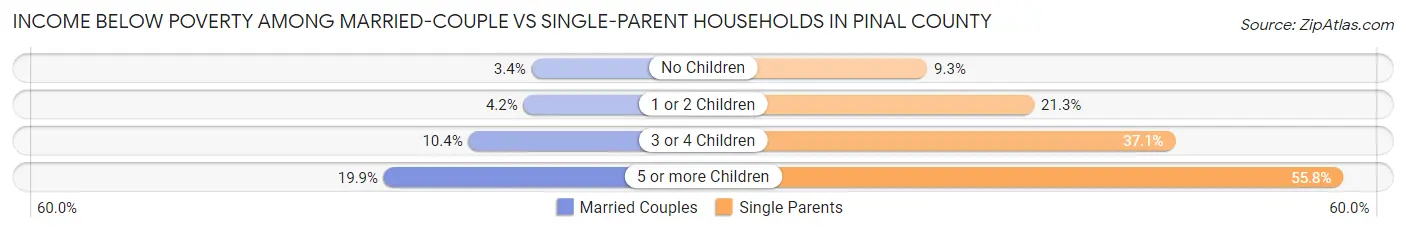
| Children | Married-Couple Families | Single-Parent Households |
| No Children | 1,739 (3.4%) | 884 (9.3%) |
| 1 or 2 Children | 891 (4.2%) | 2,573 (21.3%) |
| 3 or 4 Children | 1,038 (10.4%) | 1,341 (37.1%) |
| 5 or more Children | 288 (19.9%) | 263 (55.8%) |
| Total | 3,956 (4.7%) | 5,061 (19.7%) |
Race in Pinal County
The most populous races in Pinal County are White / Caucasian (299,613 | 69.1%), Hispanic or Latino (135,346 | 31.2%), and Two or more Races (51,326 | 11.8%).
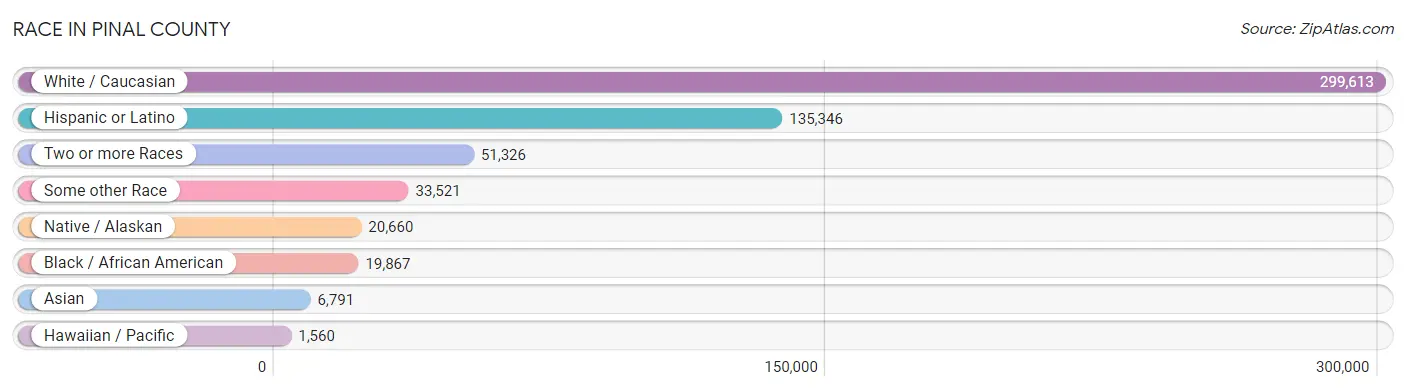
| Race | # Population | % Population |
| Asian | 6,791 | 1.6% |
| Black / African American | 19,867 | 4.6% |
| Hawaiian / Pacific | 1,560 | 0.4% |
| Hispanic or Latino | 135,346 | 31.2% |
| Native / Alaskan | 20,660 | 4.8% |
| White / Caucasian | 299,613 | 69.1% |
| Two or more Races | 51,326 | 11.8% |
| Some other Race | 33,521 | 7.7% |
| Total | 433,338 | 100.0% |
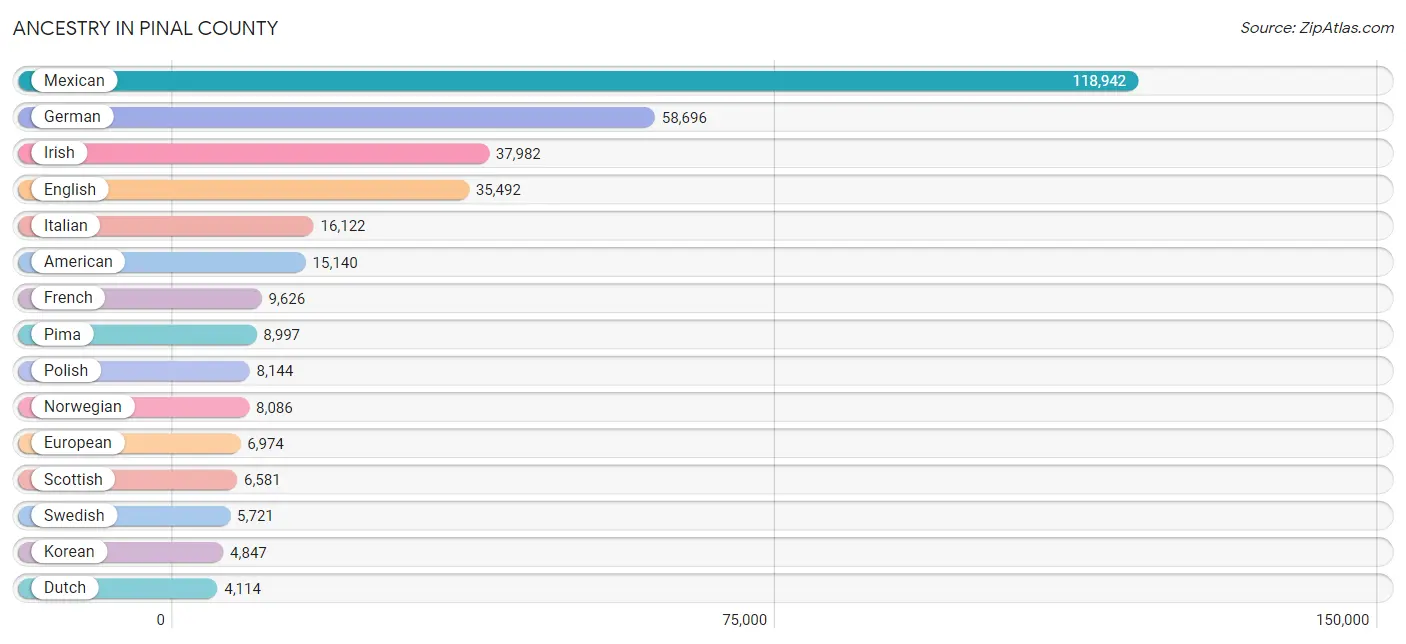
Ancestry in Pinal County
The most populous ancestries reported in Pinal County are Mexican (118,942 | 27.5%), German (58,696 | 13.6%), Irish (37,982 | 8.8%), English (35,492 | 8.2%), and Italian (16,122 | 3.7%), together accounting for 61.7% of all Pinal County residents.
| Ancestry | # Population | % Population |
| Afghan | 113 | 0.0% |
| African | 1,119 | 0.3% |
| Alaska Native | 39 | 0.0% |
| Alaskan Athabascan | 25 | 0.0% |
| Albanian | 54 | 0.0% |
| Alsatian | 12 | 0.0% |
| American | 15,140 | 3.5% |
| Apache | 1,060 | 0.2% |
| Arab | 745 | 0.2% |
| Argentinean | 59 | 0.0% |
| Armenian | 69 | 0.0% |
| Assyrian / Chaldean / Syriac | 28 | 0.0% |
| Australian | 85 | 0.0% |
| Austrian | 582 | 0.1% |
| Bangladeshi | 76 | 0.0% |
| Basque | 87 | 0.0% |
| Belgian | 627 | 0.1% |
| Belizean | 73 | 0.0% |
| Bhutanese | 1,147 | 0.3% |
| Blackfeet | 381 | 0.1% |
| Bolivian | 23 | 0.0% |
| Brazilian | 144 | 0.0% |
| British | 2,312 | 0.5% |
| Bulgarian | 34 | 0.0% |
| Burmese | 1,193 | 0.3% |
| Cajun | 9 | 0.0% |
| Cambodian | 23 | 0.0% |
| Canadian | 1,206 | 0.3% |
| Cape Verdean | 19 | 0.0% |
| Celtic | 60 | 0.0% |
| Central American | 3,617 | 0.8% |
| Central American Indian | 242 | 0.1% |
| Cherokee | 2,226 | 0.5% |
| Chickasaw | 153 | 0.0% |
| Chilean | 281 | 0.1% |
| Chinese | 29 | 0.0% |
| Chippewa | 84 | 0.0% |
| Choctaw | 645 | 0.2% |
| Colombian | 444 | 0.1% |
| Comanche | 55 | 0.0% |
| Costa Rican | 7 | 0.0% |
| Cree | 19 | 0.0% |
| Creek | 201 | 0.1% |
| Croatian | 416 | 0.1% |
| Cuban | 925 | 0.2% |
| Czech | 905 | 0.2% |
| Czechoslovakian | 380 | 0.1% |
| Danish | 2,826 | 0.6% |
| Dominican | 62 | 0.0% |
| Dutch | 4,114 | 0.9% |
| Dutch West Indian | 14 | 0.0% |
| Eastern European | 773 | 0.2% |
| Ecuadorian | 329 | 0.1% |
| Egyptian | 18 | 0.0% |
| English | 35,492 | 8.2% |
| Estonian | 7 | 0.0% |
| Ethiopian | 23 | 0.0% |
| European | 6,974 | 1.6% |
| Filipino | 49 | 0.0% |
| Finnish | 720 | 0.2% |
| French | 9,626 | 2.2% |
| French American Indian | 5 | 0.0% |
| French Canadian | 1,959 | 0.4% |
| German | 58,696 | 13.6% |
| German Russian | 8 | 0.0% |
| Ghanaian | 249 | 0.1% |
| Greek | 1,127 | 0.3% |
| Guamanian / Chamorro | 570 | 0.1% |
| Guatemalan | 593 | 0.1% |
| Guyanese | 9 | 0.0% |
| Haitian | 82 | 0.0% |
| Honduran | 235 | 0.1% |
| Hopi | 279 | 0.1% |
| Hungarian | 1,716 | 0.4% |
| Icelander | 6 | 0.0% |
| Indian (Asian) | 1,243 | 0.3% |
| Indonesian | 64 | 0.0% |
| Inupiat | 22 | 0.0% |
| Iranian | 450 | 0.1% |
| Iraqi | 70 | 0.0% |
| Irish | 37,982 | 8.8% |
| Iroquois | 183 | 0.0% |
| Israeli | 47 | 0.0% |
| Italian | 16,122 | 3.7% |
| Jamaican | 655 | 0.2% |
| Japanese | 70 | 0.0% |
| Jordanian | 53 | 0.0% |
| Kenyan | 17 | 0.0% |
| Kiowa | 5 | 0.0% |
| Korean | 4,847 | 1.1% |
| Laotian | 416 | 0.1% |
| Latvian | 8 | 0.0% |
| Lebanese | 190 | 0.0% |
| Liberian | 47 | 0.0% |
| Lithuanian | 460 | 0.1% |
| Luxembourger | 32 | 0.0% |
| Macedonian | 57 | 0.0% |
| Malaysian | 305 | 0.1% |
| Maltese | 19 | 0.0% |
| Mexican | 118,942 | 27.5% |
| Mexican American Indian | 460 | 0.1% |
| Moroccan | 9 | 0.0% |
| Native Hawaiian | 1,382 | 0.3% |
| Navajo | 3,779 | 0.9% |
| New Zealander | 14 | 0.0% |
| Nicaraguan | 1,484 | 0.3% |
| Nigerian | 118 | 0.0% |
| Northern European | 1,095 | 0.3% |
| Norwegian | 8,086 | 1.9% |
| Osage | 69 | 0.0% |
| Paiute | 5 | 0.0% |
| Pakistani | 269 | 0.1% |
| Palestinian | 136 | 0.0% |
| Panamanian | 117 | 0.0% |
| Pennsylvania German | 60 | 0.0% |
| Peruvian | 300 | 0.1% |
| Pima | 8,997 | 2.1% |
| Polish | 8,144 | 1.9% |
| Portuguese | 1,062 | 0.3% |
| Potawatomi | 11 | 0.0% |
| Pueblo | 58 | 0.0% |
| Puerto Rican | 2,992 | 0.7% |
| Puget Sound Salish | 17 | 0.0% |
| Romanian | 598 | 0.1% |
| Russian | 1,616 | 0.4% |
| Salvadoran | 1,142 | 0.3% |
| Samoan | 332 | 0.1% |
| Scandinavian | 1,766 | 0.4% |
| Scotch-Irish | 2,814 | 0.6% |
| Scottish | 6,581 | 1.5% |
| Serbian | 157 | 0.0% |
| Sioux | 456 | 0.1% |
| Slavic | 225 | 0.1% |
| Slovak | 311 | 0.1% |
| Slovene | 545 | 0.1% |
| South African | 29 | 0.0% |
| South American | 1,537 | 0.4% |
| Spaniard | 2,012 | 0.5% |
| Spanish | 1,963 | 0.4% |
| Sri Lankan | 671 | 0.2% |
| Subsaharan African | 1,711 | 0.4% |
| Sudanese | 47 | 0.0% |
| Swedish | 5,721 | 1.3% |
| Swiss | 1,100 | 0.3% |
| Syrian | 131 | 0.0% |
| Thai | 799 | 0.2% |
| Tohono O'Odham | 2,531 | 0.6% |
| Tongan | 560 | 0.1% |
| Trinidadian and Tobagonian | 8 | 0.0% |
| Turkish | 28 | 0.0% |
| Ukrainian | 711 | 0.2% |
| Venezuelan | 101 | 0.0% |
| Welsh | 2,713 | 0.6% |
| West Indian | 71 | 0.0% |
| Yaqui | 1,448 | 0.3% |
| Yugoslavian | 290 | 0.1% |
| Yuman | 133 | 0.0% |
| Yup'ik | 11 | 0.0% | View All 158 Rows |
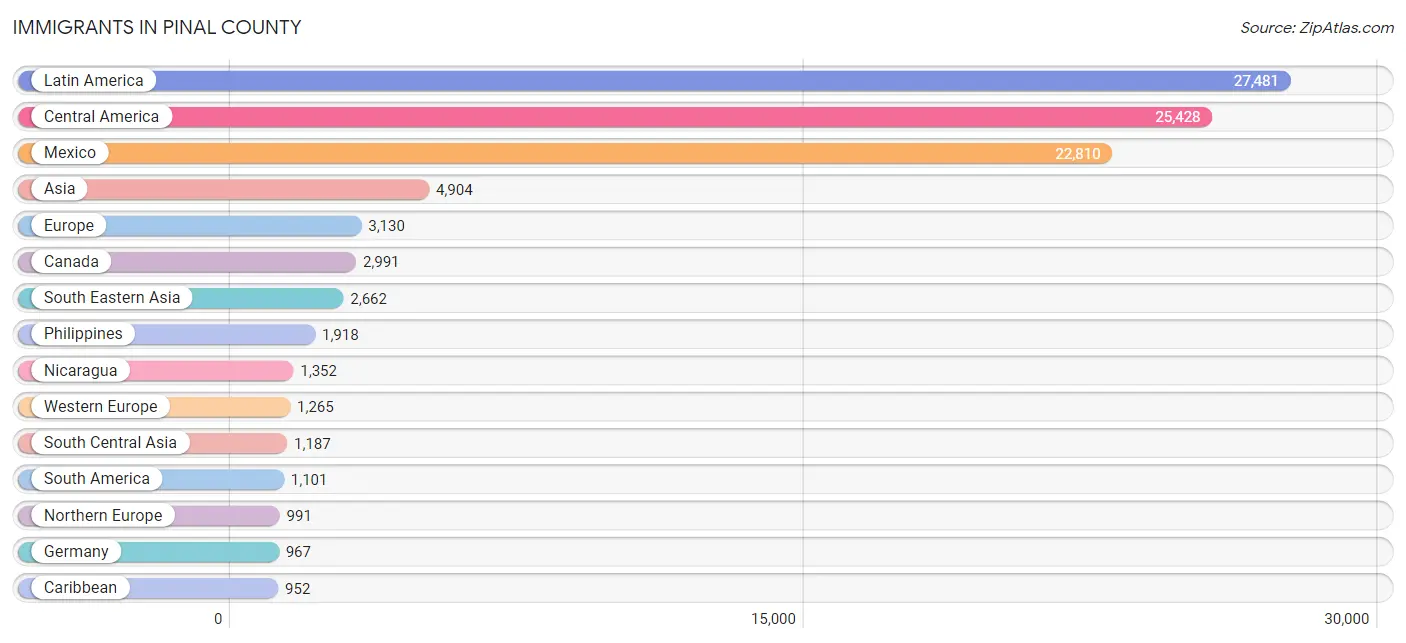
Immigrants in Pinal County
The most numerous immigrant groups reported in Pinal County came from Latin America (27,481 | 6.3%), Central America (25,428 | 5.9%), Mexico (22,810 | 5.3%), Asia (4,904 | 1.1%), and Europe (3,130 | 0.7%), together accounting for 19.3% of all Pinal County residents.
| Immigration Origin | # Population | % Population |
| Afghanistan | 91 | 0.0% |
| Africa | 859 | 0.2% |
| Argentina | 30 | 0.0% |
| Asia | 4,904 | 1.1% |
| Australia | 64 | 0.0% |
| Austria | 71 | 0.0% |
| Belarus | 8 | 0.0% |
| Belize | 80 | 0.0% |
| Bolivia | 23 | 0.0% |
| Brazil | 125 | 0.0% |
| Bulgaria | 29 | 0.0% |
| Cambodia | 17 | 0.0% |
| Canada | 2,991 | 0.7% |
| Caribbean | 952 | 0.2% |
| Central America | 25,428 | 5.9% |
| Chile | 119 | 0.0% |
| China | 181 | 0.0% |
| Colombia | 351 | 0.1% |
| Congo | 1 | 0.0% |
| Costa Rica | 7 | 0.0% |
| Cuba | 451 | 0.1% |
| Czechoslovakia | 14 | 0.0% |
| Denmark | 40 | 0.0% |
| Dominica | 42 | 0.0% |
| Dominican Republic | 25 | 0.0% |
| Eastern Africa | 319 | 0.1% |
| Eastern Asia | 807 | 0.2% |
| Eastern Europe | 587 | 0.1% |
| Ecuador | 143 | 0.0% |
| Egypt | 12 | 0.0% |
| El Salvador | 635 | 0.2% |
| England | 463 | 0.1% |
| Eritrea | 11 | 0.0% |
| Ethiopia | 16 | 0.0% |
| Europe | 3,130 | 0.7% |
| Fiji | 65 | 0.0% |
| France | 105 | 0.0% |
| Germany | 967 | 0.2% |
| Ghana | 48 | 0.0% |
| Greece | 35 | 0.0% |
| Guatemala | 356 | 0.1% |
| Guyana | 5 | 0.0% |
| Haiti | 92 | 0.0% |
| Honduras | 150 | 0.0% |
| Hungary | 43 | 0.0% |
| India | 677 | 0.2% |
| Indonesia | 62 | 0.0% |
| Iran | 359 | 0.1% |
| Iraq | 69 | 0.0% |
| Ireland | 40 | 0.0% |
| Israel | 25 | 0.0% |
| Italy | 104 | 0.0% |
| Jamaica | 272 | 0.1% |
| Japan | 135 | 0.0% |
| Jordan | 54 | 0.0% |
| Kazakhstan | 17 | 0.0% |
| Kenya | 208 | 0.1% |
| Korea | 468 | 0.1% |
| Kuwait | 18 | 0.0% |
| Laos | 142 | 0.0% |
| Latin America | 27,481 | 6.3% |
| Lebanon | 19 | 0.0% |
| Liberia | 47 | 0.0% |
| Lithuania | 6 | 0.0% |
| Malaysia | 5 | 0.0% |
| Mexico | 22,810 | 5.3% |
| Middle Africa | 1 | 0.0% |
| Morocco | 7 | 0.0% |
| Netherlands | 112 | 0.0% |
| Nicaragua | 1,352 | 0.3% |
| Nigeria | 217 | 0.1% |
| Northern Africa | 132 | 0.0% |
| Northern Europe | 991 | 0.2% |
| Oceania | 349 | 0.1% |
| Pakistan | 36 | 0.0% |
| Panama | 26 | 0.0% |
| Peru | 211 | 0.1% |
| Philippines | 1,918 | 0.4% |
| Poland | 205 | 0.1% |
| Portugal | 89 | 0.0% |
| Romania | 126 | 0.0% |
| Russia | 47 | 0.0% |
| Scotland | 64 | 0.0% |
| Sierra Leone | 24 | 0.0% |
| South Africa | 64 | 0.0% |
| South America | 1,101 | 0.3% |
| South Central Asia | 1,187 | 0.3% |
| South Eastern Asia | 2,662 | 0.6% |
| Southern Europe | 287 | 0.1% |
| Spain | 59 | 0.0% |
| Sudan | 47 | 0.0% |
| Sweden | 49 | 0.0% |
| Switzerland | 10 | 0.0% |
| Syria | 14 | 0.0% |
| Taiwan | 61 | 0.0% |
| Thailand | 140 | 0.0% |
| Trinidad and Tobago | 70 | 0.0% |
| Uganda | 8 | 0.0% |
| Ukraine | 41 | 0.0% |
| Uzbekistan | 7 | 0.0% |
| Venezuela | 94 | 0.0% |
| Vietnam | 378 | 0.1% |
| Western Africa | 336 | 0.1% |
| Western Asia | 199 | 0.1% |
| Western Europe | 1,265 | 0.3% | View All 105 Rows |
Sex and Age in Pinal County
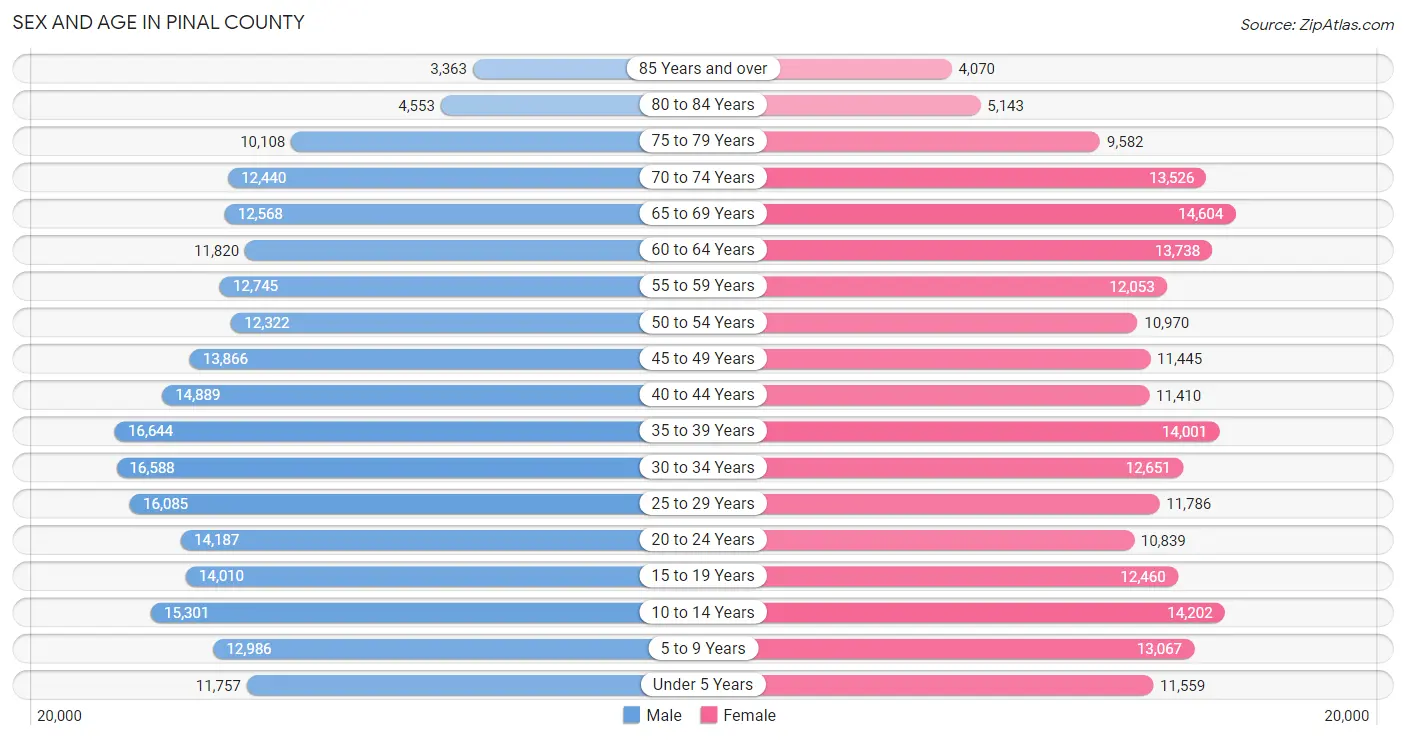
Sex and Age in Pinal County
The most populous age groups in Pinal County are 35 to 39 Years (16,644 | 7.4%) for men and 65 to 69 Years (14,604 | 7.0%) for women.
| Age Bracket | Male | Female |
| Under 5 Years | 11,757 (5.2%) | 11,559 (5.6%) |
| 5 to 9 Years | 12,986 (5.7%) | 13,067 (6.3%) |
| 10 to 14 Years | 15,301 (6.8%) | 14,202 (6.9%) |
| 15 to 19 Years | 14,010 (6.2%) | 12,460 (6.0%) |
| 20 to 24 Years | 14,187 (6.3%) | 10,839 (5.2%) |
| 25 to 29 Years | 16,085 (7.1%) | 11,786 (5.7%) |
| 30 to 34 Years | 16,588 (7.3%) | 12,651 (6.1%) |
| 35 to 39 Years | 16,644 (7.4%) | 14,001 (6.8%) |
| 40 to 44 Years | 14,889 (6.6%) | 11,410 (5.5%) |
| 45 to 49 Years | 13,866 (6.1%) | 11,445 (5.5%) |
| 50 to 54 Years | 12,322 (5.4%) | 10,970 (5.3%) |
| 55 to 59 Years | 12,745 (5.6%) | 12,053 (5.8%) |
| 60 to 64 Years | 11,820 (5.2%) | 13,738 (6.6%) |
| 65 to 69 Years | 12,568 (5.6%) | 14,604 (7.0%) |
| 70 to 74 Years | 12,440 (5.5%) | 13,526 (6.5%) |
| 75 to 79 Years | 10,108 (4.5%) | 9,582 (4.6%) |
| 80 to 84 Years | 4,553 (2.0%) | 5,143 (2.5%) |
| 85 Years and over | 3,363 (1.5%) | 4,070 (2.0%) |
| Total | 226,232 (100.0%) | 207,106 (100.0%) |
Families and Households in Pinal County
Median Family Size in Pinal County
The median family size in Pinal County is 3.14 persons per family, with single female/mother families (17,062 | 15.5%) accounting for the largest median family size of 3.31 persons per family. On the other hand, single male/father families (8,583 | 7.8%) represent the smallest median family size with 2.96 persons per family.
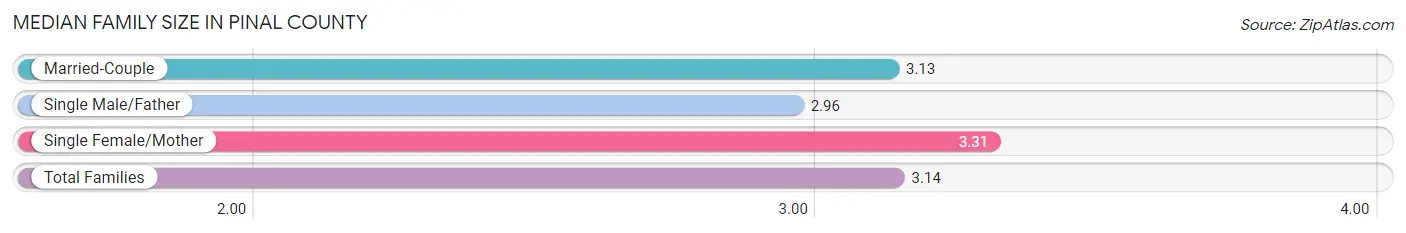
| Family Type | # Families | Family Size |
| Married-Couple | 84,411 (76.7%) | 3.13 |
| Single Male/Father | 8,583 (7.8%) | 2.96 |
| Single Female/Mother | 17,062 (15.5%) | 3.31 |
| Total Families | 110,056 (100.0%) | 3.14 |
Median Household Size in Pinal County
The median household size in Pinal County is 2.72 persons per household, with single female/mother households (17,062 | 11.3%) accounting for the largest median household size of 3.66 persons per household. non-family households (41,434 | 27.4%) represent the smallest median household size with 1.30 persons per household.
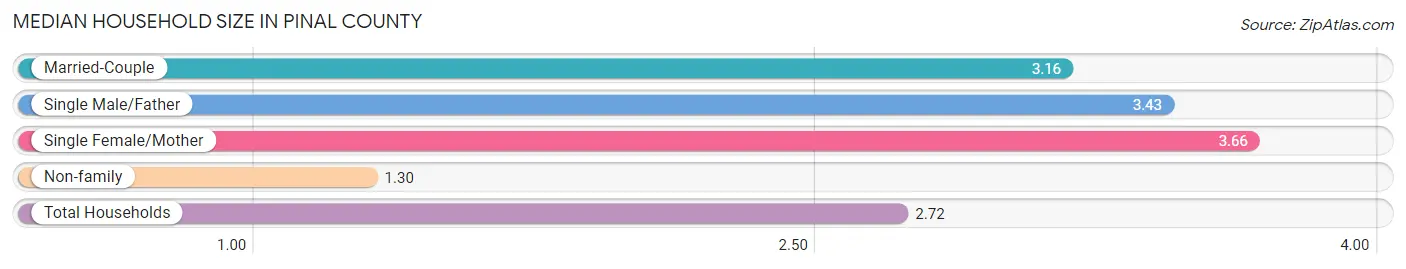
| Household Type | # Households | Household Size |
| Married-Couple | 84,411 (55.7%) | 3.16 |
| Single Male/Father | 8,583 (5.7%) | 3.43 |
| Single Female/Mother | 17,062 (11.3%) | 3.66 |
| Non-family | 41,434 (27.4%) | 1.30 |
| Total Households | 151,490 (100.0%) | 2.72 |
Household Size by Marriage Status in Pinal County
Out of a total of 151,490 households in Pinal County, 110,056 (72.7%) are family households, while 41,434 (27.4%) are nonfamily households. The most numerous type of family households are 2-person households, comprising 50,817, and the most common type of nonfamily households are 1-person households, comprising 31,954.
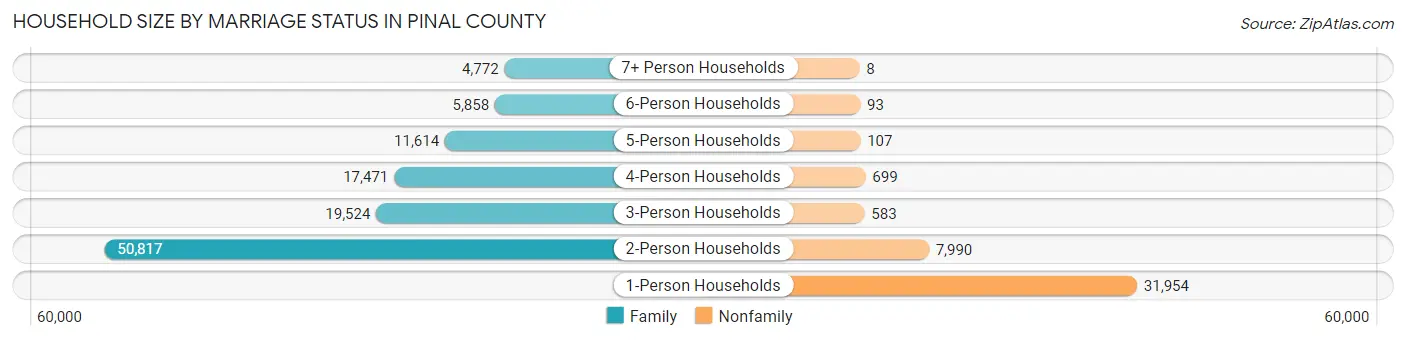
| Household Size | Family Households | Nonfamily Households |
| 1-Person Households | - | 31,954 (21.1%) |
| 2-Person Households | 50,817 (33.5%) | 7,990 (5.3%) |
| 3-Person Households | 19,524 (12.9%) | 583 (0.4%) |
| 4-Person Households | 17,471 (11.5%) | 699 (0.5%) |
| 5-Person Households | 11,614 (7.7%) | 107 (0.1%) |
| 6-Person Households | 5,858 (3.9%) | 93 (0.1%) |
| 7+ Person Households | 4,772 (3.2%) | 8 (0.0%) |
| Total | 110,056 (72.7%) | 41,434 (27.4%) |
Female Fertility in Pinal County
Fertility by Age in Pinal County
Average fertility rate in Pinal County is 70.0 births per 1,000 women. Women in the age bracket of 20 to 34 years have the highest fertility rate with 135.0 births per 1,000 women. Women in the age bracket of 20 to 34 years acount for 77.5% of all women with births.
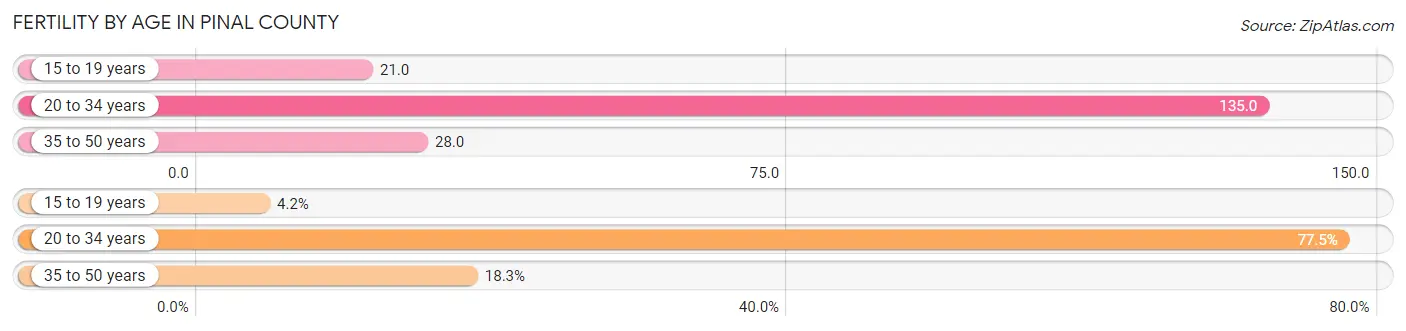
| Age Bracket | Women with Births | Births / 1,000 Women |
| 15 to 19 years | 258 (4.2%) | 21.0 |
| 20 to 34 years | 4,748 (77.5%) | 135.0 |
| 35 to 50 years | 1,122 (18.3%) | 28.0 |
| Total | 6,128 (100.0%) | 70.0 |
Fertility by Age by Marriage Status in Pinal County
67.7% of women with births (6,128) in Pinal County are married. The highest percentage of unmarried women with births falls into 15 to 19 years age bracket with 100.0% of them unmarried at the time of birth, while the lowest percentage of unmarried women with births belong to 35 to 50 years age bracket with 9.8% of them unmarried.
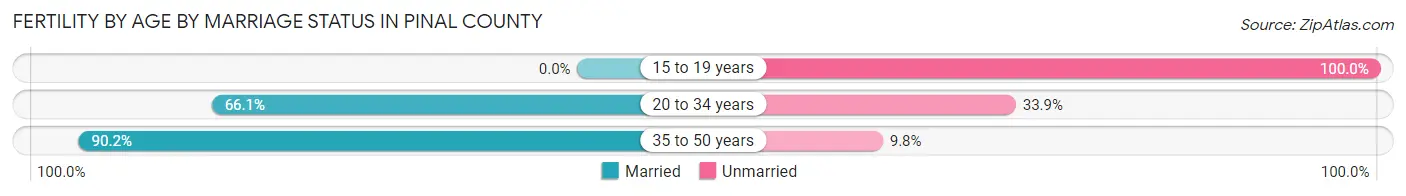
| Age Bracket | Married | Unmarried |
| 15 to 19 years | 0 (0.0%) | 258 (100.0%) |
| 20 to 34 years | 3,138 (66.1%) | 1,610 (33.9%) |
| 35 to 50 years | 1,012 (90.2%) | 110 (9.8%) |
| Total | 4,149 (67.7%) | 1,979 (32.3%) |
Fertility by Education in Pinal County
Average fertility rate in Pinal County is 70.0 births per 1,000 women. Women with the education attainment of bachelor's degree have the highest fertility rate of 108.0 births per 1,000 women, while women with the education attainment of graduate degree have the lowest fertility at 40.0 births per 1,000 women. Women with the education attainment of college or associate's degree represent 39.9% of all women with births.
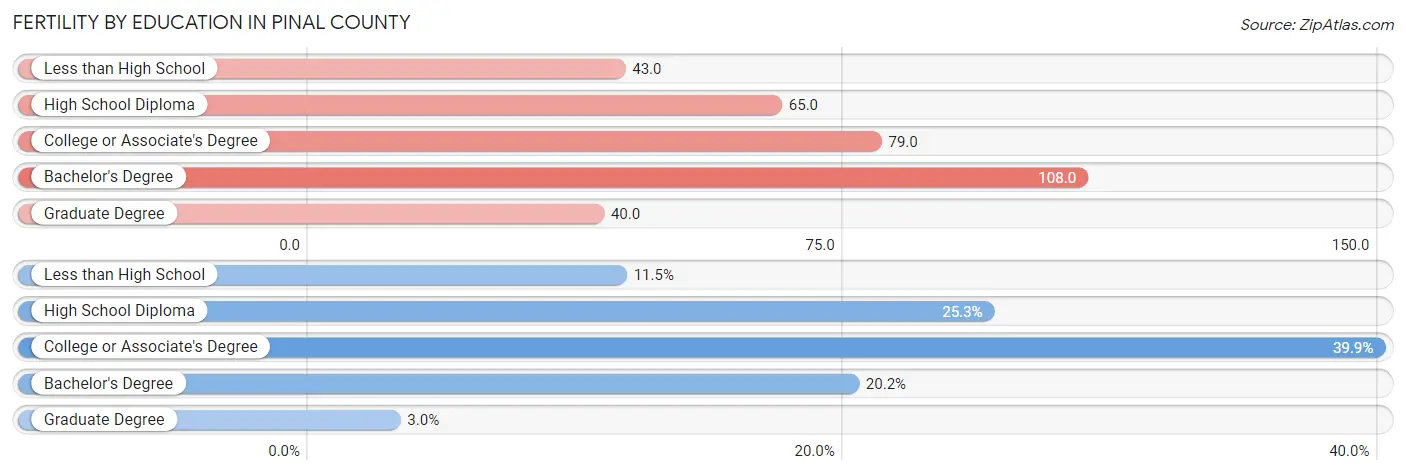
| Educational Attainment | Women with Births | Births / 1,000 Women |
| Less than High School | 706 (11.5%) | 43.0 |
| High School Diploma | 1,550 (25.3%) | 65.0 |
| College or Associate's Degree | 2,447 (39.9%) | 79.0 |
| Bachelor's Degree | 1,239 (20.2%) | 108.0 |
| Graduate Degree | 186 (3.0%) | 40.0 |
| Total | 6,128 (100.0%) | 70.0 |
Fertility by Education by Marriage Status in Pinal County
32.3% of women with births in Pinal County are unmarried. Women with the educational attainment of graduate degree are most likely to be married with 95.7% of them married at childbirth, while women with the educational attainment of less than high school are least likely to be married with 52.1% of them unmarried at childbirth.
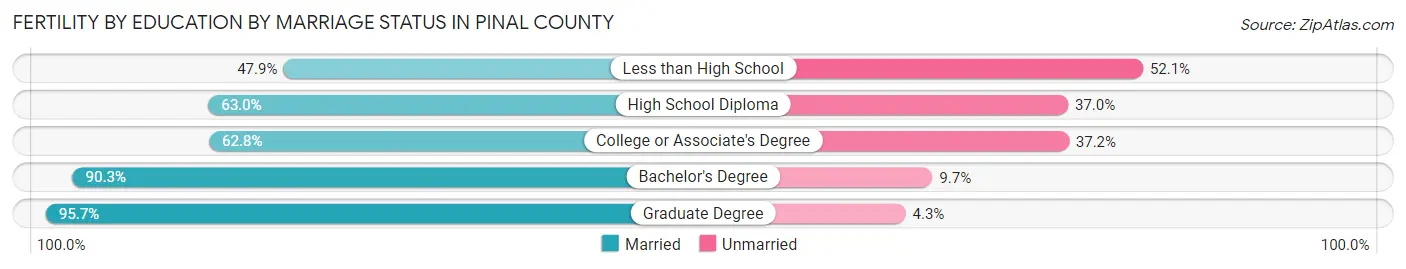
| Educational Attainment | Married | Unmarried |
| Less than High School | 338 (47.9%) | 368 (52.1%) |
| High School Diploma | 976 (63.0%) | 574 (37.0%) |
| College or Associate's Degree | 1,537 (62.8%) | 910 (37.2%) |
| Bachelor's Degree | 1,119 (90.3%) | 120 (9.7%) |
| Graduate Degree | 178 (95.7%) | 8 (4.3%) |
| Total | 4,149 (67.7%) | 1,979 (32.3%) |
Employment Characteristics in Pinal County
Employment by Class of Employer in Pinal County
Among the 167,486 employed individuals in Pinal County, private company employees (118,011 | 70.5%), local government employees (13,446 | 8.0%), and not-for-profit organizations (9,555 | 5.7%) make up the most common classes of employment.
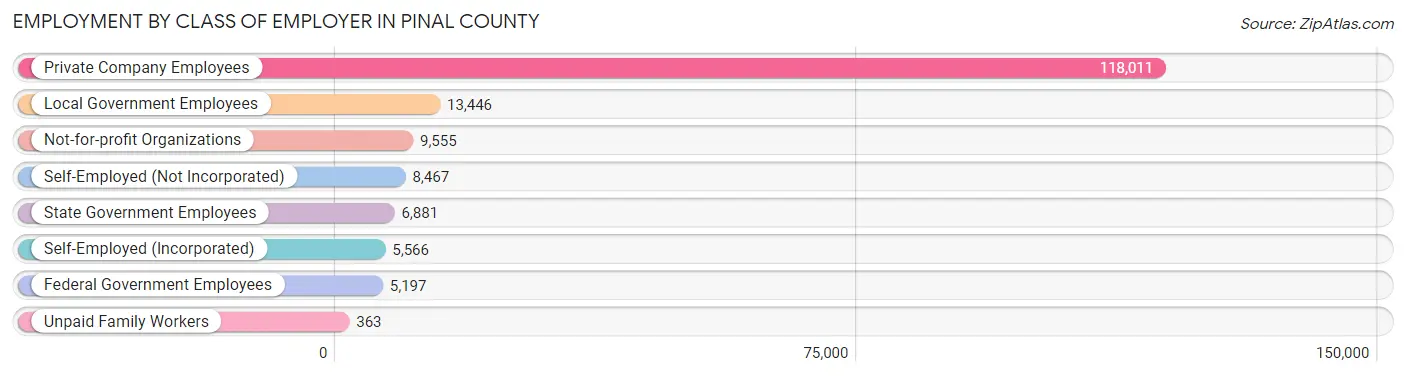
| Employer Class | # Employees | % Employees |
| Private Company Employees | 118,011 | 70.5% |
| Self-Employed (Incorporated) | 5,566 | 3.3% |
| Self-Employed (Not Incorporated) | 8,467 | 5.1% |
| Not-for-profit Organizations | 9,555 | 5.7% |
| Local Government Employees | 13,446 | 8.0% |
| State Government Employees | 6,881 | 4.1% |
| Federal Government Employees | 5,197 | 3.1% |
| Unpaid Family Workers | 363 | 0.2% |
| Total | 167,486 | 100.0% |
Employment Status by Age in Pinal County
According to the labor force statistics for Pinal County, out of the total population over 16 years of age (348,601), 52.6% or 183,364 individuals are in the labor force, with 6.4% or 11,735 of them unemployed. The age group with the highest labor force participation rate is 45 to 54 years, with 74.4% or 36,161 individuals in the labor force. Within the labor force, the 20 to 24 years age range has the highest percentage of unemployed individuals, with 13.5% or 2,449 of them being unemployed.
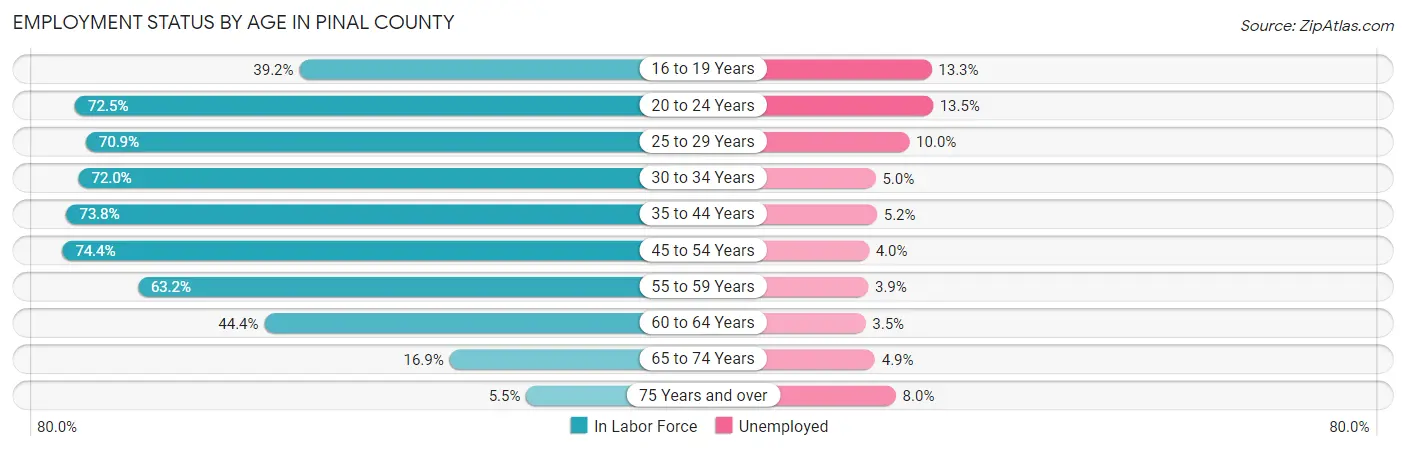
| Age Bracket | In Labor Force | Unemployed |
| 16 to 19 Years | 8,077 (39.2%) | 1,074 (13.3%) |
| 20 to 24 Years | 18,144 (72.5%) | 2,449 (13.5%) |
| 25 to 29 Years | 19,761 (70.9%) | 1,976 (10.0%) |
| 30 to 34 Years | 21,052 (72.0%) | 1,053 (5.0%) |
| 35 to 44 Years | 42,025 (73.8%) | 2,185 (5.2%) |
| 45 to 54 Years | 36,161 (74.4%) | 1,446 (4.0%) |
| 55 to 59 Years | 15,672 (63.2%) | 611 (3.9%) |
| 60 to 64 Years | 11,348 (44.4%) | 397 (3.5%) |
| 65 to 74 Years | 8,980 (16.9%) | 440 (4.9%) |
| 75 Years and over | 2,025 (5.5%) | 162 (8.0%) |
| Total | 183,364 (52.6%) | 11,735 (6.4%) |
Employment Status by Educational Attainment in Pinal County
According to labor force statistics for Pinal County, 68.6% of individuals (146,127) out of the total population between 25 and 64 years of age (213,013) are in the labor force, with 5.3% or 7,745 of them being unemployed. The group with the highest labor force participation rate are those with the educational attainment of bachelor's degree or higher, with 80.2% or 33,520 individuals in the labor force. Within the labor force, individuals with less than high school education have the highest percentage of unemployment, with 10.6% or 1,365 of them being unemployed.
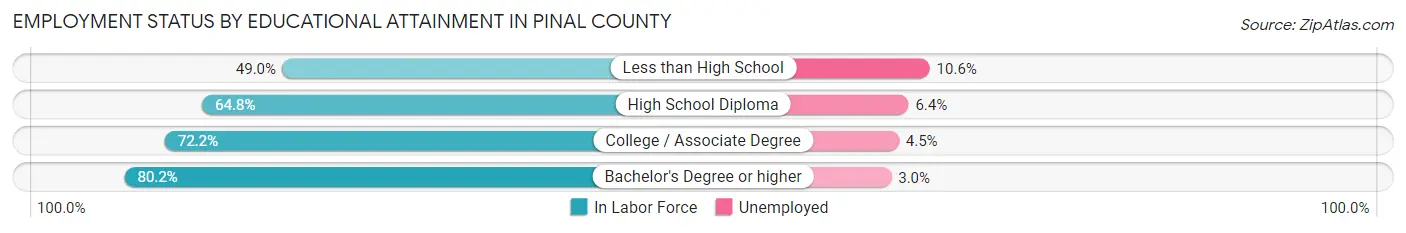
| Educational Attainment | In Labor Force | Unemployed |
| Less than High School | 12,873 (49.0%) | 2,785 (10.6%) |
| High School Diploma | 43,771 (64.8%) | 4,323 (6.4%) |
| College / Associate Degree | 55,881 (72.2%) | 3,483 (4.5%) |
| Bachelor's Degree or higher | 33,520 (80.2%) | 1,254 (3.0%) |
| Total | 146,127 (68.6%) | 11,290 (5.3%) |
Employment Occupations by Sex in Pinal County
Management, Business, Science and Arts Occupations
The most common Management, Business, Science and Arts occupations in Pinal County are Management (17,080 | 10.0%), Community & Social Service (13,540 | 7.9%), Business & Financial (10,022 | 5.9%), Computers, Engineering & Science (8,681 | 5.1%), and Education Instruction & Library (8,175 | 4.8%).
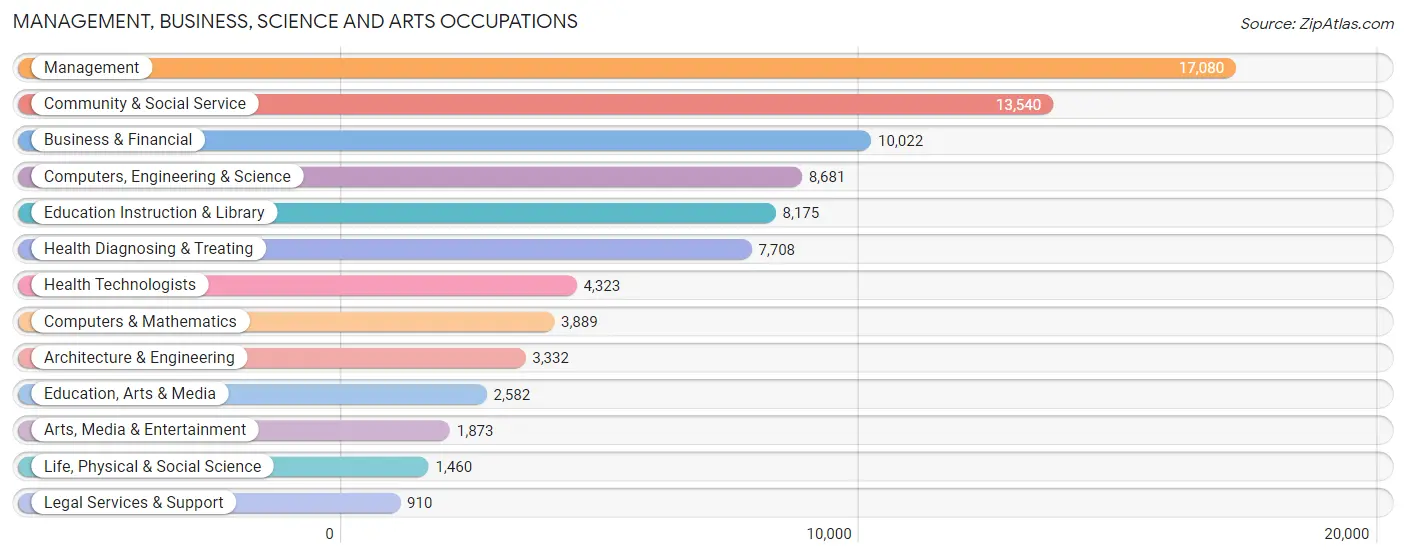
Management, Business, Science and Arts Occupations by Sex
Within the Management, Business, Science and Arts occupations in Pinal County, the most male-oriented occupations are Architecture & Engineering (88.1%), Computers, Engineering & Science (79.7%), and Computers & Mathematics (77.2%), while the most female-oriented occupations are Legal Services & Support (83.6%), Health Technologists (80.9%), and Education Instruction & Library (80.0%).
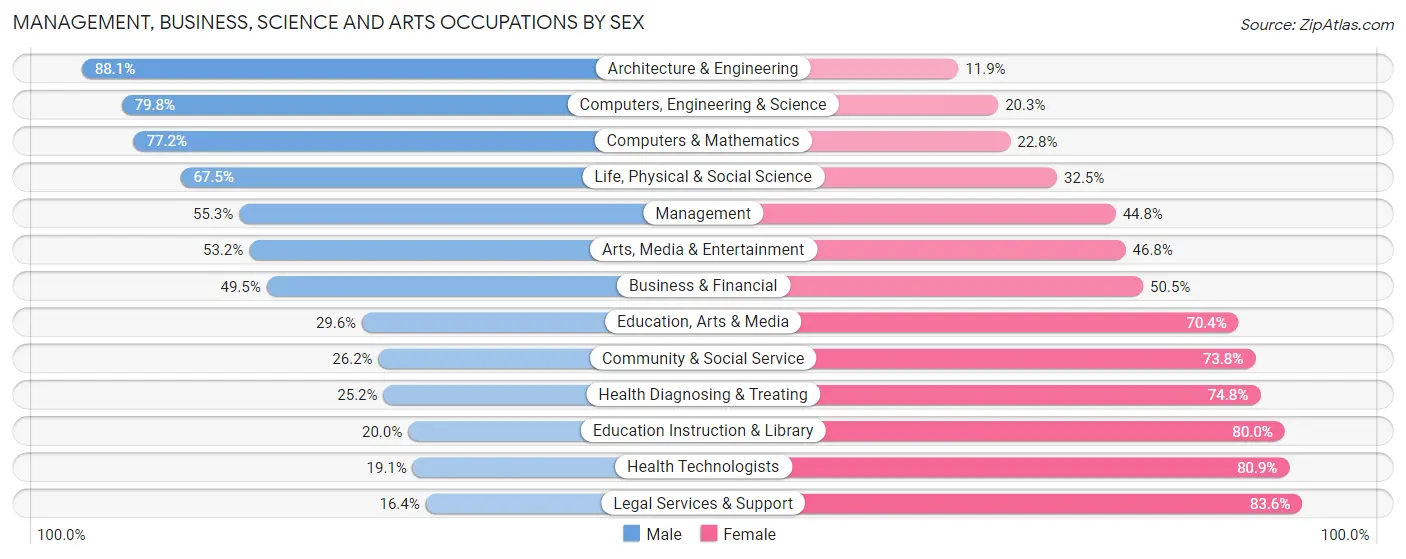
| Occupation | Male | Female |
| Management | 9,436 (55.2%) | 7,644 (44.8%) |
| Business & Financial | 4,963 (49.5%) | 5,059 (50.5%) |
| Computers, Engineering & Science | 6,923 (79.7%) | 1,758 (20.3%) |
| Computers & Mathematics | 3,004 (77.2%) | 885 (22.8%) |
| Architecture & Engineering | 2,934 (88.1%) | 398 (11.9%) |
| Life, Physical & Social Science | 985 (67.5%) | 475 (32.5%) |
| Community & Social Service | 3,546 (26.2%) | 9,994 (73.8%) |
| Education, Arts & Media | 765 (29.6%) | 1,817 (70.4%) |
| Legal Services & Support | 149 (16.4%) | 761 (83.6%) |
| Education Instruction & Library | 1,636 (20.0%) | 6,539 (80.0%) |
| Arts, Media & Entertainment | 996 (53.2%) | 877 (46.8%) |
| Health Diagnosing & Treating | 1,939 (25.2%) | 5,769 (74.8%) |
| Health Technologists | 824 (19.1%) | 3,499 (80.9%) |
| Total (Category) | 26,807 (47.0%) | 30,224 (53.0%) |
| Total (Overall) | 93,996 (55.0%) | 76,776 (45.0%) |
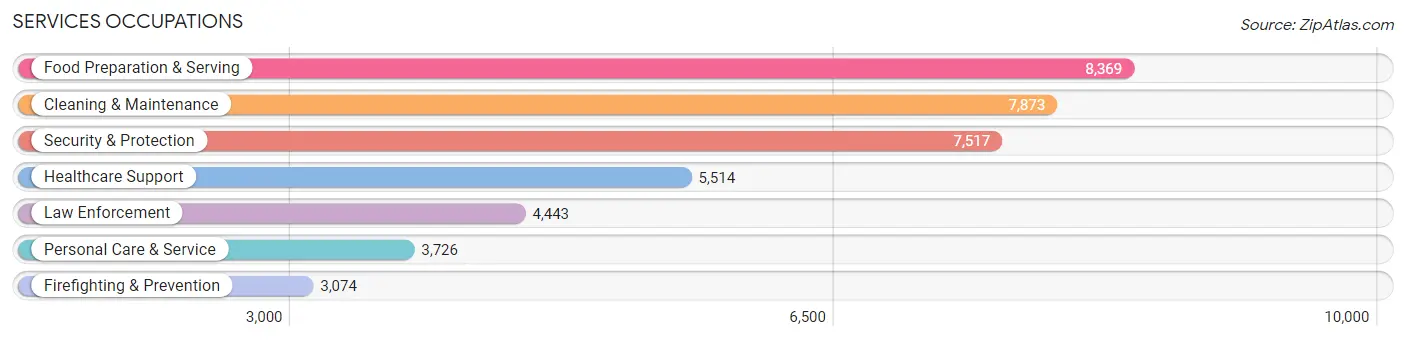
Services Occupations
The most common Services occupations in Pinal County are Food Preparation & Serving (8,369 | 4.9%), Cleaning & Maintenance (7,873 | 4.6%), Security & Protection (7,517 | 4.4%), Healthcare Support (5,514 | 3.2%), and Law Enforcement (4,443 | 2.6%).
Services Occupations by Sex
Within the Services occupations in Pinal County, the most male-oriented occupations are Law Enforcement (81.2%), Security & Protection (77.0%), and Firefighting & Prevention (70.9%), while the most female-oriented occupations are Healthcare Support (84.5%), Personal Care & Service (76.9%), and Food Preparation & Serving (52.8%).
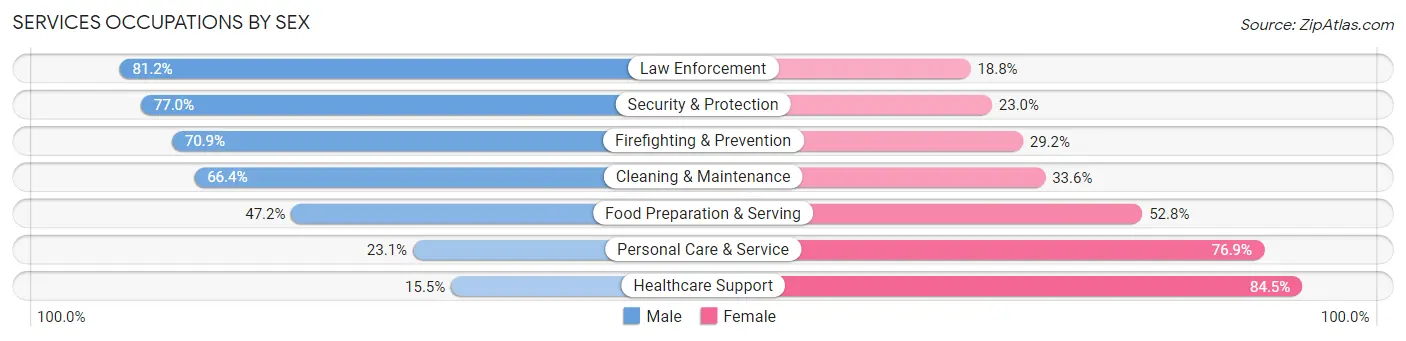
| Occupation | Male | Female |
| Healthcare Support | 857 (15.5%) | 4,657 (84.5%) |
| Security & Protection | 5,786 (77.0%) | 1,731 (23.0%) |
| Firefighting & Prevention | 2,178 (70.9%) | 896 (29.1%) |
| Law Enforcement | 3,608 (81.2%) | 835 (18.8%) |
| Food Preparation & Serving | 3,949 (47.2%) | 4,420 (52.8%) |
| Cleaning & Maintenance | 5,228 (66.4%) | 2,645 (33.6%) |
| Personal Care & Service | 861 (23.1%) | 2,865 (76.9%) |
| Total (Category) | 16,681 (50.5%) | 16,318 (49.4%) |
| Total (Overall) | 93,996 (55.0%) | 76,776 (45.0%) |
Sales and Office Occupations
The most common Sales and Office occupations in Pinal County are Office & Administration (21,512 | 12.6%), and Sales & Related (16,056 | 9.4%).

Sales and Office Occupations by Sex

| Occupation | Male | Female |
| Sales & Related | 7,943 (49.5%) | 8,113 (50.5%) |
| Office & Administration | 5,224 (24.3%) | 16,288 (75.7%) |
| Total (Category) | 13,167 (35.0%) | 24,401 (64.9%) |
| Total (Overall) | 93,996 (55.0%) | 76,776 (45.0%) |
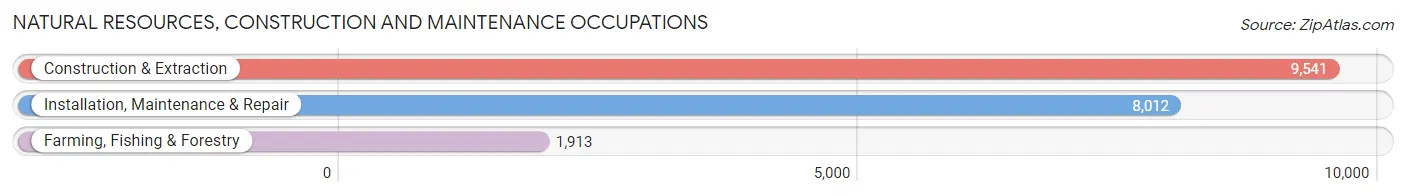
Natural Resources, Construction and Maintenance Occupations
The most common Natural Resources, Construction and Maintenance occupations in Pinal County are Construction & Extraction (9,541 | 5.6%), Installation, Maintenance & Repair (8,012 | 4.7%), and Farming, Fishing & Forestry (1,913 | 1.1%).
Natural Resources, Construction and Maintenance Occupations by Sex
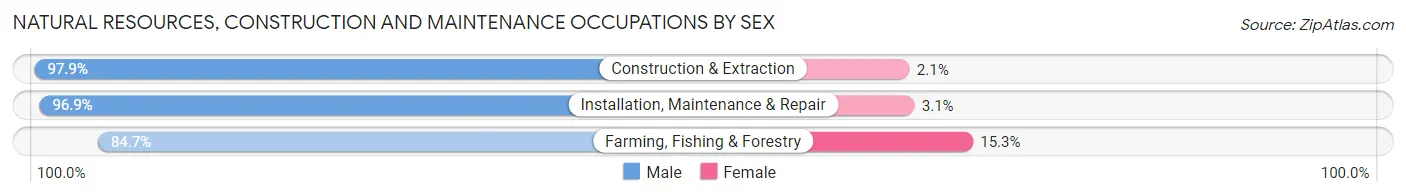
| Occupation | Male | Female |
| Farming, Fishing & Forestry | 1,621 (84.7%) | 292 (15.3%) |
| Construction & Extraction | 9,343 (97.9%) | 198 (2.1%) |
| Installation, Maintenance & Repair | 7,764 (96.9%) | 248 (3.1%) |
| Total (Category) | 18,728 (96.2%) | 738 (3.8%) |
| Total (Overall) | 93,996 (55.0%) | 76,776 (45.0%) |
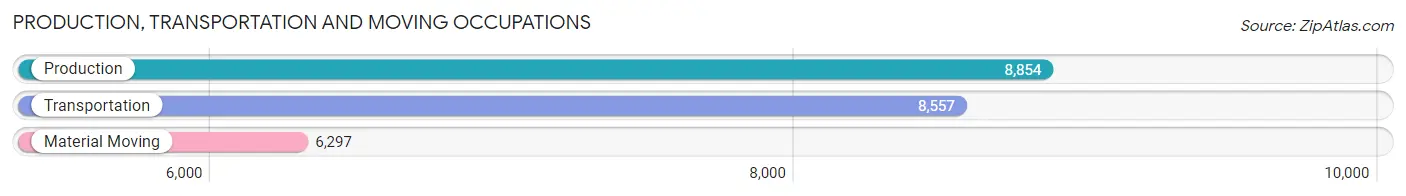
Production, Transportation and Moving Occupations
The most common Production, Transportation and Moving occupations in Pinal County are Production (8,854 | 5.2%), Transportation (8,557 | 5.0%), and Material Moving (6,297 | 3.7%).
Production, Transportation and Moving Occupations by Sex
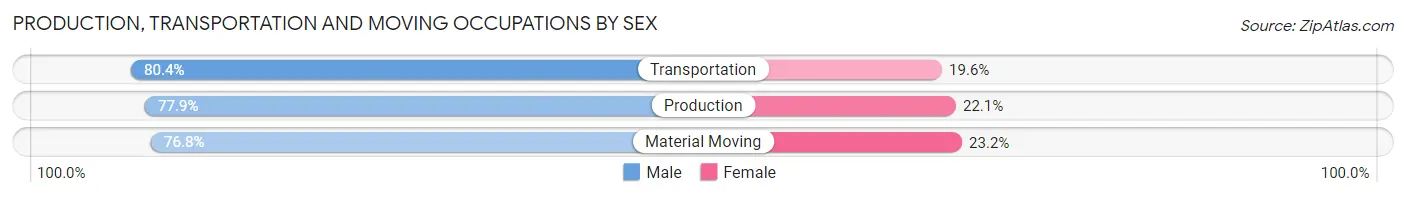
| Occupation | Male | Female |
| Production | 6,896 (77.9%) | 1,958 (22.1%) |
| Transportation | 6,883 (80.4%) | 1,674 (19.6%) |
| Material Moving | 4,834 (76.8%) | 1,463 (23.2%) |
| Total (Category) | 18,613 (78.5%) | 5,095 (21.5%) |
| Total (Overall) | 93,996 (55.0%) | 76,776 (45.0%) |
Employment Industries by Sex in Pinal County
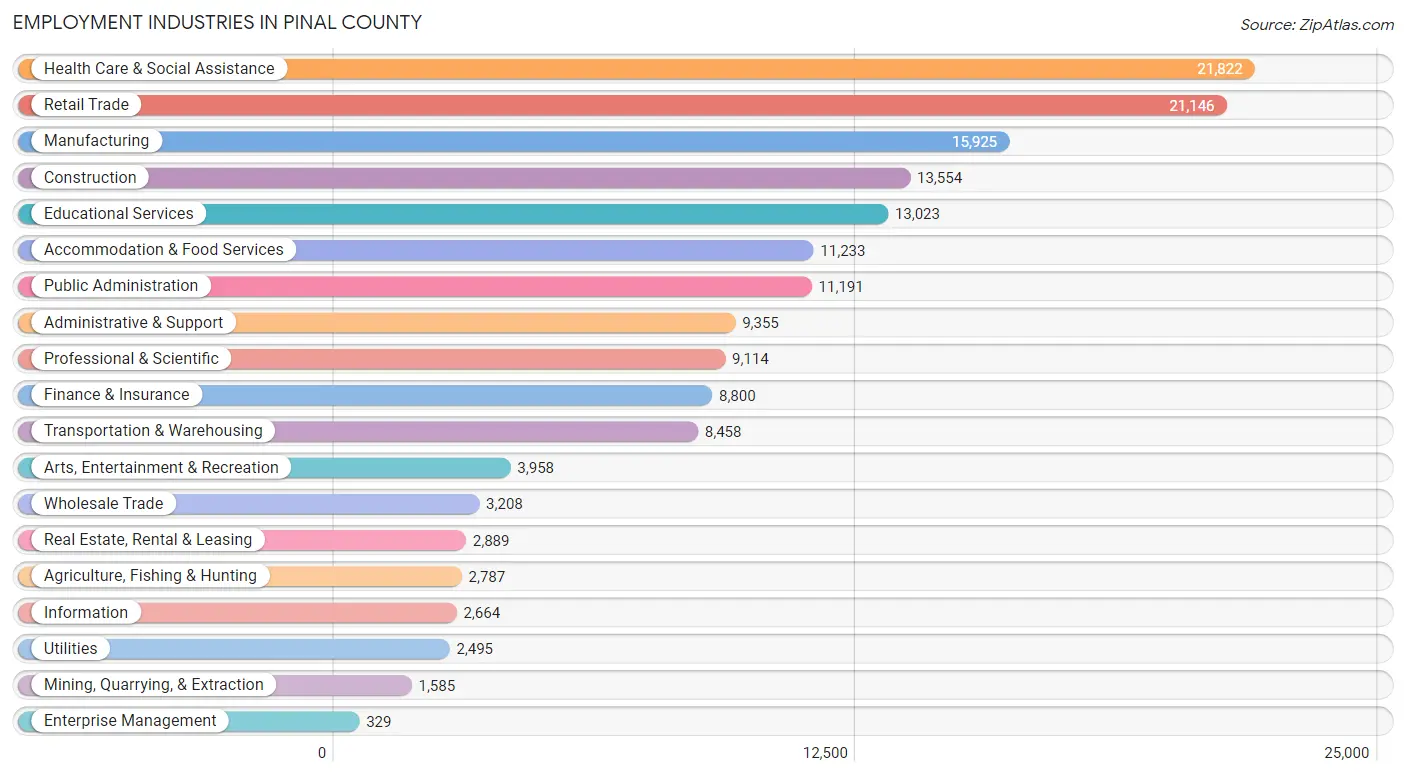
Employment Industries in Pinal County
The major employment industries in Pinal County include Health Care & Social Assistance (21,822 | 12.8%), Retail Trade (21,146 | 12.4%), Manufacturing (15,925 | 9.3%), Construction (13,554 | 7.9%), and Educational Services (13,023 | 7.6%).
Employment Industries by Sex in Pinal County
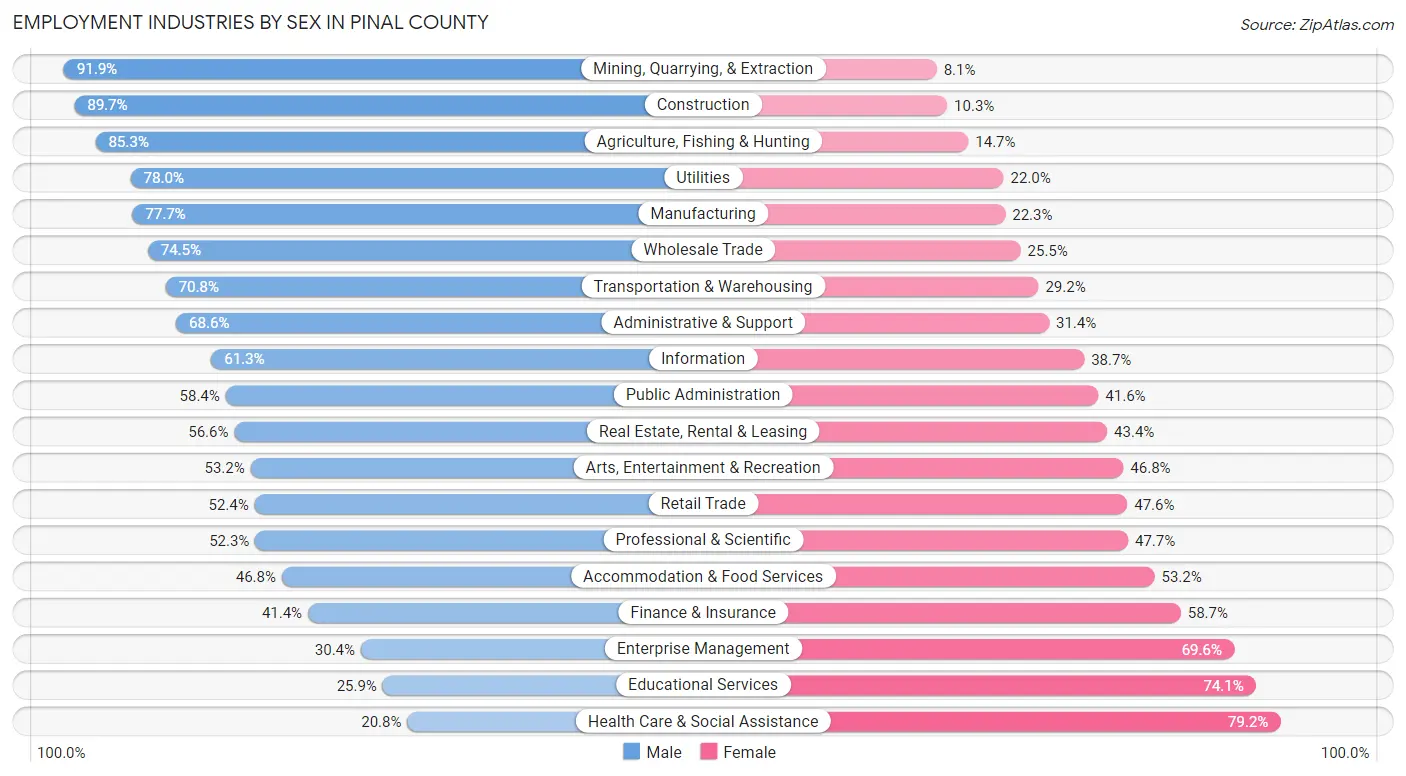
The Pinal County industries that see more men than women are Mining, Quarrying, & Extraction (91.9%), Construction (89.7%), and Agriculture, Fishing & Hunting (85.3%), whereas the industries that tend to have a higher number of women are Health Care & Social Assistance (79.2%), Educational Services (74.1%), and Enterprise Management (69.6%).
| Industry | Male | Female |
| Agriculture, Fishing & Hunting | 2,378 (85.3%) | 409 (14.7%) |
| Mining, Quarrying, & Extraction | 1,456 (91.9%) | 129 (8.1%) |
| Construction | 12,158 (89.7%) | 1,396 (10.3%) |
| Manufacturing | 12,370 (77.7%) | 3,555 (22.3%) |
| Wholesale Trade | 2,390 (74.5%) | 818 (25.5%) |
| Retail Trade | 11,082 (52.4%) | 10,064 (47.6%) |
| Transportation & Warehousing | 5,988 (70.8%) | 2,470 (29.2%) |
| Utilities | 1,947 (78.0%) | 548 (22.0%) |
| Information | 1,634 (61.3%) | 1,030 (38.7%) |
| Finance & Insurance | 3,639 (41.3%) | 5,161 (58.7%) |
| Real Estate, Rental & Leasing | 1,635 (56.6%) | 1,254 (43.4%) |
| Professional & Scientific | 4,764 (52.3%) | 4,350 (47.7%) |
| Enterprise Management | 100 (30.4%) | 229 (69.6%) |
| Administrative & Support | 6,419 (68.6%) | 2,936 (31.4%) |
| Educational Services | 3,370 (25.9%) | 9,653 (74.1%) |
| Health Care & Social Assistance | 4,536 (20.8%) | 17,286 (79.2%) |
| Arts, Entertainment & Recreation | 2,107 (53.2%) | 1,851 (46.8%) |
| Accommodation & Food Services | 5,254 (46.8%) | 5,979 (53.2%) |
| Public Administration | 6,536 (58.4%) | 4,655 (41.6%) |
| Total | 93,996 (55.0%) | 76,776 (45.0%) |
Education in Pinal County
School Enrollment in Pinal County
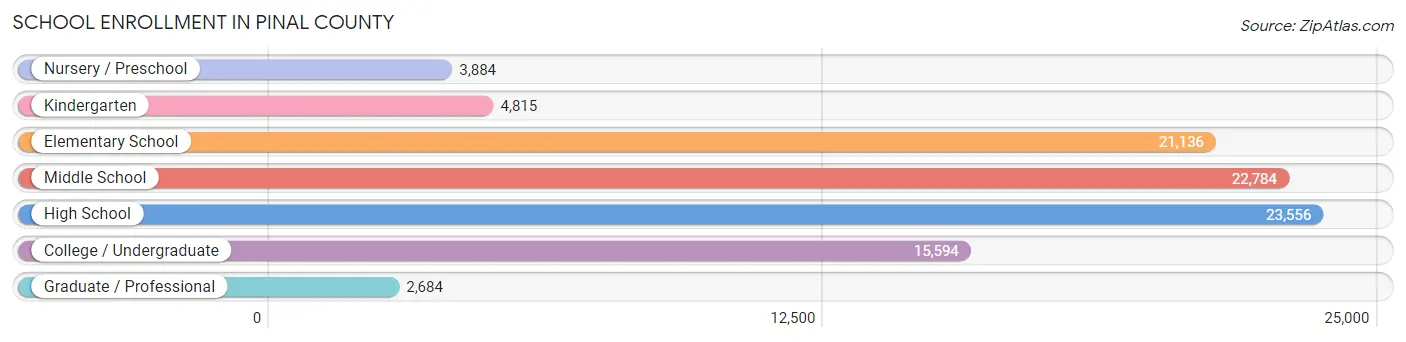
The most common levels of schooling among the 94,453 students in Pinal County are high school (23,556 | 24.9%), middle school (22,784 | 24.1%), and elementary school (21,136 | 22.4%).
| School Level | # Students | % Students |
| Nursery / Preschool | 3,884 | 4.1% |
| Kindergarten | 4,815 | 5.1% |
| Elementary School | 21,136 | 22.4% |
| Middle School | 22,784 | 24.1% |
| High School | 23,556 | 24.9% |
| College / Undergraduate | 15,594 | 16.5% |
| Graduate / Professional | 2,684 | 2.8% |
| Total | 94,453 | 100.0% |
School Enrollment by Age by Funding Source in Pinal County
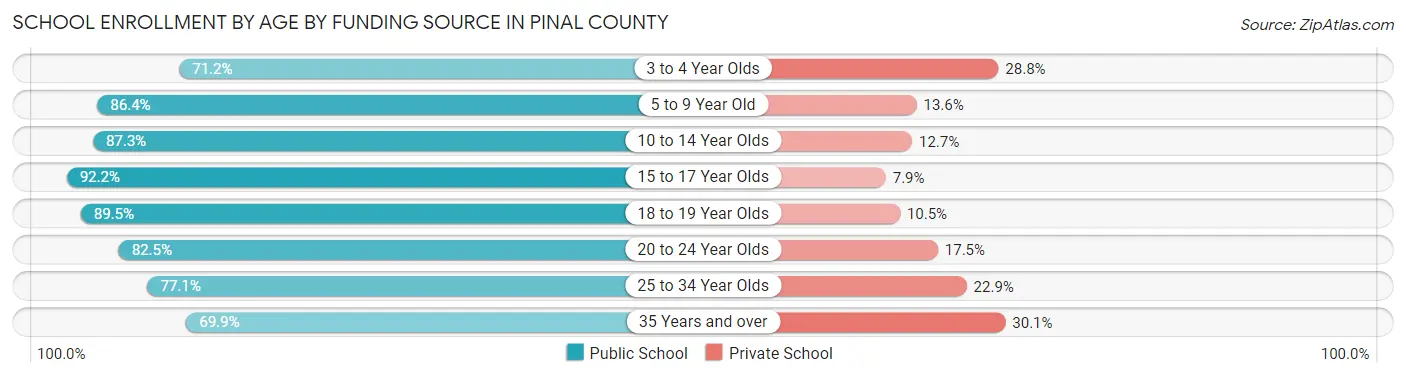
Out of a total of 94,453 students who are enrolled in schools in Pinal County, 13,696 (14.5%) attend a private institution, while the remaining 80,757 (85.5%) are enrolled in public schools. The age group of 35 years and over has the highest likelihood of being enrolled in private schools, with 1,783 (30.1% in the age bracket) enrolled. Conversely, the age group of 15 to 17 year olds has the lowest likelihood of being enrolled in a private school, with 14,552 (92.1% in the age bracket) attending a public institution.
| Age Bracket | Public School | Private School |
| 3 to 4 Year Olds | 2,220 (71.2%) | 899 (28.8%) |
| 5 to 9 Year Old | 20,713 (86.4%) | 3,253 (13.6%) |
| 10 to 14 Year Olds | 25,083 (87.3%) | 3,663 (12.7%) |
| 15 to 17 Year Olds | 14,552 (92.1%) | 1,239 (7.9%) |
| 18 to 19 Year Olds | 4,885 (89.5%) | 572 (10.5%) |
| 20 to 24 Year Olds | 4,806 (82.5%) | 1,022 (17.5%) |
| 25 to 34 Year Olds | 4,338 (77.1%) | 1,289 (22.9%) |
| 35 Years and over | 4,136 (69.9%) | 1,783 (30.1%) |
| Total | 80,757 (85.5%) | 13,696 (14.5%) |
Educational Attainment by Field of Study in Pinal County
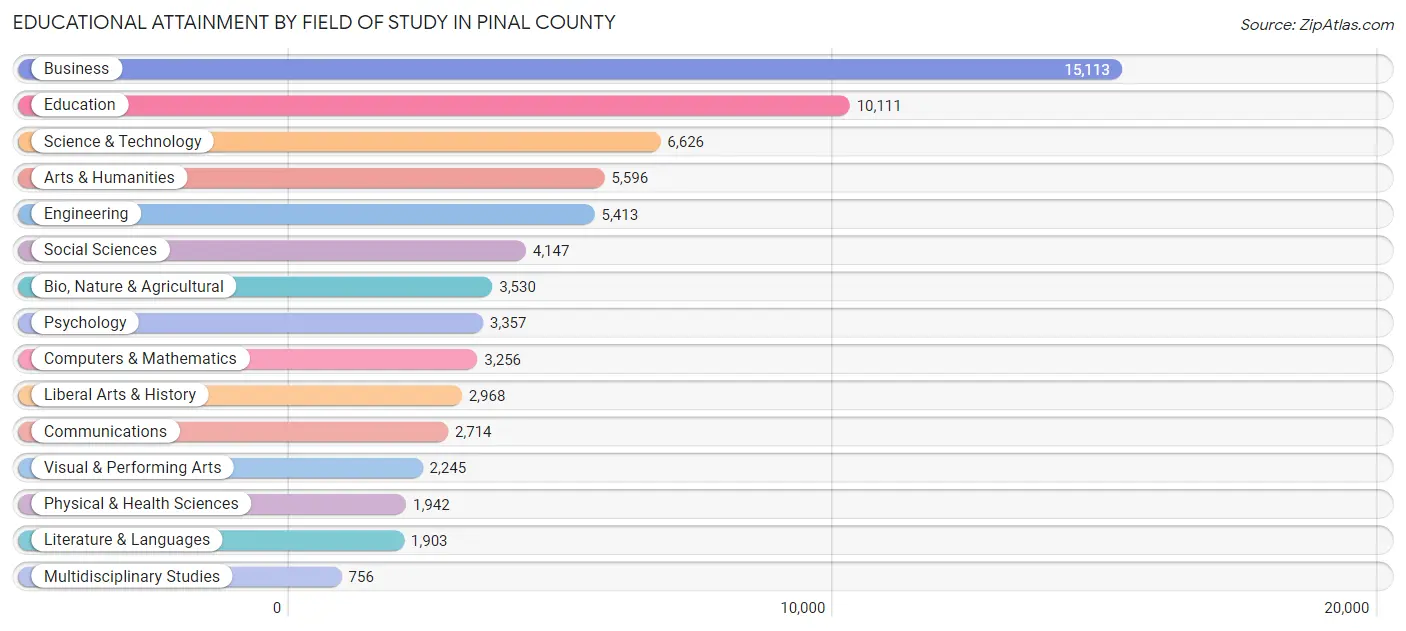
Business (15,113 | 21.7%), education (10,111 | 14.5%), science & technology (6,626 | 9.5%), arts & humanities (5,596 | 8.0%), and engineering (5,413 | 7.8%) are the most common fields of study among 69,677 individuals in Pinal County who have obtained a bachelor's degree or higher.
| Field of Study | # Graduates | % Graduates |
| Computers & Mathematics | 3,256 | 4.7% |
| Bio, Nature & Agricultural | 3,530 | 5.1% |
| Physical & Health Sciences | 1,942 | 2.8% |
| Psychology | 3,357 | 4.8% |
| Social Sciences | 4,147 | 5.9% |
| Engineering | 5,413 | 7.8% |
| Multidisciplinary Studies | 756 | 1.1% |
| Science & Technology | 6,626 | 9.5% |
| Business | 15,113 | 21.7% |
| Education | 10,111 | 14.5% |
| Literature & Languages | 1,903 | 2.7% |
| Liberal Arts & History | 2,968 | 4.3% |
| Visual & Performing Arts | 2,245 | 3.2% |
| Communications | 2,714 | 3.9% |
| Arts & Humanities | 5,596 | 8.0% |
| Total | 69,677 | 100.0% |
Transportation & Commute in Pinal County
Vehicle Availability by Sex in Pinal County
The most prevalent vehicle ownership categories in Pinal County are males with 2 vehicles (39,535, accounting for 42.6%) and females with 2 vehicles (29,404, making up 53.1%).
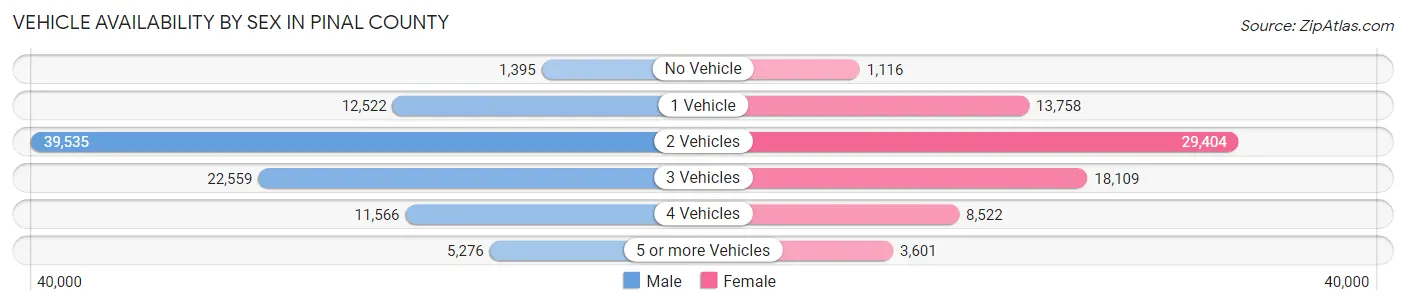
| Vehicles Available | Male | Female |
| No Vehicle | 1,395 (1.5%) | 1,116 (1.5%) |
| 1 Vehicle | 12,522 (13.5%) | 13,758 (18.5%) |
| 2 Vehicles | 39,535 (42.6%) | 29,404 (39.5%) |
| 3 Vehicles | 22,559 (24.3%) | 18,109 (24.3%) |
| 4 Vehicles | 11,566 (12.5%) | 8,522 (11.4%) |
| 5 or more Vehicles | 5,276 (5.7%) | 3,601 (4.8%) |
| Total | 92,853 (100.0%) | 74,510 (100.0%) |
Commute Time in Pinal County
The most frequently occuring commute durations in Pinal County are 45 to 59 minutes (24,645 commuters, 16.8%), 30 to 34 minutes (18,877 commuters, 12.9%), and 60 to 89 minutes (16,021 commuters, 10.9%).
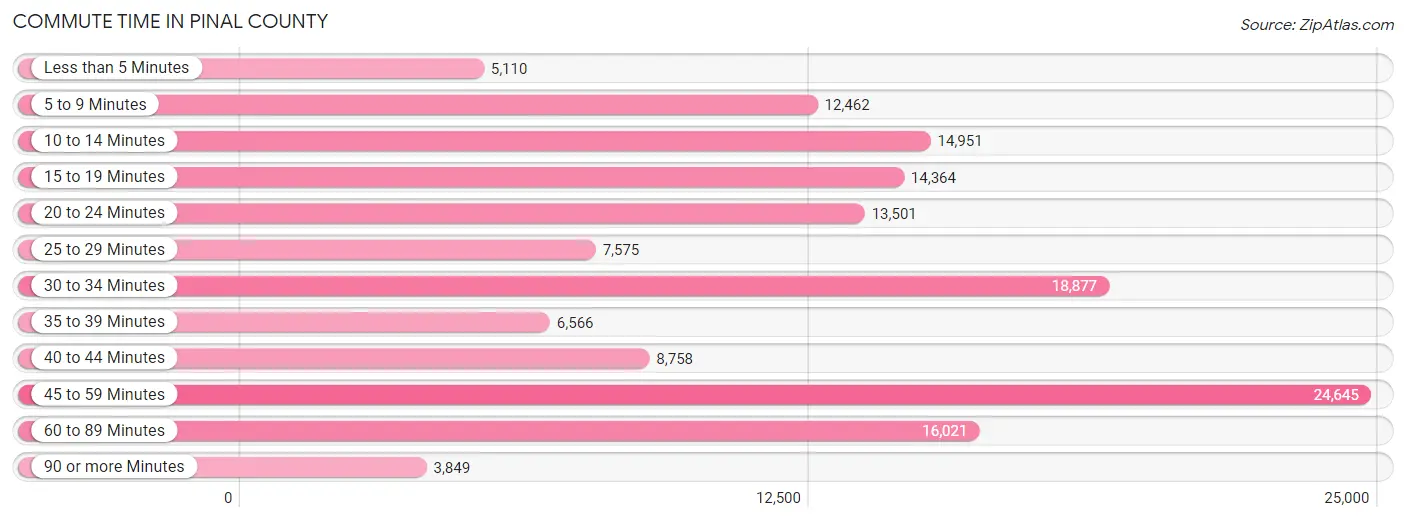
| Commute Time | # Commuters | % Commuters |
| Less than 5 Minutes | 5,110 | 3.5% |
| 5 to 9 Minutes | 12,462 | 8.5% |
| 10 to 14 Minutes | 14,951 | 10.2% |
| 15 to 19 Minutes | 14,364 | 9.8% |
| 20 to 24 Minutes | 13,501 | 9.2% |
| 25 to 29 Minutes | 7,575 | 5.2% |
| 30 to 34 Minutes | 18,877 | 12.9% |
| 35 to 39 Minutes | 6,566 | 4.5% |
| 40 to 44 Minutes | 8,758 | 6.0% |
| 45 to 59 Minutes | 24,645 | 16.8% |
| 60 to 89 Minutes | 16,021 | 10.9% |
| 90 or more Minutes | 3,849 | 2.6% |
Commute Time by Sex in Pinal County
The most common commute times in Pinal County are 45 to 59 minutes (15,029 commuters, 17.9%) for males and 45 to 59 minutes (9,616 commuters, 15.3%) for females.
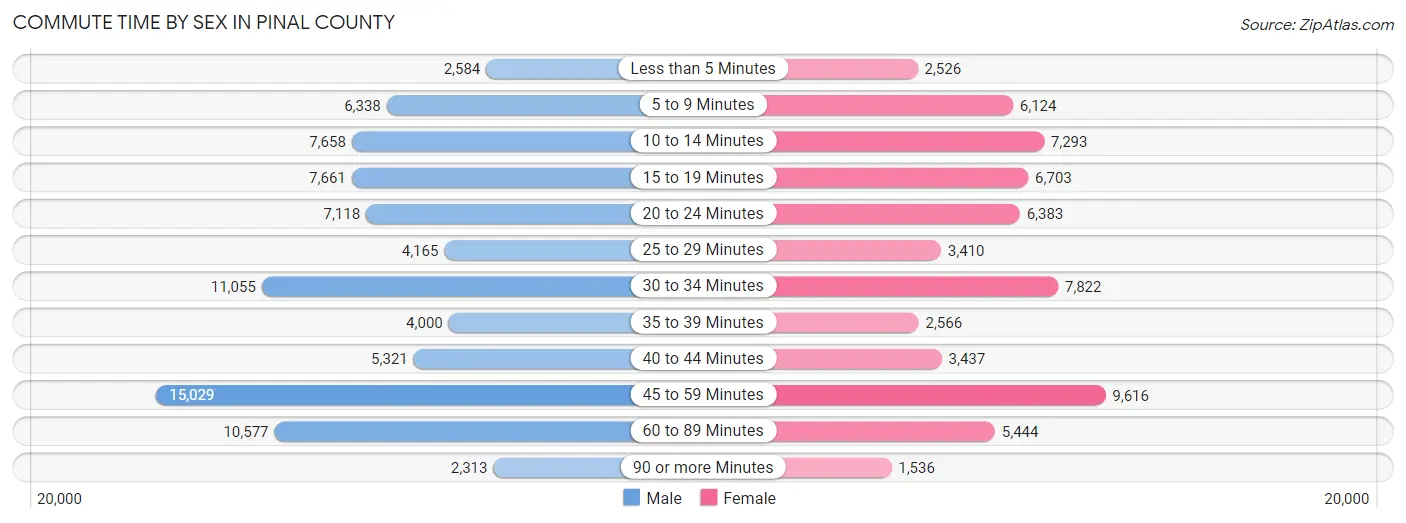
| Commute Time | Male | Female |
| Less than 5 Minutes | 2,584 (3.1%) | 2,526 (4.0%) |
| 5 to 9 Minutes | 6,338 (7.6%) | 6,124 (9.7%) |
| 10 to 14 Minutes | 7,658 (9.1%) | 7,293 (11.6%) |
| 15 to 19 Minutes | 7,661 (9.1%) | 6,703 (10.7%) |
| 20 to 24 Minutes | 7,118 (8.5%) | 6,383 (10.2%) |
| 25 to 29 Minutes | 4,165 (5.0%) | 3,410 (5.4%) |
| 30 to 34 Minutes | 11,055 (13.2%) | 7,822 (12.4%) |
| 35 to 39 Minutes | 4,000 (4.8%) | 2,566 (4.1%) |
| 40 to 44 Minutes | 5,321 (6.4%) | 3,437 (5.5%) |
| 45 to 59 Minutes | 15,029 (17.9%) | 9,616 (15.3%) |
| 60 to 89 Minutes | 10,577 (12.6%) | 5,444 (8.7%) |
| 90 or more Minutes | 2,313 (2.8%) | 1,536 (2.4%) |
Time of Departure to Work by Sex in Pinal County
The most frequent times of departure to work in Pinal County are 12:00 AM to 4:59 AM (15,047, 17.9%) for males and 7:00 AM to 7:29 AM (9,179, 14.6%) for females.
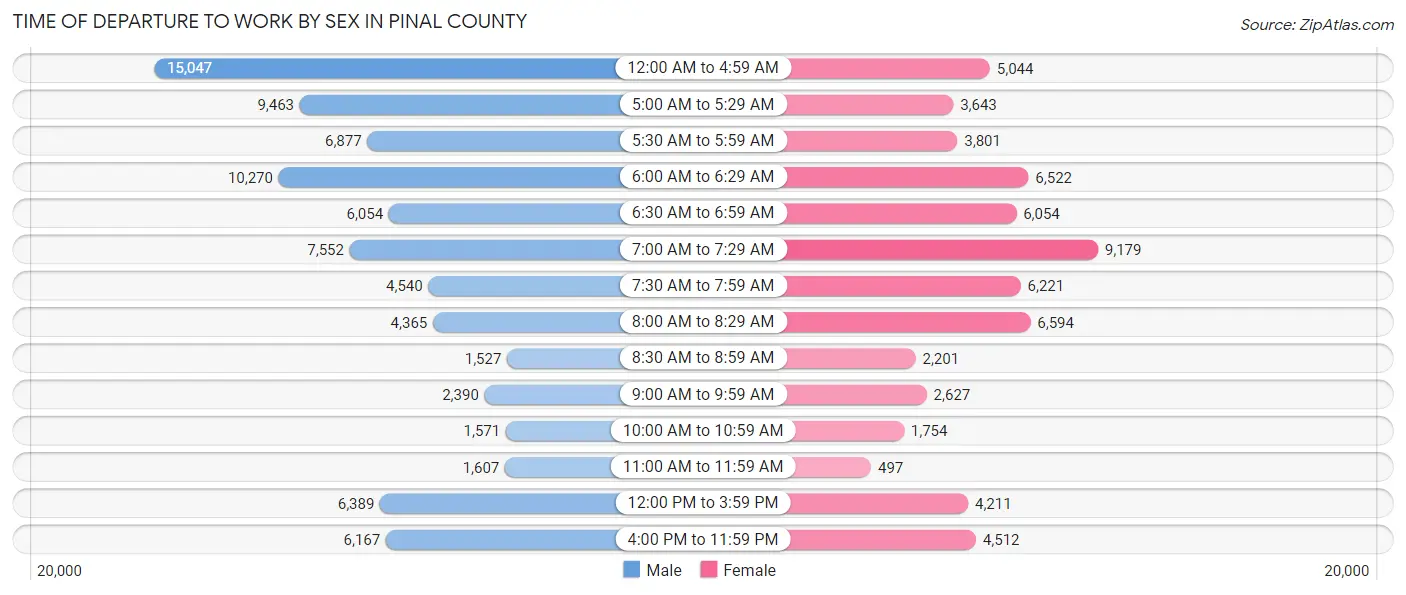
| Time of Departure | Male | Female |
| 12:00 AM to 4:59 AM | 15,047 (17.9%) | 5,044 (8.0%) |
| 5:00 AM to 5:29 AM | 9,463 (11.3%) | 3,643 (5.8%) |
| 5:30 AM to 5:59 AM | 6,877 (8.2%) | 3,801 (6.0%) |
| 6:00 AM to 6:29 AM | 10,270 (12.2%) | 6,522 (10.4%) |
| 6:30 AM to 6:59 AM | 6,054 (7.2%) | 6,054 (9.6%) |
| 7:00 AM to 7:29 AM | 7,552 (9.0%) | 9,179 (14.6%) |
| 7:30 AM to 7:59 AM | 4,540 (5.4%) | 6,221 (9.9%) |
| 8:00 AM to 8:29 AM | 4,365 (5.2%) | 6,594 (10.5%) |
| 8:30 AM to 8:59 AM | 1,527 (1.8%) | 2,201 (3.5%) |
| 9:00 AM to 9:59 AM | 2,390 (2.9%) | 2,627 (4.2%) |
| 10:00 AM to 10:59 AM | 1,571 (1.9%) | 1,754 (2.8%) |
| 11:00 AM to 11:59 AM | 1,607 (1.9%) | 497 (0.8%) |
| 12:00 PM to 3:59 PM | 6,389 (7.6%) | 4,211 (6.7%) |
| 4:00 PM to 11:59 PM | 6,167 (7.4%) | 4,512 (7.2%) |
| Total | 83,819 (100.0%) | 62,860 (100.0%) |
Housing Occupancy in Pinal County
Occupancy by Ownership in Pinal County
Of the total 151,490 dwellings in Pinal County, owner-occupied units account for 120,657 (79.6%), while renter-occupied units make up 30,833 (20.3%).
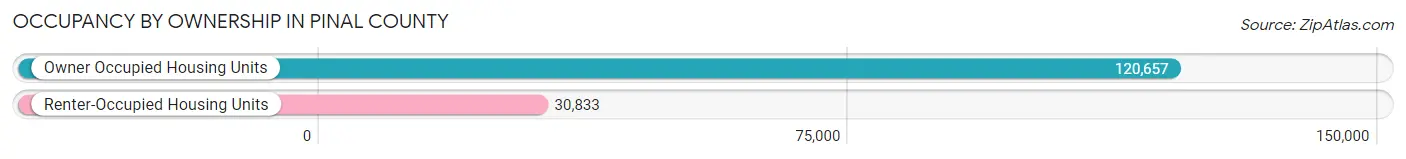
| Occupancy | # Housing Units | % Housing Units |
| Owner Occupied Housing Units | 120,657 | 79.6% |
| Renter-Occupied Housing Units | 30,833 | 20.3% |
| Total Occupied Housing Units | 151,490 | 100.0% |
Occupancy by Household Size in Pinal County
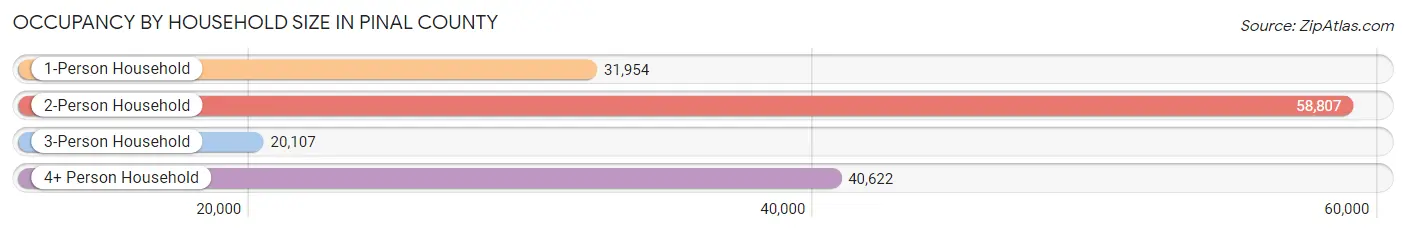
| Household Size | # Housing Units | % Housing Units |
| 1-Person Household | 31,954 | 21.1% |
| 2-Person Household | 58,807 | 38.8% |
| 3-Person Household | 20,107 | 13.3% |
| 4+ Person Household | 40,622 | 26.8% |
| Total Housing Units | 151,490 | 100.0% |
Occupancy by Ownership by Household Size in Pinal County
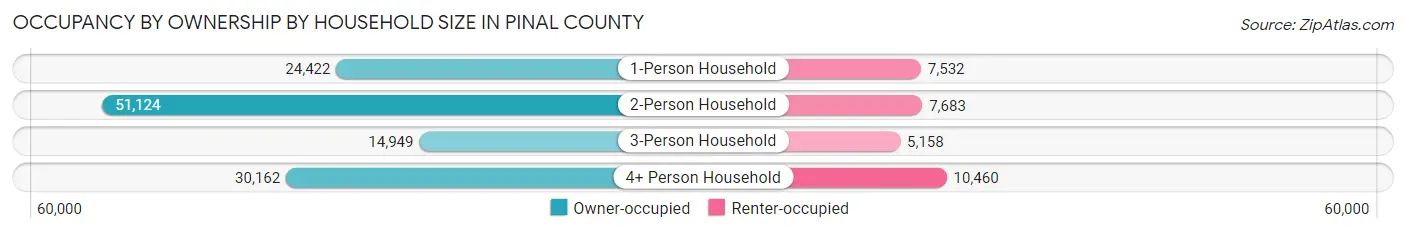
| Household Size | Owner-occupied | Renter-occupied |
| 1-Person Household | 24,422 (76.4%) | 7,532 (23.6%) |
| 2-Person Household | 51,124 (86.9%) | 7,683 (13.1%) |
| 3-Person Household | 14,949 (74.4%) | 5,158 (25.7%) |
| 4+ Person Household | 30,162 (74.3%) | 10,460 (25.8%) |
| Total Housing Units | 120,657 (79.6%) | 30,833 (20.3%) |
Occupancy by Educational Attainment in Pinal County
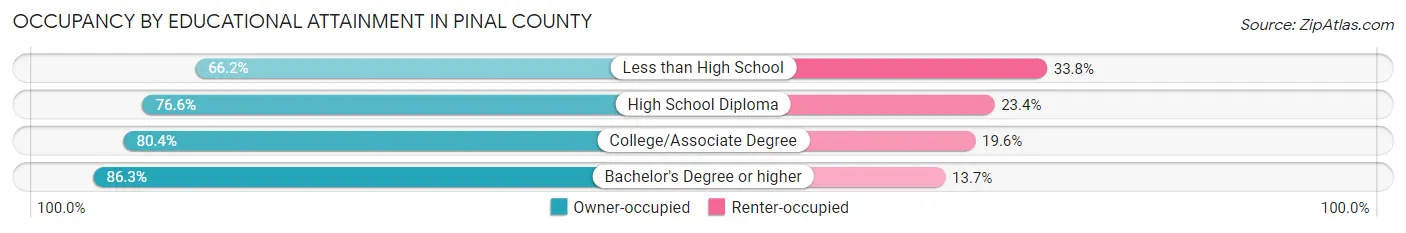
| Household Size | Owner-occupied | Renter-occupied |
| Less than High School | 8,745 (66.2%) | 4,470 (33.8%) |
| High School Diploma | 30,487 (76.6%) | 9,318 (23.4%) |
| College/Associate Degree | 48,426 (80.4%) | 11,818 (19.6%) |
| Bachelor's Degree or higher | 32,999 (86.3%) | 5,227 (13.7%) |
Occupancy by Age of Householder in Pinal County
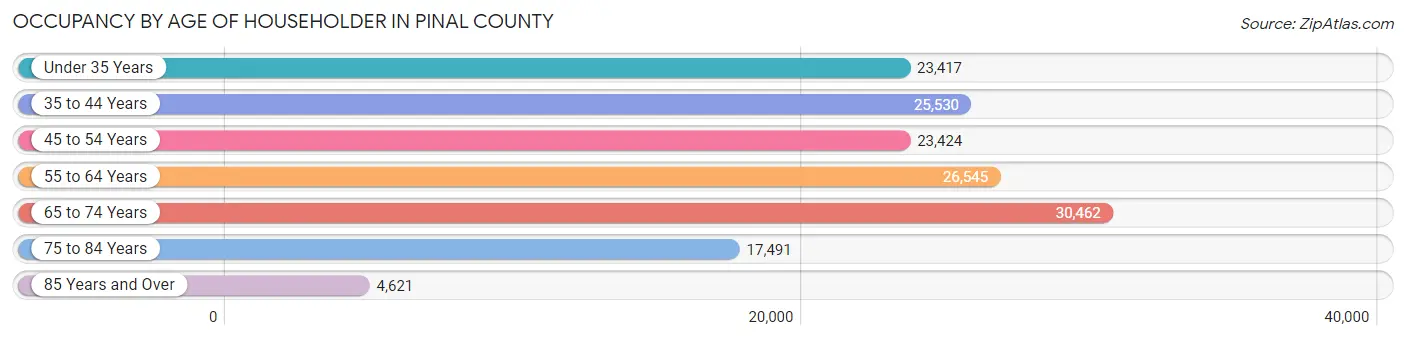
| Age Bracket | # Households | % Households |
| Under 35 Years | 23,417 | 15.5% |
| 35 to 44 Years | 25,530 | 16.9% |
| 45 to 54 Years | 23,424 | 15.5% |
| 55 to 64 Years | 26,545 | 17.5% |
| 65 to 74 Years | 30,462 | 20.1% |
| 75 to 84 Years | 17,491 | 11.6% |
| 85 Years and Over | 4,621 | 3.0% |
| Total | 151,490 | 100.0% |
Housing Finances in Pinal County
Median Income by Occupancy in Pinal County
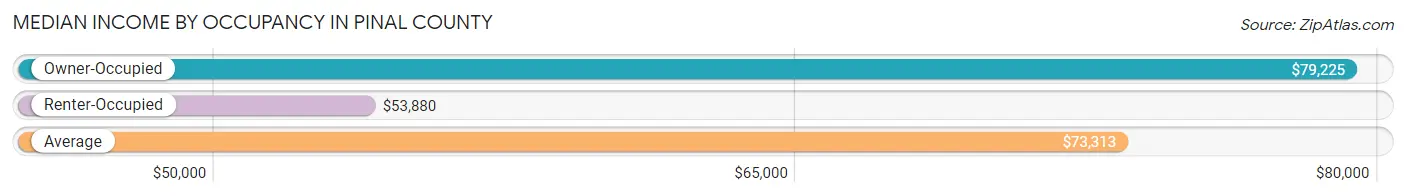
| Occupancy Type | # Households | Median Income |
| Owner-Occupied | 120,657 (79.6%) | $79,225 |
| Renter-Occupied | 30,833 (20.3%) | $53,880 |
| Average | 151,490 (100.0%) | $73,313 |
Occupancy by Householder Income Bracket in Pinal County
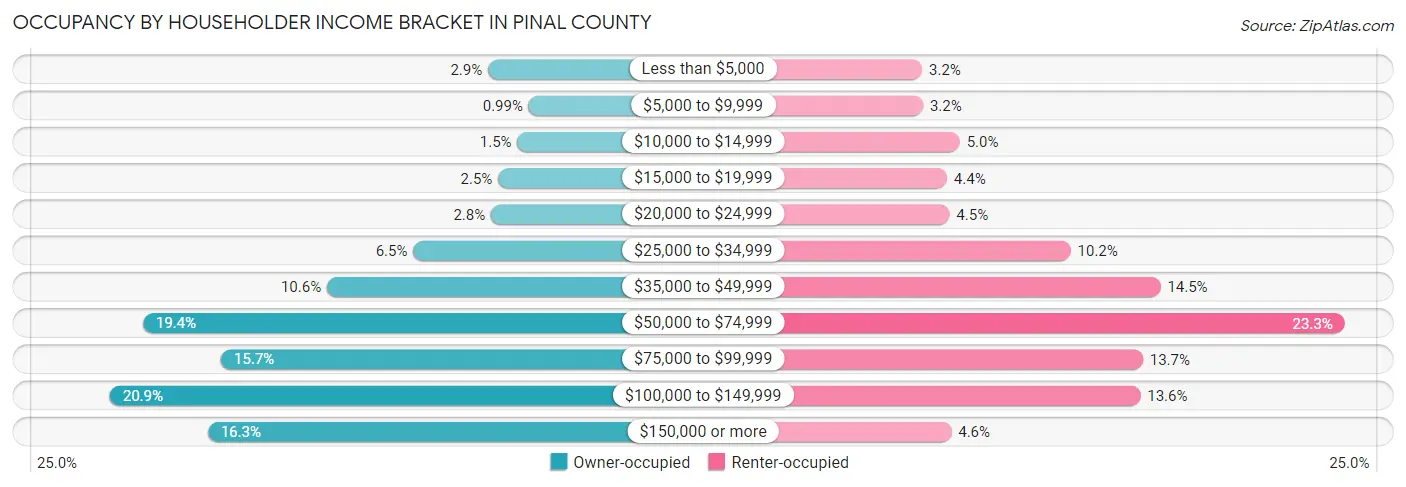
| Income Bracket | Owner-occupied | Renter-occupied |
| Less than $5,000 | 3,535 (2.9%) | 978 (3.2%) |
| $5,000 to $9,999 | 1,194 (1.0%) | 989 (3.2%) |
| $10,000 to $14,999 | 1,846 (1.5%) | 1,529 (5.0%) |
| $15,000 to $19,999 | 2,952 (2.5%) | 1,342 (4.3%) |
| $20,000 to $24,999 | 3,371 (2.8%) | 1,377 (4.5%) |
| $25,000 to $34,999 | 7,827 (6.5%) | 3,156 (10.2%) |
| $35,000 to $49,999 | 12,787 (10.6%) | 4,477 (14.5%) |
| $50,000 to $74,999 | 23,366 (19.4%) | 7,182 (23.3%) |
| $75,000 to $99,999 | 18,877 (15.7%) | 4,217 (13.7%) |
| $100,000 to $149,999 | 25,260 (20.9%) | 4,180 (13.6%) |
| $150,000 or more | 19,642 (16.3%) | 1,406 (4.6%) |
| Total | 120,657 (100.0%) | 30,833 (100.0%) |
Monthly Housing Cost Tiers in Pinal County
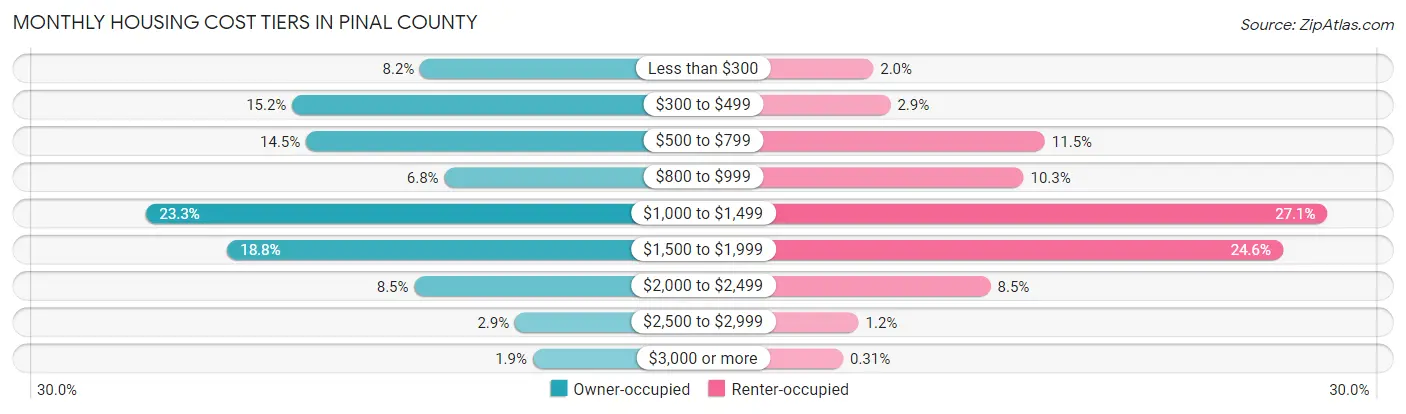
| Monthly Cost | Owner-occupied | Renter-occupied |
| Less than $300 | 9,831 (8.2%) | 612 (2.0%) |
| $300 to $499 | 18,359 (15.2%) | 902 (2.9%) |
| $500 to $799 | 17,436 (14.4%) | 3,534 (11.5%) |
| $800 to $999 | 8,213 (6.8%) | 3,170 (10.3%) |
| $1,000 to $1,499 | 28,075 (23.3%) | 8,342 (27.1%) |
| $1,500 to $1,999 | 22,683 (18.8%) | 7,585 (24.6%) |
| $2,000 to $2,499 | 10,223 (8.5%) | 2,607 (8.5%) |
| $2,500 to $2,999 | 3,508 (2.9%) | 362 (1.2%) |
| $3,000 or more | 2,329 (1.9%) | 95 (0.3%) |
| Total | 120,657 (100.0%) | 30,833 (100.0%) |
Physical Housing Characteristics in Pinal County
Housing Structures in Pinal County
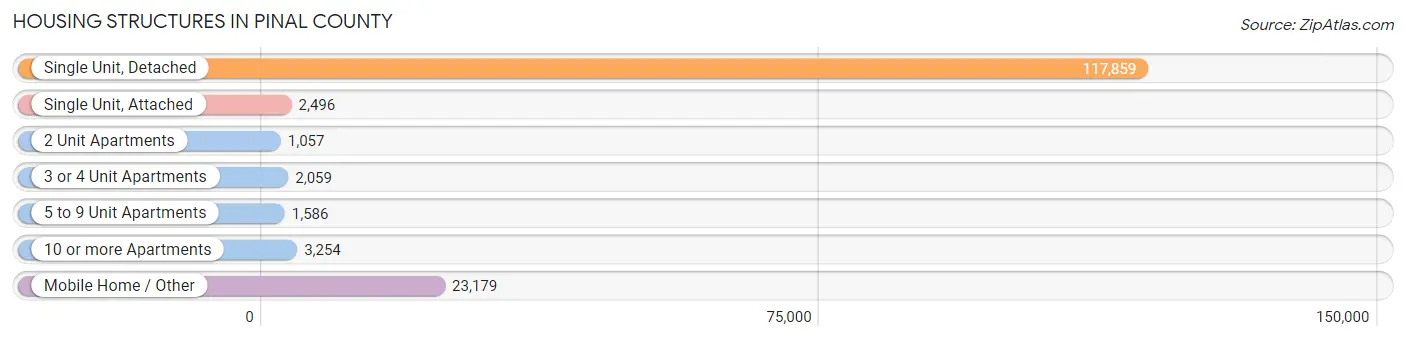
| Structure Type | # Housing Units | % Housing Units |
| Single Unit, Detached | 117,859 | 77.8% |
| Single Unit, Attached | 2,496 | 1.7% |
| 2 Unit Apartments | 1,057 | 0.7% |
| 3 or 4 Unit Apartments | 2,059 | 1.4% |
| 5 to 9 Unit Apartments | 1,586 | 1.1% |
| 10 or more Apartments | 3,254 | 2.1% |
| Mobile Home / Other | 23,179 | 15.3% |
| Total | 151,490 | 100.0% |
Housing Structures by Occupancy in Pinal County
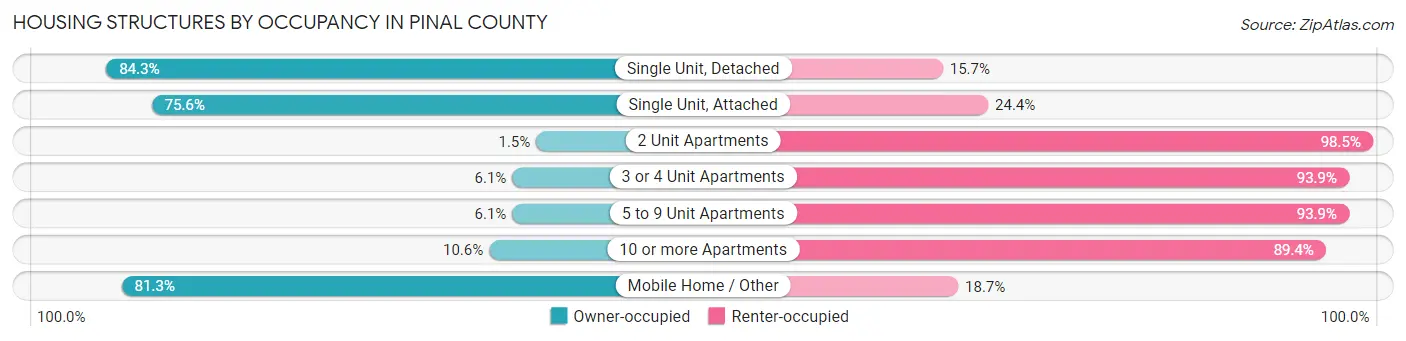
| Structure Type | Owner-occupied | Renter-occupied |
| Single Unit, Detached | 99,336 (84.3%) | 18,523 (15.7%) |
| Single Unit, Attached | 1,886 (75.6%) | 610 (24.4%) |
| 2 Unit Apartments | 16 (1.5%) | 1,041 (98.5%) |
| 3 or 4 Unit Apartments | 126 (6.1%) | 1,933 (93.9%) |
| 5 to 9 Unit Apartments | 97 (6.1%) | 1,489 (93.9%) |
| 10 or more Apartments | 344 (10.6%) | 2,910 (89.4%) |
| Mobile Home / Other | 18,852 (81.3%) | 4,327 (18.7%) |
| Total | 120,657 (79.6%) | 30,833 (20.3%) |
Housing Structures by Number of Rooms in Pinal County
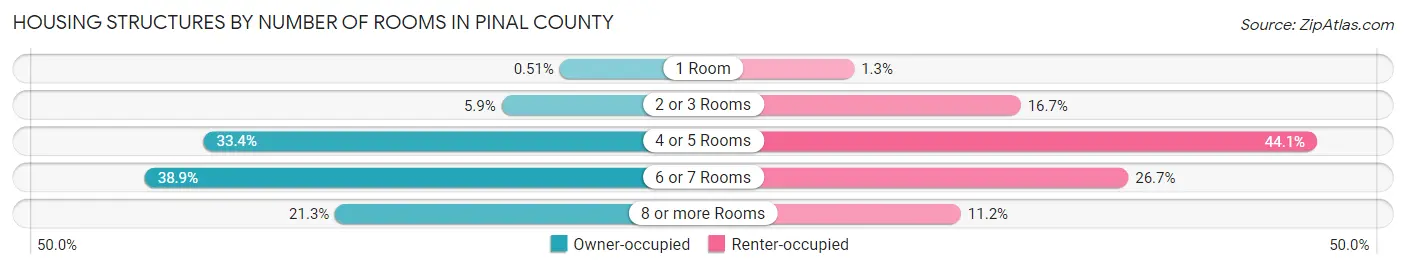
| Number of Rooms | Owner-occupied | Renter-occupied |
| 1 Room | 613 (0.5%) | 406 (1.3%) |
| 2 or 3 Rooms | 7,107 (5.9%) | 5,156 (16.7%) |
| 4 or 5 Rooms | 40,353 (33.4%) | 13,599 (44.1%) |
| 6 or 7 Rooms | 46,910 (38.9%) | 8,222 (26.7%) |
| 8 or more Rooms | 25,674 (21.3%) | 3,450 (11.2%) |
| Total | 120,657 (100.0%) | 30,833 (100.0%) |
Housing Structure by Heating Type in Pinal County
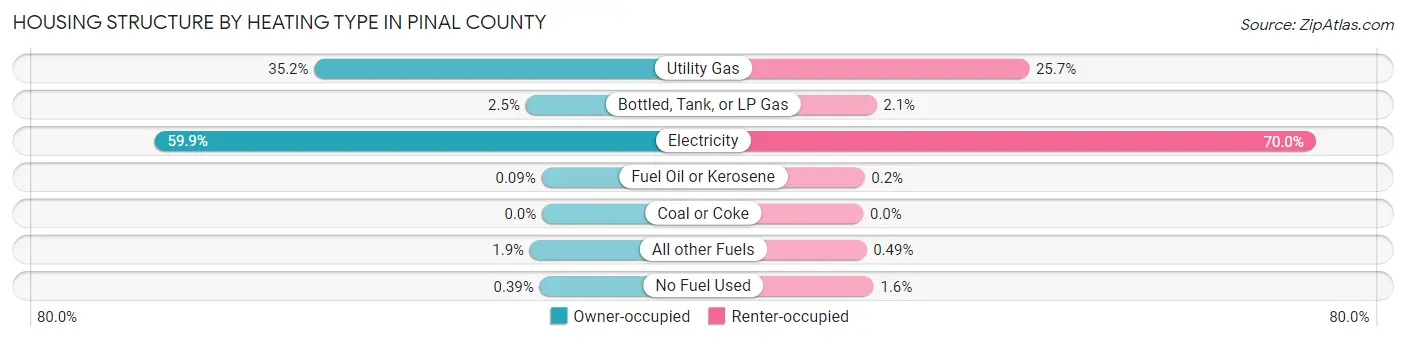
| Heating Type | Owner-occupied | Renter-occupied |
| Utility Gas | 42,480 (35.2%) | 7,908 (25.7%) |
| Bottled, Tank, or LP Gas | 3,058 (2.5%) | 636 (2.1%) |
| Electricity | 72,272 (59.9%) | 21,575 (70.0%) |
| Fuel Oil or Kerosene | 106 (0.1%) | 63 (0.2%) |
| Coal or Coke | 0 (0.0%) | 0 (0.0%) |
| All other Fuels | 2,266 (1.9%) | 151 (0.5%) |
| No Fuel Used | 475 (0.4%) | 500 (1.6%) |
| Total | 120,657 (100.0%) | 30,833 (100.0%) |
Household Vehicle Usage in Pinal County
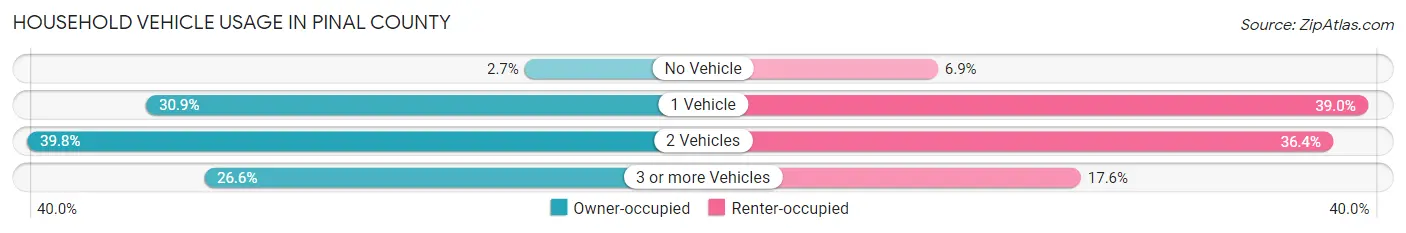
| Vehicles per Household | Owner-occupied | Renter-occupied |
| No Vehicle | 3,214 (2.7%) | 2,140 (6.9%) |
| 1 Vehicle | 37,314 (30.9%) | 12,030 (39.0%) |
| 2 Vehicles | 48,033 (39.8%) | 11,231 (36.4%) |
| 3 or more Vehicles | 32,096 (26.6%) | 5,432 (17.6%) |
| Total | 120,657 (100.0%) | 30,833 (100.0%) |
Real Estate & Mortgages in Pinal County
Real Estate and Mortgage Overview in Pinal County
| Characteristic | Without Mortgage | With Mortgage |
| Housing Units | 46,522 | 74,135 |
| Median Property Value | $200,600 | $293,600 |
| Median Household Income | $61,258 | $14,420 |
| Monthly Housing Costs | $451 | $2,227 |
| Real Estate Taxes | $1,322 | $2,127 |
Property Value by Mortgage Status in Pinal County
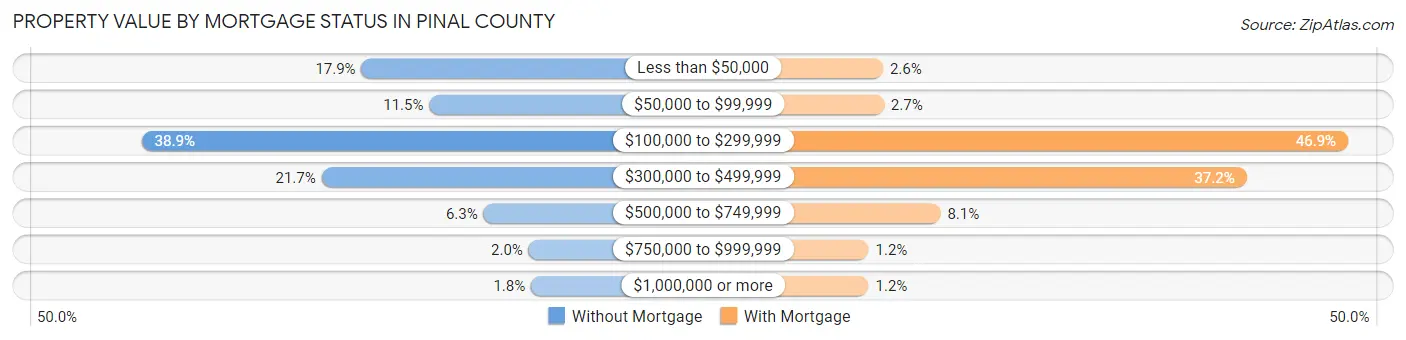
| Property Value | Without Mortgage | With Mortgage |
| Less than $50,000 | 8,338 (17.9%) | 1,934 (2.6%) |
| $50,000 to $99,999 | 5,330 (11.5%) | 2,005 (2.7%) |
| $100,000 to $299,999 | 18,074 (38.9%) | 34,763 (46.9%) |
| $300,000 to $499,999 | 10,106 (21.7%) | 27,605 (37.2%) |
| $500,000 to $749,999 | 2,926 (6.3%) | 5,996 (8.1%) |
| $750,000 to $999,999 | 926 (2.0%) | 916 (1.2%) |
| $1,000,000 or more | 822 (1.8%) | 916 (1.2%) |
| Total | 46,522 (100.0%) | 74,135 (100.0%) |
Household Income by Mortgage Status in Pinal County
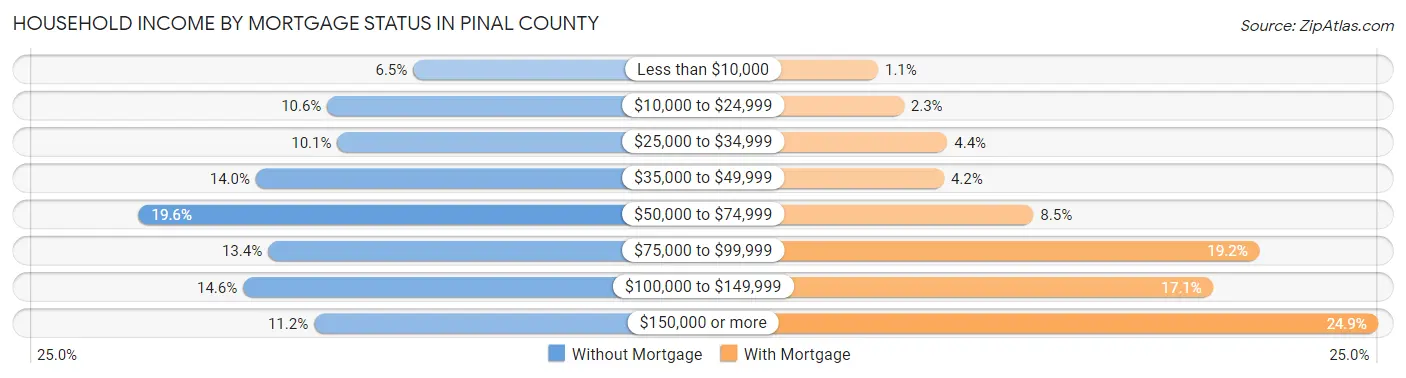
| Household Income | Without Mortgage | With Mortgage |
| Less than $10,000 | 3,024 (6.5%) | 791 (1.1%) |
| $10,000 to $24,999 | 4,928 (10.6%) | 1,705 (2.3%) |
| $25,000 to $34,999 | 4,703 (10.1%) | 3,241 (4.4%) |
| $35,000 to $49,999 | 6,510 (14.0%) | 3,124 (4.2%) |
| $50,000 to $74,999 | 9,105 (19.6%) | 6,277 (8.5%) |
| $75,000 to $99,999 | 6,238 (13.4%) | 14,261 (19.2%) |
| $100,000 to $149,999 | 6,792 (14.6%) | 12,639 (17.1%) |
| $150,000 or more | 5,222 (11.2%) | 18,468 (24.9%) |
| Total | 46,522 (100.0%) | 74,135 (100.0%) |
Property Value to Household Income Ratio in Pinal County
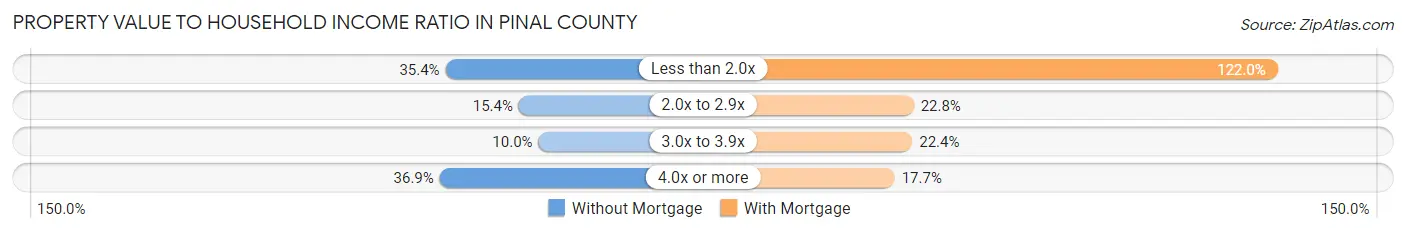
| Value-to-Income Ratio | Without Mortgage | With Mortgage |
| Less than 2.0x | 16,449 (35.4%) | 90,424 (122.0%) |
| 2.0x to 2.9x | 7,150 (15.4%) | 16,914 (22.8%) |
| 3.0x to 3.9x | 4,665 (10.0%) | 16,639 (22.4%) |
| 4.0x or more | 17,185 (36.9%) | 13,083 (17.6%) |
| Total | 46,522 (100.0%) | 74,135 (100.0%) |
Real Estate Taxes by Mortgage Status in Pinal County
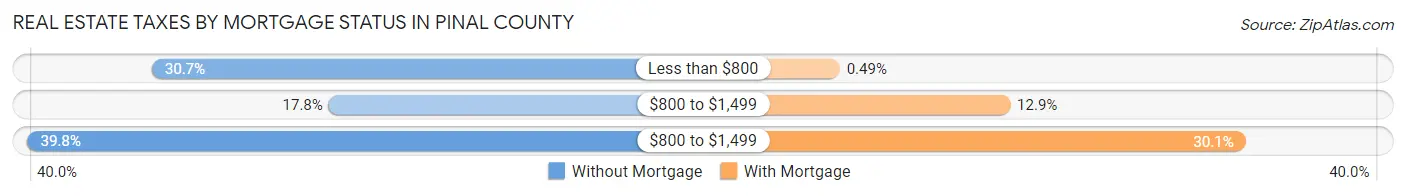
| Property Taxes | Without Mortgage | With Mortgage |
| Less than $800 | 14,281 (30.7%) | 360 (0.5%) |
| $800 to $1,499 | 8,274 (17.8%) | 9,593 (12.9%) |
| $800 to $1,499 | 18,507 (39.8%) | 22,344 (30.1%) |
| Total | 46,522 (100.0%) | 74,135 (100.0%) |
Health & Disability in Pinal County
Health Insurance Coverage by Age in Pinal County
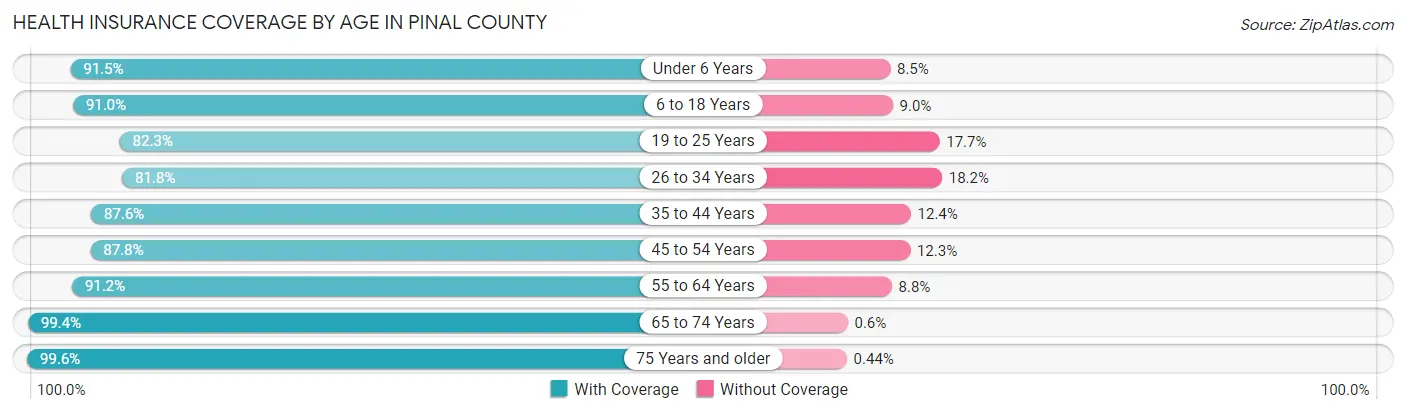
| Age Bracket | With Coverage | Without Coverage |
| Under 6 Years | 25,891 (91.5%) | 2,416 (8.5%) |
| 6 to 18 Years | 66,315 (91.0%) | 6,555 (9.0%) |
| 19 to 25 Years | 26,524 (82.3%) | 5,713 (17.7%) |
| 26 to 34 Years | 37,194 (81.8%) | 8,267 (18.2%) |
| 35 to 44 Years | 44,924 (87.6%) | 6,344 (12.4%) |
| 45 to 54 Years | 40,102 (87.7%) | 5,598 (12.2%) |
| 55 to 64 Years | 43,659 (91.2%) | 4,222 (8.8%) |
| 65 to 74 Years | 52,102 (99.4%) | 315 (0.6%) |
| 75 Years and older | 36,330 (99.6%) | 161 (0.4%) |
| Total | 373,041 (90.4%) | 39,591 (9.6%) |
Health Insurance Coverage by Citizenship Status in Pinal County

| Citizenship Status | With Coverage | Without Coverage |
| Native Born | 25,891 (91.5%) | 2,416 (8.5%) |
| Foreign Born, Citizen | 66,315 (91.0%) | 6,555 (9.0%) |
| Foreign Born, not a Citizen | 26,524 (82.3%) | 5,713 (17.7%) |
Health Insurance Coverage by Household Income in Pinal County
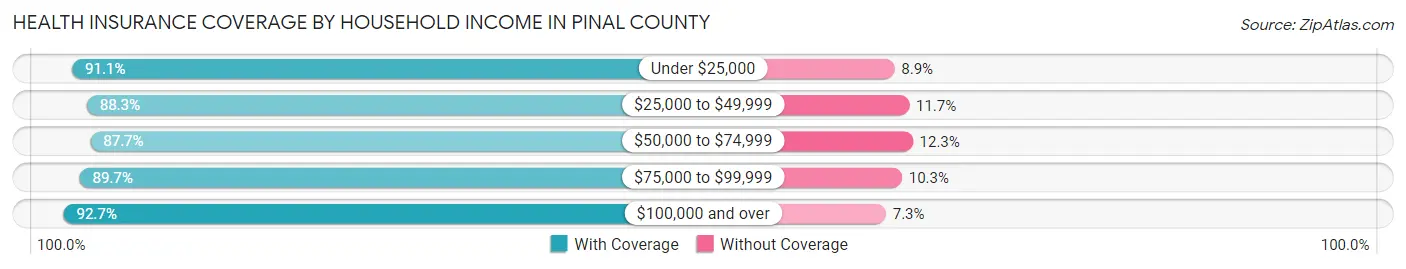
| Household Income | With Coverage | Without Coverage |
| Under $25,000 | 32,008 (91.1%) | 3,130 (8.9%) |
| $25,000 to $49,999 | 56,288 (88.3%) | 7,426 (11.7%) |
| $50,000 to $74,999 | 72,268 (87.7%) | 10,160 (12.3%) |
| $75,000 to $99,999 | 59,098 (89.7%) | 6,789 (10.3%) |
| $100,000 and over | 152,652 (92.7%) | 12,042 (7.3%) |
Public vs Private Health Insurance Coverage by Age in Pinal County
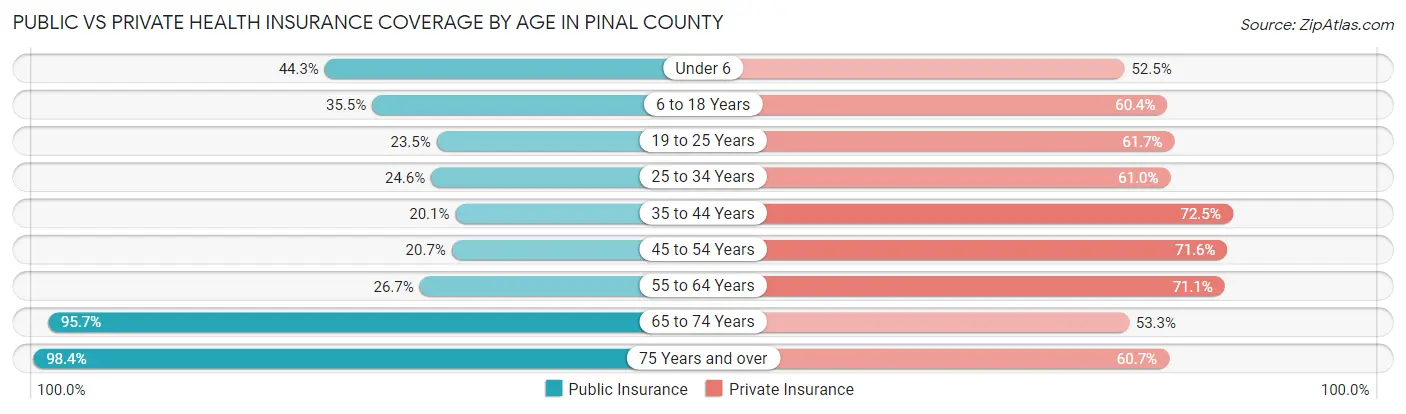
| Age Bracket | Public Insurance | Private Insurance |
| Under 6 | 12,541 (44.3%) | 14,852 (52.5%) |
| 6 to 18 Years | 25,870 (35.5%) | 44,027 (60.4%) |
| 19 to 25 Years | 7,586 (23.5%) | 19,904 (61.7%) |
| 25 to 34 Years | 11,167 (24.6%) | 27,724 (61.0%) |
| 35 to 44 Years | 10,280 (20.1%) | 37,181 (72.5%) |
| 45 to 54 Years | 9,474 (20.7%) | 32,701 (71.6%) |
| 55 to 64 Years | 12,783 (26.7%) | 34,027 (71.1%) |
| 65 to 74 Years | 50,149 (95.7%) | 27,922 (53.3%) |
| 75 Years and over | 35,905 (98.4%) | 22,155 (60.7%) |
| Total | 175,755 (42.6%) | 260,493 (63.1%) |
Disability Status by Sex by Age in Pinal County
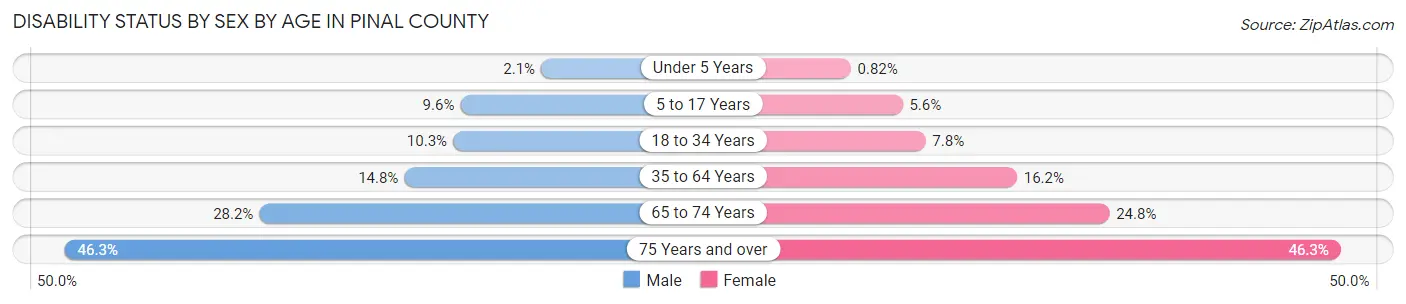
| Age Bracket | Male | Female |
| Under 5 Years | 244 (2.1%) | 95 (0.8%) |
| 5 to 17 Years | 3,505 (9.6%) | 1,987 (5.6%) |
| 18 to 34 Years | 4,522 (10.2%) | 3,064 (7.8%) |
| 35 to 64 Years | 10,539 (14.8%) | 11,936 (16.2%) |
| 65 to 74 Years | 6,881 (28.2%) | 6,959 (24.8%) |
| 75 Years and over | 8,243 (46.3%) | 8,649 (46.3%) |
Disability Class by Sex by Age in Pinal County
Disability Class: Hearing Difficulty
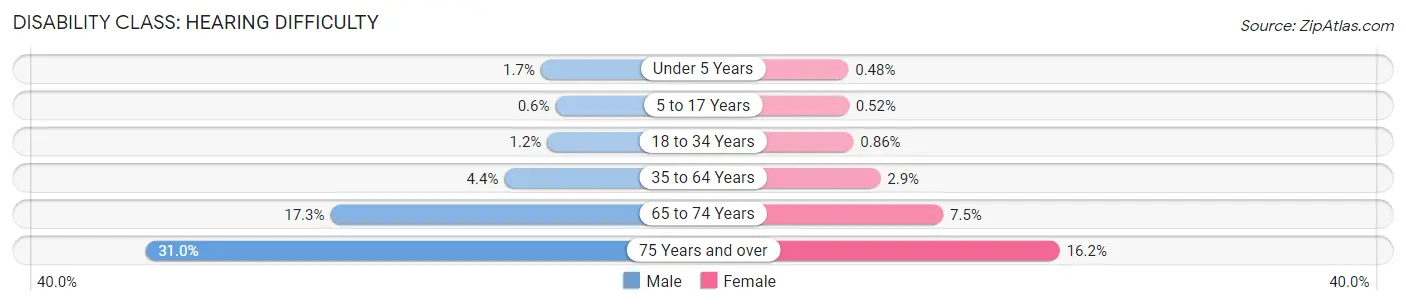
| Age Bracket | Male | Female |
| Under 5 Years | 198 (1.7%) | 55 (0.5%) |
| 5 to 17 Years | 218 (0.6%) | 182 (0.5%) |
| 18 to 34 Years | 529 (1.2%) | 340 (0.9%) |
| 35 to 64 Years | 3,134 (4.4%) | 2,102 (2.9%) |
| 65 to 74 Years | 4,217 (17.3%) | 2,109 (7.5%) |
| 75 Years and over | 5,529 (31.0%) | 3,023 (16.2%) |
Disability Class: Vision Difficulty
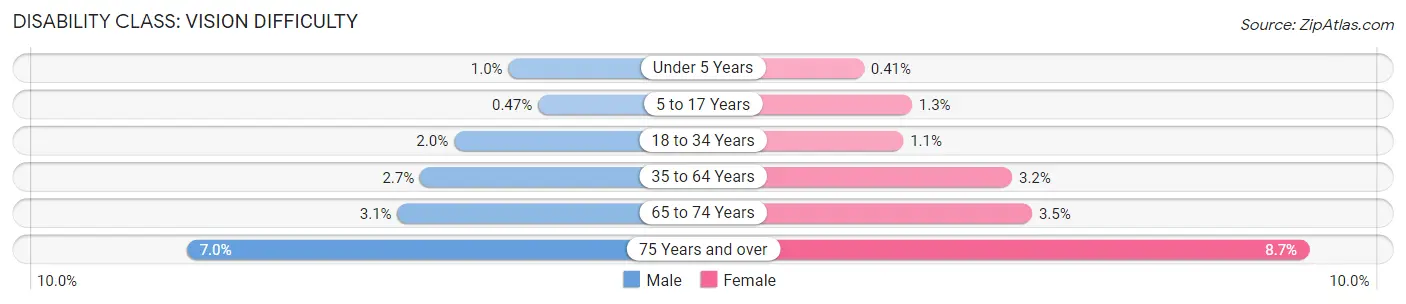
| Age Bracket | Male | Female |
| Under 5 Years | 120 (1.0%) | 47 (0.4%) |
| 5 to 17 Years | 174 (0.5%) | 458 (1.3%) |
| 18 to 34 Years | 894 (2.0%) | 451 (1.1%) |
| 35 to 64 Years | 1,900 (2.7%) | 2,325 (3.2%) |
| 65 to 74 Years | 751 (3.1%) | 991 (3.5%) |
| 75 Years and over | 1,245 (7.0%) | 1,619 (8.7%) |
Disability Class: Cognitive Difficulty
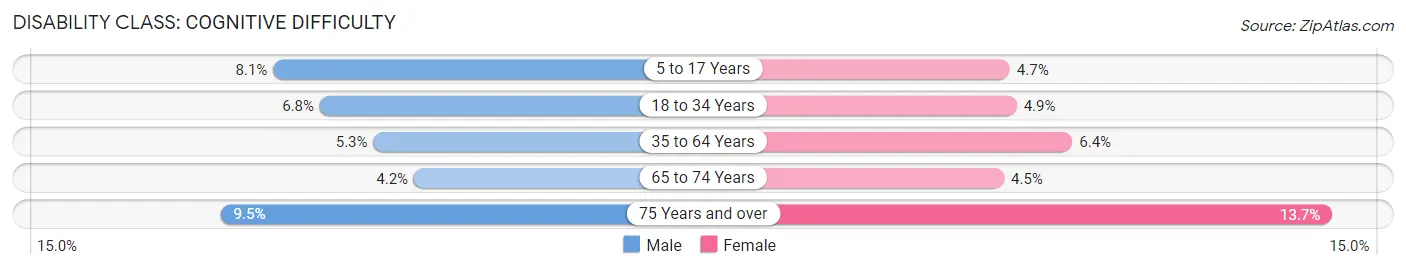
| Age Bracket | Male | Female |
| 5 to 17 Years | 2,960 (8.1%) | 1,652 (4.7%) |
| 18 to 34 Years | 2,990 (6.8%) | 1,922 (4.9%) |
| 35 to 64 Years | 3,774 (5.3%) | 4,715 (6.4%) |
| 65 to 74 Years | 1,015 (4.2%) | 1,268 (4.5%) |
| 75 Years and over | 1,700 (9.5%) | 2,549 (13.7%) |
Disability Class: Ambulatory Difficulty
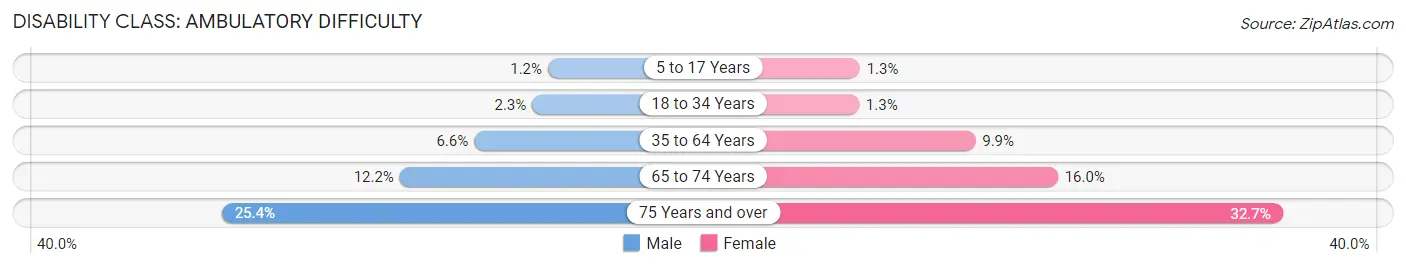
| Age Bracket | Male | Female |
| 5 to 17 Years | 422 (1.1%) | 471 (1.3%) |
| 18 to 34 Years | 1,023 (2.3%) | 500 (1.3%) |
| 35 to 64 Years | 4,734 (6.6%) | 7,282 (9.9%) |
| 65 to 74 Years | 2,963 (12.1%) | 4,494 (16.0%) |
| 75 Years and over | 4,516 (25.4%) | 6,113 (32.7%) |
Disability Class: Self-Care Difficulty
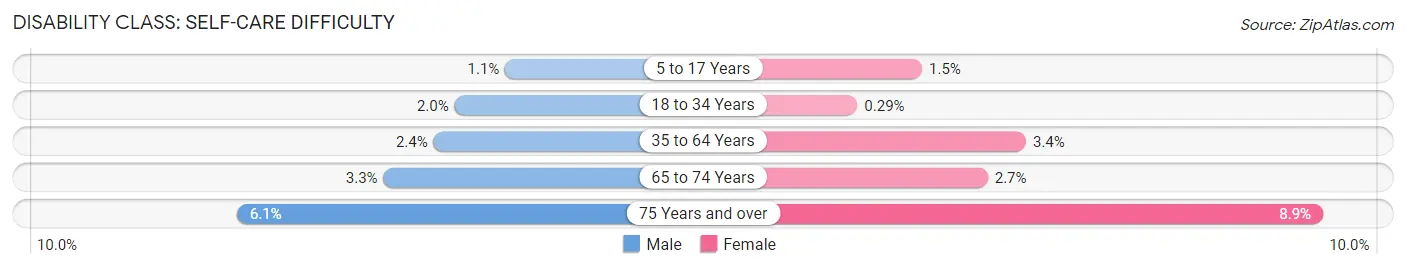
| Age Bracket | Male | Female |
| 5 to 17 Years | 394 (1.1%) | 526 (1.5%) |
| 18 to 34 Years | 889 (2.0%) | 116 (0.3%) |
| 35 to 64 Years | 1,719 (2.4%) | 2,514 (3.4%) |
| 65 to 74 Years | 814 (3.3%) | 760 (2.7%) |
| 75 Years and over | 1,079 (6.1%) | 1,668 (8.9%) |
Technology Access in Pinal County
Computing Device Access in Pinal County
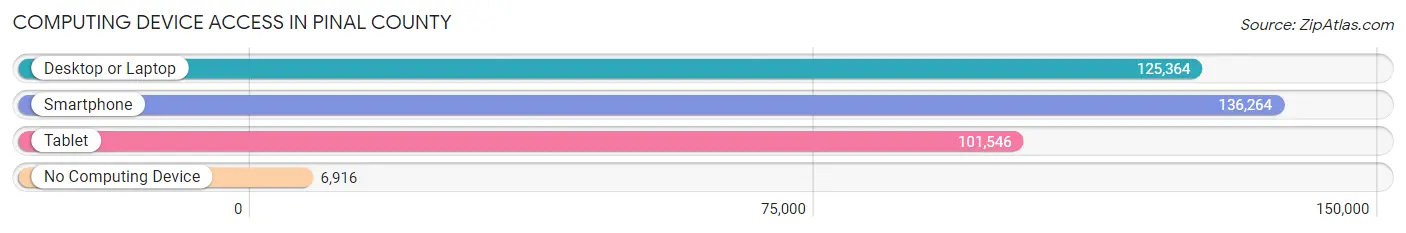
| Device Type | # Households | % Households |
| Desktop or Laptop | 125,364 | 82.8% |
| Smartphone | 136,264 | 89.9% |
| Tablet | 101,546 | 67.0% |
| No Computing Device | 6,916 | 4.6% |
| Total | 151,490 | 100.0% |
Internet Access in Pinal County
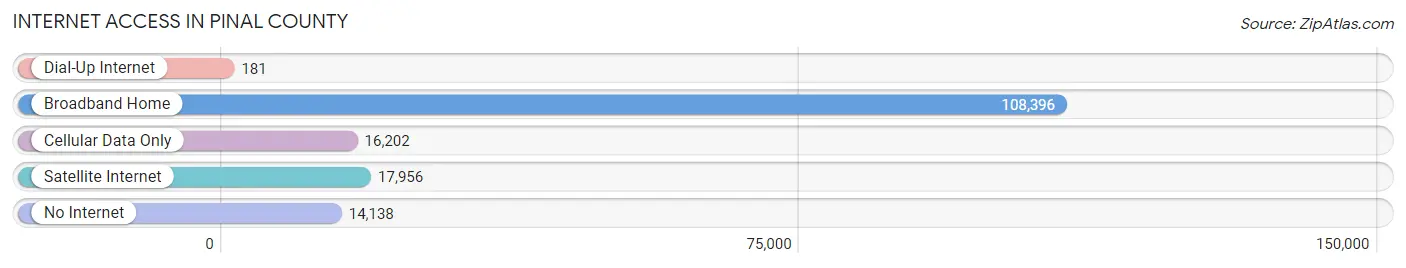
| Internet Type | # Households | % Households |
| Dial-Up Internet | 181 | 0.1% |
| Broadband Home | 108,396 | 71.6% |
| Cellular Data Only | 16,202 | 10.7% |
| Satellite Internet | 17,956 | 11.8% |
| No Internet | 14,138 | 9.3% |
| Total | 151,490 | 100.0% |
Pinal County Summary
Pinal County, Arizona is located in the south-central part of the state and is bordered by Maricopa County to the west, Gila County to the east, and Pima County to the south. The county seat is Florence, and the largest city is Casa Grande. Pinal County is the third-largest county in Arizona, covering an area of 5,374 square miles. As of the 2010 census, the population was 375,770, making it the fourth-most populous county in Arizona.
Geography
Pinal County is located in the Sonoran Desert, and is characterized by its arid climate and rugged terrain. The county is home to several mountain ranges, including the Superstition Mountains, the Mazatzal Mountains, and the Santa Catalina Mountains. The Gila River, which flows through the county, is the only major river in the area. The county is also home to several lakes, including Apache Lake, Canyon Lake, and San Carlos Lake.
The county is divided into five distinct regions: the Sonoran Desert, the Central Mountains, the Gila River Valley, the San Pedro Valley, and the San Carlos Plateau. The Sonoran Desert is the driest region, and is characterized by its cacti and other desert vegetation. The Central Mountains are home to several mountain ranges, and are the most rugged region of the county. The Gila River Valley is the most populated region, and is home to several cities and towns. The San Pedro Valley is the most agriculturally productive region, and is home to several farms and ranches. The San Carlos Plateau is the highest region, and is home to several Native American reservations.
Economy
Pinal County’s economy is largely based on agriculture, mining, and tourism. Agriculture is the largest sector of the economy, and is responsible for the production of cotton, alfalfa, wheat, and other crops. Mining is also an important part of the economy, and is responsible for the production of copper, gold, and other minerals. Tourism is also an important part of the economy, and is responsible for the influx of visitors to the county’s many attractions, such as the Superstition Mountains, the Gila River, and the San Carlos Plateau.
Demographics
As of the 2010 census, the population of Pinal County was 375,770, making it the fourth-most populous county in Arizona. The population is largely composed of White (63.2%), Hispanic or Latino (30.2%), and Native American (3.3%) individuals. The median household income is $50,845, and the median age is 35.7 years.
Pinal County is home to several Native American tribes, including the Akimel O’odham, the Tohono O’odham, the Pima, and the Maricopa. The county is also home to several military installations, including the Marine Corps Air Station Yuma and the Army National Guard’s Camp Navajo.
Conclusion
Pinal County, Arizona is a large county located in the south-central part of the state. It is characterized by its arid climate and rugged terrain, and is home to several mountain ranges, rivers, and lakes. The economy is largely based on agriculture, mining, and tourism, and the population is largely composed of White, Hispanic or Latino, and Native American individuals. Pinal County is home to several Native American tribes, and is also home to several military installations.
Common Questions
What is Per Capita Income in Pinal County?
Per Capita income in Pinal County is $33,158.
What is the Median Family Income in Pinal County?
Median Family Income in Pinal County is $80,809.
What is the Median Household income in Pinal County?
Median Household Income in Pinal County is $73,313.
What is Income or Wage Gap in Pinal County?
Income or Wage Gap in Pinal County is 23.9%.
Women in Pinal County earn 76.1 cents for every dollar earned by a man.
What is Family Income Deficit in Pinal County?
Family Income Deficit in Pinal County is $11,490.
Families that are below poverty line in Pinal County earn $11,490 less on average than the poverty threshold level.
What is Inequality or Gini Index in Pinal County?
Inequality or Gini Index in Pinal County is 0.42.
What is the Total Population of Pinal County?
Total Population of Pinal County is 433,338.
What is the Total Male Population of Pinal County?
Total Male Population of Pinal County is 226,232.
What is the Total Female Population of Pinal County?
Total Female Population of Pinal County is 207,106.
What is the Ratio of Males per 100 Females in Pinal County?
There are 109.23 Males per 100 Females in Pinal County.
What is the Ratio of Females per 100 Males in Pinal County?
There are 91.55 Females per 100 Males in Pinal County.
What is the Median Population Age in Pinal County?
Median Population Age in Pinal County is 39.8 Years.
What is the Average Family Size in Pinal County
Average Family Size in Pinal County is 3.1 People.
What is the Average Household Size in Pinal County
Average Household Size in Pinal County is 2.7 People.
How Large is the Labor Force in Pinal County?
There are 183,364 People in the Labor Forcein in Pinal County.
What is the Percentage of People in the Labor Force in Pinal County?
52.6% of People are in the Labor Force in Pinal County.
What is the Unemployment Rate in Pinal County?
Unemployment Rate in Pinal County is 6.4%.