Pima County, AZ Map & Demographics
Pima County Map
Pima County Overview
$36,494
PER CAPITA INCOME
$82,620
AVG FAMILY INCOME
$64,323
AVG HOUSEHOLD INCOME
21.4%
WAGE / INCOME GAP [ % ]
78.6¢/ $1
WAGE / INCOME GAP [ $ ]
$11,516
FAMILY INCOME DEFICIT
0.47
INEQUALITY / GINI INDEX
1,042,393
TOTAL POPULATION
516,095
MALE POPULATION
526,298
FEMALE POPULATION
98.06
MALES / 100 FEMALES
101.98
FEMALES / 100 MALES
39.0
MEDIAN AGE
3.0
AVG FAMILY SIZE
2.4
AVG HOUSEHOLD SIZE
499,555
LABOR FORCE [ PEOPLE ]
58.4%
PERCENT IN LABOR FORCE
5.9%
UNEMPLOYMENT RATE
Income in Pima County
Income Overview in Pima County
Per Capita Income in Pima County is $36,494, while median incomes of families and households are $82,620 and $64,323 respectively.
| Characteristic | Number | Measure |
| Per Capita Income | 1,042,393 | $36,494 |
| Median Family Income | 256,950 | $82,620 |
| Mean Family Income | 256,950 | $106,185 |
| Median Household Income | 423,075 | $64,323 |
| Mean Household Income | 423,075 | $88,437 |
| Income Deficit | 256,950 | $11,516 |
| Wage / Income Gap (%) | 1,042,393 | 21.41% |
| Wage / Income Gap ($) | 1,042,393 | 78.59¢ per $1 |
| Gini / Inequality Index | 1,042,393 | 0.47 |
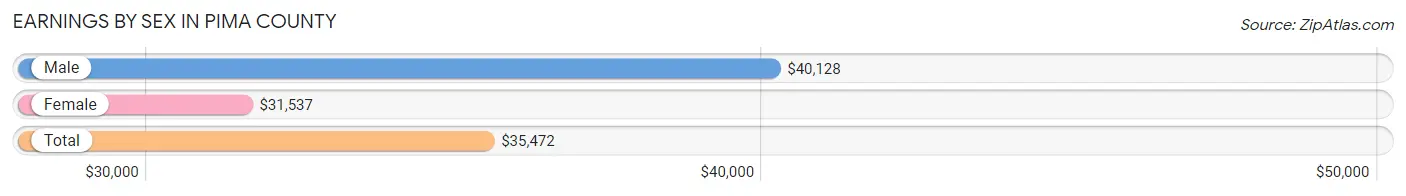
Earnings by Sex in Pima County
Average Earnings in Pima County are $35,472, $40,128 for men and $31,537 for women, a difference of 21.4%.
| Sex | Number | Average Earnings |
| Male | 277,824 (53.0%) | $40,128 |
| Female | 246,403 (47.0%) | $31,537 |
| Total | 524,227 (100.0%) | $35,472 |
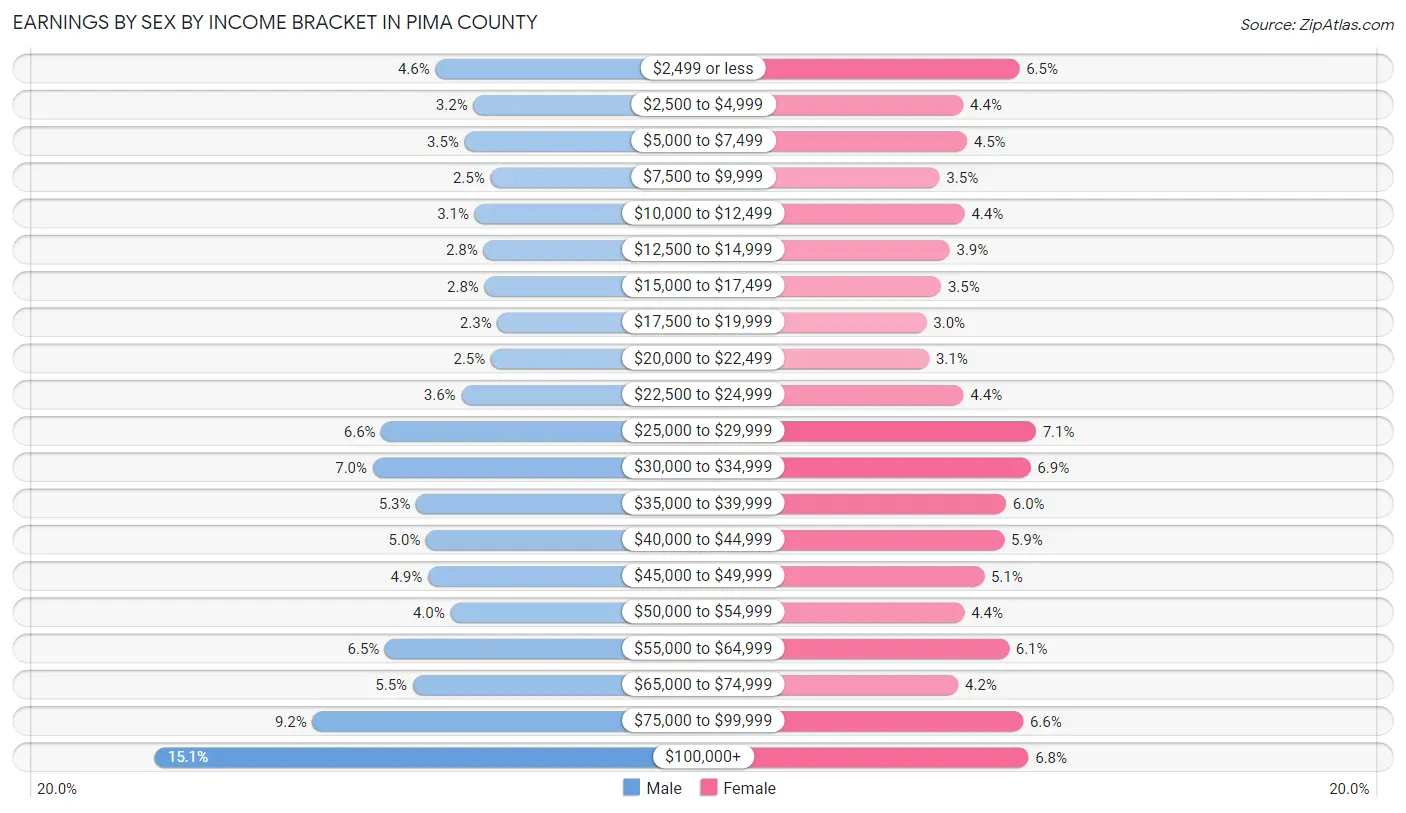
Earnings by Sex by Income Bracket in Pima County
The most common earnings brackets in Pima County are $100,000+ for men (41,998 | 15.1%) and $25,000 to $29,999 for women (17,443 | 7.1%).
| Income | Male | Female |
| $2,499 or less | 12,782 (4.6%) | 15,912 (6.5%) |
| $2,500 to $4,999 | 8,837 (3.2%) | 10,750 (4.4%) |
| $5,000 to $7,499 | 9,764 (3.5%) | 11,097 (4.5%) |
| $7,500 to $9,999 | 7,051 (2.5%) | 8,556 (3.5%) |
| $10,000 to $12,499 | 8,687 (3.1%) | 10,857 (4.4%) |
| $12,500 to $14,999 | 7,774 (2.8%) | 9,478 (3.8%) |
| $15,000 to $17,499 | 7,681 (2.8%) | 8,698 (3.5%) |
| $17,500 to $19,999 | 6,328 (2.3%) | 7,352 (3.0%) |
| $20,000 to $22,499 | 7,015 (2.5%) | 7,585 (3.1%) |
| $22,500 to $24,999 | 10,088 (3.6%) | 10,780 (4.4%) |
| $25,000 to $29,999 | 18,415 (6.6%) | 17,443 (7.1%) |
| $30,000 to $34,999 | 19,313 (7.0%) | 16,964 (6.9%) |
| $35,000 to $39,999 | 14,778 (5.3%) | 14,678 (6.0%) |
| $40,000 to $44,999 | 13,757 (5.0%) | 14,512 (5.9%) |
| $45,000 to $49,999 | 13,564 (4.9%) | 12,654 (5.1%) |
| $50,000 to $54,999 | 11,234 (4.0%) | 10,841 (4.4%) |
| $55,000 to $64,999 | 18,041 (6.5%) | 14,945 (6.1%) |
| $65,000 to $74,999 | 15,138 (5.4%) | 10,278 (4.2%) |
| $75,000 to $99,999 | 25,579 (9.2%) | 16,265 (6.6%) |
| $100,000+ | 41,998 (15.1%) | 16,758 (6.8%) |
| Total | 277,824 (100.0%) | 246,403 (100.0%) |
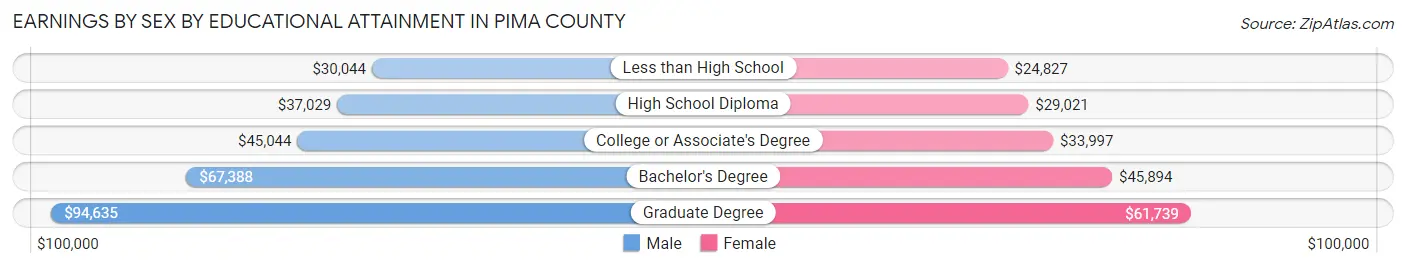
Earnings by Sex by Educational Attainment in Pima County
Average earnings in Pima County are $47,668 for men and $37,399 for women, a difference of 21.5%. Men with an educational attainment of graduate degree enjoy the highest average annual earnings of $94,635, while those with less than high school education earn the least with $30,044. Women with an educational attainment of graduate degree earn the most with the average annual earnings of $61,739, while those with less than high school education have the smallest earnings of $24,827.
| Educational Attainment | Male Income | Female Income |
| Less than High School | $30,044 | $24,827 |
| High School Diploma | $37,029 | $29,021 |
| College or Associate's Degree | $45,044 | $33,997 |
| Bachelor's Degree | $67,388 | $45,894 |
| Graduate Degree | $94,635 | $61,739 |
| Total | $47,668 | $37,399 |
Family Income in Pima County
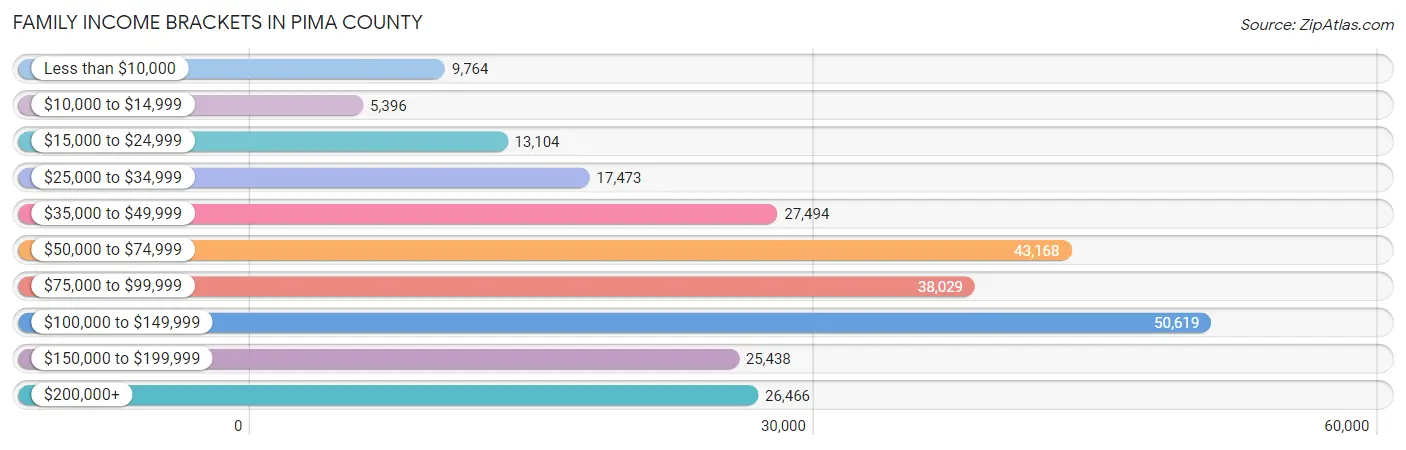
Family Income Brackets in Pima County
According to the Pima County family income data, there are 50,619 families falling into the $100,000 to $149,999 income range, which is the most common income bracket and makes up 19.7% of all families. Conversely, the $10,000 to $14,999 income bracket is the least frequent group with only 5,396 families (2.1%) belonging to this category.
| Income Bracket | # Families | % Families |
| Less than $10,000 | 9,764 | 3.8% |
| $10,000 to $14,999 | 5,396 | 2.1% |
| $15,000 to $24,999 | 13,104 | 5.1% |
| $25,000 to $34,999 | 17,473 | 6.8% |
| $35,000 to $49,999 | 27,494 | 10.7% |
| $50,000 to $74,999 | 43,168 | 16.8% |
| $75,000 to $99,999 | 38,029 | 14.8% |
| $100,000 to $149,999 | 50,619 | 19.7% |
| $150,000 to $199,999 | 25,438 | 9.9% |
| $200,000+ | 26,466 | 10.3% |
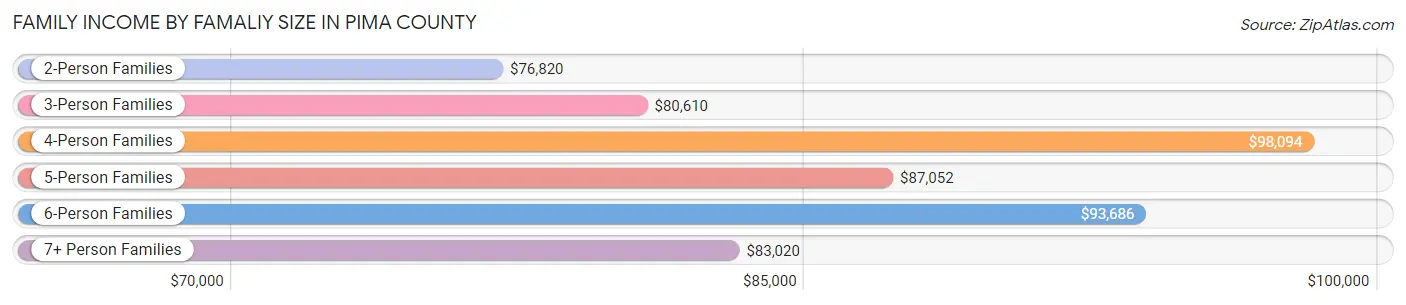
Family Income by Famaliy Size in Pima County
4-person families (43,818 | 17.1%) account for the highest median family income in Pima County with $98,094 per family, while 2-person families (130,226 | 50.7%) have the highest median income of $38,410 per family member.
| Income Bracket | # Families | Median Income |
| 2-Person Families | 130,226 (50.7%) | $76,820 |
| 3-Person Families | 50,913 (19.8%) | $80,610 |
| 4-Person Families | 43,818 (17.1%) | $98,094 |
| 5-Person Families | 19,276 (7.5%) | $87,052 |
| 6-Person Families | 8,244 (3.2%) | $93,686 |
| 7+ Person Families | 4,473 (1.7%) | $83,020 |
| Total | 256,950 (100.0%) | $82,620 |
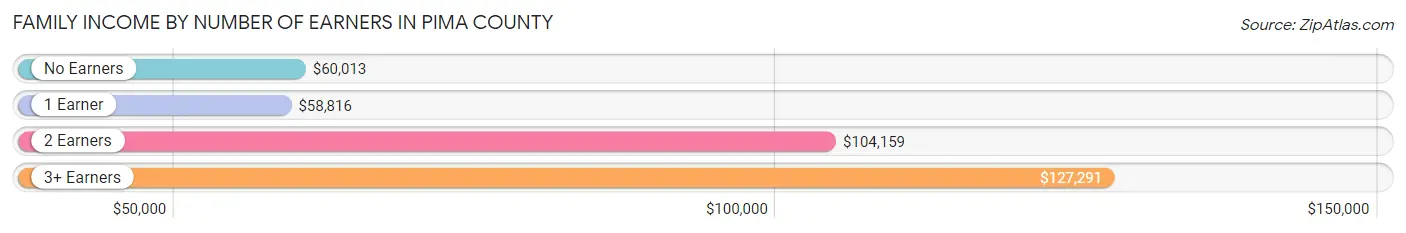
Family Income by Number of Earners in Pima County
The median family income in Pima County is $82,620, with families comprising 3+ earners (23,169) having the highest median family income of $127,291, while families with 1 earner (87,070) have the lowest median family income of $58,816, accounting for 9.0% and 33.9% of families, respectively.
| Number of Earners | # Families | Median Income |
| No Earners | 51,407 (20.0%) | $60,013 |
| 1 Earner | 87,070 (33.9%) | $58,816 |
| 2 Earners | 95,304 (37.1%) | $104,159 |
| 3+ Earners | 23,169 (9.0%) | $127,291 |
| Total | 256,950 (100.0%) | $82,620 |
Household Income in Pima County
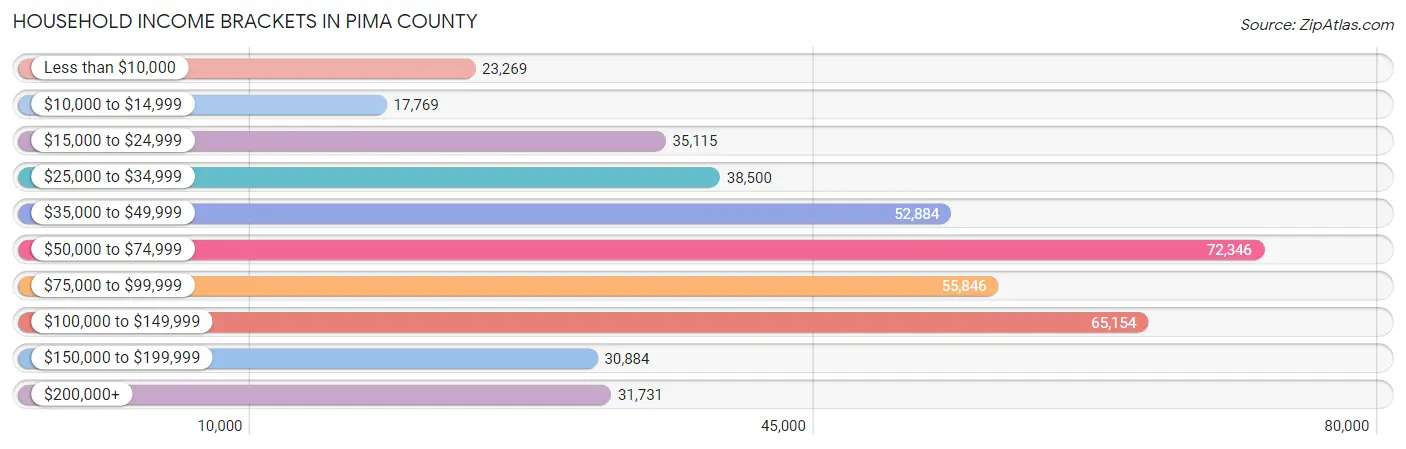
Household Income Brackets in Pima County
With 72,346 households falling in the category, the $50,000 to $74,999 income range is the most frequent in Pima County, accounting for 17.1% of all households. In contrast, only 17,769 households (4.2%) fall into the $10,000 to $14,999 income bracket, making it the least populous group.
| Income Bracket | # Households | % Households |
| Less than $10,000 | 23,269 | 5.5% |
| $10,000 to $14,999 | 17,769 | 4.2% |
| $15,000 to $24,999 | 35,115 | 8.3% |
| $25,000 to $34,999 | 38,500 | 9.1% |
| $35,000 to $49,999 | 52,884 | 12.5% |
| $50,000 to $74,999 | 72,346 | 17.1% |
| $75,000 to $99,999 | 55,846 | 13.2% |
| $100,000 to $149,999 | 65,154 | 15.4% |
| $150,000 to $199,999 | 30,884 | 7.3% |
| $200,000+ | 31,731 | 7.5% |
Household Income by Householder Age in Pima County
The median household income in Pima County is $64,323, with the highest median household income of $79,327 found in the 45 to 64 years age bracket for the primary householder. A total of 135,864 households (32.1%) fall into this category. Meanwhile, the 15 to 24 years age bracket for the primary householder has the lowest median household income of $34,806, with 29,524 households (7.0%) in this group.
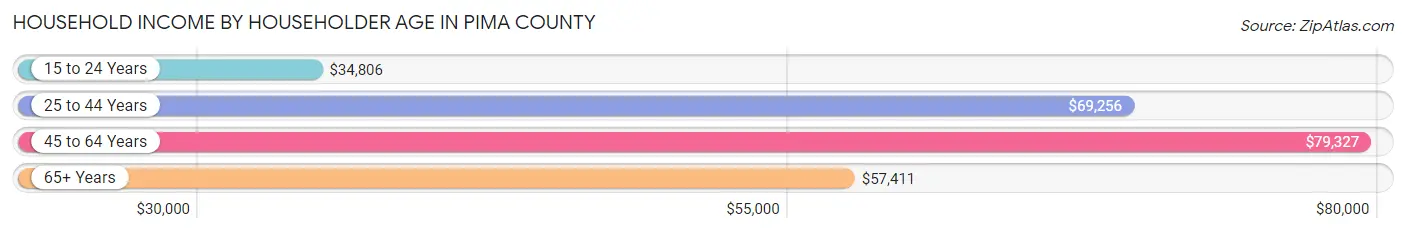
| Income Bracket | # Households | Median Income |
| 15 to 24 Years | 29,524 (7.0%) | $34,806 |
| 25 to 44 Years | 123,079 (29.1%) | $69,256 |
| 45 to 64 Years | 135,864 (32.1%) | $79,327 |
| 65+ Years | 134,608 (31.8%) | $57,411 |
| Total | 423,075 (100.0%) | $64,323 |
Poverty in Pima County
Income Below Poverty by Sex and Age in Pima County
With 13.8% poverty level for males and 16.1% for females among the residents of Pima County, under 5 year old males and 18 to 24 year old females are the most vulnerable to poverty, with 6,523 males (24.1%) and 15,813 females (27.9%) in their respective age groups living below the poverty level.
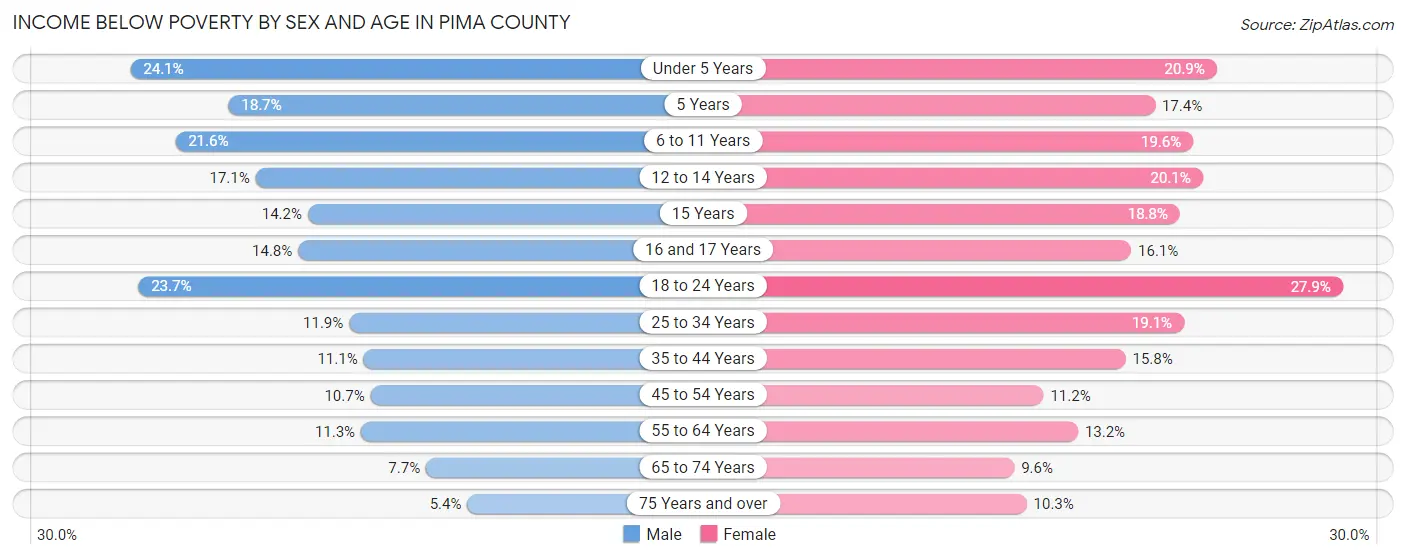
| Age Bracket | Male | Female |
| Under 5 Years | 6,523 (24.1%) | 5,334 (20.9%) |
| 5 Years | 1,049 (18.6%) | 857 (17.4%) |
| 6 to 11 Years | 7,800 (21.6%) | 7,025 (19.6%) |
| 12 to 14 Years | 3,176 (17.1%) | 3,407 (20.1%) |
| 15 Years | 965 (14.2%) | 1,224 (18.8%) |
| 16 and 17 Years | 1,764 (14.8%) | 1,825 (16.1%) |
| 18 to 24 Years | 13,951 (23.7%) | 15,813 (27.9%) |
| 25 to 34 Years | 8,012 (11.9%) | 12,122 (19.1%) |
| 35 to 44 Years | 6,542 (11.1%) | 9,333 (15.8%) |
| 45 to 54 Years | 5,818 (10.7%) | 6,321 (11.2%) |
| 55 to 64 Years | 6,665 (11.3%) | 8,605 (13.2%) |
| 65 to 74 Years | 4,224 (7.6%) | 6,088 (9.6%) |
| 75 Years and over | 2,127 (5.3%) | 5,163 (10.3%) |
| Total | 68,616 (13.8%) | 83,117 (16.1%) |
Income Above Poverty by Sex and Age in Pima County
According to the poverty statistics in Pima County, males aged 75 years and over and females aged 65 to 74 years are the age groups that are most secure financially, with 94.7% of males and 90.4% of females in these age groups living above the poverty line.
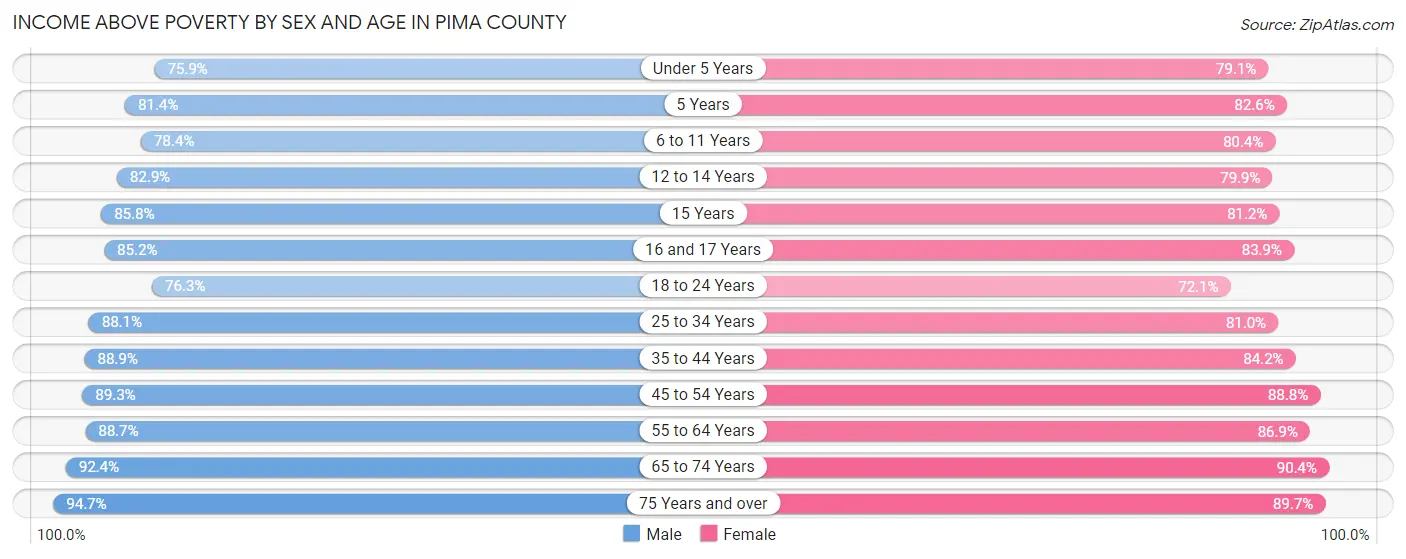
| Age Bracket | Male | Female |
| Under 5 Years | 20,528 (75.9%) | 20,230 (79.1%) |
| 5 Years | 4,575 (81.4%) | 4,058 (82.6%) |
| 6 to 11 Years | 28,292 (78.4%) | 28,897 (80.4%) |
| 12 to 14 Years | 15,350 (82.9%) | 13,553 (79.9%) |
| 15 Years | 5,815 (85.8%) | 5,280 (81.2%) |
| 16 and 17 Years | 10,181 (85.2%) | 9,501 (83.9%) |
| 18 to 24 Years | 44,980 (76.3%) | 40,880 (72.1%) |
| 25 to 34 Years | 59,139 (88.1%) | 51,517 (80.9%) |
| 35 to 44 Years | 52,223 (88.9%) | 49,730 (84.2%) |
| 45 to 54 Years | 48,378 (89.3%) | 49,945 (88.8%) |
| 55 to 64 Years | 52,459 (88.7%) | 56,813 (86.9%) |
| 65 to 74 Years | 50,964 (92.3%) | 57,301 (90.4%) |
| 75 Years and over | 37,659 (94.7%) | 45,017 (89.7%) |
| Total | 430,543 (86.3%) | 432,722 (83.9%) |
Income Below Poverty Among Married-Couple Families in Pima County
The poverty statistics for married-couple families in Pima County show that 5.3% or 9,605 of the total 182,022 families live below the poverty line. Families with 5 or more children have the highest poverty rate of 28.5%, comprising of 337 families. On the other hand, families with no children have the lowest poverty rate of 3.3%, which includes 3,780 families.
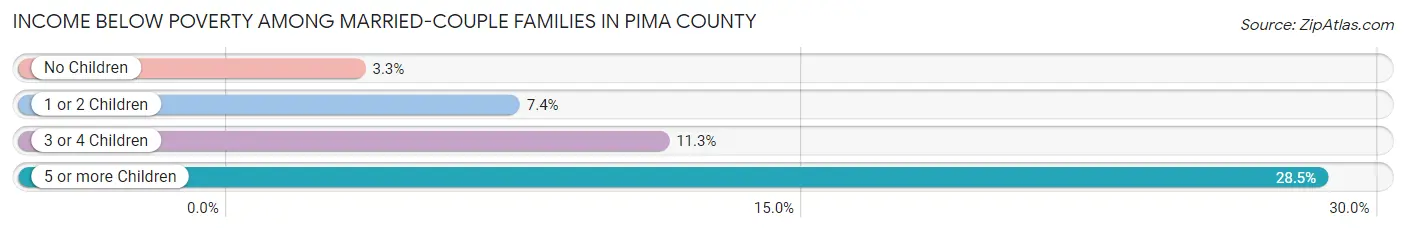
| Children | Above Poverty | Below Poverty |
| No Children | 109,742 (96.7%) | 3,780 (3.3%) |
| 1 or 2 Children | 49,641 (92.6%) | 3,941 (7.4%) |
| 3 or 4 Children | 12,187 (88.7%) | 1,547 (11.3%) |
| 5 or more Children | 847 (71.5%) | 337 (28.5%) |
| Total | 172,417 (94.7%) | 9,605 (5.3%) |
Income Below Poverty Among Single-Parent Households in Pima County
According to the poverty data in Pima County, 15.4% or 3,629 single-father households and 25.5% or 13,078 single-mother households are living below the poverty line. Among single-father households, those with 5 or more children have the highest poverty rate, with 156 households (62.2%) experiencing poverty. Likewise, among single-mother households, those with 5 or more children have the highest poverty rate, with 415 households (69.5%) falling below the poverty line.
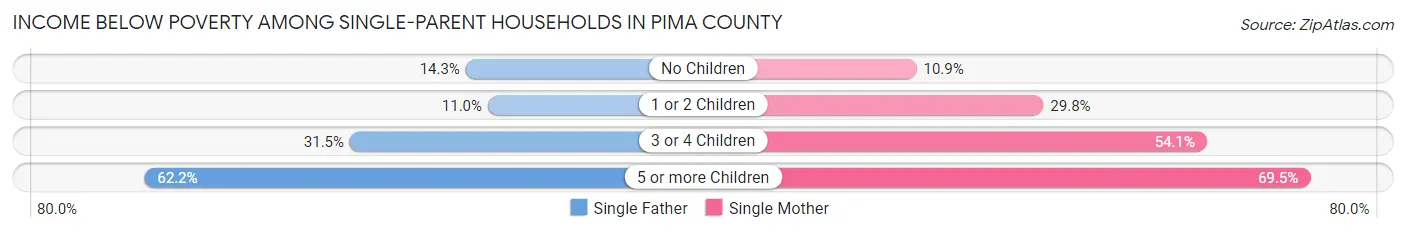
| Children | Single Father | Single Mother |
| No Children | 1,380 (14.3%) | 2,230 (10.9%) |
| 1 or 2 Children | 1,190 (11.0%) | 7,195 (29.8%) |
| 3 or 4 Children | 903 (31.5%) | 3,238 (54.1%) |
| 5 or more Children | 156 (62.2%) | 415 (69.5%) |
| Total | 3,629 (15.4%) | 13,078 (25.5%) |
Income Below Poverty Among Married-Couple vs Single-Parent Households in Pima County
The poverty data for Pima County shows that 9,605 of the married-couple family households (5.3%) and 16,707 of the single-parent households (22.3%) are living below the poverty level. Within the married-couple family households, those with 5 or more children have the highest poverty rate, with 337 households (28.5%) falling below the poverty line. Among the single-parent households, those with 5 or more children have the highest poverty rate, with 571 household (67.3%) living below poverty.
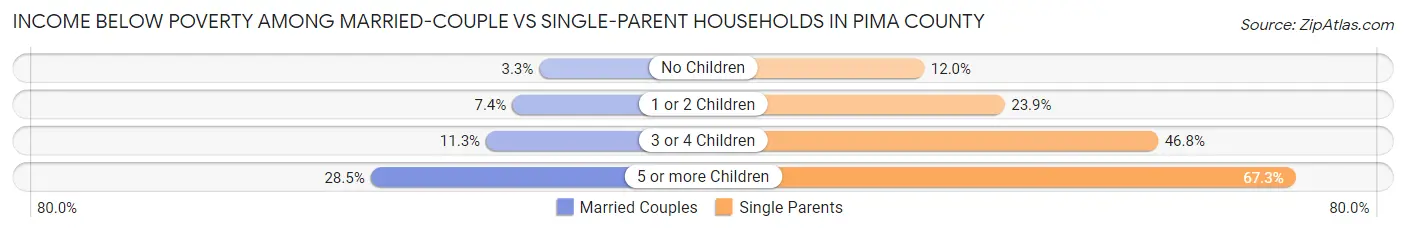
| Children | Married-Couple Families | Single-Parent Households |
| No Children | 3,780 (3.3%) | 3,610 (11.9%) |
| 1 or 2 Children | 3,941 (7.4%) | 8,385 (23.9%) |
| 3 or 4 Children | 1,547 (11.3%) | 4,141 (46.8%) |
| 5 or more Children | 337 (28.5%) | 571 (67.3%) |
| Total | 9,605 (5.3%) | 16,707 (22.3%) |
Race in Pima County
The most populous races in Pima County are White / Caucasian (686,722 | 65.9%), Hispanic or Latino (397,081 | 38.1%), and Two or more Races (147,895 | 14.2%).
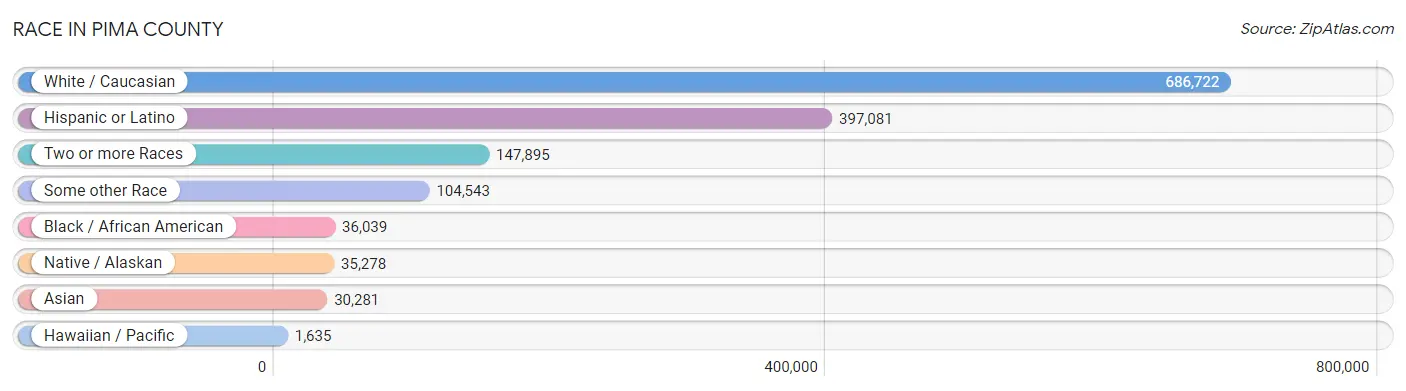
| Race | # Population | % Population |
| Asian | 30,281 | 2.9% |
| Black / African American | 36,039 | 3.5% |
| Hawaiian / Pacific | 1,635 | 0.2% |
| Hispanic or Latino | 397,081 | 38.1% |
| Native / Alaskan | 35,278 | 3.4% |
| White / Caucasian | 686,722 | 65.9% |
| Two or more Races | 147,895 | 14.2% |
| Some other Race | 104,543 | 10.0% |
| Total | 1,042,393 | 100.0% |
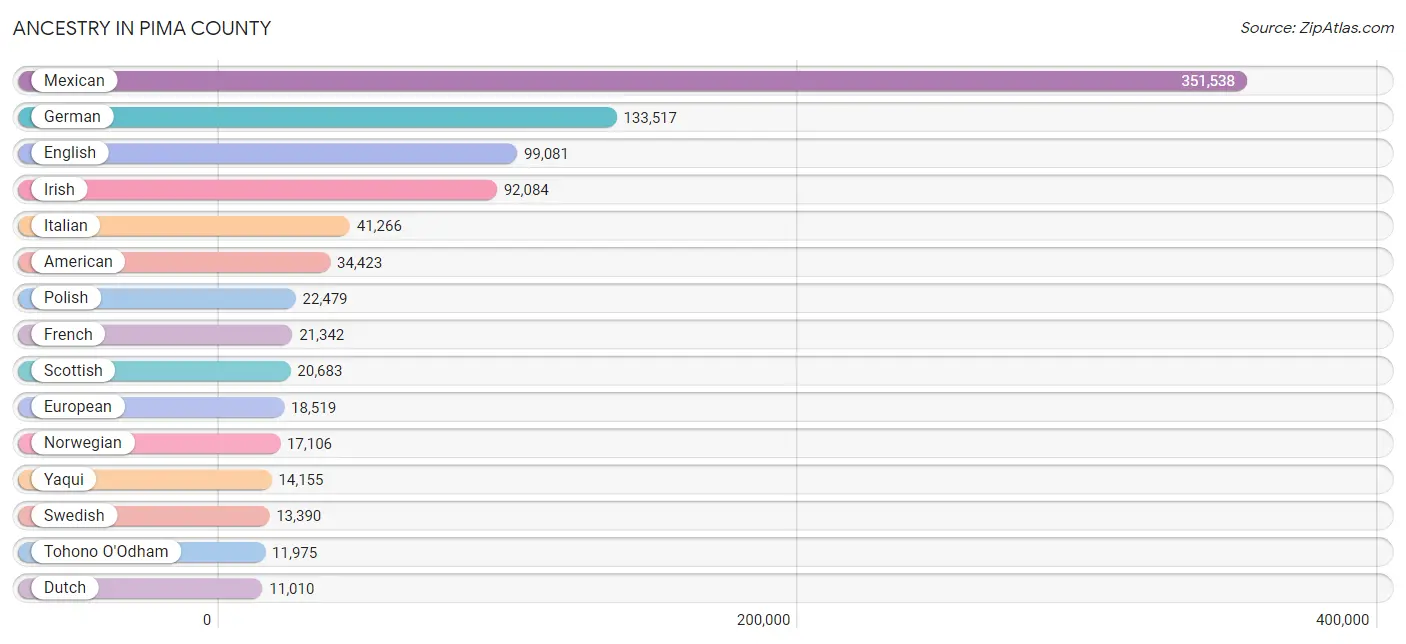
Ancestry in Pima County
The most populous ancestries reported in Pima County are Mexican (351,538 | 33.7%), German (133,517 | 12.8%), English (99,081 | 9.5%), Irish (92,084 | 8.8%), and Italian (41,266 | 4.0%), together accounting for 68.8% of all Pima County residents.
| Ancestry | # Population | % Population |
| Afghan | 381 | 0.0% |
| African | 2,685 | 0.3% |
| Alaska Native | 20 | 0.0% |
| Alaskan Athabascan | 11 | 0.0% |
| Albanian | 35 | 0.0% |
| Aleut | 47 | 0.0% |
| Alsatian | 69 | 0.0% |
| American | 34,423 | 3.3% |
| Apache | 2,069 | 0.2% |
| Arab | 5,763 | 0.5% |
| Argentinean | 303 | 0.0% |
| Armenian | 707 | 0.1% |
| Assyrian / Chaldean / Syriac | 177 | 0.0% |
| Australian | 346 | 0.0% |
| Austrian | 2,300 | 0.2% |
| Bahamian | 12 | 0.0% |
| Barbadian | 23 | 0.0% |
| Basque | 536 | 0.1% |
| Belgian | 880 | 0.1% |
| Belizean | 219 | 0.0% |
| Bermudan | 11 | 0.0% |
| Bhutanese | 4,632 | 0.4% |
| Blackfeet | 361 | 0.0% |
| Bolivian | 153 | 0.0% |
| Brazilian | 710 | 0.1% |
| British | 8,448 | 0.8% |
| British West Indian | 82 | 0.0% |
| Bulgarian | 163 | 0.0% |
| Burmese | 4,853 | 0.5% |
| Cajun | 103 | 0.0% |
| Cambodian | 28 | 0.0% |
| Canadian | 2,772 | 0.3% |
| Cape Verdean | 9 | 0.0% |
| Carpatho Rusyn | 44 | 0.0% |
| Celtic | 561 | 0.1% |
| Central American | 6,004 | 0.6% |
| Central American Indian | 1,788 | 0.2% |
| Cherokee | 3,427 | 0.3% |
| Cheyenne | 64 | 0.0% |
| Chickasaw | 113 | 0.0% |
| Chilean | 497 | 0.1% |
| Chinese | 84 | 0.0% |
| Chippewa | 516 | 0.1% |
| Choctaw | 807 | 0.1% |
| Colombian | 1,758 | 0.2% |
| Comanche | 105 | 0.0% |
| Costa Rican | 288 | 0.0% |
| Cree | 6 | 0.0% |
| Creek | 172 | 0.0% |
| Croatian | 1,407 | 0.1% |
| Crow | 54 | 0.0% |
| Cuban | 1,906 | 0.2% |
| Cypriot | 21 | 0.0% |
| Czech | 3,769 | 0.4% |
| Czechoslovakian | 906 | 0.1% |
| Danish | 4,548 | 0.4% |
| Delaware | 100 | 0.0% |
| Dominican | 646 | 0.1% |
| Dutch | 11,010 | 1.1% |
| Dutch West Indian | 44 | 0.0% |
| Eastern European | 3,333 | 0.3% |
| Ecuadorian | 458 | 0.0% |
| Egyptian | 1,031 | 0.1% |
| English | 99,081 | 9.5% |
| Estonian | 38 | 0.0% |
| Ethiopian | 866 | 0.1% |
| European | 18,519 | 1.8% |
| Fijian | 329 | 0.0% |
| Filipino | 465 | 0.0% |
| Finnish | 1,949 | 0.2% |
| French | 21,342 | 2.1% |
| French American Indian | 246 | 0.0% |
| French Canadian | 4,334 | 0.4% |
| German | 133,517 | 12.8% |
| German Russian | 54 | 0.0% |
| Ghanaian | 131 | 0.0% |
| Greek | 3,967 | 0.4% |
| Guamanian / Chamorro | 582 | 0.1% |
| Guatemalan | 1,482 | 0.1% |
| Guyanese | 146 | 0.0% |
| Haitian | 703 | 0.1% |
| Honduran | 1,120 | 0.1% |
| Hopi | 301 | 0.0% |
| Hungarian | 4,963 | 0.5% |
| Icelander | 209 | 0.0% |
| Indian (Asian) | 10,966 | 1.1% |
| Indonesian | 73 | 0.0% |
| Inupiat | 87 | 0.0% |
| Iranian | 1,288 | 0.1% |
| Iraqi | 339 | 0.0% |
| Irish | 92,084 | 8.8% |
| Iroquois | 312 | 0.0% |
| Israeli | 615 | 0.1% |
| Italian | 41,266 | 4.0% |
| Jamaican | 595 | 0.1% |
| Japanese | 97 | 0.0% |
| Jordanian | 217 | 0.0% |
| Kenyan | 417 | 0.0% |
| Kiowa | 29 | 0.0% |
| Korean | 10,995 | 1.1% |
| Laotian | 222 | 0.0% |
| Latvian | 272 | 0.0% |
| Lebanese | 1,568 | 0.2% |
| Liberian | 119 | 0.0% |
| Lithuanian | 2,182 | 0.2% |
| Lumbee | 11 | 0.0% |
| Luxembourger | 157 | 0.0% |
| Macedonian | 168 | 0.0% |
| Malaysian | 336 | 0.0% |
| Maltese | 78 | 0.0% |
| Menominee | 103 | 0.0% |
| Mexican | 351,538 | 33.7% |
| Mexican American Indian | 2,332 | 0.2% |
| Mongolian | 34 | 0.0% |
| Moroccan | 155 | 0.0% |
| Native Hawaiian | 1,383 | 0.1% |
| Navajo | 3,463 | 0.3% |
| New Zealander | 72 | 0.0% |
| Nicaraguan | 634 | 0.1% |
| Nigerian | 521 | 0.1% |
| Northern European | 2,322 | 0.2% |
| Norwegian | 17,106 | 1.6% |
| Okinawan | 14 | 0.0% |
| Osage | 7 | 0.0% |
| Ottawa | 103 | 0.0% |
| Paiute | 22 | 0.0% |
| Pakistani | 1,438 | 0.1% |
| Palestinian | 191 | 0.0% |
| Panamanian | 560 | 0.1% |
| Paraguayan | 45 | 0.0% |
| Pennsylvania German | 309 | 0.0% |
| Peruvian | 1,245 | 0.1% |
| Pima | 835 | 0.1% |
| Polish | 22,479 | 2.2% |
| Portuguese | 2,330 | 0.2% |
| Potawatomi | 43 | 0.0% |
| Pueblo | 249 | 0.0% |
| Puerto Rican | 9,959 | 1.0% |
| Puget Sound Salish | 25 | 0.0% |
| Romanian | 896 | 0.1% |
| Russian | 7,392 | 0.7% |
| Salvadoran | 1,884 | 0.2% |
| Samoan | 440 | 0.0% |
| Scandinavian | 4,582 | 0.4% |
| Scotch-Irish | 9,665 | 0.9% |
| Scottish | 20,683 | 2.0% |
| Seminole | 85 | 0.0% |
| Serbian | 427 | 0.0% |
| Shoshone | 25 | 0.0% |
| Sierra Leonean | 4 | 0.0% |
| Sioux | 691 | 0.1% |
| Slavic | 366 | 0.0% |
| Slovak | 1,266 | 0.1% |
| Slovene | 427 | 0.0% |
| Somali | 643 | 0.1% |
| South African | 157 | 0.0% |
| South American | 4,899 | 0.5% |
| South American Indian | 38 | 0.0% |
| Soviet Union | 30 | 0.0% |
| Spaniard | 7,016 | 0.7% |
| Spanish | 4,555 | 0.4% |
| Spanish American | 79 | 0.0% |
| Spanish American Indian | 91 | 0.0% |
| Sri Lankan | 4,683 | 0.4% |
| Subsaharan African | 7,556 | 0.7% |
| Sudanese | 244 | 0.0% |
| Swedish | 13,390 | 1.3% |
| Swiss | 2,685 | 0.3% |
| Syrian | 800 | 0.1% |
| Thai | 5,977 | 0.6% |
| Tlingit-Haida | 40 | 0.0% |
| Tohono O'Odham | 11,975 | 1.1% |
| Trinidadian and Tobagonian | 426 | 0.0% |
| Turkish | 395 | 0.0% |
| U.S. Virgin Islander | 76 | 0.0% |
| Ugandan | 26 | 0.0% |
| Ukrainian | 2,851 | 0.3% |
| Uruguayan | 3 | 0.0% |
| Ute | 42 | 0.0% |
| Venezuelan | 365 | 0.0% |
| Vietnamese | 321 | 0.0% |
| Welsh | 7,201 | 0.7% |
| West Indian | 275 | 0.0% |
| Yakama | 9 | 0.0% |
| Yaqui | 14,155 | 1.4% |
| Yugoslavian | 677 | 0.1% |
| Yuman | 232 | 0.0% |
| Yup'ik | 167 | 0.0% |
| Zimbabwean | 102 | 0.0% | View All 189 Rows |
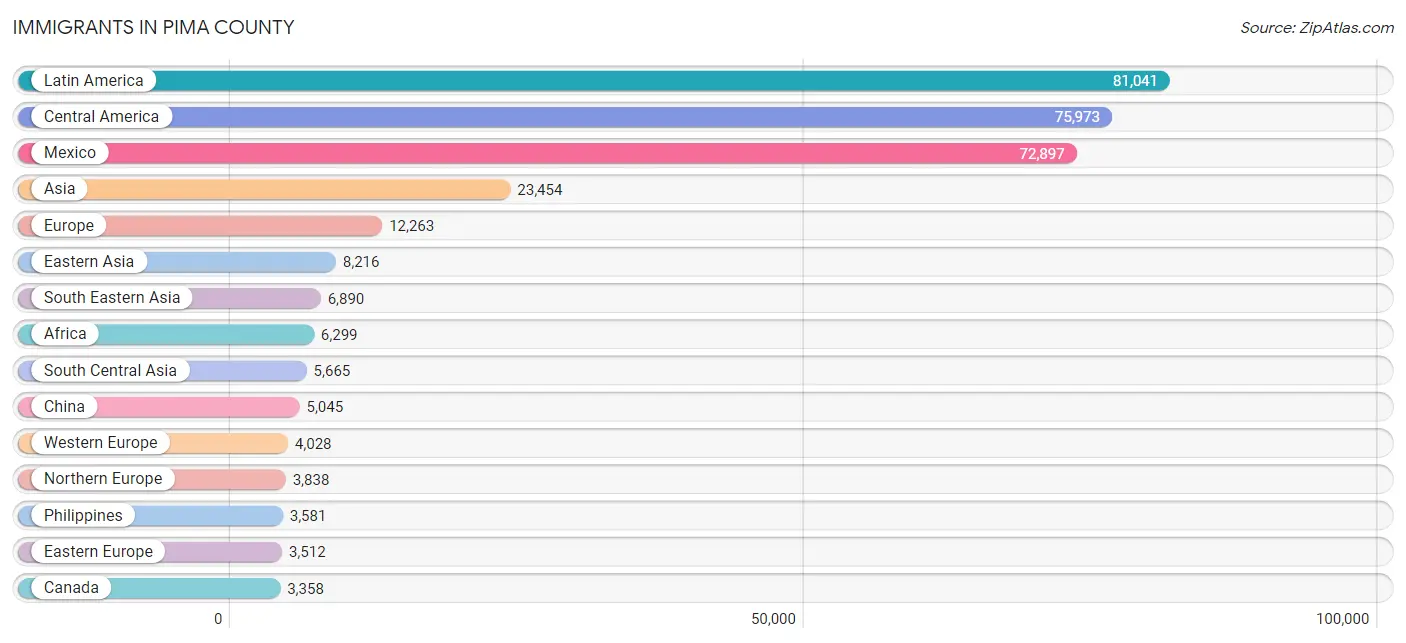
Immigrants in Pima County
The most numerous immigrant groups reported in Pima County came from Latin America (81,041 | 7.8%), Central America (75,973 | 7.3%), Mexico (72,897 | 7.0%), Asia (23,454 | 2.2%), and Europe (12,263 | 1.2%), together accounting for 25.5% of all Pima County residents.
| Immigration Origin | # Population | % Population |
| Afghanistan | 152 | 0.0% |
| Africa | 6,299 | 0.6% |
| Albania | 10 | 0.0% |
| Argentina | 270 | 0.0% |
| Armenia | 26 | 0.0% |
| Asia | 23,454 | 2.2% |
| Australia | 361 | 0.0% |
| Austria | 192 | 0.0% |
| Bahamas | 26 | 0.0% |
| Bangladesh | 289 | 0.0% |
| Barbados | 8 | 0.0% |
| Belarus | 65 | 0.0% |
| Belgium | 129 | 0.0% |
| Bolivia | 88 | 0.0% |
| Bosnia and Herzegovina | 136 | 0.0% |
| Brazil | 570 | 0.1% |
| Bulgaria | 69 | 0.0% |
| Cabo Verde | 9 | 0.0% |
| Cambodia | 72 | 0.0% |
| Cameroon | 240 | 0.0% |
| Canada | 3,358 | 0.3% |
| Caribbean | 1,821 | 0.2% |
| Central America | 75,973 | 7.3% |
| Chile | 197 | 0.0% |
| China | 5,045 | 0.5% |
| Colombia | 951 | 0.1% |
| Congo | 484 | 0.1% |
| Costa Rica | 199 | 0.0% |
| Croatia | 127 | 0.0% |
| Cuba | 626 | 0.1% |
| Czechoslovakia | 301 | 0.0% |
| Denmark | 45 | 0.0% |
| Dominican Republic | 353 | 0.0% |
| Eastern Africa | 2,928 | 0.3% |
| Eastern Asia | 8,216 | 0.8% |
| Eastern Europe | 3,512 | 0.3% |
| Ecuador | 125 | 0.0% |
| Egypt | 475 | 0.1% |
| El Salvador | 1,081 | 0.1% |
| England | 1,843 | 0.2% |
| Eritrea | 135 | 0.0% |
| Ethiopia | 195 | 0.0% |
| Europe | 12,263 | 1.2% |
| Fiji | 92 | 0.0% |
| France | 517 | 0.1% |
| Germany | 2,330 | 0.2% |
| Ghana | 77 | 0.0% |
| Greece | 190 | 0.0% |
| Grenada | 27 | 0.0% |
| Guatemala | 705 | 0.1% |
| Guyana | 129 | 0.0% |
| Haiti | 240 | 0.0% |
| Honduras | 595 | 0.1% |
| Hong Kong | 313 | 0.0% |
| Hungary | 309 | 0.0% |
| India | 2,797 | 0.3% |
| Indonesia | 115 | 0.0% |
| Iran | 887 | 0.1% |
| Iraq | 448 | 0.0% |
| Ireland | 205 | 0.0% |
| Israel | 238 | 0.0% |
| Italy | 299 | 0.0% |
| Jamaica | 283 | 0.0% |
| Japan | 1,162 | 0.1% |
| Jordan | 162 | 0.0% |
| Kazakhstan | 61 | 0.0% |
| Kenya | 1,094 | 0.1% |
| Korea | 2,009 | 0.2% |
| Kuwait | 298 | 0.0% |
| Laos | 110 | 0.0% |
| Latin America | 81,041 | 7.8% |
| Latvia | 9 | 0.0% |
| Lebanon | 358 | 0.0% |
| Liberia | 79 | 0.0% |
| Lithuania | 168 | 0.0% |
| Malaysia | 119 | 0.0% |
| Mexico | 72,897 | 7.0% |
| Micronesia | 51 | 0.0% |
| Middle Africa | 1,051 | 0.1% |
| Moldova | 43 | 0.0% |
| Morocco | 186 | 0.0% |
| Nepal | 571 | 0.1% |
| Netherlands | 458 | 0.0% |
| Nicaragua | 318 | 0.0% |
| Nigeria | 271 | 0.0% |
| North Macedonia | 76 | 0.0% |
| Northern Africa | 877 | 0.1% |
| Northern Europe | 3,838 | 0.4% |
| Norway | 13 | 0.0% |
| Oceania | 951 | 0.1% |
| Pakistan | 513 | 0.1% |
| Panama | 178 | 0.0% |
| Peru | 726 | 0.1% |
| Philippines | 3,581 | 0.3% |
| Poland | 630 | 0.1% |
| Portugal | 69 | 0.0% |
| Romania | 210 | 0.0% |
| Russia | 647 | 0.1% |
| Saudi Arabia | 144 | 0.0% |
| Scotland | 169 | 0.0% |
| Senegal | 28 | 0.0% |
| Serbia | 146 | 0.0% |
| Sierra Leone | 57 | 0.0% |
| Singapore | 158 | 0.0% |
| Somalia | 585 | 0.1% |
| South Africa | 284 | 0.0% |
| South America | 3,247 | 0.3% |
| South Central Asia | 5,665 | 0.5% |
| South Eastern Asia | 6,890 | 0.7% |
| Southern Europe | 872 | 0.1% |
| Spain | 296 | 0.0% |
| Sri Lanka | 46 | 0.0% |
| Sudan | 152 | 0.0% |
| Sweden | 80 | 0.0% |
| Switzerland | 383 | 0.0% |
| Syria | 497 | 0.1% |
| Taiwan | 886 | 0.1% |
| Thailand | 756 | 0.1% |
| Trinidad and Tobago | 220 | 0.0% |
| Turkey | 298 | 0.0% |
| Uganda | 38 | 0.0% |
| Ukraine | 331 | 0.0% |
| Uruguay | 3 | 0.0% |
| Uzbekistan | 127 | 0.0% |
| Venezuela | 172 | 0.0% |
| Vietnam | 1,899 | 0.2% |
| Western Africa | 831 | 0.1% |
| Western Asia | 2,595 | 0.3% |
| Western Europe | 4,028 | 0.4% |
| Yemen | 49 | 0.0% |
| Zaire | 248 | 0.0% |
| Zimbabwe | 128 | 0.0% | View All 132 Rows |
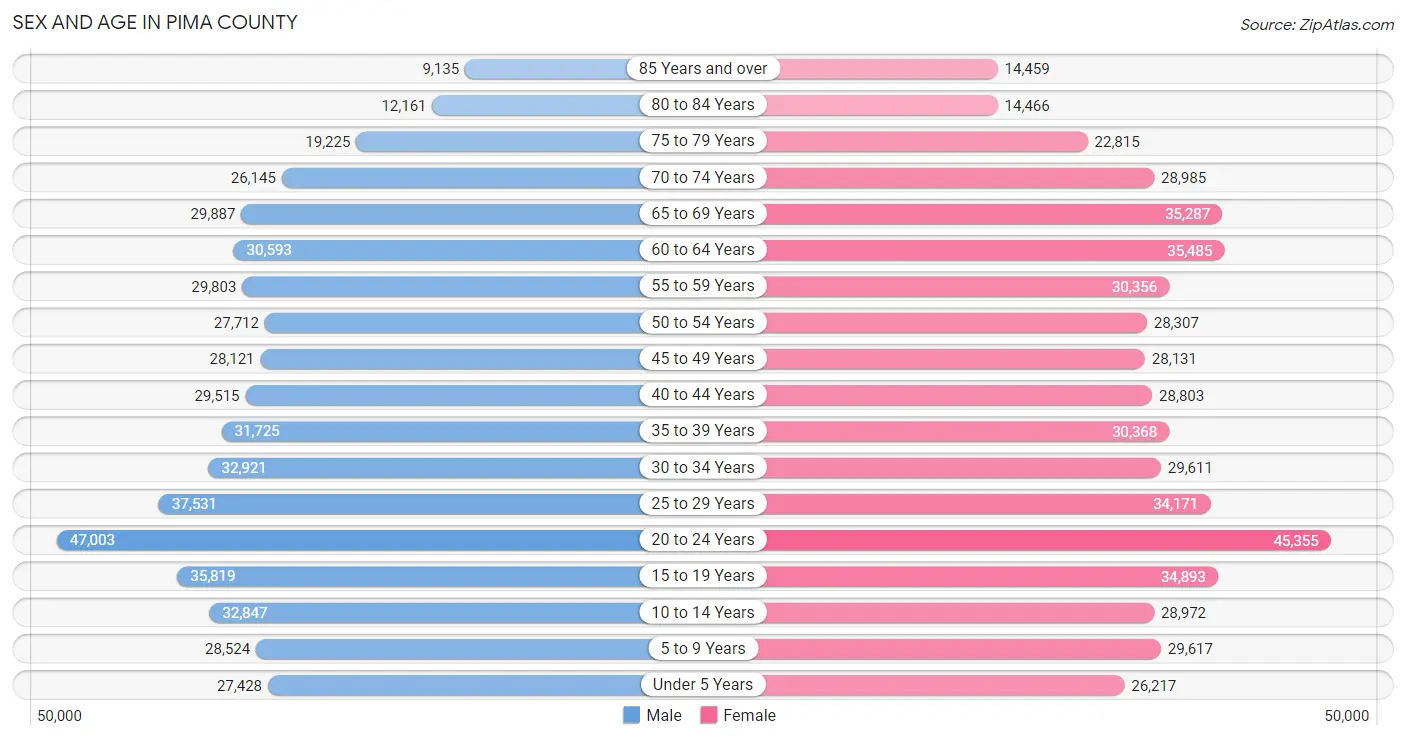
Sex and Age in Pima County
Sex and Age in Pima County
The most populous age groups in Pima County are 20 to 24 Years (47,003 | 9.1%) for men and 20 to 24 Years (45,355 | 8.6%) for women.
| Age Bracket | Male | Female |
| Under 5 Years | 27,428 (5.3%) | 26,217 (5.0%) |
| 5 to 9 Years | 28,524 (5.5%) | 29,617 (5.6%) |
| 10 to 14 Years | 32,847 (6.4%) | 28,972 (5.5%) |
| 15 to 19 Years | 35,819 (6.9%) | 34,893 (6.6%) |
| 20 to 24 Years | 47,003 (9.1%) | 45,355 (8.6%) |
| 25 to 29 Years | 37,531 (7.3%) | 34,171 (6.5%) |
| 30 to 34 Years | 32,921 (6.4%) | 29,611 (5.6%) |
| 35 to 39 Years | 31,725 (6.1%) | 30,368 (5.8%) |
| 40 to 44 Years | 29,515 (5.7%) | 28,803 (5.5%) |
| 45 to 49 Years | 28,121 (5.4%) | 28,131 (5.3%) |
| 50 to 54 Years | 27,712 (5.4%) | 28,307 (5.4%) |
| 55 to 59 Years | 29,803 (5.8%) | 30,356 (5.8%) |
| 60 to 64 Years | 30,593 (5.9%) | 35,485 (6.7%) |
| 65 to 69 Years | 29,887 (5.8%) | 35,287 (6.7%) |
| 70 to 74 Years | 26,145 (5.1%) | 28,985 (5.5%) |
| 75 to 79 Years | 19,225 (3.7%) | 22,815 (4.3%) |
| 80 to 84 Years | 12,161 (2.4%) | 14,466 (2.8%) |
| 85 Years and over | 9,135 (1.8%) | 14,459 (2.8%) |
| Total | 516,095 (100.0%) | 526,298 (100.0%) |
Families and Households in Pima County
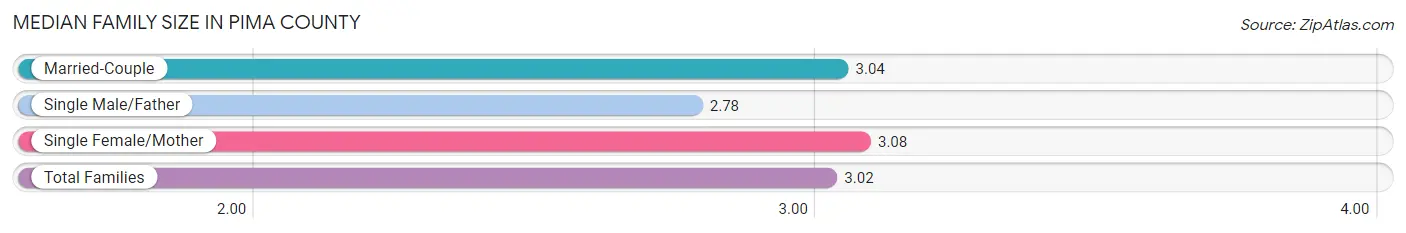
Median Family Size in Pima County
The median family size in Pima County is 3.02 persons per family, with single female/mother families (51,295 | 20.0%) accounting for the largest median family size of 3.08 persons per family. On the other hand, single male/father families (23,633 | 9.2%) represent the smallest median family size with 2.78 persons per family.
| Family Type | # Families | Family Size |
| Married-Couple | 182,022 (70.8%) | 3.04 |
| Single Male/Father | 23,633 (9.2%) | 2.78 |
| Single Female/Mother | 51,295 (20.0%) | 3.08 |
| Total Families | 256,950 (100.0%) | 3.02 |
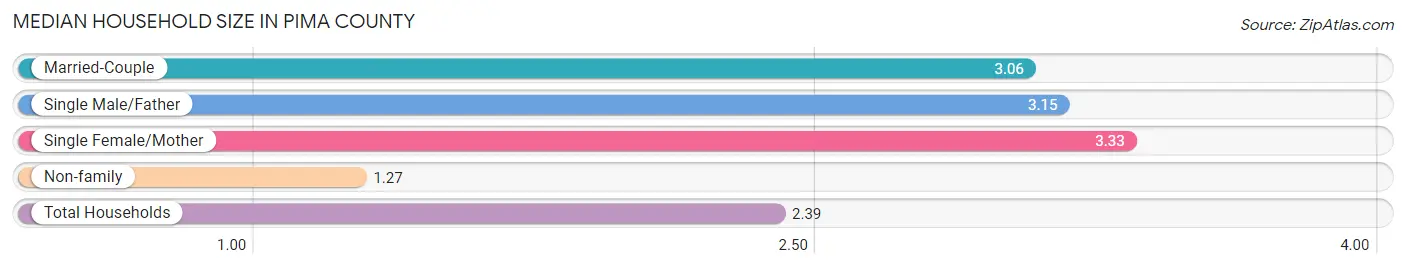
Median Household Size in Pima County
The median household size in Pima County is 2.39 persons per household, with single female/mother households (51,295 | 12.1%) accounting for the largest median household size of 3.33 persons per household. non-family households (166,125 | 39.3%) represent the smallest median household size with 1.27 persons per household.
| Household Type | # Households | Household Size |
| Married-Couple | 182,022 (43.0%) | 3.06 |
| Single Male/Father | 23,633 (5.6%) | 3.15 |
| Single Female/Mother | 51,295 (12.1%) | 3.33 |
| Non-family | 166,125 (39.3%) | 1.27 |
| Total Households | 423,075 (100.0%) | 2.39 |
Household Size by Marriage Status in Pima County
Out of a total of 423,075 households in Pima County, 256,950 (60.7%) are family households, while 166,125 (39.3%) are nonfamily households. The most numerous type of family households are 2-person households, comprising 120,829, and the most common type of nonfamily households are 1-person households, comprising 131,578.
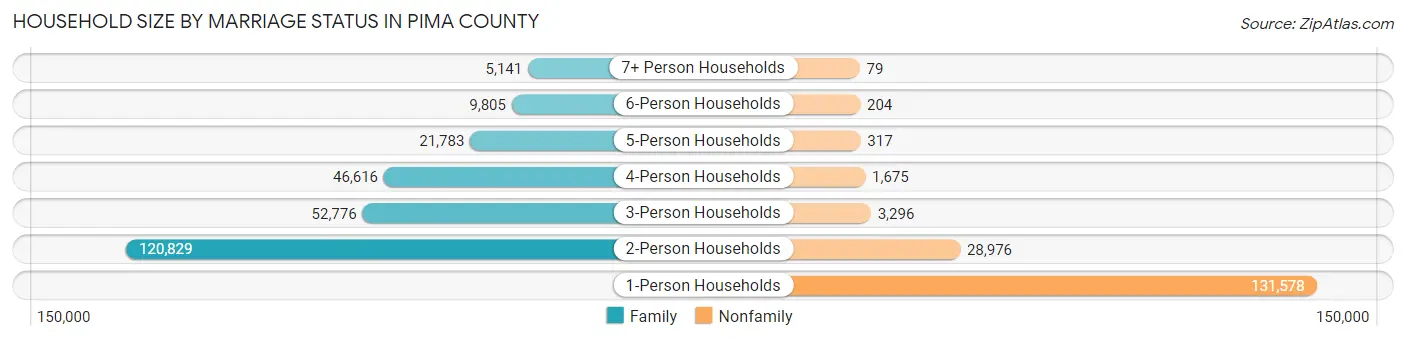
| Household Size | Family Households | Nonfamily Households |
| 1-Person Households | - | 131,578 (31.1%) |
| 2-Person Households | 120,829 (28.6%) | 28,976 (6.9%) |
| 3-Person Households | 52,776 (12.5%) | 3,296 (0.8%) |
| 4-Person Households | 46,616 (11.0%) | 1,675 (0.4%) |
| 5-Person Households | 21,783 (5.1%) | 317 (0.1%) |
| 6-Person Households | 9,805 (2.3%) | 204 (0.1%) |
| 7+ Person Households | 5,141 (1.2%) | 79 (0.0%) |
| Total | 256,950 (60.7%) | 166,125 (39.3%) |
Female Fertility in Pima County
Fertility by Age in Pima County
Average fertility rate in Pima County is 52.0 births per 1,000 women. Women in the age bracket of 20 to 34 years have the highest fertility rate with 84.0 births per 1,000 women. Women in the age bracket of 20 to 34 years acount for 74.1% of all women with births.
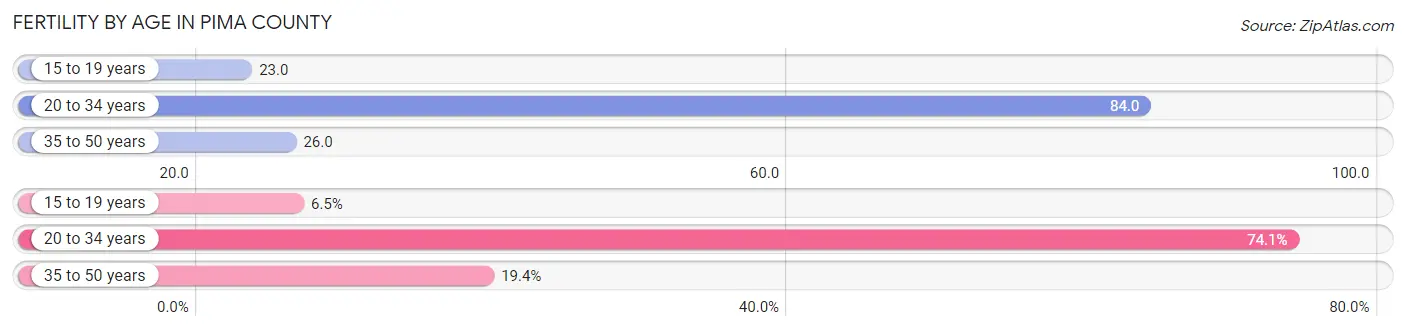
| Age Bracket | Women with Births | Births / 1,000 Women |
| 15 to 19 years | 808 (6.5%) | 23.0 |
| 20 to 34 years | 9,178 (74.1%) | 84.0 |
| 35 to 50 years | 2,407 (19.4%) | 26.0 |
| Total | 12,393 (100.0%) | 52.0 |
Fertility by Age by Marriage Status in Pima County
56.0% of women with births (12,393) in Pima County are married. The highest percentage of unmarried women with births falls into 15 to 19 years age bracket with 94.7% of them unmarried at the time of birth, while the lowest percentage of unmarried women with births belong to 35 to 50 years age bracket with 27.9% of them unmarried.
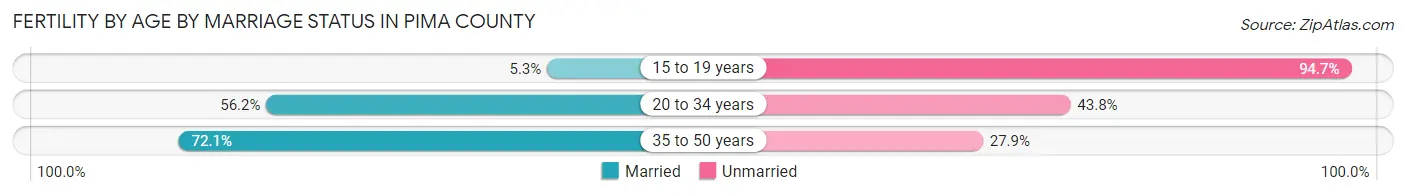
| Age Bracket | Married | Unmarried |
| 15 to 19 years | 43 (5.3%) | 765 (94.7%) |
| 20 to 34 years | 5,158 (56.2%) | 4,020 (43.8%) |
| 35 to 50 years | 1,735 (72.1%) | 672 (27.9%) |
| Total | 6,940 (56.0%) | 5,453 (44.0%) |
Fertility by Education in Pima County
Average fertility rate in Pima County is 52.0 births per 1,000 women. Women with the education attainment of high school diploma have the highest fertility rate of 64.0 births per 1,000 women, while women with the education attainment of college or associate's degree have the lowest fertility at 44.0 births per 1,000 women. Women with the education attainment of college or associate's degree represent 29.6% of all women with births.
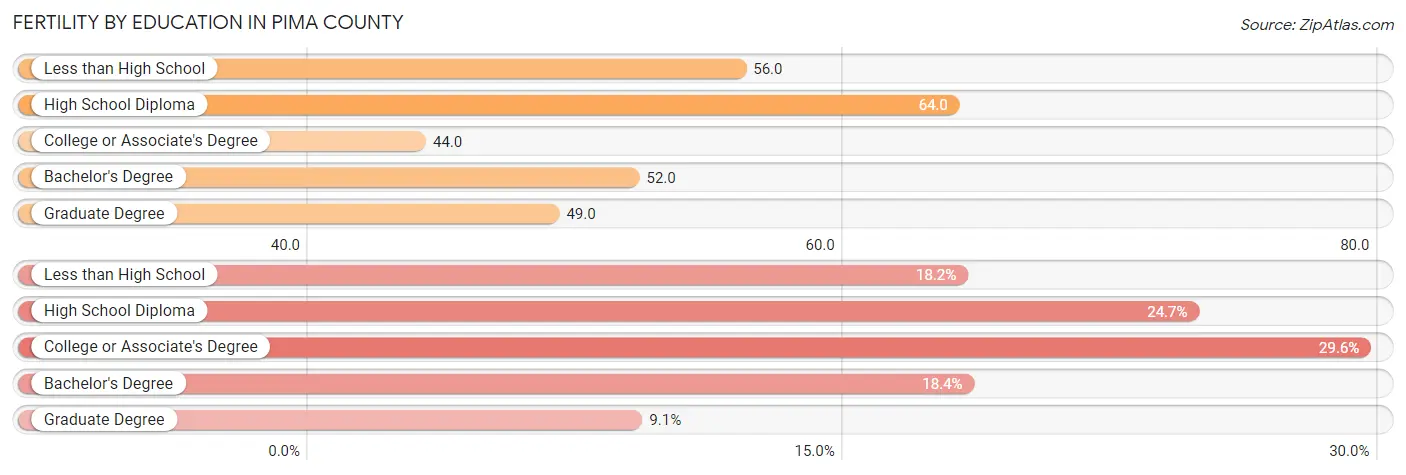
| Educational Attainment | Women with Births | Births / 1,000 Women |
| Less than High School | 2,259 (18.2%) | 56.0 |
| High School Diploma | 3,065 (24.7%) | 64.0 |
| College or Associate's Degree | 3,663 (29.6%) | 44.0 |
| Bachelor's Degree | 2,281 (18.4%) | 52.0 |
| Graduate Degree | 1,125 (9.1%) | 49.0 |
| Total | 12,393 (100.0%) | 52.0 |
Fertility by Education by Marriage Status in Pima County
44.0% of women with births in Pima County are unmarried. Women with the educational attainment of bachelor's degree are most likely to be married with 84.9% of them married at childbirth, while women with the educational attainment of less than high school are least likely to be married with 71.3% of them unmarried at childbirth.
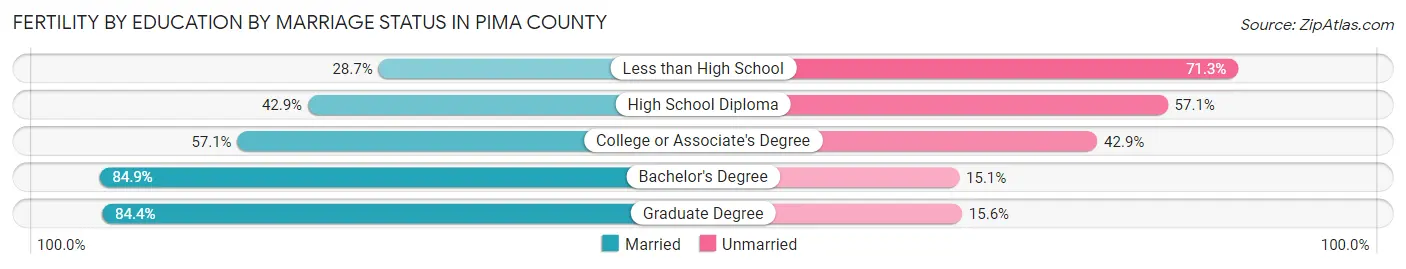
| Educational Attainment | Married | Unmarried |
| Less than High School | 648 (28.7%) | 1,611 (71.3%) |
| High School Diploma | 1,315 (42.9%) | 1,750 (57.1%) |
| College or Associate's Degree | 2,092 (57.1%) | 1,571 (42.9%) |
| Bachelor's Degree | 1,937 (84.9%) | 344 (15.1%) |
| Graduate Degree | 949 (84.4%) | 176 (15.6%) |
| Total | 6,940 (56.0%) | 5,453 (44.0%) |
Employment Characteristics in Pima County
Employment by Class of Employer in Pima County
Among the 461,211 employed individuals in Pima County, private company employees (291,308 | 63.2%), not-for-profit organizations (36,825 | 8.0%), and local government employees (33,410 | 7.2%) make up the most common classes of employment.
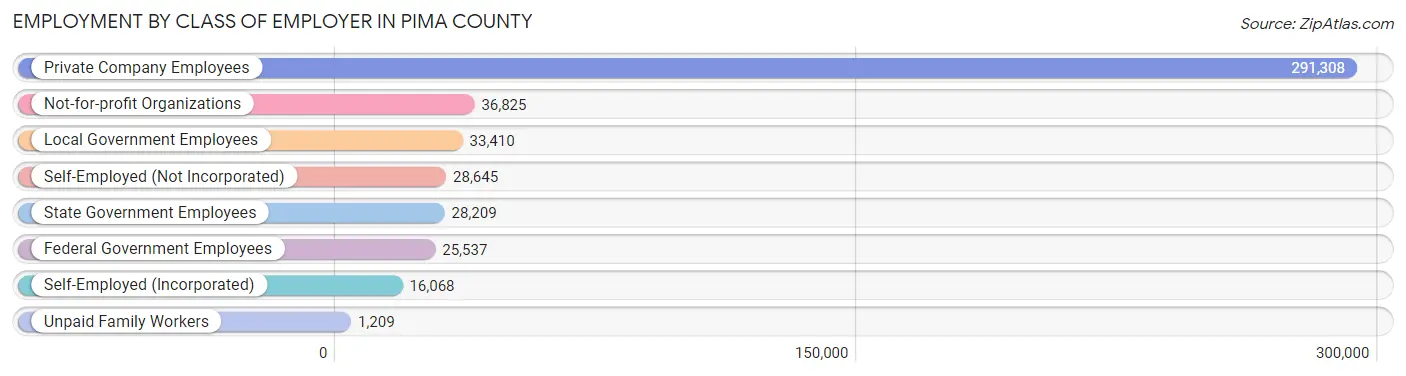
| Employer Class | # Employees | % Employees |
| Private Company Employees | 291,308 | 63.2% |
| Self-Employed (Incorporated) | 16,068 | 3.5% |
| Self-Employed (Not Incorporated) | 28,645 | 6.2% |
| Not-for-profit Organizations | 36,825 | 8.0% |
| Local Government Employees | 33,410 | 7.2% |
| State Government Employees | 28,209 | 6.1% |
| Federal Government Employees | 25,537 | 5.5% |
| Unpaid Family Workers | 1,209 | 0.3% |
| Total | 461,211 | 100.0% |
Employment Status by Age in Pima County
According to the labor force statistics for Pima County, out of the total population over 16 years of age (855,402), 58.4% or 499,555 individuals are in the labor force, with 5.9% or 29,474 of them unemployed. The age group with the highest labor force participation rate is 25 to 29 years, with 83.2% or 59,656 individuals in the labor force. Within the labor force, the 16 to 19 years age range has the highest percentage of unemployed individuals, with 18.6% or 4,244 of them being unemployed.
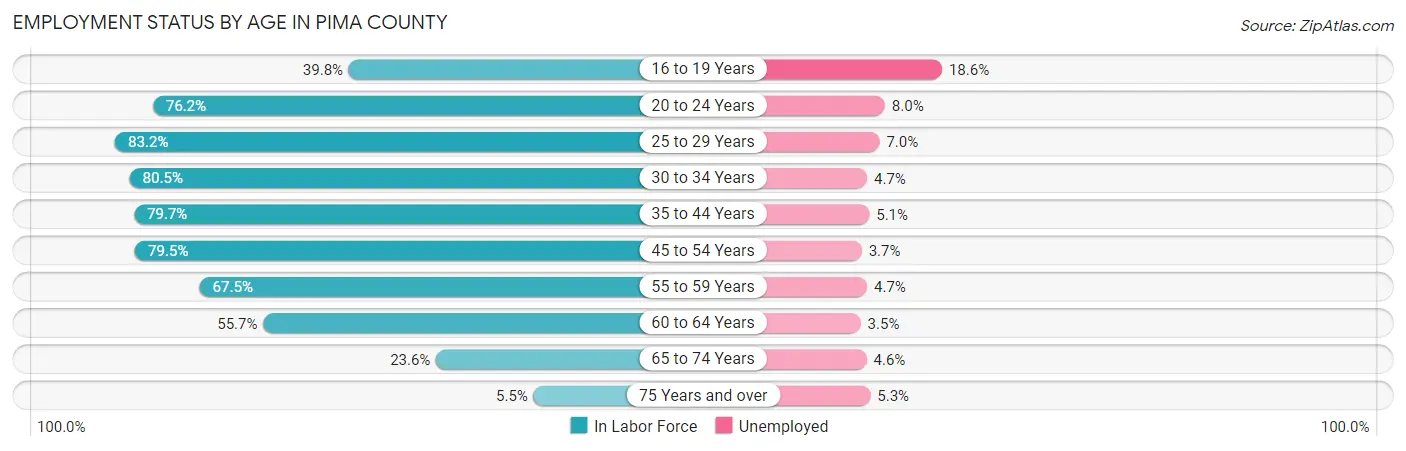
| Age Bracket | In Labor Force | Unemployed |
| 16 to 19 Years | 22,816 (39.8%) | 4,244 (18.6%) |
| 20 to 24 Years | 70,377 (76.2%) | 5,630 (8.0%) |
| 25 to 29 Years | 59,656 (83.2%) | 4,176 (7.0%) |
| 30 to 34 Years | 50,338 (80.5%) | 2,366 (4.7%) |
| 35 to 44 Years | 95,968 (79.7%) | 4,894 (5.1%) |
| 45 to 54 Years | 89,255 (79.5%) | 3,302 (3.7%) |
| 55 to 59 Years | 40,607 (67.5%) | 1,909 (4.7%) |
| 60 to 64 Years | 36,805 (55.7%) | 1,288 (3.5%) |
| 65 to 74 Years | 28,392 (23.6%) | 1,306 (4.6%) |
| 75 Years and over | 5,074 (5.5%) | 269 (5.3%) |
| Total | 499,555 (58.4%) | 29,474 (5.9%) |
Employment Status by Educational Attainment in Pima County
According to labor force statistics for Pima County, 75.6% of individuals (372,824) out of the total population between 25 and 64 years of age (493,153) are in the labor force, with 4.8% or 17,896 of them being unemployed. The group with the highest labor force participation rate are those with the educational attainment of bachelor's degree or higher, with 83.7% or 137,845 individuals in the labor force. Within the labor force, individuals with less than high school education have the highest percentage of unemployment, with 8.0% or 2,519 of them being unemployed.
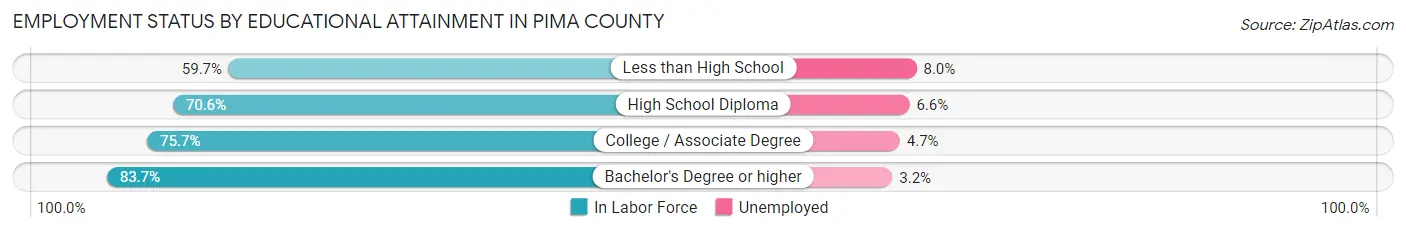
| Educational Attainment | In Labor Force | Unemployed |
| Less than High School | 31,482 (59.7%) | 4,219 (8.0%) |
| High School Diploma | 75,991 (70.6%) | 7,104 (6.6%) |
| College / Associate Degree | 127,248 (75.7%) | 7,900 (4.7%) |
| Bachelor's Degree or higher | 137,845 (83.7%) | 5,270 (3.2%) |
| Total | 372,824 (75.6%) | 23,671 (4.8%) |
Employment Occupations by Sex in Pima County
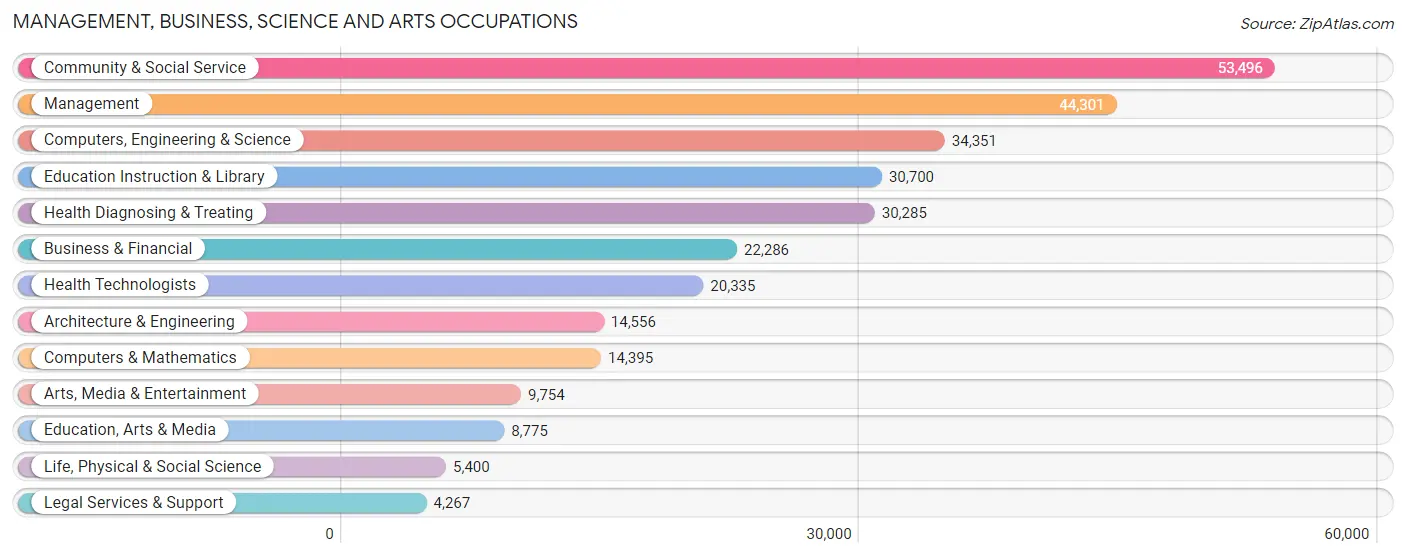
Management, Business, Science and Arts Occupations
The most common Management, Business, Science and Arts occupations in Pima County are Community & Social Service (53,496 | 11.6%), Management (44,301 | 9.6%), Computers, Engineering & Science (34,351 | 7.4%), Education Instruction & Library (30,700 | 6.6%), and Health Diagnosing & Treating (30,285 | 6.5%).
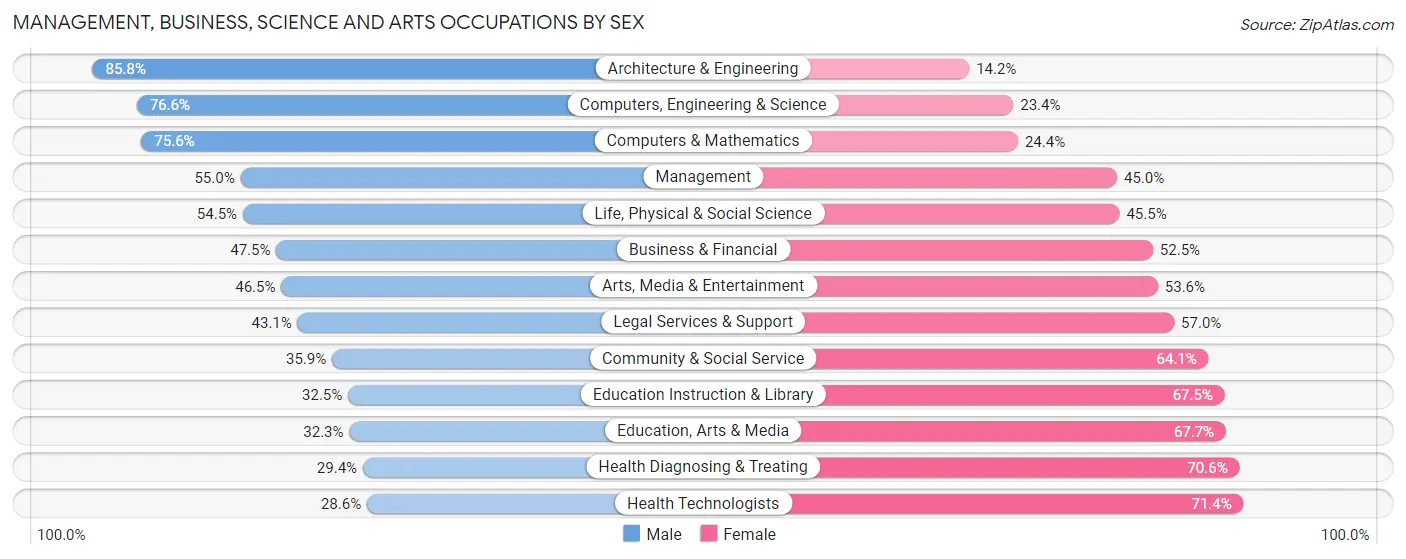
Management, Business, Science and Arts Occupations by Sex
Within the Management, Business, Science and Arts occupations in Pima County, the most male-oriented occupations are Architecture & Engineering (85.8%), Computers, Engineering & Science (76.6%), and Computers & Mathematics (75.6%), while the most female-oriented occupations are Health Technologists (71.4%), Health Diagnosing & Treating (70.6%), and Education, Arts & Media (67.7%).
| Occupation | Male | Female |
| Management | 24,351 (55.0%) | 19,950 (45.0%) |
| Business & Financial | 10,584 (47.5%) | 11,702 (52.5%) |
| Computers, Engineering & Science | 26,318 (76.6%) | 8,033 (23.4%) |
| Computers & Mathematics | 10,887 (75.6%) | 3,508 (24.4%) |
| Architecture & Engineering | 12,490 (85.8%) | 2,066 (14.2%) |
| Life, Physical & Social Science | 2,941 (54.5%) | 2,459 (45.5%) |
| Community & Social Service | 19,183 (35.9%) | 34,313 (64.1%) |
| Education, Arts & Media | 2,831 (32.3%) | 5,944 (67.7%) |
| Legal Services & Support | 1,837 (43.0%) | 2,430 (57.0%) |
| Education Instruction & Library | 9,984 (32.5%) | 20,716 (67.5%) |
| Arts, Media & Entertainment | 4,531 (46.5%) | 5,223 (53.5%) |
| Health Diagnosing & Treating | 8,913 (29.4%) | 21,372 (70.6%) |
| Health Technologists | 5,811 (28.6%) | 14,524 (71.4%) |
| Total (Category) | 89,349 (48.4%) | 95,370 (51.6%) |
| Total (Overall) | 244,997 (52.9%) | 217,960 (47.1%) |
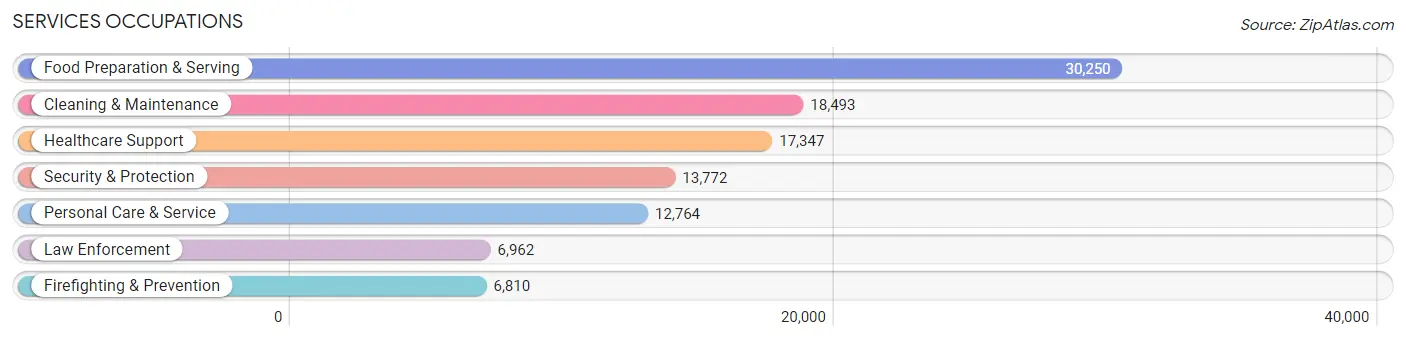
Services Occupations
The most common Services occupations in Pima County are Food Preparation & Serving (30,250 | 6.5%), Cleaning & Maintenance (18,493 | 4.0%), Healthcare Support (17,347 | 3.7%), Security & Protection (13,772 | 3.0%), and Personal Care & Service (12,764 | 2.8%).
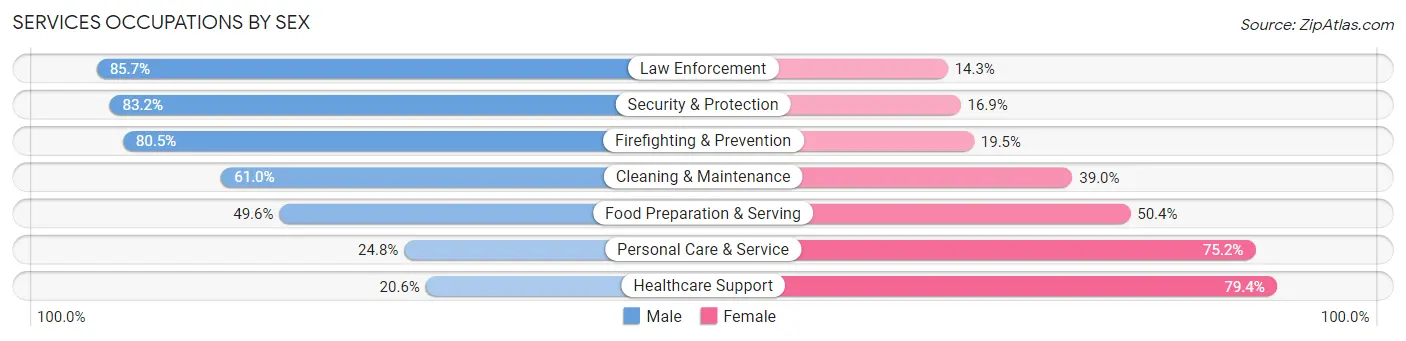
Services Occupations by Sex
Within the Services occupations in Pima County, the most male-oriented occupations are Law Enforcement (85.7%), Security & Protection (83.2%), and Firefighting & Prevention (80.5%), while the most female-oriented occupations are Healthcare Support (79.4%), Personal Care & Service (75.2%), and Food Preparation & Serving (50.4%).
| Occupation | Male | Female |
| Healthcare Support | 3,570 (20.6%) | 13,777 (79.4%) |
| Security & Protection | 11,451 (83.2%) | 2,321 (16.9%) |
| Firefighting & Prevention | 5,484 (80.5%) | 1,326 (19.5%) |
| Law Enforcement | 5,967 (85.7%) | 995 (14.3%) |
| Food Preparation & Serving | 14,991 (49.6%) | 15,259 (50.4%) |
| Cleaning & Maintenance | 11,286 (61.0%) | 7,207 (39.0%) |
| Personal Care & Service | 3,170 (24.8%) | 9,594 (75.2%) |
| Total (Category) | 44,468 (48.0%) | 48,158 (52.0%) |
| Total (Overall) | 244,997 (52.9%) | 217,960 (47.1%) |
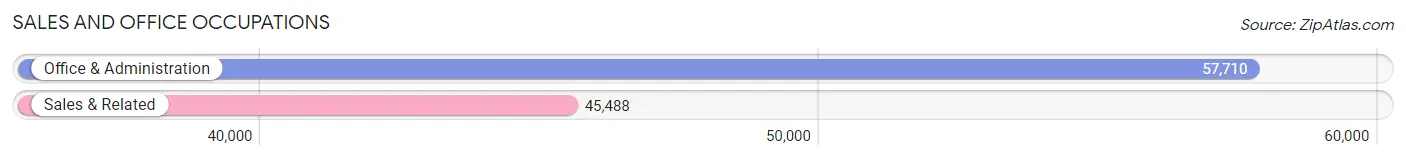
Sales and Office Occupations
The most common Sales and Office occupations in Pima County are Office & Administration (57,710 | 12.5%), and Sales & Related (45,488 | 9.8%).
Sales and Office Occupations by Sex
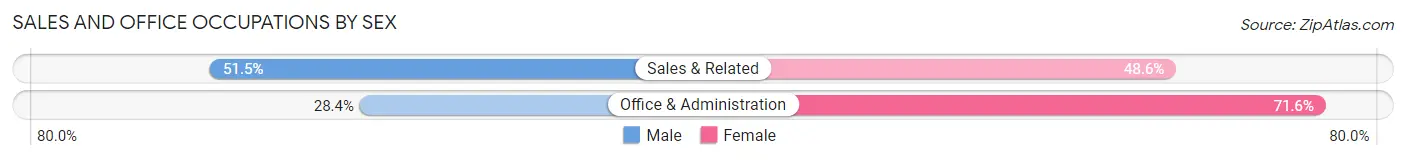
| Occupation | Male | Female |
| Sales & Related | 23,403 (51.4%) | 22,085 (48.5%) |
| Office & Administration | 16,409 (28.4%) | 41,301 (71.6%) |
| Total (Category) | 39,812 (38.6%) | 63,386 (61.4%) |
| Total (Overall) | 244,997 (52.9%) | 217,960 (47.1%) |
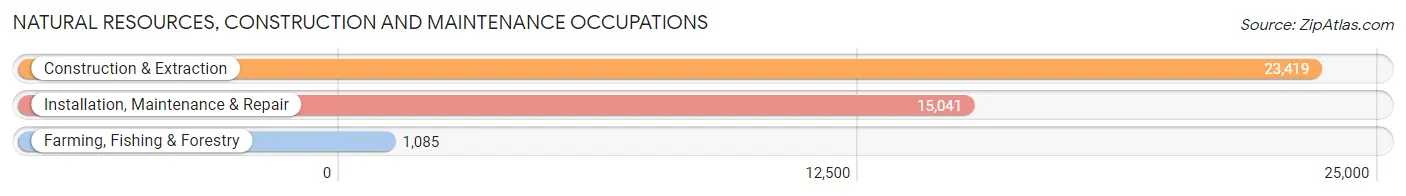
Natural Resources, Construction and Maintenance Occupations
The most common Natural Resources, Construction and Maintenance occupations in Pima County are Construction & Extraction (23,419 | 5.1%), Installation, Maintenance & Repair (15,041 | 3.3%), and Farming, Fishing & Forestry (1,085 | 0.2%).
Natural Resources, Construction and Maintenance Occupations by Sex
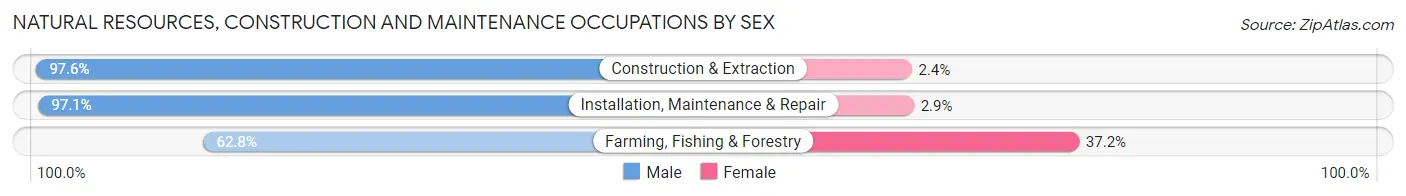
| Occupation | Male | Female |
| Farming, Fishing & Forestry | 681 (62.8%) | 404 (37.2%) |
| Construction & Extraction | 22,853 (97.6%) | 566 (2.4%) |
| Installation, Maintenance & Repair | 14,609 (97.1%) | 432 (2.9%) |
| Total (Category) | 38,143 (96.5%) | 1,402 (3.5%) |
| Total (Overall) | 244,997 (52.9%) | 217,960 (47.1%) |
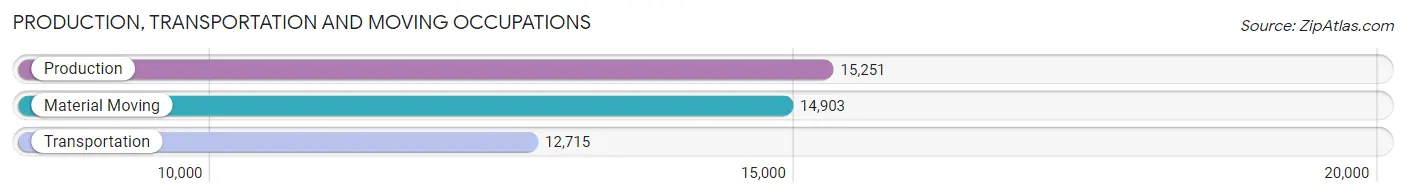
Production, Transportation and Moving Occupations
The most common Production, Transportation and Moving occupations in Pima County are Production (15,251 | 3.3%), Material Moving (14,903 | 3.2%), and Transportation (12,715 | 2.8%).
Production, Transportation and Moving Occupations by Sex
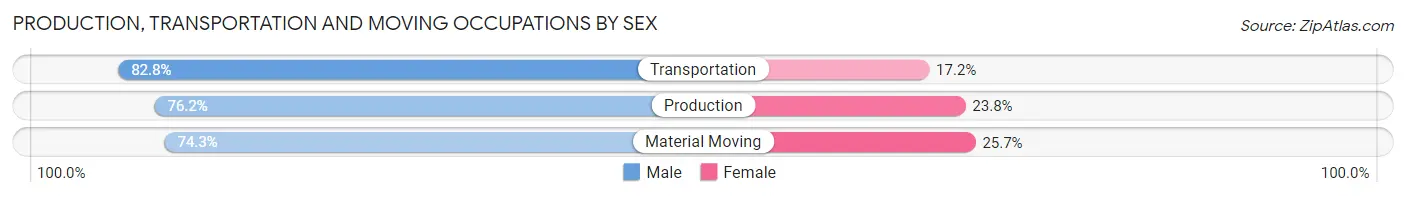
| Occupation | Male | Female |
| Production | 11,617 (76.2%) | 3,634 (23.8%) |
| Transportation | 10,530 (82.8%) | 2,185 (17.2%) |
| Material Moving | 11,078 (74.3%) | 3,825 (25.7%) |
| Total (Category) | 33,225 (77.5%) | 9,644 (22.5%) |
| Total (Overall) | 244,997 (52.9%) | 217,960 (47.1%) |
Employment Industries by Sex in Pima County
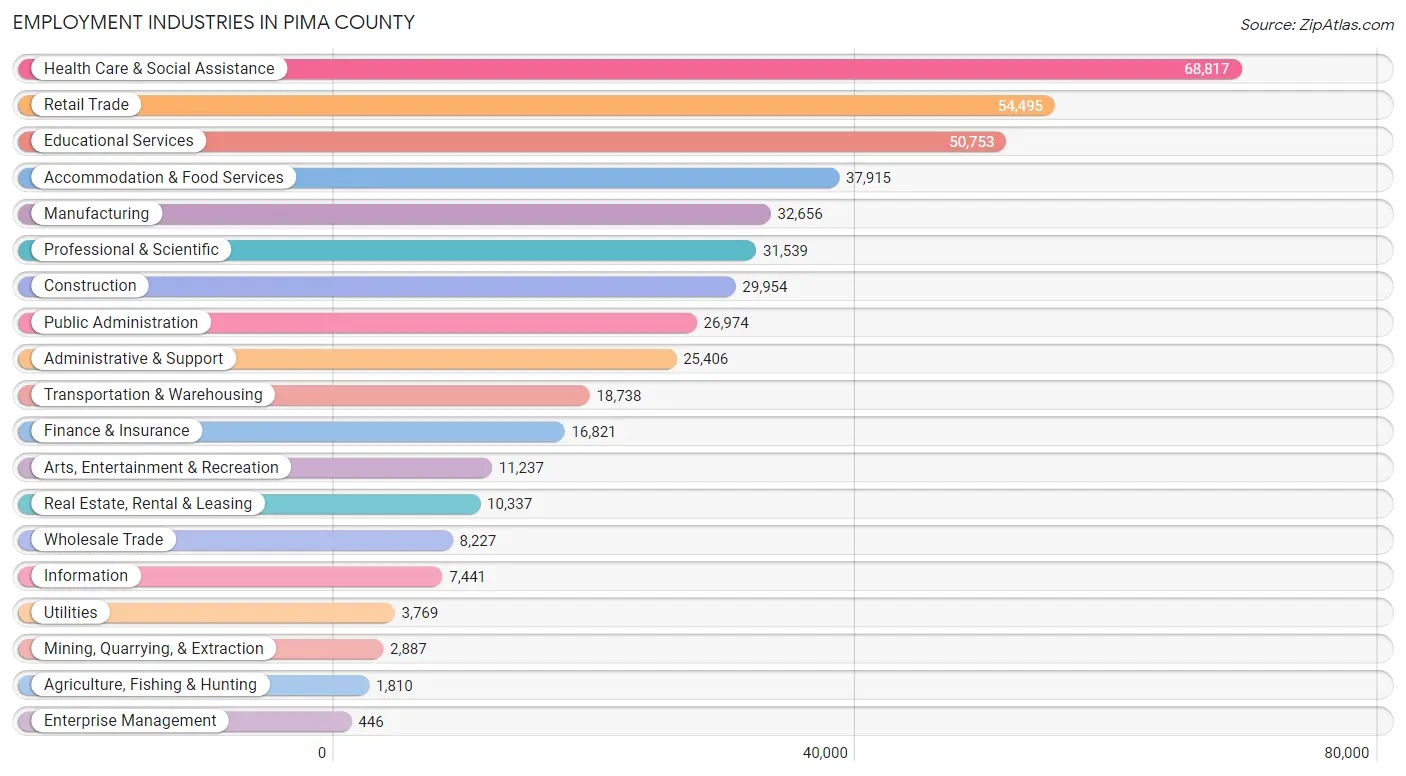
Employment Industries in Pima County
The major employment industries in Pima County include Health Care & Social Assistance (68,817 | 14.9%), Retail Trade (54,495 | 11.8%), Educational Services (50,753 | 11.0%), Accommodation & Food Services (37,915 | 8.2%), and Manufacturing (32,656 | 7.0%).
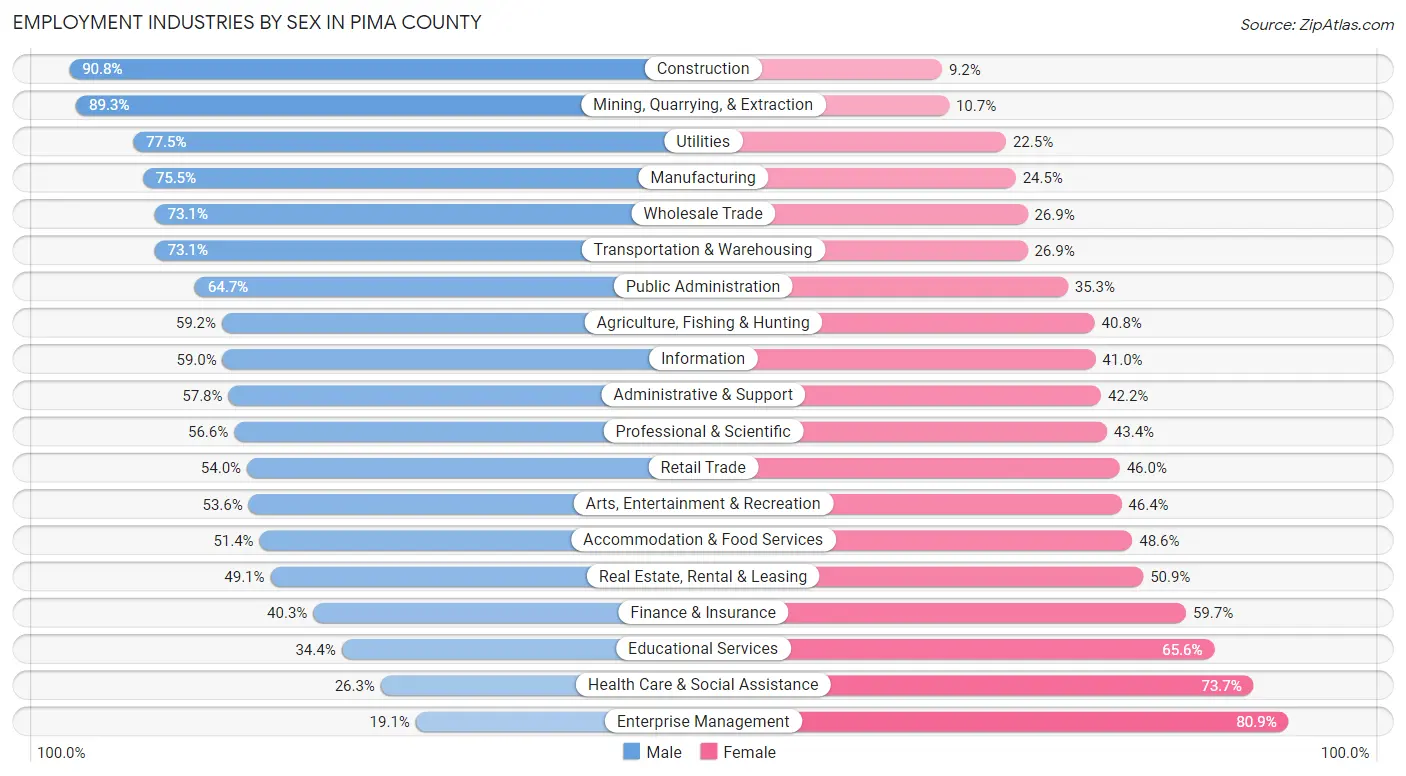
Employment Industries by Sex in Pima County
The Pima County industries that see more men than women are Construction (90.8%), Mining, Quarrying, & Extraction (89.3%), and Utilities (77.5%), whereas the industries that tend to have a higher number of women are Enterprise Management (80.9%), Health Care & Social Assistance (73.7%), and Educational Services (65.6%).
| Industry | Male | Female |
| Agriculture, Fishing & Hunting | 1,071 (59.2%) | 739 (40.8%) |
| Mining, Quarrying, & Extraction | 2,579 (89.3%) | 308 (10.7%) |
| Construction | 27,185 (90.8%) | 2,769 (9.2%) |
| Manufacturing | 24,661 (75.5%) | 7,995 (24.5%) |
| Wholesale Trade | 6,012 (73.1%) | 2,215 (26.9%) |
| Retail Trade | 29,423 (54.0%) | 25,072 (46.0%) |
| Transportation & Warehousing | 13,693 (73.1%) | 5,045 (26.9%) |
| Utilities | 2,922 (77.5%) | 847 (22.5%) |
| Information | 4,392 (59.0%) | 3,049 (41.0%) |
| Finance & Insurance | 6,774 (40.3%) | 10,047 (59.7%) |
| Real Estate, Rental & Leasing | 5,079 (49.1%) | 5,258 (50.9%) |
| Professional & Scientific | 17,863 (56.6%) | 13,676 (43.4%) |
| Enterprise Management | 85 (19.1%) | 361 (80.9%) |
| Administrative & Support | 14,693 (57.8%) | 10,713 (42.2%) |
| Educational Services | 17,465 (34.4%) | 33,288 (65.6%) |
| Health Care & Social Assistance | 18,093 (26.3%) | 50,724 (73.7%) |
| Arts, Entertainment & Recreation | 6,027 (53.6%) | 5,210 (46.4%) |
| Accommodation & Food Services | 19,485 (51.4%) | 18,430 (48.6%) |
| Public Administration | 17,464 (64.7%) | 9,510 (35.3%) |
| Total | 244,997 (52.9%) | 217,960 (47.1%) |
Education in Pima County
School Enrollment in Pima County
The most common levels of schooling among the 253,850 students in Pima County are college / undergraduate (68,475 | 27.0%), high school (52,099 | 20.5%), and middle school (49,090 | 19.3%).
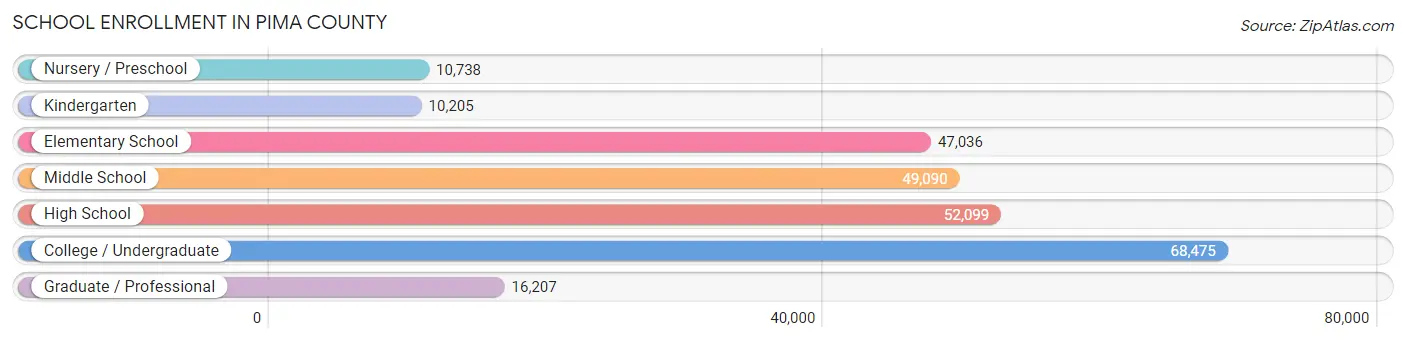
| School Level | # Students | % Students |
| Nursery / Preschool | 10,738 | 4.2% |
| Kindergarten | 10,205 | 4.0% |
| Elementary School | 47,036 | 18.5% |
| Middle School | 49,090 | 19.3% |
| High School | 52,099 | 20.5% |
| College / Undergraduate | 68,475 | 27.0% |
| Graduate / Professional | 16,207 | 6.4% |
| Total | 253,850 | 100.0% |
School Enrollment by Age by Funding Source in Pima County
Out of a total of 253,850 students who are enrolled in schools in Pima County, 29,700 (11.7%) attend a private institution, while the remaining 224,150 (88.3%) are enrolled in public schools. The age group of 3 to 4 year olds has the highest likelihood of being enrolled in private schools, with 2,652 (31.5% in the age bracket) enrolled. Conversely, the age group of 18 to 19 year olds has the lowest likelihood of being enrolled in a private school, with 24,231 (95.4% in the age bracket) attending a public institution.
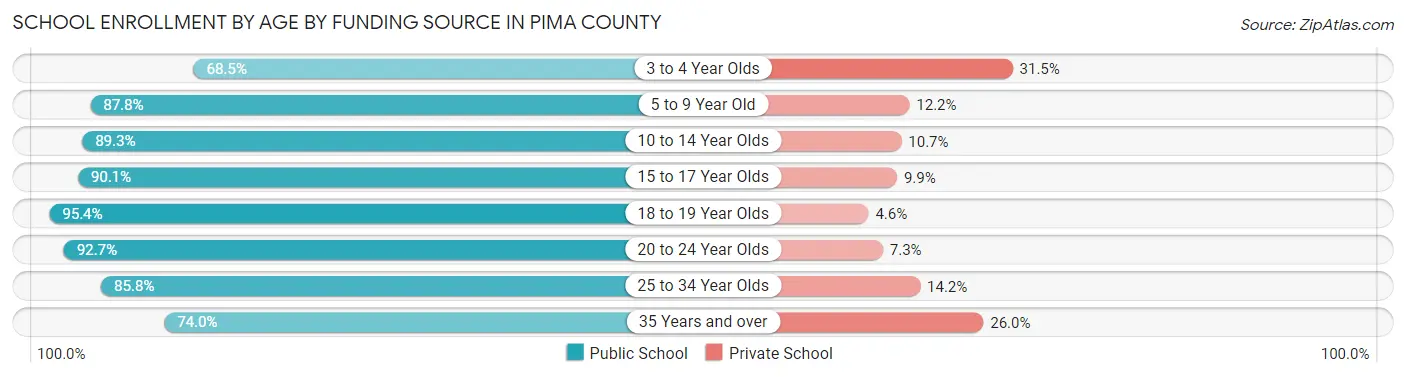
| Age Bracket | Public School | Private School |
| 3 to 4 Year Olds | 5,776 (68.5%) | 2,652 (31.5%) |
| 5 to 9 Year Old | 47,072 (87.8%) | 6,566 (12.2%) |
| 10 to 14 Year Olds | 53,949 (89.3%) | 6,490 (10.7%) |
| 15 to 17 Year Olds | 32,147 (90.1%) | 3,544 (9.9%) |
| 18 to 19 Year Olds | 24,231 (95.4%) | 1,174 (4.6%) |
| 20 to 24 Year Olds | 34,321 (92.7%) | 2,701 (7.3%) |
| 25 to 34 Year Olds | 15,719 (85.8%) | 2,610 (14.2%) |
| 35 Years and over | 11,023 (74.0%) | 3,875 (26.0%) |
| Total | 224,150 (88.3%) | 29,700 (11.7%) |
Educational Attainment by Field of Study in Pima County
Business (42,650 | 15.9%), education (33,079 | 12.3%), science & technology (27,997 | 10.4%), engineering (23,382 | 8.7%), and social sciences (21,870 | 8.2%) are the most common fields of study among 268,441 individuals in Pima County who have obtained a bachelor's degree or higher.
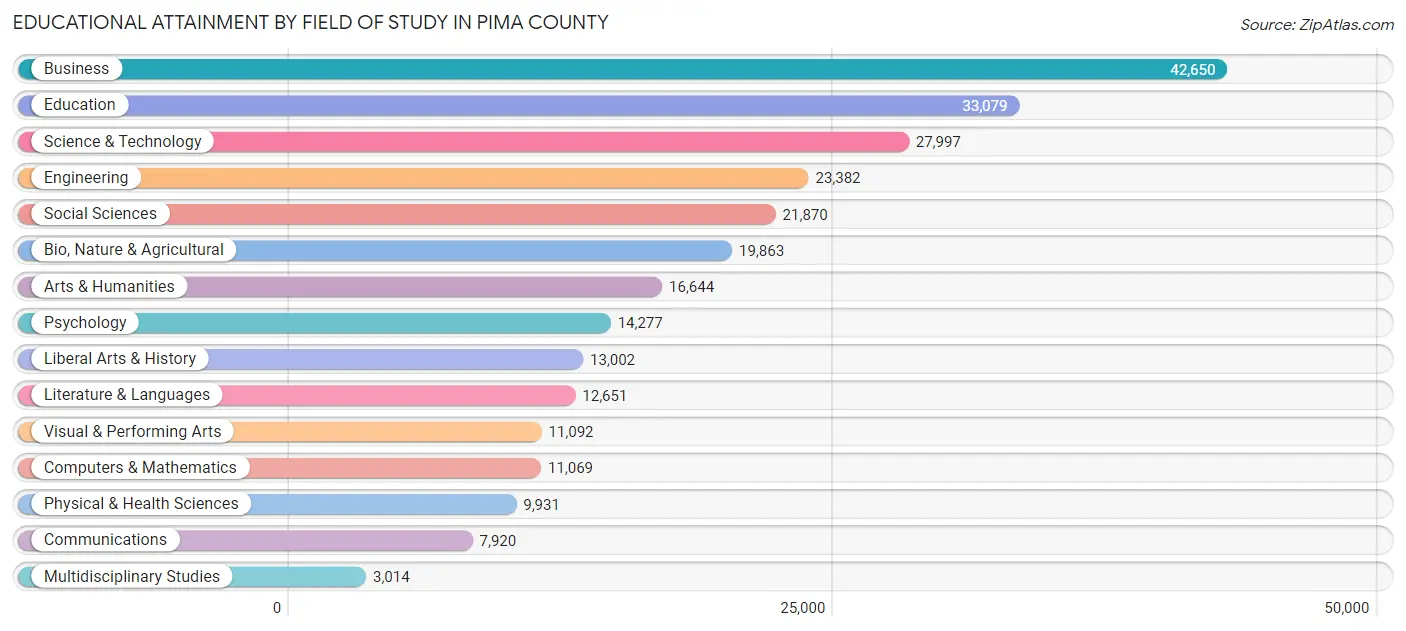
| Field of Study | # Graduates | % Graduates |
| Computers & Mathematics | 11,069 | 4.1% |
| Bio, Nature & Agricultural | 19,863 | 7.4% |
| Physical & Health Sciences | 9,931 | 3.7% |
| Psychology | 14,277 | 5.3% |
| Social Sciences | 21,870 | 8.2% |
| Engineering | 23,382 | 8.7% |
| Multidisciplinary Studies | 3,014 | 1.1% |
| Science & Technology | 27,997 | 10.4% |
| Business | 42,650 | 15.9% |
| Education | 33,079 | 12.3% |
| Literature & Languages | 12,651 | 4.7% |
| Liberal Arts & History | 13,002 | 4.8% |
| Visual & Performing Arts | 11,092 | 4.1% |
| Communications | 7,920 | 2.9% |
| Arts & Humanities | 16,644 | 6.2% |
| Total | 268,441 | 100.0% |
Transportation & Commute in Pima County
Vehicle Availability by Sex in Pima County
The most prevalent vehicle ownership categories in Pima County are males with 2 vehicles (101,266, accounting for 41.4%) and females with 2 vehicles (86,626, making up 47.8%).
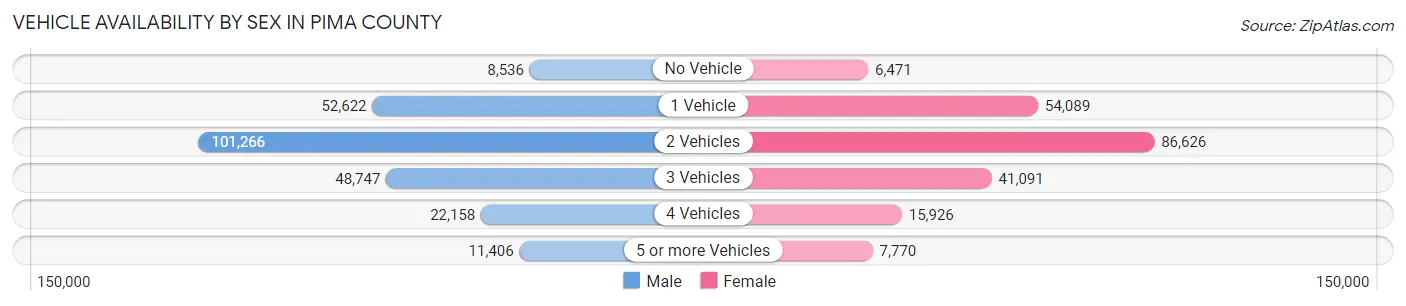
| Vehicles Available | Male | Female |
| No Vehicle | 8,536 (3.5%) | 6,471 (3.0%) |
| 1 Vehicle | 52,622 (21.5%) | 54,089 (25.5%) |
| 2 Vehicles | 101,266 (41.4%) | 86,626 (40.9%) |
| 3 Vehicles | 48,747 (19.9%) | 41,091 (19.4%) |
| 4 Vehicles | 22,158 (9.0%) | 15,926 (7.5%) |
| 5 or more Vehicles | 11,406 (4.7%) | 7,770 (3.7%) |
| Total | 244,735 (100.0%) | 211,973 (100.0%) |
Commute Time in Pima County
The most frequently occuring commute durations in Pima County are 15 to 19 minutes (69,169 commuters, 17.1%), 20 to 24 minutes (67,578 commuters, 16.7%), and 30 to 34 minutes (64,951 commuters, 16.0%).
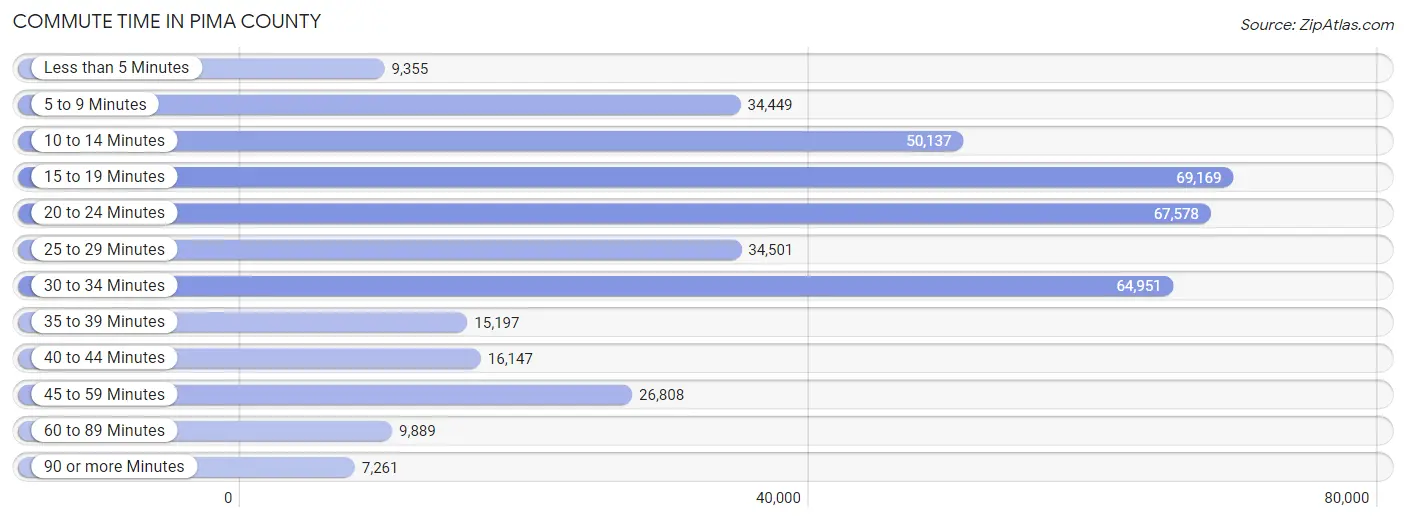
| Commute Time | # Commuters | % Commuters |
| Less than 5 Minutes | 9,355 | 2.3% |
| 5 to 9 Minutes | 34,449 | 8.5% |
| 10 to 14 Minutes | 50,137 | 12.4% |
| 15 to 19 Minutes | 69,169 | 17.1% |
| 20 to 24 Minutes | 67,578 | 16.7% |
| 25 to 29 Minutes | 34,501 | 8.5% |
| 30 to 34 Minutes | 64,951 | 16.0% |
| 35 to 39 Minutes | 15,197 | 3.7% |
| 40 to 44 Minutes | 16,147 | 4.0% |
| 45 to 59 Minutes | 26,808 | 6.6% |
| 60 to 89 Minutes | 9,889 | 2.4% |
| 90 or more Minutes | 7,261 | 1.8% |
Commute Time by Sex in Pima County
The most common commute times in Pima County are 20 to 24 minutes (38,125 commuters, 17.2%) for males and 15 to 19 minutes (32,435 commuters, 17.6%) for females.
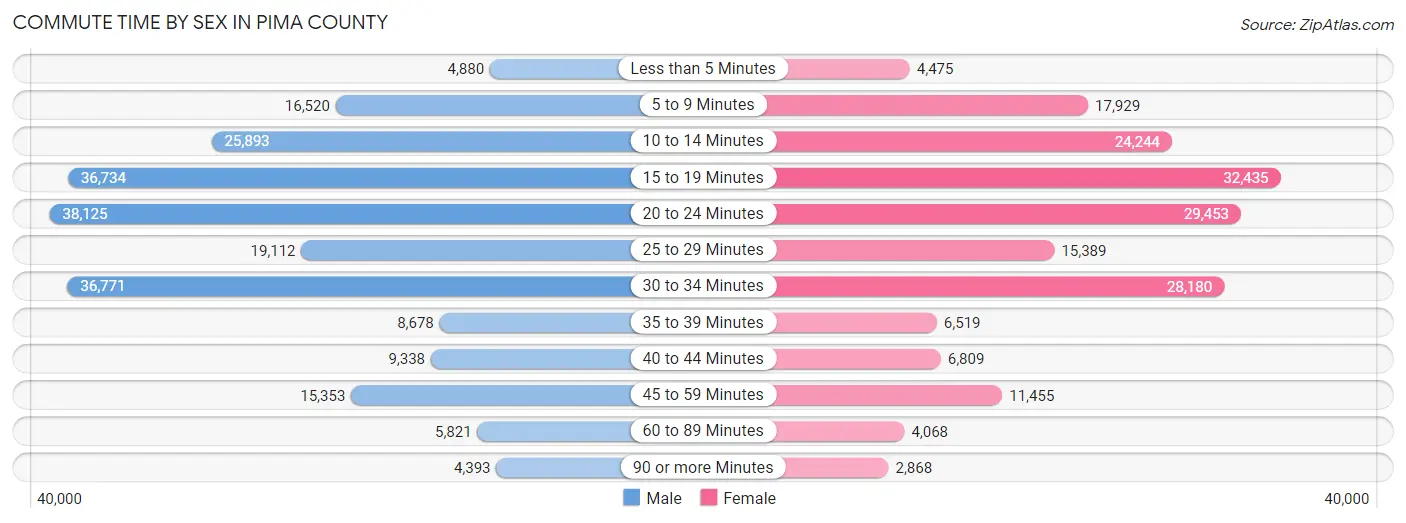
| Commute Time | Male | Female |
| Less than 5 Minutes | 4,880 (2.2%) | 4,475 (2.4%) |
| 5 to 9 Minutes | 16,520 (7.4%) | 17,929 (9.8%) |
| 10 to 14 Minutes | 25,893 (11.7%) | 24,244 (13.2%) |
| 15 to 19 Minutes | 36,734 (16.6%) | 32,435 (17.6%) |
| 20 to 24 Minutes | 38,125 (17.2%) | 29,453 (16.0%) |
| 25 to 29 Minutes | 19,112 (8.6%) | 15,389 (8.4%) |
| 30 to 34 Minutes | 36,771 (16.6%) | 28,180 (15.3%) |
| 35 to 39 Minutes | 8,678 (3.9%) | 6,519 (3.5%) |
| 40 to 44 Minutes | 9,338 (4.2%) | 6,809 (3.7%) |
| 45 to 59 Minutes | 15,353 (6.9%) | 11,455 (6.2%) |
| 60 to 89 Minutes | 5,821 (2.6%) | 4,068 (2.2%) |
| 90 or more Minutes | 4,393 (2.0%) | 2,868 (1.6%) |
Time of Departure to Work by Sex in Pima County
The most frequent times of departure to work in Pima County are 7:00 AM to 7:29 AM (28,015, 12.6%) for males and 7:00 AM to 7:29 AM (27,852, 15.1%) for females.
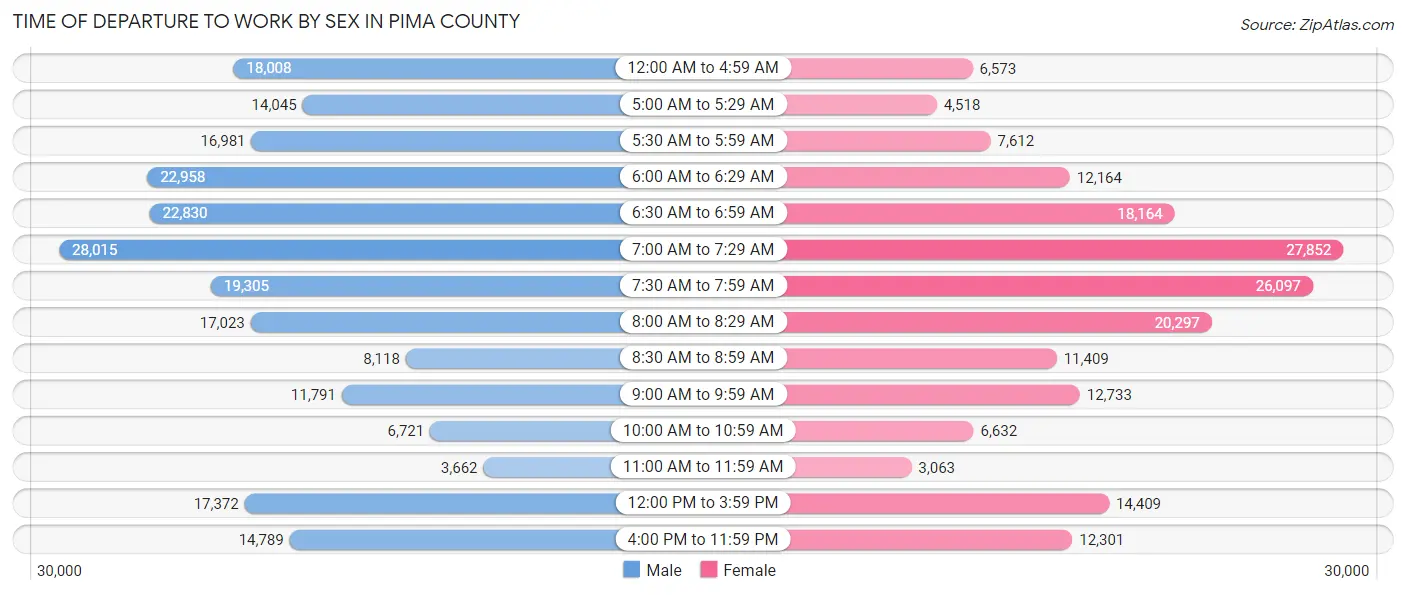
| Time of Departure | Male | Female |
| 12:00 AM to 4:59 AM | 18,008 (8.1%) | 6,573 (3.6%) |
| 5:00 AM to 5:29 AM | 14,045 (6.3%) | 4,518 (2.5%) |
| 5:30 AM to 5:59 AM | 16,981 (7.7%) | 7,612 (4.1%) |
| 6:00 AM to 6:29 AM | 22,958 (10.4%) | 12,164 (6.6%) |
| 6:30 AM to 6:59 AM | 22,830 (10.3%) | 18,164 (9.9%) |
| 7:00 AM to 7:29 AM | 28,015 (12.6%) | 27,852 (15.1%) |
| 7:30 AM to 7:59 AM | 19,305 (8.7%) | 26,097 (14.2%) |
| 8:00 AM to 8:29 AM | 17,023 (7.7%) | 20,297 (11.0%) |
| 8:30 AM to 8:59 AM | 8,118 (3.7%) | 11,409 (6.2%) |
| 9:00 AM to 9:59 AM | 11,791 (5.3%) | 12,733 (6.9%) |
| 10:00 AM to 10:59 AM | 6,721 (3.0%) | 6,632 (3.6%) |
| 11:00 AM to 11:59 AM | 3,662 (1.7%) | 3,063 (1.7%) |
| 12:00 PM to 3:59 PM | 17,372 (7.8%) | 14,409 (7.8%) |
| 4:00 PM to 11:59 PM | 14,789 (6.7%) | 12,301 (6.7%) |
| Total | 221,618 (100.0%) | 183,824 (100.0%) |
Housing Occupancy in Pima County
Occupancy by Ownership in Pima County
Of the total 423,075 dwellings in Pima County, owner-occupied units account for 271,377 (64.1%), while renter-occupied units make up 151,698 (35.9%).
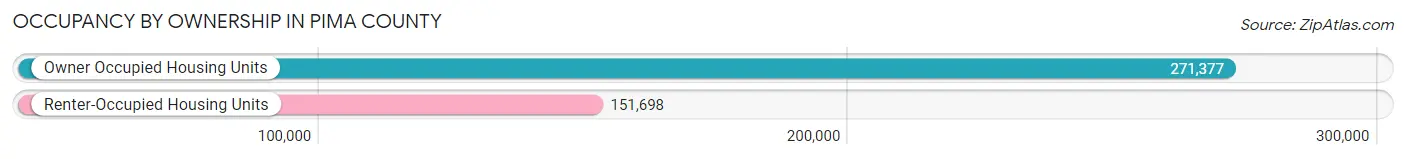
| Occupancy | # Housing Units | % Housing Units |
| Owner Occupied Housing Units | 271,377 | 64.1% |
| Renter-Occupied Housing Units | 151,698 | 35.9% |
| Total Occupied Housing Units | 423,075 | 100.0% |
Occupancy by Household Size in Pima County
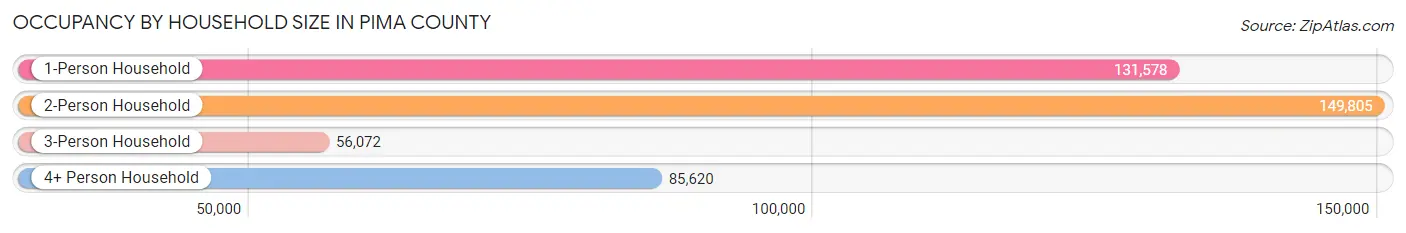
| Household Size | # Housing Units | % Housing Units |
| 1-Person Household | 131,578 | 31.1% |
| 2-Person Household | 149,805 | 35.4% |
| 3-Person Household | 56,072 | 13.3% |
| 4+ Person Household | 85,620 | 20.2% |
| Total Housing Units | 423,075 | 100.0% |
Occupancy by Ownership by Household Size in Pima County
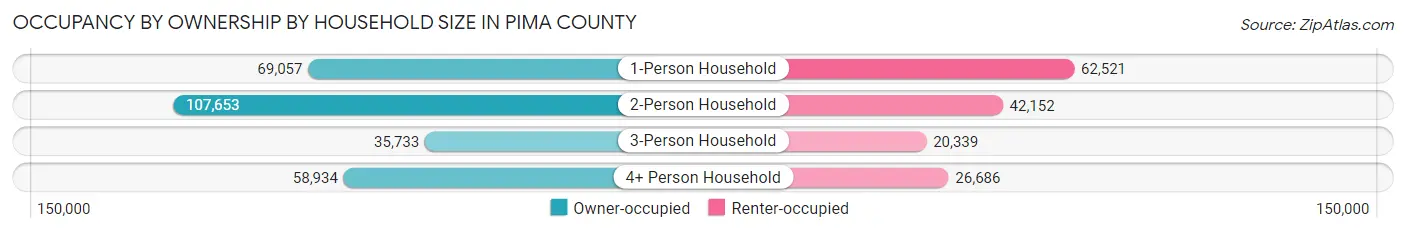
| Household Size | Owner-occupied | Renter-occupied |
| 1-Person Household | 69,057 (52.5%) | 62,521 (47.5%) |
| 2-Person Household | 107,653 (71.9%) | 42,152 (28.1%) |
| 3-Person Household | 35,733 (63.7%) | 20,339 (36.3%) |
| 4+ Person Household | 58,934 (68.8%) | 26,686 (31.2%) |
| Total Housing Units | 271,377 (64.1%) | 151,698 (35.9%) |
Occupancy by Educational Attainment in Pima County
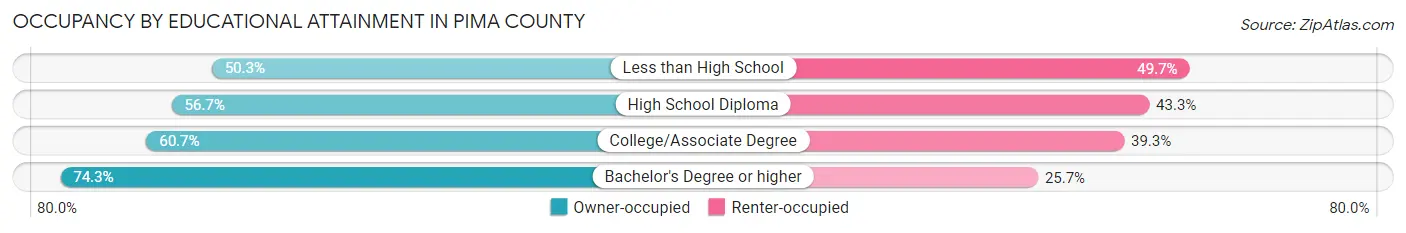
| Household Size | Owner-occupied | Renter-occupied |
| Less than High School | 18,323 (50.3%) | 18,087 (49.7%) |
| High School Diploma | 44,373 (56.7%) | 33,886 (43.3%) |
| College/Associate Degree | 91,545 (60.7%) | 59,293 (39.3%) |
| Bachelor's Degree or higher | 117,136 (74.3%) | 40,432 (25.7%) |
Occupancy by Age of Householder in Pima County
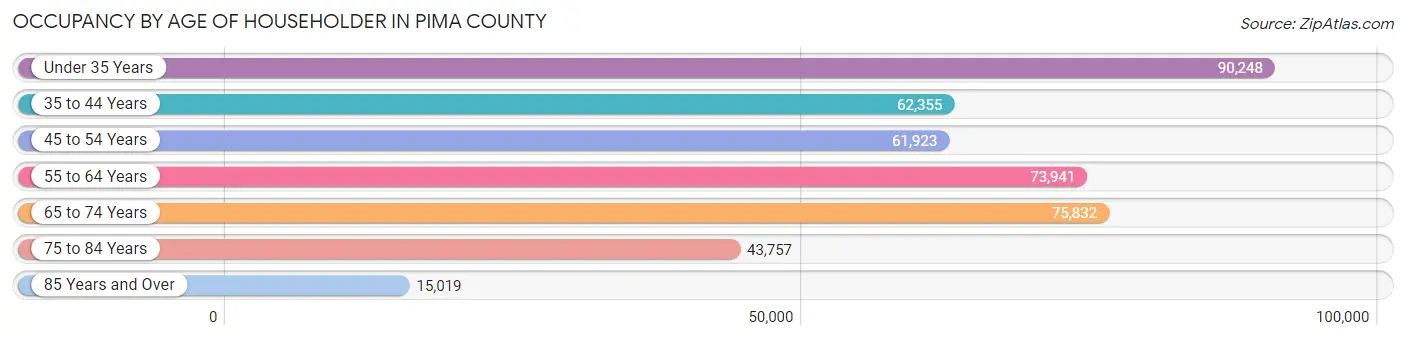
| Age Bracket | # Households | % Households |
| Under 35 Years | 90,248 | 21.3% |
| 35 to 44 Years | 62,355 | 14.7% |
| 45 to 54 Years | 61,923 | 14.6% |
| 55 to 64 Years | 73,941 | 17.5% |
| 65 to 74 Years | 75,832 | 17.9% |
| 75 to 84 Years | 43,757 | 10.3% |
| 85 Years and Over | 15,019 | 3.5% |
| Total | 423,075 | 100.0% |
Housing Finances in Pima County
Median Income by Occupancy in Pima County
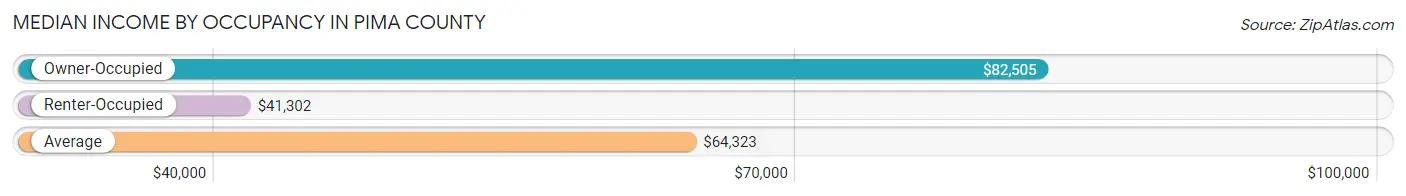
| Occupancy Type | # Households | Median Income |
| Owner-Occupied | 271,377 (64.1%) | $82,505 |
| Renter-Occupied | 151,698 (35.9%) | $41,302 |
| Average | 423,075 (100.0%) | $64,323 |
Occupancy by Householder Income Bracket in Pima County
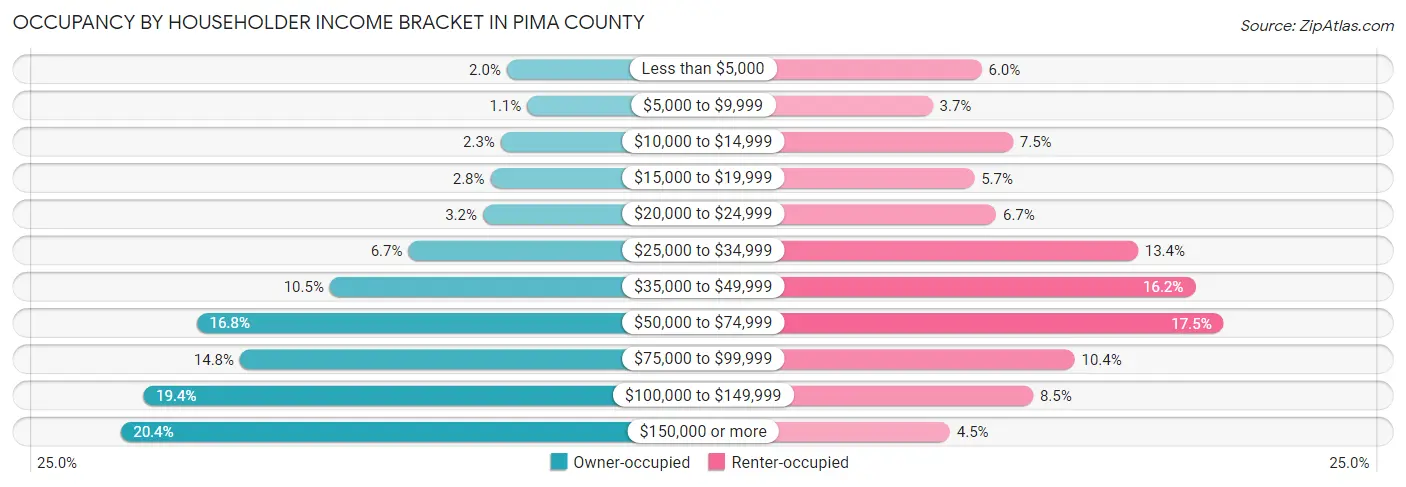
| Income Bracket | Owner-occupied | Renter-occupied |
| Less than $5,000 | 5,549 (2.0%) | 9,105 (6.0%) |
| $5,000 to $9,999 | 2,913 (1.1%) | 5,567 (3.7%) |
| $10,000 to $14,999 | 6,333 (2.3%) | 11,357 (7.5%) |
| $15,000 to $19,999 | 7,642 (2.8%) | 8,567 (5.7%) |
| $20,000 to $24,999 | 8,639 (3.2%) | 10,145 (6.7%) |
| $25,000 to $34,999 | 18,254 (6.7%) | 20,389 (13.4%) |
| $35,000 to $49,999 | 28,404 (10.5%) | 24,529 (16.2%) |
| $50,000 to $74,999 | 45,608 (16.8%) | 26,583 (17.5%) |
| $75,000 to $99,999 | 40,018 (14.7%) | 15,829 (10.4%) |
| $100,000 to $149,999 | 52,546 (19.4%) | 12,816 (8.5%) |
| $150,000 or more | 55,471 (20.4%) | 6,811 (4.5%) |
| Total | 271,377 (100.0%) | 151,698 (100.0%) |
Monthly Housing Cost Tiers in Pima County
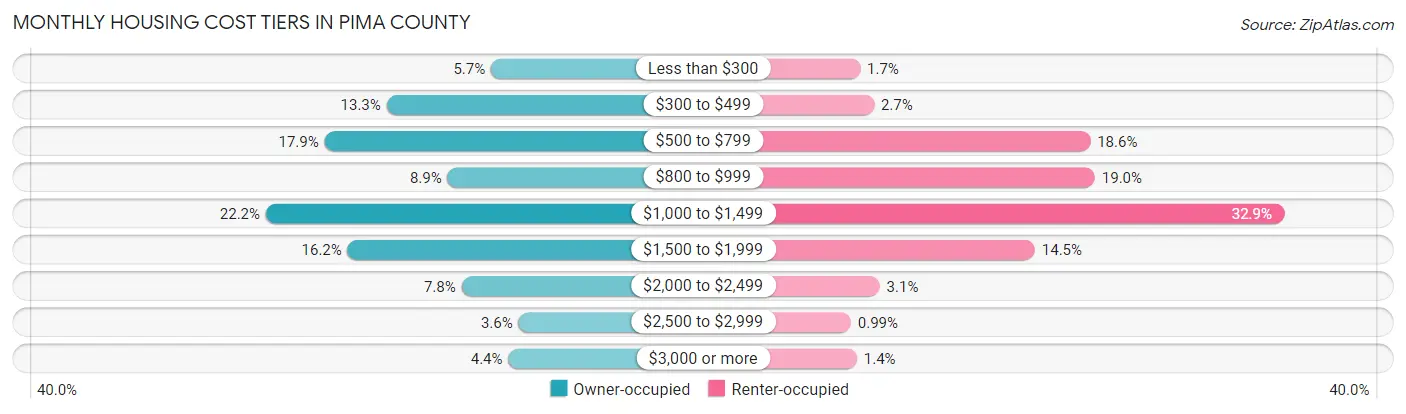
| Monthly Cost | Owner-occupied | Renter-occupied |
| Less than $300 | 15,334 (5.7%) | 2,530 (1.7%) |
| $300 to $499 | 36,193 (13.3%) | 4,077 (2.7%) |
| $500 to $799 | 48,599 (17.9%) | 28,252 (18.6%) |
| $800 to $999 | 24,027 (8.8%) | 28,756 (19.0%) |
| $1,000 to $1,499 | 60,319 (22.2%) | 49,860 (32.9%) |
| $1,500 to $1,999 | 43,998 (16.2%) | 22,055 (14.5%) |
| $2,000 to $2,499 | 21,222 (7.8%) | 4,723 (3.1%) |
| $2,500 to $2,999 | 9,834 (3.6%) | 1,496 (1.0%) |
| $3,000 or more | 11,851 (4.4%) | 2,173 (1.4%) |
| Total | 271,377 (100.0%) | 151,698 (100.0%) |
Physical Housing Characteristics in Pima County
Housing Structures in Pima County
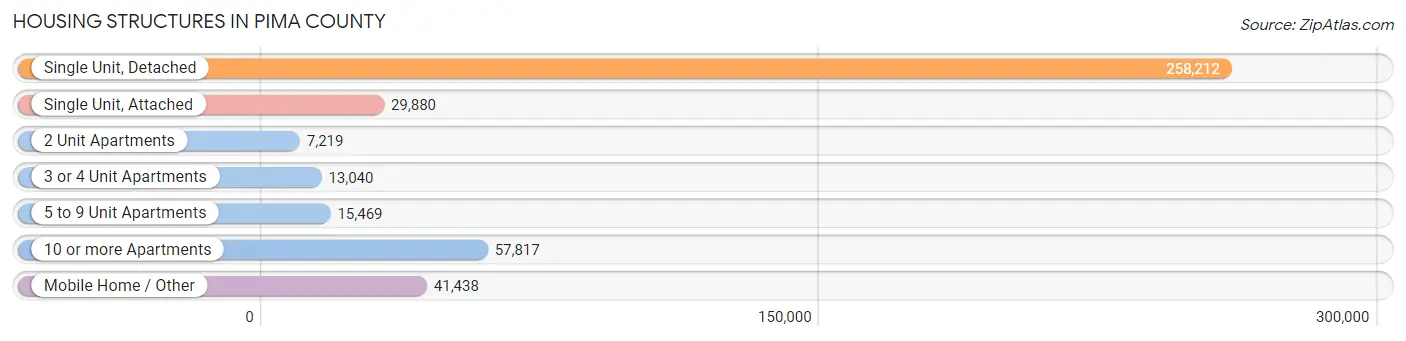
| Structure Type | # Housing Units | % Housing Units |
| Single Unit, Detached | 258,212 | 61.0% |
| Single Unit, Attached | 29,880 | 7.1% |
| 2 Unit Apartments | 7,219 | 1.7% |
| 3 or 4 Unit Apartments | 13,040 | 3.1% |
| 5 to 9 Unit Apartments | 15,469 | 3.7% |
| 10 or more Apartments | 57,817 | 13.7% |
| Mobile Home / Other | 41,438 | 9.8% |
| Total | 423,075 | 100.0% |
Housing Structures by Occupancy in Pima County
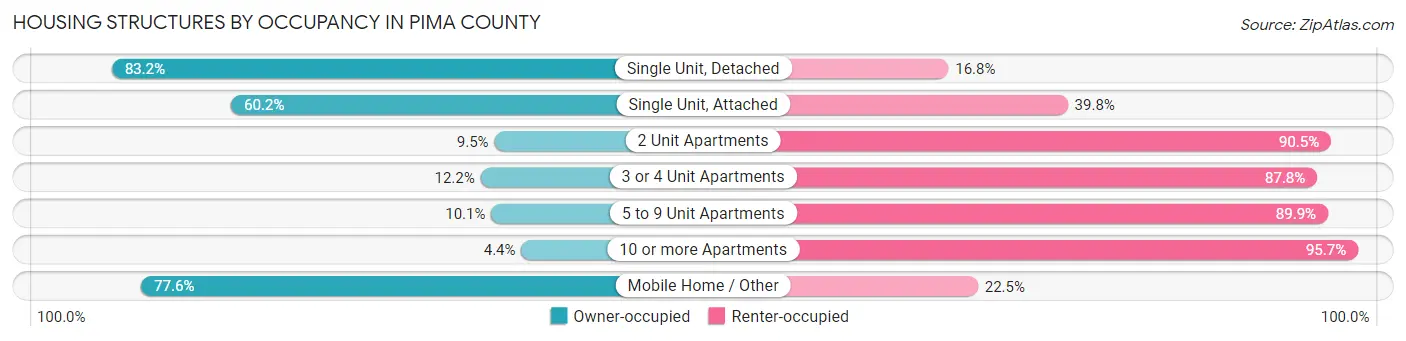
| Structure Type | Owner-occupied | Renter-occupied |
| Single Unit, Detached | 214,878 (83.2%) | 43,334 (16.8%) |
| Single Unit, Attached | 18,000 (60.2%) | 11,880 (39.8%) |
| 2 Unit Apartments | 689 (9.5%) | 6,530 (90.5%) |
| 3 or 4 Unit Apartments | 1,593 (12.2%) | 11,447 (87.8%) |
| 5 to 9 Unit Apartments | 1,568 (10.1%) | 13,901 (89.9%) |
| 10 or more Apartments | 2,513 (4.3%) | 55,304 (95.7%) |
| Mobile Home / Other | 32,136 (77.5%) | 9,302 (22.5%) |
| Total | 271,377 (64.1%) | 151,698 (35.9%) |
Housing Structures by Number of Rooms in Pima County
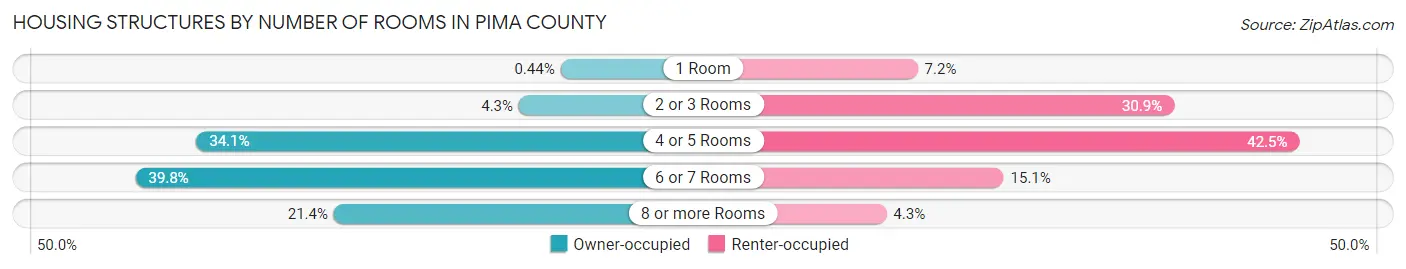
| Number of Rooms | Owner-occupied | Renter-occupied |
| 1 Room | 1,185 (0.4%) | 10,904 (7.2%) |
| 2 or 3 Rooms | 11,650 (4.3%) | 46,875 (30.9%) |
| 4 or 5 Rooms | 92,589 (34.1%) | 64,434 (42.5%) |
| 6 or 7 Rooms | 107,866 (39.8%) | 22,963 (15.1%) |
| 8 or more Rooms | 58,087 (21.4%) | 6,522 (4.3%) |
| Total | 271,377 (100.0%) | 151,698 (100.0%) |
Housing Structure by Heating Type in Pima County
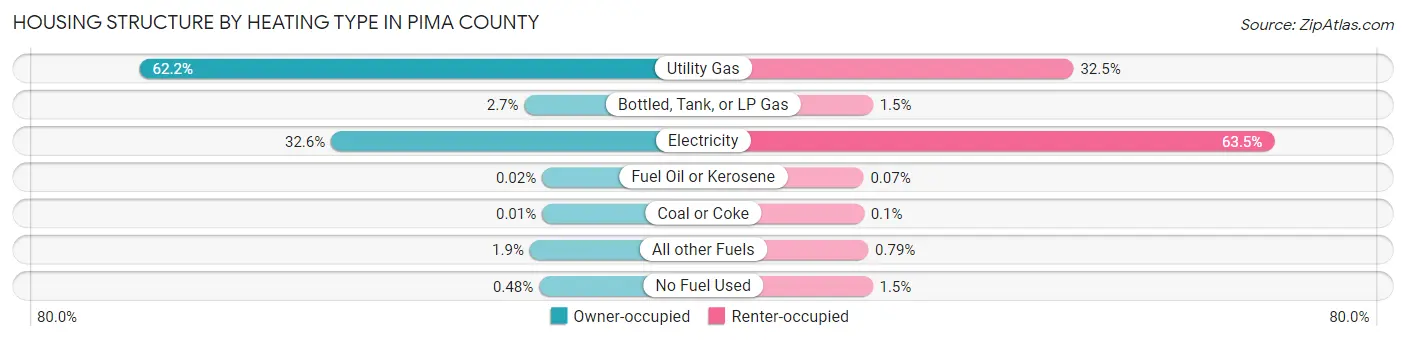
| Heating Type | Owner-occupied | Renter-occupied |
| Utility Gas | 168,815 (62.2%) | 49,347 (32.5%) |
| Bottled, Tank, or LP Gas | 7,447 (2.7%) | 2,270 (1.5%) |
| Electricity | 88,540 (32.6%) | 96,392 (63.5%) |
| Fuel Oil or Kerosene | 66 (0.0%) | 105 (0.1%) |
| Coal or Coke | 22 (0.0%) | 150 (0.1%) |
| All other Fuels | 5,194 (1.9%) | 1,205 (0.8%) |
| No Fuel Used | 1,293 (0.5%) | 2,229 (1.5%) |
| Total | 271,377 (100.0%) | 151,698 (100.0%) |
Household Vehicle Usage in Pima County
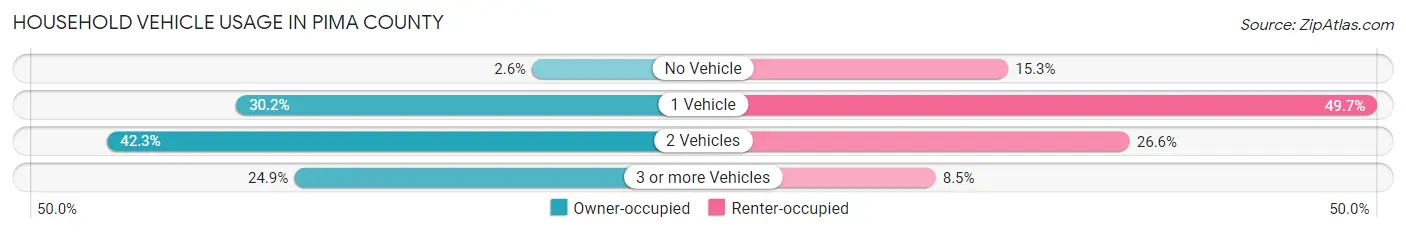
| Vehicles per Household | Owner-occupied | Renter-occupied |
| No Vehicle | 7,166 (2.6%) | 23,129 (15.2%) |
| 1 Vehicle | 82,073 (30.2%) | 75,358 (49.7%) |
| 2 Vehicles | 114,701 (42.3%) | 40,345 (26.6%) |
| 3 or more Vehicles | 67,437 (24.8%) | 12,866 (8.5%) |
| Total | 271,377 (100.0%) | 151,698 (100.0%) |
Real Estate & Mortgages in Pima County
Real Estate and Mortgage Overview in Pima County
| Characteristic | Without Mortgage | With Mortgage |
| Housing Units | 107,555 | 163,822 |
| Median Property Value | $238,200 | $270,200 |
| Median Household Income | $63,779 | $39,569 |
| Monthly Housing Costs | $523 | $11,558 |
| Real Estate Taxes | $2,064 | $5,489 |
Property Value by Mortgage Status in Pima County
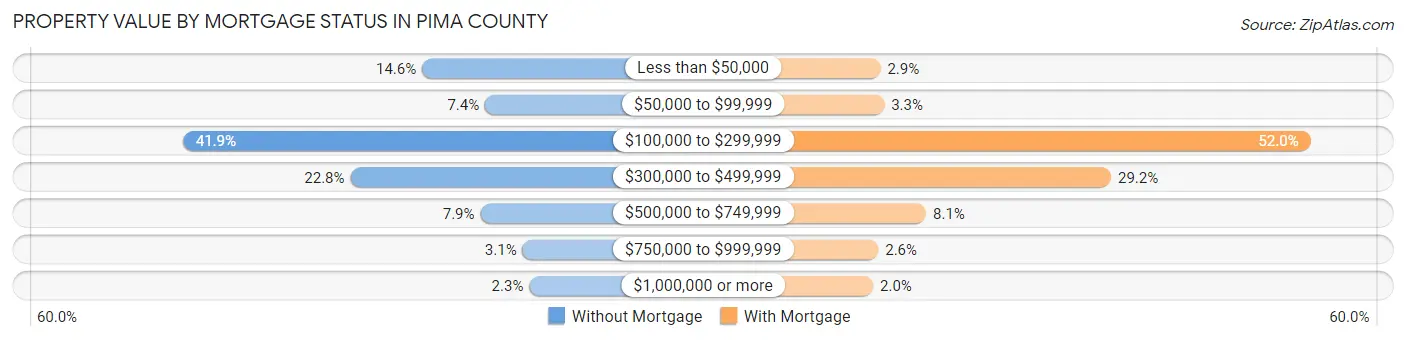
| Property Value | Without Mortgage | With Mortgage |
| Less than $50,000 | 15,681 (14.6%) | 4,668 (2.9%) |
| $50,000 to $99,999 | 7,940 (7.4%) | 5,373 (3.3%) |
| $100,000 to $299,999 | 45,092 (41.9%) | 85,188 (52.0%) |
| $300,000 to $499,999 | 24,487 (22.8%) | 47,836 (29.2%) |
| $500,000 to $749,999 | 8,512 (7.9%) | 13,212 (8.1%) |
| $750,000 to $999,999 | 3,339 (3.1%) | 4,252 (2.6%) |
| $1,000,000 or more | 2,504 (2.3%) | 3,293 (2.0%) |
| Total | 107,555 (100.0%) | 163,822 (100.0%) |
Household Income by Mortgage Status in Pima County
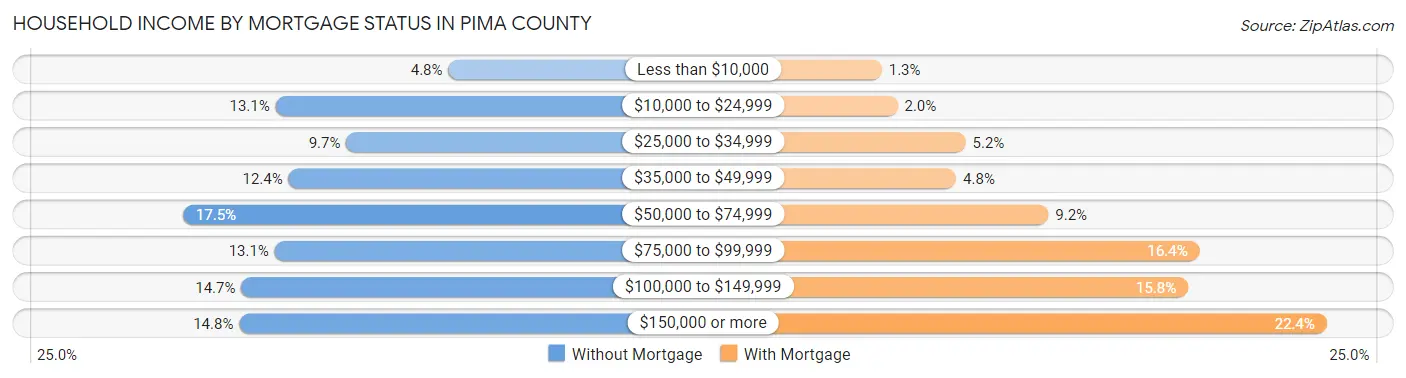
| Household Income | Without Mortgage | With Mortgage |
| Less than $10,000 | 5,185 (4.8%) | 2,054 (1.3%) |
| $10,000 to $24,999 | 14,032 (13.1%) | 3,277 (2.0%) |
| $25,000 to $34,999 | 10,415 (9.7%) | 8,582 (5.2%) |
| $35,000 to $49,999 | 13,372 (12.4%) | 7,839 (4.8%) |
| $50,000 to $74,999 | 18,782 (17.5%) | 15,032 (9.2%) |
| $75,000 to $99,999 | 14,079 (13.1%) | 26,826 (16.4%) |
| $100,000 to $149,999 | 15,788 (14.7%) | 25,939 (15.8%) |
| $150,000 or more | 15,902 (14.8%) | 36,758 (22.4%) |
| Total | 107,555 (100.0%) | 163,822 (100.0%) |
Property Value to Household Income Ratio in Pima County
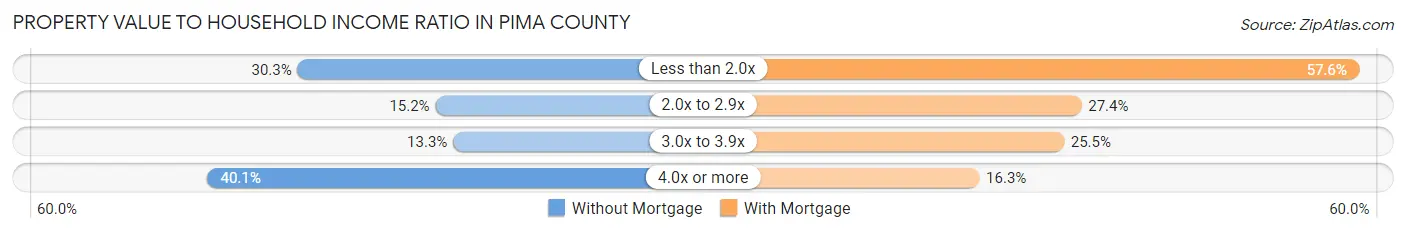
| Value-to-Income Ratio | Without Mortgage | With Mortgage |
| Less than 2.0x | 32,551 (30.3%) | 94,409 (57.6%) |
| 2.0x to 2.9x | 16,386 (15.2%) | 44,877 (27.4%) |
| 3.0x to 3.9x | 14,303 (13.3%) | 41,746 (25.5%) |
| 4.0x or more | 43,082 (40.1%) | 26,630 (16.3%) |
| Total | 107,555 (100.0%) | 163,822 (100.0%) |
Real Estate Taxes by Mortgage Status in Pima County
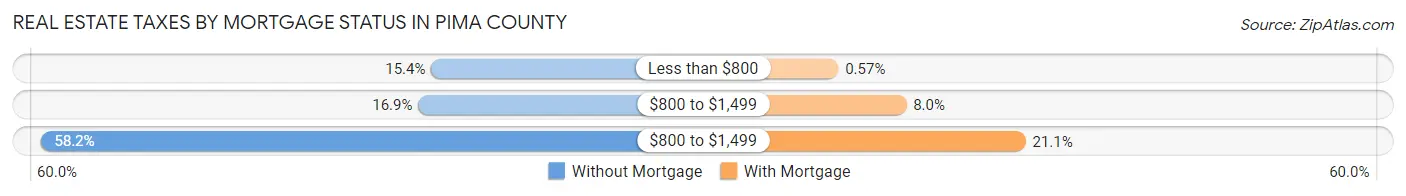
| Property Taxes | Without Mortgage | With Mortgage |
| Less than $800 | 16,601 (15.4%) | 940 (0.6%) |
| $800 to $1,499 | 18,139 (16.9%) | 13,142 (8.0%) |
| $800 to $1,499 | 62,553 (58.2%) | 34,569 (21.1%) |
| Total | 107,555 (100.0%) | 163,822 (100.0%) |
Health & Disability in Pima County
Health Insurance Coverage by Age in Pima County
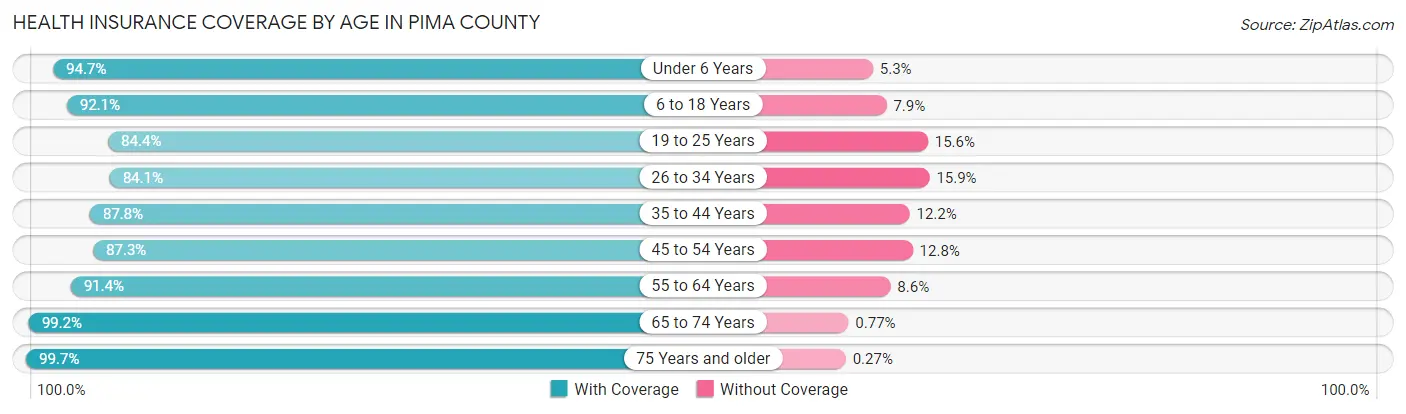
| Age Bracket | With Coverage | Without Coverage |
| Under 6 Years | 60,932 (94.7%) | 3,423 (5.3%) |
| 6 to 18 Years | 149,746 (92.1%) | 12,786 (7.9%) |
| 19 to 25 Years | 99,823 (84.4%) | 18,403 (15.6%) |
| 26 to 34 Years | 96,716 (84.1%) | 18,255 (15.9%) |
| 35 to 44 Years | 102,087 (87.8%) | 14,142 (12.2%) |
| 45 to 54 Years | 96,076 (87.3%) | 14,045 (12.8%) |
| 55 to 64 Years | 113,776 (91.4%) | 10,708 (8.6%) |
| 65 to 74 Years | 117,664 (99.2%) | 913 (0.8%) |
| 75 Years and older | 89,722 (99.7%) | 244 (0.3%) |
| Total | 926,542 (90.9%) | 92,919 (9.1%) |
Health Insurance Coverage by Citizenship Status in Pima County
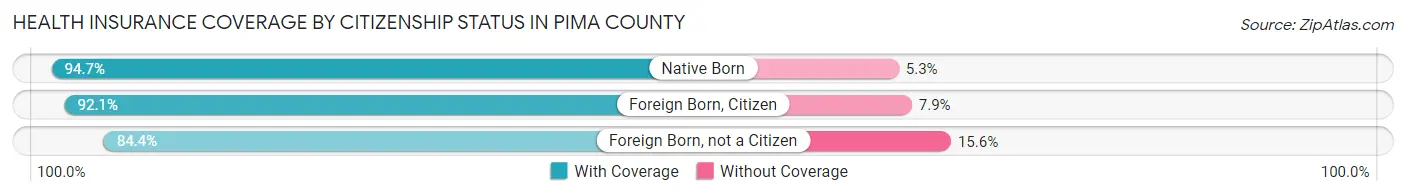
| Citizenship Status | With Coverage | Without Coverage |
| Native Born | 60,932 (94.7%) | 3,423 (5.3%) |
| Foreign Born, Citizen | 149,746 (92.1%) | 12,786 (7.9%) |
| Foreign Born, not a Citizen | 99,823 (84.4%) | 18,403 (15.6%) |
Health Insurance Coverage by Household Income in Pima County
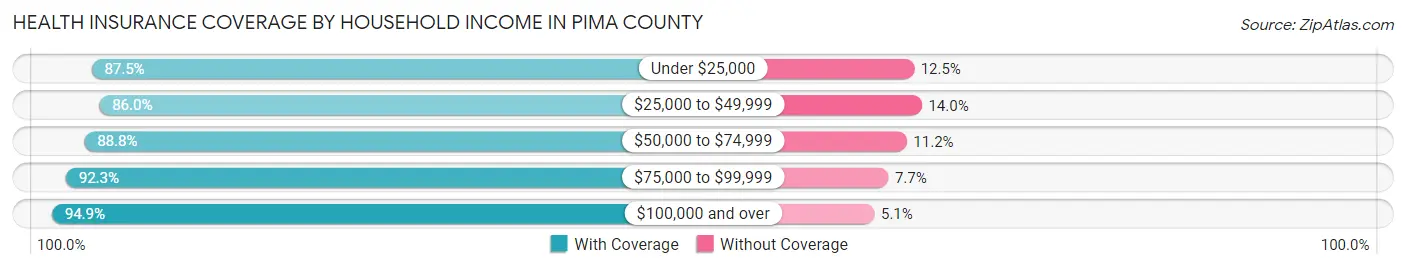
| Household Income | With Coverage | Without Coverage |
| Under $25,000 | 114,510 (87.5%) | 16,409 (12.5%) |
| $25,000 to $49,999 | 159,801 (86.0%) | 25,996 (14.0%) |
| $50,000 to $74,999 | 152,319 (88.8%) | 19,157 (11.2%) |
| $75,000 to $99,999 | 132,477 (92.3%) | 11,081 (7.7%) |
| $100,000 and over | 355,147 (94.9%) | 19,070 (5.1%) |
Public vs Private Health Insurance Coverage by Age in Pima County
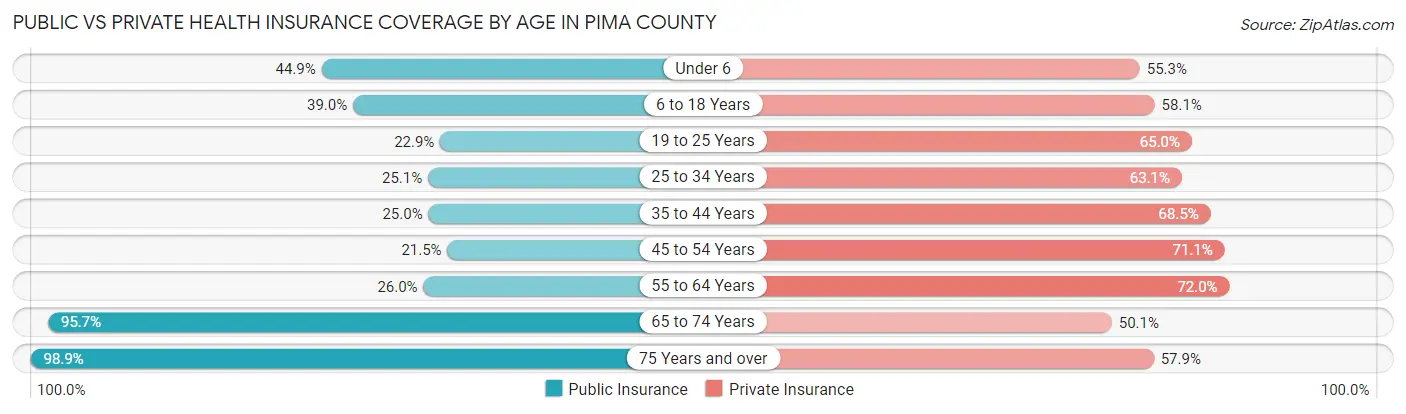
| Age Bracket | Public Insurance | Private Insurance |
| Under 6 | 28,883 (44.9%) | 35,602 (55.3%) |
| 6 to 18 Years | 63,455 (39.0%) | 94,389 (58.1%) |
| 19 to 25 Years | 27,025 (22.9%) | 76,815 (65.0%) |
| 25 to 34 Years | 28,868 (25.1%) | 72,556 (63.1%) |
| 35 to 44 Years | 29,093 (25.0%) | 79,576 (68.5%) |
| 45 to 54 Years | 23,688 (21.5%) | 78,254 (71.1%) |
| 55 to 64 Years | 32,332 (26.0%) | 89,571 (72.0%) |
| 65 to 74 Years | 113,467 (95.7%) | 59,424 (50.1%) |
| 75 Years and over | 88,989 (98.9%) | 52,088 (57.9%) |
| Total | 435,800 (42.7%) | 638,275 (62.6%) |
Disability Status by Sex by Age in Pima County
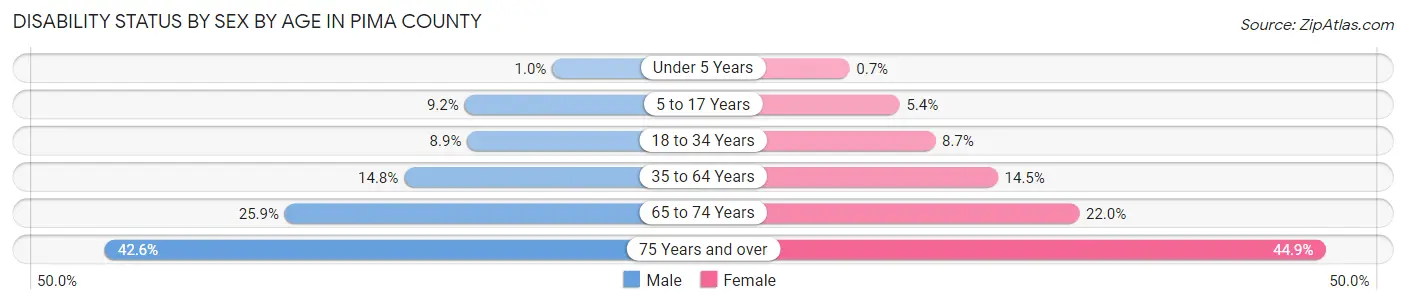
| Age Bracket | Male | Female |
| Under 5 Years | 286 (1.0%) | 183 (0.7%) |
| 5 to 17 Years | 7,333 (9.2%) | 4,096 (5.3%) |
| 18 to 34 Years | 11,168 (8.9%) | 10,795 (8.6%) |
| 35 to 64 Years | 25,171 (14.8%) | 26,106 (14.5%) |
| 65 to 74 Years | 14,267 (25.9%) | 13,960 (22.0%) |
| 75 Years and over | 16,928 (42.5%) | 22,516 (44.9%) |
Disability Class by Sex by Age in Pima County
Disability Class: Hearing Difficulty
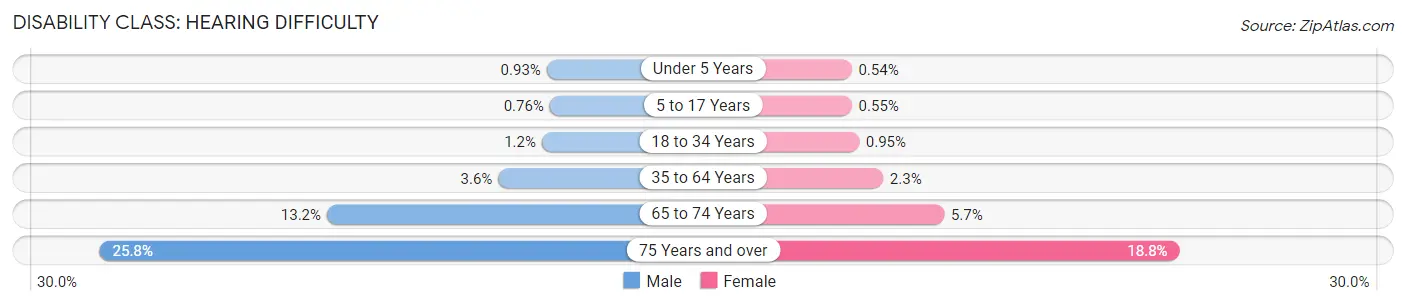
| Age Bracket | Male | Female |
| Under 5 Years | 256 (0.9%) | 141 (0.5%) |
| 5 to 17 Years | 608 (0.8%) | 419 (0.5%) |
| 18 to 34 Years | 1,500 (1.2%) | 1,188 (0.9%) |
| 35 to 64 Years | 6,188 (3.6%) | 4,132 (2.3%) |
| 65 to 74 Years | 7,269 (13.2%) | 3,607 (5.7%) |
| 75 Years and over | 10,274 (25.8%) | 9,432 (18.8%) |
Disability Class: Vision Difficulty
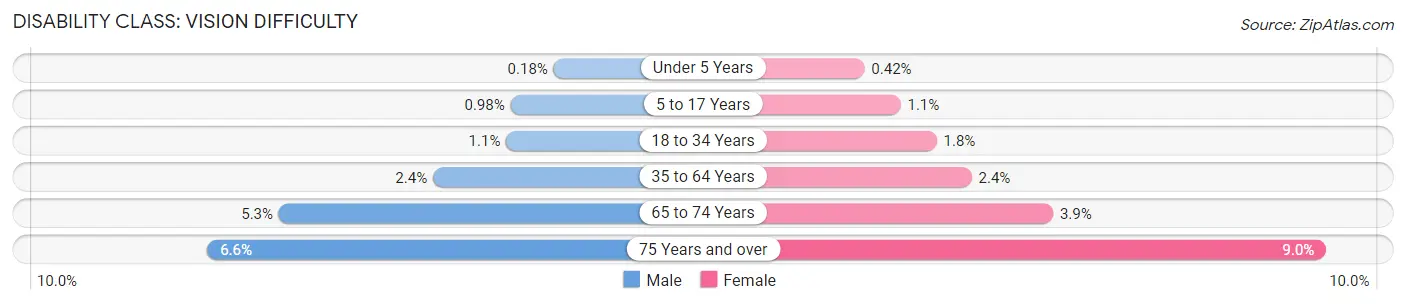
| Age Bracket | Male | Female |
| Under 5 Years | 50 (0.2%) | 110 (0.4%) |
| 5 to 17 Years | 785 (1.0%) | 832 (1.1%) |
| 18 to 34 Years | 1,324 (1.1%) | 2,201 (1.8%) |
| 35 to 64 Years | 4,115 (2.4%) | 4,348 (2.4%) |
| 65 to 74 Years | 2,913 (5.3%) | 2,487 (3.9%) |
| 75 Years and over | 2,629 (6.6%) | 4,510 (9.0%) |
Disability Class: Cognitive Difficulty
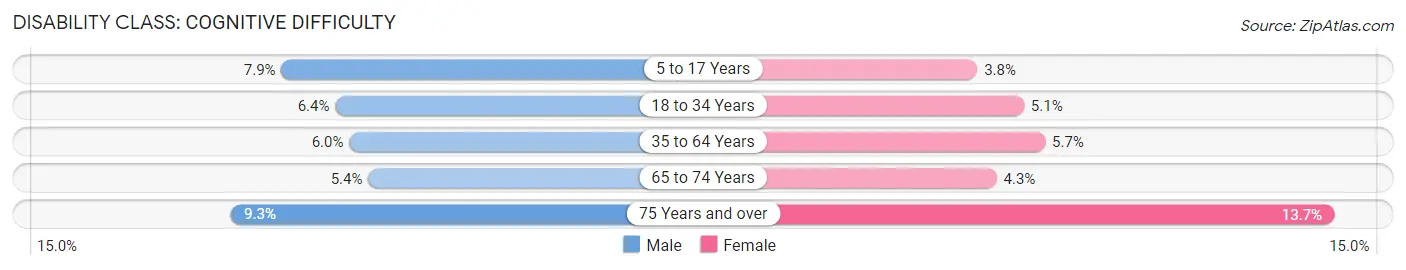
| Age Bracket | Male | Female |
| 5 to 17 Years | 6,277 (7.9%) | 2,881 (3.8%) |
| 18 to 34 Years | 7,945 (6.4%) | 6,325 (5.1%) |
| 35 to 64 Years | 10,149 (6.0%) | 10,210 (5.7%) |
| 65 to 74 Years | 2,997 (5.4%) | 2,730 (4.3%) |
| 75 Years and over | 3,680 (9.2%) | 6,874 (13.7%) |
Disability Class: Ambulatory Difficulty
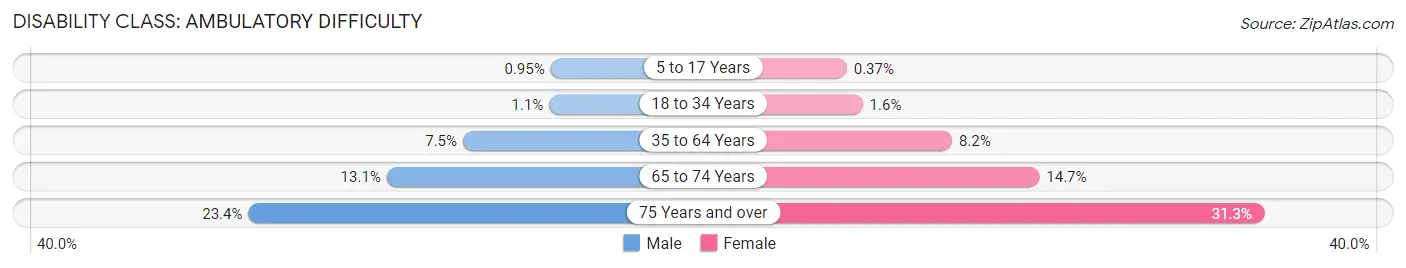
| Age Bracket | Male | Female |
| 5 to 17 Years | 756 (0.9%) | 285 (0.4%) |
| 18 to 34 Years | 1,312 (1.1%) | 1,928 (1.5%) |
| 35 to 64 Years | 12,709 (7.5%) | 14,769 (8.2%) |
| 65 to 74 Years | 7,241 (13.1%) | 9,301 (14.7%) |
| 75 Years and over | 9,306 (23.4%) | 15,721 (31.3%) |
Disability Class: Self-Care Difficulty
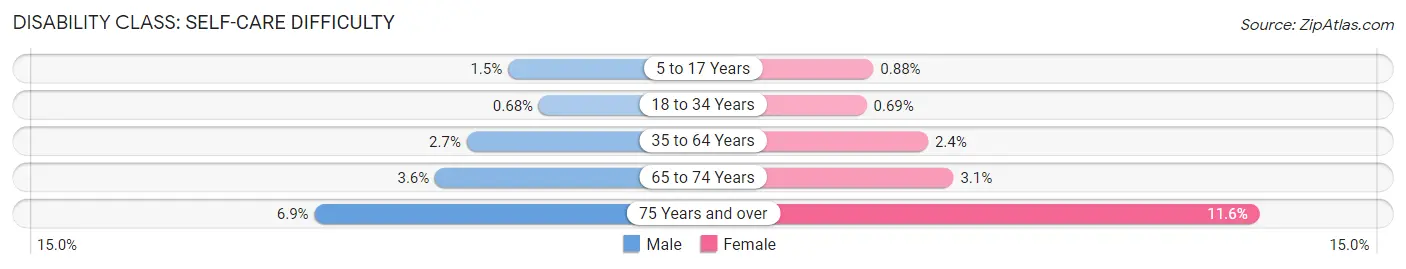
| Age Bracket | Male | Female |
| 5 to 17 Years | 1,228 (1.5%) | 675 (0.9%) |
| 18 to 34 Years | 857 (0.7%) | 867 (0.7%) |
| 35 to 64 Years | 4,581 (2.7%) | 4,332 (2.4%) |
| 65 to 74 Years | 1,969 (3.6%) | 1,971 (3.1%) |
| 75 Years and over | 2,759 (6.9%) | 5,836 (11.6%) |
Technology Access in Pima County
Computing Device Access in Pima County
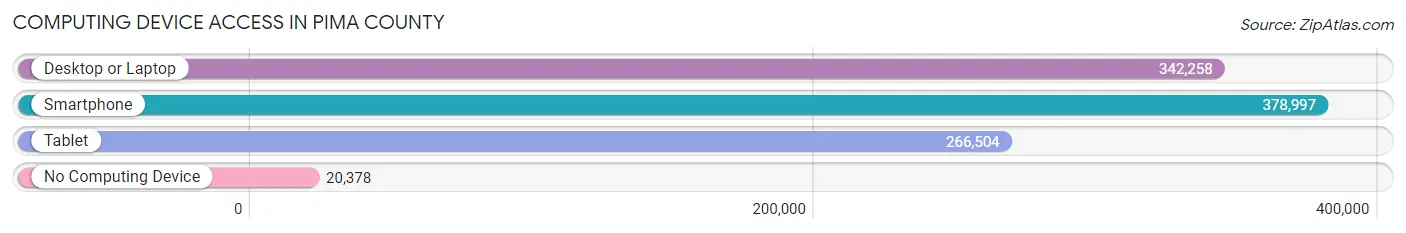
| Device Type | # Households | % Households |
| Desktop or Laptop | 342,258 | 80.9% |
| Smartphone | 378,997 | 89.6% |
| Tablet | 266,504 | 63.0% |
| No Computing Device | 20,378 | 4.8% |
| Total | 423,075 | 100.0% |
Internet Access in Pima County
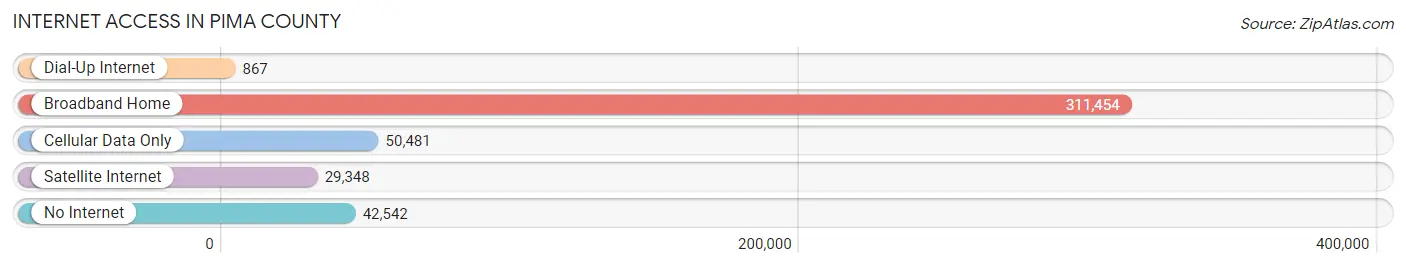
| Internet Type | # Households | % Households |
| Dial-Up Internet | 867 | 0.2% |
| Broadband Home | 311,454 | 73.6% |
| Cellular Data Only | 50,481 | 11.9% |
| Satellite Internet | 29,348 | 6.9% |
| No Internet | 42,542 | 10.1% |
| Total | 423,075 | 100.0% |
Pima County Summary
Pima County, Arizona is located in the south-central region of the state and is the second largest county in Arizona. It is bordered by Santa Cruz County to the west, Pinal County to the east, Maricopa County to the north, and Mexico to the south. The county seat is Tucson, the second largest city in Arizona. Pima County is home to a diverse population of over 1 million people, making it the third most populous county in the state.
Geography
Pima County covers an area of 9,184 square miles, making it the largest county in Arizona. The county is located in the Sonoran Desert and is home to a variety of landscapes, including mountains, canyons, valleys, and plains. The Santa Cruz River runs through the county, providing a source of water for the area. The county is also home to several national parks and monuments, including Saguaro National Park, Coronado National Forest, and Organ Pipe Cactus National Monument.
The climate in Pima County is generally hot and dry, with temperatures ranging from the mid-90s in the summer to the mid-50s in the winter. The area receives an average of 12 inches of rain per year, with most of the precipitation occurring in the summer months.
Economy
Pima County has a diverse economy, with a variety of industries providing employment opportunities. The county is home to several major employers, including Raytheon Missile Systems, Davis-Monthan Air Force Base, and the University of Arizona. The county is also home to a number of smaller businesses, including manufacturing, retail, and tourism.
The county’s economy is largely driven by the tourism industry, which brings in millions of dollars each year. The county is home to a number of attractions, including the Arizona-Sonora Desert Museum, the Pima Air and Space Museum, and the Tucson Botanical Gardens.
Demographics
As of the 2020 census, Pima County had a population of 1,035,818 people. The population is diverse, with the largest ethnic groups being White (63.2%), Hispanic or Latino (30.2%), and Native American (3.3%). The median household income in the county is $50,845, and the median age is 35.
The county is home to a number of higher education institutions, including the University of Arizona, Pima Community College, and the University of Phoenix. The county is also home to a number of cultural attractions, including the Tucson Museum of Art, the Tucson Symphony Orchestra, and the Tucson Jazz Festival.
Conclusion
Pima County, Arizona is a diverse and vibrant county located in the south-central region of the state. The county is home to a variety of landscapes, including mountains, canyons, valleys, and plains. The county has a diverse economy, with a variety of industries providing employment opportunities. The county is also home to a diverse population, with the largest ethnic groups being White, Hispanic or Latino, and Native American. The county is home to a number of higher education institutions, cultural attractions, and national parks and monuments.
Common Questions
What is Per Capita Income in Pima County?
Per Capita income in Pima County is $36,494.
What is the Median Family Income in Pima County?
Median Family Income in Pima County is $82,620.
What is the Median Household income in Pima County?
Median Household Income in Pima County is $64,323.
What is Income or Wage Gap in Pima County?
Income or Wage Gap in Pima County is 21.4%.
Women in Pima County earn 78.6 cents for every dollar earned by a man.
What is Family Income Deficit in Pima County?
Family Income Deficit in Pima County is $11,516.
Families that are below poverty line in Pima County earn $11,516 less on average than the poverty threshold level.
What is Inequality or Gini Index in Pima County?
Inequality or Gini Index in Pima County is 0.47.
What is the Total Population of Pima County?
Total Population of Pima County is 1,042,393.
What is the Total Male Population of Pima County?
Total Male Population of Pima County is 516,095.
What is the Total Female Population of Pima County?
Total Female Population of Pima County is 526,298.
What is the Ratio of Males per 100 Females in Pima County?
There are 98.06 Males per 100 Females in Pima County.
What is the Ratio of Females per 100 Males in Pima County?
There are 101.98 Females per 100 Males in Pima County.
What is the Median Population Age in Pima County?
Median Population Age in Pima County is 39.0 Years.
What is the Average Family Size in Pima County
Average Family Size in Pima County is 3.0 People.
What is the Average Household Size in Pima County
Average Household Size in Pima County is 2.4 People.
How Large is the Labor Force in Pima County?
There are 499,555 People in the Labor Forcein in Pima County.
What is the Percentage of People in the Labor Force in Pima County?
58.4% of People are in the Labor Force in Pima County.
What is the Unemployment Rate in Pima County?
Unemployment Rate in Pima County is 5.9%.