Gila County, AZ Map & Demographics
Gila County Map
Gila County Overview
$29,945
PER CAPITA INCOME
$64,786
AVG FAMILY INCOME
$55,242
AVG HOUSEHOLD INCOME
27.7%
WAGE / INCOME GAP [ % ]
72.3¢/ $1
WAGE / INCOME GAP [ $ ]
$11,637
FAMILY INCOME DEFICIT
0.44
INEQUALITY / GINI INDEX
53,419
TOTAL POPULATION
26,688
MALE POPULATION
26,731
FEMALE POPULATION
99.84
MALES / 100 FEMALES
100.16
FEMALES / 100 MALES
50.6
MEDIAN AGE
2.9
AVG FAMILY SIZE
2.3
AVG HOUSEHOLD SIZE
20,174
LABOR FORCE [ PEOPLE ]
45.7%
PERCENT IN LABOR FORCE
6.9%
UNEMPLOYMENT RATE
Income in Gila County
Income Overview in Gila County
Per Capita Income in Gila County is $29,945, while median incomes of families and households are $64,786 and $55,242 respectively.
| Characteristic | Number | Measure |
| Per Capita Income | 53,419 | $29,945 |
| Median Family Income | 13,858 | $64,786 |
| Mean Family Income | 13,858 | $81,965 |
| Median Household Income | 22,714 | $55,242 |
| Mean Household Income | 22,714 | $69,681 |
| Income Deficit | 13,858 | $11,637 |
| Wage / Income Gap (%) | 53,419 | 27.69% |
| Wage / Income Gap ($) | 53,419 | 72.31¢ per $1 |
| Gini / Inequality Index | 53,419 | 0.44 |
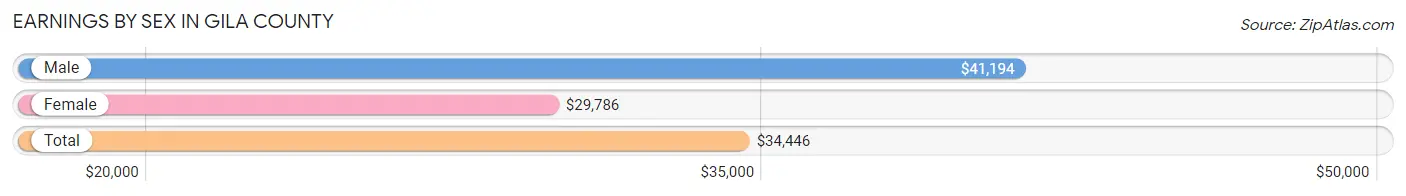
Earnings by Sex in Gila County
Average Earnings in Gila County are $34,446, $41,194 for men and $29,786 for women, a difference of 27.7%.
| Sex | Number | Average Earnings |
| Male | 11,005 (51.7%) | $41,194 |
| Female | 10,270 (48.3%) | $29,786 |
| Total | 21,275 (100.0%) | $34,446 |
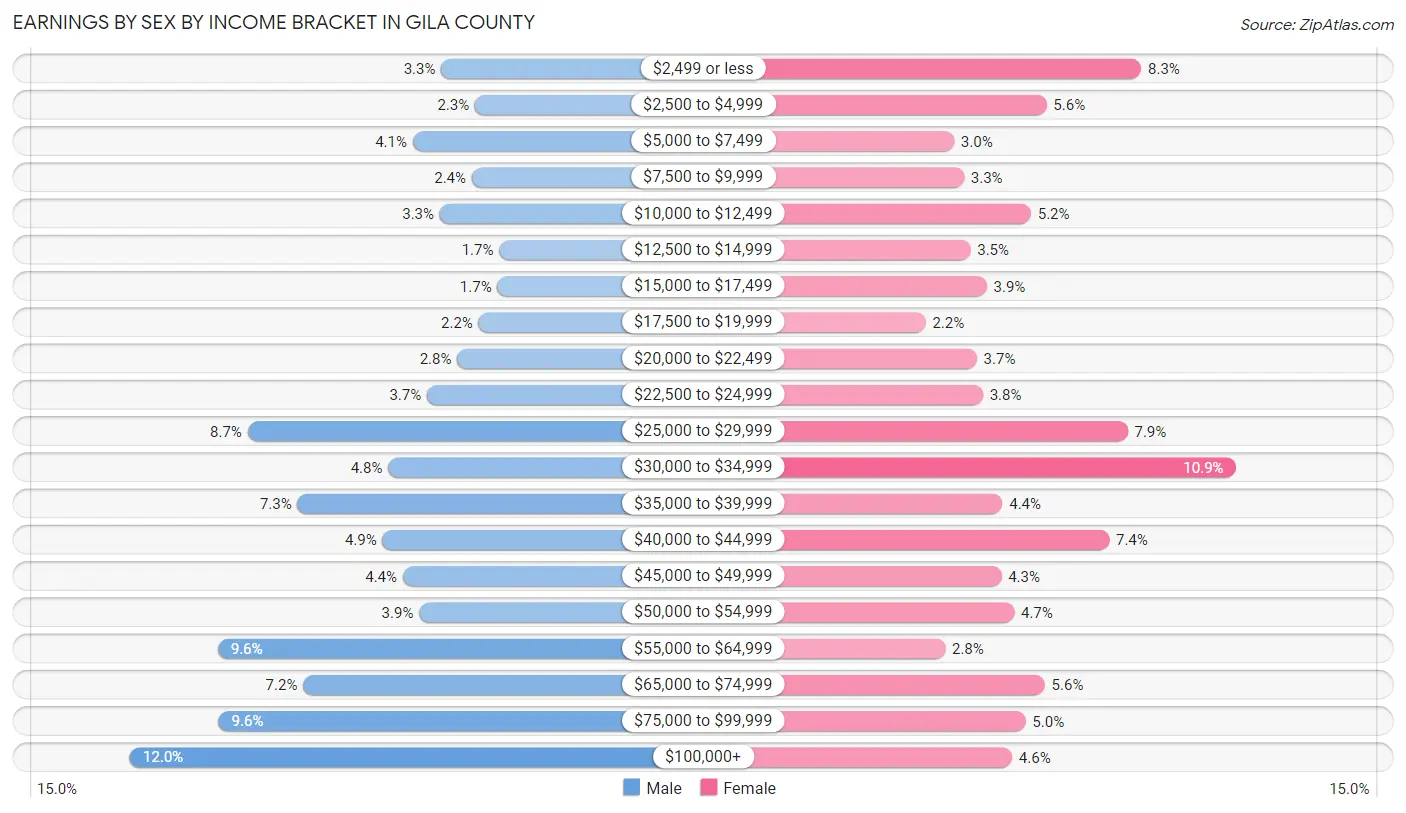
Earnings by Sex by Income Bracket in Gila County
The most common earnings brackets in Gila County are $100,000+ for men (1,325 | 12.0%) and $30,000 to $34,999 for women (1,121 | 10.9%).
| Income | Male | Female |
| $2,499 or less | 362 (3.3%) | 849 (8.3%) |
| $2,500 to $4,999 | 257 (2.3%) | 576 (5.6%) |
| $5,000 to $7,499 | 450 (4.1%) | 309 (3.0%) |
| $7,500 to $9,999 | 267 (2.4%) | 338 (3.3%) |
| $10,000 to $12,499 | 366 (3.3%) | 531 (5.2%) |
| $12,500 to $14,999 | 183 (1.7%) | 356 (3.5%) |
| $15,000 to $17,499 | 188 (1.7%) | 404 (3.9%) |
| $17,500 to $19,999 | 247 (2.2%) | 227 (2.2%) |
| $20,000 to $22,499 | 312 (2.8%) | 375 (3.6%) |
| $22,500 to $24,999 | 406 (3.7%) | 392 (3.8%) |
| $25,000 to $29,999 | 961 (8.7%) | 810 (7.9%) |
| $30,000 to $34,999 | 526 (4.8%) | 1,121 (10.9%) |
| $35,000 to $39,999 | 807 (7.3%) | 449 (4.4%) |
| $40,000 to $44,999 | 544 (4.9%) | 757 (7.4%) |
| $45,000 to $49,999 | 481 (4.4%) | 446 (4.3%) |
| $50,000 to $54,999 | 430 (3.9%) | 483 (4.7%) |
| $55,000 to $64,999 | 1,053 (9.6%) | 283 (2.8%) |
| $65,000 to $74,999 | 789 (7.2%) | 571 (5.6%) |
| $75,000 to $99,999 | 1,051 (9.6%) | 516 (5.0%) |
| $100,000+ | 1,325 (12.0%) | 477 (4.6%) |
| Total | 11,005 (100.0%) | 10,270 (100.0%) |
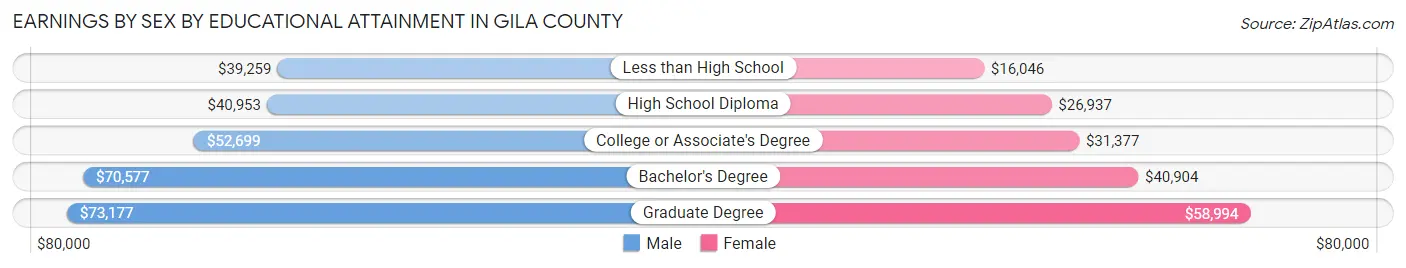
Earnings by Sex by Educational Attainment in Gila County
Average earnings in Gila County are $46,507 for men and $31,145 for women, a difference of 33.0%. Men with an educational attainment of graduate degree enjoy the highest average annual earnings of $73,177, while those with less than high school education earn the least with $39,259. Women with an educational attainment of graduate degree earn the most with the average annual earnings of $58,994, while those with less than high school education have the smallest earnings of $16,046.
| Educational Attainment | Male Income | Female Income |
| Less than High School | $39,259 | $16,046 |
| High School Diploma | $40,953 | $26,937 |
| College or Associate's Degree | $52,699 | $31,377 |
| Bachelor's Degree | $70,577 | $40,904 |
| Graduate Degree | $73,177 | $58,994 |
| Total | $46,507 | $31,145 |
Family Income in Gila County
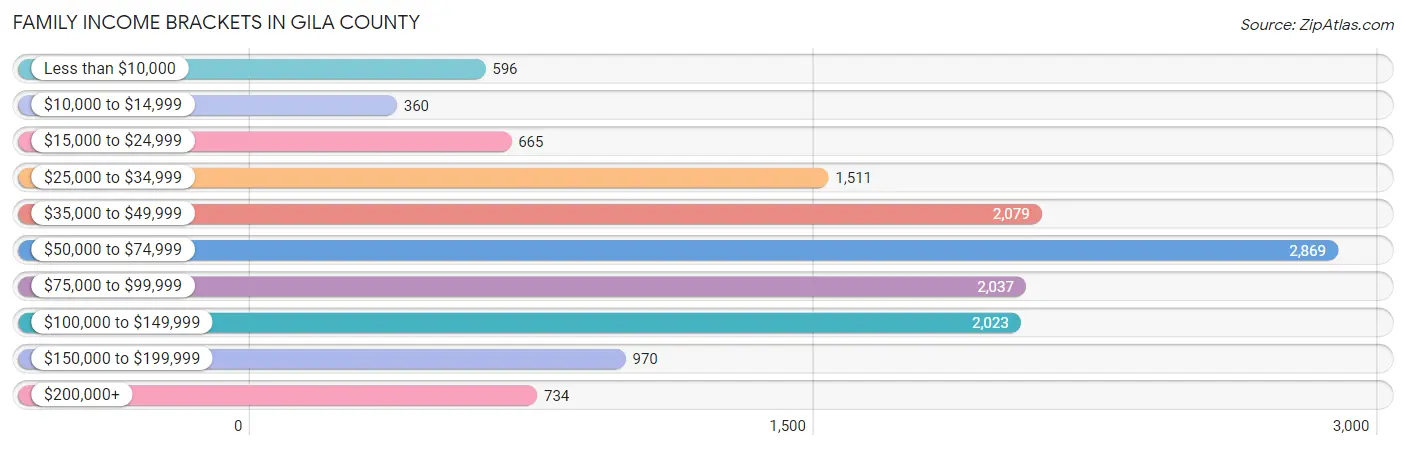
Family Income Brackets in Gila County
According to the Gila County family income data, there are 2,869 families falling into the $50,000 to $74,999 income range, which is the most common income bracket and makes up 20.7% of all families. Conversely, the $10,000 to $14,999 income bracket is the least frequent group with only 360 families (2.6%) belonging to this category.
| Income Bracket | # Families | % Families |
| Less than $10,000 | 596 | 4.3% |
| $10,000 to $14,999 | 360 | 2.6% |
| $15,000 to $24,999 | 665 | 4.8% |
| $25,000 to $34,999 | 1,511 | 10.9% |
| $35,000 to $49,999 | 2,079 | 15.0% |
| $50,000 to $74,999 | 2,869 | 20.7% |
| $75,000 to $99,999 | 2,037 | 14.7% |
| $100,000 to $149,999 | 2,023 | 14.6% |
| $150,000 to $199,999 | 970 | 7.0% |
| $200,000+ | 734 | 5.3% |
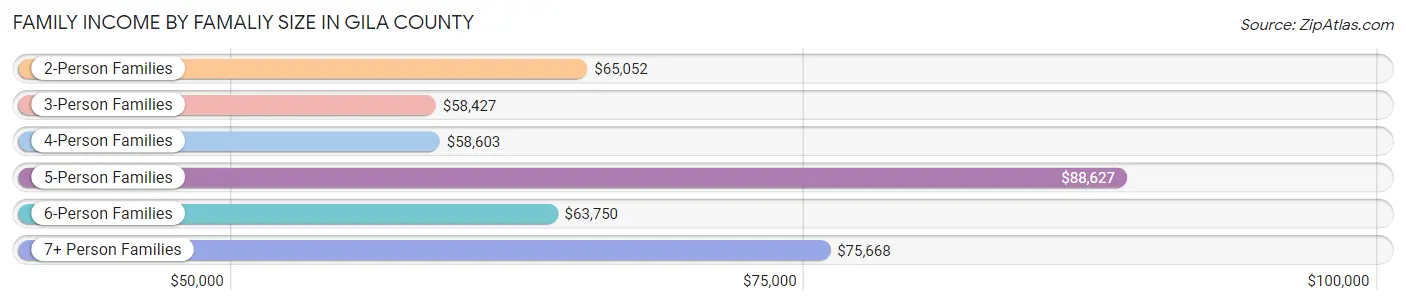
Family Income by Famaliy Size in Gila County
5-person families (888 | 6.4%) account for the highest median family income in Gila County with $88,627 per family, while 2-person families (8,105 | 58.5%) have the highest median income of $32,526 per family member.
| Income Bracket | # Families | Median Income |
| 2-Person Families | 8,105 (58.5%) | $65,052 |
| 3-Person Families | 2,208 (15.9%) | $58,427 |
| 4-Person Families | 1,807 (13.0%) | $58,603 |
| 5-Person Families | 888 (6.4%) | $88,627 |
| 6-Person Families | 383 (2.8%) | $63,750 |
| 7+ Person Families | 467 (3.4%) | $75,668 |
| Total | 13,858 (100.0%) | $64,786 |
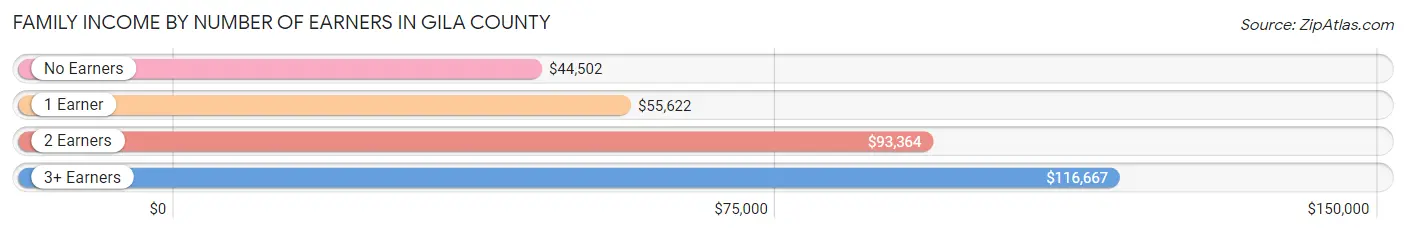
Family Income by Number of Earners in Gila County
The median family income in Gila County is $64,786, with families comprising 3+ earners (1,054) having the highest median family income of $116,667, while families with no earners (4,553) have the lowest median family income of $44,502, accounting for 7.6% and 32.9% of families, respectively.
| Number of Earners | # Families | Median Income |
| No Earners | 4,553 (32.9%) | $44,502 |
| 1 Earner | 4,066 (29.3%) | $55,622 |
| 2 Earners | 4,185 (30.2%) | $93,364 |
| 3+ Earners | 1,054 (7.6%) | $116,667 |
| Total | 13,858 (100.0%) | $64,786 |
Household Income in Gila County
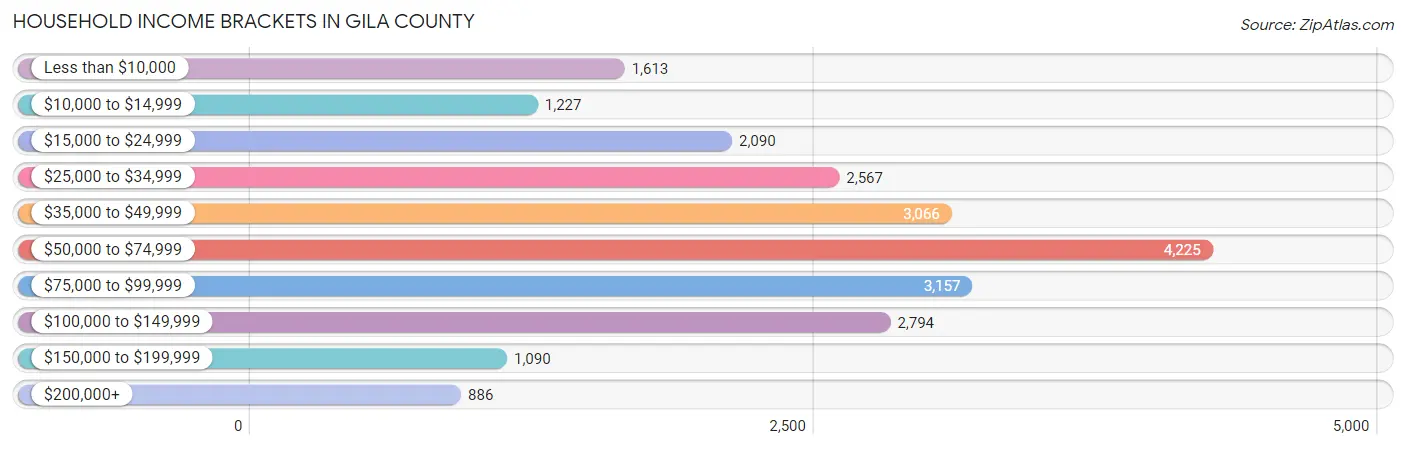
Household Income Brackets in Gila County
With 4,225 households falling in the category, the $50,000 to $74,999 income range is the most frequent in Gila County, accounting for 18.6% of all households. In contrast, only 886 households (3.9%) fall into the $200,000+ income bracket, making it the least populous group.
| Income Bracket | # Households | % Households |
| Less than $10,000 | 1,613 | 7.1% |
| $10,000 to $14,999 | 1,227 | 5.4% |
| $15,000 to $24,999 | 2,090 | 9.2% |
| $25,000 to $34,999 | 2,567 | 11.3% |
| $35,000 to $49,999 | 3,066 | 13.5% |
| $50,000 to $74,999 | 4,225 | 18.6% |
| $75,000 to $99,999 | 3,157 | 13.9% |
| $100,000 to $149,999 | 2,794 | 12.3% |
| $150,000 to $199,999 | 1,090 | 4.8% |
| $200,000+ | 886 | 3.9% |
Household Income by Householder Age in Gila County
The median household income in Gila County is $55,242, with the highest median household income of $71,365 found in the 25 to 44 years age bracket for the primary householder. A total of 4,031 households (17.7%) fall into this category. Meanwhile, the 65+ years age bracket for the primary householder has the lowest median household income of $44,495, with 10,510 households (46.3%) in this group.
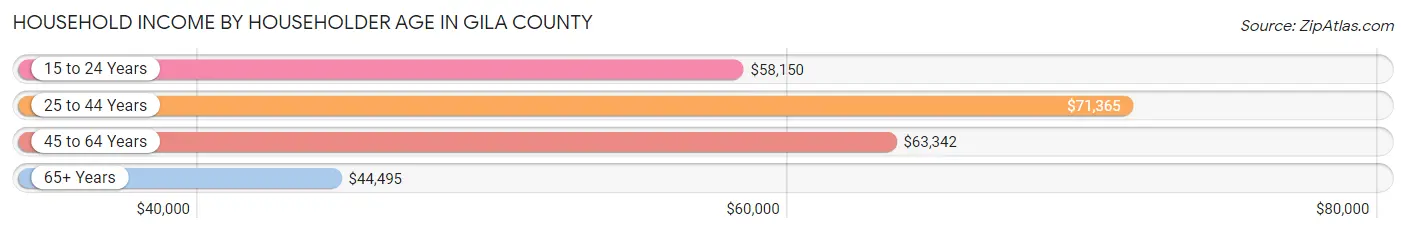
| Income Bracket | # Households | Median Income |
| 15 to 24 Years | 583 (2.6%) | $58,150 |
| 25 to 44 Years | 4,031 (17.7%) | $71,365 |
| 45 to 64 Years | 7,590 (33.4%) | $63,342 |
| 65+ Years | 10,510 (46.3%) | $44,495 |
| Total | 22,714 (100.0%) | $55,242 |
Poverty in Gila County
Income Below Poverty by Sex and Age in Gila County
With 17.2% poverty level for males and 20.8% for females among the residents of Gila County, 16 and 17 year old males and 16 and 17 year old females are the most vulnerable to poverty, with 215 males (42.1%) and 250 females (45.4%) in their respective age groups living below the poverty level.
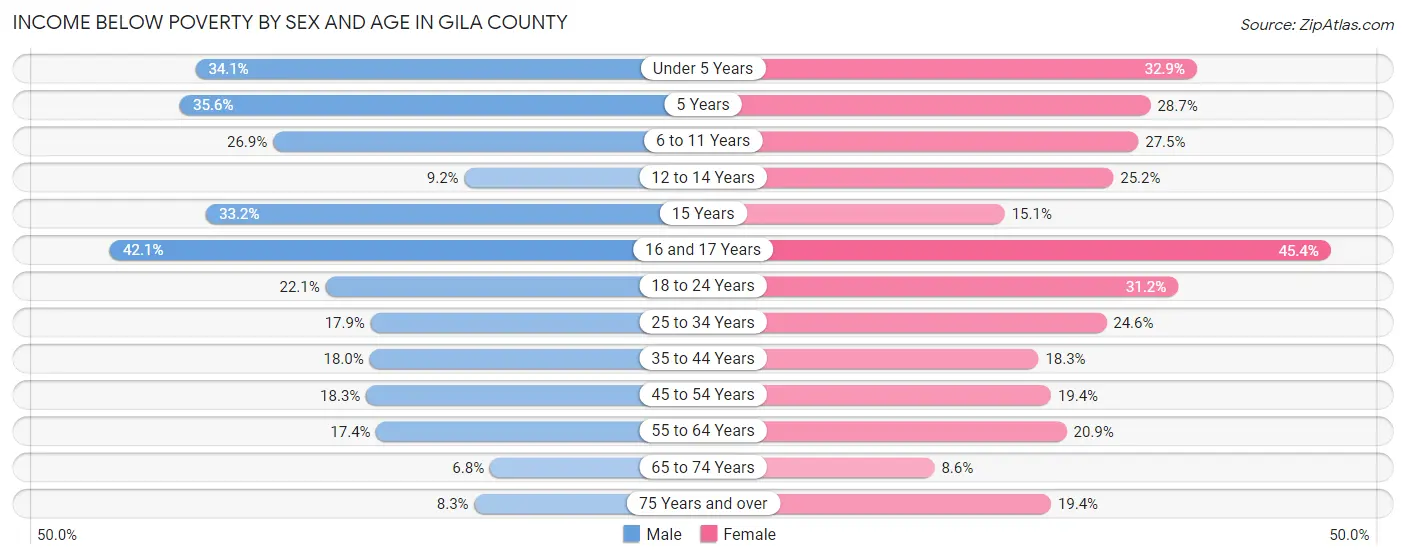
| Age Bracket | Male | Female |
| Under 5 Years | 425 (34.1%) | 395 (32.9%) |
| 5 Years | 69 (35.6%) | 102 (28.6%) |
| 6 to 11 Years | 572 (26.9%) | 475 (27.5%) |
| 12 to 14 Years | 66 (9.2%) | 190 (25.2%) |
| 15 Years | 128 (33.2%) | 49 (15.1%) |
| 16 and 17 Years | 215 (42.1%) | 250 (45.4%) |
| 18 to 24 Years | 380 (22.1%) | 503 (31.2%) |
| 25 to 34 Years | 440 (17.9%) | 627 (24.5%) |
| 35 to 44 Years | 434 (18.0%) | 437 (18.2%) |
| 45 to 54 Years | 460 (18.3%) | 523 (19.4%) |
| 55 to 64 Years | 686 (17.3%) | 891 (20.9%) |
| 65 to 74 Years | 311 (6.8%) | 396 (8.6%) |
| 75 Years and over | 253 (8.3%) | 633 (19.4%) |
| Total | 4,439 (17.2%) | 5,471 (20.8%) |
Income Above Poverty by Sex and Age in Gila County
According to the poverty statistics in Gila County, males aged 65 to 74 years and females aged 65 to 74 years are the age groups that are most secure financially, with 93.2% of males and 91.4% of females in these age groups living above the poverty line.
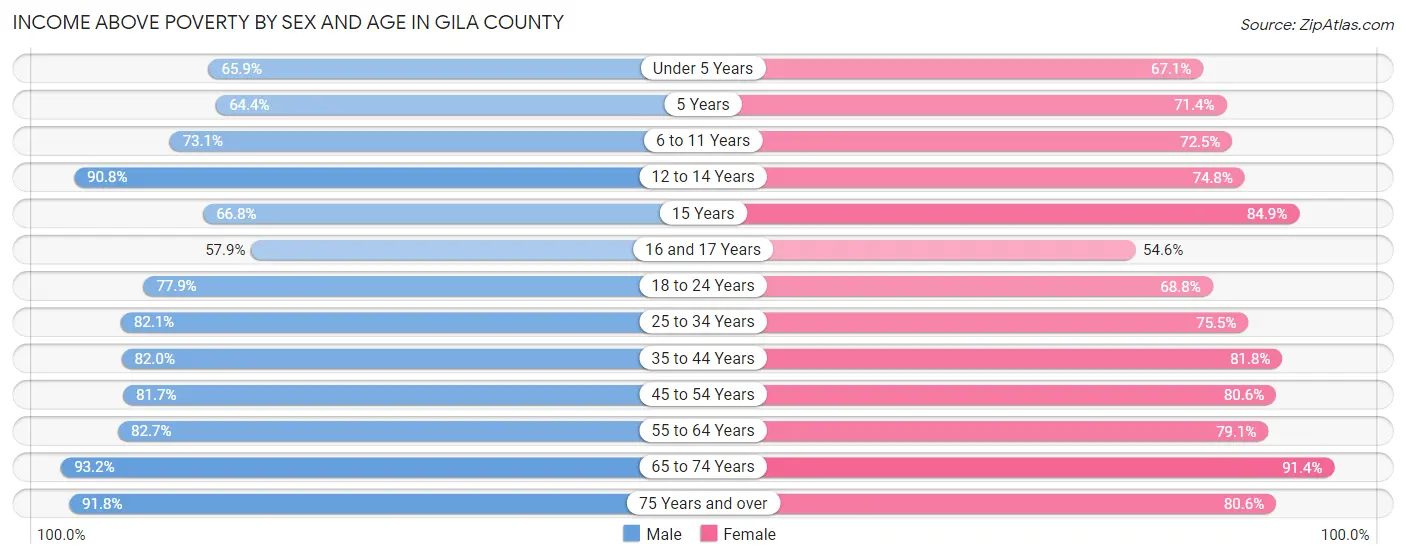
| Age Bracket | Male | Female |
| Under 5 Years | 820 (65.9%) | 804 (67.1%) |
| 5 Years | 125 (64.4%) | 254 (71.4%) |
| 6 to 11 Years | 1,551 (73.1%) | 1,251 (72.5%) |
| 12 to 14 Years | 653 (90.8%) | 564 (74.8%) |
| 15 Years | 258 (66.8%) | 275 (84.9%) |
| 16 and 17 Years | 296 (57.9%) | 301 (54.6%) |
| 18 to 24 Years | 1,342 (77.9%) | 1,109 (68.8%) |
| 25 to 34 Years | 2,021 (82.1%) | 1,927 (75.4%) |
| 35 to 44 Years | 1,978 (82.0%) | 1,958 (81.8%) |
| 45 to 54 Years | 2,053 (81.7%) | 2,172 (80.6%) |
| 55 to 64 Years | 3,268 (82.7%) | 3,381 (79.1%) |
| 65 to 74 Years | 4,257 (93.2%) | 4,208 (91.4%) |
| 75 Years and over | 2,812 (91.7%) | 2,628 (80.6%) |
| Total | 21,434 (82.8%) | 20,832 (79.2%) |
Income Below Poverty Among Married-Couple Families in Gila County
The poverty statistics for married-couple families in Gila County show that 6.3% or 657 of the total 10,458 families live below the poverty line. Families with 3 or 4 children have the highest poverty rate of 12.5%, comprising of 78 families. On the other hand, families with 5 or more children have the lowest poverty rate of 0.0%, which includes 0 families.
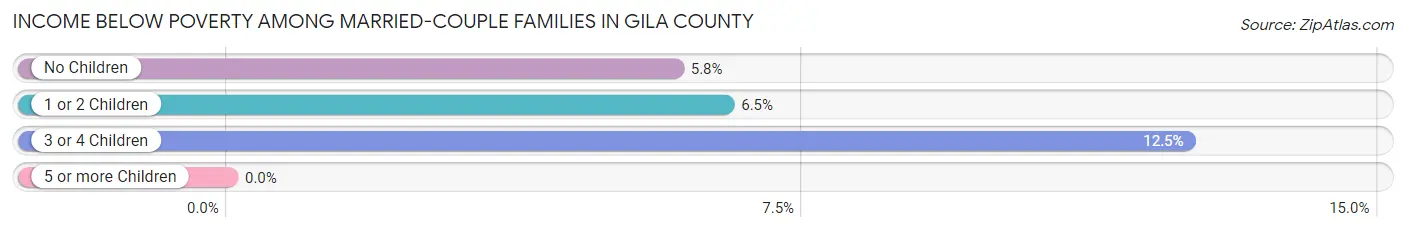
| Children | Above Poverty | Below Poverty |
| No Children | 7,057 (94.2%) | 436 (5.8%) |
| 1 or 2 Children | 2,065 (93.5%) | 143 (6.5%) |
| 3 or 4 Children | 546 (87.5%) | 78 (12.5%) |
| 5 or more Children | 133 (100.0%) | 0 (0.0%) |
| Total | 9,801 (93.7%) | 657 (6.3%) |
Income Below Poverty Among Single-Parent Households in Gila County
According to the poverty data in Gila County, 21.4% or 207 single-father households and 36.1% or 879 single-mother households are living below the poverty line. Among single-father households, those with 5 or more children have the highest poverty rate, with 8 households (100.0%) experiencing poverty. Likewise, among single-mother households, those with 5 or more children have the highest poverty rate, with 99 households (76.7%) falling below the poverty line.
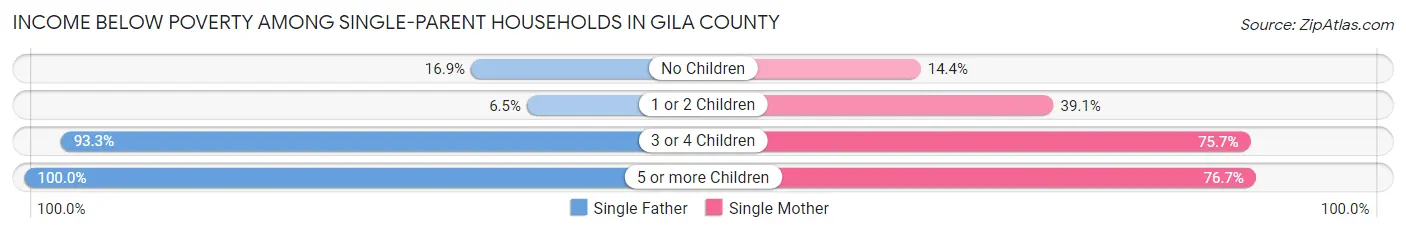
| Children | Single Father | Single Mother |
| No Children | 97 (16.9%) | 137 (14.4%) |
| 1 or 2 Children | 19 (6.5%) | 406 (39.1%) |
| 3 or 4 Children | 83 (93.3%) | 237 (75.7%) |
| 5 or more Children | 8 (100.0%) | 99 (76.7%) |
| Total | 207 (21.4%) | 879 (36.1%) |
Income Below Poverty Among Married-Couple vs Single-Parent Households in Gila County
The poverty data for Gila County shows that 657 of the married-couple family households (6.3%) and 1,086 of the single-parent households (31.9%) are living below the poverty level. Within the married-couple family households, those with 3 or 4 children have the highest poverty rate, with 78 households (12.5%) falling below the poverty line. Among the single-parent households, those with 3 or 4 children have the highest poverty rate, with 320 household (79.6%) living below poverty.
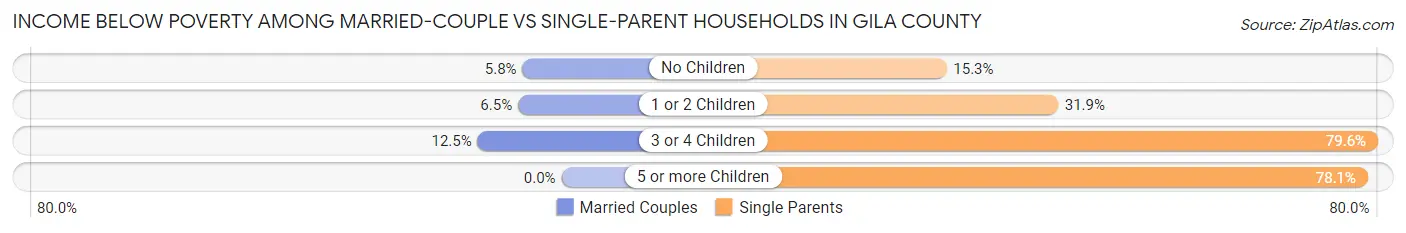
| Children | Married-Couple Families | Single-Parent Households |
| No Children | 436 (5.8%) | 234 (15.3%) |
| 1 or 2 Children | 143 (6.5%) | 425 (31.9%) |
| 3 or 4 Children | 78 (12.5%) | 320 (79.6%) |
| 5 or more Children | 0 (0.0%) | 107 (78.1%) |
| Total | 657 (6.3%) | 1,086 (31.9%) |
Race in Gila County
The most populous races in Gila County are White / Caucasian (37,037 | 69.3%), Hispanic or Latino (10,276 | 19.2%), and Native / Alaskan (8,433 | 15.8%).
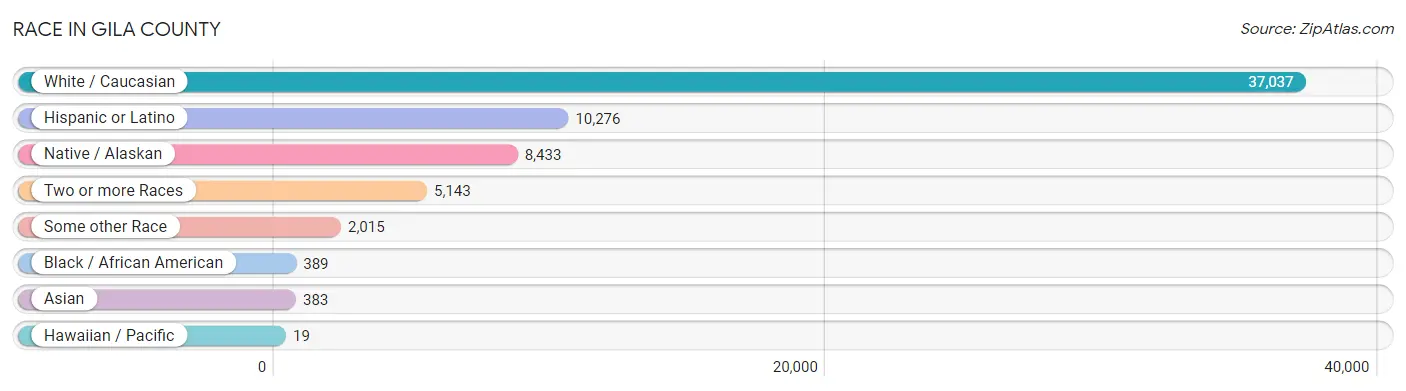
| Race | # Population | % Population |
| Asian | 383 | 0.7% |
| Black / African American | 389 | 0.7% |
| Hawaiian / Pacific | 19 | 0.0% |
| Hispanic or Latino | 10,276 | 19.2% |
| Native / Alaskan | 8,433 | 15.8% |
| White / Caucasian | 37,037 | 69.3% |
| Two or more Races | 5,143 | 9.6% |
| Some other Race | 2,015 | 3.8% |
| Total | 53,419 | 100.0% |
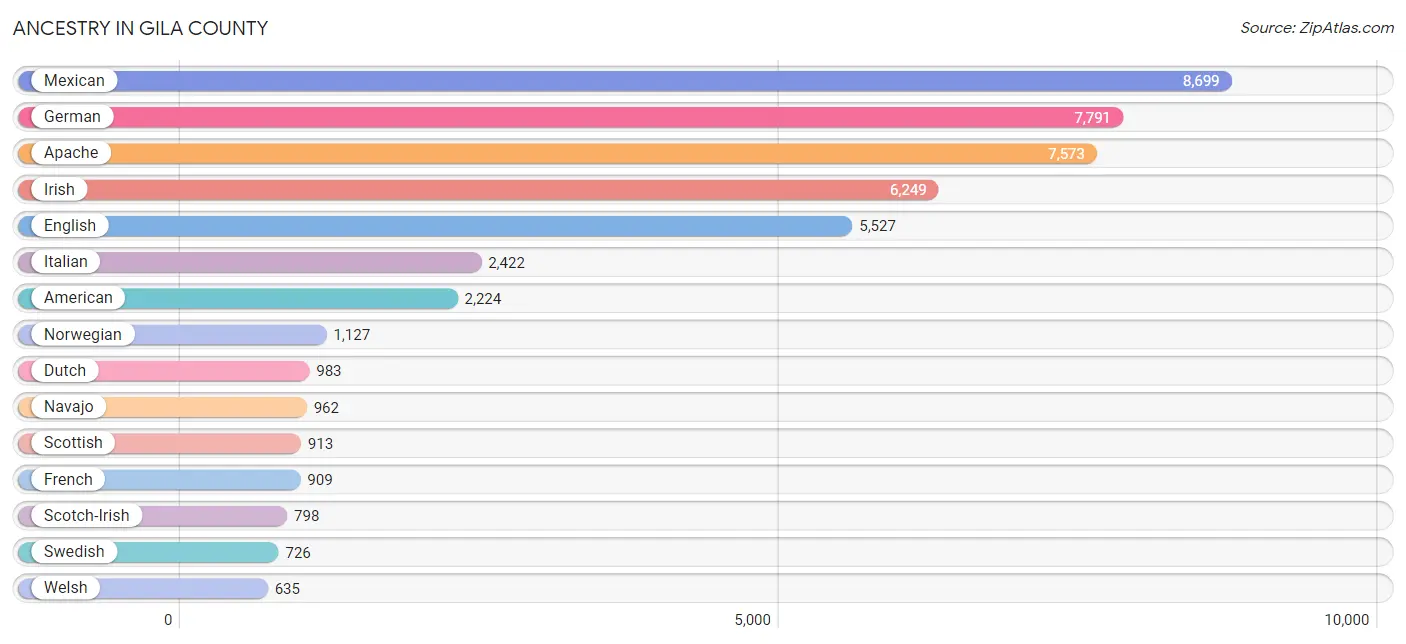
Ancestry in Gila County
The most populous ancestries reported in Gila County are Mexican (8,699 | 16.3%), German (7,791 | 14.6%), Apache (7,573 | 14.2%), Irish (6,249 | 11.7%), and English (5,527 | 10.3%), together accounting for 67.1% of all Gila County residents.
| Ancestry | # Population | % Population |
| African | 21 | 0.0% |
| American | 2,224 | 4.2% |
| Apache | 7,573 | 14.2% |
| Arab | 19 | 0.0% |
| Arapaho | 35 | 0.1% |
| Assyrian / Chaldean / Syriac | 36 | 0.1% |
| Australian | 11 | 0.0% |
| Austrian | 40 | 0.1% |
| Belgian | 47 | 0.1% |
| Bhutanese | 54 | 0.1% |
| Blackfeet | 116 | 0.2% |
| Brazilian | 13 | 0.0% |
| British | 277 | 0.5% |
| Burmese | 59 | 0.1% |
| Canadian | 99 | 0.2% |
| Celtic | 16 | 0.0% |
| Central American | 159 | 0.3% |
| Central American Indian | 8 | 0.0% |
| Cherokee | 287 | 0.5% |
| Chippewa | 13 | 0.0% |
| Choctaw | 8 | 0.0% |
| Colombian | 27 | 0.1% |
| Croatian | 55 | 0.1% |
| Cuban | 187 | 0.4% |
| Czech | 197 | 0.4% |
| Czechoslovakian | 15 | 0.0% |
| Danish | 246 | 0.5% |
| Dutch | 983 | 1.8% |
| Dutch West Indian | 11 | 0.0% |
| Eastern European | 28 | 0.1% |
| English | 5,527 | 10.3% |
| European | 556 | 1.0% |
| Finnish | 135 | 0.3% |
| French | 909 | 1.7% |
| French Canadian | 312 | 0.6% |
| German | 7,791 | 14.6% |
| Greek | 164 | 0.3% |
| Guatemalan | 101 | 0.2% |
| Honduran | 21 | 0.0% |
| Hopi | 113 | 0.2% |
| Hungarian | 107 | 0.2% |
| Indian (Asian) | 28 | 0.1% |
| Irish | 6,249 | 11.7% |
| Italian | 2,422 | 4.5% |
| Jamaican | 26 | 0.1% |
| Japanese | 125 | 0.2% |
| Korean | 183 | 0.3% |
| Laotian | 50 | 0.1% |
| Lithuanian | 112 | 0.2% |
| Mexican | 8,699 | 16.3% |
| Mexican American Indian | 145 | 0.3% |
| Native Hawaiian | 71 | 0.1% |
| Navajo | 962 | 1.8% |
| Nigerian | 18 | 0.0% |
| Northern European | 40 | 0.1% |
| Norwegian | 1,127 | 2.1% |
| Panamanian | 37 | 0.1% |
| Pennsylvania German | 9 | 0.0% |
| Pima | 71 | 0.1% |
| Polish | 485 | 0.9% |
| Portuguese | 176 | 0.3% |
| Pueblo | 242 | 0.4% |
| Puerto Rican | 77 | 0.1% |
| Romanian | 73 | 0.1% |
| Russian | 100 | 0.2% |
| Samoan | 15 | 0.0% |
| Scandinavian | 393 | 0.7% |
| Scotch-Irish | 798 | 1.5% |
| Scottish | 913 | 1.7% |
| Serbian | 68 | 0.1% |
| Sioux | 108 | 0.2% |
| Slavic | 9 | 0.0% |
| Slovak | 23 | 0.0% |
| Slovene | 13 | 0.0% |
| South African | 16 | 0.0% |
| South American | 33 | 0.1% |
| Spaniard | 177 | 0.3% |
| Spanish | 460 | 0.9% |
| Spanish American | 33 | 0.1% |
| Sri Lankan | 34 | 0.1% |
| Subsaharan African | 55 | 0.1% |
| Swedish | 726 | 1.4% |
| Swiss | 159 | 0.3% |
| Thai | 41 | 0.1% |
| Tlingit-Haida | 66 | 0.1% |
| Tohono O'Odham | 50 | 0.1% |
| Turkish | 86 | 0.2% |
| Ukrainian | 74 | 0.1% |
| Venezuelan | 6 | 0.0% |
| Welsh | 635 | 1.2% |
| Yaqui | 24 | 0.0% |
| Yugoslavian | 25 | 0.1% | View All 92 Rows |
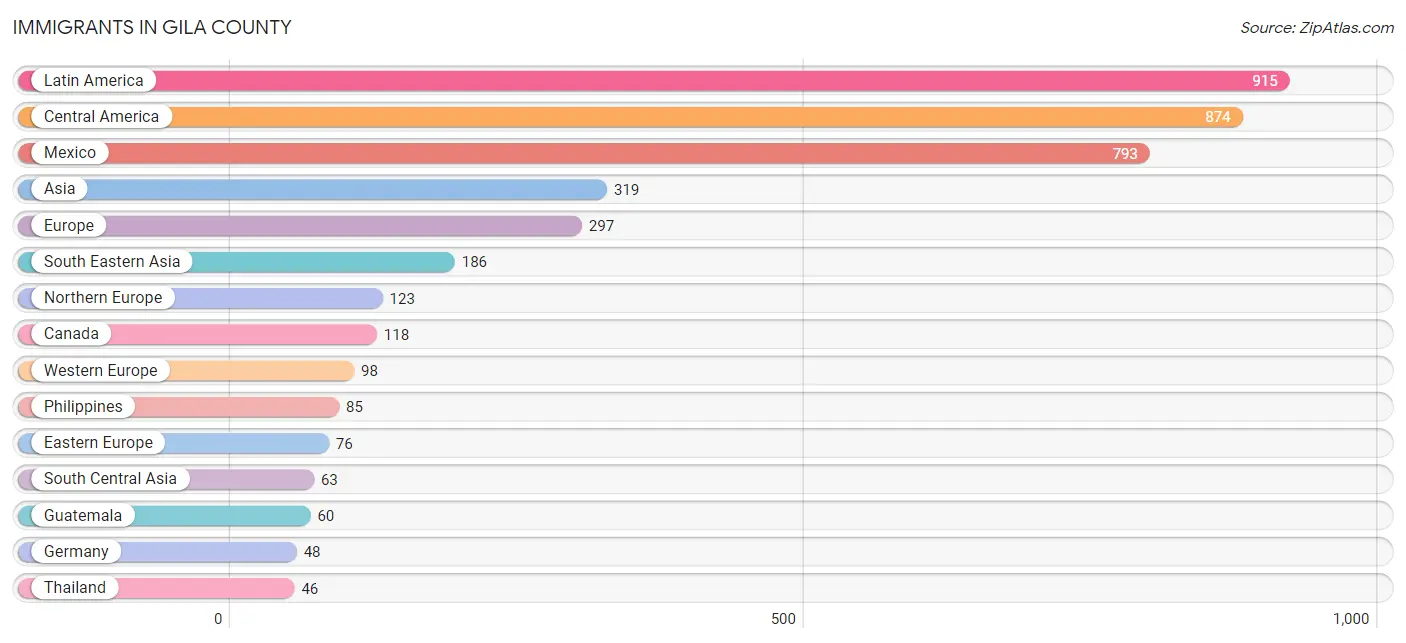
Immigrants in Gila County
The most numerous immigrant groups reported in Gila County came from Latin America (915 | 1.7%), Central America (874 | 1.6%), Mexico (793 | 1.5%), Asia (319 | 0.6%), and Europe (297 | 0.6%), together accounting for 6.0% of all Gila County residents.
| Immigration Origin | # Population | % Population |
| Africa | 29 | 0.1% |
| Asia | 319 | 0.6% |
| Cambodia | 40 | 0.1% |
| Canada | 118 | 0.2% |
| Caribbean | 23 | 0.0% |
| Central America | 874 | 1.6% |
| Eastern Asia | 34 | 0.1% |
| Eastern Europe | 76 | 0.1% |
| England | 41 | 0.1% |
| Europe | 297 | 0.6% |
| Germany | 48 | 0.1% |
| Guatemala | 60 | 0.1% |
| Guyana | 17 | 0.0% |
| Honduras | 21 | 0.0% |
| Hungary | 5 | 0.0% |
| India | 41 | 0.1% |
| Indonesia | 15 | 0.0% |
| Iran | 22 | 0.0% |
| Ireland | 17 | 0.0% |
| Jamaica | 17 | 0.0% |
| Japan | 23 | 0.0% |
| Jordan | 36 | 0.1% |
| Korea | 11 | 0.0% |
| Latin America | 915 | 1.7% |
| Mexico | 793 | 1.5% |
| Netherlands | 29 | 0.1% |
| Northern Europe | 123 | 0.2% |
| Philippines | 85 | 0.2% |
| Romania | 15 | 0.0% |
| Russia | 16 | 0.0% |
| South Africa | 29 | 0.1% |
| South America | 18 | 0.0% |
| South Central Asia | 63 | 0.1% |
| South Eastern Asia | 186 | 0.4% |
| Sweden | 10 | 0.0% |
| Switzerland | 21 | 0.0% |
| Thailand | 46 | 0.1% |
| Ukraine | 40 | 0.1% |
| Venezuela | 1 | 0.0% |
| West Indies | 6 | 0.0% |
| Western Asia | 36 | 0.1% |
| Western Europe | 98 | 0.2% | View All 42 Rows |
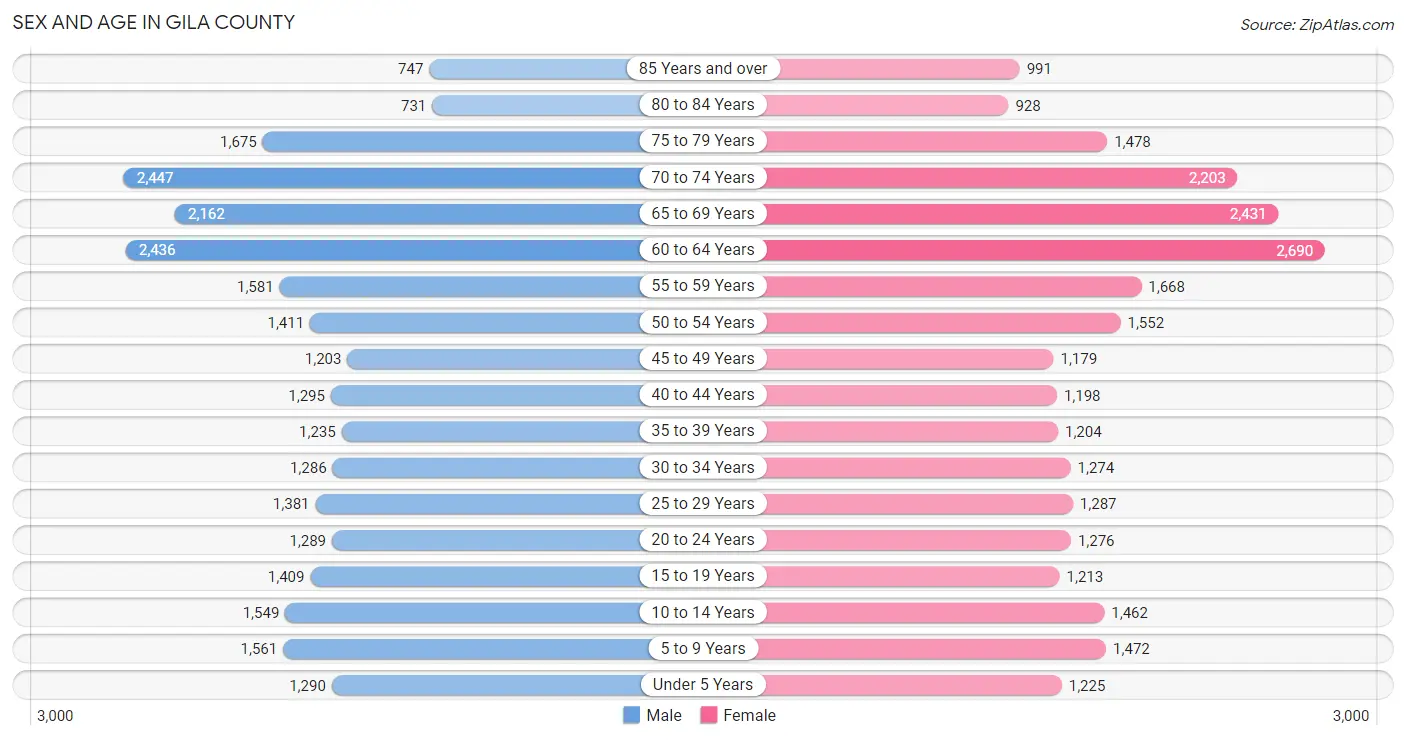
Sex and Age in Gila County
Sex and Age in Gila County
The most populous age groups in Gila County are 70 to 74 Years (2,447 | 9.2%) for men and 60 to 64 Years (2,690 | 10.1%) for women.
| Age Bracket | Male | Female |
| Under 5 Years | 1,290 (4.8%) | 1,225 (4.6%) |
| 5 to 9 Years | 1,561 (5.9%) | 1,472 (5.5%) |
| 10 to 14 Years | 1,549 (5.8%) | 1,462 (5.5%) |
| 15 to 19 Years | 1,409 (5.3%) | 1,213 (4.5%) |
| 20 to 24 Years | 1,289 (4.8%) | 1,276 (4.8%) |
| 25 to 29 Years | 1,381 (5.2%) | 1,287 (4.8%) |
| 30 to 34 Years | 1,286 (4.8%) | 1,274 (4.8%) |
| 35 to 39 Years | 1,235 (4.6%) | 1,204 (4.5%) |
| 40 to 44 Years | 1,295 (4.9%) | 1,198 (4.5%) |
| 45 to 49 Years | 1,203 (4.5%) | 1,179 (4.4%) |
| 50 to 54 Years | 1,411 (5.3%) | 1,552 (5.8%) |
| 55 to 59 Years | 1,581 (5.9%) | 1,668 (6.2%) |
| 60 to 64 Years | 2,436 (9.1%) | 2,690 (10.1%) |
| 65 to 69 Years | 2,162 (8.1%) | 2,431 (9.1%) |
| 70 to 74 Years | 2,447 (9.2%) | 2,203 (8.2%) |
| 75 to 79 Years | 1,675 (6.3%) | 1,478 (5.5%) |
| 80 to 84 Years | 731 (2.7%) | 928 (3.5%) |
| 85 Years and over | 747 (2.8%) | 991 (3.7%) |
| Total | 26,688 (100.0%) | 26,731 (100.0%) |
Families and Households in Gila County
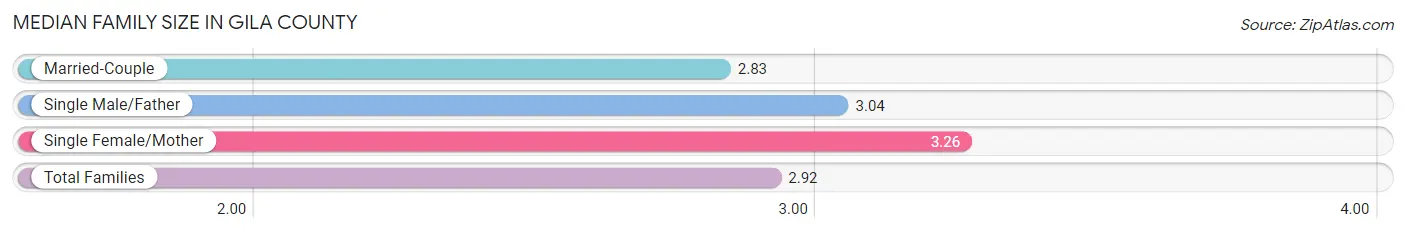
Median Family Size in Gila County
The median family size in Gila County is 2.92 persons per family, with single female/mother families (2,434 | 17.6%) accounting for the largest median family size of 3.26 persons per family. On the other hand, married-couple families (10,458 | 75.5%) represent the smallest median family size with 2.83 persons per family.
| Family Type | # Families | Family Size |
| Married-Couple | 10,458 (75.5%) | 2.83 |
| Single Male/Father | 966 (7.0%) | 3.04 |
| Single Female/Mother | 2,434 (17.6%) | 3.26 |
| Total Families | 13,858 (100.0%) | 2.92 |
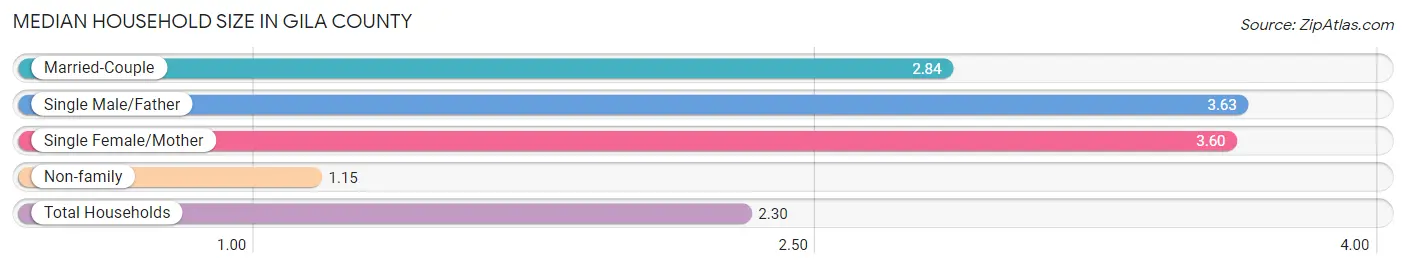
Median Household Size in Gila County
The median household size in Gila County is 2.30 persons per household, with single male/father households (966 | 4.3%) accounting for the largest median household size of 3.63 persons per household. non-family households (8,856 | 39.0%) represent the smallest median household size with 1.15 persons per household.
| Household Type | # Households | Household Size |
| Married-Couple | 10,458 (46.0%) | 2.84 |
| Single Male/Father | 966 (4.3%) | 3.63 |
| Single Female/Mother | 2,434 (10.7%) | 3.60 |
| Non-family | 8,856 (39.0%) | 1.15 |
| Total Households | 22,714 (100.0%) | 2.30 |
Household Size by Marriage Status in Gila County
Out of a total of 22,714 households in Gila County, 13,858 (61.0%) are family households, while 8,856 (39.0%) are nonfamily households. The most numerous type of family households are 2-person households, comprising 7,559, and the most common type of nonfamily households are 1-person households, comprising 7,504.
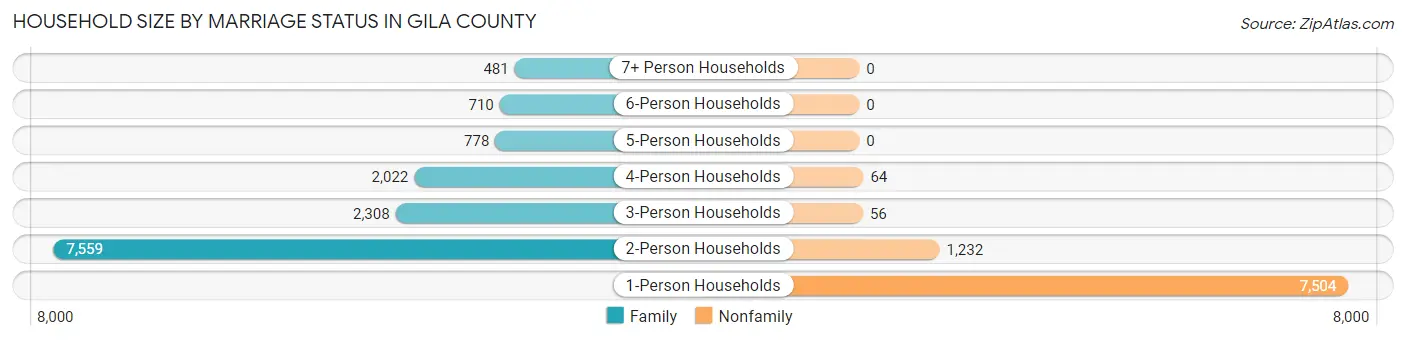
| Household Size | Family Households | Nonfamily Households |
| 1-Person Households | - | 7,504 (33.0%) |
| 2-Person Households | 7,559 (33.3%) | 1,232 (5.4%) |
| 3-Person Households | 2,308 (10.2%) | 56 (0.3%) |
| 4-Person Households | 2,022 (8.9%) | 64 (0.3%) |
| 5-Person Households | 778 (3.4%) | 0 (0.0%) |
| 6-Person Households | 710 (3.1%) | 0 (0.0%) |
| 7+ Person Households | 481 (2.1%) | 0 (0.0%) |
| Total | 13,858 (61.0%) | 8,856 (39.0%) |
Female Fertility in Gila County
Fertility by Age in Gila County
Average fertility rate in Gila County is 67.0 births per 1,000 women. Women in the age bracket of 20 to 34 years have the highest fertility rate with 142.0 births per 1,000 women. Women in the age bracket of 20 to 34 years acount for 90.7% of all women with births.
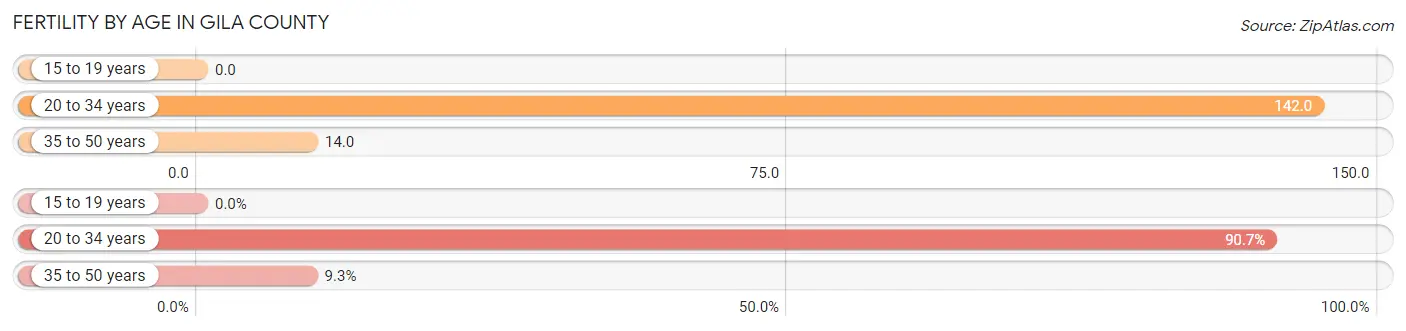
| Age Bracket | Women with Births | Births / 1,000 Women |
| 15 to 19 years | 0 (0.0%) | 0.0 |
| 20 to 34 years | 546 (90.7%) | 142.0 |
| 35 to 50 years | 56 (9.3%) | 14.0 |
| Total | 602 (100.0%) | 67.0 |
Fertility by Age by Marriage Status in Gila County
45.5% of women with births (602) in Gila County are married. The highest percentage of unmarried women with births falls into 20 to 34 years age bracket with 60.1% of them unmarried at the time of birth, while the lowest percentage of unmarried women with births belong to 35 to 50 years age bracket with 0.0% of them unmarried.
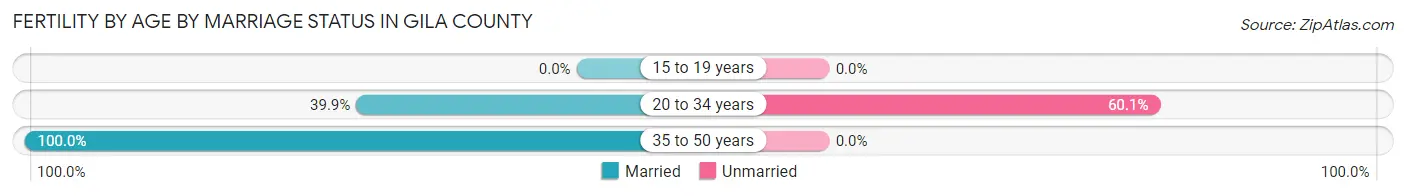
| Age Bracket | Married | Unmarried |
| 15 to 19 years | 0 (0.0%) | 0 (0.0%) |
| 20 to 34 years | 218 (39.9%) | 328 (60.1%) |
| 35 to 50 years | 56 (100.0%) | 0 (0.0%) |
| Total | 274 (45.5%) | 328 (54.5%) |
Fertility by Education in Gila County
Average fertility rate in Gila County is 67.0 births per 1,000 women. Women with the education attainment of high school diploma have the highest fertility rate of 125.0 births per 1,000 women, while women with the education attainment of less than high school have the lowest fertility at 26.0 births per 1,000 women. Women with the education attainment of high school diploma represent 50.0% of all women with births.
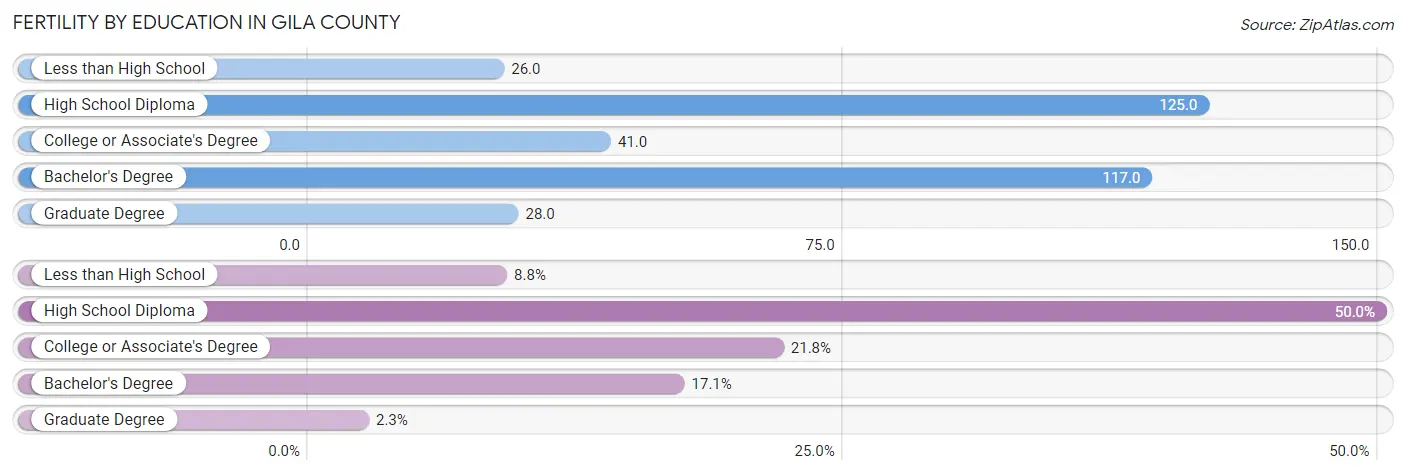
| Educational Attainment | Women with Births | Births / 1,000 Women |
| Less than High School | 53 (8.8%) | 26.0 |
| High School Diploma | 301 (50.0%) | 125.0 |
| College or Associate's Degree | 131 (21.8%) | 41.0 |
| Bachelor's Degree | 103 (17.1%) | 117.0 |
| Graduate Degree | 14 (2.3%) | 28.0 |
| Total | 602 (100.0%) | 67.0 |
Fertility by Education by Marriage Status in Gila County
54.5% of women with births in Gila County are unmarried. Women with the educational attainment of graduate degree are most likely to be married with 100.0% of them married at childbirth, while women with the educational attainment of high school diploma are least likely to be married with 73.1% of them unmarried at childbirth.
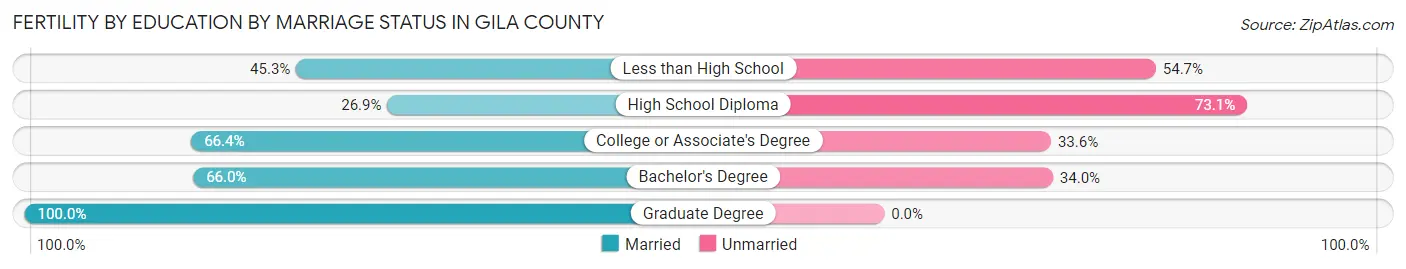
| Educational Attainment | Married | Unmarried |
| Less than High School | 24 (45.3%) | 29 (54.7%) |
| High School Diploma | 81 (26.9%) | 220 (73.1%) |
| College or Associate's Degree | 87 (66.4%) | 44 (33.6%) |
| Bachelor's Degree | 68 (66.0%) | 35 (34.0%) |
| Graduate Degree | 14 (100.0%) | 0 (0.0%) |
| Total | 274 (45.5%) | 328 (54.5%) |
Employment Characteristics in Gila County
Employment by Class of Employer in Gila County
Among the 18,434 employed individuals in Gila County, private company employees (10,602 | 57.5%), local government employees (2,487 | 13.5%), and state government employees (1,476 | 8.0%) make up the most common classes of employment.
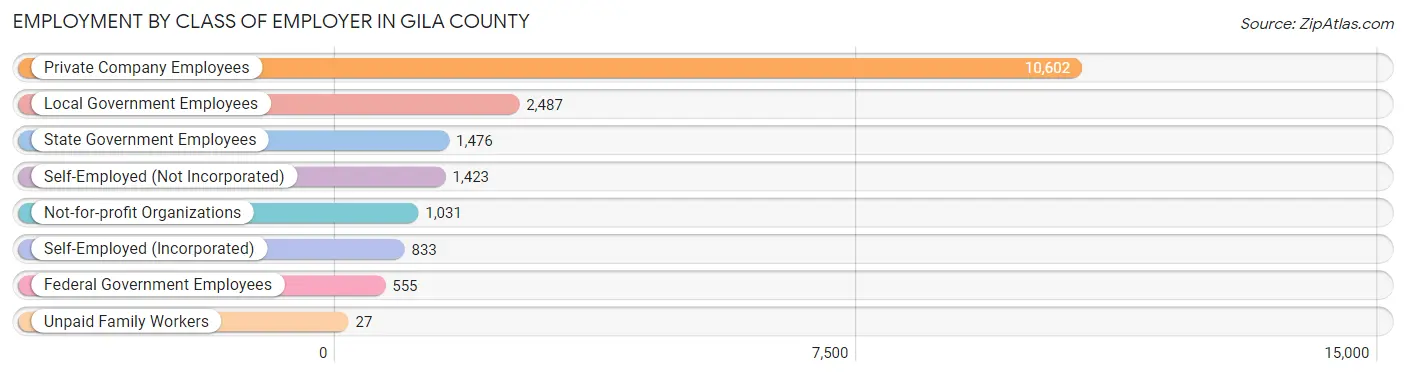
| Employer Class | # Employees | % Employees |
| Private Company Employees | 10,602 | 57.5% |
| Self-Employed (Incorporated) | 833 | 4.5% |
| Self-Employed (Not Incorporated) | 1,423 | 7.7% |
| Not-for-profit Organizations | 1,031 | 5.6% |
| Local Government Employees | 2,487 | 13.5% |
| State Government Employees | 1,476 | 8.0% |
| Federal Government Employees | 555 | 3.0% |
| Unpaid Family Workers | 27 | 0.2% |
| Total | 18,434 | 100.0% |
Employment Status by Age in Gila County
According to the labor force statistics for Gila County, out of the total population over 16 years of age (44,145), 45.7% or 20,174 individuals are in the labor force, with 6.9% or 1,392 of them unemployed. The age group with the highest labor force participation rate is 25 to 29 years, with 78.7% or 2,100 individuals in the labor force. Within the labor force, the 16 to 19 years age range has the highest percentage of unemployed individuals, with 22.1% or 133 of them being unemployed.
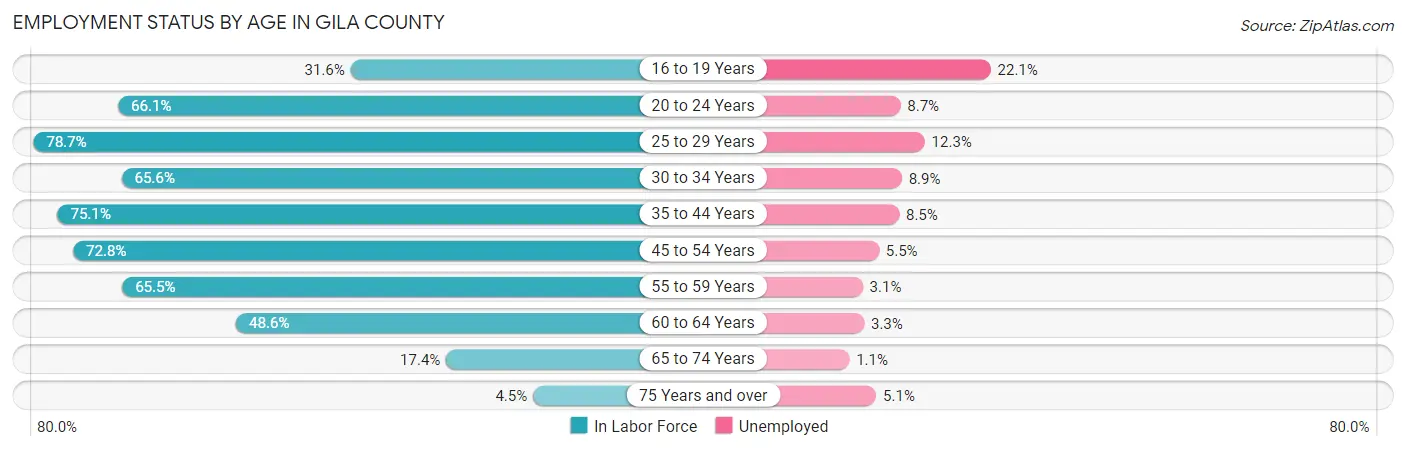
| Age Bracket | In Labor Force | Unemployed |
| 16 to 19 Years | 603 (31.6%) | 133 (22.1%) |
| 20 to 24 Years | 1,695 (66.1%) | 147 (8.7%) |
| 25 to 29 Years | 2,100 (78.7%) | 258 (12.3%) |
| 30 to 34 Years | 1,679 (65.6%) | 149 (8.9%) |
| 35 to 44 Years | 3,704 (75.1%) | 315 (8.5%) |
| 45 to 54 Years | 3,891 (72.8%) | 214 (5.5%) |
| 55 to 59 Years | 2,128 (65.5%) | 66 (3.1%) |
| 60 to 64 Years | 2,491 (48.6%) | 82 (3.3%) |
| 65 to 74 Years | 1,608 (17.4%) | 18 (1.1%) |
| 75 Years and over | 295 (4.5%) | 15 (5.1%) |
| Total | 20,174 (45.7%) | 1,392 (6.9%) |
Employment Status by Educational Attainment in Gila County
According to labor force statistics for Gila County, 67.0% of individuals (16,000) out of the total population between 25 and 64 years of age (23,880) are in the labor force, with 6.8% or 1,088 of them being unemployed. The group with the highest labor force participation rate are those with the educational attainment of bachelor's degree or higher, with 78.3% or 3,173 individuals in the labor force. Within the labor force, individuals with less than high school education have the highest percentage of unemployment, with 22.0% or 421 of them being unemployed.
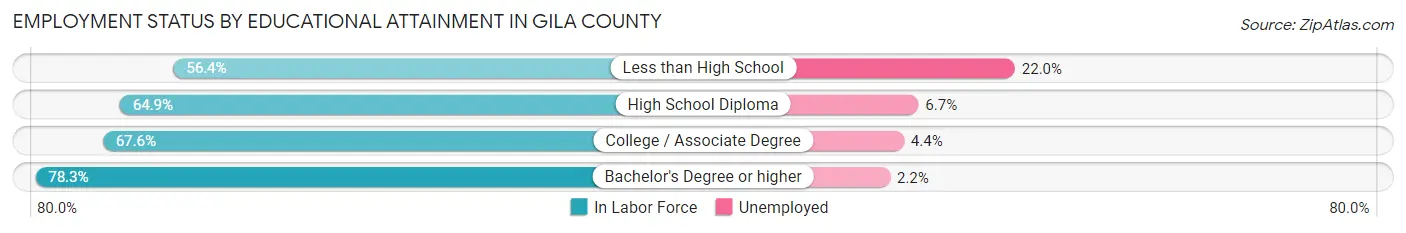
| Educational Attainment | In Labor Force | Unemployed |
| Less than High School | 1,912 (56.4%) | 746 (22.0%) |
| High School Diploma | 4,912 (64.9%) | 507 (6.7%) |
| College / Associate Degree | 5,995 (67.6%) | 390 (4.4%) |
| Bachelor's Degree or higher | 3,173 (78.3%) | 89 (2.2%) |
| Total | 16,000 (67.0%) | 1,624 (6.8%) |
Employment Occupations by Sex in Gila County
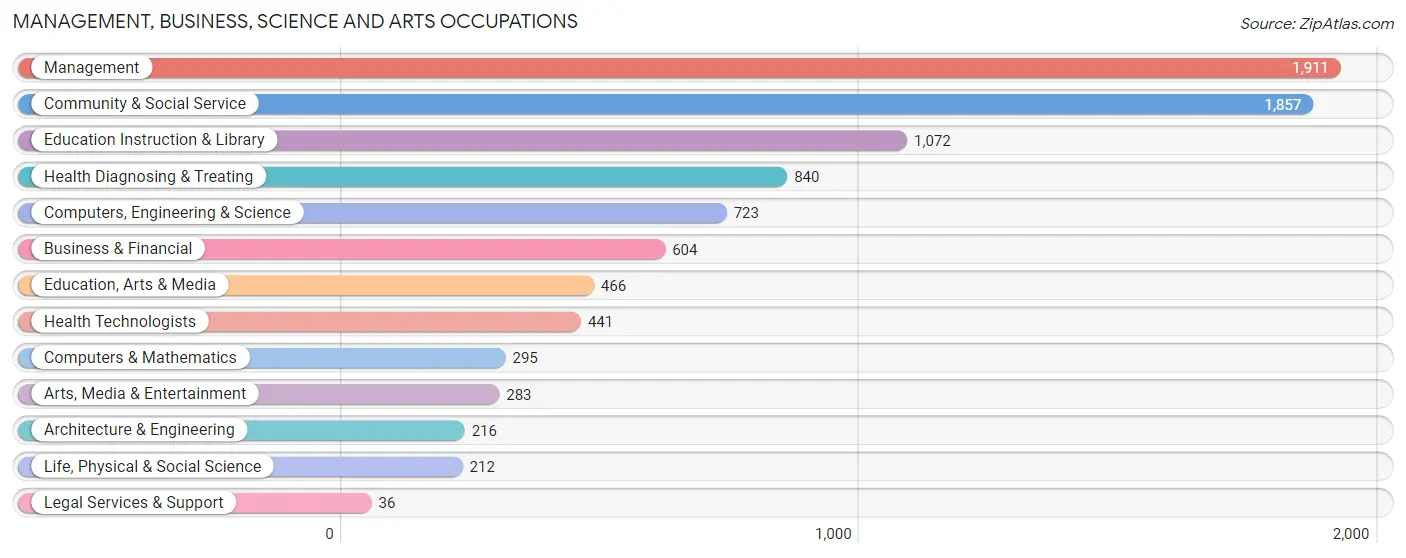
Management, Business, Science and Arts Occupations
The most common Management, Business, Science and Arts occupations in Gila County are Management (1,911 | 10.2%), Community & Social Service (1,857 | 9.9%), Education Instruction & Library (1,072 | 5.7%), Health Diagnosing & Treating (840 | 4.5%), and Computers, Engineering & Science (723 | 3.9%).
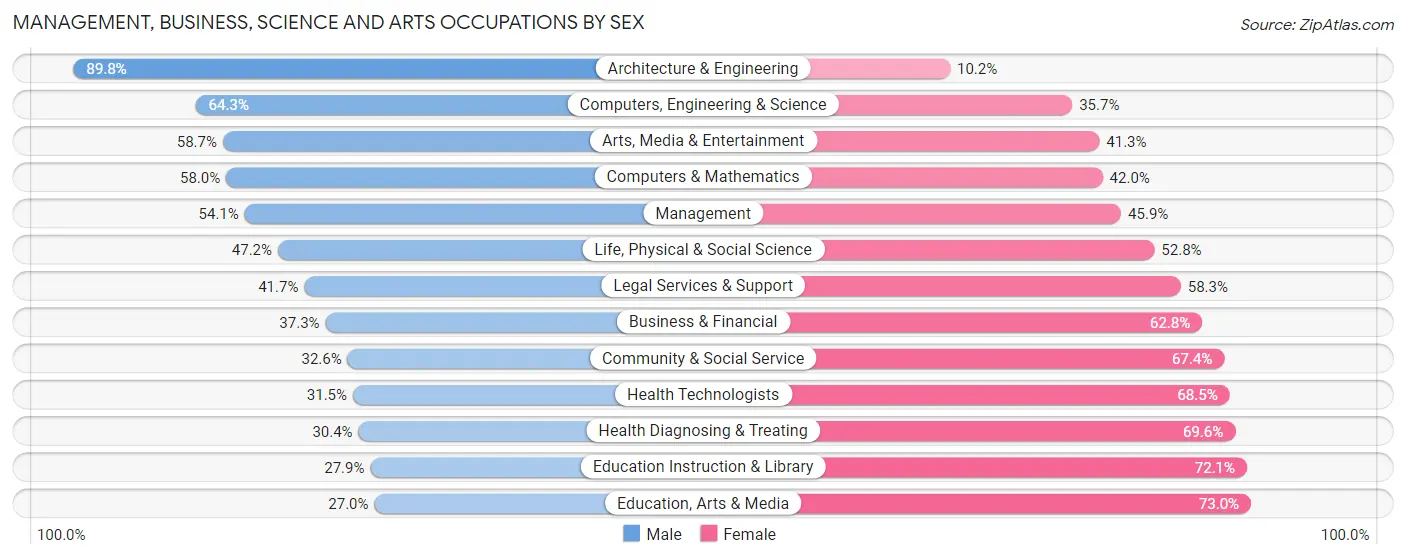
Management, Business, Science and Arts Occupations by Sex
Within the Management, Business, Science and Arts occupations in Gila County, the most male-oriented occupations are Architecture & Engineering (89.8%), Computers, Engineering & Science (64.3%), and Arts, Media & Entertainment (58.7%), while the most female-oriented occupations are Education, Arts & Media (73.0%), Education Instruction & Library (72.1%), and Health Diagnosing & Treating (69.6%).
| Occupation | Male | Female |
| Management | 1,034 (54.1%) | 877 (45.9%) |
| Business & Financial | 225 (37.2%) | 379 (62.7%) |
| Computers, Engineering & Science | 465 (64.3%) | 258 (35.7%) |
| Computers & Mathematics | 171 (58.0%) | 124 (42.0%) |
| Architecture & Engineering | 194 (89.8%) | 22 (10.2%) |
| Life, Physical & Social Science | 100 (47.2%) | 112 (52.8%) |
| Community & Social Service | 606 (32.6%) | 1,251 (67.4%) |
| Education, Arts & Media | 126 (27.0%) | 340 (73.0%) |
| Legal Services & Support | 15 (41.7%) | 21 (58.3%) |
| Education Instruction & Library | 299 (27.9%) | 773 (72.1%) |
| Arts, Media & Entertainment | 166 (58.7%) | 117 (41.3%) |
| Health Diagnosing & Treating | 255 (30.4%) | 585 (69.6%) |
| Health Technologists | 139 (31.5%) | 302 (68.5%) |
| Total (Category) | 2,585 (43.6%) | 3,350 (56.4%) |
| Total (Overall) | 9,790 (52.4%) | 8,902 (47.6%) |
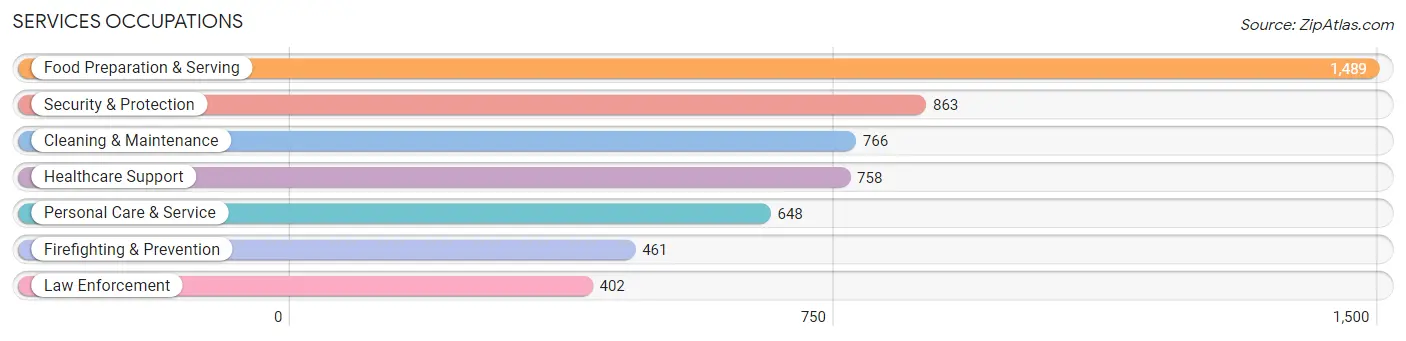
Services Occupations
The most common Services occupations in Gila County are Food Preparation & Serving (1,489 | 8.0%), Security & Protection (863 | 4.6%), Cleaning & Maintenance (766 | 4.1%), Healthcare Support (758 | 4.1%), and Personal Care & Service (648 | 3.5%).
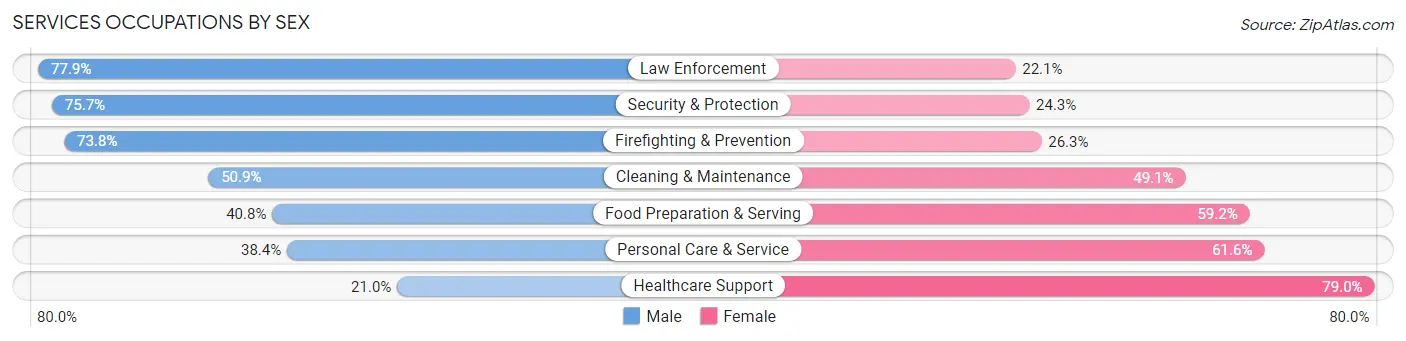
Services Occupations by Sex
Within the Services occupations in Gila County, the most male-oriented occupations are Law Enforcement (77.9%), Security & Protection (75.7%), and Firefighting & Prevention (73.8%), while the most female-oriented occupations are Healthcare Support (79.0%), Personal Care & Service (61.6%), and Food Preparation & Serving (59.2%).
| Occupation | Male | Female |
| Healthcare Support | 159 (21.0%) | 599 (79.0%) |
| Security & Protection | 653 (75.7%) | 210 (24.3%) |
| Firefighting & Prevention | 340 (73.8%) | 121 (26.3%) |
| Law Enforcement | 313 (77.9%) | 89 (22.1%) |
| Food Preparation & Serving | 607 (40.8%) | 882 (59.2%) |
| Cleaning & Maintenance | 390 (50.9%) | 376 (49.1%) |
| Personal Care & Service | 249 (38.4%) | 399 (61.6%) |
| Total (Category) | 2,058 (45.5%) | 2,466 (54.5%) |
| Total (Overall) | 9,790 (52.4%) | 8,902 (47.6%) |
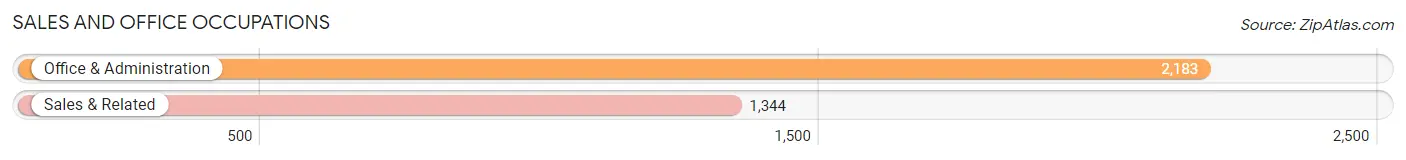
Sales and Office Occupations
The most common Sales and Office occupations in Gila County are Office & Administration (2,183 | 11.7%), and Sales & Related (1,344 | 7.2%).
Sales and Office Occupations by Sex
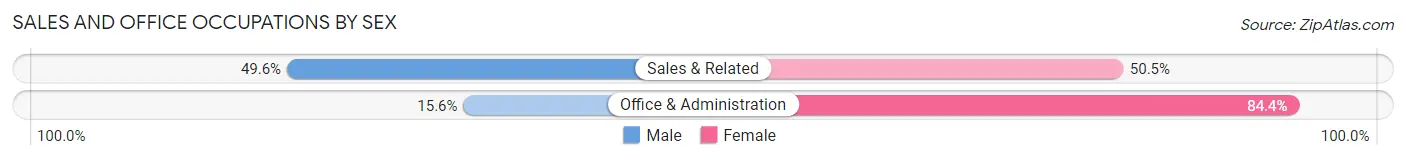
| Occupation | Male | Female |
| Sales & Related | 666 (49.5%) | 678 (50.4%) |
| Office & Administration | 341 (15.6%) | 1,842 (84.4%) |
| Total (Category) | 1,007 (28.5%) | 2,520 (71.5%) |
| Total (Overall) | 9,790 (52.4%) | 8,902 (47.6%) |
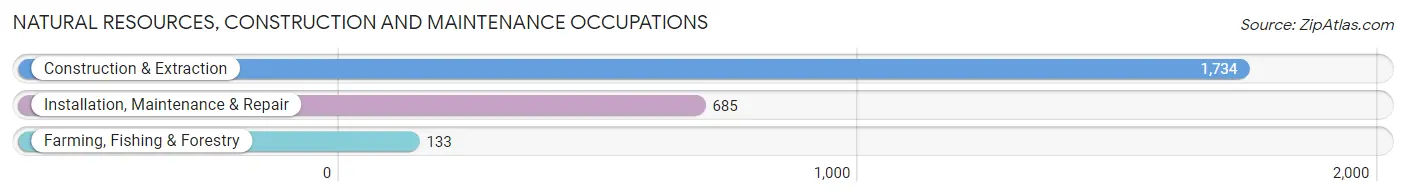
Natural Resources, Construction and Maintenance Occupations
The most common Natural Resources, Construction and Maintenance occupations in Gila County are Construction & Extraction (1,734 | 9.3%), Installation, Maintenance & Repair (685 | 3.7%), and Farming, Fishing & Forestry (133 | 0.7%).
Natural Resources, Construction and Maintenance Occupations by Sex
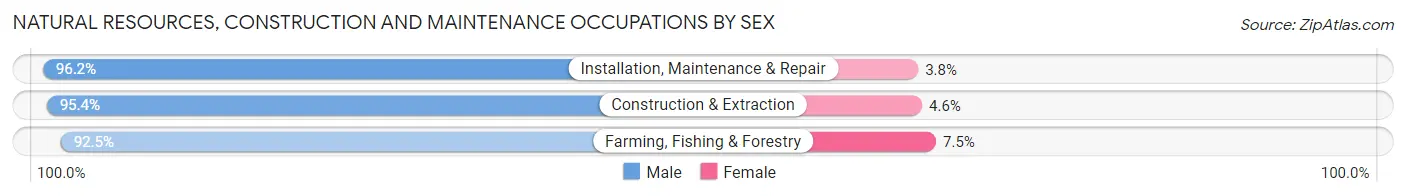
| Occupation | Male | Female |
| Farming, Fishing & Forestry | 123 (92.5%) | 10 (7.5%) |
| Construction & Extraction | 1,654 (95.4%) | 80 (4.6%) |
| Installation, Maintenance & Repair | 659 (96.2%) | 26 (3.8%) |
| Total (Category) | 2,436 (95.5%) | 116 (4.5%) |
| Total (Overall) | 9,790 (52.4%) | 8,902 (47.6%) |
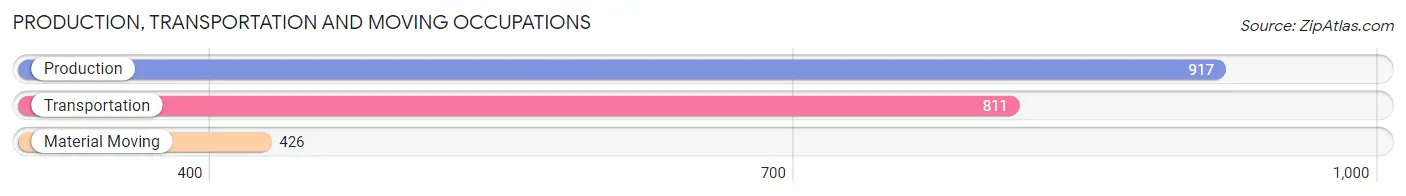
Production, Transportation and Moving Occupations
The most common Production, Transportation and Moving occupations in Gila County are Production (917 | 4.9%), Transportation (811 | 4.3%), and Material Moving (426 | 2.3%).
Production, Transportation and Moving Occupations by Sex
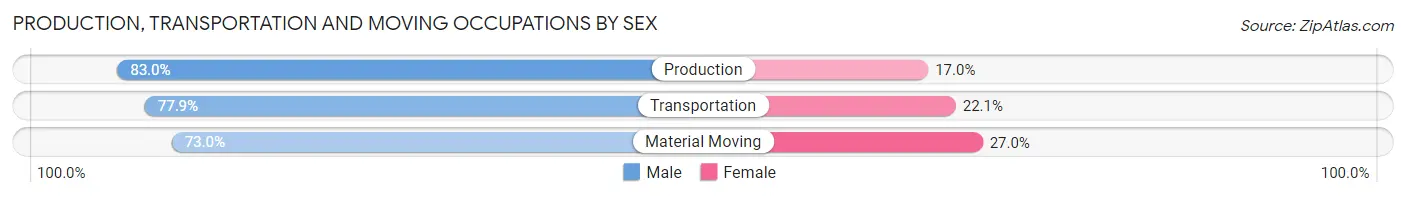
| Occupation | Male | Female |
| Production | 761 (83.0%) | 156 (17.0%) |
| Transportation | 632 (77.9%) | 179 (22.1%) |
| Material Moving | 311 (73.0%) | 115 (27.0%) |
| Total (Category) | 1,704 (79.1%) | 450 (20.9%) |
| Total (Overall) | 9,790 (52.4%) | 8,902 (47.6%) |
Employment Industries by Sex in Gila County
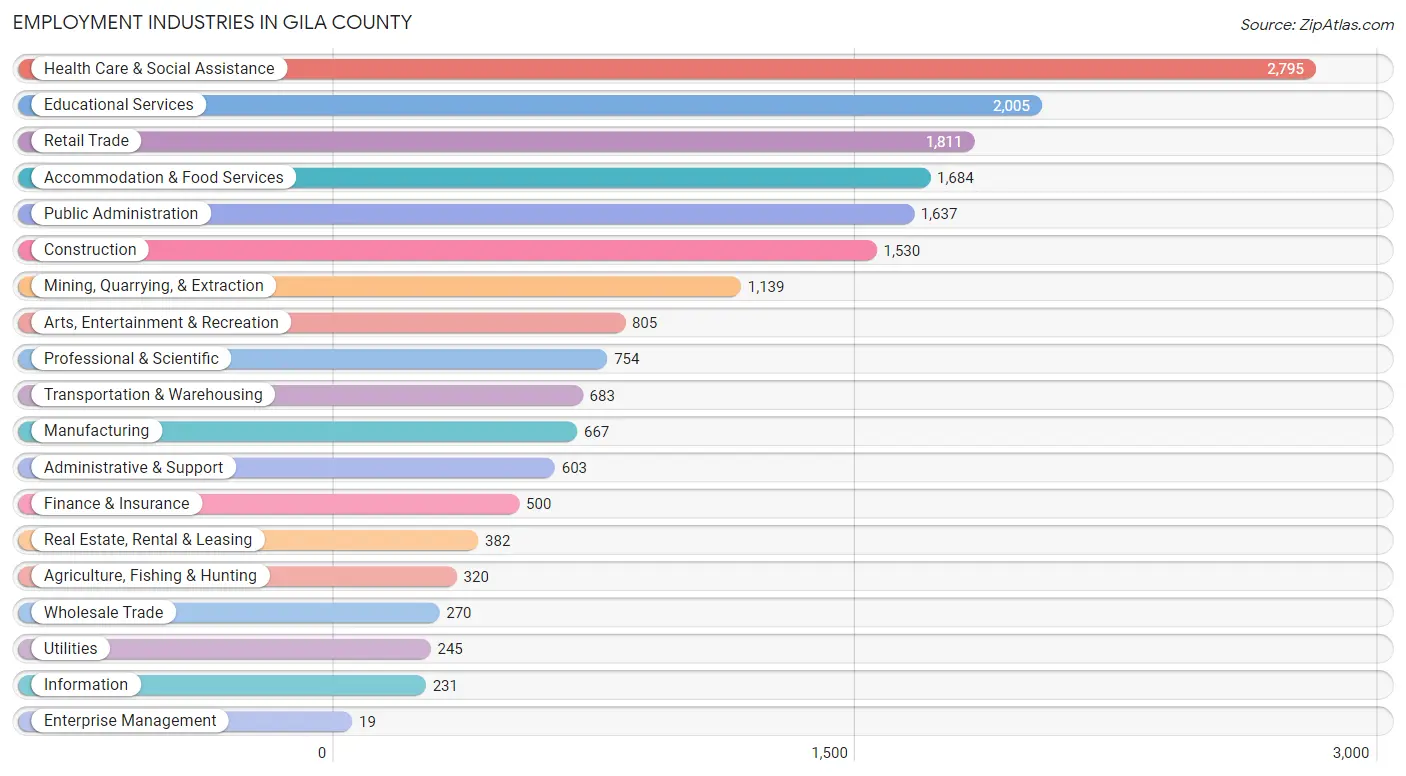
Employment Industries in Gila County
The major employment industries in Gila County include Health Care & Social Assistance (2,795 | 14.9%), Educational Services (2,005 | 10.7%), Retail Trade (1,811 | 9.7%), Accommodation & Food Services (1,684 | 9.0%), and Public Administration (1,637 | 8.8%).
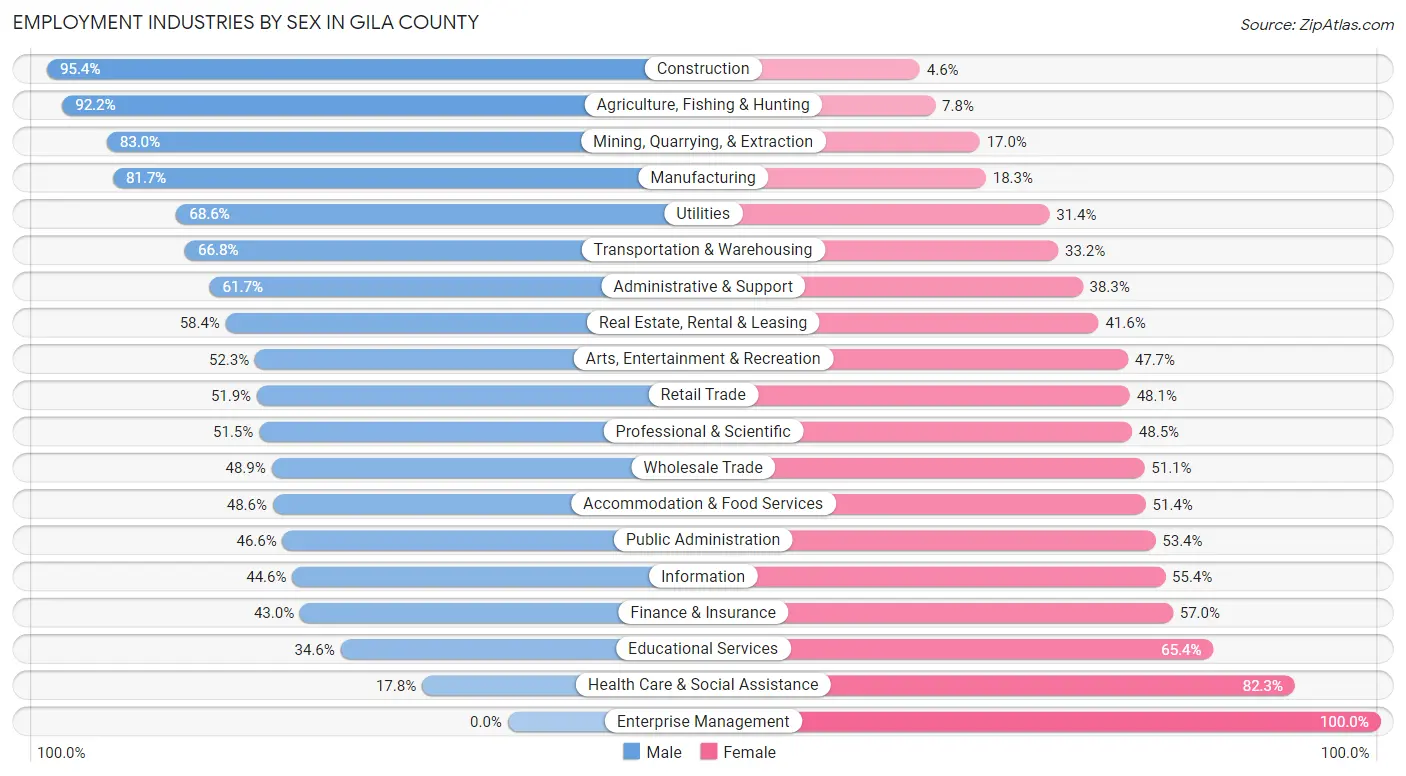
Employment Industries by Sex in Gila County
The Gila County industries that see more men than women are Construction (95.4%), Agriculture, Fishing & Hunting (92.2%), and Mining, Quarrying, & Extraction (83.0%), whereas the industries that tend to have a higher number of women are Enterprise Management (100.0%), Health Care & Social Assistance (82.3%), and Educational Services (65.4%).
| Industry | Male | Female |
| Agriculture, Fishing & Hunting | 295 (92.2%) | 25 (7.8%) |
| Mining, Quarrying, & Extraction | 945 (83.0%) | 194 (17.0%) |
| Construction | 1,459 (95.4%) | 71 (4.6%) |
| Manufacturing | 545 (81.7%) | 122 (18.3%) |
| Wholesale Trade | 132 (48.9%) | 138 (51.1%) |
| Retail Trade | 940 (51.9%) | 871 (48.1%) |
| Transportation & Warehousing | 456 (66.8%) | 227 (33.2%) |
| Utilities | 168 (68.6%) | 77 (31.4%) |
| Information | 103 (44.6%) | 128 (55.4%) |
| Finance & Insurance | 215 (43.0%) | 285 (57.0%) |
| Real Estate, Rental & Leasing | 223 (58.4%) | 159 (41.6%) |
| Professional & Scientific | 388 (51.5%) | 366 (48.5%) |
| Enterprise Management | 0 (0.0%) | 19 (100.0%) |
| Administrative & Support | 372 (61.7%) | 231 (38.3%) |
| Educational Services | 694 (34.6%) | 1,311 (65.4%) |
| Health Care & Social Assistance | 496 (17.7%) | 2,299 (82.3%) |
| Arts, Entertainment & Recreation | 421 (52.3%) | 384 (47.7%) |
| Accommodation & Food Services | 819 (48.6%) | 865 (51.4%) |
| Public Administration | 763 (46.6%) | 874 (53.4%) |
| Total | 9,790 (52.4%) | 8,902 (47.6%) |
Education in Gila County
School Enrollment in Gila County
The most common levels of schooling among the 9,493 students in Gila County are elementary school (2,498 | 26.3%), middle school (2,376 | 25.0%), and high school (2,063 | 21.7%).
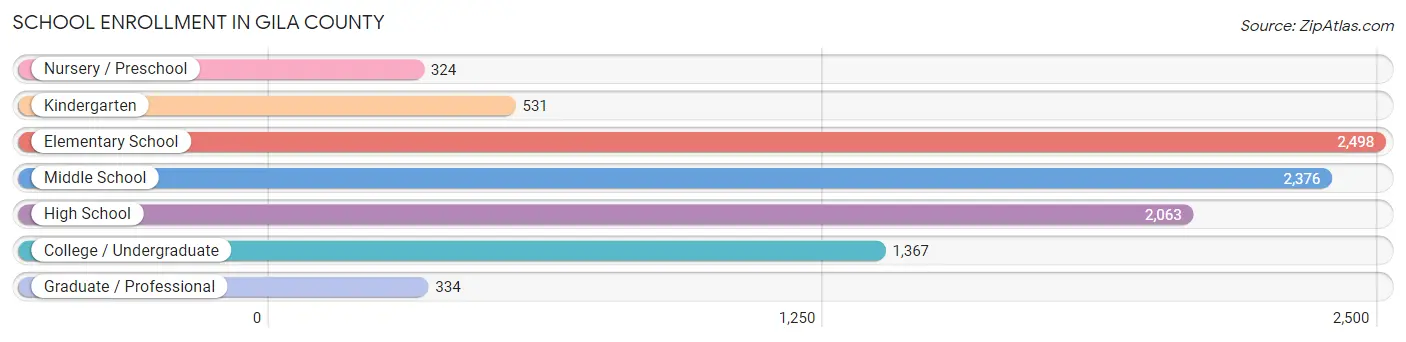
| School Level | # Students | % Students |
| Nursery / Preschool | 324 | 3.4% |
| Kindergarten | 531 | 5.6% |
| Elementary School | 2,498 | 26.3% |
| Middle School | 2,376 | 25.0% |
| High School | 2,063 | 21.7% |
| College / Undergraduate | 1,367 | 14.4% |
| Graduate / Professional | 334 | 3.5% |
| Total | 9,493 | 100.0% |
School Enrollment by Age by Funding Source in Gila County
Out of a total of 9,493 students who are enrolled in schools in Gila County, 788 (8.3%) attend a private institution, while the remaining 8,705 (91.7%) are enrolled in public schools. The age group of 25 to 34 year olds has the highest likelihood of being enrolled in private schools, with 95 (20.6% in the age bracket) enrolled. Conversely, the age group of 18 to 19 year olds has the lowest likelihood of being enrolled in a private school, with 435 (99.5% in the age bracket) attending a public institution.
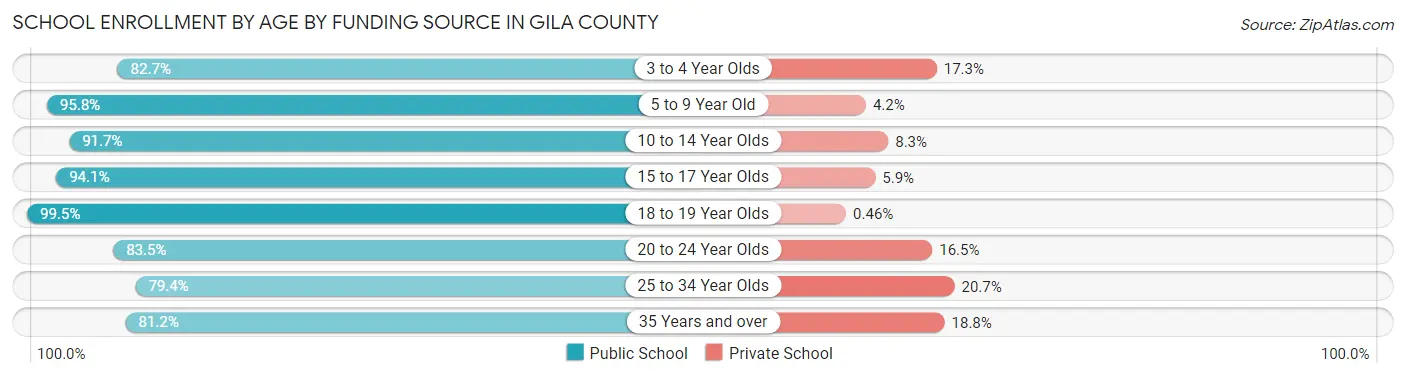
| Age Bracket | Public School | Private School |
| 3 to 4 Year Olds | 224 (82.7%) | 47 (17.3%) |
| 5 to 9 Year Old | 2,556 (95.8%) | 111 (4.2%) |
| 10 to 14 Year Olds | 2,702 (91.7%) | 245 (8.3%) |
| 15 to 17 Year Olds | 1,532 (94.1%) | 96 (5.9%) |
| 18 to 19 Year Olds | 435 (99.5%) | 2 (0.5%) |
| 20 to 24 Year Olds | 349 (83.5%) | 69 (16.5%) |
| 25 to 34 Year Olds | 365 (79.3%) | 95 (20.6%) |
| 35 Years and over | 540 (81.2%) | 125 (18.8%) |
| Total | 8,705 (91.7%) | 788 (8.3%) |
Educational Attainment by Field of Study in Gila County
Business (1,802 | 23.7%), education (1,779 | 23.4%), engineering (606 | 8.0%), bio, nature & agricultural (487 | 6.4%), and science & technology (466 | 6.1%) are the most common fields of study among 7,611 individuals in Gila County who have obtained a bachelor's degree or higher.
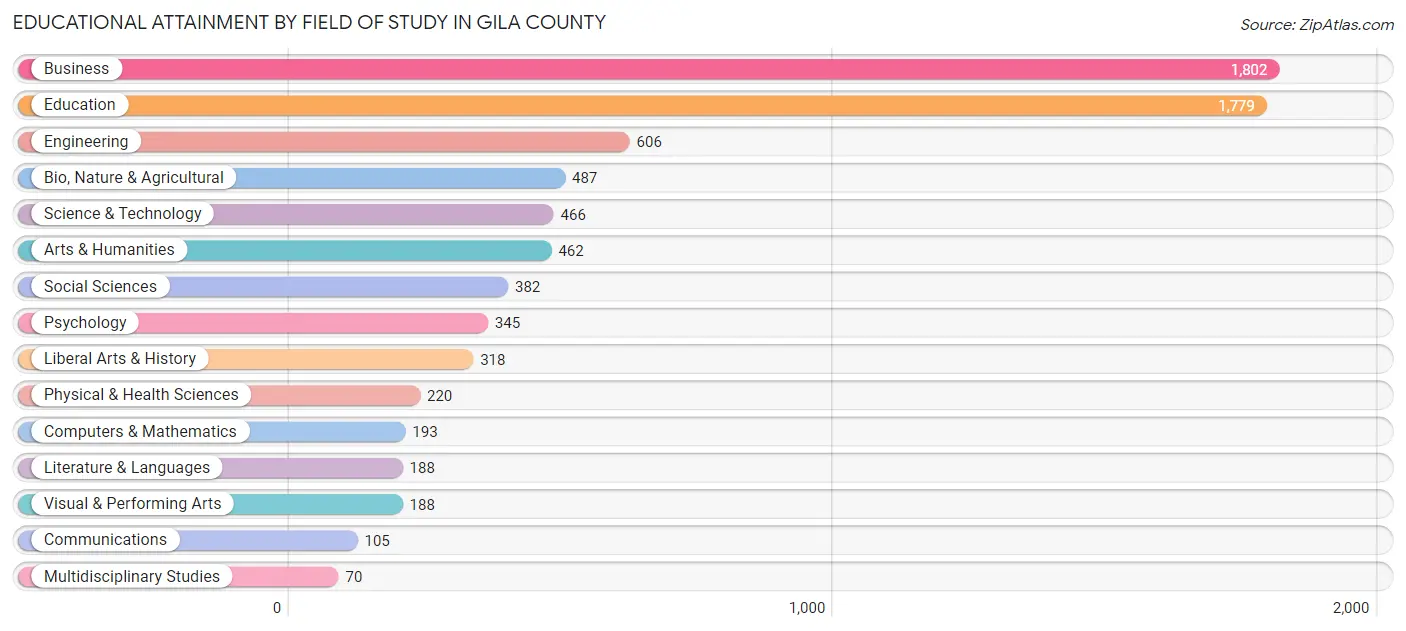
| Field of Study | # Graduates | % Graduates |
| Computers & Mathematics | 193 | 2.5% |
| Bio, Nature & Agricultural | 487 | 6.4% |
| Physical & Health Sciences | 220 | 2.9% |
| Psychology | 345 | 4.5% |
| Social Sciences | 382 | 5.0% |
| Engineering | 606 | 8.0% |
| Multidisciplinary Studies | 70 | 0.9% |
| Science & Technology | 466 | 6.1% |
| Business | 1,802 | 23.7% |
| Education | 1,779 | 23.4% |
| Literature & Languages | 188 | 2.5% |
| Liberal Arts & History | 318 | 4.2% |
| Visual & Performing Arts | 188 | 2.5% |
| Communications | 105 | 1.4% |
| Arts & Humanities | 462 | 6.1% |
| Total | 7,611 | 100.0% |
Transportation & Commute in Gila County
Vehicle Availability by Sex in Gila County
The most prevalent vehicle ownership categories in Gila County are males with 2 vehicles (3,747, accounting for 38.9%) and females with 2 vehicles (3,224, making up 42.7%).
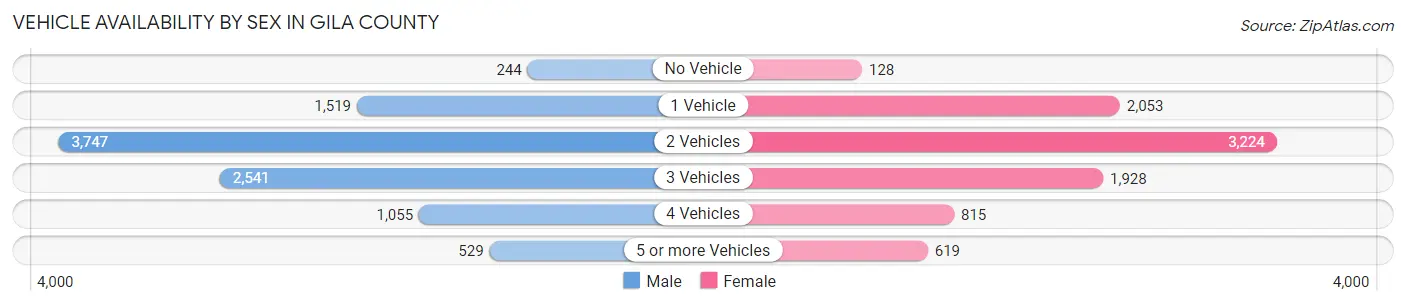
| Vehicles Available | Male | Female |
| No Vehicle | 244 (2.5%) | 128 (1.5%) |
| 1 Vehicle | 1,519 (15.8%) | 2,053 (23.4%) |
| 2 Vehicles | 3,747 (38.9%) | 3,224 (36.8%) |
| 3 Vehicles | 2,541 (26.4%) | 1,928 (22.0%) |
| 4 Vehicles | 1,055 (11.0%) | 815 (9.3%) |
| 5 or more Vehicles | 529 (5.5%) | 619 (7.1%) |
| Total | 9,635 (100.0%) | 8,767 (100.0%) |
Commute Time in Gila County
The most frequently occuring commute durations in Gila County are 5 to 9 minutes (3,941 commuters, 23.4%), 10 to 14 minutes (3,764 commuters, 22.4%), and 15 to 19 minutes (2,247 commuters, 13.4%).
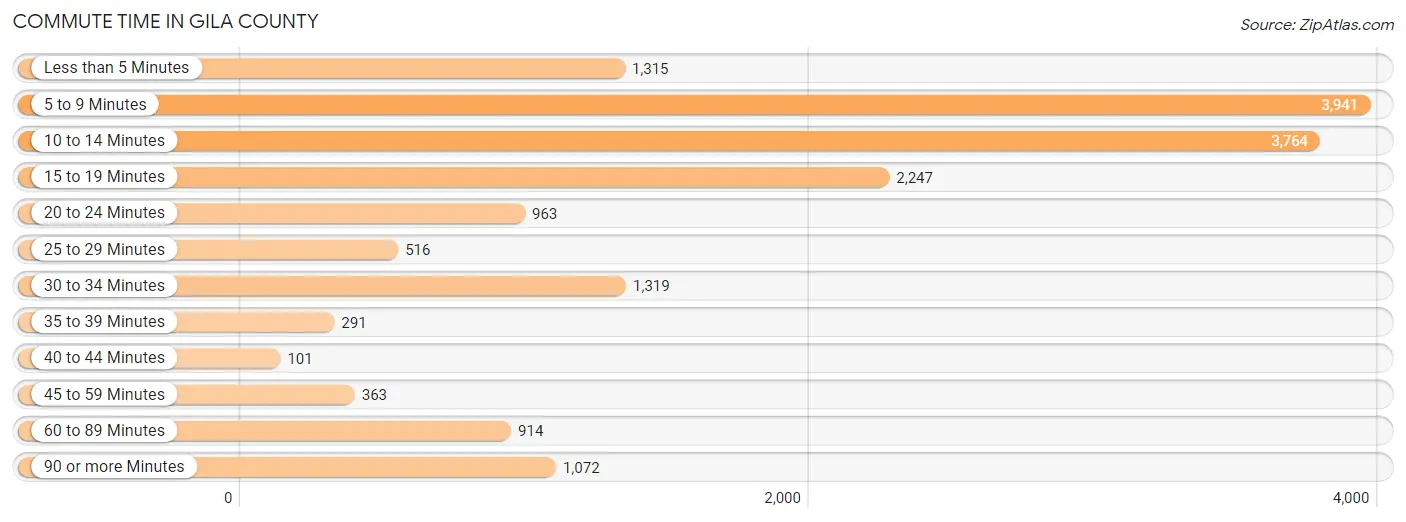
| Commute Time | # Commuters | % Commuters |
| Less than 5 Minutes | 1,315 | 7.8% |
| 5 to 9 Minutes | 3,941 | 23.4% |
| 10 to 14 Minutes | 3,764 | 22.4% |
| 15 to 19 Minutes | 2,247 | 13.4% |
| 20 to 24 Minutes | 963 | 5.7% |
| 25 to 29 Minutes | 516 | 3.1% |
| 30 to 34 Minutes | 1,319 | 7.9% |
| 35 to 39 Minutes | 291 | 1.7% |
| 40 to 44 Minutes | 101 | 0.6% |
| 45 to 59 Minutes | 363 | 2.2% |
| 60 to 89 Minutes | 914 | 5.4% |
| 90 or more Minutes | 1,072 | 6.4% |
Commute Time by Sex in Gila County
The most common commute times in Gila County are 10 to 14 minutes (1,964 commuters, 22.3%) for males and 5 to 9 minutes (2,046 commuters, 25.6%) for females.
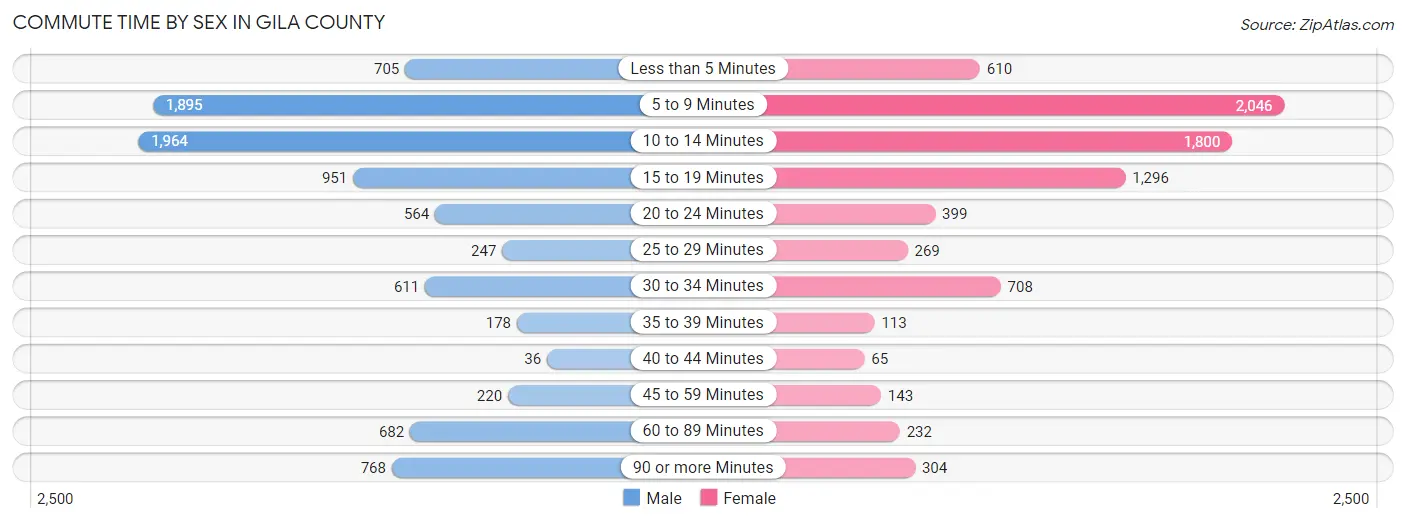
| Commute Time | Male | Female |
| Less than 5 Minutes | 705 (8.0%) | 610 (7.6%) |
| 5 to 9 Minutes | 1,895 (21.5%) | 2,046 (25.6%) |
| 10 to 14 Minutes | 1,964 (22.3%) | 1,800 (22.5%) |
| 15 to 19 Minutes | 951 (10.8%) | 1,296 (16.2%) |
| 20 to 24 Minutes | 564 (6.4%) | 399 (5.0%) |
| 25 to 29 Minutes | 247 (2.8%) | 269 (3.4%) |
| 30 to 34 Minutes | 611 (6.9%) | 708 (8.9%) |
| 35 to 39 Minutes | 178 (2.0%) | 113 (1.4%) |
| 40 to 44 Minutes | 36 (0.4%) | 65 (0.8%) |
| 45 to 59 Minutes | 220 (2.5%) | 143 (1.8%) |
| 60 to 89 Minutes | 682 (7.7%) | 232 (2.9%) |
| 90 or more Minutes | 768 (8.7%) | 304 (3.8%) |
Time of Departure to Work by Sex in Gila County
The most frequent times of departure to work in Gila County are 12:00 AM to 4:59 AM (1,231, 14.0%) for males and 7:30 AM to 7:59 AM (1,213, 15.2%) for females.
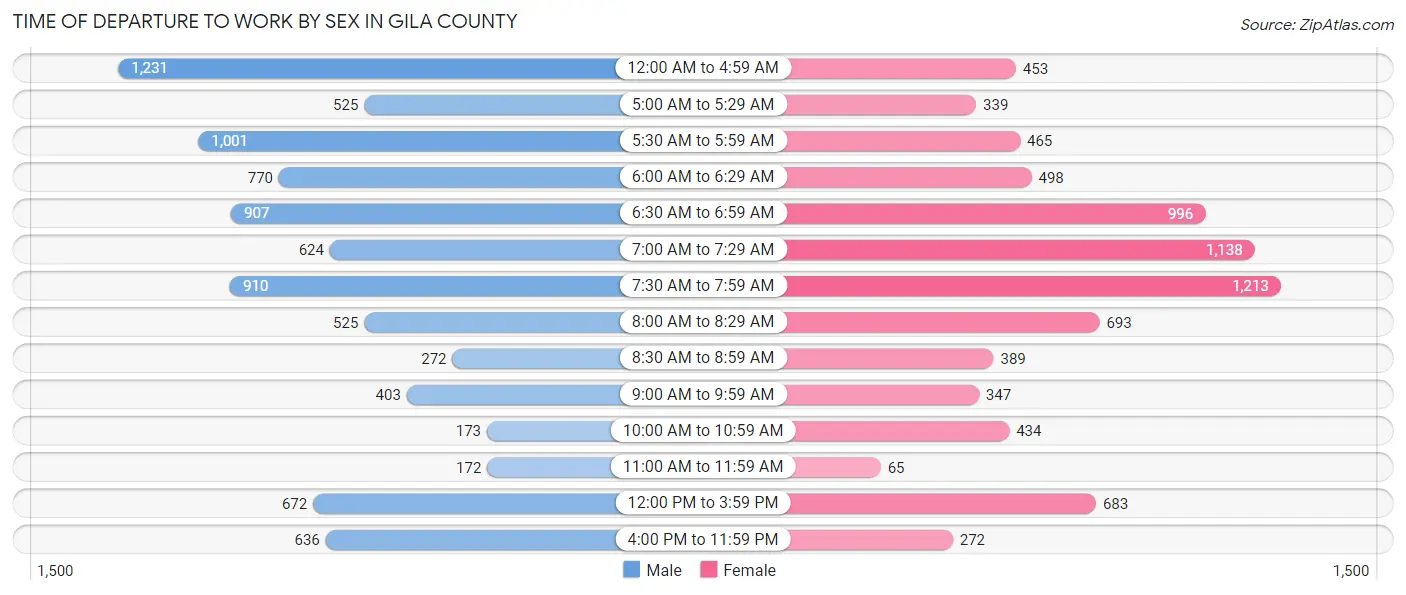
| Time of Departure | Male | Female |
| 12:00 AM to 4:59 AM | 1,231 (14.0%) | 453 (5.7%) |
| 5:00 AM to 5:29 AM | 525 (5.9%) | 339 (4.3%) |
| 5:30 AM to 5:59 AM | 1,001 (11.4%) | 465 (5.8%) |
| 6:00 AM to 6:29 AM | 770 (8.7%) | 498 (6.2%) |
| 6:30 AM to 6:59 AM | 907 (10.3%) | 996 (12.5%) |
| 7:00 AM to 7:29 AM | 624 (7.1%) | 1,138 (14.2%) |
| 7:30 AM to 7:59 AM | 910 (10.3%) | 1,213 (15.2%) |
| 8:00 AM to 8:29 AM | 525 (5.9%) | 693 (8.7%) |
| 8:30 AM to 8:59 AM | 272 (3.1%) | 389 (4.9%) |
| 9:00 AM to 9:59 AM | 403 (4.6%) | 347 (4.3%) |
| 10:00 AM to 10:59 AM | 173 (2.0%) | 434 (5.4%) |
| 11:00 AM to 11:59 AM | 172 (1.9%) | 65 (0.8%) |
| 12:00 PM to 3:59 PM | 672 (7.6%) | 683 (8.6%) |
| 4:00 PM to 11:59 PM | 636 (7.2%) | 272 (3.4%) |
| Total | 8,821 (100.0%) | 7,985 (100.0%) |
Housing Occupancy in Gila County
Occupancy by Ownership in Gila County
Of the total 22,714 dwellings in Gila County, owner-occupied units account for 17,178 (75.6%), while renter-occupied units make up 5,536 (24.4%).
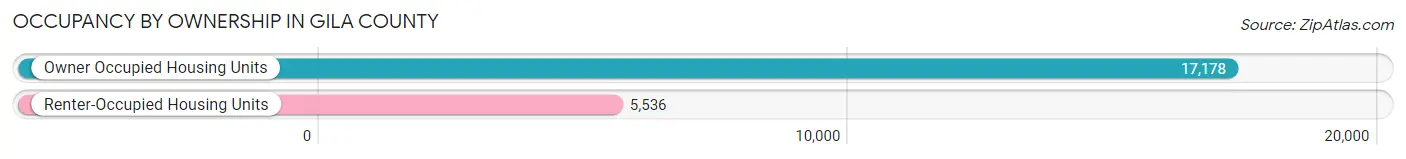
| Occupancy | # Housing Units | % Housing Units |
| Owner Occupied Housing Units | 17,178 | 75.6% |
| Renter-Occupied Housing Units | 5,536 | 24.4% |
| Total Occupied Housing Units | 22,714 | 100.0% |
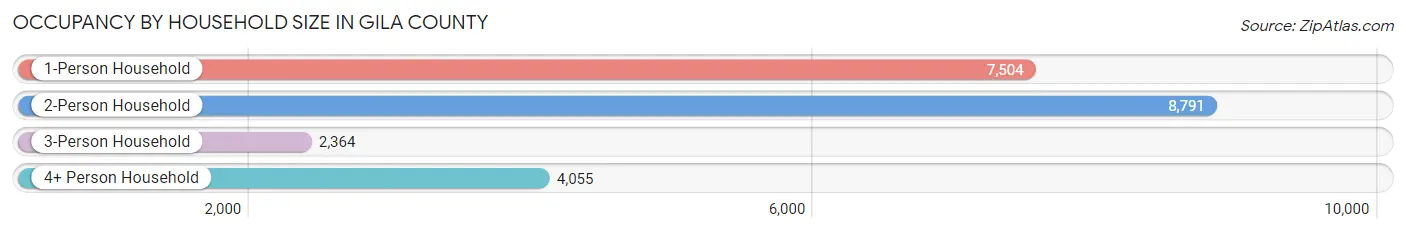
Occupancy by Household Size in Gila County
| Household Size | # Housing Units | % Housing Units |
| 1-Person Household | 7,504 | 33.0% |
| 2-Person Household | 8,791 | 38.7% |
| 3-Person Household | 2,364 | 10.4% |
| 4+ Person Household | 4,055 | 17.8% |
| Total Housing Units | 22,714 | 100.0% |
Occupancy by Ownership by Household Size in Gila County
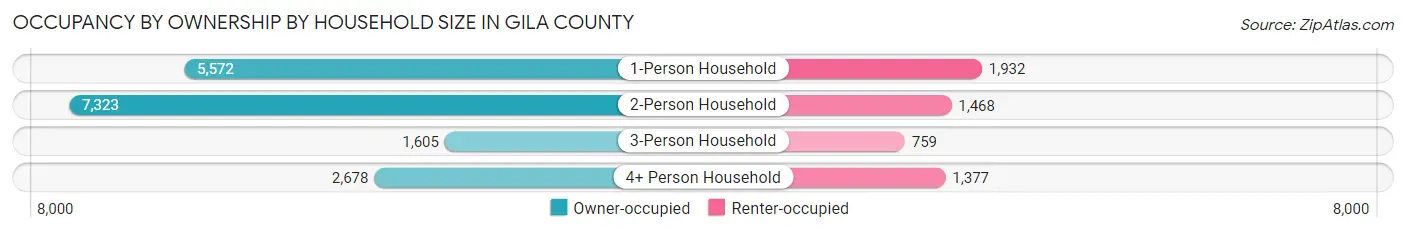
| Household Size | Owner-occupied | Renter-occupied |
| 1-Person Household | 5,572 (74.3%) | 1,932 (25.8%) |
| 2-Person Household | 7,323 (83.3%) | 1,468 (16.7%) |
| 3-Person Household | 1,605 (67.9%) | 759 (32.1%) |
| 4+ Person Household | 2,678 (66.0%) | 1,377 (34.0%) |
| Total Housing Units | 17,178 (75.6%) | 5,536 (24.4%) |
Occupancy by Educational Attainment in Gila County
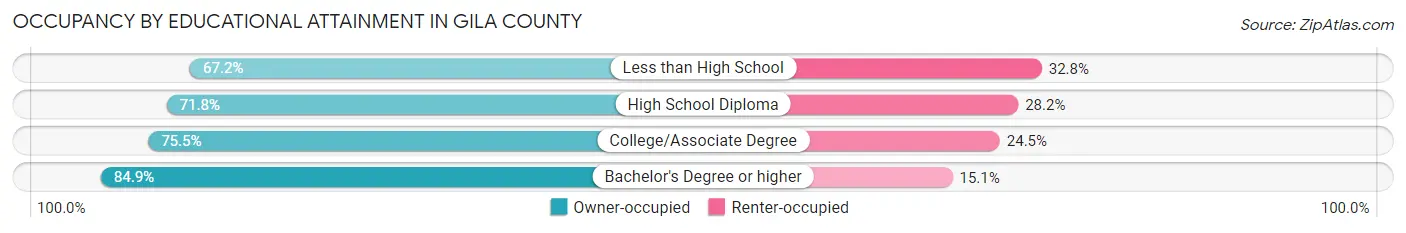
| Household Size | Owner-occupied | Renter-occupied |
| Less than High School | 1,567 (67.2%) | 766 (32.8%) |
| High School Diploma | 4,414 (71.8%) | 1,731 (28.2%) |
| College/Associate Degree | 7,110 (75.5%) | 2,310 (24.5%) |
| Bachelor's Degree or higher | 4,087 (84.9%) | 729 (15.1%) |
Occupancy by Age of Householder in Gila County
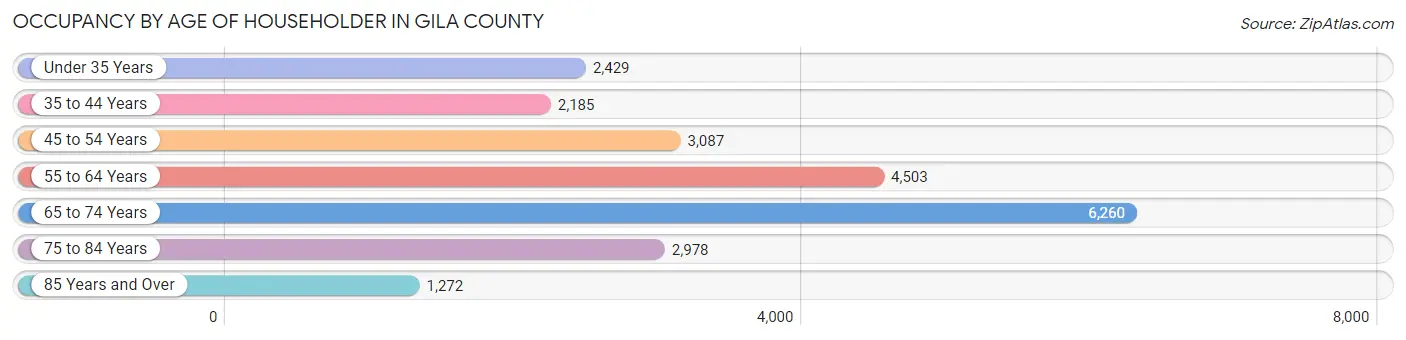
| Age Bracket | # Households | % Households |
| Under 35 Years | 2,429 | 10.7% |
| 35 to 44 Years | 2,185 | 9.6% |
| 45 to 54 Years | 3,087 | 13.6% |
| 55 to 64 Years | 4,503 | 19.8% |
| 65 to 74 Years | 6,260 | 27.6% |
| 75 to 84 Years | 2,978 | 13.1% |
| 85 Years and Over | 1,272 | 5.6% |
| Total | 22,714 | 100.0% |
Housing Finances in Gila County
Median Income by Occupancy in Gila County
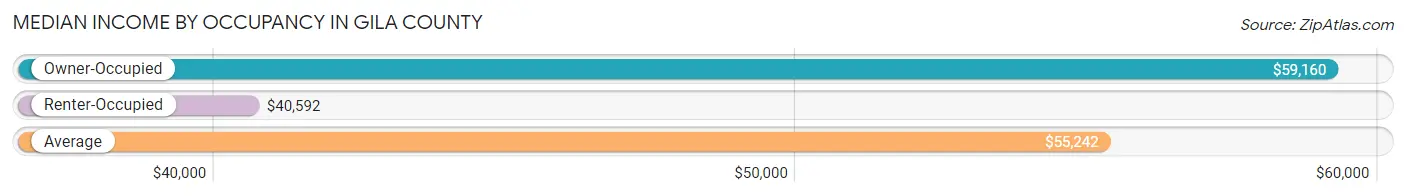
| Occupancy Type | # Households | Median Income |
| Owner-Occupied | 17,178 (75.6%) | $59,160 |
| Renter-Occupied | 5,536 (24.4%) | $40,592 |
| Average | 22,714 (100.0%) | $55,242 |
Occupancy by Householder Income Bracket in Gila County
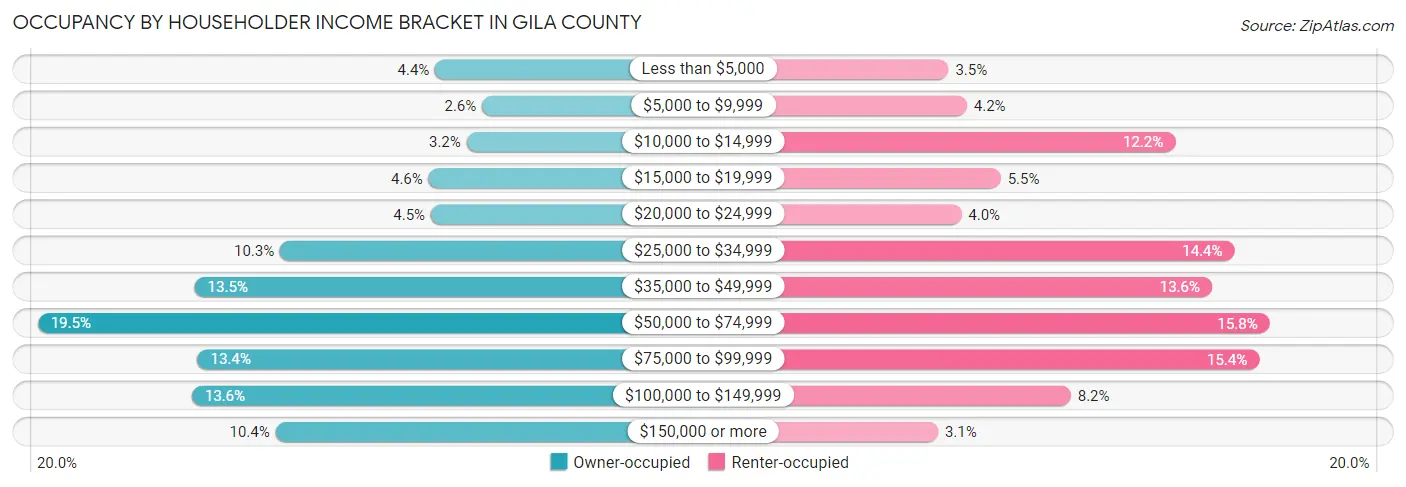
| Income Bracket | Owner-occupied | Renter-occupied |
| Less than $5,000 | 749 (4.4%) | 196 (3.5%) |
| $5,000 to $9,999 | 442 (2.6%) | 235 (4.2%) |
| $10,000 to $14,999 | 543 (3.2%) | 674 (12.2%) |
| $15,000 to $19,999 | 792 (4.6%) | 306 (5.5%) |
| $20,000 to $24,999 | 777 (4.5%) | 223 (4.0%) |
| $25,000 to $34,999 | 1,765 (10.3%) | 799 (14.4%) |
| $35,000 to $49,999 | 2,323 (13.5%) | 751 (13.6%) |
| $50,000 to $74,999 | 3,349 (19.5%) | 873 (15.8%) |
| $75,000 to $99,999 | 2,303 (13.4%) | 851 (15.4%) |
| $100,000 to $149,999 | 2,342 (13.6%) | 454 (8.2%) |
| $150,000 or more | 1,793 (10.4%) | 174 (3.1%) |
| Total | 17,178 (100.0%) | 5,536 (100.0%) |
Monthly Housing Cost Tiers in Gila County
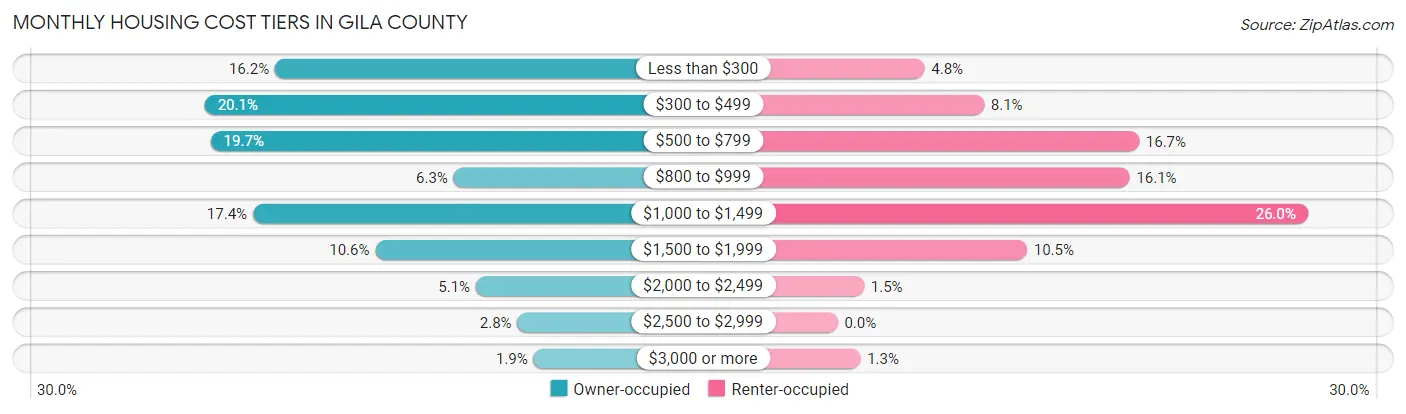
| Monthly Cost | Owner-occupied | Renter-occupied |
| Less than $300 | 2,777 (16.2%) | 266 (4.8%) |
| $300 to $499 | 3,445 (20.1%) | 448 (8.1%) |
| $500 to $799 | 3,387 (19.7%) | 922 (16.7%) |
| $800 to $999 | 1,083 (6.3%) | 893 (16.1%) |
| $1,000 to $1,499 | 2,987 (17.4%) | 1,438 (26.0%) |
| $1,500 to $1,999 | 1,826 (10.6%) | 579 (10.5%) |
| $2,000 to $2,499 | 871 (5.1%) | 81 (1.5%) |
| $2,500 to $2,999 | 478 (2.8%) | 0 (0.0%) |
| $3,000 or more | 324 (1.9%) | 70 (1.3%) |
| Total | 17,178 (100.0%) | 5,536 (100.0%) |
Physical Housing Characteristics in Gila County
Housing Structures in Gila County
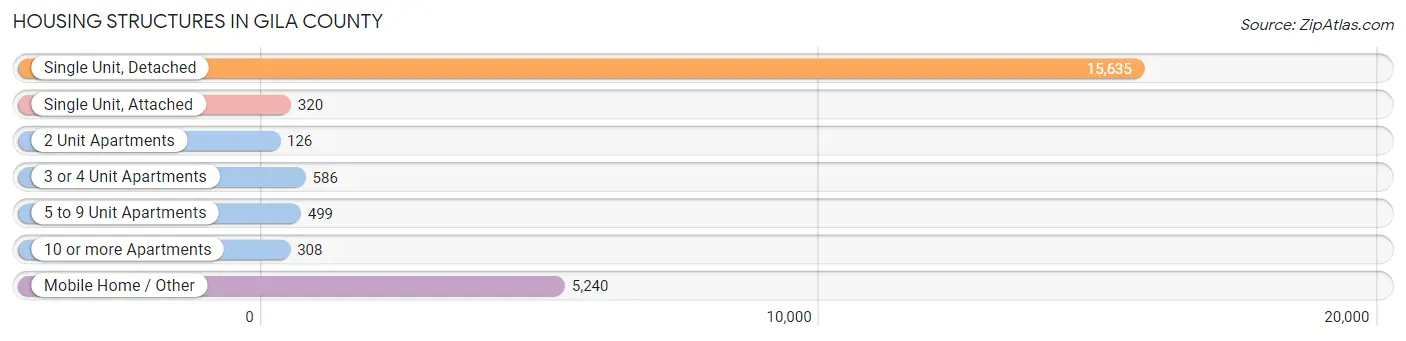
| Structure Type | # Housing Units | % Housing Units |
| Single Unit, Detached | 15,635 | 68.8% |
| Single Unit, Attached | 320 | 1.4% |
| 2 Unit Apartments | 126 | 0.5% |
| 3 or 4 Unit Apartments | 586 | 2.6% |
| 5 to 9 Unit Apartments | 499 | 2.2% |
| 10 or more Apartments | 308 | 1.4% |
| Mobile Home / Other | 5,240 | 23.1% |
| Total | 22,714 | 100.0% |
Housing Structures by Occupancy in Gila County
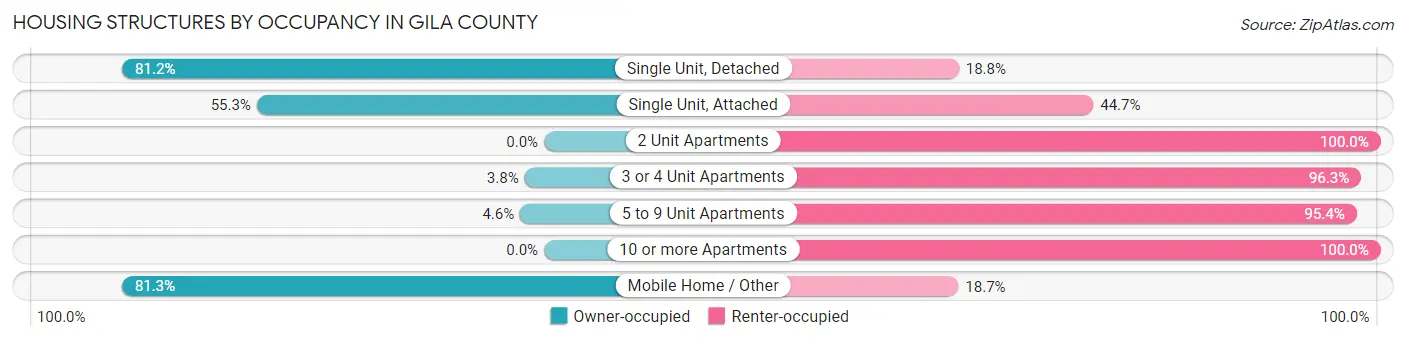
| Structure Type | Owner-occupied | Renter-occupied |
| Single Unit, Detached | 12,697 (81.2%) | 2,938 (18.8%) |
| Single Unit, Attached | 177 (55.3%) | 143 (44.7%) |
| 2 Unit Apartments | 0 (0.0%) | 126 (100.0%) |
| 3 or 4 Unit Apartments | 22 (3.7%) | 564 (96.3%) |
| 5 to 9 Unit Apartments | 23 (4.6%) | 476 (95.4%) |
| 10 or more Apartments | 0 (0.0%) | 308 (100.0%) |
| Mobile Home / Other | 4,259 (81.3%) | 981 (18.7%) |
| Total | 17,178 (75.6%) | 5,536 (24.4%) |
Housing Structures by Number of Rooms in Gila County
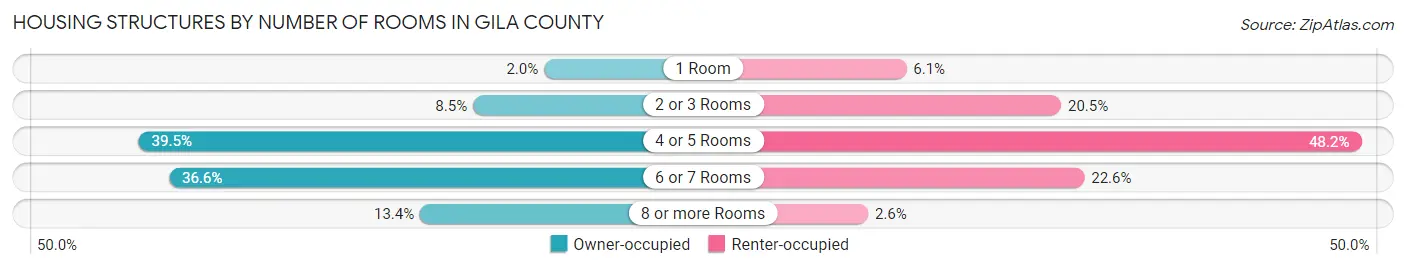
| Number of Rooms | Owner-occupied | Renter-occupied |
| 1 Room | 336 (2.0%) | 340 (6.1%) |
| 2 or 3 Rooms | 1,465 (8.5%) | 1,132 (20.4%) |
| 4 or 5 Rooms | 6,777 (39.5%) | 2,669 (48.2%) |
| 6 or 7 Rooms | 6,293 (36.6%) | 1,251 (22.6%) |
| 8 or more Rooms | 2,307 (13.4%) | 144 (2.6%) |
| Total | 17,178 (100.0%) | 5,536 (100.0%) |
Housing Structure by Heating Type in Gila County
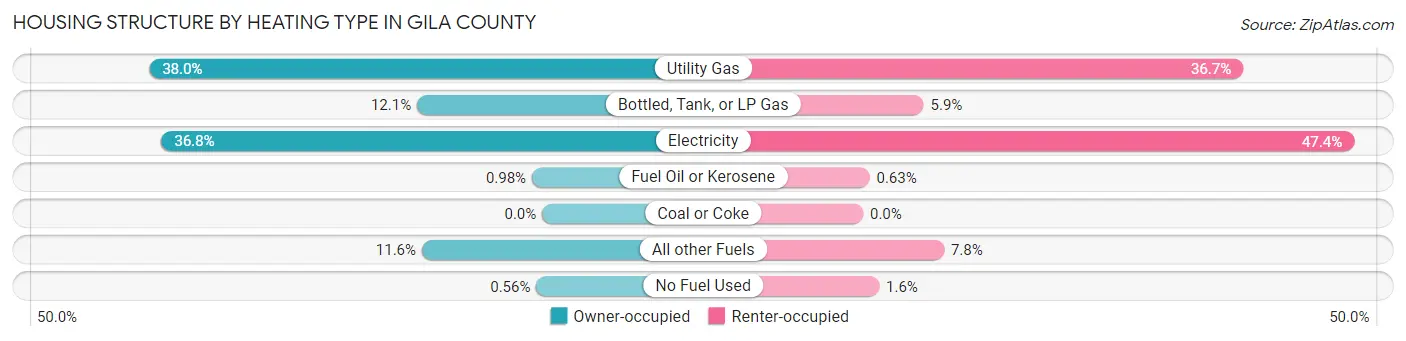
| Heating Type | Owner-occupied | Renter-occupied |
| Utility Gas | 6,521 (38.0%) | 2,032 (36.7%) |
| Bottled, Tank, or LP Gas | 2,076 (12.1%) | 324 (5.9%) |
| Electricity | 6,320 (36.8%) | 2,626 (47.4%) |
| Fuel Oil or Kerosene | 169 (1.0%) | 35 (0.6%) |
| Coal or Coke | 0 (0.0%) | 0 (0.0%) |
| All other Fuels | 1,996 (11.6%) | 433 (7.8%) |
| No Fuel Used | 96 (0.6%) | 86 (1.5%) |
| Total | 17,178 (100.0%) | 5,536 (100.0%) |
Household Vehicle Usage in Gila County
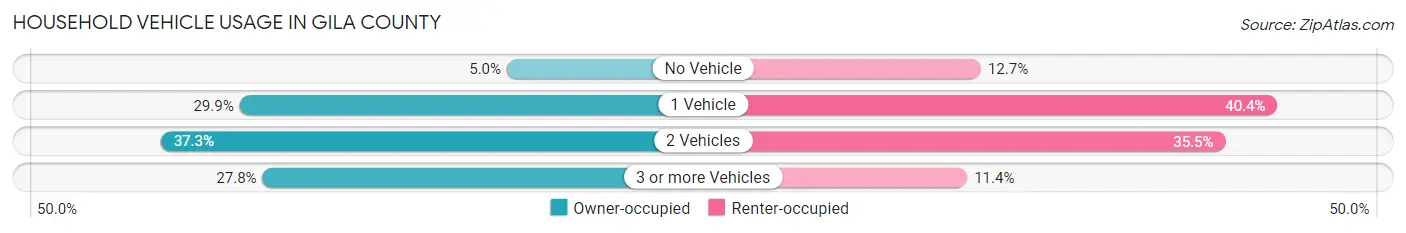
| Vehicles per Household | Owner-occupied | Renter-occupied |
| No Vehicle | 855 (5.0%) | 703 (12.7%) |
| 1 Vehicle | 5,143 (29.9%) | 2,235 (40.4%) |
| 2 Vehicles | 6,405 (37.3%) | 1,966 (35.5%) |
| 3 or more Vehicles | 4,775 (27.8%) | 632 (11.4%) |
| Total | 17,178 (100.0%) | 5,536 (100.0%) |
Real Estate & Mortgages in Gila County
Real Estate and Mortgage Overview in Gila County
| Characteristic | Without Mortgage | With Mortgage |
| Housing Units | 9,711 | 7,467 |
| Median Property Value | $167,600 | $274,500 |
| Median Household Income | $46,719 | $1,186 |
| Monthly Housing Costs | $422 | $324 |
| Real Estate Taxes | $1,158 | $441 |
Property Value by Mortgage Status in Gila County
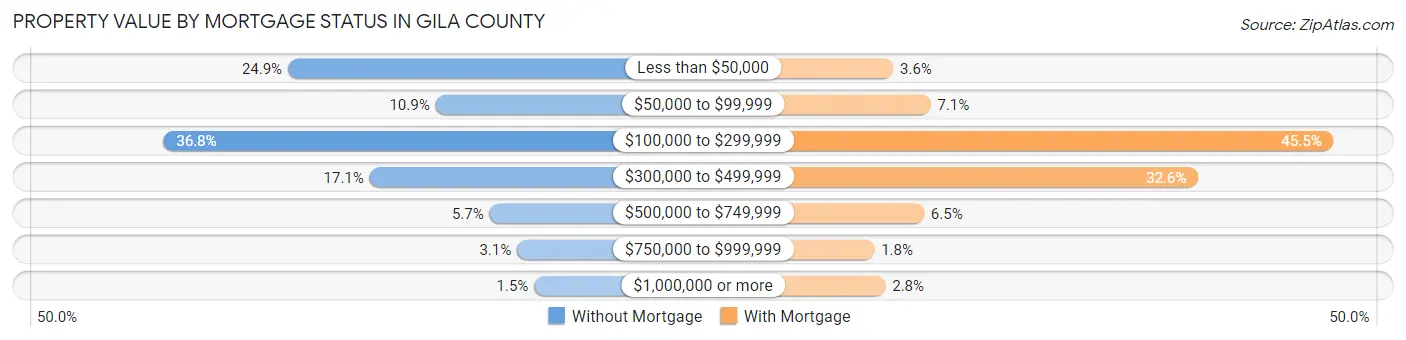
| Property Value | Without Mortgage | With Mortgage |
| Less than $50,000 | 2,420 (24.9%) | 267 (3.6%) |
| $50,000 to $99,999 | 1,056 (10.9%) | 533 (7.1%) |
| $100,000 to $299,999 | 3,572 (36.8%) | 3,400 (45.5%) |
| $300,000 to $499,999 | 1,664 (17.1%) | 2,437 (32.6%) |
| $500,000 to $749,999 | 555 (5.7%) | 486 (6.5%) |
| $750,000 to $999,999 | 301 (3.1%) | 133 (1.8%) |
| $1,000,000 or more | 143 (1.5%) | 211 (2.8%) |
| Total | 9,711 (100.0%) | 7,467 (100.0%) |
Household Income by Mortgage Status in Gila County
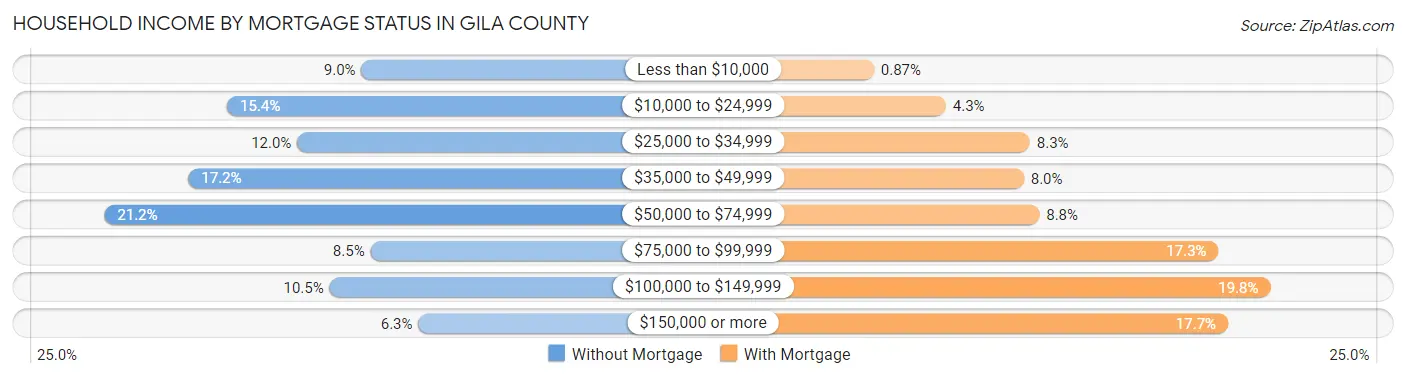
| Household Income | Without Mortgage | With Mortgage |
| Less than $10,000 | 870 (9.0%) | 65 (0.9%) |
| $10,000 to $24,999 | 1,492 (15.4%) | 321 (4.3%) |
| $25,000 to $34,999 | 1,167 (12.0%) | 620 (8.3%) |
| $35,000 to $49,999 | 1,670 (17.2%) | 598 (8.0%) |
| $50,000 to $74,999 | 2,059 (21.2%) | 653 (8.7%) |
| $75,000 to $99,999 | 828 (8.5%) | 1,290 (17.3%) |
| $100,000 to $149,999 | 1,018 (10.5%) | 1,475 (19.8%) |
| $150,000 or more | 607 (6.2%) | 1,324 (17.7%) |
| Total | 9,711 (100.0%) | 7,467 (100.0%) |
Property Value to Household Income Ratio in Gila County
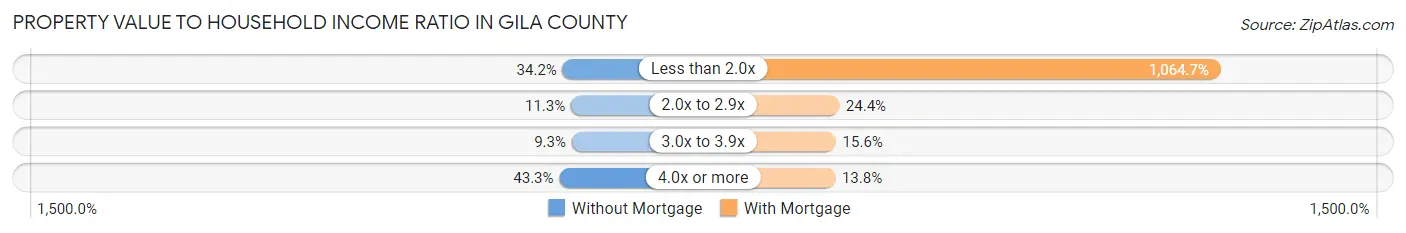
| Value-to-Income Ratio | Without Mortgage | With Mortgage |
| Less than 2.0x | 3,325 (34.2%) | 79,502 (1,064.7%) |
| 2.0x to 2.9x | 1,100 (11.3%) | 1,825 (24.4%) |
| 3.0x to 3.9x | 901 (9.3%) | 1,168 (15.6%) |
| 4.0x or more | 4,200 (43.2%) | 1,033 (13.8%) |
| Total | 9,711 (100.0%) | 7,467 (100.0%) |
Real Estate Taxes by Mortgage Status in Gila County
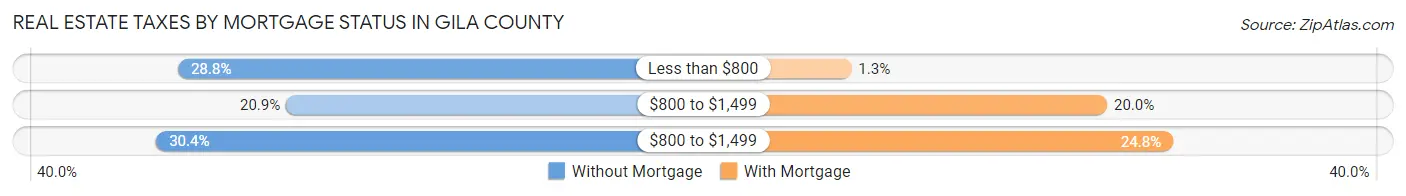
| Property Taxes | Without Mortgage | With Mortgage |
| Less than $800 | 2,796 (28.8%) | 100 (1.3%) |
| $800 to $1,499 | 2,030 (20.9%) | 1,495 (20.0%) |
| $800 to $1,499 | 2,950 (30.4%) | 1,855 (24.8%) |
| Total | 9,711 (100.0%) | 7,467 (100.0%) |
Health & Disability in Gila County
Health Insurance Coverage by Age in Gila County
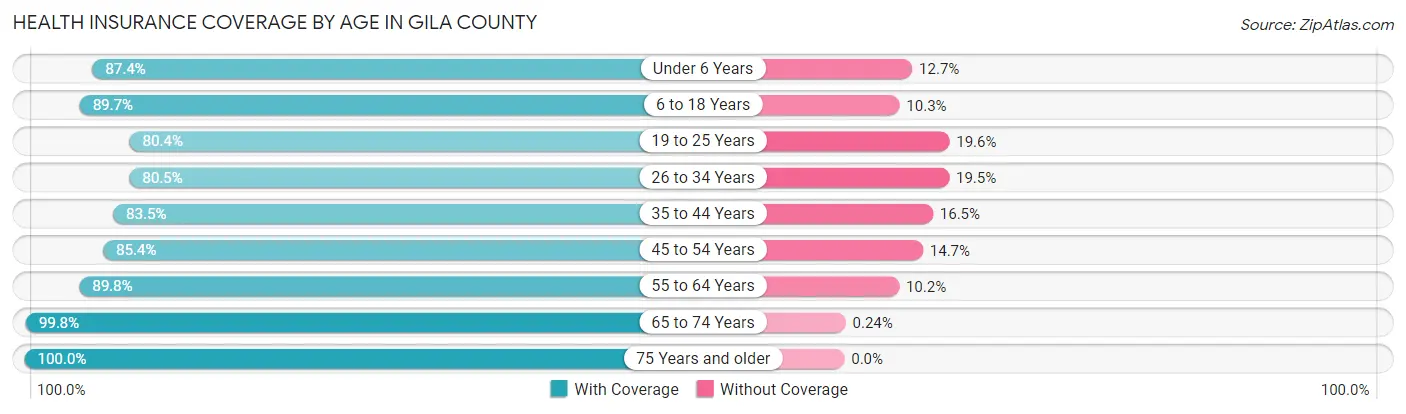
| Age Bracket | With Coverage | Without Coverage |
| Under 6 Years | 2,678 (87.4%) | 388 (12.7%) |
| 6 to 18 Years | 6,822 (89.7%) | 782 (10.3%) |
| 19 to 25 Years | 2,784 (80.4%) | 678 (19.6%) |
| 26 to 34 Years | 3,649 (80.5%) | 886 (19.5%) |
| 35 to 44 Years | 3,946 (83.5%) | 781 (16.5%) |
| 45 to 54 Years | 4,435 (85.4%) | 761 (14.6%) |
| 55 to 64 Years | 7,387 (89.8%) | 839 (10.2%) |
| 65 to 74 Years | 9,150 (99.8%) | 22 (0.2%) |
| 75 Years and older | 6,326 (100.0%) | 0 (0.0%) |
| Total | 47,177 (90.2%) | 5,137 (9.8%) |
Health Insurance Coverage by Citizenship Status in Gila County
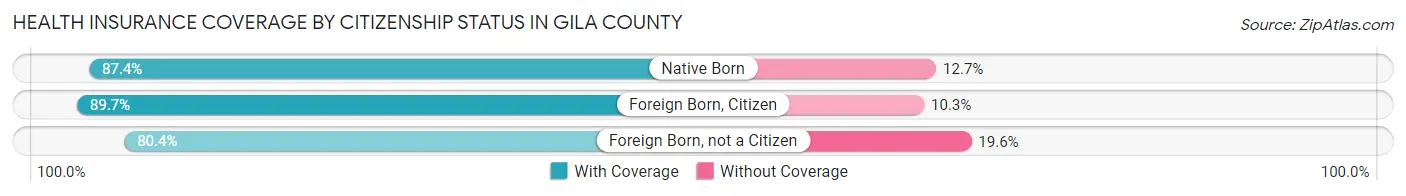
| Citizenship Status | With Coverage | Without Coverage |
| Native Born | 2,678 (87.4%) | 388 (12.7%) |
| Foreign Born, Citizen | 6,822 (89.7%) | 782 (10.3%) |
| Foreign Born, not a Citizen | 2,784 (80.4%) | 678 (19.6%) |
Health Insurance Coverage by Household Income in Gila County
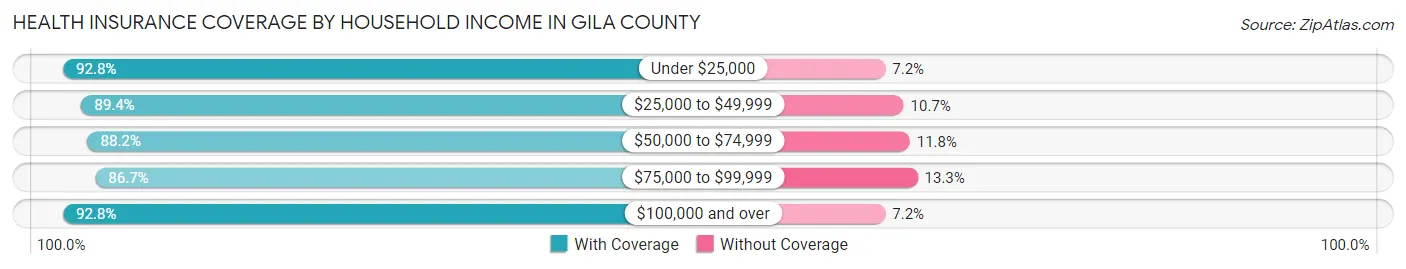
| Household Income | With Coverage | Without Coverage |
| Under $25,000 | 7,763 (92.8%) | 605 (7.2%) |
| $25,000 to $49,999 | 11,201 (89.3%) | 1,335 (10.6%) |
| $50,000 to $74,999 | 8,503 (88.2%) | 1,139 (11.8%) |
| $75,000 to $99,999 | 6,994 (86.7%) | 1,070 (13.3%) |
| $100,000 and over | 12,524 (92.8%) | 974 (7.2%) |
Public vs Private Health Insurance Coverage by Age in Gila County
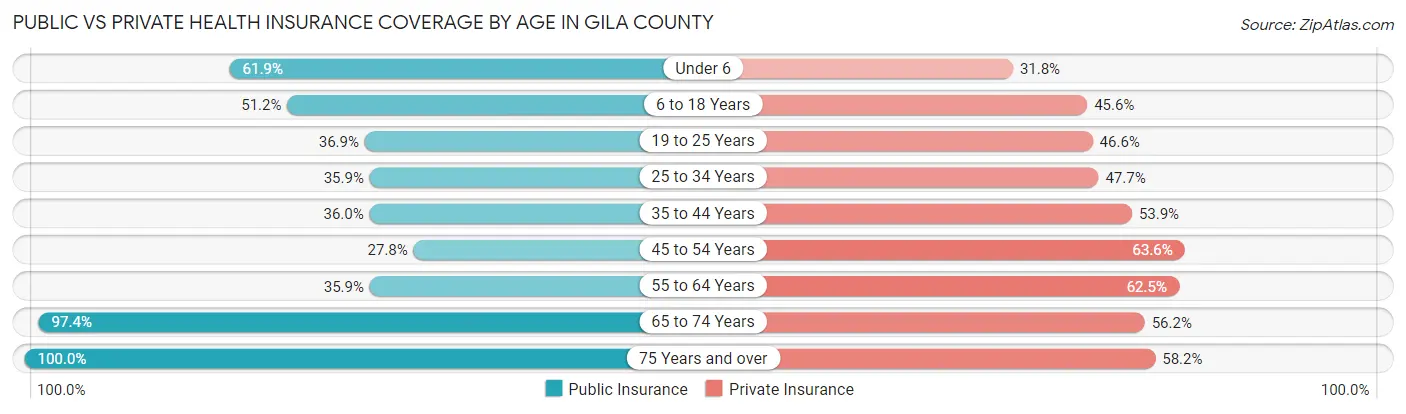
| Age Bracket | Public Insurance | Private Insurance |
| Under 6 | 1,899 (61.9%) | 974 (31.8%) |
| 6 to 18 Years | 3,896 (51.2%) | 3,464 (45.6%) |
| 19 to 25 Years | 1,276 (36.9%) | 1,612 (46.6%) |
| 25 to 34 Years | 1,630 (35.9%) | 2,161 (47.6%) |
| 35 to 44 Years | 1,701 (36.0%) | 2,546 (53.9%) |
| 45 to 54 Years | 1,444 (27.8%) | 3,306 (63.6%) |
| 55 to 64 Years | 2,956 (35.9%) | 5,144 (62.5%) |
| 65 to 74 Years | 8,932 (97.4%) | 5,157 (56.2%) |
| 75 Years and over | 6,326 (100.0%) | 3,681 (58.2%) |
| Total | 30,060 (57.5%) | 28,045 (53.6%) |
Disability Status by Sex by Age in Gila County
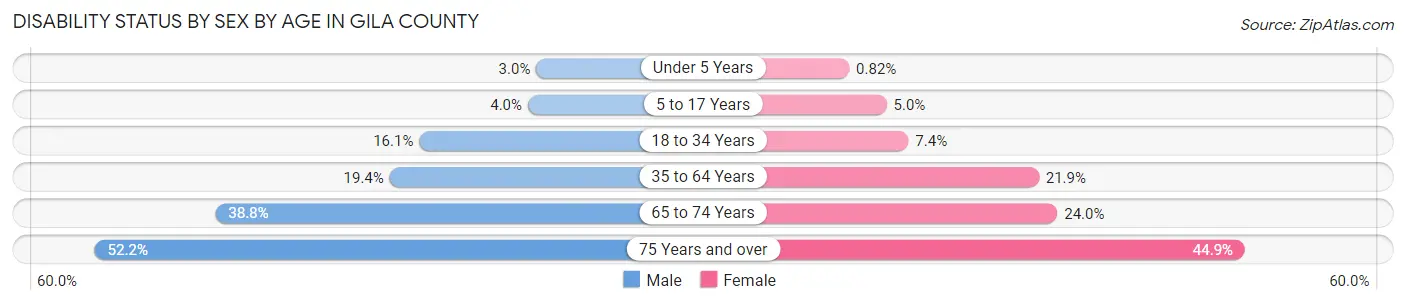
| Age Bracket | Male | Female |
| Under 5 Years | 39 (3.0%) | 10 (0.8%) |
| 5 to 17 Years | 158 (4.0%) | 190 (5.0%) |
| 18 to 34 Years | 670 (16.1%) | 309 (7.4%) |
| 35 to 64 Years | 1,700 (19.4%) | 2,054 (21.9%) |
| 65 to 74 Years | 1,770 (38.8%) | 1,105 (24.0%) |
| 75 Years and over | 1,600 (52.2%) | 1,464 (44.9%) |
Disability Class by Sex by Age in Gila County
Disability Class: Hearing Difficulty
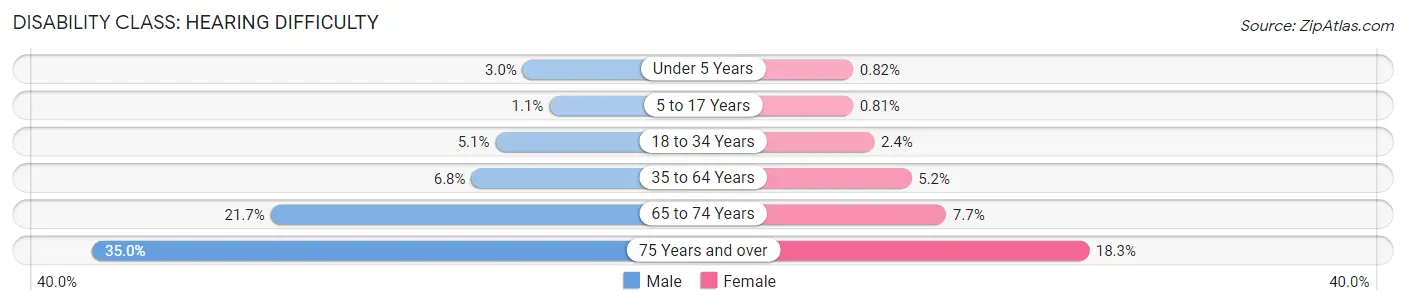
| Age Bracket | Male | Female |
| Under 5 Years | 39 (3.0%) | 10 (0.8%) |
| 5 to 17 Years | 42 (1.1%) | 31 (0.8%) |
| 18 to 34 Years | 211 (5.1%) | 100 (2.4%) |
| 35 to 64 Years | 600 (6.8%) | 483 (5.2%) |
| 65 to 74 Years | 993 (21.7%) | 356 (7.7%) |
| 75 Years and over | 1,072 (35.0%) | 598 (18.3%) |
Disability Class: Vision Difficulty
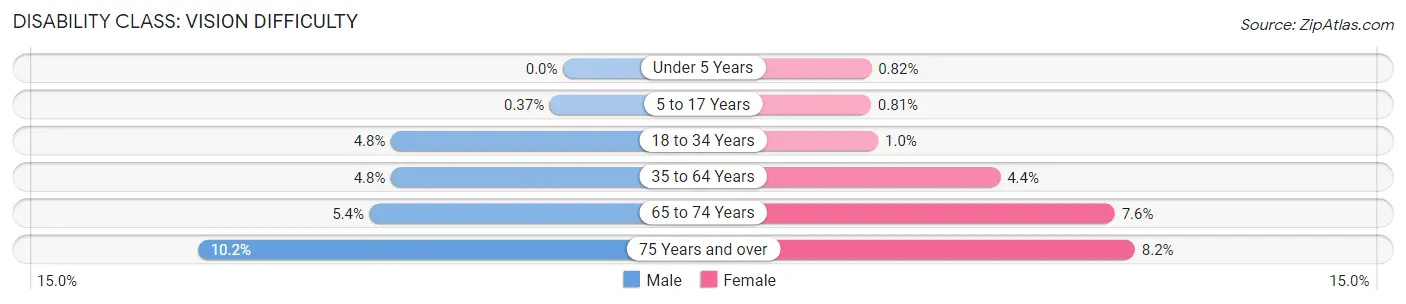
| Age Bracket | Male | Female |
| Under 5 Years | 0 (0.0%) | 10 (0.8%) |
| 5 to 17 Years | 15 (0.4%) | 31 (0.8%) |
| 18 to 34 Years | 200 (4.8%) | 42 (1.0%) |
| 35 to 64 Years | 421 (4.8%) | 413 (4.4%) |
| 65 to 74 Years | 246 (5.4%) | 350 (7.6%) |
| 75 Years and over | 312 (10.2%) | 266 (8.2%) |
Disability Class: Cognitive Difficulty
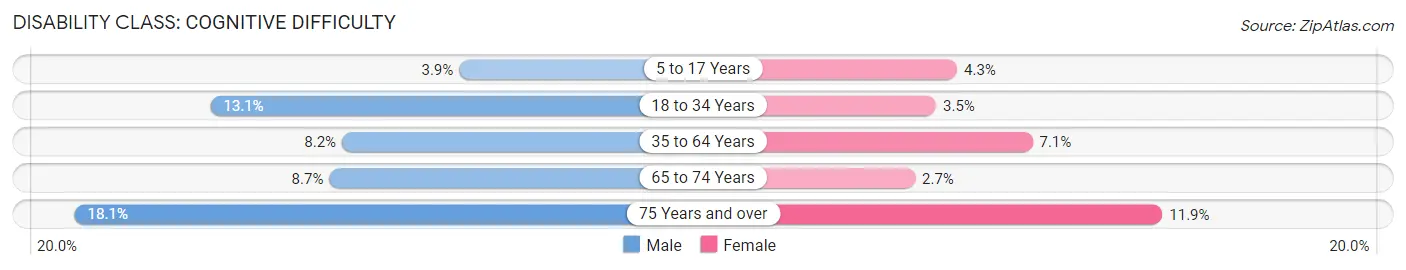
| Age Bracket | Male | Female |
| 5 to 17 Years | 155 (3.9%) | 163 (4.3%) |
| 18 to 34 Years | 547 (13.1%) | 146 (3.5%) |
| 35 to 64 Years | 722 (8.2%) | 663 (7.1%) |
| 65 to 74 Years | 397 (8.7%) | 125 (2.7%) |
| 75 Years and over | 556 (18.1%) | 388 (11.9%) |
Disability Class: Ambulatory Difficulty
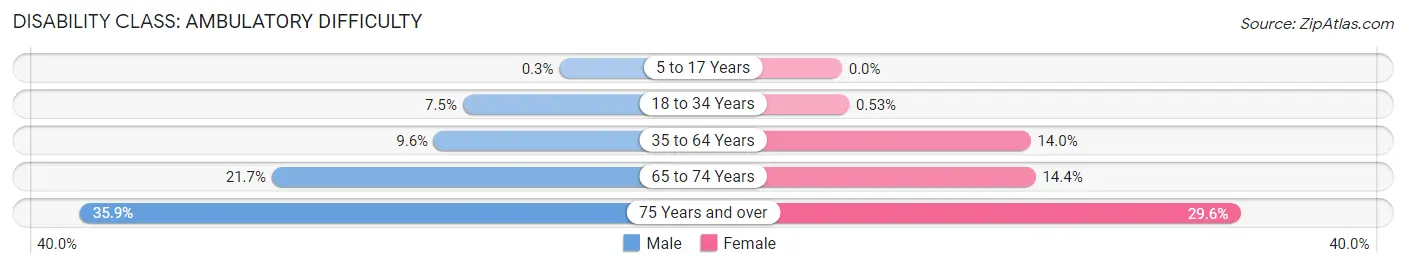
| Age Bracket | Male | Female |
| 5 to 17 Years | 12 (0.3%) | 0 (0.0%) |
| 18 to 34 Years | 312 (7.5%) | 22 (0.5%) |
| 35 to 64 Years | 844 (9.6%) | 1,312 (14.0%) |
| 65 to 74 Years | 989 (21.6%) | 662 (14.4%) |
| 75 Years and over | 1,100 (35.9%) | 964 (29.6%) |
Disability Class: Self-Care Difficulty
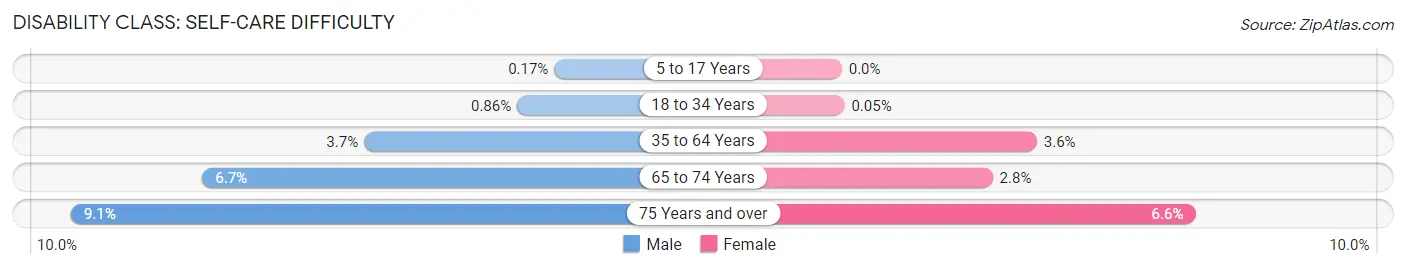
| Age Bracket | Male | Female |
| 5 to 17 Years | 7 (0.2%) | 0 (0.0%) |
| 18 to 34 Years | 36 (0.9%) | 2 (0.1%) |
| 35 to 64 Years | 325 (3.7%) | 339 (3.6%) |
| 65 to 74 Years | 306 (6.7%) | 129 (2.8%) |
| 75 Years and over | 280 (9.1%) | 214 (6.6%) |
Technology Access in Gila County
Computing Device Access in Gila County
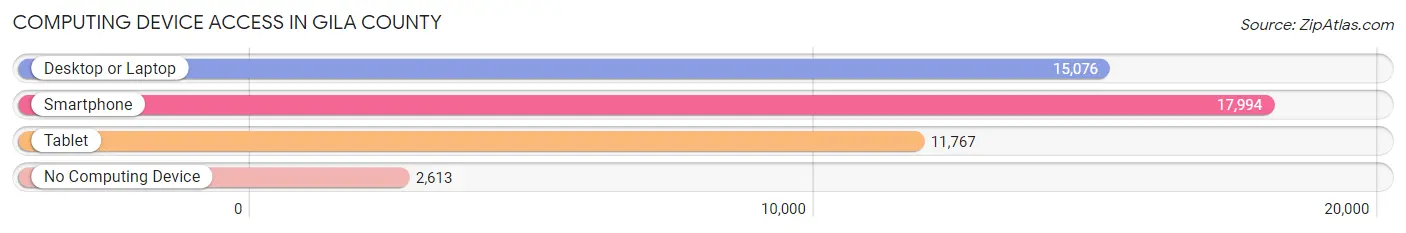
| Device Type | # Households | % Households |
| Desktop or Laptop | 15,076 | 66.4% |
| Smartphone | 17,994 | 79.2% |
| Tablet | 11,767 | 51.8% |
| No Computing Device | 2,613 | 11.5% |
| Total | 22,714 | 100.0% |
Internet Access in Gila County
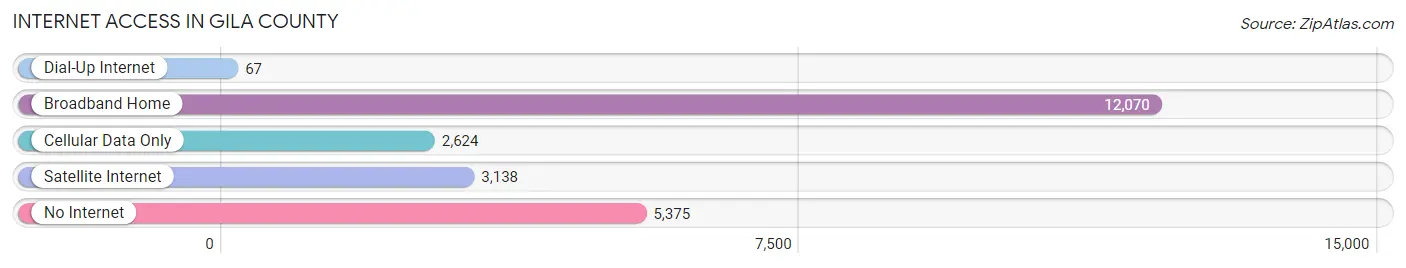
| Internet Type | # Households | % Households |
| Dial-Up Internet | 67 | 0.3% |
| Broadband Home | 12,070 | 53.1% |
| Cellular Data Only | 2,624 | 11.6% |
| Satellite Internet | 3,138 | 13.8% |
| No Internet | 5,375 | 23.7% |
| Total | 22,714 | 100.0% |
Gila County Summary
Gila County is located in the central part of Arizona, and is bordered by Maricopa County to the west, Pinal County to the south, Navajo County to the east, and Coconino County to the north. The county seat is Globe, and the largest city is Payson. Gila County covers an area of 4,795 square miles, making it the fifth largest county in Arizona. As of the 2010 census, the population of Gila County was 53,597.
Geography
Gila County is located in the central part of Arizona, and is bordered by Maricopa County to the west, Pinal County to the south, Navajo County to the east, and Coconino County to the north. The county covers an area of 4,795 square miles, making it the fifth largest county in Arizona. The county is divided into two distinct regions: the Mogollon Rim, which is a high plateau that runs along the eastern edge of the county, and the lower elevation of the Sonoran Desert, which covers the western portion of the county. The highest point in Gila County is Mount Ord, which has an elevation of 7,128 feet.
The county is home to several rivers, including the Gila River, the Salt River, and the San Carlos River. The Gila River is the largest river in the county, and is a major tributary of the Colorado River. The Salt River is a major tributary of the Gila River, and the San Carlos River is a tributary of the Salt River.
The county is home to several lakes, including Roosevelt Lake, Apache Lake, Canyon Lake, and Saguaro Lake. Roosevelt Lake is the largest lake in the county, and is a major reservoir on the Salt River. Apache Lake is a reservoir on the Apache River, and Canyon Lake and Saguaro Lake are reservoirs on the Salt River.
History
Gila County was established in 1881, and was named after the Gila River, which runs through the county. The county was originally part of the Arizona Territory, and was created from parts of Maricopa and Yavapai counties. The county seat was originally located in Globe, which was established in 1876.
The county was home to several Native American tribes, including the Apache, Yavapai, and Pima. The Apache were the dominant tribe in the area, and their territory included much of what is now Gila County.
The county was an important mining center during the late 19th and early 20th centuries. The county was home to several copper mines, including the Copper Queen Mine in Globe, and the Old Dominion Mine in Miami. The county was also home to several gold mines, including the Goldfield Mine in Globe, and the Gold Hill Mine in Miami.
Economy
Gila County has a diverse economy, with a mix of industries including agriculture, mining, manufacturing, tourism, and government. The county is home to several large employers, including the Gila County Sheriff’s Office, the Gila County Health Department, and the Gila County School District.
Agriculture is an important part of the county’s economy, and the county is home to several large farms and ranches. The county is also home to several wineries, and is a popular destination for wine tours.
Mining is also an important part of the county’s economy, and the county is home to several copper and gold mines. The county is also home to several large manufacturing companies, including the Payson-based Arizona Copper Company.
Tourism is also an important part of the county’s economy, and the county is home to several popular tourist attractions, including the Tonto National Monument, the Roosevelt Lake Recreation Area, and the Apache Trail.
Demographics
As of the 2010 census, the population of Gila County was 53,597. The population is spread out across the county, with the largest cities being Globe (population 7,532), Payson (population 15,301), and Miami (population 2,831).
The racial makeup of the county is predominantly white (83.3%), followed by Hispanic or Latino (9.3%), Native American (3.2%), and Asian (1.2%). The median household income in the county is $41,945, and the median age is 44.7 years.
Common Questions
What is Per Capita Income in Gila County?
Per Capita income in Gila County is $29,945.
What is the Median Family Income in Gila County?
Median Family Income in Gila County is $64,786.
What is the Median Household income in Gila County?
Median Household Income in Gila County is $55,242.
What is Income or Wage Gap in Gila County?
Income or Wage Gap in Gila County is 27.7%.
Women in Gila County earn 72.3 cents for every dollar earned by a man.
What is Family Income Deficit in Gila County?
Family Income Deficit in Gila County is $11,637.
Families that are below poverty line in Gila County earn $11,637 less on average than the poverty threshold level.
What is Inequality or Gini Index in Gila County?
Inequality or Gini Index in Gila County is 0.44.
What is the Total Population of Gila County?
Total Population of Gila County is 53,419.
What is the Total Male Population of Gila County?
Total Male Population of Gila County is 26,688.
What is the Total Female Population of Gila County?
Total Female Population of Gila County is 26,731.
What is the Ratio of Males per 100 Females in Gila County?
There are 99.84 Males per 100 Females in Gila County.
What is the Ratio of Females per 100 Males in Gila County?
There are 100.16 Females per 100 Males in Gila County.
What is the Median Population Age in Gila County?
Median Population Age in Gila County is 50.6 Years.
What is the Average Family Size in Gila County
Average Family Size in Gila County is 2.9 People.
What is the Average Household Size in Gila County
Average Household Size in Gila County is 2.3 People.
How Large is the Labor Force in Gila County?
There are 20,174 People in the Labor Forcein in Gila County.
What is the Percentage of People in the Labor Force in Gila County?
45.7% of People are in the Labor Force in Gila County.
What is the Unemployment Rate in Gila County?
Unemployment Rate in Gila County is 6.9%.