Cochise County, AZ Map & Demographics
Cochise County Map
Cochise County Overview
$31,423
PER CAPITA INCOME
$73,643
AVG FAMILY INCOME
$58,421
AVG HOUSEHOLD INCOME
30.7%
WAGE / INCOME GAP [ % ]
69.3¢/ $1
WAGE / INCOME GAP [ $ ]
$10,867
FAMILY INCOME DEFICIT
0.44
INEQUALITY / GINI INDEX
125,504
TOTAL POPULATION
64,221
MALE POPULATION
61,283
FEMALE POPULATION
104.79
MALES / 100 FEMALES
95.43
FEMALES / 100 MALES
41.4
MEDIAN AGE
3.1
AVG FAMILY SIZE
2.4
AVG HOUSEHOLD SIZE
51,094
LABOR FORCE [ PEOPLE ]
50.1%
PERCENT IN LABOR FORCE
6.8%
UNEMPLOYMENT RATE
Cochise County Area Codes
Income in Cochise County
Income Overview in Cochise County
Per Capita Income in Cochise County is $31,423, while median incomes of families and households are $73,643 and $58,421 respectively.
| Characteristic | Number | Measure |
| Per Capita Income | 125,504 | $31,423 |
| Median Family Income | 30,471 | $73,643 |
| Mean Family Income | 30,471 | $89,546 |
| Median Household Income | 49,680 | $58,421 |
| Mean Household Income | 49,680 | $75,274 |
| Income Deficit | 30,471 | $10,867 |
| Wage / Income Gap (%) | 125,504 | 30.75% |
| Wage / Income Gap ($) | 125,504 | 69.25¢ per $1 |
| Gini / Inequality Index | 125,504 | 0.44 |
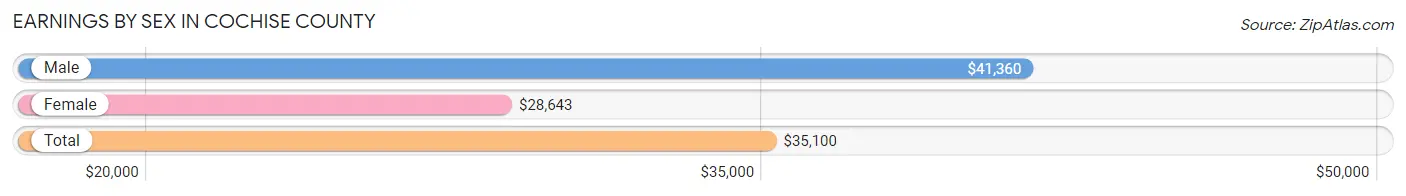
Earnings by Sex in Cochise County
Average Earnings in Cochise County are $35,100, $41,360 for men and $28,643 for women, a difference of 30.7%.
| Sex | Number | Average Earnings |
| Male | 30,817 (56.3%) | $41,360 |
| Female | 23,910 (43.7%) | $28,643 |
| Total | 54,727 (100.0%) | $35,100 |
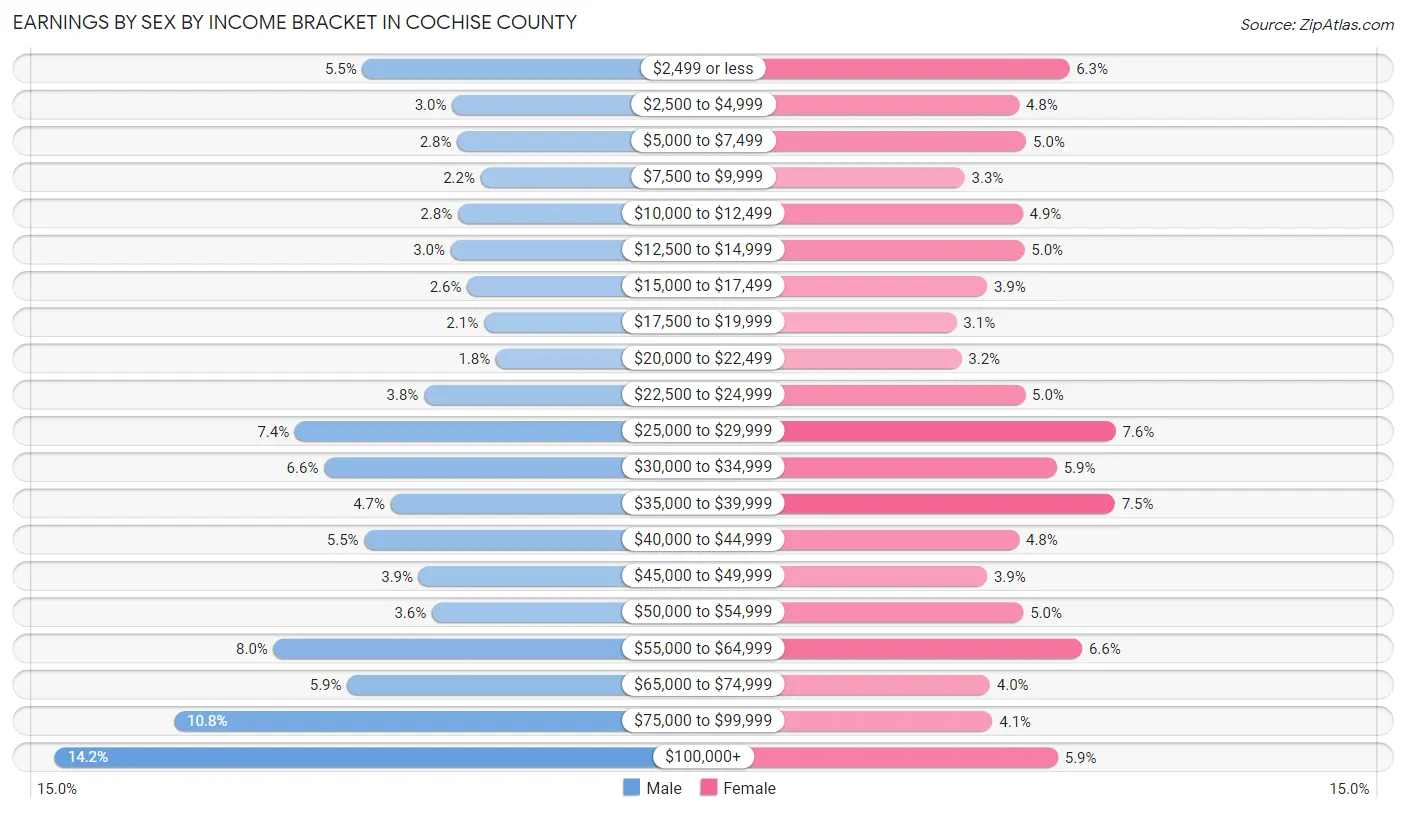
Earnings by Sex by Income Bracket in Cochise County
The most common earnings brackets in Cochise County are $100,000+ for men (4,362 | 14.1%) and $25,000 to $29,999 for women (1,805 | 7.5%).
| Income | Male | Female |
| $2,499 or less | 1,696 (5.5%) | 1,494 (6.2%) |
| $2,500 to $4,999 | 919 (3.0%) | 1,158 (4.8%) |
| $5,000 to $7,499 | 875 (2.8%) | 1,206 (5.0%) |
| $7,500 to $9,999 | 671 (2.2%) | 791 (3.3%) |
| $10,000 to $12,499 | 870 (2.8%) | 1,180 (4.9%) |
| $12,500 to $14,999 | 930 (3.0%) | 1,194 (5.0%) |
| $15,000 to $17,499 | 788 (2.6%) | 943 (3.9%) |
| $17,500 to $19,999 | 644 (2.1%) | 736 (3.1%) |
| $20,000 to $22,499 | 539 (1.8%) | 770 (3.2%) |
| $22,500 to $24,999 | 1,163 (3.8%) | 1,197 (5.0%) |
| $25,000 to $29,999 | 2,281 (7.4%) | 1,805 (7.5%) |
| $30,000 to $34,999 | 2,027 (6.6%) | 1,411 (5.9%) |
| $35,000 to $39,999 | 1,450 (4.7%) | 1,801 (7.5%) |
| $40,000 to $44,999 | 1,679 (5.4%) | 1,157 (4.8%) |
| $45,000 to $49,999 | 1,209 (3.9%) | 942 (3.9%) |
| $50,000 to $54,999 | 1,093 (3.5%) | 1,187 (5.0%) |
| $55,000 to $64,999 | 2,465 (8.0%) | 1,581 (6.6%) |
| $65,000 to $74,999 | 1,828 (5.9%) | 962 (4.0%) |
| $75,000 to $99,999 | 3,328 (10.8%) | 978 (4.1%) |
| $100,000+ | 4,362 (14.1%) | 1,417 (5.9%) |
| Total | 30,817 (100.0%) | 23,910 (100.0%) |
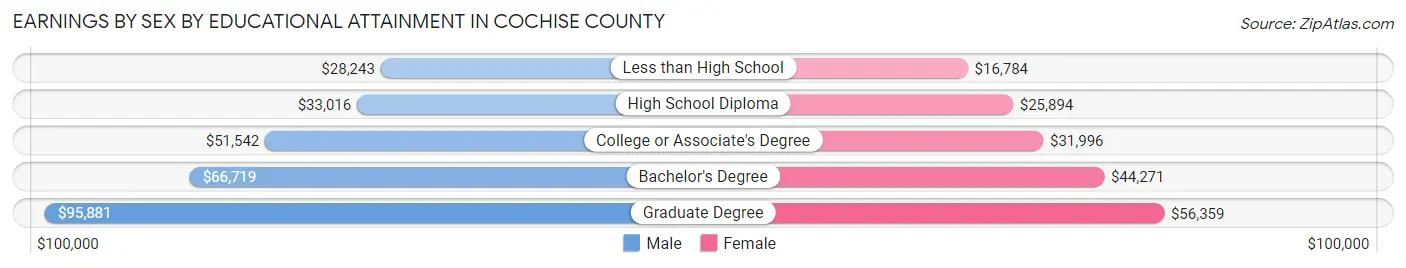
Earnings by Sex by Educational Attainment in Cochise County
Average earnings in Cochise County are $49,013 for men and $32,522 for women, a difference of 33.7%. Men with an educational attainment of graduate degree enjoy the highest average annual earnings of $95,881, while those with less than high school education earn the least with $28,243. Women with an educational attainment of graduate degree earn the most with the average annual earnings of $56,359, while those with less than high school education have the smallest earnings of $16,784.
| Educational Attainment | Male Income | Female Income |
| Less than High School | $28,243 | $16,784 |
| High School Diploma | $33,016 | $25,894 |
| College or Associate's Degree | $51,542 | $31,996 |
| Bachelor's Degree | $66,719 | $44,271 |
| Graduate Degree | $95,881 | $56,359 |
| Total | $49,013 | $32,522 |
Family Income in Cochise County
Family Income Brackets in Cochise County
According to the Cochise County family income data, there are 6,186 families falling into the $50,000 to $74,999 income range, which is the most common income bracket and makes up 20.3% of all families. Conversely, the $10,000 to $14,999 income bracket is the least frequent group with only 853 families (2.8%) belonging to this category.
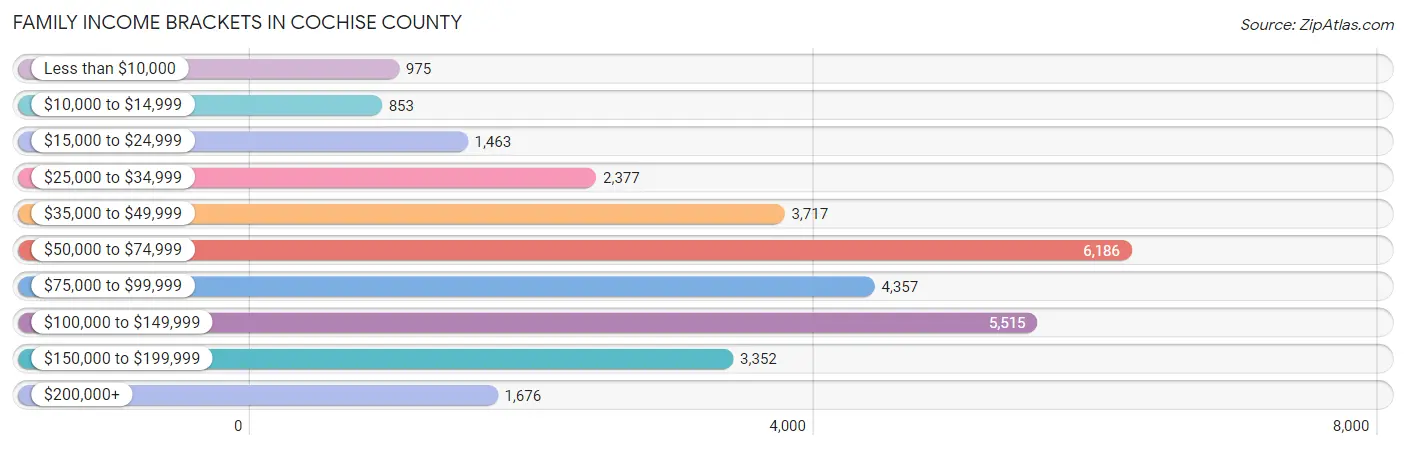
| Income Bracket | # Families | % Families |
| Less than $10,000 | 975 | 3.2% |
| $10,000 to $14,999 | 853 | 2.8% |
| $15,000 to $24,999 | 1,463 | 4.8% |
| $25,000 to $34,999 | 2,377 | 7.8% |
| $35,000 to $49,999 | 3,717 | 12.2% |
| $50,000 to $74,999 | 6,186 | 20.3% |
| $75,000 to $99,999 | 4,357 | 14.3% |
| $100,000 to $149,999 | 5,515 | 18.1% |
| $150,000 to $199,999 | 3,352 | 11.0% |
| $200,000+ | 1,676 | 5.5% |
Family Income by Famaliy Size in Cochise County
5-person families (2,290 | 7.5%) account for the highest median family income in Cochise County with $88,352 per family, while 2-person families (16,415 | 53.9%) have the highest median income of $35,954 per family member.
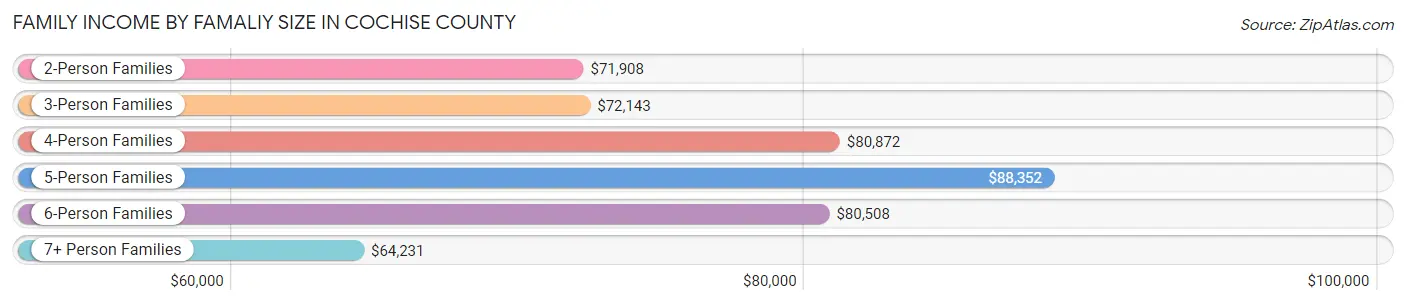
| Income Bracket | # Families | Median Income |
| 2-Person Families | 16,415 (53.9%) | $71,908 |
| 3-Person Families | 5,492 (18.0%) | $72,143 |
| 4-Person Families | 4,621 (15.2%) | $80,872 |
| 5-Person Families | 2,290 (7.5%) | $88,352 |
| 6-Person Families | 1,009 (3.3%) | $80,508 |
| 7+ Person Families | 644 (2.1%) | $64,231 |
| Total | 30,471 (100.0%) | $73,643 |
Family Income by Number of Earners in Cochise County
The median family income in Cochise County is $73,643, with families comprising 3+ earners (2,154) having the highest median family income of $113,773, while families with no earners (6,980) have the lowest median family income of $53,444, accounting for 7.1% and 22.9% of families, respectively.
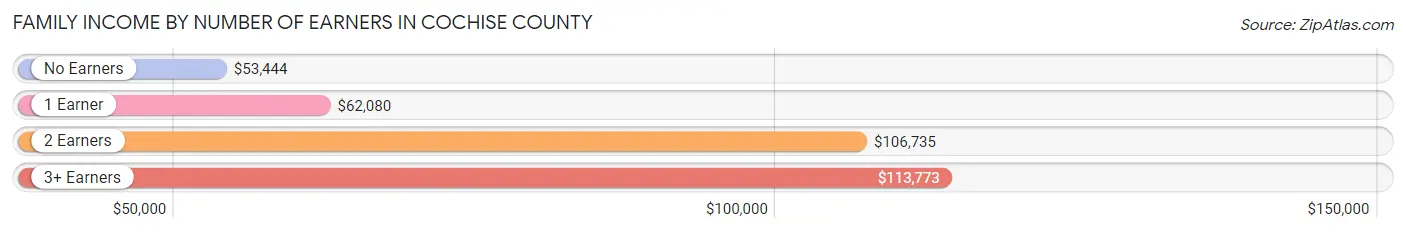
| Number of Earners | # Families | Median Income |
| No Earners | 6,980 (22.9%) | $53,444 |
| 1 Earner | 11,659 (38.3%) | $62,080 |
| 2 Earners | 9,678 (31.8%) | $106,735 |
| 3+ Earners | 2,154 (7.1%) | $113,773 |
| Total | 30,471 (100.0%) | $73,643 |
Household Income in Cochise County
Household Income Brackets in Cochise County
With 8,942 households falling in the category, the $50,000 to $74,999 income range is the most frequent in Cochise County, accounting for 18.0% of all households. In contrast, only 1,987 households (4.0%) fall into the $200,000+ income bracket, making it the least populous group.
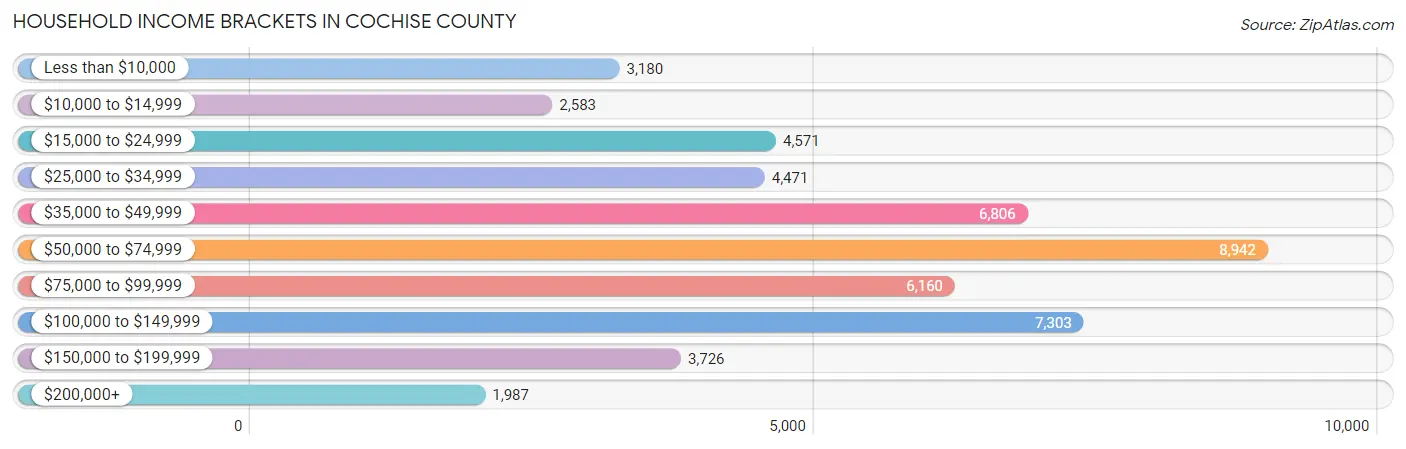
| Income Bracket | # Households | % Households |
| Less than $10,000 | 3,180 | 6.4% |
| $10,000 to $14,999 | 2,583 | 5.2% |
| $15,000 to $24,999 | 4,571 | 9.2% |
| $25,000 to $34,999 | 4,471 | 9.0% |
| $35,000 to $49,999 | 6,806 | 13.7% |
| $50,000 to $74,999 | 8,942 | 18.0% |
| $75,000 to $99,999 | 6,160 | 12.4% |
| $100,000 to $149,999 | 7,303 | 14.7% |
| $150,000 to $199,999 | 3,726 | 7.5% |
| $200,000+ | 1,987 | 4.0% |
Household Income by Householder Age in Cochise County
The median household income in Cochise County is $58,421, with the highest median household income of $71,100 found in the 45 to 64 years age bracket for the primary householder. A total of 15,978 households (32.2%) fall into this category. Meanwhile, the 15 to 24 years age bracket for the primary householder has the lowest median household income of $43,651, with 1,215 households (2.5%) in this group.
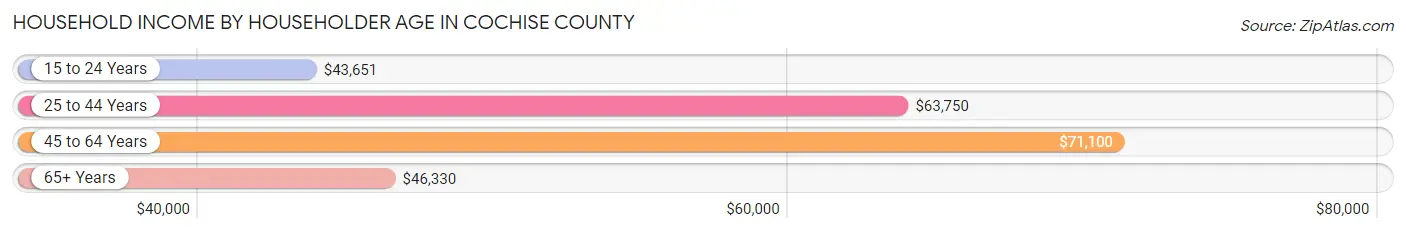
| Income Bracket | # Households | Median Income |
| 15 to 24 Years | 1,215 (2.5%) | $43,651 |
| 25 to 44 Years | 13,345 (26.9%) | $63,750 |
| 45 to 64 Years | 15,978 (32.2%) | $71,100 |
| 65+ Years | 19,142 (38.5%) | $46,330 |
| Total | 49,680 (100.0%) | $58,421 |
Poverty in Cochise County
Income Below Poverty by Sex and Age in Cochise County
With 13.1% poverty level for males and 16.3% for females among the residents of Cochise County, 12 to 14 year old males and 12 to 14 year old females are the most vulnerable to poverty, with 525 males (24.1%) and 576 females (25.8%) in their respective age groups living below the poverty level.
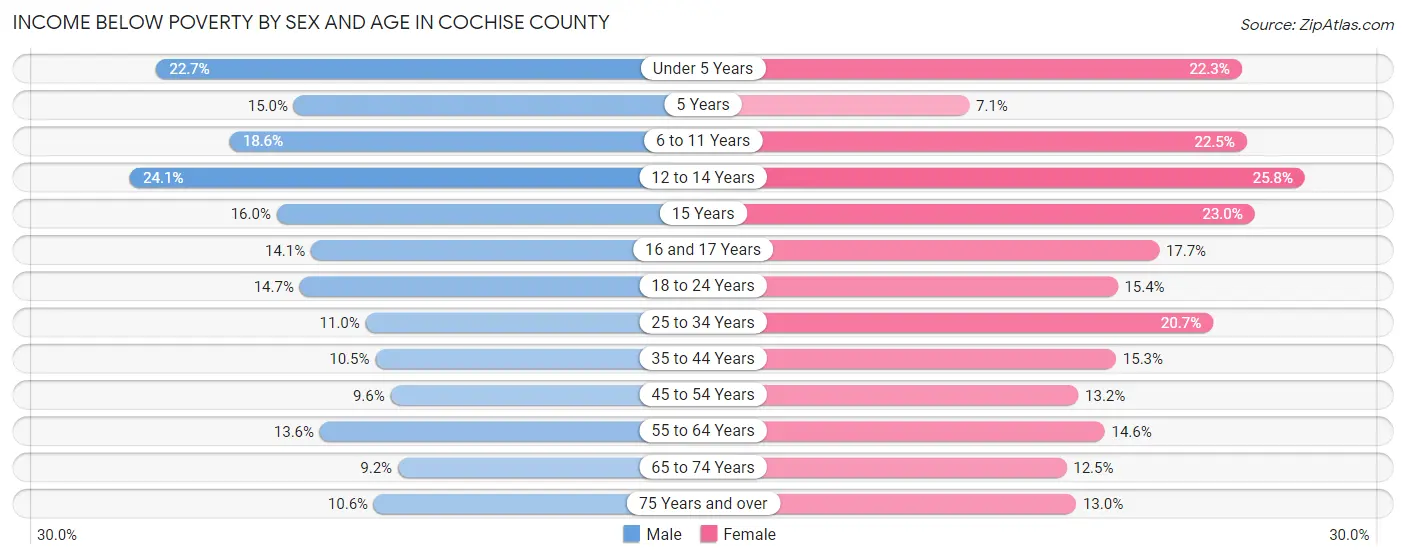
| Age Bracket | Male | Female |
| Under 5 Years | 756 (22.7%) | 732 (22.3%) |
| 5 Years | 134 (15.0%) | 51 (7.1%) |
| 6 to 11 Years | 826 (18.6%) | 985 (22.5%) |
| 12 to 14 Years | 525 (24.1%) | 576 (25.8%) |
| 15 Years | 136 (16.0%) | 165 (23.0%) |
| 16 and 17 Years | 211 (14.1%) | 254 (17.7%) |
| 18 to 24 Years | 674 (14.7%) | 682 (15.3%) |
| 25 to 34 Years | 799 (11.0%) | 1,451 (20.7%) |
| 35 to 44 Years | 690 (10.5%) | 1,004 (15.3%) |
| 45 to 54 Years | 579 (9.6%) | 826 (13.2%) |
| 55 to 64 Years | 998 (13.6%) | 1,244 (14.6%) |
| 65 to 74 Years | 743 (9.2%) | 1,050 (12.5%) |
| 75 Years and over | 608 (10.5%) | 854 (13.0%) |
| Total | 7,679 (13.1%) | 9,874 (16.3%) |
Income Above Poverty by Sex and Age in Cochise County
According to the poverty statistics in Cochise County, males aged 65 to 74 years and females aged 5 years are the age groups that are most secure financially, with 90.8% of males and 92.9% of females in these age groups living above the poverty line.
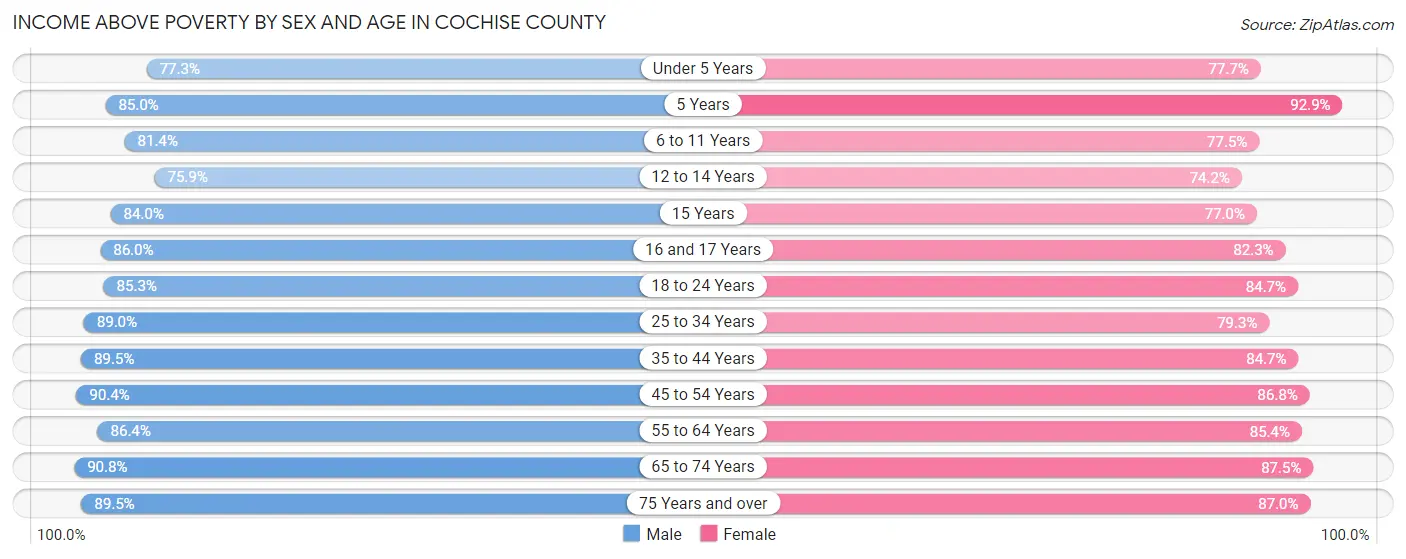
| Age Bracket | Male | Female |
| Under 5 Years | 2,580 (77.3%) | 2,557 (77.7%) |
| 5 Years | 759 (85.0%) | 668 (92.9%) |
| 6 to 11 Years | 3,623 (81.4%) | 3,385 (77.5%) |
| 12 to 14 Years | 1,652 (75.9%) | 1,658 (74.2%) |
| 15 Years | 716 (84.0%) | 553 (77.0%) |
| 16 and 17 Years | 1,291 (86.0%) | 1,184 (82.3%) |
| 18 to 24 Years | 3,917 (85.3%) | 3,761 (84.7%) |
| 25 to 34 Years | 6,456 (89.0%) | 5,570 (79.3%) |
| 35 to 44 Years | 5,900 (89.5%) | 5,576 (84.7%) |
| 45 to 54 Years | 5,437 (90.4%) | 5,450 (86.8%) |
| 55 to 64 Years | 6,360 (86.4%) | 7,257 (85.4%) |
| 65 to 74 Years | 7,325 (90.8%) | 7,352 (87.5%) |
| 75 Years and over | 5,154 (89.4%) | 5,694 (87.0%) |
| Total | 51,170 (87.0%) | 50,665 (83.7%) |
Income Below Poverty Among Married-Couple Families in Cochise County
The poverty statistics for married-couple families in Cochise County show that 4.7% or 1,086 of the total 22,930 families live below the poverty line. Families with 5 or more children have the highest poverty rate of 37.6%, comprising of 88 families. On the other hand, families with no children have the lowest poverty rate of 3.1%, which includes 453 families.
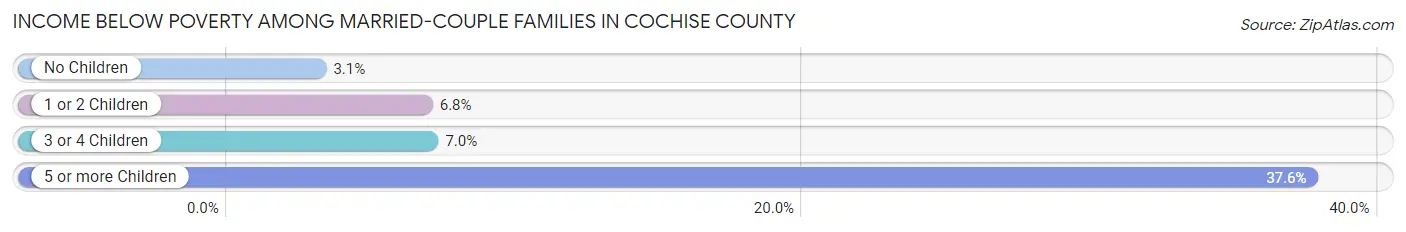
| Children | Above Poverty | Below Poverty |
| No Children | 14,276 (96.9%) | 453 (3.1%) |
| 1 or 2 Children | 5,277 (93.2%) | 384 (6.8%) |
| 3 or 4 Children | 2,145 (93.0%) | 161 (7.0%) |
| 5 or more Children | 146 (62.4%) | 88 (37.6%) |
| Total | 21,844 (95.3%) | 1,086 (4.7%) |
Income Below Poverty Among Single-Parent Households in Cochise County
According to the poverty data in Cochise County, 15.9% or 360 single-father households and 30.3% or 1,601 single-mother households are living below the poverty line. Among single-father households, those with 5 or more children have the highest poverty rate, with 16 households (100.0%) experiencing poverty. Likewise, among single-mother households, those with 5 or more children have the highest poverty rate, with 58 households (85.3%) falling below the poverty line.
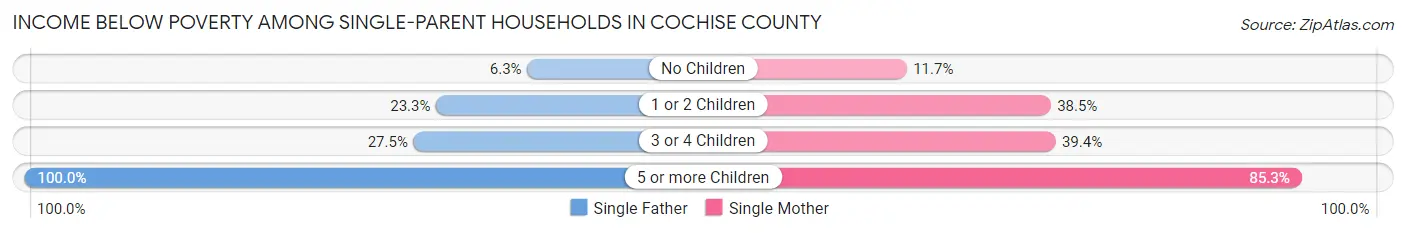
| Children | Single Father | Single Mother |
| No Children | 69 (6.3%) | 203 (11.7%) |
| 1 or 2 Children | 245 (23.3%) | 1,059 (38.5%) |
| 3 or 4 Children | 30 (27.5%) | 281 (39.4%) |
| 5 or more Children | 16 (100.0%) | 58 (85.3%) |
| Total | 360 (15.9%) | 1,601 (30.3%) |
Income Below Poverty Among Married-Couple vs Single-Parent Households in Cochise County
The poverty data for Cochise County shows that 1,086 of the married-couple family households (4.7%) and 1,961 of the single-parent households (26.0%) are living below the poverty level. Within the married-couple family households, those with 5 or more children have the highest poverty rate, with 88 households (37.6%) falling below the poverty line. Among the single-parent households, those with 5 or more children have the highest poverty rate, with 74 household (88.1%) living below poverty.
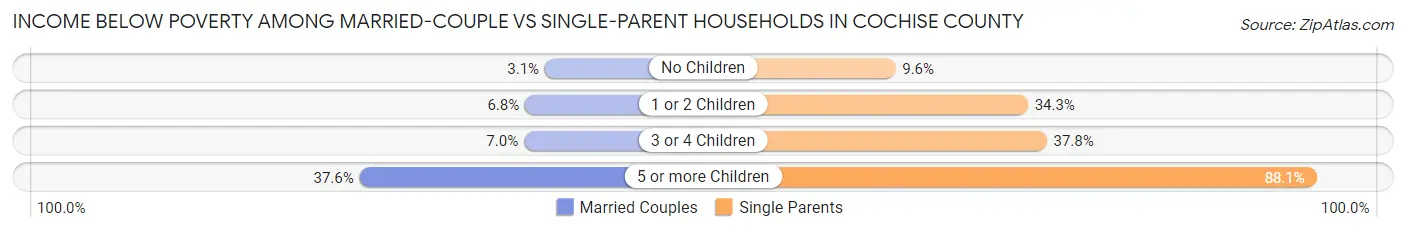
| Children | Married-Couple Families | Single-Parent Households |
| No Children | 453 (3.1%) | 272 (9.6%) |
| 1 or 2 Children | 384 (6.8%) | 1,304 (34.3%) |
| 3 or 4 Children | 161 (7.0%) | 311 (37.8%) |
| 5 or more Children | 88 (37.6%) | 74 (88.1%) |
| Total | 1,086 (4.7%) | 1,961 (26.0%) |
Race in Cochise County
The most populous races in Cochise County are White / Caucasian (89,661 | 71.4%), Hispanic or Latino (44,809 | 35.7%), and Two or more Races (21,481 | 17.1%).
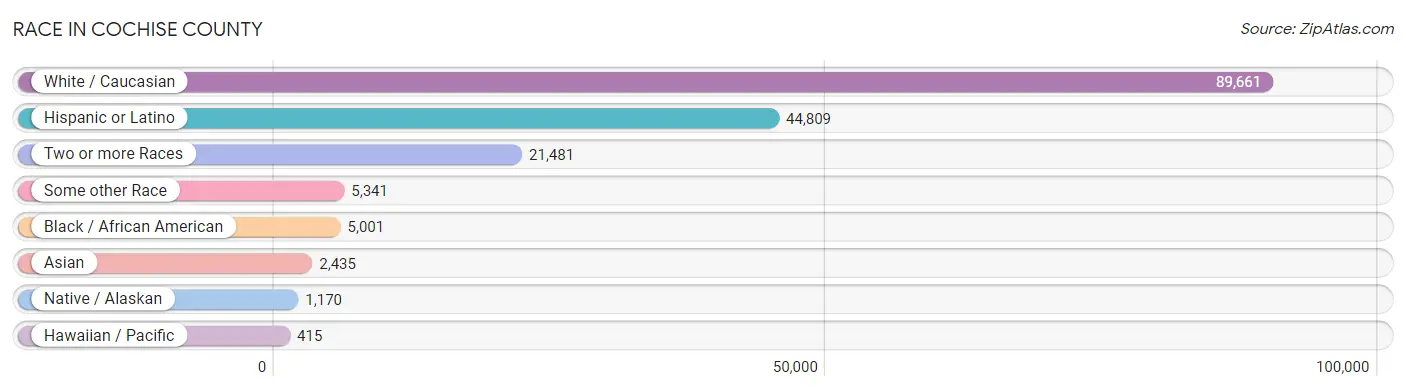
| Race | # Population | % Population |
| Asian | 2,435 | 1.9% |
| Black / African American | 5,001 | 4.0% |
| Hawaiian / Pacific | 415 | 0.3% |
| Hispanic or Latino | 44,809 | 35.7% |
| Native / Alaskan | 1,170 | 0.9% |
| White / Caucasian | 89,661 | 71.4% |
| Two or more Races | 21,481 | 17.1% |
| Some other Race | 5,341 | 4.3% |
| Total | 125,504 | 100.0% |
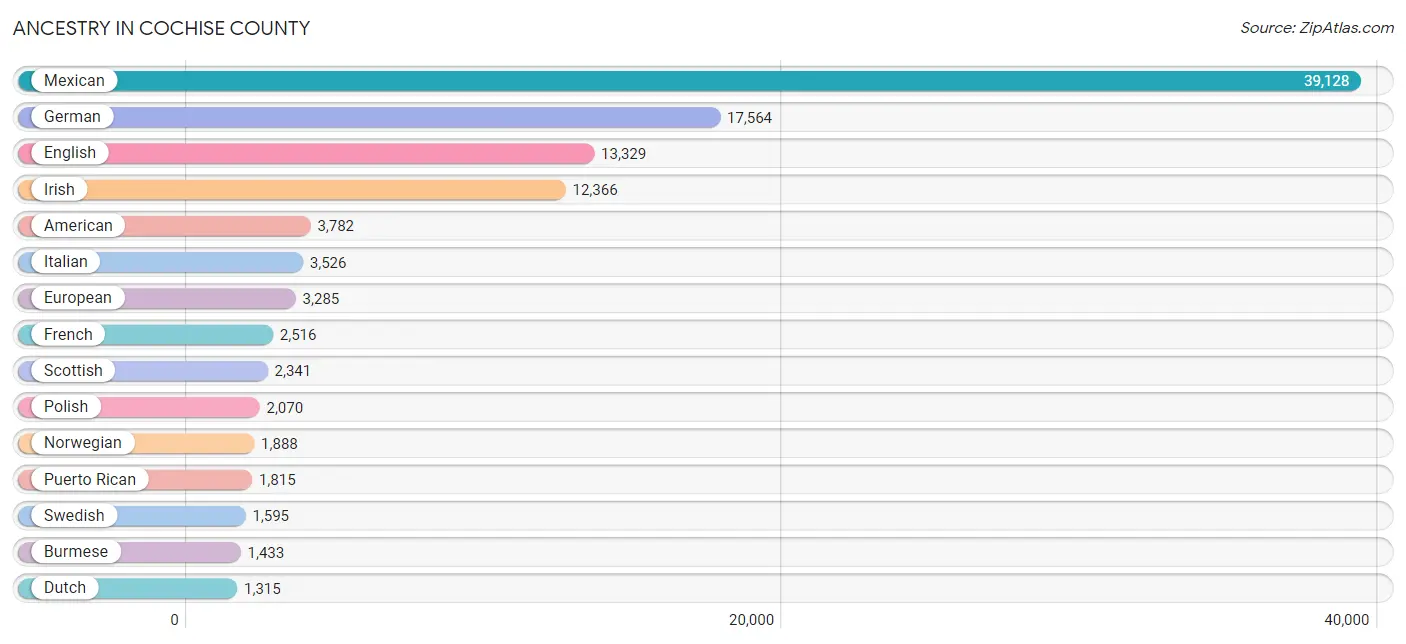
Ancestry in Cochise County
The most populous ancestries reported in Cochise County are Mexican (39,128 | 31.2%), German (17,564 | 14.0%), English (13,329 | 10.6%), Irish (12,366 | 9.9%), and American (3,782 | 3.0%), together accounting for 68.6% of all Cochise County residents.
| Ancestry | # Population | % Population |
| African | 364 | 0.3% |
| Alaskan Athabascan | 4 | 0.0% |
| Albanian | 19 | 0.0% |
| Alsatian | 6 | 0.0% |
| American | 3,782 | 3.0% |
| Apache | 137 | 0.1% |
| Arab | 345 | 0.3% |
| Argentinean | 94 | 0.1% |
| Armenian | 33 | 0.0% |
| Assyrian / Chaldean / Syriac | 47 | 0.0% |
| Australian | 44 | 0.0% |
| Austrian | 336 | 0.3% |
| Bangladeshi | 12 | 0.0% |
| Barbadian | 2 | 0.0% |
| Basque | 4 | 0.0% |
| Belgian | 75 | 0.1% |
| Bhutanese | 613 | 0.5% |
| Blackfeet | 117 | 0.1% |
| British | 684 | 0.5% |
| Bulgarian | 53 | 0.0% |
| Burmese | 1,433 | 1.1% |
| Cambodian | 44 | 0.0% |
| Canadian | 222 | 0.2% |
| Celtic | 26 | 0.0% |
| Central American | 990 | 0.8% |
| Central American Indian | 110 | 0.1% |
| Cherokee | 457 | 0.4% |
| Chickasaw | 52 | 0.0% |
| Chilean | 38 | 0.0% |
| Chinese | 91 | 0.1% |
| Chippewa | 34 | 0.0% |
| Choctaw | 47 | 0.0% |
| Colombian | 77 | 0.1% |
| Comanche | 80 | 0.1% |
| Costa Rican | 69 | 0.1% |
| Cree | 17 | 0.0% |
| Creek | 25 | 0.0% |
| Croatian | 75 | 0.1% |
| Crow | 9 | 0.0% |
| Cuban | 232 | 0.2% |
| Czech | 257 | 0.2% |
| Czechoslovakian | 132 | 0.1% |
| Danish | 564 | 0.4% |
| Dominican | 154 | 0.1% |
| Dutch | 1,315 | 1.1% |
| Dutch West Indian | 14 | 0.0% |
| Eastern European | 339 | 0.3% |
| Ecuadorian | 129 | 0.1% |
| Egyptian | 15 | 0.0% |
| English | 13,329 | 10.6% |
| Ethiopian | 17 | 0.0% |
| European | 3,285 | 2.6% |
| Filipino | 61 | 0.1% |
| Finnish | 301 | 0.2% |
| French | 2,516 | 2.0% |
| French Canadian | 691 | 0.5% |
| German | 17,564 | 14.0% |
| Greek | 231 | 0.2% |
| Guamanian / Chamorro | 135 | 0.1% |
| Guatemalan | 326 | 0.3% |
| Guyanese | 49 | 0.0% |
| Haitian | 21 | 0.0% |
| Honduran | 65 | 0.1% |
| Hopi | 176 | 0.1% |
| Hungarian | 294 | 0.2% |
| Indian (Asian) | 468 | 0.4% |
| Indonesian | 9 | 0.0% |
| Iranian | 75 | 0.1% |
| Iraqi | 5 | 0.0% |
| Irish | 12,366 | 9.9% |
| Iroquois | 15 | 0.0% |
| Italian | 3,526 | 2.8% |
| Jamaican | 69 | 0.1% |
| Japanese | 99 | 0.1% |
| Jordanian | 50 | 0.0% |
| Kiowa | 10 | 0.0% |
| Korean | 1,096 | 0.9% |
| Laotian | 52 | 0.0% |
| Latvian | 68 | 0.1% |
| Lebanese | 90 | 0.1% |
| Lithuanian | 147 | 0.1% |
| Luxembourger | 22 | 0.0% |
| Malaysian | 44 | 0.0% |
| Mexican | 39,128 | 31.2% |
| Mexican American Indian | 126 | 0.1% |
| Moroccan | 69 | 0.1% |
| Native Hawaiian | 405 | 0.3% |
| Navajo | 358 | 0.3% |
| Nicaraguan | 40 | 0.0% |
| Nigerian | 75 | 0.1% |
| Northern European | 398 | 0.3% |
| Norwegian | 1,888 | 1.5% |
| Osage | 7 | 0.0% |
| Ottawa | 11 | 0.0% |
| Pakistani | 73 | 0.1% |
| Panamanian | 347 | 0.3% |
| Pennsylvania German | 19 | 0.0% |
| Peruvian | 55 | 0.0% |
| Pima | 22 | 0.0% |
| Polish | 2,070 | 1.7% |
| Portuguese | 141 | 0.1% |
| Potawatomi | 43 | 0.0% |
| Pueblo | 37 | 0.0% |
| Puerto Rican | 1,815 | 1.5% |
| Romanian | 98 | 0.1% |
| Russian | 443 | 0.4% |
| Salvadoran | 143 | 0.1% |
| Scandinavian | 392 | 0.3% |
| Scotch-Irish | 1,093 | 0.9% |
| Scottish | 2,341 | 1.9% |
| Serbian | 29 | 0.0% |
| Sioux | 77 | 0.1% |
| Slavic | 27 | 0.0% |
| Slovak | 170 | 0.1% |
| Slovene | 16 | 0.0% |
| South African | 3 | 0.0% |
| South American | 481 | 0.4% |
| South American Indian | 42 | 0.0% |
| Spaniard | 593 | 0.5% |
| Spanish | 258 | 0.2% |
| Spanish American | 19 | 0.0% |
| Spanish American Indian | 7 | 0.0% |
| Sri Lankan | 405 | 0.3% |
| Subsaharan African | 480 | 0.4% |
| Swedish | 1,595 | 1.3% |
| Swiss | 280 | 0.2% |
| Syrian | 79 | 0.1% |
| Thai | 122 | 0.1% |
| Tlingit-Haida | 59 | 0.1% |
| Tohono O'Odham | 27 | 0.0% |
| Trinidadian and Tobagonian | 15 | 0.0% |
| Turkish | 14 | 0.0% |
| Ukrainian | 365 | 0.3% |
| Venezuelan | 88 | 0.1% |
| Vietnamese | 52 | 0.0% |
| Welsh | 931 | 0.7% |
| West Indian | 5 | 0.0% |
| Yakama | 17 | 0.0% |
| Yaqui | 134 | 0.1% |
| Yugoslavian | 51 | 0.0% |
| Yuman | 49 | 0.0% |
| Yup'ik | 25 | 0.0% | View All 142 Rows |
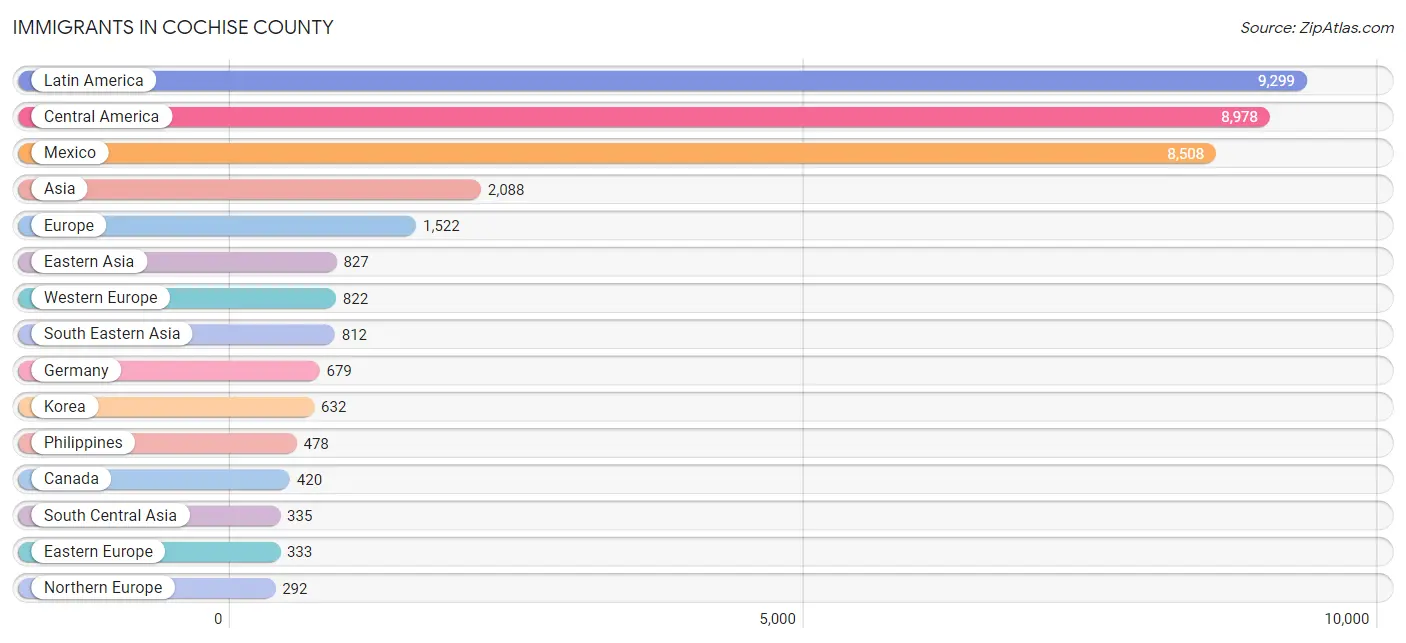
Immigrants in Cochise County
The most numerous immigrant groups reported in Cochise County came from Latin America (9,299 | 7.4%), Central America (8,978 | 7.1%), Mexico (8,508 | 6.8%), Asia (2,088 | 1.7%), and Europe (1,522 | 1.2%), together accounting for 24.2% of all Cochise County residents.
| Immigration Origin | # Population | % Population |
| Africa | 136 | 0.1% |
| Argentina | 30 | 0.0% |
| Asia | 2,088 | 1.7% |
| Australia | 39 | 0.0% |
| Austria | 14 | 0.0% |
| Bangladesh | 50 | 0.0% |
| Barbados | 2 | 0.0% |
| Belgium | 33 | 0.0% |
| Bolivia | 1 | 0.0% |
| Brazil | 6 | 0.0% |
| Bulgaria | 42 | 0.0% |
| Canada | 420 | 0.3% |
| Caribbean | 142 | 0.1% |
| Central America | 8,978 | 7.1% |
| China | 103 | 0.1% |
| Colombia | 50 | 0.0% |
| Costa Rica | 13 | 0.0% |
| Cuba | 53 | 0.0% |
| Czechoslovakia | 14 | 0.0% |
| Denmark | 46 | 0.0% |
| Dominican Republic | 61 | 0.1% |
| Eastern Africa | 10 | 0.0% |
| Eastern Asia | 827 | 0.7% |
| Eastern Europe | 333 | 0.3% |
| Ecuador | 19 | 0.0% |
| El Salvador | 89 | 0.1% |
| England | 161 | 0.1% |
| Ethiopia | 10 | 0.0% |
| Europe | 1,522 | 1.2% |
| France | 51 | 0.0% |
| Germany | 679 | 0.5% |
| Guatemala | 279 | 0.2% |
| Guyana | 13 | 0.0% |
| Haiti | 17 | 0.0% |
| Honduras | 43 | 0.0% |
| Hong Kong | 24 | 0.0% |
| Hungary | 18 | 0.0% |
| India | 50 | 0.0% |
| Indonesia | 8 | 0.0% |
| Iran | 198 | 0.2% |
| Iraq | 1 | 0.0% |
| Italy | 13 | 0.0% |
| Jamaica | 9 | 0.0% |
| Japan | 92 | 0.1% |
| Jordan | 50 | 0.0% |
| Korea | 632 | 0.5% |
| Kuwait | 29 | 0.0% |
| Laos | 14 | 0.0% |
| Latin America | 9,299 | 7.4% |
| Lebanon | 34 | 0.0% |
| Mexico | 8,508 | 6.8% |
| Middle Africa | 20 | 0.0% |
| Morocco | 80 | 0.1% |
| Nepal | 37 | 0.0% |
| Netherlands | 45 | 0.0% |
| Nigeria | 2 | 0.0% |
| Northern Africa | 95 | 0.1% |
| Northern Europe | 292 | 0.2% |
| Oceania | 70 | 0.1% |
| Panama | 46 | 0.0% |
| Peru | 21 | 0.0% |
| Philippines | 478 | 0.4% |
| Poland | 181 | 0.1% |
| Romania | 23 | 0.0% |
| Russia | 24 | 0.0% |
| Scotland | 3 | 0.0% |
| South Africa | 5 | 0.0% |
| South America | 179 | 0.1% |
| South Central Asia | 335 | 0.3% |
| South Eastern Asia | 812 | 0.6% |
| Southern Europe | 75 | 0.1% |
| Spain | 62 | 0.1% |
| Taiwan | 7 | 0.0% |
| Thailand | 22 | 0.0% |
| Ukraine | 19 | 0.0% |
| Vietnam | 289 | 0.2% |
| Western Africa | 2 | 0.0% |
| Western Asia | 114 | 0.1% |
| Western Europe | 822 | 0.6% |
| Zaire | 20 | 0.0% | View All 80 Rows |
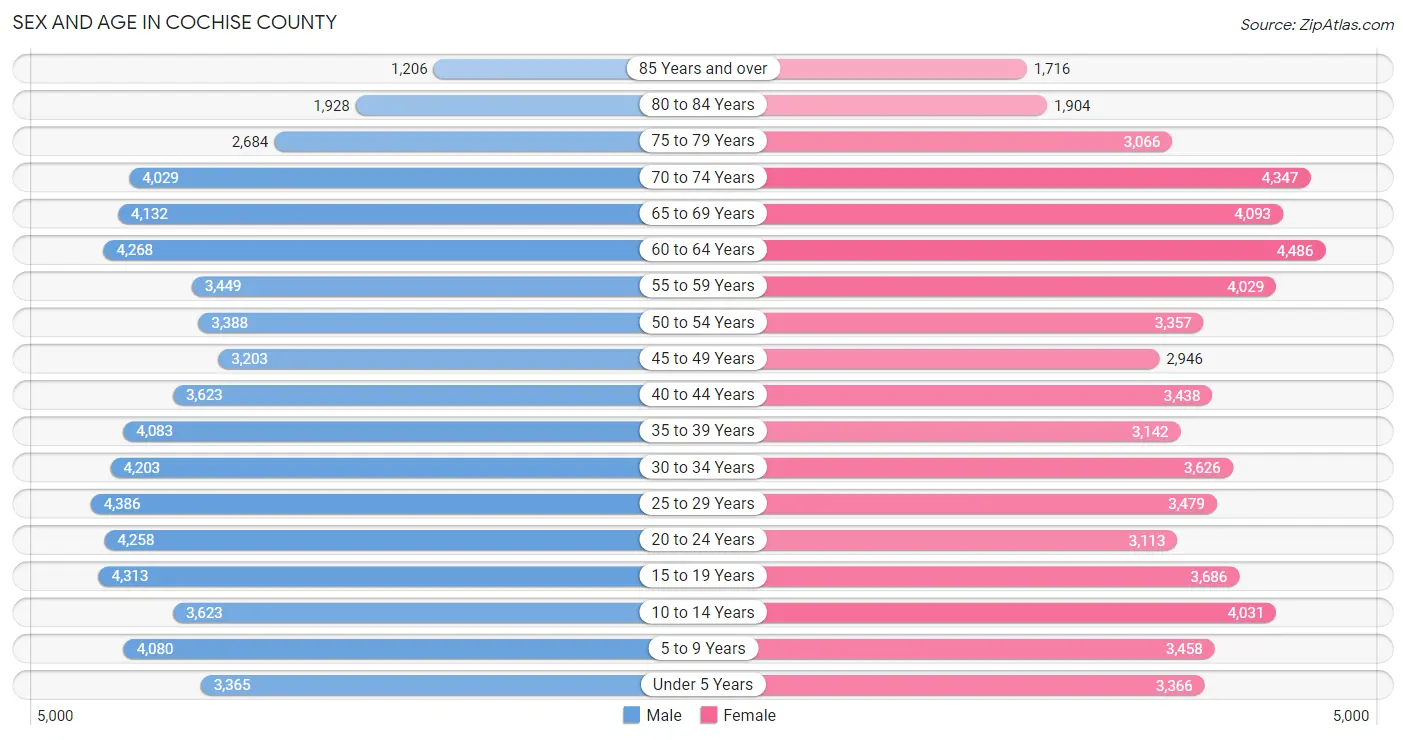
Sex and Age in Cochise County
Sex and Age in Cochise County
The most populous age groups in Cochise County are 25 to 29 Years (4,386 | 6.8%) for men and 60 to 64 Years (4,486 | 7.3%) for women.
| Age Bracket | Male | Female |
| Under 5 Years | 3,365 (5.2%) | 3,366 (5.5%) |
| 5 to 9 Years | 4,080 (6.4%) | 3,458 (5.6%) |
| 10 to 14 Years | 3,623 (5.6%) | 4,031 (6.6%) |
| 15 to 19 Years | 4,313 (6.7%) | 3,686 (6.0%) |
| 20 to 24 Years | 4,258 (6.6%) | 3,113 (5.1%) |
| 25 to 29 Years | 4,386 (6.8%) | 3,479 (5.7%) |
| 30 to 34 Years | 4,203 (6.5%) | 3,626 (5.9%) |
| 35 to 39 Years | 4,083 (6.4%) | 3,142 (5.1%) |
| 40 to 44 Years | 3,623 (5.6%) | 3,438 (5.6%) |
| 45 to 49 Years | 3,203 (5.0%) | 2,946 (4.8%) |
| 50 to 54 Years | 3,388 (5.3%) | 3,357 (5.5%) |
| 55 to 59 Years | 3,449 (5.4%) | 4,029 (6.6%) |
| 60 to 64 Years | 4,268 (6.7%) | 4,486 (7.3%) |
| 65 to 69 Years | 4,132 (6.4%) | 4,093 (6.7%) |
| 70 to 74 Years | 4,029 (6.3%) | 4,347 (7.1%) |
| 75 to 79 Years | 2,684 (4.2%) | 3,066 (5.0%) |
| 80 to 84 Years | 1,928 (3.0%) | 1,904 (3.1%) |
| 85 Years and over | 1,206 (1.9%) | 1,716 (2.8%) |
| Total | 64,221 (100.0%) | 61,283 (100.0%) |
Families and Households in Cochise County
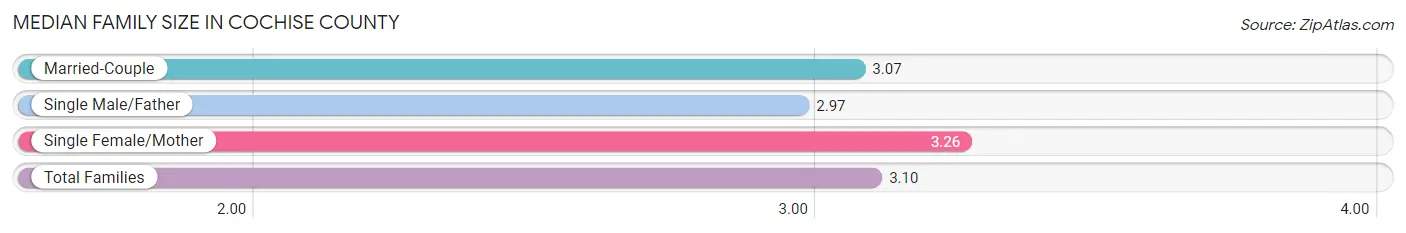
Median Family Size in Cochise County
The median family size in Cochise County is 3.10 persons per family, with single female/mother families (5,277 | 17.3%) accounting for the largest median family size of 3.26 persons per family. On the other hand, single male/father families (2,264 | 7.4%) represent the smallest median family size with 2.97 persons per family.
| Family Type | # Families | Family Size |
| Married-Couple | 22,930 (75.2%) | 3.07 |
| Single Male/Father | 2,264 (7.4%) | 2.97 |
| Single Female/Mother | 5,277 (17.3%) | 3.26 |
| Total Families | 30,471 (100.0%) | 3.10 |
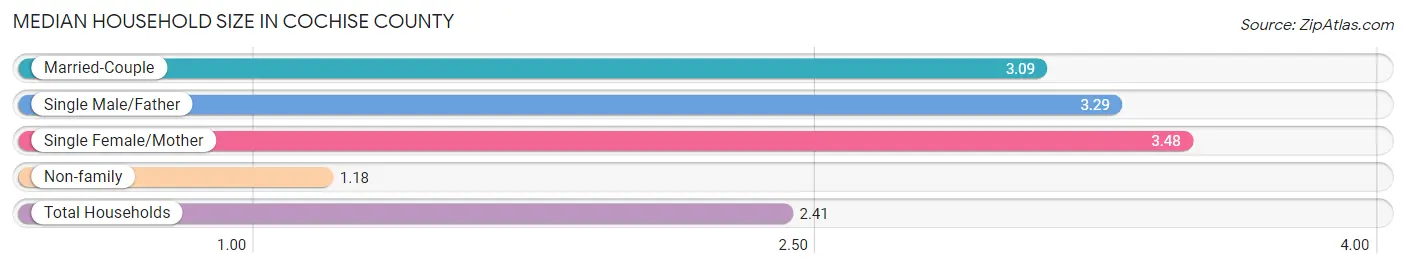
Median Household Size in Cochise County
The median household size in Cochise County is 2.41 persons per household, with single female/mother households (5,277 | 10.6%) accounting for the largest median household size of 3.48 persons per household. non-family households (19,209 | 38.7%) represent the smallest median household size with 1.18 persons per household.
| Household Type | # Households | Household Size |
| Married-Couple | 22,930 (46.2%) | 3.09 |
| Single Male/Father | 2,264 (4.6%) | 3.29 |
| Single Female/Mother | 5,277 (10.6%) | 3.48 |
| Non-family | 19,209 (38.7%) | 1.18 |
| Total Households | 49,680 (100.0%) | 2.41 |
Household Size by Marriage Status in Cochise County
Out of a total of 49,680 households in Cochise County, 30,471 (61.3%) are family households, while 19,209 (38.7%) are nonfamily households. The most numerous type of family households are 2-person households, comprising 15,314, and the most common type of nonfamily households are 1-person households, comprising 16,773.
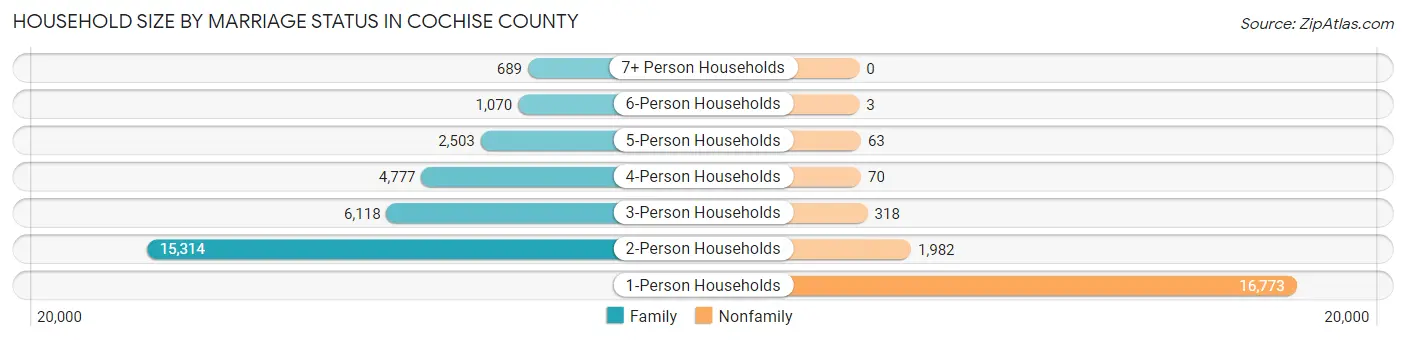
| Household Size | Family Households | Nonfamily Households |
| 1-Person Households | - | 16,773 (33.8%) |
| 2-Person Households | 15,314 (30.8%) | 1,982 (4.0%) |
| 3-Person Households | 6,118 (12.3%) | 318 (0.6%) |
| 4-Person Households | 4,777 (9.6%) | 70 (0.1%) |
| 5-Person Households | 2,503 (5.0%) | 63 (0.1%) |
| 6-Person Households | 1,070 (2.1%) | 3 (0.0%) |
| 7+ Person Households | 689 (1.4%) | 0 (0.0%) |
| Total | 30,471 (61.3%) | 19,209 (38.7%) |
Female Fertility in Cochise County
Fertility by Age in Cochise County
Average fertility rate in Cochise County is 50.0 births per 1,000 women. Women in the age bracket of 20 to 34 years have the highest fertility rate with 92.0 births per 1,000 women. Women in the age bracket of 20 to 34 years acount for 77.9% of all women with births.
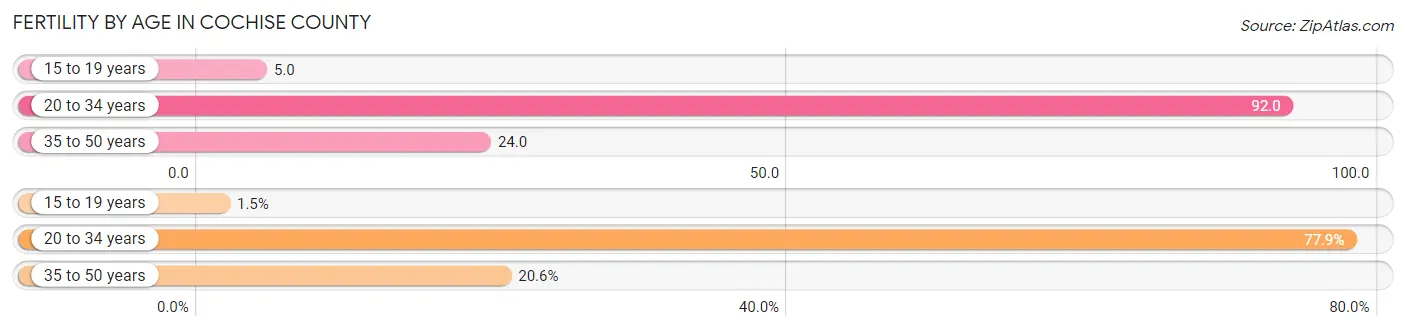
| Age Bracket | Women with Births | Births / 1,000 Women |
| 15 to 19 years | 18 (1.5%) | 5.0 |
| 20 to 34 years | 943 (77.9%) | 92.0 |
| 35 to 50 years | 249 (20.6%) | 24.0 |
| Total | 1,210 (100.0%) | 50.0 |
Fertility by Age by Marriage Status in Cochise County
85.2% of women with births (1,210) in Cochise County are married. The highest percentage of unmarried women with births falls into 15 to 19 years age bracket with 100.0% of them unmarried at the time of birth, while the lowest percentage of unmarried women with births belong to 20 to 34 years age bracket with 12.3% of them unmarried.
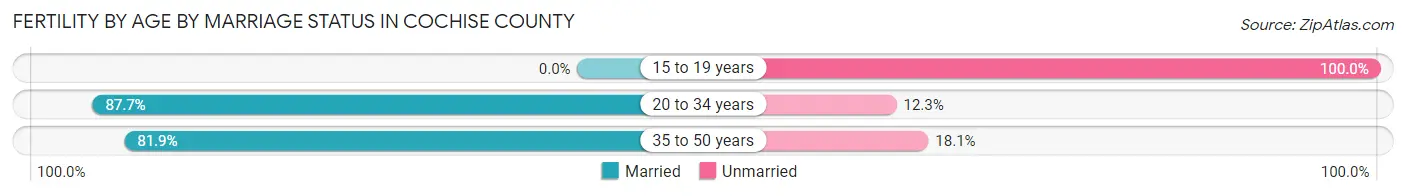
| Age Bracket | Married | Unmarried |
| 15 to 19 years | 0 (0.0%) | 18 (100.0%) |
| 20 to 34 years | 827 (87.7%) | 116 (12.3%) |
| 35 to 50 years | 204 (81.9%) | 45 (18.1%) |
| Total | 1,031 (85.2%) | 179 (14.8%) |
Fertility by Education in Cochise County
Average fertility rate in Cochise County is 50.0 births per 1,000 women. Women with the education attainment of graduate degree have the highest fertility rate of 84.0 births per 1,000 women, while women with the education attainment of high school diploma have the lowest fertility at 39.0 births per 1,000 women. Women with the education attainment of college or associate's degree represent 37.9% of all women with births.
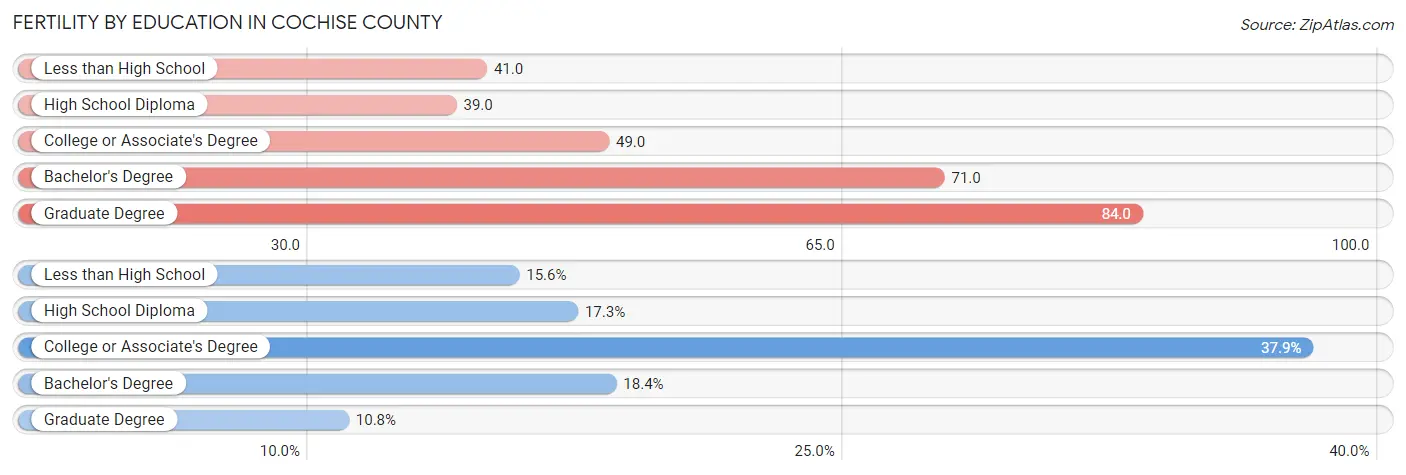
| Educational Attainment | Women with Births | Births / 1,000 Women |
| Less than High School | 189 (15.6%) | 41.0 |
| High School Diploma | 209 (17.3%) | 39.0 |
| College or Associate's Degree | 459 (37.9%) | 49.0 |
| Bachelor's Degree | 222 (18.3%) | 71.0 |
| Graduate Degree | 131 (10.8%) | 84.0 |
| Total | 1,210 (100.0%) | 50.0 |
Fertility by Education by Marriage Status in Cochise County
14.8% of women with births in Cochise County are unmarried. Women with the educational attainment of graduate degree are most likely to be married with 100.0% of them married at childbirth, while women with the educational attainment of high school diploma are least likely to be married with 29.7% of them unmarried at childbirth.
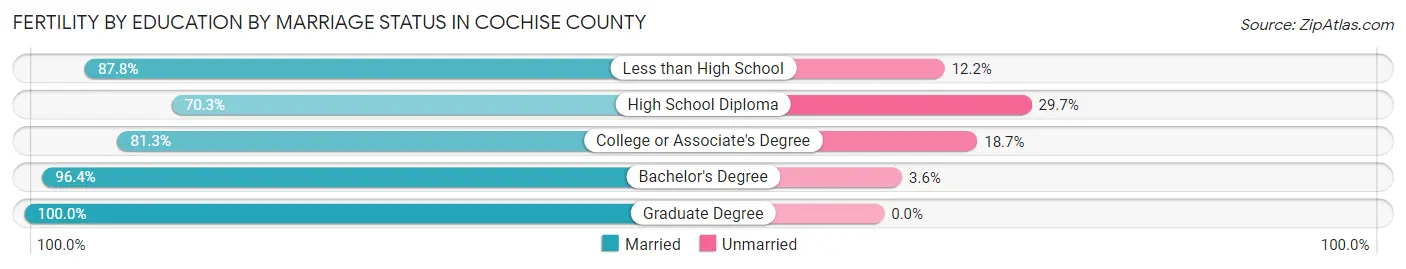
| Educational Attainment | Married | Unmarried |
| Less than High School | 166 (87.8%) | 23 (12.2%) |
| High School Diploma | 147 (70.3%) | 62 (29.7%) |
| College or Associate's Degree | 373 (81.3%) | 86 (18.7%) |
| Bachelor's Degree | 214 (96.4%) | 8 (3.6%) |
| Graduate Degree | 131 (100.0%) | 0 (0.0%) |
| Total | 1,031 (85.2%) | 179 (14.8%) |
Employment Characteristics in Cochise County
Employment by Class of Employer in Cochise County
Among the 46,755 employed individuals in Cochise County, private company employees (23,916 | 51.1%), federal government employees (9,617 | 20.6%), and local government employees (3,420 | 7.3%) make up the most common classes of employment.
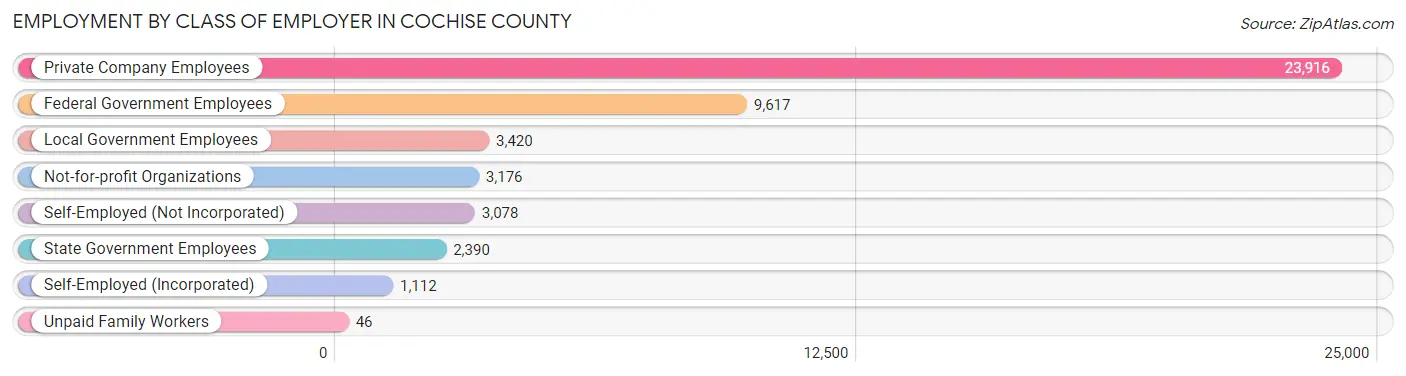
| Employer Class | # Employees | % Employees |
| Private Company Employees | 23,916 | 51.1% |
| Self-Employed (Incorporated) | 1,112 | 2.4% |
| Self-Employed (Not Incorporated) | 3,078 | 6.6% |
| Not-for-profit Organizations | 3,176 | 6.8% |
| Local Government Employees | 3,420 | 7.3% |
| State Government Employees | 2,390 | 5.1% |
| Federal Government Employees | 9,617 | 20.6% |
| Unpaid Family Workers | 46 | 0.1% |
| Total | 46,755 | 100.0% |
Employment Status by Age in Cochise County
According to the labor force statistics for Cochise County, out of the total population over 16 years of age (101,985), 50.1% or 51,094 individuals are in the labor force, with 6.8% or 3,474 of them unemployed. The age group with the highest labor force participation rate is 25 to 29 years, with 78.9% or 6,205 individuals in the labor force. Within the labor force, the 20 to 24 years age range has the highest percentage of unemployed individuals, with 14.3% or 725 of them being unemployed.
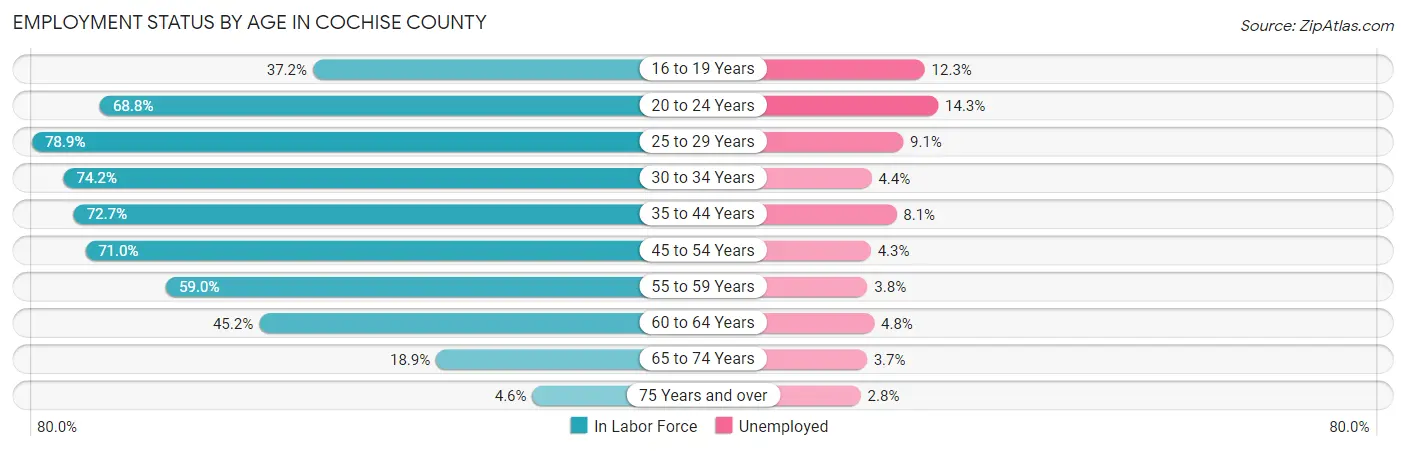
| Age Bracket | In Labor Force | Unemployed |
| 16 to 19 Years | 2,382 (37.2%) | 293 (12.3%) |
| 20 to 24 Years | 5,071 (68.8%) | 725 (14.3%) |
| 25 to 29 Years | 6,205 (78.9%) | 565 (9.1%) |
| 30 to 34 Years | 5,809 (74.2%) | 256 (4.4%) |
| 35 to 44 Years | 10,386 (72.7%) | 841 (8.1%) |
| 45 to 54 Years | 9,155 (71.0%) | 394 (4.3%) |
| 55 to 59 Years | 4,412 (59.0%) | 168 (3.8%) |
| 60 to 64 Years | 3,957 (45.2%) | 190 (4.8%) |
| 65 to 74 Years | 3,138 (18.9%) | 116 (3.7%) |
| 75 Years and over | 575 (4.6%) | 16 (2.8%) |
| Total | 51,094 (50.1%) | 3,474 (6.8%) |
Employment Status by Educational Attainment in Cochise County
According to labor force statistics for Cochise County, 67.5% of individuals (39,897) out of the total population between 25 and 64 years of age (59,106) are in the labor force, with 6.0% or 2,394 of them being unemployed. The group with the highest labor force participation rate are those with the educational attainment of bachelor's degree or higher, with 80.1% or 11,784 individuals in the labor force. Within the labor force, individuals with less than high school education have the highest percentage of unemployment, with 12.1% or 425 of them being unemployed.
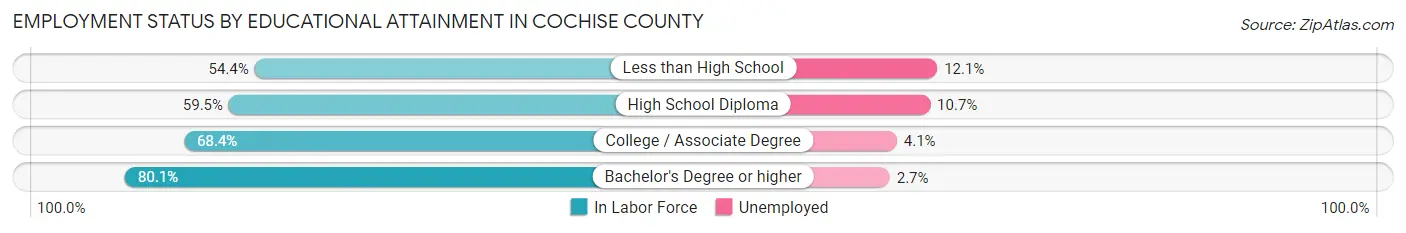
| Educational Attainment | In Labor Force | Unemployed |
| Less than High School | 3,511 (54.4%) | 781 (12.1%) |
| High School Diploma | 8,907 (59.5%) | 1,602 (10.7%) |
| College / Associate Degree | 15,712 (68.4%) | 942 (4.1%) |
| Bachelor's Degree or higher | 11,784 (80.1%) | 397 (2.7%) |
| Total | 39,897 (67.5%) | 3,546 (6.0%) |
Employment Occupations by Sex in Cochise County
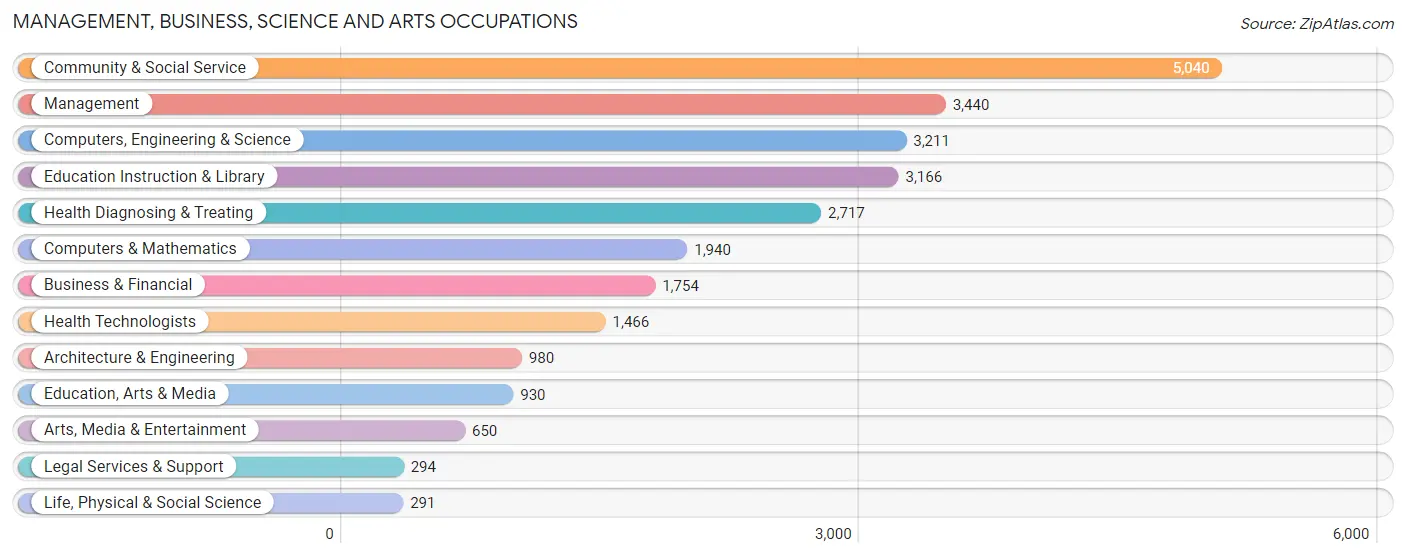
Management, Business, Science and Arts Occupations
The most common Management, Business, Science and Arts occupations in Cochise County are Community & Social Service (5,040 | 11.4%), Management (3,440 | 7.8%), Computers, Engineering & Science (3,211 | 7.3%), Education Instruction & Library (3,166 | 7.2%), and Health Diagnosing & Treating (2,717 | 6.1%).
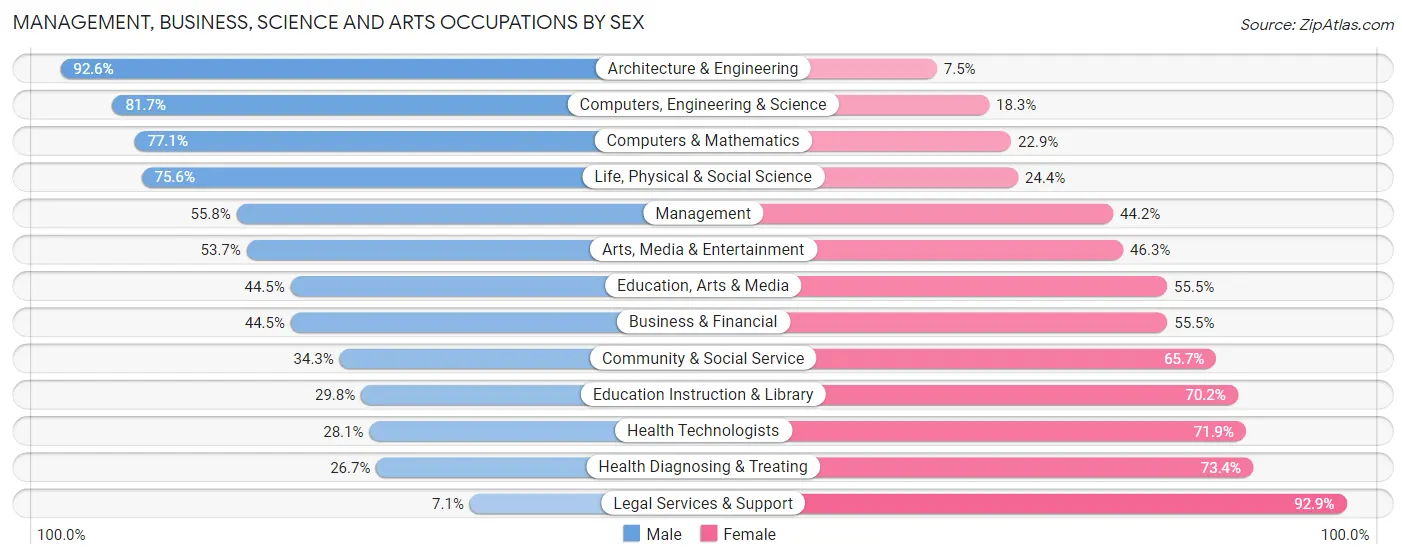
Management, Business, Science and Arts Occupations by Sex
Within the Management, Business, Science and Arts occupations in Cochise County, the most male-oriented occupations are Architecture & Engineering (92.5%), Computers, Engineering & Science (81.7%), and Computers & Mathematics (77.1%), while the most female-oriented occupations are Legal Services & Support (92.9%), Health Diagnosing & Treating (73.4%), and Health Technologists (71.9%).
| Occupation | Male | Female |
| Management | 1,919 (55.8%) | 1,521 (44.2%) |
| Business & Financial | 780 (44.5%) | 974 (55.5%) |
| Computers, Engineering & Science | 2,622 (81.7%) | 589 (18.3%) |
| Computers & Mathematics | 1,495 (77.1%) | 445 (22.9%) |
| Architecture & Engineering | 907 (92.5%) | 73 (7.4%) |
| Life, Physical & Social Science | 220 (75.6%) | 71 (24.4%) |
| Community & Social Service | 1,728 (34.3%) | 3,312 (65.7%) |
| Education, Arts & Media | 414 (44.5%) | 516 (55.5%) |
| Legal Services & Support | 21 (7.1%) | 273 (92.9%) |
| Education Instruction & Library | 944 (29.8%) | 2,222 (70.2%) |
| Arts, Media & Entertainment | 349 (53.7%) | 301 (46.3%) |
| Health Diagnosing & Treating | 724 (26.7%) | 1,993 (73.4%) |
| Health Technologists | 412 (28.1%) | 1,054 (71.9%) |
| Total (Category) | 7,773 (48.1%) | 8,389 (51.9%) |
| Total (Overall) | 23,575 (53.3%) | 20,625 (46.7%) |
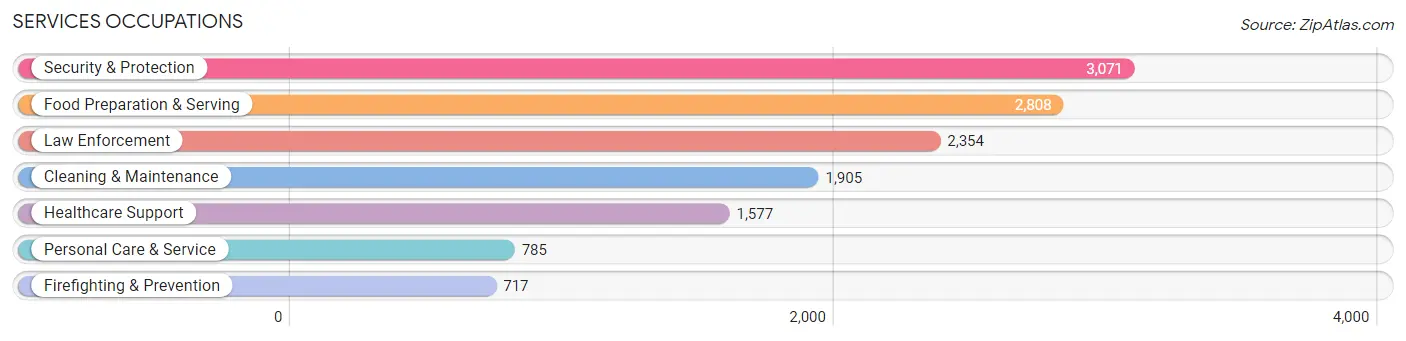
Services Occupations
The most common Services occupations in Cochise County are Security & Protection (3,071 | 7.0%), Food Preparation & Serving (2,808 | 6.4%), Law Enforcement (2,354 | 5.3%), Cleaning & Maintenance (1,905 | 4.3%), and Healthcare Support (1,577 | 3.6%).
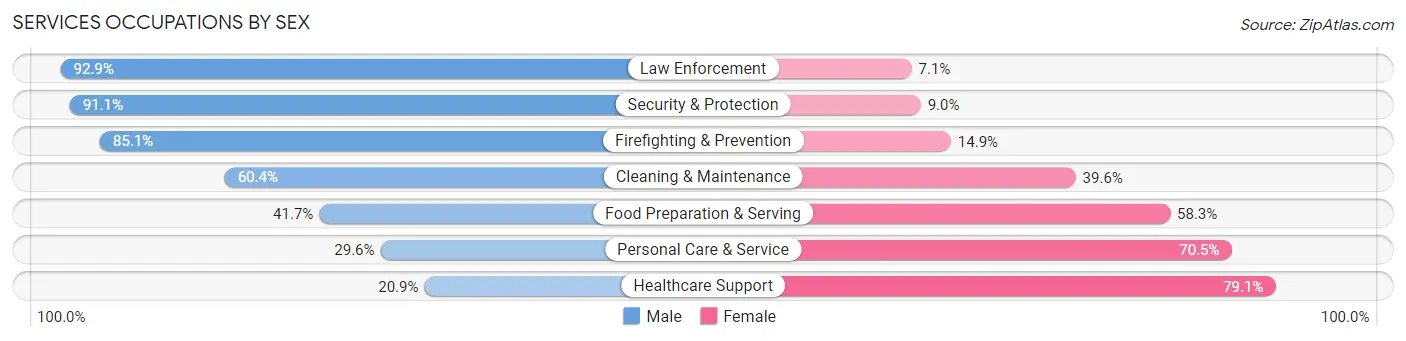
Services Occupations by Sex
Within the Services occupations in Cochise County, the most male-oriented occupations are Law Enforcement (92.9%), Security & Protection (91.0%), and Firefighting & Prevention (85.1%), while the most female-oriented occupations are Healthcare Support (79.1%), Personal Care & Service (70.5%), and Food Preparation & Serving (58.3%).
| Occupation | Male | Female |
| Healthcare Support | 329 (20.9%) | 1,248 (79.1%) |
| Security & Protection | 2,796 (91.0%) | 275 (8.9%) |
| Firefighting & Prevention | 610 (85.1%) | 107 (14.9%) |
| Law Enforcement | 2,186 (92.9%) | 168 (7.1%) |
| Food Preparation & Serving | 1,170 (41.7%) | 1,638 (58.3%) |
| Cleaning & Maintenance | 1,150 (60.4%) | 755 (39.6%) |
| Personal Care & Service | 232 (29.5%) | 553 (70.5%) |
| Total (Category) | 5,677 (55.9%) | 4,469 (44.1%) |
| Total (Overall) | 23,575 (53.3%) | 20,625 (46.7%) |
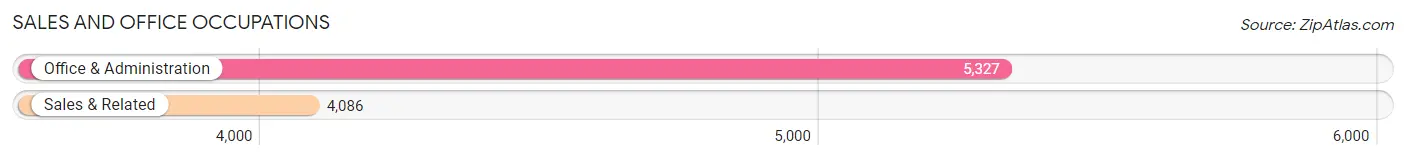
Sales and Office Occupations
The most common Sales and Office occupations in Cochise County are Office & Administration (5,327 | 12.0%), and Sales & Related (4,086 | 9.2%).
Sales and Office Occupations by Sex
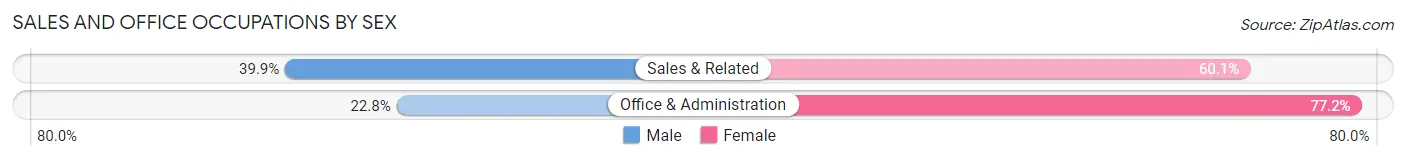
| Occupation | Male | Female |
| Sales & Related | 1,631 (39.9%) | 2,455 (60.1%) |
| Office & Administration | 1,214 (22.8%) | 4,113 (77.2%) |
| Total (Category) | 2,845 (30.2%) | 6,568 (69.8%) |
| Total (Overall) | 23,575 (53.3%) | 20,625 (46.7%) |
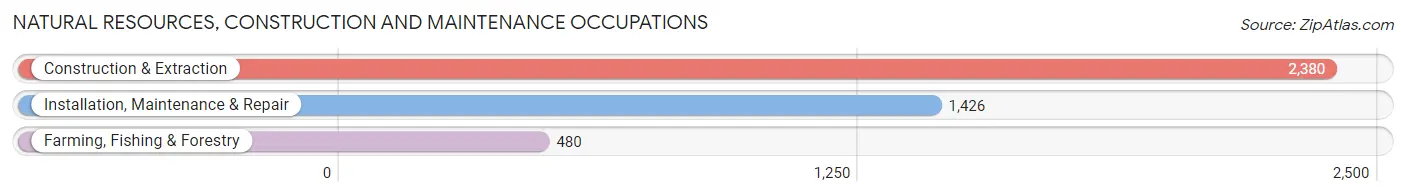
Natural Resources, Construction and Maintenance Occupations
The most common Natural Resources, Construction and Maintenance occupations in Cochise County are Construction & Extraction (2,380 | 5.4%), Installation, Maintenance & Repair (1,426 | 3.2%), and Farming, Fishing & Forestry (480 | 1.1%).
Natural Resources, Construction and Maintenance Occupations by Sex
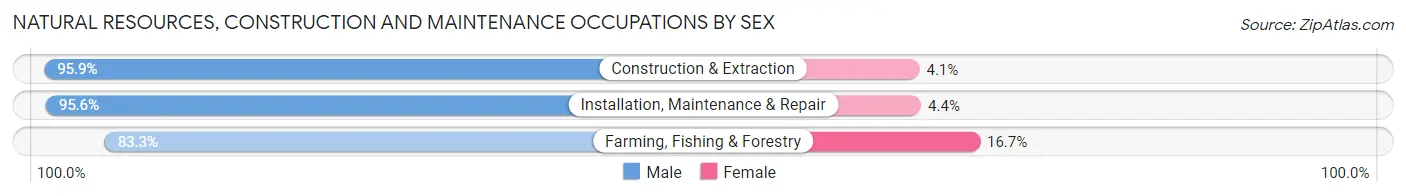
| Occupation | Male | Female |
| Farming, Fishing & Forestry | 400 (83.3%) | 80 (16.7%) |
| Construction & Extraction | 2,283 (95.9%) | 97 (4.1%) |
| Installation, Maintenance & Repair | 1,363 (95.6%) | 63 (4.4%) |
| Total (Category) | 4,046 (94.4%) | 240 (5.6%) |
| Total (Overall) | 23,575 (53.3%) | 20,625 (46.7%) |
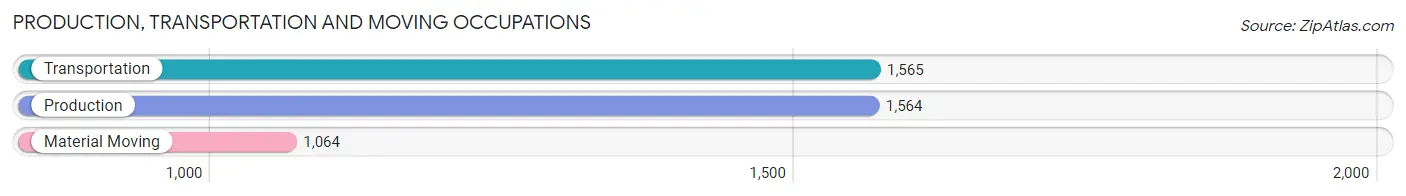
Production, Transportation and Moving Occupations
The most common Production, Transportation and Moving occupations in Cochise County are Transportation (1,565 | 3.5%), Production (1,564 | 3.5%), and Material Moving (1,064 | 2.4%).
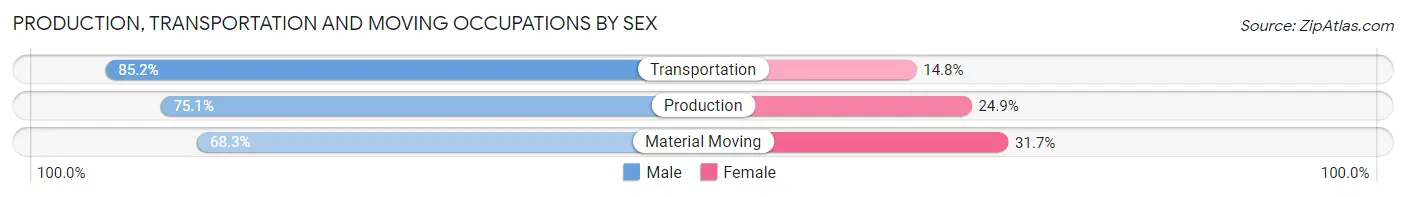
Production, Transportation and Moving Occupations by Sex
| Occupation | Male | Female |
| Production | 1,174 (75.1%) | 390 (24.9%) |
| Transportation | 1,333 (85.2%) | 232 (14.8%) |
| Material Moving | 727 (68.3%) | 337 (31.7%) |
| Total (Category) | 3,234 (77.1%) | 959 (22.9%) |
| Total (Overall) | 23,575 (53.3%) | 20,625 (46.7%) |
Employment Industries by Sex in Cochise County
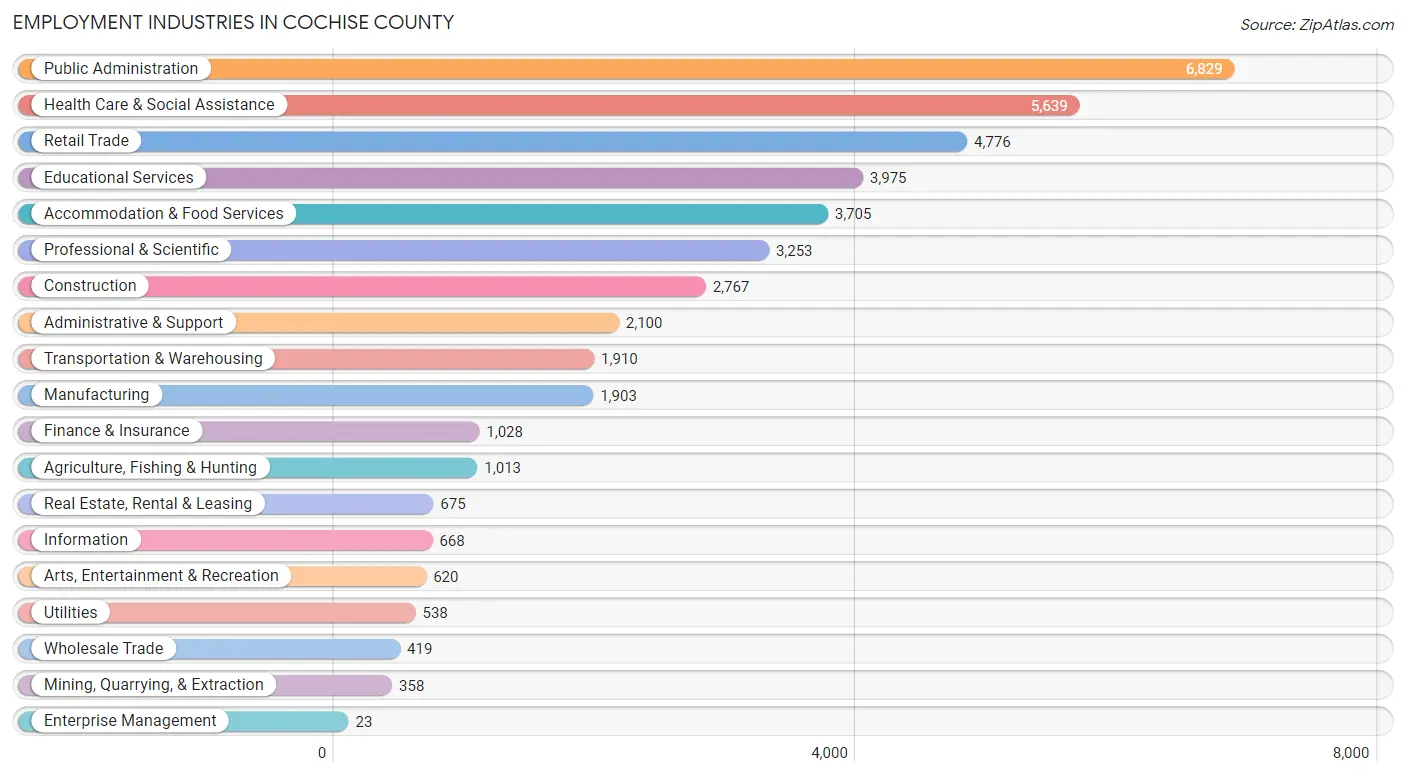
Employment Industries in Cochise County
The major employment industries in Cochise County include Public Administration (6,829 | 15.4%), Health Care & Social Assistance (5,639 | 12.8%), Retail Trade (4,776 | 10.8%), Educational Services (3,975 | 9.0%), and Accommodation & Food Services (3,705 | 8.4%).
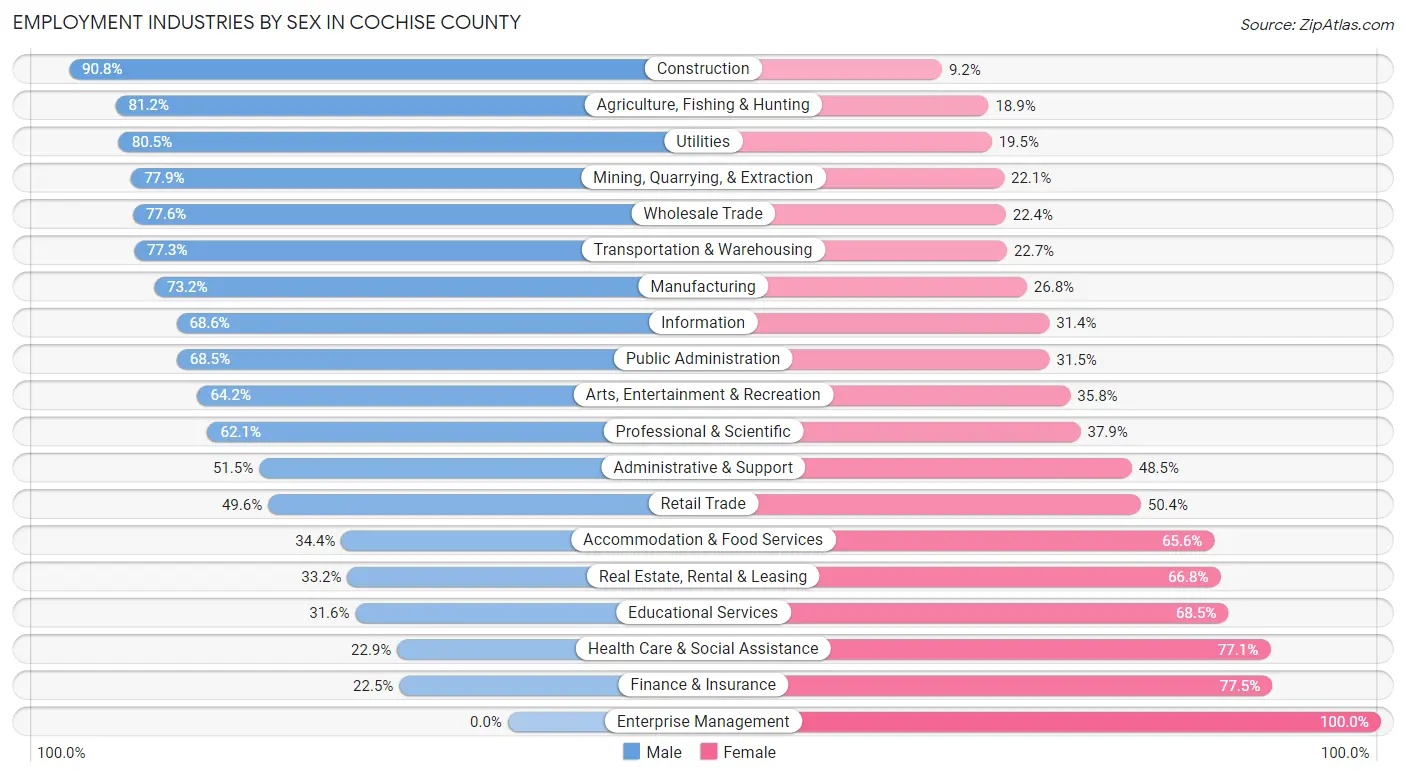
Employment Industries by Sex in Cochise County
The Cochise County industries that see more men than women are Construction (90.8%), Agriculture, Fishing & Hunting (81.1%), and Utilities (80.5%), whereas the industries that tend to have a higher number of women are Enterprise Management (100.0%), Finance & Insurance (77.5%), and Health Care & Social Assistance (77.1%).
| Industry | Male | Female |
| Agriculture, Fishing & Hunting | 822 (81.1%) | 191 (18.9%) |
| Mining, Quarrying, & Extraction | 279 (77.9%) | 79 (22.1%) |
| Construction | 2,512 (90.8%) | 255 (9.2%) |
| Manufacturing | 1,393 (73.2%) | 510 (26.8%) |
| Wholesale Trade | 325 (77.6%) | 94 (22.4%) |
| Retail Trade | 2,370 (49.6%) | 2,406 (50.4%) |
| Transportation & Warehousing | 1,477 (77.3%) | 433 (22.7%) |
| Utilities | 433 (80.5%) | 105 (19.5%) |
| Information | 458 (68.6%) | 210 (31.4%) |
| Finance & Insurance | 231 (22.5%) | 797 (77.5%) |
| Real Estate, Rental & Leasing | 224 (33.2%) | 451 (66.8%) |
| Professional & Scientific | 2,020 (62.1%) | 1,233 (37.9%) |
| Enterprise Management | 0 (0.0%) | 23 (100.0%) |
| Administrative & Support | 1,081 (51.5%) | 1,019 (48.5%) |
| Educational Services | 1,254 (31.6%) | 2,721 (68.4%) |
| Health Care & Social Assistance | 1,291 (22.9%) | 4,348 (77.1%) |
| Arts, Entertainment & Recreation | 398 (64.2%) | 222 (35.8%) |
| Accommodation & Food Services | 1,276 (34.4%) | 2,429 (65.6%) |
| Public Administration | 4,677 (68.5%) | 2,152 (31.5%) |
| Total | 23,575 (53.3%) | 20,625 (46.7%) |
Education in Cochise County
School Enrollment in Cochise County
The most common levels of schooling among the 28,693 students in Cochise County are high school (6,658 | 23.2%), elementary school (6,132 | 21.4%), and middle school (6,129 | 21.4%).
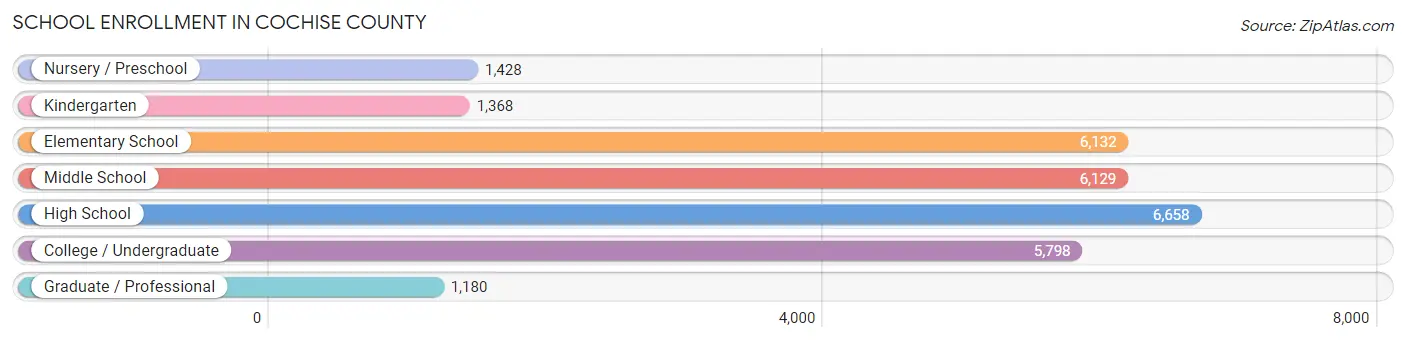
| School Level | # Students | % Students |
| Nursery / Preschool | 1,428 | 5.0% |
| Kindergarten | 1,368 | 4.8% |
| Elementary School | 6,132 | 21.4% |
| Middle School | 6,129 | 21.4% |
| High School | 6,658 | 23.2% |
| College / Undergraduate | 5,798 | 20.2% |
| Graduate / Professional | 1,180 | 4.1% |
| Total | 28,693 | 100.0% |
School Enrollment by Age by Funding Source in Cochise County
Out of a total of 28,693 students who are enrolled in schools in Cochise County, 3,529 (12.3%) attend a private institution, while the remaining 25,164 (87.7%) are enrolled in public schools. The age group of 3 to 4 year olds has the highest likelihood of being enrolled in private schools, with 385 (33.5% in the age bracket) enrolled. Conversely, the age group of 18 to 19 year olds has the lowest likelihood of being enrolled in a private school, with 2,005 (95.3% in the age bracket) attending a public institution.
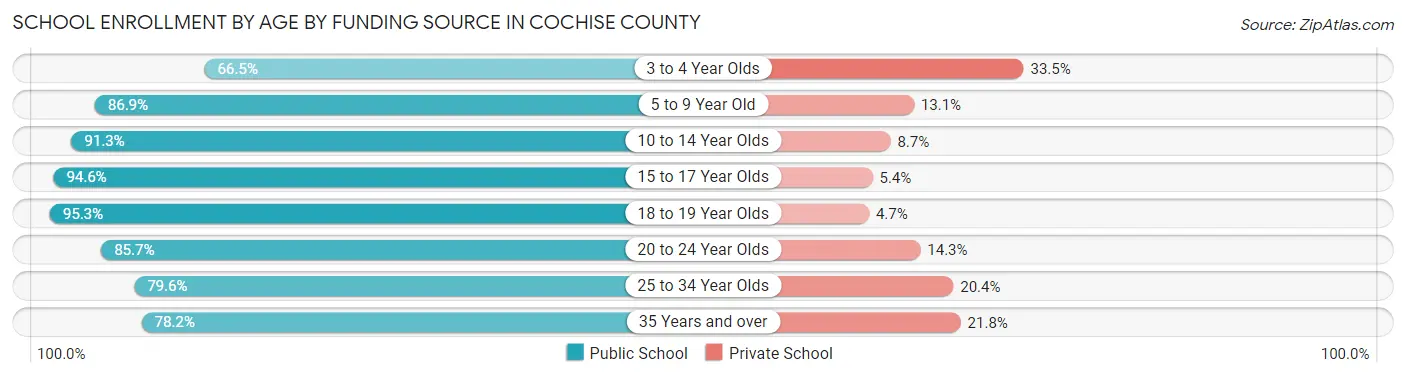
| Age Bracket | Public School | Private School |
| 3 to 4 Year Olds | 764 (66.5%) | 385 (33.5%) |
| 5 to 9 Year Old | 6,040 (86.9%) | 910 (13.1%) |
| 10 to 14 Year Olds | 6,900 (91.3%) | 659 (8.7%) |
| 15 to 17 Year Olds | 4,170 (94.6%) | 237 (5.4%) |
| 18 to 19 Year Olds | 2,005 (95.3%) | 99 (4.7%) |
| 20 to 24 Year Olds | 1,615 (85.7%) | 269 (14.3%) |
| 25 to 34 Year Olds | 1,695 (79.6%) | 435 (20.4%) |
| 35 Years and over | 1,963 (78.2%) | 547 (21.8%) |
| Total | 25,164 (87.7%) | 3,529 (12.3%) |
Educational Attainment by Field of Study in Cochise County
Business (4,268 | 17.1%), education (3,518 | 14.1%), arts & humanities (2,326 | 9.3%), science & technology (2,013 | 8.1%), and social sciences (1,593 | 6.4%) are the most common fields of study among 24,962 individuals in Cochise County who have obtained a bachelor's degree or higher.
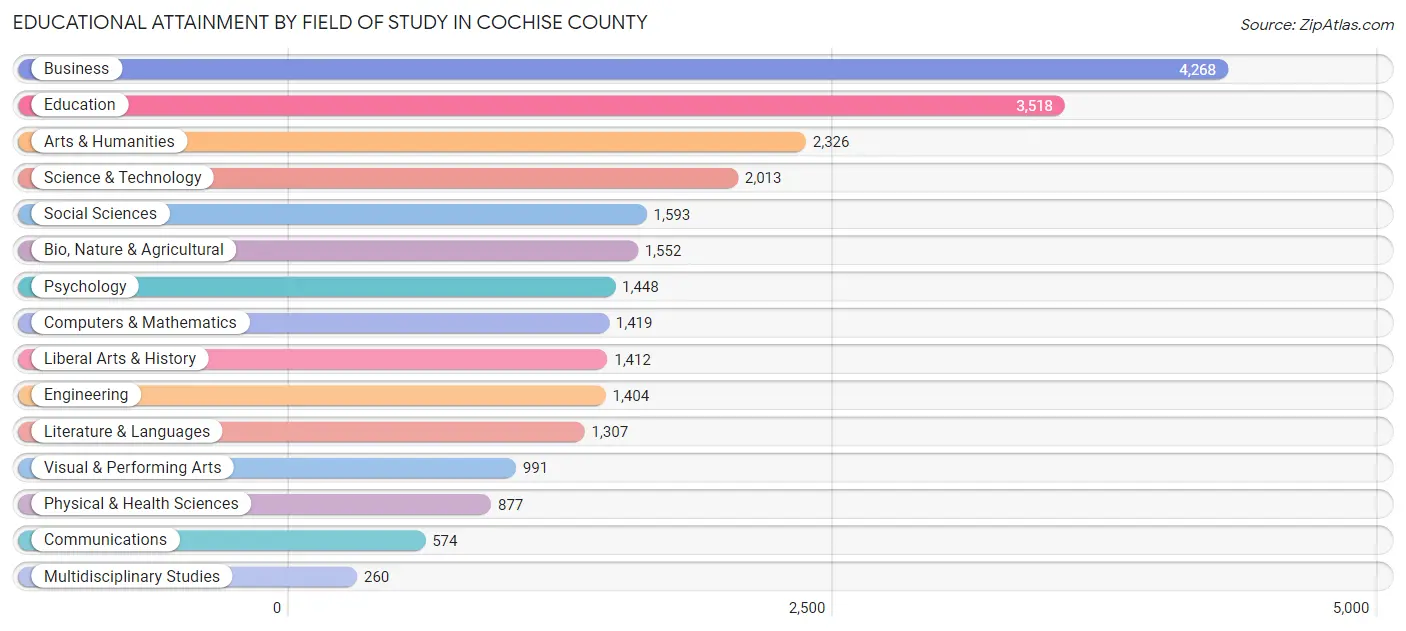
| Field of Study | # Graduates | % Graduates |
| Computers & Mathematics | 1,419 | 5.7% |
| Bio, Nature & Agricultural | 1,552 | 6.2% |
| Physical & Health Sciences | 877 | 3.5% |
| Psychology | 1,448 | 5.8% |
| Social Sciences | 1,593 | 6.4% |
| Engineering | 1,404 | 5.6% |
| Multidisciplinary Studies | 260 | 1.0% |
| Science & Technology | 2,013 | 8.1% |
| Business | 4,268 | 17.1% |
| Education | 3,518 | 14.1% |
| Literature & Languages | 1,307 | 5.2% |
| Liberal Arts & History | 1,412 | 5.7% |
| Visual & Performing Arts | 991 | 4.0% |
| Communications | 574 | 2.3% |
| Arts & Humanities | 2,326 | 9.3% |
| Total | 24,962 | 100.0% |
Transportation & Commute in Cochise County
Vehicle Availability by Sex in Cochise County
The most prevalent vehicle ownership categories in Cochise County are males with 2 vehicles (9,599, accounting for 38.9%) and females with 2 vehicles (7,279, making up 47.4%).
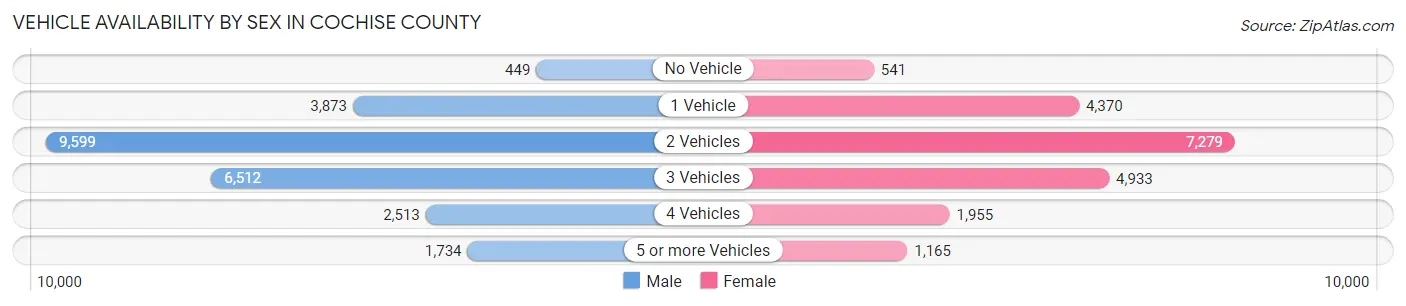
| Vehicles Available | Male | Female |
| No Vehicle | 449 (1.8%) | 541 (2.7%) |
| 1 Vehicle | 3,873 (15.7%) | 4,370 (21.6%) |
| 2 Vehicles | 9,599 (38.9%) | 7,279 (36.0%) |
| 3 Vehicles | 6,512 (26.4%) | 4,933 (24.4%) |
| 4 Vehicles | 2,513 (10.2%) | 1,955 (9.7%) |
| 5 or more Vehicles | 1,734 (7.0%) | 1,165 (5.8%) |
| Total | 24,680 (100.0%) | 20,243 (100.0%) |
Commute Time in Cochise County
The most frequently occuring commute durations in Cochise County are 10 to 14 minutes (8,386 commuters, 19.7%), 5 to 9 minutes (7,906 commuters, 18.5%), and 15 to 19 minutes (7,198 commuters, 16.9%).
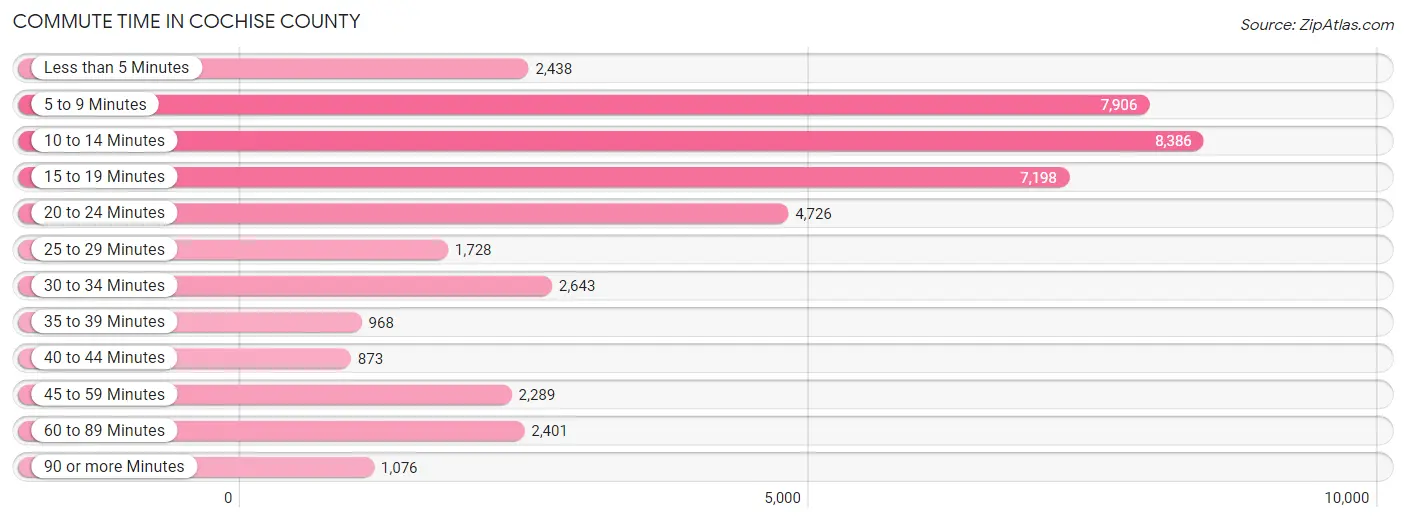
| Commute Time | # Commuters | % Commuters |
| Less than 5 Minutes | 2,438 | 5.7% |
| 5 to 9 Minutes | 7,906 | 18.5% |
| 10 to 14 Minutes | 8,386 | 19.7% |
| 15 to 19 Minutes | 7,198 | 16.9% |
| 20 to 24 Minutes | 4,726 | 11.1% |
| 25 to 29 Minutes | 1,728 | 4.1% |
| 30 to 34 Minutes | 2,643 | 6.2% |
| 35 to 39 Minutes | 968 | 2.3% |
| 40 to 44 Minutes | 873 | 2.1% |
| 45 to 59 Minutes | 2,289 | 5.4% |
| 60 to 89 Minutes | 2,401 | 5.6% |
| 90 or more Minutes | 1,076 | 2.5% |
Commute Time by Sex in Cochise County
The most common commute times in Cochise County are 15 to 19 minutes (4,395 commuters, 18.3%) for males and 10 to 14 minutes (4,225 commuters, 22.7%) for females.
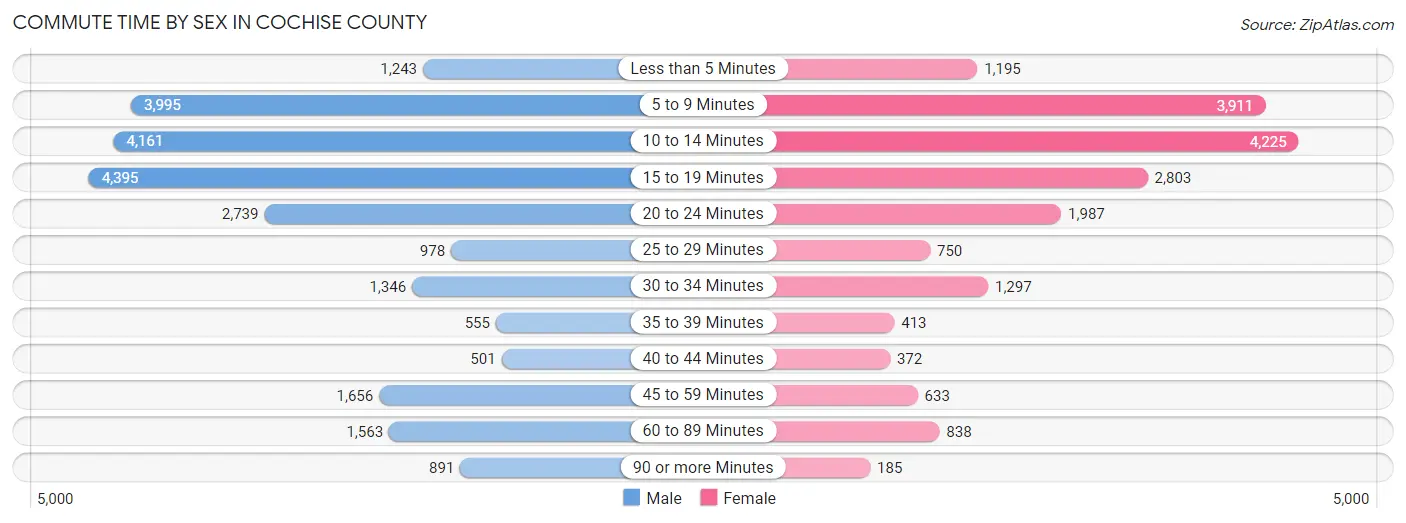
| Commute Time | Male | Female |
| Less than 5 Minutes | 1,243 (5.2%) | 1,195 (6.4%) |
| 5 to 9 Minutes | 3,995 (16.6%) | 3,911 (21.0%) |
| 10 to 14 Minutes | 4,161 (17.3%) | 4,225 (22.7%) |
| 15 to 19 Minutes | 4,395 (18.3%) | 2,803 (15.1%) |
| 20 to 24 Minutes | 2,739 (11.4%) | 1,987 (10.7%) |
| 25 to 29 Minutes | 978 (4.1%) | 750 (4.0%) |
| 30 to 34 Minutes | 1,346 (5.6%) | 1,297 (7.0%) |
| 35 to 39 Minutes | 555 (2.3%) | 413 (2.2%) |
| 40 to 44 Minutes | 501 (2.1%) | 372 (2.0%) |
| 45 to 59 Minutes | 1,656 (6.9%) | 633 (3.4%) |
| 60 to 89 Minutes | 1,563 (6.5%) | 838 (4.5%) |
| 90 or more Minutes | 891 (3.7%) | 185 (1.0%) |
Time of Departure to Work by Sex in Cochise County
The most frequent times of departure to work in Cochise County are 12:00 AM to 4:59 AM (2,961, 12.3%) for males and 7:30 AM to 7:59 AM (3,045, 16.4%) for females.
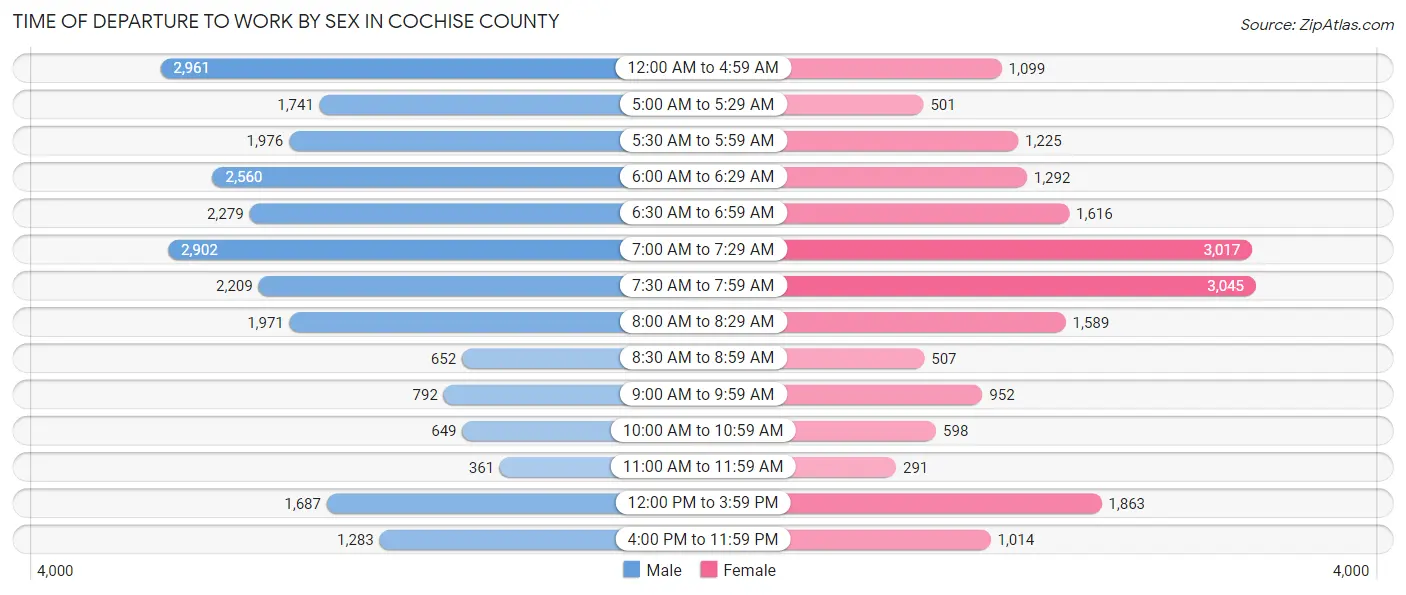
| Time of Departure | Male | Female |
| 12:00 AM to 4:59 AM | 2,961 (12.3%) | 1,099 (5.9%) |
| 5:00 AM to 5:29 AM | 1,741 (7.2%) | 501 (2.7%) |
| 5:30 AM to 5:59 AM | 1,976 (8.2%) | 1,225 (6.6%) |
| 6:00 AM to 6:29 AM | 2,560 (10.7%) | 1,292 (6.9%) |
| 6:30 AM to 6:59 AM | 2,279 (9.5%) | 1,616 (8.7%) |
| 7:00 AM to 7:29 AM | 2,902 (12.1%) | 3,017 (16.2%) |
| 7:30 AM to 7:59 AM | 2,209 (9.2%) | 3,045 (16.4%) |
| 8:00 AM to 8:29 AM | 1,971 (8.2%) | 1,589 (8.5%) |
| 8:30 AM to 8:59 AM | 652 (2.7%) | 507 (2.7%) |
| 9:00 AM to 9:59 AM | 792 (3.3%) | 952 (5.1%) |
| 10:00 AM to 10:59 AM | 649 (2.7%) | 598 (3.2%) |
| 11:00 AM to 11:59 AM | 361 (1.5%) | 291 (1.6%) |
| 12:00 PM to 3:59 PM | 1,687 (7.0%) | 1,863 (10.0%) |
| 4:00 PM to 11:59 PM | 1,283 (5.3%) | 1,014 (5.4%) |
| Total | 24,023 (100.0%) | 18,609 (100.0%) |
Housing Occupancy in Cochise County
Occupancy by Ownership in Cochise County
Of the total 49,680 dwellings in Cochise County, owner-occupied units account for 34,882 (70.2%), while renter-occupied units make up 14,798 (29.8%).
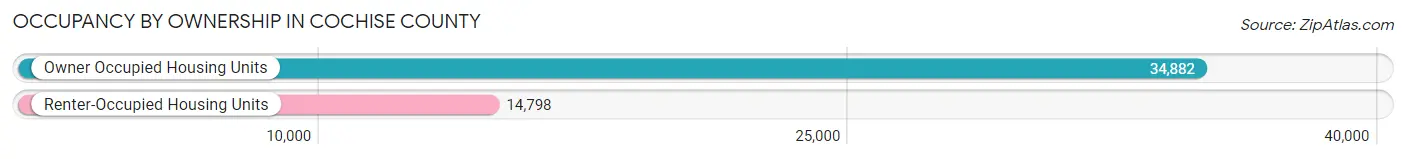
| Occupancy | # Housing Units | % Housing Units |
| Owner Occupied Housing Units | 34,882 | 70.2% |
| Renter-Occupied Housing Units | 14,798 | 29.8% |
| Total Occupied Housing Units | 49,680 | 100.0% |
Occupancy by Household Size in Cochise County
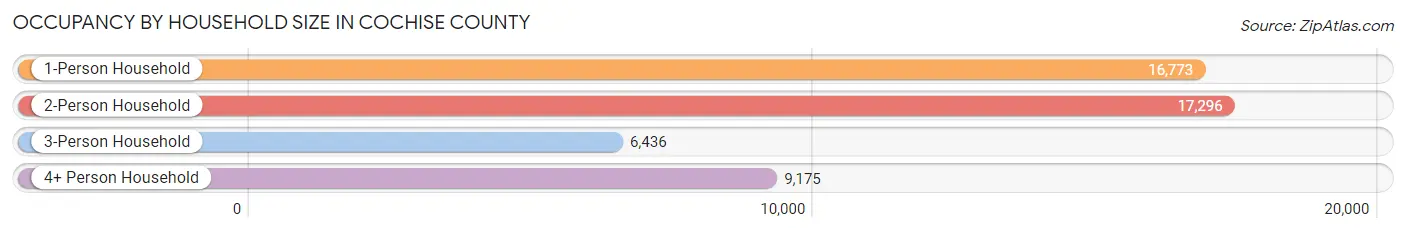
| Household Size | # Housing Units | % Housing Units |
| 1-Person Household | 16,773 | 33.8% |
| 2-Person Household | 17,296 | 34.8% |
| 3-Person Household | 6,436 | 13.0% |
| 4+ Person Household | 9,175 | 18.5% |
| Total Housing Units | 49,680 | 100.0% |
Occupancy by Ownership by Household Size in Cochise County
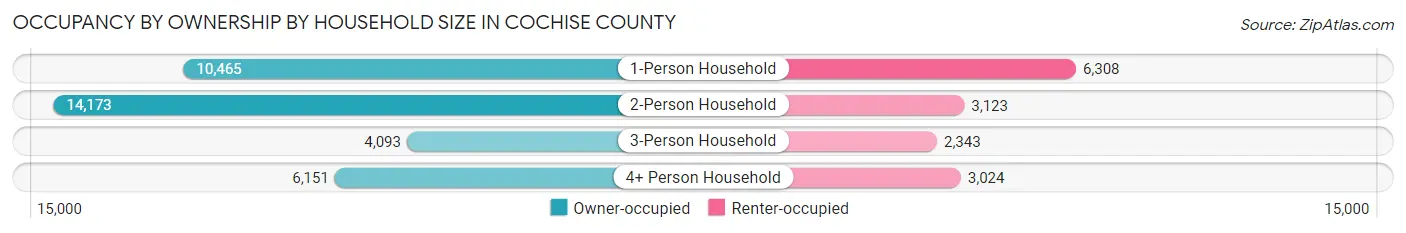
| Household Size | Owner-occupied | Renter-occupied |
| 1-Person Household | 10,465 (62.4%) | 6,308 (37.6%) |
| 2-Person Household | 14,173 (81.9%) | 3,123 (18.1%) |
| 3-Person Household | 4,093 (63.6%) | 2,343 (36.4%) |
| 4+ Person Household | 6,151 (67.0%) | 3,024 (33.0%) |
| Total Housing Units | 34,882 (70.2%) | 14,798 (29.8%) |
Occupancy by Educational Attainment in Cochise County
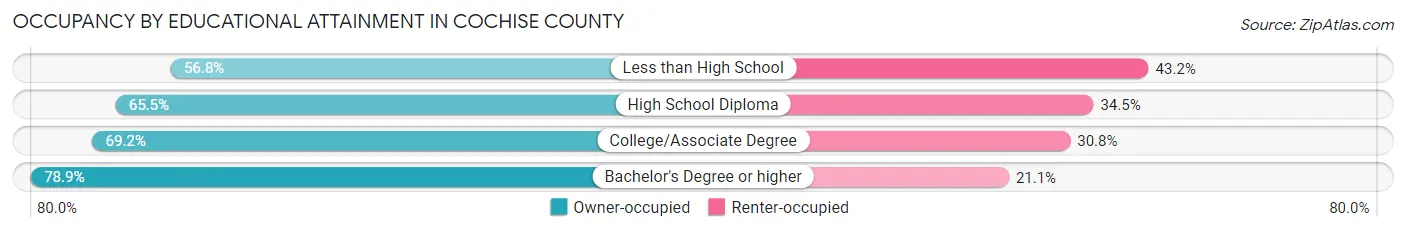
| Household Size | Owner-occupied | Renter-occupied |
| Less than High School | 2,528 (56.8%) | 1,924 (43.2%) |
| High School Diploma | 7,084 (65.5%) | 3,727 (34.5%) |
| College/Associate Degree | 13,506 (69.2%) | 6,009 (30.8%) |
| Bachelor's Degree or higher | 11,764 (78.9%) | 3,138 (21.1%) |
Occupancy by Age of Householder in Cochise County
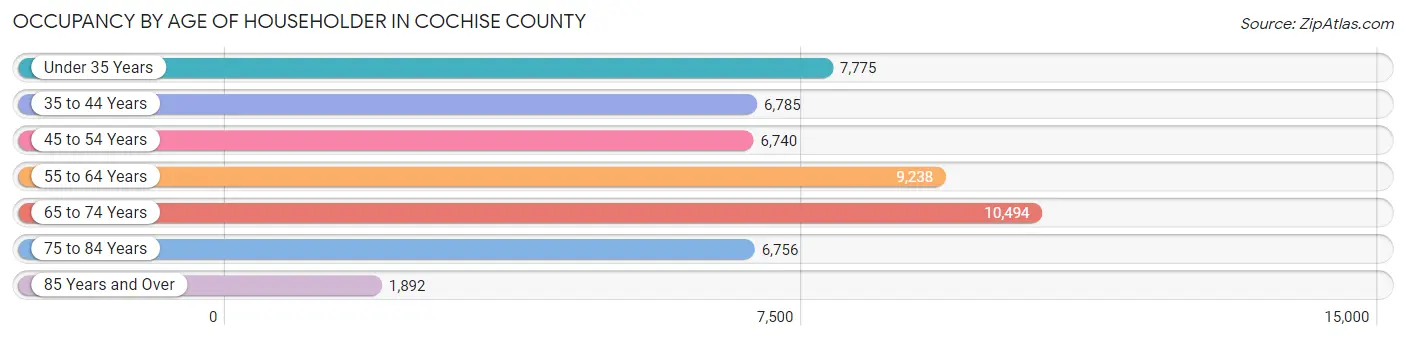
| Age Bracket | # Households | % Households |
| Under 35 Years | 7,775 | 15.7% |
| 35 to 44 Years | 6,785 | 13.7% |
| 45 to 54 Years | 6,740 | 13.6% |
| 55 to 64 Years | 9,238 | 18.6% |
| 65 to 74 Years | 10,494 | 21.1% |
| 75 to 84 Years | 6,756 | 13.6% |
| 85 Years and Over | 1,892 | 3.8% |
| Total | 49,680 | 100.0% |
Housing Finances in Cochise County
Median Income by Occupancy in Cochise County
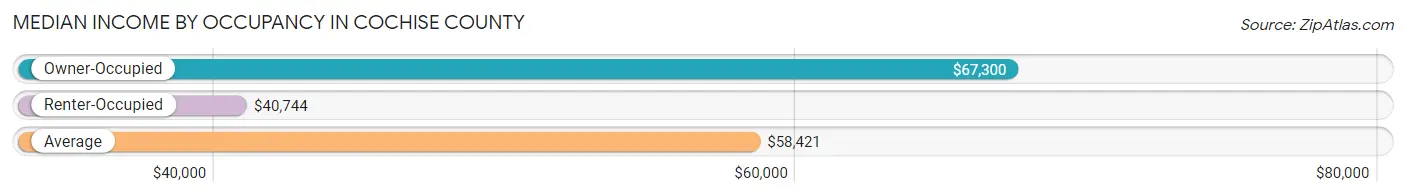
| Occupancy Type | # Households | Median Income |
| Owner-Occupied | 34,882 (70.2%) | $67,300 |
| Renter-Occupied | 14,798 (29.8%) | $40,744 |
| Average | 49,680 (100.0%) | $58,421 |
Occupancy by Householder Income Bracket in Cochise County
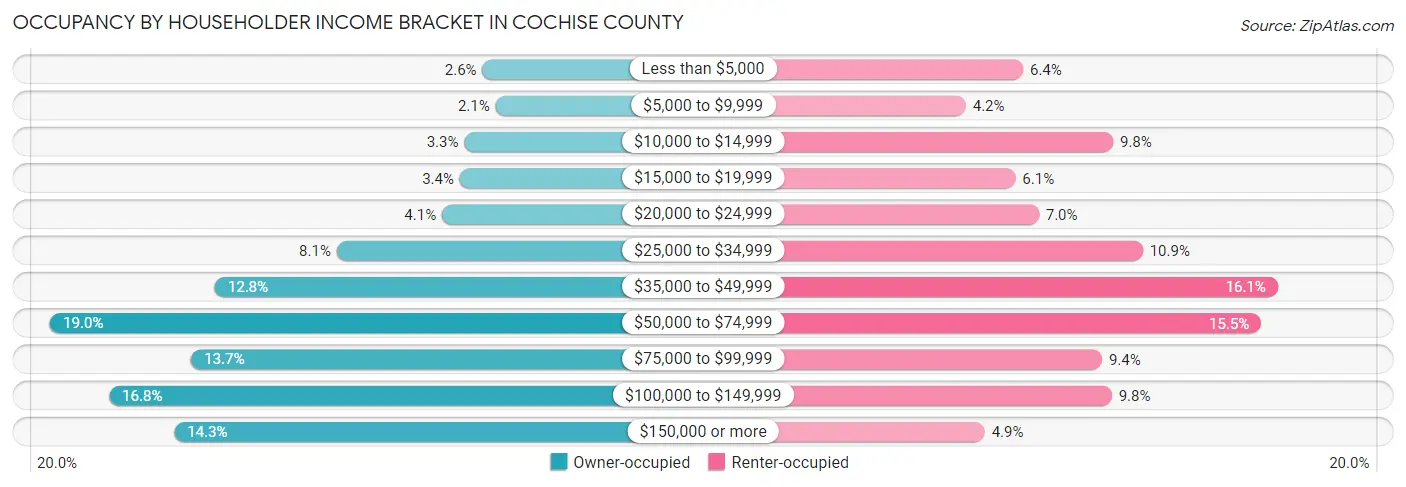
| Income Bracket | Owner-occupied | Renter-occupied |
| Less than $5,000 | 892 (2.6%) | 944 (6.4%) |
| $5,000 to $9,999 | 718 (2.1%) | 621 (4.2%) |
| $10,000 to $14,999 | 1,133 (3.3%) | 1,452 (9.8%) |
| $15,000 to $19,999 | 1,192 (3.4%) | 901 (6.1%) |
| $20,000 to $24,999 | 1,429 (4.1%) | 1,033 (7.0%) |
| $25,000 to $34,999 | 2,828 (8.1%) | 1,619 (10.9%) |
| $35,000 to $49,999 | 4,448 (12.8%) | 2,380 (16.1%) |
| $50,000 to $74,999 | 6,637 (19.0%) | 2,286 (15.4%) |
| $75,000 to $99,999 | 4,762 (13.7%) | 1,389 (9.4%) |
| $100,000 to $149,999 | 5,854 (16.8%) | 1,445 (9.8%) |
| $150,000 or more | 4,989 (14.3%) | 728 (4.9%) |
| Total | 34,882 (100.0%) | 14,798 (100.0%) |
Monthly Housing Cost Tiers in Cochise County
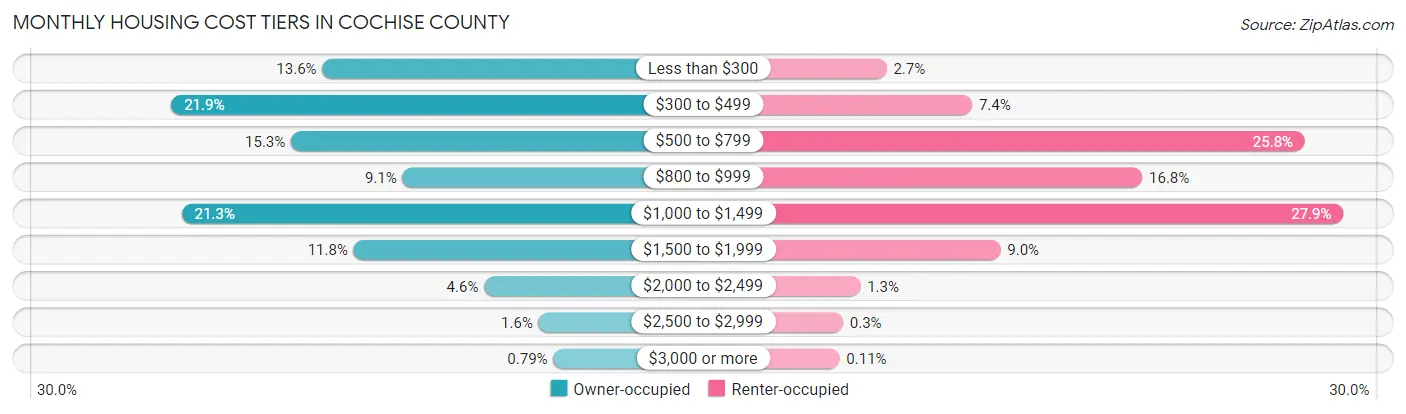
| Monthly Cost | Owner-occupied | Renter-occupied |
| Less than $300 | 4,727 (13.6%) | 401 (2.7%) |
| $300 to $499 | 7,638 (21.9%) | 1,099 (7.4%) |
| $500 to $799 | 5,331 (15.3%) | 3,821 (25.8%) |
| $800 to $999 | 3,182 (9.1%) | 2,491 (16.8%) |
| $1,000 to $1,499 | 7,439 (21.3%) | 4,134 (27.9%) |
| $1,500 to $1,999 | 4,122 (11.8%) | 1,332 (9.0%) |
| $2,000 to $2,499 | 1,607 (4.6%) | 186 (1.3%) |
| $2,500 to $2,999 | 559 (1.6%) | 45 (0.3%) |
| $3,000 or more | 277 (0.8%) | 17 (0.1%) |
| Total | 34,882 (100.0%) | 14,798 (100.0%) |
Physical Housing Characteristics in Cochise County
Housing Structures in Cochise County
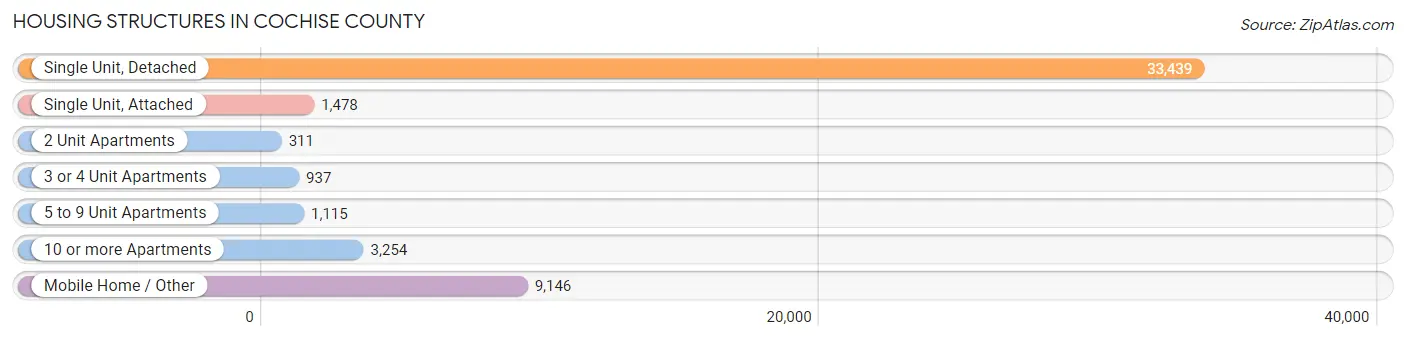
| Structure Type | # Housing Units | % Housing Units |
| Single Unit, Detached | 33,439 | 67.3% |
| Single Unit, Attached | 1,478 | 3.0% |
| 2 Unit Apartments | 311 | 0.6% |
| 3 or 4 Unit Apartments | 937 | 1.9% |
| 5 to 9 Unit Apartments | 1,115 | 2.2% |
| 10 or more Apartments | 3,254 | 6.6% |
| Mobile Home / Other | 9,146 | 18.4% |
| Total | 49,680 | 100.0% |
Housing Structures by Occupancy in Cochise County
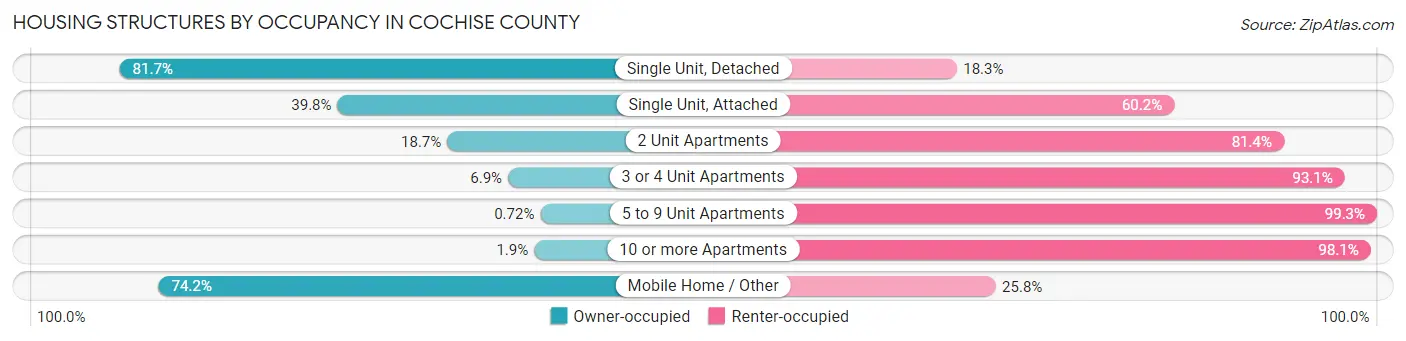
| Structure Type | Owner-occupied | Renter-occupied |
| Single Unit, Detached | 27,315 (81.7%) | 6,124 (18.3%) |
| Single Unit, Attached | 588 (39.8%) | 890 (60.2%) |
| 2 Unit Apartments | 58 (18.6%) | 253 (81.4%) |
| 3 or 4 Unit Apartments | 65 (6.9%) | 872 (93.1%) |
| 5 to 9 Unit Apartments | 8 (0.7%) | 1,107 (99.3%) |
| 10 or more Apartments | 62 (1.9%) | 3,192 (98.1%) |
| Mobile Home / Other | 6,786 (74.2%) | 2,360 (25.8%) |
| Total | 34,882 (70.2%) | 14,798 (29.8%) |
Housing Structures by Number of Rooms in Cochise County
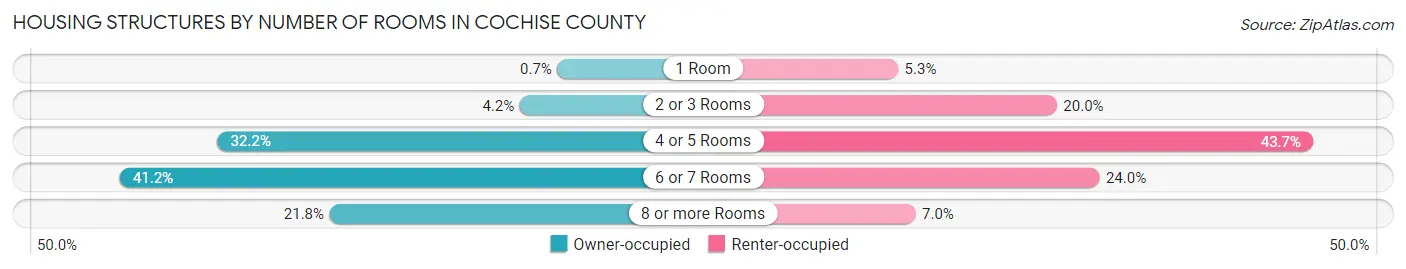
| Number of Rooms | Owner-occupied | Renter-occupied |
| 1 Room | 245 (0.7%) | 790 (5.3%) |
| 2 or 3 Rooms | 1,459 (4.2%) | 2,963 (20.0%) |
| 4 or 5 Rooms | 11,218 (32.2%) | 6,471 (43.7%) |
| 6 or 7 Rooms | 14,365 (41.2%) | 3,545 (24.0%) |
| 8 or more Rooms | 7,595 (21.8%) | 1,029 (7.0%) |
| Total | 34,882 (100.0%) | 14,798 (100.0%) |
Housing Structure by Heating Type in Cochise County
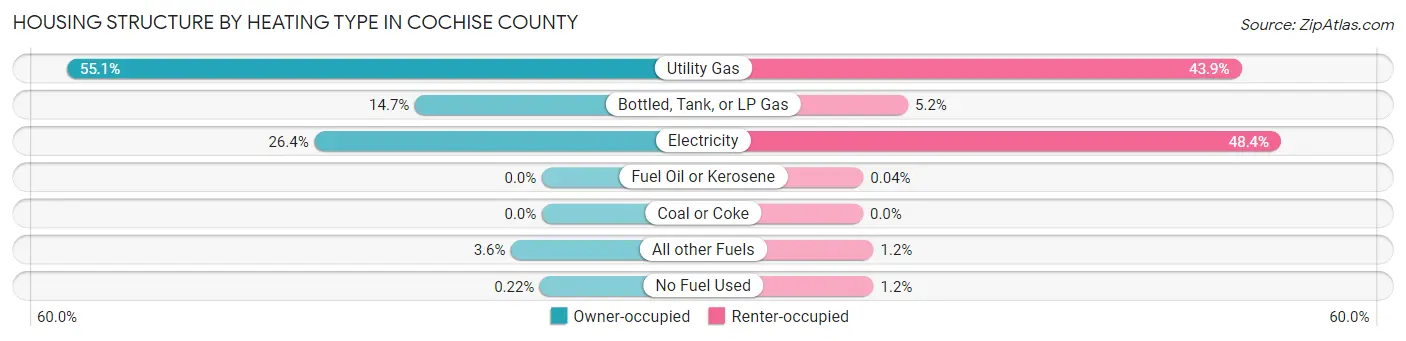
| Heating Type | Owner-occupied | Renter-occupied |
| Utility Gas | 19,221 (55.1%) | 6,489 (43.9%) |
| Bottled, Tank, or LP Gas | 5,135 (14.7%) | 773 (5.2%) |
| Electricity | 9,204 (26.4%) | 7,168 (48.4%) |
| Fuel Oil or Kerosene | 0 (0.0%) | 6 (0.0%) |
| Coal or Coke | 0 (0.0%) | 0 (0.0%) |
| All other Fuels | 1,247 (3.6%) | 181 (1.2%) |
| No Fuel Used | 75 (0.2%) | 181 (1.2%) |
| Total | 34,882 (100.0%) | 14,798 (100.0%) |
Household Vehicle Usage in Cochise County
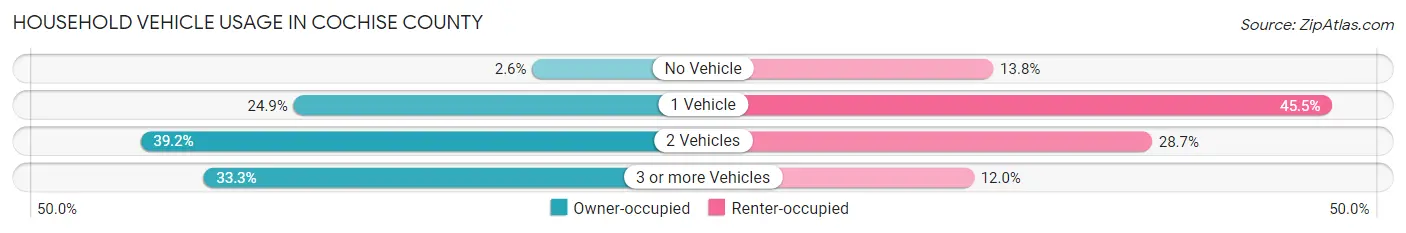
| Vehicles per Household | Owner-occupied | Renter-occupied |
| No Vehicle | 908 (2.6%) | 2,048 (13.8%) |
| 1 Vehicle | 8,681 (24.9%) | 6,732 (45.5%) |
| 2 Vehicles | 13,673 (39.2%) | 4,240 (28.6%) |
| 3 or more Vehicles | 11,620 (33.3%) | 1,778 (12.0%) |
| Total | 34,882 (100.0%) | 14,798 (100.0%) |
Real Estate & Mortgages in Cochise County
Real Estate and Mortgage Overview in Cochise County
| Characteristic | Without Mortgage | With Mortgage |
| Housing Units | 16,639 | 18,243 |
| Median Property Value | $157,600 | $202,500 |
| Median Household Income | $52,043 | $3,493 |
| Monthly Housing Costs | $388 | $203 |
| Real Estate Taxes | $1,242 | $558 |
Property Value by Mortgage Status in Cochise County
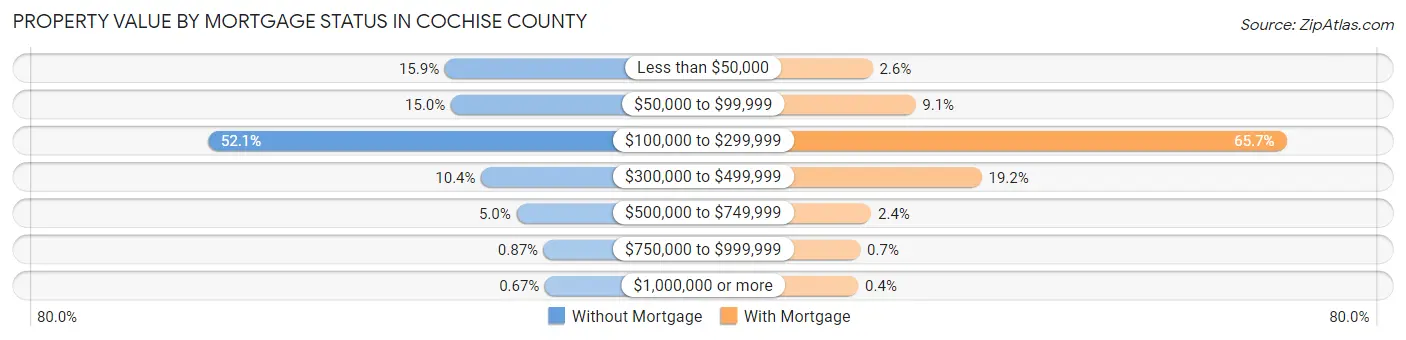
| Property Value | Without Mortgage | With Mortgage |
| Less than $50,000 | 2,653 (15.9%) | 471 (2.6%) |
| $50,000 to $99,999 | 2,498 (15.0%) | 1,662 (9.1%) |
| $100,000 to $299,999 | 8,664 (52.1%) | 11,976 (65.6%) |
| $300,000 to $499,999 | 1,731 (10.4%) | 3,502 (19.2%) |
| $500,000 to $749,999 | 837 (5.0%) | 432 (2.4%) |
| $750,000 to $999,999 | 144 (0.9%) | 127 (0.7%) |
| $1,000,000 or more | 112 (0.7%) | 73 (0.4%) |
| Total | 16,639 (100.0%) | 18,243 (100.0%) |
Household Income by Mortgage Status in Cochise County
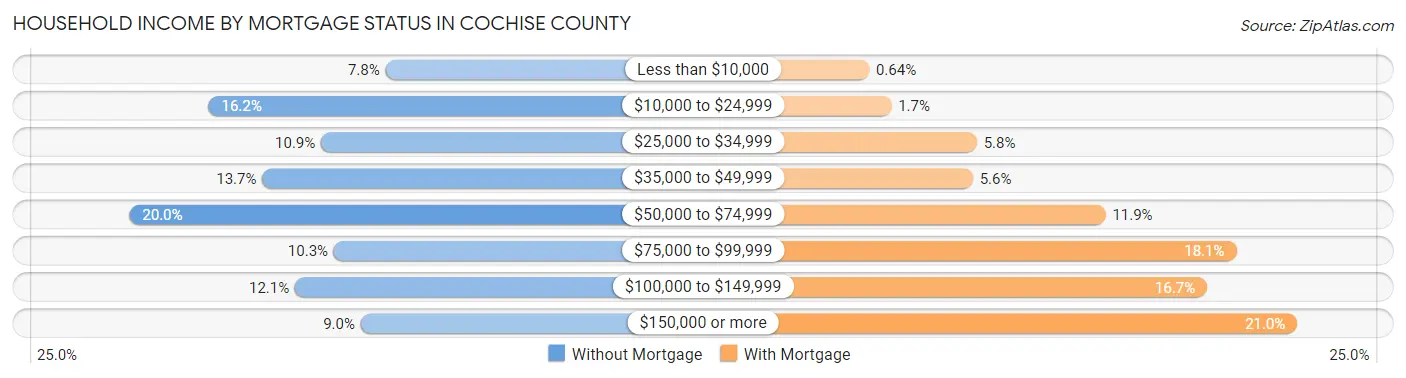
| Household Income | Without Mortgage | With Mortgage |
| Less than $10,000 | 1,300 (7.8%) | 117 (0.6%) |
| $10,000 to $24,999 | 2,702 (16.2%) | 310 (1.7%) |
| $25,000 to $34,999 | 1,810 (10.9%) | 1,052 (5.8%) |
| $35,000 to $49,999 | 2,277 (13.7%) | 1,018 (5.6%) |
| $50,000 to $74,999 | 3,329 (20.0%) | 2,171 (11.9%) |
| $75,000 to $99,999 | 1,708 (10.3%) | 3,308 (18.1%) |
| $100,000 to $149,999 | 2,017 (12.1%) | 3,054 (16.7%) |
| $150,000 or more | 1,496 (9.0%) | 3,837 (21.0%) |
| Total | 16,639 (100.0%) | 18,243 (100.0%) |
Property Value to Household Income Ratio in Cochise County
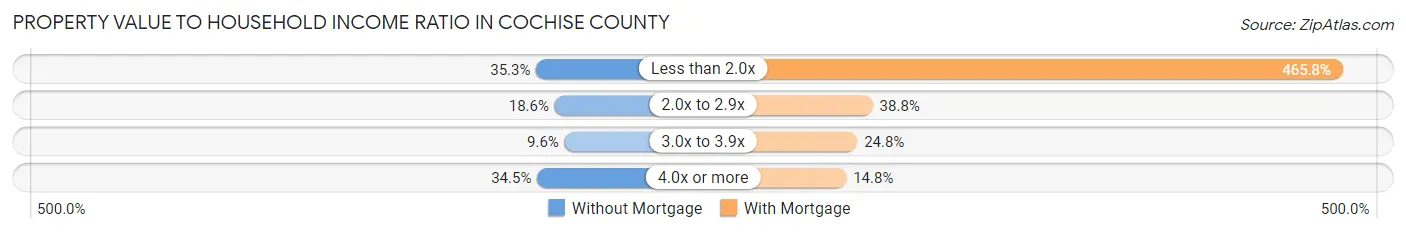
| Value-to-Income Ratio | Without Mortgage | With Mortgage |
| Less than 2.0x | 5,879 (35.3%) | 84,970 (465.8%) |
| 2.0x to 2.9x | 3,087 (18.5%) | 7,077 (38.8%) |
| 3.0x to 3.9x | 1,594 (9.6%) | 4,518 (24.8%) |
| 4.0x or more | 5,742 (34.5%) | 2,703 (14.8%) |
| Total | 16,639 (100.0%) | 18,243 (100.0%) |
Real Estate Taxes by Mortgage Status in Cochise County
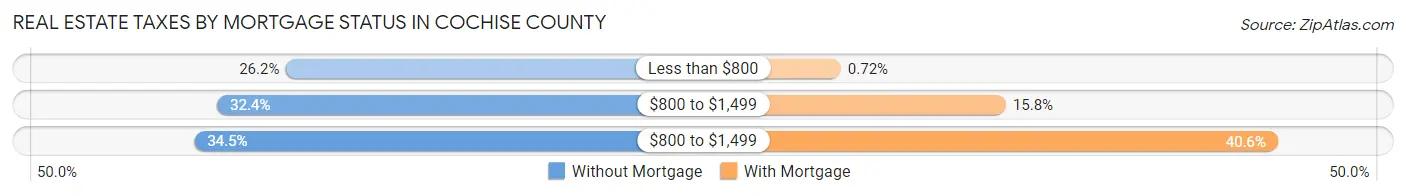
| Property Taxes | Without Mortgage | With Mortgage |
| Less than $800 | 4,360 (26.2%) | 131 (0.7%) |
| $800 to $1,499 | 5,395 (32.4%) | 2,881 (15.8%) |
| $800 to $1,499 | 5,742 (34.5%) | 7,411 (40.6%) |
| Total | 16,639 (100.0%) | 18,243 (100.0%) |
Health & Disability in Cochise County
Health Insurance Coverage by Age in Cochise County
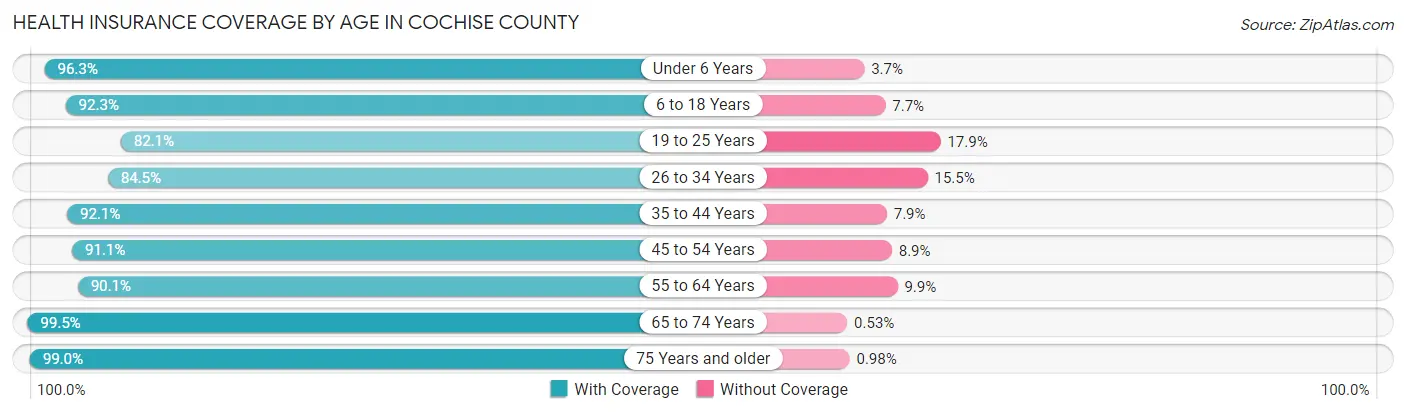
| Age Bracket | With Coverage | Without Coverage |
| Under 6 Years | 8,100 (96.3%) | 313 (3.7%) |
| 6 to 18 Years | 18,293 (92.3%) | 1,518 (7.7%) |
| 19 to 25 Years | 7,081 (82.1%) | 1,548 (17.9%) |
| 26 to 34 Years | 9,898 (84.5%) | 1,819 (15.5%) |
| 35 to 44 Years | 11,586 (92.1%) | 996 (7.9%) |
| 45 to 54 Years | 11,032 (91.1%) | 1,073 (8.9%) |
| 55 to 64 Years | 14,258 (90.1%) | 1,569 (9.9%) |
| 65 to 74 Years | 16,382 (99.5%) | 88 (0.5%) |
| 75 Years and older | 12,189 (99.0%) | 121 (1.0%) |
| Total | 108,819 (92.3%) | 9,045 (7.7%) |
Health Insurance Coverage by Citizenship Status in Cochise County
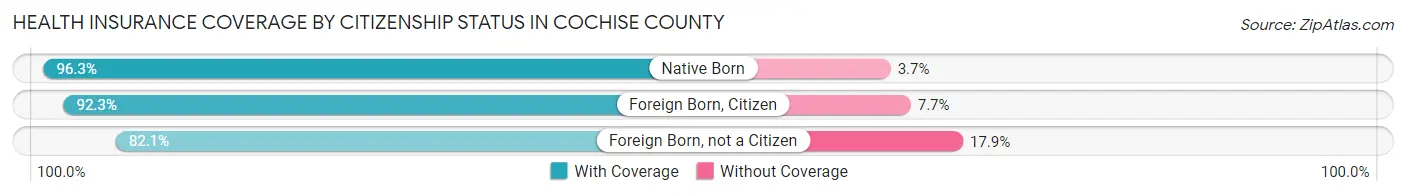
| Citizenship Status | With Coverage | Without Coverage |
| Native Born | 8,100 (96.3%) | 313 (3.7%) |
| Foreign Born, Citizen | 18,293 (92.3%) | 1,518 (7.7%) |
| Foreign Born, not a Citizen | 7,081 (82.1%) | 1,548 (17.9%) |
Health Insurance Coverage by Household Income in Cochise County
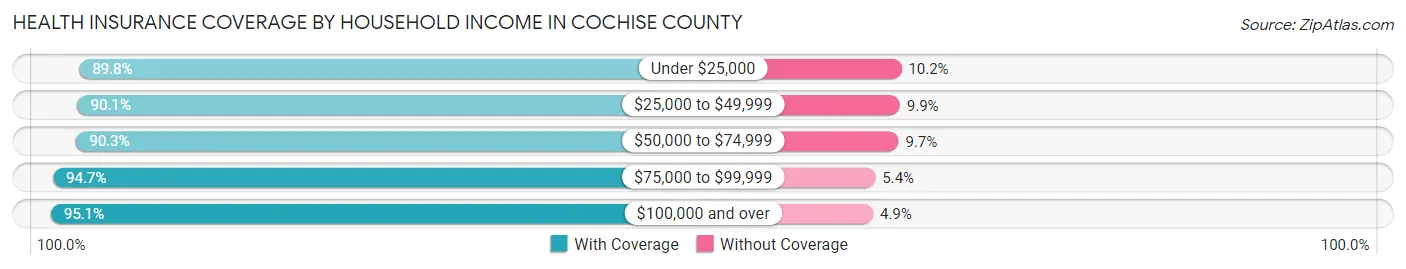
| Household Income | With Coverage | Without Coverage |
| Under $25,000 | 15,522 (89.8%) | 1,771 (10.2%) |
| $25,000 to $49,999 | 22,236 (90.1%) | 2,455 (9.9%) |
| $50,000 to $74,999 | 18,774 (90.3%) | 2,015 (9.7%) |
| $75,000 to $99,999 | 16,056 (94.7%) | 908 (5.3%) |
| $100,000 and over | 35,839 (95.1%) | 1,853 (4.9%) |
Public vs Private Health Insurance Coverage by Age in Cochise County
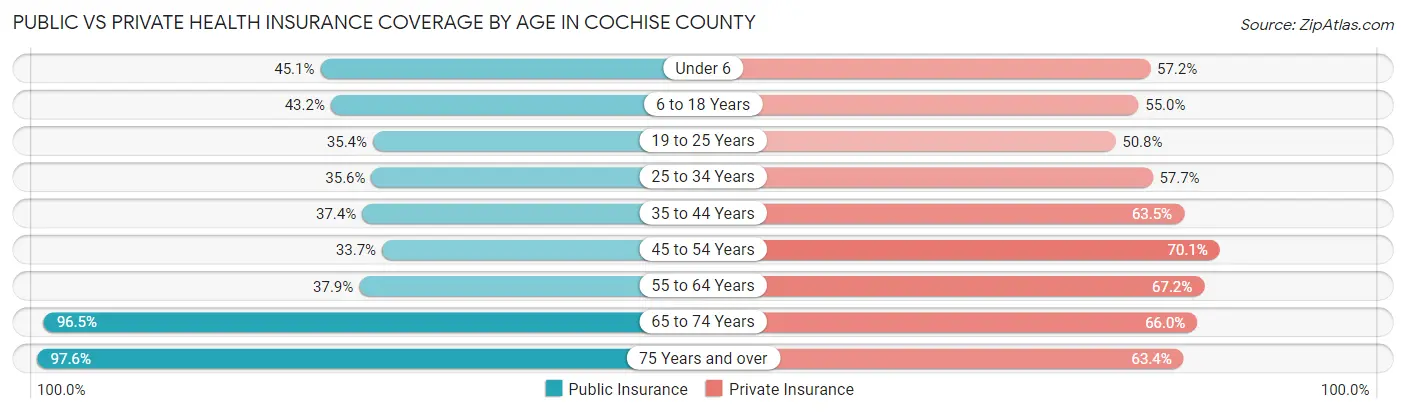
| Age Bracket | Public Insurance | Private Insurance |
| Under 6 | 3,795 (45.1%) | 4,813 (57.2%) |
| 6 to 18 Years | 8,555 (43.2%) | 10,904 (55.0%) |
| 19 to 25 Years | 3,051 (35.4%) | 4,380 (50.8%) |
| 25 to 34 Years | 4,176 (35.6%) | 6,756 (57.7%) |
| 35 to 44 Years | 4,701 (37.4%) | 7,989 (63.5%) |
| 45 to 54 Years | 4,077 (33.7%) | 8,489 (70.1%) |
| 55 to 64 Years | 6,000 (37.9%) | 10,642 (67.2%) |
| 65 to 74 Years | 15,885 (96.5%) | 10,863 (66.0%) |
| 75 Years and over | 12,012 (97.6%) | 7,809 (63.4%) |
| Total | 62,252 (52.8%) | 72,645 (61.6%) |
Disability Status by Sex by Age in Cochise County
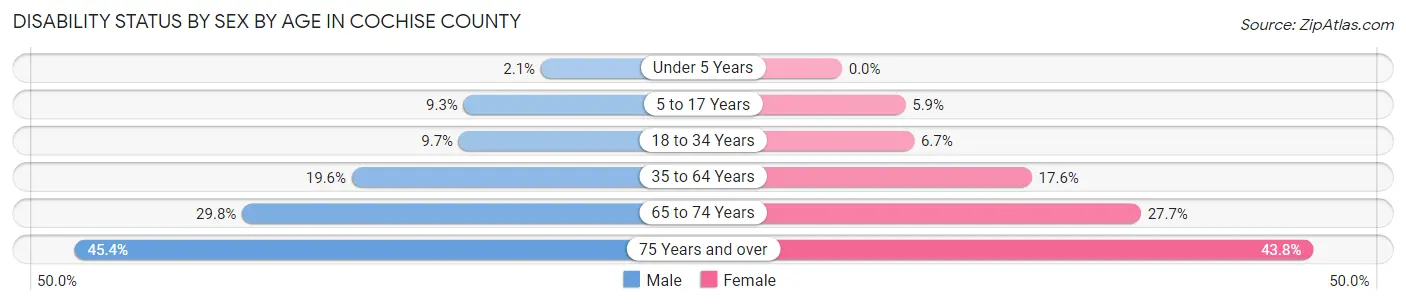
| Age Bracket | Male | Female |
| Under 5 Years | 70 (2.1%) | 0 (0.0%) |
| 5 to 17 Years | 929 (9.2%) | 568 (5.9%) |
| 18 to 34 Years | 1,056 (9.7%) | 755 (6.7%) |
| 35 to 64 Years | 3,772 (19.6%) | 3,752 (17.6%) |
| 65 to 74 Years | 2,405 (29.8%) | 2,331 (27.7%) |
| 75 Years and over | 2,613 (45.4%) | 2,865 (43.8%) |
Disability Class by Sex by Age in Cochise County
Disability Class: Hearing Difficulty
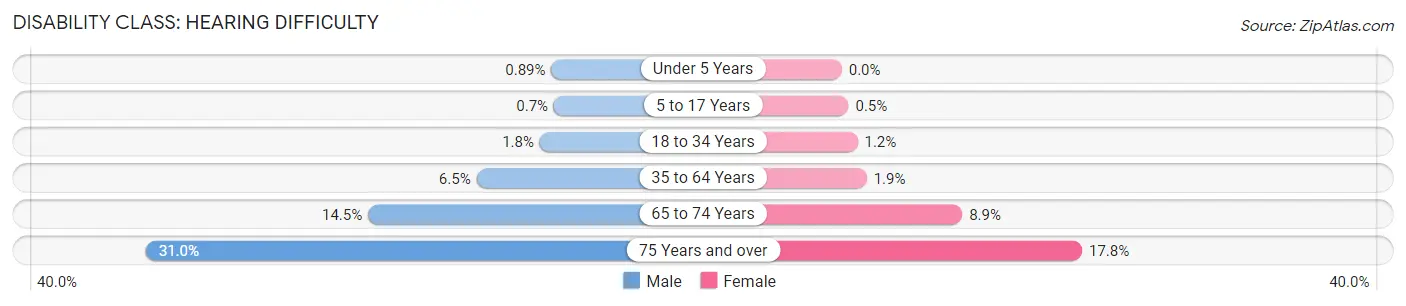
| Age Bracket | Male | Female |
| Under 5 Years | 30 (0.9%) | 0 (0.0%) |
| 5 to 17 Years | 70 (0.7%) | 48 (0.5%) |
| 18 to 34 Years | 191 (1.8%) | 132 (1.2%) |
| 35 to 64 Years | 1,239 (6.5%) | 394 (1.8%) |
| 65 to 74 Years | 1,170 (14.5%) | 751 (8.9%) |
| 75 Years and over | 1,786 (31.0%) | 1,168 (17.8%) |
Disability Class: Vision Difficulty
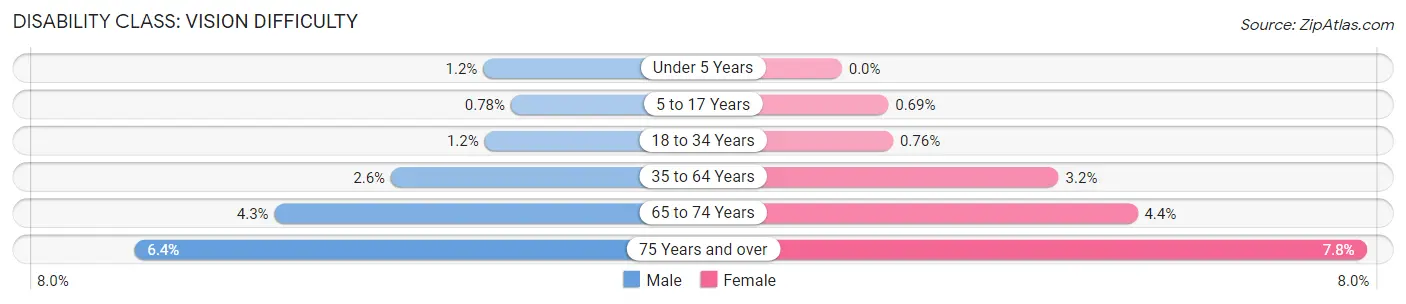
| Age Bracket | Male | Female |
| Under 5 Years | 40 (1.2%) | 0 (0.0%) |
| 5 to 17 Years | 78 (0.8%) | 67 (0.7%) |
| 18 to 34 Years | 127 (1.2%) | 86 (0.8%) |
| 35 to 64 Years | 491 (2.6%) | 686 (3.2%) |
| 65 to 74 Years | 346 (4.3%) | 369 (4.4%) |
| 75 Years and over | 367 (6.4%) | 510 (7.8%) |
Disability Class: Cognitive Difficulty
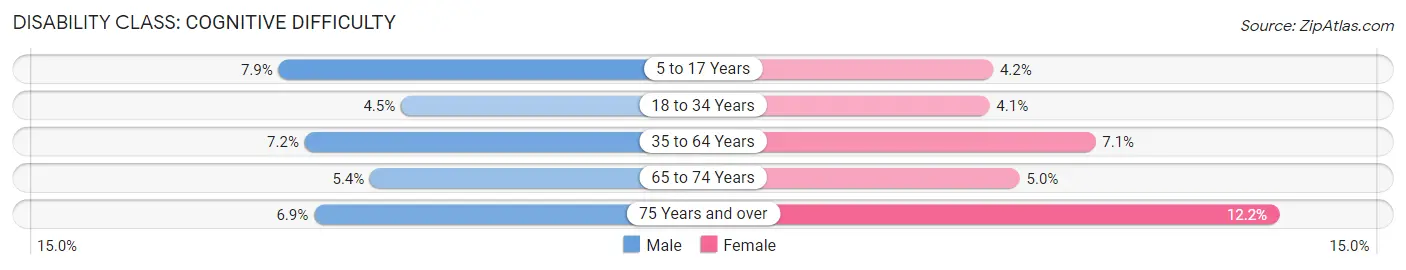
| Age Bracket | Male | Female |
| 5 to 17 Years | 796 (7.9%) | 406 (4.2%) |
| 18 to 34 Years | 492 (4.5%) | 463 (4.1%) |
| 35 to 64 Years | 1,384 (7.2%) | 1,504 (7.1%) |
| 65 to 74 Years | 434 (5.4%) | 416 (5.0%) |
| 75 Years and over | 400 (6.9%) | 797 (12.2%) |
Disability Class: Ambulatory Difficulty
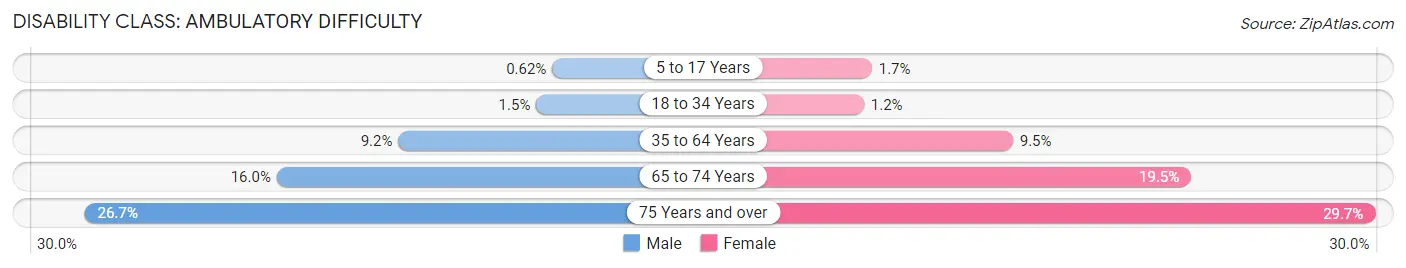
| Age Bracket | Male | Female |
| 5 to 17 Years | 62 (0.6%) | 161 (1.7%) |
| 18 to 34 Years | 164 (1.5%) | 138 (1.2%) |
| 35 to 64 Years | 1,766 (9.2%) | 2,028 (9.5%) |
| 65 to 74 Years | 1,288 (16.0%) | 1,634 (19.5%) |
| 75 Years and over | 1,536 (26.7%) | 1,945 (29.7%) |
Disability Class: Self-Care Difficulty
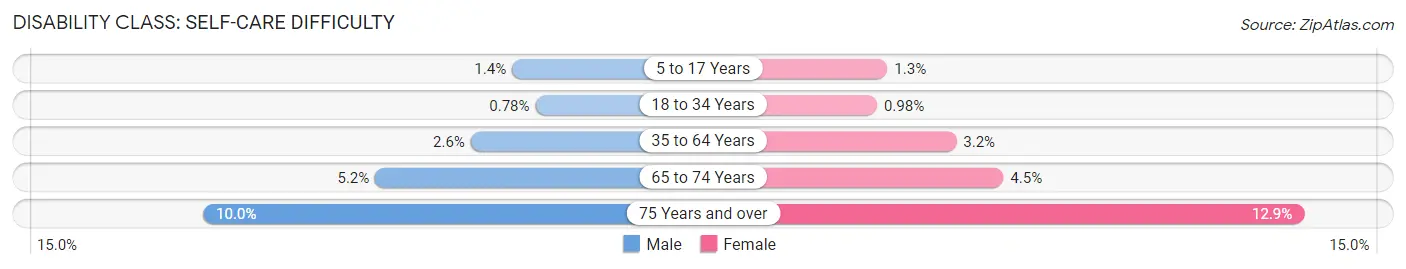
| Age Bracket | Male | Female |
| 5 to 17 Years | 144 (1.4%) | 122 (1.3%) |
| 18 to 34 Years | 85 (0.8%) | 110 (1.0%) |
| 35 to 64 Years | 495 (2.6%) | 680 (3.2%) |
| 65 to 74 Years | 423 (5.2%) | 378 (4.5%) |
| 75 Years and over | 578 (10.0%) | 843 (12.9%) |
Technology Access in Cochise County
Computing Device Access in Cochise County
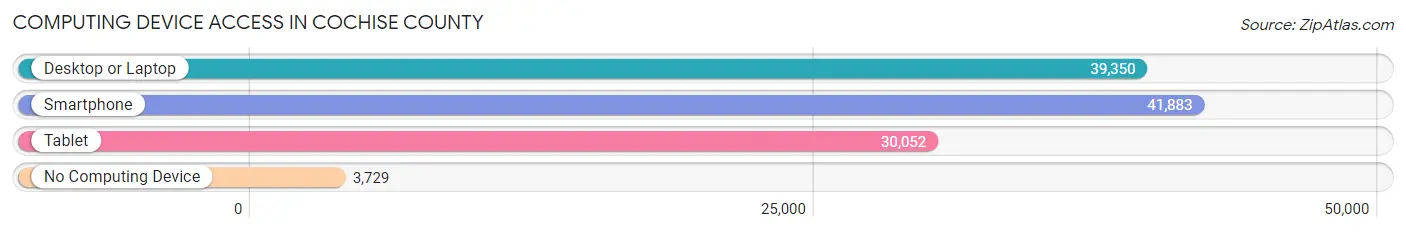
| Device Type | # Households | % Households |
| Desktop or Laptop | 39,350 | 79.2% |
| Smartphone | 41,883 | 84.3% |
| Tablet | 30,052 | 60.5% |
| No Computing Device | 3,729 | 7.5% |
| Total | 49,680 | 100.0% |
Internet Access in Cochise County
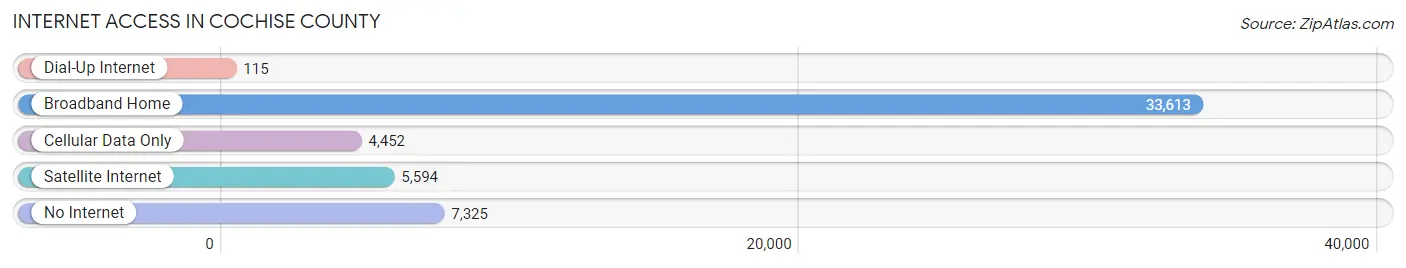
| Internet Type | # Households | % Households |
| Dial-Up Internet | 115 | 0.2% |
| Broadband Home | 33,613 | 67.7% |
| Cellular Data Only | 4,452 | 9.0% |
| Satellite Internet | 5,594 | 11.3% |
| No Internet | 7,325 | 14.7% |
| Total | 49,680 | 100.0% |
Cochise County Summary
Cochise County is located in the southeastern corner of Arizona, and is bordered by New Mexico to the east, Mexico to the south, and Pima and Santa Cruz counties to the west. The county is named after the famous Apache leader, Cochise, who led his people in a series of battles against the United States Army in the late 1800s. The county covers an area of 6,219 square miles, making it the fourth largest county in Arizona.
Geography
Cochise County is located in the Basin and Range Province of the southwestern United States. The county is characterized by a series of mountain ranges, including the Chiricahua, Dragoon, Huachuca, and Mule Mountains. The county is also home to the San Pedro River, which flows through the county from north to south. The county is home to several national parks and monuments, including Chiricahua National Monument, Coronado National Memorial, and Fort Bowie National Historic Site.
The county has a semi-arid climate, with hot summers and mild winters. The average annual temperature is 68°F, and the average annual precipitation is 13.5 inches.
Economy
Cochise County has a diverse economy, with a mix of agriculture, manufacturing, and services. The county is home to several large employers, including Raytheon Missile Systems, Freeport-McMoRan Copper & Gold, and the University of Arizona South.
Agriculture is an important part of the county’s economy, with cattle, cotton, and hay being the primary crops. The county is also home to several wineries, and is a popular destination for wine tourism.
Manufacturing is also an important part of the county’s economy, with several large companies located in the county, including General Dynamics, Lockheed Martin, and Raytheon.
The county is also home to several military bases, including Fort Huachuca, Davis-Monthan Air Force Base, and the Sierra Vista Army Airfield.
Demographics
As of the 2010 census, the population of Cochise County was 131,346, making it the fourth most populous county in Arizona. The population is predominantly white (77.3%), with a significant Hispanic population (20.2%). The median household income is $45,845, and the median home value is $142,400.
The county is home to several Native American tribes, including the Chiricahua Apache, the Tohono O’odham, and the Pascua Yaqui.
Conclusion
Cochise County is a large and diverse county located in the southeastern corner of Arizona. The county is home to a variety of industries, including agriculture, manufacturing, and services. The county is also home to several national parks and monuments, and is a popular destination for wine tourism. The population of the county is predominantly white, with a significant Hispanic population. The median household income is $45,845, and the median home value is $142,400.
Common Questions
What is Per Capita Income in Cochise County?
Per Capita income in Cochise County is $31,423.
What is the Median Family Income in Cochise County?
Median Family Income in Cochise County is $73,643.
What is the Median Household income in Cochise County?
Median Household Income in Cochise County is $58,421.
What is Income or Wage Gap in Cochise County?
Income or Wage Gap in Cochise County is 30.7%.
Women in Cochise County earn 69.3 cents for every dollar earned by a man.
What is Family Income Deficit in Cochise County?
Family Income Deficit in Cochise County is $10,867.
Families that are below poverty line in Cochise County earn $10,867 less on average than the poverty threshold level.
What is Inequality or Gini Index in Cochise County?
Inequality or Gini Index in Cochise County is 0.44.
What is the Total Population of Cochise County?
Total Population of Cochise County is 125,504.
What is the Total Male Population of Cochise County?
Total Male Population of Cochise County is 64,221.
What is the Total Female Population of Cochise County?
Total Female Population of Cochise County is 61,283.
What is the Ratio of Males per 100 Females in Cochise County?
There are 104.79 Males per 100 Females in Cochise County.
What is the Ratio of Females per 100 Males in Cochise County?
There are 95.43 Females per 100 Males in Cochise County.
What is the Median Population Age in Cochise County?
Median Population Age in Cochise County is 41.4 Years.
What is the Average Family Size in Cochise County
Average Family Size in Cochise County is 3.1 People.
What is the Average Household Size in Cochise County
Average Household Size in Cochise County is 2.4 People.
How Large is the Labor Force in Cochise County?
There are 51,094 People in the Labor Forcein in Cochise County.
What is the Percentage of People in the Labor Force in Cochise County?
50.1% of People are in the Labor Force in Cochise County.
What is the Unemployment Rate in Cochise County?
Unemployment Rate in Cochise County is 6.8%.