York, AL Map & Demographics
York Map
York Overview
$18,773
PER CAPITA INCOME
$45,181
AVG FAMILY INCOME
$33,269
AVG HOUSEHOLD INCOME
39.9%
WAGE / INCOME GAP [ % ]
60.1¢/ $1
WAGE / INCOME GAP [ $ ]
0.41
INEQUALITY / GINI INDEX
2,423
TOTAL POPULATION
1,152
MALE POPULATION
1,271
FEMALE POPULATION
90.64
MALES / 100 FEMALES
110.33
FEMALES / 100 MALES
38.7
MEDIAN AGE
2.7
AVG FAMILY SIZE
2.1
AVG HOUSEHOLD SIZE
1,070
LABOR FORCE [ PEOPLE ]
57.5%
PERCENT IN LABOR FORCE
8.2%
UNEMPLOYMENT RATE
York Zip Codes
York Area Codes
Income in York
Income Overview in York
Per Capita Income in York is $18,773, while median incomes of families and households are $45,181 and $33,269 respectively.
| Characteristic | Number | Measure |
| Per Capita Income | 2,423 | $18,773 |
| Median Family Income | 645 | $45,181 |
| Mean Family Income | 645 | $48,808 |
| Median Household Income | 1,084 | $33,269 |
| Mean Household Income | 1,084 | $41,261 |
| Income Deficit | 645 | $0 |
| Wage / Income Gap (%) | 2,423 | 39.89% |
| Wage / Income Gap ($) | 2,423 | 60.11¢ per $1 |
| Gini / Inequality Index | 2,423 | 0.41 |
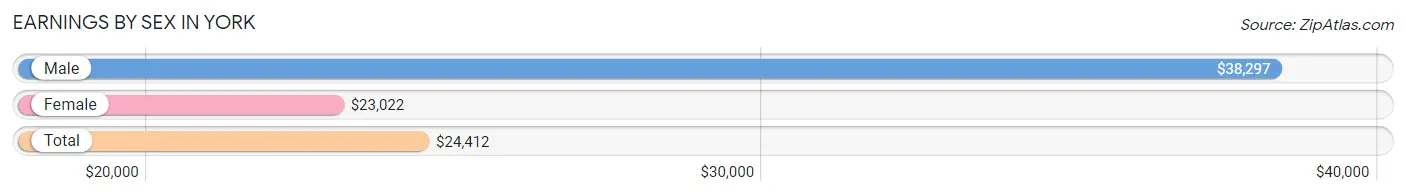
Earnings by Sex in York
Average Earnings in York are $24,412, $38,297 for men and $23,022 for women, a difference of 39.9%.
| Sex | Number | Average Earnings |
| Male | 493 (45.4%) | $38,297 |
| Female | 594 (54.6%) | $23,022 |
| Total | 1,087 (100.0%) | $24,412 |
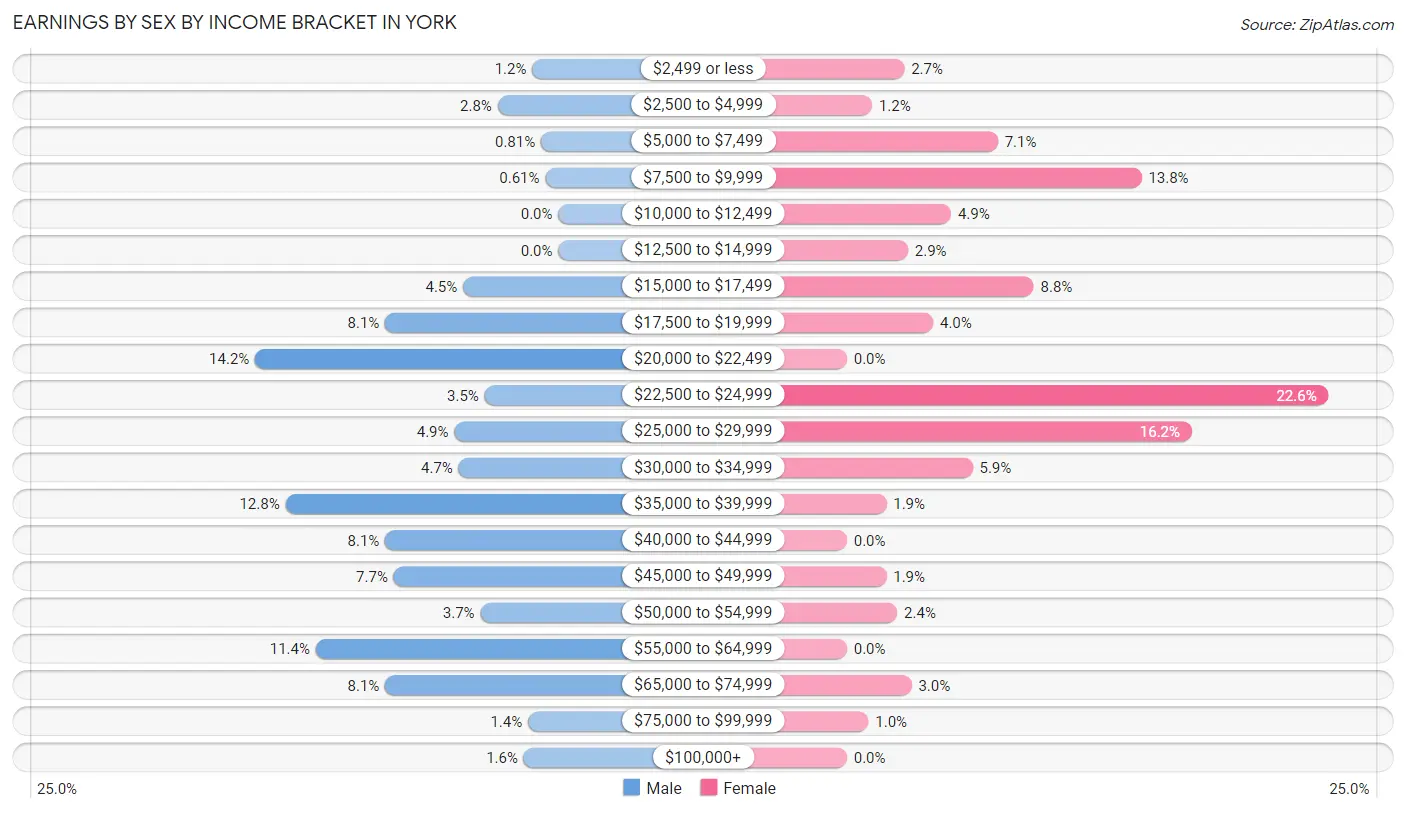
Earnings by Sex by Income Bracket in York
The most common earnings brackets in York are $20,000 to $22,499 for men (70 | 14.2%) and $22,500 to $24,999 for women (134 | 22.6%).
| Income | Male | Female |
| $2,499 or less | 6 (1.2%) | 16 (2.7%) |
| $2,500 to $4,999 | 14 (2.8%) | 7 (1.2%) |
| $5,000 to $7,499 | 4 (0.8%) | 42 (7.1%) |
| $7,500 to $9,999 | 3 (0.6%) | 82 (13.8%) |
| $10,000 to $12,499 | 0 (0.0%) | 29 (4.9%) |
| $12,500 to $14,999 | 0 (0.0%) | 17 (2.9%) |
| $15,000 to $17,499 | 22 (4.5%) | 52 (8.7%) |
| $17,500 to $19,999 | 40 (8.1%) | 24 (4.0%) |
| $20,000 to $22,499 | 70 (14.2%) | 0 (0.0%) |
| $22,500 to $24,999 | 17 (3.5%) | 134 (22.6%) |
| $25,000 to $29,999 | 24 (4.9%) | 96 (16.2%) |
| $30,000 to $34,999 | 23 (4.7%) | 35 (5.9%) |
| $35,000 to $39,999 | 63 (12.8%) | 11 (1.8%) |
| $40,000 to $44,999 | 40 (8.1%) | 0 (0.0%) |
| $45,000 to $49,999 | 38 (7.7%) | 11 (1.8%) |
| $50,000 to $54,999 | 18 (3.6%) | 14 (2.4%) |
| $55,000 to $64,999 | 56 (11.4%) | 0 (0.0%) |
| $65,000 to $74,999 | 40 (8.1%) | 18 (3.0%) |
| $75,000 to $99,999 | 7 (1.4%) | 6 (1.0%) |
| $100,000+ | 8 (1.6%) | 0 (0.0%) |
| Total | 493 (100.0%) | 594 (100.0%) |
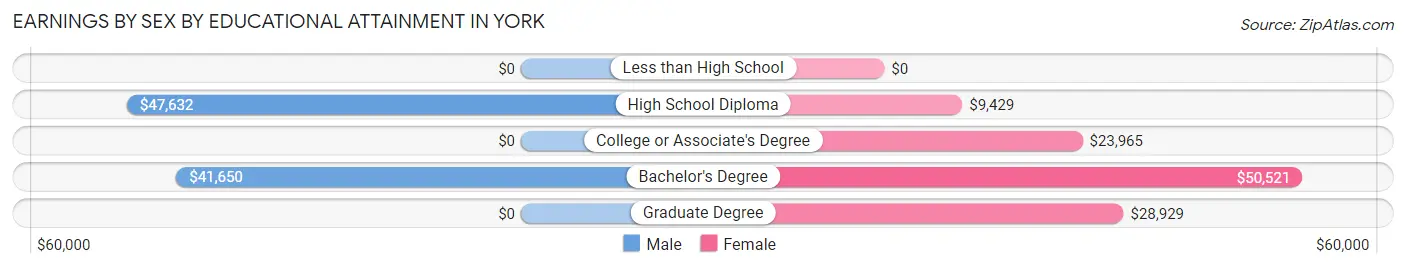
Earnings by Sex by Educational Attainment in York
Average earnings in York are $38,297 for men and $23,256 for women, a difference of 39.3%. Men with an educational attainment of high school diploma enjoy the highest average annual earnings of $47,632, while those with bachelor's degree education earn the least with $41,650. Women with an educational attainment of bachelor's degree earn the most with the average annual earnings of $50,521, while those with high school diploma education have the smallest earnings of $9,429.
| Educational Attainment | Male Income | Female Income |
| Less than High School | - | - |
| High School Diploma | $47,632 | $9,429 |
| College or Associate's Degree | - | - |
| Bachelor's Degree | $41,650 | $50,521 |
| Graduate Degree | - | - |
| Total | $38,297 | $23,256 |
Family Income in York
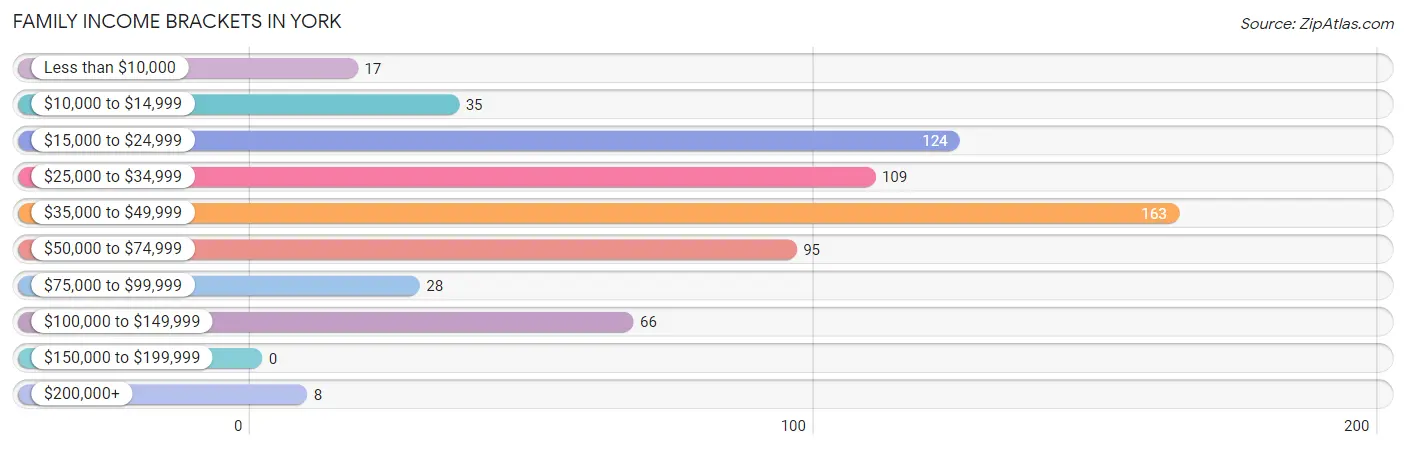
Family Income Brackets in York
According to the York family income data, there are 163 families falling into the $35,000 to $49,999 income range, which is the most common income bracket and makes up 25.3% of all families.
| Income Bracket | # Families | % Families |
| Less than $10,000 | 17 | 2.6% |
| $10,000 to $14,999 | 35 | 5.4% |
| $15,000 to $24,999 | 124 | 19.2% |
| $25,000 to $34,999 | 109 | 16.9% |
| $35,000 to $49,999 | 163 | 25.3% |
| $50,000 to $74,999 | 95 | 14.7% |
| $75,000 to $99,999 | 28 | 4.3% |
| $100,000 to $149,999 | 66 | 10.2% |
| $150,000 to $199,999 | 0 | 0.0% |
| $200,000+ | 8 | 1.2% |
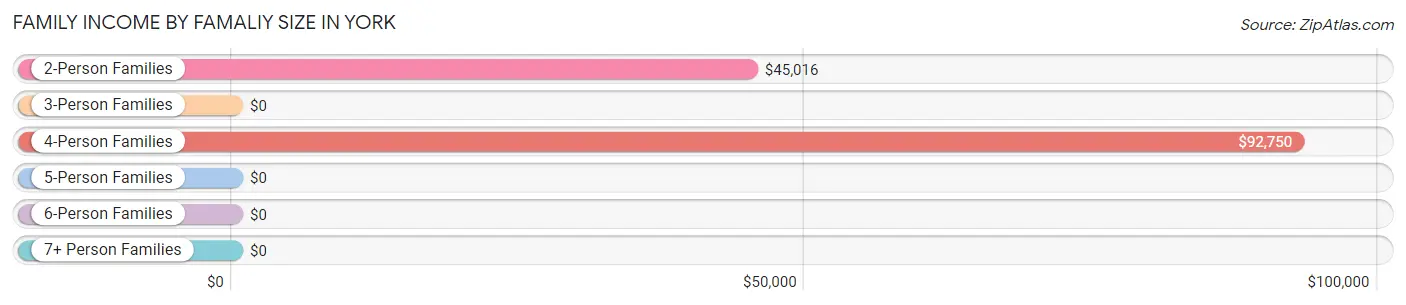
Family Income by Famaliy Size in York
4-person families (111 | 17.2%) account for the highest median family income in York with $92,750 per family, while 4-person families (111 | 17.2%) have the highest median income of $23,188 per family member.
| Income Bracket | # Families | Median Income |
| 2-Person Families | 377 (58.5%) | $45,016 |
| 3-Person Families | 118 (18.3%) | $0 |
| 4-Person Families | 111 (17.2%) | $92,750 |
| 5-Person Families | 28 (4.3%) | $0 |
| 6-Person Families | 11 (1.7%) | $0 |
| 7+ Person Families | 0 (0.0%) | $0 |
| Total | 645 (100.0%) | $45,181 |
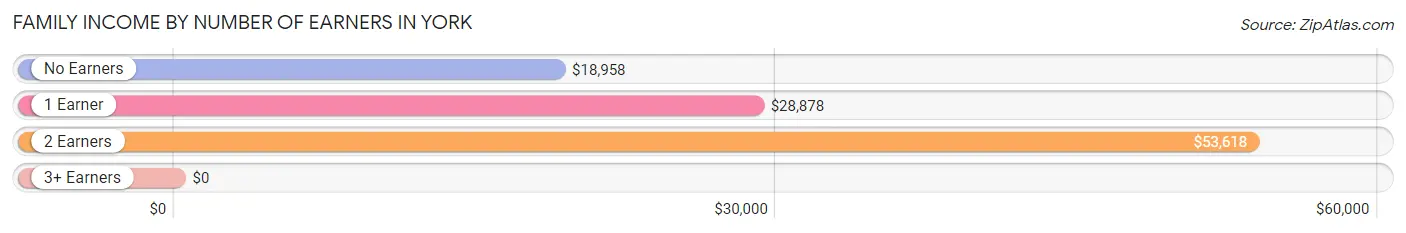
Family Income by Number of Earners in York
| Number of Earners | # Families | Median Income |
| No Earners | 116 (18.0%) | $18,958 |
| 1 Earner | 290 (45.0%) | $28,878 |
| 2 Earners | 217 (33.6%) | $53,618 |
| 3+ Earners | 22 (3.4%) | $0 |
| Total | 645 (100.0%) | $45,181 |
Household Income in York
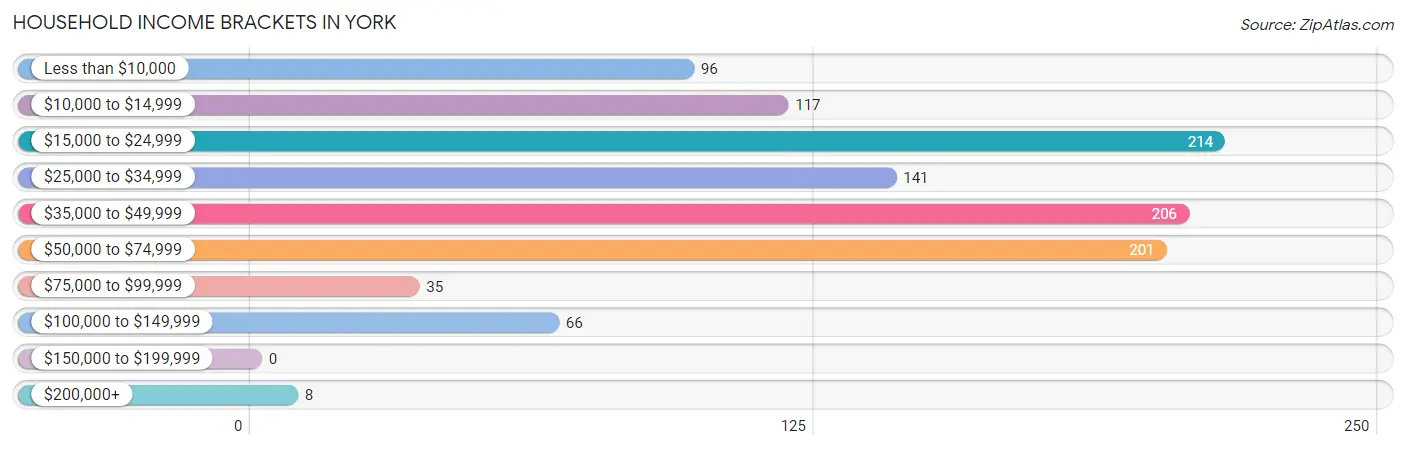
Household Income Brackets in York
With 214 households falling in the category, the $15,000 to $24,999 income range is the most frequent in York, accounting for 19.7% of all households.
| Income Bracket | # Households | % Households |
| Less than $10,000 | 96 | 8.9% |
| $10,000 to $14,999 | 117 | 10.8% |
| $15,000 to $24,999 | 214 | 19.7% |
| $25,000 to $34,999 | 141 | 13.0% |
| $35,000 to $49,999 | 206 | 19.0% |
| $50,000 to $74,999 | 201 | 18.5% |
| $75,000 to $99,999 | 35 | 3.2% |
| $100,000 to $149,999 | 66 | 6.1% |
| $150,000 to $199,999 | 0 | 0.0% |
| $200,000+ | 8 | 0.7% |
Household Income by Householder Age in York
The median household income in York is $33,269, with the highest median household income of $46,250 found in the 25 to 44 years age bracket for the primary householder. A total of 477 households (44.0%) fall into this category.
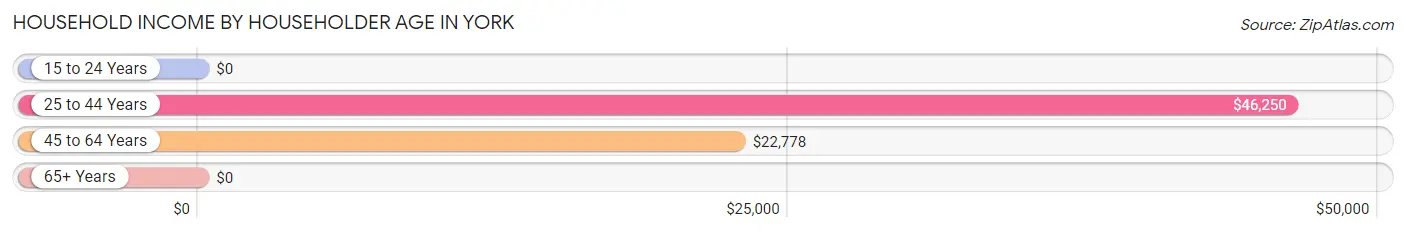
| Income Bracket | # Households | Median Income |
| 15 to 24 Years | 0 (0.0%) | $0 |
| 25 to 44 Years | 477 (44.0%) | $46,250 |
| 45 to 64 Years | 378 (34.9%) | $22,778 |
| 65+ Years | 229 (21.1%) | $0 |
| Total | 1,084 (100.0%) | $33,269 |
Poverty in York
Income Below Poverty by Sex and Age in York
With 23.9% poverty level for males and 33.8% for females among the residents of York, 45 to 54 year old males and 15 year old females are the most vulnerable to poverty, with 34 males (50.7%) and 18 females (100.0%) in their respective age groups living below the poverty level.
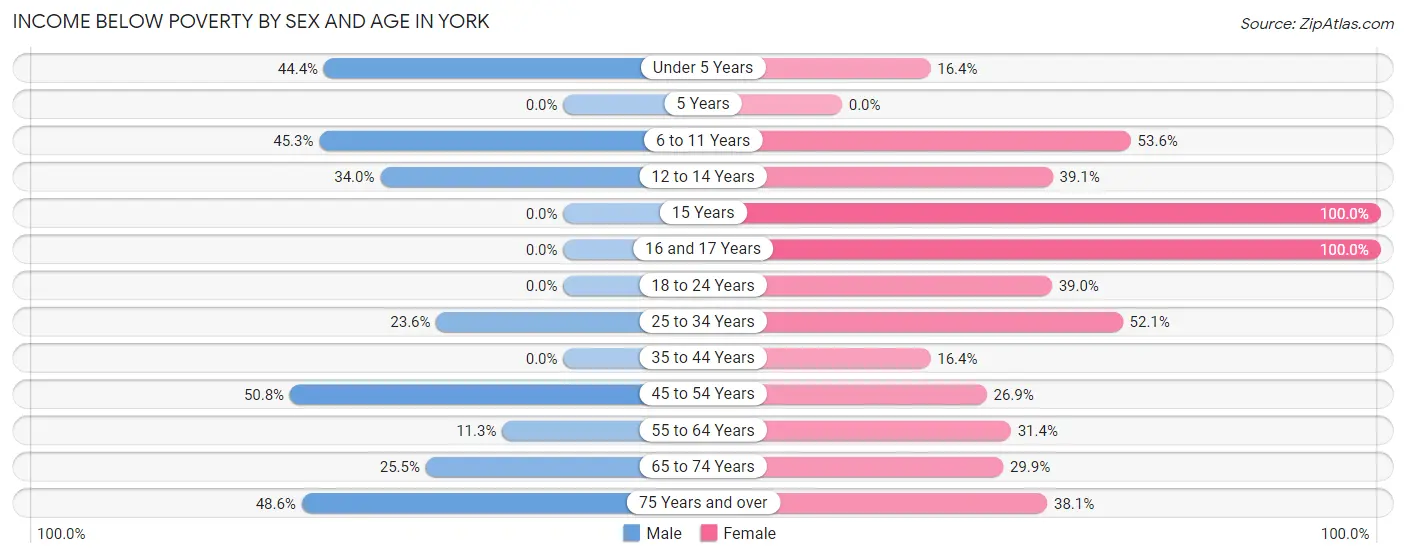
| Age Bracket | Male | Female |
| Under 5 Years | 48 (44.4%) | 11 (16.4%) |
| 5 Years | 0 (0.0%) | 0 (0.0%) |
| 6 to 11 Years | 53 (45.3%) | 37 (53.6%) |
| 12 to 14 Years | 35 (34.0%) | 18 (39.1%) |
| 15 Years | 0 (0.0%) | 18 (100.0%) |
| 16 and 17 Years | 0 (0.0%) | 5 (100.0%) |
| 18 to 24 Years | 0 (0.0%) | 30 (39.0%) |
| 25 to 34 Years | 37 (23.6%) | 86 (52.1%) |
| 35 to 44 Years | 0 (0.0%) | 33 (16.4%) |
| 45 to 54 Years | 34 (50.7%) | 47 (26.9%) |
| 55 to 64 Years | 11 (11.3%) | 53 (31.4%) |
| 65 to 74 Years | 24 (25.5%) | 38 (29.9%) |
| 75 Years and over | 17 (48.6%) | 16 (38.1%) |
| Total | 259 (23.9%) | 392 (33.8%) |
Income Above Poverty by Sex and Age in York
According to the poverty statistics in York, males aged 16 and 17 years and females aged under 5 years are the age groups that are most secure financially, with 100.0% of males and 83.6% of females in these age groups living above the poverty line.
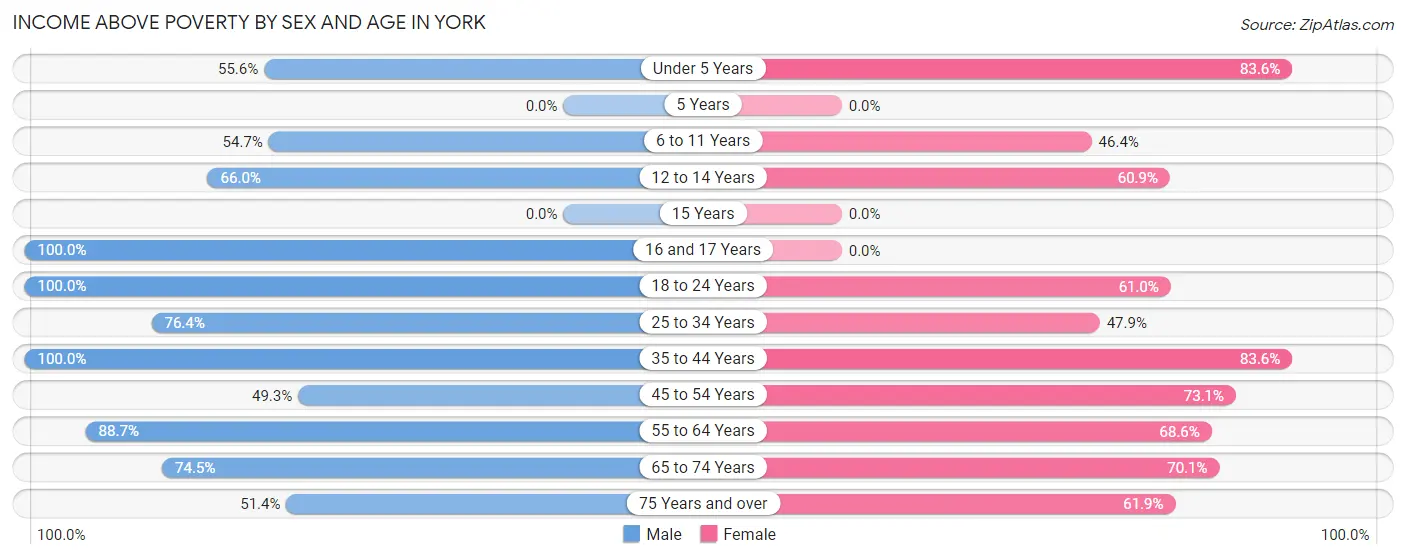
| Age Bracket | Male | Female |
| Under 5 Years | 60 (55.6%) | 56 (83.6%) |
| 5 Years | 0 (0.0%) | 0 (0.0%) |
| 6 to 11 Years | 64 (54.7%) | 32 (46.4%) |
| 12 to 14 Years | 68 (66.0%) | 28 (60.9%) |
| 15 Years | 0 (0.0%) | 0 (0.0%) |
| 16 and 17 Years | 25 (100.0%) | 0 (0.0%) |
| 18 to 24 Years | 34 (100.0%) | 47 (61.0%) |
| 25 to 34 Years | 120 (76.4%) | 79 (47.9%) |
| 35 to 44 Years | 248 (100.0%) | 168 (83.6%) |
| 45 to 54 Years | 33 (49.2%) | 128 (73.1%) |
| 55 to 64 Years | 86 (88.7%) | 116 (68.6%) |
| 65 to 74 Years | 70 (74.5%) | 89 (70.1%) |
| 75 Years and over | 18 (51.4%) | 26 (61.9%) |
| Total | 826 (76.1%) | 769 (66.2%) |
Income Below Poverty Among Married-Couple Families in York
The poverty statistics for married-couple families in York show that 5.6% or 18 of the total 320 families live below the poverty line. Families with no children have the highest poverty rate of 7.3%, comprising of 18 families. On the other hand, families with 1 or 2 children have the lowest poverty rate of 0.0%, which includes 0 families.
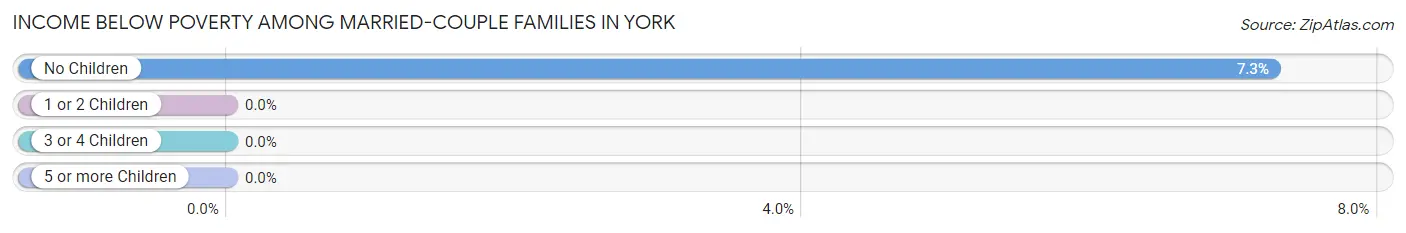
| Children | Above Poverty | Below Poverty |
| No Children | 230 (92.7%) | 18 (7.3%) |
| 1 or 2 Children | 61 (100.0%) | 0 (0.0%) |
| 3 or 4 Children | 11 (100.0%) | 0 (0.0%) |
| 5 or more Children | 0 (0.0%) | 0 (0.0%) |
| Total | 302 (94.4%) | 18 (5.6%) |
Income Below Poverty Among Single-Parent Households in York
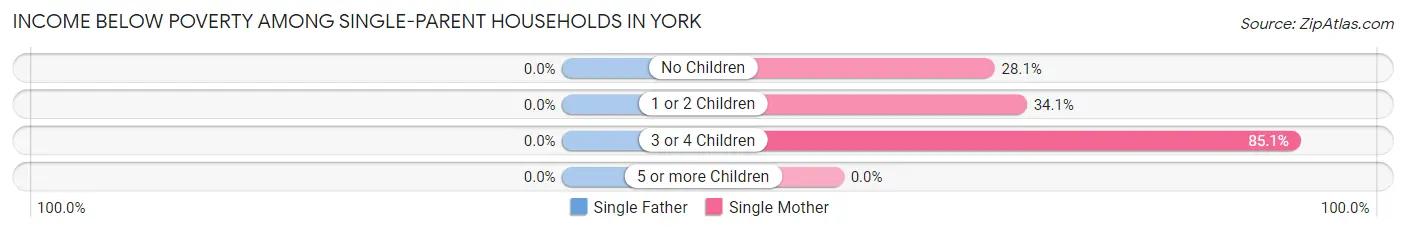
| Children | Single Father | Single Mother |
| No Children | 0 (0.0%) | 18 (28.1%) |
| 1 or 2 Children | 0 (0.0%) | 60 (34.1%) |
| 3 or 4 Children | 0 (0.0%) | 40 (85.1%) |
| 5 or more Children | 0 (0.0%) | 0 (0.0%) |
| Total | 0 (0.0%) | 118 (41.1%) |
Income Below Poverty Among Married-Couple vs Single-Parent Households in York
The poverty data for York shows that 18 of the married-couple family households (5.6%) and 118 of the single-parent households (36.3%) are living below the poverty level. Within the married-couple family households, those with no children have the highest poverty rate, with 18 households (7.3%) falling below the poverty line. Among the single-parent households, those with 3 or 4 children have the highest poverty rate, with 40 household (85.1%) living below poverty.
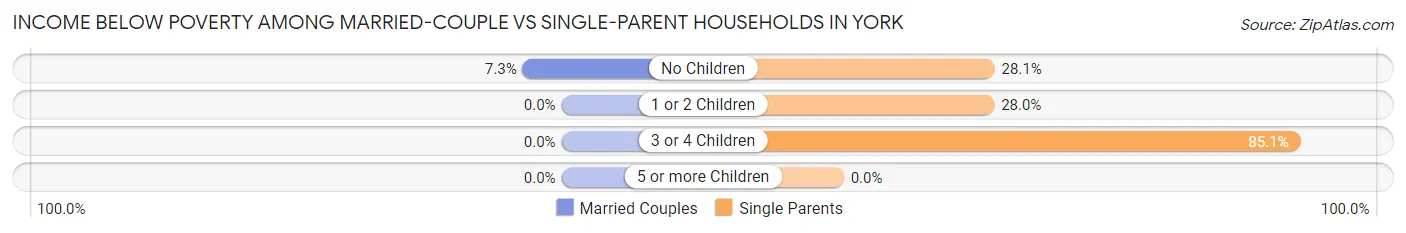
| Children | Married-Couple Families | Single-Parent Households |
| No Children | 18 (7.3%) | 18 (28.1%) |
| 1 or 2 Children | 0 (0.0%) | 60 (28.0%) |
| 3 or 4 Children | 0 (0.0%) | 40 (85.1%) |
| 5 or more Children | 0 (0.0%) | 0 (0.0%) |
| Total | 18 (5.6%) | 118 (36.3%) |
Race in York
The most populous races in York are Black / African American (2,053 | 84.7%), White / Caucasian (325 | 13.4%), and Two or more Races (40 | 1.7%).
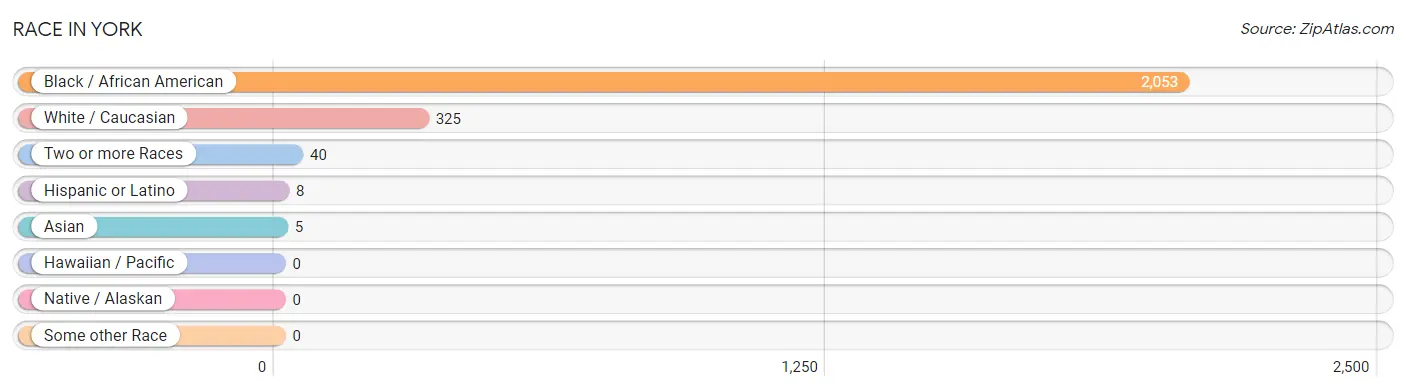
| Race | # Population | % Population |
| Asian | 5 | 0.2% |
| Black / African American | 2,053 | 84.7% |
| Hawaiian / Pacific | 0 | 0.0% |
| Hispanic or Latino | 8 | 0.3% |
| Native / Alaskan | 0 | 0.0% |
| White / Caucasian | 325 | 13.4% |
| Two or more Races | 40 | 1.7% |
| Some other Race | 0 | 0.0% |
| Total | 2,423 | 100.0% |
Ancestry in York
The most populous ancestries reported in York are American (623 | 25.7%), African (115 | 4.8%), Subsaharan African (115 | 4.8%), English (51 | 2.1%), and Irish (39 | 1.6%), together accounting for 38.9% of all York residents.
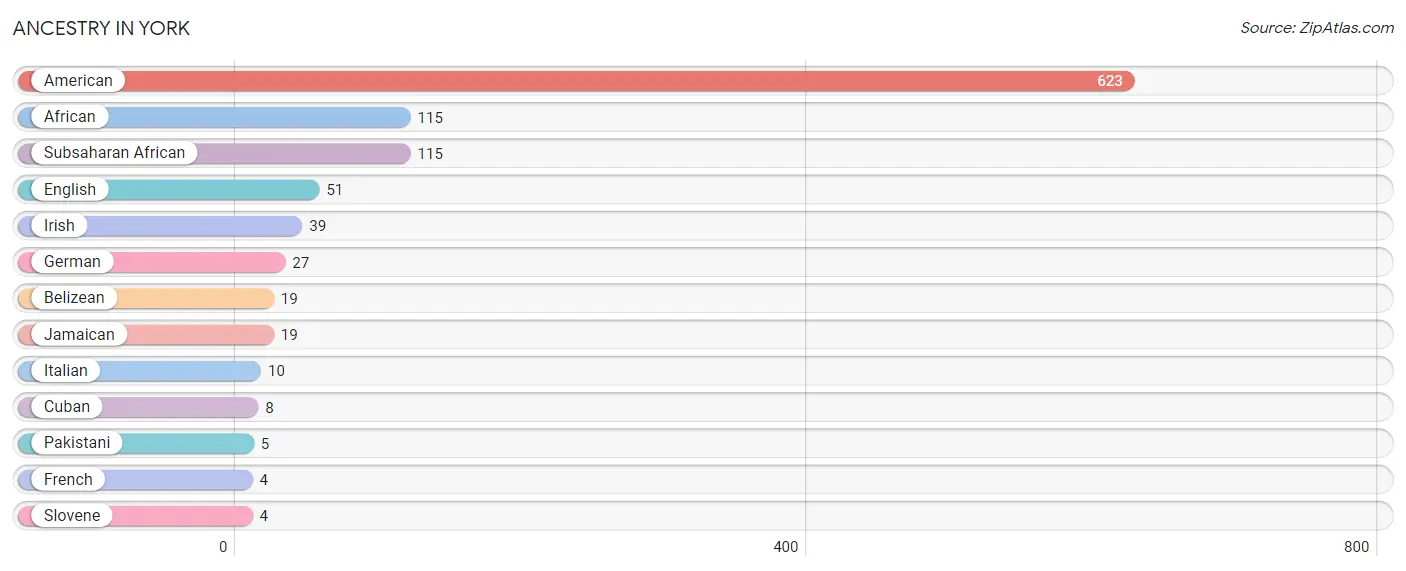
| Ancestry | # Population | % Population |
| African | 115 | 4.8% |
| American | 623 | 25.7% |
| Belizean | 19 | 0.8% |
| Cuban | 8 | 0.3% |
| English | 51 | 2.1% |
| French | 4 | 0.2% |
| German | 27 | 1.1% |
| Irish | 39 | 1.6% |
| Italian | 10 | 0.4% |
| Jamaican | 19 | 0.8% |
| Pakistani | 5 | 0.2% |
| Slovene | 4 | 0.2% |
| Subsaharan African | 115 | 4.8% | View All 13 Rows |
Immigrants in York
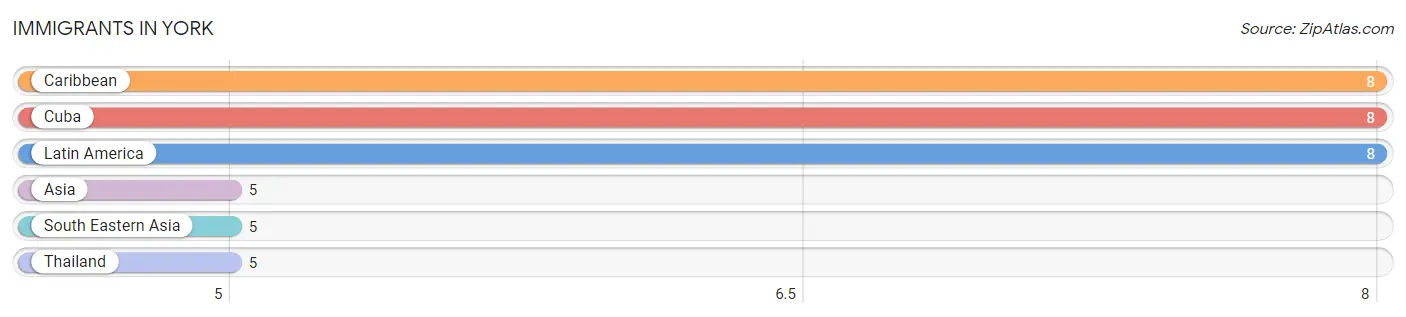
The most numerous immigrant groups reported in York came from Caribbean (8 | 0.3%), Cuba (8 | 0.3%), Latin America (8 | 0.3%), Asia (5 | 0.2%), and South Eastern Asia (5 | 0.2%), together accounting for 1.4% of all York residents.
| Immigration Origin | # Population | % Population |
| Asia | 5 | 0.2% |
| Caribbean | 8 | 0.3% |
| Cuba | 8 | 0.3% |
| Latin America | 8 | 0.3% |
| South Eastern Asia | 5 | 0.2% |
| Thailand | 5 | 0.2% | View All 6 Rows |
Sex and Age in York
Sex and Age in York
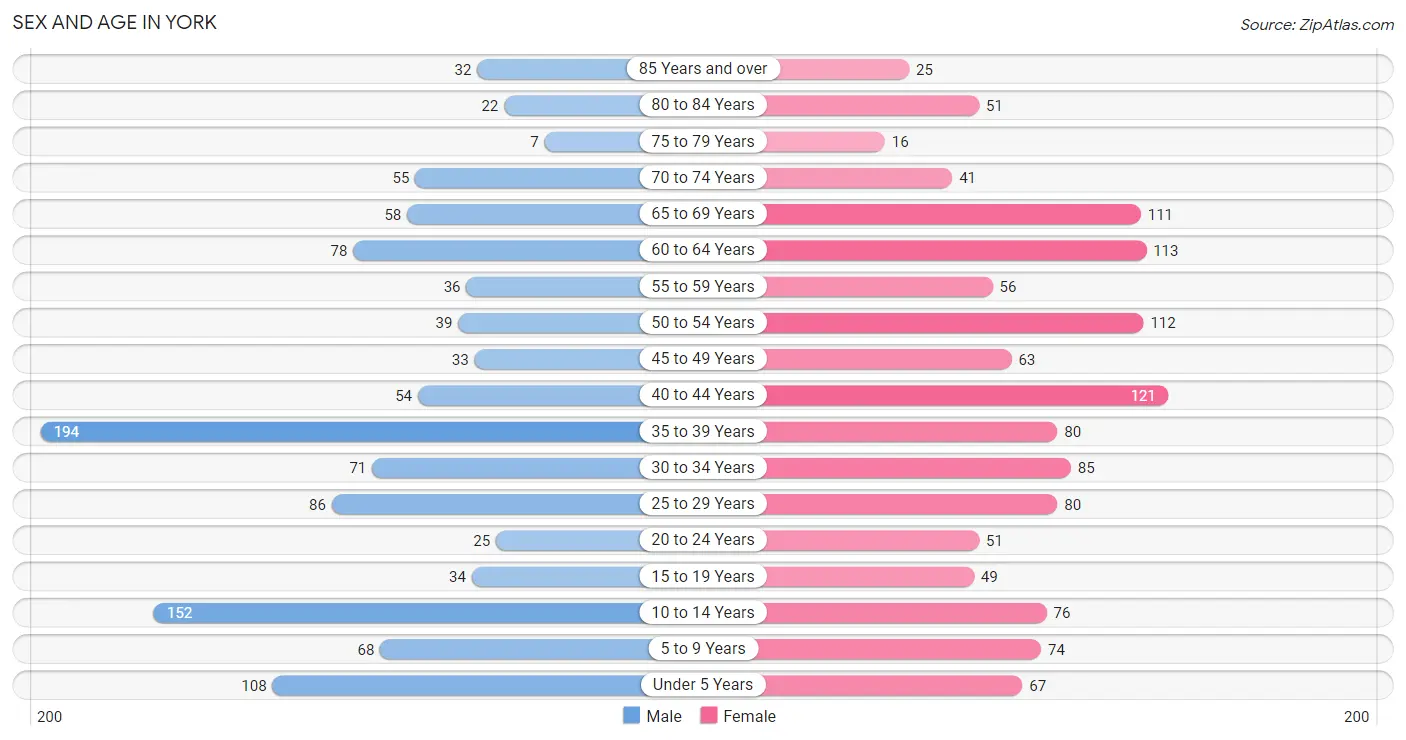
The most populous age groups in York are 35 to 39 Years (194 | 16.8%) for men and 40 to 44 Years (121 | 9.5%) for women.
| Age Bracket | Male | Female |
| Under 5 Years | 108 (9.4%) | 67 (5.3%) |
| 5 to 9 Years | 68 (5.9%) | 74 (5.8%) |
| 10 to 14 Years | 152 (13.2%) | 76 (6.0%) |
| 15 to 19 Years | 34 (2.9%) | 49 (3.9%) |
| 20 to 24 Years | 25 (2.2%) | 51 (4.0%) |
| 25 to 29 Years | 86 (7.5%) | 80 (6.3%) |
| 30 to 34 Years | 71 (6.2%) | 85 (6.7%) |
| 35 to 39 Years | 194 (16.8%) | 80 (6.3%) |
| 40 to 44 Years | 54 (4.7%) | 121 (9.5%) |
| 45 to 49 Years | 33 (2.9%) | 63 (5.0%) |
| 50 to 54 Years | 39 (3.4%) | 112 (8.8%) |
| 55 to 59 Years | 36 (3.1%) | 56 (4.4%) |
| 60 to 64 Years | 78 (6.8%) | 113 (8.9%) |
| 65 to 69 Years | 58 (5.0%) | 111 (8.7%) |
| 70 to 74 Years | 55 (4.8%) | 41 (3.2%) |
| 75 to 79 Years | 7 (0.6%) | 16 (1.3%) |
| 80 to 84 Years | 22 (1.9%) | 51 (4.0%) |
| 85 Years and over | 32 (2.8%) | 25 (2.0%) |
| Total | 1,152 (100.0%) | 1,271 (100.0%) |
Families and Households in York
Median Family Size in York
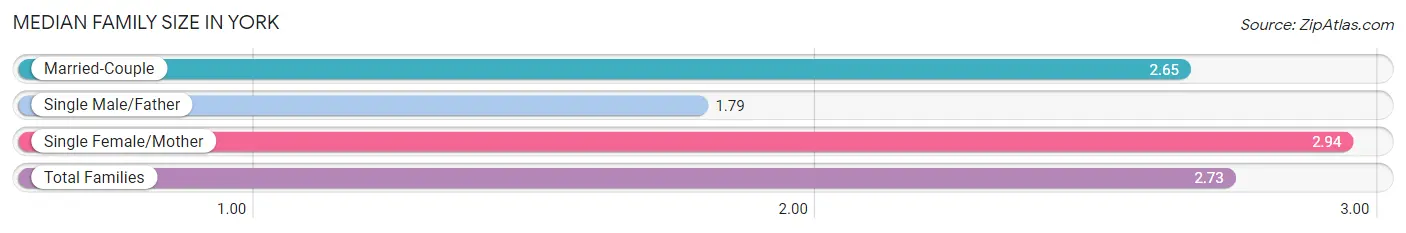
The median family size in York is 2.73 persons per family, with single female/mother families (287 | 44.5%) accounting for the largest median family size of 2.94 persons per family. On the other hand, single male/father families (38 | 5.9%) represent the smallest median family size with 1.79 persons per family.
| Family Type | # Families | Family Size |
| Married-Couple | 320 (49.6%) | 2.65 |
| Single Male/Father | 38 (5.9%) | 1.79 |
| Single Female/Mother | 287 (44.5%) | 2.94 |
| Total Families | 645 (100.0%) | 2.73 |
Median Household Size in York
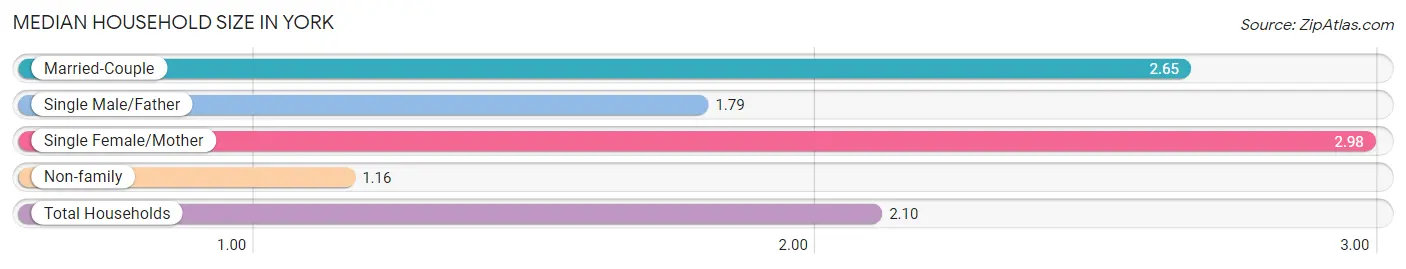
The median household size in York is 2.10 persons per household, with single female/mother households (287 | 26.5%) accounting for the largest median household size of 2.98 persons per household. non-family households (439 | 40.5%) represent the smallest median household size with 1.16 persons per household.
| Household Type | # Households | Household Size |
| Married-Couple | 320 (29.5%) | 2.65 |
| Single Male/Father | 38 (3.5%) | 1.79 |
| Single Female/Mother | 287 (26.5%) | 2.98 |
| Non-family | 439 (40.5%) | 1.16 |
| Total Households | 1,084 (100.0%) | 2.10 |
Household Size by Marriage Status in York
Out of a total of 1,084 households in York, 645 (59.5%) are family households, while 439 (40.5%) are nonfamily households. The most numerous type of family households are 2-person households, comprising 374, and the most common type of nonfamily households are 1-person households, comprising 383.
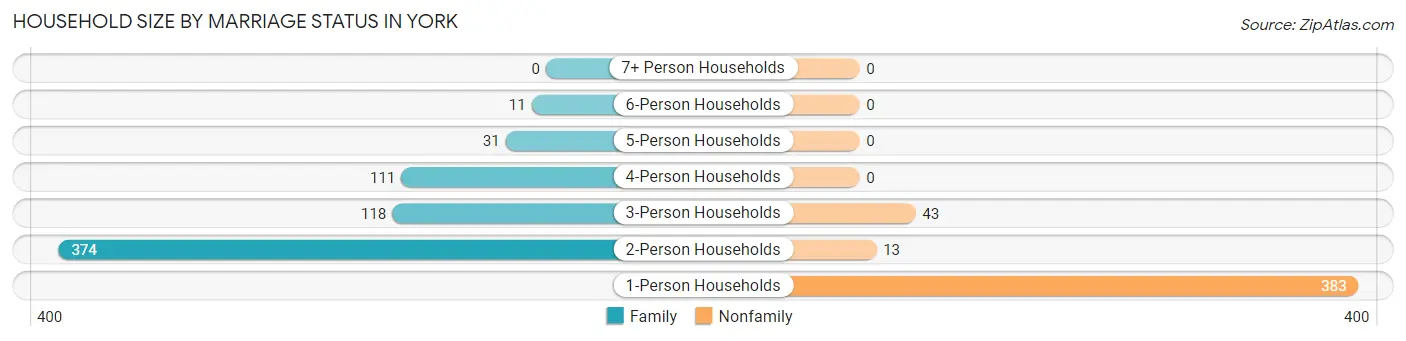
| Household Size | Family Households | Nonfamily Households |
| 1-Person Households | - | 383 (35.3%) |
| 2-Person Households | 374 (34.5%) | 13 (1.2%) |
| 3-Person Households | 118 (10.9%) | 43 (4.0%) |
| 4-Person Households | 111 (10.2%) | 0 (0.0%) |
| 5-Person Households | 31 (2.9%) | 0 (0.0%) |
| 6-Person Households | 11 (1.0%) | 0 (0.0%) |
| 7+ Person Households | 0 (0.0%) | 0 (0.0%) |
| Total | 645 (59.5%) | 439 (40.5%) |
Female Fertility in York
Fertility by Age in York
Average fertility rate in York is 13.0 births per 1,000 women. Women in the age bracket of 20 to 34 years have the highest fertility rate with 32.0 births per 1,000 women. Women in the age bracket of 20 to 34 years acount for 100.0% of all women with births.
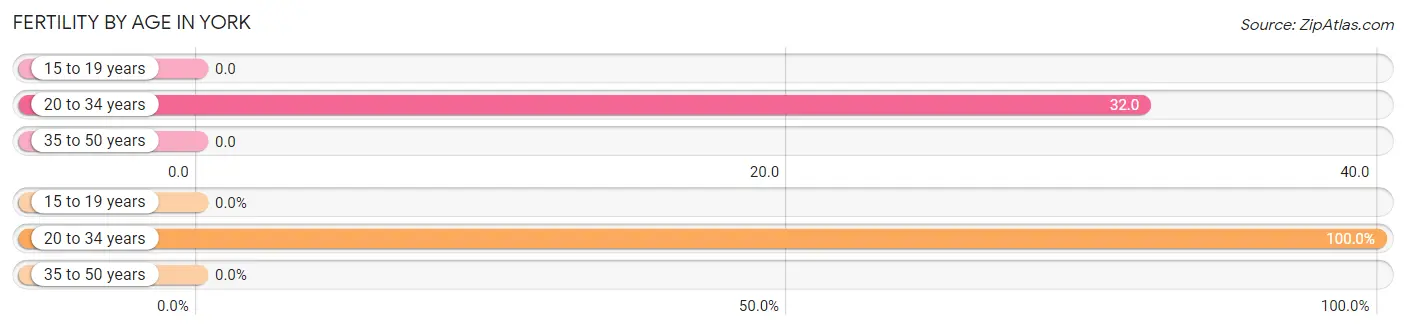
| Age Bracket | Women with Births | Births / 1,000 Women |
| 15 to 19 years | 0 (0.0%) | 0.0 |
| 20 to 34 years | 7 (100.0%) | 32.0 |
| 35 to 50 years | 0 (0.0%) | 0.0 |
| Total | 7 (100.0%) | 13.0 |
Fertility by Age by Marriage Status in York
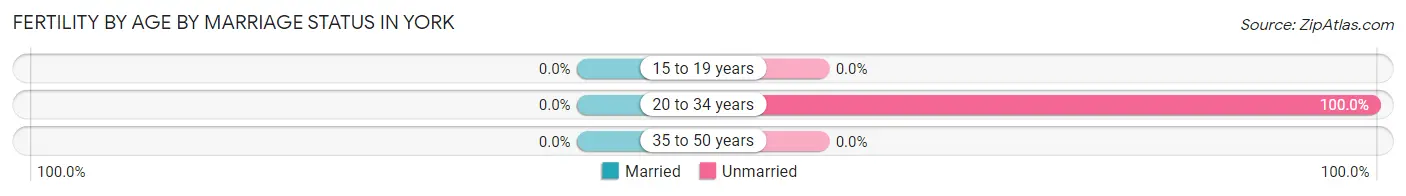
| Age Bracket | Married | Unmarried |
| 15 to 19 years | 0 (0.0%) | 0 (0.0%) |
| 20 to 34 years | 0 (0.0%) | 7 (100.0%) |
| 35 to 50 years | 0 (0.0%) | 0 (0.0%) |
| Total | 0 (0.0%) | 7 (100.0%) |
Fertility by Education in York
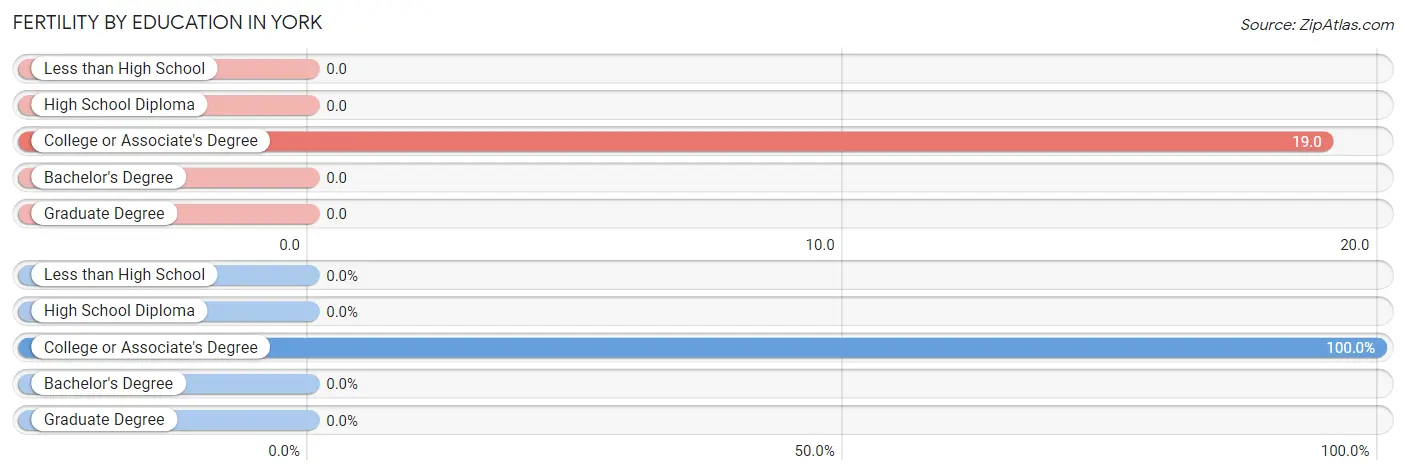
| Educational Attainment | Women with Births | Births / 1,000 Women |
| Less than High School | 0 (0.0%) | 0.0 |
| High School Diploma | 0 (0.0%) | 0.0 |
| College or Associate's Degree | 7 (100.0%) | 19.0 |
| Bachelor's Degree | 0 (0.0%) | 0.0 |
| Graduate Degree | 0 (0.0%) | 0.0 |
| Total | 7 (100.0%) | 13.0 |
Fertility by Education by Marriage Status in York
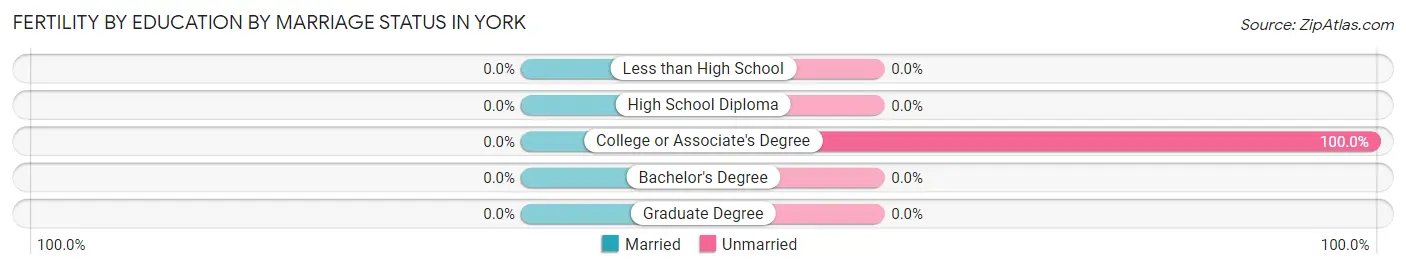
| Educational Attainment | Married | Unmarried |
| Less than High School | 0 (0.0%) | 0 (0.0%) |
| High School Diploma | 0 (0.0%) | 0 (0.0%) |
| College or Associate's Degree | 0 (0.0%) | 7 (100.0%) |
| Bachelor's Degree | 0 (0.0%) | 0 (0.0%) |
| Graduate Degree | 0 (0.0%) | 0 (0.0%) |
| Total | 0 (0.0%) | 7 (100.0%) |
Employment Characteristics in York
Employment by Class of Employer in York
Among the 876 employed individuals in York, private company employees (582 | 66.4%), state government employees (134 | 15.3%), and not-for-profit organizations (69 | 7.9%) make up the most common classes of employment.
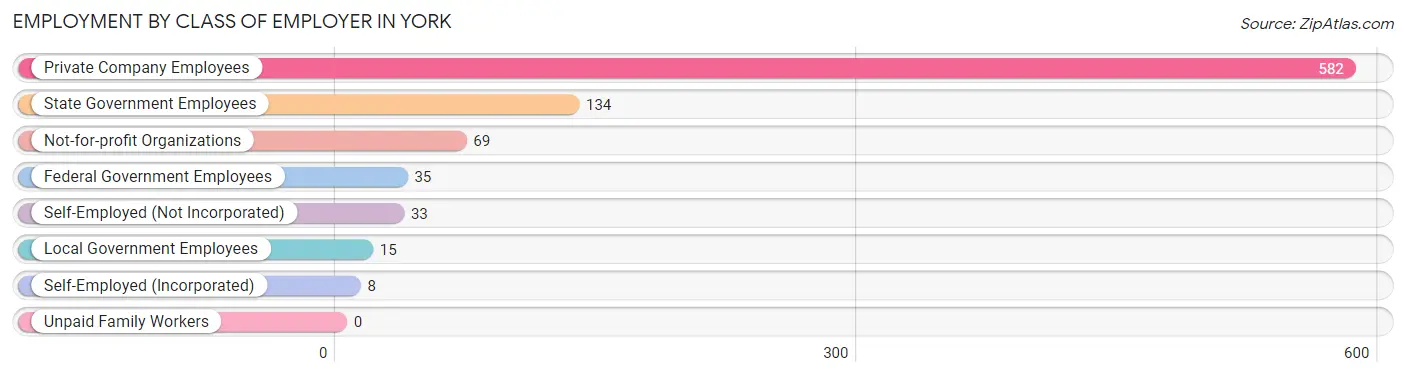
| Employer Class | # Employees | % Employees |
| Private Company Employees | 582 | 66.4% |
| Self-Employed (Incorporated) | 8 | 0.9% |
| Self-Employed (Not Incorporated) | 33 | 3.8% |
| Not-for-profit Organizations | 69 | 7.9% |
| Local Government Employees | 15 | 1.7% |
| State Government Employees | 134 | 15.3% |
| Federal Government Employees | 35 | 4.0% |
| Unpaid Family Workers | 0 | 0.0% |
| Total | 876 | 100.0% |
Employment Status by Age in York
According to the labor force statistics for York, out of the total population over 16 years of age (1,860), 57.5% or 1,070 individuals are in the labor force, with 8.2% or 88 of them unemployed. The age group with the highest labor force participation rate is 25 to 29 years, with 89.2% or 148 individuals in the labor force. Within the labor force, the 16 to 19 years age range has the highest percentage of unemployed individuals, with 88.5% or 23 of them being unemployed.
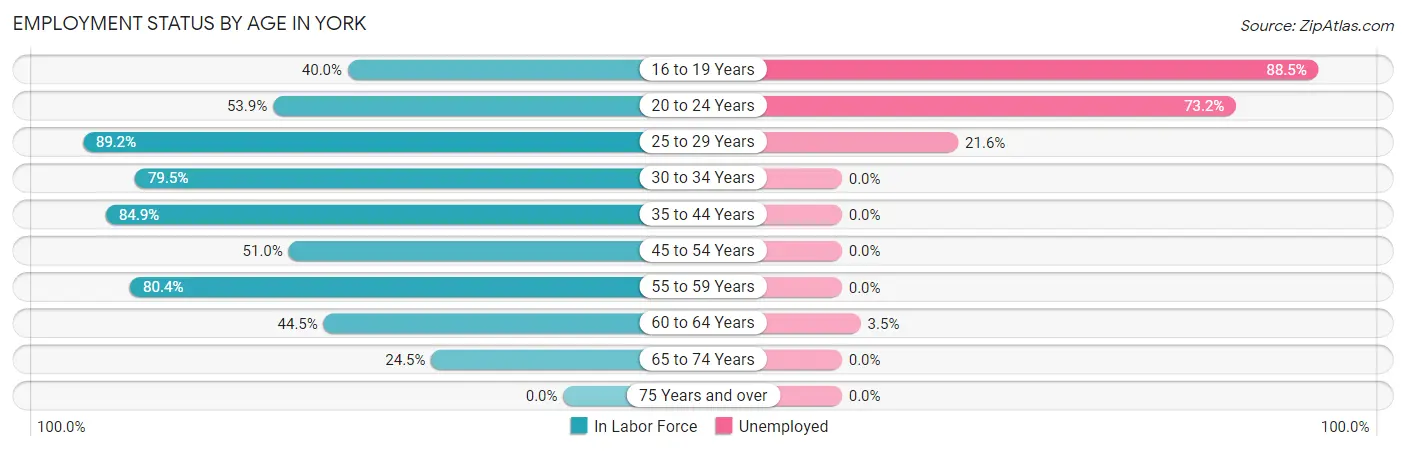
| Age Bracket | In Labor Force | Unemployed |
| 16 to 19 Years | 26 (40.0%) | 23 (88.5%) |
| 20 to 24 Years | 41 (53.9%) | 30 (73.2%) |
| 25 to 29 Years | 148 (89.2%) | 32 (21.6%) |
| 30 to 34 Years | 124 (79.5%) | 0 (0.0%) |
| 35 to 44 Years | 381 (84.9%) | 0 (0.0%) |
| 45 to 54 Years | 126 (51.0%) | 0 (0.0%) |
| 55 to 59 Years | 74 (80.4%) | 0 (0.0%) |
| 60 to 64 Years | 85 (44.5%) | 3 (3.5%) |
| 65 to 74 Years | 65 (24.5%) | 0 (0.0%) |
| 75 Years and over | 0 (0.0%) | 0 (0.0%) |
| Total | 1,070 (57.5%) | 88 (8.2%) |
Employment Status by Educational Attainment in York
According to labor force statistics for York, 72.1% of individuals (938) out of the total population between 25 and 64 years of age (1,301) are in the labor force, with 3.7% or 35 of them being unemployed. The group with the highest labor force participation rate are those with the educational attainment of bachelor's degree or higher, with 98.2% or 167 individuals in the labor force. Within the labor force, individuals with college / associate degree education have the highest percentage of unemployment, with 4.9% or 28 of them being unemployed.
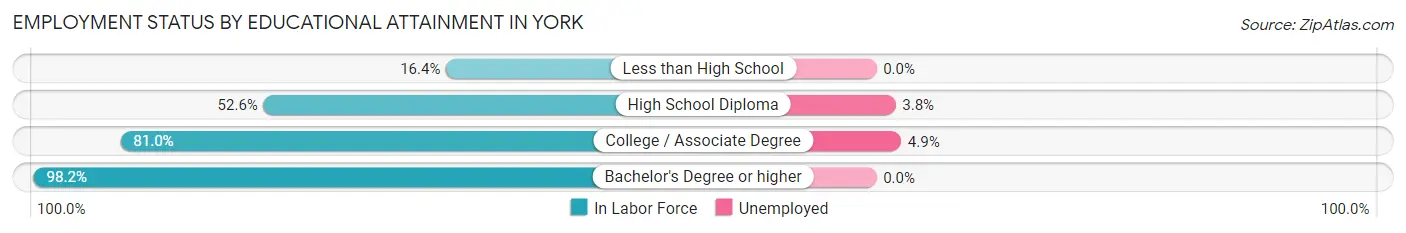
| Educational Attainment | In Labor Force | Unemployed |
| Less than High School | 12 (16.4%) | 0 (0.0%) |
| High School Diploma | 182 (52.6%) | 13 (3.8%) |
| College / Associate Degree | 577 (81.0%) | 35 (4.9%) |
| Bachelor's Degree or higher | 167 (98.2%) | 0 (0.0%) |
| Total | 938 (72.1%) | 48 (3.7%) |
Employment Occupations by Sex in York
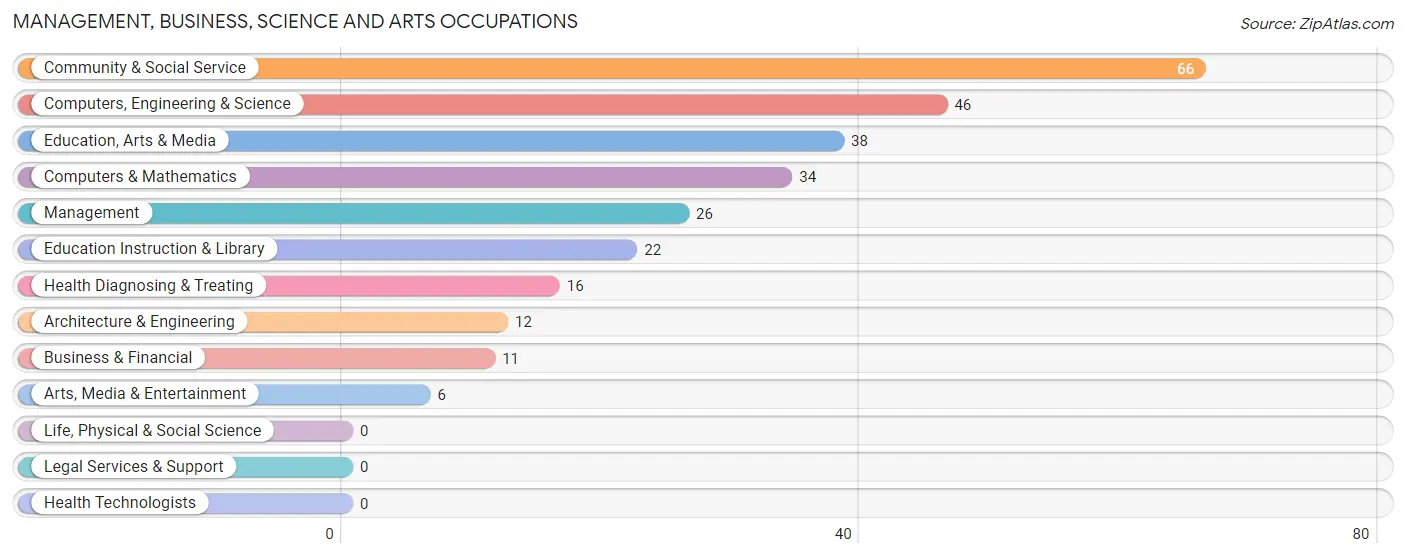
Management, Business, Science and Arts Occupations
The most common Management, Business, Science and Arts occupations in York are Community & Social Service (66 | 6.7%), Computers, Engineering & Science (46 | 4.7%), Education, Arts & Media (38 | 3.9%), Computers & Mathematics (34 | 3.5%), and Management (26 | 2.6%).
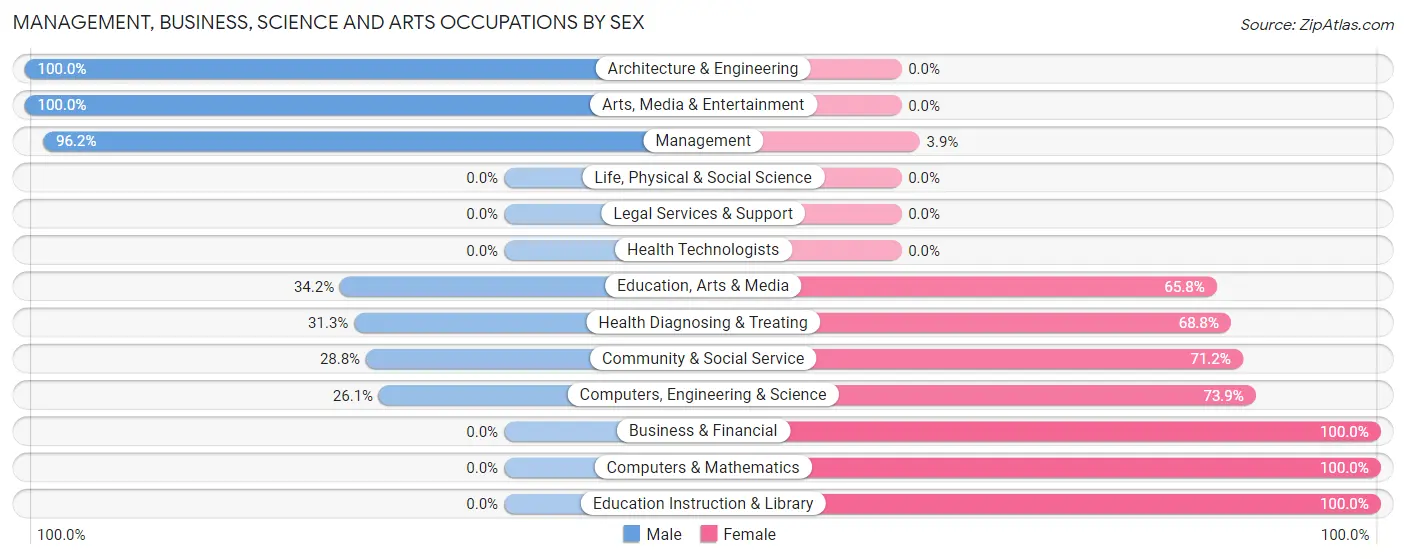
Management, Business, Science and Arts Occupations by Sex
Within the Management, Business, Science and Arts occupations in York, the most male-oriented occupations are Architecture & Engineering (100.0%), Arts, Media & Entertainment (100.0%), and Management (96.2%), while the most female-oriented occupations are Business & Financial (100.0%), Computers & Mathematics (100.0%), and Education Instruction & Library (100.0%).
| Occupation | Male | Female |
| Management | 25 (96.2%) | 1 (3.8%) |
| Business & Financial | 0 (0.0%) | 11 (100.0%) |
| Computers, Engineering & Science | 12 (26.1%) | 34 (73.9%) |
| Computers & Mathematics | 0 (0.0%) | 34 (100.0%) |
| Architecture & Engineering | 12 (100.0%) | 0 (0.0%) |
| Life, Physical & Social Science | 0 (0.0%) | 0 (0.0%) |
| Community & Social Service | 19 (28.8%) | 47 (71.2%) |
| Education, Arts & Media | 13 (34.2%) | 25 (65.8%) |
| Legal Services & Support | 0 (0.0%) | 0 (0.0%) |
| Education Instruction & Library | 0 (0.0%) | 22 (100.0%) |
| Arts, Media & Entertainment | 6 (100.0%) | 0 (0.0%) |
| Health Diagnosing & Treating | 5 (31.2%) | 11 (68.8%) |
| Health Technologists | 0 (0.0%) | 0 (0.0%) |
| Total (Category) | 61 (37.0%) | 104 (63.0%) |
| Total (Overall) | 470 (47.9%) | 511 (52.1%) |
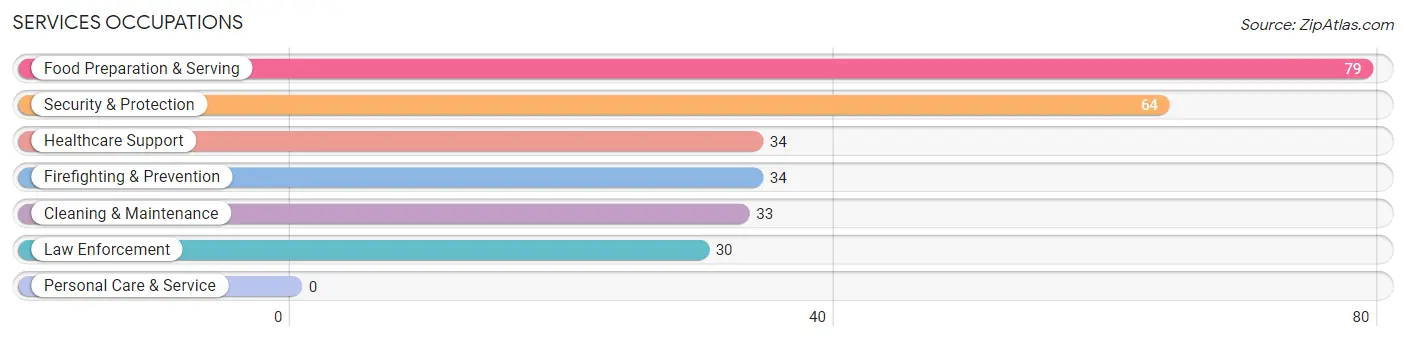
Services Occupations
The most common Services occupations in York are Food Preparation & Serving (79 | 8.1%), Security & Protection (64 | 6.5%), Healthcare Support (34 | 3.5%), Firefighting & Prevention (34 | 3.5%), and Cleaning & Maintenance (33 | 3.4%).
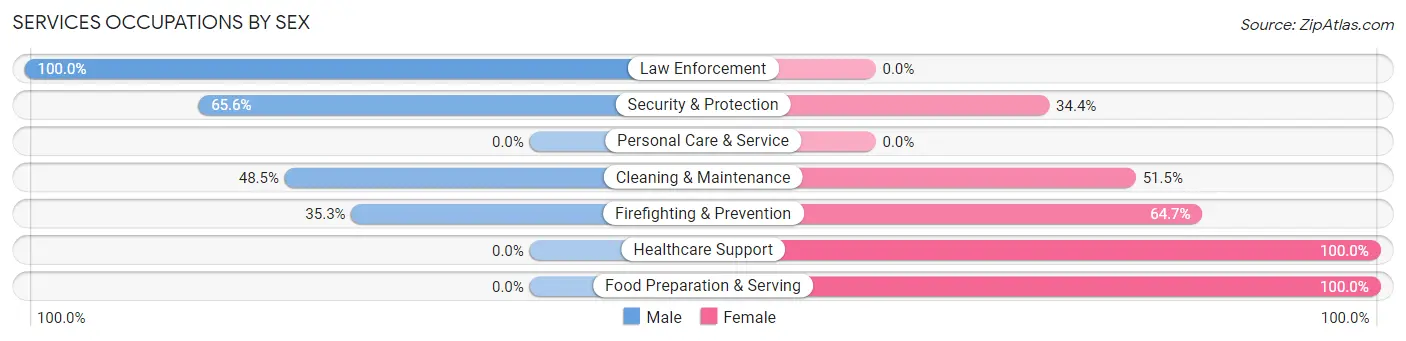
Services Occupations by Sex
Within the Services occupations in York, the most male-oriented occupations are Law Enforcement (100.0%), Security & Protection (65.6%), and Cleaning & Maintenance (48.5%), while the most female-oriented occupations are Healthcare Support (100.0%), Food Preparation & Serving (100.0%), and Firefighting & Prevention (64.7%).
| Occupation | Male | Female |
| Healthcare Support | 0 (0.0%) | 34 (100.0%) |
| Security & Protection | 42 (65.6%) | 22 (34.4%) |
| Firefighting & Prevention | 12 (35.3%) | 22 (64.7%) |
| Law Enforcement | 30 (100.0%) | 0 (0.0%) |
| Food Preparation & Serving | 0 (0.0%) | 79 (100.0%) |
| Cleaning & Maintenance | 16 (48.5%) | 17 (51.5%) |
| Personal Care & Service | 0 (0.0%) | 0 (0.0%) |
| Total (Category) | 58 (27.6%) | 152 (72.4%) |
| Total (Overall) | 470 (47.9%) | 511 (52.1%) |
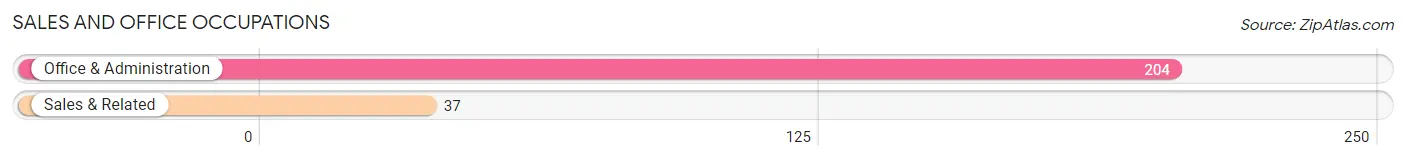
Sales and Office Occupations
The most common Sales and Office occupations in York are Office & Administration (204 | 20.8%), and Sales & Related (37 | 3.8%).
Sales and Office Occupations by Sex
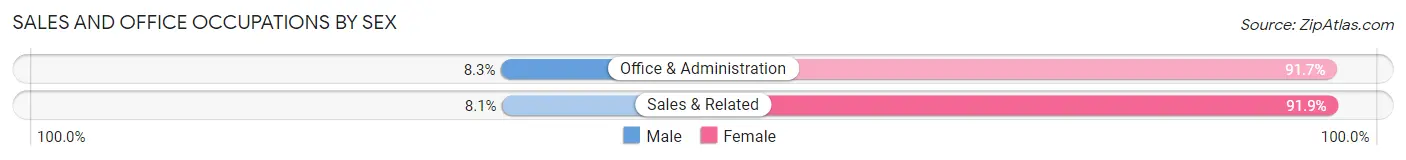
| Occupation | Male | Female |
| Sales & Related | 3 (8.1%) | 34 (91.9%) |
| Office & Administration | 17 (8.3%) | 187 (91.7%) |
| Total (Category) | 20 (8.3%) | 221 (91.7%) |
| Total (Overall) | 470 (47.9%) | 511 (52.1%) |
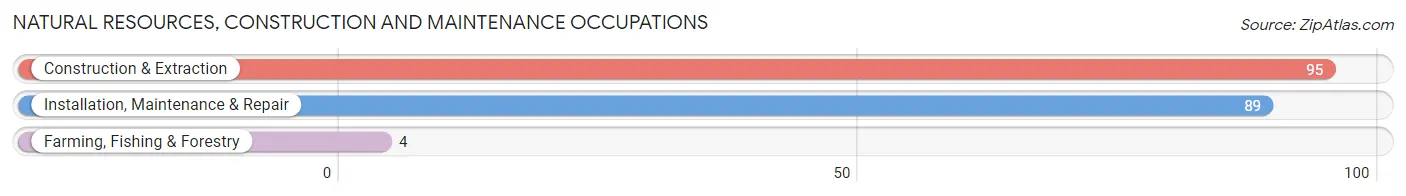
Natural Resources, Construction and Maintenance Occupations
The most common Natural Resources, Construction and Maintenance occupations in York are Construction & Extraction (95 | 9.7%), Installation, Maintenance & Repair (89 | 9.1%), and Farming, Fishing & Forestry (4 | 0.4%).
Natural Resources, Construction and Maintenance Occupations by Sex
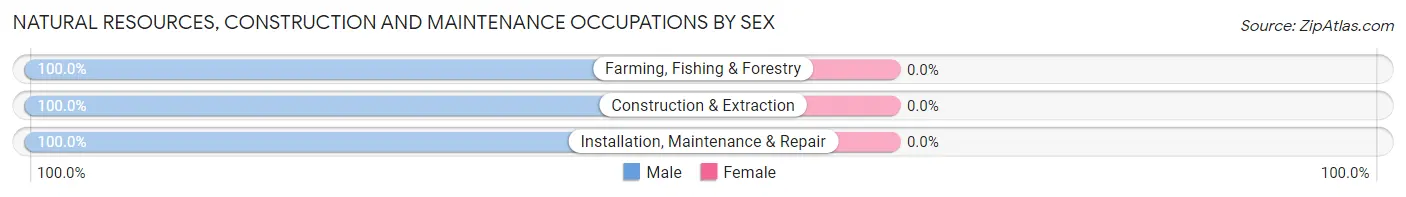
| Occupation | Male | Female |
| Farming, Fishing & Forestry | 4 (100.0%) | 0 (0.0%) |
| Construction & Extraction | 95 (100.0%) | 0 (0.0%) |
| Installation, Maintenance & Repair | 89 (100.0%) | 0 (0.0%) |
| Total (Category) | 188 (100.0%) | 0 (0.0%) |
| Total (Overall) | 470 (47.9%) | 511 (52.1%) |
Production, Transportation and Moving Occupations
The most common Production, Transportation and Moving occupations in York are Production (126 | 12.8%), and Transportation (51 | 5.2%).
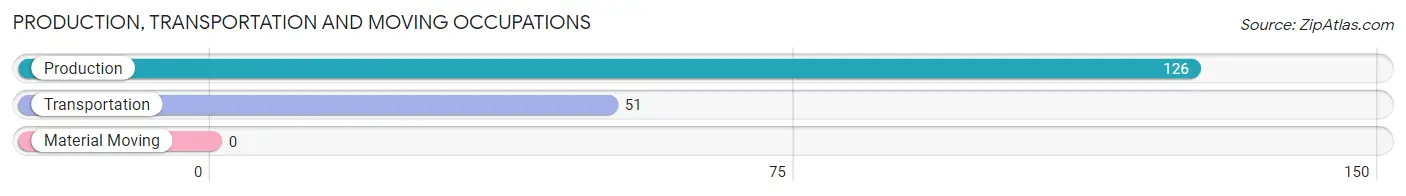
Production, Transportation and Moving Occupations by Sex
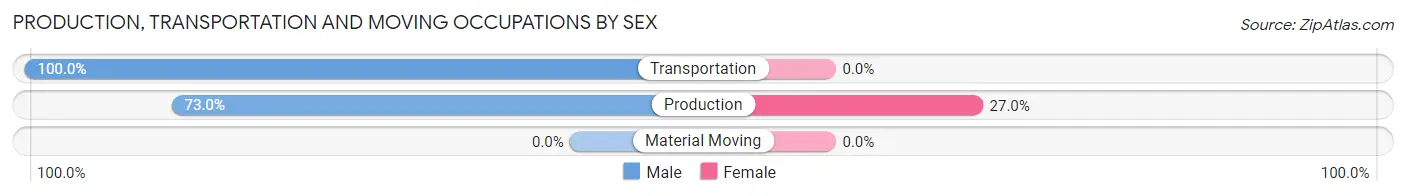
| Occupation | Male | Female |
| Production | 92 (73.0%) | 34 (27.0%) |
| Transportation | 51 (100.0%) | 0 (0.0%) |
| Material Moving | 0 (0.0%) | 0 (0.0%) |
| Total (Category) | 143 (80.8%) | 34 (19.2%) |
| Total (Overall) | 470 (47.9%) | 511 (52.1%) |
Employment Industries by Sex in York
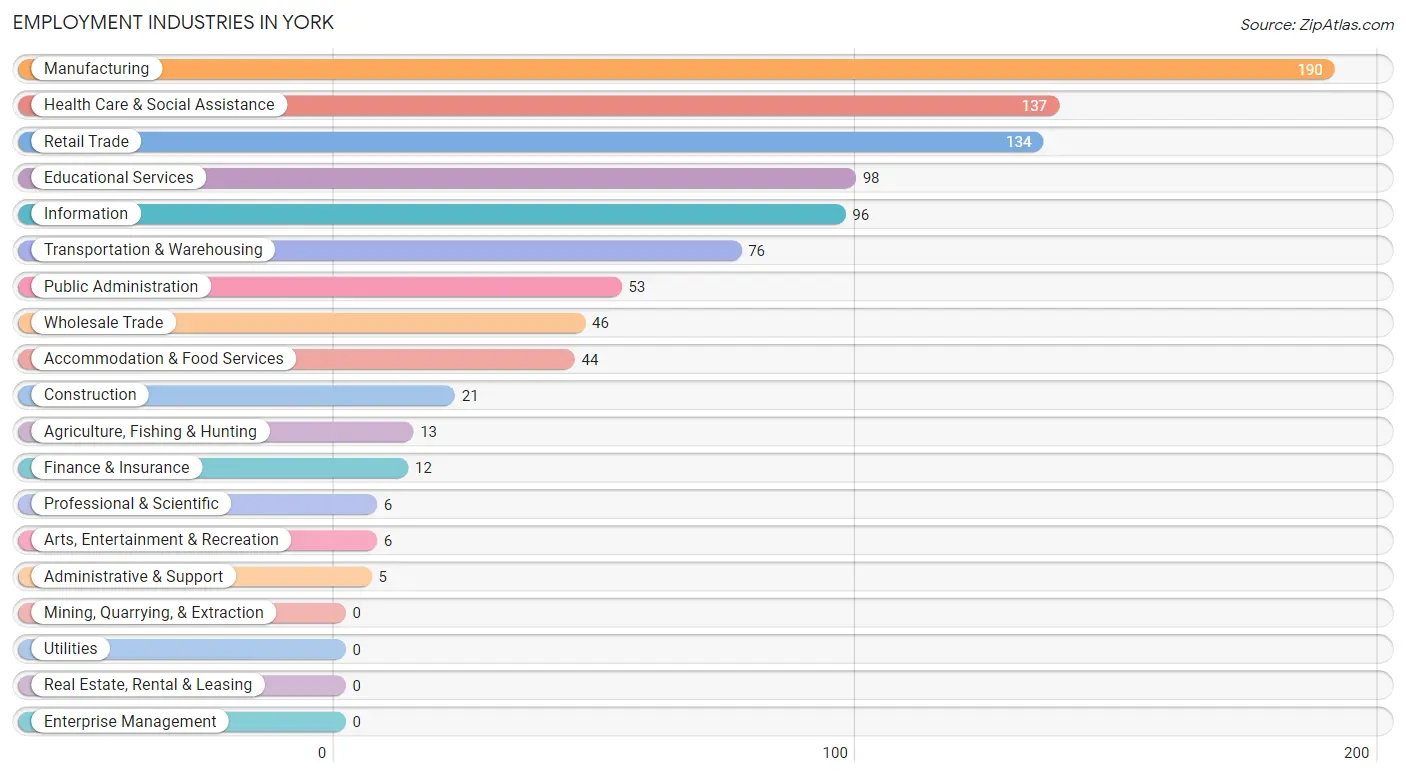
Employment Industries in York
The major employment industries in York include Manufacturing (190 | 19.4%), Health Care & Social Assistance (137 | 14.0%), Retail Trade (134 | 13.7%), Educational Services (98 | 10.0%), and Information (96 | 9.8%).
Employment Industries by Sex in York
The York industries that see more men than women are Administrative & Support (100.0%), Arts, Entertainment & Recreation (100.0%), and Construction (90.5%), whereas the industries that tend to have a higher number of women are Professional & Scientific (100.0%), Accommodation & Food Services (100.0%), and Retail Trade (97.8%).
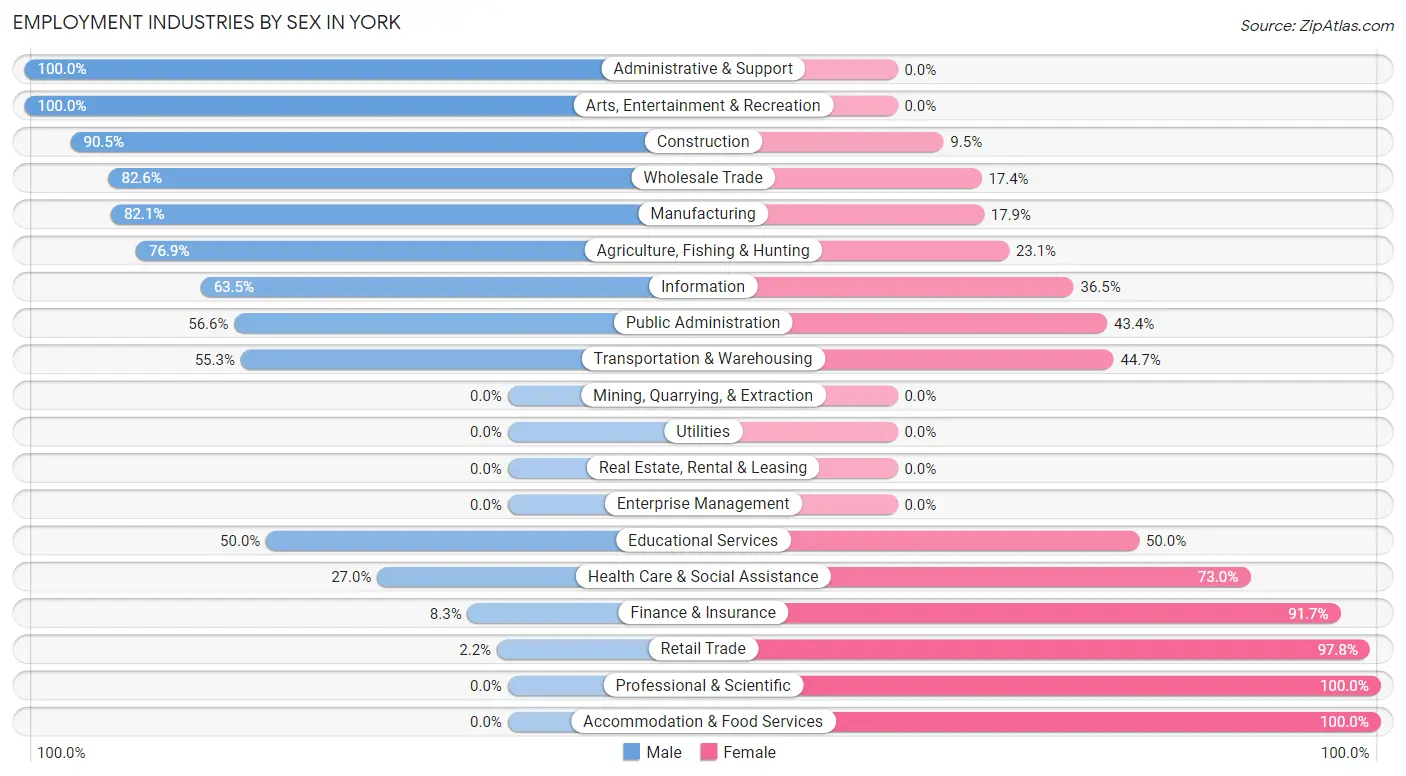
| Industry | Male | Female |
| Agriculture, Fishing & Hunting | 10 (76.9%) | 3 (23.1%) |
| Mining, Quarrying, & Extraction | 0 (0.0%) | 0 (0.0%) |
| Construction | 19 (90.5%) | 2 (9.5%) |
| Manufacturing | 156 (82.1%) | 34 (17.9%) |
| Wholesale Trade | 38 (82.6%) | 8 (17.4%) |
| Retail Trade | 3 (2.2%) | 131 (97.8%) |
| Transportation & Warehousing | 42 (55.3%) | 34 (44.7%) |
| Utilities | 0 (0.0%) | 0 (0.0%) |
| Information | 61 (63.5%) | 35 (36.5%) |
| Finance & Insurance | 1 (8.3%) | 11 (91.7%) |
| Real Estate, Rental & Leasing | 0 (0.0%) | 0 (0.0%) |
| Professional & Scientific | 0 (0.0%) | 6 (100.0%) |
| Enterprise Management | 0 (0.0%) | 0 (0.0%) |
| Administrative & Support | 5 (100.0%) | 0 (0.0%) |
| Educational Services | 49 (50.0%) | 49 (50.0%) |
| Health Care & Social Assistance | 37 (27.0%) | 100 (73.0%) |
| Arts, Entertainment & Recreation | 6 (100.0%) | 0 (0.0%) |
| Accommodation & Food Services | 0 (0.0%) | 44 (100.0%) |
| Public Administration | 30 (56.6%) | 23 (43.4%) |
| Total | 470 (47.9%) | 511 (52.1%) |
Education in York
School Enrollment in York
The most common levels of schooling among the 529 students in York are middle school (171 | 32.3%), elementary school (131 | 24.8%), and college / undergraduate (78 | 14.7%).
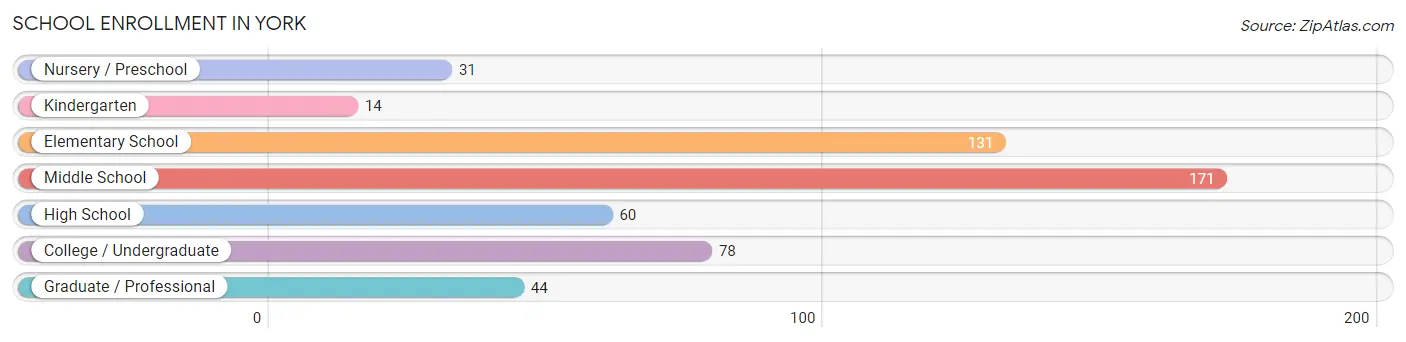
| School Level | # Students | % Students |
| Nursery / Preschool | 31 | 5.9% |
| Kindergarten | 14 | 2.6% |
| Elementary School | 131 | 24.8% |
| Middle School | 171 | 32.3% |
| High School | 60 | 11.3% |
| College / Undergraduate | 78 | 14.7% |
| Graduate / Professional | 44 | 8.3% |
| Total | 529 | 100.0% |
School Enrollment by Age by Funding Source in York
Out of a total of 529 students who are enrolled in schools in York, 63 (11.9%) attend a private institution, while the remaining 466 (88.1%) are enrolled in public schools. The age group of 20 to 24 year olds has the highest likelihood of being enrolled in private schools, with 30 (73.2% in the age bracket) enrolled. Conversely, the age group of 3 to 4 year olds has the lowest likelihood of being enrolled in a private school, with 45 (100.0% in the age bracket) attending a public institution.
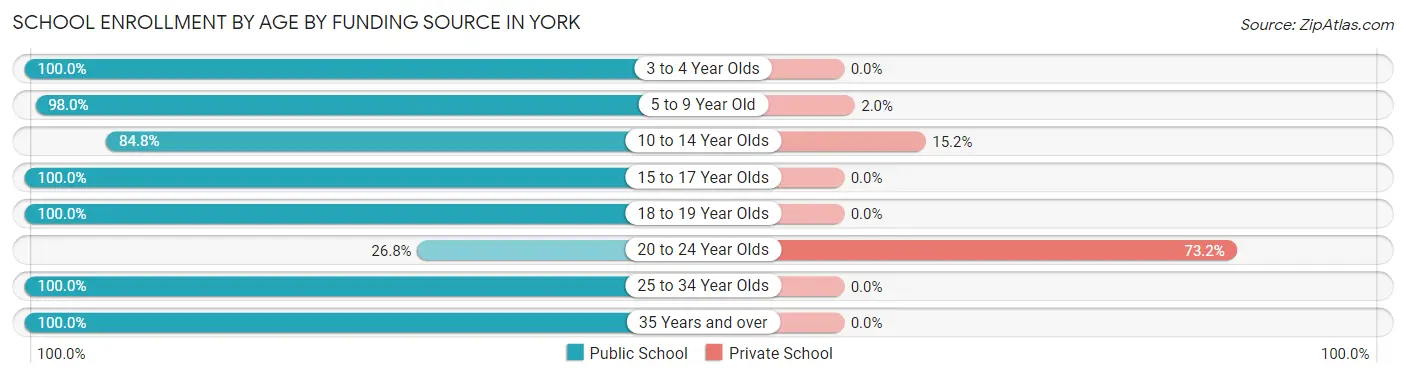
| Age Bracket | Public School | Private School |
| 3 to 4 Year Olds | 45 (100.0%) | 0 (0.0%) |
| 5 to 9 Year Old | 99 (98.0%) | 2 (2.0%) |
| 10 to 14 Year Olds | 173 (84.8%) | 31 (15.2%) |
| 15 to 17 Year Olds | 48 (100.0%) | 0 (0.0%) |
| 18 to 19 Year Olds | 32 (100.0%) | 0 (0.0%) |
| 20 to 24 Year Olds | 11 (26.8%) | 30 (73.2%) |
| 25 to 34 Year Olds | 12 (100.0%) | 0 (0.0%) |
| 35 Years and over | 46 (100.0%) | 0 (0.0%) |
| Total | 466 (88.1%) | 63 (11.9%) |
Educational Attainment by Field of Study in York
Liberal arts & history (47 | 17.7%), psychology (46 | 17.4%), education (44 | 16.6%), arts & humanities (41 | 15.5%), and computers & mathematics (32 | 12.1%) are the most common fields of study among 265 individuals in York who have obtained a bachelor's degree or higher.
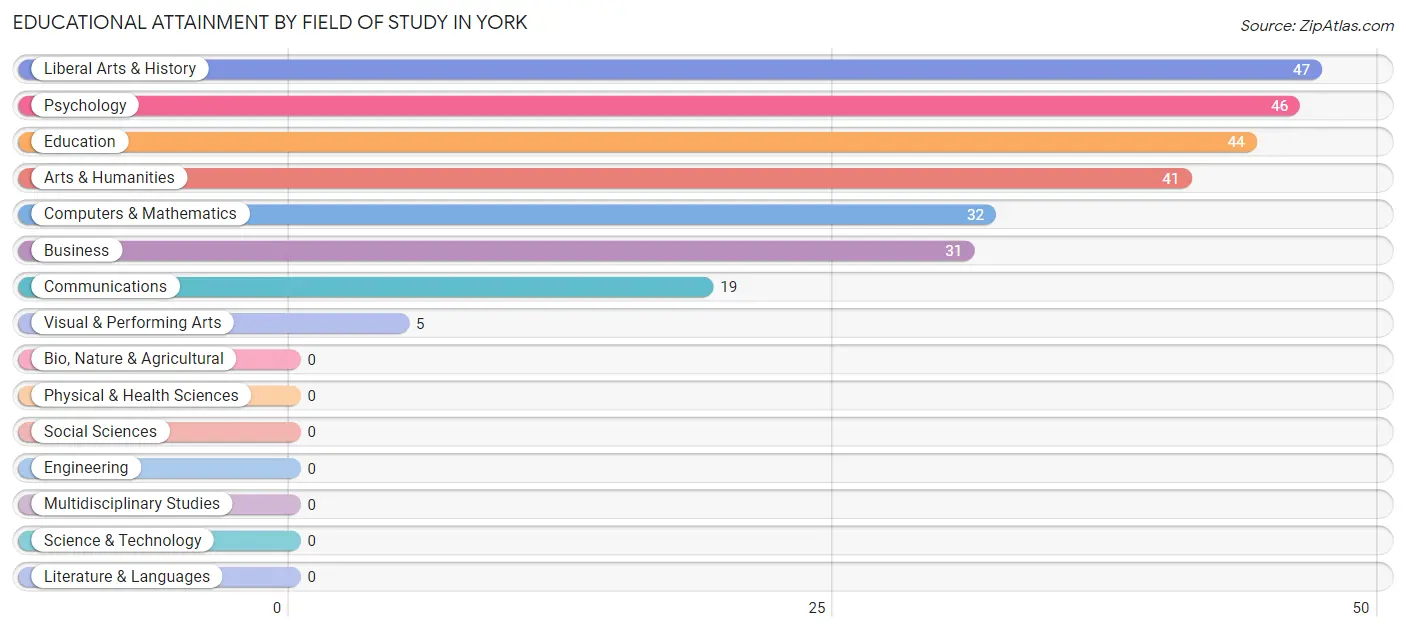
| Field of Study | # Graduates | % Graduates |
| Computers & Mathematics | 32 | 12.1% |
| Bio, Nature & Agricultural | 0 | 0.0% |
| Physical & Health Sciences | 0 | 0.0% |
| Psychology | 46 | 17.4% |
| Social Sciences | 0 | 0.0% |
| Engineering | 0 | 0.0% |
| Multidisciplinary Studies | 0 | 0.0% |
| Science & Technology | 0 | 0.0% |
| Business | 31 | 11.7% |
| Education | 44 | 16.6% |
| Literature & Languages | 0 | 0.0% |
| Liberal Arts & History | 47 | 17.7% |
| Visual & Performing Arts | 5 | 1.9% |
| Communications | 19 | 7.2% |
| Arts & Humanities | 41 | 15.5% |
| Total | 265 | 100.0% |
Transportation & Commute in York
Vehicle Availability by Sex in York
The most prevalent vehicle ownership categories in York are males with 2 vehicles (152, accounting for 41.6%) and females with 2 vehicles (149, making up 29.7%).
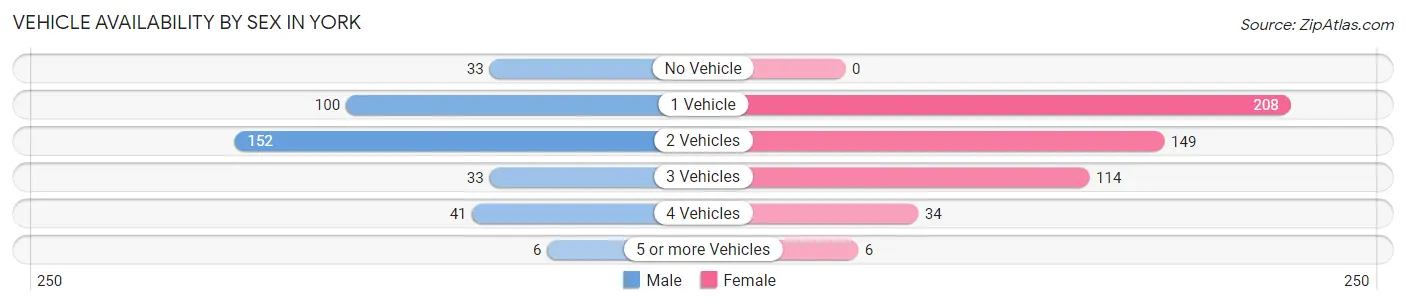
| Vehicles Available | Male | Female |
| No Vehicle | 33 (9.0%) | 0 (0.0%) |
| 1 Vehicle | 100 (27.4%) | 208 (40.7%) |
| 2 Vehicles | 152 (41.6%) | 149 (29.2%) |
| 3 Vehicles | 33 (9.0%) | 114 (22.3%) |
| 4 Vehicles | 41 (11.2%) | 34 (6.7%) |
| 5 or more Vehicles | 6 (1.6%) | 6 (1.2%) |
| Total | 365 (100.0%) | 511 (100.0%) |
Commute Time in York
The most frequently occuring commute durations in York are 30 to 34 minutes (205 commuters, 24.5%), 5 to 9 minutes (191 commuters, 22.9%), and 10 to 14 minutes (104 commuters, 12.4%).
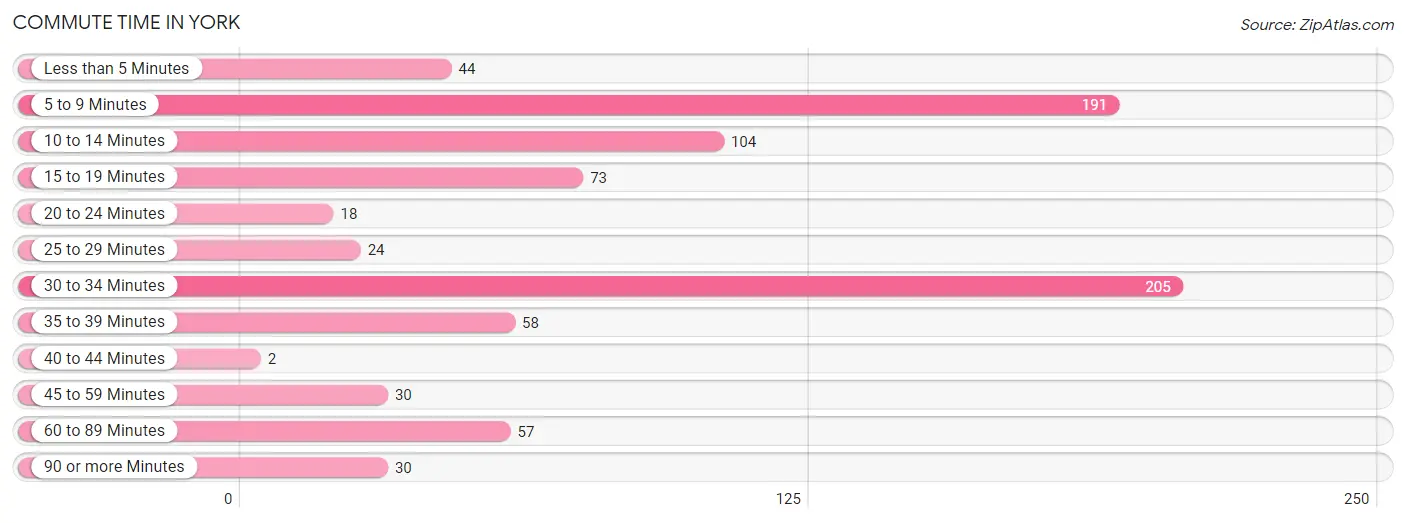
| Commute Time | # Commuters | % Commuters |
| Less than 5 Minutes | 44 | 5.3% |
| 5 to 9 Minutes | 191 | 22.9% |
| 10 to 14 Minutes | 104 | 12.4% |
| 15 to 19 Minutes | 73 | 8.7% |
| 20 to 24 Minutes | 18 | 2.1% |
| 25 to 29 Minutes | 24 | 2.9% |
| 30 to 34 Minutes | 205 | 24.5% |
| 35 to 39 Minutes | 58 | 6.9% |
| 40 to 44 Minutes | 2 | 0.2% |
| 45 to 59 Minutes | 30 | 3.6% |
| 60 to 89 Minutes | 57 | 6.8% |
| 90 or more Minutes | 30 | 3.6% |
Commute Time by Sex in York
The most common commute times in York are 30 to 34 minutes (96 commuters, 26.3%) for males and 5 to 9 minutes (167 commuters, 35.5%) for females.
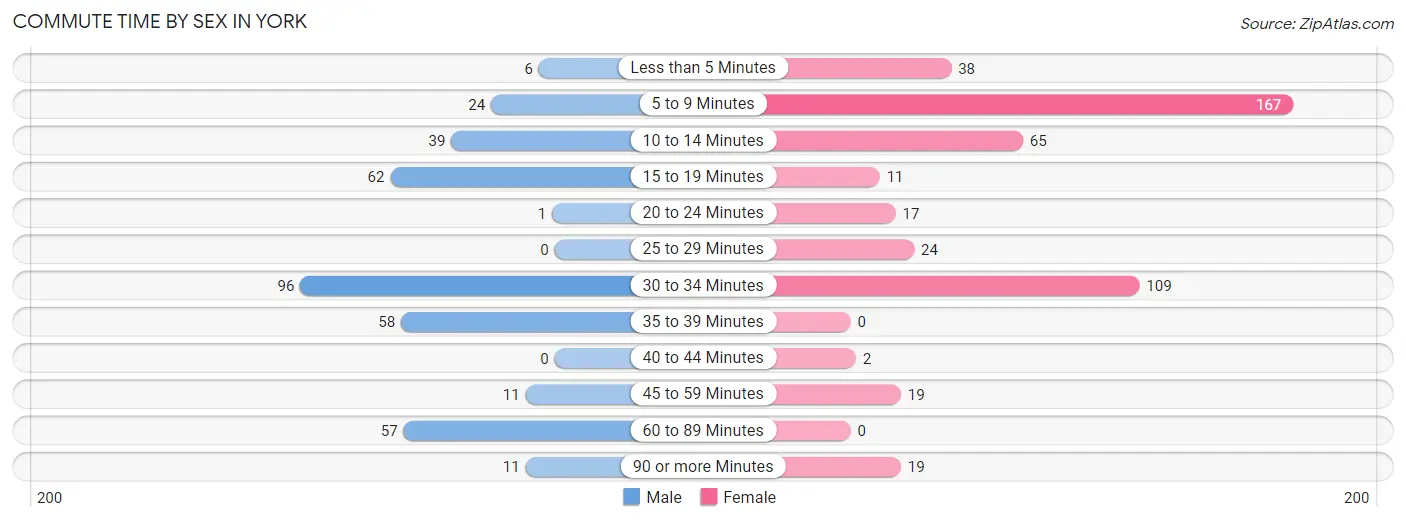
| Commute Time | Male | Female |
| Less than 5 Minutes | 6 (1.6%) | 38 (8.1%) |
| 5 to 9 Minutes | 24 (6.6%) | 167 (35.5%) |
| 10 to 14 Minutes | 39 (10.7%) | 65 (13.8%) |
| 15 to 19 Minutes | 62 (17.0%) | 11 (2.3%) |
| 20 to 24 Minutes | 1 (0.3%) | 17 (3.6%) |
| 25 to 29 Minutes | 0 (0.0%) | 24 (5.1%) |
| 30 to 34 Minutes | 96 (26.3%) | 109 (23.1%) |
| 35 to 39 Minutes | 58 (15.9%) | 0 (0.0%) |
| 40 to 44 Minutes | 0 (0.0%) | 2 (0.4%) |
| 45 to 59 Minutes | 11 (3.0%) | 19 (4.0%) |
| 60 to 89 Minutes | 57 (15.6%) | 0 (0.0%) |
| 90 or more Minutes | 11 (3.0%) | 19 (4.0%) |
Time of Departure to Work by Sex in York
The most frequent times of departure to work in York are 6:30 AM to 6:59 AM (100, 27.4%) for males and 7:30 AM to 7:59 AM (117, 24.8%) for females.
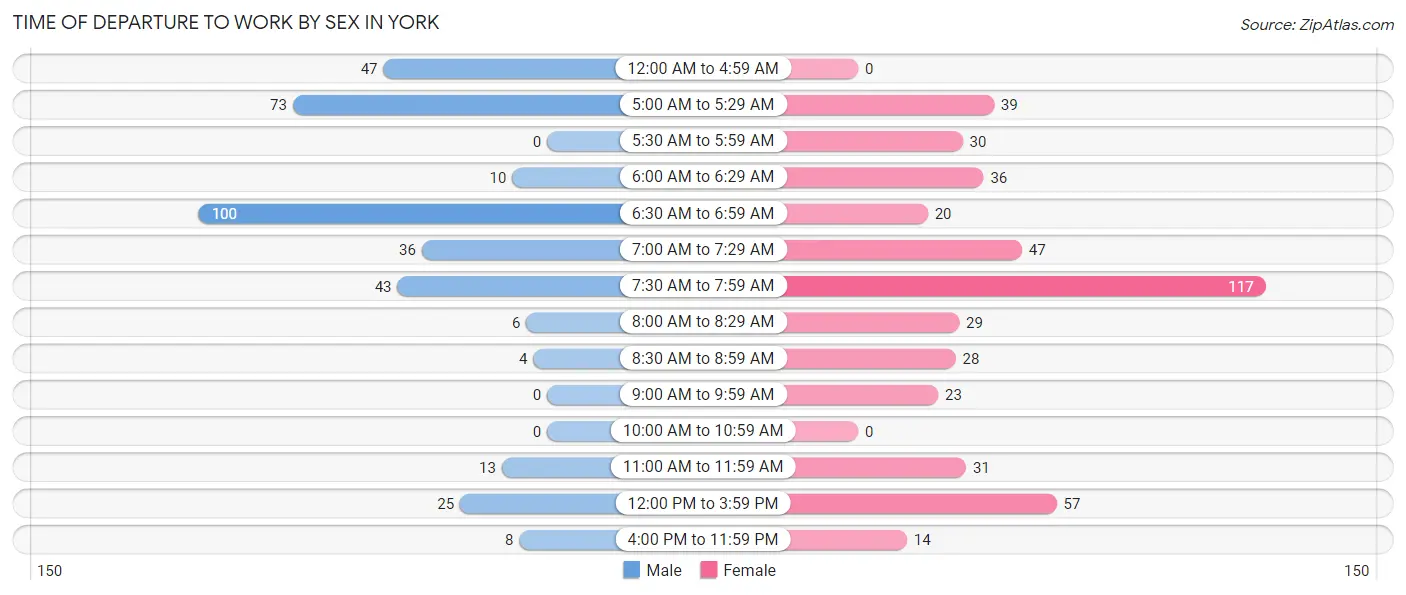
| Time of Departure | Male | Female |
| 12:00 AM to 4:59 AM | 47 (12.9%) | 0 (0.0%) |
| 5:00 AM to 5:29 AM | 73 (20.0%) | 39 (8.3%) |
| 5:30 AM to 5:59 AM | 0 (0.0%) | 30 (6.4%) |
| 6:00 AM to 6:29 AM | 10 (2.7%) | 36 (7.6%) |
| 6:30 AM to 6:59 AM | 100 (27.4%) | 20 (4.3%) |
| 7:00 AM to 7:29 AM | 36 (9.9%) | 47 (10.0%) |
| 7:30 AM to 7:59 AM | 43 (11.8%) | 117 (24.8%) |
| 8:00 AM to 8:29 AM | 6 (1.6%) | 29 (6.2%) |
| 8:30 AM to 8:59 AM | 4 (1.1%) | 28 (5.9%) |
| 9:00 AM to 9:59 AM | 0 (0.0%) | 23 (4.9%) |
| 10:00 AM to 10:59 AM | 0 (0.0%) | 0 (0.0%) |
| 11:00 AM to 11:59 AM | 13 (3.6%) | 31 (6.6%) |
| 12:00 PM to 3:59 PM | 25 (6.9%) | 57 (12.1%) |
| 4:00 PM to 11:59 PM | 8 (2.2%) | 14 (3.0%) |
| Total | 365 (100.0%) | 471 (100.0%) |
Housing Occupancy in York
Occupancy by Ownership in York
Of the total 1,084 dwellings in York, owner-occupied units account for 638 (58.9%), while renter-occupied units make up 446 (41.1%).
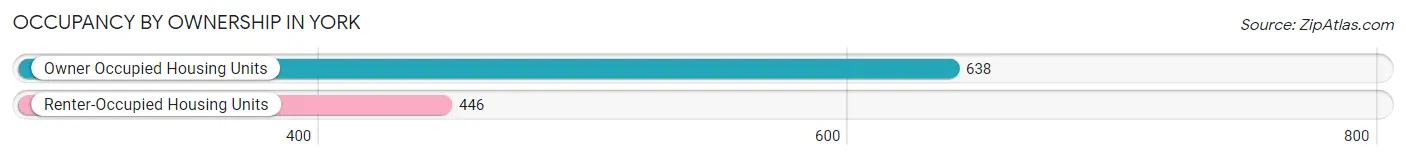
| Occupancy | # Housing Units | % Housing Units |
| Owner Occupied Housing Units | 638 | 58.9% |
| Renter-Occupied Housing Units | 446 | 41.1% |
| Total Occupied Housing Units | 1,084 | 100.0% |
Occupancy by Household Size in York
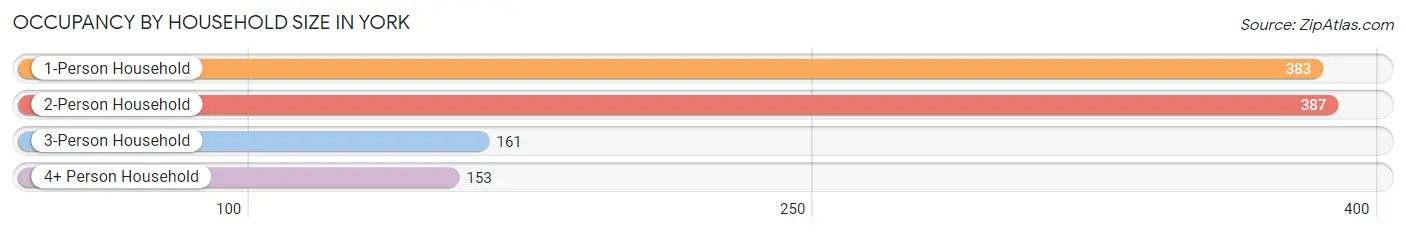
| Household Size | # Housing Units | % Housing Units |
| 1-Person Household | 383 | 35.3% |
| 2-Person Household | 387 | 35.7% |
| 3-Person Household | 161 | 14.8% |
| 4+ Person Household | 153 | 14.1% |
| Total Housing Units | 1,084 | 100.0% |
Occupancy by Ownership by Household Size in York
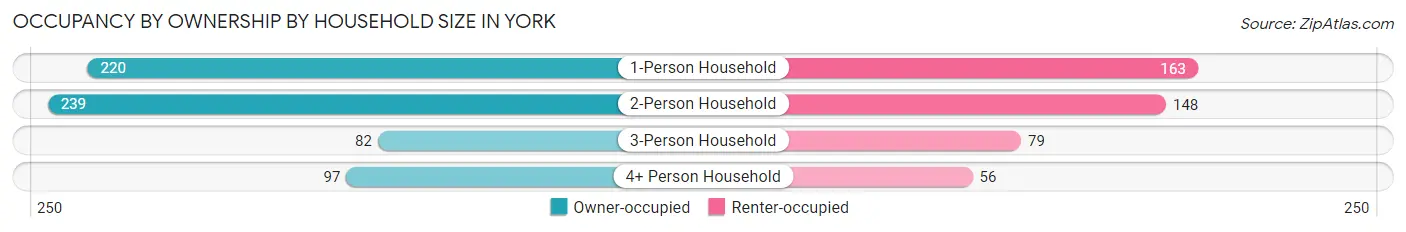
| Household Size | Owner-occupied | Renter-occupied |
| 1-Person Household | 220 (57.4%) | 163 (42.6%) |
| 2-Person Household | 239 (61.8%) | 148 (38.2%) |
| 3-Person Household | 82 (50.9%) | 79 (49.1%) |
| 4+ Person Household | 97 (63.4%) | 56 (36.6%) |
| Total Housing Units | 638 (58.9%) | 446 (41.1%) |
Occupancy by Educational Attainment in York
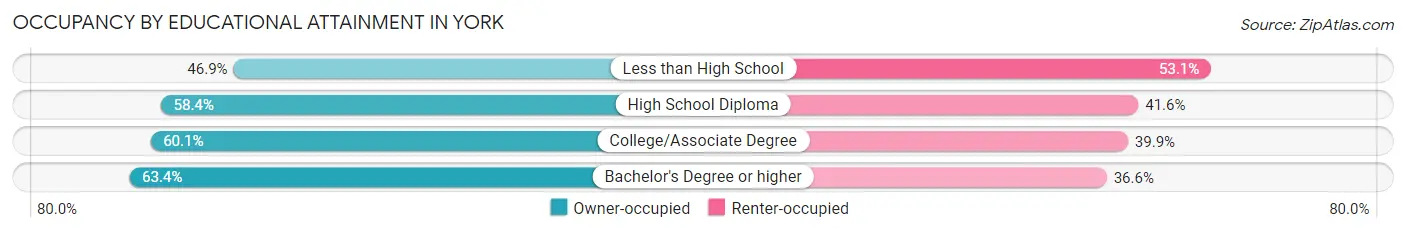
| Household Size | Owner-occupied | Renter-occupied |
| Less than High School | 45 (46.9%) | 51 (53.1%) |
| High School Diploma | 177 (58.4%) | 126 (41.6%) |
| College/Associate Degree | 331 (60.1%) | 220 (39.9%) |
| Bachelor's Degree or higher | 85 (63.4%) | 49 (36.6%) |
Occupancy by Age of Householder in York
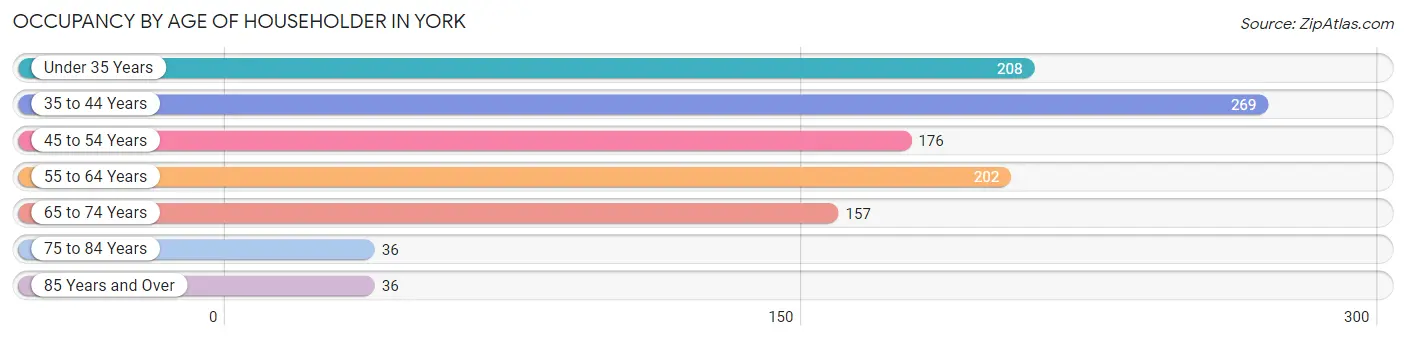
| Age Bracket | # Households | % Households |
| Under 35 Years | 208 | 19.2% |
| 35 to 44 Years | 269 | 24.8% |
| 45 to 54 Years | 176 | 16.2% |
| 55 to 64 Years | 202 | 18.6% |
| 65 to 74 Years | 157 | 14.5% |
| 75 to 84 Years | 36 | 3.3% |
| 85 Years and Over | 36 | 3.3% |
| Total | 1,084 | 100.0% |
Housing Finances in York
Median Income by Occupancy in York
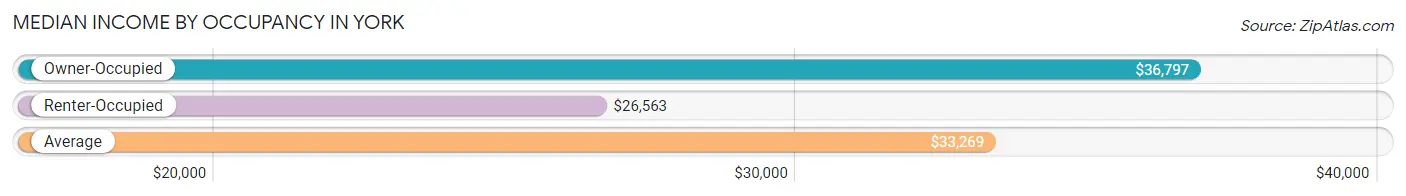
| Occupancy Type | # Households | Median Income |
| Owner-Occupied | 638 (58.9%) | $36,797 |
| Renter-Occupied | 446 (41.1%) | $26,563 |
| Average | 1,084 (100.0%) | $33,269 |
Occupancy by Householder Income Bracket in York
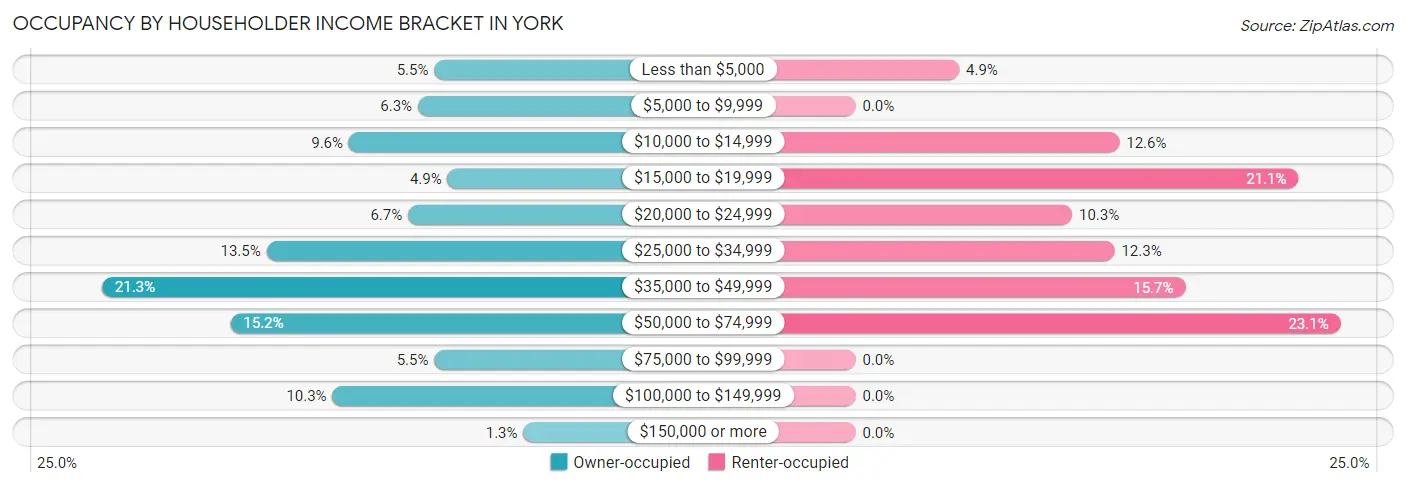
| Income Bracket | Owner-occupied | Renter-occupied |
| Less than $5,000 | 35 (5.5%) | 22 (4.9%) |
| $5,000 to $9,999 | 40 (6.3%) | 0 (0.0%) |
| $10,000 to $14,999 | 61 (9.6%) | 56 (12.6%) |
| $15,000 to $19,999 | 31 (4.9%) | 94 (21.1%) |
| $20,000 to $24,999 | 43 (6.7%) | 46 (10.3%) |
| $25,000 to $34,999 | 86 (13.5%) | 55 (12.3%) |
| $35,000 to $49,999 | 136 (21.3%) | 70 (15.7%) |
| $50,000 to $74,999 | 97 (15.2%) | 103 (23.1%) |
| $75,000 to $99,999 | 35 (5.5%) | 0 (0.0%) |
| $100,000 to $149,999 | 66 (10.3%) | 0 (0.0%) |
| $150,000 or more | 8 (1.3%) | 0 (0.0%) |
| Total | 638 (100.0%) | 446 (100.0%) |
Monthly Housing Cost Tiers in York
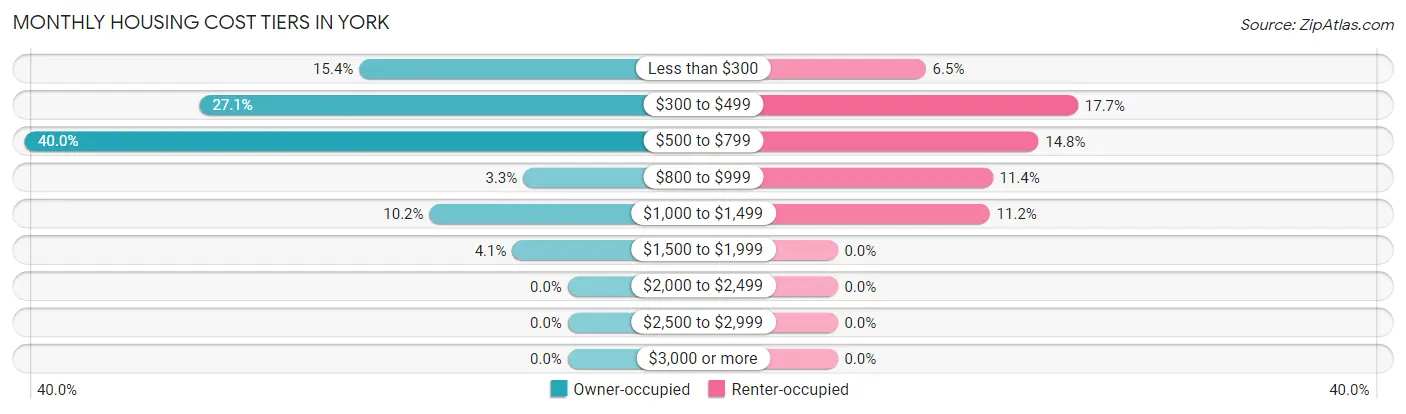
| Monthly Cost | Owner-occupied | Renter-occupied |
| Less than $300 | 98 (15.4%) | 29 (6.5%) |
| $300 to $499 | 173 (27.1%) | 79 (17.7%) |
| $500 to $799 | 255 (40.0%) | 66 (14.8%) |
| $800 to $999 | 21 (3.3%) | 51 (11.4%) |
| $1,000 to $1,499 | 65 (10.2%) | 50 (11.2%) |
| $1,500 to $1,999 | 26 (4.1%) | 0 (0.0%) |
| $2,000 to $2,499 | 0 (0.0%) | 0 (0.0%) |
| $2,500 to $2,999 | 0 (0.0%) | 0 (0.0%) |
| $3,000 or more | 0 (0.0%) | 0 (0.0%) |
| Total | 638 (100.0%) | 446 (100.0%) |
Physical Housing Characteristics in York
Housing Structures in York
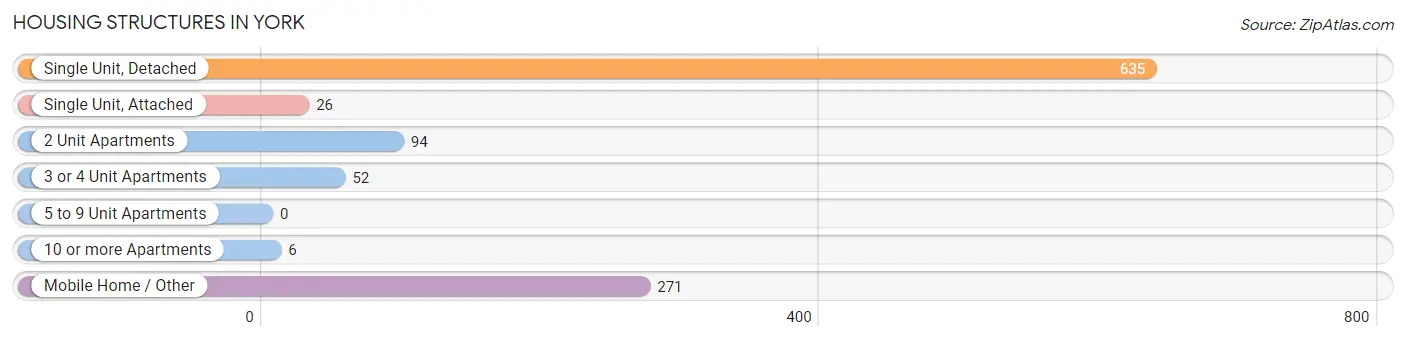
| Structure Type | # Housing Units | % Housing Units |
| Single Unit, Detached | 635 | 58.6% |
| Single Unit, Attached | 26 | 2.4% |
| 2 Unit Apartments | 94 | 8.7% |
| 3 or 4 Unit Apartments | 52 | 4.8% |
| 5 to 9 Unit Apartments | 0 | 0.0% |
| 10 or more Apartments | 6 | 0.5% |
| Mobile Home / Other | 271 | 25.0% |
| Total | 1,084 | 100.0% |
Housing Structures by Occupancy in York
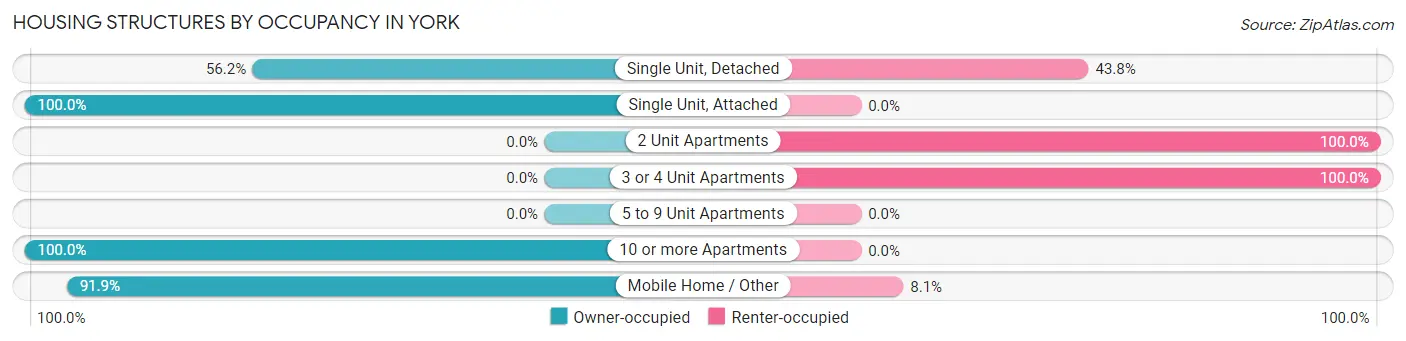
| Structure Type | Owner-occupied | Renter-occupied |
| Single Unit, Detached | 357 (56.2%) | 278 (43.8%) |
| Single Unit, Attached | 26 (100.0%) | 0 (0.0%) |
| 2 Unit Apartments | 0 (0.0%) | 94 (100.0%) |
| 3 or 4 Unit Apartments | 0 (0.0%) | 52 (100.0%) |
| 5 to 9 Unit Apartments | 0 (0.0%) | 0 (0.0%) |
| 10 or more Apartments | 6 (100.0%) | 0 (0.0%) |
| Mobile Home / Other | 249 (91.9%) | 22 (8.1%) |
| Total | 638 (58.9%) | 446 (41.1%) |
Housing Structures by Number of Rooms in York
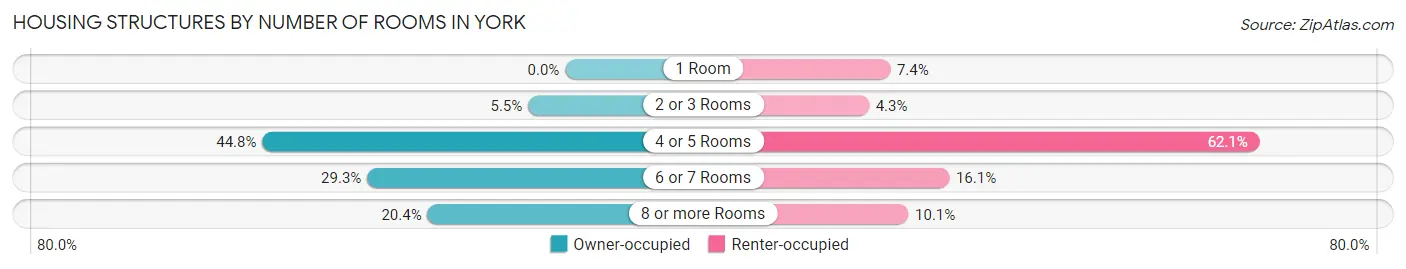
| Number of Rooms | Owner-occupied | Renter-occupied |
| 1 Room | 0 (0.0%) | 33 (7.4%) |
| 2 or 3 Rooms | 35 (5.5%) | 19 (4.3%) |
| 4 or 5 Rooms | 286 (44.8%) | 277 (62.1%) |
| 6 or 7 Rooms | 187 (29.3%) | 72 (16.1%) |
| 8 or more Rooms | 130 (20.4%) | 45 (10.1%) |
| Total | 638 (100.0%) | 446 (100.0%) |
Housing Structure by Heating Type in York
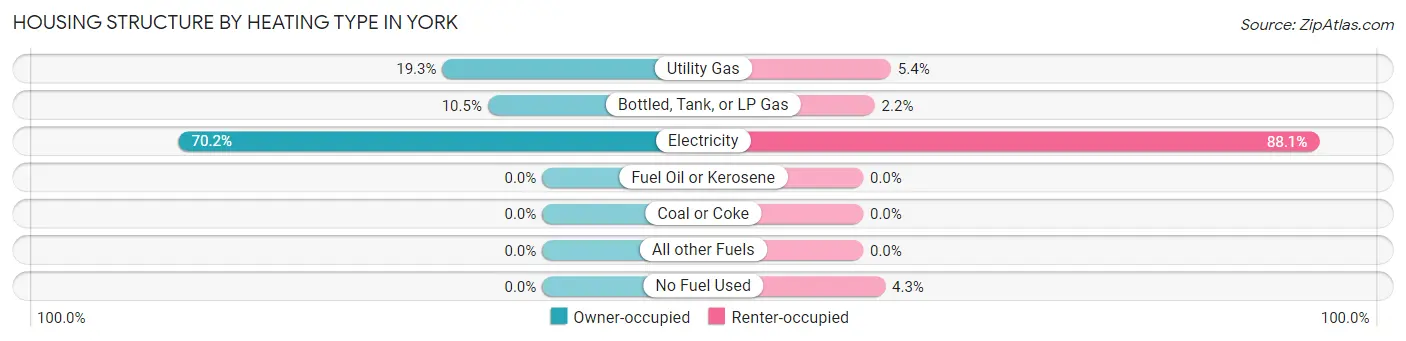
| Heating Type | Owner-occupied | Renter-occupied |
| Utility Gas | 123 (19.3%) | 24 (5.4%) |
| Bottled, Tank, or LP Gas | 67 (10.5%) | 10 (2.2%) |
| Electricity | 448 (70.2%) | 393 (88.1%) |
| Fuel Oil or Kerosene | 0 (0.0%) | 0 (0.0%) |
| Coal or Coke | 0 (0.0%) | 0 (0.0%) |
| All other Fuels | 0 (0.0%) | 0 (0.0%) |
| No Fuel Used | 0 (0.0%) | 19 (4.3%) |
| Total | 638 (100.0%) | 446 (100.0%) |
Household Vehicle Usage in York
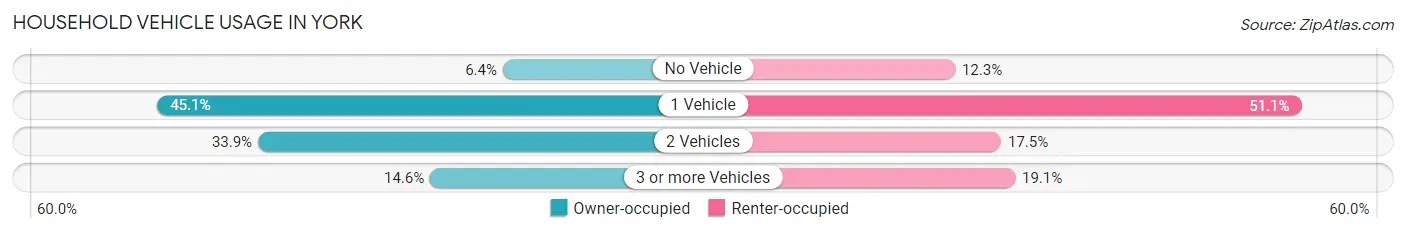
| Vehicles per Household | Owner-occupied | Renter-occupied |
| No Vehicle | 41 (6.4%) | 55 (12.3%) |
| 1 Vehicle | 288 (45.1%) | 228 (51.1%) |
| 2 Vehicles | 216 (33.9%) | 78 (17.5%) |
| 3 or more Vehicles | 93 (14.6%) | 85 (19.1%) |
| Total | 638 (100.0%) | 446 (100.0%) |
Real Estate & Mortgages in York
Real Estate and Mortgage Overview in York
| Characteristic | Without Mortgage | With Mortgage |
| Housing Units | 405 | 233 |
| Median Property Value | $33,900 | $80,300 |
| Median Household Income | $27,750 | $4 |
| Monthly Housing Costs | $399 | $0 |
| Real Estate Taxes | $274 | $61 |
Property Value by Mortgage Status in York
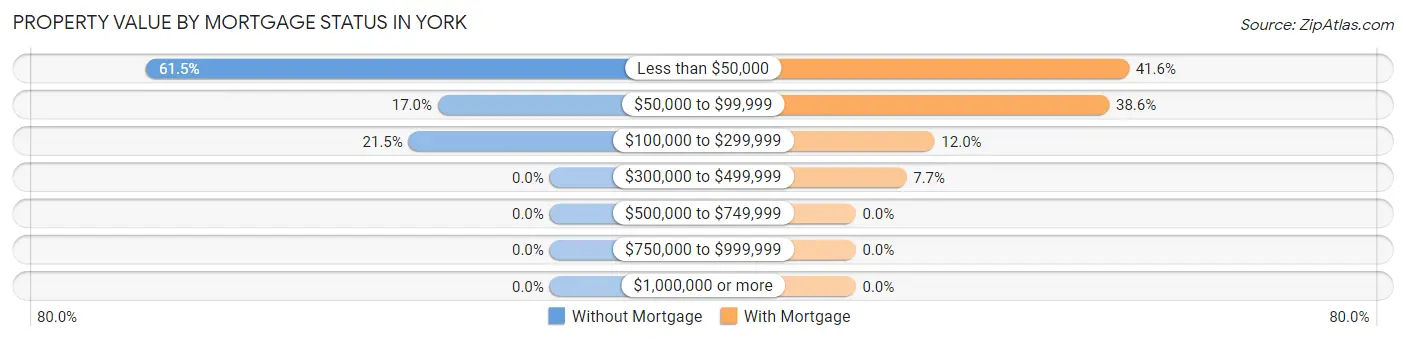
| Property Value | Without Mortgage | With Mortgage |
| Less than $50,000 | 249 (61.5%) | 97 (41.6%) |
| $50,000 to $99,999 | 69 (17.0%) | 90 (38.6%) |
| $100,000 to $299,999 | 87 (21.5%) | 28 (12.0%) |
| $300,000 to $499,999 | 0 (0.0%) | 18 (7.7%) |
| $500,000 to $749,999 | 0 (0.0%) | 0 (0.0%) |
| $750,000 to $999,999 | 0 (0.0%) | 0 (0.0%) |
| $1,000,000 or more | 0 (0.0%) | 0 (0.0%) |
| Total | 405 (100.0%) | 233 (100.0%) |
Household Income by Mortgage Status in York
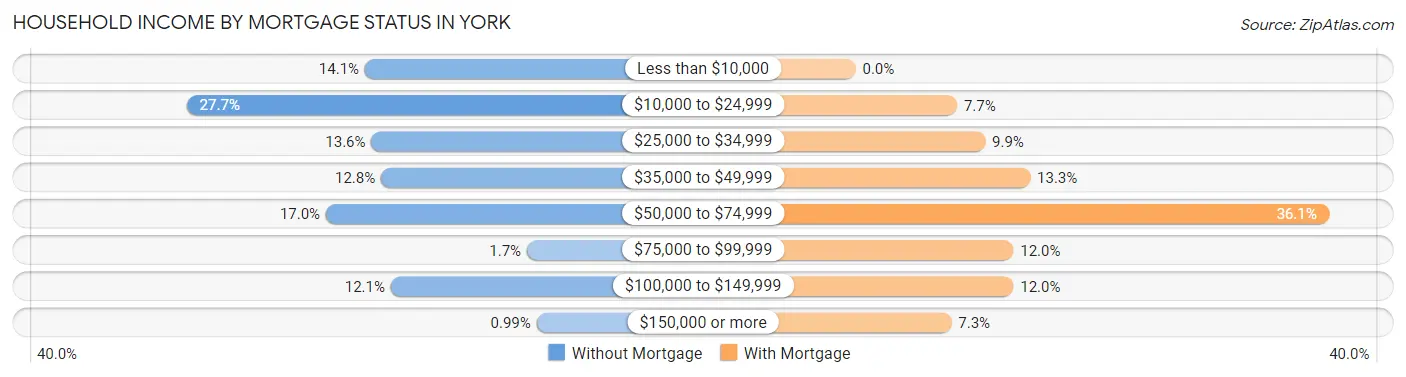
| Household Income | Without Mortgage | With Mortgage |
| Less than $10,000 | 57 (14.1%) | 0 (0.0%) |
| $10,000 to $24,999 | 112 (27.7%) | 18 (7.7%) |
| $25,000 to $34,999 | 55 (13.6%) | 23 (9.9%) |
| $35,000 to $49,999 | 52 (12.8%) | 31 (13.3%) |
| $50,000 to $74,999 | 69 (17.0%) | 84 (36.0%) |
| $75,000 to $99,999 | 7 (1.7%) | 28 (12.0%) |
| $100,000 to $149,999 | 49 (12.1%) | 28 (12.0%) |
| $150,000 or more | 4 (1.0%) | 17 (7.3%) |
| Total | 405 (100.0%) | 233 (100.0%) |
Property Value to Household Income Ratio in York
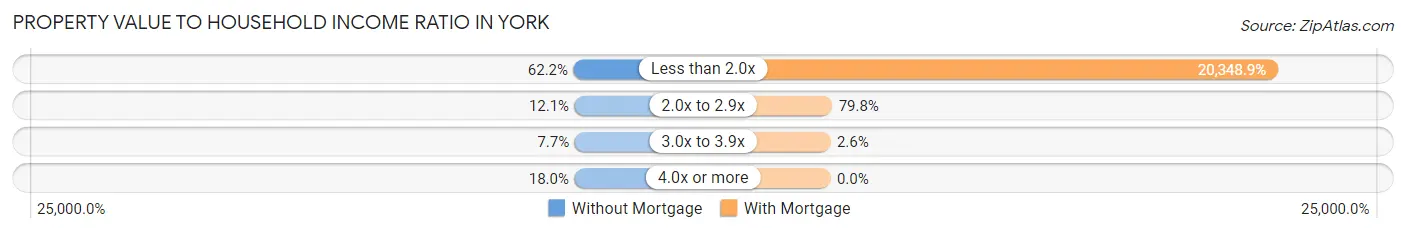
| Value-to-Income Ratio | Without Mortgage | With Mortgage |
| Less than 2.0x | 252 (62.2%) | 47,413 (20,348.9%) |
| 2.0x to 2.9x | 49 (12.1%) | 186 (79.8%) |
| 3.0x to 3.9x | 31 (7.6%) | 6 (2.6%) |
| 4.0x or more | 73 (18.0%) | 0 (0.0%) |
| Total | 405 (100.0%) | 233 (100.0%) |
Real Estate Taxes by Mortgage Status in York
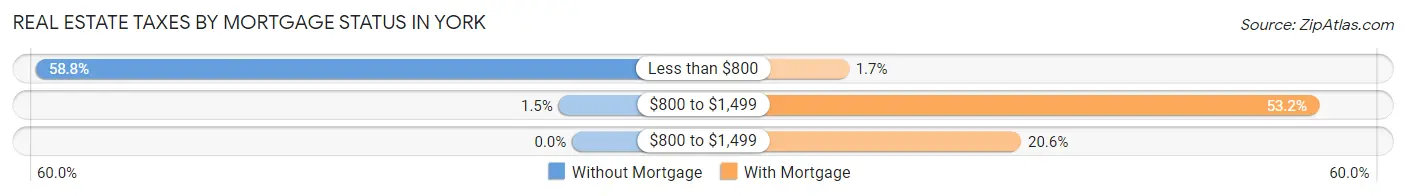
| Property Taxes | Without Mortgage | With Mortgage |
| Less than $800 | 238 (58.8%) | 4 (1.7%) |
| $800 to $1,499 | 6 (1.5%) | 124 (53.2%) |
| $800 to $1,499 | 0 (0.0%) | 48 (20.6%) |
| Total | 405 (100.0%) | 233 (100.0%) |
Health & Disability in York
Health Insurance Coverage by Age in York
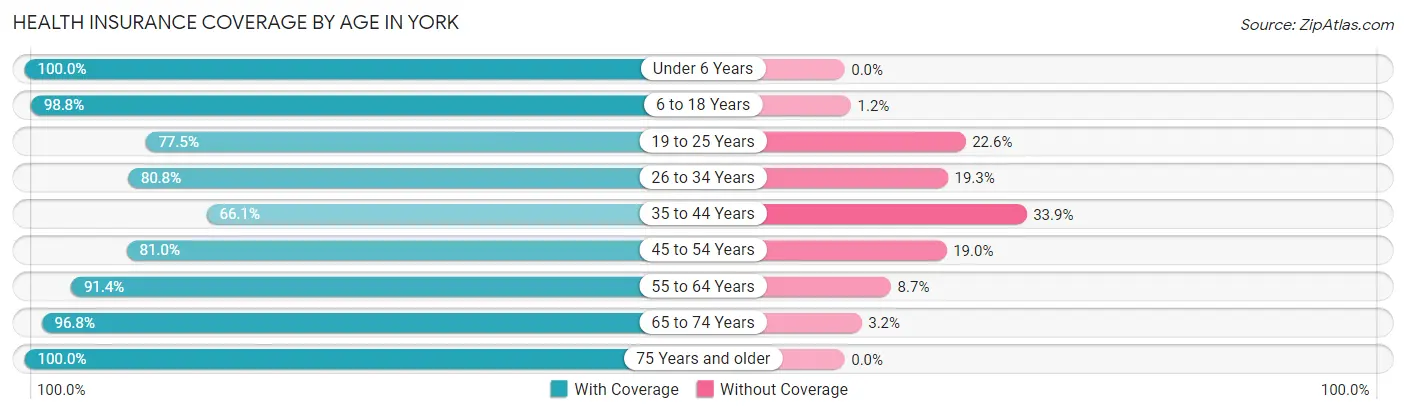
| Age Bracket | With Coverage | Without Coverage |
| Under 6 Years | 175 (100.0%) | 0 (0.0%) |
| 6 to 18 Years | 422 (98.8%) | 5 (1.2%) |
| 19 to 25 Years | 79 (77.4%) | 23 (22.6%) |
| 26 to 34 Years | 260 (80.7%) | 62 (19.3%) |
| 35 to 44 Years | 296 (66.1%) | 152 (33.9%) |
| 45 to 54 Years | 196 (81.0%) | 46 (19.0%) |
| 55 to 64 Years | 243 (91.3%) | 23 (8.6%) |
| 65 to 74 Years | 214 (96.8%) | 7 (3.2%) |
| 75 Years and older | 77 (100.0%) | 0 (0.0%) |
| Total | 1,962 (86.1%) | 318 (14.0%) |
Health Insurance Coverage by Citizenship Status in York
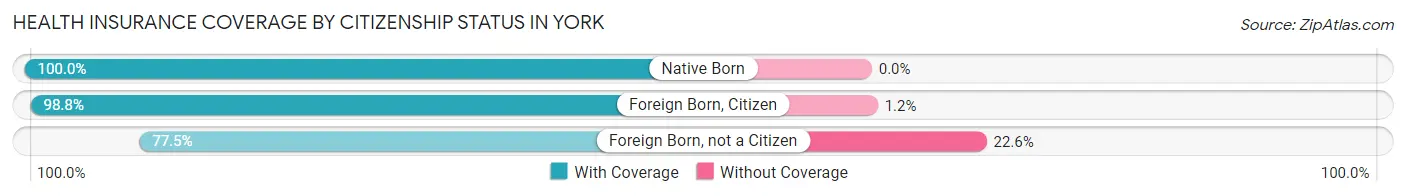
| Citizenship Status | With Coverage | Without Coverage |
| Native Born | 175 (100.0%) | 0 (0.0%) |
| Foreign Born, Citizen | 422 (98.8%) | 5 (1.2%) |
| Foreign Born, not a Citizen | 79 (77.4%) | 23 (22.6%) |
Health Insurance Coverage by Household Income in York
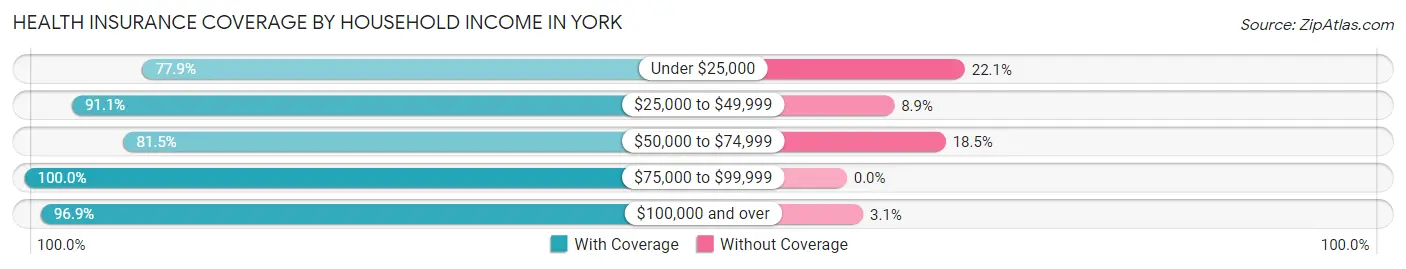
| Household Income | With Coverage | Without Coverage |
| Under $25,000 | 592 (77.9%) | 168 (22.1%) |
| $25,000 to $49,999 | 718 (91.1%) | 70 (8.9%) |
| $50,000 to $74,999 | 321 (81.5%) | 73 (18.5%) |
| $75,000 to $99,999 | 109 (100.0%) | 0 (0.0%) |
| $100,000 and over | 222 (96.9%) | 7 (3.1%) |
Public vs Private Health Insurance Coverage by Age in York
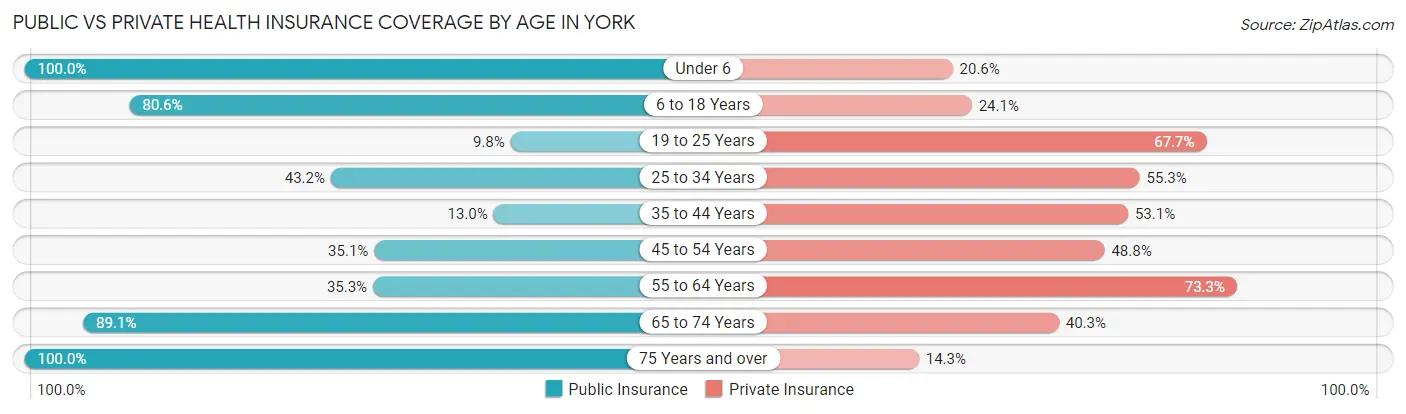
| Age Bracket | Public Insurance | Private Insurance |
| Under 6 | 175 (100.0%) | 36 (20.6%) |
| 6 to 18 Years | 344 (80.6%) | 103 (24.1%) |
| 19 to 25 Years | 10 (9.8%) | 69 (67.6%) |
| 25 to 34 Years | 139 (43.2%) | 178 (55.3%) |
| 35 to 44 Years | 58 (13.0%) | 238 (53.1%) |
| 45 to 54 Years | 85 (35.1%) | 118 (48.8%) |
| 55 to 64 Years | 94 (35.3%) | 195 (73.3%) |
| 65 to 74 Years | 197 (89.1%) | 89 (40.3%) |
| 75 Years and over | 77 (100.0%) | 11 (14.3%) |
| Total | 1,179 (51.7%) | 1,037 (45.5%) |
Disability Status by Sex by Age in York
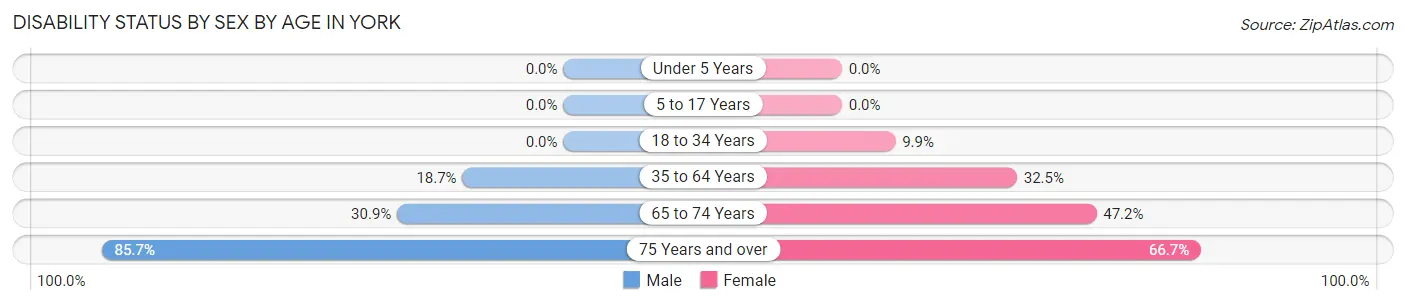
| Age Bracket | Male | Female |
| Under 5 Years | 0 (0.0%) | 0 (0.0%) |
| 5 to 17 Years | 0 (0.0%) | 0 (0.0%) |
| 18 to 34 Years | 0 (0.0%) | 24 (9.9%) |
| 35 to 64 Years | 77 (18.7%) | 177 (32.5%) |
| 65 to 74 Years | 29 (30.8%) | 60 (47.2%) |
| 75 Years and over | 30 (85.7%) | 28 (66.7%) |
Disability Class by Sex by Age in York
Disability Class: Hearing Difficulty
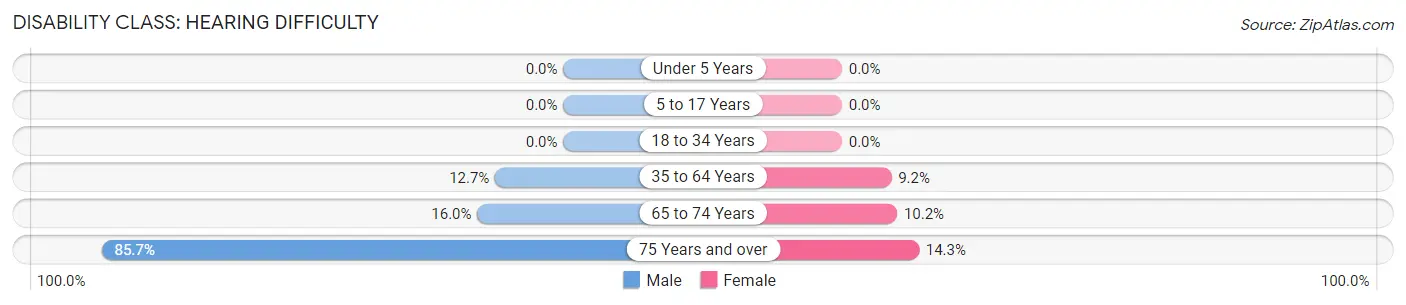
| Age Bracket | Male | Female |
| Under 5 Years | 0 (0.0%) | 0 (0.0%) |
| 5 to 17 Years | 0 (0.0%) | 0 (0.0%) |
| 18 to 34 Years | 0 (0.0%) | 0 (0.0%) |
| 35 to 64 Years | 52 (12.7%) | 50 (9.2%) |
| 65 to 74 Years | 15 (16.0%) | 13 (10.2%) |
| 75 Years and over | 30 (85.7%) | 6 (14.3%) |
Disability Class: Vision Difficulty
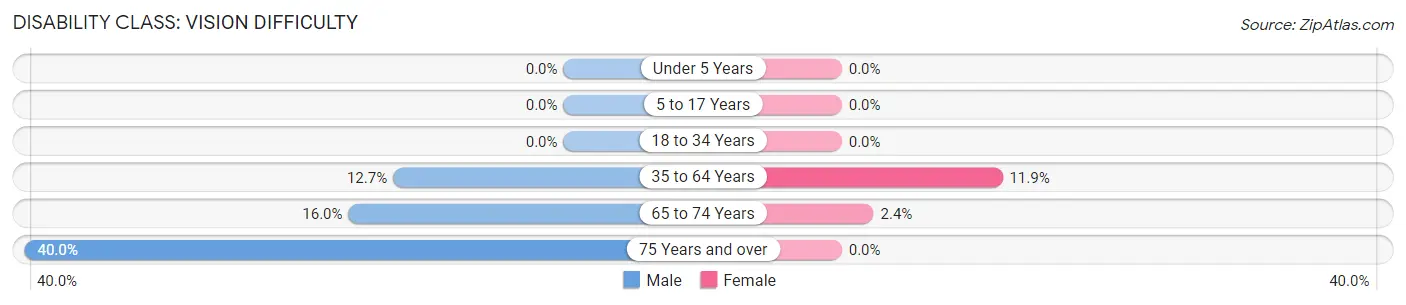
| Age Bracket | Male | Female |
| Under 5 Years | 0 (0.0%) | 0 (0.0%) |
| 5 to 17 Years | 0 (0.0%) | 0 (0.0%) |
| 18 to 34 Years | 0 (0.0%) | 0 (0.0%) |
| 35 to 64 Years | 52 (12.7%) | 65 (11.9%) |
| 65 to 74 Years | 15 (16.0%) | 3 (2.4%) |
| 75 Years and over | 14 (40.0%) | 0 (0.0%) |
Disability Class: Cognitive Difficulty
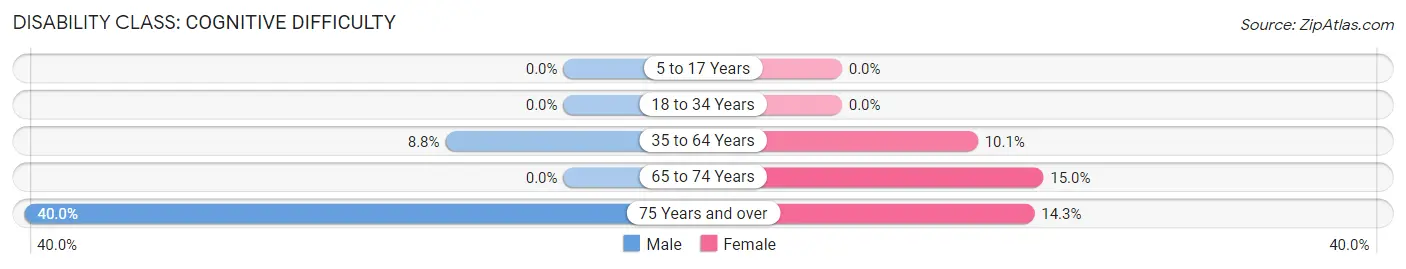
| Age Bracket | Male | Female |
| 5 to 17 Years | 0 (0.0%) | 0 (0.0%) |
| 18 to 34 Years | 0 (0.0%) | 0 (0.0%) |
| 35 to 64 Years | 36 (8.8%) | 55 (10.1%) |
| 65 to 74 Years | 0 (0.0%) | 19 (15.0%) |
| 75 Years and over | 14 (40.0%) | 6 (14.3%) |
Disability Class: Ambulatory Difficulty
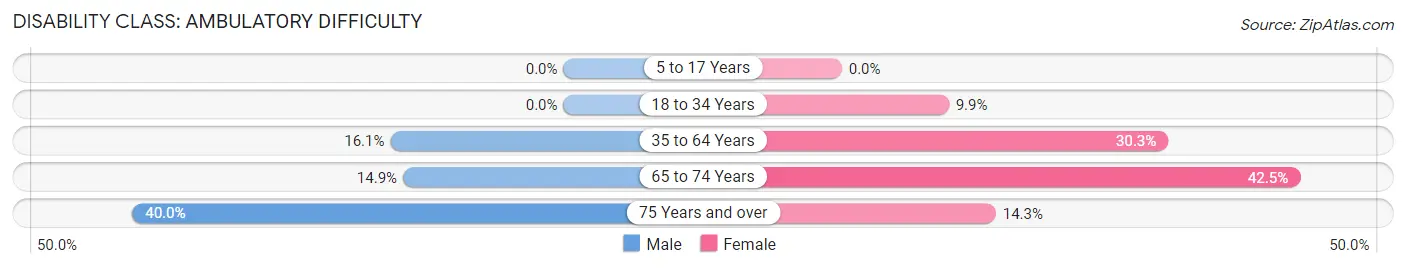
| Age Bracket | Male | Female |
| 5 to 17 Years | 0 (0.0%) | 0 (0.0%) |
| 18 to 34 Years | 0 (0.0%) | 24 (9.9%) |
| 35 to 64 Years | 66 (16.1%) | 165 (30.3%) |
| 65 to 74 Years | 14 (14.9%) | 54 (42.5%) |
| 75 Years and over | 14 (40.0%) | 6 (14.3%) |
Disability Class: Self-Care Difficulty
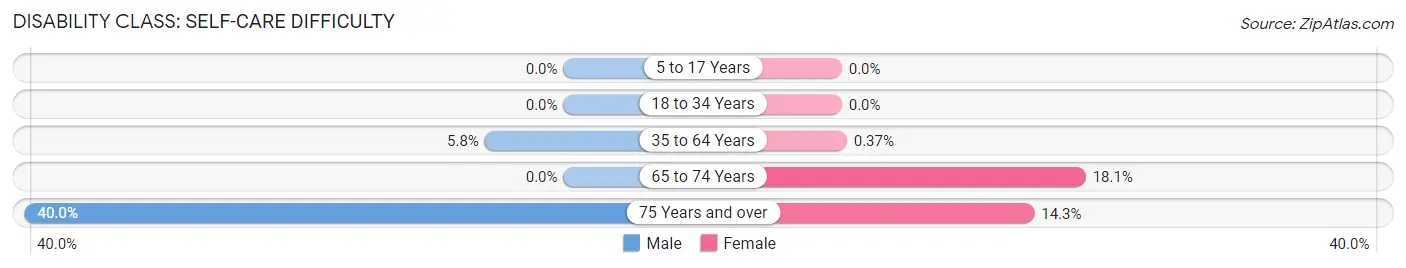
| Age Bracket | Male | Female |
| 5 to 17 Years | 0 (0.0%) | 0 (0.0%) |
| 18 to 34 Years | 0 (0.0%) | 0 (0.0%) |
| 35 to 64 Years | 24 (5.8%) | 2 (0.4%) |
| 65 to 74 Years | 0 (0.0%) | 23 (18.1%) |
| 75 Years and over | 14 (40.0%) | 6 (14.3%) |
Technology Access in York
Computing Device Access in York
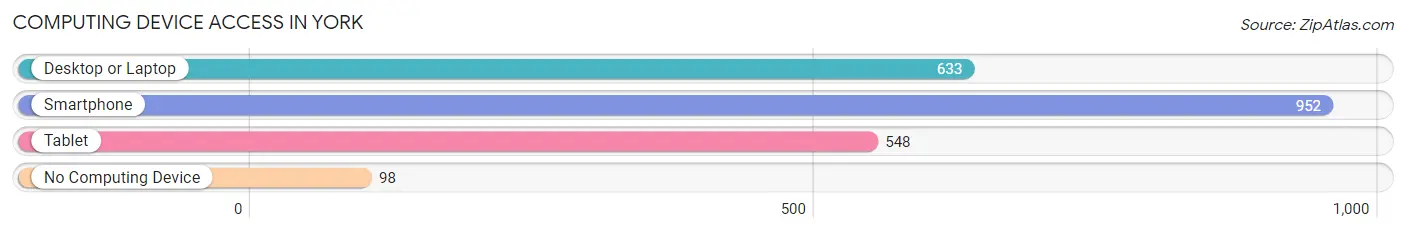
| Device Type | # Households | % Households |
| Desktop or Laptop | 633 | 58.4% |
| Smartphone | 952 | 87.8% |
| Tablet | 548 | 50.5% |
| No Computing Device | 98 | 9.0% |
| Total | 1,084 | 100.0% |
Internet Access in York
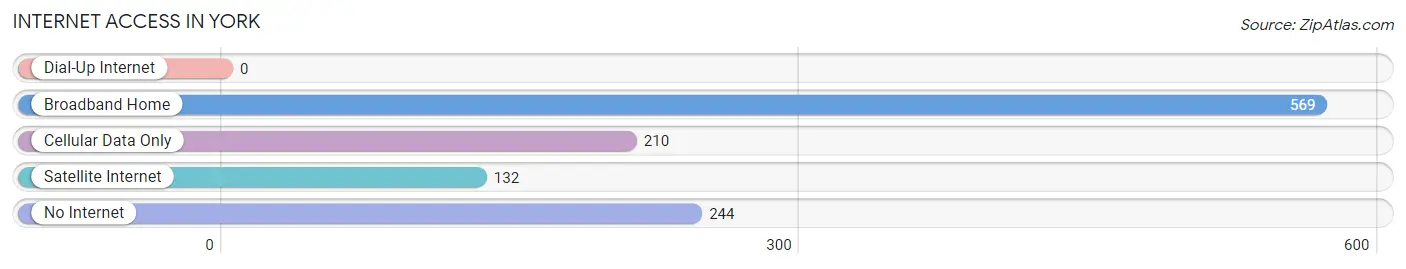
| Internet Type | # Households | % Households |
| Dial-Up Internet | 0 | 0.0% |
| Broadband Home | 569 | 52.5% |
| Cellular Data Only | 210 | 19.4% |
| Satellite Internet | 132 | 12.2% |
| No Internet | 244 | 22.5% |
| Total | 1,084 | 100.0% |
York Summary
York is a city located in the state of Alabama, in the United States of America. It is the county seat of Sumter County and is located in the southwestern part of the state. The city has a population of approximately 2,000 people and is part of the Tuscaloosa Metropolitan Statistical Area.
Geography
York is located in the southwestern part of Alabama, in Sumter County. It is situated at the intersection of U.S. Route 11 and State Route 17. The city is located about 30 miles south of Tuscaloosa and about 50 miles west of Birmingham. The city is situated on the banks of the Tombigbee River and is surrounded by the Black Belt region of Alabama. The city has a total area of 2.2 square miles, all of which is land.
History
York was founded in 1819 and was originally known as Yorkville. The city was named after the city of York in England. The city was incorporated in 1832 and was the county seat of Sumter County. During the Civil War, the city was the site of a major battle between Union and Confederate forces. After the war, the city experienced a period of growth and development. In the late 19th century, the city was home to several cotton mills and other industries.
Economy
The economy of York is largely based on agriculture and manufacturing. The city is home to several large farms that produce cotton, soybeans, corn, and other crops. The city is also home to several manufacturing companies that produce a variety of products, including furniture, clothing, and automotive parts. The city is also home to several retail stores and restaurants.
Demographics
As of the 2010 census, the population of York was 2,000. The racial makeup of the city was 79.2% White, 18.2% African American, 0.3% Native American, 0.2% Asian, 0.1% Pacific Islander, 0.7% from other races, and 1.5% from two or more races. Hispanic or Latino of any race were 1.7% of the population.
The median income for a household in the city was $25,000 and the median income for a family was $31,250. The per capita income for the city was $14,845. About 22.2% of the population was below the poverty line.
Conclusion
York is a small city located in the southwestern part of Alabama. The city has a population of approximately 2,000 people and is part of the Tuscaloosa Metropolitan Statistical Area. The economy of the city is largely based on agriculture and manufacturing. The city is also home to several retail stores and restaurants. The racial makeup of the city is 79.2% White, 18.2% African American, 0.3% Native American, 0.2% Asian, 0.1% Pacific Islander, 0.7% from other races, and 1.5% from two or more races. The median income for a household in the city was $25,000 and the median income for a family was $31,250.
Common Questions
What is Per Capita Income in York?
Per Capita income in York is $18,773.
What is the Median Family Income in York?
Median Family Income in York is $45,181.
What is the Median Household income in York?
Median Household Income in York is $33,269.
What is Income or Wage Gap in York?
Income or Wage Gap in York is 39.9%.
Women in York earn 60.1 cents for every dollar earned by a man.
What is Inequality or Gini Index in York?
Inequality or Gini Index in York is 0.41.
What is the Total Population of York?
Total Population of York is 2,423.
What is the Total Male Population of York?
Total Male Population of York is 1,152.
What is the Total Female Population of York?
Total Female Population of York is 1,271.
What is the Ratio of Males per 100 Females in York?
There are 90.64 Males per 100 Females in York.
What is the Ratio of Females per 100 Males in York?
There are 110.33 Females per 100 Males in York.
What is the Median Population Age in York?
Median Population Age in York is 38.7 Years.
What is the Average Family Size in York
Average Family Size in York is 2.7 People.
What is the Average Household Size in York
Average Household Size in York is 2.1 People.
How Large is the Labor Force in York?
There are 1,070 People in the Labor Forcein in York.
What is the Percentage of People in the Labor Force in York?
57.5% of People are in the Labor Force in York.
What is the Unemployment Rate in York?
Unemployment Rate in York is 8.2%.