Woodville, AL Map & Demographics
Woodville Map
Woodville Overview
$24,966
PER CAPITA INCOME
$70,417
AVG FAMILY INCOME
$53,542
AVG HOUSEHOLD INCOME
39.6%
WAGE / INCOME GAP [ % ]
60.4¢/ $1
WAGE / INCOME GAP [ $ ]
0.41
INEQUALITY / GINI INDEX
1,053
TOTAL POPULATION
445
MALE POPULATION
608
FEMALE POPULATION
73.19
MALES / 100 FEMALES
136.63
FEMALES / 100 MALES
42.1
MEDIAN AGE
3.6
AVG FAMILY SIZE
2.7
AVG HOUSEHOLD SIZE
439
LABOR FORCE [ PEOPLE ]
51.8%
PERCENT IN LABOR FORCE
10.9%
UNEMPLOYMENT RATE
Woodville Zip Codes
Income in Woodville
Income Overview in Woodville
Per Capita Income in Woodville is $24,966, while median incomes of families and households are $70,417 and $53,542 respectively.
| Characteristic | Number | Measure |
| Per Capita Income | 1,053 | $24,966 |
| Median Family Income | 247 | $70,417 |
| Mean Family Income | 247 | $79,121 |
| Median Household Income | 386 | $53,542 |
| Mean Household Income | 386 | $65,059 |
| Income Deficit | 247 | $0 |
| Wage / Income Gap (%) | 1,053 | 39.61% |
| Wage / Income Gap ($) | 1,053 | 60.39¢ per $1 |
| Gini / Inequality Index | 1,053 | 0.41 |
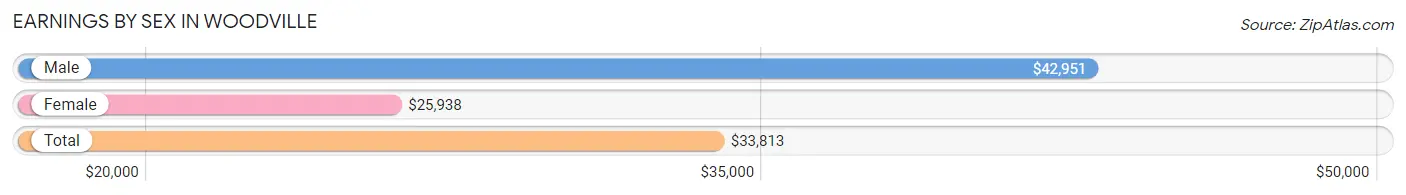
Earnings by Sex in Woodville
Average Earnings in Woodville are $33,813, $42,951 for men and $25,938 for women, a difference of 39.6%.
| Sex | Number | Average Earnings |
| Male | 231 (54.0%) | $42,951 |
| Female | 197 (46.0%) | $25,938 |
| Total | 428 (100.0%) | $33,813 |
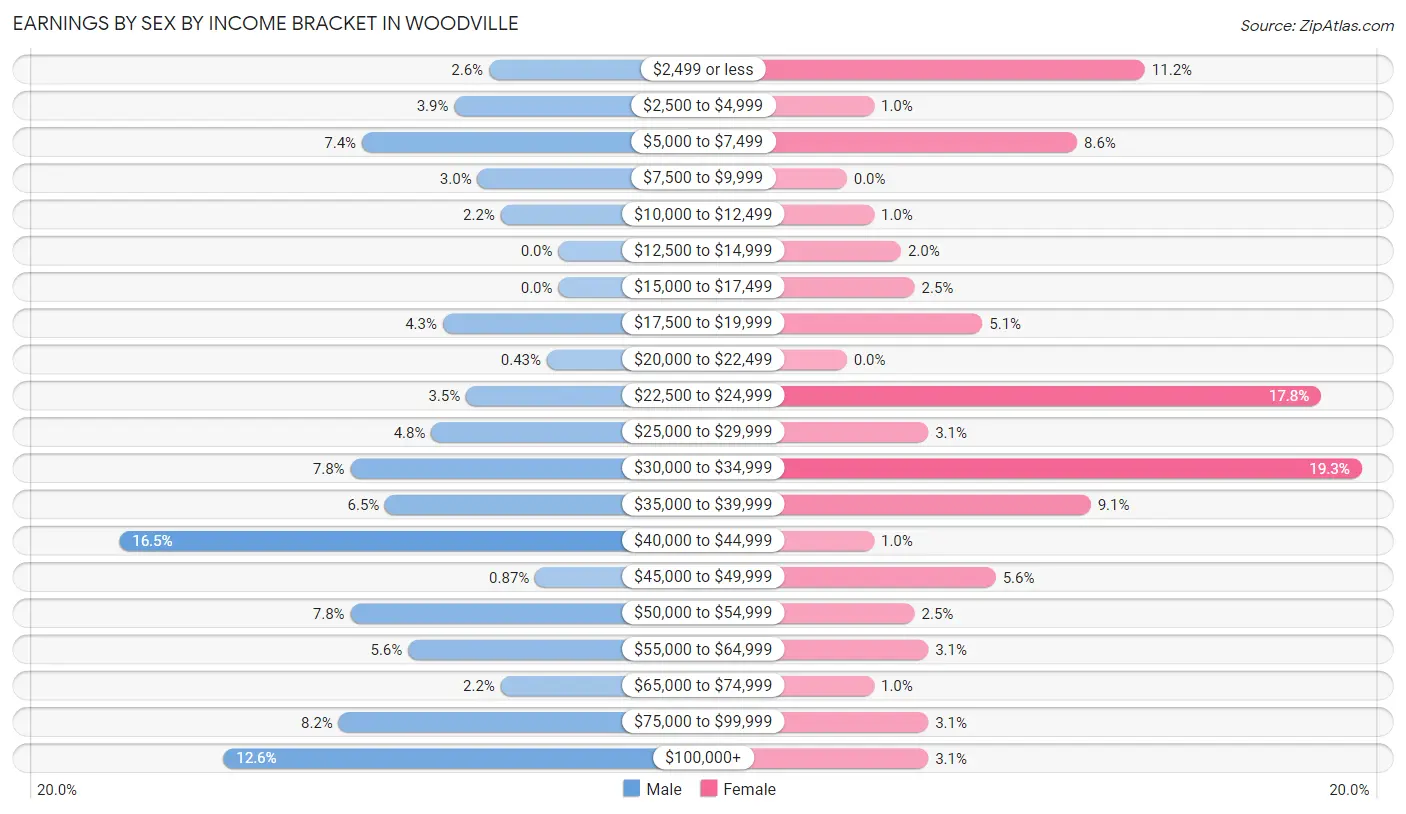
Earnings by Sex by Income Bracket in Woodville
The most common earnings brackets in Woodville are $40,000 to $44,999 for men (38 | 16.5%) and $30,000 to $34,999 for women (38 | 19.3%).
| Income | Male | Female |
| $2,499 or less | 6 (2.6%) | 22 (11.2%) |
| $2,500 to $4,999 | 9 (3.9%) | 2 (1.0%) |
| $5,000 to $7,499 | 17 (7.4%) | 17 (8.6%) |
| $7,500 to $9,999 | 7 (3.0%) | 0 (0.0%) |
| $10,000 to $12,499 | 5 (2.2%) | 2 (1.0%) |
| $12,500 to $14,999 | 0 (0.0%) | 4 (2.0%) |
| $15,000 to $17,499 | 0 (0.0%) | 5 (2.5%) |
| $17,500 to $19,999 | 10 (4.3%) | 10 (5.1%) |
| $20,000 to $22,499 | 1 (0.4%) | 0 (0.0%) |
| $22,500 to $24,999 | 8 (3.5%) | 35 (17.8%) |
| $25,000 to $29,999 | 11 (4.8%) | 6 (3.0%) |
| $30,000 to $34,999 | 18 (7.8%) | 38 (19.3%) |
| $35,000 to $39,999 | 15 (6.5%) | 18 (9.1%) |
| $40,000 to $44,999 | 38 (16.5%) | 2 (1.0%) |
| $45,000 to $49,999 | 2 (0.9%) | 11 (5.6%) |
| $50,000 to $54,999 | 18 (7.8%) | 5 (2.5%) |
| $55,000 to $64,999 | 13 (5.6%) | 6 (3.0%) |
| $65,000 to $74,999 | 5 (2.2%) | 2 (1.0%) |
| $75,000 to $99,999 | 19 (8.2%) | 6 (3.0%) |
| $100,000+ | 29 (12.6%) | 6 (3.0%) |
| Total | 231 (100.0%) | 197 (100.0%) |
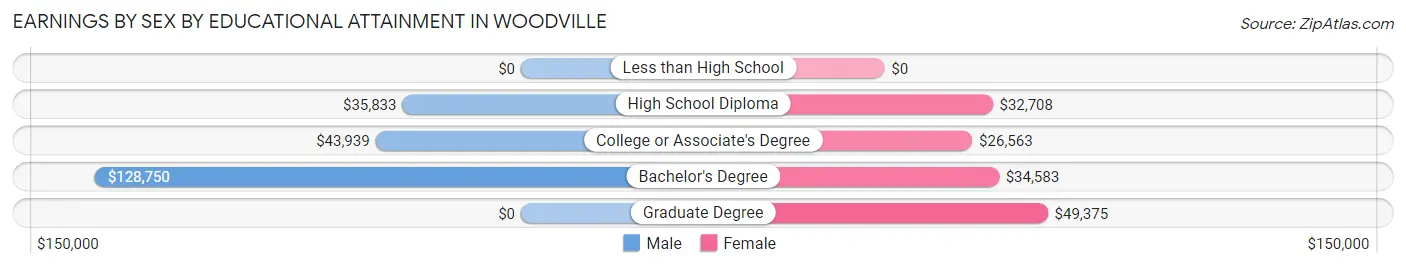
Earnings by Sex by Educational Attainment in Woodville
Average earnings in Woodville are $43,854 for men and $33,021 for women, a difference of 24.7%. Men with an educational attainment of bachelor's degree enjoy the highest average annual earnings of $128,750, while those with high school diploma education earn the least with $35,833. Women with an educational attainment of graduate degree earn the most with the average annual earnings of $49,375, while those with college or associate's degree education have the smallest earnings of $26,563.
| Educational Attainment | Male Income | Female Income |
| Less than High School | - | - |
| High School Diploma | $35,833 | $32,708 |
| College or Associate's Degree | $43,939 | $26,563 |
| Bachelor's Degree | $128,750 | $34,583 |
| Graduate Degree | - | - |
| Total | $43,854 | $33,021 |
Family Income in Woodville
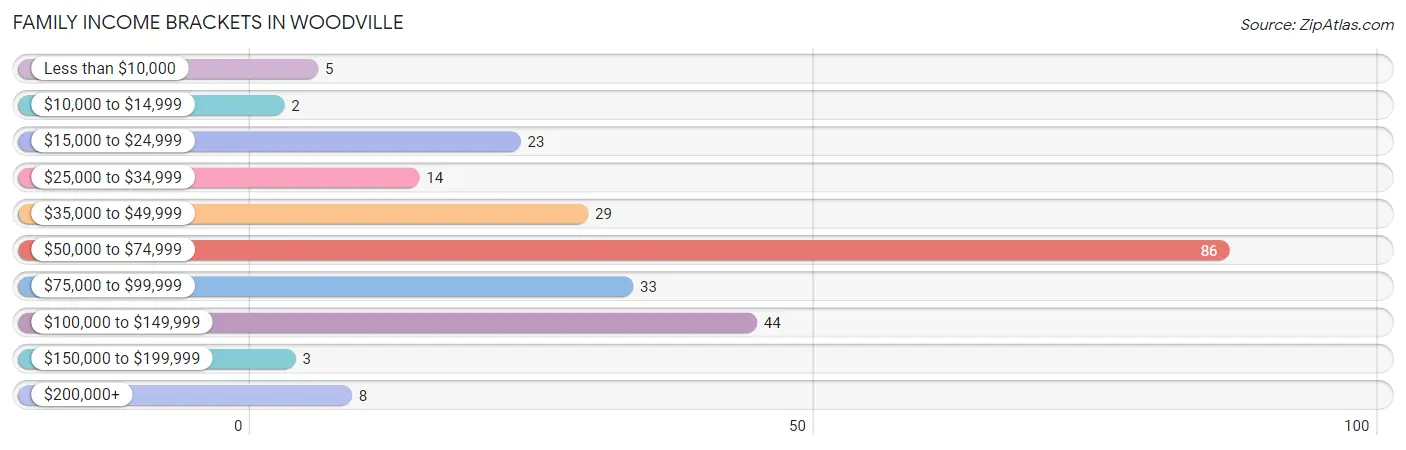
Family Income Brackets in Woodville
According to the Woodville family income data, there are 86 families falling into the $50,000 to $74,999 income range, which is the most common income bracket and makes up 34.8% of all families. Conversely, the $10,000 to $14,999 income bracket is the least frequent group with only 2 families (0.8%) belonging to this category.
| Income Bracket | # Families | % Families |
| Less than $10,000 | 5 | 2.0% |
| $10,000 to $14,999 | 2 | 0.8% |
| $15,000 to $24,999 | 23 | 9.3% |
| $25,000 to $34,999 | 14 | 5.7% |
| $35,000 to $49,999 | 29 | 11.7% |
| $50,000 to $74,999 | 86 | 34.8% |
| $75,000 to $99,999 | 33 | 13.4% |
| $100,000 to $149,999 | 44 | 17.8% |
| $150,000 to $199,999 | 3 | 1.2% |
| $200,000+ | 8 | 3.2% |
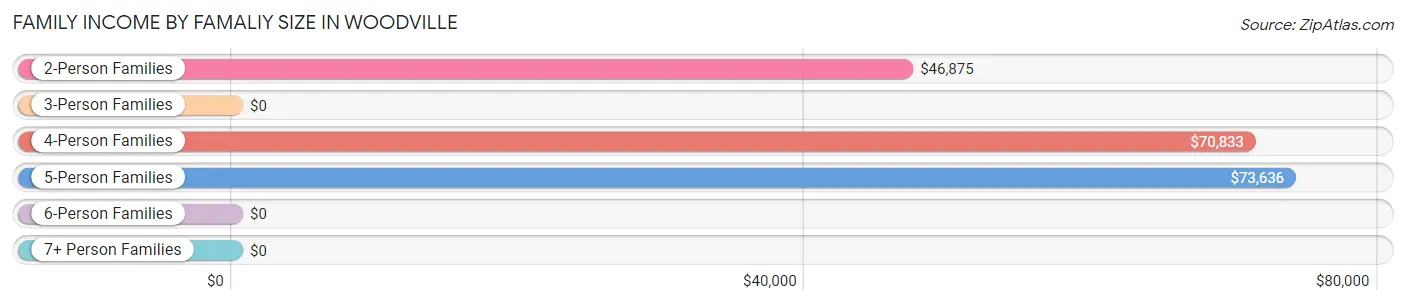
Family Income by Famaliy Size in Woodville
5-person families (50 | 20.2%) account for the highest median family income in Woodville with $73,636 per family, while 2-person families (76 | 30.8%) have the highest median income of $23,438 per family member.
| Income Bracket | # Families | Median Income |
| 2-Person Families | 76 (30.8%) | $46,875 |
| 3-Person Families | 91 (36.8%) | $0 |
| 4-Person Families | 16 (6.5%) | $70,833 |
| 5-Person Families | 50 (20.2%) | $73,636 |
| 6-Person Families | 12 (4.9%) | $0 |
| 7+ Person Families | 2 (0.8%) | $0 |
| Total | 247 (100.0%) | $70,417 |
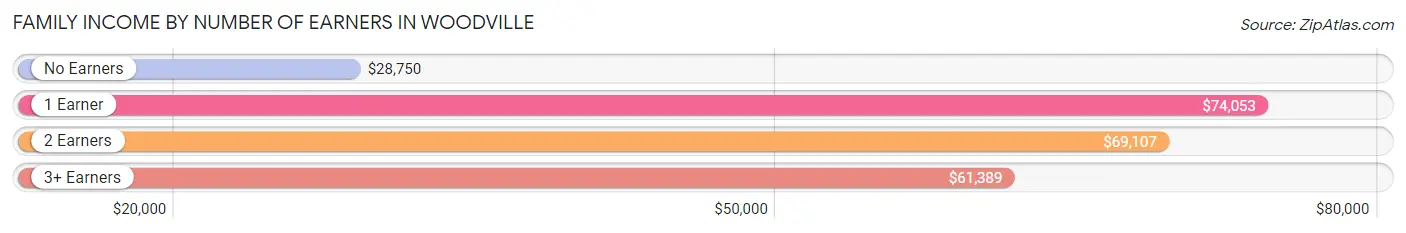
Family Income by Number of Earners in Woodville
The median family income in Woodville is $70,417, with families comprising 1 earner (117) having the highest median family income of $74,053, while families with no earners (26) have the lowest median family income of $28,750, accounting for 47.4% and 10.5% of families, respectively.
| Number of Earners | # Families | Median Income |
| No Earners | 26 (10.5%) | $28,750 |
| 1 Earner | 117 (47.4%) | $74,053 |
| 2 Earners | 82 (33.2%) | $69,107 |
| 3+ Earners | 22 (8.9%) | $61,389 |
| Total | 247 (100.0%) | $70,417 |
Household Income in Woodville
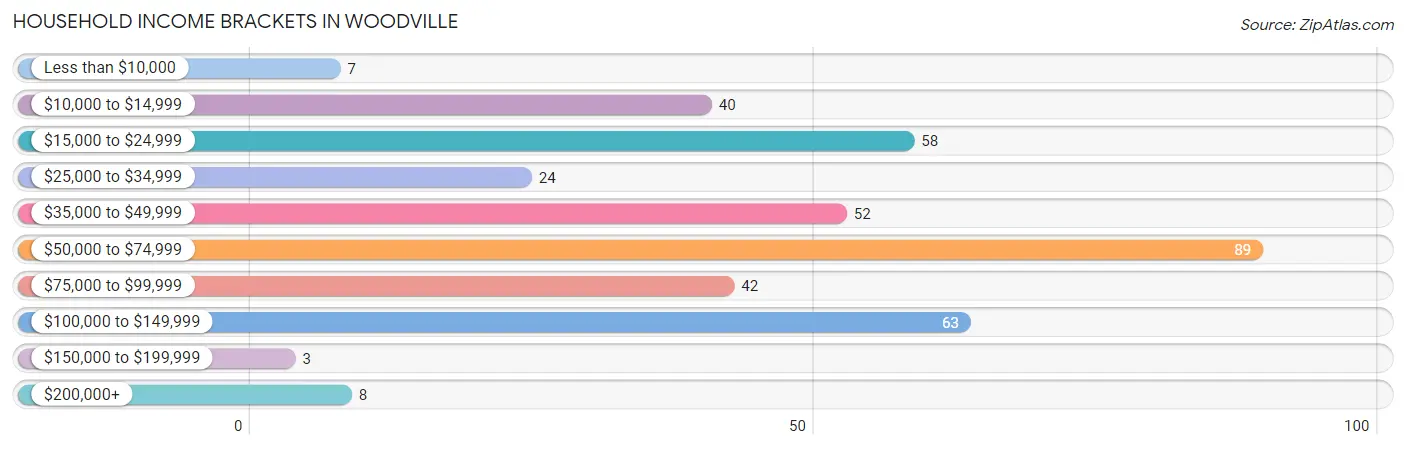
Household Income Brackets in Woodville
With 89 households falling in the category, the $50,000 to $74,999 income range is the most frequent in Woodville, accounting for 23.1% of all households. In contrast, only 3 households (0.8%) fall into the $150,000 to $199,999 income bracket, making it the least populous group.
| Income Bracket | # Households | % Households |
| Less than $10,000 | 7 | 1.8% |
| $10,000 to $14,999 | 40 | 10.4% |
| $15,000 to $24,999 | 58 | 15.0% |
| $25,000 to $34,999 | 24 | 6.2% |
| $35,000 to $49,999 | 52 | 13.5% |
| $50,000 to $74,999 | 89 | 23.1% |
| $75,000 to $99,999 | 42 | 10.9% |
| $100,000 to $149,999 | 63 | 16.3% |
| $150,000 to $199,999 | 3 | 0.8% |
| $200,000+ | 8 | 2.1% |
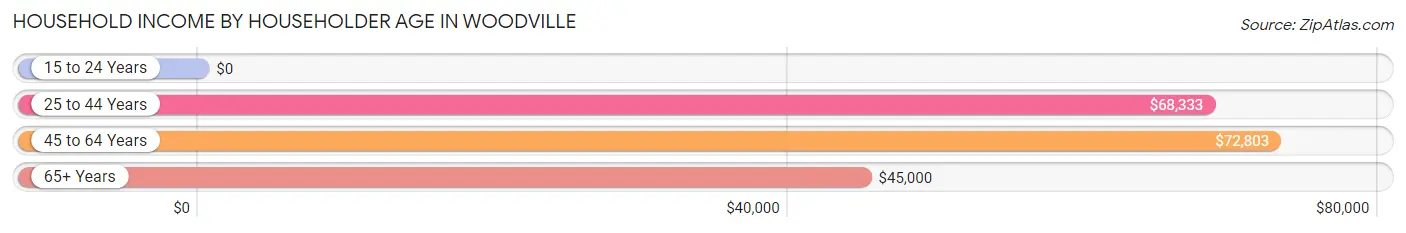
Household Income by Householder Age in Woodville
The median household income in Woodville is $53,542, with the highest median household income of $72,803 found in the 45 to 64 years age bracket for the primary householder. A total of 140 households (36.3%) fall into this category.
| Income Bracket | # Households | Median Income |
| 15 to 24 Years | 0 (0.0%) | $0 |
| 25 to 44 Years | 146 (37.8%) | $68,333 |
| 45 to 64 Years | 140 (36.3%) | $72,803 |
| 65+ Years | 100 (25.9%) | $45,000 |
| Total | 386 (100.0%) | $53,542 |
Poverty in Woodville
Income Below Poverty by Sex and Age in Woodville
With 9.7% poverty level for males and 8.5% for females among the residents of Woodville, 55 to 64 year old males and 75 year old and over females are the most vulnerable to poverty, with 17 males (28.8%) and 12 females (52.2%) in their respective age groups living below the poverty level.
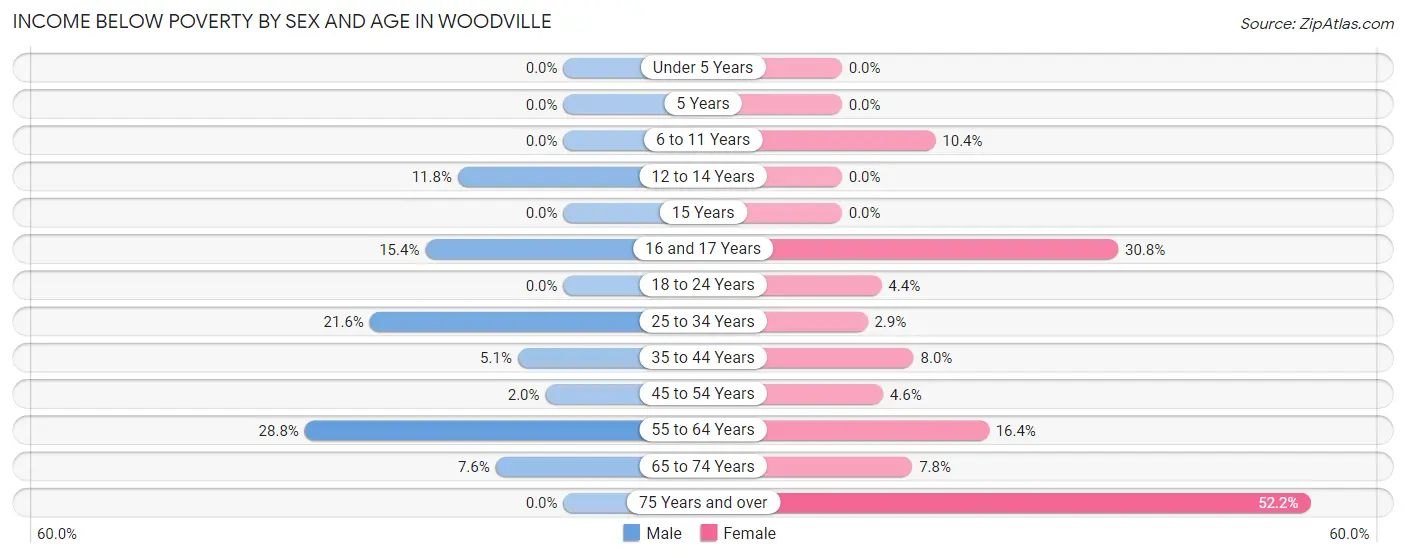
| Age Bracket | Male | Female |
| Under 5 Years | 0 (0.0%) | 0 (0.0%) |
| 5 Years | 0 (0.0%) | 0 (0.0%) |
| 6 to 11 Years | 0 (0.0%) | 5 (10.4%) |
| 12 to 14 Years | 4 (11.8%) | 0 (0.0%) |
| 15 Years | 0 (0.0%) | 0 (0.0%) |
| 16 and 17 Years | 2 (15.4%) | 4 (30.8%) |
| 18 to 24 Years | 0 (0.0%) | 3 (4.4%) |
| 25 to 34 Years | 11 (21.6%) | 2 (2.9%) |
| 35 to 44 Years | 3 (5.1%) | 6 (8.0%) |
| 45 to 54 Years | 2 (2.0%) | 6 (4.6%) |
| 55 to 64 Years | 17 (28.8%) | 9 (16.4%) |
| 65 to 74 Years | 4 (7.5%) | 4 (7.8%) |
| 75 Years and over | 0 (0.0%) | 12 (52.2%) |
| Total | 43 (9.7%) | 51 (8.5%) |
Income Above Poverty by Sex and Age in Woodville
According to the poverty statistics in Woodville, males aged under 5 years and females aged under 5 years are the age groups that are most secure financially, with 100.0% of males and 100.0% of females in these age groups living above the poverty line.
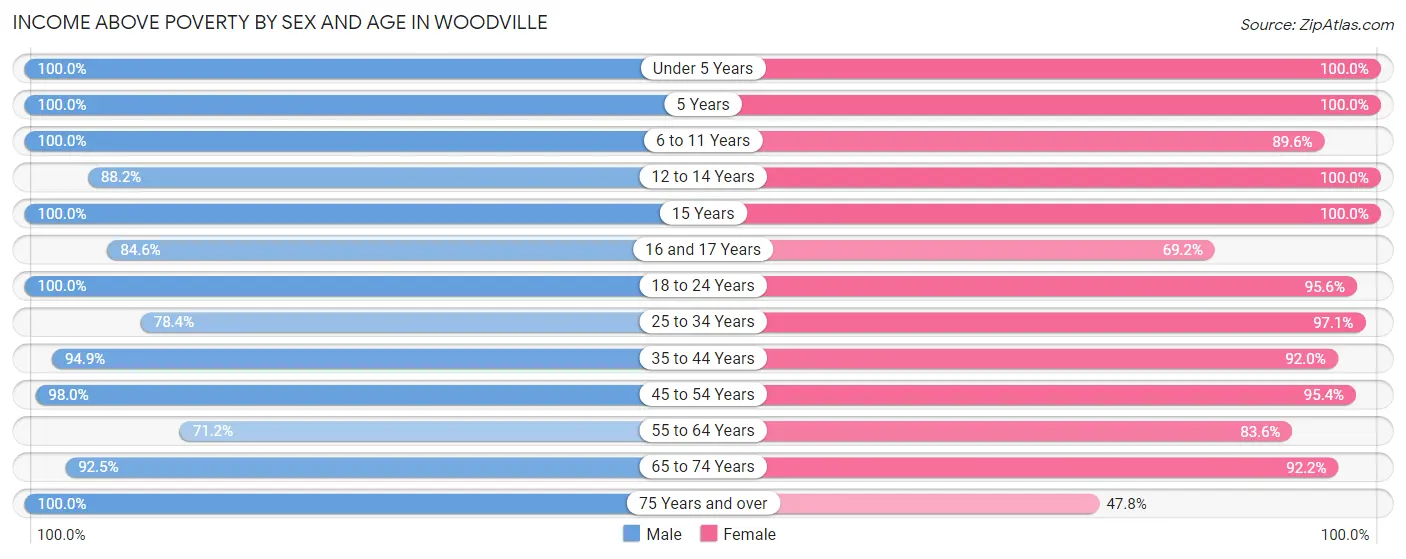
| Age Bracket | Male | Female |
| Under 5 Years | 5 (100.0%) | 16 (100.0%) |
| 5 Years | 5 (100.0%) | 4 (100.0%) |
| 6 to 11 Years | 33 (100.0%) | 43 (89.6%) |
| 12 to 14 Years | 30 (88.2%) | 15 (100.0%) |
| 15 Years | 6 (100.0%) | 31 (100.0%) |
| 16 and 17 Years | 11 (84.6%) | 9 (69.2%) |
| 18 to 24 Years | 17 (100.0%) | 65 (95.6%) |
| 25 to 34 Years | 40 (78.4%) | 68 (97.1%) |
| 35 to 44 Years | 56 (94.9%) | 69 (92.0%) |
| 45 to 54 Years | 98 (98.0%) | 125 (95.4%) |
| 55 to 64 Years | 42 (71.2%) | 46 (83.6%) |
| 65 to 74 Years | 49 (92.4%) | 47 (92.2%) |
| 75 Years and over | 10 (100.0%) | 11 (47.8%) |
| Total | 402 (90.3%) | 549 (91.5%) |
Income Below Poverty Among Married-Couple Families in Woodville
The poverty statistics for married-couple families in Woodville show that 3.2% or 6 of the total 187 families live below the poverty line. Families with no children have the highest poverty rate of 7.9%, comprising of 6 families. On the other hand, families with 1 or 2 children have the lowest poverty rate of 0.0%, which includes 0 families.
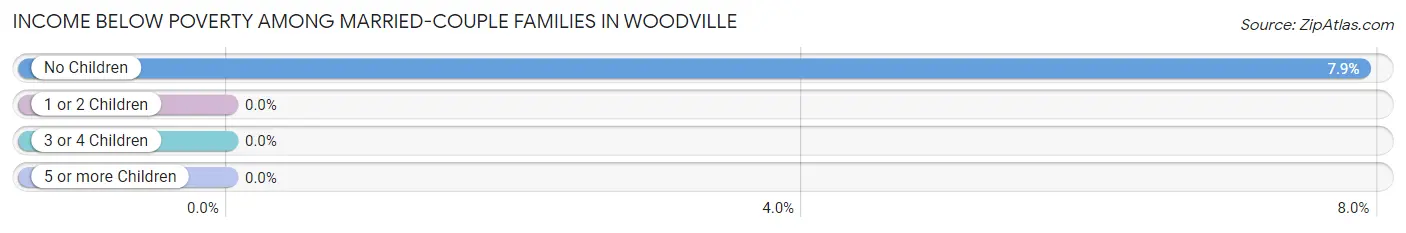
| Children | Above Poverty | Below Poverty |
| No Children | 70 (92.1%) | 6 (7.9%) |
| 1 or 2 Children | 93 (100.0%) | 0 (0.0%) |
| 3 or 4 Children | 16 (100.0%) | 0 (0.0%) |
| 5 or more Children | 2 (100.0%) | 0 (0.0%) |
| Total | 181 (96.8%) | 6 (3.2%) |
Income Below Poverty Among Single-Parent Households in Woodville
According to the poverty data in Woodville, 18.2% or 2 single-father households and 12.2% or 6 single-mother households are living below the poverty line. Among single-father households, those with 1 or 2 children have the highest poverty rate, with 2 households (33.3%) experiencing poverty. Likewise, among single-mother households, those with 3 or 4 children have the highest poverty rate, with 3 households (100.0%) falling below the poverty line.
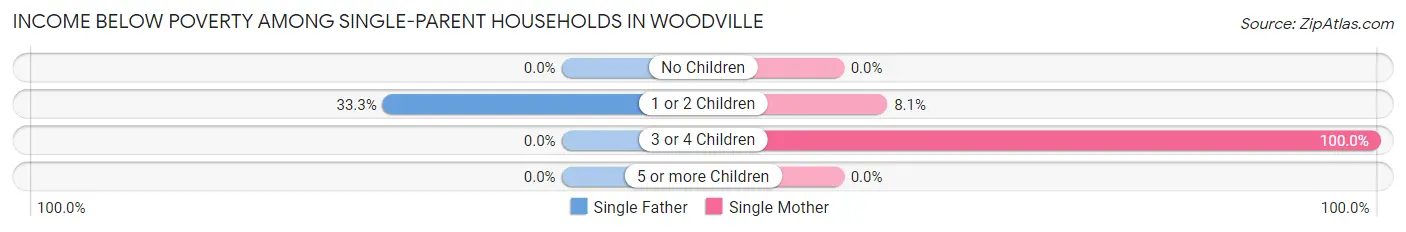
| Children | Single Father | Single Mother |
| No Children | 0 (0.0%) | 0 (0.0%) |
| 1 or 2 Children | 2 (33.3%) | 3 (8.1%) |
| 3 or 4 Children | 0 (0.0%) | 3 (100.0%) |
| 5 or more Children | 0 (0.0%) | 0 (0.0%) |
| Total | 2 (18.2%) | 6 (12.2%) |
Income Below Poverty Among Married-Couple vs Single-Parent Households in Woodville
The poverty data for Woodville shows that 6 of the married-couple family households (3.2%) and 8 of the single-parent households (13.3%) are living below the poverty level. Within the married-couple family households, those with no children have the highest poverty rate, with 6 households (7.9%) falling below the poverty line. Among the single-parent households, those with 3 or 4 children have the highest poverty rate, with 3 household (100.0%) living below poverty.
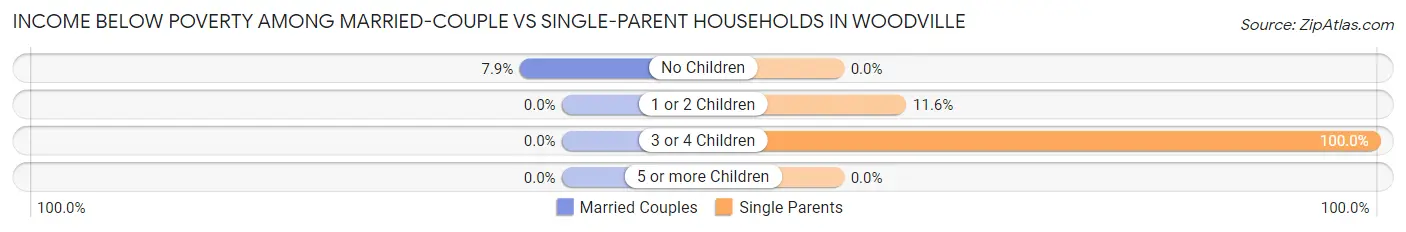
| Children | Married-Couple Families | Single-Parent Households |
| No Children | 6 (7.9%) | 0 (0.0%) |
| 1 or 2 Children | 0 (0.0%) | 5 (11.6%) |
| 3 or 4 Children | 0 (0.0%) | 3 (100.0%) |
| 5 or more Children | 0 (0.0%) | 0 (0.0%) |
| Total | 6 (3.2%) | 8 (13.3%) |
Race in Woodville
The most populous races in Woodville are White / Caucasian (1,018 | 96.7%), Two or more Races (16 | 1.5%), and Native / Alaskan (11 | 1.0%).
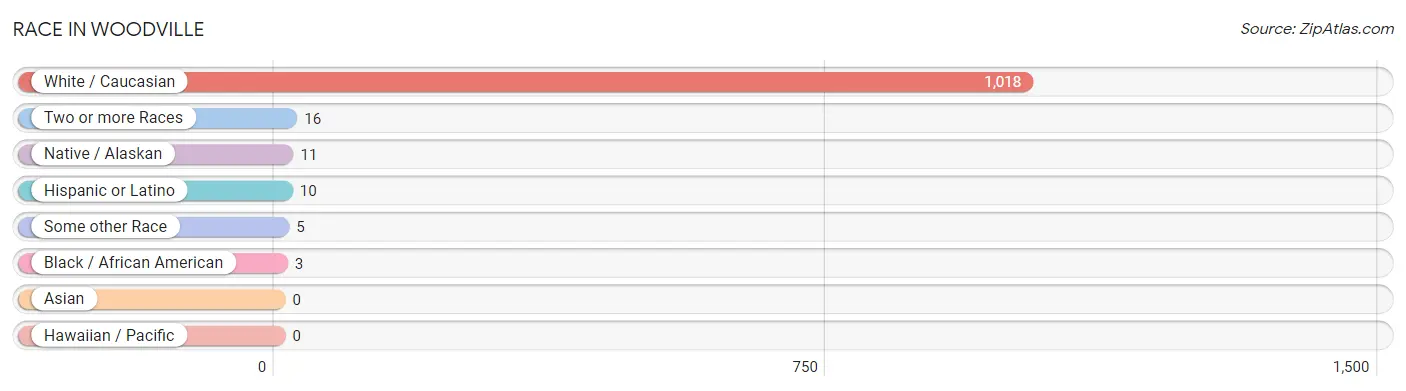
| Race | # Population | % Population |
| Asian | 0 | 0.0% |
| Black / African American | 3 | 0.3% |
| Hawaiian / Pacific | 0 | 0.0% |
| Hispanic or Latino | 10 | 0.9% |
| Native / Alaskan | 11 | 1.0% |
| White / Caucasian | 1,018 | 96.7% |
| Two or more Races | 16 | 1.5% |
| Some other Race | 5 | 0.5% |
| Total | 1,053 | 100.0% |
Ancestry in Woodville
The most populous ancestries reported in Woodville are American (129 | 12.2%), Scotch-Irish (120 | 11.4%), Irish (115 | 10.9%), English (109 | 10.3%), and German (88 | 8.4%), together accounting for 53.3% of all Woodville residents.
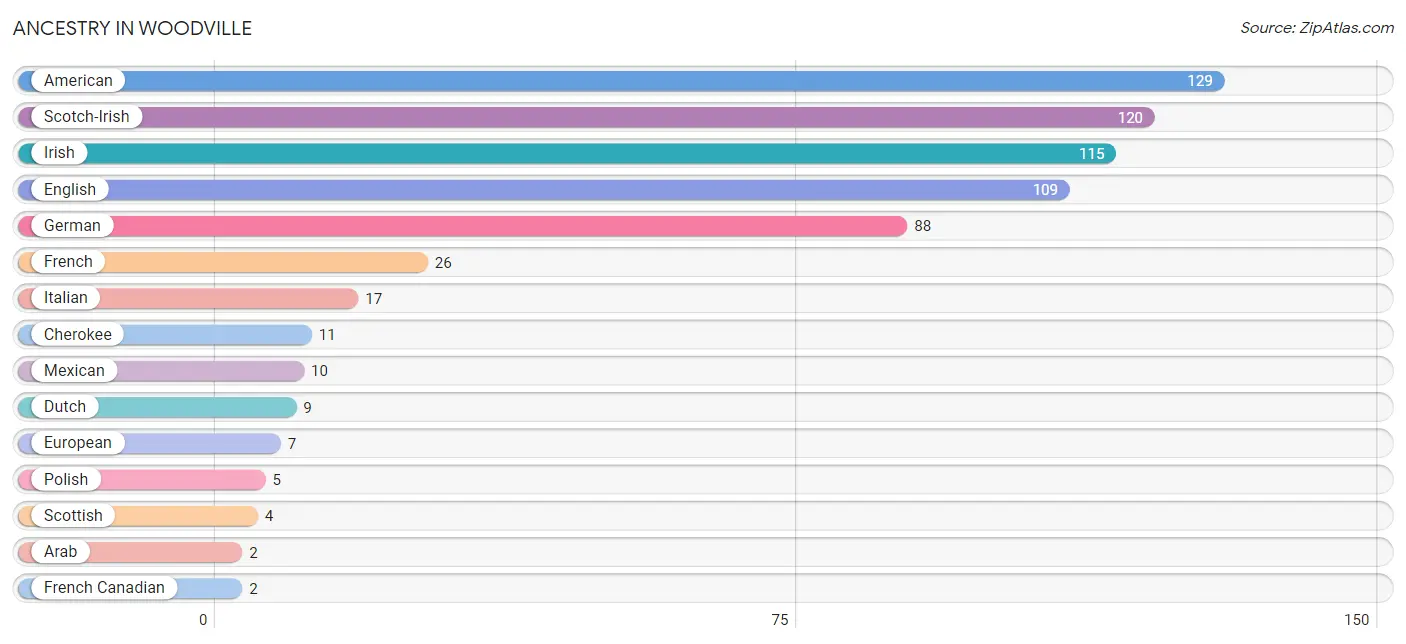
| Ancestry | # Population | % Population |
| American | 129 | 12.2% |
| Arab | 2 | 0.2% |
| Cherokee | 11 | 1.0% |
| Dutch | 9 | 0.9% |
| English | 109 | 10.3% |
| European | 7 | 0.7% |
| French | 26 | 2.5% |
| French Canadian | 2 | 0.2% |
| German | 88 | 8.4% |
| Irish | 115 | 10.9% |
| Italian | 17 | 1.6% |
| Mexican | 10 | 0.9% |
| Norwegian | 2 | 0.2% |
| Polish | 5 | 0.5% |
| Scotch-Irish | 120 | 11.4% |
| Scottish | 4 | 0.4% |
| Welsh | 2 | 0.2% | View All 17 Rows |
Immigrants in Woodville
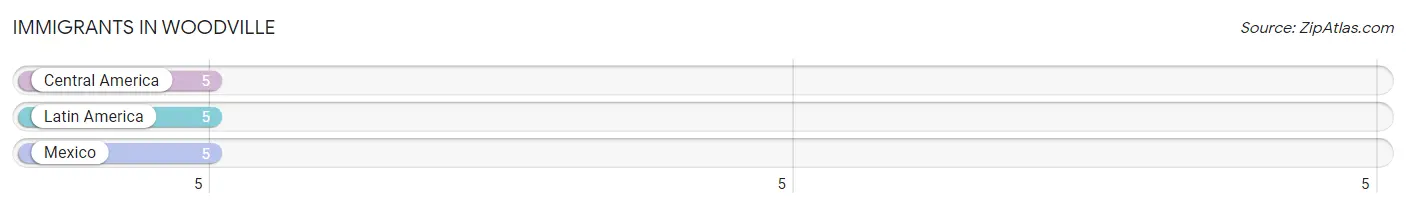
The most numerous immigrant groups reported in Woodville came from Central America (5 | 0.5%), Latin America (5 | 0.5%), and Mexico (5 | 0.5%), together accounting for 1.4% of all Woodville residents.
| Immigration Origin | # Population | % Population |
| Central America | 5 | 0.5% |
| Latin America | 5 | 0.5% |
| Mexico | 5 | 0.5% | View All 3 Rows |
Sex and Age in Woodville
Sex and Age in Woodville
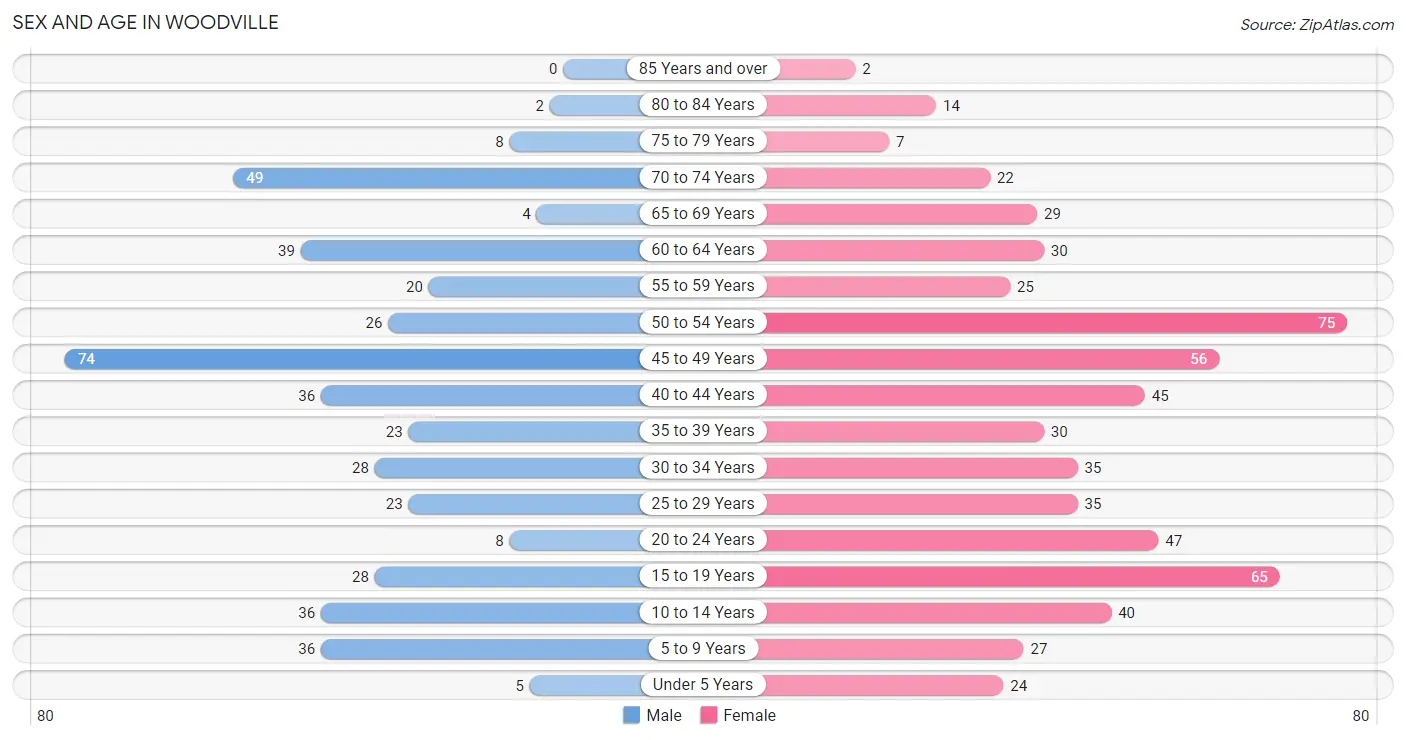
The most populous age groups in Woodville are 45 to 49 Years (74 | 16.6%) for men and 50 to 54 Years (75 | 12.3%) for women.
| Age Bracket | Male | Female |
| Under 5 Years | 5 (1.1%) | 24 (4.0%) |
| 5 to 9 Years | 36 (8.1%) | 27 (4.4%) |
| 10 to 14 Years | 36 (8.1%) | 40 (6.6%) |
| 15 to 19 Years | 28 (6.3%) | 65 (10.7%) |
| 20 to 24 Years | 8 (1.8%) | 47 (7.7%) |
| 25 to 29 Years | 23 (5.2%) | 35 (5.8%) |
| 30 to 34 Years | 28 (6.3%) | 35 (5.8%) |
| 35 to 39 Years | 23 (5.2%) | 30 (4.9%) |
| 40 to 44 Years | 36 (8.1%) | 45 (7.4%) |
| 45 to 49 Years | 74 (16.6%) | 56 (9.2%) |
| 50 to 54 Years | 26 (5.8%) | 75 (12.3%) |
| 55 to 59 Years | 20 (4.5%) | 25 (4.1%) |
| 60 to 64 Years | 39 (8.8%) | 30 (4.9%) |
| 65 to 69 Years | 4 (0.9%) | 29 (4.8%) |
| 70 to 74 Years | 49 (11.0%) | 22 (3.6%) |
| 75 to 79 Years | 8 (1.8%) | 7 (1.1%) |
| 80 to 84 Years | 2 (0.4%) | 14 (2.3%) |
| 85 Years and over | 0 (0.0%) | 2 (0.3%) |
| Total | 445 (100.0%) | 608 (100.0%) |
Families and Households in Woodville
Median Family Size in Woodville
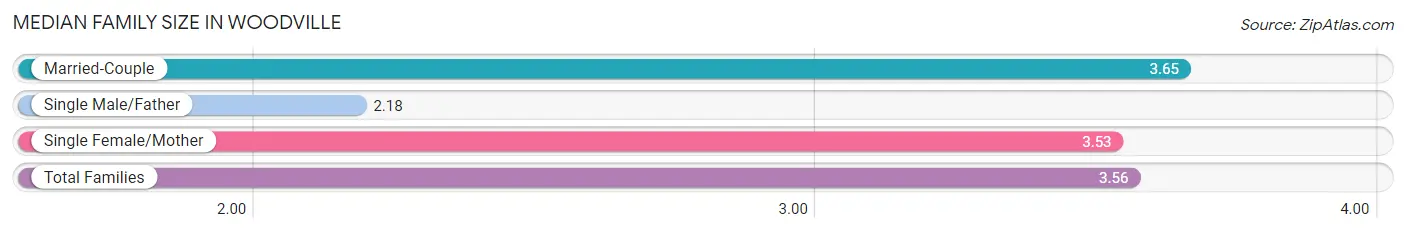
The median family size in Woodville is 3.56 persons per family, with married-couple families (187 | 75.7%) accounting for the largest median family size of 3.65 persons per family. On the other hand, single male/father families (11 | 4.4%) represent the smallest median family size with 2.18 persons per family.
| Family Type | # Families | Family Size |
| Married-Couple | 187 (75.7%) | 3.65 |
| Single Male/Father | 11 (4.4%) | 2.18 |
| Single Female/Mother | 49 (19.8%) | 3.53 |
| Total Families | 247 (100.0%) | 3.56 |
Median Household Size in Woodville
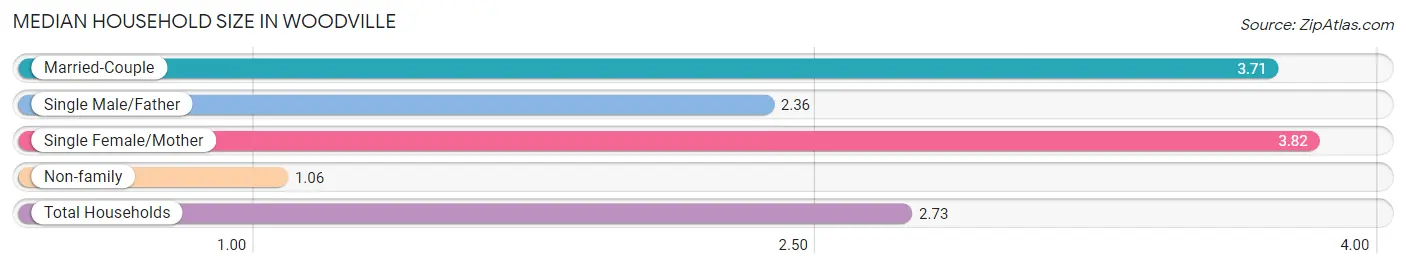
The median household size in Woodville is 2.73 persons per household, with single female/mother households (49 | 12.7%) accounting for the largest median household size of 3.82 persons per household. non-family households (139 | 36.0%) represent the smallest median household size with 1.06 persons per household.
| Household Type | # Households | Household Size |
| Married-Couple | 187 (48.4%) | 3.71 |
| Single Male/Father | 11 (2.9%) | 2.36 |
| Single Female/Mother | 49 (12.7%) | 3.82 |
| Non-family | 139 (36.0%) | 1.06 |
| Total Households | 386 (100.0%) | 2.73 |
Household Size by Marriage Status in Woodville
Out of a total of 386 households in Woodville, 247 (64.0%) are family households, while 139 (36.0%) are nonfamily households. The most numerous type of family households are 3-person households, comprising 90, and the most common type of nonfamily households are 1-person households, comprising 129.
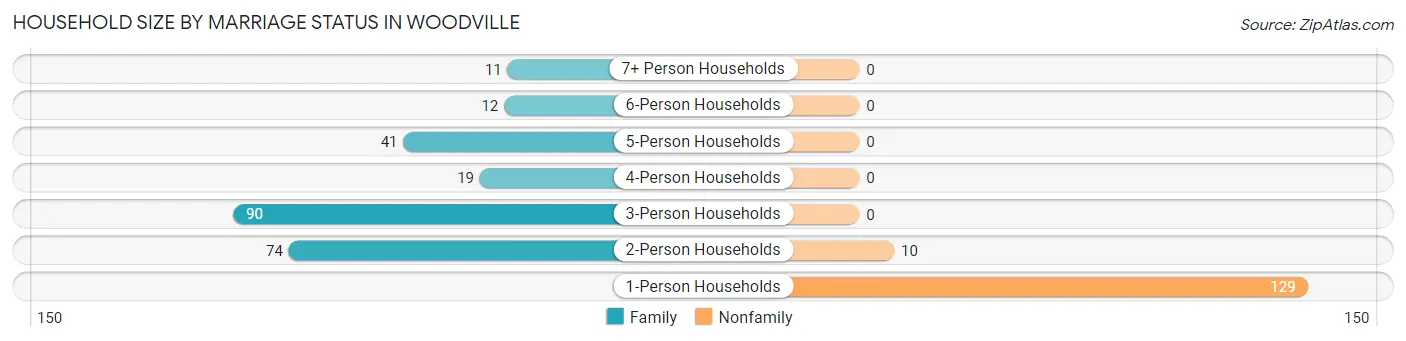
| Household Size | Family Households | Nonfamily Households |
| 1-Person Households | - | 129 (33.4%) |
| 2-Person Households | 74 (19.2%) | 10 (2.6%) |
| 3-Person Households | 90 (23.3%) | 0 (0.0%) |
| 4-Person Households | 19 (4.9%) | 0 (0.0%) |
| 5-Person Households | 41 (10.6%) | 0 (0.0%) |
| 6-Person Households | 12 (3.1%) | 0 (0.0%) |
| 7+ Person Households | 11 (2.9%) | 0 (0.0%) |
| Total | 247 (64.0%) | 139 (36.0%) |
Female Fertility in Woodville
Fertility by Age in Woodville
Average fertility rate in Woodville is 9.0 births per 1,000 women. Women in the age bracket of 35 to 50 years have the highest fertility rate with 22.0 births per 1,000 women. Women in the age bracket of 35 to 50 years acount for 100.0% of all women with births.
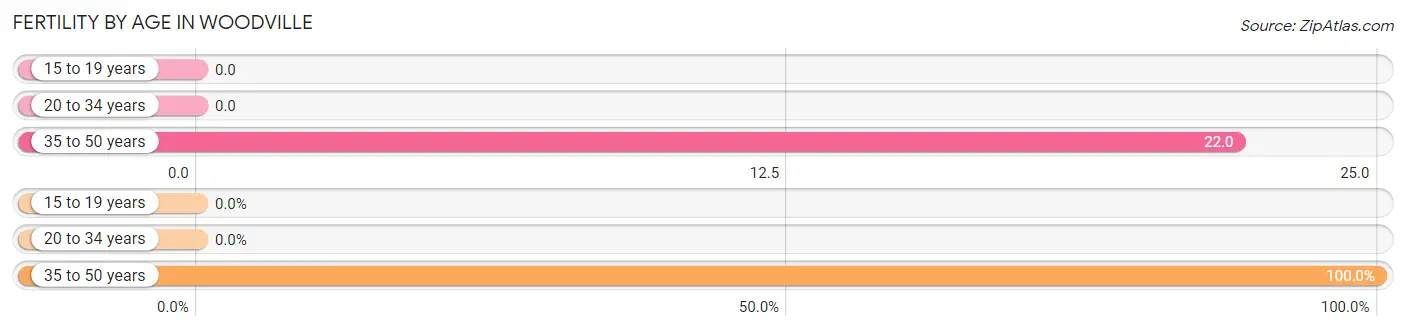
| Age Bracket | Women with Births | Births / 1,000 Women |
| 15 to 19 years | 0 (0.0%) | 0.0 |
| 20 to 34 years | 0 (0.0%) | 0.0 |
| 35 to 50 years | 3 (100.0%) | 22.0 |
| Total | 3 (100.0%) | 9.0 |
Fertility by Age by Marriage Status in Woodville
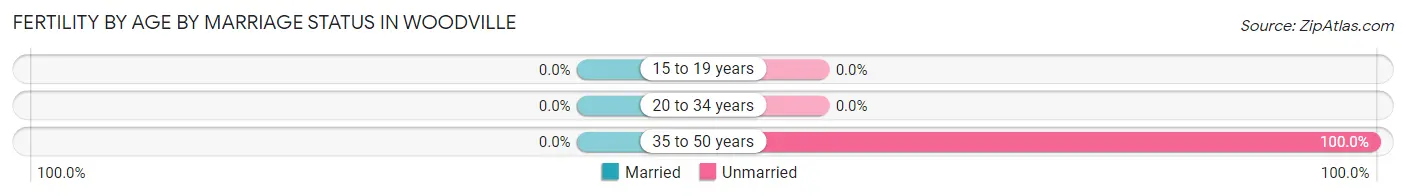
| Age Bracket | Married | Unmarried |
| 15 to 19 years | 0 (0.0%) | 0 (0.0%) |
| 20 to 34 years | 0 (0.0%) | 0 (0.0%) |
| 35 to 50 years | 0 (0.0%) | 3 (100.0%) |
| Total | 0 (0.0%) | 3 (100.0%) |
Fertility by Education in Woodville
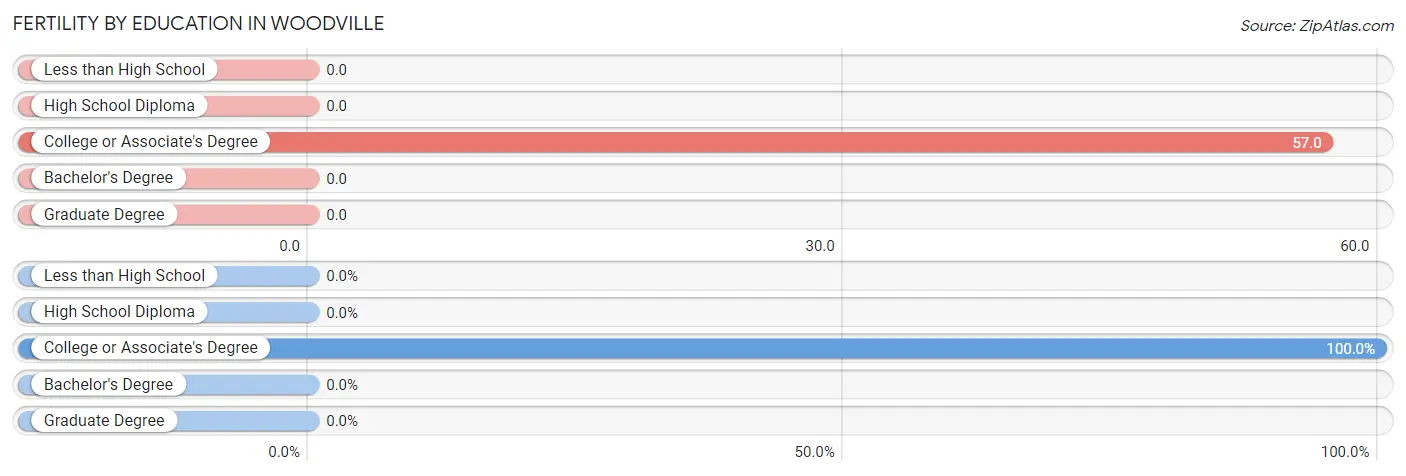
| Educational Attainment | Women with Births | Births / 1,000 Women |
| Less than High School | 0 (0.0%) | 0.0 |
| High School Diploma | 0 (0.0%) | 0.0 |
| College or Associate's Degree | 3 (100.0%) | 57.0 |
| Bachelor's Degree | 0 (0.0%) | 0.0 |
| Graduate Degree | 0 (0.0%) | 0.0 |
| Total | 3 (100.0%) | 9.0 |
Fertility by Education by Marriage Status in Woodville
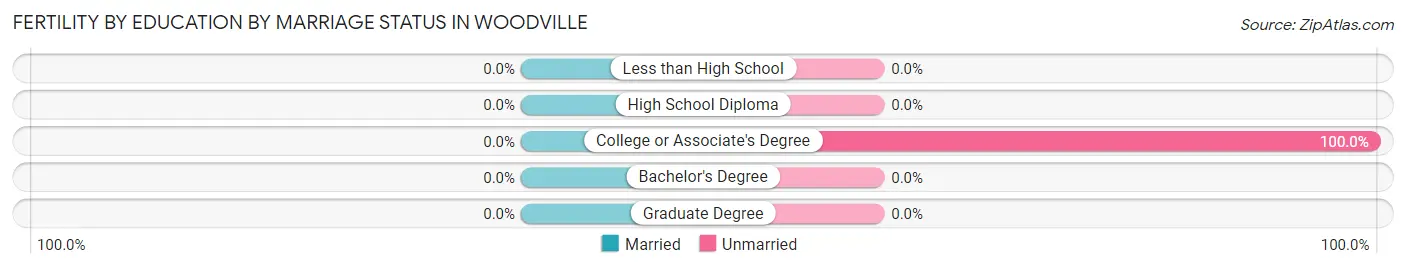
| Educational Attainment | Married | Unmarried |
| Less than High School | 0 (0.0%) | 0 (0.0%) |
| High School Diploma | 0 (0.0%) | 0 (0.0%) |
| College or Associate's Degree | 0 (0.0%) | 3 (100.0%) |
| Bachelor's Degree | 0 (0.0%) | 0 (0.0%) |
| Graduate Degree | 0 (0.0%) | 0 (0.0%) |
| Total | 0 (0.0%) | 3 (100.0%) |
Employment Characteristics in Woodville
Employment by Class of Employer in Woodville
Among the 389 employed individuals in Woodville, private company employees (265 | 68.1%), local government employees (41 | 10.5%), and federal government employees (37 | 9.5%) make up the most common classes of employment.
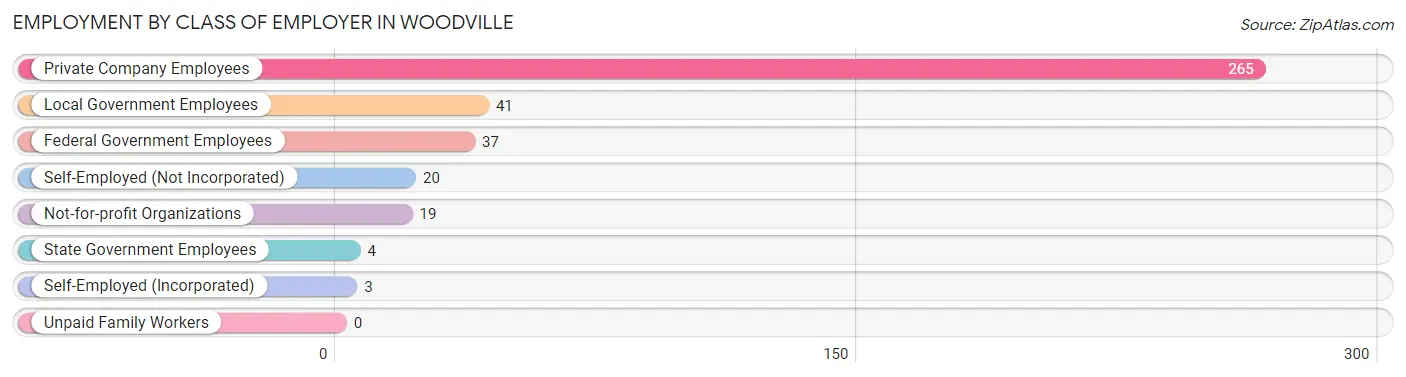
| Employer Class | # Employees | % Employees |
| Private Company Employees | 265 | 68.1% |
| Self-Employed (Incorporated) | 3 | 0.8% |
| Self-Employed (Not Incorporated) | 20 | 5.1% |
| Not-for-profit Organizations | 19 | 4.9% |
| Local Government Employees | 41 | 10.5% |
| State Government Employees | 4 | 1.0% |
| Federal Government Employees | 37 | 9.5% |
| Unpaid Family Workers | 0 | 0.0% |
| Total | 389 | 100.0% |
Employment Status by Age in Woodville
According to the labor force statistics for Woodville, out of the total population over 16 years of age (848), 51.8% or 439 individuals are in the labor force, with 10.9% or 48 of them unemployed. The age group with the highest labor force participation rate is 25 to 29 years, with 93.1% or 54 individuals in the labor force. Within the labor force, the 25 to 29 years age range has the highest percentage of unemployed individuals, with 55.6% or 30 of them being unemployed.
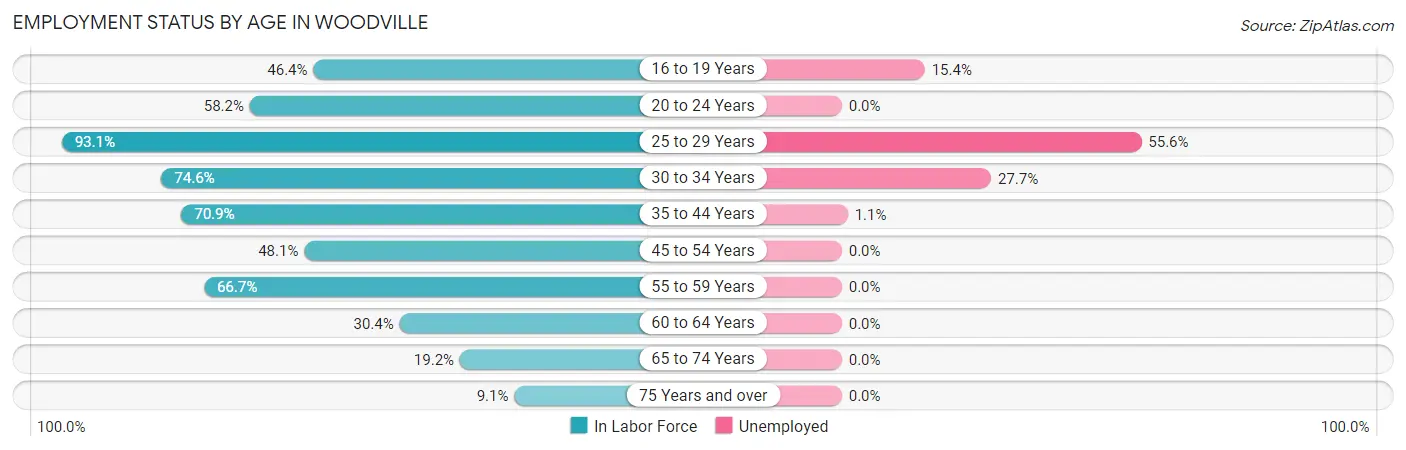
| Age Bracket | In Labor Force | Unemployed |
| 16 to 19 Years | 26 (46.4%) | 4 (15.4%) |
| 20 to 24 Years | 32 (58.2%) | 0 (0.0%) |
| 25 to 29 Years | 54 (93.1%) | 30 (55.6%) |
| 30 to 34 Years | 47 (74.6%) | 13 (27.7%) |
| 35 to 44 Years | 95 (70.9%) | 1 (1.1%) |
| 45 to 54 Years | 111 (48.1%) | 0 (0.0%) |
| 55 to 59 Years | 30 (66.7%) | 0 (0.0%) |
| 60 to 64 Years | 21 (30.4%) | 0 (0.0%) |
| 65 to 74 Years | 20 (19.2%) | 0 (0.0%) |
| 75 Years and over | 3 (9.1%) | 0 (0.0%) |
| Total | 439 (51.8%) | 48 (10.9%) |
Employment Status by Educational Attainment in Woodville
According to labor force statistics for Woodville, 59.7% of individuals (358) out of the total population between 25 and 64 years of age (600) are in the labor force, with 12.3% or 44 of them being unemployed. The group with the highest labor force participation rate are those with the educational attainment of bachelor's degree or higher, with 77.1% or 74 individuals in the labor force. Within the labor force, individuals with high school diploma education have the highest percentage of unemployment, with 18.3% or 26 of them being unemployed.
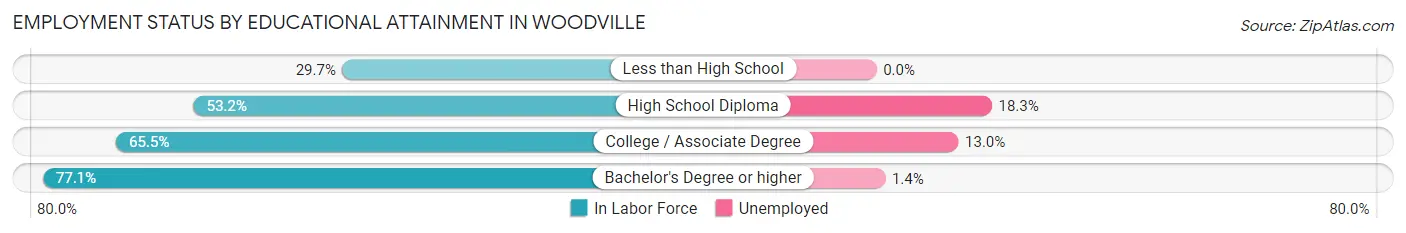
| Educational Attainment | In Labor Force | Unemployed |
| Less than High School | 11 (29.7%) | 0 (0.0%) |
| High School Diploma | 142 (53.2%) | 49 (18.3%) |
| College / Associate Degree | 131 (65.5%) | 26 (13.0%) |
| Bachelor's Degree or higher | 74 (77.1%) | 1 (1.4%) |
| Total | 358 (59.7%) | 74 (12.3%) |
Employment Occupations by Sex in Woodville
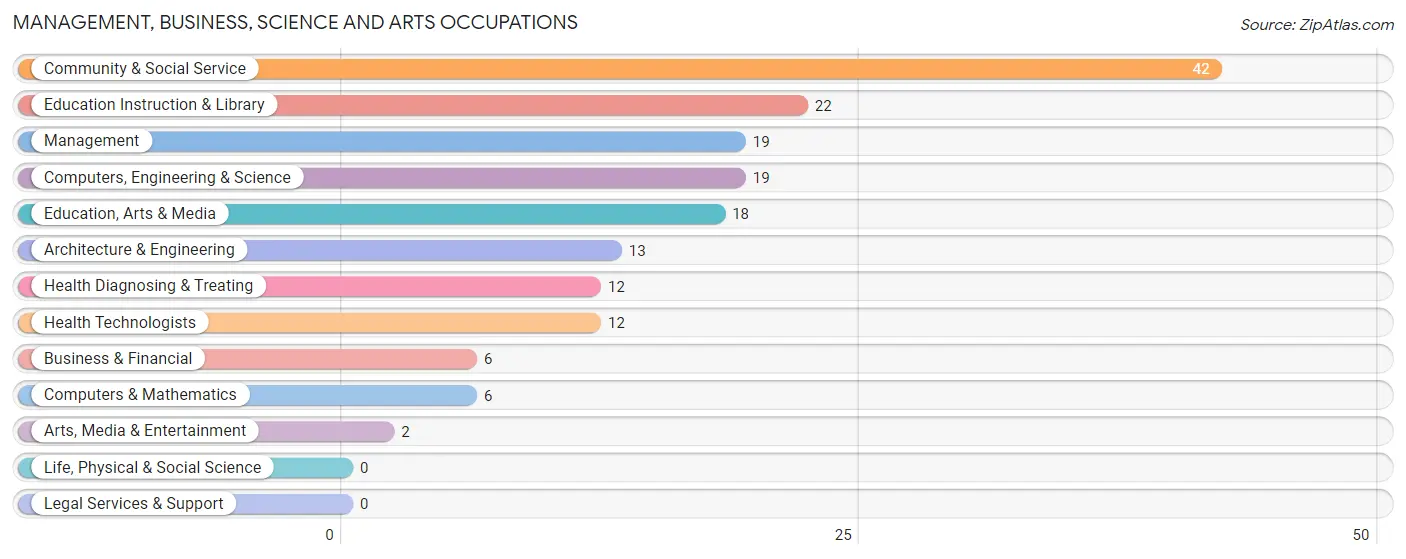
Management, Business, Science and Arts Occupations
The most common Management, Business, Science and Arts occupations in Woodville are Community & Social Service (42 | 10.7%), Education Instruction & Library (22 | 5.6%), Management (19 | 4.9%), Computers, Engineering & Science (19 | 4.9%), and Education, Arts & Media (18 | 4.6%).
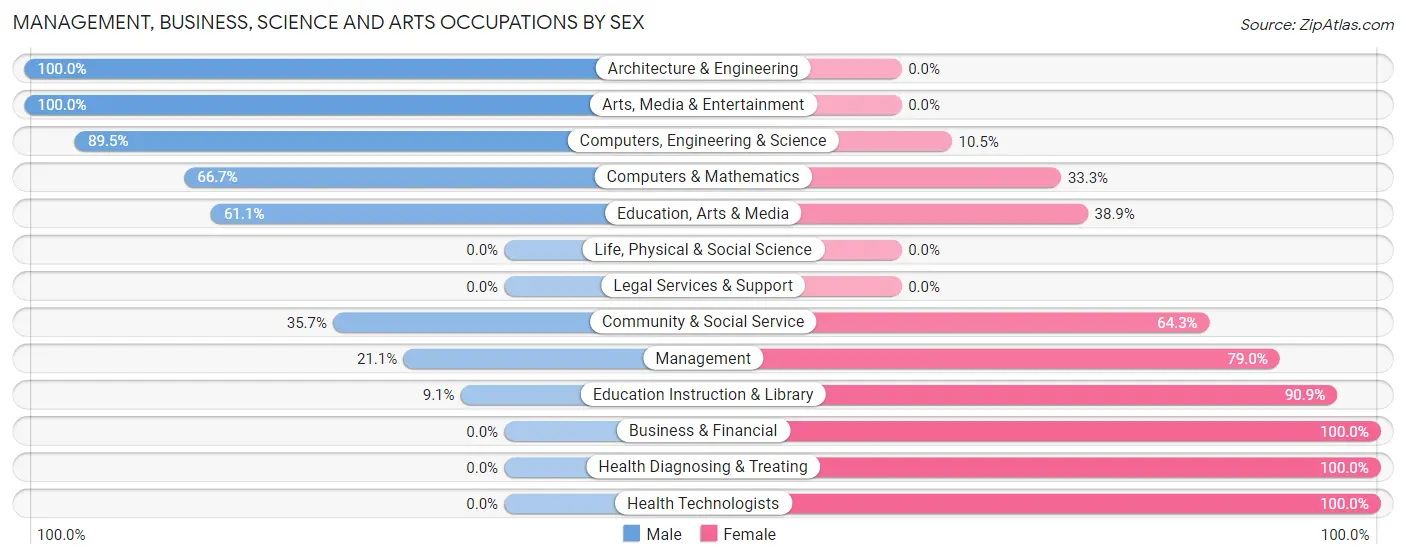
Management, Business, Science and Arts Occupations by Sex
Within the Management, Business, Science and Arts occupations in Woodville, the most male-oriented occupations are Architecture & Engineering (100.0%), Arts, Media & Entertainment (100.0%), and Computers, Engineering & Science (89.5%), while the most female-oriented occupations are Business & Financial (100.0%), Health Diagnosing & Treating (100.0%), and Health Technologists (100.0%).
| Occupation | Male | Female |
| Management | 4 (21.0%) | 15 (78.9%) |
| Business & Financial | 0 (0.0%) | 6 (100.0%) |
| Computers, Engineering & Science | 17 (89.5%) | 2 (10.5%) |
| Computers & Mathematics | 4 (66.7%) | 2 (33.3%) |
| Architecture & Engineering | 13 (100.0%) | 0 (0.0%) |
| Life, Physical & Social Science | 0 (0.0%) | 0 (0.0%) |
| Community & Social Service | 15 (35.7%) | 27 (64.3%) |
| Education, Arts & Media | 11 (61.1%) | 7 (38.9%) |
| Legal Services & Support | 0 (0.0%) | 0 (0.0%) |
| Education Instruction & Library | 2 (9.1%) | 20 (90.9%) |
| Arts, Media & Entertainment | 2 (100.0%) | 0 (0.0%) |
| Health Diagnosing & Treating | 0 (0.0%) | 12 (100.0%) |
| Health Technologists | 0 (0.0%) | 12 (100.0%) |
| Total (Category) | 36 (36.7%) | 62 (63.3%) |
| Total (Overall) | 213 (54.5%) | 178 (45.5%) |
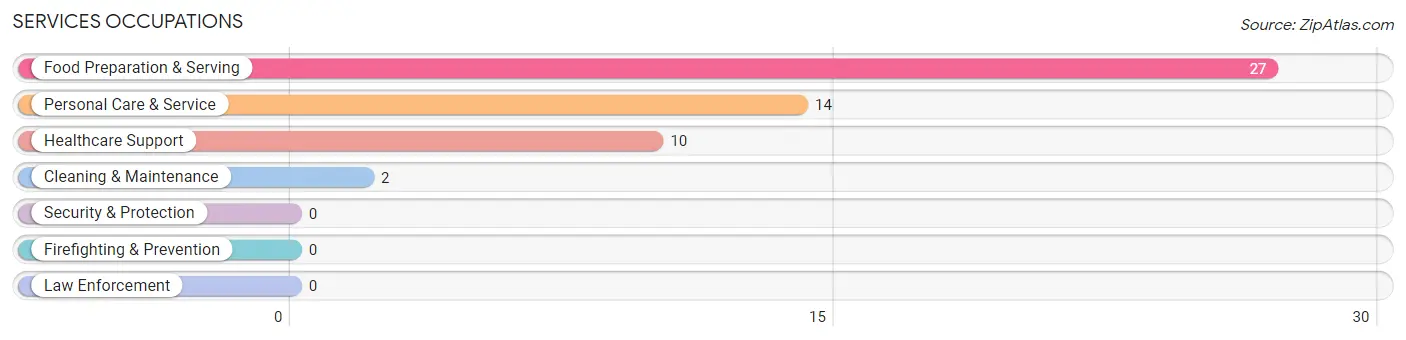
Services Occupations
The most common Services occupations in Woodville are Food Preparation & Serving (27 | 6.9%), Personal Care & Service (14 | 3.6%), Healthcare Support (10 | 2.6%), and Cleaning & Maintenance (2 | 0.5%).
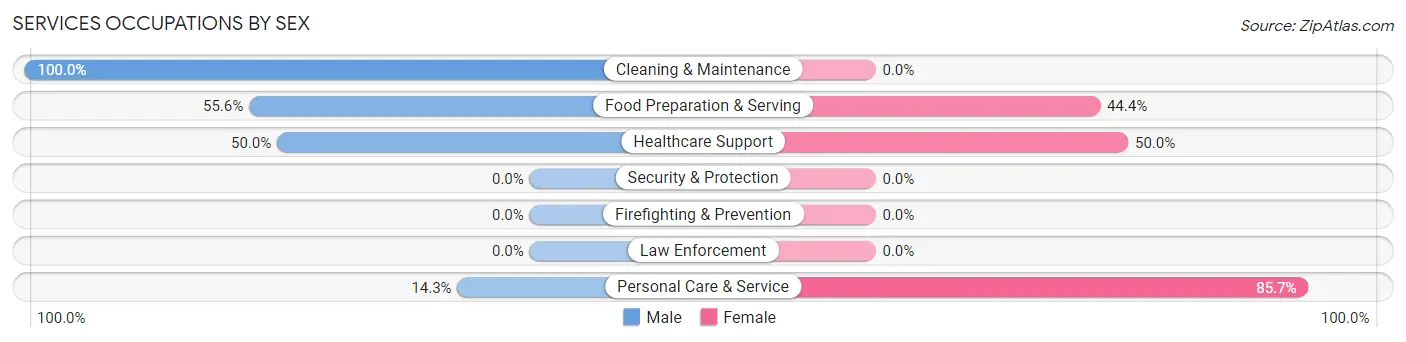
Services Occupations by Sex
Within the Services occupations in Woodville, the most male-oriented occupations are Cleaning & Maintenance (100.0%), Food Preparation & Serving (55.6%), and Healthcare Support (50.0%), while the most female-oriented occupations are Personal Care & Service (85.7%), Healthcare Support (50.0%), and Food Preparation & Serving (44.4%).
| Occupation | Male | Female |
| Healthcare Support | 5 (50.0%) | 5 (50.0%) |
| Security & Protection | 0 (0.0%) | 0 (0.0%) |
| Firefighting & Prevention | 0 (0.0%) | 0 (0.0%) |
| Law Enforcement | 0 (0.0%) | 0 (0.0%) |
| Food Preparation & Serving | 15 (55.6%) | 12 (44.4%) |
| Cleaning & Maintenance | 2 (100.0%) | 0 (0.0%) |
| Personal Care & Service | 2 (14.3%) | 12 (85.7%) |
| Total (Category) | 24 (45.3%) | 29 (54.7%) |
| Total (Overall) | 213 (54.5%) | 178 (45.5%) |
Sales and Office Occupations
The most common Sales and Office occupations in Woodville are Office & Administration (62 | 15.9%), and Sales & Related (10 | 2.6%).
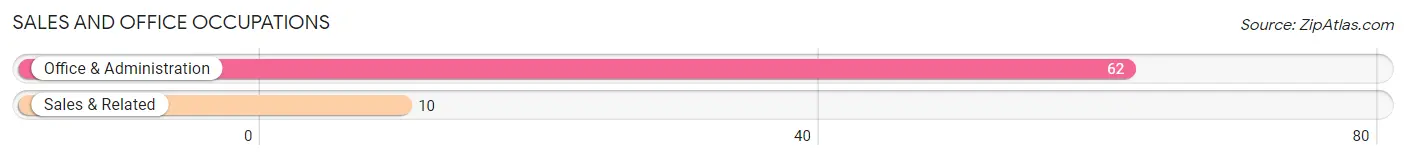
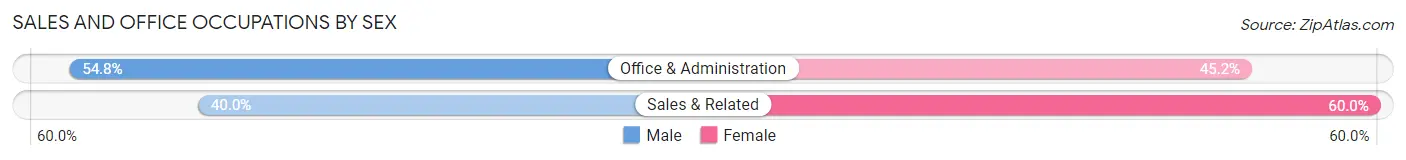
Sales and Office Occupations by Sex
| Occupation | Male | Female |
| Sales & Related | 4 (40.0%) | 6 (60.0%) |
| Office & Administration | 34 (54.8%) | 28 (45.2%) |
| Total (Category) | 38 (52.8%) | 34 (47.2%) |
| Total (Overall) | 213 (54.5%) | 178 (45.5%) |
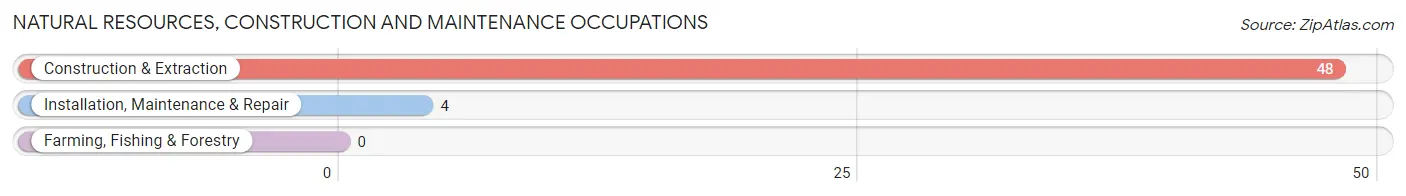
Natural Resources, Construction and Maintenance Occupations
The most common Natural Resources, Construction and Maintenance occupations in Woodville are Construction & Extraction (48 | 12.3%), and Installation, Maintenance & Repair (4 | 1.0%).
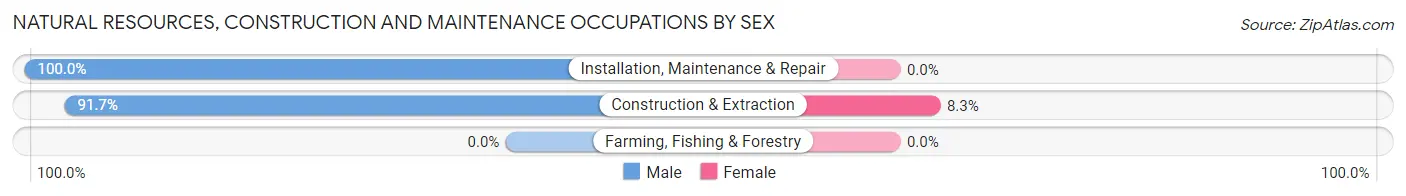
Natural Resources, Construction and Maintenance Occupations by Sex
| Occupation | Male | Female |
| Farming, Fishing & Forestry | 0 (0.0%) | 0 (0.0%) |
| Construction & Extraction | 44 (91.7%) | 4 (8.3%) |
| Installation, Maintenance & Repair | 4 (100.0%) | 0 (0.0%) |
| Total (Category) | 48 (92.3%) | 4 (7.7%) |
| Total (Overall) | 213 (54.5%) | 178 (45.5%) |
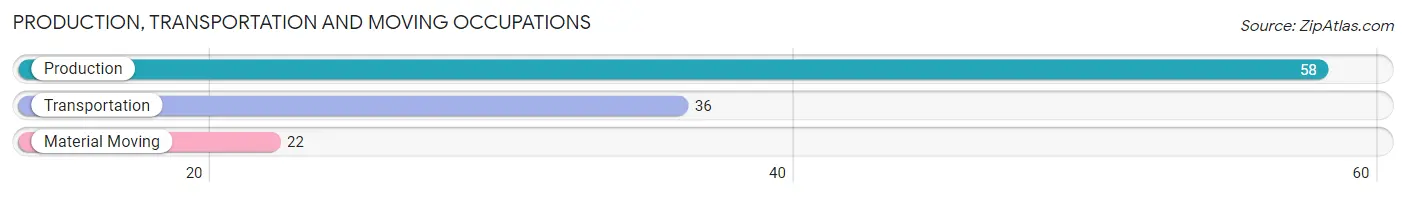
Production, Transportation and Moving Occupations
The most common Production, Transportation and Moving occupations in Woodville are Production (58 | 14.8%), Transportation (36 | 9.2%), and Material Moving (22 | 5.6%).
Production, Transportation and Moving Occupations by Sex
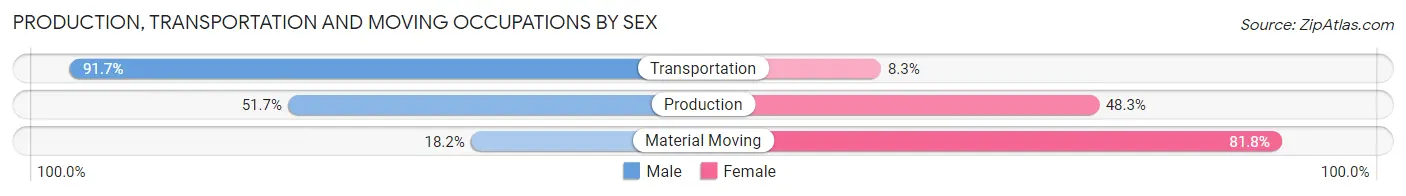
| Occupation | Male | Female |
| Production | 30 (51.7%) | 28 (48.3%) |
| Transportation | 33 (91.7%) | 3 (8.3%) |
| Material Moving | 4 (18.2%) | 18 (81.8%) |
| Total (Category) | 67 (57.8%) | 49 (42.2%) |
| Total (Overall) | 213 (54.5%) | 178 (45.5%) |
Employment Industries by Sex in Woodville
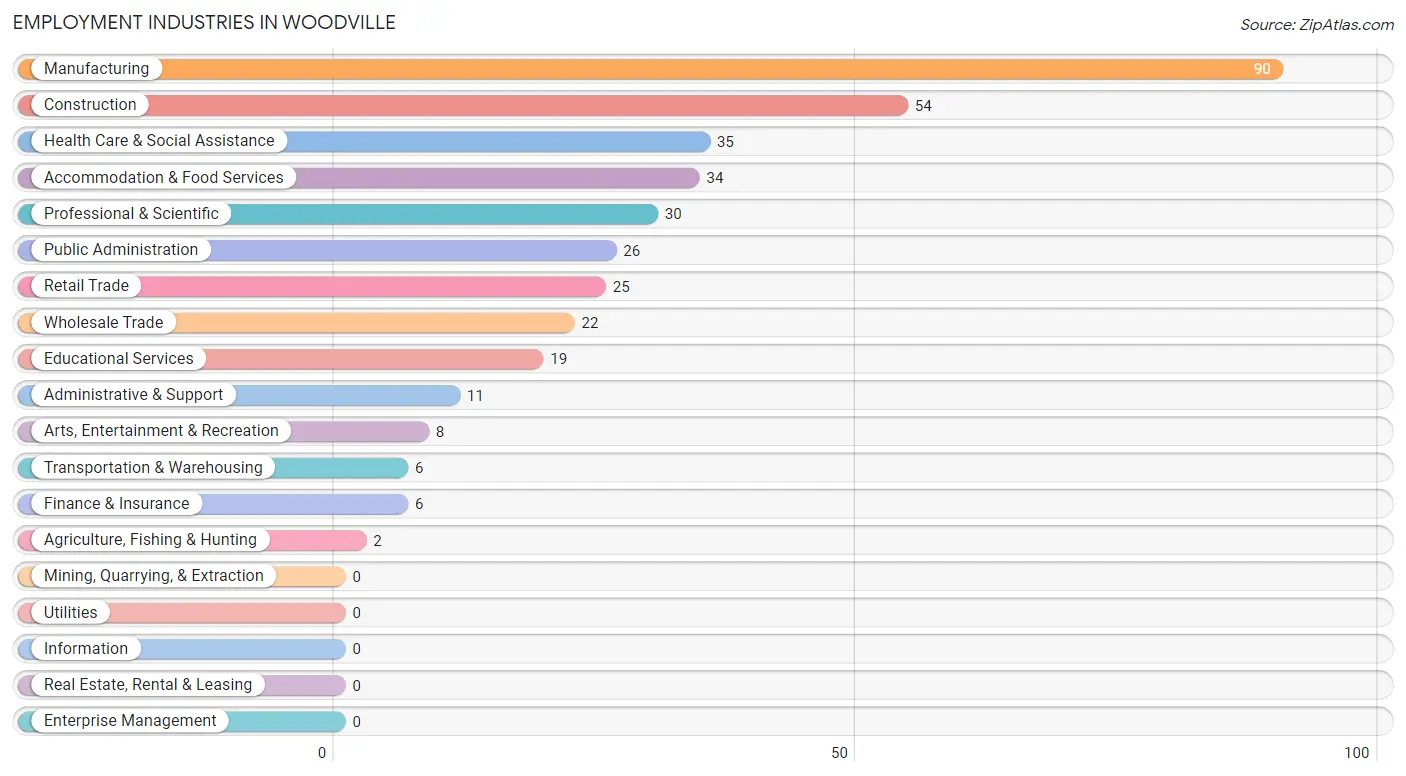
Employment Industries in Woodville
The major employment industries in Woodville include Manufacturing (90 | 23.0%), Construction (54 | 13.8%), Health Care & Social Assistance (35 | 8.9%), Accommodation & Food Services (34 | 8.7%), and Professional & Scientific (30 | 7.7%).
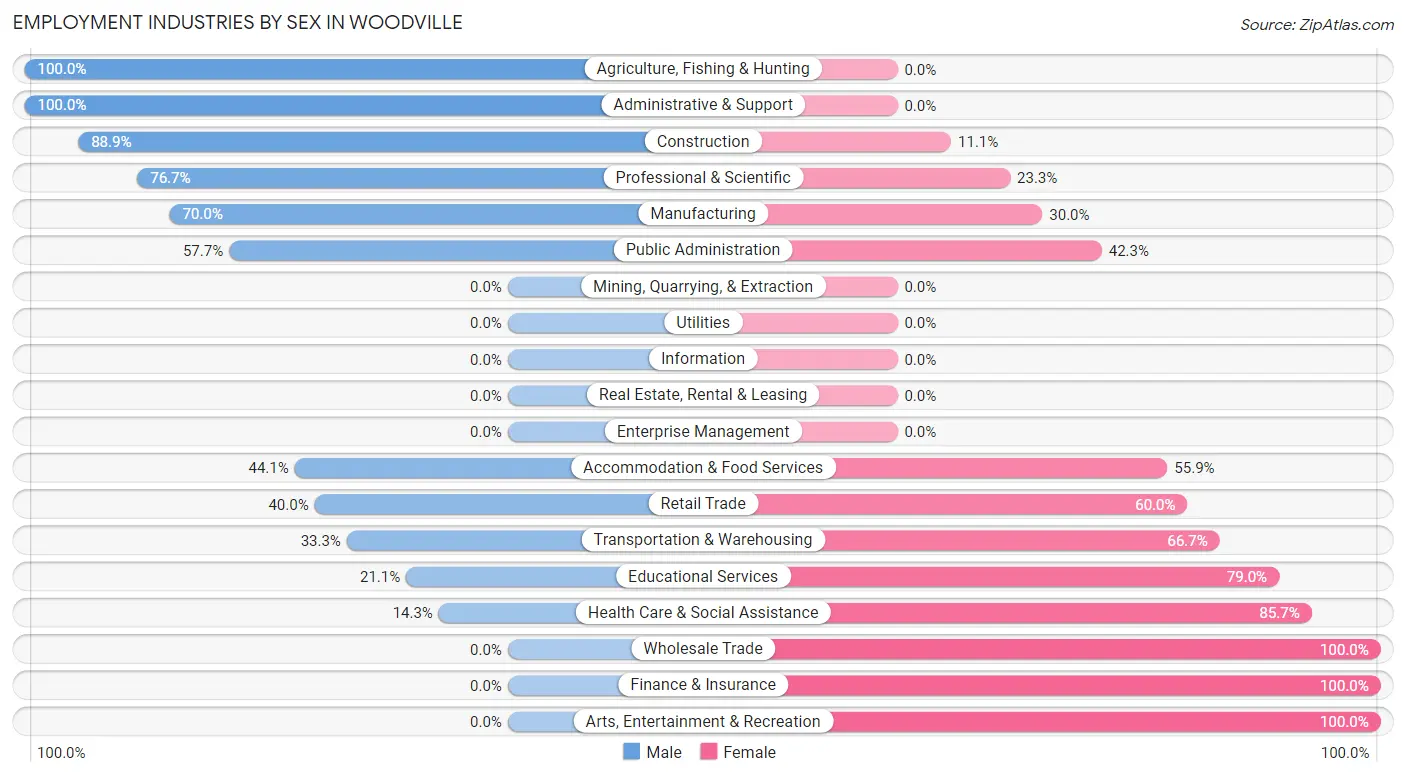
Employment Industries by Sex in Woodville
The Woodville industries that see more men than women are Agriculture, Fishing & Hunting (100.0%), Administrative & Support (100.0%), and Construction (88.9%), whereas the industries that tend to have a higher number of women are Wholesale Trade (100.0%), Finance & Insurance (100.0%), and Arts, Entertainment & Recreation (100.0%).
| Industry | Male | Female |
| Agriculture, Fishing & Hunting | 2 (100.0%) | 0 (0.0%) |
| Mining, Quarrying, & Extraction | 0 (0.0%) | 0 (0.0%) |
| Construction | 48 (88.9%) | 6 (11.1%) |
| Manufacturing | 63 (70.0%) | 27 (30.0%) |
| Wholesale Trade | 0 (0.0%) | 22 (100.0%) |
| Retail Trade | 10 (40.0%) | 15 (60.0%) |
| Transportation & Warehousing | 2 (33.3%) | 4 (66.7%) |
| Utilities | 0 (0.0%) | 0 (0.0%) |
| Information | 0 (0.0%) | 0 (0.0%) |
| Finance & Insurance | 0 (0.0%) | 6 (100.0%) |
| Real Estate, Rental & Leasing | 0 (0.0%) | 0 (0.0%) |
| Professional & Scientific | 23 (76.7%) | 7 (23.3%) |
| Enterprise Management | 0 (0.0%) | 0 (0.0%) |
| Administrative & Support | 11 (100.0%) | 0 (0.0%) |
| Educational Services | 4 (21.0%) | 15 (78.9%) |
| Health Care & Social Assistance | 5 (14.3%) | 30 (85.7%) |
| Arts, Entertainment & Recreation | 0 (0.0%) | 8 (100.0%) |
| Accommodation & Food Services | 15 (44.1%) | 19 (55.9%) |
| Public Administration | 15 (57.7%) | 11 (42.3%) |
| Total | 213 (54.5%) | 178 (45.5%) |
Education in Woodville
School Enrollment in Woodville
The most common levels of schooling among the 270 students in Woodville are high school (85 | 31.5%), middle school (64 | 23.7%), and elementary school (47 | 17.4%).
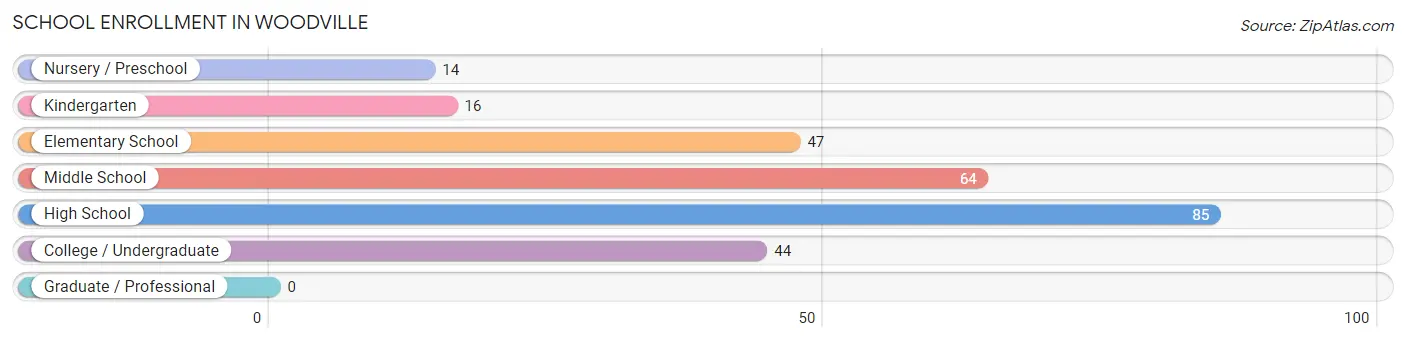
| School Level | # Students | % Students |
| Nursery / Preschool | 14 | 5.2% |
| Kindergarten | 16 | 5.9% |
| Elementary School | 47 | 17.4% |
| Middle School | 64 | 23.7% |
| High School | 85 | 31.5% |
| College / Undergraduate | 44 | 16.3% |
| Graduate / Professional | 0 | 0.0% |
| Total | 270 | 100.0% |
School Enrollment by Age by Funding Source in Woodville
Out of a total of 270 students who are enrolled in schools in Woodville, 100 (37.0%) attend a private institution, while the remaining 170 (63.0%) are enrolled in public schools. The age group of 3 to 4 year olds has the highest likelihood of being enrolled in private schools, with 14 (100.0% in the age bracket) enrolled. Conversely, the age group of 18 to 19 year olds has the lowest likelihood of being enrolled in a private school, with 24 (100.0% in the age bracket) attending a public institution.
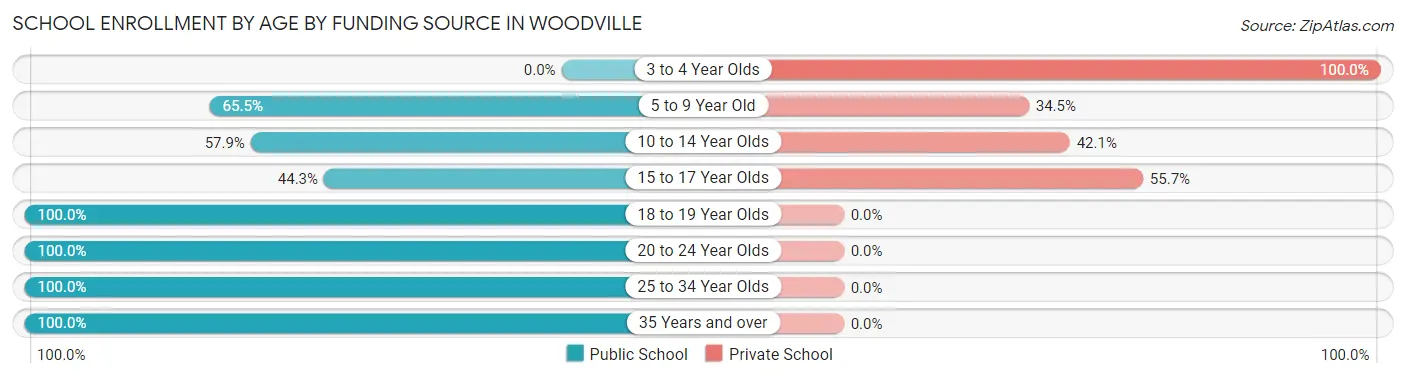
| Age Bracket | Public School | Private School |
| 3 to 4 Year Olds | 0 (0.0%) | 14 (100.0%) |
| 5 to 9 Year Old | 38 (65.5%) | 20 (34.5%) |
| 10 to 14 Year Olds | 44 (57.9%) | 32 (42.1%) |
| 15 to 17 Year Olds | 27 (44.3%) | 34 (55.7%) |
| 18 to 19 Year Olds | 24 (100.0%) | 0 (0.0%) |
| 20 to 24 Year Olds | 23 (100.0%) | 0 (0.0%) |
| 25 to 34 Year Olds | 12 (100.0%) | 0 (0.0%) |
| 35 Years and over | 2 (100.0%) | 0 (0.0%) |
| Total | 170 (63.0%) | 100 (37.0%) |
Educational Attainment by Field of Study in Woodville
Education (24 | 17.0%), arts & humanities (21 | 14.9%), business (20 | 14.2%), science & technology (19 | 13.5%), and bio, nature & agricultural (18 | 12.8%) are the most common fields of study among 141 individuals in Woodville who have obtained a bachelor's degree or higher.
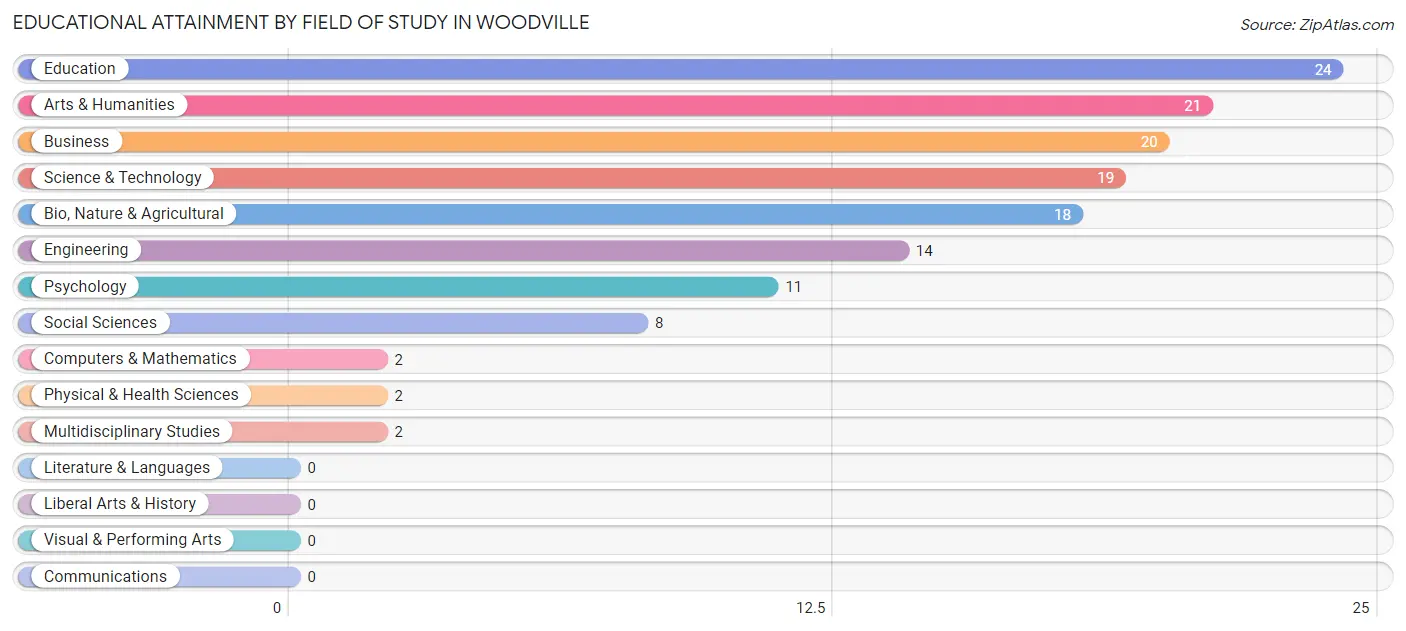
| Field of Study | # Graduates | % Graduates |
| Computers & Mathematics | 2 | 1.4% |
| Bio, Nature & Agricultural | 18 | 12.8% |
| Physical & Health Sciences | 2 | 1.4% |
| Psychology | 11 | 7.8% |
| Social Sciences | 8 | 5.7% |
| Engineering | 14 | 9.9% |
| Multidisciplinary Studies | 2 | 1.4% |
| Science & Technology | 19 | 13.5% |
| Business | 20 | 14.2% |
| Education | 24 | 17.0% |
| Literature & Languages | 0 | 0.0% |
| Liberal Arts & History | 0 | 0.0% |
| Visual & Performing Arts | 0 | 0.0% |
| Communications | 0 | 0.0% |
| Arts & Humanities | 21 | 14.9% |
| Total | 141 | 100.0% |
Transportation & Commute in Woodville
Vehicle Availability by Sex in Woodville
The most prevalent vehicle ownership categories in Woodville are males with 2 vehicles (78, accounting for 36.6%) and females with 2 vehicles (38, making up 44.3%).
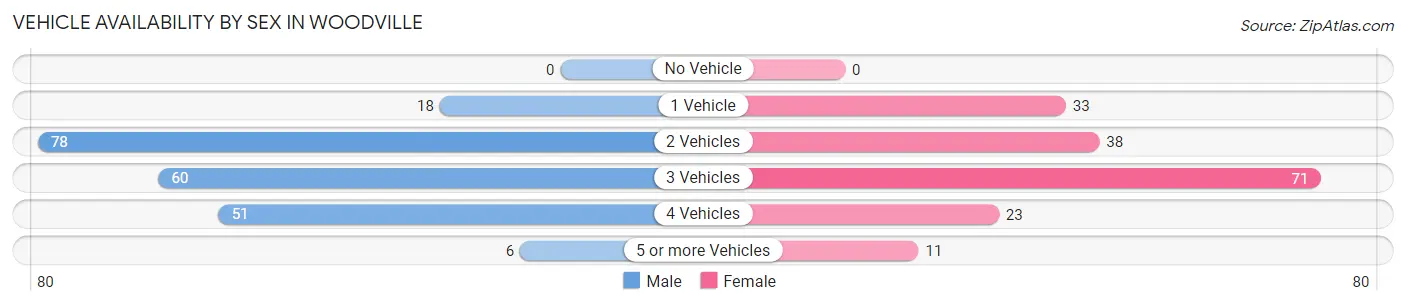
| Vehicles Available | Male | Female |
| No Vehicle | 0 (0.0%) | 0 (0.0%) |
| 1 Vehicle | 18 (8.5%) | 33 (18.8%) |
| 2 Vehicles | 78 (36.6%) | 38 (21.6%) |
| 3 Vehicles | 60 (28.2%) | 71 (40.3%) |
| 4 Vehicles | 51 (23.9%) | 23 (13.1%) |
| 5 or more Vehicles | 6 (2.8%) | 11 (6.2%) |
| Total | 213 (100.0%) | 176 (100.0%) |
Commute Time in Woodville
The most frequently occuring commute durations in Woodville are 20 to 24 minutes (81 commuters, 21.5%), 30 to 34 minutes (51 commuters, 13.5%), and 45 to 59 minutes (46 commuters, 12.2%).
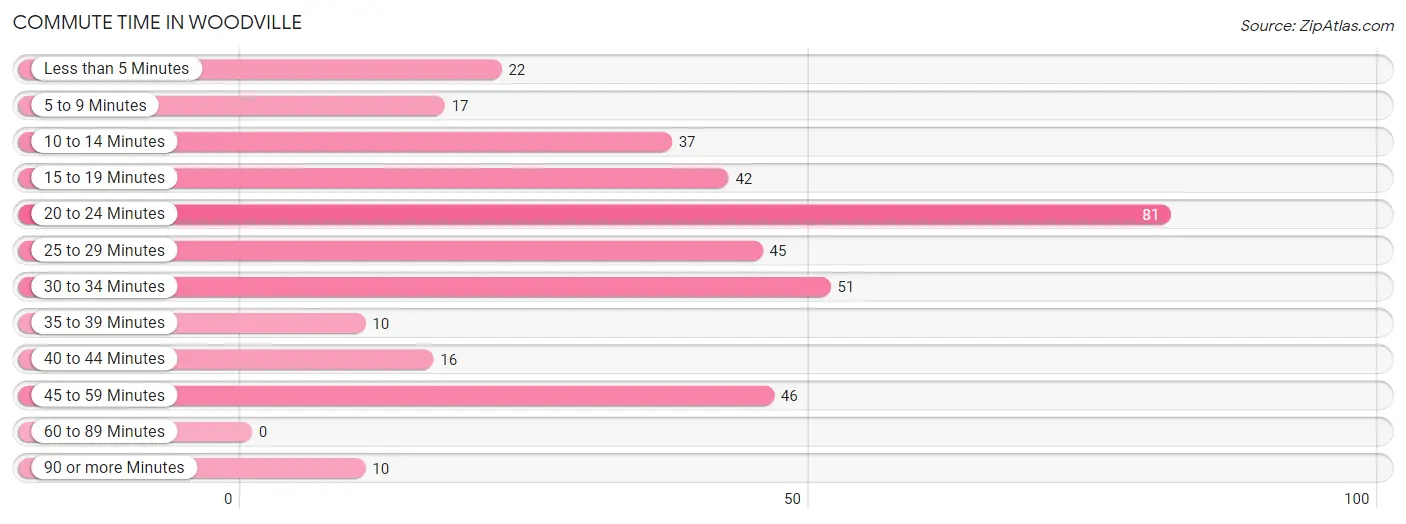
| Commute Time | # Commuters | % Commuters |
| Less than 5 Minutes | 22 | 5.8% |
| 5 to 9 Minutes | 17 | 4.5% |
| 10 to 14 Minutes | 37 | 9.8% |
| 15 to 19 Minutes | 42 | 11.1% |
| 20 to 24 Minutes | 81 | 21.5% |
| 25 to 29 Minutes | 45 | 11.9% |
| 30 to 34 Minutes | 51 | 13.5% |
| 35 to 39 Minutes | 10 | 2.6% |
| 40 to 44 Minutes | 16 | 4.2% |
| 45 to 59 Minutes | 46 | 12.2% |
| 60 to 89 Minutes | 0 | 0.0% |
| 90 or more Minutes | 10 | 2.6% |
Commute Time by Sex in Woodville
The most common commute times in Woodville are 20 to 24 minutes (45 commuters, 21.1%) for males and 20 to 24 minutes (36 commuters, 22.0%) for females.
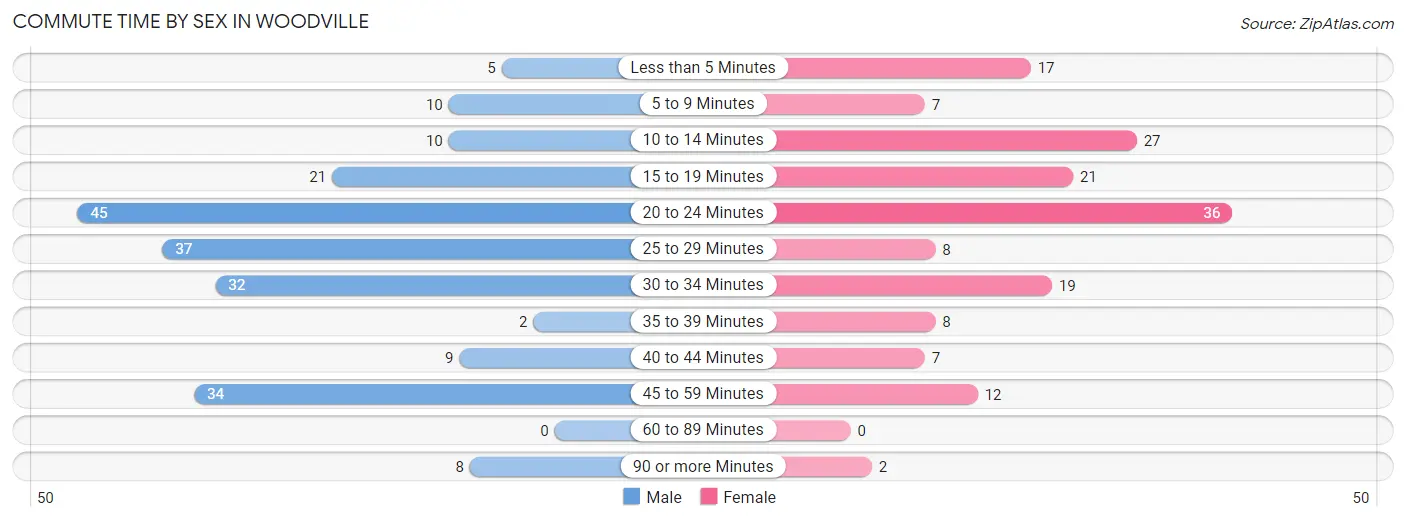
| Commute Time | Male | Female |
| Less than 5 Minutes | 5 (2.4%) | 17 (10.4%) |
| 5 to 9 Minutes | 10 (4.7%) | 7 (4.3%) |
| 10 to 14 Minutes | 10 (4.7%) | 27 (16.5%) |
| 15 to 19 Minutes | 21 (9.9%) | 21 (12.8%) |
| 20 to 24 Minutes | 45 (21.1%) | 36 (22.0%) |
| 25 to 29 Minutes | 37 (17.4%) | 8 (4.9%) |
| 30 to 34 Minutes | 32 (15.0%) | 19 (11.6%) |
| 35 to 39 Minutes | 2 (0.9%) | 8 (4.9%) |
| 40 to 44 Minutes | 9 (4.2%) | 7 (4.3%) |
| 45 to 59 Minutes | 34 (16.0%) | 12 (7.3%) |
| 60 to 89 Minutes | 0 (0.0%) | 0 (0.0%) |
| 90 or more Minutes | 8 (3.8%) | 2 (1.2%) |
Time of Departure to Work by Sex in Woodville
The most frequent times of departure to work in Woodville are 12:00 PM to 3:59 PM (58, 27.2%) for males and 7:00 AM to 7:29 AM (35, 21.3%) for females.
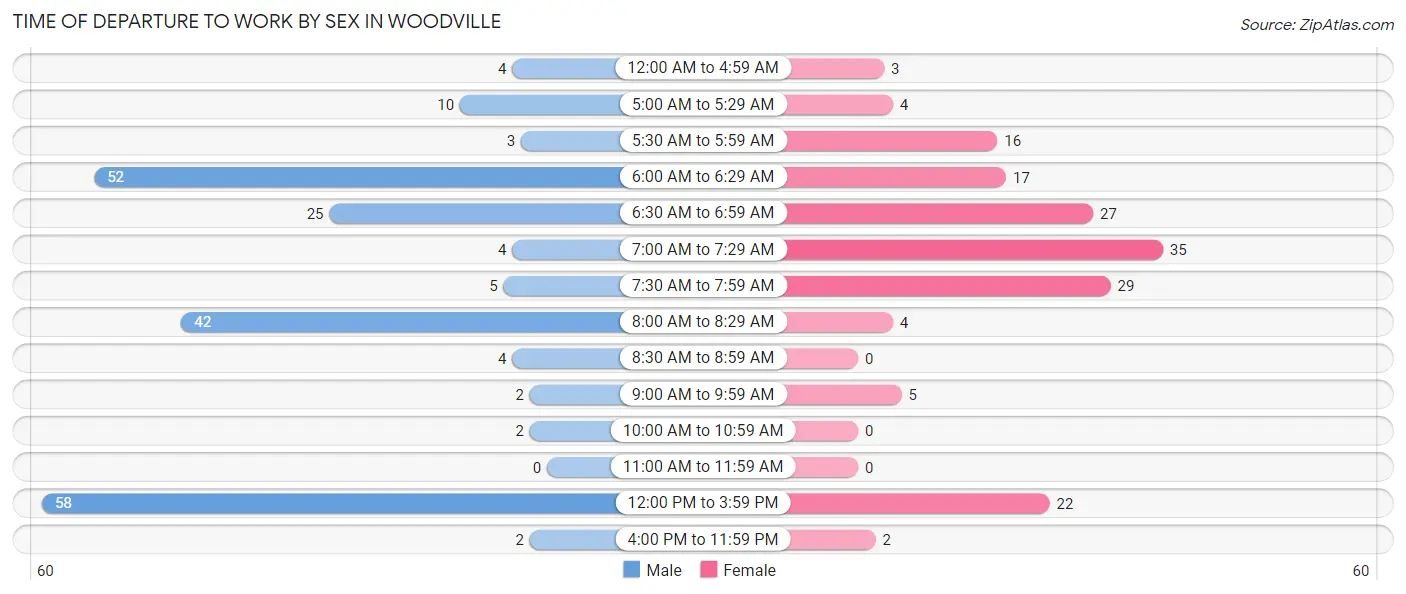
| Time of Departure | Male | Female |
| 12:00 AM to 4:59 AM | 4 (1.9%) | 3 (1.8%) |
| 5:00 AM to 5:29 AM | 10 (4.7%) | 4 (2.4%) |
| 5:30 AM to 5:59 AM | 3 (1.4%) | 16 (9.8%) |
| 6:00 AM to 6:29 AM | 52 (24.4%) | 17 (10.4%) |
| 6:30 AM to 6:59 AM | 25 (11.7%) | 27 (16.5%) |
| 7:00 AM to 7:29 AM | 4 (1.9%) | 35 (21.3%) |
| 7:30 AM to 7:59 AM | 5 (2.4%) | 29 (17.7%) |
| 8:00 AM to 8:29 AM | 42 (19.7%) | 4 (2.4%) |
| 8:30 AM to 8:59 AM | 4 (1.9%) | 0 (0.0%) |
| 9:00 AM to 9:59 AM | 2 (0.9%) | 5 (3.0%) |
| 10:00 AM to 10:59 AM | 2 (0.9%) | 0 (0.0%) |
| 11:00 AM to 11:59 AM | 0 (0.0%) | 0 (0.0%) |
| 12:00 PM to 3:59 PM | 58 (27.2%) | 22 (13.4%) |
| 4:00 PM to 11:59 PM | 2 (0.9%) | 2 (1.2%) |
| Total | 213 (100.0%) | 164 (100.0%) |
Housing Occupancy in Woodville
Occupancy by Ownership in Woodville
Of the total 386 dwellings in Woodville, owner-occupied units account for 303 (78.5%), while renter-occupied units make up 83 (21.5%).
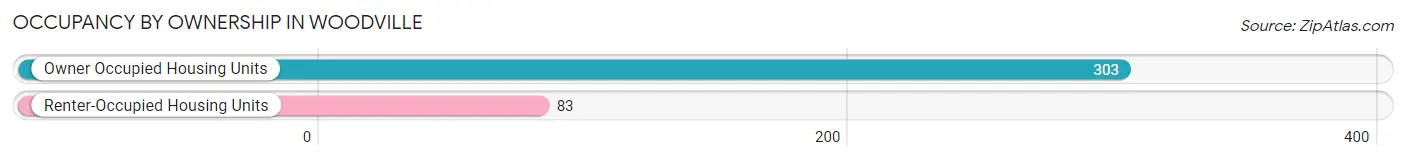
| Occupancy | # Housing Units | % Housing Units |
| Owner Occupied Housing Units | 303 | 78.5% |
| Renter-Occupied Housing Units | 83 | 21.5% |
| Total Occupied Housing Units | 386 | 100.0% |
Occupancy by Household Size in Woodville
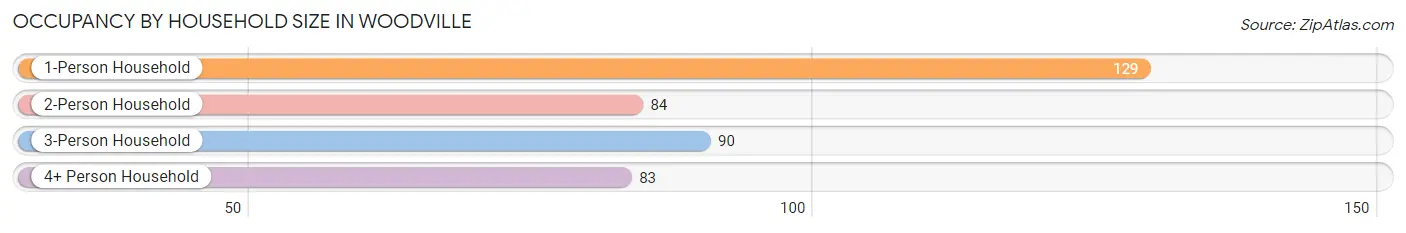
| Household Size | # Housing Units | % Housing Units |
| 1-Person Household | 129 | 33.4% |
| 2-Person Household | 84 | 21.8% |
| 3-Person Household | 90 | 23.3% |
| 4+ Person Household | 83 | 21.5% |
| Total Housing Units | 386 | 100.0% |
Occupancy by Ownership by Household Size in Woodville
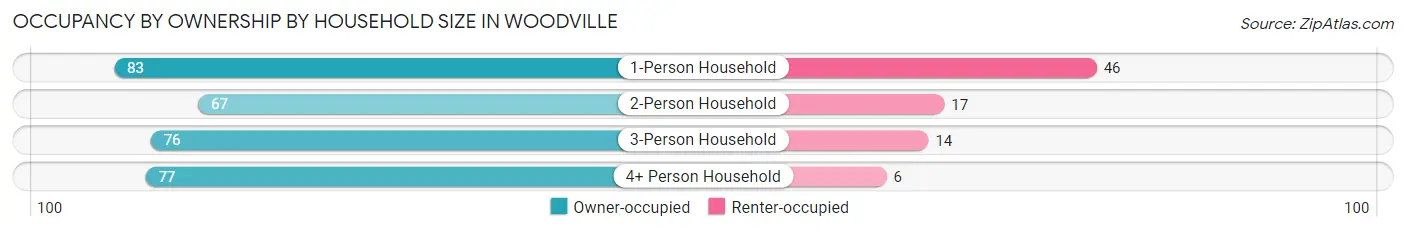
| Household Size | Owner-occupied | Renter-occupied |
| 1-Person Household | 83 (64.3%) | 46 (35.7%) |
| 2-Person Household | 67 (79.8%) | 17 (20.2%) |
| 3-Person Household | 76 (84.4%) | 14 (15.6%) |
| 4+ Person Household | 77 (92.8%) | 6 (7.2%) |
| Total Housing Units | 303 (78.5%) | 83 (21.5%) |
Occupancy by Educational Attainment in Woodville
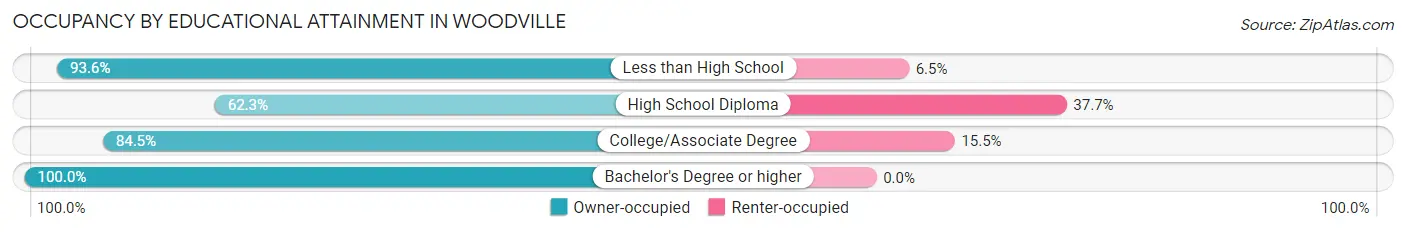
| Household Size | Owner-occupied | Renter-occupied |
| Less than High School | 29 (93.5%) | 2 (6.5%) |
| High School Diploma | 104 (62.3%) | 63 (37.7%) |
| College/Associate Degree | 98 (84.5%) | 18 (15.5%) |
| Bachelor's Degree or higher | 72 (100.0%) | 0 (0.0%) |
Occupancy by Age of Householder in Woodville
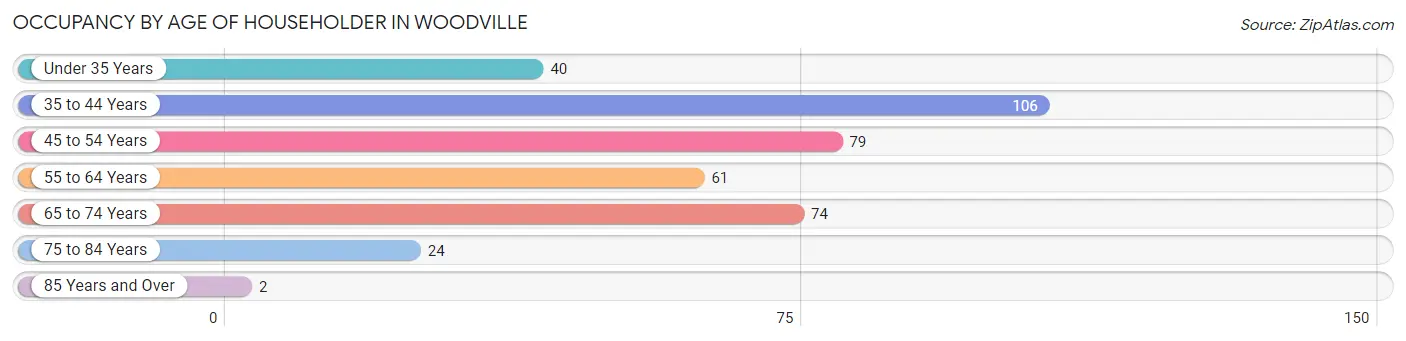
| Age Bracket | # Households | % Households |
| Under 35 Years | 40 | 10.4% |
| 35 to 44 Years | 106 | 27.5% |
| 45 to 54 Years | 79 | 20.5% |
| 55 to 64 Years | 61 | 15.8% |
| 65 to 74 Years | 74 | 19.2% |
| 75 to 84 Years | 24 | 6.2% |
| 85 Years and Over | 2 | 0.5% |
| Total | 386 | 100.0% |
Housing Finances in Woodville
Median Income by Occupancy in Woodville
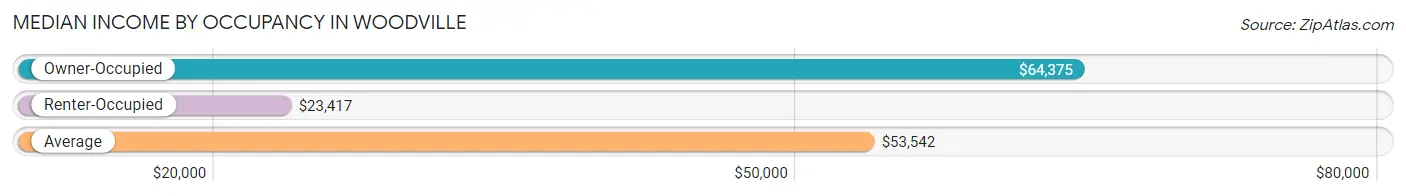
| Occupancy Type | # Households | Median Income |
| Owner-Occupied | 303 (78.5%) | $64,375 |
| Renter-Occupied | 83 (21.5%) | $23,417 |
| Average | 386 (100.0%) | $53,542 |
Occupancy by Householder Income Bracket in Woodville
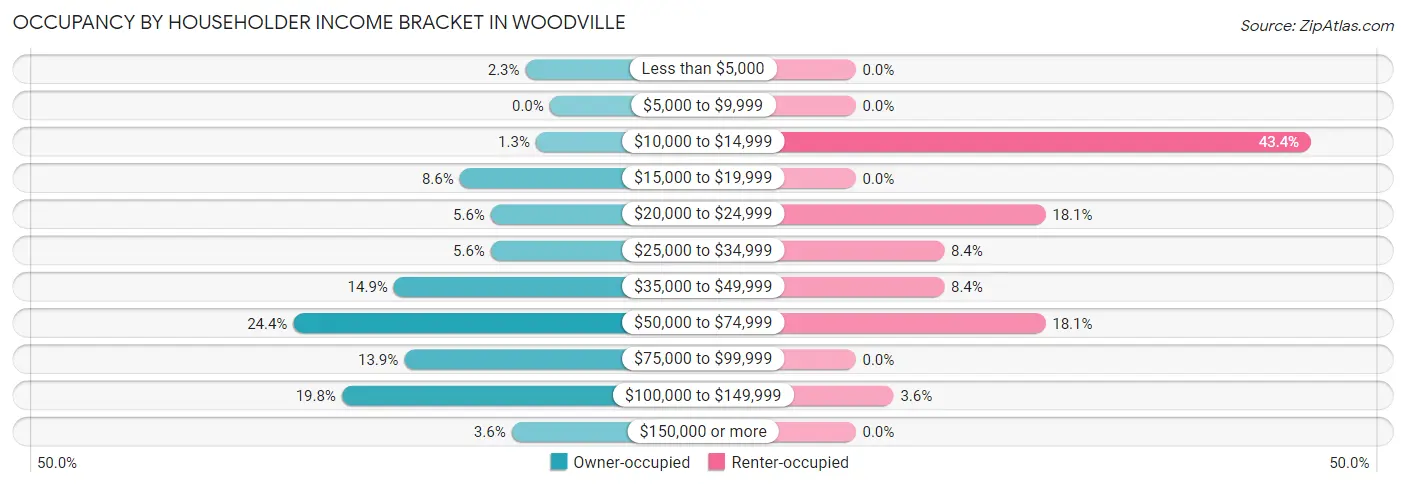
| Income Bracket | Owner-occupied | Renter-occupied |
| Less than $5,000 | 7 (2.3%) | 0 (0.0%) |
| $5,000 to $9,999 | 0 (0.0%) | 0 (0.0%) |
| $10,000 to $14,999 | 4 (1.3%) | 36 (43.4%) |
| $15,000 to $19,999 | 26 (8.6%) | 0 (0.0%) |
| $20,000 to $24,999 | 17 (5.6%) | 15 (18.1%) |
| $25,000 to $34,999 | 17 (5.6%) | 7 (8.4%) |
| $35,000 to $49,999 | 45 (14.8%) | 7 (8.4%) |
| $50,000 to $74,999 | 74 (24.4%) | 15 (18.1%) |
| $75,000 to $99,999 | 42 (13.9%) | 0 (0.0%) |
| $100,000 to $149,999 | 60 (19.8%) | 3 (3.6%) |
| $150,000 or more | 11 (3.6%) | 0 (0.0%) |
| Total | 303 (100.0%) | 83 (100.0%) |
Monthly Housing Cost Tiers in Woodville
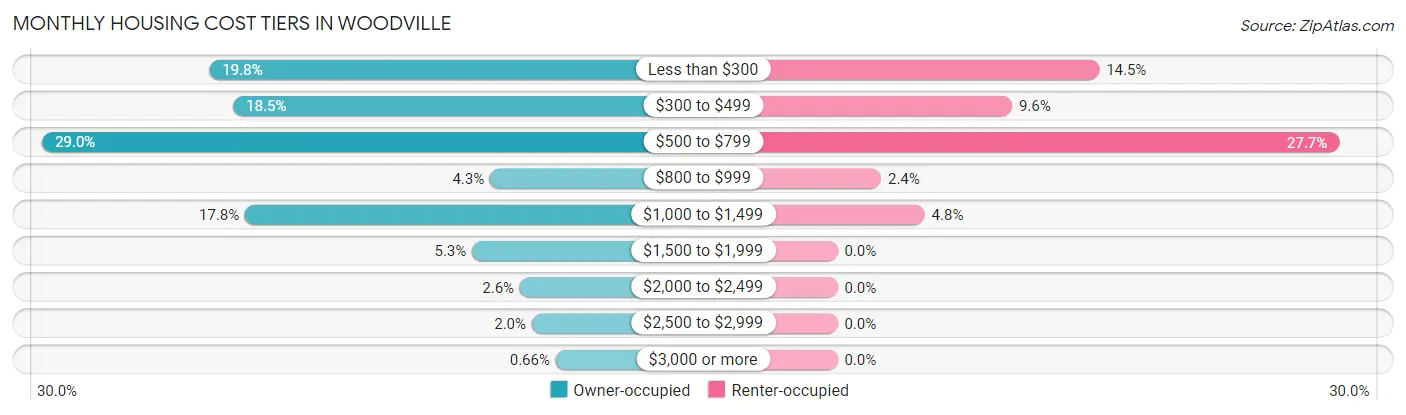
| Monthly Cost | Owner-occupied | Renter-occupied |
| Less than $300 | 60 (19.8%) | 12 (14.5%) |
| $300 to $499 | 56 (18.5%) | 8 (9.6%) |
| $500 to $799 | 88 (29.0%) | 23 (27.7%) |
| $800 to $999 | 13 (4.3%) | 2 (2.4%) |
| $1,000 to $1,499 | 54 (17.8%) | 4 (4.8%) |
| $1,500 to $1,999 | 16 (5.3%) | 0 (0.0%) |
| $2,000 to $2,499 | 8 (2.6%) | 0 (0.0%) |
| $2,500 to $2,999 | 6 (2.0%) | 0 (0.0%) |
| $3,000 or more | 2 (0.7%) | 0 (0.0%) |
| Total | 303 (100.0%) | 83 (100.0%) |
Physical Housing Characteristics in Woodville
Housing Structures in Woodville
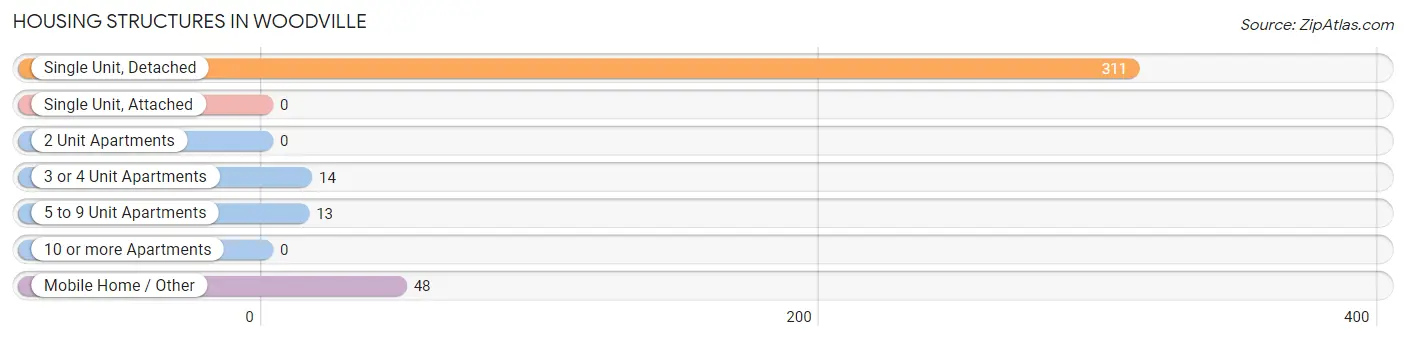
| Structure Type | # Housing Units | % Housing Units |
| Single Unit, Detached | 311 | 80.6% |
| Single Unit, Attached | 0 | 0.0% |
| 2 Unit Apartments | 0 | 0.0% |
| 3 or 4 Unit Apartments | 14 | 3.6% |
| 5 to 9 Unit Apartments | 13 | 3.4% |
| 10 or more Apartments | 0 | 0.0% |
| Mobile Home / Other | 48 | 12.4% |
| Total | 386 | 100.0% |
Housing Structures by Occupancy in Woodville
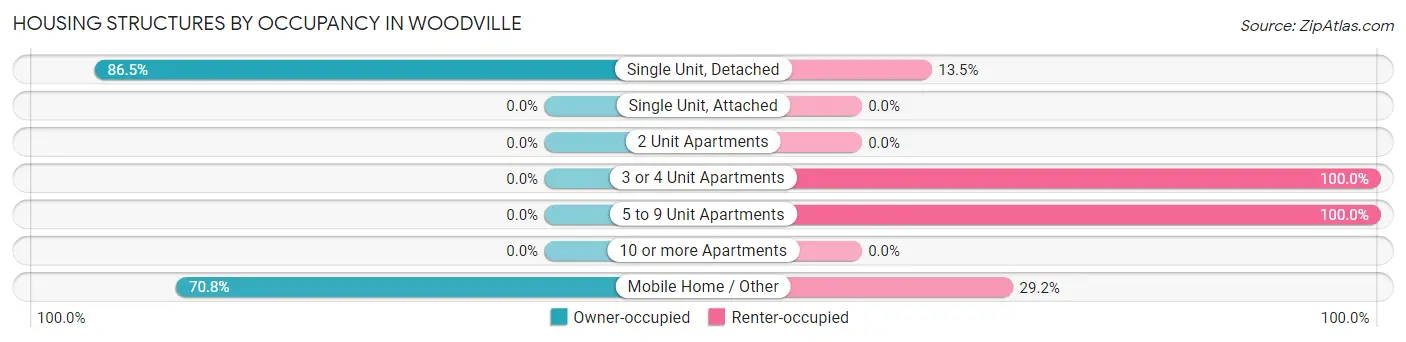
| Structure Type | Owner-occupied | Renter-occupied |
| Single Unit, Detached | 269 (86.5%) | 42 (13.5%) |
| Single Unit, Attached | 0 (0.0%) | 0 (0.0%) |
| 2 Unit Apartments | 0 (0.0%) | 0 (0.0%) |
| 3 or 4 Unit Apartments | 0 (0.0%) | 14 (100.0%) |
| 5 to 9 Unit Apartments | 0 (0.0%) | 13 (100.0%) |
| 10 or more Apartments | 0 (0.0%) | 0 (0.0%) |
| Mobile Home / Other | 34 (70.8%) | 14 (29.2%) |
| Total | 303 (78.5%) | 83 (21.5%) |
Housing Structures by Number of Rooms in Woodville
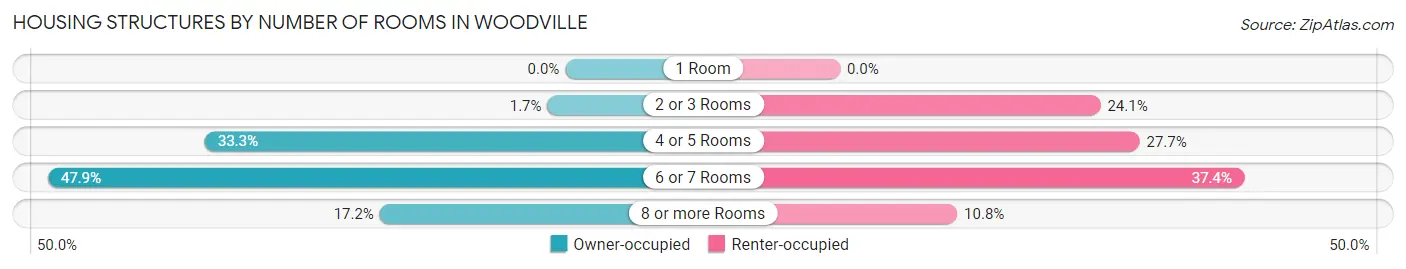
| Number of Rooms | Owner-occupied | Renter-occupied |
| 1 Room | 0 (0.0%) | 0 (0.0%) |
| 2 or 3 Rooms | 5 (1.7%) | 20 (24.1%) |
| 4 or 5 Rooms | 101 (33.3%) | 23 (27.7%) |
| 6 or 7 Rooms | 145 (47.8%) | 31 (37.3%) |
| 8 or more Rooms | 52 (17.2%) | 9 (10.8%) |
| Total | 303 (100.0%) | 83 (100.0%) |
Housing Structure by Heating Type in Woodville
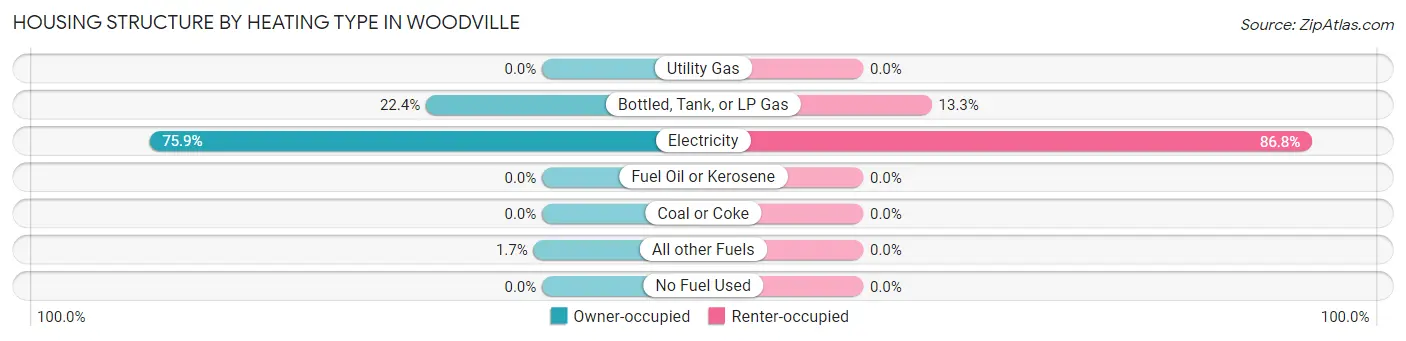
| Heating Type | Owner-occupied | Renter-occupied |
| Utility Gas | 0 (0.0%) | 0 (0.0%) |
| Bottled, Tank, or LP Gas | 68 (22.4%) | 11 (13.3%) |
| Electricity | 230 (75.9%) | 72 (86.8%) |
| Fuel Oil or Kerosene | 0 (0.0%) | 0 (0.0%) |
| Coal or Coke | 0 (0.0%) | 0 (0.0%) |
| All other Fuels | 5 (1.7%) | 0 (0.0%) |
| No Fuel Used | 0 (0.0%) | 0 (0.0%) |
| Total | 303 (100.0%) | 83 (100.0%) |
Household Vehicle Usage in Woodville
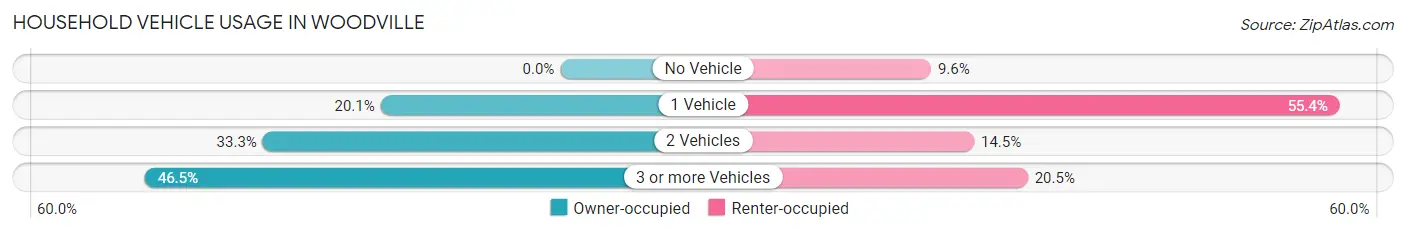
| Vehicles per Household | Owner-occupied | Renter-occupied |
| No Vehicle | 0 (0.0%) | 8 (9.6%) |
| 1 Vehicle | 61 (20.1%) | 46 (55.4%) |
| 2 Vehicles | 101 (33.3%) | 12 (14.5%) |
| 3 or more Vehicles | 141 (46.5%) | 17 (20.5%) |
| Total | 303 (100.0%) | 83 (100.0%) |
Real Estate & Mortgages in Woodville
Real Estate and Mortgage Overview in Woodville
| Characteristic | Without Mortgage | With Mortgage |
| Housing Units | 162 | 141 |
| Median Property Value | $162,500 | $122,800 |
| Median Household Income | $48,750 | $7 |
| Monthly Housing Costs | $388 | $2 |
| Real Estate Taxes | $345 | $14 |
Property Value by Mortgage Status in Woodville
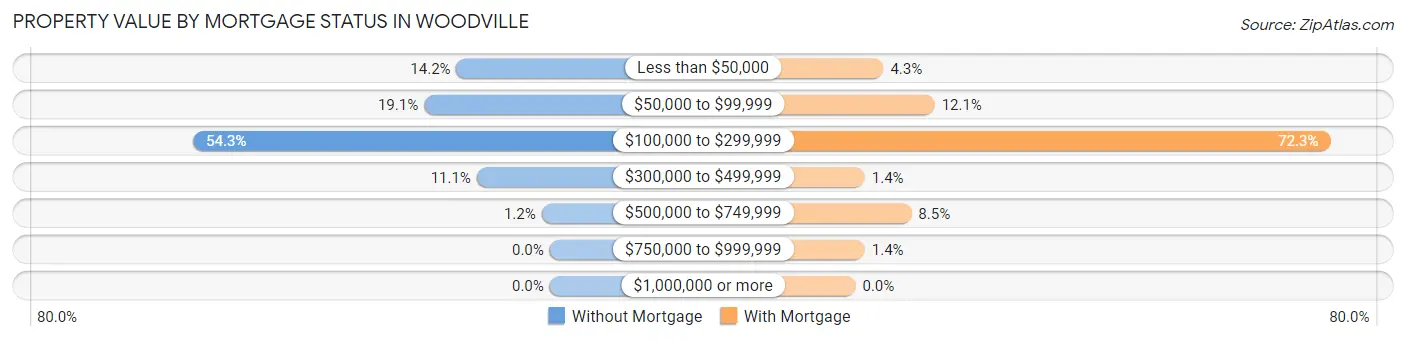
| Property Value | Without Mortgage | With Mortgage |
| Less than $50,000 | 23 (14.2%) | 6 (4.3%) |
| $50,000 to $99,999 | 31 (19.1%) | 17 (12.1%) |
| $100,000 to $299,999 | 88 (54.3%) | 102 (72.3%) |
| $300,000 to $499,999 | 18 (11.1%) | 2 (1.4%) |
| $500,000 to $749,999 | 2 (1.2%) | 12 (8.5%) |
| $750,000 to $999,999 | 0 (0.0%) | 2 (1.4%) |
| $1,000,000 or more | 0 (0.0%) | 0 (0.0%) |
| Total | 162 (100.0%) | 141 (100.0%) |
Household Income by Mortgage Status in Woodville
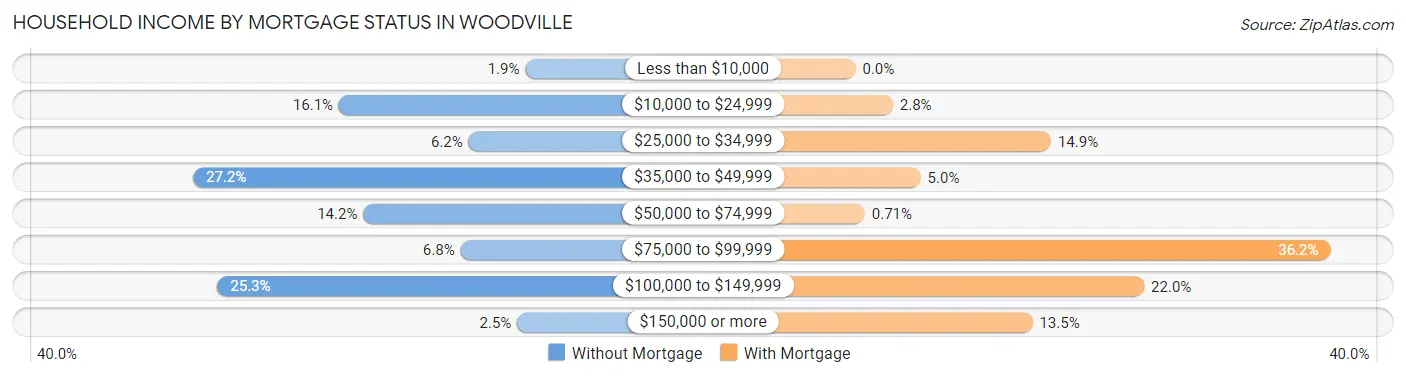
| Household Income | Without Mortgage | With Mortgage |
| Less than $10,000 | 3 (1.8%) | 0 (0.0%) |
| $10,000 to $24,999 | 26 (16.1%) | 4 (2.8%) |
| $25,000 to $34,999 | 10 (6.2%) | 21 (14.9%) |
| $35,000 to $49,999 | 44 (27.2%) | 7 (5.0%) |
| $50,000 to $74,999 | 23 (14.2%) | 1 (0.7%) |
| $75,000 to $99,999 | 11 (6.8%) | 51 (36.2%) |
| $100,000 to $149,999 | 41 (25.3%) | 31 (22.0%) |
| $150,000 or more | 4 (2.5%) | 19 (13.5%) |
| Total | 162 (100.0%) | 141 (100.0%) |
Property Value to Household Income Ratio in Woodville
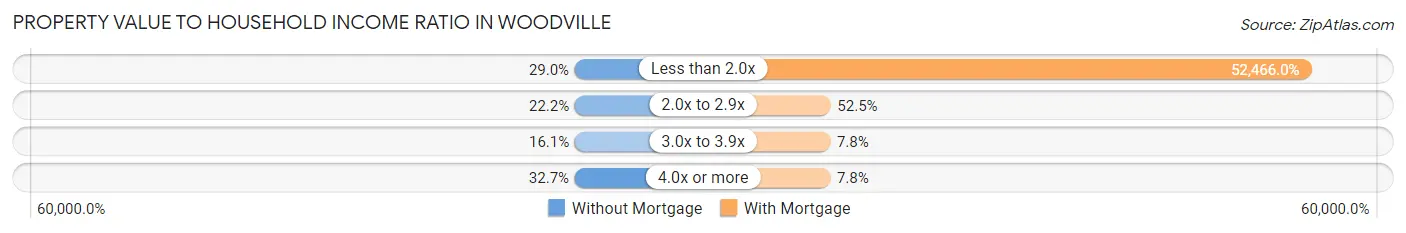
| Value-to-Income Ratio | Without Mortgage | With Mortgage |
| Less than 2.0x | 47 (29.0%) | 73,977 (52,466.0%) |
| 2.0x to 2.9x | 36 (22.2%) | 74 (52.5%) |
| 3.0x to 3.9x | 26 (16.1%) | 11 (7.8%) |
| 4.0x or more | 53 (32.7%) | 11 (7.8%) |
| Total | 162 (100.0%) | 141 (100.0%) |
Real Estate Taxes by Mortgage Status in Woodville
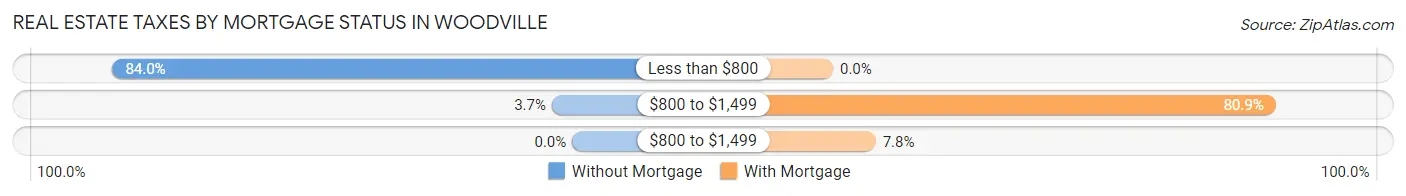
| Property Taxes | Without Mortgage | With Mortgage |
| Less than $800 | 136 (84.0%) | 0 (0.0%) |
| $800 to $1,499 | 6 (3.7%) | 114 (80.8%) |
| $800 to $1,499 | 0 (0.0%) | 11 (7.8%) |
| Total | 162 (100.0%) | 141 (100.0%) |
Health & Disability in Woodville
Health Insurance Coverage by Age in Woodville
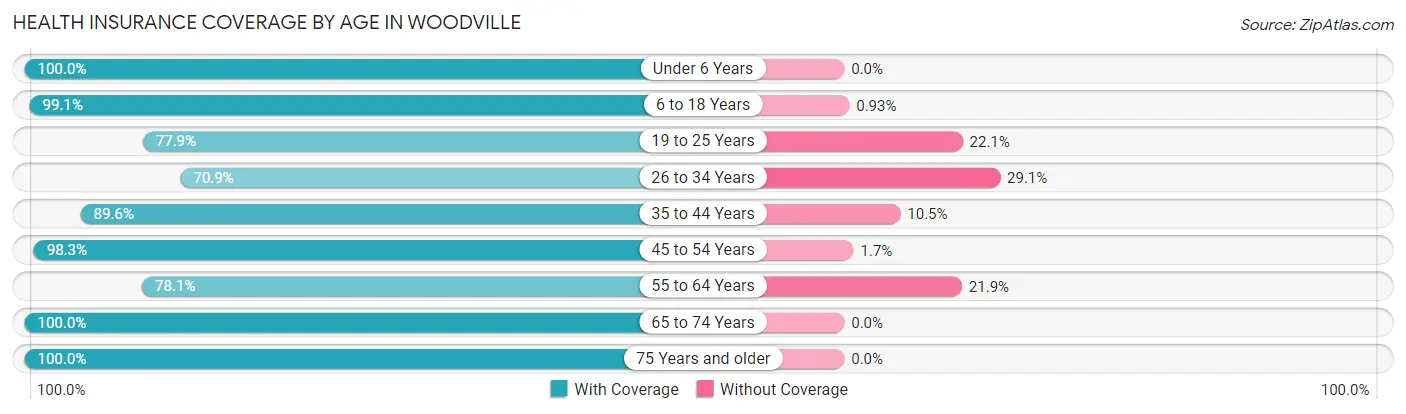
| Age Bracket | With Coverage | Without Coverage |
| Under 6 Years | 38 (100.0%) | 0 (0.0%) |
| 6 to 18 Years | 212 (99.1%) | 2 (0.9%) |
| 19 to 25 Years | 53 (77.9%) | 15 (22.1%) |
| 26 to 34 Years | 83 (70.9%) | 34 (29.1%) |
| 35 to 44 Years | 120 (89.5%) | 14 (10.4%) |
| 45 to 54 Years | 227 (98.3%) | 4 (1.7%) |
| 55 to 64 Years | 89 (78.1%) | 25 (21.9%) |
| 65 to 74 Years | 104 (100.0%) | 0 (0.0%) |
| 75 Years and older | 33 (100.0%) | 0 (0.0%) |
| Total | 959 (91.1%) | 94 (8.9%) |
Health Insurance Coverage by Citizenship Status in Woodville
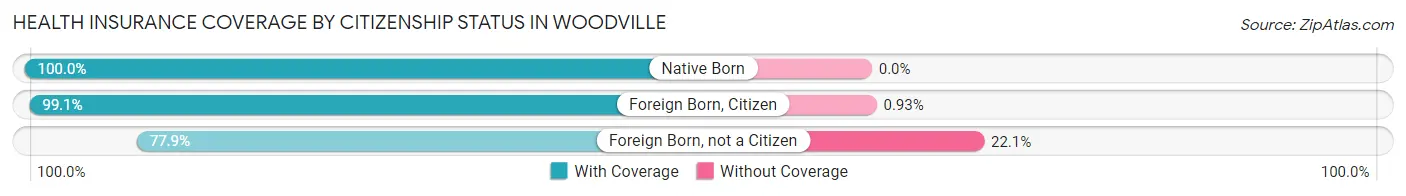
| Citizenship Status | With Coverage | Without Coverage |
| Native Born | 38 (100.0%) | 0 (0.0%) |
| Foreign Born, Citizen | 212 (99.1%) | 2 (0.9%) |
| Foreign Born, not a Citizen | 53 (77.9%) | 15 (22.1%) |
Health Insurance Coverage by Household Income in Woodville
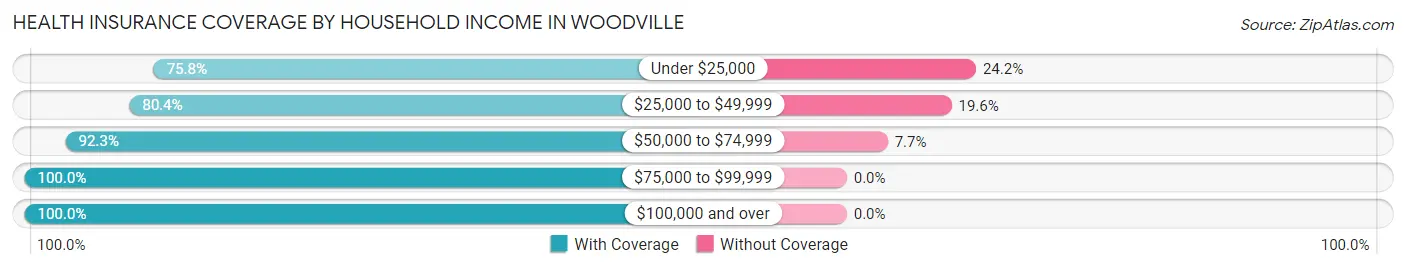
| Household Income | With Coverage | Without Coverage |
| Under $25,000 | 119 (75.8%) | 38 (24.2%) |
| $25,000 to $49,999 | 127 (80.4%) | 31 (19.6%) |
| $50,000 to $74,999 | 301 (92.3%) | 25 (7.7%) |
| $75,000 to $99,999 | 220 (100.0%) | 0 (0.0%) |
| $100,000 and over | 192 (100.0%) | 0 (0.0%) |
Public vs Private Health Insurance Coverage by Age in Woodville
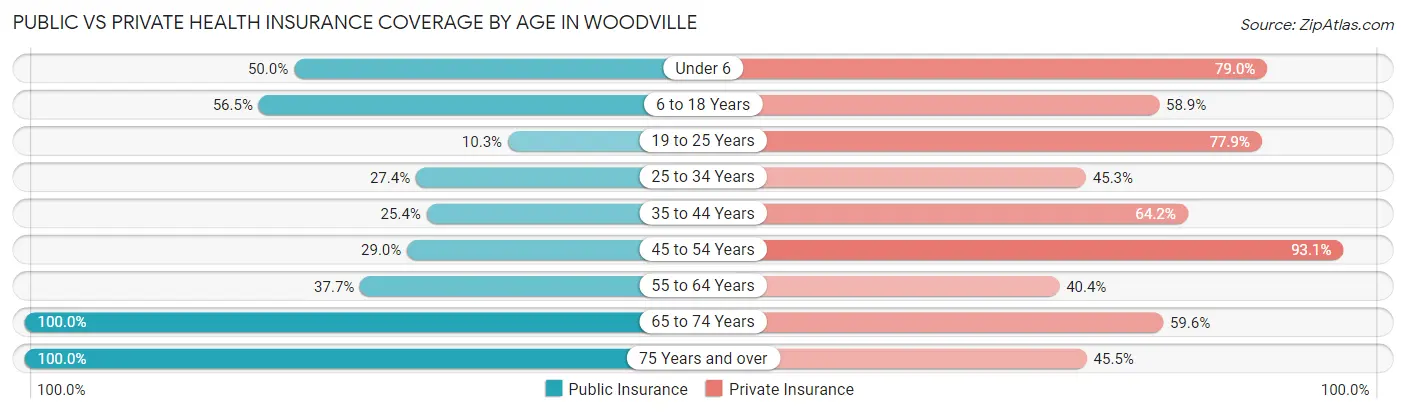
| Age Bracket | Public Insurance | Private Insurance |
| Under 6 | 19 (50.0%) | 30 (78.9%) |
| 6 to 18 Years | 121 (56.5%) | 126 (58.9%) |
| 19 to 25 Years | 7 (10.3%) | 53 (77.9%) |
| 25 to 34 Years | 32 (27.4%) | 53 (45.3%) |
| 35 to 44 Years | 34 (25.4%) | 86 (64.2%) |
| 45 to 54 Years | 67 (29.0%) | 215 (93.1%) |
| 55 to 64 Years | 43 (37.7%) | 46 (40.4%) |
| 65 to 74 Years | 104 (100.0%) | 62 (59.6%) |
| 75 Years and over | 33 (100.0%) | 15 (45.5%) |
| Total | 460 (43.7%) | 686 (65.1%) |
Disability Status by Sex by Age in Woodville
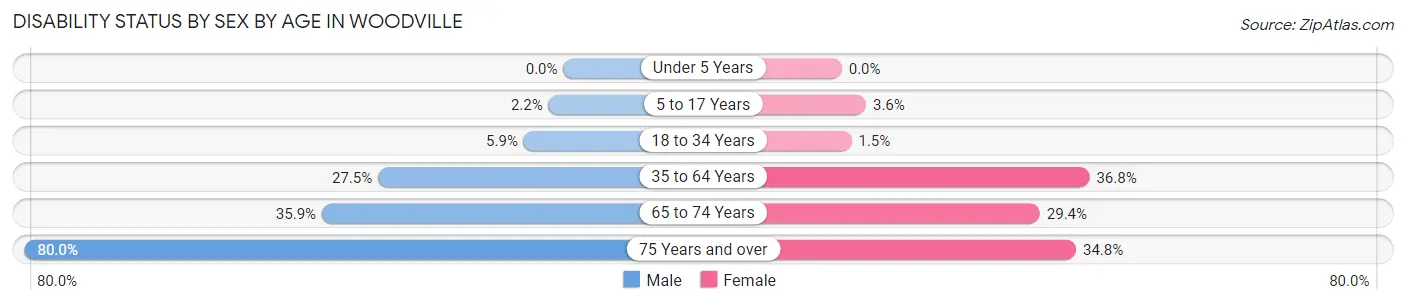
| Age Bracket | Male | Female |
| Under 5 Years | 0 (0.0%) | 0 (0.0%) |
| 5 to 17 Years | 2 (2.2%) | 4 (3.6%) |
| 18 to 34 Years | 4 (5.9%) | 2 (1.5%) |
| 35 to 64 Years | 60 (27.5%) | 96 (36.8%) |
| 65 to 74 Years | 19 (35.8%) | 15 (29.4%) |
| 75 Years and over | 8 (80.0%) | 8 (34.8%) |
Disability Class by Sex by Age in Woodville
Disability Class: Hearing Difficulty
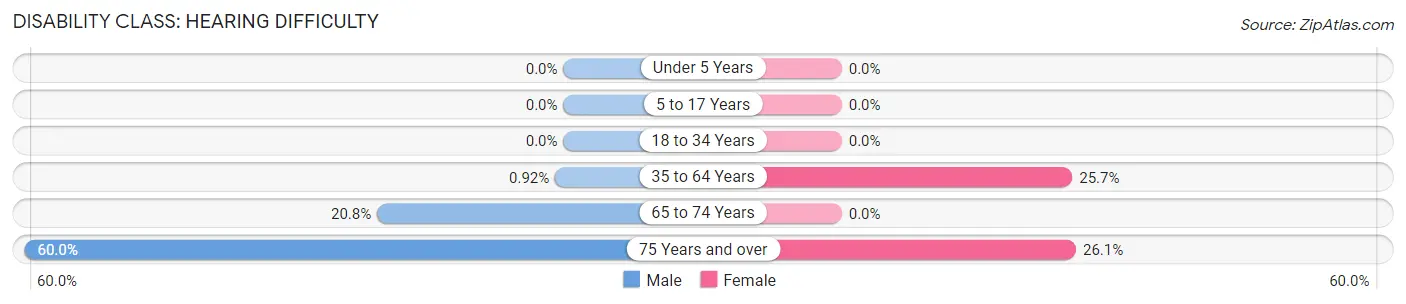
| Age Bracket | Male | Female |
| Under 5 Years | 0 (0.0%) | 0 (0.0%) |
| 5 to 17 Years | 0 (0.0%) | 0 (0.0%) |
| 18 to 34 Years | 0 (0.0%) | 0 (0.0%) |
| 35 to 64 Years | 2 (0.9%) | 67 (25.7%) |
| 65 to 74 Years | 11 (20.7%) | 0 (0.0%) |
| 75 Years and over | 6 (60.0%) | 6 (26.1%) |
Disability Class: Vision Difficulty
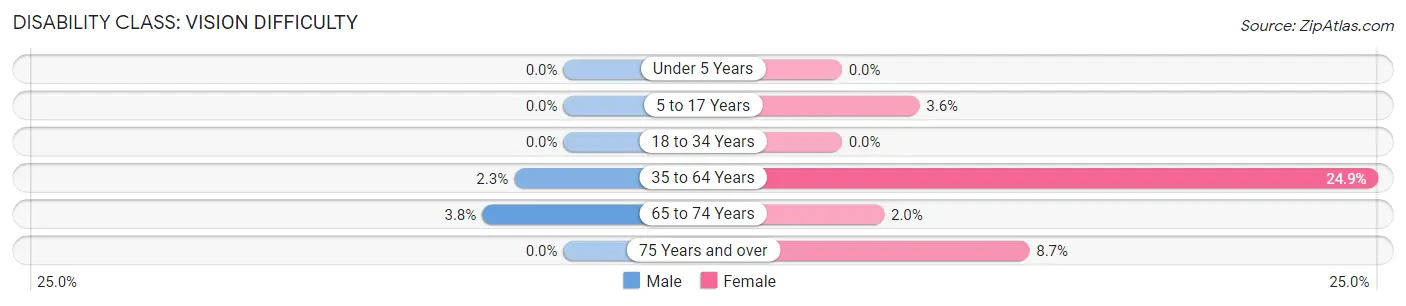
| Age Bracket | Male | Female |
| Under 5 Years | 0 (0.0%) | 0 (0.0%) |
| 5 to 17 Years | 0 (0.0%) | 4 (3.6%) |
| 18 to 34 Years | 0 (0.0%) | 0 (0.0%) |
| 35 to 64 Years | 5 (2.3%) | 65 (24.9%) |
| 65 to 74 Years | 2 (3.8%) | 1 (2.0%) |
| 75 Years and over | 0 (0.0%) | 2 (8.7%) |
Disability Class: Cognitive Difficulty
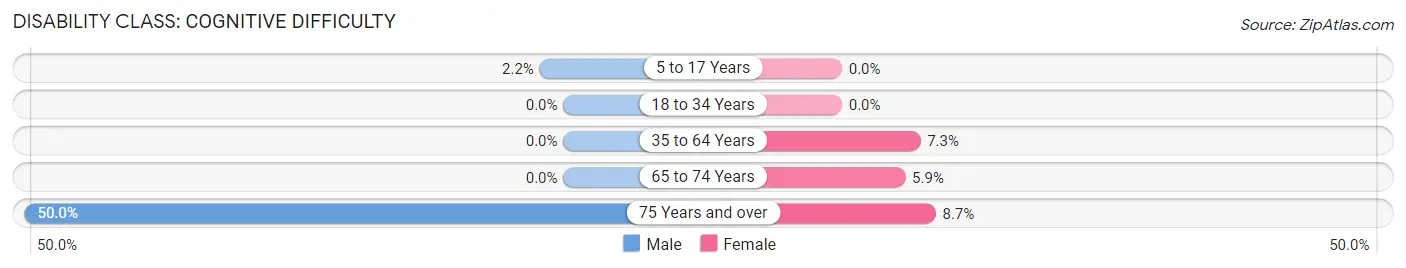
| Age Bracket | Male | Female |
| 5 to 17 Years | 2 (2.2%) | 0 (0.0%) |
| 18 to 34 Years | 0 (0.0%) | 0 (0.0%) |
| 35 to 64 Years | 0 (0.0%) | 19 (7.3%) |
| 65 to 74 Years | 0 (0.0%) | 3 (5.9%) |
| 75 Years and over | 5 (50.0%) | 2 (8.7%) |
Disability Class: Ambulatory Difficulty
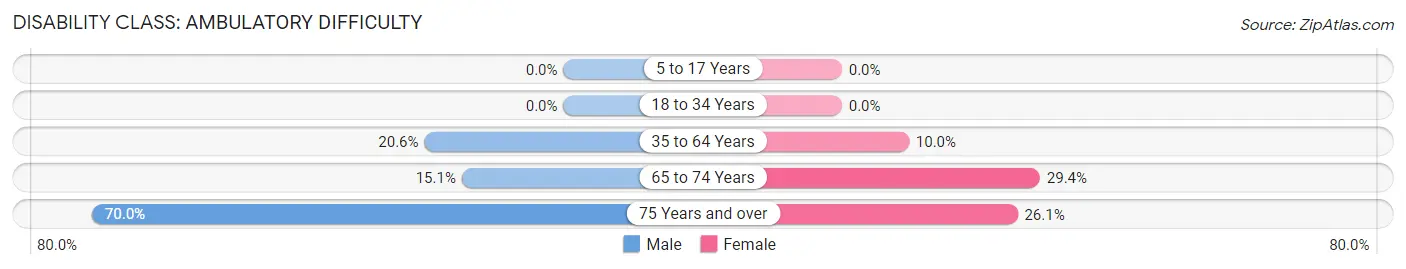
| Age Bracket | Male | Female |
| 5 to 17 Years | 0 (0.0%) | 0 (0.0%) |
| 18 to 34 Years | 0 (0.0%) | 0 (0.0%) |
| 35 to 64 Years | 45 (20.6%) | 26 (10.0%) |
| 65 to 74 Years | 8 (15.1%) | 15 (29.4%) |
| 75 Years and over | 7 (70.0%) | 6 (26.1%) |
Disability Class: Self-Care Difficulty
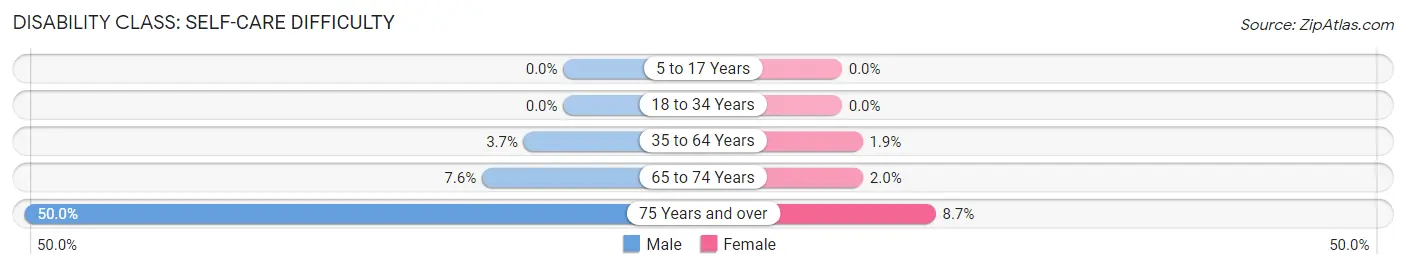
| Age Bracket | Male | Female |
| 5 to 17 Years | 0 (0.0%) | 0 (0.0%) |
| 18 to 34 Years | 0 (0.0%) | 0 (0.0%) |
| 35 to 64 Years | 8 (3.7%) | 5 (1.9%) |
| 65 to 74 Years | 4 (7.5%) | 1 (2.0%) |
| 75 Years and over | 5 (50.0%) | 2 (8.7%) |
Technology Access in Woodville
Computing Device Access in Woodville
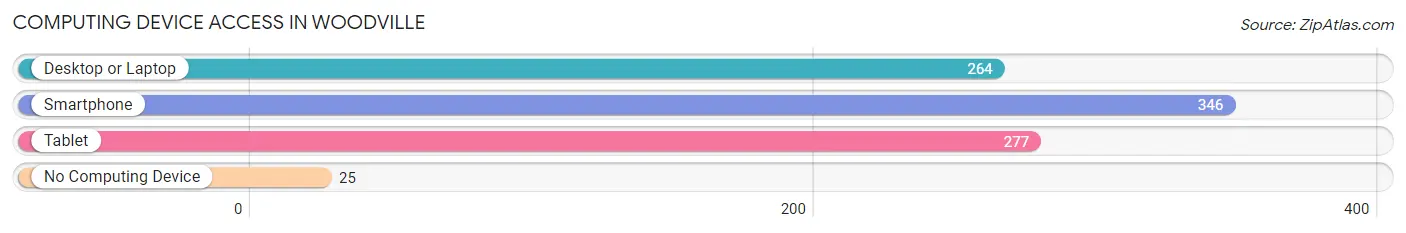
| Device Type | # Households | % Households |
| Desktop or Laptop | 264 | 68.4% |
| Smartphone | 346 | 89.6% |
| Tablet | 277 | 71.8% |
| No Computing Device | 25 | 6.5% |
| Total | 386 | 100.0% |
Internet Access in Woodville
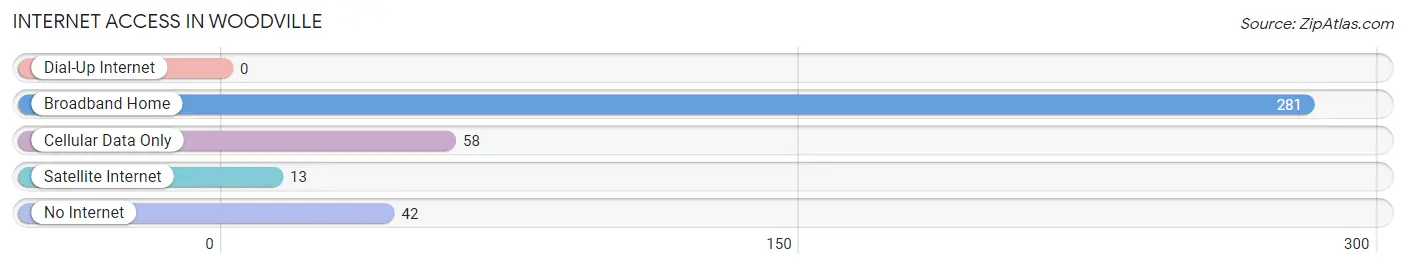
| Internet Type | # Households | % Households |
| Dial-Up Internet | 0 | 0.0% |
| Broadband Home | 281 | 72.8% |
| Cellular Data Only | 58 | 15.0% |
| Satellite Internet | 13 | 3.4% |
| No Internet | 42 | 10.9% |
| Total | 386 | 100.0% |
Woodville Summary
Woodville is a small town located in Jackson County, Alabama. It is situated in the foothills of the Appalachian Mountains and is part of the Huntsville-Decatur Combined Statistical Area. The town has a population of approximately 1,500 people and is known for its rural charm and friendly atmosphere.
History
Woodville was founded in 1818 by a group of settlers from Georgia. The town was named after the nearby Woodville Creek, which was named after a local family. The town was originally a farming community, but it soon developed into a small industrial center. The town was home to several sawmills, gristmills, and a cotton gin. The town also had a post office, a general store, and a blacksmith shop.
In the late 19th century, the town began to decline as the local economy shifted away from agriculture and industry. The town was bypassed by the railroad and the population began to decline. By the early 20th century, the town had become a small, rural community.
Geography
Woodville is located in the foothills of the Appalachian Mountains in Jackson County, Alabama. The town is situated at the intersection of Alabama State Route 35 and Alabama State Route 65. The town is located approximately 25 miles south of Huntsville and approximately 40 miles north of Birmingham.
The town is situated in a hilly region and is surrounded by forests and farmland. The town is located near the Woodville Creek, which is a tributary of the Tennessee River. The town is also located near the Paint Rock River, which is a tributary of the Tennessee River.
Economy
The economy of Woodville is largely based on agriculture and forestry. The town is home to several farms and timber companies. The town is also home to several small businesses, including a grocery store, a hardware store, and a restaurant.
The town is also home to several manufacturing companies, including a furniture manufacturer and a plastics manufacturer. The town is also home to a small airport, which is used for private and commercial flights.
Demographics
As of the 2010 census, the population of Woodville was 1,500. The town is predominantly white, with approximately 95% of the population being white. The town is also home to a small African American population, with approximately 4% of the population being African American. The town is also home to a small Hispanic population, with approximately 1% of the population being Hispanic.
The median household income in Woodville is approximately $35,000. The median home value in the town is approximately $90,000. The town has a poverty rate of approximately 15%.
Conclusion
Woodville is a small town located in Jackson County, Alabama. The town has a population of approximately 1,500 people and is known for its rural charm and friendly atmosphere. The town is largely based on agriculture and forestry, and is home to several small businesses. The town is predominantly white, with a small African American and Hispanic population. The median household income in Woodville is approximately $35,000 and the median home value is approximately $90,000.
Common Questions
What is Per Capita Income in Woodville?
Per Capita income in Woodville is $24,966.
What is the Median Family Income in Woodville?
Median Family Income in Woodville is $70,417.
What is the Median Household income in Woodville?
Median Household Income in Woodville is $53,542.
What is Income or Wage Gap in Woodville?
Income or Wage Gap in Woodville is 39.6%.
Women in Woodville earn 60.4 cents for every dollar earned by a man.
What is Inequality or Gini Index in Woodville?
Inequality or Gini Index in Woodville is 0.41.
What is the Total Population of Woodville?
Total Population of Woodville is 1,053.
What is the Total Male Population of Woodville?
Total Male Population of Woodville is 445.
What is the Total Female Population of Woodville?
Total Female Population of Woodville is 608.
What is the Ratio of Males per 100 Females in Woodville?
There are 73.19 Males per 100 Females in Woodville.
What is the Ratio of Females per 100 Males in Woodville?
There are 136.63 Females per 100 Males in Woodville.
What is the Median Population Age in Woodville?
Median Population Age in Woodville is 42.1 Years.
What is the Average Family Size in Woodville
Average Family Size in Woodville is 3.6 People.
What is the Average Household Size in Woodville
Average Household Size in Woodville is 2.7 People.
How Large is the Labor Force in Woodville?
There are 439 People in the Labor Forcein in Woodville.
What is the Percentage of People in the Labor Force in Woodville?
51.8% of People are in the Labor Force in Woodville.
What is the Unemployment Rate in Woodville?
Unemployment Rate in Woodville is 10.9%.