Walnut Grove, AL Map & Demographics
Walnut Grove Map
Walnut Grove Overview
$22,155
PER CAPITA INCOME
$40,833
AVG FAMILY INCOME
$39,049
AVG HOUSEHOLD INCOME
0.44
INEQUALITY / GINI INDEX
873
TOTAL POPULATION
417
MALE POPULATION
456
FEMALE POPULATION
91.45
MALES / 100 FEMALES
109.35
FEMALES / 100 MALES
47.3
MEDIAN AGE
2.8
AVG FAMILY SIZE
2.5
AVG HOUSEHOLD SIZE
383
LABOR FORCE [ PEOPLE ]
52.3%
PERCENT IN LABOR FORCE
1.0%
UNEMPLOYMENT RATE
Income in Walnut Grove
Income Overview in Walnut Grove
Per Capita Income in Walnut Grove is $22,155, while median incomes of families and households are $40,833 and $39,049 respectively.
| Characteristic | Number | Measure |
| Per Capita Income | 873 | $22,155 |
| Median Family Income | 256 | $40,833 |
| Mean Family Income | 256 | $57,700 |
| Median Household Income | 347 | $39,049 |
| Mean Household Income | 347 | $53,202 |
| Income Deficit | 256 | $0 |
| Wage / Income Gap (%) | 873 | 0.00% |
| Wage / Income Gap ($) | 873 | 100.00¢ per $1 |
| Gini / Inequality Index | 873 | 0.44 |
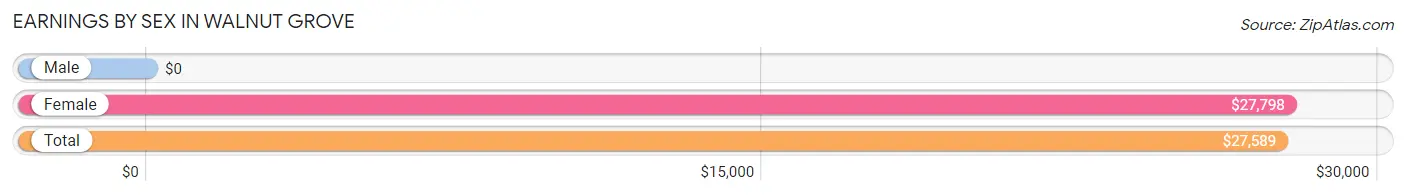
Earnings by Sex in Walnut Grove
| Sex | Number | Average Earnings |
| Male | 209 (52.6%) | $0 |
| Female | 188 (47.4%) | $27,798 |
| Total | 397 (100.0%) | $27,589 |
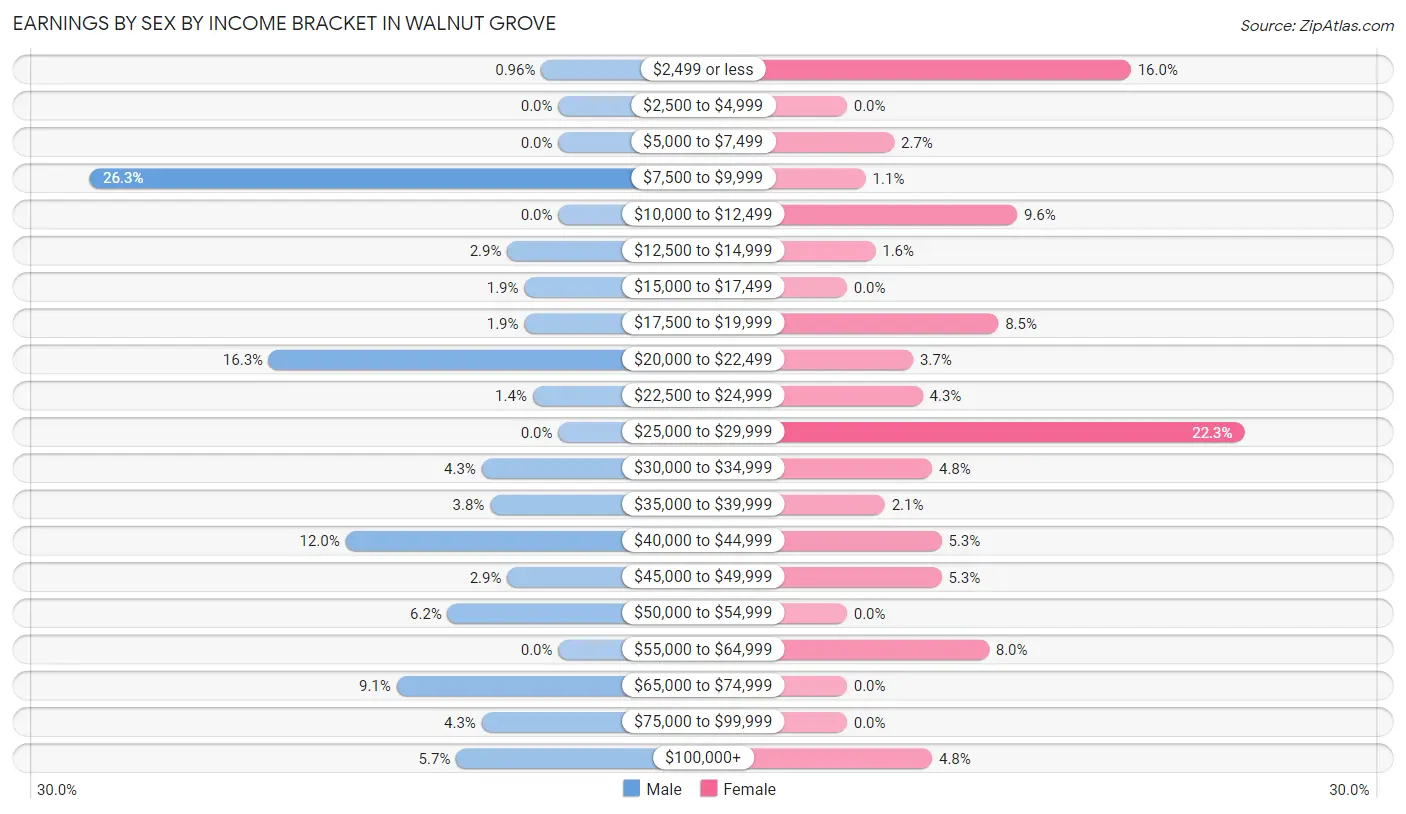
Earnings by Sex by Income Bracket in Walnut Grove
The most common earnings brackets in Walnut Grove are $7,500 to $9,999 for men (55 | 26.3%) and $25,000 to $29,999 for women (42 | 22.3%).
| Income | Male | Female |
| $2,499 or less | 2 (1.0%) | 30 (16.0%) |
| $2,500 to $4,999 | 0 (0.0%) | 0 (0.0%) |
| $5,000 to $7,499 | 0 (0.0%) | 5 (2.7%) |
| $7,500 to $9,999 | 55 (26.3%) | 2 (1.1%) |
| $10,000 to $12,499 | 0 (0.0%) | 18 (9.6%) |
| $12,500 to $14,999 | 6 (2.9%) | 3 (1.6%) |
| $15,000 to $17,499 | 4 (1.9%) | 0 (0.0%) |
| $17,500 to $19,999 | 4 (1.9%) | 16 (8.5%) |
| $20,000 to $22,499 | 34 (16.3%) | 7 (3.7%) |
| $22,500 to $24,999 | 3 (1.4%) | 8 (4.3%) |
| $25,000 to $29,999 | 0 (0.0%) | 42 (22.3%) |
| $30,000 to $34,999 | 9 (4.3%) | 9 (4.8%) |
| $35,000 to $39,999 | 8 (3.8%) | 4 (2.1%) |
| $40,000 to $44,999 | 25 (12.0%) | 10 (5.3%) |
| $45,000 to $49,999 | 6 (2.9%) | 10 (5.3%) |
| $50,000 to $54,999 | 13 (6.2%) | 0 (0.0%) |
| $55,000 to $64,999 | 0 (0.0%) | 15 (8.0%) |
| $65,000 to $74,999 | 19 (9.1%) | 0 (0.0%) |
| $75,000 to $99,999 | 9 (4.3%) | 0 (0.0%) |
| $100,000+ | 12 (5.7%) | 9 (4.8%) |
| Total | 209 (100.0%) | 188 (100.0%) |
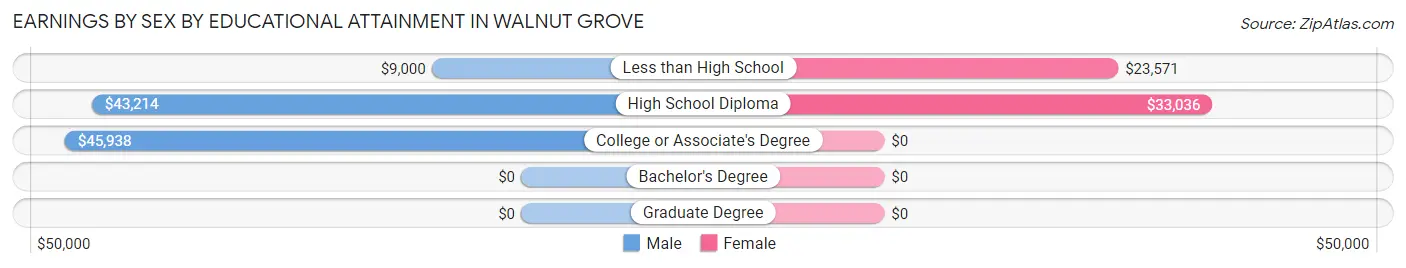
Earnings by Sex by Educational Attainment in Walnut Grove
| Educational Attainment | Male Income | Female Income |
| Less than High School | $9,000 | $23,571 |
| High School Diploma | $43,214 | $33,036 |
| College or Associate's Degree | $45,938 | $0 |
| Bachelor's Degree | - | - |
| Graduate Degree | - | - |
| Total | - | - |
Family Income in Walnut Grove
Family Income Brackets in Walnut Grove
According to the Walnut Grove family income data, there are 56 families falling into the $25,000 to $34,999 income range, which is the most common income bracket and makes up 21.9% of all families. Conversely, the less than $10,000 income bracket is the least frequent group with only 3 families (1.2%) belonging to this category.
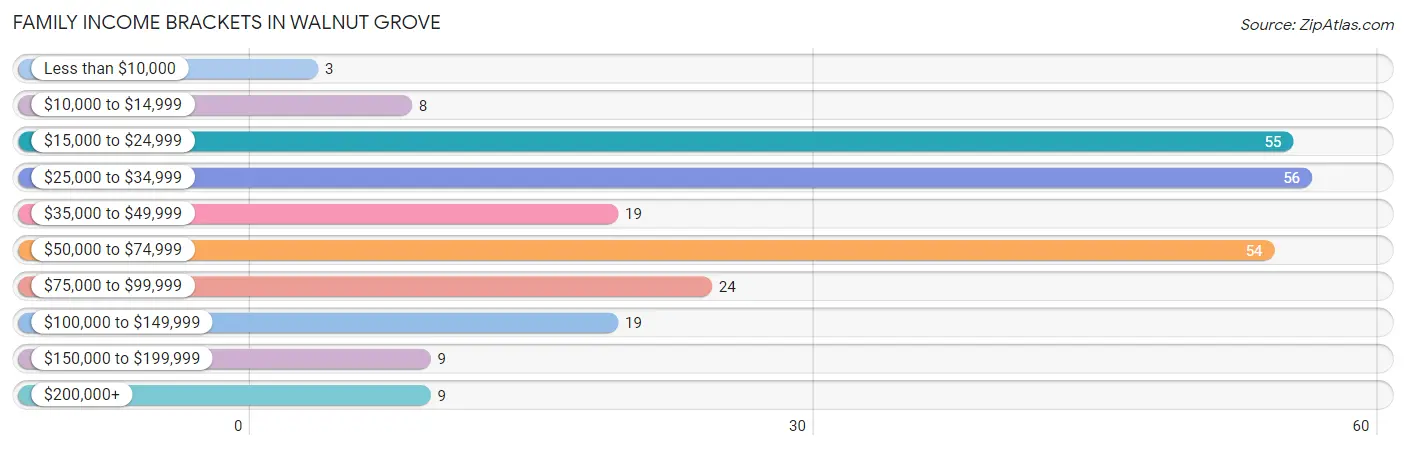
| Income Bracket | # Families | % Families |
| Less than $10,000 | 3 | 1.2% |
| $10,000 to $14,999 | 8 | 3.1% |
| $15,000 to $24,999 | 55 | 21.5% |
| $25,000 to $34,999 | 56 | 21.9% |
| $35,000 to $49,999 | 19 | 7.4% |
| $50,000 to $74,999 | 54 | 21.1% |
| $75,000 to $99,999 | 24 | 9.4% |
| $100,000 to $149,999 | 19 | 7.4% |
| $150,000 to $199,999 | 9 | 3.5% |
| $200,000+ | 9 | 3.5% |
Family Income by Famaliy Size in Walnut Grove
6-person families (6 | 2.3%) account for the highest median family income in Walnut Grove with $76,250 per family, while 2-person families (142 | 55.5%) have the highest median income of $28,750 per family member.
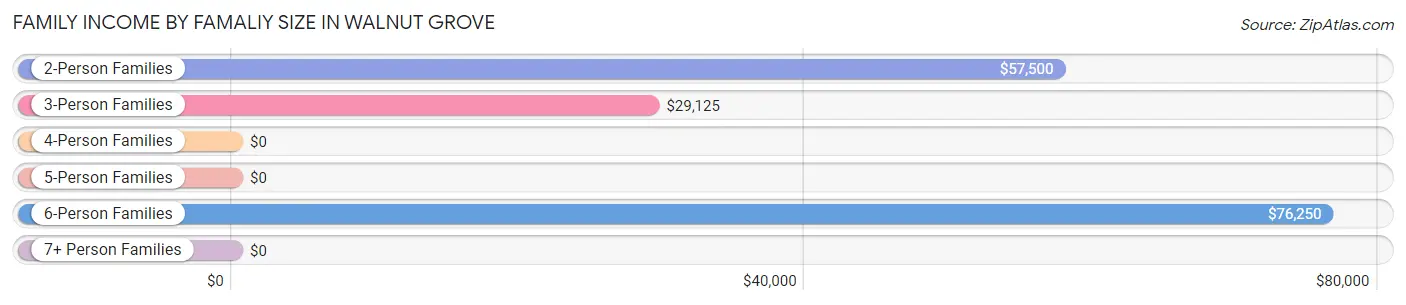
| Income Bracket | # Families | Median Income |
| 2-Person Families | 142 (55.5%) | $57,500 |
| 3-Person Families | 64 (25.0%) | $29,125 |
| 4-Person Families | 29 (11.3%) | $0 |
| 5-Person Families | 15 (5.9%) | $0 |
| 6-Person Families | 6 (2.3%) | $76,250 |
| 7+ Person Families | 0 (0.0%) | $0 |
| Total | 256 (100.0%) | $40,833 |
Family Income by Number of Earners in Walnut Grove
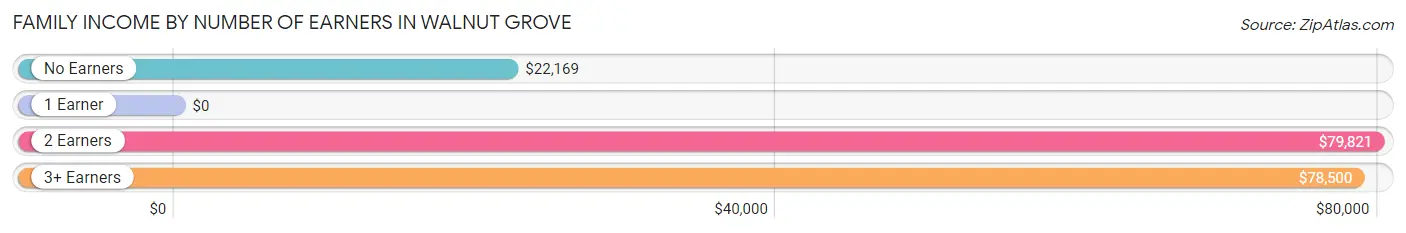
| Number of Earners | # Families | Median Income |
| No Earners | 71 (27.7%) | $22,169 |
| 1 Earner | 108 (42.2%) | $0 |
| 2 Earners | 57 (22.3%) | $79,821 |
| 3+ Earners | 20 (7.8%) | $78,500 |
| Total | 256 (100.0%) | $40,833 |
Household Income in Walnut Grove
Household Income Brackets in Walnut Grove
With 87 households falling in the category, the $15,000 to $24,999 income range is the most frequent in Walnut Grove, accounting for 25.1% of all households. In contrast, only 9 households (2.6%) fall into the $150,000 to $199,999 income bracket, making it the least populous group.
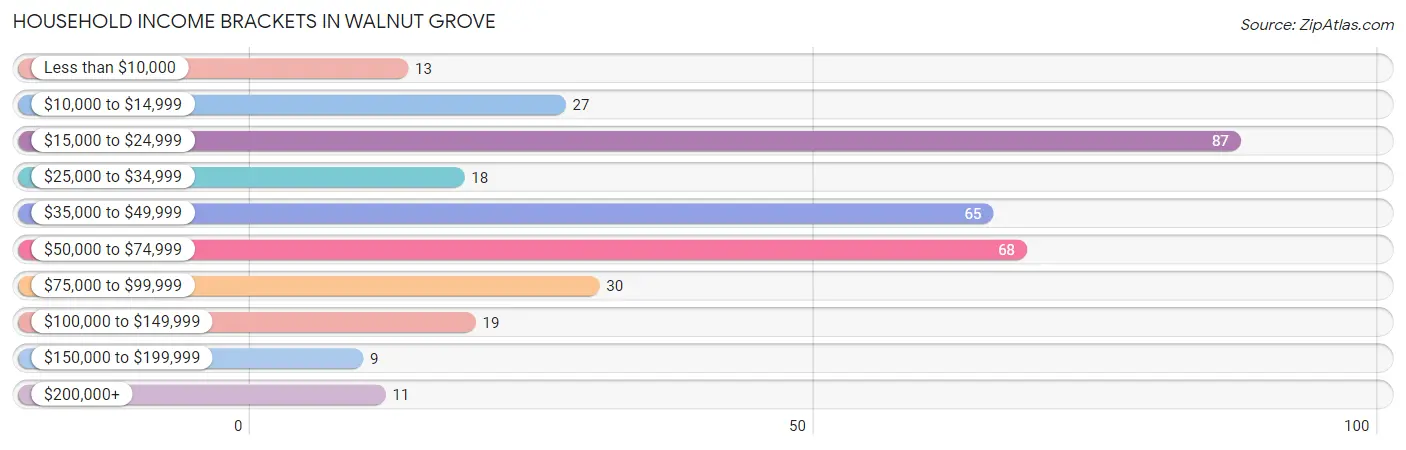
| Income Bracket | # Households | % Households |
| Less than $10,000 | 13 | 3.7% |
| $10,000 to $14,999 | 27 | 7.8% |
| $15,000 to $24,999 | 87 | 25.1% |
| $25,000 to $34,999 | 18 | 5.2% |
| $35,000 to $49,999 | 65 | 18.7% |
| $50,000 to $74,999 | 68 | 19.6% |
| $75,000 to $99,999 | 30 | 8.6% |
| $100,000 to $149,999 | 19 | 5.5% |
| $150,000 to $199,999 | 9 | 2.6% |
| $200,000+ | 11 | 3.2% |
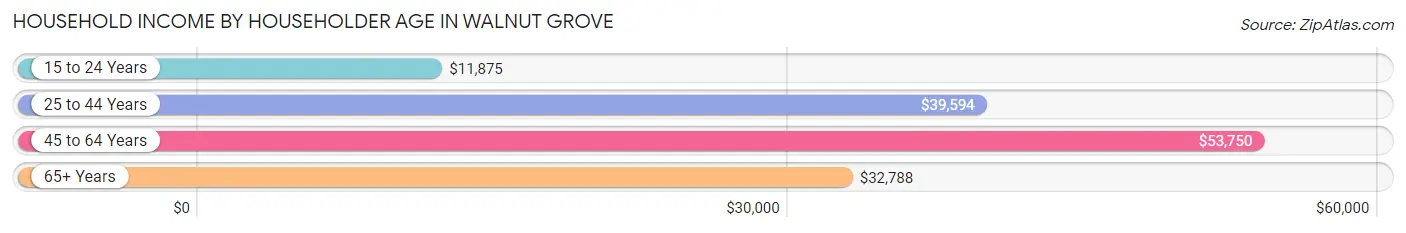
Household Income by Householder Age in Walnut Grove
The median household income in Walnut Grove is $39,049, with the highest median household income of $53,750 found in the 45 to 64 years age bracket for the primary householder. A total of 153 households (44.1%) fall into this category. Meanwhile, the 15 to 24 years age bracket for the primary householder has the lowest median household income of $11,875, with 18 households (5.2%) in this group.
| Income Bracket | # Households | Median Income |
| 15 to 24 Years | 18 (5.2%) | $11,875 |
| 25 to 44 Years | 69 (19.9%) | $39,594 |
| 45 to 64 Years | 153 (44.1%) | $53,750 |
| 65+ Years | 107 (30.8%) | $32,788 |
| Total | 347 (100.0%) | $39,049 |
Poverty in Walnut Grove
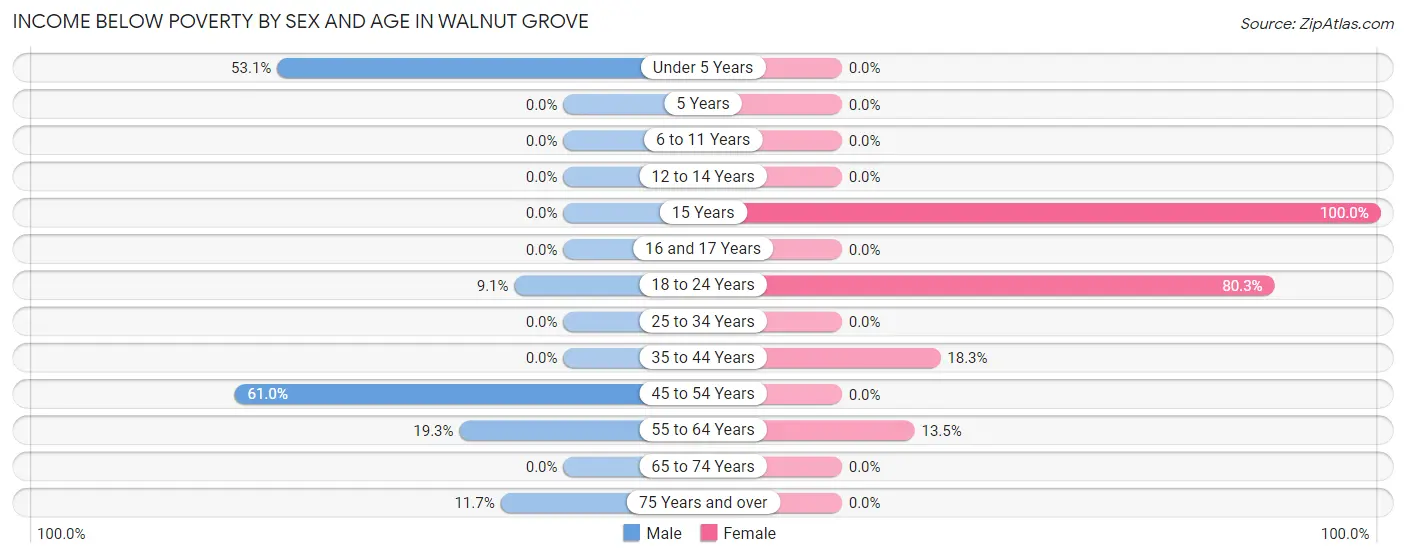
Income Below Poverty by Sex and Age in Walnut Grove
With 26.4% poverty level for males and 18.0% for females among the residents of Walnut Grove, 45 to 54 year old males and 15 year old females are the most vulnerable to poverty, with 72 males (61.0%) and 9 females (100.0%) in their respective age groups living below the poverty level.
| Age Bracket | Male | Female |
| Under 5 Years | 17 (53.1%) | 0 (0.0%) |
| 5 Years | 0 (0.0%) | 0 (0.0%) |
| 6 to 11 Years | 0 (0.0%) | 0 (0.0%) |
| 12 to 14 Years | 0 (0.0%) | 0 (0.0%) |
| 15 Years | 0 (0.0%) | 9 (100.0%) |
| 16 and 17 Years | 0 (0.0%) | 0 (0.0%) |
| 18 to 24 Years | 3 (9.1%) | 53 (80.3%) |
| 25 to 34 Years | 0 (0.0%) | 0 (0.0%) |
| 35 to 44 Years | 0 (0.0%) | 15 (18.3%) |
| 45 to 54 Years | 72 (61.0%) | 0 (0.0%) |
| 55 to 64 Years | 11 (19.3%) | 5 (13.5%) |
| 65 to 74 Years | 0 (0.0%) | 0 (0.0%) |
| 75 Years and over | 7 (11.7%) | 0 (0.0%) |
| Total | 110 (26.4%) | 82 (18.0%) |
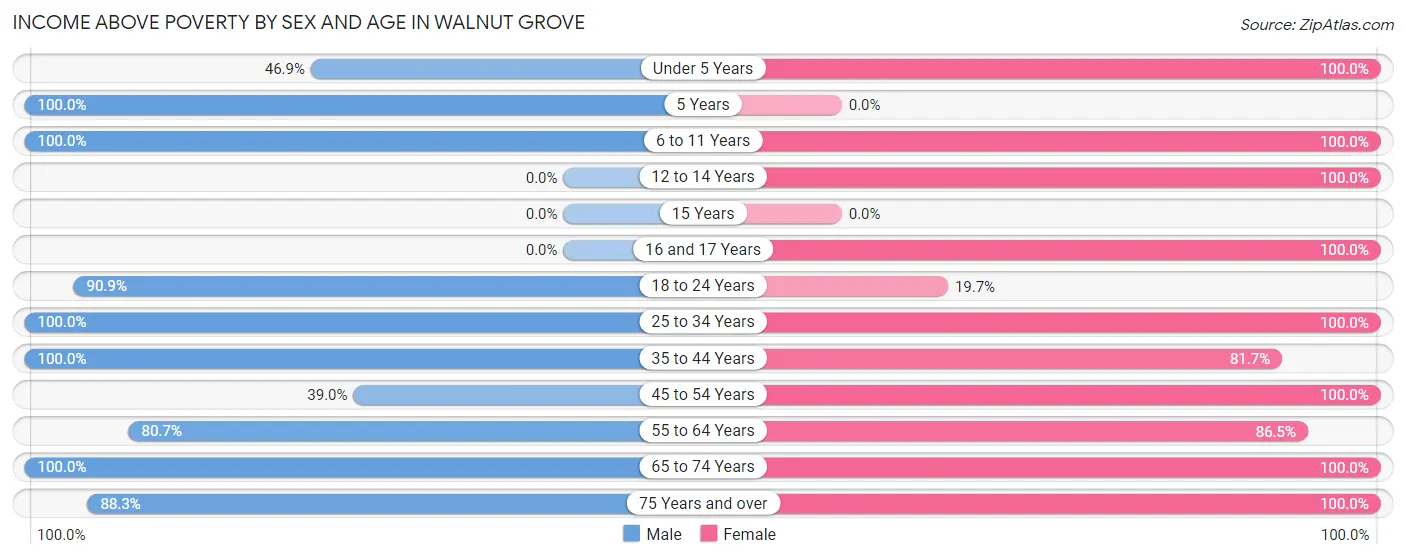
Income Above Poverty by Sex and Age in Walnut Grove
According to the poverty statistics in Walnut Grove, males aged 5 years and females aged under 5 years are the age groups that are most secure financially, with 100.0% of males and 100.0% of females in these age groups living above the poverty line.
| Age Bracket | Male | Female |
| Under 5 Years | 15 (46.9%) | 34 (100.0%) |
| 5 Years | 2 (100.0%) | 0 (0.0%) |
| 6 to 11 Years | 45 (100.0%) | 7 (100.0%) |
| 12 to 14 Years | 0 (0.0%) | 11 (100.0%) |
| 15 Years | 0 (0.0%) | 0 (0.0%) |
| 16 and 17 Years | 0 (0.0%) | 7 (100.0%) |
| 18 to 24 Years | 30 (90.9%) | 13 (19.7%) |
| 25 to 34 Years | 2 (100.0%) | 22 (100.0%) |
| 35 to 44 Years | 36 (100.0%) | 67 (81.7%) |
| 45 to 54 Years | 46 (39.0%) | 95 (100.0%) |
| 55 to 64 Years | 46 (80.7%) | 32 (86.5%) |
| 65 to 74 Years | 32 (100.0%) | 30 (100.0%) |
| 75 Years and over | 53 (88.3%) | 56 (100.0%) |
| Total | 307 (73.6%) | 374 (82.0%) |
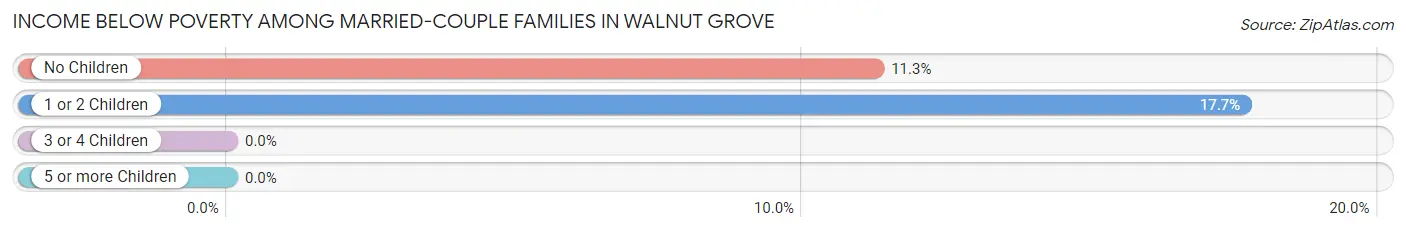
Income Below Poverty Among Married-Couple Families in Walnut Grove
The poverty statistics for married-couple families in Walnut Grove show that 10.8% or 21 of the total 194 families live below the poverty line. Families with 1 or 2 children have the highest poverty rate of 17.6%, comprising of 3 families. On the other hand, families with 3 or 4 children have the lowest poverty rate of 0.0%, which includes 0 families.
| Children | Above Poverty | Below Poverty |
| No Children | 142 (88.7%) | 18 (11.3%) |
| 1 or 2 Children | 14 (82.4%) | 3 (17.6%) |
| 3 or 4 Children | 17 (100.0%) | 0 (0.0%) |
| 5 or more Children | 0 (0.0%) | 0 (0.0%) |
| Total | 173 (89.2%) | 21 (10.8%) |
Income Below Poverty Among Single-Parent Households in Walnut Grove
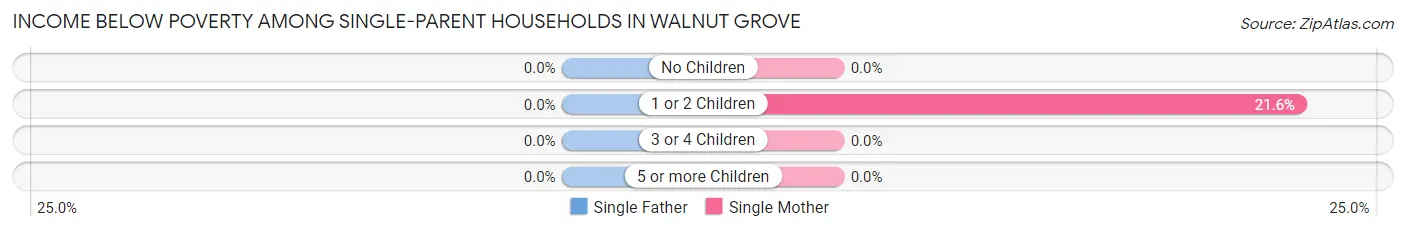
| Children | Single Father | Single Mother |
| No Children | 0 (0.0%) | 0 (0.0%) |
| 1 or 2 Children | 0 (0.0%) | 11 (21.6%) |
| 3 or 4 Children | 0 (0.0%) | 0 (0.0%) |
| 5 or more Children | 0 (0.0%) | 0 (0.0%) |
| Total | 0 (0.0%) | 11 (17.7%) |
Income Below Poverty Among Married-Couple vs Single-Parent Households in Walnut Grove
The poverty data for Walnut Grove shows that 21 of the married-couple family households (10.8%) and 11 of the single-parent households (17.7%) are living below the poverty level. Within the married-couple family households, those with 1 or 2 children have the highest poverty rate, with 3 households (17.6%) falling below the poverty line. Among the single-parent households, those with 1 or 2 children have the highest poverty rate, with 11 household (21.6%) living below poverty.
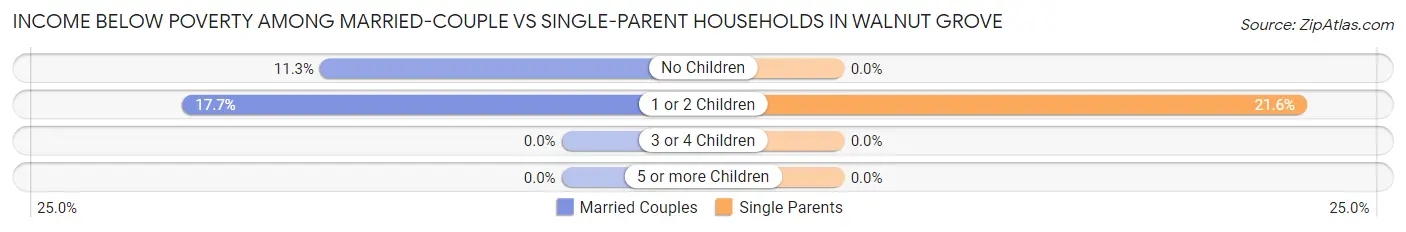
| Children | Married-Couple Families | Single-Parent Households |
| No Children | 18 (11.3%) | 0 (0.0%) |
| 1 or 2 Children | 3 (17.6%) | 11 (21.6%) |
| 3 or 4 Children | 0 (0.0%) | 0 (0.0%) |
| 5 or more Children | 0 (0.0%) | 0 (0.0%) |
| Total | 21 (10.8%) | 11 (17.7%) |
Race in Walnut Grove
The most populous races in Walnut Grove are White / Caucasian (856 | 98.1%), Hispanic or Latino (144 | 16.5%), and Asian (9 | 1.0%).
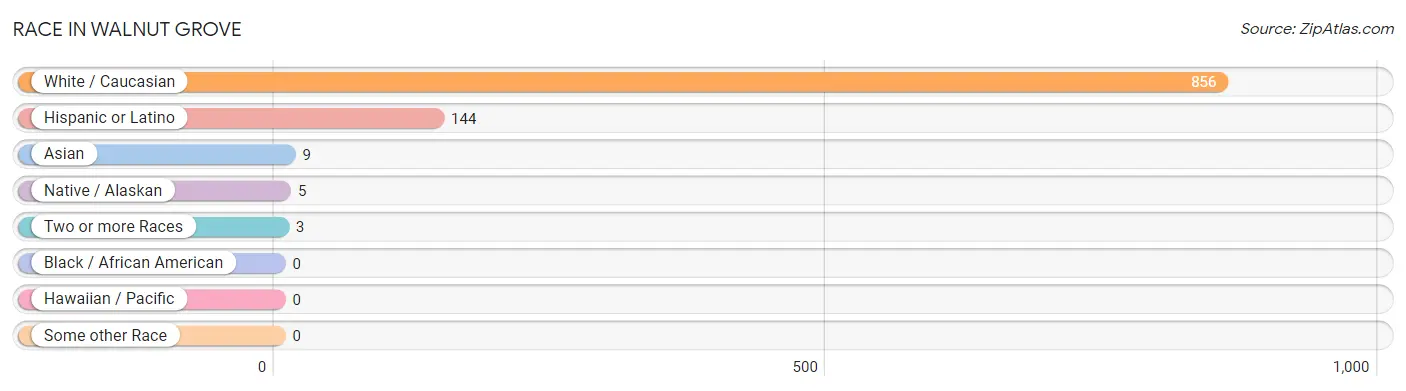
| Race | # Population | % Population |
| Asian | 9 | 1.0% |
| Black / African American | 0 | 0.0% |
| Hawaiian / Pacific | 0 | 0.0% |
| Hispanic or Latino | 144 | 16.5% |
| Native / Alaskan | 5 | 0.6% |
| White / Caucasian | 856 | 98.1% |
| Two or more Races | 3 | 0.3% |
| Some other Race | 0 | 0.0% |
| Total | 873 | 100.0% |
Ancestry in Walnut Grove
The most populous ancestries reported in Walnut Grove are American (275 | 31.5%), Mexican (144 | 16.5%), Irish (60 | 6.9%), English (39 | 4.5%), and Italian (27 | 3.1%), together accounting for 62.4% of all Walnut Grove residents.
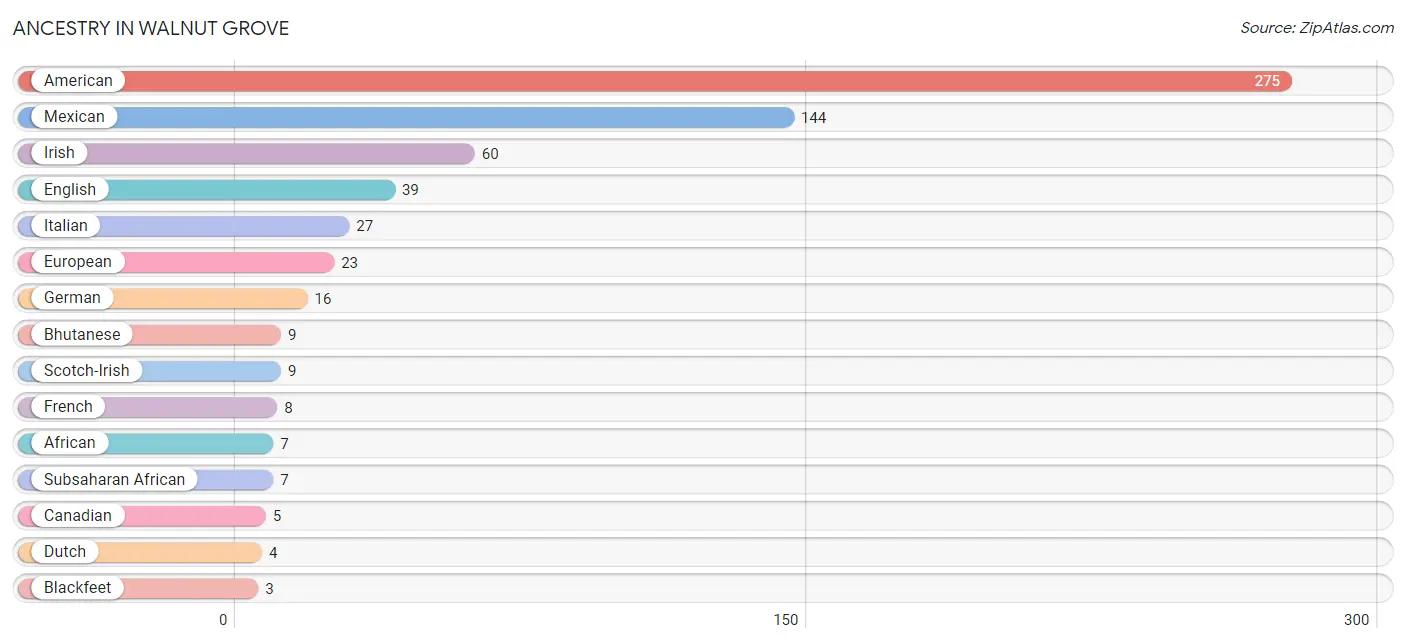
| Ancestry | # Population | % Population |
| African | 7 | 0.8% |
| American | 275 | 31.5% |
| Bhutanese | 9 | 1.0% |
| Blackfeet | 3 | 0.3% |
| British | 2 | 0.2% |
| Canadian | 5 | 0.6% |
| Celtic | 2 | 0.2% |
| Cherokee | 3 | 0.3% |
| Dutch | 4 | 0.5% |
| English | 39 | 4.5% |
| European | 23 | 2.6% |
| French | 8 | 0.9% |
| German | 16 | 1.8% |
| Irish | 60 | 6.9% |
| Italian | 27 | 3.1% |
| Mexican | 144 | 16.5% |
| Scotch-Irish | 9 | 1.0% |
| Scottish | 2 | 0.2% |
| Subsaharan African | 7 | 0.8% |
| Swedish | 2 | 0.2% | View All 20 Rows |
Immigrants in Walnut Grove
The most numerous immigrant groups reported in Walnut Grove came from Central America (96 | 11.0%), Latin America (96 | 11.0%), and Mexico (96 | 11.0%), together accounting for 33.0% of all Walnut Grove residents.
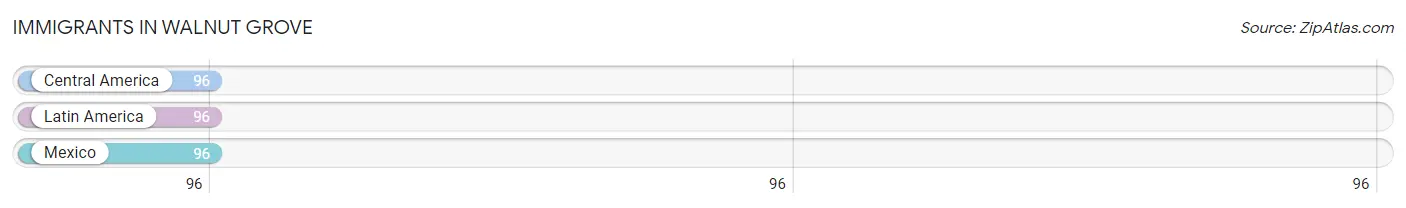
| Immigration Origin | # Population | % Population |
| Central America | 96 | 11.0% |
| Latin America | 96 | 11.0% |
| Mexico | 96 | 11.0% | View All 3 Rows |
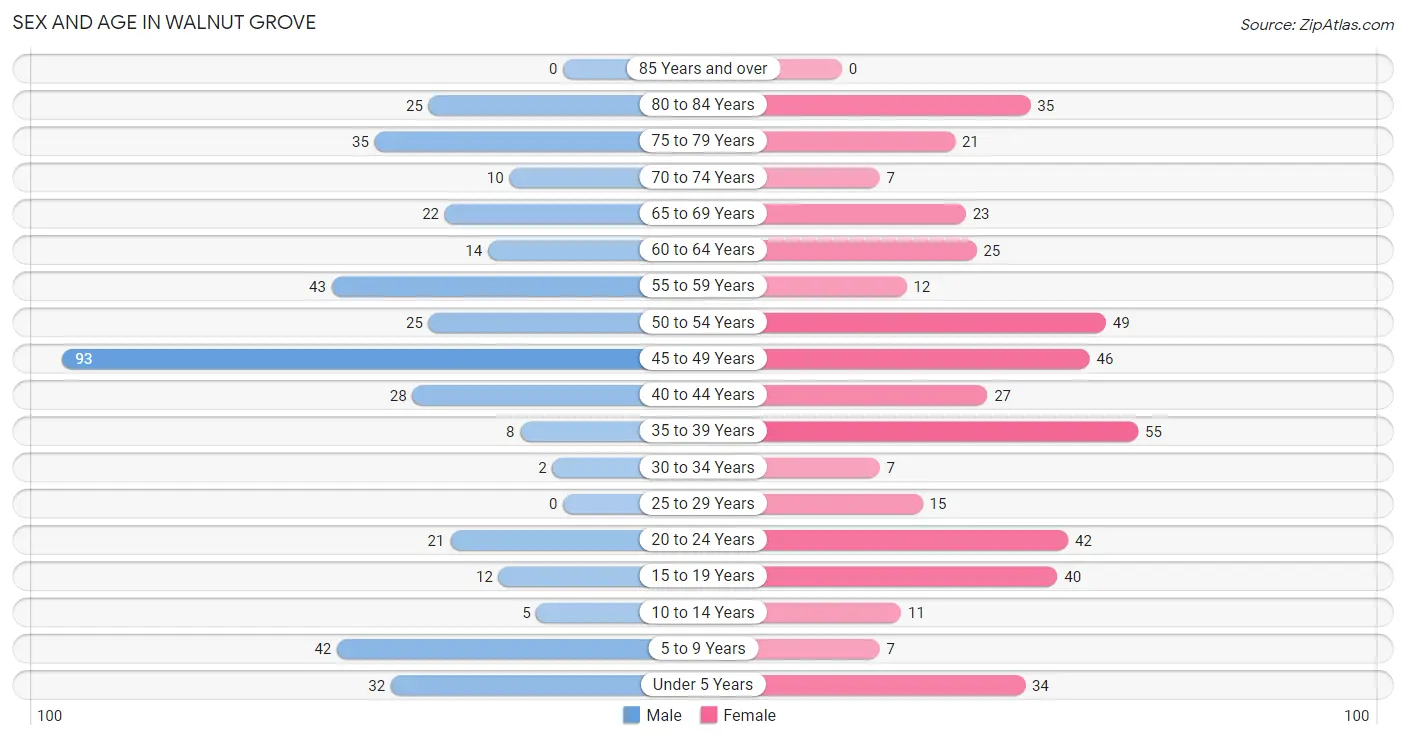
Sex and Age in Walnut Grove
Sex and Age in Walnut Grove
The most populous age groups in Walnut Grove are 45 to 49 Years (93 | 22.3%) for men and 35 to 39 Years (55 | 12.1%) for women.
| Age Bracket | Male | Female |
| Under 5 Years | 32 (7.7%) | 34 (7.5%) |
| 5 to 9 Years | 42 (10.1%) | 7 (1.5%) |
| 10 to 14 Years | 5 (1.2%) | 11 (2.4%) |
| 15 to 19 Years | 12 (2.9%) | 40 (8.8%) |
| 20 to 24 Years | 21 (5.0%) | 42 (9.2%) |
| 25 to 29 Years | 0 (0.0%) | 15 (3.3%) |
| 30 to 34 Years | 2 (0.5%) | 7 (1.5%) |
| 35 to 39 Years | 8 (1.9%) | 55 (12.1%) |
| 40 to 44 Years | 28 (6.7%) | 27 (5.9%) |
| 45 to 49 Years | 93 (22.3%) | 46 (10.1%) |
| 50 to 54 Years | 25 (6.0%) | 49 (10.7%) |
| 55 to 59 Years | 43 (10.3%) | 12 (2.6%) |
| 60 to 64 Years | 14 (3.4%) | 25 (5.5%) |
| 65 to 69 Years | 22 (5.3%) | 23 (5.0%) |
| 70 to 74 Years | 10 (2.4%) | 7 (1.5%) |
| 75 to 79 Years | 35 (8.4%) | 21 (4.6%) |
| 80 to 84 Years | 25 (6.0%) | 35 (7.7%) |
| 85 Years and over | 0 (0.0%) | 0 (0.0%) |
| Total | 417 (100.0%) | 456 (100.0%) |
Families and Households in Walnut Grove
Median Family Size in Walnut Grove
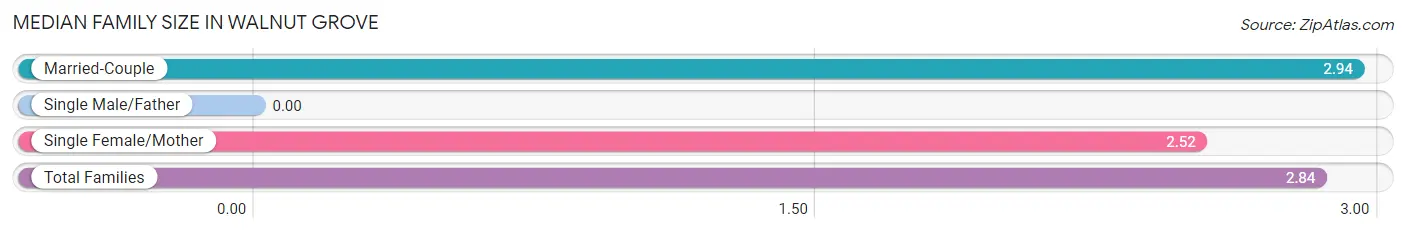
| Family Type | # Families | Family Size |
| Married-Couple | 194 (75.8%) | 2.94 |
| Single Male/Father | 0 (0.0%) | - |
| Single Female/Mother | 62 (24.2%) | 2.52 |
| Total Families | 256 (100.0%) | 2.84 |
Median Household Size in Walnut Grove
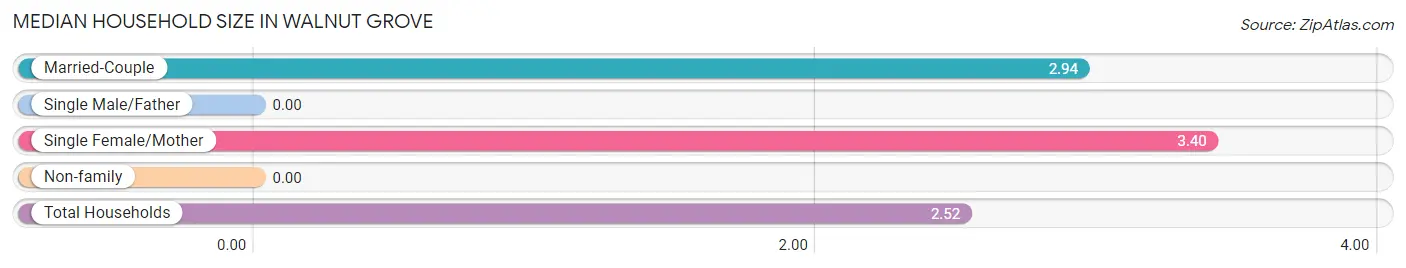
| Household Type | # Households | Household Size |
| Married-Couple | 194 (55.9%) | 2.94 |
| Single Male/Father | 0 (0.0%) | - |
| Single Female/Mother | 62 (17.9%) | 3.40 |
| Non-family | 91 (26.2%) | - |
| Total Households | 347 (100.0%) | 2.52 |
Household Size by Marriage Status in Walnut Grove
Out of a total of 347 households in Walnut Grove, 256 (73.8%) are family households, while 91 (26.2%) are nonfamily households. The most numerous type of family households are 2-person households, comprising 142, and the most common type of nonfamily households are 1-person households, comprising 91.
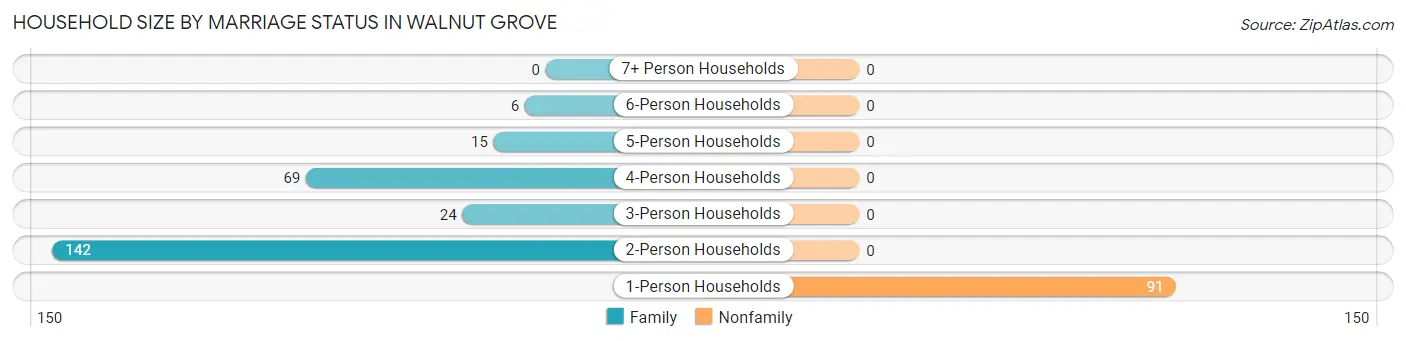
| Household Size | Family Households | Nonfamily Households |
| 1-Person Households | - | 91 (26.2%) |
| 2-Person Households | 142 (40.9%) | 0 (0.0%) |
| 3-Person Households | 24 (6.9%) | 0 (0.0%) |
| 4-Person Households | 69 (19.9%) | 0 (0.0%) |
| 5-Person Households | 15 (4.3%) | 0 (0.0%) |
| 6-Person Households | 6 (1.7%) | 0 (0.0%) |
| 7+ Person Households | 0 (0.0%) | 0 (0.0%) |
| Total | 256 (73.8%) | 91 (26.2%) |
Female Fertility in Walnut Grove
Fertility by Age in Walnut Grove
Average fertility rate in Walnut Grove is 68.0 births per 1,000 women. Women in the age bracket of 20 to 34 years have the highest fertility rate with 266.0 births per 1,000 women. Women in the age bracket of 20 to 34 years acount for 100.0% of all women with births.
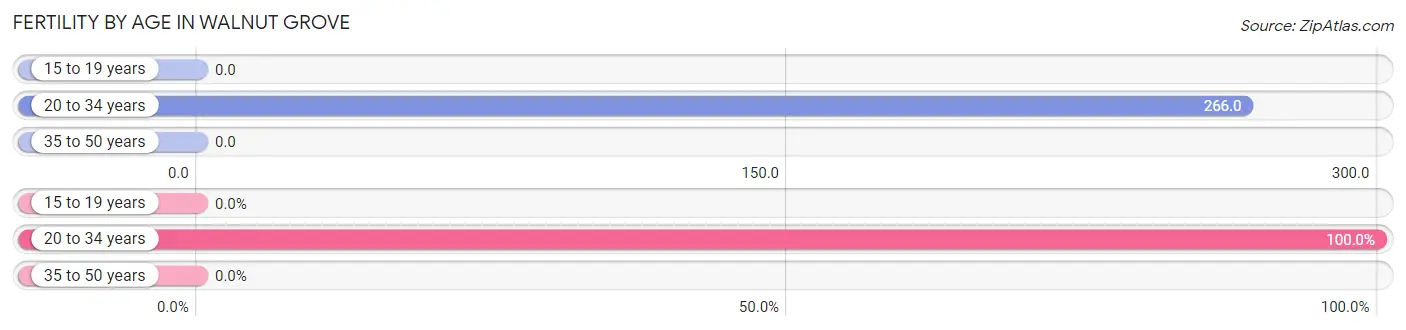
| Age Bracket | Women with Births | Births / 1,000 Women |
| 15 to 19 years | 0 (0.0%) | 0.0 |
| 20 to 34 years | 17 (100.0%) | 266.0 |
| 35 to 50 years | 0 (0.0%) | 0.0 |
| Total | 17 (100.0%) | 68.0 |
Fertility by Age by Marriage Status in Walnut Grove
17.6% of women with births (17) in Walnut Grove are married. The highest percentage of unmarried women with births falls into 20 to 34 years age bracket with 82.4% of them unmarried at the time of birth, while the lowest percentage of unmarried women with births belong to 20 to 34 years age bracket with 82.4% of them unmarried.
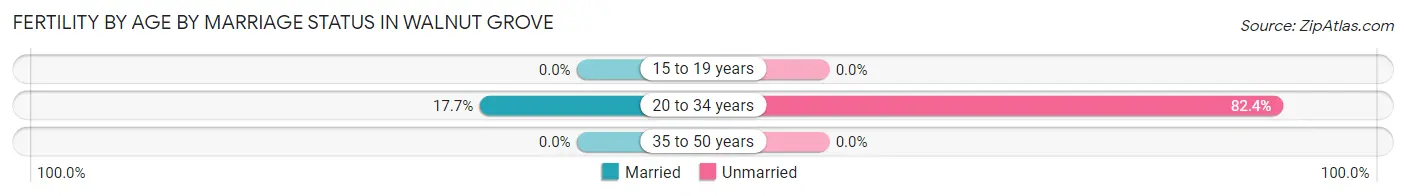
| Age Bracket | Married | Unmarried |
| 15 to 19 years | 0 (0.0%) | 0 (0.0%) |
| 20 to 34 years | 3 (17.6%) | 14 (82.4%) |
| 35 to 50 years | 0 (0.0%) | 0 (0.0%) |
| Total | 3 (17.6%) | 14 (82.4%) |
Fertility by Education in Walnut Grove
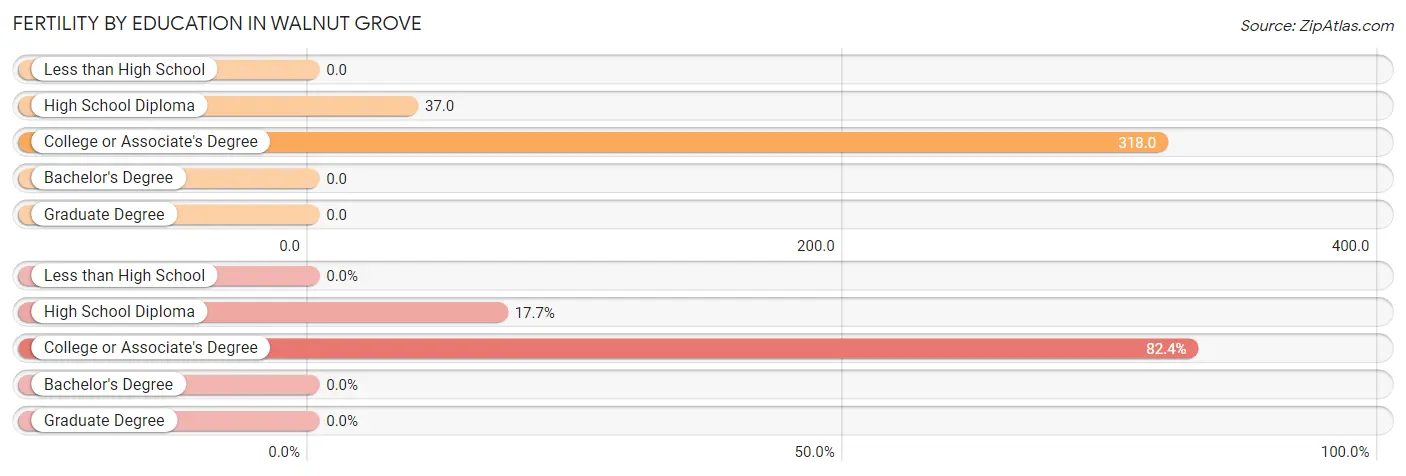
| Educational Attainment | Women with Births | Births / 1,000 Women |
| Less than High School | 0 (0.0%) | 0.0 |
| High School Diploma | 3 (17.6%) | 37.0 |
| College or Associate's Degree | 14 (82.4%) | 318.0 |
| Bachelor's Degree | 0 (0.0%) | 0.0 |
| Graduate Degree | 0 (0.0%) | 0.0 |
| Total | 17 (100.0%) | 68.0 |
Fertility by Education by Marriage Status in Walnut Grove
82.4% of women with births in Walnut Grove are unmarried. Women with the educational attainment of high school diploma are most likely to be married with 100.0% of them married at childbirth, while women with the educational attainment of college or associate's degree are least likely to be married with 100.0% of them unmarried at childbirth.
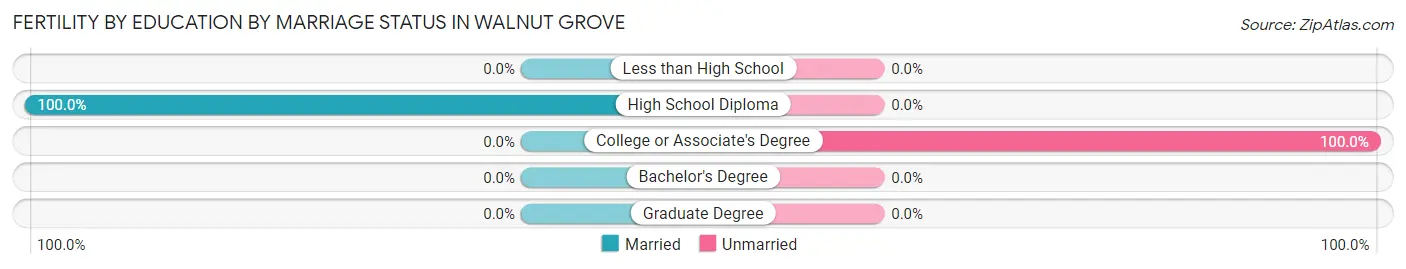
| Educational Attainment | Married | Unmarried |
| Less than High School | 0 (0.0%) | 0 (0.0%) |
| High School Diploma | 3 (100.0%) | 0 (0.0%) |
| College or Associate's Degree | 0 (0.0%) | 14 (100.0%) |
| Bachelor's Degree | 0 (0.0%) | 0 (0.0%) |
| Graduate Degree | 0 (0.0%) | 0 (0.0%) |
| Total | 3 (17.6%) | 14 (82.4%) |
Employment Characteristics in Walnut Grove
Employment by Class of Employer in Walnut Grove
Among the 379 employed individuals in Walnut Grove, private company employees (257 | 67.8%), self-employed (not incorporated) (62 | 16.4%), and local government employees (33 | 8.7%) make up the most common classes of employment.
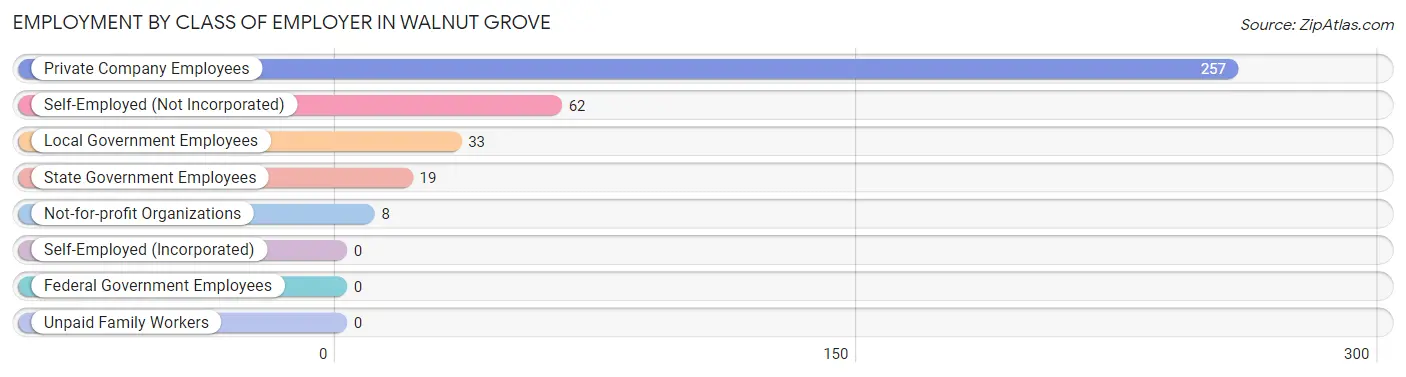
| Employer Class | # Employees | % Employees |
| Private Company Employees | 257 | 67.8% |
| Self-Employed (Incorporated) | 0 | 0.0% |
| Self-Employed (Not Incorporated) | 62 | 16.4% |
| Not-for-profit Organizations | 8 | 2.1% |
| Local Government Employees | 33 | 8.7% |
| State Government Employees | 19 | 5.0% |
| Federal Government Employees | 0 | 0.0% |
| Unpaid Family Workers | 0 | 0.0% |
| Total | 379 | 100.0% |
Employment Status by Age in Walnut Grove
According to the labor force statistics for Walnut Grove, out of the total population over 16 years of age (733), 52.3% or 383 individuals are in the labor force, with 1.0% or 4 of them unemployed. The age group with the highest labor force participation rate is 25 to 29 years, with 93.3% or 14 individuals in the labor force. Within the labor force, the 16 to 19 years age range has the highest percentage of unemployed individuals, with 26.7% or 4 of them being unemployed.
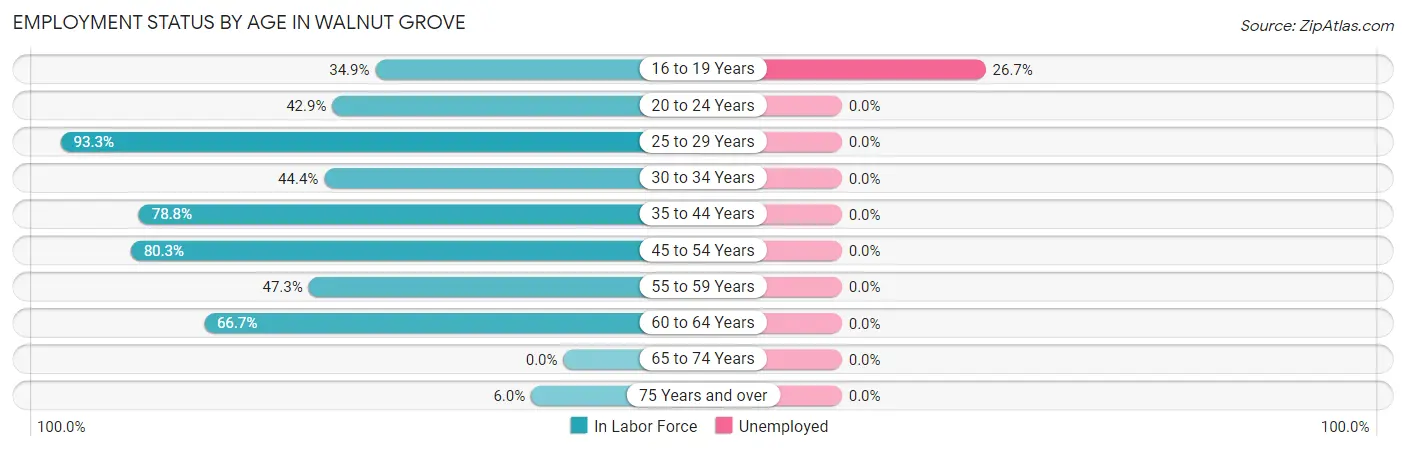
| Age Bracket | In Labor Force | Unemployed |
| 16 to 19 Years | 15 (34.9%) | 4 (26.7%) |
| 20 to 24 Years | 27 (42.9%) | 0 (0.0%) |
| 25 to 29 Years | 14 (93.3%) | 0 (0.0%) |
| 30 to 34 Years | 4 (44.4%) | 0 (0.0%) |
| 35 to 44 Years | 93 (78.8%) | 0 (0.0%) |
| 45 to 54 Years | 171 (80.3%) | 0 (0.0%) |
| 55 to 59 Years | 26 (47.3%) | 0 (0.0%) |
| 60 to 64 Years | 26 (66.7%) | 0 (0.0%) |
| 65 to 74 Years | 0 (0.0%) | 0 (0.0%) |
| 75 Years and over | 7 (6.0%) | 0 (0.0%) |
| Total | 383 (52.3%) | 4 (1.0%) |
Employment Status by Educational Attainment in Walnut Grove
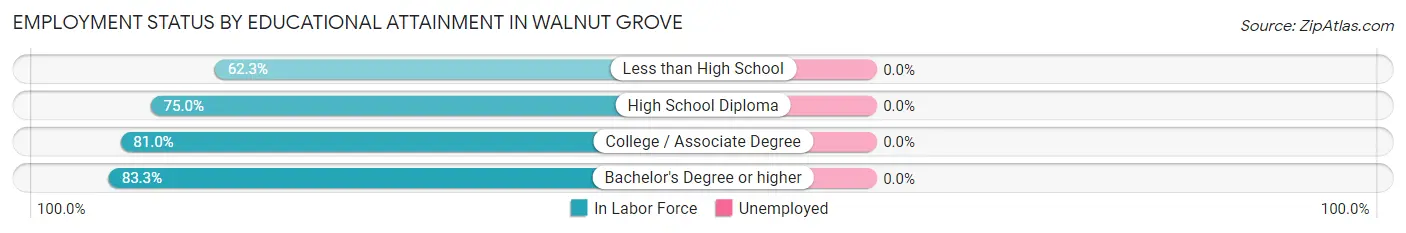
| Educational Attainment | In Labor Force | Unemployed |
| Less than High School | 76 (62.3%) | 0 (0.0%) |
| High School Diploma | 105 (75.0%) | 0 (0.0%) |
| College / Associate Degree | 98 (81.0%) | 0 (0.0%) |
| Bachelor's Degree or higher | 55 (83.3%) | 0 (0.0%) |
| Total | 334 (74.4%) | 0 (0.0%) |
Employment Occupations by Sex in Walnut Grove
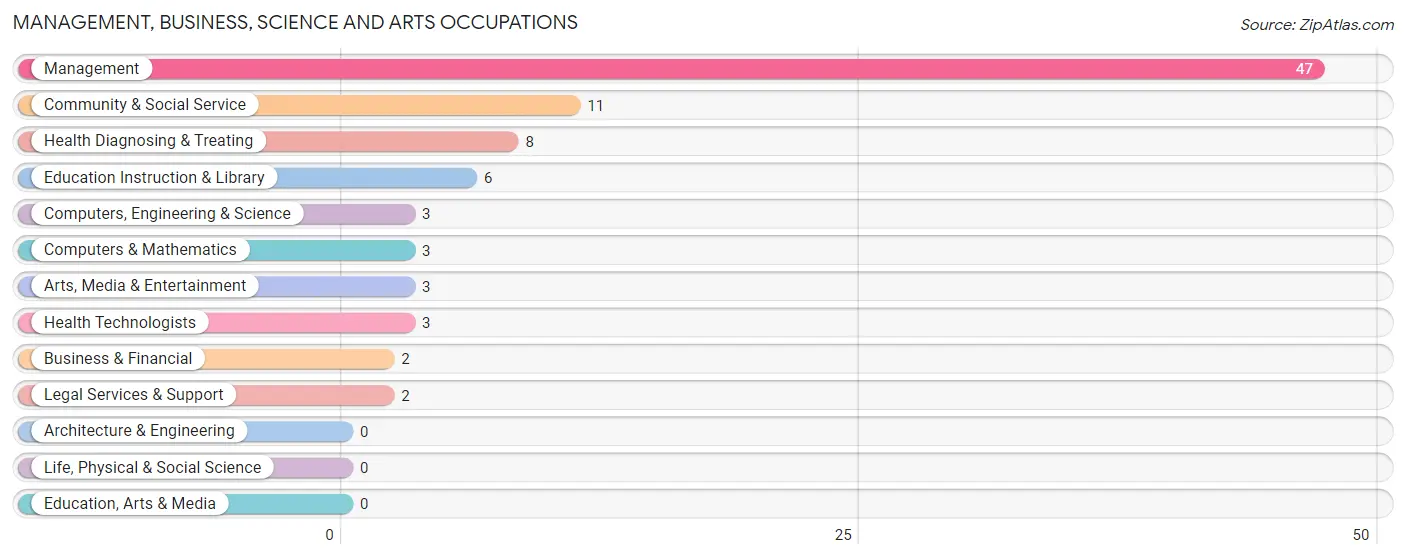
Management, Business, Science and Arts Occupations
The most common Management, Business, Science and Arts occupations in Walnut Grove are Management (47 | 12.4%), Community & Social Service (11 | 2.9%), Health Diagnosing & Treating (8 | 2.1%), Education Instruction & Library (6 | 1.6%), and Computers, Engineering & Science (3 | 0.8%).
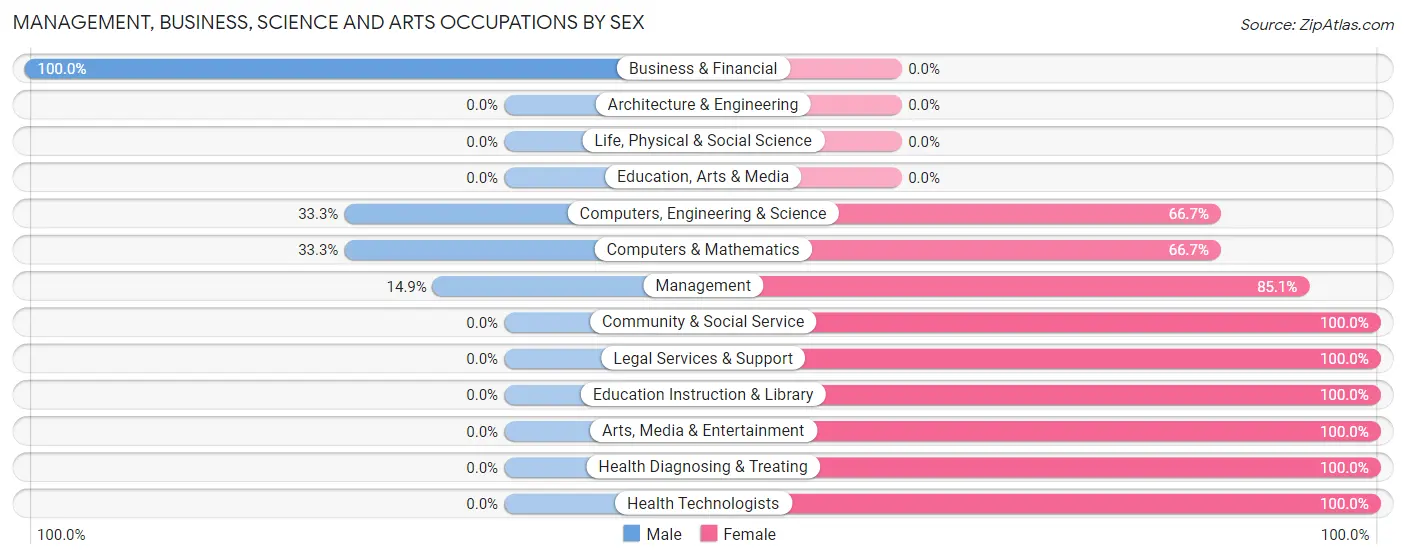
Management, Business, Science and Arts Occupations by Sex
Within the Management, Business, Science and Arts occupations in Walnut Grove, the most male-oriented occupations are Business & Financial (100.0%), Computers, Engineering & Science (33.3%), and Computers & Mathematics (33.3%), while the most female-oriented occupations are Community & Social Service (100.0%), Legal Services & Support (100.0%), and Education Instruction & Library (100.0%).
| Occupation | Male | Female |
| Management | 7 (14.9%) | 40 (85.1%) |
| Business & Financial | 2 (100.0%) | 0 (0.0%) |
| Computers, Engineering & Science | 1 (33.3%) | 2 (66.7%) |
| Computers & Mathematics | 1 (33.3%) | 2 (66.7%) |
| Architecture & Engineering | 0 (0.0%) | 0 (0.0%) |
| Life, Physical & Social Science | 0 (0.0%) | 0 (0.0%) |
| Community & Social Service | 0 (0.0%) | 11 (100.0%) |
| Education, Arts & Media | 0 (0.0%) | 0 (0.0%) |
| Legal Services & Support | 0 (0.0%) | 2 (100.0%) |
| Education Instruction & Library | 0 (0.0%) | 6 (100.0%) |
| Arts, Media & Entertainment | 0 (0.0%) | 3 (100.0%) |
| Health Diagnosing & Treating | 0 (0.0%) | 8 (100.0%) |
| Health Technologists | 0 (0.0%) | 3 (100.0%) |
| Total (Category) | 10 (14.1%) | 61 (85.9%) |
| Total (Overall) | 198 (52.2%) | 181 (47.8%) |
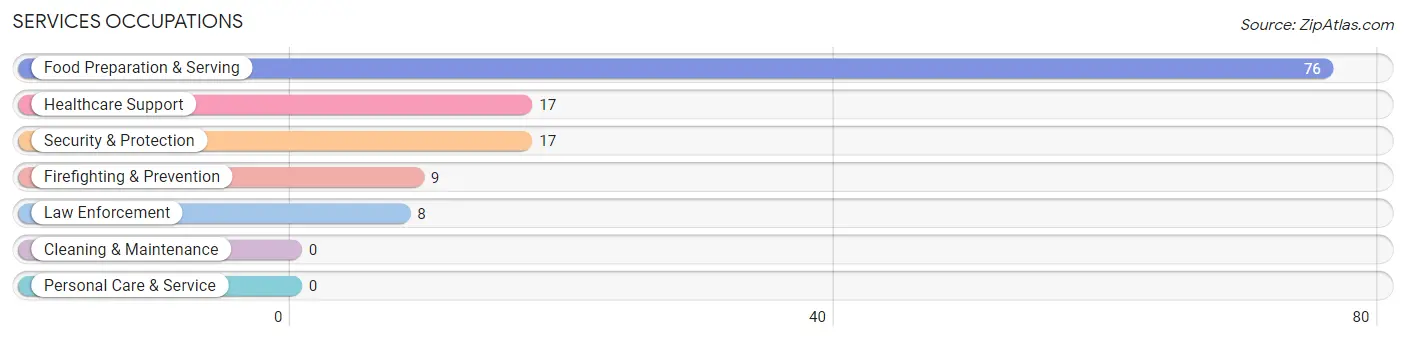
Services Occupations
The most common Services occupations in Walnut Grove are Food Preparation & Serving (76 | 20.1%), Healthcare Support (17 | 4.5%), Security & Protection (17 | 4.5%), Firefighting & Prevention (9 | 2.4%), and Law Enforcement (8 | 2.1%).
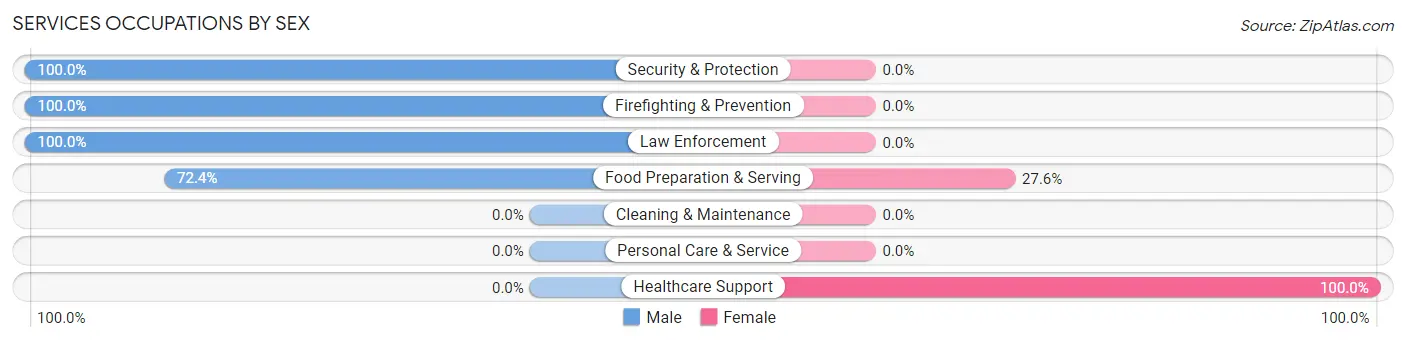
Services Occupations by Sex
Within the Services occupations in Walnut Grove, the most male-oriented occupations are Security & Protection (100.0%), Firefighting & Prevention (100.0%), and Law Enforcement (100.0%), while the most female-oriented occupations are Healthcare Support (100.0%), and Food Preparation & Serving (27.6%).
| Occupation | Male | Female |
| Healthcare Support | 0 (0.0%) | 17 (100.0%) |
| Security & Protection | 17 (100.0%) | 0 (0.0%) |
| Firefighting & Prevention | 9 (100.0%) | 0 (0.0%) |
| Law Enforcement | 8 (100.0%) | 0 (0.0%) |
| Food Preparation & Serving | 55 (72.4%) | 21 (27.6%) |
| Cleaning & Maintenance | 0 (0.0%) | 0 (0.0%) |
| Personal Care & Service | 0 (0.0%) | 0 (0.0%) |
| Total (Category) | 72 (65.4%) | 38 (34.5%) |
| Total (Overall) | 198 (52.2%) | 181 (47.8%) |
Sales and Office Occupations
The most common Sales and Office occupations in Walnut Grove are Sales & Related (41 | 10.8%), and Office & Administration (36 | 9.5%).
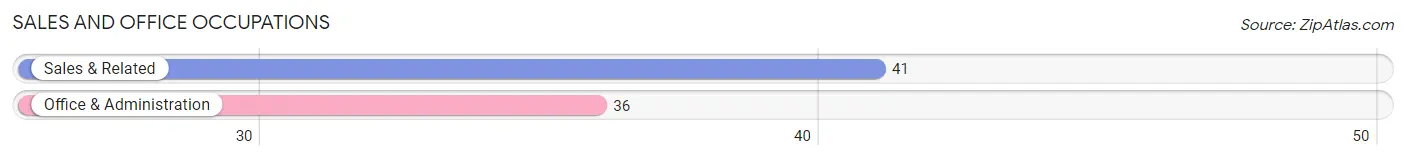
Sales and Office Occupations by Sex
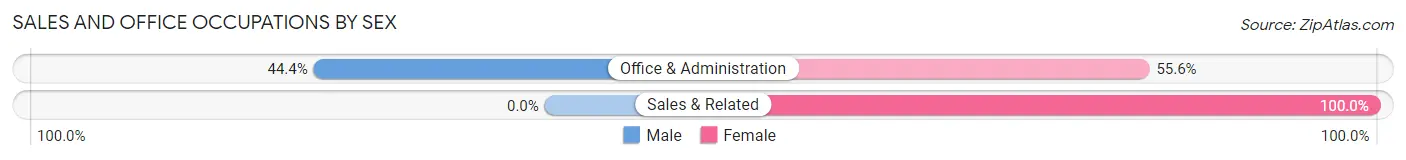
| Occupation | Male | Female |
| Sales & Related | 0 (0.0%) | 41 (100.0%) |
| Office & Administration | 16 (44.4%) | 20 (55.6%) |
| Total (Category) | 16 (20.8%) | 61 (79.2%) |
| Total (Overall) | 198 (52.2%) | 181 (47.8%) |
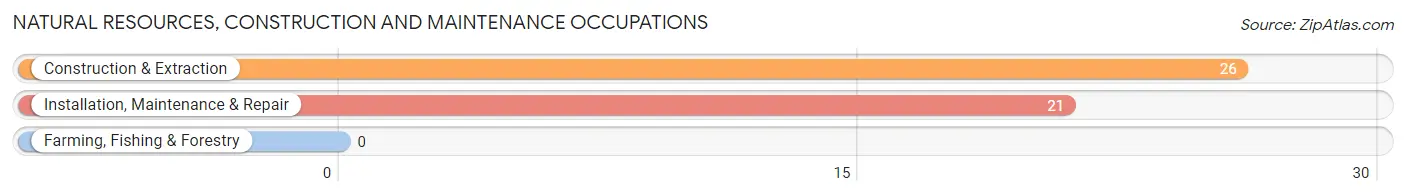
Natural Resources, Construction and Maintenance Occupations
The most common Natural Resources, Construction and Maintenance occupations in Walnut Grove are Construction & Extraction (26 | 6.9%), and Installation, Maintenance & Repair (21 | 5.5%).
Natural Resources, Construction and Maintenance Occupations by Sex
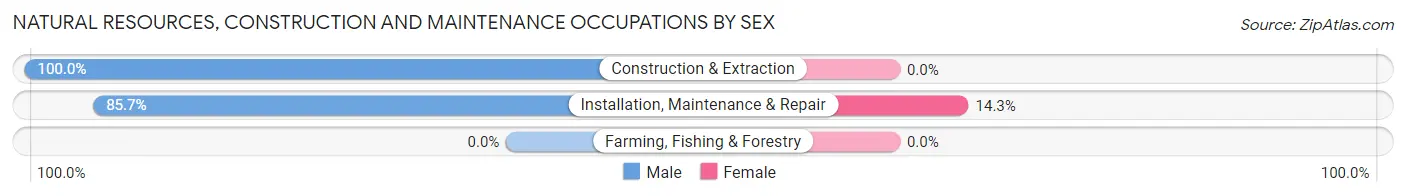
| Occupation | Male | Female |
| Farming, Fishing & Forestry | 0 (0.0%) | 0 (0.0%) |
| Construction & Extraction | 26 (100.0%) | 0 (0.0%) |
| Installation, Maintenance & Repair | 18 (85.7%) | 3 (14.3%) |
| Total (Category) | 44 (93.6%) | 3 (6.4%) |
| Total (Overall) | 198 (52.2%) | 181 (47.8%) |
Production, Transportation and Moving Occupations
The most common Production, Transportation and Moving occupations in Walnut Grove are Transportation (36 | 9.5%), Production (27 | 7.1%), and Material Moving (11 | 2.9%).
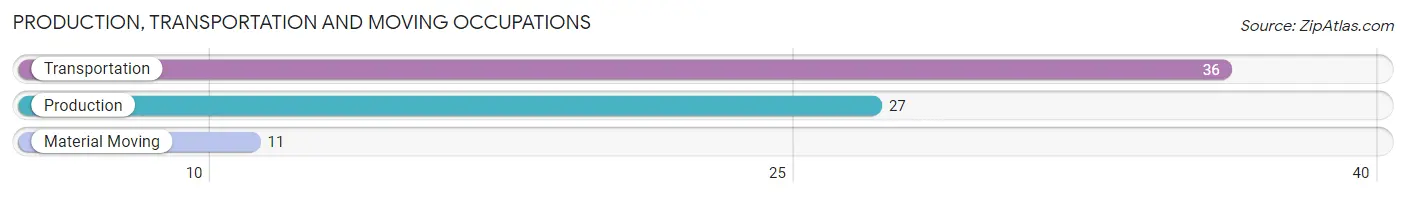
Production, Transportation and Moving Occupations by Sex
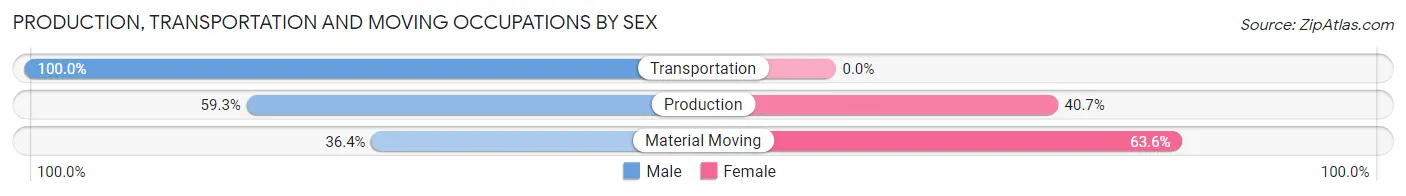
| Occupation | Male | Female |
| Production | 16 (59.3%) | 11 (40.7%) |
| Transportation | 36 (100.0%) | 0 (0.0%) |
| Material Moving | 4 (36.4%) | 7 (63.6%) |
| Total (Category) | 56 (75.7%) | 18 (24.3%) |
| Total (Overall) | 198 (52.2%) | 181 (47.8%) |
Employment Industries by Sex in Walnut Grove
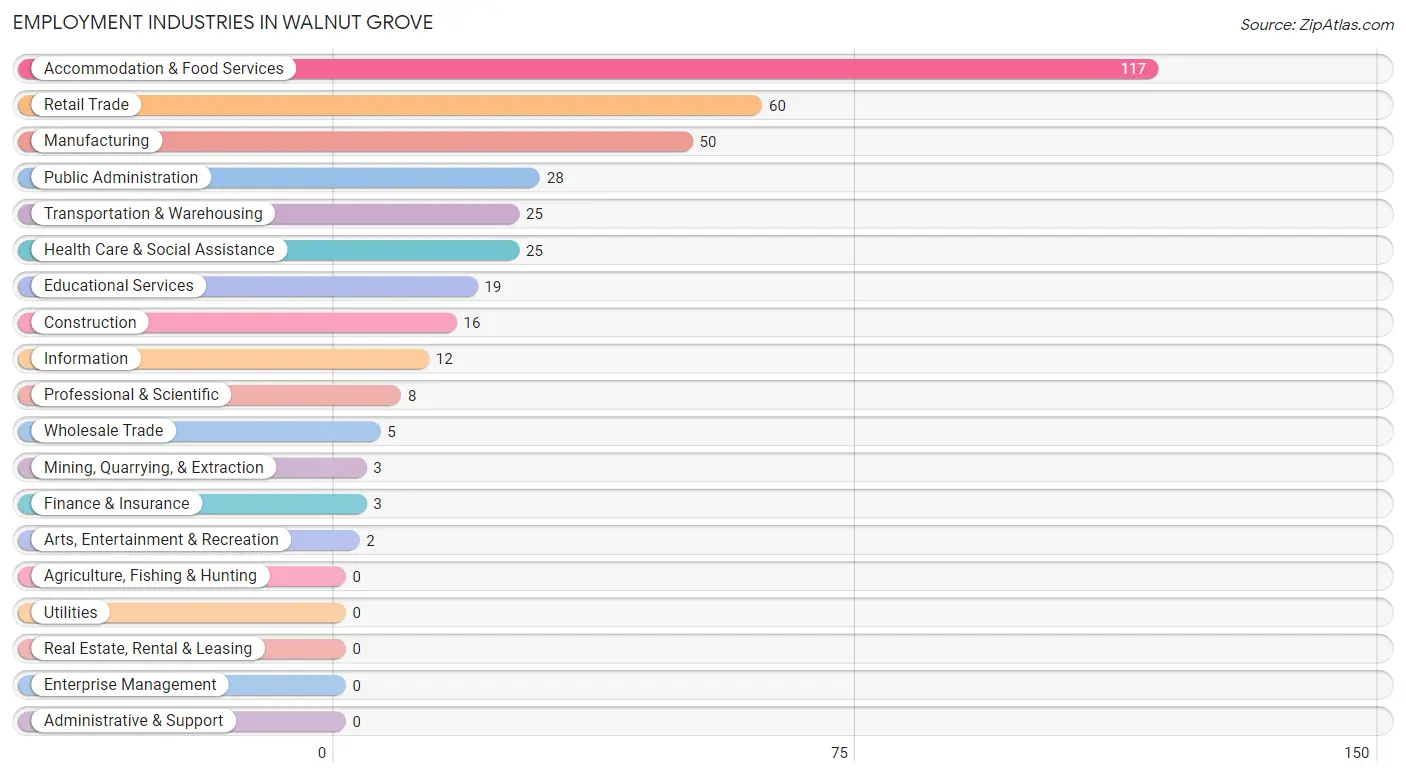
Employment Industries in Walnut Grove
The major employment industries in Walnut Grove include Accommodation & Food Services (117 | 30.9%), Retail Trade (60 | 15.8%), Manufacturing (50 | 13.2%), Public Administration (28 | 7.4%), and Transportation & Warehousing (25 | 6.6%).
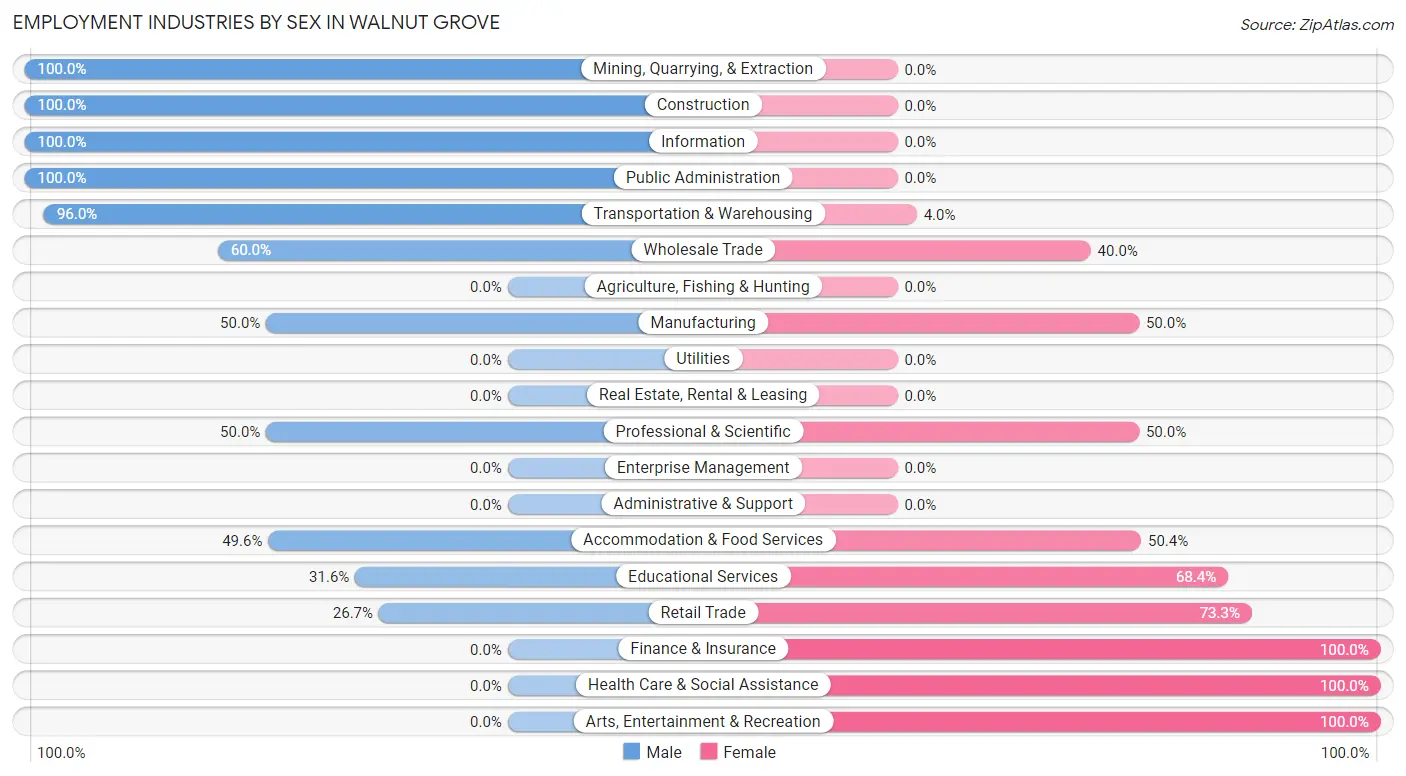
Employment Industries by Sex in Walnut Grove
The Walnut Grove industries that see more men than women are Mining, Quarrying, & Extraction (100.0%), Construction (100.0%), and Information (100.0%), whereas the industries that tend to have a higher number of women are Finance & Insurance (100.0%), Health Care & Social Assistance (100.0%), and Arts, Entertainment & Recreation (100.0%).
| Industry | Male | Female |
| Agriculture, Fishing & Hunting | 0 (0.0%) | 0 (0.0%) |
| Mining, Quarrying, & Extraction | 3 (100.0%) | 0 (0.0%) |
| Construction | 16 (100.0%) | 0 (0.0%) |
| Manufacturing | 25 (50.0%) | 25 (50.0%) |
| Wholesale Trade | 3 (60.0%) | 2 (40.0%) |
| Retail Trade | 16 (26.7%) | 44 (73.3%) |
| Transportation & Warehousing | 24 (96.0%) | 1 (4.0%) |
| Utilities | 0 (0.0%) | 0 (0.0%) |
| Information | 12 (100.0%) | 0 (0.0%) |
| Finance & Insurance | 0 (0.0%) | 3 (100.0%) |
| Real Estate, Rental & Leasing | 0 (0.0%) | 0 (0.0%) |
| Professional & Scientific | 4 (50.0%) | 4 (50.0%) |
| Enterprise Management | 0 (0.0%) | 0 (0.0%) |
| Administrative & Support | 0 (0.0%) | 0 (0.0%) |
| Educational Services | 6 (31.6%) | 13 (68.4%) |
| Health Care & Social Assistance | 0 (0.0%) | 25 (100.0%) |
| Arts, Entertainment & Recreation | 0 (0.0%) | 2 (100.0%) |
| Accommodation & Food Services | 58 (49.6%) | 59 (50.4%) |
| Public Administration | 28 (100.0%) | 0 (0.0%) |
| Total | 198 (52.2%) | 181 (47.8%) |
Education in Walnut Grove
School Enrollment in Walnut Grove
The most common levels of schooling among the 168 students in Walnut Grove are high school (46 | 27.4%), college / undergraduate (44 | 26.2%), and elementary school (43 | 25.6%).
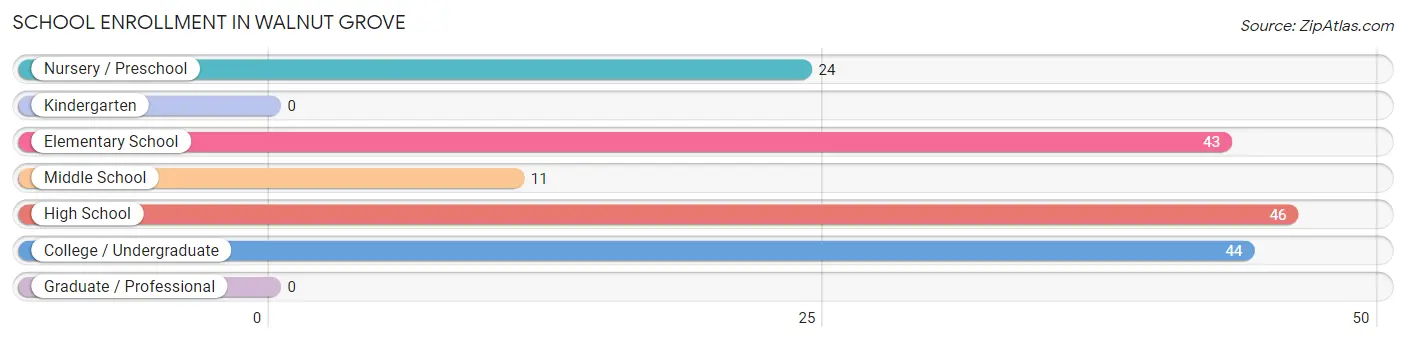
| School Level | # Students | % Students |
| Nursery / Preschool | 24 | 14.3% |
| Kindergarten | 0 | 0.0% |
| Elementary School | 43 | 25.6% |
| Middle School | 11 | 6.6% |
| High School | 46 | 27.4% |
| College / Undergraduate | 44 | 26.2% |
| Graduate / Professional | 0 | 0.0% |
| Total | 168 | 100.0% |
School Enrollment by Age by Funding Source in Walnut Grove
Out of a total of 168 students who are enrolled in schools in Walnut Grove, 40 (23.8%) attend a private institution, while the remaining 128 (76.2%) are enrolled in public schools. The age group of 5 to 9 year old has the highest likelihood of being enrolled in private schools, with 37 (75.5% in the age bracket) enrolled. Conversely, the age group of 3 to 4 year olds has the lowest likelihood of being enrolled in a private school, with 18 (100.0% in the age bracket) attending a public institution.
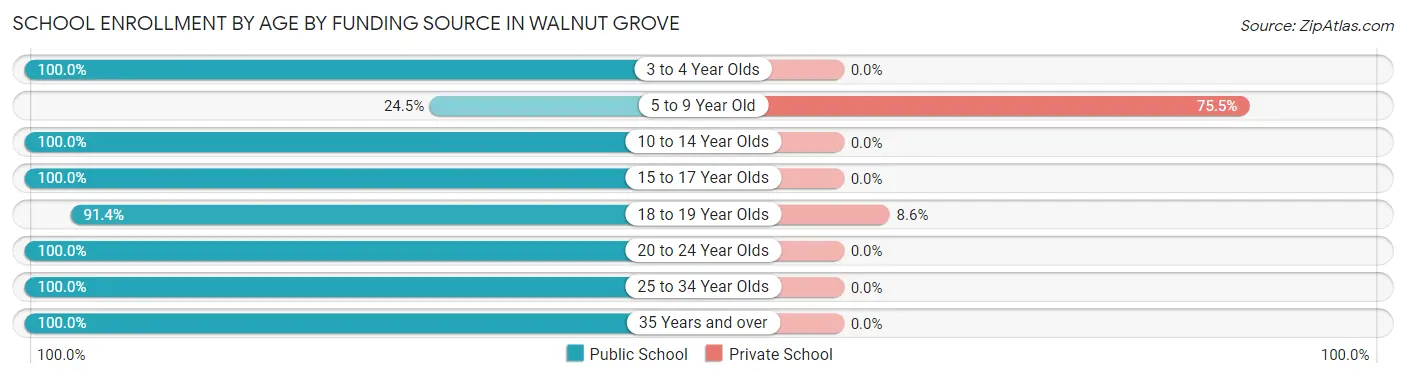
| Age Bracket | Public School | Private School |
| 3 to 4 Year Olds | 18 (100.0%) | 0 (0.0%) |
| 5 to 9 Year Old | 12 (24.5%) | 37 (75.5%) |
| 10 to 14 Year Olds | 16 (100.0%) | 0 (0.0%) |
| 15 to 17 Year Olds | 11 (100.0%) | 0 (0.0%) |
| 18 to 19 Year Olds | 32 (91.4%) | 3 (8.6%) |
| 20 to 24 Year Olds | 11 (100.0%) | 0 (0.0%) |
| 25 to 34 Year Olds | 19 (100.0%) | 0 (0.0%) |
| 35 Years and over | 9 (100.0%) | 0 (0.0%) |
| Total | 128 (76.2%) | 40 (23.8%) |
Educational Attainment by Field of Study in Walnut Grove
Education (52 | 63.4%), business (14 | 17.1%), science & technology (6 | 7.3%), social sciences (3 | 3.7%), and communications (3 | 3.7%) are the most common fields of study among 82 individuals in Walnut Grove who have obtained a bachelor's degree or higher.
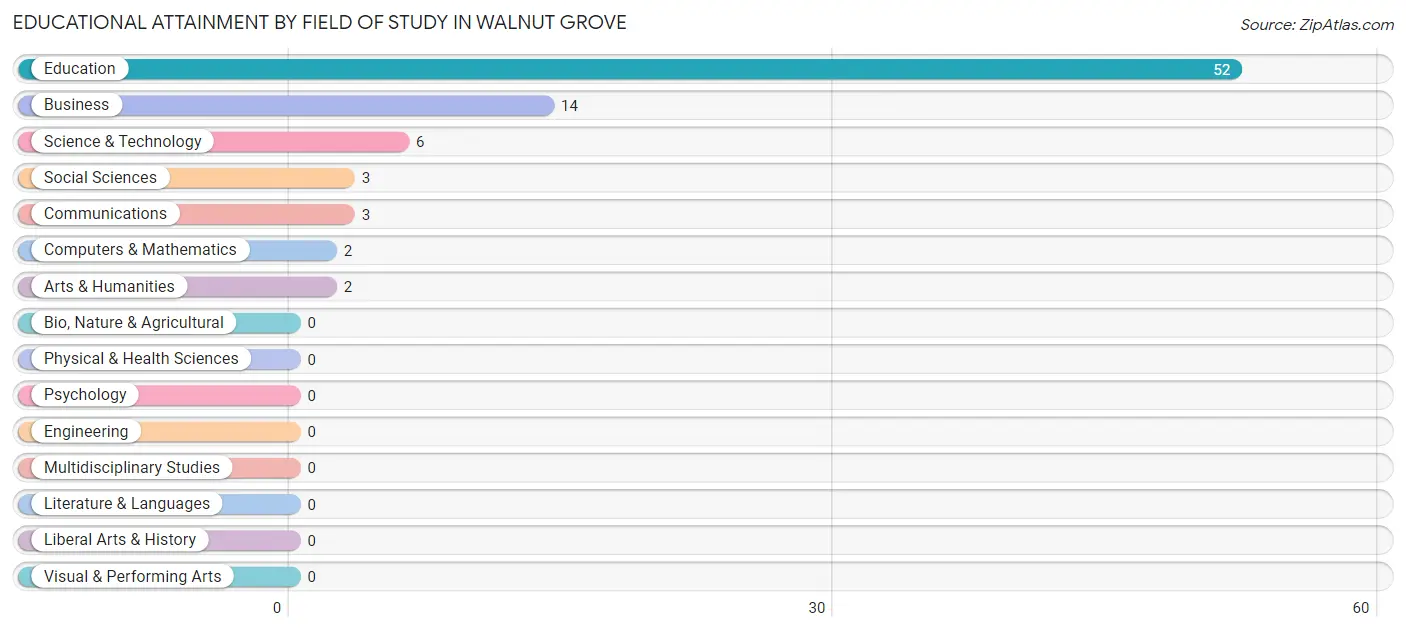
| Field of Study | # Graduates | % Graduates |
| Computers & Mathematics | 2 | 2.4% |
| Bio, Nature & Agricultural | 0 | 0.0% |
| Physical & Health Sciences | 0 | 0.0% |
| Psychology | 0 | 0.0% |
| Social Sciences | 3 | 3.7% |
| Engineering | 0 | 0.0% |
| Multidisciplinary Studies | 0 | 0.0% |
| Science & Technology | 6 | 7.3% |
| Business | 14 | 17.1% |
| Education | 52 | 63.4% |
| Literature & Languages | 0 | 0.0% |
| Liberal Arts & History | 0 | 0.0% |
| Visual & Performing Arts | 0 | 0.0% |
| Communications | 3 | 3.7% |
| Arts & Humanities | 2 | 2.4% |
| Total | 82 | 100.0% |
Transportation & Commute in Walnut Grove
Vehicle Availability by Sex in Walnut Grove
The most prevalent vehicle ownership categories in Walnut Grove are males with 4 vehicles (79, accounting for 39.9%) and females with 4 vehicles (47, making up 43.6%).
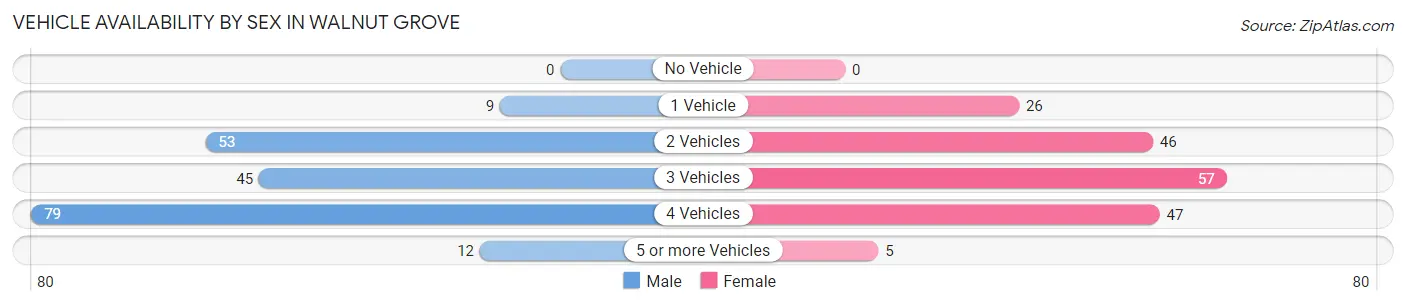
| Vehicles Available | Male | Female |
| No Vehicle | 0 (0.0%) | 0 (0.0%) |
| 1 Vehicle | 9 (4.5%) | 26 (14.4%) |
| 2 Vehicles | 53 (26.8%) | 46 (25.4%) |
| 3 Vehicles | 45 (22.7%) | 57 (31.5%) |
| 4 Vehicles | 79 (39.9%) | 47 (26.0%) |
| 5 or more Vehicles | 12 (6.1%) | 5 (2.8%) |
| Total | 198 (100.0%) | 181 (100.0%) |
Commute Time in Walnut Grove
The most frequently occuring commute durations in Walnut Grove are 10 to 14 minutes (119 commuters, 31.7%), 20 to 24 minutes (65 commuters, 17.3%), and 60 to 89 minutes (43 commuters, 11.5%).
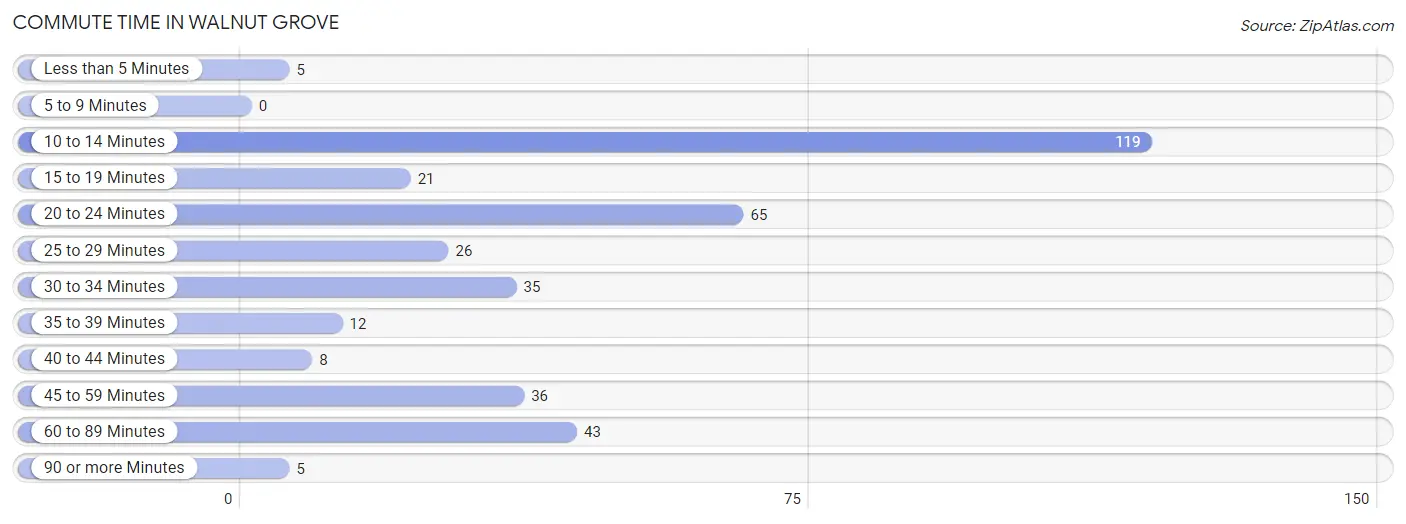
| Commute Time | # Commuters | % Commuters |
| Less than 5 Minutes | 5 | 1.3% |
| 5 to 9 Minutes | 0 | 0.0% |
| 10 to 14 Minutes | 119 | 31.7% |
| 15 to 19 Minutes | 21 | 5.6% |
| 20 to 24 Minutes | 65 | 17.3% |
| 25 to 29 Minutes | 26 | 6.9% |
| 30 to 34 Minutes | 35 | 9.3% |
| 35 to 39 Minutes | 12 | 3.2% |
| 40 to 44 Minutes | 8 | 2.1% |
| 45 to 59 Minutes | 36 | 9.6% |
| 60 to 89 Minutes | 43 | 11.5% |
| 90 or more Minutes | 5 | 1.3% |
Commute Time by Sex in Walnut Grove
The most common commute times in Walnut Grove are 10 to 14 minutes (58 commuters, 29.3%) for males and 10 to 14 minutes (61 commuters, 34.5%) for females.
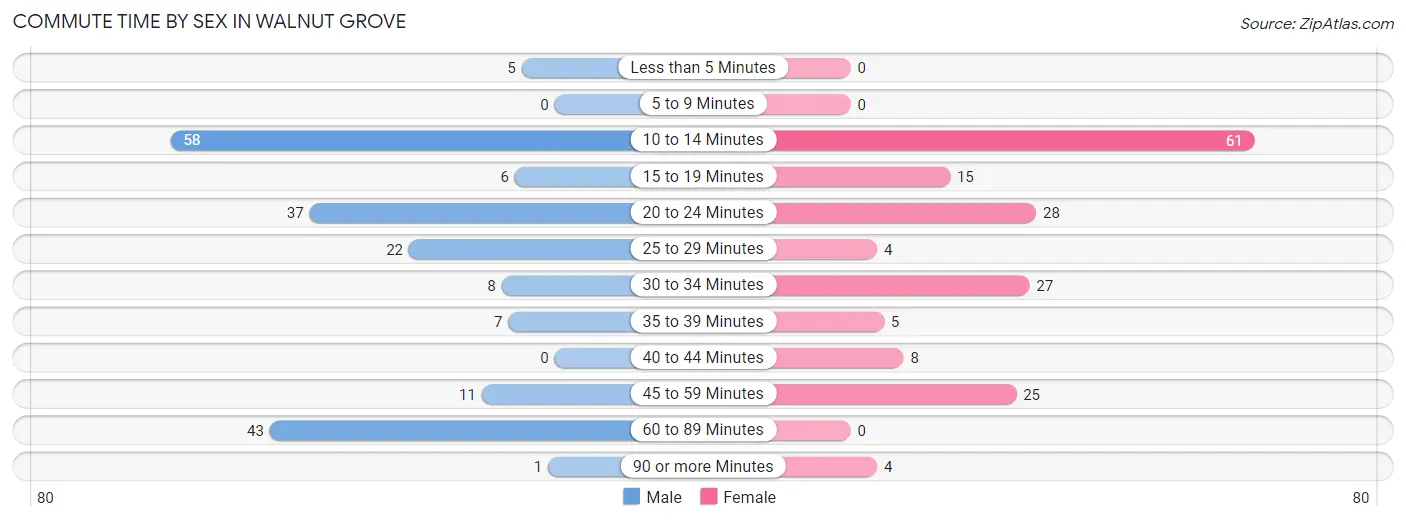
| Commute Time | Male | Female |
| Less than 5 Minutes | 5 (2.5%) | 0 (0.0%) |
| 5 to 9 Minutes | 0 (0.0%) | 0 (0.0%) |
| 10 to 14 Minutes | 58 (29.3%) | 61 (34.5%) |
| 15 to 19 Minutes | 6 (3.0%) | 15 (8.5%) |
| 20 to 24 Minutes | 37 (18.7%) | 28 (15.8%) |
| 25 to 29 Minutes | 22 (11.1%) | 4 (2.3%) |
| 30 to 34 Minutes | 8 (4.0%) | 27 (15.2%) |
| 35 to 39 Minutes | 7 (3.5%) | 5 (2.8%) |
| 40 to 44 Minutes | 0 (0.0%) | 8 (4.5%) |
| 45 to 59 Minutes | 11 (5.6%) | 25 (14.1%) |
| 60 to 89 Minutes | 43 (21.7%) | 0 (0.0%) |
| 90 or more Minutes | 1 (0.5%) | 4 (2.3%) |
Time of Departure to Work by Sex in Walnut Grove
The most frequent times of departure to work in Walnut Grove are 10:00 AM to 10:59 AM (55, 27.8%) for males and 7:00 AM to 7:29 AM (42, 23.7%) for females.
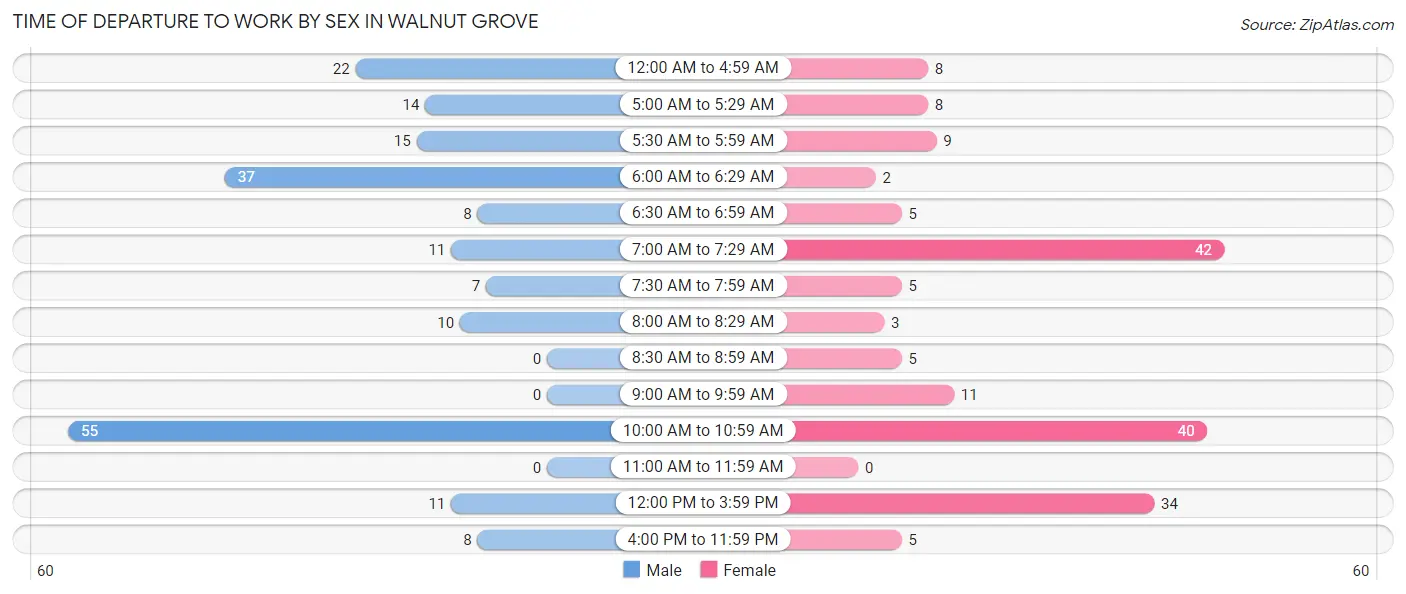
| Time of Departure | Male | Female |
| 12:00 AM to 4:59 AM | 22 (11.1%) | 8 (4.5%) |
| 5:00 AM to 5:29 AM | 14 (7.1%) | 8 (4.5%) |
| 5:30 AM to 5:59 AM | 15 (7.6%) | 9 (5.1%) |
| 6:00 AM to 6:29 AM | 37 (18.7%) | 2 (1.1%) |
| 6:30 AM to 6:59 AM | 8 (4.0%) | 5 (2.8%) |
| 7:00 AM to 7:29 AM | 11 (5.6%) | 42 (23.7%) |
| 7:30 AM to 7:59 AM | 7 (3.5%) | 5 (2.8%) |
| 8:00 AM to 8:29 AM | 10 (5.1%) | 3 (1.7%) |
| 8:30 AM to 8:59 AM | 0 (0.0%) | 5 (2.8%) |
| 9:00 AM to 9:59 AM | 0 (0.0%) | 11 (6.2%) |
| 10:00 AM to 10:59 AM | 55 (27.8%) | 40 (22.6%) |
| 11:00 AM to 11:59 AM | 0 (0.0%) | 0 (0.0%) |
| 12:00 PM to 3:59 PM | 11 (5.6%) | 34 (19.2%) |
| 4:00 PM to 11:59 PM | 8 (4.0%) | 5 (2.8%) |
| Total | 198 (100.0%) | 177 (100.0%) |
Housing Occupancy in Walnut Grove
Occupancy by Ownership in Walnut Grove
Of the total 347 dwellings in Walnut Grove, owner-occupied units account for 291 (83.9%), while renter-occupied units make up 56 (16.1%).
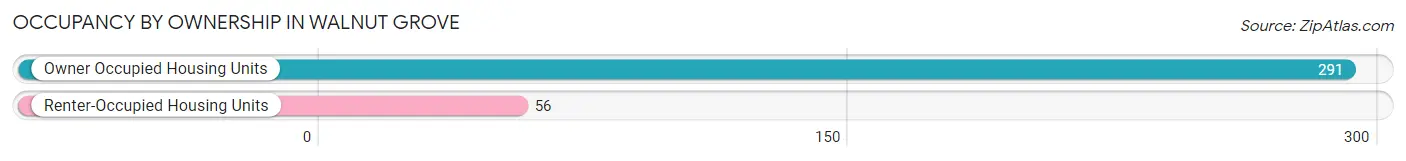
| Occupancy | # Housing Units | % Housing Units |
| Owner Occupied Housing Units | 291 | 83.9% |
| Renter-Occupied Housing Units | 56 | 16.1% |
| Total Occupied Housing Units | 347 | 100.0% |
Occupancy by Household Size in Walnut Grove
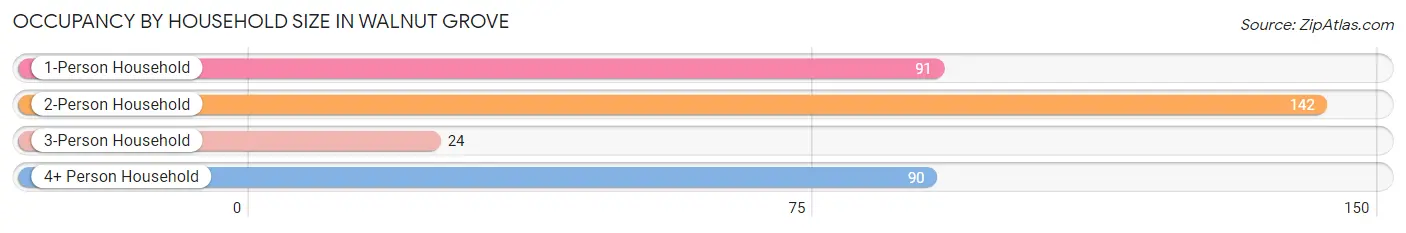
| Household Size | # Housing Units | % Housing Units |
| 1-Person Household | 91 | 26.2% |
| 2-Person Household | 142 | 40.9% |
| 3-Person Household | 24 | 6.9% |
| 4+ Person Household | 90 | 25.9% |
| Total Housing Units | 347 | 100.0% |
Occupancy by Ownership by Household Size in Walnut Grove
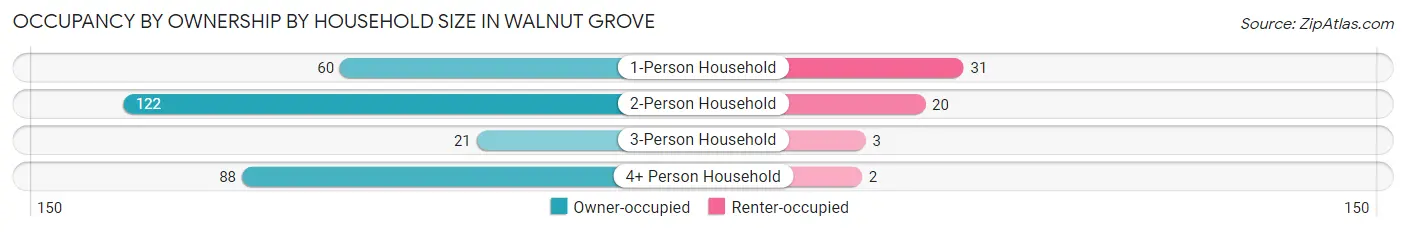
| Household Size | Owner-occupied | Renter-occupied |
| 1-Person Household | 60 (65.9%) | 31 (34.1%) |
| 2-Person Household | 122 (85.9%) | 20 (14.1%) |
| 3-Person Household | 21 (87.5%) | 3 (12.5%) |
| 4+ Person Household | 88 (97.8%) | 2 (2.2%) |
| Total Housing Units | 291 (83.9%) | 56 (16.1%) |
Occupancy by Educational Attainment in Walnut Grove
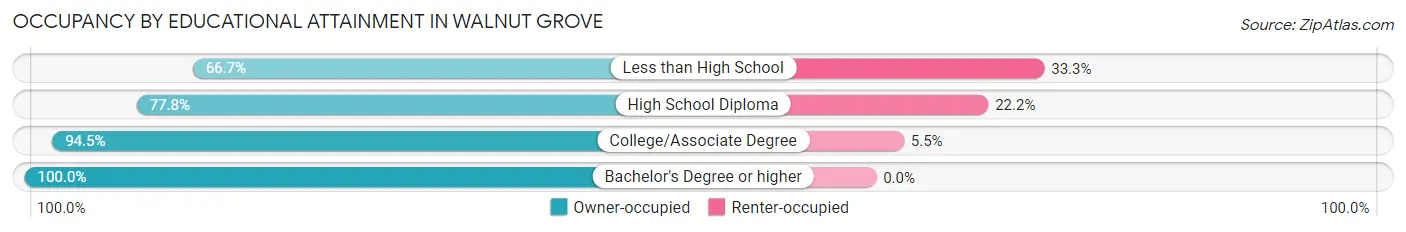
| Household Size | Owner-occupied | Renter-occupied |
| Less than High School | 50 (66.7%) | 25 (33.3%) |
| High School Diploma | 91 (77.8%) | 26 (22.2%) |
| College/Associate Degree | 86 (94.5%) | 5 (5.5%) |
| Bachelor's Degree or higher | 64 (100.0%) | 0 (0.0%) |
Occupancy by Age of Householder in Walnut Grove
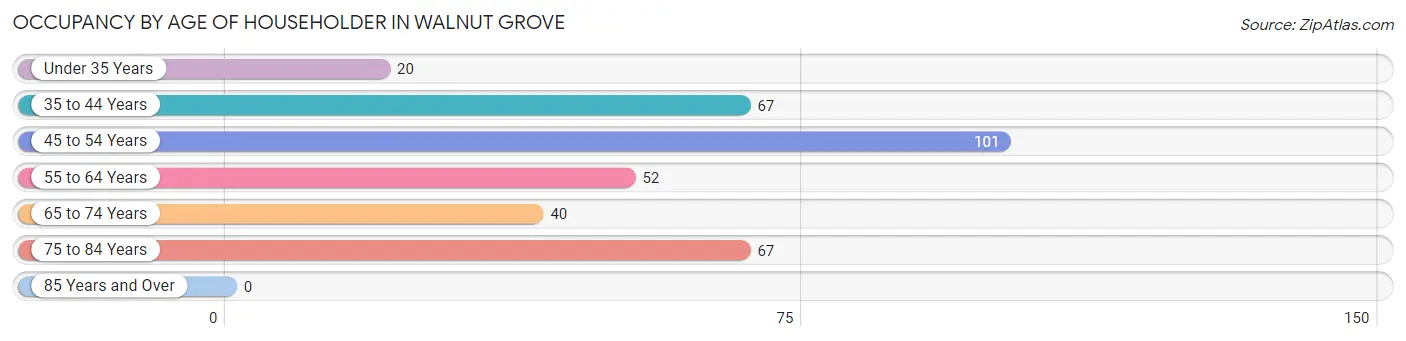
| Age Bracket | # Households | % Households |
| Under 35 Years | 20 | 5.8% |
| 35 to 44 Years | 67 | 19.3% |
| 45 to 54 Years | 101 | 29.1% |
| 55 to 64 Years | 52 | 15.0% |
| 65 to 74 Years | 40 | 11.5% |
| 75 to 84 Years | 67 | 19.3% |
| 85 Years and Over | 0 | 0.0% |
| Total | 347 | 100.0% |
Housing Finances in Walnut Grove
Median Income by Occupancy in Walnut Grove
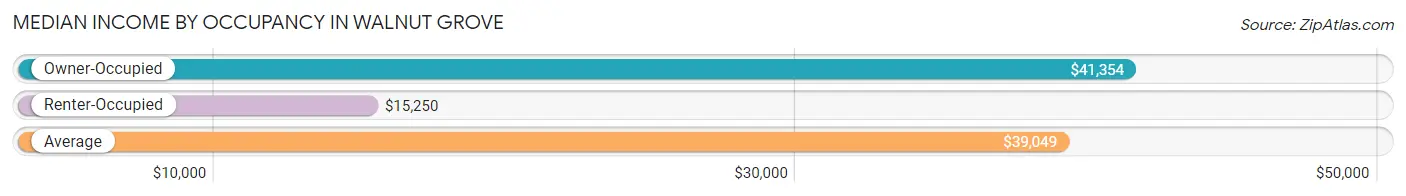
| Occupancy Type | # Households | Median Income |
| Owner-Occupied | 291 (83.9%) | $41,354 |
| Renter-Occupied | 56 (16.1%) | $15,250 |
| Average | 347 (100.0%) | $39,049 |
Occupancy by Householder Income Bracket in Walnut Grove
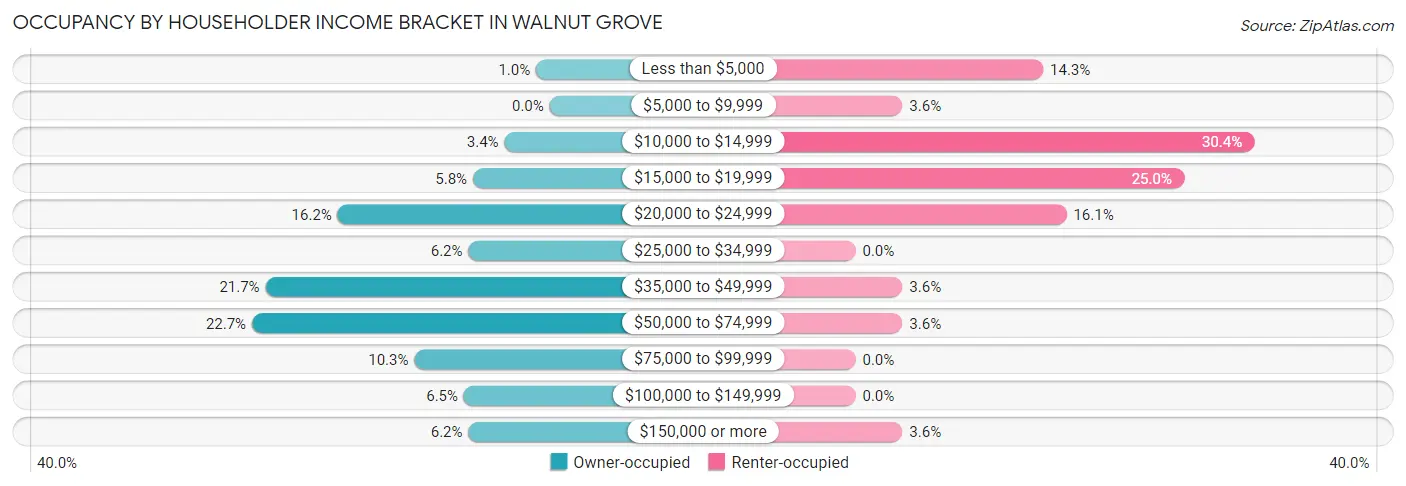
| Income Bracket | Owner-occupied | Renter-occupied |
| Less than $5,000 | 3 (1.0%) | 8 (14.3%) |
| $5,000 to $9,999 | 0 (0.0%) | 2 (3.6%) |
| $10,000 to $14,999 | 10 (3.4%) | 17 (30.4%) |
| $15,000 to $19,999 | 17 (5.8%) | 14 (25.0%) |
| $20,000 to $24,999 | 47 (16.2%) | 9 (16.1%) |
| $25,000 to $34,999 | 18 (6.2%) | 0 (0.0%) |
| $35,000 to $49,999 | 63 (21.6%) | 2 (3.6%) |
| $50,000 to $74,999 | 66 (22.7%) | 2 (3.6%) |
| $75,000 to $99,999 | 30 (10.3%) | 0 (0.0%) |
| $100,000 to $149,999 | 19 (6.5%) | 0 (0.0%) |
| $150,000 or more | 18 (6.2%) | 2 (3.6%) |
| Total | 291 (100.0%) | 56 (100.0%) |
Monthly Housing Cost Tiers in Walnut Grove
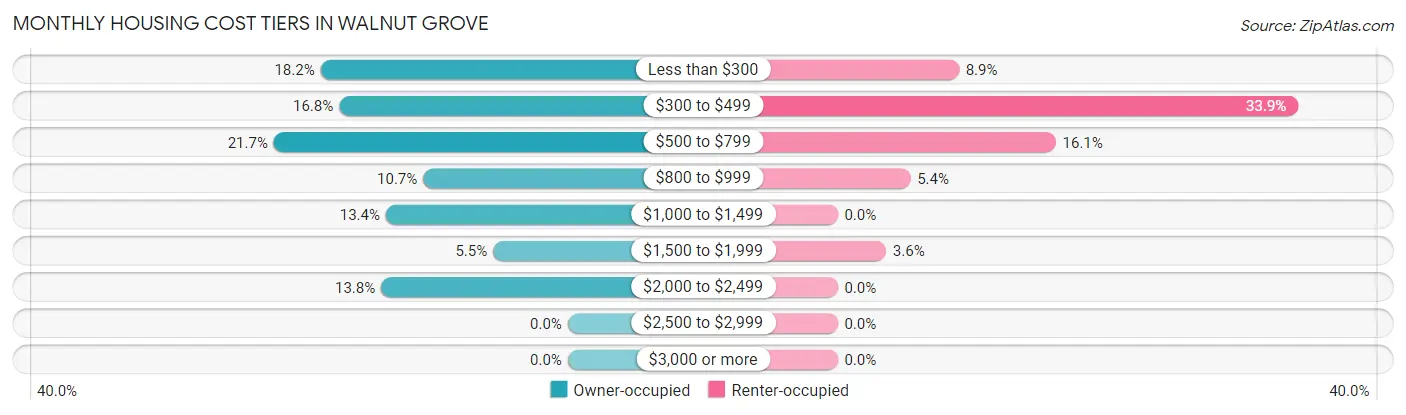
| Monthly Cost | Owner-occupied | Renter-occupied |
| Less than $300 | 53 (18.2%) | 5 (8.9%) |
| $300 to $499 | 49 (16.8%) | 19 (33.9%) |
| $500 to $799 | 63 (21.6%) | 9 (16.1%) |
| $800 to $999 | 31 (10.6%) | 3 (5.4%) |
| $1,000 to $1,499 | 39 (13.4%) | 0 (0.0%) |
| $1,500 to $1,999 | 16 (5.5%) | 2 (3.6%) |
| $2,000 to $2,499 | 40 (13.8%) | 0 (0.0%) |
| $2,500 to $2,999 | 0 (0.0%) | 0 (0.0%) |
| $3,000 or more | 0 (0.0%) | 0 (0.0%) |
| Total | 291 (100.0%) | 56 (100.0%) |
Physical Housing Characteristics in Walnut Grove
Housing Structures in Walnut Grove
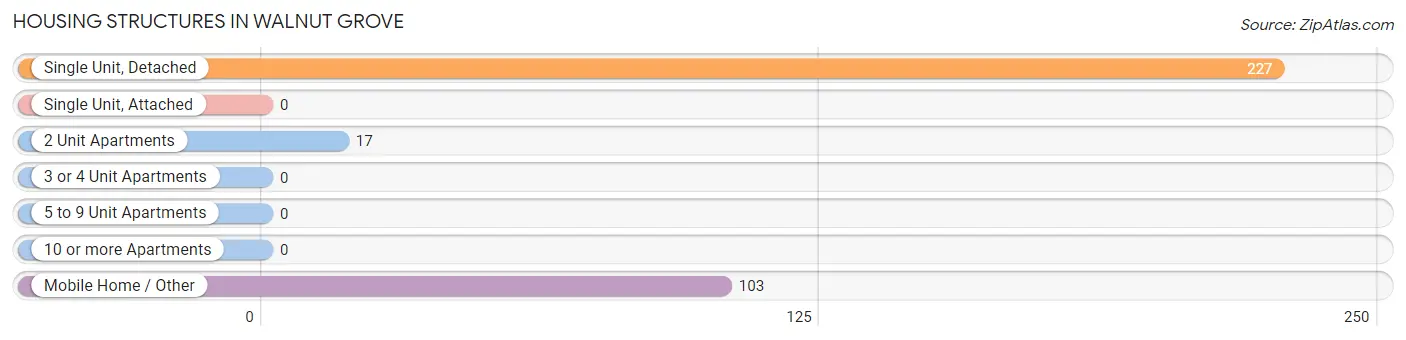
| Structure Type | # Housing Units | % Housing Units |
| Single Unit, Detached | 227 | 65.4% |
| Single Unit, Attached | 0 | 0.0% |
| 2 Unit Apartments | 17 | 4.9% |
| 3 or 4 Unit Apartments | 0 | 0.0% |
| 5 to 9 Unit Apartments | 0 | 0.0% |
| 10 or more Apartments | 0 | 0.0% |
| Mobile Home / Other | 103 | 29.7% |
| Total | 347 | 100.0% |
Housing Structures by Occupancy in Walnut Grove
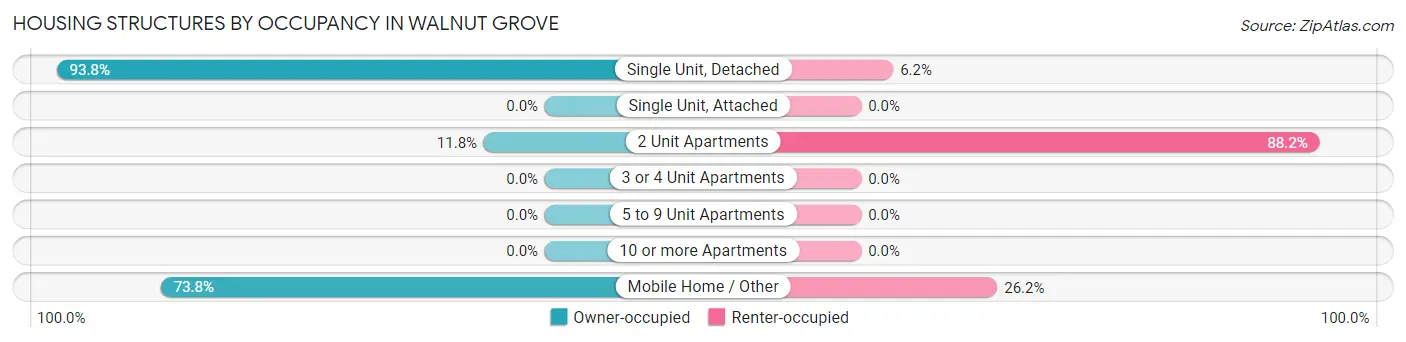
| Structure Type | Owner-occupied | Renter-occupied |
| Single Unit, Detached | 213 (93.8%) | 14 (6.2%) |
| Single Unit, Attached | 0 (0.0%) | 0 (0.0%) |
| 2 Unit Apartments | 2 (11.8%) | 15 (88.2%) |
| 3 or 4 Unit Apartments | 0 (0.0%) | 0 (0.0%) |
| 5 to 9 Unit Apartments | 0 (0.0%) | 0 (0.0%) |
| 10 or more Apartments | 0 (0.0%) | 0 (0.0%) |
| Mobile Home / Other | 76 (73.8%) | 27 (26.2%) |
| Total | 291 (83.9%) | 56 (16.1%) |
Housing Structures by Number of Rooms in Walnut Grove
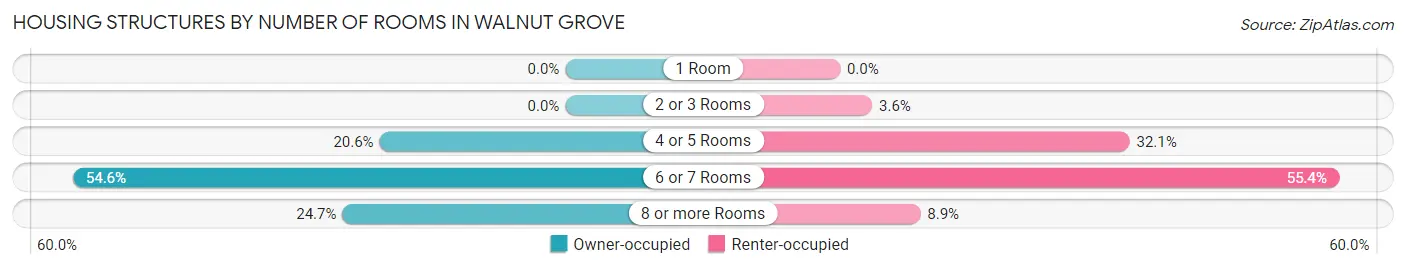
| Number of Rooms | Owner-occupied | Renter-occupied |
| 1 Room | 0 (0.0%) | 0 (0.0%) |
| 2 or 3 Rooms | 0 (0.0%) | 2 (3.6%) |
| 4 or 5 Rooms | 60 (20.6%) | 18 (32.1%) |
| 6 or 7 Rooms | 159 (54.6%) | 31 (55.4%) |
| 8 or more Rooms | 72 (24.7%) | 5 (8.9%) |
| Total | 291 (100.0%) | 56 (100.0%) |
Housing Structure by Heating Type in Walnut Grove
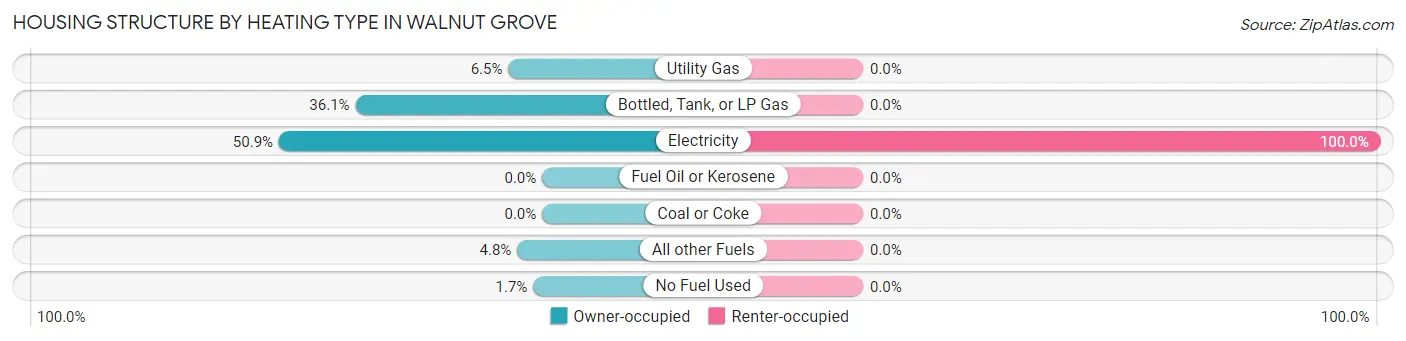
| Heating Type | Owner-occupied | Renter-occupied |
| Utility Gas | 19 (6.5%) | 0 (0.0%) |
| Bottled, Tank, or LP Gas | 105 (36.1%) | 0 (0.0%) |
| Electricity | 148 (50.9%) | 56 (100.0%) |
| Fuel Oil or Kerosene | 0 (0.0%) | 0 (0.0%) |
| Coal or Coke | 0 (0.0%) | 0 (0.0%) |
| All other Fuels | 14 (4.8%) | 0 (0.0%) |
| No Fuel Used | 5 (1.7%) | 0 (0.0%) |
| Total | 291 (100.0%) | 56 (100.0%) |
Household Vehicle Usage in Walnut Grove
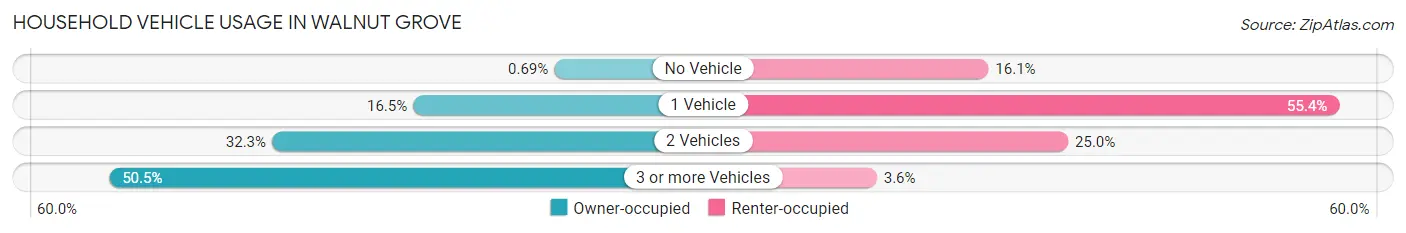
| Vehicles per Household | Owner-occupied | Renter-occupied |
| No Vehicle | 2 (0.7%) | 9 (16.1%) |
| 1 Vehicle | 48 (16.5%) | 31 (55.4%) |
| 2 Vehicles | 94 (32.3%) | 14 (25.0%) |
| 3 or more Vehicles | 147 (50.5%) | 2 (3.6%) |
| Total | 291 (100.0%) | 56 (100.0%) |
Real Estate & Mortgages in Walnut Grove
Real Estate and Mortgage Overview in Walnut Grove
| Characteristic | Without Mortgage | With Mortgage |
| Housing Units | 140 | 151 |
| Median Property Value | $98,200 | $142,400 |
| Median Household Income | $27,000 | $18 |
| Monthly Housing Costs | $328 | $0 |
| Real Estate Taxes | $244 | $31 |
Property Value by Mortgage Status in Walnut Grove
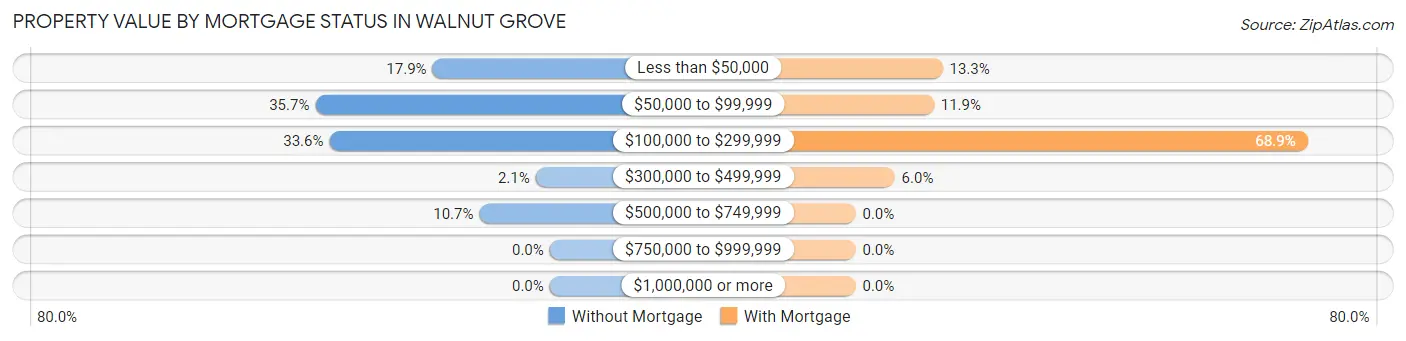
| Property Value | Without Mortgage | With Mortgage |
| Less than $50,000 | 25 (17.9%) | 20 (13.3%) |
| $50,000 to $99,999 | 50 (35.7%) | 18 (11.9%) |
| $100,000 to $299,999 | 47 (33.6%) | 104 (68.9%) |
| $300,000 to $499,999 | 3 (2.1%) | 9 (6.0%) |
| $500,000 to $749,999 | 15 (10.7%) | 0 (0.0%) |
| $750,000 to $999,999 | 0 (0.0%) | 0 (0.0%) |
| $1,000,000 or more | 0 (0.0%) | 0 (0.0%) |
| Total | 140 (100.0%) | 151 (100.0%) |
Household Income by Mortgage Status in Walnut Grove
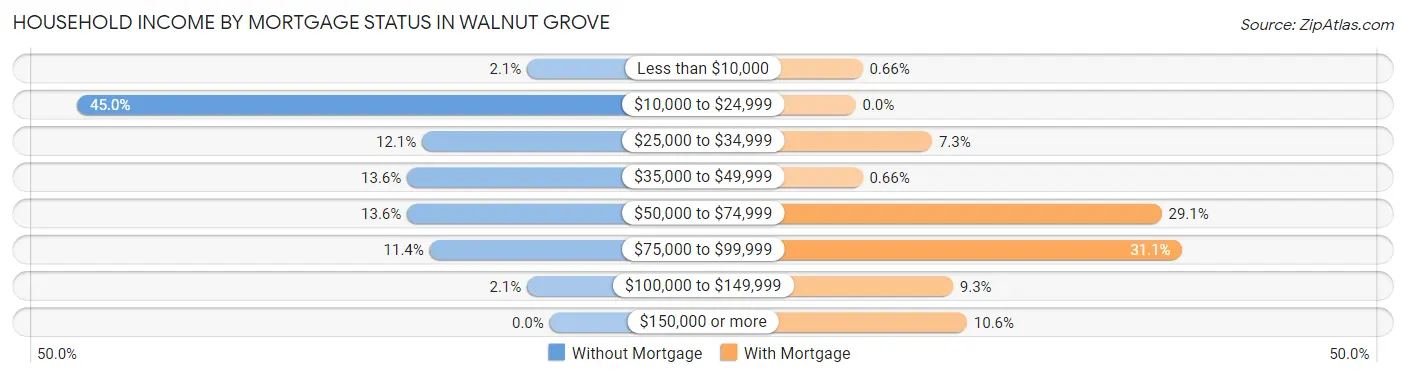
| Household Income | Without Mortgage | With Mortgage |
| Less than $10,000 | 3 (2.1%) | 1 (0.7%) |
| $10,000 to $24,999 | 63 (45.0%) | 0 (0.0%) |
| $25,000 to $34,999 | 17 (12.1%) | 11 (7.3%) |
| $35,000 to $49,999 | 19 (13.6%) | 1 (0.7%) |
| $50,000 to $74,999 | 19 (13.6%) | 44 (29.1%) |
| $75,000 to $99,999 | 16 (11.4%) | 47 (31.1%) |
| $100,000 to $149,999 | 3 (2.1%) | 14 (9.3%) |
| $150,000 or more | 0 (0.0%) | 16 (10.6%) |
| Total | 140 (100.0%) | 151 (100.0%) |
Property Value to Household Income Ratio in Walnut Grove
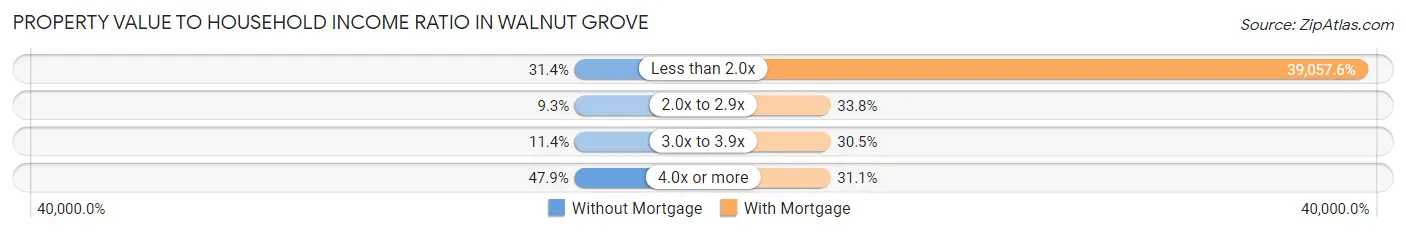
| Value-to-Income Ratio | Without Mortgage | With Mortgage |
| Less than 2.0x | 44 (31.4%) | 58,977 (39,057.6%) |
| 2.0x to 2.9x | 13 (9.3%) | 51 (33.8%) |
| 3.0x to 3.9x | 16 (11.4%) | 46 (30.5%) |
| 4.0x or more | 67 (47.9%) | 47 (31.1%) |
| Total | 140 (100.0%) | 151 (100.0%) |
Real Estate Taxes by Mortgage Status in Walnut Grove
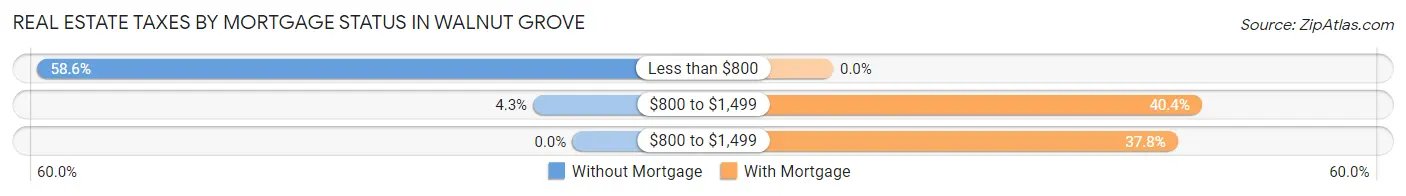
| Property Taxes | Without Mortgage | With Mortgage |
| Less than $800 | 82 (58.6%) | 0 (0.0%) |
| $800 to $1,499 | 6 (4.3%) | 61 (40.4%) |
| $800 to $1,499 | 0 (0.0%) | 57 (37.8%) |
| Total | 140 (100.0%) | 151 (100.0%) |
Health & Disability in Walnut Grove
Health Insurance Coverage by Age in Walnut Grove
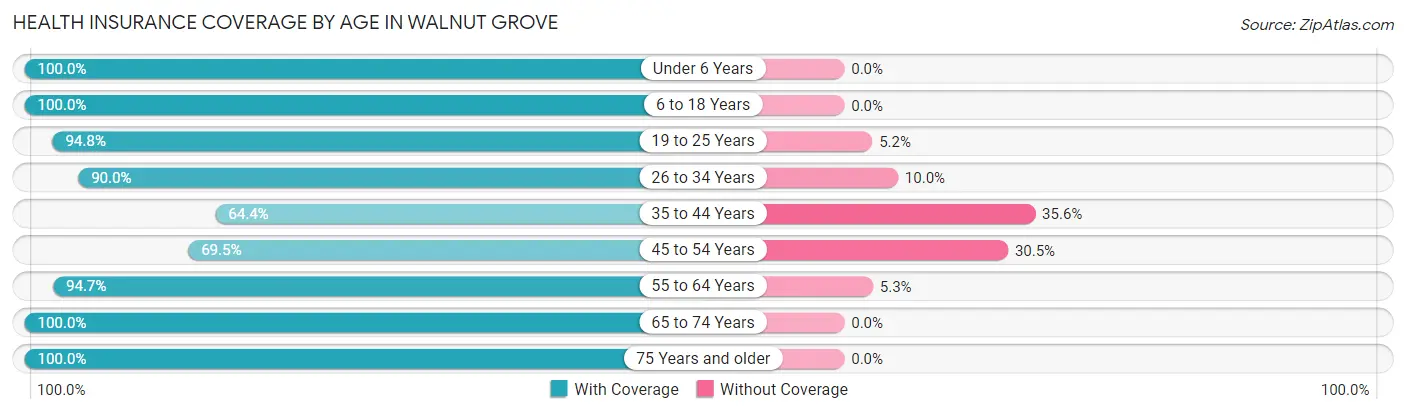
| Age Bracket | With Coverage | Without Coverage |
| Under 6 Years | 68 (100.0%) | 0 (0.0%) |
| 6 to 18 Years | 96 (100.0%) | 0 (0.0%) |
| 19 to 25 Years | 91 (94.8%) | 5 (5.2%) |
| 26 to 34 Years | 9 (90.0%) | 1 (10.0%) |
| 35 to 44 Years | 76 (64.4%) | 42 (35.6%) |
| 45 to 54 Years | 148 (69.5%) | 65 (30.5%) |
| 55 to 64 Years | 89 (94.7%) | 5 (5.3%) |
| 65 to 74 Years | 62 (100.0%) | 0 (0.0%) |
| 75 Years and older | 116 (100.0%) | 0 (0.0%) |
| Total | 755 (86.5%) | 118 (13.5%) |
Health Insurance Coverage by Citizenship Status in Walnut Grove

| Citizenship Status | With Coverage | Without Coverage |
| Native Born | 68 (100.0%) | 0 (0.0%) |
| Foreign Born, Citizen | 96 (100.0%) | 0 (0.0%) |
| Foreign Born, not a Citizen | 91 (94.8%) | 5 (5.2%) |
Health Insurance Coverage by Household Income in Walnut Grove
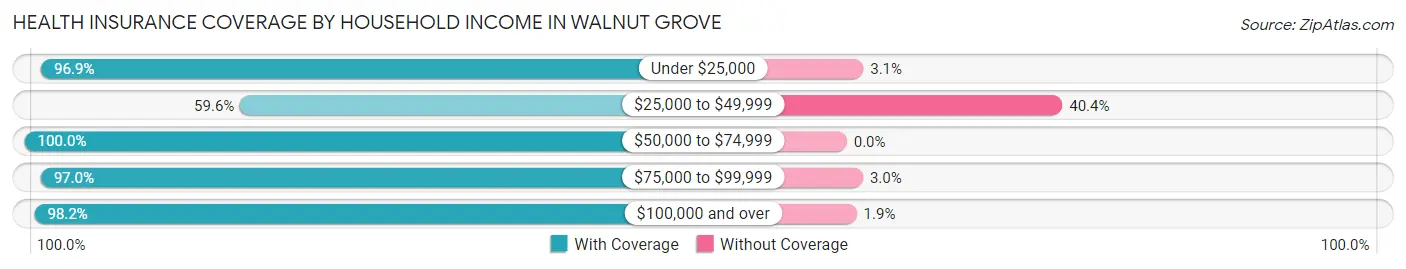
| Household Income | With Coverage | Without Coverage |
| Under $25,000 | 251 (96.9%) | 8 (3.1%) |
| $25,000 to $49,999 | 155 (59.6%) | 105 (40.4%) |
| $50,000 to $74,999 | 147 (100.0%) | 0 (0.0%) |
| $75,000 to $99,999 | 96 (97.0%) | 3 (3.0%) |
| $100,000 and over | 106 (98.2%) | 2 (1.8%) |
Public vs Private Health Insurance Coverage by Age in Walnut Grove
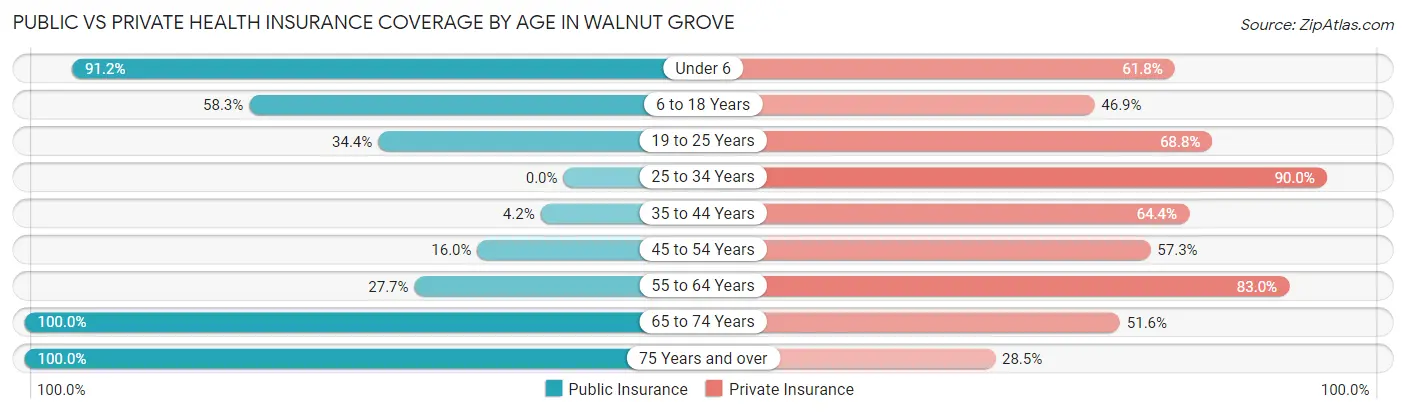
| Age Bracket | Public Insurance | Private Insurance |
| Under 6 | 62 (91.2%) | 42 (61.8%) |
| 6 to 18 Years | 56 (58.3%) | 45 (46.9%) |
| 19 to 25 Years | 33 (34.4%) | 66 (68.8%) |
| 25 to 34 Years | 0 (0.0%) | 9 (90.0%) |
| 35 to 44 Years | 5 (4.2%) | 76 (64.4%) |
| 45 to 54 Years | 34 (16.0%) | 122 (57.3%) |
| 55 to 64 Years | 26 (27.7%) | 78 (83.0%) |
| 65 to 74 Years | 62 (100.0%) | 32 (51.6%) |
| 75 Years and over | 116 (100.0%) | 33 (28.4%) |
| Total | 394 (45.1%) | 503 (57.6%) |
Disability Status by Sex by Age in Walnut Grove
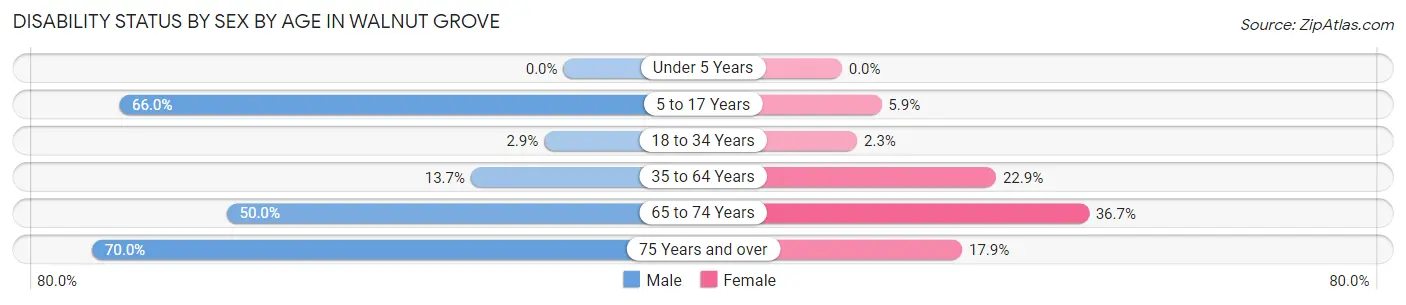
| Age Bracket | Male | Female |
| Under 5 Years | 0 (0.0%) | 0 (0.0%) |
| 5 to 17 Years | 31 (66.0%) | 2 (5.9%) |
| 18 to 34 Years | 1 (2.9%) | 2 (2.3%) |
| 35 to 64 Years | 29 (13.7%) | 49 (22.9%) |
| 65 to 74 Years | 16 (50.0%) | 11 (36.7%) |
| 75 Years and over | 42 (70.0%) | 10 (17.9%) |
Disability Class by Sex by Age in Walnut Grove
Disability Class: Hearing Difficulty
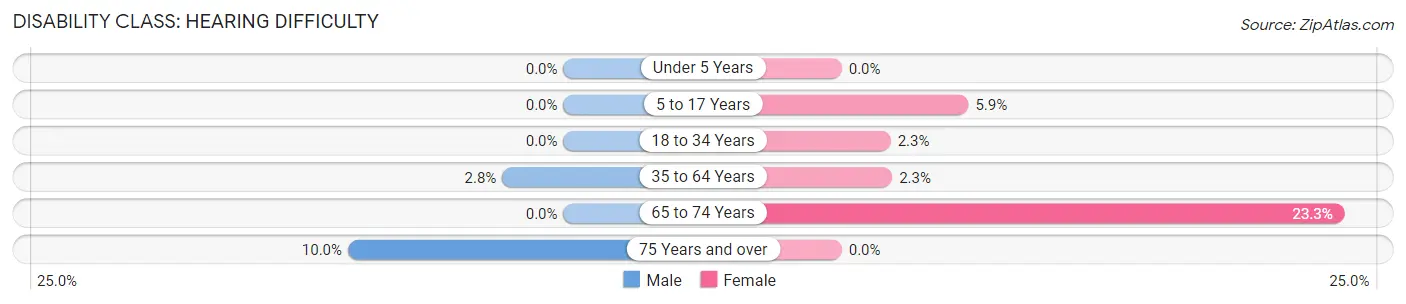
| Age Bracket | Male | Female |
| Under 5 Years | 0 (0.0%) | 0 (0.0%) |
| 5 to 17 Years | 0 (0.0%) | 2 (5.9%) |
| 18 to 34 Years | 0 (0.0%) | 2 (2.3%) |
| 35 to 64 Years | 6 (2.8%) | 5 (2.3%) |
| 65 to 74 Years | 0 (0.0%) | 7 (23.3%) |
| 75 Years and over | 6 (10.0%) | 0 (0.0%) |
Disability Class: Vision Difficulty
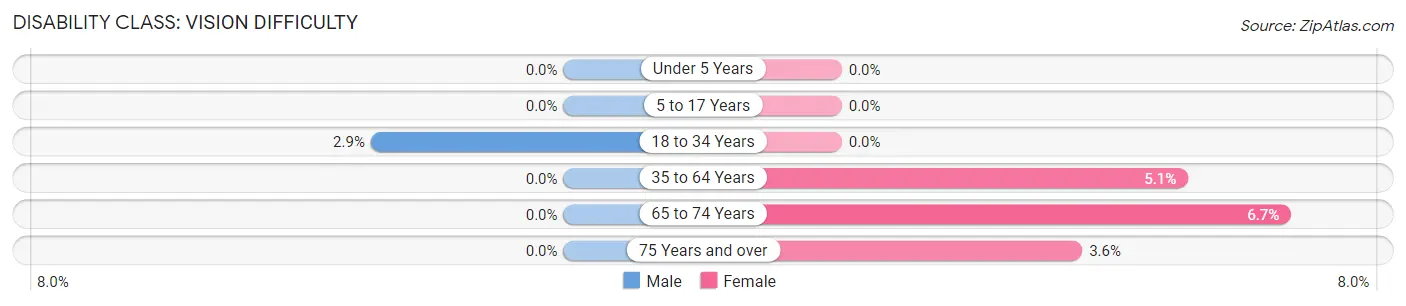
| Age Bracket | Male | Female |
| Under 5 Years | 0 (0.0%) | 0 (0.0%) |
| 5 to 17 Years | 0 (0.0%) | 0 (0.0%) |
| 18 to 34 Years | 1 (2.9%) | 0 (0.0%) |
| 35 to 64 Years | 0 (0.0%) | 11 (5.1%) |
| 65 to 74 Years | 0 (0.0%) | 2 (6.7%) |
| 75 Years and over | 0 (0.0%) | 2 (3.6%) |
Disability Class: Cognitive Difficulty
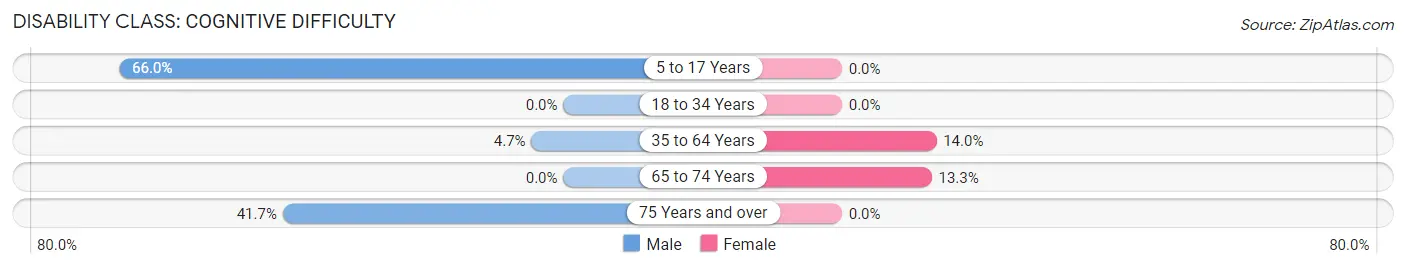
| Age Bracket | Male | Female |
| 5 to 17 Years | 31 (66.0%) | 0 (0.0%) |
| 18 to 34 Years | 0 (0.0%) | 0 (0.0%) |
| 35 to 64 Years | 10 (4.7%) | 30 (14.0%) |
| 65 to 74 Years | 0 (0.0%) | 4 (13.3%) |
| 75 Years and over | 25 (41.7%) | 0 (0.0%) |
Disability Class: Ambulatory Difficulty
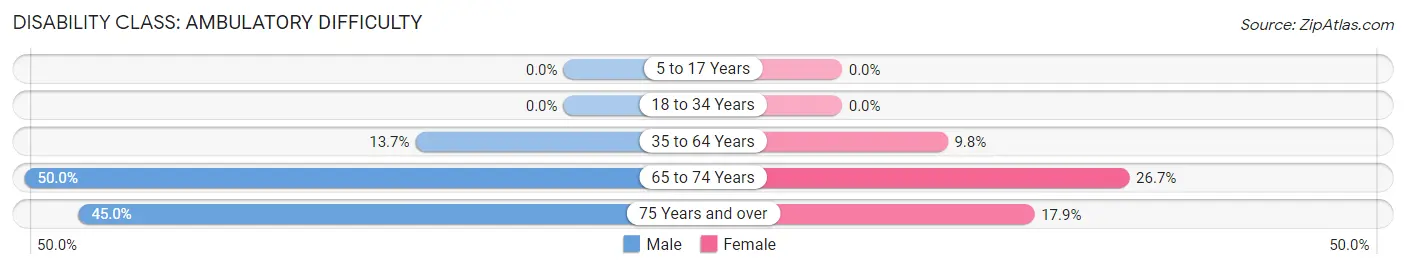
| Age Bracket | Male | Female |
| 5 to 17 Years | 0 (0.0%) | 0 (0.0%) |
| 18 to 34 Years | 0 (0.0%) | 0 (0.0%) |
| 35 to 64 Years | 29 (13.7%) | 21 (9.8%) |
| 65 to 74 Years | 16 (50.0%) | 8 (26.7%) |
| 75 Years and over | 27 (45.0%) | 10 (17.9%) |
Disability Class: Self-Care Difficulty
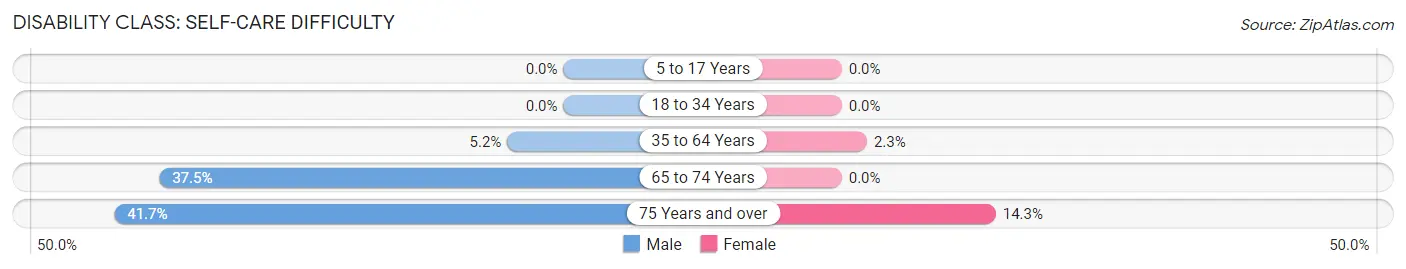
| Age Bracket | Male | Female |
| 5 to 17 Years | 0 (0.0%) | 0 (0.0%) |
| 18 to 34 Years | 0 (0.0%) | 0 (0.0%) |
| 35 to 64 Years | 11 (5.2%) | 5 (2.3%) |
| 65 to 74 Years | 12 (37.5%) | 0 (0.0%) |
| 75 Years and over | 25 (41.7%) | 8 (14.3%) |
Technology Access in Walnut Grove
Computing Device Access in Walnut Grove
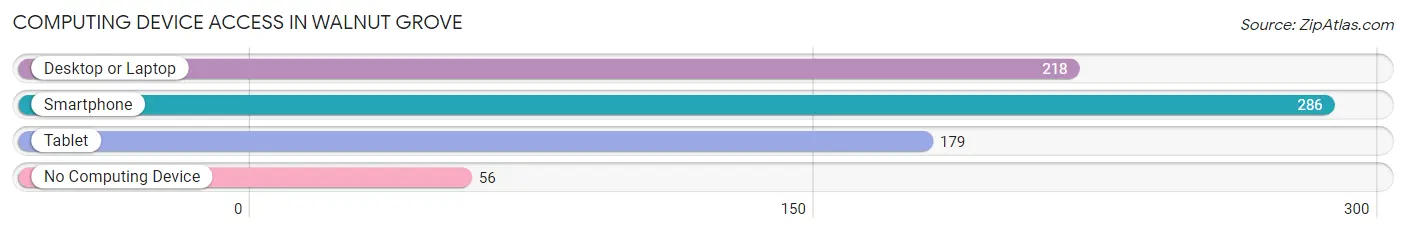
| Device Type | # Households | % Households |
| Desktop or Laptop | 218 | 62.8% |
| Smartphone | 286 | 82.4% |
| Tablet | 179 | 51.6% |
| No Computing Device | 56 | 16.1% |
| Total | 347 | 100.0% |
Internet Access in Walnut Grove
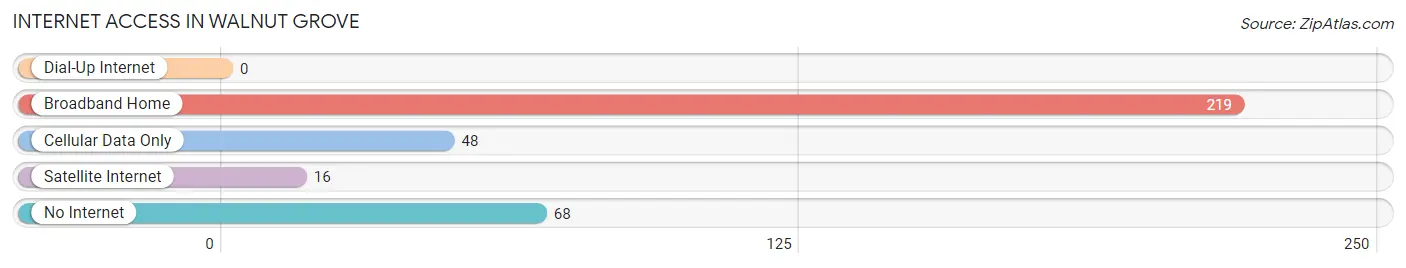
| Internet Type | # Households | % Households |
| Dial-Up Internet | 0 | 0.0% |
| Broadband Home | 219 | 63.1% |
| Cellular Data Only | 48 | 13.8% |
| Satellite Internet | 16 | 4.6% |
| No Internet | 68 | 19.6% |
| Total | 347 | 100.0% |
Walnut Grove Summary
Walnut Grove, Alabama is a small town located in the northwest corner of the state, in the foothills of the Appalachian Mountains. It is situated in the Black Warrior River Valley, and is part of the larger Tuscaloosa metropolitan area. The town has a population of just over 1,000 people, and is known for its rural charm and small-town atmosphere.
History
Walnut Grove was founded in 1818 by a group of settlers from Georgia. The town was originally known as “Walnut Hill”, and was named after the abundance of walnut trees in the area. The town was incorporated in 1837, and the name was changed to Walnut Grove.
The town was an important stop on the stagecoach route between Tuscaloosa and Huntsville, and was a popular destination for travelers. The town was also a major center for cotton production, and was home to several cotton mills.
In the late 19th century, the town was home to a number of prominent families, including the McAdorys, the McWhorters, and the McNeals. These families were influential in the development of the town, and many of their descendants still live in the area today.
Geography
Walnut Grove is located in the northwest corner of Alabama, in the foothills of the Appalachian Mountains. The town is situated in the Black Warrior River Valley, and is part of the larger Tuscaloosa metropolitan area. The town is located approximately 25 miles north of Tuscaloosa, and is bordered by the towns of Northport, Coker, and Brookwood.
The town is situated on a plateau, and is surrounded by rolling hills and forests. The town is located at an elevation of approximately 800 feet, and is situated on the banks of the Black Warrior River.
Economy
The economy of Walnut Grove is largely based on agriculture and tourism. The town is home to several farms, and is known for its production of cotton, corn, soybeans, and other crops. The town is also home to several small businesses, including restaurants, shops, and other services.
The town is also a popular tourist destination, and is home to several historic sites, including the McAdory House, the McWhorter House, and the McNeal House. The town is also home to several parks, including the Walnut Grove Park and the Walnut Grove Nature Preserve.
Demographics
As of the 2010 census, the population of Walnut Grove was 1,072. The town is predominantly white, with a population that is 97.3% white, 0.9% African American, 0.3% Native American, 0.3% Asian, and 0.2% from other races. The median household income in the town is $37,500, and the median age is 41.
Conclusion
Walnut Grove, Alabama is a small town located in the northwest corner of the state, in the foothills of the Appalachian Mountains. The town has a population of just over 1,000 people, and is known for its rural charm and small-town atmosphere. The town is largely based on agriculture and tourism, and is home to several farms, businesses, and historic sites. The town is predominantly white, with a median household income of $37,500 and a median age of 41.
Common Questions
What is Per Capita Income in Walnut Grove?
Per Capita income in Walnut Grove is $22,155.
What is the Median Family Income in Walnut Grove?
Median Family Income in Walnut Grove is $40,833.
What is the Median Household income in Walnut Grove?
Median Household Income in Walnut Grove is $39,049.
What is Inequality or Gini Index in Walnut Grove?
Inequality or Gini Index in Walnut Grove is 0.44.
What is the Total Population of Walnut Grove?
Total Population of Walnut Grove is 873.
What is the Total Male Population of Walnut Grove?
Total Male Population of Walnut Grove is 417.
What is the Total Female Population of Walnut Grove?
Total Female Population of Walnut Grove is 456.
What is the Ratio of Males per 100 Females in Walnut Grove?
There are 91.45 Males per 100 Females in Walnut Grove.
What is the Ratio of Females per 100 Males in Walnut Grove?
There are 109.35 Females per 100 Males in Walnut Grove.
What is the Median Population Age in Walnut Grove?
Median Population Age in Walnut Grove is 47.3 Years.
What is the Average Family Size in Walnut Grove
Average Family Size in Walnut Grove is 2.8 People.
What is the Average Household Size in Walnut Grove
Average Household Size in Walnut Grove is 2.5 People.
How Large is the Labor Force in Walnut Grove?
There are 383 People in the Labor Forcein in Walnut Grove.
What is the Percentage of People in the Labor Force in Walnut Grove?
52.3% of People are in the Labor Force in Walnut Grove.
What is the Unemployment Rate in Walnut Grove?
Unemployment Rate in Walnut Grove is 1.0%.