Vina, AL Map & Demographics
Vina Map
Vina Overview
$15,784
PER CAPITA INCOME
$37,708
AVG HOUSEHOLD INCOME
41.4%
WAGE / INCOME GAP [ % ]
58.6¢/ $1
WAGE / INCOME GAP [ $ ]
0.41
INEQUALITY / GINI INDEX
389
TOTAL POPULATION
187
MALE POPULATION
202
FEMALE POPULATION
92.57
MALES / 100 FEMALES
108.02
FEMALES / 100 MALES
41.0
MEDIAN AGE
3.6
AVG FAMILY SIZE
3.0
AVG HOUSEHOLD SIZE
120
LABOR FORCE [ PEOPLE ]
39.7%
PERCENT IN LABOR FORCE
Vina Zip Codes
Income in Vina
Income Overview in Vina
| Characteristic | Number | Measure |
| Per Capita Income | 389 | $15,784 |
| Median Family Income | 91 | $0 |
| Mean Family Income | 91 | $41,414 |
| Median Household Income | 129 | $37,708 |
| Mean Household Income | 129 | $41,996 |
| Income Deficit | 91 | $0 |
| Wage / Income Gap (%) | 389 | 41.40% |
| Wage / Income Gap ($) | 389 | 58.59¢ per $1 |
| Gini / Inequality Index | 389 | 0.41 |
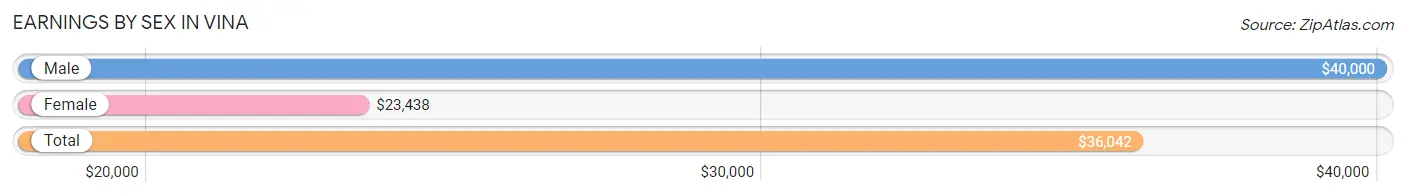
Earnings by Sex in Vina
Average Earnings in Vina are $36,042, $40,000 for men and $23,438 for women, a difference of 41.4%.
| Sex | Number | Average Earnings |
| Male | 86 (65.6%) | $40,000 |
| Female | 45 (34.4%) | $23,438 |
| Total | 131 (100.0%) | $36,042 |
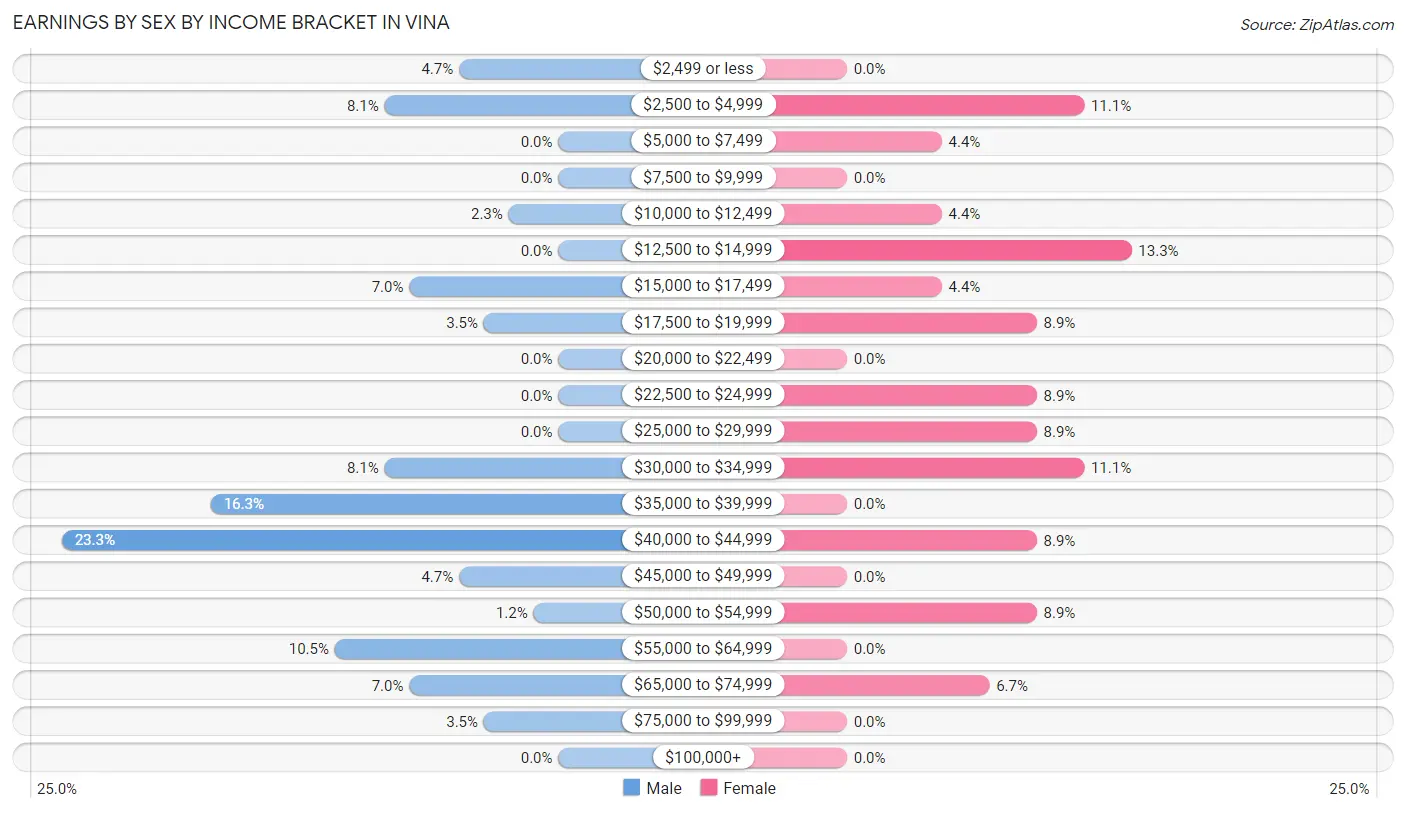
Earnings by Sex by Income Bracket in Vina
The most common earnings brackets in Vina are $40,000 to $44,999 for men (20 | 23.3%) and $12,500 to $14,999 for women (6 | 13.3%).
| Income | Male | Female |
| $2,499 or less | 4 (4.6%) | 0 (0.0%) |
| $2,500 to $4,999 | 7 (8.1%) | 5 (11.1%) |
| $5,000 to $7,499 | 0 (0.0%) | 2 (4.4%) |
| $7,500 to $9,999 | 0 (0.0%) | 0 (0.0%) |
| $10,000 to $12,499 | 2 (2.3%) | 2 (4.4%) |
| $12,500 to $14,999 | 0 (0.0%) | 6 (13.3%) |
| $15,000 to $17,499 | 6 (7.0%) | 2 (4.4%) |
| $17,500 to $19,999 | 3 (3.5%) | 4 (8.9%) |
| $20,000 to $22,499 | 0 (0.0%) | 0 (0.0%) |
| $22,500 to $24,999 | 0 (0.0%) | 4 (8.9%) |
| $25,000 to $29,999 | 0 (0.0%) | 4 (8.9%) |
| $30,000 to $34,999 | 7 (8.1%) | 5 (11.1%) |
| $35,000 to $39,999 | 14 (16.3%) | 0 (0.0%) |
| $40,000 to $44,999 | 20 (23.3%) | 4 (8.9%) |
| $45,000 to $49,999 | 4 (4.6%) | 0 (0.0%) |
| $50,000 to $54,999 | 1 (1.2%) | 4 (8.9%) |
| $55,000 to $64,999 | 9 (10.5%) | 0 (0.0%) |
| $65,000 to $74,999 | 6 (7.0%) | 3 (6.7%) |
| $75,000 to $99,999 | 3 (3.5%) | 0 (0.0%) |
| $100,000+ | 0 (0.0%) | 0 (0.0%) |
| Total | 86 (100.0%) | 45 (100.0%) |
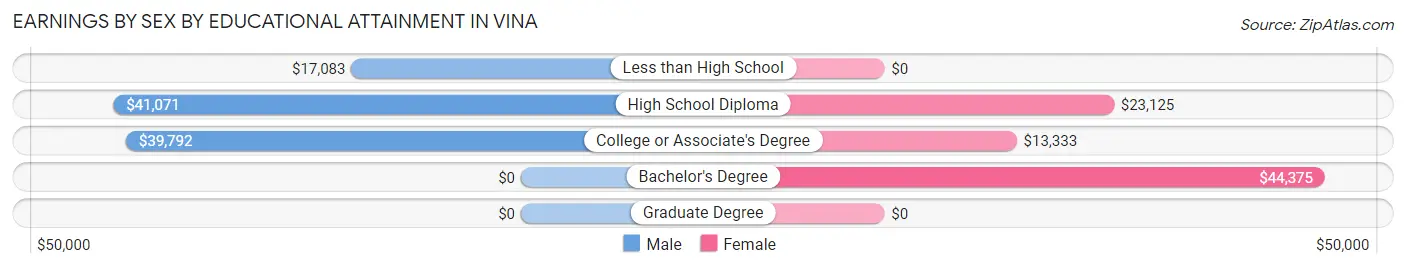
Earnings by Sex by Educational Attainment in Vina
Average earnings in Vina are $40,893 for men and $23,438 for women, a difference of 42.7%. Men with an educational attainment of high school diploma enjoy the highest average annual earnings of $41,071, while those with less than high school education earn the least with $17,083. Women with an educational attainment of bachelor's degree earn the most with the average annual earnings of $44,375, while those with college or associate's degree education have the smallest earnings of $13,333.
| Educational Attainment | Male Income | Female Income |
| Less than High School | $17,083 | $0 |
| High School Diploma | $41,071 | $23,125 |
| College or Associate's Degree | $39,792 | $13,333 |
| Bachelor's Degree | - | - |
| Graduate Degree | - | - |
| Total | $40,893 | $23,438 |
Family Income in Vina
Family Income Brackets in Vina
According to the Vina family income data, there are 16 families falling into the $10,000 to $14,999 income range, which is the most common income bracket and makes up 17.6% of all families.
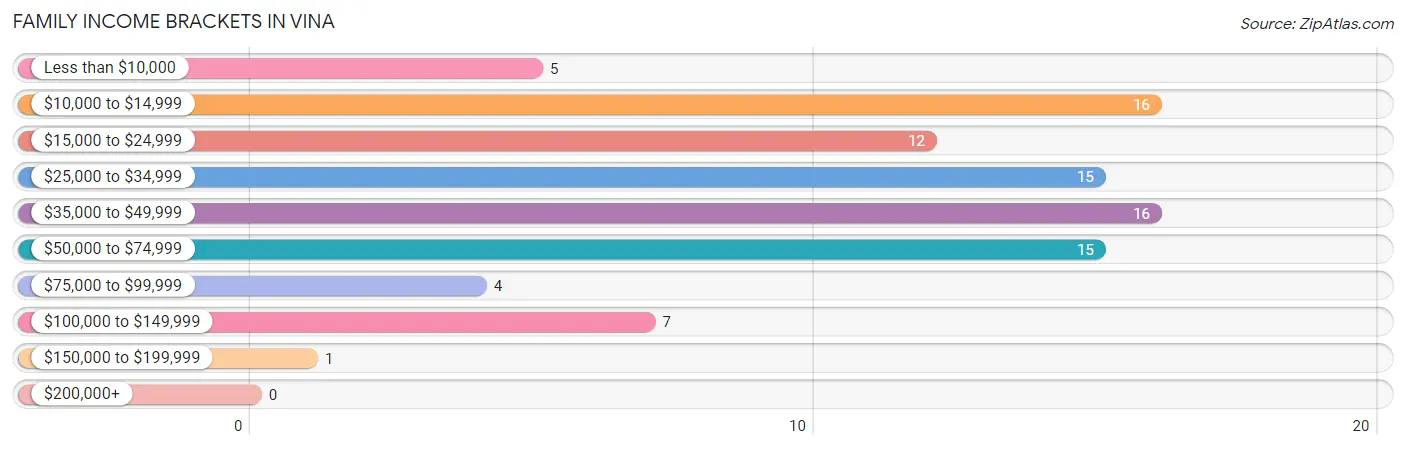
| Income Bracket | # Families | % Families |
| Less than $10,000 | 5 | 5.5% |
| $10,000 to $14,999 | 16 | 17.6% |
| $15,000 to $24,999 | 12 | 13.2% |
| $25,000 to $34,999 | 15 | 16.5% |
| $35,000 to $49,999 | 16 | 17.6% |
| $50,000 to $74,999 | 15 | 16.5% |
| $75,000 to $99,999 | 4 | 4.4% |
| $100,000 to $149,999 | 7 | 7.7% |
| $150,000 to $199,999 | 1 | 1.1% |
| $200,000+ | 0 | 0.0% |
Family Income by Famaliy Size in Vina
4-person families (14 | 15.4%) account for the highest median family income in Vina with $55,625 per family, while 4-person families (14 | 15.4%) have the highest median income of $13,906 per family member.
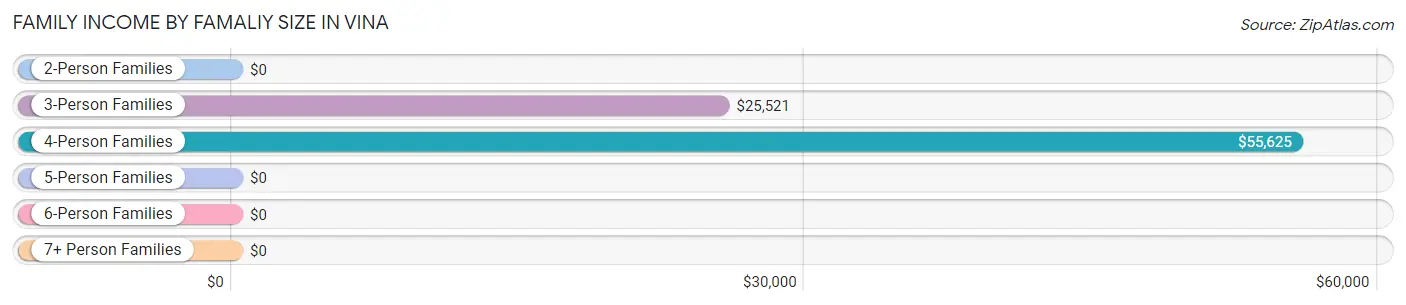
| Income Bracket | # Families | Median Income |
| 2-Person Families | 28 (30.8%) | $0 |
| 3-Person Families | 39 (42.9%) | $25,521 |
| 4-Person Families | 14 (15.4%) | $55,625 |
| 5-Person Families | 10 (11.0%) | $0 |
| 6-Person Families | 0 (0.0%) | $0 |
| 7+ Person Families | 0 (0.0%) | $0 |
| Total | 91 (100.0%) | $0 |
Family Income by Number of Earners in Vina
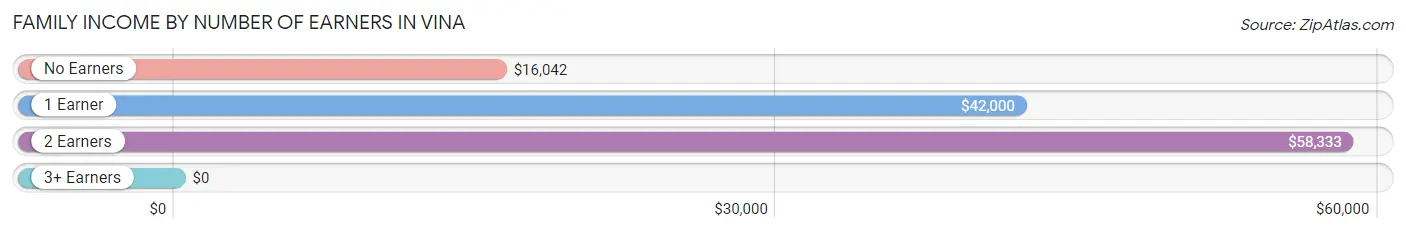
| Number of Earners | # Families | Median Income |
| No Earners | 39 (42.9%) | $16,042 |
| 1 Earner | 30 (33.0%) | $42,000 |
| 2 Earners | 20 (22.0%) | $58,333 |
| 3+ Earners | 2 (2.2%) | $0 |
| Total | 91 (100.0%) | $0 |
Household Income in Vina
Household Income Brackets in Vina
With 31 households falling in the category, the $50,000 to $74,999 income range is the most frequent in Vina, accounting for 24.0% of all households.
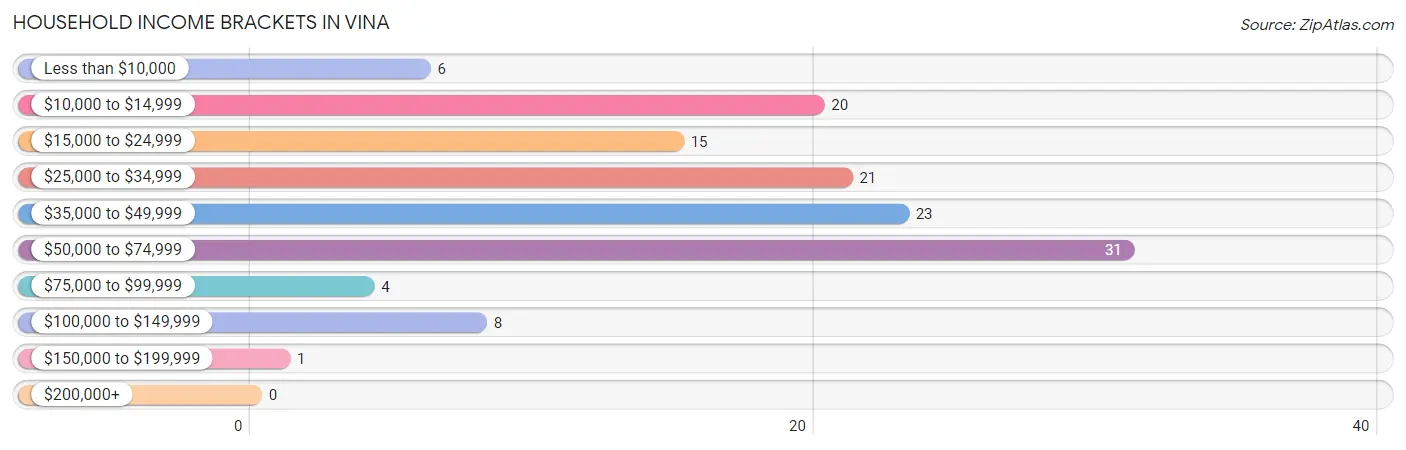
| Income Bracket | # Households | % Households |
| Less than $10,000 | 6 | 4.7% |
| $10,000 to $14,999 | 20 | 15.5% |
| $15,000 to $24,999 | 15 | 11.6% |
| $25,000 to $34,999 | 21 | 16.3% |
| $35,000 to $49,999 | 23 | 17.8% |
| $50,000 to $74,999 | 31 | 24.0% |
| $75,000 to $99,999 | 4 | 3.1% |
| $100,000 to $149,999 | 8 | 6.2% |
| $150,000 to $199,999 | 1 | 0.8% |
| $200,000+ | 0 | 0.0% |
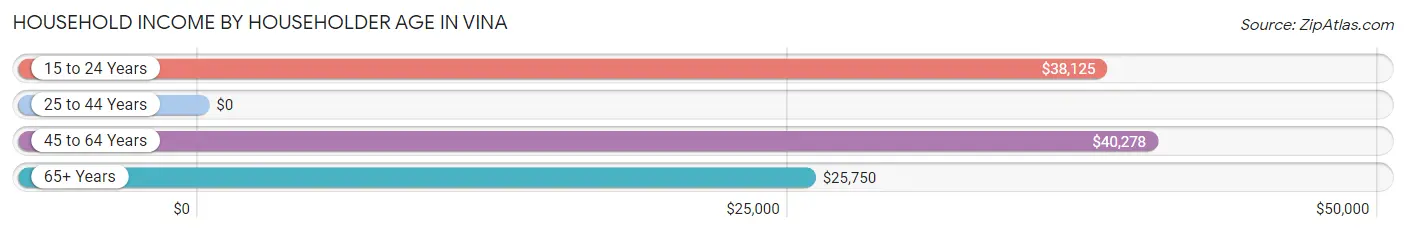
Household Income by Householder Age in Vina
The median household income in Vina is $37,708, with the highest median household income of $40,278 found in the 45 to 64 years age bracket for the primary householder. A total of 52 households (40.3%) fall into this category. Meanwhile, the 25 to 44 years age bracket for the primary householder has the lowest median household income of $0, with 45 households (34.9%) in this group.
| Income Bracket | # Households | Median Income |
| 15 to 24 Years | 5 (3.9%) | $38,125 |
| 25 to 44 Years | 45 (34.9%) | $0 |
| 45 to 64 Years | 52 (40.3%) | $40,278 |
| 65+ Years | 27 (20.9%) | $25,750 |
| Total | 129 (100.0%) | $37,708 |
Poverty in Vina
Income Below Poverty by Sex and Age in Vina
With 24.6% poverty level for males and 40.6% for females among the residents of Vina, 15 year old males and 12 to 14 year old females are the most vulnerable to poverty, with 5 males (100.0%) and 12 females (85.7%) in their respective age groups living below the poverty level.
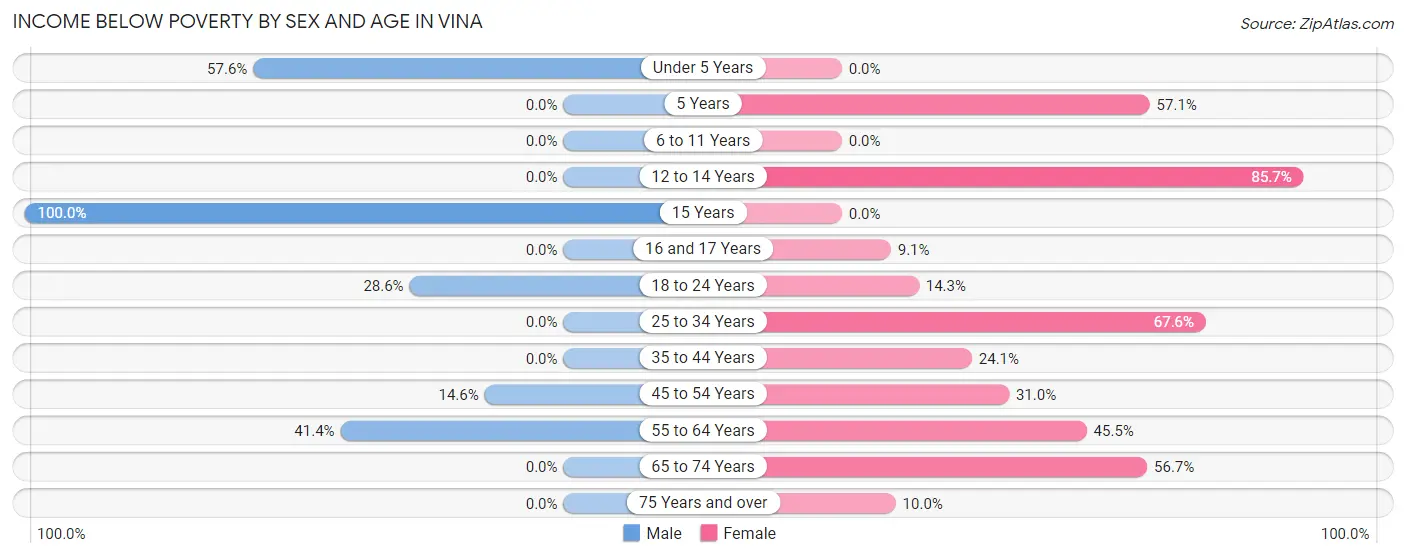
| Age Bracket | Male | Female |
| Under 5 Years | 19 (57.6%) | 0 (0.0%) |
| 5 Years | 0 (0.0%) | 4 (57.1%) |
| 6 to 11 Years | 0 (0.0%) | 0 (0.0%) |
| 12 to 14 Years | 0 (0.0%) | 12 (85.7%) |
| 15 Years | 5 (100.0%) | 0 (0.0%) |
| 16 and 17 Years | 0 (0.0%) | 1 (9.1%) |
| 18 to 24 Years | 4 (28.6%) | 1 (14.3%) |
| 25 to 34 Years | 0 (0.0%) | 25 (67.6%) |
| 35 to 44 Years | 0 (0.0%) | 7 (24.1%) |
| 45 to 54 Years | 6 (14.6%) | 9 (31.0%) |
| 55 to 64 Years | 12 (41.4%) | 5 (45.5%) |
| 65 to 74 Years | 0 (0.0%) | 17 (56.7%) |
| 75 Years and over | 0 (0.0%) | 1 (10.0%) |
| Total | 46 (24.6%) | 82 (40.6%) |
Income Above Poverty by Sex and Age in Vina
According to the poverty statistics in Vina, males aged 6 to 11 years and females aged under 5 years are the age groups that are most secure financially, with 100.0% of males and 100.0% of females in these age groups living above the poverty line.
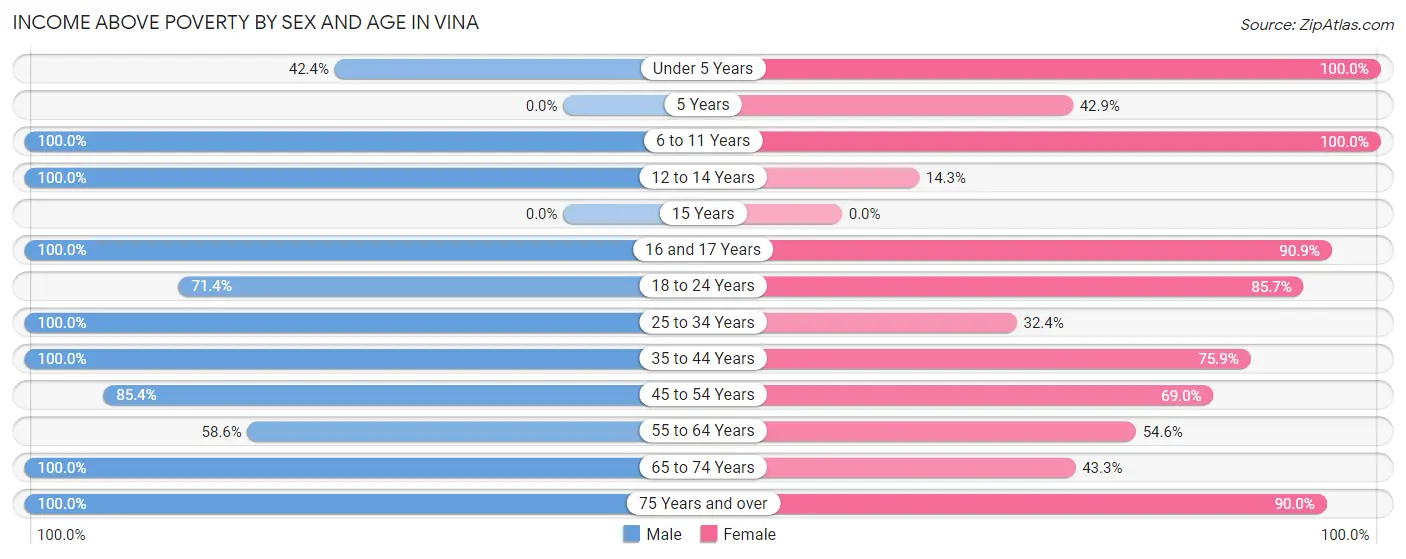
| Age Bracket | Male | Female |
| Under 5 Years | 14 (42.4%) | 13 (100.0%) |
| 5 Years | 0 (0.0%) | 3 (42.9%) |
| 6 to 11 Years | 3 (100.0%) | 4 (100.0%) |
| 12 to 14 Years | 8 (100.0%) | 2 (14.3%) |
| 15 Years | 0 (0.0%) | 0 (0.0%) |
| 16 and 17 Years | 9 (100.0%) | 10 (90.9%) |
| 18 to 24 Years | 10 (71.4%) | 6 (85.7%) |
| 25 to 34 Years | 12 (100.0%) | 12 (32.4%) |
| 35 to 44 Years | 18 (100.0%) | 22 (75.9%) |
| 45 to 54 Years | 35 (85.4%) | 20 (69.0%) |
| 55 to 64 Years | 17 (58.6%) | 6 (54.5%) |
| 65 to 74 Years | 7 (100.0%) | 13 (43.3%) |
| 75 Years and over | 8 (100.0%) | 9 (90.0%) |
| Total | 141 (75.4%) | 120 (59.4%) |
Income Below Poverty Among Married-Couple Families in Vina
The poverty statistics for married-couple families in Vina show that 12.1% or 7 of the total 58 families live below the poverty line. Families with no children have the highest poverty rate of 28.6%, comprising of 6 families. On the other hand, families with 3 or 4 children have the lowest poverty rate of 0.0%, which includes 0 families.
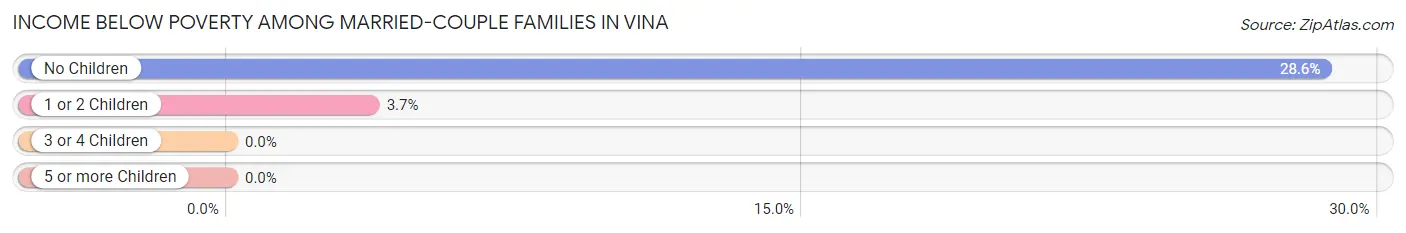
| Children | Above Poverty | Below Poverty |
| No Children | 15 (71.4%) | 6 (28.6%) |
| 1 or 2 Children | 26 (96.3%) | 1 (3.7%) |
| 3 or 4 Children | 10 (100.0%) | 0 (0.0%) |
| 5 or more Children | 0 (0.0%) | 0 (0.0%) |
| Total | 51 (87.9%) | 7 (12.1%) |
Income Below Poverty Among Single-Parent Households in Vina
According to the poverty data in Vina, 25.0% or 1 single-father households and 79.3% or 23 single-mother households are living below the poverty line. Among single-father households, those with no children have the highest poverty rate, with 1 households (33.3%) experiencing poverty. Likewise, among single-mother households, those with 3 or 4 children have the highest poverty rate, with 4 households (100.0%) falling below the poverty line.
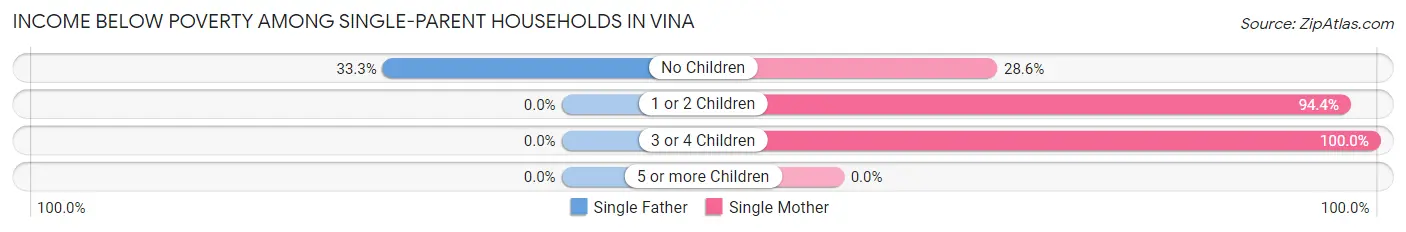
| Children | Single Father | Single Mother |
| No Children | 1 (33.3%) | 2 (28.6%) |
| 1 or 2 Children | 0 (0.0%) | 17 (94.4%) |
| 3 or 4 Children | 0 (0.0%) | 4 (100.0%) |
| 5 or more Children | 0 (0.0%) | 0 (0.0%) |
| Total | 1 (25.0%) | 23 (79.3%) |
Income Below Poverty Among Married-Couple vs Single-Parent Households in Vina
The poverty data for Vina shows that 7 of the married-couple family households (12.1%) and 24 of the single-parent households (72.7%) are living below the poverty level. Within the married-couple family households, those with no children have the highest poverty rate, with 6 households (28.6%) falling below the poverty line. Among the single-parent households, those with 3 or 4 children have the highest poverty rate, with 4 household (100.0%) living below poverty.
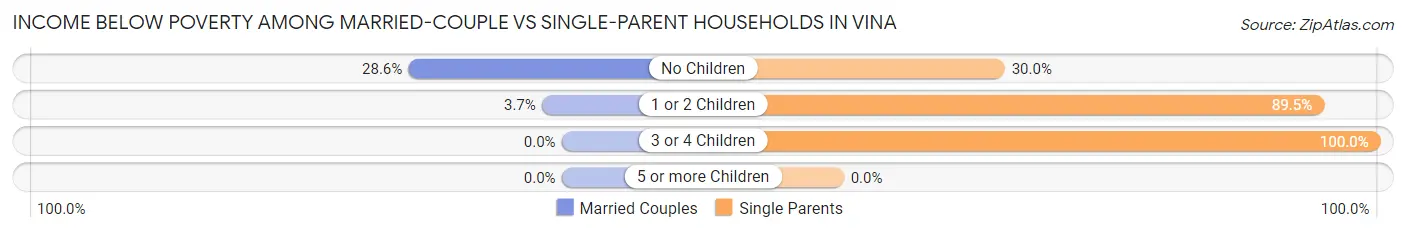
| Children | Married-Couple Families | Single-Parent Households |
| No Children | 6 (28.6%) | 3 (30.0%) |
| 1 or 2 Children | 1 (3.7%) | 17 (89.5%) |
| 3 or 4 Children | 0 (0.0%) | 4 (100.0%) |
| 5 or more Children | 0 (0.0%) | 0 (0.0%) |
| Total | 7 (12.1%) | 24 (72.7%) |
Race in Vina
The most populous races in Vina are White / Caucasian (384 | 98.7%), and Black / African American (5 | 1.3%).
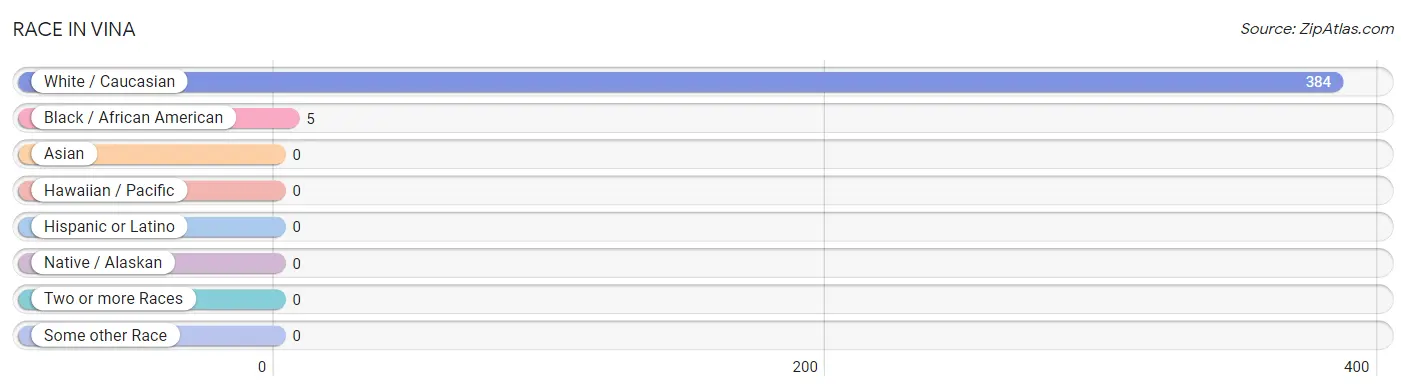
| Race | # Population | % Population |
| Asian | 0 | 0.0% |
| Black / African American | 5 | 1.3% |
| Hawaiian / Pacific | 0 | 0.0% |
| Hispanic or Latino | 0 | 0.0% |
| Native / Alaskan | 0 | 0.0% |
| White / Caucasian | 384 | 98.7% |
| Two or more Races | 0 | 0.0% |
| Some other Race | 0 | 0.0% |
| Total | 389 | 100.0% |
Ancestry in Vina
The most populous ancestries reported in Vina are American (218 | 56.0%), English (43 | 11.1%), German (22 | 5.7%), European (13 | 3.3%), and Irish (10 | 2.6%), together accounting for 78.7% of all Vina residents.
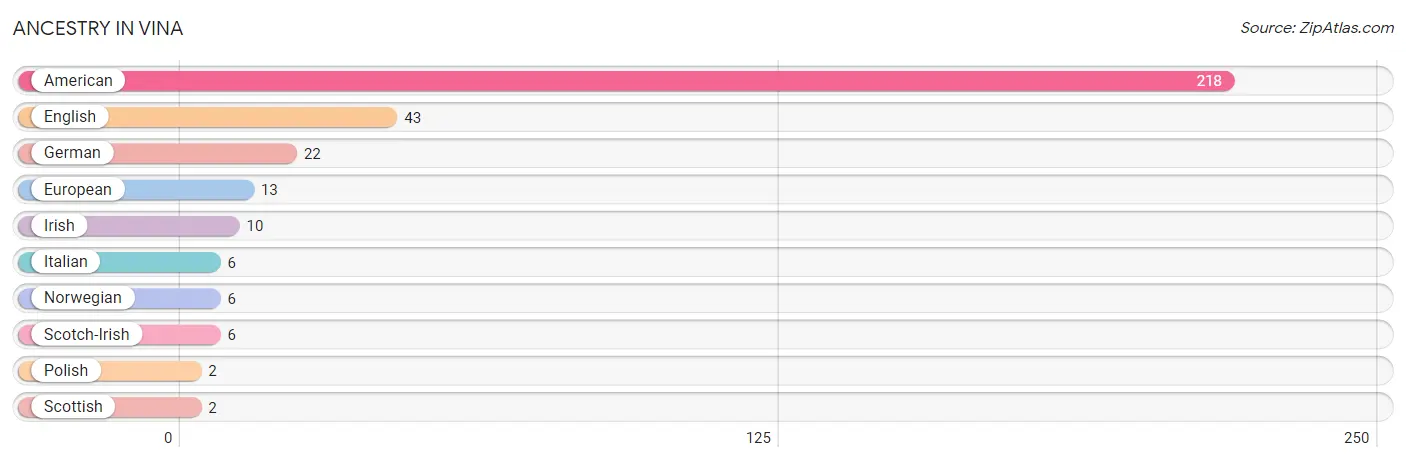
| Ancestry | # Population | % Population |
| American | 218 | 56.0% |
| English | 43 | 11.1% |
| European | 13 | 3.3% |
| German | 22 | 5.7% |
| Irish | 10 | 2.6% |
| Italian | 6 | 1.5% |
| Norwegian | 6 | 1.5% |
| Polish | 2 | 0.5% |
| Scotch-Irish | 6 | 1.5% |
| Scottish | 2 | 0.5% | View All 10 Rows |
Immigrants in Vina

| Immigration Origin | # Population | % Population | View All 0 Rows |
Sex and Age in Vina
Sex and Age in Vina
The most populous age groups in Vina are Under 5 Years (33 | 17.6%) for men and 25 to 29 Years (23 | 11.4%) for women.

| Age Bracket | Male | Female |
| Under 5 Years | 33 (17.6%) | 13 (6.4%) |
| 5 to 9 Years | 3 (1.6%) | 11 (5.4%) |
| 10 to 14 Years | 8 (4.3%) | 14 (6.9%) |
| 15 to 19 Years | 16 (8.6%) | 11 (5.4%) |
| 20 to 24 Years | 12 (6.4%) | 7 (3.5%) |
| 25 to 29 Years | 4 (2.1%) | 23 (11.4%) |
| 30 to 34 Years | 8 (4.3%) | 14 (6.9%) |
| 35 to 39 Years | 4 (2.1%) | 9 (4.5%) |
| 40 to 44 Years | 14 (7.5%) | 20 (9.9%) |
| 45 to 49 Years | 26 (13.9%) | 10 (5.0%) |
| 50 to 54 Years | 15 (8.0%) | 19 (9.4%) |
| 55 to 59 Years | 7 (3.7%) | 9 (4.5%) |
| 60 to 64 Years | 22 (11.8%) | 2 (1.0%) |
| 65 to 69 Years | 2 (1.1%) | 8 (4.0%) |
| 70 to 74 Years | 5 (2.7%) | 22 (10.9%) |
| 75 to 79 Years | 6 (3.2%) | 0 (0.0%) |
| 80 to 84 Years | 0 (0.0%) | 8 (4.0%) |
| 85 Years and over | 2 (1.1%) | 2 (1.0%) |
| Total | 187 (100.0%) | 202 (100.0%) |
Families and Households in Vina
Median Family Size in Vina
The median family size in Vina is 3.63 persons per family, with single female/mother families (29 | 31.9%) accounting for the largest median family size of 4.21 persons per family. On the other hand, married-couple families (58 | 63.7%) represent the smallest median family size with 3.33 persons per family.
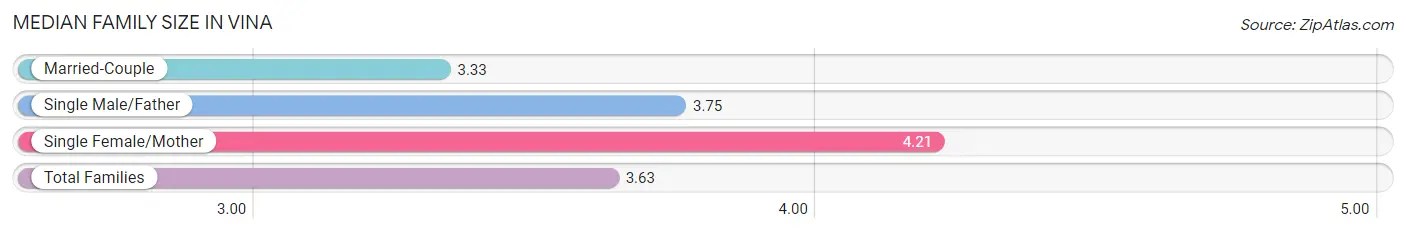
| Family Type | # Families | Family Size |
| Married-Couple | 58 (63.7%) | 3.33 |
| Single Male/Father | 4 (4.4%) | 3.75 |
| Single Female/Mother | 29 (31.9%) | 4.21 |
| Total Families | 91 (100.0%) | 3.63 |
Median Household Size in Vina
The median household size in Vina is 3.02 persons per household, with single female/mother households (29 | 22.5%) accounting for the largest median household size of 4.38 persons per household. non-family households (38 | 29.5%) represent the smallest median household size with 1.42 persons per household.
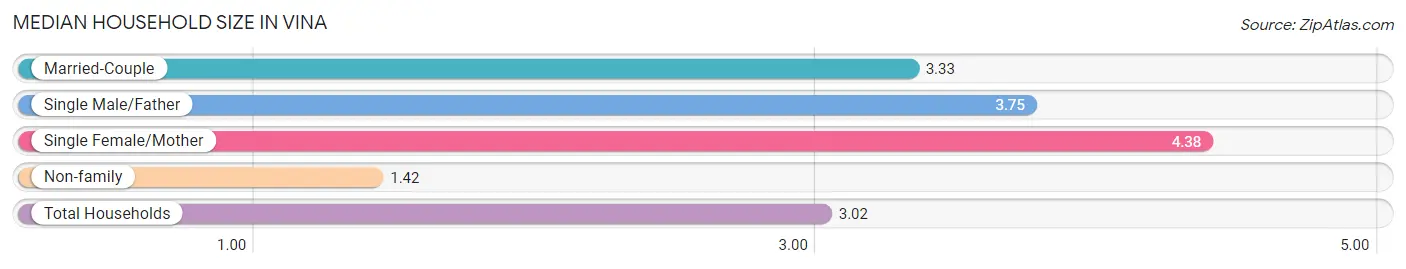
| Household Type | # Households | Household Size |
| Married-Couple | 58 (45.0%) | 3.33 |
| Single Male/Father | 4 (3.1%) | 3.75 |
| Single Female/Mother | 29 (22.5%) | 4.38 |
| Non-family | 38 (29.5%) | 1.42 |
| Total Households | 129 (100.0%) | 3.02 |
Household Size by Marriage Status in Vina
Out of a total of 129 households in Vina, 91 (70.5%) are family households, while 38 (29.5%) are nonfamily households. The most numerous type of family households are 3-person households, comprising 40, and the most common type of nonfamily households are 1-person households, comprising 25.
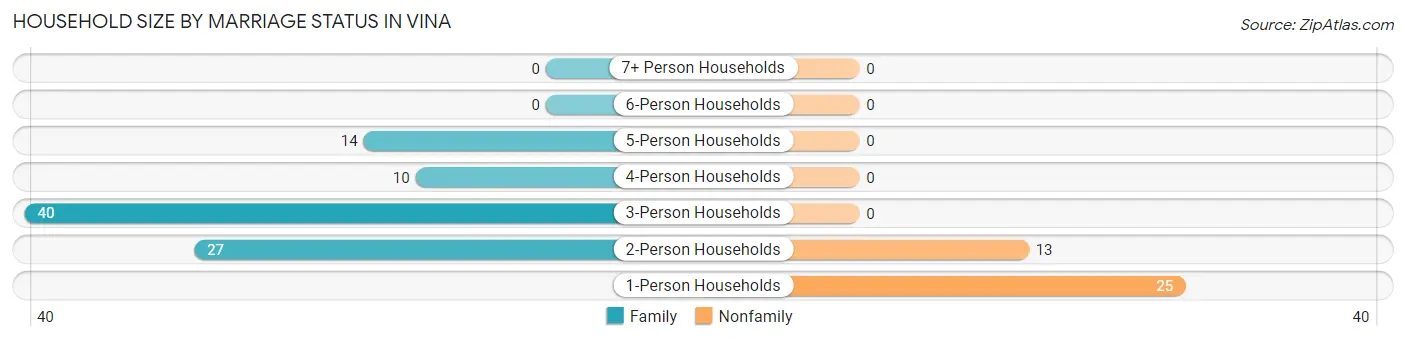
| Household Size | Family Households | Nonfamily Households |
| 1-Person Households | - | 25 (19.4%) |
| 2-Person Households | 27 (20.9%) | 13 (10.1%) |
| 3-Person Households | 40 (31.0%) | 0 (0.0%) |
| 4-Person Households | 10 (7.7%) | 0 (0.0%) |
| 5-Person Households | 14 (10.8%) | 0 (0.0%) |
| 6-Person Households | 0 (0.0%) | 0 (0.0%) |
| 7+ Person Households | 0 (0.0%) | 0 (0.0%) |
| Total | 91 (70.5%) | 38 (29.5%) |
Female Fertility in Vina
Fertility by Age in Vina
Average fertility rate in Vina is 147.0 births per 1,000 women. Women in the age bracket of 35 to 50 years have the highest fertility rate with 175.0 births per 1,000 women. Women in the age bracket of 20 to 34 years acount for 50.0% of all women with births.
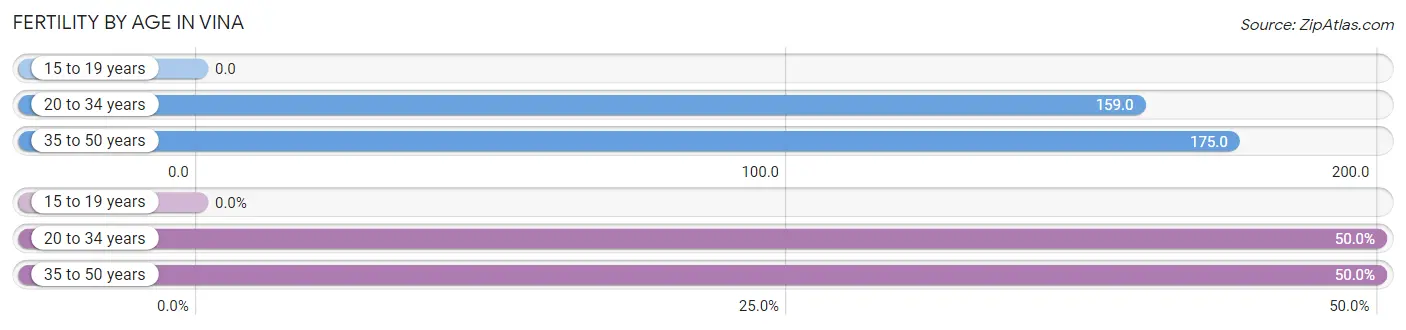
| Age Bracket | Women with Births | Births / 1,000 Women |
| 15 to 19 years | 0 (0.0%) | 0.0 |
| 20 to 34 years | 7 (50.0%) | 159.0 |
| 35 to 50 years | 7 (50.0%) | 175.0 |
| Total | 14 (100.0%) | 147.0 |
Fertility by Age by Marriage Status in Vina
35.7% of women with births (14) in Vina are married. The highest percentage of unmarried women with births falls into 35 to 50 years age bracket with 100.0% of them unmarried at the time of birth, while the lowest percentage of unmarried women with births belong to 20 to 34 years age bracket with 28.6% of them unmarried.
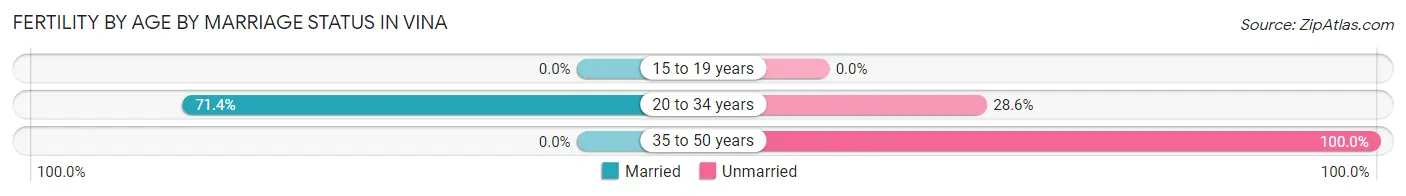
| Age Bracket | Married | Unmarried |
| 15 to 19 years | 0 (0.0%) | 0 (0.0%) |
| 20 to 34 years | 5 (71.4%) | 2 (28.6%) |
| 35 to 50 years | 0 (0.0%) | 7 (100.0%) |
| Total | 5 (35.7%) | 9 (64.3%) |
Fertility by Education in Vina
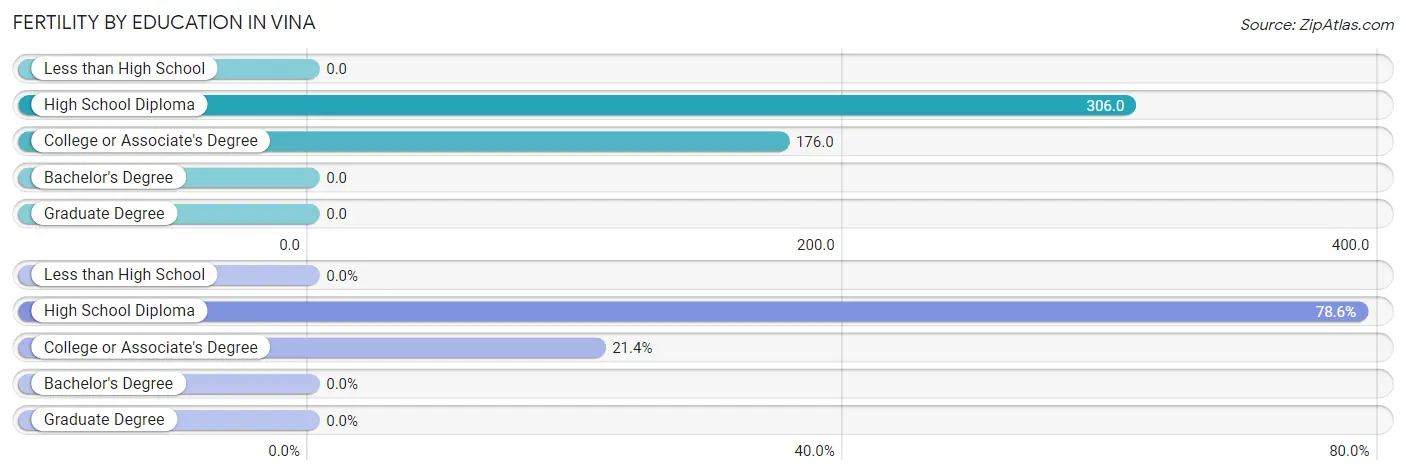
| Educational Attainment | Women with Births | Births / 1,000 Women |
| Less than High School | 0 (0.0%) | 0.0 |
| High School Diploma | 11 (78.6%) | 306.0 |
| College or Associate's Degree | 3 (21.4%) | 176.0 |
| Bachelor's Degree | 0 (0.0%) | 0.0 |
| Graduate Degree | 0 (0.0%) | 0.0 |
| Total | 14 (100.0%) | 147.0 |
Fertility by Education by Marriage Status in Vina
64.3% of women with births in Vina are unmarried. Women with the educational attainment of college or associate's degree are most likely to be married with 100.0% of them married at childbirth, while women with the educational attainment of high school diploma are least likely to be married with 81.8% of them unmarried at childbirth.
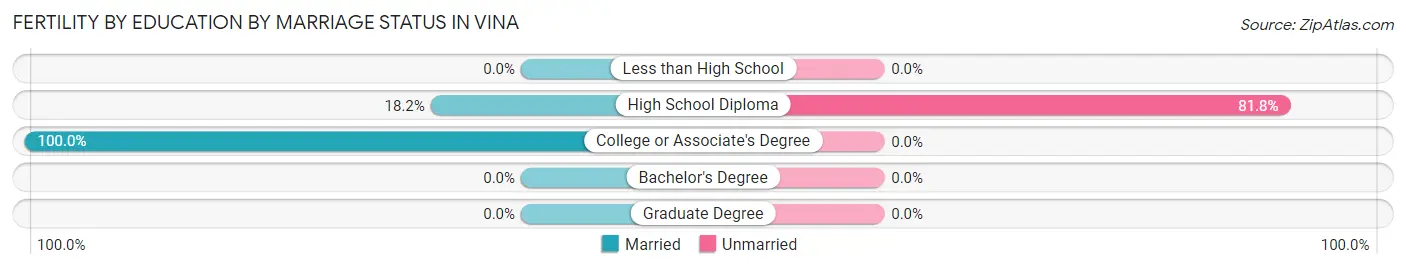
| Educational Attainment | Married | Unmarried |
| Less than High School | 0 (0.0%) | 0 (0.0%) |
| High School Diploma | 2 (18.2%) | 9 (81.8%) |
| College or Associate's Degree | 3 (100.0%) | 0 (0.0%) |
| Bachelor's Degree | 0 (0.0%) | 0 (0.0%) |
| Graduate Degree | 0 (0.0%) | 0 (0.0%) |
| Total | 5 (35.7%) | 9 (64.3%) |
Employment Characteristics in Vina
Employment by Class of Employer in Vina
Among the 119 employed individuals in Vina, private company employees (98 | 82.4%), self-employed (incorporated) (5 | 4.2%), and self-employed (not incorporated) (5 | 4.2%) make up the most common classes of employment.
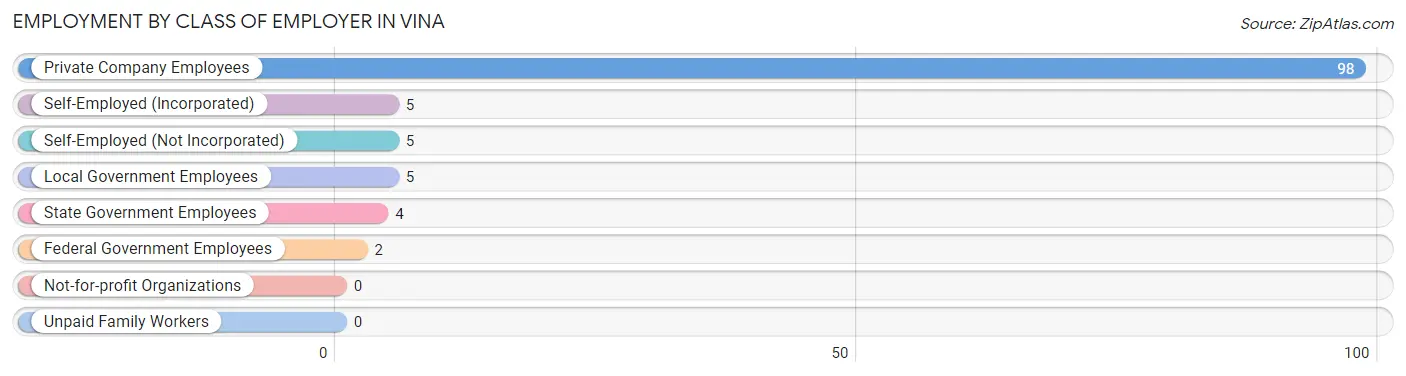
| Employer Class | # Employees | % Employees |
| Private Company Employees | 98 | 82.4% |
| Self-Employed (Incorporated) | 5 | 4.2% |
| Self-Employed (Not Incorporated) | 5 | 4.2% |
| Not-for-profit Organizations | 0 | 0.0% |
| Local Government Employees | 5 | 4.2% |
| State Government Employees | 4 | 3.4% |
| Federal Government Employees | 2 | 1.7% |
| Unpaid Family Workers | 0 | 0.0% |
| Total | 119 | 100.0% |
Employment Status by Age in Vina
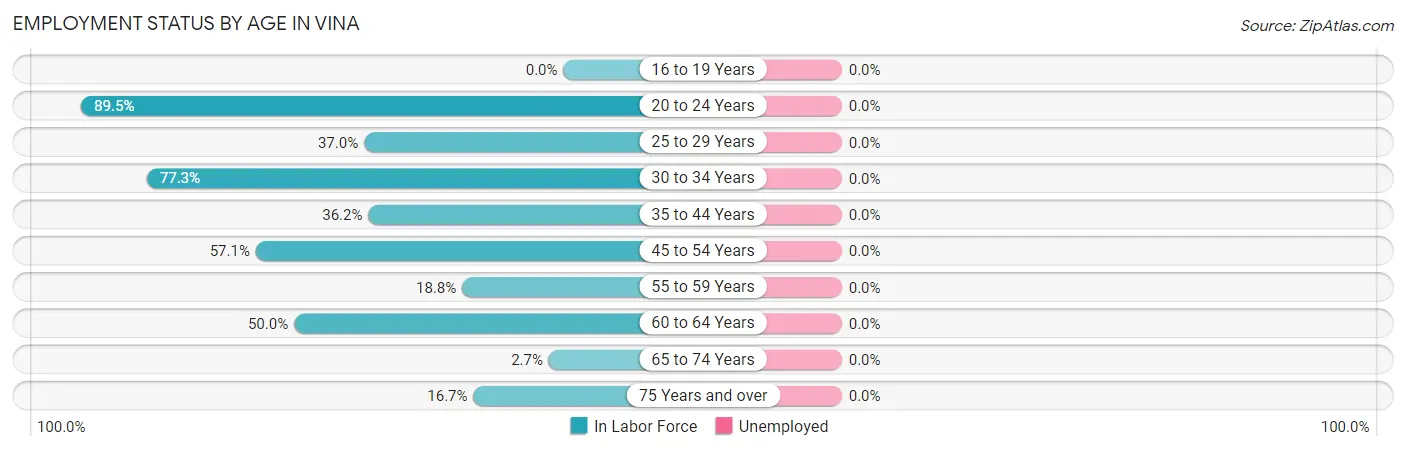
| Age Bracket | In Labor Force | Unemployed |
| 16 to 19 Years | 0 (0.0%) | 0 (0.0%) |
| 20 to 24 Years | 17 (89.5%) | 0 (0.0%) |
| 25 to 29 Years | 10 (37.0%) | 0 (0.0%) |
| 30 to 34 Years | 17 (77.3%) | 0 (0.0%) |
| 35 to 44 Years | 17 (36.2%) | 0 (0.0%) |
| 45 to 54 Years | 40 (57.1%) | 0 (0.0%) |
| 55 to 59 Years | 3 (18.8%) | 0 (0.0%) |
| 60 to 64 Years | 12 (50.0%) | 0 (0.0%) |
| 65 to 74 Years | 1 (2.7%) | 0 (0.0%) |
| 75 Years and over | 3 (16.7%) | 0 (0.0%) |
| Total | 120 (39.7%) | 0 (0.0%) |
Employment Status by Educational Attainment in Vina
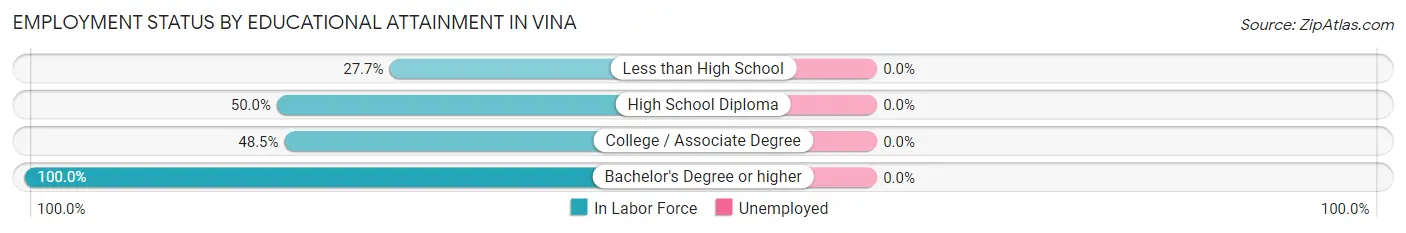
| Educational Attainment | In Labor Force | Unemployed |
| Less than High School | 13 (27.7%) | 0 (0.0%) |
| High School Diploma | 56 (50.0%) | 0 (0.0%) |
| College / Associate Degree | 16 (48.5%) | 0 (0.0%) |
| Bachelor's Degree or higher | 14 (100.0%) | 0 (0.0%) |
| Total | 99 (48.1%) | 0 (0.0%) |
Employment Occupations by Sex in Vina
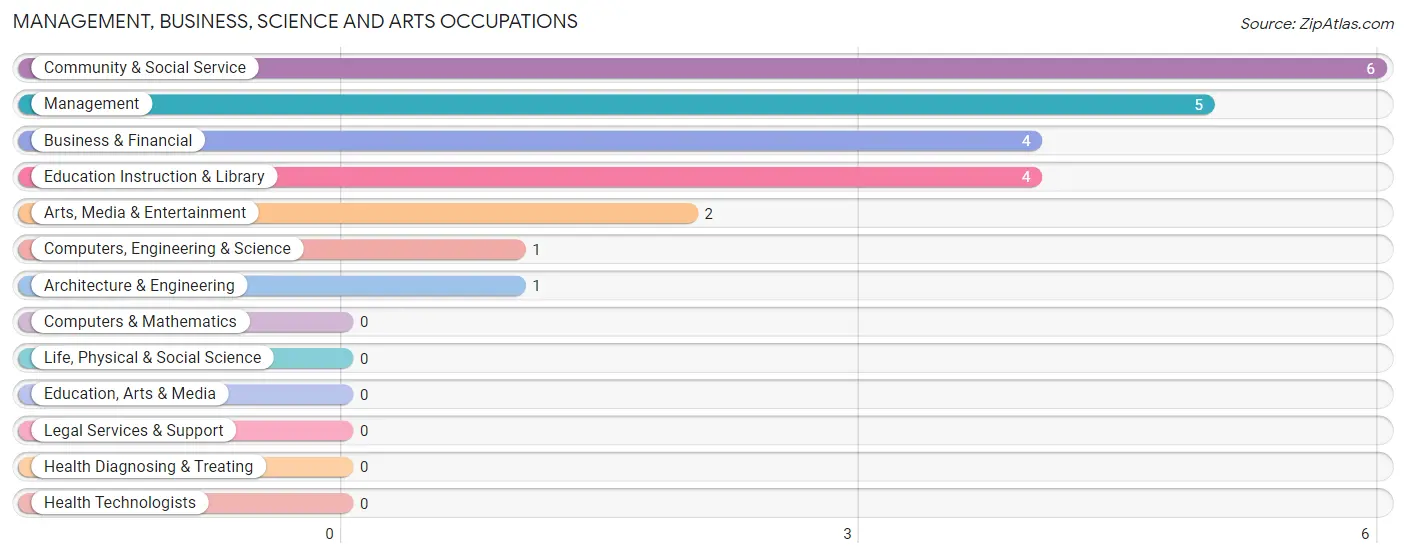
Management, Business, Science and Arts Occupations
The most common Management, Business, Science and Arts occupations in Vina are Community & Social Service (6 | 5.0%), Management (5 | 4.2%), Business & Financial (4 | 3.3%), Education Instruction & Library (4 | 3.3%), and Arts, Media & Entertainment (2 | 1.7%).
Management, Business, Science and Arts Occupations by Sex
Within the Management, Business, Science and Arts occupations in Vina, the most male-oriented occupations are Management (100.0%), Computers, Engineering & Science (100.0%), and Architecture & Engineering (100.0%), while the most female-oriented occupations are Arts, Media & Entertainment (100.0%), Business & Financial (75.0%), and Community & Social Service (66.7%).
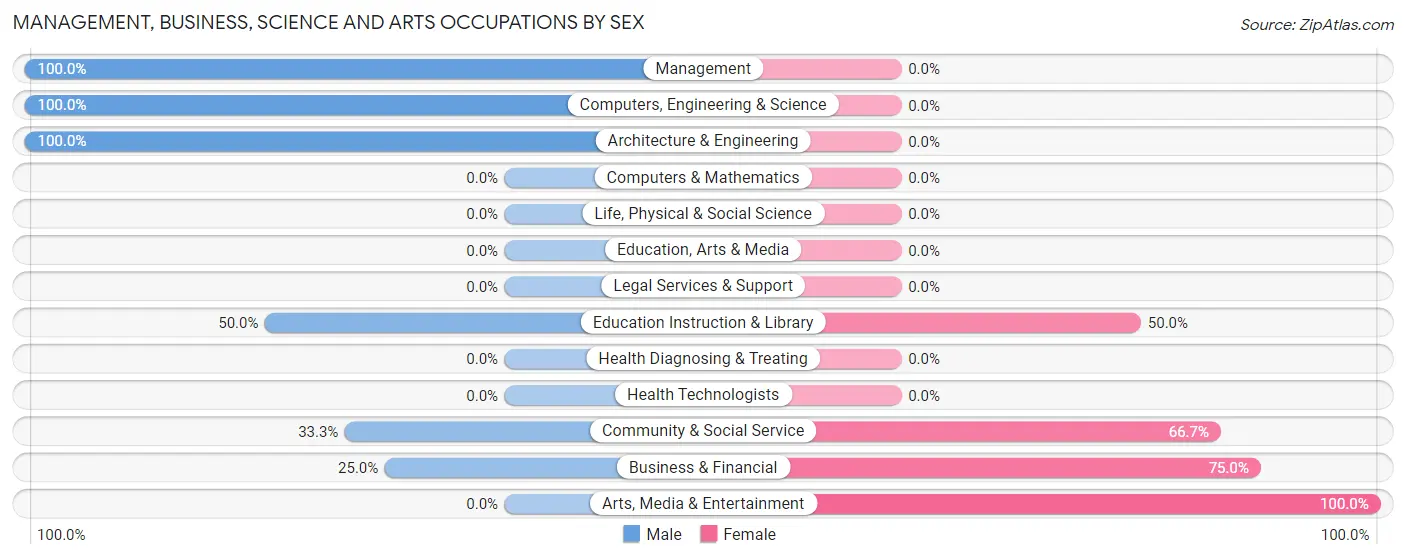
| Occupation | Male | Female |
| Management | 5 (100.0%) | 0 (0.0%) |
| Business & Financial | 1 (25.0%) | 3 (75.0%) |
| Computers, Engineering & Science | 1 (100.0%) | 0 (0.0%) |
| Computers & Mathematics | 0 (0.0%) | 0 (0.0%) |
| Architecture & Engineering | 1 (100.0%) | 0 (0.0%) |
| Life, Physical & Social Science | 0 (0.0%) | 0 (0.0%) |
| Community & Social Service | 2 (33.3%) | 4 (66.7%) |
| Education, Arts & Media | 0 (0.0%) | 0 (0.0%) |
| Legal Services & Support | 0 (0.0%) | 0 (0.0%) |
| Education Instruction & Library | 2 (50.0%) | 2 (50.0%) |
| Arts, Media & Entertainment | 0 (0.0%) | 2 (100.0%) |
| Health Diagnosing & Treating | 0 (0.0%) | 0 (0.0%) |
| Health Technologists | 0 (0.0%) | 0 (0.0%) |
| Total (Category) | 9 (56.2%) | 7 (43.8%) |
| Total (Overall) | 76 (63.3%) | 44 (36.7%) |
Services Occupations
The most common Services occupations in Vina are Healthcare Support (5 | 4.2%), and Food Preparation & Serving (4 | 3.3%).
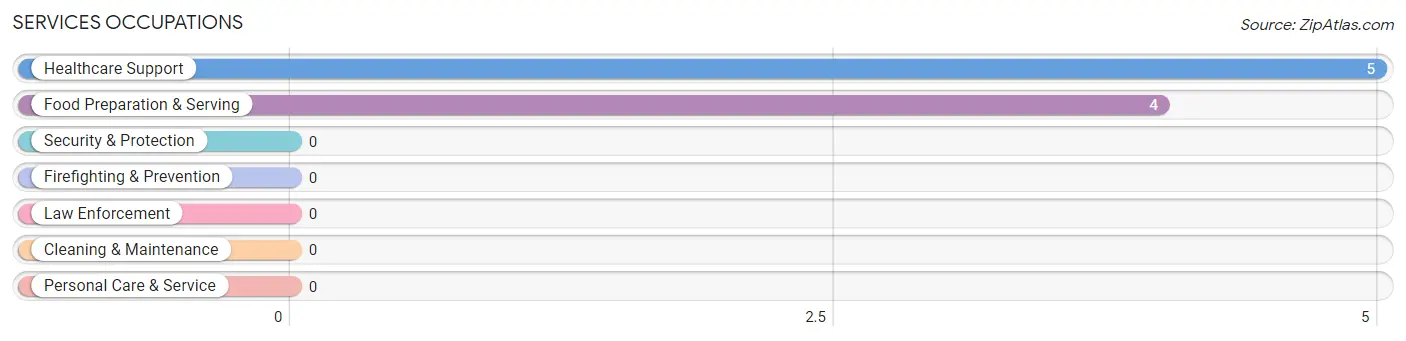
Services Occupations by Sex
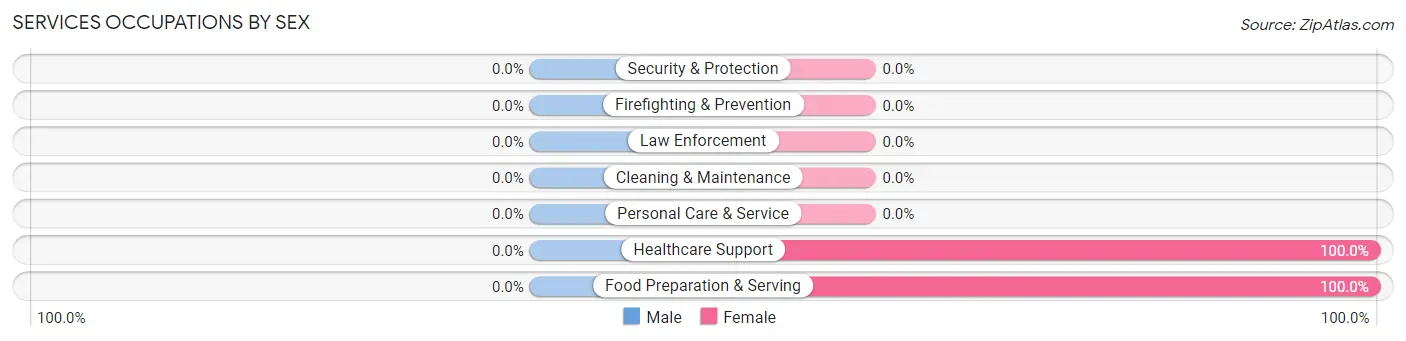
| Occupation | Male | Female |
| Healthcare Support | 0 (0.0%) | 5 (100.0%) |
| Security & Protection | 0 (0.0%) | 0 (0.0%) |
| Firefighting & Prevention | 0 (0.0%) | 0 (0.0%) |
| Law Enforcement | 0 (0.0%) | 0 (0.0%) |
| Food Preparation & Serving | 0 (0.0%) | 4 (100.0%) |
| Cleaning & Maintenance | 0 (0.0%) | 0 (0.0%) |
| Personal Care & Service | 0 (0.0%) | 0 (0.0%) |
| Total (Category) | 0 (0.0%) | 9 (100.0%) |
| Total (Overall) | 76 (63.3%) | 44 (36.7%) |
Sales and Office Occupations
The most common Sales and Office occupations in Vina are Sales & Related (14 | 11.7%), and Office & Administration (5 | 4.2%).
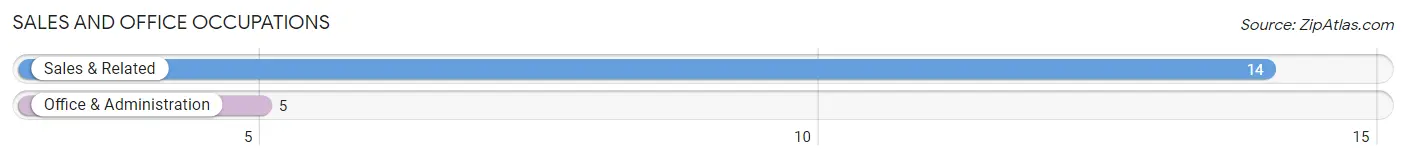
Sales and Office Occupations by Sex
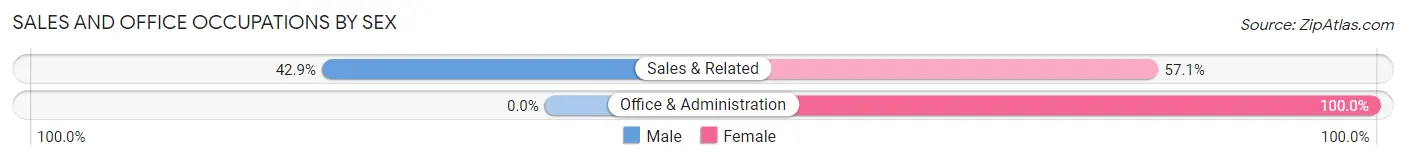
| Occupation | Male | Female |
| Sales & Related | 6 (42.9%) | 8 (57.1%) |
| Office & Administration | 0 (0.0%) | 5 (100.0%) |
| Total (Category) | 6 (31.6%) | 13 (68.4%) |
| Total (Overall) | 76 (63.3%) | 44 (36.7%) |
Natural Resources, Construction and Maintenance Occupations
The most common Natural Resources, Construction and Maintenance occupations in Vina are Construction & Extraction (6 | 5.0%), and Installation, Maintenance & Repair (3 | 2.5%).
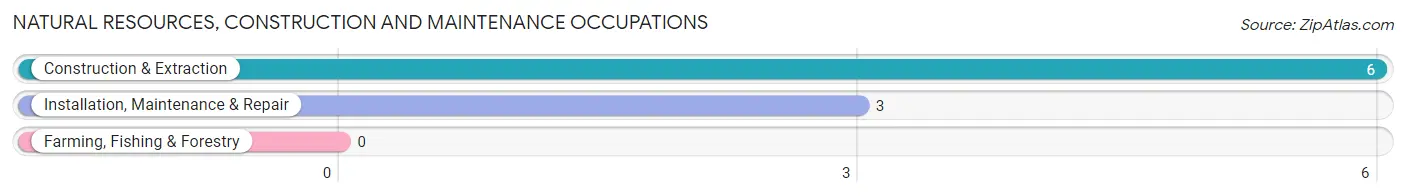
Natural Resources, Construction and Maintenance Occupations by Sex
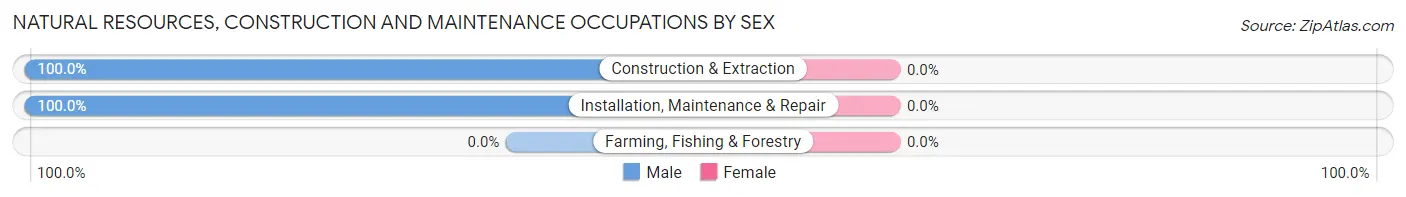
| Occupation | Male | Female |
| Farming, Fishing & Forestry | 0 (0.0%) | 0 (0.0%) |
| Construction & Extraction | 6 (100.0%) | 0 (0.0%) |
| Installation, Maintenance & Repair | 3 (100.0%) | 0 (0.0%) |
| Total (Category) | 9 (100.0%) | 0 (0.0%) |
| Total (Overall) | 76 (63.3%) | 44 (36.7%) |
Production, Transportation and Moving Occupations
The most common Production, Transportation and Moving occupations in Vina are Production (35 | 29.2%), Material Moving (20 | 16.7%), and Transportation (12 | 10.0%).
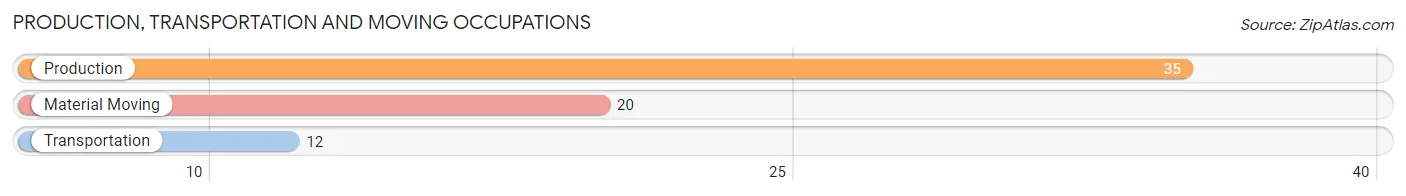
Production, Transportation and Moving Occupations by Sex
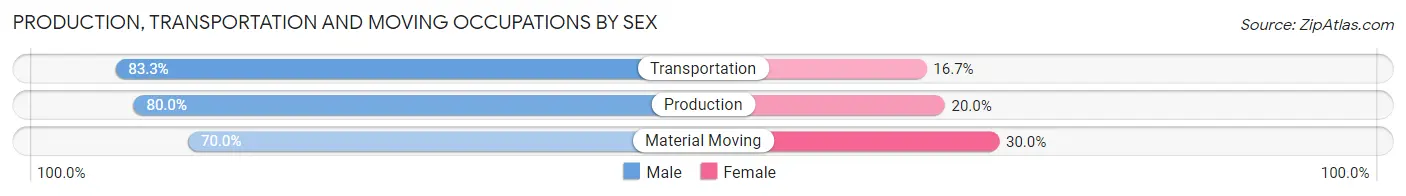
| Occupation | Male | Female |
| Production | 28 (80.0%) | 7 (20.0%) |
| Transportation | 10 (83.3%) | 2 (16.7%) |
| Material Moving | 14 (70.0%) | 6 (30.0%) |
| Total (Category) | 52 (77.6%) | 15 (22.4%) |
| Total (Overall) | 76 (63.3%) | 44 (36.7%) |
Employment Industries by Sex in Vina
Employment Industries in Vina
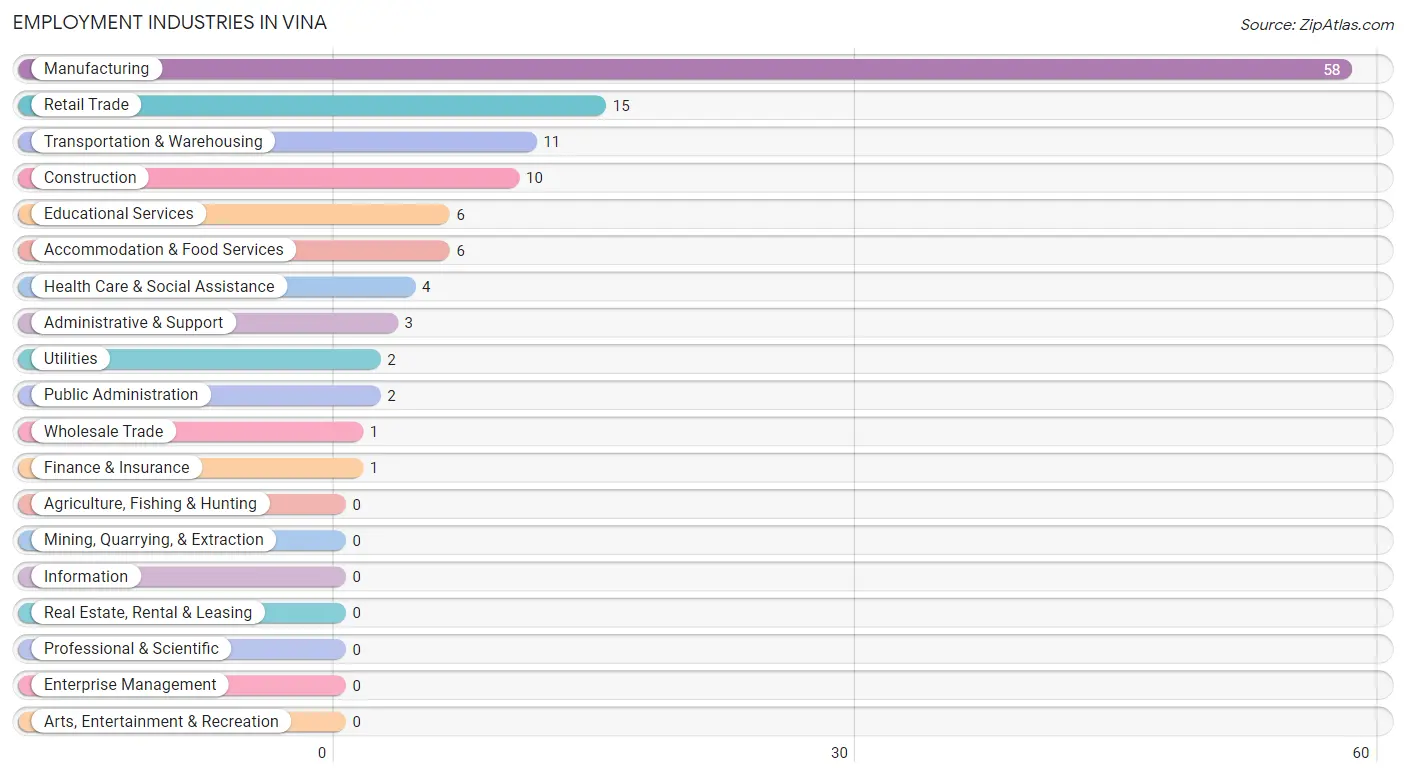
The major employment industries in Vina include Manufacturing (58 | 48.3%), Retail Trade (15 | 12.5%), Transportation & Warehousing (11 | 9.2%), Construction (10 | 8.3%), and Educational Services (6 | 5.0%).
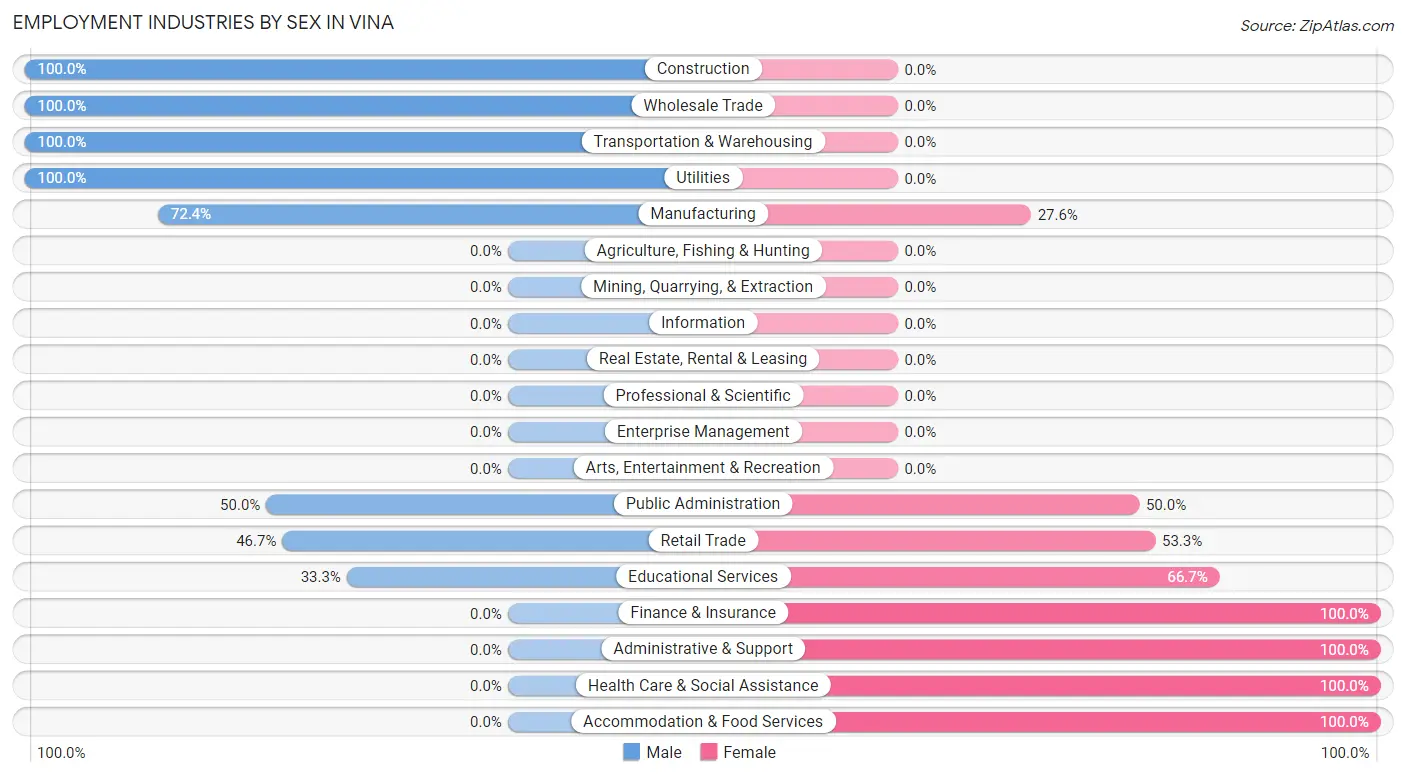
Employment Industries by Sex in Vina
The Vina industries that see more men than women are Construction (100.0%), Wholesale Trade (100.0%), and Transportation & Warehousing (100.0%), whereas the industries that tend to have a higher number of women are Finance & Insurance (100.0%), Administrative & Support (100.0%), and Health Care & Social Assistance (100.0%).
| Industry | Male | Female |
| Agriculture, Fishing & Hunting | 0 (0.0%) | 0 (0.0%) |
| Mining, Quarrying, & Extraction | 0 (0.0%) | 0 (0.0%) |
| Construction | 10 (100.0%) | 0 (0.0%) |
| Manufacturing | 42 (72.4%) | 16 (27.6%) |
| Wholesale Trade | 1 (100.0%) | 0 (0.0%) |
| Retail Trade | 7 (46.7%) | 8 (53.3%) |
| Transportation & Warehousing | 11 (100.0%) | 0 (0.0%) |
| Utilities | 2 (100.0%) | 0 (0.0%) |
| Information | 0 (0.0%) | 0 (0.0%) |
| Finance & Insurance | 0 (0.0%) | 1 (100.0%) |
| Real Estate, Rental & Leasing | 0 (0.0%) | 0 (0.0%) |
| Professional & Scientific | 0 (0.0%) | 0 (0.0%) |
| Enterprise Management | 0 (0.0%) | 0 (0.0%) |
| Administrative & Support | 0 (0.0%) | 3 (100.0%) |
| Educational Services | 2 (33.3%) | 4 (66.7%) |
| Health Care & Social Assistance | 0 (0.0%) | 4 (100.0%) |
| Arts, Entertainment & Recreation | 0 (0.0%) | 0 (0.0%) |
| Accommodation & Food Services | 0 (0.0%) | 6 (100.0%) |
| Public Administration | 1 (50.0%) | 1 (50.0%) |
| Total | 76 (63.3%) | 44 (36.7%) |
Education in Vina
School Enrollment in Vina
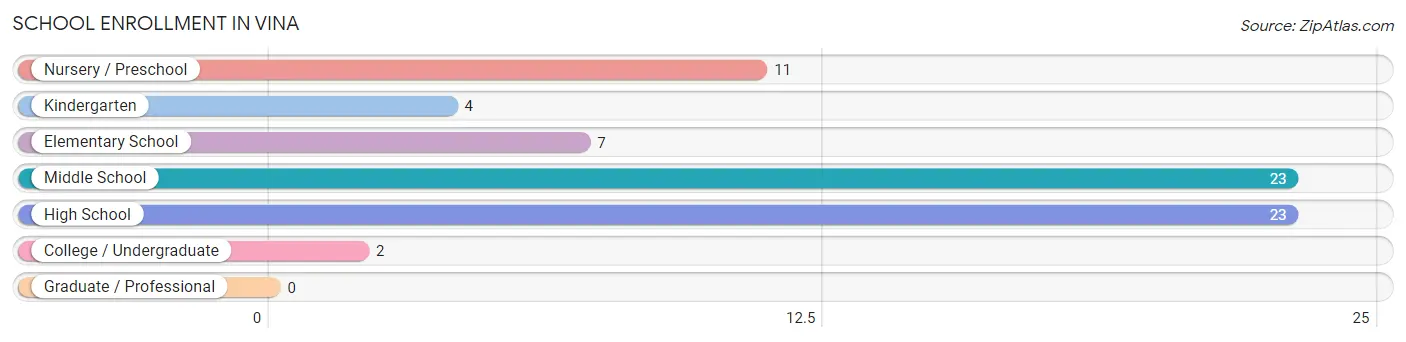
The most common levels of schooling among the 70 students in Vina are middle school (23 | 32.9%), high school (23 | 32.9%), and nursery / preschool (11 | 15.7%).
| School Level | # Students | % Students |
| Nursery / Preschool | 11 | 15.7% |
| Kindergarten | 4 | 5.7% |
| Elementary School | 7 | 10.0% |
| Middle School | 23 | 32.9% |
| High School | 23 | 32.9% |
| College / Undergraduate | 2 | 2.9% |
| Graduate / Professional | 0 | 0.0% |
| Total | 70 | 100.0% |
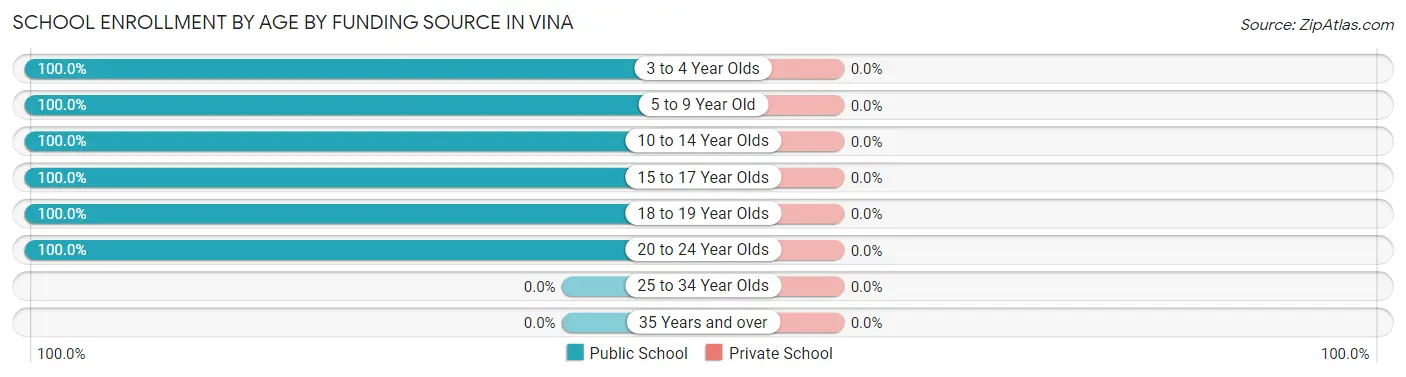
School Enrollment by Age by Funding Source in Vina
| Age Bracket | Public School | Private School |
| 3 to 4 Year Olds | 11 (100.0%) | 0 (0.0%) |
| 5 to 9 Year Old | 11 (100.0%) | 0 (0.0%) |
| 10 to 14 Year Olds | 20 (100.0%) | 0 (0.0%) |
| 15 to 17 Year Olds | 25 (100.0%) | 0 (0.0%) |
| 18 to 19 Year Olds | 2 (100.0%) | 0 (0.0%) |
| 20 to 24 Year Olds | 1 (100.0%) | 0 (0.0%) |
| 25 to 34 Year Olds | 0 (0.0%) | 0 (0.0%) |
| 35 Years and over | 0 (0.0%) | 0 (0.0%) |
| Total | 70 (100.0%) | 0 (0.0%) |
Educational Attainment by Field of Study in Vina
Engineering (5 | 23.8%), education (4 | 19.1%), business (3 | 14.3%), communications (3 | 14.3%), and physical & health sciences (2 | 9.5%) are the most common fields of study among 21 individuals in Vina who have obtained a bachelor's degree or higher.
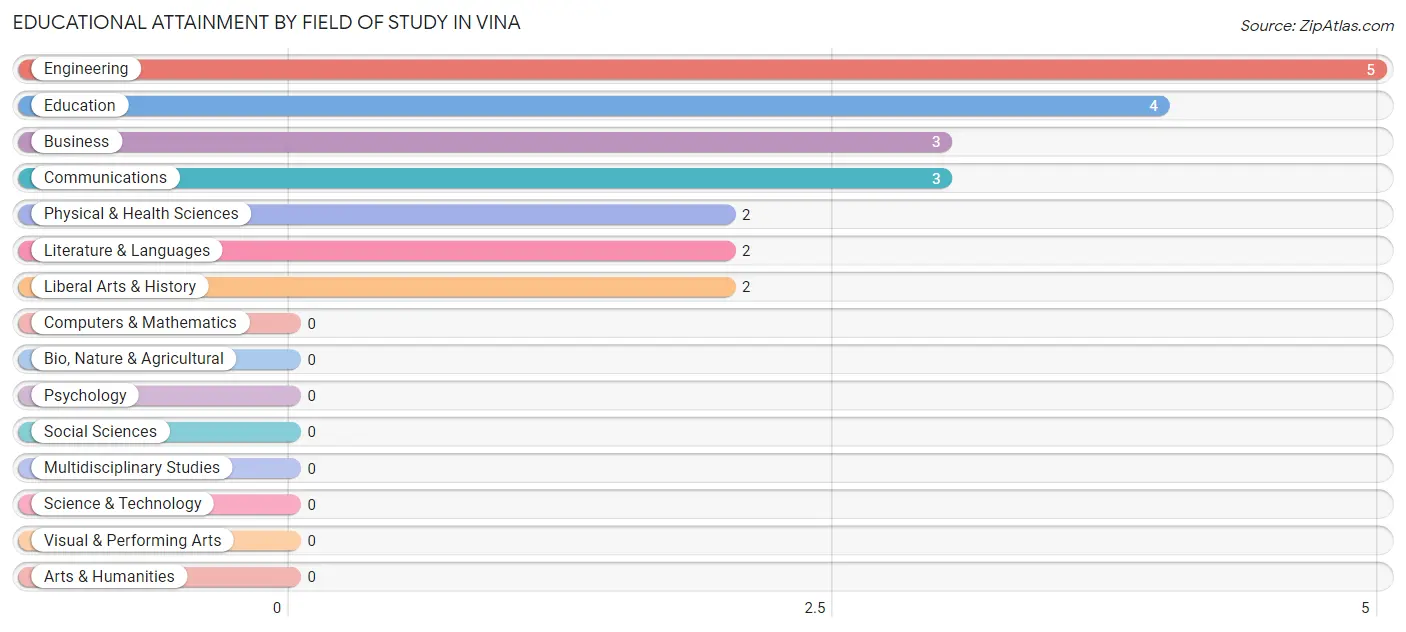
| Field of Study | # Graduates | % Graduates |
| Computers & Mathematics | 0 | 0.0% |
| Bio, Nature & Agricultural | 0 | 0.0% |
| Physical & Health Sciences | 2 | 9.5% |
| Psychology | 0 | 0.0% |
| Social Sciences | 0 | 0.0% |
| Engineering | 5 | 23.8% |
| Multidisciplinary Studies | 0 | 0.0% |
| Science & Technology | 0 | 0.0% |
| Business | 3 | 14.3% |
| Education | 4 | 19.1% |
| Literature & Languages | 2 | 9.5% |
| Liberal Arts & History | 2 | 9.5% |
| Visual & Performing Arts | 0 | 0.0% |
| Communications | 3 | 14.3% |
| Arts & Humanities | 0 | 0.0% |
| Total | 21 | 100.0% |
Transportation & Commute in Vina
Vehicle Availability by Sex in Vina
The most prevalent vehicle ownership categories in Vina are males with 2 vehicles (37, accounting for 49.3%) and females with 2 vehicles (19, making up 84.1%).
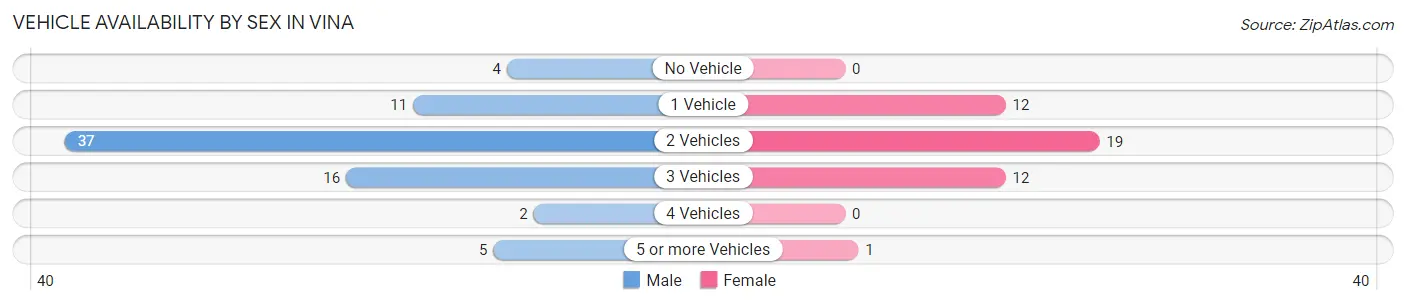
| Vehicles Available | Male | Female |
| No Vehicle | 4 (5.3%) | 0 (0.0%) |
| 1 Vehicle | 11 (14.7%) | 12 (27.3%) |
| 2 Vehicles | 37 (49.3%) | 19 (43.2%) |
| 3 Vehicles | 16 (21.3%) | 12 (27.3%) |
| 4 Vehicles | 2 (2.7%) | 0 (0.0%) |
| 5 or more Vehicles | 5 (6.7%) | 1 (2.3%) |
| Total | 75 (100.0%) | 44 (100.0%) |
Commute Time in Vina
The most frequently occuring commute durations in Vina are 20 to 24 minutes (24 commuters, 20.2%), 15 to 19 minutes (22 commuters, 18.5%), and 30 to 34 minutes (17 commuters, 14.3%).
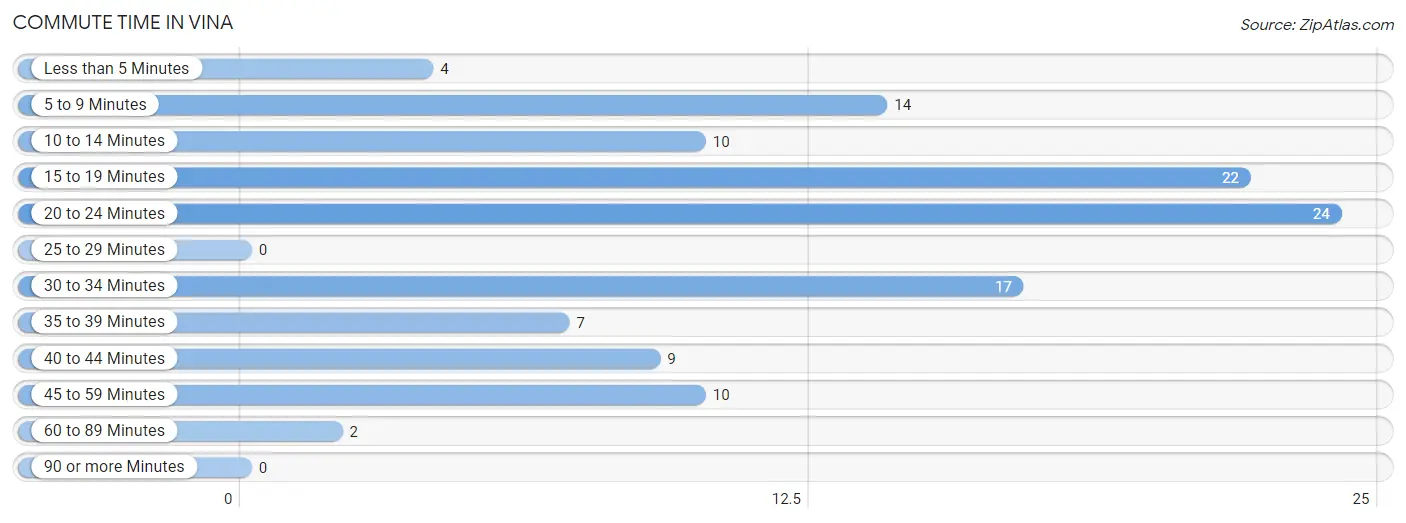
| Commute Time | # Commuters | % Commuters |
| Less than 5 Minutes | 4 | 3.4% |
| 5 to 9 Minutes | 14 | 11.8% |
| 10 to 14 Minutes | 10 | 8.4% |
| 15 to 19 Minutes | 22 | 18.5% |
| 20 to 24 Minutes | 24 | 20.2% |
| 25 to 29 Minutes | 0 | 0.0% |
| 30 to 34 Minutes | 17 | 14.3% |
| 35 to 39 Minutes | 7 | 5.9% |
| 40 to 44 Minutes | 9 | 7.6% |
| 45 to 59 Minutes | 10 | 8.4% |
| 60 to 89 Minutes | 2 | 1.7% |
| 90 or more Minutes | 0 | 0.0% |
Commute Time by Sex in Vina
The most common commute times in Vina are 20 to 24 minutes (17 commuters, 22.7%) for males and 15 to 19 minutes (10 commuters, 22.7%) for females.
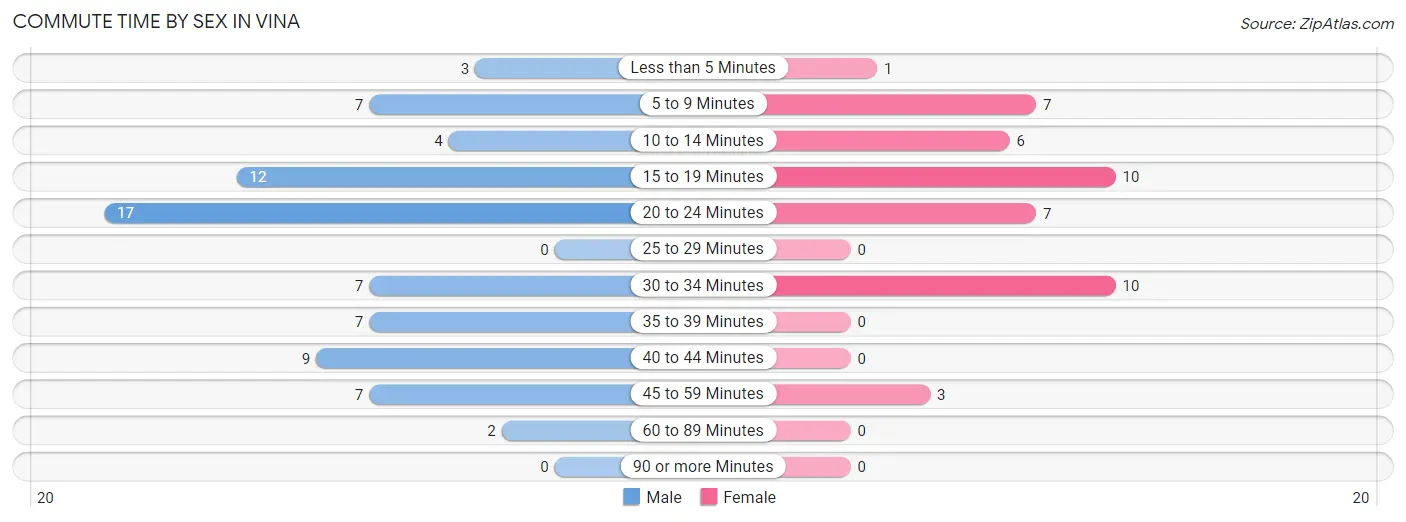
| Commute Time | Male | Female |
| Less than 5 Minutes | 3 (4.0%) | 1 (2.3%) |
| 5 to 9 Minutes | 7 (9.3%) | 7 (15.9%) |
| 10 to 14 Minutes | 4 (5.3%) | 6 (13.6%) |
| 15 to 19 Minutes | 12 (16.0%) | 10 (22.7%) |
| 20 to 24 Minutes | 17 (22.7%) | 7 (15.9%) |
| 25 to 29 Minutes | 0 (0.0%) | 0 (0.0%) |
| 30 to 34 Minutes | 7 (9.3%) | 10 (22.7%) |
| 35 to 39 Minutes | 7 (9.3%) | 0 (0.0%) |
| 40 to 44 Minutes | 9 (12.0%) | 0 (0.0%) |
| 45 to 59 Minutes | 7 (9.3%) | 3 (6.8%) |
| 60 to 89 Minutes | 2 (2.7%) | 0 (0.0%) |
| 90 or more Minutes | 0 (0.0%) | 0 (0.0%) |
Time of Departure to Work by Sex in Vina
The most frequent times of departure to work in Vina are 6:30 AM to 6:59 AM (20, 26.7%) for males and 8:00 AM to 8:29 AM (8, 18.2%) for females.
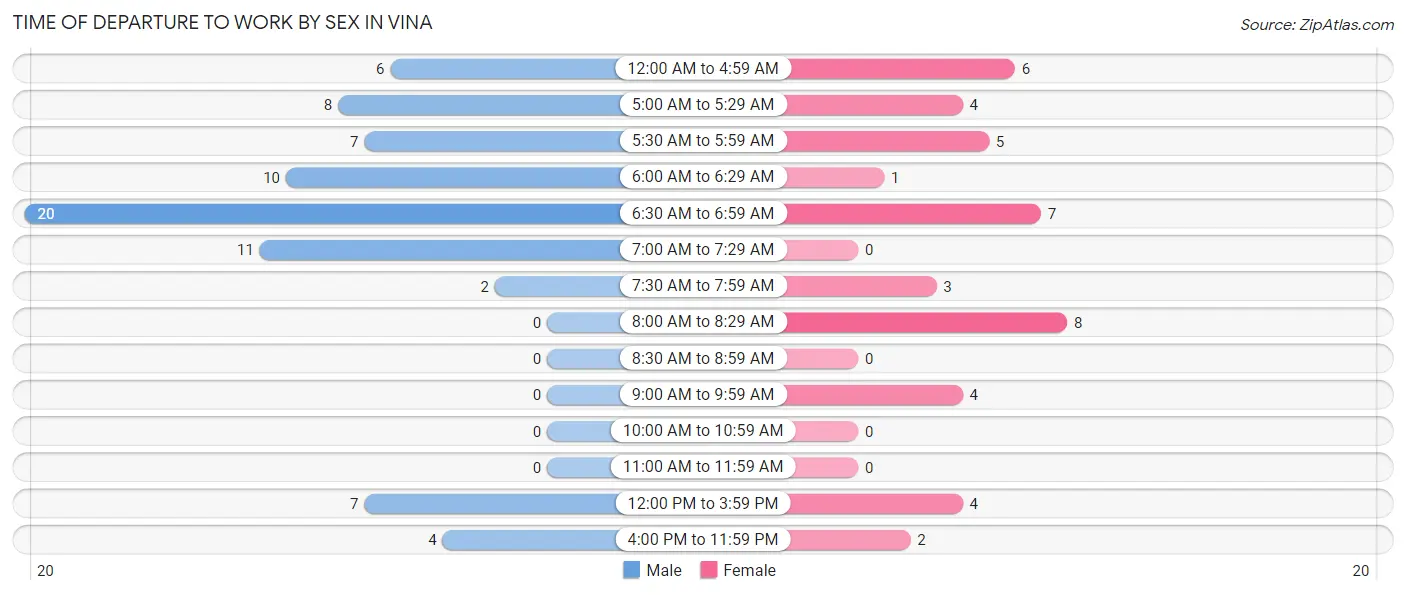
| Time of Departure | Male | Female |
| 12:00 AM to 4:59 AM | 6 (8.0%) | 6 (13.6%) |
| 5:00 AM to 5:29 AM | 8 (10.7%) | 4 (9.1%) |
| 5:30 AM to 5:59 AM | 7 (9.3%) | 5 (11.4%) |
| 6:00 AM to 6:29 AM | 10 (13.3%) | 1 (2.3%) |
| 6:30 AM to 6:59 AM | 20 (26.7%) | 7 (15.9%) |
| 7:00 AM to 7:29 AM | 11 (14.7%) | 0 (0.0%) |
| 7:30 AM to 7:59 AM | 2 (2.7%) | 3 (6.8%) |
| 8:00 AM to 8:29 AM | 0 (0.0%) | 8 (18.2%) |
| 8:30 AM to 8:59 AM | 0 (0.0%) | 0 (0.0%) |
| 9:00 AM to 9:59 AM | 0 (0.0%) | 4 (9.1%) |
| 10:00 AM to 10:59 AM | 0 (0.0%) | 0 (0.0%) |
| 11:00 AM to 11:59 AM | 0 (0.0%) | 0 (0.0%) |
| 12:00 PM to 3:59 PM | 7 (9.3%) | 4 (9.1%) |
| 4:00 PM to 11:59 PM | 4 (5.3%) | 2 (4.5%) |
| Total | 75 (100.0%) | 44 (100.0%) |
Housing Occupancy in Vina
Occupancy by Ownership in Vina
Of the total 129 dwellings in Vina, owner-occupied units account for 78 (60.5%), while renter-occupied units make up 51 (39.5%).
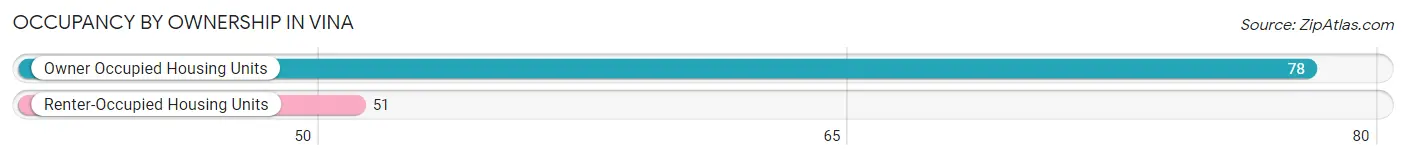
| Occupancy | # Housing Units | % Housing Units |
| Owner Occupied Housing Units | 78 | 60.5% |
| Renter-Occupied Housing Units | 51 | 39.5% |
| Total Occupied Housing Units | 129 | 100.0% |
Occupancy by Household Size in Vina
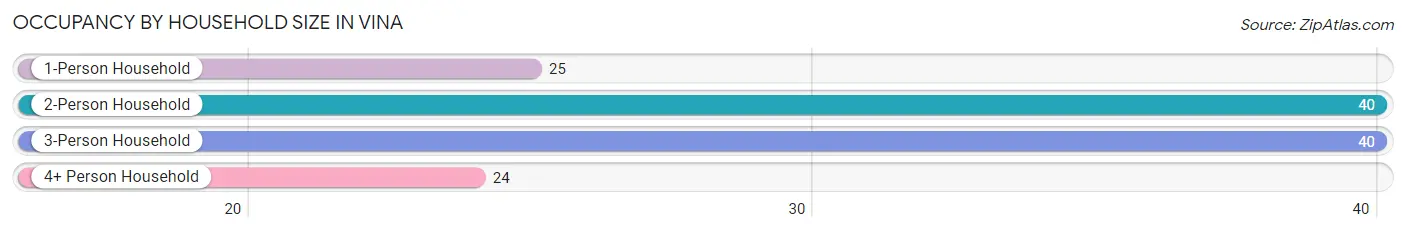
| Household Size | # Housing Units | % Housing Units |
| 1-Person Household | 25 | 19.4% |
| 2-Person Household | 40 | 31.0% |
| 3-Person Household | 40 | 31.0% |
| 4+ Person Household | 24 | 18.6% |
| Total Housing Units | 129 | 100.0% |
Occupancy by Ownership by Household Size in Vina
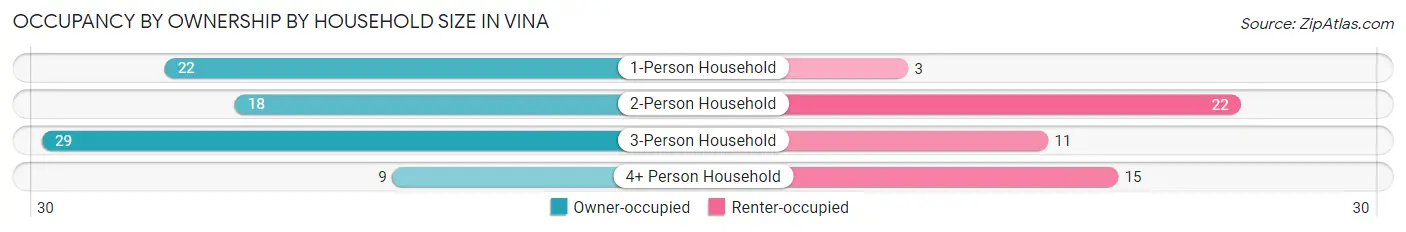
| Household Size | Owner-occupied | Renter-occupied |
| 1-Person Household | 22 (88.0%) | 3 (12.0%) |
| 2-Person Household | 18 (45.0%) | 22 (55.0%) |
| 3-Person Household | 29 (72.5%) | 11 (27.5%) |
| 4+ Person Household | 9 (37.5%) | 15 (62.5%) |
| Total Housing Units | 78 (60.5%) | 51 (39.5%) |
Occupancy by Educational Attainment in Vina
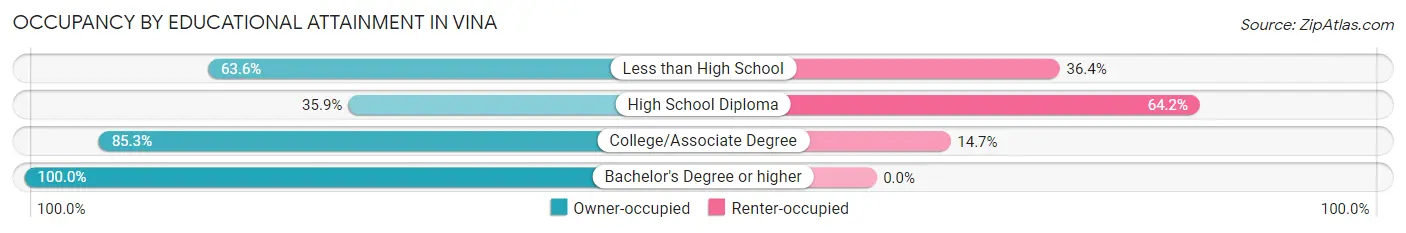
| Household Size | Owner-occupied | Renter-occupied |
| Less than High School | 21 (63.6%) | 12 (36.4%) |
| High School Diploma | 19 (35.8%) | 34 (64.1%) |
| College/Associate Degree | 29 (85.3%) | 5 (14.7%) |
| Bachelor's Degree or higher | 9 (100.0%) | 0 (0.0%) |
Occupancy by Age of Householder in Vina
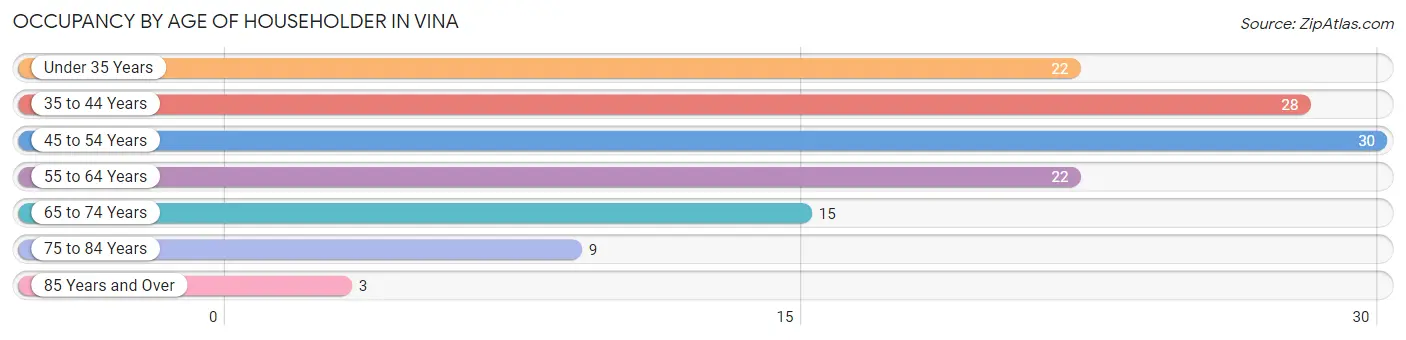
| Age Bracket | # Households | % Households |
| Under 35 Years | 22 | 17.1% |
| 35 to 44 Years | 28 | 21.7% |
| 45 to 54 Years | 30 | 23.3% |
| 55 to 64 Years | 22 | 17.1% |
| 65 to 74 Years | 15 | 11.6% |
| 75 to 84 Years | 9 | 7.0% |
| 85 Years and Over | 3 | 2.3% |
| Total | 129 | 100.0% |
Housing Finances in Vina
Median Income by Occupancy in Vina
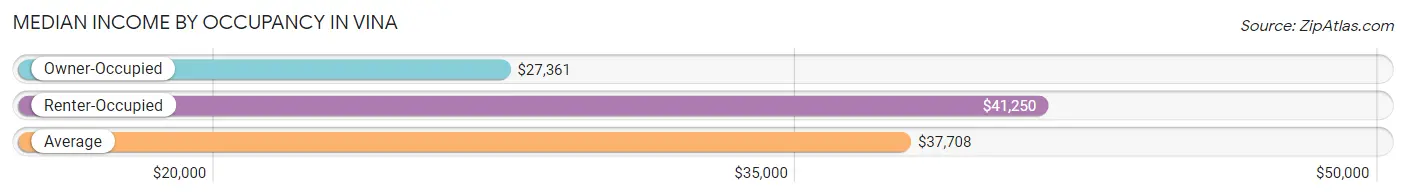
| Occupancy Type | # Households | Median Income |
| Owner-Occupied | 78 (60.5%) | $27,361 |
| Renter-Occupied | 51 (39.5%) | $41,250 |
| Average | 129 (100.0%) | $37,708 |
Occupancy by Householder Income Bracket in Vina
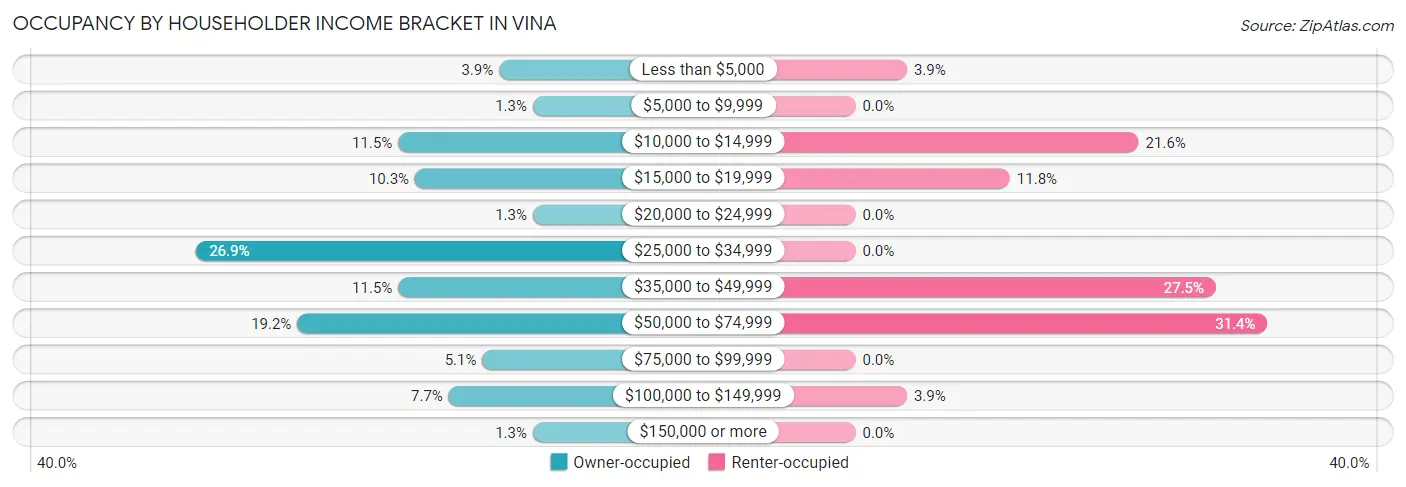
| Income Bracket | Owner-occupied | Renter-occupied |
| Less than $5,000 | 3 (3.8%) | 2 (3.9%) |
| $5,000 to $9,999 | 1 (1.3%) | 0 (0.0%) |
| $10,000 to $14,999 | 9 (11.5%) | 11 (21.6%) |
| $15,000 to $19,999 | 8 (10.3%) | 6 (11.8%) |
| $20,000 to $24,999 | 1 (1.3%) | 0 (0.0%) |
| $25,000 to $34,999 | 21 (26.9%) | 0 (0.0%) |
| $35,000 to $49,999 | 9 (11.5%) | 14 (27.5%) |
| $50,000 to $74,999 | 15 (19.2%) | 16 (31.4%) |
| $75,000 to $99,999 | 4 (5.1%) | 0 (0.0%) |
| $100,000 to $149,999 | 6 (7.7%) | 2 (3.9%) |
| $150,000 or more | 1 (1.3%) | 0 (0.0%) |
| Total | 78 (100.0%) | 51 (100.0%) |
Monthly Housing Cost Tiers in Vina
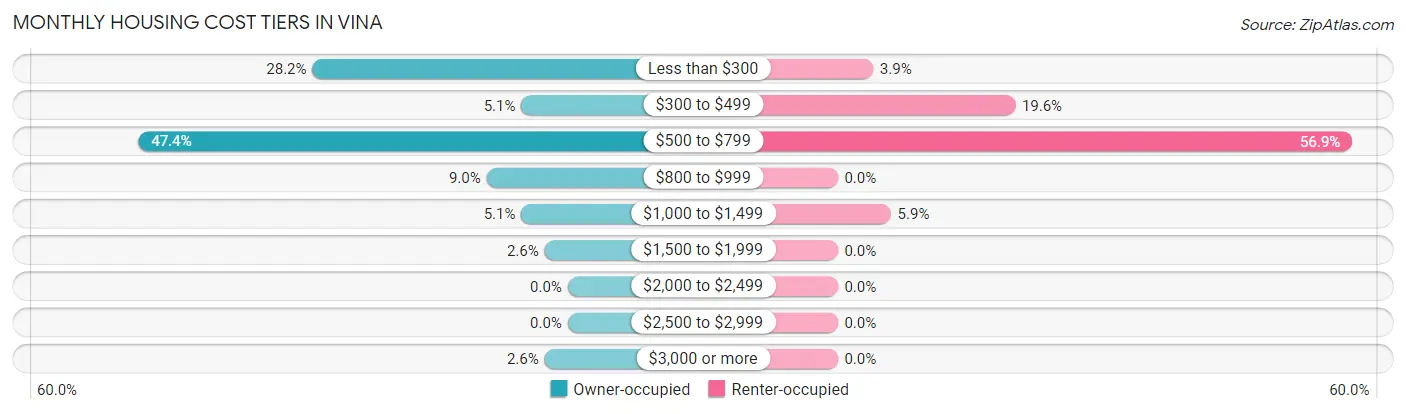
| Monthly Cost | Owner-occupied | Renter-occupied |
| Less than $300 | 22 (28.2%) | 2 (3.9%) |
| $300 to $499 | 4 (5.1%) | 10 (19.6%) |
| $500 to $799 | 37 (47.4%) | 29 (56.9%) |
| $800 to $999 | 7 (9.0%) | 0 (0.0%) |
| $1,000 to $1,499 | 4 (5.1%) | 3 (5.9%) |
| $1,500 to $1,999 | 2 (2.6%) | 0 (0.0%) |
| $2,000 to $2,499 | 0 (0.0%) | 0 (0.0%) |
| $2,500 to $2,999 | 0 (0.0%) | 0 (0.0%) |
| $3,000 or more | 2 (2.6%) | 0 (0.0%) |
| Total | 78 (100.0%) | 51 (100.0%) |
Physical Housing Characteristics in Vina
Housing Structures in Vina
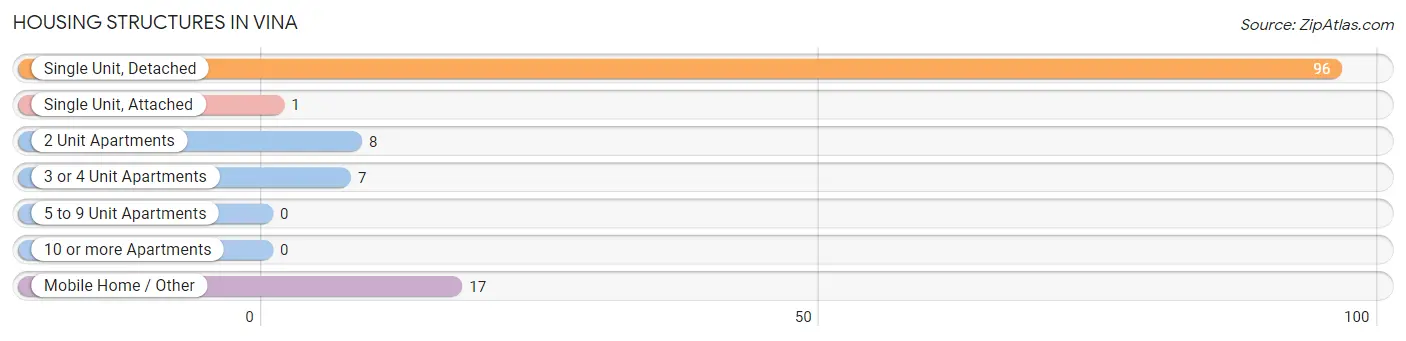
| Structure Type | # Housing Units | % Housing Units |
| Single Unit, Detached | 96 | 74.4% |
| Single Unit, Attached | 1 | 0.8% |
| 2 Unit Apartments | 8 | 6.2% |
| 3 or 4 Unit Apartments | 7 | 5.4% |
| 5 to 9 Unit Apartments | 0 | 0.0% |
| 10 or more Apartments | 0 | 0.0% |
| Mobile Home / Other | 17 | 13.2% |
| Total | 129 | 100.0% |
Housing Structures by Occupancy in Vina
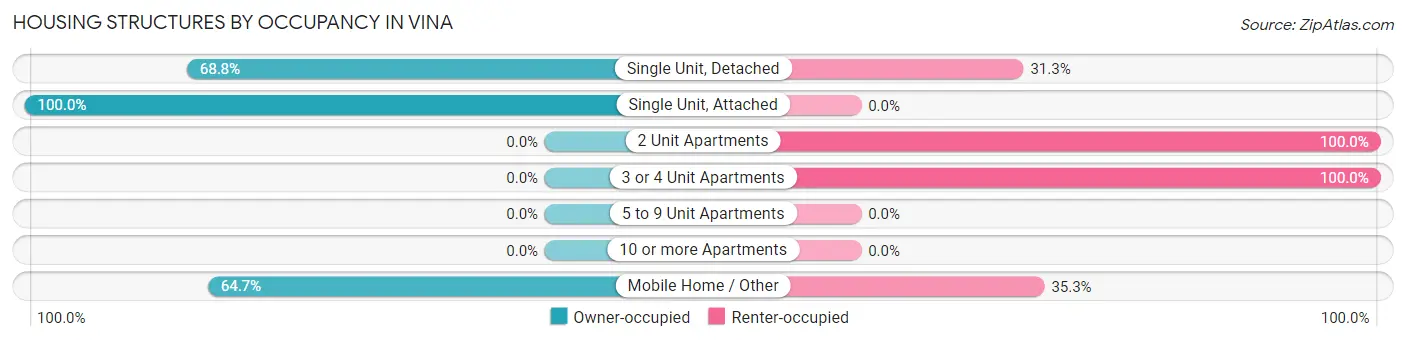
| Structure Type | Owner-occupied | Renter-occupied |
| Single Unit, Detached | 66 (68.8%) | 30 (31.2%) |
| Single Unit, Attached | 1 (100.0%) | 0 (0.0%) |
| 2 Unit Apartments | 0 (0.0%) | 8 (100.0%) |
| 3 or 4 Unit Apartments | 0 (0.0%) | 7 (100.0%) |
| 5 to 9 Unit Apartments | 0 (0.0%) | 0 (0.0%) |
| 10 or more Apartments | 0 (0.0%) | 0 (0.0%) |
| Mobile Home / Other | 11 (64.7%) | 6 (35.3%) |
| Total | 78 (60.5%) | 51 (39.5%) |
Housing Structures by Number of Rooms in Vina
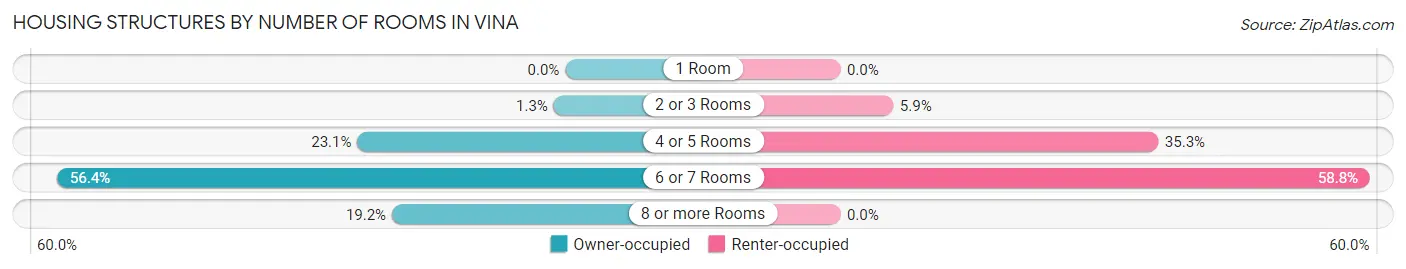
| Number of Rooms | Owner-occupied | Renter-occupied |
| 1 Room | 0 (0.0%) | 0 (0.0%) |
| 2 or 3 Rooms | 1 (1.3%) | 3 (5.9%) |
| 4 or 5 Rooms | 18 (23.1%) | 18 (35.3%) |
| 6 or 7 Rooms | 44 (56.4%) | 30 (58.8%) |
| 8 or more Rooms | 15 (19.2%) | 0 (0.0%) |
| Total | 78 (100.0%) | 51 (100.0%) |
Housing Structure by Heating Type in Vina
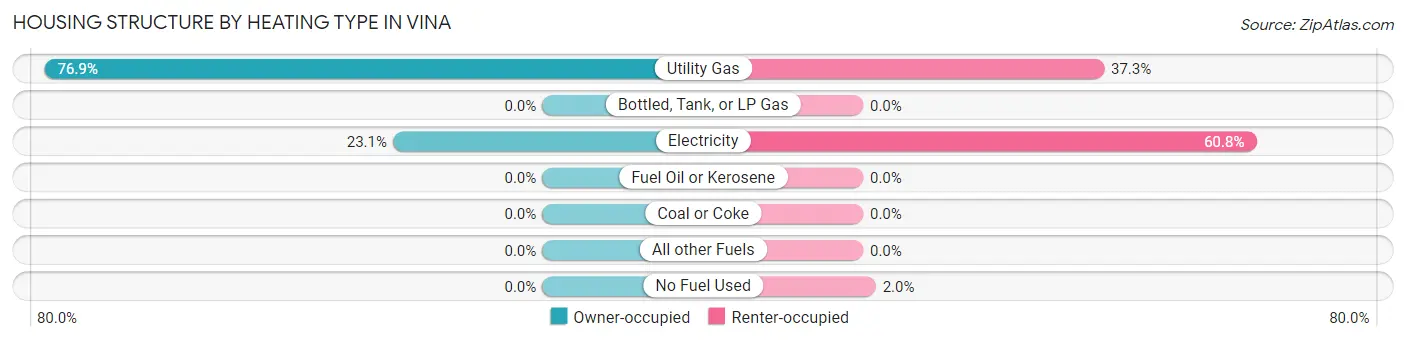
| Heating Type | Owner-occupied | Renter-occupied |
| Utility Gas | 60 (76.9%) | 19 (37.2%) |
| Bottled, Tank, or LP Gas | 0 (0.0%) | 0 (0.0%) |
| Electricity | 18 (23.1%) | 31 (60.8%) |
| Fuel Oil or Kerosene | 0 (0.0%) | 0 (0.0%) |
| Coal or Coke | 0 (0.0%) | 0 (0.0%) |
| All other Fuels | 0 (0.0%) | 0 (0.0%) |
| No Fuel Used | 0 (0.0%) | 1 (2.0%) |
| Total | 78 (100.0%) | 51 (100.0%) |
Household Vehicle Usage in Vina
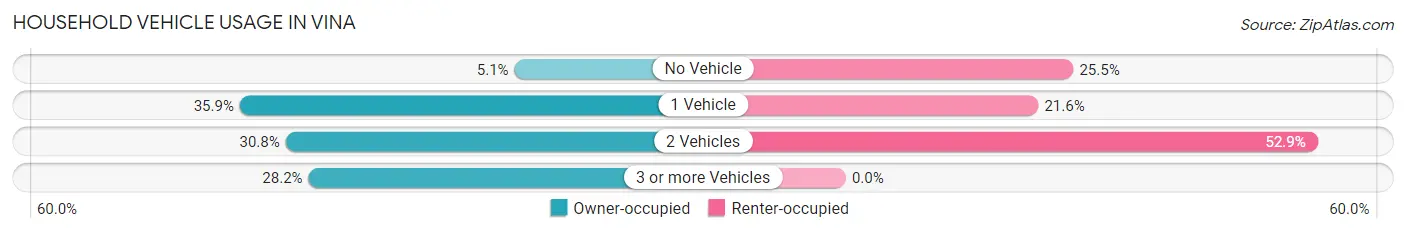
| Vehicles per Household | Owner-occupied | Renter-occupied |
| No Vehicle | 4 (5.1%) | 13 (25.5%) |
| 1 Vehicle | 28 (35.9%) | 11 (21.6%) |
| 2 Vehicles | 24 (30.8%) | 27 (52.9%) |
| 3 or more Vehicles | 22 (28.2%) | 0 (0.0%) |
| Total | 78 (100.0%) | 51 (100.0%) |
Real Estate & Mortgages in Vina
Real Estate and Mortgage Overview in Vina
| Characteristic | Without Mortgage | With Mortgage |
| Housing Units | 29 | 49 |
| Median Property Value | $80,700 | $65,400 |
| Median Household Income | $27,250 | $1 |
| Monthly Housing Costs | $263 | $2 |
| Real Estate Taxes | $225 | $3 |
Property Value by Mortgage Status in Vina
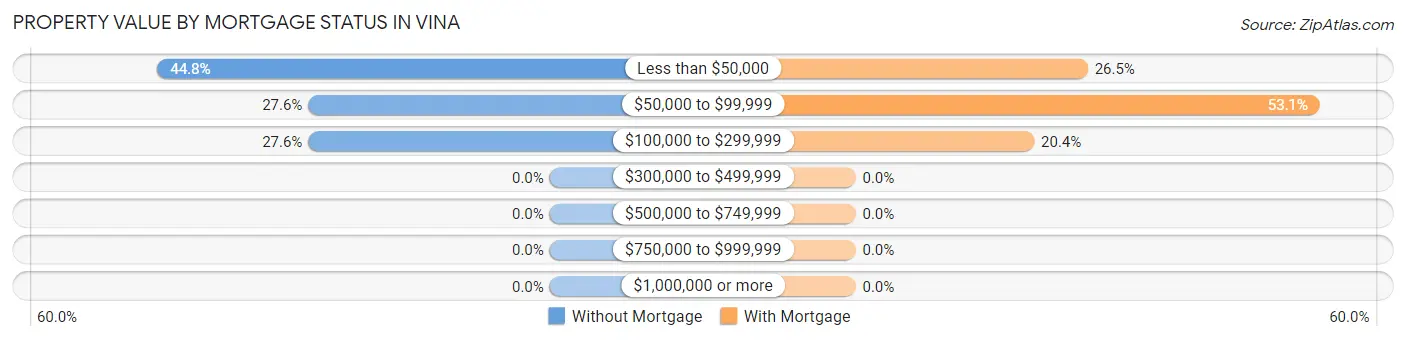
| Property Value | Without Mortgage | With Mortgage |
| Less than $50,000 | 13 (44.8%) | 13 (26.5%) |
| $50,000 to $99,999 | 8 (27.6%) | 26 (53.1%) |
| $100,000 to $299,999 | 8 (27.6%) | 10 (20.4%) |
| $300,000 to $499,999 | 0 (0.0%) | 0 (0.0%) |
| $500,000 to $749,999 | 0 (0.0%) | 0 (0.0%) |
| $750,000 to $999,999 | 0 (0.0%) | 0 (0.0%) |
| $1,000,000 or more | 0 (0.0%) | 0 (0.0%) |
| Total | 29 (100.0%) | 49 (100.0%) |
Household Income by Mortgage Status in Vina
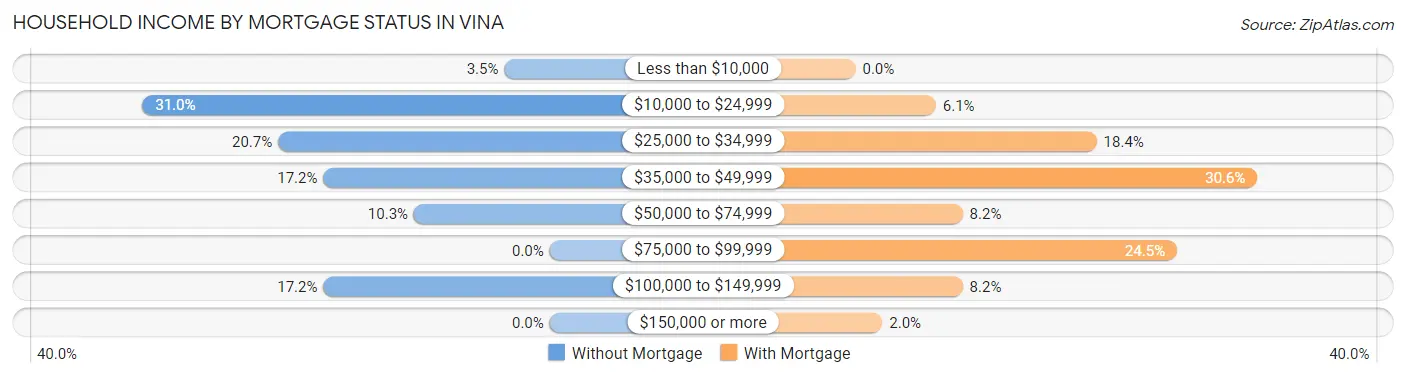
| Household Income | Without Mortgage | With Mortgage |
| Less than $10,000 | 1 (3.5%) | 0 (0.0%) |
| $10,000 to $24,999 | 9 (31.0%) | 3 (6.1%) |
| $25,000 to $34,999 | 6 (20.7%) | 9 (18.4%) |
| $35,000 to $49,999 | 5 (17.2%) | 15 (30.6%) |
| $50,000 to $74,999 | 3 (10.3%) | 4 (8.2%) |
| $75,000 to $99,999 | 0 (0.0%) | 12 (24.5%) |
| $100,000 to $149,999 | 5 (17.2%) | 4 (8.2%) |
| $150,000 or more | 0 (0.0%) | 1 (2.0%) |
| Total | 29 (100.0%) | 49 (100.0%) |
Property Value to Household Income Ratio in Vina
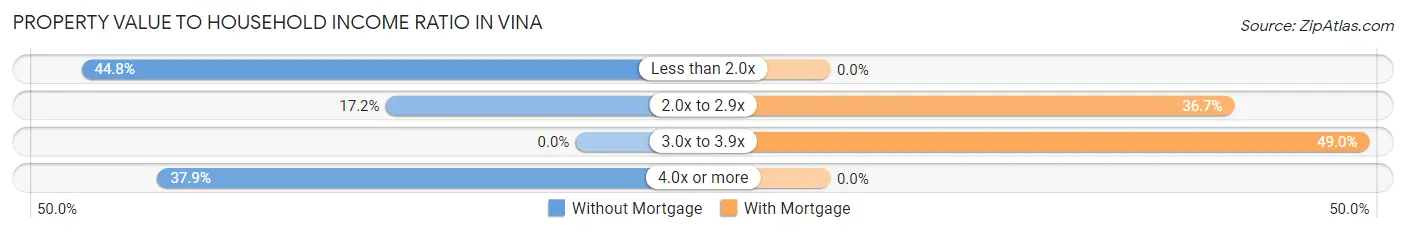
| Value-to-Income Ratio | Without Mortgage | With Mortgage |
| Less than 2.0x | 13 (44.8%) | 0 (0.0%) |
| 2.0x to 2.9x | 5 (17.2%) | 18 (36.7%) |
| 3.0x to 3.9x | 0 (0.0%) | 24 (49.0%) |
| 4.0x or more | 11 (37.9%) | 0 (0.0%) |
| Total | 29 (100.0%) | 49 (100.0%) |
Real Estate Taxes by Mortgage Status in Vina
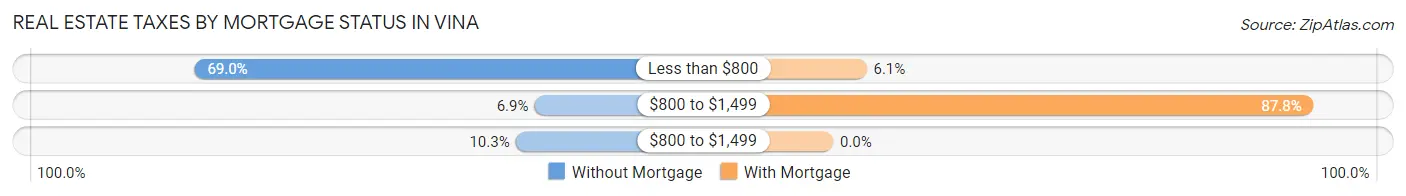
| Property Taxes | Without Mortgage | With Mortgage |
| Less than $800 | 20 (69.0%) | 3 (6.1%) |
| $800 to $1,499 | 2 (6.9%) | 43 (87.8%) |
| $800 to $1,499 | 3 (10.3%) | 0 (0.0%) |
| Total | 29 (100.0%) | 49 (100.0%) |
Health & Disability in Vina
Health Insurance Coverage by Age in Vina
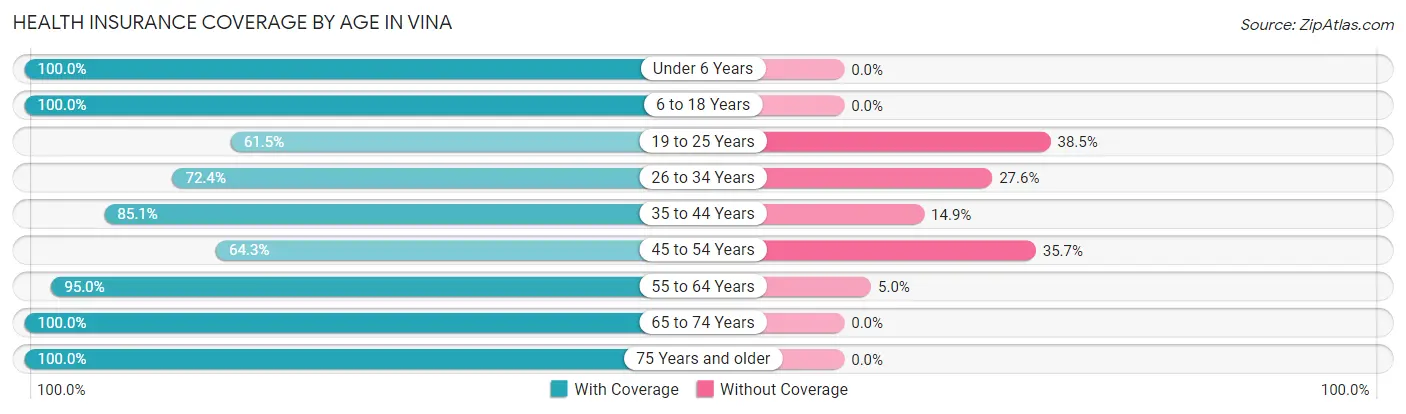
| Age Bracket | With Coverage | Without Coverage |
| Under 6 Years | 53 (100.0%) | 0 (0.0%) |
| 6 to 18 Years | 56 (100.0%) | 0 (0.0%) |
| 19 to 25 Years | 24 (61.5%) | 15 (38.5%) |
| 26 to 34 Years | 21 (72.4%) | 8 (27.6%) |
| 35 to 44 Years | 40 (85.1%) | 7 (14.9%) |
| 45 to 54 Years | 45 (64.3%) | 25 (35.7%) |
| 55 to 64 Years | 38 (95.0%) | 2 (5.0%) |
| 65 to 74 Years | 37 (100.0%) | 0 (0.0%) |
| 75 Years and older | 18 (100.0%) | 0 (0.0%) |
| Total | 332 (85.4%) | 57 (14.6%) |
Health Insurance Coverage by Citizenship Status in Vina
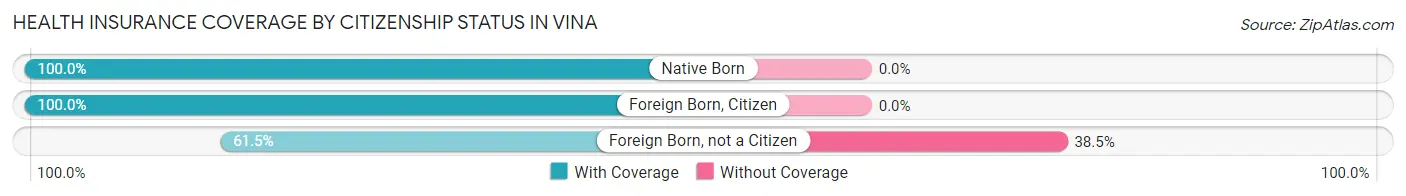
| Citizenship Status | With Coverage | Without Coverage |
| Native Born | 53 (100.0%) | 0 (0.0%) |
| Foreign Born, Citizen | 56 (100.0%) | 0 (0.0%) |
| Foreign Born, not a Citizen | 24 (61.5%) | 15 (38.5%) |
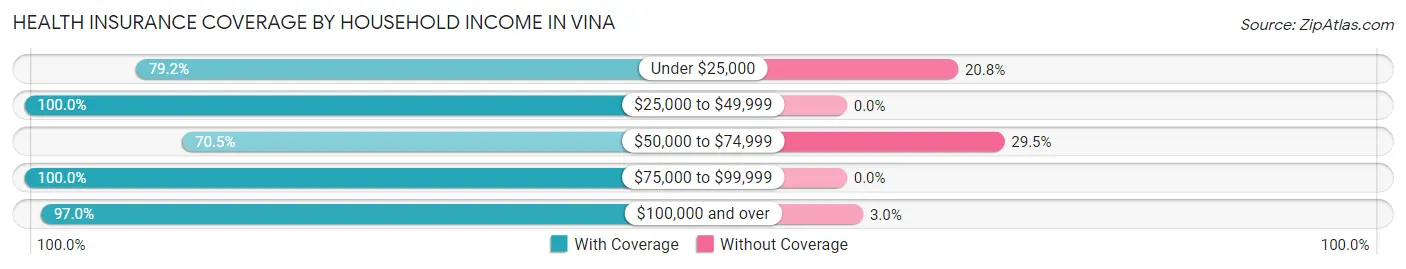
Health Insurance Coverage by Household Income in Vina
| Household Income | With Coverage | Without Coverage |
| Under $25,000 | 95 (79.2%) | 25 (20.8%) |
| $25,000 to $49,999 | 113 (100.0%) | 0 (0.0%) |
| $50,000 to $74,999 | 74 (70.5%) | 31 (29.5%) |
| $75,000 to $99,999 | 18 (100.0%) | 0 (0.0%) |
| $100,000 and over | 32 (97.0%) | 1 (3.0%) |
Public vs Private Health Insurance Coverage by Age in Vina
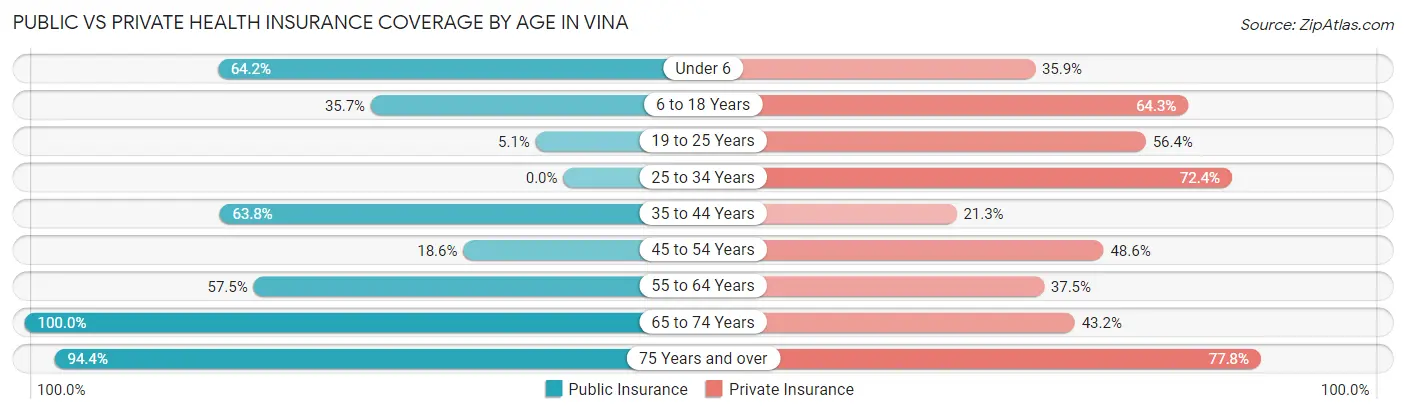
| Age Bracket | Public Insurance | Private Insurance |
| Under 6 | 34 (64.1%) | 19 (35.8%) |
| 6 to 18 Years | 20 (35.7%) | 36 (64.3%) |
| 19 to 25 Years | 2 (5.1%) | 22 (56.4%) |
| 25 to 34 Years | 0 (0.0%) | 21 (72.4%) |
| 35 to 44 Years | 30 (63.8%) | 10 (21.3%) |
| 45 to 54 Years | 13 (18.6%) | 34 (48.6%) |
| 55 to 64 Years | 23 (57.5%) | 15 (37.5%) |
| 65 to 74 Years | 37 (100.0%) | 16 (43.2%) |
| 75 Years and over | 17 (94.4%) | 14 (77.8%) |
| Total | 176 (45.2%) | 187 (48.1%) |
Disability Status by Sex by Age in Vina
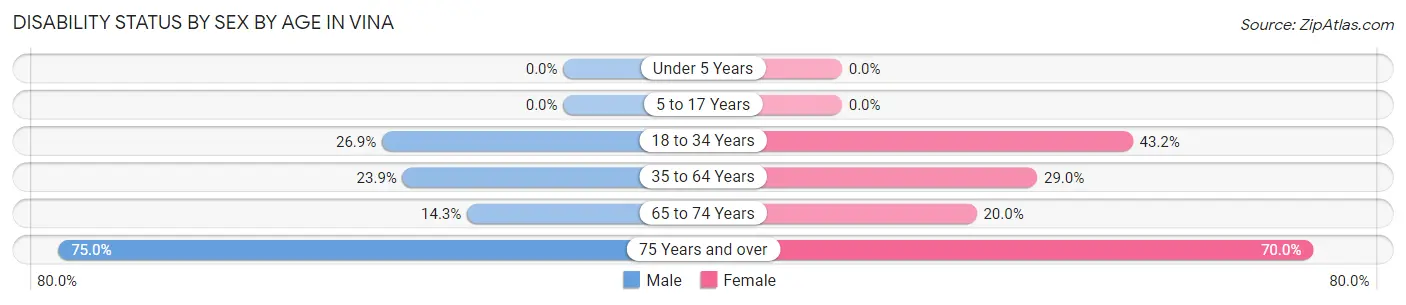
| Age Bracket | Male | Female |
| Under 5 Years | 0 (0.0%) | 0 (0.0%) |
| 5 to 17 Years | 0 (0.0%) | 0 (0.0%) |
| 18 to 34 Years | 7 (26.9%) | 19 (43.2%) |
| 35 to 64 Years | 21 (23.9%) | 20 (29.0%) |
| 65 to 74 Years | 1 (14.3%) | 6 (20.0%) |
| 75 Years and over | 6 (75.0%) | 7 (70.0%) |
Disability Class by Sex by Age in Vina
Disability Class: Hearing Difficulty
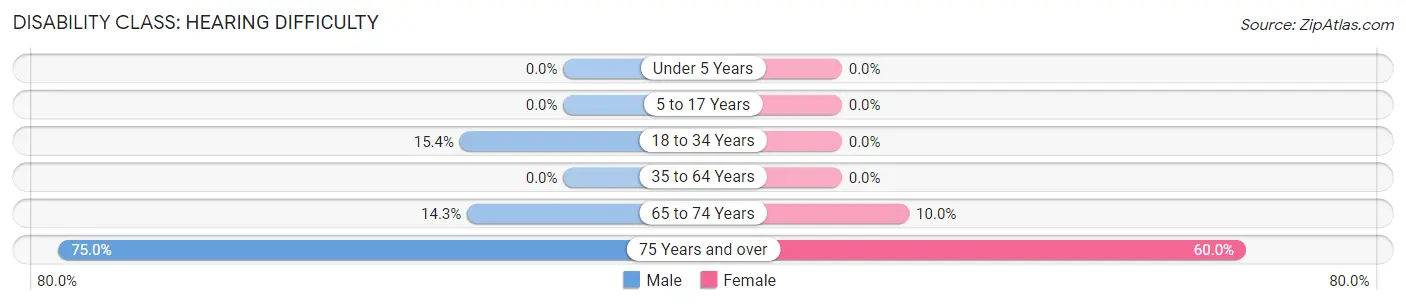
| Age Bracket | Male | Female |
| Under 5 Years | 0 (0.0%) | 0 (0.0%) |
| 5 to 17 Years | 0 (0.0%) | 0 (0.0%) |
| 18 to 34 Years | 4 (15.4%) | 0 (0.0%) |
| 35 to 64 Years | 0 (0.0%) | 0 (0.0%) |
| 65 to 74 Years | 1 (14.3%) | 3 (10.0%) |
| 75 Years and over | 6 (75.0%) | 6 (60.0%) |
Disability Class: Vision Difficulty
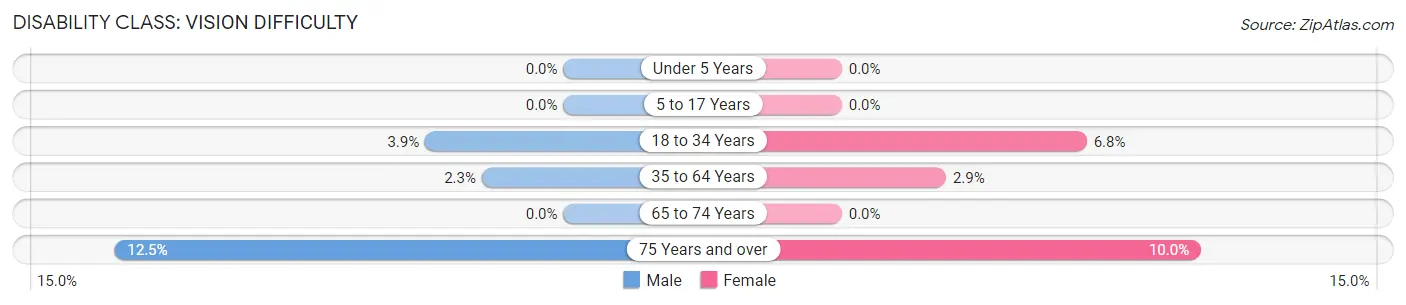
| Age Bracket | Male | Female |
| Under 5 Years | 0 (0.0%) | 0 (0.0%) |
| 5 to 17 Years | 0 (0.0%) | 0 (0.0%) |
| 18 to 34 Years | 1 (3.8%) | 3 (6.8%) |
| 35 to 64 Years | 2 (2.3%) | 2 (2.9%) |
| 65 to 74 Years | 0 (0.0%) | 0 (0.0%) |
| 75 Years and over | 1 (12.5%) | 1 (10.0%) |
Disability Class: Cognitive Difficulty
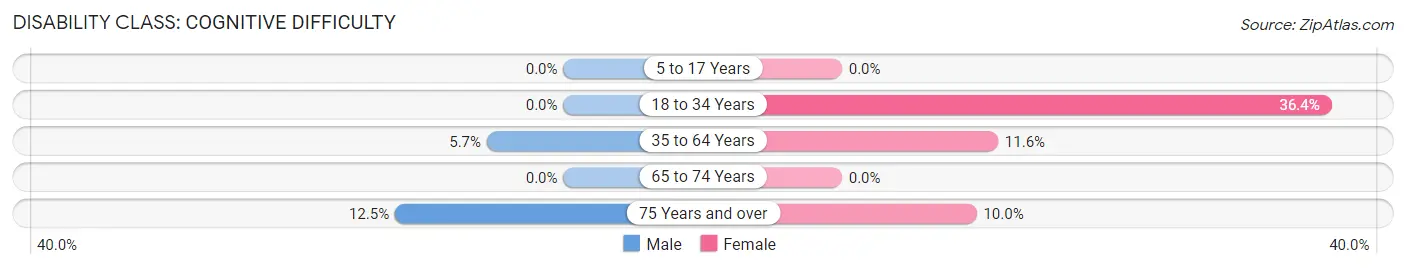
| Age Bracket | Male | Female |
| 5 to 17 Years | 0 (0.0%) | 0 (0.0%) |
| 18 to 34 Years | 0 (0.0%) | 16 (36.4%) |
| 35 to 64 Years | 5 (5.7%) | 8 (11.6%) |
| 65 to 74 Years | 0 (0.0%) | 0 (0.0%) |
| 75 Years and over | 1 (12.5%) | 1 (10.0%) |
Disability Class: Ambulatory Difficulty
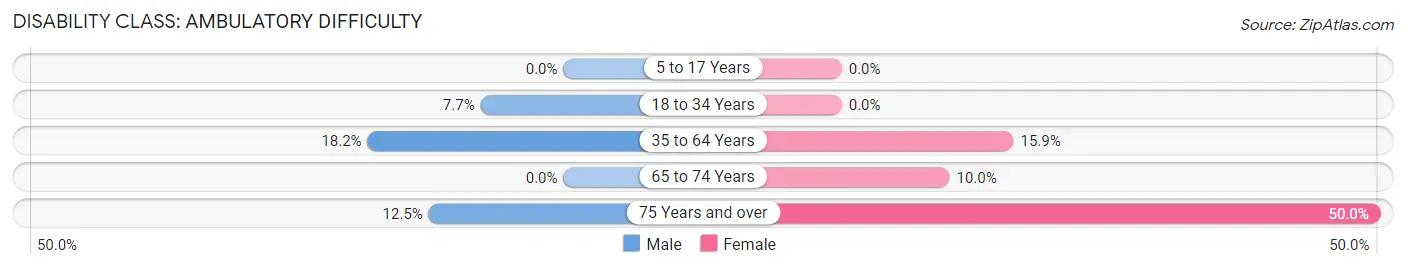
| Age Bracket | Male | Female |
| 5 to 17 Years | 0 (0.0%) | 0 (0.0%) |
| 18 to 34 Years | 2 (7.7%) | 0 (0.0%) |
| 35 to 64 Years | 16 (18.2%) | 11 (15.9%) |
| 65 to 74 Years | 0 (0.0%) | 3 (10.0%) |
| 75 Years and over | 1 (12.5%) | 5 (50.0%) |
Disability Class: Self-Care Difficulty
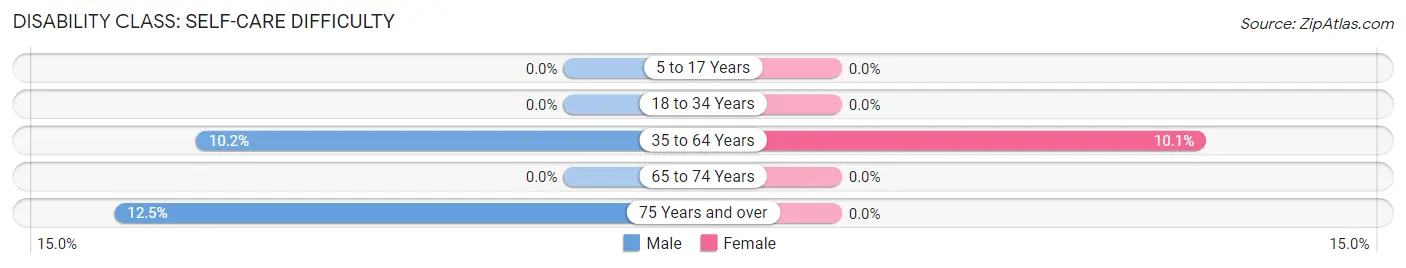
| Age Bracket | Male | Female |
| 5 to 17 Years | 0 (0.0%) | 0 (0.0%) |
| 18 to 34 Years | 0 (0.0%) | 0 (0.0%) |
| 35 to 64 Years | 9 (10.2%) | 7 (10.1%) |
| 65 to 74 Years | 0 (0.0%) | 0 (0.0%) |
| 75 Years and over | 1 (12.5%) | 0 (0.0%) |
Technology Access in Vina
Computing Device Access in Vina
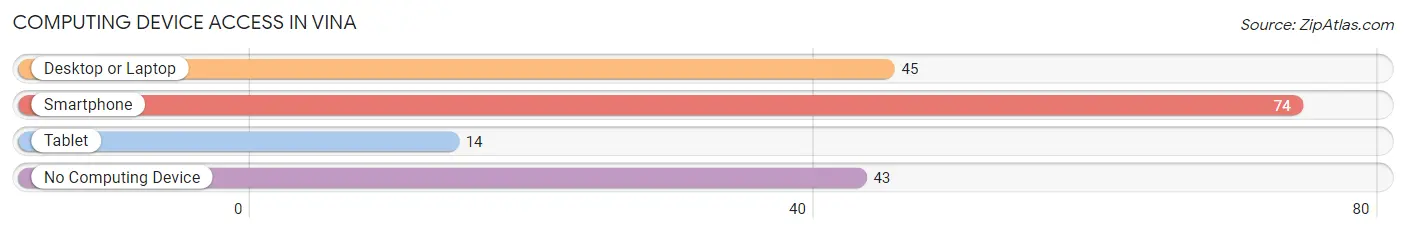
| Device Type | # Households | % Households |
| Desktop or Laptop | 45 | 34.9% |
| Smartphone | 74 | 57.4% |
| Tablet | 14 | 10.8% |
| No Computing Device | 43 | 33.3% |
| Total | 129 | 100.0% |
Internet Access in Vina
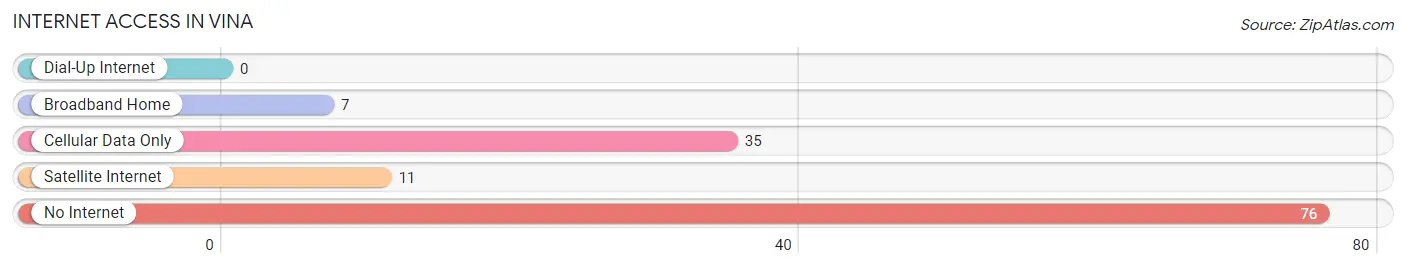
| Internet Type | # Households | % Households |
| Dial-Up Internet | 0 | 0.0% |
| Broadband Home | 7 | 5.4% |
| Cellular Data Only | 35 | 27.1% |
| Satellite Internet | 11 | 8.5% |
| No Internet | 76 | 58.9% |
| Total | 129 | 100.0% |
Vina Summary
Vina is a small town located in Franklin County, Alabama. It is situated in the northwest corner of the state, near the Tennessee border. The town was founded in 1836 and has a population of approximately 1,000 people.
Geography
Vina is located in the foothills of the Appalachian Mountains, and is surrounded by rolling hills and forests. The town is situated on the banks of the Tennessee River, and is bordered by the towns of Russellville, Red Bay, and Phil Campbell. The town is located at an elevation of 830 feet above sea level.
The climate in Vina is humid subtropical, with hot summers and mild winters. The average annual temperature is around 64 degrees Fahrenheit, with an average high of around 90 degrees in the summer and an average low of around 40 degrees in the winter. The town receives an average of 48 inches of precipitation per year, with most of it falling in the form of rain.
Economy
The economy of Vina is largely based on agriculture and forestry. The town is home to several farms, which produce a variety of crops, including corn, soybeans, cotton, and wheat. The town also has several timber companies, which harvest and process timber for use in construction and other industries.
In addition to agriculture and forestry, Vina is home to several small businesses, including restaurants, retail stores, and service providers. The town also has a few manufacturing companies, which produce a variety of products, including furniture, clothing, and automotive parts.
Demographics
As of the 2010 census, Vina had a population of 1,000 people. The racial makeup of the town was 97.2% White, 0.7% African American, 0.3% Native American, 0.2% Asian, and 1.6% from other races. The median household income was $30,000, and the median family income was $35,000.
The town is served by the Franklin County School District, which includes two elementary schools, one middle school, and one high school. The town also has a library, a post office, and several churches.
Vina is a small, rural town with a rich history and a strong sense of community. The town is home to a variety of businesses and industries, and is a great place to live and work. With its beautiful scenery and friendly people, Vina is a great place to call home.
Common Questions
What is Per Capita Income in Vina?
Per Capita income in Vina is $15,784.
What is the Median Household income in Vina?
Median Household Income in Vina is $37,708.
What is Income or Wage Gap in Vina?
Income or Wage Gap in Vina is 41.4%.
Women in Vina earn 58.6 cents for every dollar earned by a man.
What is Inequality or Gini Index in Vina?
Inequality or Gini Index in Vina is 0.41.
What is the Total Population of Vina?
Total Population of Vina is 389.
What is the Total Male Population of Vina?
Total Male Population of Vina is 187.
What is the Total Female Population of Vina?
Total Female Population of Vina is 202.
What is the Ratio of Males per 100 Females in Vina?
There are 92.57 Males per 100 Females in Vina.
What is the Ratio of Females per 100 Males in Vina?
There are 108.02 Females per 100 Males in Vina.
What is the Median Population Age in Vina?
Median Population Age in Vina is 41.0 Years.
What is the Average Family Size in Vina
Average Family Size in Vina is 3.6 People.
What is the Average Household Size in Vina
Average Household Size in Vina is 3.0 People.
How Large is the Labor Force in Vina?
There are 120 People in the Labor Forcein in Vina.
What is the Percentage of People in the Labor Force in Vina?
39.7% of People are in the Labor Force in Vina.