Uniontown, AL Map & Demographics
Uniontown Map
Uniontown Overview
$14,998
PER CAPITA INCOME
$25,563
AVG FAMILY INCOME
$24,355
AVG HOUSEHOLD INCOME
0.45
INEQUALITY / GINI INDEX
1,754
TOTAL POPULATION
849
MALE POPULATION
905
FEMALE POPULATION
93.81
MALES / 100 FEMALES
106.60
FEMALES / 100 MALES
41.2
MEDIAN AGE
3.4
AVG FAMILY SIZE
2.5
AVG HOUSEHOLD SIZE
562
LABOR FORCE [ PEOPLE ]
41.5%
PERCENT IN LABOR FORCE
21.0%
UNEMPLOYMENT RATE
Uniontown Zip Codes
Uniontown Area Codes
Income in Uniontown
Income Overview in Uniontown
Per Capita Income in Uniontown is $14,998, while median incomes of families and households are $25,563 and $24,355 respectively.
| Characteristic | Number | Measure |
| Per Capita Income | 1,754 | $14,998 |
| Median Family Income | 410 | $25,563 |
| Mean Family Income | 410 | $37,823 |
| Median Household Income | 699 | $24,355 |
| Mean Household Income | 699 | $35,431 |
| Income Deficit | 410 | $0 |
| Wage / Income Gap (%) | 1,754 | 0.00% |
| Wage / Income Gap ($) | 1,754 | 100.00¢ per $1 |
| Gini / Inequality Index | 1,754 | 0.45 |
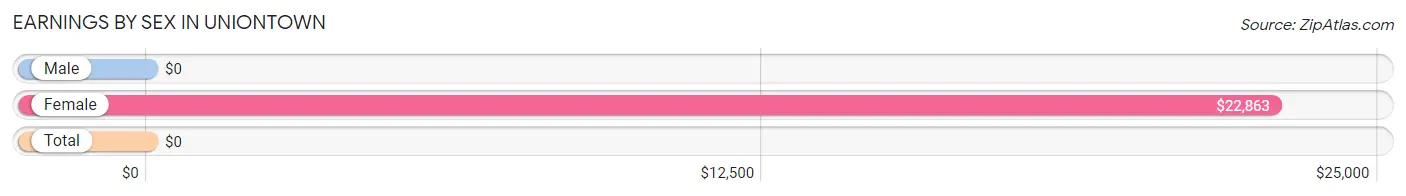
Earnings by Sex in Uniontown
| Sex | Number | Average Earnings |
| Male | 390 (72.6%) | $0 |
| Female | 147 (27.4%) | $22,863 |
| Total | 537 (100.0%) | $0 |
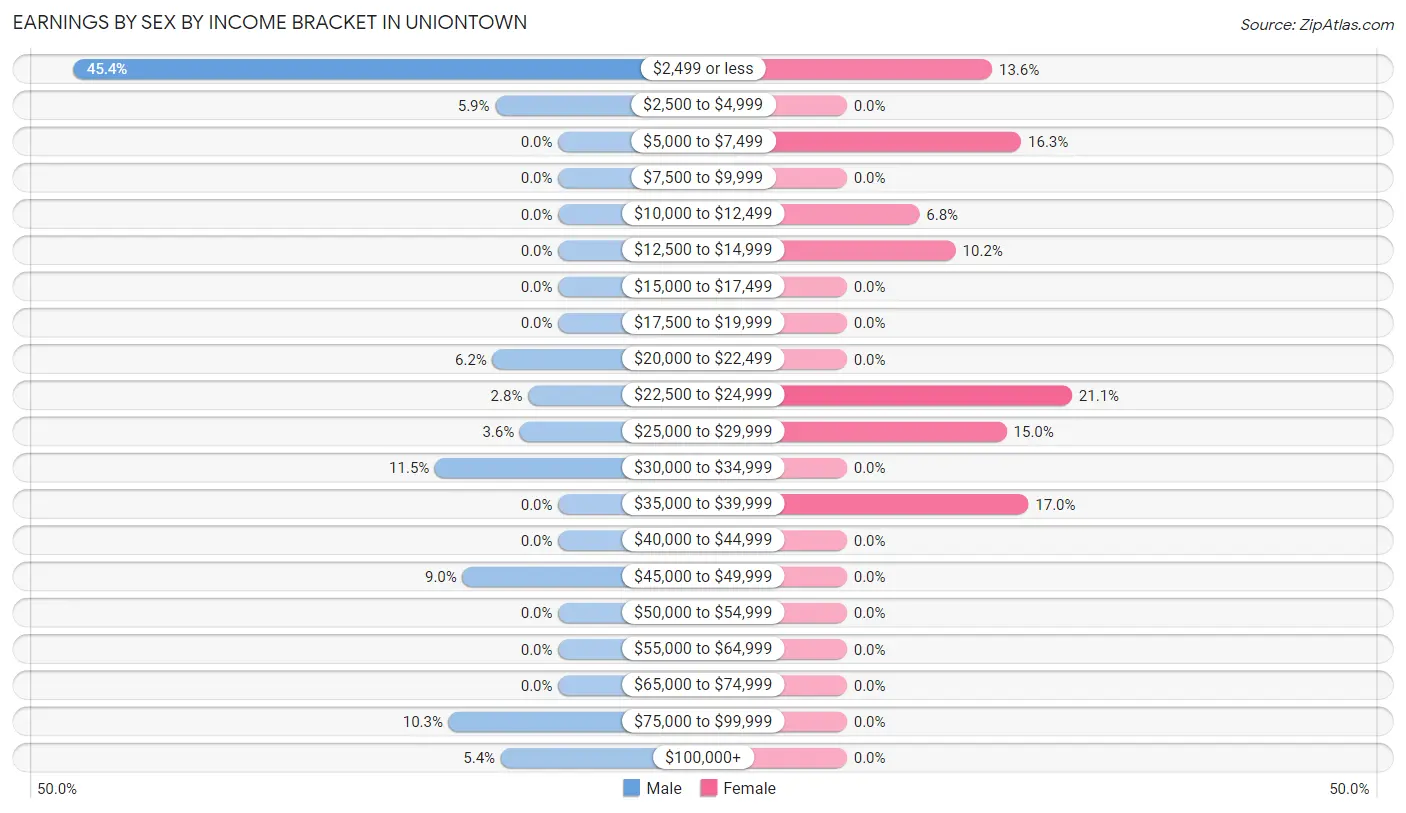
Earnings by Sex by Income Bracket in Uniontown
The most common earnings brackets in Uniontown are $2,499 or less for men (177 | 45.4%) and $22,500 to $24,999 for women (31 | 21.1%).
| Income | Male | Female |
| $2,499 or less | 177 (45.4%) | 20 (13.6%) |
| $2,500 to $4,999 | 23 (5.9%) | 0 (0.0%) |
| $5,000 to $7,499 | 0 (0.0%) | 24 (16.3%) |
| $7,500 to $9,999 | 0 (0.0%) | 0 (0.0%) |
| $10,000 to $12,499 | 0 (0.0%) | 10 (6.8%) |
| $12,500 to $14,999 | 0 (0.0%) | 15 (10.2%) |
| $15,000 to $17,499 | 0 (0.0%) | 0 (0.0%) |
| $17,500 to $19,999 | 0 (0.0%) | 0 (0.0%) |
| $20,000 to $22,499 | 24 (6.1%) | 0 (0.0%) |
| $22,500 to $24,999 | 11 (2.8%) | 31 (21.1%) |
| $25,000 to $29,999 | 14 (3.6%) | 22 (15.0%) |
| $30,000 to $34,999 | 45 (11.5%) | 0 (0.0%) |
| $35,000 to $39,999 | 0 (0.0%) | 25 (17.0%) |
| $40,000 to $44,999 | 0 (0.0%) | 0 (0.0%) |
| $45,000 to $49,999 | 35 (9.0%) | 0 (0.0%) |
| $50,000 to $54,999 | 0 (0.0%) | 0 (0.0%) |
| $55,000 to $64,999 | 0 (0.0%) | 0 (0.0%) |
| $65,000 to $74,999 | 0 (0.0%) | 0 (0.0%) |
| $75,000 to $99,999 | 40 (10.3%) | 0 (0.0%) |
| $100,000+ | 21 (5.4%) | 0 (0.0%) |
| Total | 390 (100.0%) | 147 (100.0%) |
Earnings by Sex by Educational Attainment in Uniontown
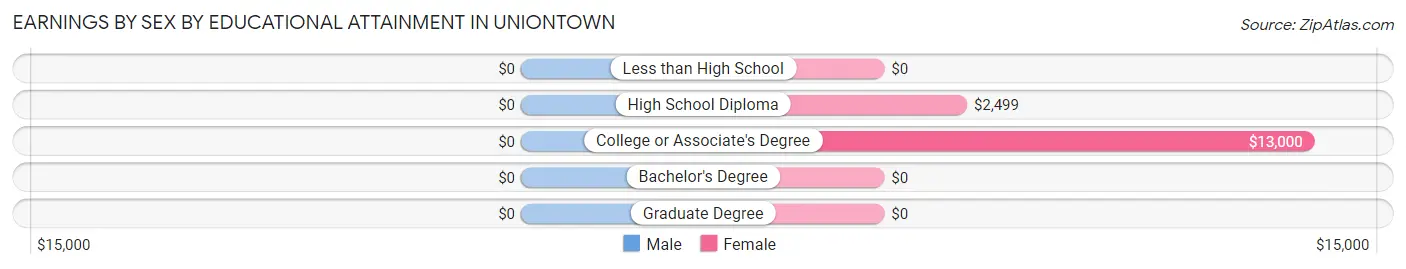
| Educational Attainment | Male Income | Female Income |
| Less than High School | - | - |
| High School Diploma | - | - |
| College or Associate's Degree | - | - |
| Bachelor's Degree | - | - |
| Graduate Degree | - | - |
| Total | - | - |
Family Income in Uniontown
Family Income Brackets in Uniontown
According to the Uniontown family income data, there are 137 families falling into the $15,000 to $24,999 income range, which is the most common income bracket and makes up 33.4% of all families.
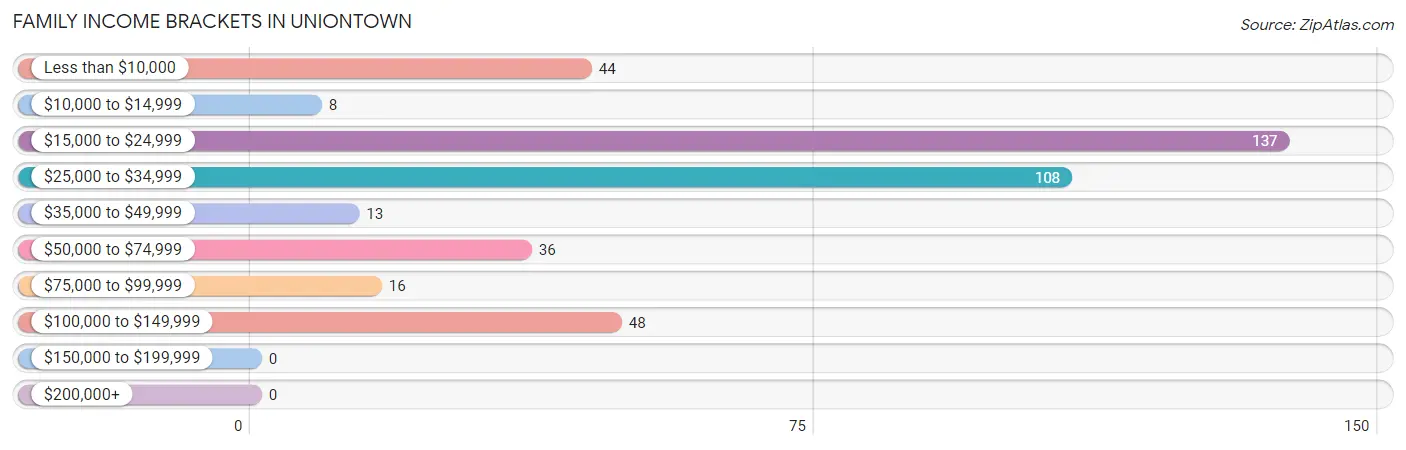
| Income Bracket | # Families | % Families |
| Less than $10,000 | 44 | 10.7% |
| $10,000 to $14,999 | 8 | 2.0% |
| $15,000 to $24,999 | 137 | 33.4% |
| $25,000 to $34,999 | 108 | 26.3% |
| $35,000 to $49,999 | 13 | 3.2% |
| $50,000 to $74,999 | 36 | 8.8% |
| $75,000 to $99,999 | 16 | 3.9% |
| $100,000 to $149,999 | 48 | 11.7% |
| $150,000 to $199,999 | 0 | 0.0% |
| $200,000+ | 0 | 0.0% |
Family Income by Famaliy Size in Uniontown
6-person families (18 | 4.4%) account for the highest median family income in Uniontown with $31,250 per family, while 2-person families (193 | 47.1%) have the highest median income of $12,670 per family member.
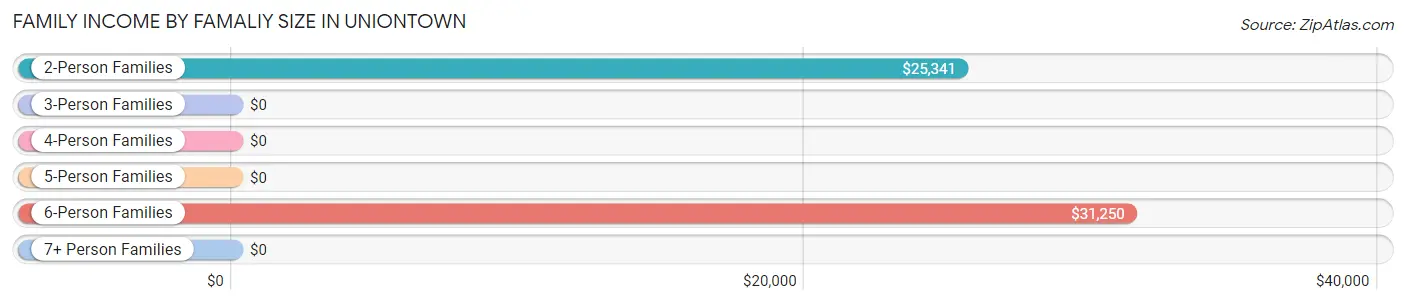
| Income Bracket | # Families | Median Income |
| 2-Person Families | 193 (47.1%) | $25,341 |
| 3-Person Families | 104 (25.4%) | $0 |
| 4-Person Families | 68 (16.6%) | $0 |
| 5-Person Families | 27 (6.6%) | $0 |
| 6-Person Families | 18 (4.4%) | $31,250 |
| 7+ Person Families | 0 (0.0%) | $0 |
| Total | 410 (100.0%) | $25,563 |
Family Income by Number of Earners in Uniontown
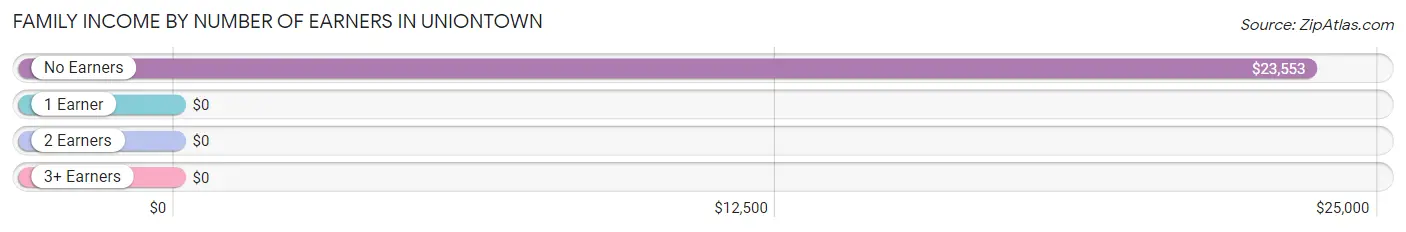
| Number of Earners | # Families | Median Income |
| No Earners | 190 (46.3%) | $23,553 |
| 1 Earner | 104 (25.4%) | $0 |
| 2 Earners | 116 (28.3%) | $0 |
| 3+ Earners | 0 (0.0%) | $0 |
| Total | 410 (100.0%) | $25,563 |
Household Income in Uniontown
Household Income Brackets in Uniontown
With 192 households falling in the category, the $15,000 to $24,999 income range is the most frequent in Uniontown, accounting for 27.5% of all households.
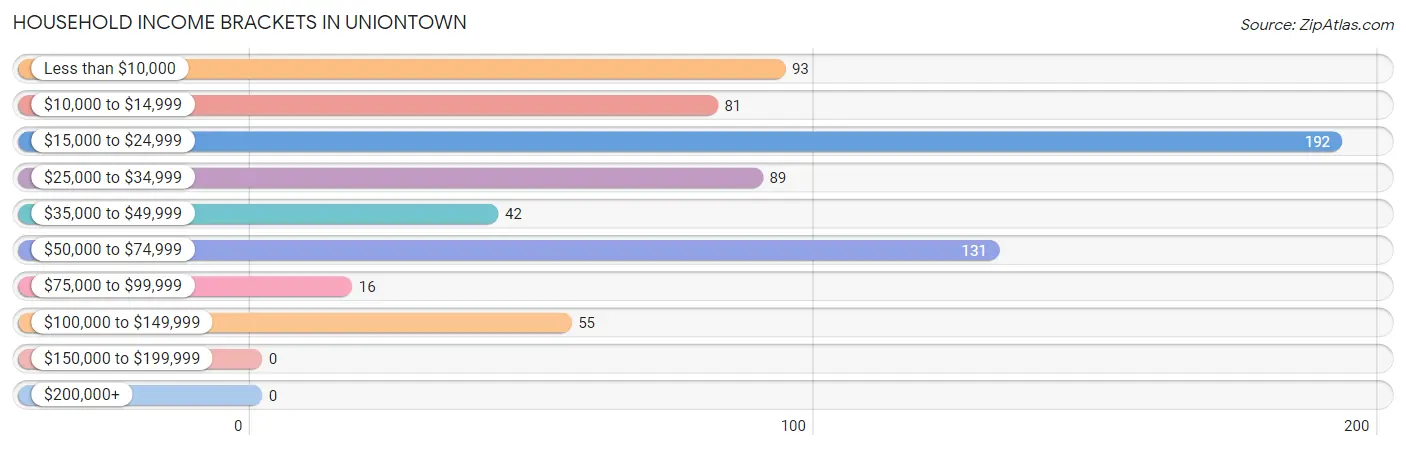
| Income Bracket | # Households | % Households |
| Less than $10,000 | 93 | 13.3% |
| $10,000 to $14,999 | 81 | 11.6% |
| $15,000 to $24,999 | 192 | 27.5% |
| $25,000 to $34,999 | 89 | 12.7% |
| $35,000 to $49,999 | 42 | 6.0% |
| $50,000 to $74,999 | 131 | 18.7% |
| $75,000 to $99,999 | 16 | 2.3% |
| $100,000 to $149,999 | 55 | 7.9% |
| $150,000 to $199,999 | 0 | 0.0% |
| $200,000+ | 0 | 0.0% |
Household Income by Householder Age in Uniontown
The median household income in Uniontown is $24,355, with the highest median household income of $31,875 found in the 65+ years age bracket for the primary householder. A total of 127 households (18.2%) fall into this category.
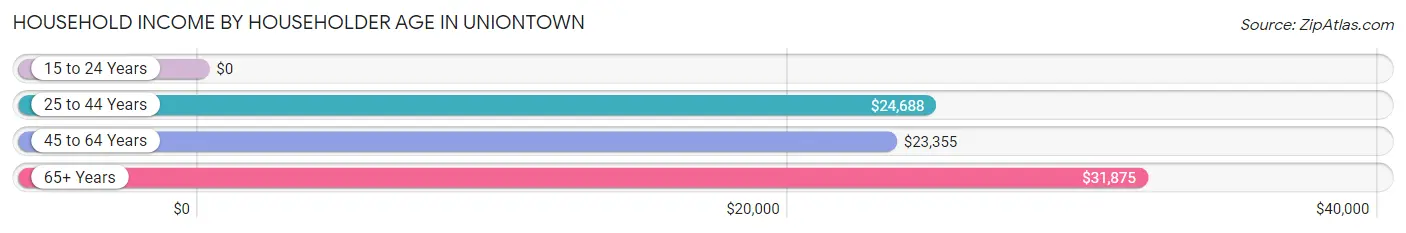
| Income Bracket | # Households | Median Income |
| 15 to 24 Years | 0 (0.0%) | $0 |
| 25 to 44 Years | 267 (38.2%) | $24,688 |
| 45 to 64 Years | 305 (43.6%) | $23,355 |
| 65+ Years | 127 (18.2%) | $31,875 |
| Total | 699 (100.0%) | $24,355 |
Poverty in Uniontown
Income Below Poverty by Sex and Age in Uniontown
With 55.6% poverty level for males and 52.3% for females among the residents of Uniontown, under 5 year old males and under 5 year old females are the most vulnerable to poverty, with 29 males (100.0%) and 22 females (100.0%) in their respective age groups living below the poverty level.
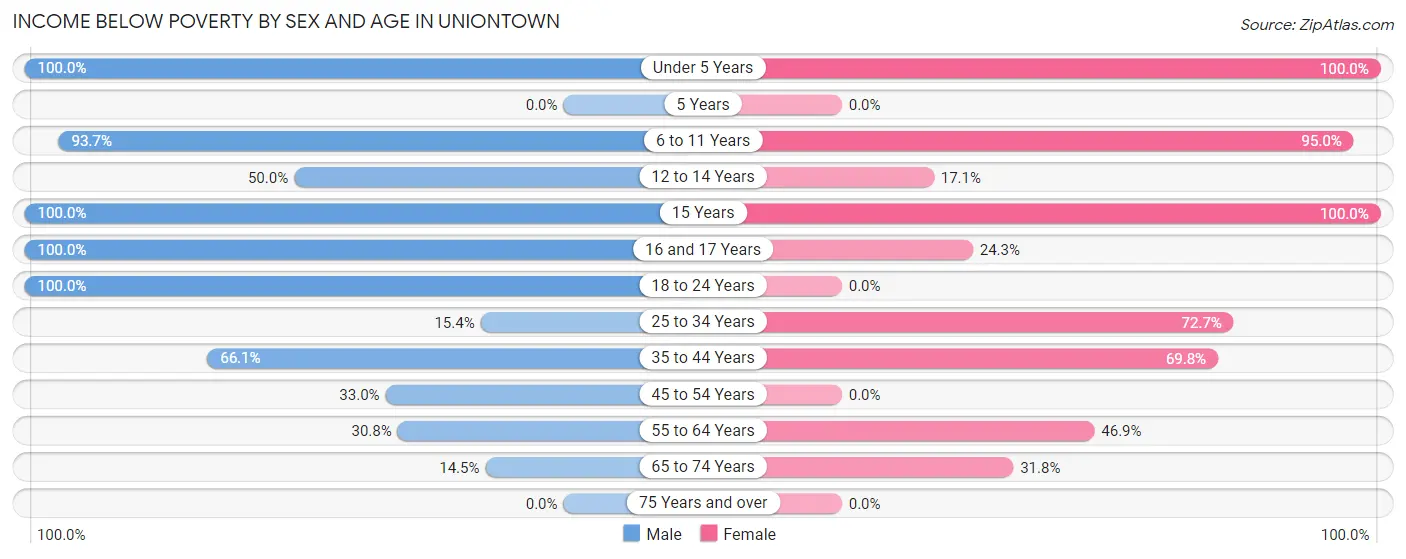
| Age Bracket | Male | Female |
| Under 5 Years | 29 (100.0%) | 22 (100.0%) |
| 5 Years | 0 (0.0%) | 0 (0.0%) |
| 6 to 11 Years | 104 (93.7%) | 133 (95.0%) |
| 12 to 14 Years | 7 (50.0%) | 7 (17.1%) |
| 15 Years | 27 (100.0%) | 8 (100.0%) |
| 16 and 17 Years | 8 (100.0%) | 9 (24.3%) |
| 18 to 24 Years | 73 (100.0%) | 0 (0.0%) |
| 25 to 34 Years | 8 (15.4%) | 72 (72.7%) |
| 35 to 44 Years | 150 (66.1%) | 111 (69.8%) |
| 45 to 54 Years | 36 (33.0%) | 0 (0.0%) |
| 55 to 64 Years | 20 (30.8%) | 90 (46.9%) |
| 65 to 74 Years | 10 (14.5%) | 21 (31.8%) |
| 75 Years and over | 0 (0.0%) | 0 (0.0%) |
| Total | 472 (55.6%) | 473 (52.3%) |
Income Above Poverty by Sex and Age in Uniontown
According to the poverty statistics in Uniontown, males aged 5 years and females aged 45 to 54 years are the age groups that are most secure financially, with 100.0% of males and 100.0% of females in these age groups living above the poverty line.
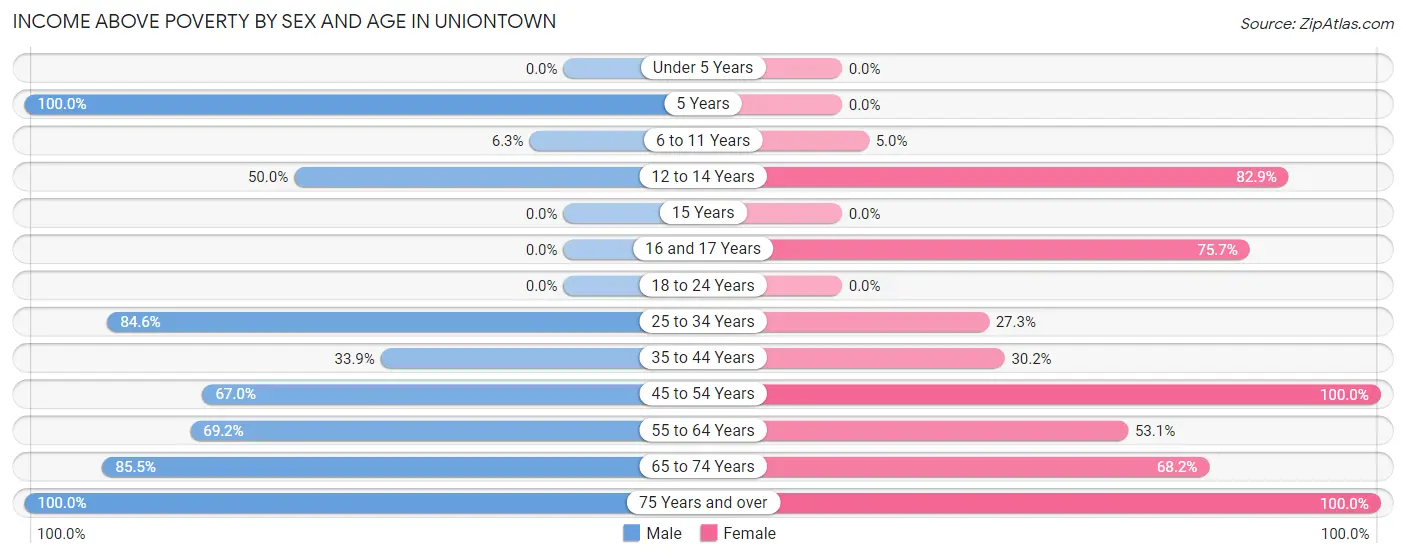
| Age Bracket | Male | Female |
| Under 5 Years | 0 (0.0%) | 0 (0.0%) |
| 5 Years | 7 (100.0%) | 0 (0.0%) |
| 6 to 11 Years | 7 (6.3%) | 7 (5.0%) |
| 12 to 14 Years | 7 (50.0%) | 34 (82.9%) |
| 15 Years | 0 (0.0%) | 0 (0.0%) |
| 16 and 17 Years | 0 (0.0%) | 28 (75.7%) |
| 18 to 24 Years | 0 (0.0%) | 0 (0.0%) |
| 25 to 34 Years | 44 (84.6%) | 27 (27.3%) |
| 35 to 44 Years | 77 (33.9%) | 48 (30.2%) |
| 45 to 54 Years | 73 (67.0%) | 78 (100.0%) |
| 55 to 64 Years | 45 (69.2%) | 102 (53.1%) |
| 65 to 74 Years | 59 (85.5%) | 45 (68.2%) |
| 75 Years and over | 58 (100.0%) | 63 (100.0%) |
| Total | 377 (44.4%) | 432 (47.7%) |
Income Below Poverty Among Married-Couple Families in Uniontown
The poverty statistics for married-couple families in Uniontown show that 2.2% or 3 of the total 139 families live below the poverty line. Families with 3 or 4 children have the highest poverty rate of 50.0%, comprising of 3 families. On the other hand, families with no children have the lowest poverty rate of 0.0%, which includes 0 families.
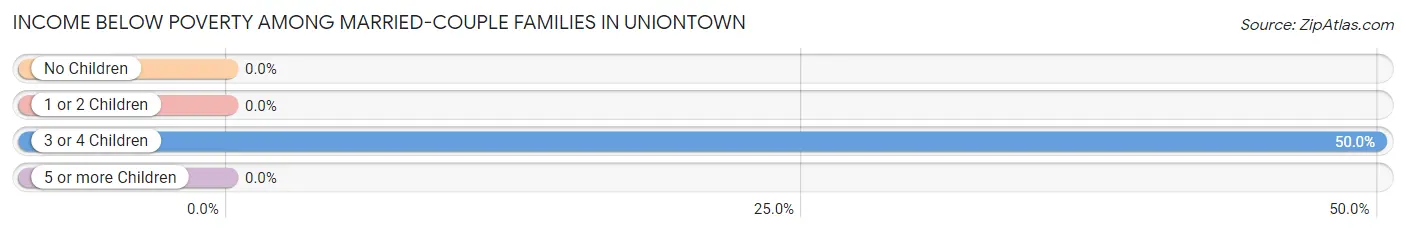
| Children | Above Poverty | Below Poverty |
| No Children | 112 (100.0%) | 0 (0.0%) |
| 1 or 2 Children | 21 (100.0%) | 0 (0.0%) |
| 3 or 4 Children | 3 (50.0%) | 3 (50.0%) |
| 5 or more Children | 0 (0.0%) | 0 (0.0%) |
| Total | 136 (97.8%) | 3 (2.2%) |
Income Below Poverty Among Single-Parent Households in Uniontown
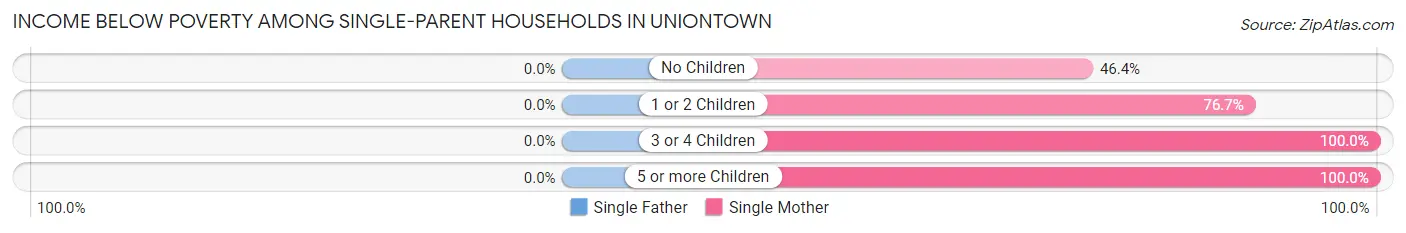
| Children | Single Father | Single Mother |
| No Children | 0 (0.0%) | 39 (46.4%) |
| 1 or 2 Children | 0 (0.0%) | 112 (76.7%) |
| 3 or 4 Children | 0 (0.0%) | 27 (100.0%) |
| 5 or more Children | 0 (0.0%) | 12 (100.0%) |
| Total | 0 (0.0%) | 190 (70.6%) |
Income Below Poverty Among Married-Couple vs Single-Parent Households in Uniontown
The poverty data for Uniontown shows that 3 of the married-couple family households (2.2%) and 190 of the single-parent households (70.1%) are living below the poverty level. Within the married-couple family households, those with 3 or 4 children have the highest poverty rate, with 3 households (50.0%) falling below the poverty line. Among the single-parent households, those with 3 or 4 children have the highest poverty rate, with 27 household (100.0%) living below poverty.
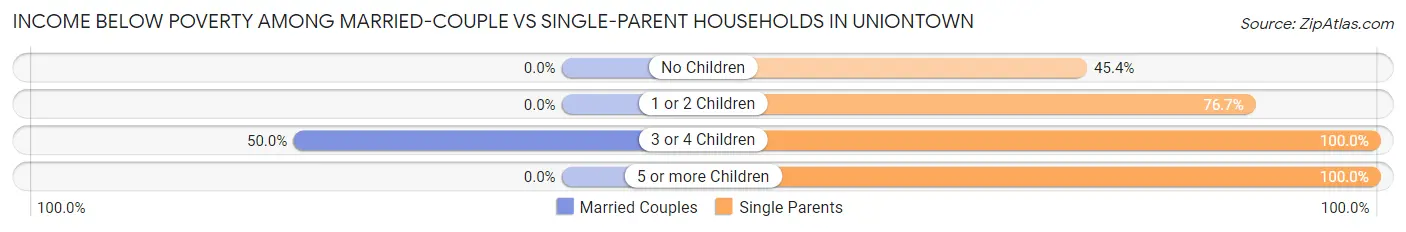
| Children | Married-Couple Families | Single-Parent Households |
| No Children | 0 (0.0%) | 39 (45.4%) |
| 1 or 2 Children | 0 (0.0%) | 112 (76.7%) |
| 3 or 4 Children | 3 (50.0%) | 27 (100.0%) |
| 5 or more Children | 0 (0.0%) | 12 (100.0%) |
| Total | 3 (2.2%) | 190 (70.1%) |
Race in Uniontown
The most populous races in Uniontown are Black / African American (1,670 | 95.2%), White / Caucasian (82 | 4.7%), and Two or more Races (2 | 0.1%).
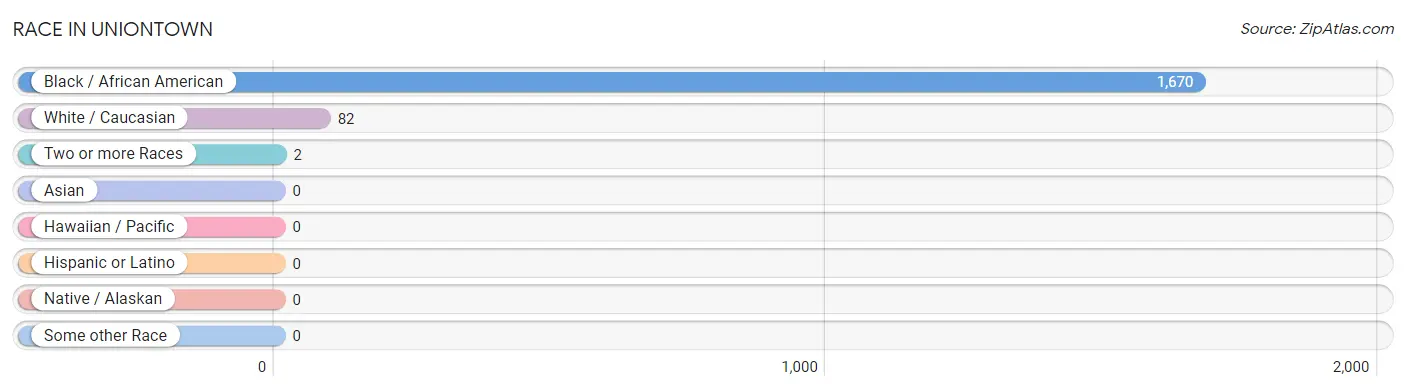
| Race | # Population | % Population |
| Asian | 0 | 0.0% |
| Black / African American | 1,670 | 95.2% |
| Hawaiian / Pacific | 0 | 0.0% |
| Hispanic or Latino | 0 | 0.0% |
| Native / Alaskan | 0 | 0.0% |
| White / Caucasian | 82 | 4.7% |
| Two or more Races | 2 | 0.1% |
| Some other Race | 0 | 0.0% |
| Total | 1,754 | 100.0% |
Ancestry in Uniontown
The most populous ancestries reported in Uniontown are American (24 | 1.4%), Dutch (24 | 1.4%), Irish (24 | 1.4%), Ghanaian (12 | 0.7%), and Subsaharan African (12 | 0.7%), together accounting for 5.5% of all Uniontown residents.
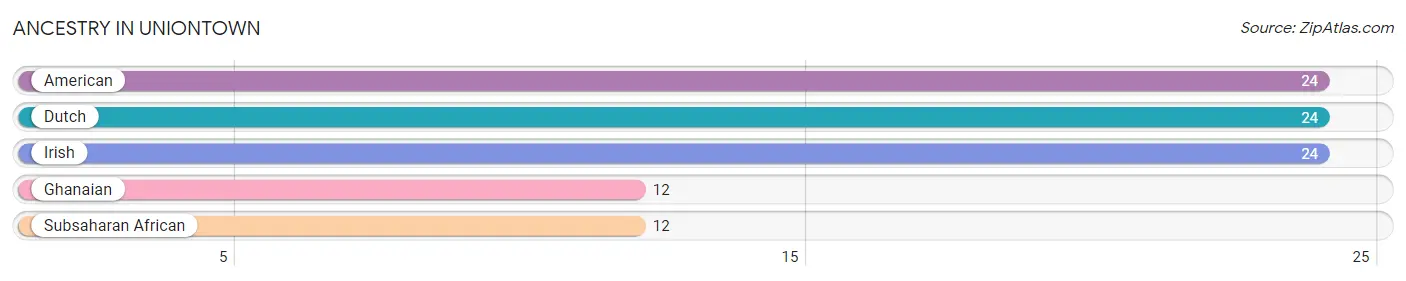
| Ancestry | # Population | % Population |
| American | 24 | 1.4% |
| Dutch | 24 | 1.4% |
| Ghanaian | 12 | 0.7% |
| Irish | 24 | 1.4% |
| Subsaharan African | 12 | 0.7% | View All 5 Rows |
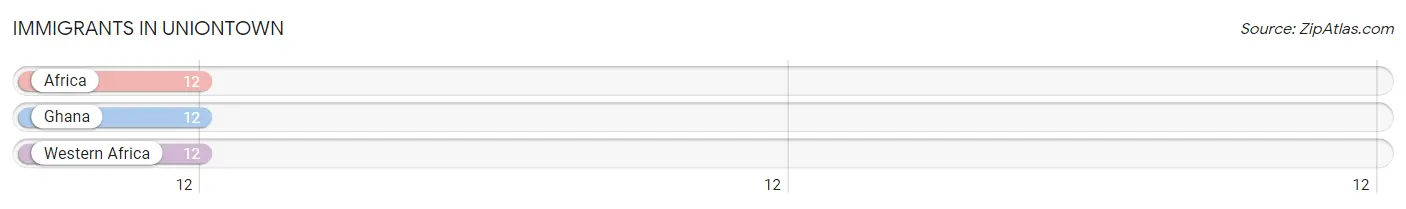
Immigrants in Uniontown
The most numerous immigrant groups reported in Uniontown came from Africa (12 | 0.7%), Ghana (12 | 0.7%), and Western Africa (12 | 0.7%), together accounting for 2.0% of all Uniontown residents.
| Immigration Origin | # Population | % Population |
| Africa | 12 | 0.7% |
| Ghana | 12 | 0.7% |
| Western Africa | 12 | 0.7% | View All 3 Rows |
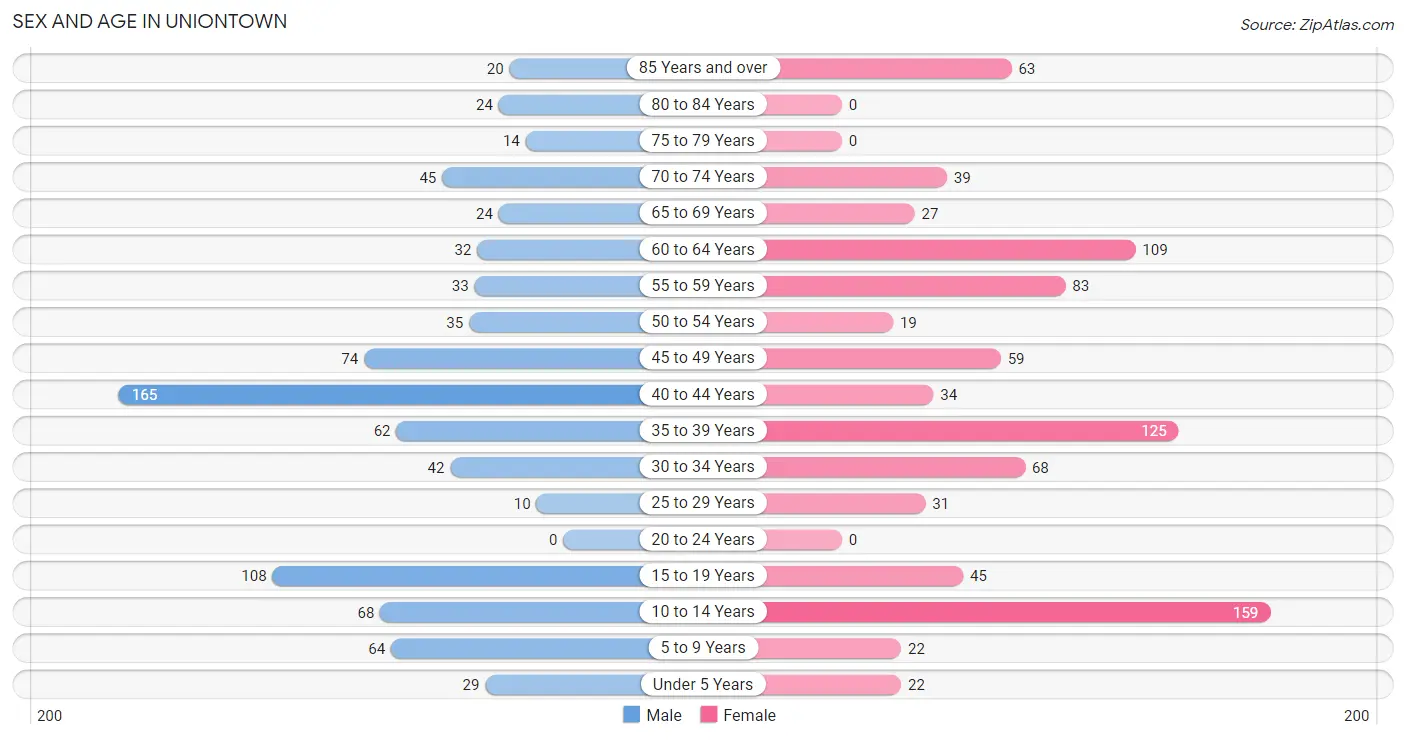
Sex and Age in Uniontown
Sex and Age in Uniontown
The most populous age groups in Uniontown are 40 to 44 Years (165 | 19.4%) for men and 10 to 14 Years (159 | 17.6%) for women.
| Age Bracket | Male | Female |
| Under 5 Years | 29 (3.4%) | 22 (2.4%) |
| 5 to 9 Years | 64 (7.5%) | 22 (2.4%) |
| 10 to 14 Years | 68 (8.0%) | 159 (17.6%) |
| 15 to 19 Years | 108 (12.7%) | 45 (5.0%) |
| 20 to 24 Years | 0 (0.0%) | 0 (0.0%) |
| 25 to 29 Years | 10 (1.2%) | 31 (3.4%) |
| 30 to 34 Years | 42 (5.0%) | 68 (7.5%) |
| 35 to 39 Years | 62 (7.3%) | 125 (13.8%) |
| 40 to 44 Years | 165 (19.4%) | 34 (3.8%) |
| 45 to 49 Years | 74 (8.7%) | 59 (6.5%) |
| 50 to 54 Years | 35 (4.1%) | 19 (2.1%) |
| 55 to 59 Years | 33 (3.9%) | 83 (9.2%) |
| 60 to 64 Years | 32 (3.8%) | 109 (12.0%) |
| 65 to 69 Years | 24 (2.8%) | 27 (3.0%) |
| 70 to 74 Years | 45 (5.3%) | 39 (4.3%) |
| 75 to 79 Years | 14 (1.7%) | 0 (0.0%) |
| 80 to 84 Years | 24 (2.8%) | 0 (0.0%) |
| 85 Years and over | 20 (2.4%) | 63 (7.0%) |
| Total | 849 (100.0%) | 905 (100.0%) |
Families and Households in Uniontown
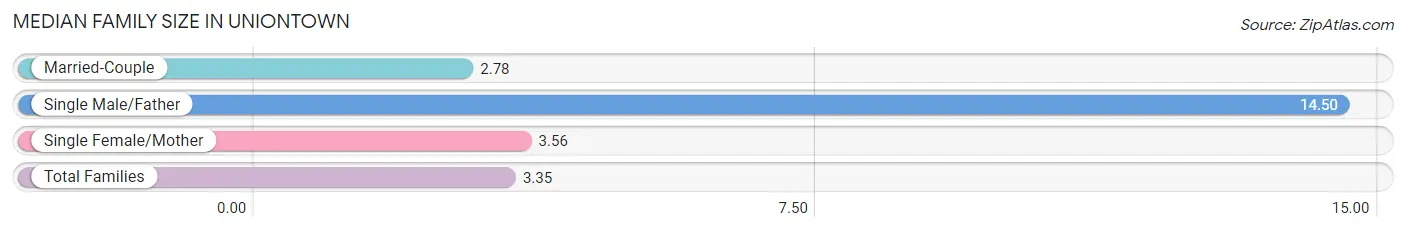
Median Family Size in Uniontown
The median family size in Uniontown is 3.35 persons per family, with single male/father families (2 | 0.5%) accounting for the largest median family size of 14.5 persons per family. On the other hand, married-couple families (139 | 33.9%) represent the smallest median family size with 2.78 persons per family.
| Family Type | # Families | Family Size |
| Married-Couple | 139 (33.9%) | 2.78 |
| Single Male/Father | 2 (0.5%) | 14.50 |
| Single Female/Mother | 269 (65.6%) | 3.56 |
| Total Families | 410 (100.0%) | 3.35 |
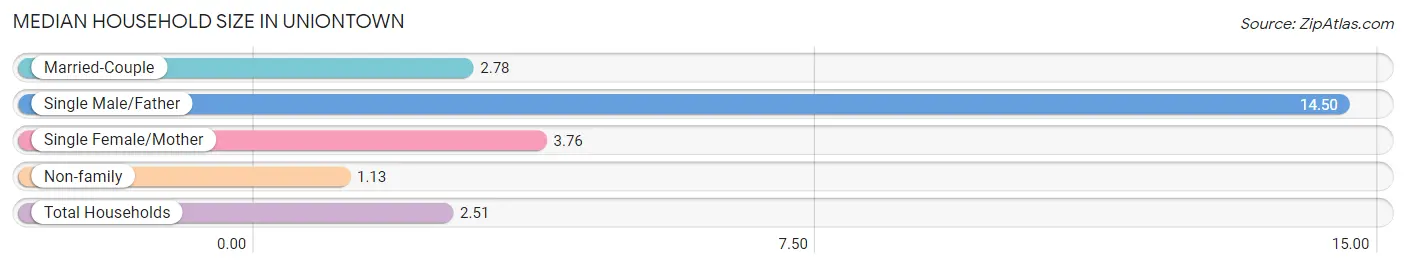
Median Household Size in Uniontown
The median household size in Uniontown is 2.51 persons per household, with single male/father households (2 | 0.3%) accounting for the largest median household size of 14.5 persons per household. non-family households (289 | 41.3%) represent the smallest median household size with 1.13 persons per household.
| Household Type | # Households | Household Size |
| Married-Couple | 139 (19.9%) | 2.78 |
| Single Male/Father | 2 (0.3%) | 14.50 |
| Single Female/Mother | 269 (38.5%) | 3.76 |
| Non-family | 289 (41.3%) | 1.13 |
| Total Households | 699 (100.0%) | 2.51 |
Household Size by Marriage Status in Uniontown
Out of a total of 699 households in Uniontown, 410 (58.7%) are family households, while 289 (41.3%) are nonfamily households. The most numerous type of family households are 2-person households, comprising 193, and the most common type of nonfamily households are 1-person households, comprising 282.
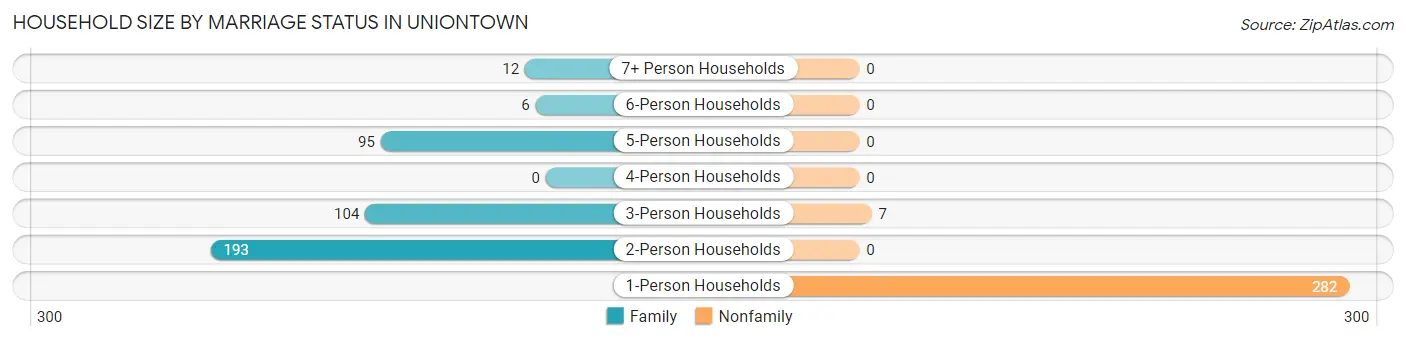
| Household Size | Family Households | Nonfamily Households |
| 1-Person Households | - | 282 (40.3%) |
| 2-Person Households | 193 (27.6%) | 0 (0.0%) |
| 3-Person Households | 104 (14.9%) | 7 (1.0%) |
| 4-Person Households | 0 (0.0%) | 0 (0.0%) |
| 5-Person Households | 95 (13.6%) | 0 (0.0%) |
| 6-Person Households | 6 (0.9%) | 0 (0.0%) |
| 7+ Person Households | 12 (1.7%) | 0 (0.0%) |
| Total | 410 (58.7%) | 289 (41.3%) |
Female Fertility in Uniontown
Fertility by Age in Uniontown
| Age Bracket | Women with Births | Births / 1,000 Women |
| 15 to 19 years | 0 (0.0%) | 0.0 |
| 20 to 34 years | 0 (0.0%) | 0.0 |
| 35 to 50 years | 0 (0.0%) | 0.0 |
| Total | 0 (0.0%) | 0.0 |
Fertility by Age by Marriage Status in Uniontown
| Age Bracket | Married | Unmarried |
| 15 to 19 years | 0 (0.0%) | 0 (0.0%) |
| 20 to 34 years | 0 (0.0%) | 0 (0.0%) |
| 35 to 50 years | 0 (0.0%) | 0 (0.0%) |
| Total | 0 (0.0%) | 0 (0.0%) |
Fertility by Education in Uniontown
| Educational Attainment | Women with Births | Births / 1,000 Women |
| Less than High School | 0 (0.0%) | 0.0 |
| High School Diploma | 0 (0.0%) | 0.0 |
| College or Associate's Degree | 0 (0.0%) | 0.0 |
| Bachelor's Degree | 0 (0.0%) | 0.0 |
| Graduate Degree | 0 (0.0%) | 0.0 |
| Total | 0 (0.0%) | 0.0 |
Fertility by Education by Marriage Status in Uniontown
| Educational Attainment | Married | Unmarried |
| Less than High School | 0 (0.0%) | 0 (0.0%) |
| High School Diploma | 0 (0.0%) | 0 (0.0%) |
| College or Associate's Degree | 0 (0.0%) | 0 (0.0%) |
| Bachelor's Degree | 0 (0.0%) | 0 (0.0%) |
| Graduate Degree | 0 (0.0%) | 0 (0.0%) |
| Total | 0 (0.0%) | 0 (0.0%) |
Employment Characteristics in Uniontown
Employment by Class of Employer in Uniontown
Among the 445 employed individuals in Uniontown, private company employees (346 | 77.7%), self-employed (not incorporated) (50 | 11.2%), and local government employees (25 | 5.6%) make up the most common classes of employment.
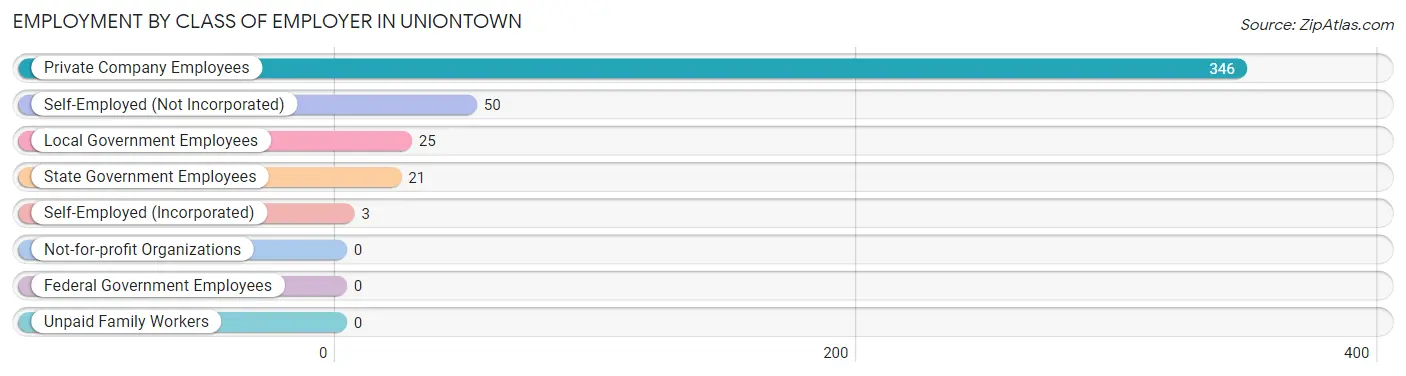
| Employer Class | # Employees | % Employees |
| Private Company Employees | 346 | 77.7% |
| Self-Employed (Incorporated) | 3 | 0.7% |
| Self-Employed (Not Incorporated) | 50 | 11.2% |
| Not-for-profit Organizations | 0 | 0.0% |
| Local Government Employees | 25 | 5.6% |
| State Government Employees | 21 | 4.7% |
| Federal Government Employees | 0 | 0.0% |
| Unpaid Family Workers | 0 | 0.0% |
| Total | 445 | 100.0% |
Employment Status by Age in Uniontown
According to the labor force statistics for Uniontown, out of the total population over 16 years of age (1,355), 41.5% or 562 individuals are in the labor force, with 21.0% or 118 of them unemployed. The age group with the highest labor force participation rate is 16 to 19 years, with 72.9% or 86 individuals in the labor force. Within the labor force, the 16 to 19 years age range has the highest percentage of unemployed individuals, with 100.0% or 86 of them being unemployed.
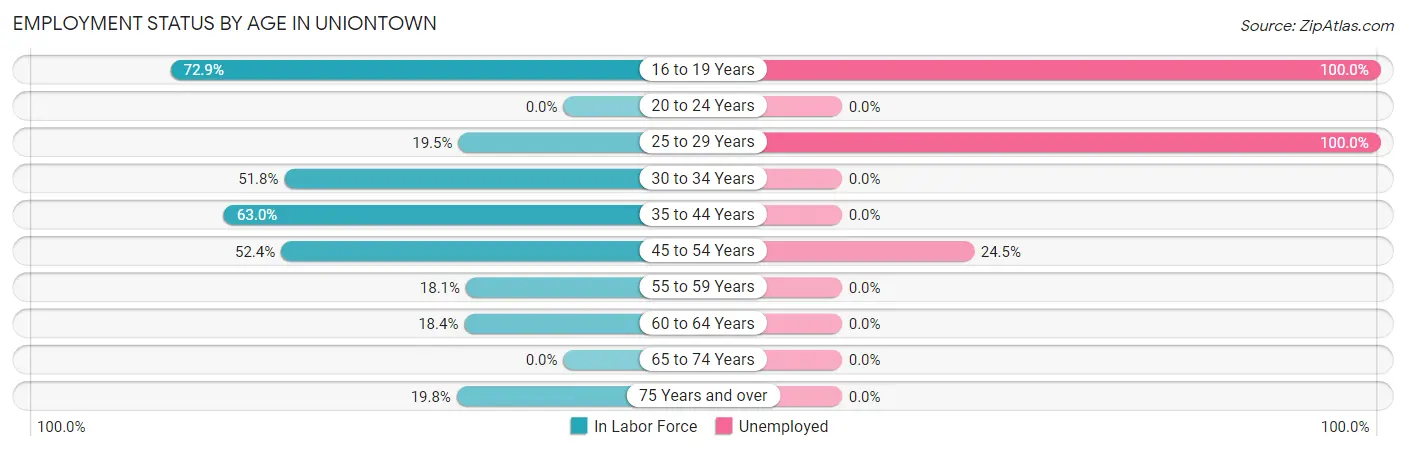
| Age Bracket | In Labor Force | Unemployed |
| 16 to 19 Years | 86 (72.9%) | 86 (100.0%) |
| 20 to 24 Years | 0 (0.0%) | 0 (0.0%) |
| 25 to 29 Years | 8 (19.5%) | 8 (100.0%) |
| 30 to 34 Years | 57 (51.8%) | 0 (0.0%) |
| 35 to 44 Years | 243 (63.0%) | 0 (0.0%) |
| 45 to 54 Years | 98 (52.4%) | 24 (24.5%) |
| 55 to 59 Years | 21 (18.1%) | 0 (0.0%) |
| 60 to 64 Years | 26 (18.4%) | 0 (0.0%) |
| 65 to 74 Years | 0 (0.0%) | 0 (0.0%) |
| 75 Years and over | 24 (19.8%) | 0 (0.0%) |
| Total | 562 (41.5%) | 118 (21.0%) |
Employment Status by Educational Attainment in Uniontown
According to labor force statistics for Uniontown, 46.2% of individuals (453) out of the total population between 25 and 64 years of age (981) are in the labor force, with 7.1% or 32 of them being unemployed. The group with the highest labor force participation rate are those with the educational attainment of bachelor's degree or higher, with 66.2% or 47 individuals in the labor force. Within the labor force, individuals with high school diploma education have the highest percentage of unemployment, with 10.1% or 32 of them being unemployed.
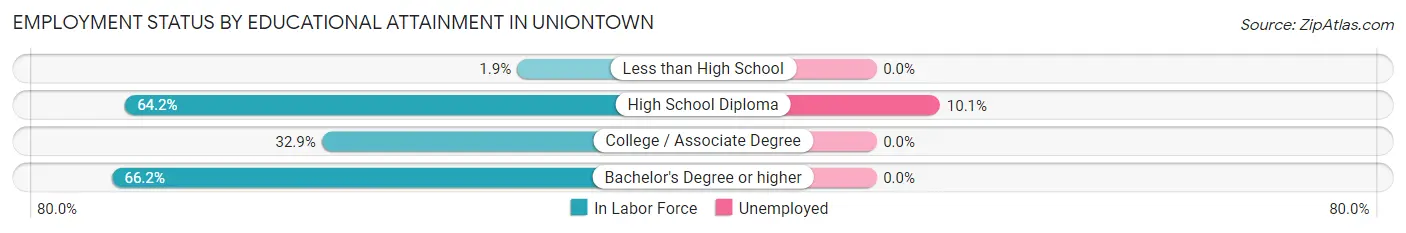
| Educational Attainment | In Labor Force | Unemployed |
| Less than High School | 3 (1.9%) | 0 (0.0%) |
| High School Diploma | 318 (64.2%) | 50 (10.1%) |
| College / Associate Degree | 85 (32.9%) | 0 (0.0%) |
| Bachelor's Degree or higher | 47 (66.2%) | 0 (0.0%) |
| Total | 453 (46.2%) | 70 (7.1%) |
Employment Occupations by Sex in Uniontown
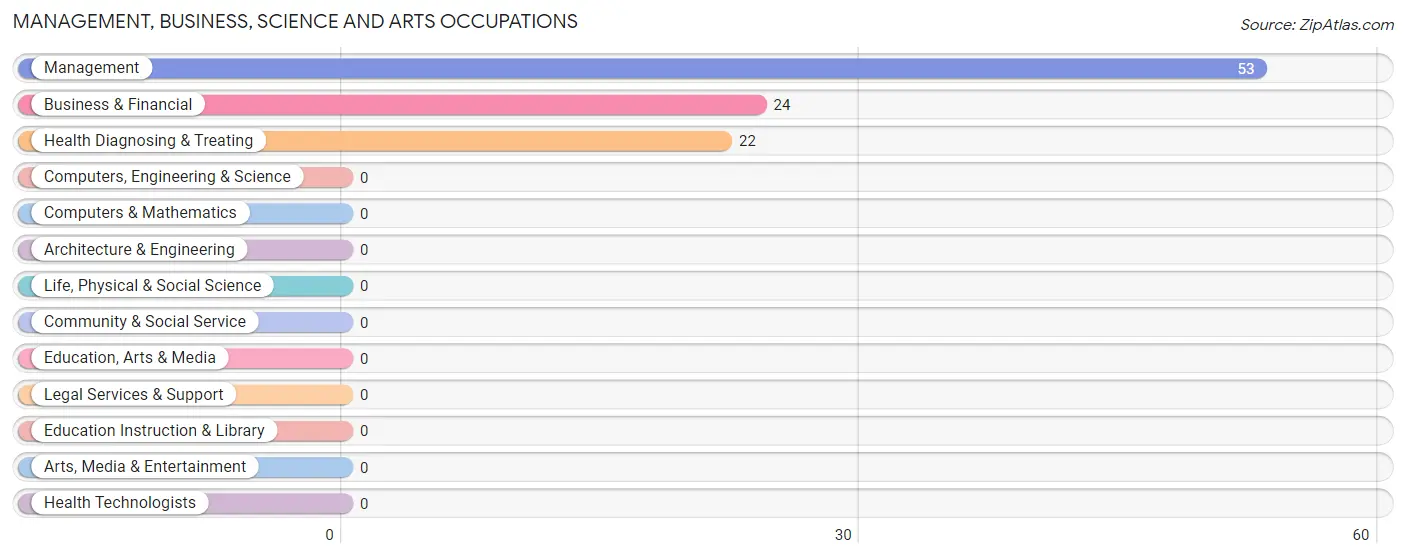
Management, Business, Science and Arts Occupations
The most common Management, Business, Science and Arts occupations in Uniontown are Management (53 | 11.9%), Business & Financial (24 | 5.4%), and Health Diagnosing & Treating (22 | 4.9%).
Management, Business, Science and Arts Occupations by Sex
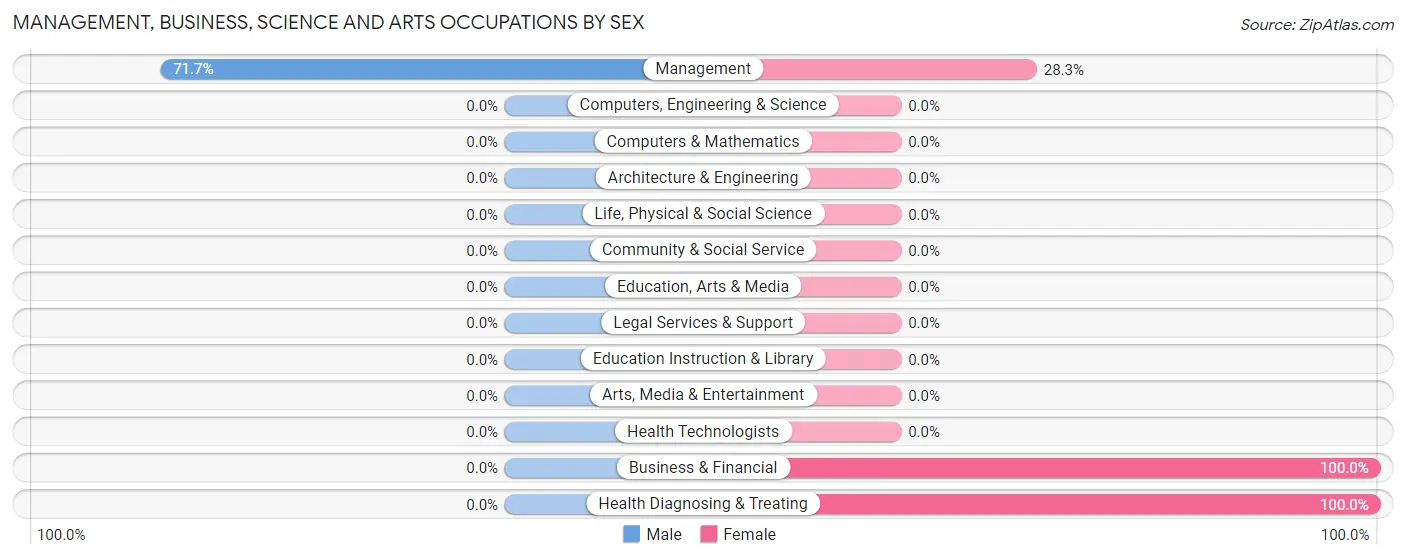
| Occupation | Male | Female |
| Management | 38 (71.7%) | 15 (28.3%) |
| Business & Financial | 0 (0.0%) | 24 (100.0%) |
| Computers, Engineering & Science | 0 (0.0%) | 0 (0.0%) |
| Computers & Mathematics | 0 (0.0%) | 0 (0.0%) |
| Architecture & Engineering | 0 (0.0%) | 0 (0.0%) |
| Life, Physical & Social Science | 0 (0.0%) | 0 (0.0%) |
| Community & Social Service | 0 (0.0%) | 0 (0.0%) |
| Education, Arts & Media | 0 (0.0%) | 0 (0.0%) |
| Legal Services & Support | 0 (0.0%) | 0 (0.0%) |
| Education Instruction & Library | 0 (0.0%) | 0 (0.0%) |
| Arts, Media & Entertainment | 0 (0.0%) | 0 (0.0%) |
| Health Diagnosing & Treating | 0 (0.0%) | 22 (100.0%) |
| Health Technologists | 0 (0.0%) | 0 (0.0%) |
| Total (Category) | 38 (38.4%) | 61 (61.6%) |
| Total (Overall) | 309 (69.4%) | 136 (30.6%) |
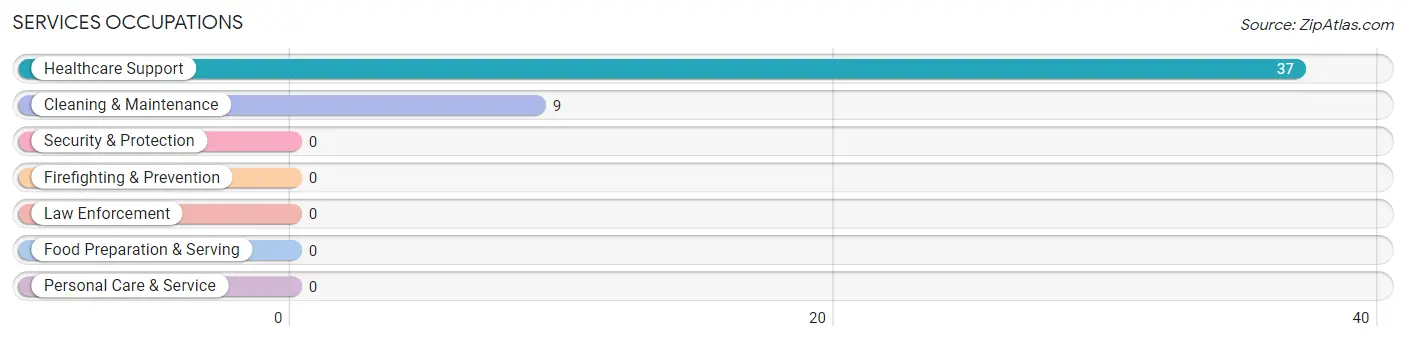
Services Occupations
The most common Services occupations in Uniontown are Healthcare Support (37 | 8.3%), and Cleaning & Maintenance (9 | 2.0%).
Services Occupations by Sex
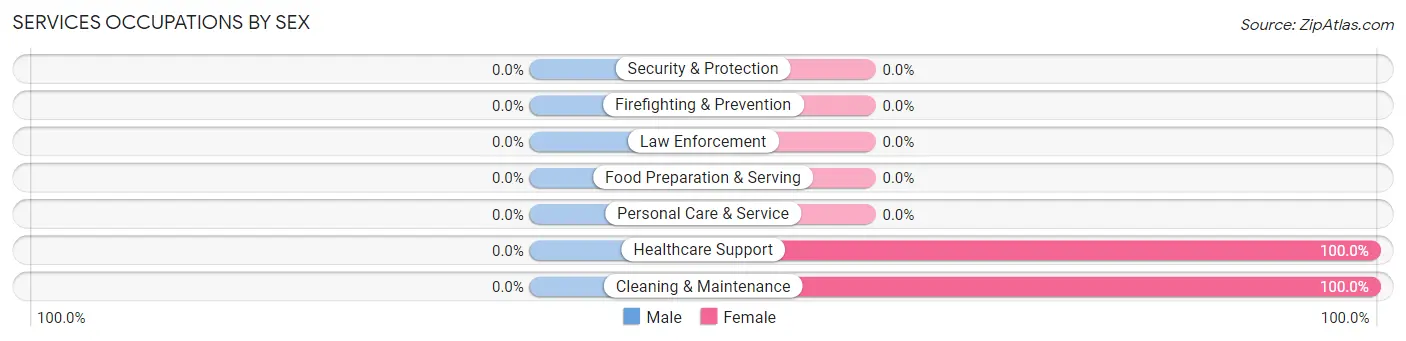
| Occupation | Male | Female |
| Healthcare Support | 0 (0.0%) | 37 (100.0%) |
| Security & Protection | 0 (0.0%) | 0 (0.0%) |
| Firefighting & Prevention | 0 (0.0%) | 0 (0.0%) |
| Law Enforcement | 0 (0.0%) | 0 (0.0%) |
| Food Preparation & Serving | 0 (0.0%) | 0 (0.0%) |
| Cleaning & Maintenance | 0 (0.0%) | 9 (100.0%) |
| Personal Care & Service | 0 (0.0%) | 0 (0.0%) |
| Total (Category) | 0 (0.0%) | 46 (100.0%) |
| Total (Overall) | 309 (69.4%) | 136 (30.6%) |
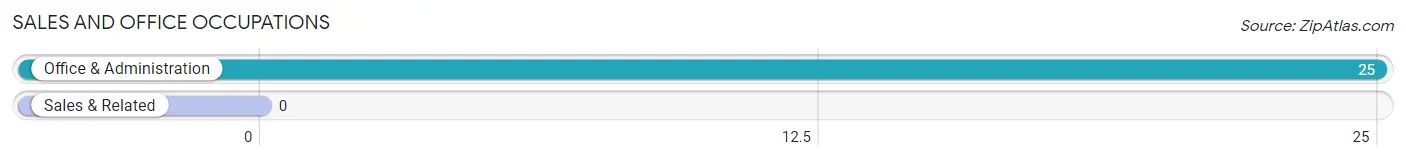
Sales and Office Occupations
The most common Sales and Office occupations in Uniontown are , and Office & Administration (25 | 5.6%).
Sales and Office Occupations by Sex
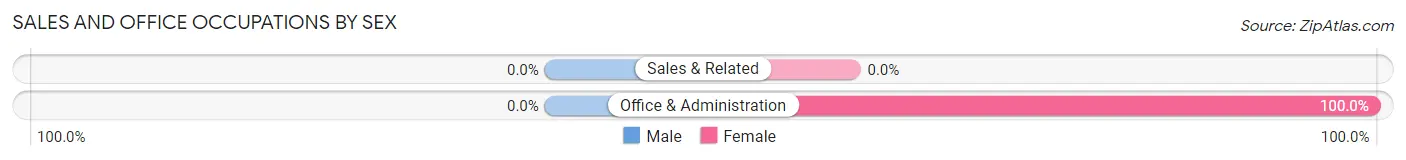
| Occupation | Male | Female |
| Sales & Related | 0 (0.0%) | 0 (0.0%) |
| Office & Administration | 0 (0.0%) | 25 (100.0%) |
| Total (Category) | 0 (0.0%) | 25 (100.0%) |
| Total (Overall) | 309 (69.4%) | 136 (30.6%) |
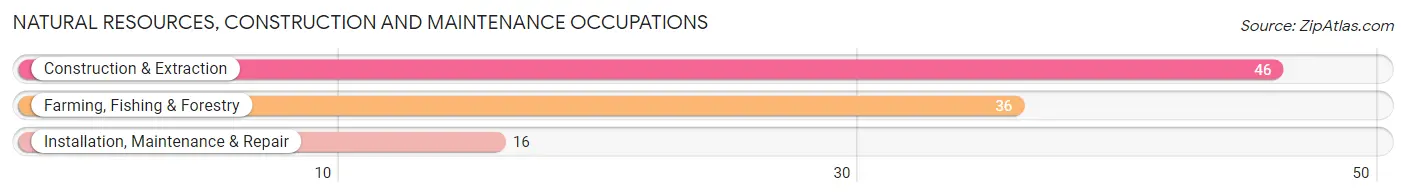
Natural Resources, Construction and Maintenance Occupations
The most common Natural Resources, Construction and Maintenance occupations in Uniontown are Construction & Extraction (46 | 10.3%), Farming, Fishing & Forestry (36 | 8.1%), and Installation, Maintenance & Repair (16 | 3.6%).
Natural Resources, Construction and Maintenance Occupations by Sex
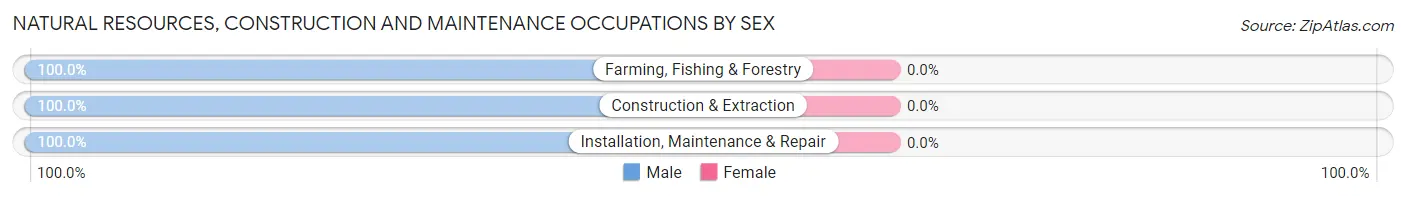
| Occupation | Male | Female |
| Farming, Fishing & Forestry | 36 (100.0%) | 0 (0.0%) |
| Construction & Extraction | 46 (100.0%) | 0 (0.0%) |
| Installation, Maintenance & Repair | 16 (100.0%) | 0 (0.0%) |
| Total (Category) | 98 (100.0%) | 0 (0.0%) |
| Total (Overall) | 309 (69.4%) | 136 (30.6%) |
Production, Transportation and Moving Occupations
The most common Production, Transportation and Moving occupations in Uniontown are Production (144 | 32.4%), and Transportation (33 | 7.4%).
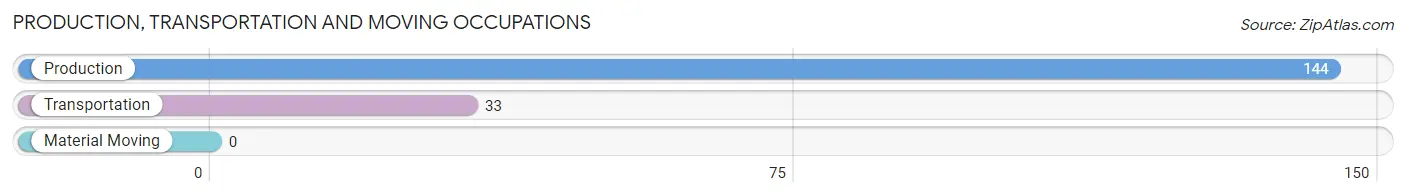
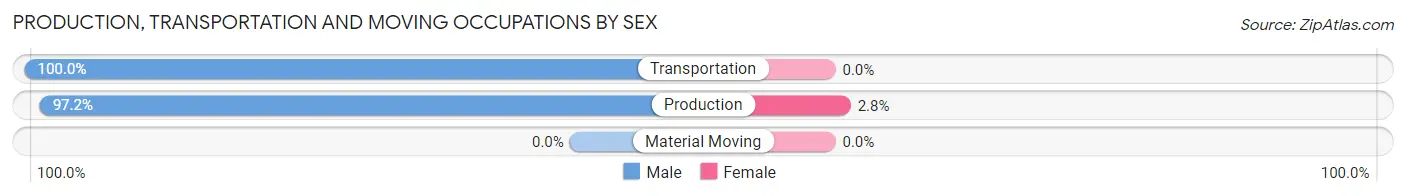
Production, Transportation and Moving Occupations by Sex
| Occupation | Male | Female |
| Production | 140 (97.2%) | 4 (2.8%) |
| Transportation | 33 (100.0%) | 0 (0.0%) |
| Material Moving | 0 (0.0%) | 0 (0.0%) |
| Total (Category) | 173 (97.7%) | 4 (2.3%) |
| Total (Overall) | 309 (69.4%) | 136 (30.6%) |
Employment Industries by Sex in Uniontown
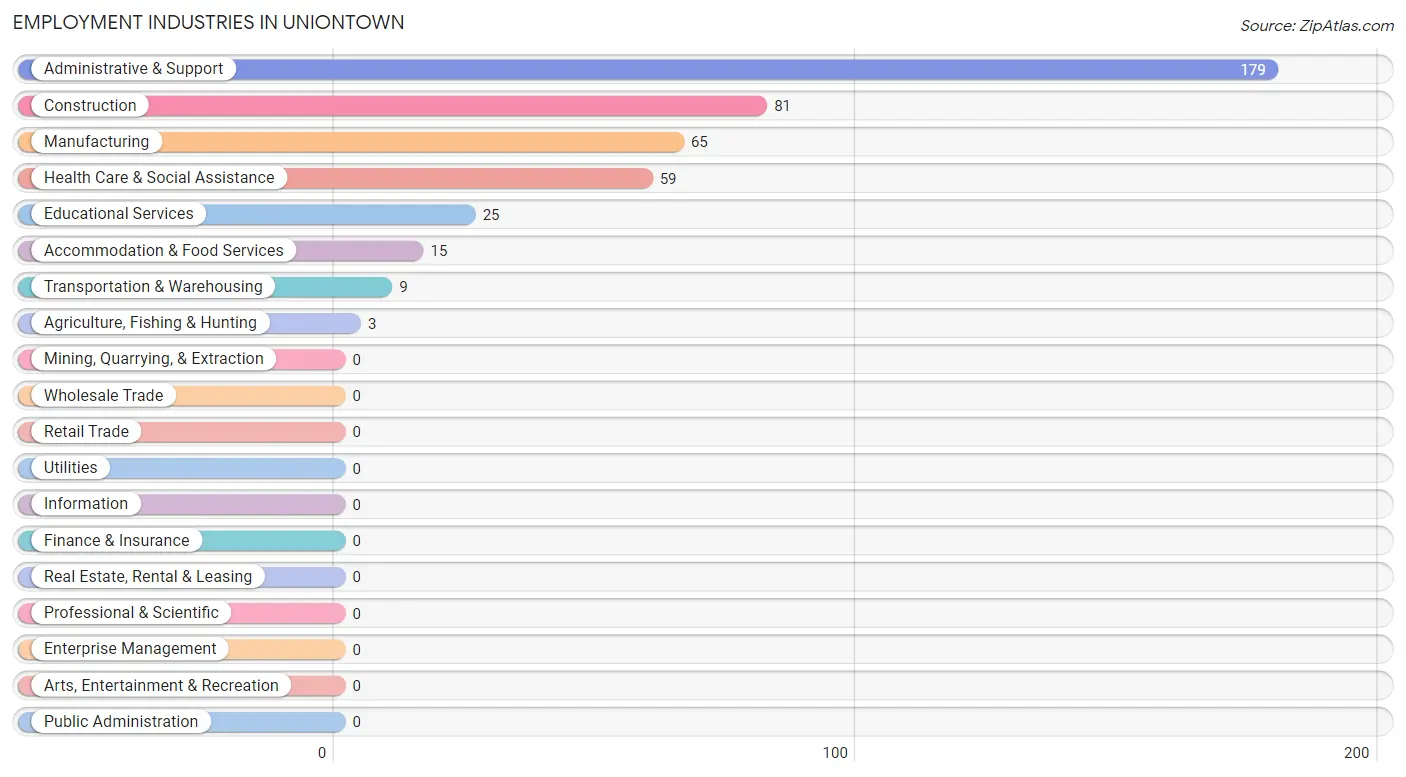
Employment Industries in Uniontown
The major employment industries in Uniontown include Administrative & Support (179 | 40.2%), Construction (81 | 18.2%), Manufacturing (65 | 14.6%), Health Care & Social Assistance (59 | 13.3%), and Educational Services (25 | 5.6%).
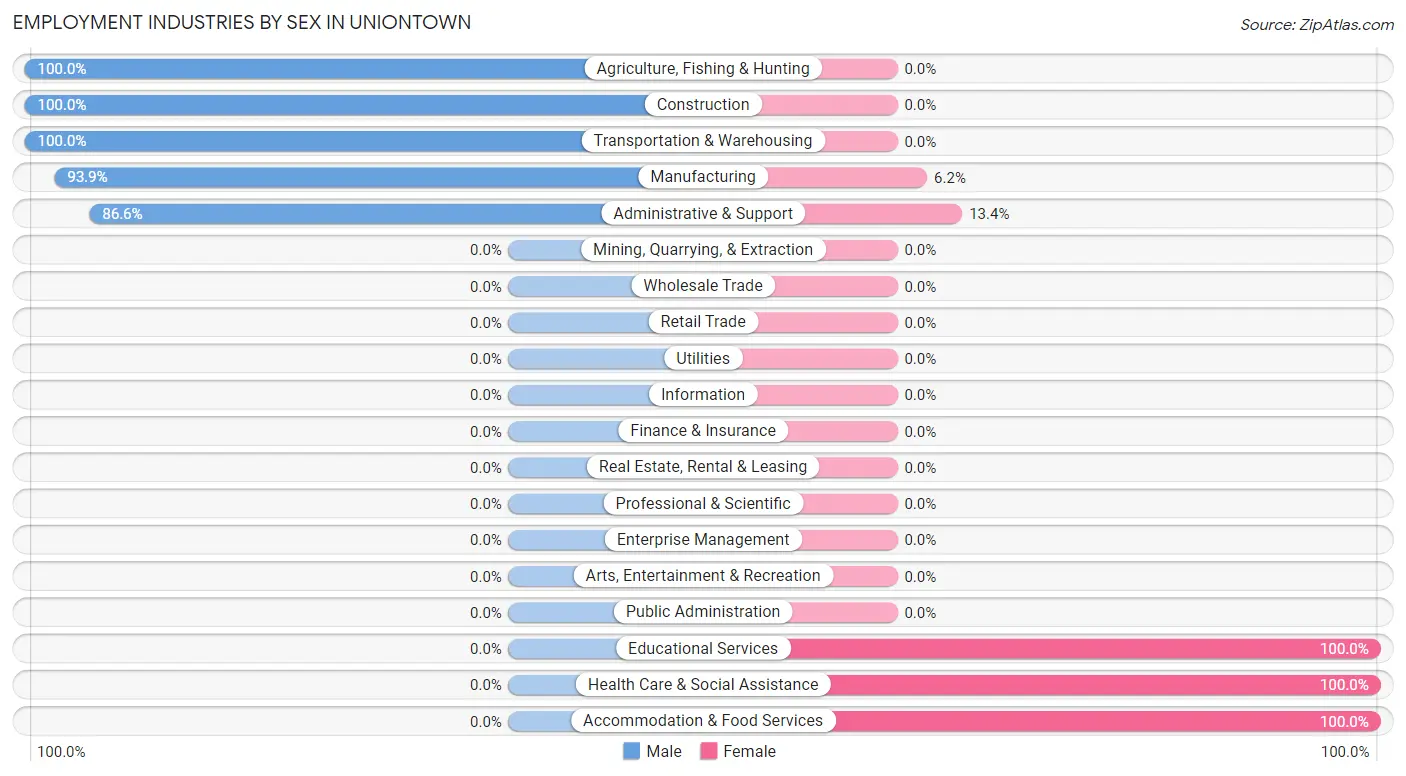
Employment Industries by Sex in Uniontown
The Uniontown industries that see more men than women are Agriculture, Fishing & Hunting (100.0%), Construction (100.0%), and Transportation & Warehousing (100.0%), whereas the industries that tend to have a higher number of women are Educational Services (100.0%), Health Care & Social Assistance (100.0%), and Accommodation & Food Services (100.0%).
| Industry | Male | Female |
| Agriculture, Fishing & Hunting | 3 (100.0%) | 0 (0.0%) |
| Mining, Quarrying, & Extraction | 0 (0.0%) | 0 (0.0%) |
| Construction | 81 (100.0%) | 0 (0.0%) |
| Manufacturing | 61 (93.9%) | 4 (6.1%) |
| Wholesale Trade | 0 (0.0%) | 0 (0.0%) |
| Retail Trade | 0 (0.0%) | 0 (0.0%) |
| Transportation & Warehousing | 9 (100.0%) | 0 (0.0%) |
| Utilities | 0 (0.0%) | 0 (0.0%) |
| Information | 0 (0.0%) | 0 (0.0%) |
| Finance & Insurance | 0 (0.0%) | 0 (0.0%) |
| Real Estate, Rental & Leasing | 0 (0.0%) | 0 (0.0%) |
| Professional & Scientific | 0 (0.0%) | 0 (0.0%) |
| Enterprise Management | 0 (0.0%) | 0 (0.0%) |
| Administrative & Support | 155 (86.6%) | 24 (13.4%) |
| Educational Services | 0 (0.0%) | 25 (100.0%) |
| Health Care & Social Assistance | 0 (0.0%) | 59 (100.0%) |
| Arts, Entertainment & Recreation | 0 (0.0%) | 0 (0.0%) |
| Accommodation & Food Services | 0 (0.0%) | 15 (100.0%) |
| Public Administration | 0 (0.0%) | 0 (0.0%) |
| Total | 309 (69.4%) | 136 (30.6%) |
Education in Uniontown
School Enrollment in Uniontown
The most common levels of schooling among the 536 students in Uniontown are elementary school (158 | 29.5%), high school (140 | 26.1%), and middle school (139 | 25.9%).
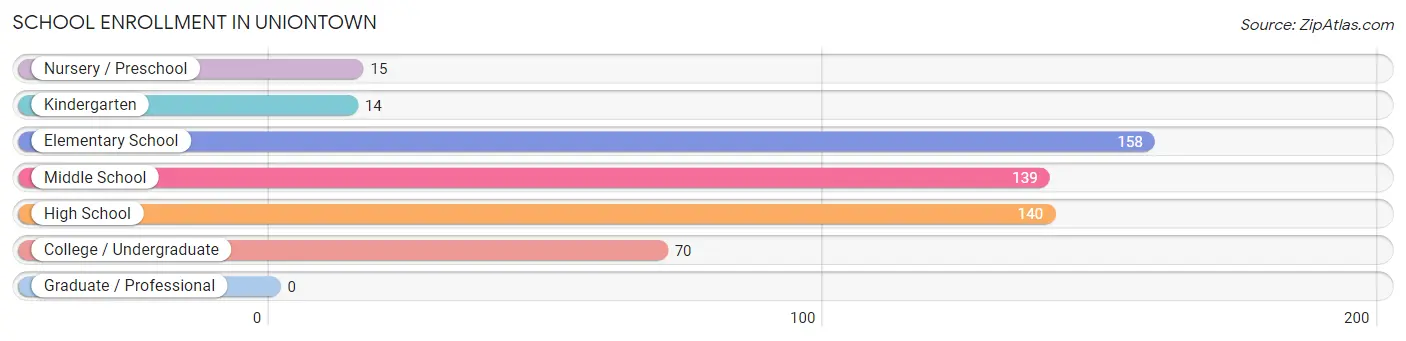
| School Level | # Students | % Students |
| Nursery / Preschool | 15 | 2.8% |
| Kindergarten | 14 | 2.6% |
| Elementary School | 158 | 29.5% |
| Middle School | 139 | 25.9% |
| High School | 140 | 26.1% |
| College / Undergraduate | 70 | 13.1% |
| Graduate / Professional | 0 | 0.0% |
| Total | 536 | 100.0% |
School Enrollment by Age by Funding Source in Uniontown
Out of a total of 536 students who are enrolled in schools in Uniontown, 74 (13.8%) attend a private institution, while the remaining 462 (86.2%) are enrolled in public schools. The age group of 35 years and over has the highest likelihood of being enrolled in private schools, with 53 (100.0% in the age bracket) enrolled. Conversely, the age group of 3 to 4 year olds has the lowest likelihood of being enrolled in a private school, with 29 (100.0% in the age bracket) attending a public institution.
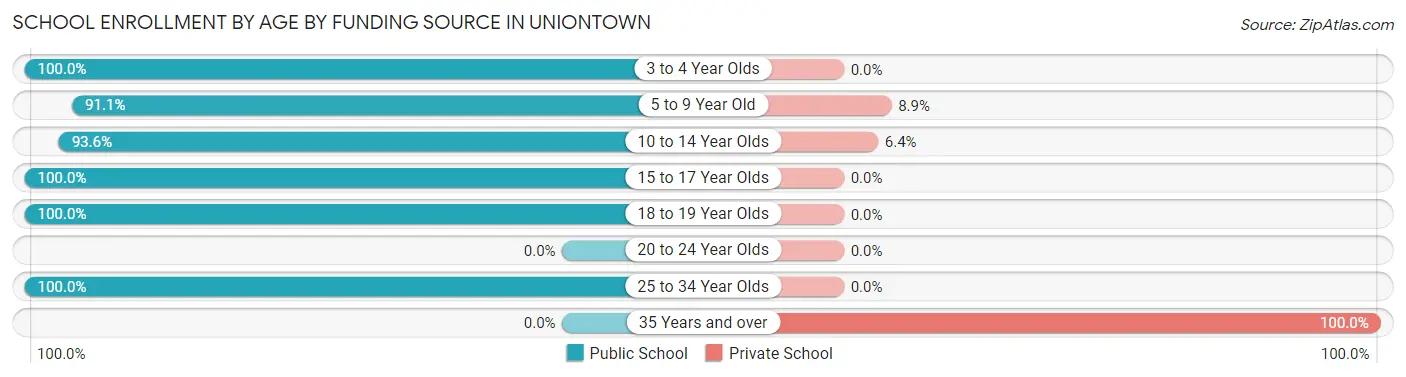
| Age Bracket | Public School | Private School |
| 3 to 4 Year Olds | 29 (100.0%) | 0 (0.0%) |
| 5 to 9 Year Old | 72 (91.1%) | 7 (8.9%) |
| 10 to 14 Year Olds | 206 (93.6%) | 14 (6.4%) |
| 15 to 17 Year Olds | 80 (100.0%) | 0 (0.0%) |
| 18 to 19 Year Olds | 73 (100.0%) | 0 (0.0%) |
| 20 to 24 Year Olds | 0 (0.0%) | 0 (0.0%) |
| 25 to 34 Year Olds | 2 (100.0%) | 0 (0.0%) |
| 35 Years and over | 0 (0.0%) | 53 (100.0%) |
| Total | 462 (86.2%) | 74 (13.8%) |
Educational Attainment by Field of Study in Uniontown
Education (47 | 43.9%), visual & performing arts (25 | 23.4%), computers & mathematics (22 | 20.6%), and social sciences (13 | 12.1%) are the most common fields of study among 107 individuals in Uniontown who have obtained a bachelor's degree or higher.
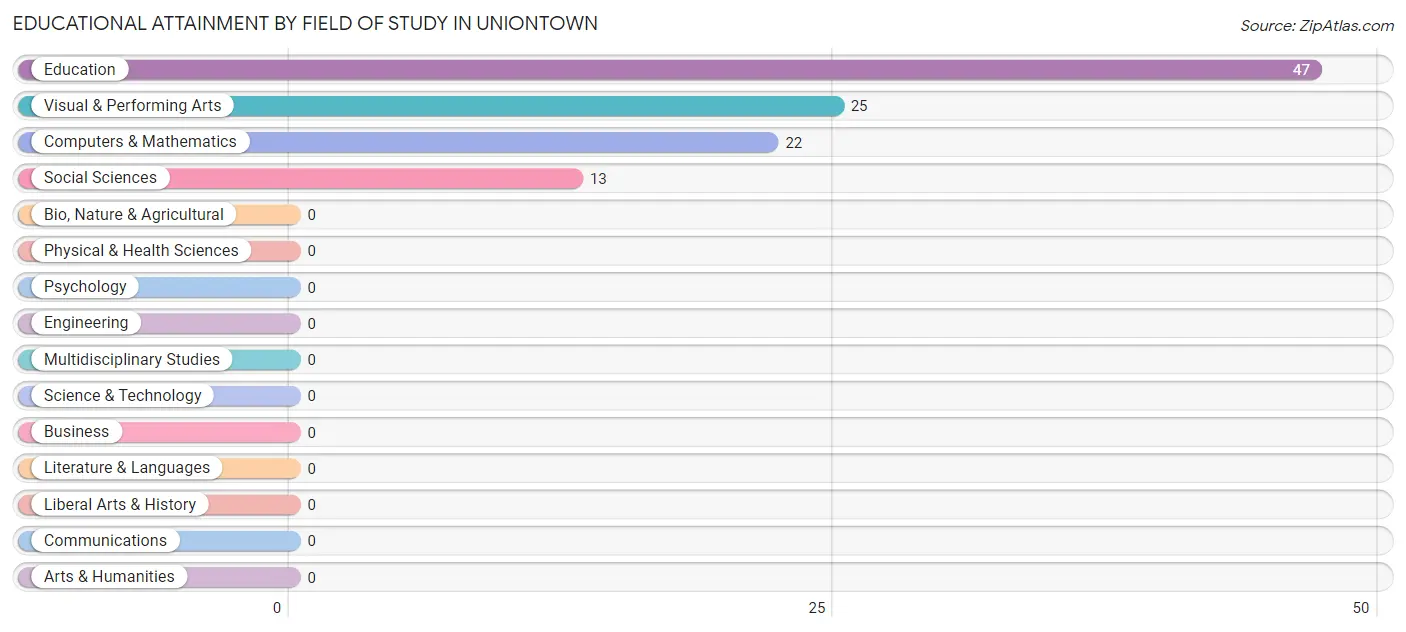
| Field of Study | # Graduates | % Graduates |
| Computers & Mathematics | 22 | 20.6% |
| Bio, Nature & Agricultural | 0 | 0.0% |
| Physical & Health Sciences | 0 | 0.0% |
| Psychology | 0 | 0.0% |
| Social Sciences | 13 | 12.1% |
| Engineering | 0 | 0.0% |
| Multidisciplinary Studies | 0 | 0.0% |
| Science & Technology | 0 | 0.0% |
| Business | 0 | 0.0% |
| Education | 47 | 43.9% |
| Literature & Languages | 0 | 0.0% |
| Liberal Arts & History | 0 | 0.0% |
| Visual & Performing Arts | 25 | 23.4% |
| Communications | 0 | 0.0% |
| Arts & Humanities | 0 | 0.0% |
| Total | 107 | 100.0% |
Transportation & Commute in Uniontown
Vehicle Availability by Sex in Uniontown
The most prevalent vehicle ownership categories in Uniontown are males with 1 vehicle (149, accounting for 48.2%) and females with 1 vehicle (10, making up 109.6%).
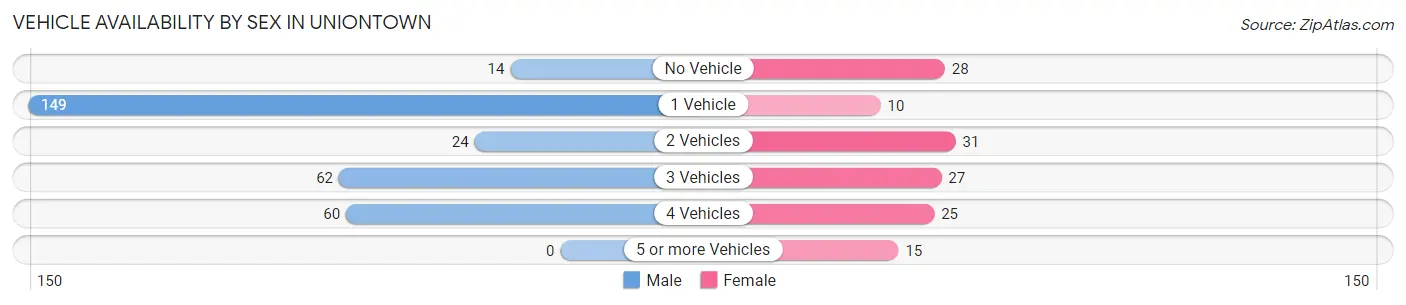
| Vehicles Available | Male | Female |
| No Vehicle | 14 (4.5%) | 28 (20.6%) |
| 1 Vehicle | 149 (48.2%) | 10 (7.3%) |
| 2 Vehicles | 24 (7.8%) | 31 (22.8%) |
| 3 Vehicles | 62 (20.1%) | 27 (19.9%) |
| 4 Vehicles | 60 (19.4%) | 25 (18.4%) |
| 5 or more Vehicles | 0 (0.0%) | 15 (11.0%) |
| Total | 309 (100.0%) | 136 (100.0%) |
Commute Time in Uniontown
The most frequently occuring commute durations in Uniontown are 15 to 19 minutes (155 commuters, 34.8%), less than 5 minutes (59 commuters, 13.3%), and 30 to 34 minutes (46 commuters, 10.3%).
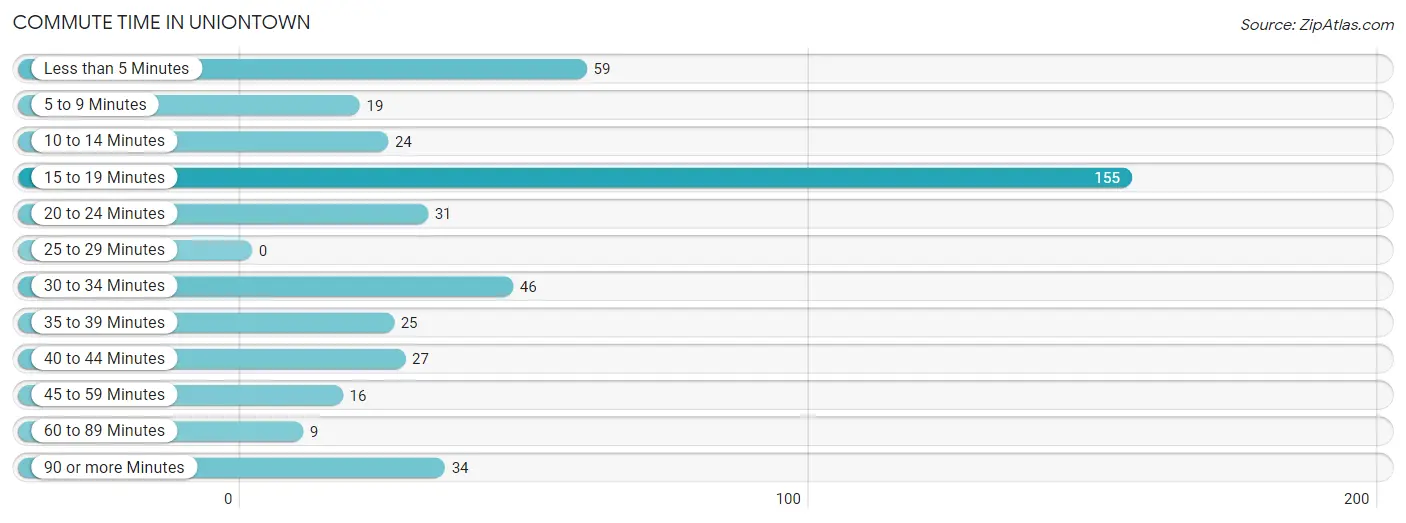
| Commute Time | # Commuters | % Commuters |
| Less than 5 Minutes | 59 | 13.3% |
| 5 to 9 Minutes | 19 | 4.3% |
| 10 to 14 Minutes | 24 | 5.4% |
| 15 to 19 Minutes | 155 | 34.8% |
| 20 to 24 Minutes | 31 | 7.0% |
| 25 to 29 Minutes | 0 | 0.0% |
| 30 to 34 Minutes | 46 | 10.3% |
| 35 to 39 Minutes | 25 | 5.6% |
| 40 to 44 Minutes | 27 | 6.1% |
| 45 to 59 Minutes | 16 | 3.6% |
| 60 to 89 Minutes | 9 | 2.0% |
| 90 or more Minutes | 34 | 7.6% |
Commute Time by Sex in Uniontown
The most common commute times in Uniontown are 15 to 19 minutes (155 commuters, 50.2%) for males and 30 to 34 minutes (46 commuters, 33.8%) for females.
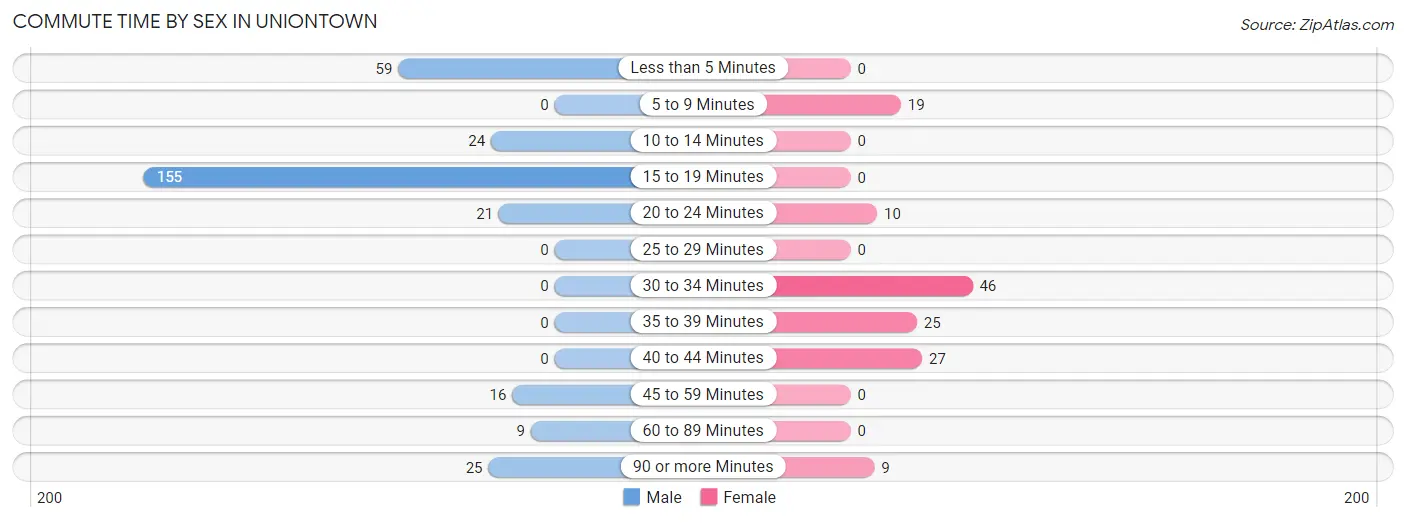
| Commute Time | Male | Female |
| Less than 5 Minutes | 59 (19.1%) | 0 (0.0%) |
| 5 to 9 Minutes | 0 (0.0%) | 19 (14.0%) |
| 10 to 14 Minutes | 24 (7.8%) | 0 (0.0%) |
| 15 to 19 Minutes | 155 (50.2%) | 0 (0.0%) |
| 20 to 24 Minutes | 21 (6.8%) | 10 (7.3%) |
| 25 to 29 Minutes | 0 (0.0%) | 0 (0.0%) |
| 30 to 34 Minutes | 0 (0.0%) | 46 (33.8%) |
| 35 to 39 Minutes | 0 (0.0%) | 25 (18.4%) |
| 40 to 44 Minutes | 0 (0.0%) | 27 (19.9%) |
| 45 to 59 Minutes | 16 (5.2%) | 0 (0.0%) |
| 60 to 89 Minutes | 9 (2.9%) | 0 (0.0%) |
| 90 or more Minutes | 25 (8.1%) | 9 (6.6%) |
Time of Departure to Work by Sex in Uniontown
The most frequent times of departure to work in Uniontown are 8:30 AM to 8:59 AM (119, 38.5%) for males and 7:00 AM to 7:29 AM (73, 53.7%) for females.
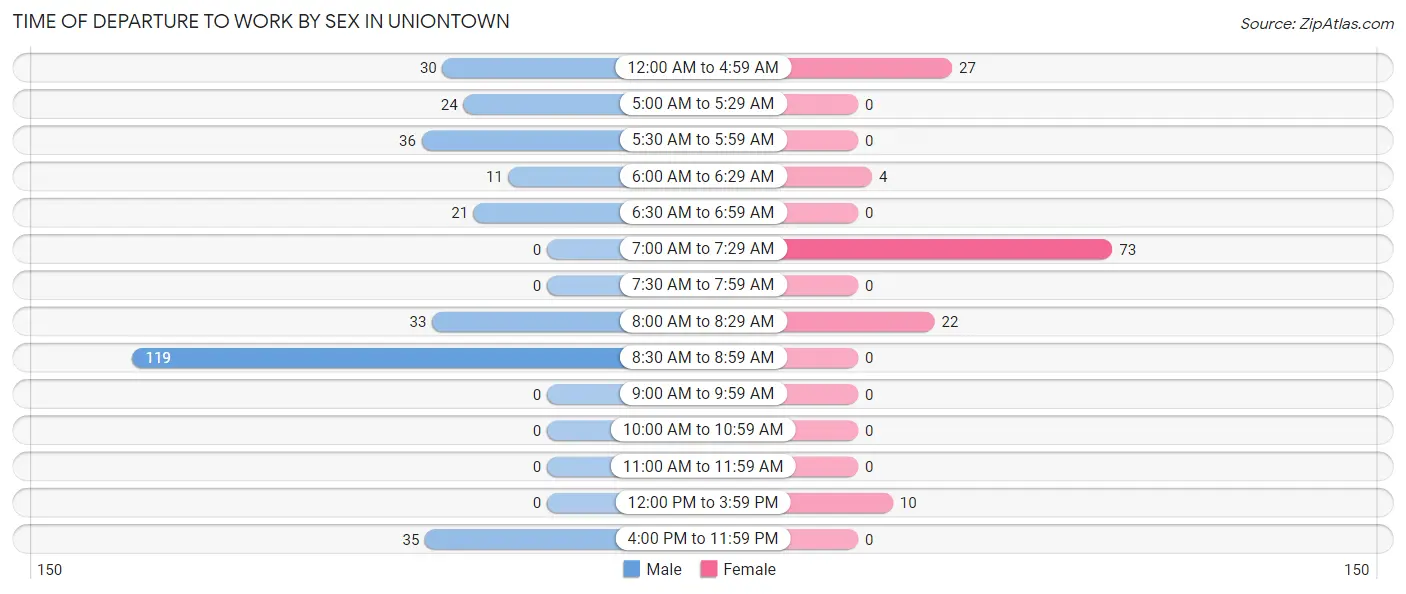
| Time of Departure | Male | Female |
| 12:00 AM to 4:59 AM | 30 (9.7%) | 27 (19.9%) |
| 5:00 AM to 5:29 AM | 24 (7.8%) | 0 (0.0%) |
| 5:30 AM to 5:59 AM | 36 (11.7%) | 0 (0.0%) |
| 6:00 AM to 6:29 AM | 11 (3.6%) | 4 (2.9%) |
| 6:30 AM to 6:59 AM | 21 (6.8%) | 0 (0.0%) |
| 7:00 AM to 7:29 AM | 0 (0.0%) | 73 (53.7%) |
| 7:30 AM to 7:59 AM | 0 (0.0%) | 0 (0.0%) |
| 8:00 AM to 8:29 AM | 33 (10.7%) | 22 (16.2%) |
| 8:30 AM to 8:59 AM | 119 (38.5%) | 0 (0.0%) |
| 9:00 AM to 9:59 AM | 0 (0.0%) | 0 (0.0%) |
| 10:00 AM to 10:59 AM | 0 (0.0%) | 0 (0.0%) |
| 11:00 AM to 11:59 AM | 0 (0.0%) | 0 (0.0%) |
| 12:00 PM to 3:59 PM | 0 (0.0%) | 10 (7.3%) |
| 4:00 PM to 11:59 PM | 35 (11.3%) | 0 (0.0%) |
| Total | 309 (100.0%) | 136 (100.0%) |
Housing Occupancy in Uniontown
Occupancy by Ownership in Uniontown
Of the total 699 dwellings in Uniontown, owner-occupied units account for 395 (56.5%), while renter-occupied units make up 304 (43.5%).
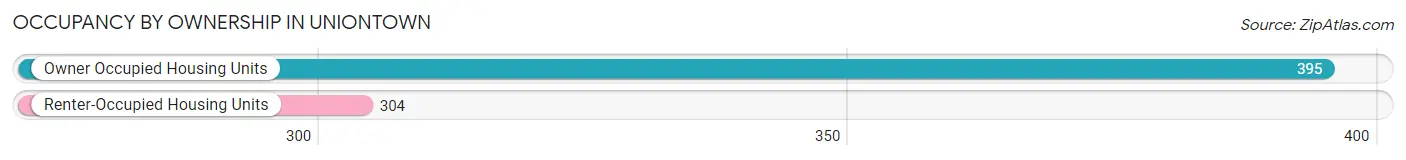
| Occupancy | # Housing Units | % Housing Units |
| Owner Occupied Housing Units | 395 | 56.5% |
| Renter-Occupied Housing Units | 304 | 43.5% |
| Total Occupied Housing Units | 699 | 100.0% |
Occupancy by Household Size in Uniontown
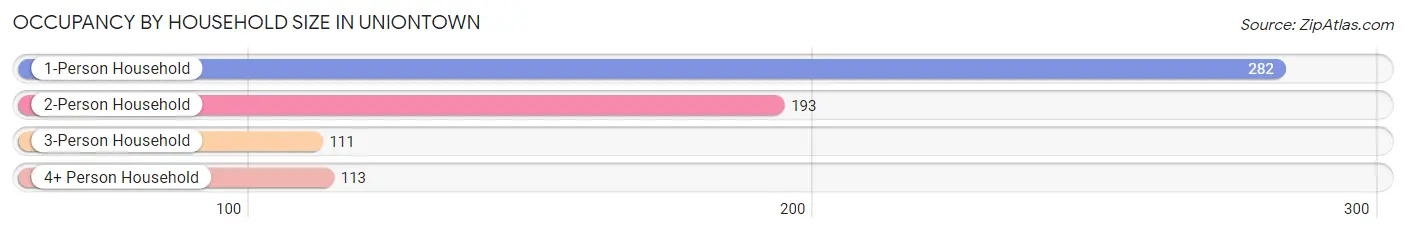
| Household Size | # Housing Units | % Housing Units |
| 1-Person Household | 282 | 40.3% |
| 2-Person Household | 193 | 27.6% |
| 3-Person Household | 111 | 15.9% |
| 4+ Person Household | 113 | 16.2% |
| Total Housing Units | 699 | 100.0% |
Occupancy by Ownership by Household Size in Uniontown
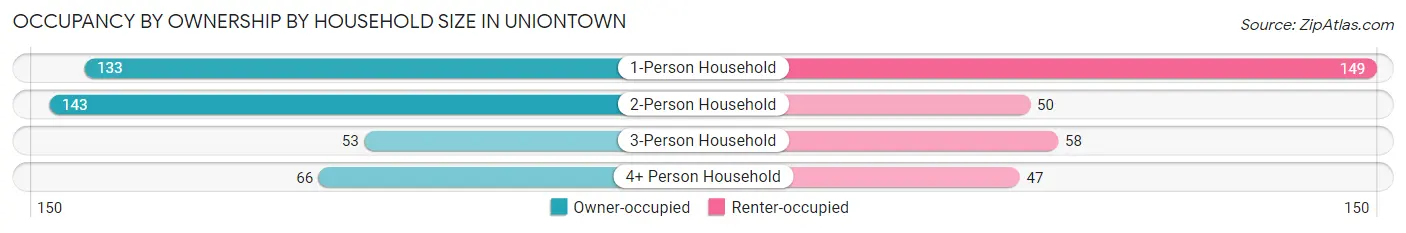
| Household Size | Owner-occupied | Renter-occupied |
| 1-Person Household | 133 (47.2%) | 149 (52.8%) |
| 2-Person Household | 143 (74.1%) | 50 (25.9%) |
| 3-Person Household | 53 (47.7%) | 58 (52.2%) |
| 4+ Person Household | 66 (58.4%) | 47 (41.6%) |
| Total Housing Units | 395 (56.5%) | 304 (43.5%) |
Occupancy by Educational Attainment in Uniontown
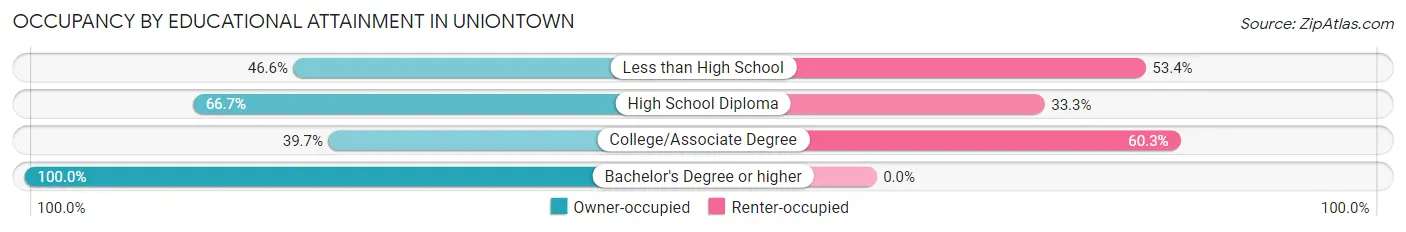
| Household Size | Owner-occupied | Renter-occupied |
| Less than High School | 62 (46.6%) | 71 (53.4%) |
| High School Diploma | 156 (66.7%) | 78 (33.3%) |
| College/Associate Degree | 102 (39.7%) | 155 (60.3%) |
| Bachelor's Degree or higher | 75 (100.0%) | 0 (0.0%) |
Occupancy by Age of Householder in Uniontown
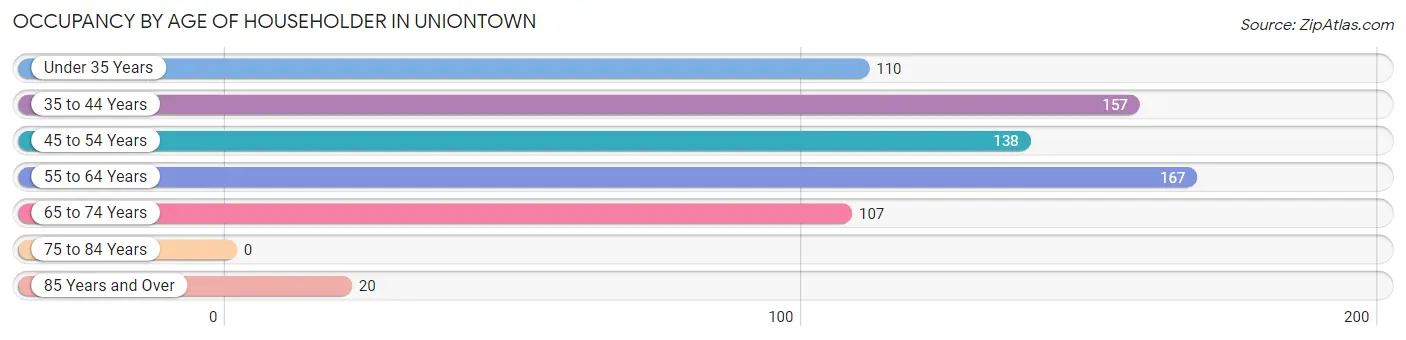
| Age Bracket | # Households | % Households |
| Under 35 Years | 110 | 15.7% |
| 35 to 44 Years | 157 | 22.5% |
| 45 to 54 Years | 138 | 19.7% |
| 55 to 64 Years | 167 | 23.9% |
| 65 to 74 Years | 107 | 15.3% |
| 75 to 84 Years | 0 | 0.0% |
| 85 Years and Over | 20 | 2.9% |
| Total | 699 | 100.0% |
Housing Finances in Uniontown
Median Income by Occupancy in Uniontown
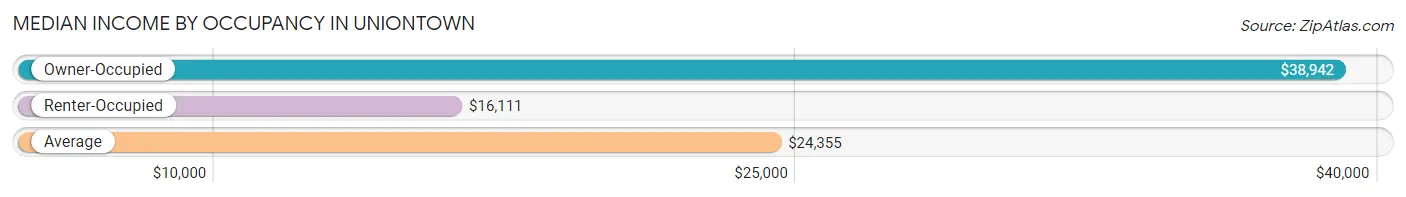
| Occupancy Type | # Households | Median Income |
| Owner-Occupied | 395 (56.5%) | $38,942 |
| Renter-Occupied | 304 (43.5%) | $16,111 |
| Average | 699 (100.0%) | $24,355 |
Occupancy by Householder Income Bracket in Uniontown
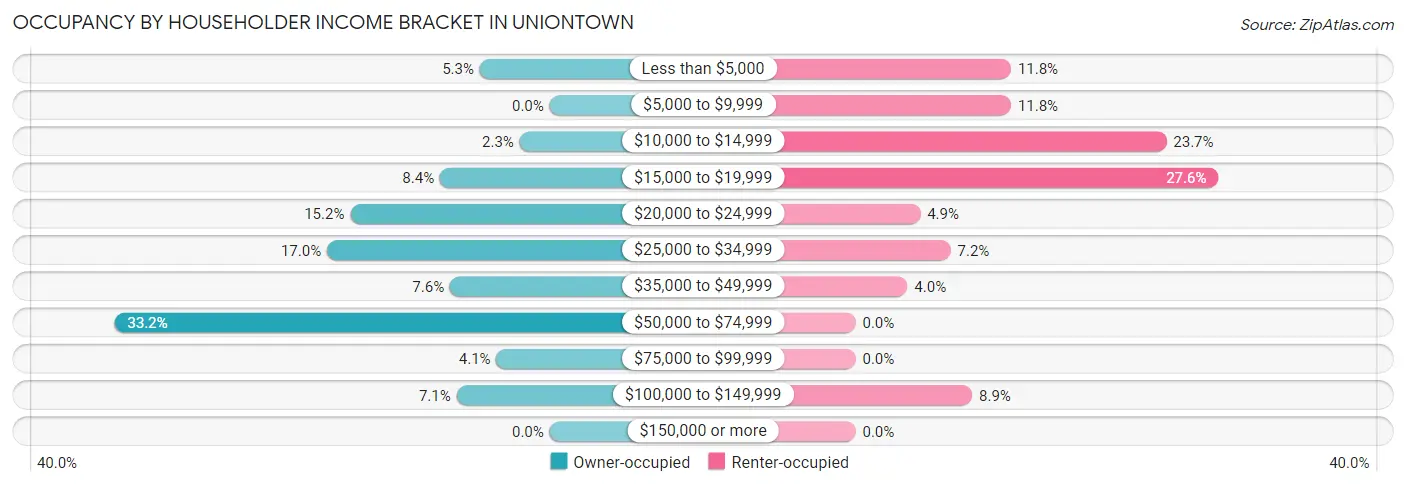
| Income Bracket | Owner-occupied | Renter-occupied |
| Less than $5,000 | 21 (5.3%) | 36 (11.8%) |
| $5,000 to $9,999 | 0 (0.0%) | 36 (11.8%) |
| $10,000 to $14,999 | 9 (2.3%) | 72 (23.7%) |
| $15,000 to $19,999 | 33 (8.4%) | 84 (27.6%) |
| $20,000 to $24,999 | 60 (15.2%) | 15 (4.9%) |
| $25,000 to $34,999 | 67 (17.0%) | 22 (7.2%) |
| $35,000 to $49,999 | 30 (7.6%) | 12 (4.0%) |
| $50,000 to $74,999 | 131 (33.2%) | 0 (0.0%) |
| $75,000 to $99,999 | 16 (4.1%) | 0 (0.0%) |
| $100,000 to $149,999 | 28 (7.1%) | 27 (8.9%) |
| $150,000 or more | 0 (0.0%) | 0 (0.0%) |
| Total | 395 (100.0%) | 304 (100.0%) |
Monthly Housing Cost Tiers in Uniontown
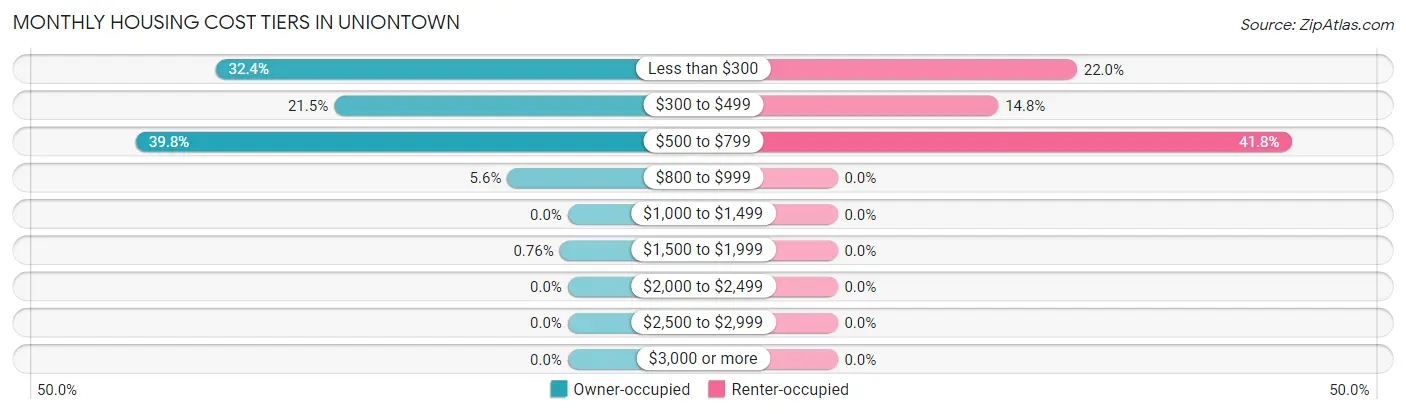
| Monthly Cost | Owner-occupied | Renter-occupied |
| Less than $300 | 128 (32.4%) | 67 (22.0%) |
| $300 to $499 | 85 (21.5%) | 45 (14.8%) |
| $500 to $799 | 157 (39.8%) | 127 (41.8%) |
| $800 to $999 | 22 (5.6%) | 0 (0.0%) |
| $1,000 to $1,499 | 0 (0.0%) | 0 (0.0%) |
| $1,500 to $1,999 | 3 (0.8%) | 0 (0.0%) |
| $2,000 to $2,499 | 0 (0.0%) | 0 (0.0%) |
| $2,500 to $2,999 | 0 (0.0%) | 0 (0.0%) |
| $3,000 or more | 0 (0.0%) | 0 (0.0%) |
| Total | 395 (100.0%) | 304 (100.0%) |
Physical Housing Characteristics in Uniontown
Housing Structures in Uniontown
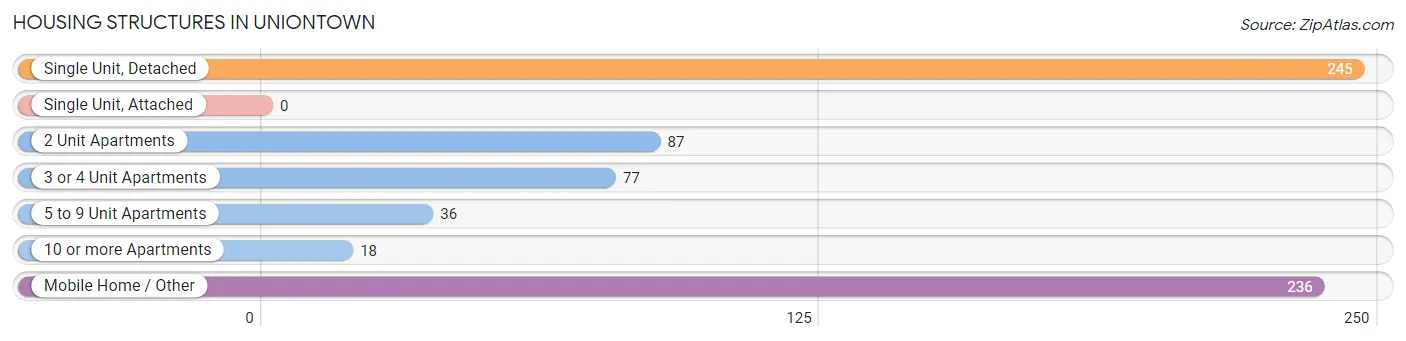
| Structure Type | # Housing Units | % Housing Units |
| Single Unit, Detached | 245 | 35.0% |
| Single Unit, Attached | 0 | 0.0% |
| 2 Unit Apartments | 87 | 12.4% |
| 3 or 4 Unit Apartments | 77 | 11.0% |
| 5 to 9 Unit Apartments | 36 | 5.1% |
| 10 or more Apartments | 18 | 2.6% |
| Mobile Home / Other | 236 | 33.8% |
| Total | 699 | 100.0% |
Housing Structures by Occupancy in Uniontown
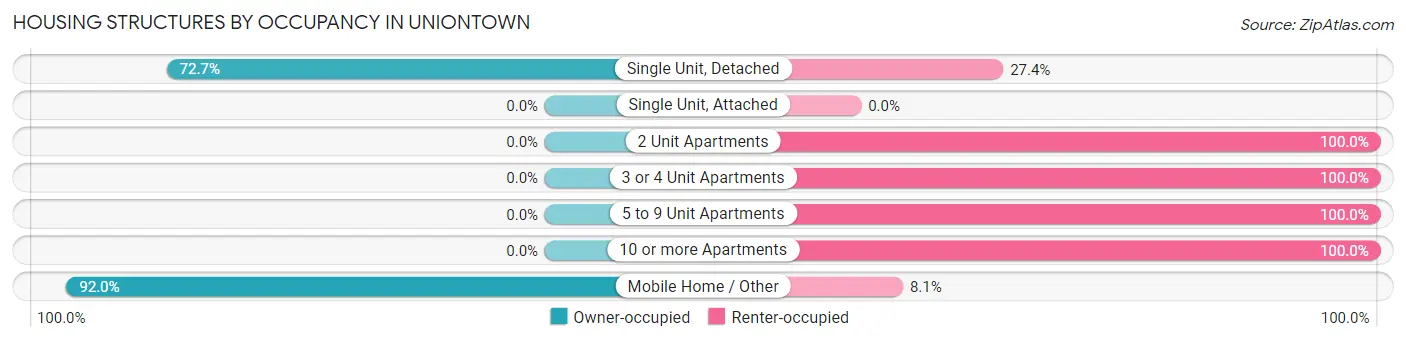
| Structure Type | Owner-occupied | Renter-occupied |
| Single Unit, Detached | 178 (72.7%) | 67 (27.4%) |
| Single Unit, Attached | 0 (0.0%) | 0 (0.0%) |
| 2 Unit Apartments | 0 (0.0%) | 87 (100.0%) |
| 3 or 4 Unit Apartments | 0 (0.0%) | 77 (100.0%) |
| 5 to 9 Unit Apartments | 0 (0.0%) | 36 (100.0%) |
| 10 or more Apartments | 0 (0.0%) | 18 (100.0%) |
| Mobile Home / Other | 217 (91.9%) | 19 (8.1%) |
| Total | 395 (56.5%) | 304 (43.5%) |
Housing Structures by Number of Rooms in Uniontown
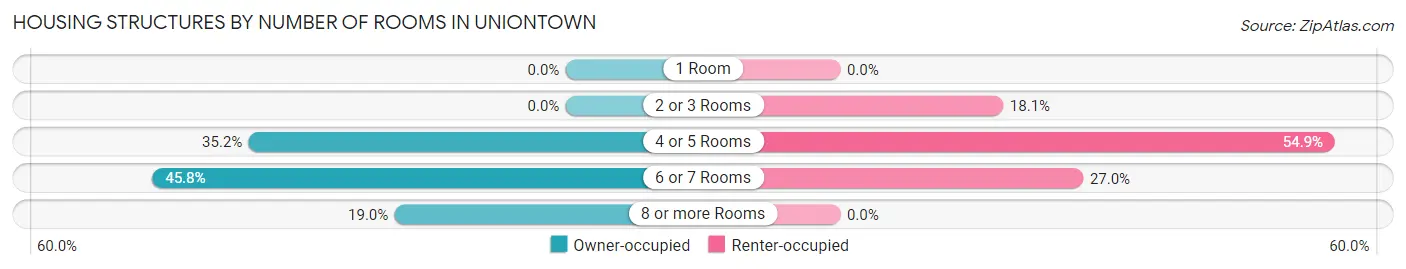
| Number of Rooms | Owner-occupied | Renter-occupied |
| 1 Room | 0 (0.0%) | 0 (0.0%) |
| 2 or 3 Rooms | 0 (0.0%) | 55 (18.1%) |
| 4 or 5 Rooms | 139 (35.2%) | 167 (54.9%) |
| 6 or 7 Rooms | 181 (45.8%) | 82 (27.0%) |
| 8 or more Rooms | 75 (19.0%) | 0 (0.0%) |
| Total | 395 (100.0%) | 304 (100.0%) |
Housing Structure by Heating Type in Uniontown
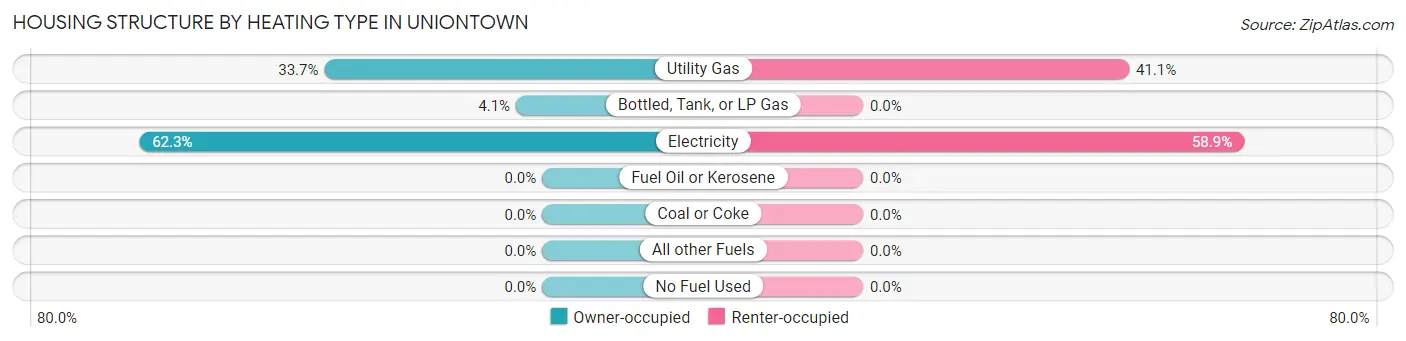
| Heating Type | Owner-occupied | Renter-occupied |
| Utility Gas | 133 (33.7%) | 125 (41.1%) |
| Bottled, Tank, or LP Gas | 16 (4.1%) | 0 (0.0%) |
| Electricity | 246 (62.3%) | 179 (58.9%) |
| Fuel Oil or Kerosene | 0 (0.0%) | 0 (0.0%) |
| Coal or Coke | 0 (0.0%) | 0 (0.0%) |
| All other Fuels | 0 (0.0%) | 0 (0.0%) |
| No Fuel Used | 0 (0.0%) | 0 (0.0%) |
| Total | 395 (100.0%) | 304 (100.0%) |
Household Vehicle Usage in Uniontown
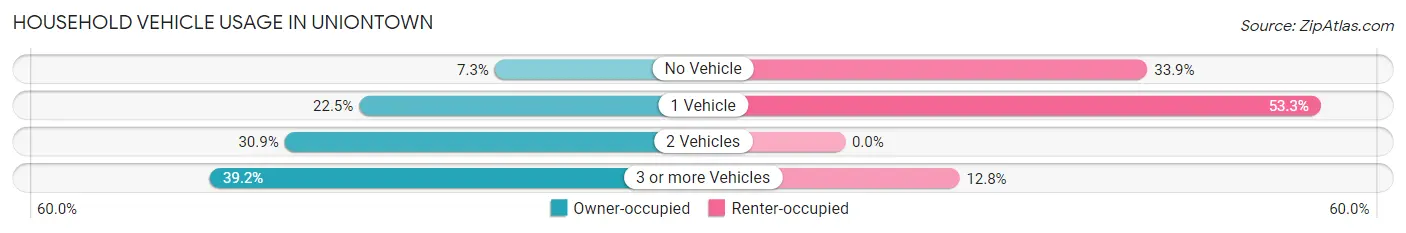
| Vehicles per Household | Owner-occupied | Renter-occupied |
| No Vehicle | 29 (7.3%) | 103 (33.9%) |
| 1 Vehicle | 89 (22.5%) | 162 (53.3%) |
| 2 Vehicles | 122 (30.9%) | 0 (0.0%) |
| 3 or more Vehicles | 155 (39.2%) | 39 (12.8%) |
| Total | 395 (100.0%) | 304 (100.0%) |
Real Estate & Mortgages in Uniontown
Real Estate and Mortgage Overview in Uniontown
| Characteristic | Without Mortgage | With Mortgage |
| Housing Units | 346 | 49 |
| Median Property Value | $66,400 | $76,100 |
| Median Household Income | $44,853 | $0 |
| Monthly Housing Costs | $385 | $0 |
| Real Estate Taxes | $199 | $0 |
Property Value by Mortgage Status in Uniontown
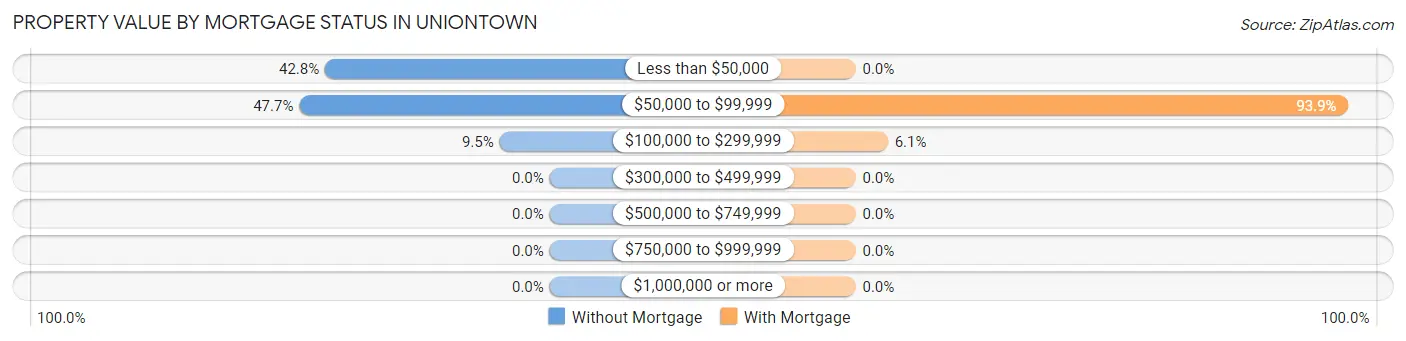
| Property Value | Without Mortgage | With Mortgage |
| Less than $50,000 | 148 (42.8%) | 0 (0.0%) |
| $50,000 to $99,999 | 165 (47.7%) | 46 (93.9%) |
| $100,000 to $299,999 | 33 (9.5%) | 3 (6.1%) |
| $300,000 to $499,999 | 0 (0.0%) | 0 (0.0%) |
| $500,000 to $749,999 | 0 (0.0%) | 0 (0.0%) |
| $750,000 to $999,999 | 0 (0.0%) | 0 (0.0%) |
| $1,000,000 or more | 0 (0.0%) | 0 (0.0%) |
| Total | 346 (100.0%) | 49 (100.0%) |
Household Income by Mortgage Status in Uniontown
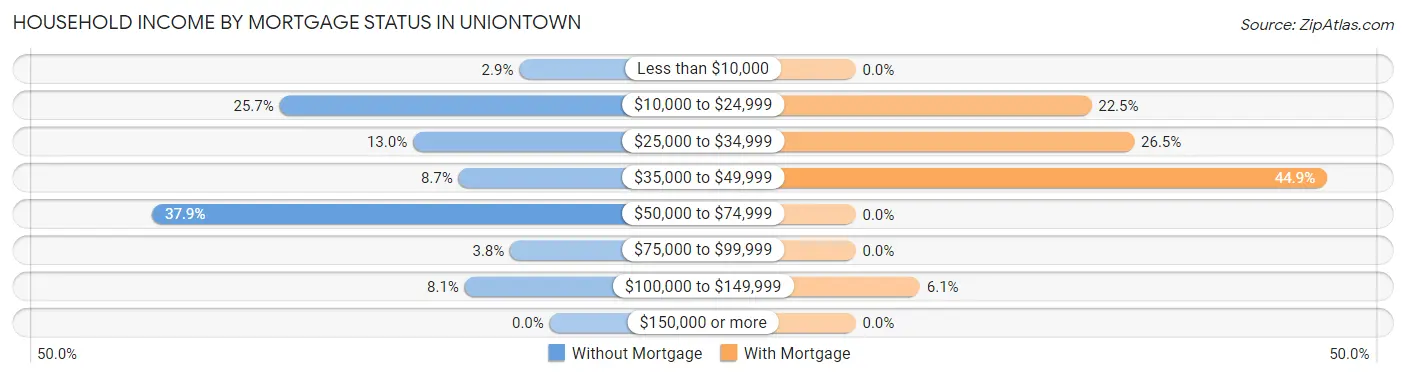
| Household Income | Without Mortgage | With Mortgage |
| Less than $10,000 | 10 (2.9%) | 0 (0.0%) |
| $10,000 to $24,999 | 89 (25.7%) | 11 (22.5%) |
| $25,000 to $34,999 | 45 (13.0%) | 13 (26.5%) |
| $35,000 to $49,999 | 30 (8.7%) | 22 (44.9%) |
| $50,000 to $74,999 | 131 (37.9%) | 0 (0.0%) |
| $75,000 to $99,999 | 13 (3.8%) | 0 (0.0%) |
| $100,000 to $149,999 | 28 (8.1%) | 3 (6.1%) |
| $150,000 or more | 0 (0.0%) | 0 (0.0%) |
| Total | 346 (100.0%) | 49 (100.0%) |
Property Value to Household Income Ratio in Uniontown
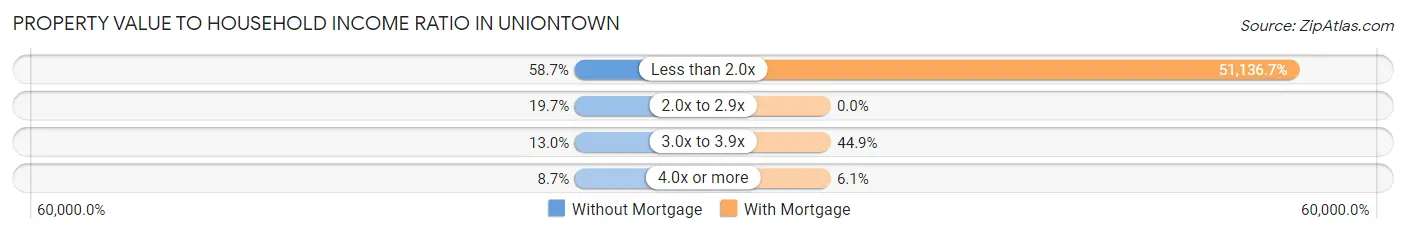
| Value-to-Income Ratio | Without Mortgage | With Mortgage |
| Less than 2.0x | 203 (58.7%) | 25,057 (51,136.7%) |
| 2.0x to 2.9x | 68 (19.7%) | 0 (0.0%) |
| 3.0x to 3.9x | 45 (13.0%) | 22 (44.9%) |
| 4.0x or more | 30 (8.7%) | 3 (6.1%) |
| Total | 346 (100.0%) | 49 (100.0%) |
Real Estate Taxes by Mortgage Status in Uniontown
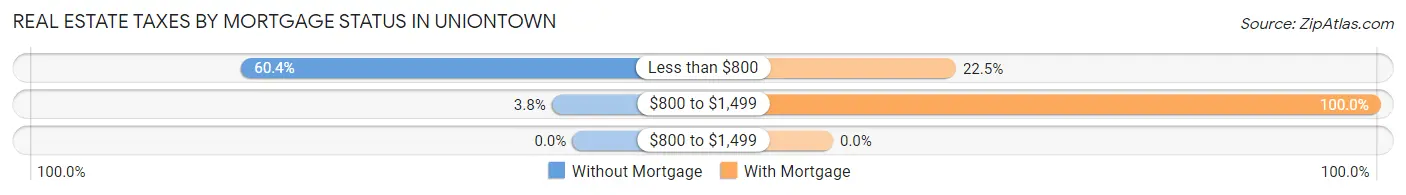
| Property Taxes | Without Mortgage | With Mortgage |
| Less than $800 | 209 (60.4%) | 11 (22.5%) |
| $800 to $1,499 | 13 (3.8%) | 49 (100.0%) |
| $800 to $1,499 | 0 (0.0%) | 0 (0.0%) |
| Total | 346 (100.0%) | 49 (100.0%) |
Health & Disability in Uniontown
Health Insurance Coverage by Age in Uniontown
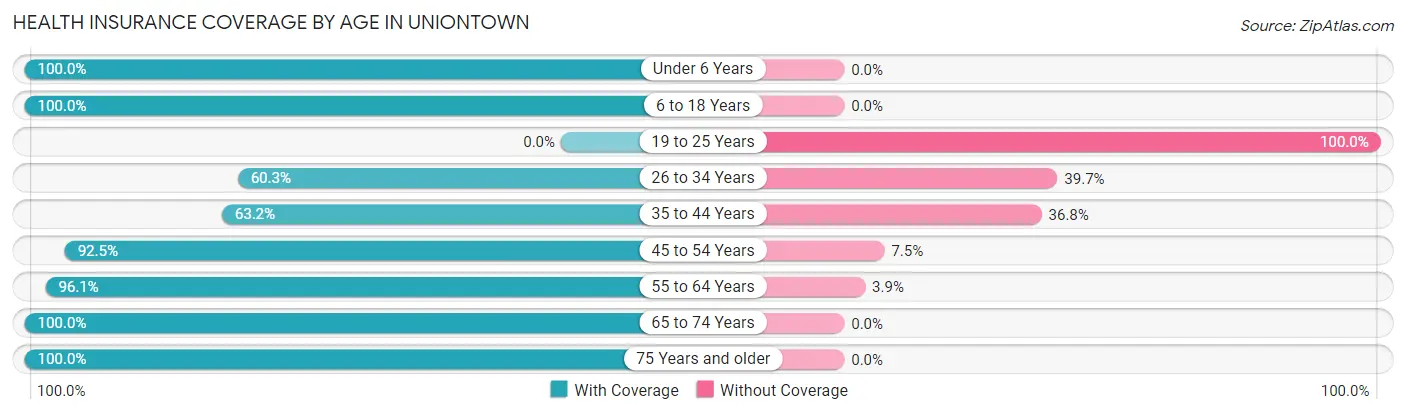
| Age Bracket | With Coverage | Without Coverage |
| Under 6 Years | 58 (100.0%) | 0 (0.0%) |
| 6 to 18 Years | 444 (100.0%) | 0 (0.0%) |
| 19 to 25 Years | 0 (0.0%) | 15 (100.0%) |
| 26 to 34 Years | 91 (60.3%) | 60 (39.7%) |
| 35 to 44 Years | 244 (63.2%) | 142 (36.8%) |
| 45 to 54 Years | 173 (92.5%) | 14 (7.5%) |
| 55 to 64 Years | 247 (96.1%) | 10 (3.9%) |
| 65 to 74 Years | 135 (100.0%) | 0 (0.0%) |
| 75 Years and older | 121 (100.0%) | 0 (0.0%) |
| Total | 1,513 (86.3%) | 241 (13.7%) |
Health Insurance Coverage by Citizenship Status in Uniontown
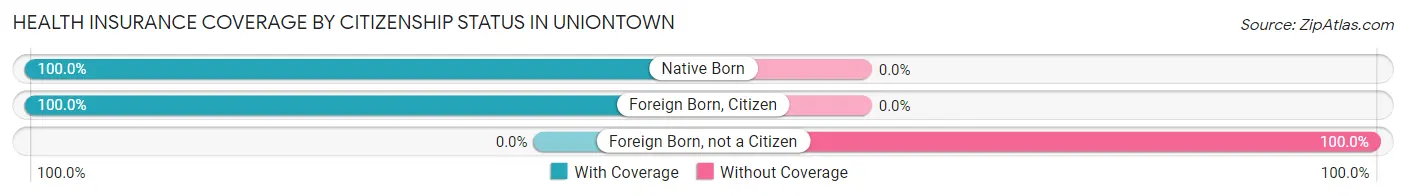
| Citizenship Status | With Coverage | Without Coverage |
| Native Born | 58 (100.0%) | 0 (0.0%) |
| Foreign Born, Citizen | 444 (100.0%) | 0 (0.0%) |
| Foreign Born, not a Citizen | 0 (0.0%) | 15 (100.0%) |
Health Insurance Coverage by Household Income in Uniontown
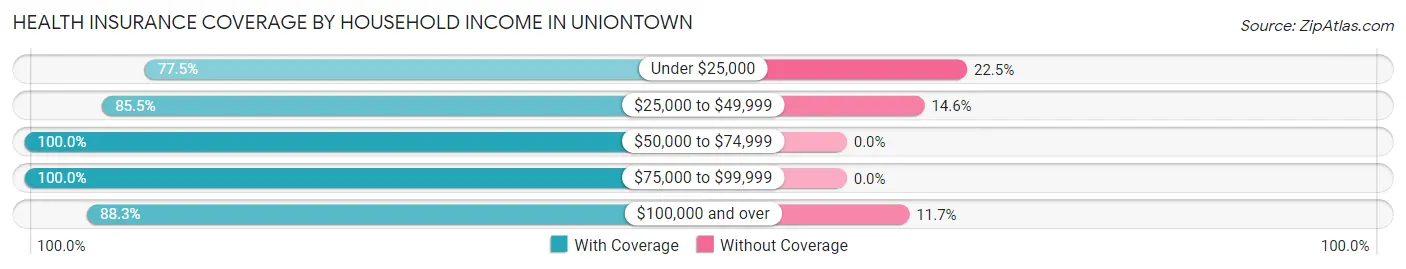
| Household Income | With Coverage | Without Coverage |
| Under $25,000 | 595 (77.5%) | 173 (22.5%) |
| $25,000 to $49,999 | 276 (85.5%) | 47 (14.5%) |
| $50,000 to $74,999 | 374 (100.0%) | 0 (0.0%) |
| $75,000 to $99,999 | 110 (100.0%) | 0 (0.0%) |
| $100,000 and over | 158 (88.3%) | 21 (11.7%) |
Public vs Private Health Insurance Coverage by Age in Uniontown
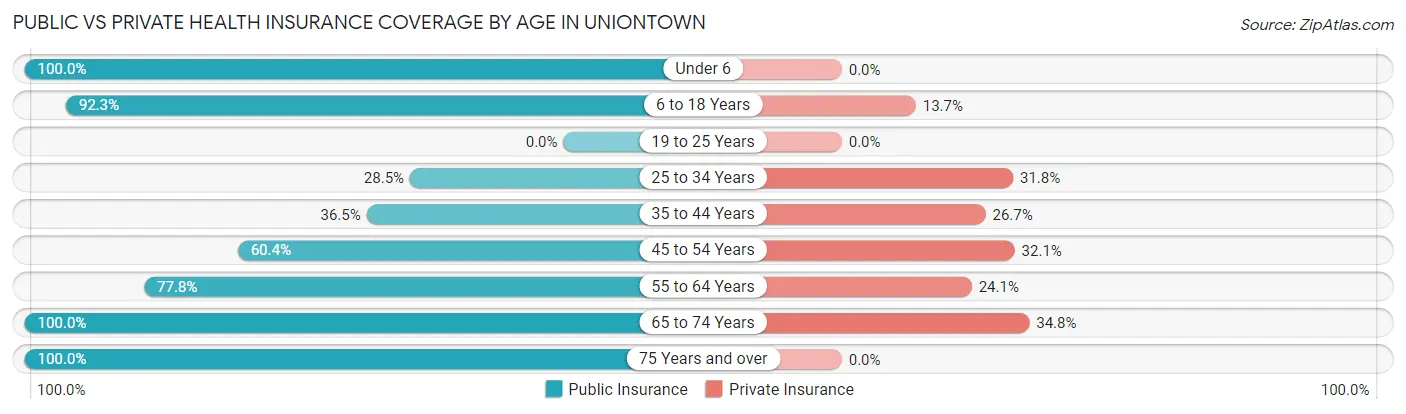
| Age Bracket | Public Insurance | Private Insurance |
| Under 6 | 58 (100.0%) | 0 (0.0%) |
| 6 to 18 Years | 410 (92.3%) | 61 (13.7%) |
| 19 to 25 Years | 0 (0.0%) | 0 (0.0%) |
| 25 to 34 Years | 43 (28.5%) | 48 (31.8%) |
| 35 to 44 Years | 141 (36.5%) | 103 (26.7%) |
| 45 to 54 Years | 113 (60.4%) | 60 (32.1%) |
| 55 to 64 Years | 200 (77.8%) | 62 (24.1%) |
| 65 to 74 Years | 135 (100.0%) | 47 (34.8%) |
| 75 Years and over | 121 (100.0%) | 0 (0.0%) |
| Total | 1,221 (69.6%) | 381 (21.7%) |
Disability Status by Sex by Age in Uniontown
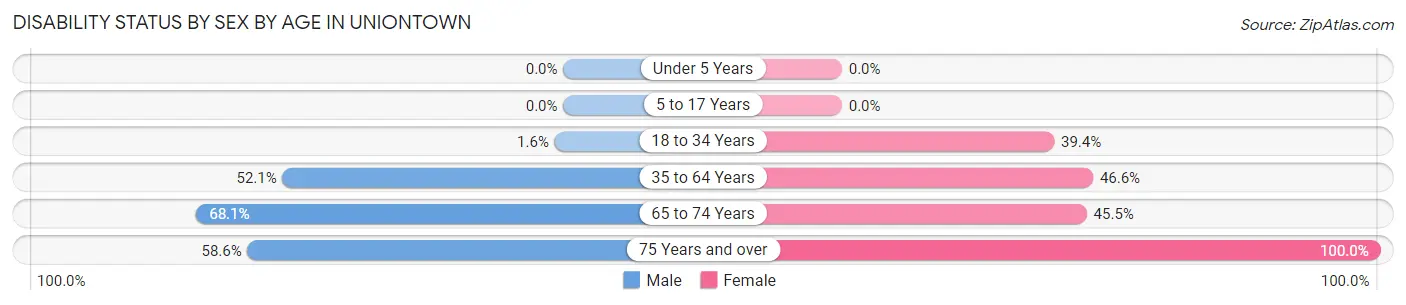
| Age Bracket | Male | Female |
| Under 5 Years | 0 (0.0%) | 0 (0.0%) |
| 5 to 17 Years | 0 (0.0%) | 0 (0.0%) |
| 18 to 34 Years | 2 (1.6%) | 39 (39.4%) |
| 35 to 64 Years | 209 (52.1%) | 200 (46.6%) |
| 65 to 74 Years | 47 (68.1%) | 30 (45.5%) |
| 75 Years and over | 34 (58.6%) | 63 (100.0%) |
Disability Class by Sex by Age in Uniontown
Disability Class: Hearing Difficulty
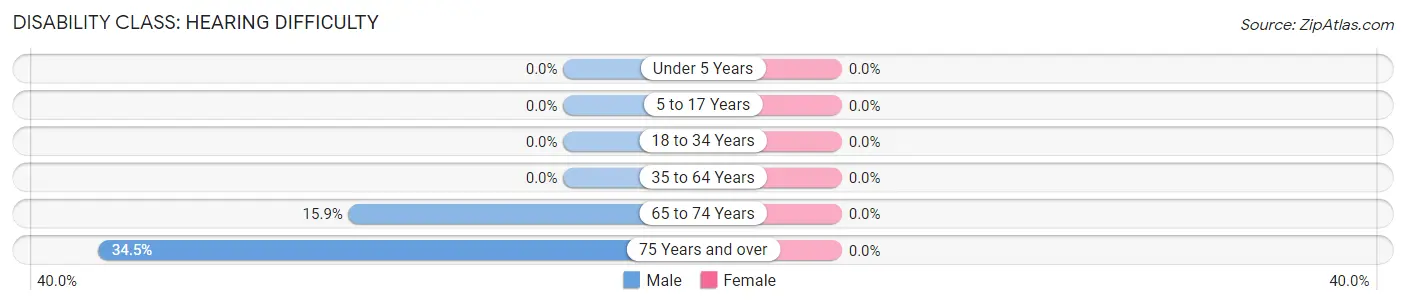
| Age Bracket | Male | Female |
| Under 5 Years | 0 (0.0%) | 0 (0.0%) |
| 5 to 17 Years | 0 (0.0%) | 0 (0.0%) |
| 18 to 34 Years | 0 (0.0%) | 0 (0.0%) |
| 35 to 64 Years | 0 (0.0%) | 0 (0.0%) |
| 65 to 74 Years | 11 (15.9%) | 0 (0.0%) |
| 75 Years and over | 20 (34.5%) | 0 (0.0%) |
Disability Class: Vision Difficulty
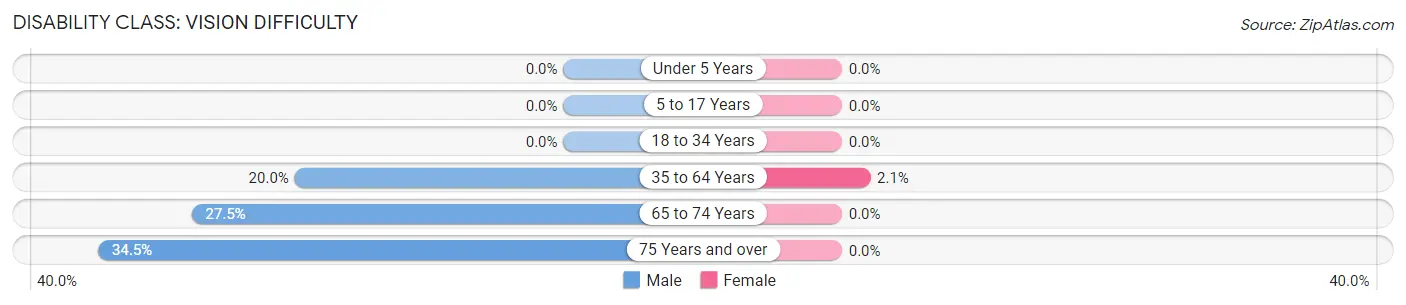
| Age Bracket | Male | Female |
| Under 5 Years | 0 (0.0%) | 0 (0.0%) |
| 5 to 17 Years | 0 (0.0%) | 0 (0.0%) |
| 18 to 34 Years | 0 (0.0%) | 0 (0.0%) |
| 35 to 64 Years | 80 (20.0%) | 9 (2.1%) |
| 65 to 74 Years | 19 (27.5%) | 0 (0.0%) |
| 75 Years and over | 20 (34.5%) | 0 (0.0%) |
Disability Class: Cognitive Difficulty
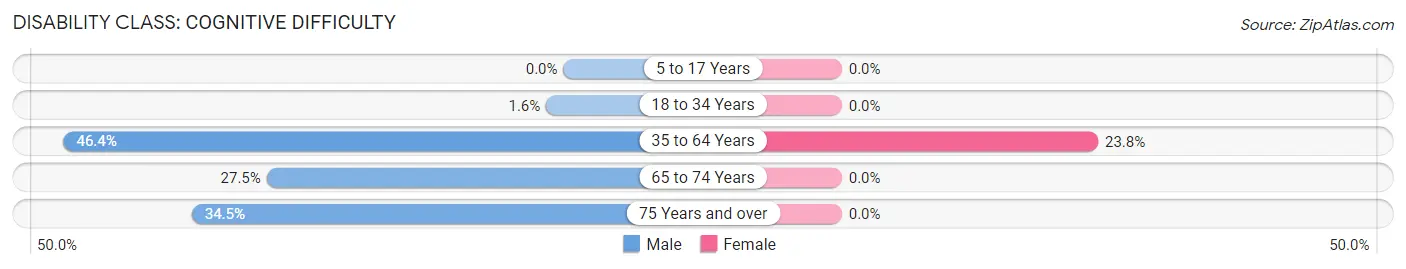
| Age Bracket | Male | Female |
| 5 to 17 Years | 0 (0.0%) | 0 (0.0%) |
| 18 to 34 Years | 2 (1.6%) | 0 (0.0%) |
| 35 to 64 Years | 186 (46.4%) | 102 (23.8%) |
| 65 to 74 Years | 19 (27.5%) | 0 (0.0%) |
| 75 Years and over | 20 (34.5%) | 0 (0.0%) |
Disability Class: Ambulatory Difficulty
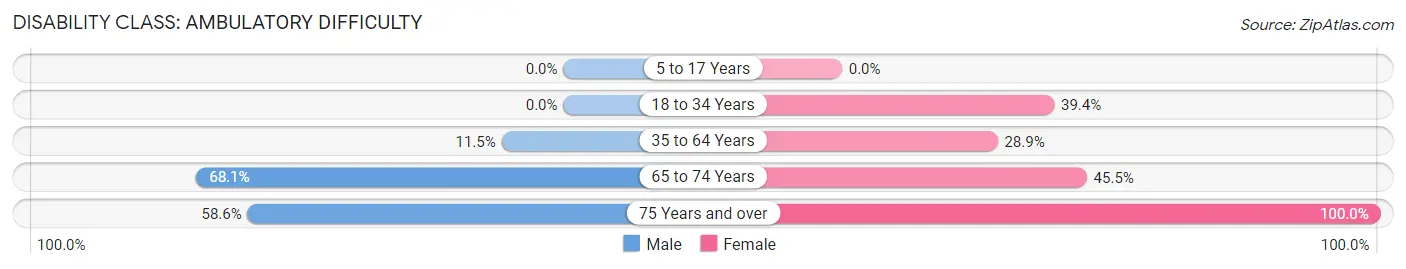
| Age Bracket | Male | Female |
| 5 to 17 Years | 0 (0.0%) | 0 (0.0%) |
| 18 to 34 Years | 0 (0.0%) | 39 (39.4%) |
| 35 to 64 Years | 46 (11.5%) | 124 (28.9%) |
| 65 to 74 Years | 47 (68.1%) | 30 (45.5%) |
| 75 Years and over | 34 (58.6%) | 63 (100.0%) |
Disability Class: Self-Care Difficulty
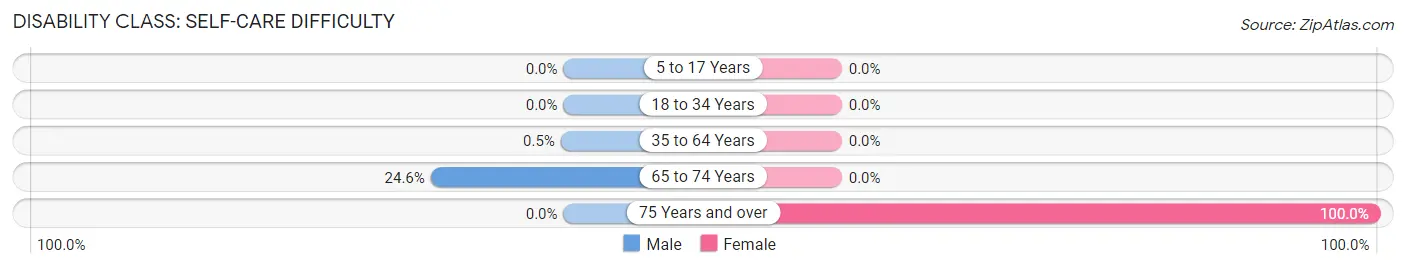
| Age Bracket | Male | Female |
| 5 to 17 Years | 0 (0.0%) | 0 (0.0%) |
| 18 to 34 Years | 0 (0.0%) | 0 (0.0%) |
| 35 to 64 Years | 2 (0.5%) | 0 (0.0%) |
| 65 to 74 Years | 17 (24.6%) | 0 (0.0%) |
| 75 Years and over | 0 (0.0%) | 63 (100.0%) |
Technology Access in Uniontown
Computing Device Access in Uniontown
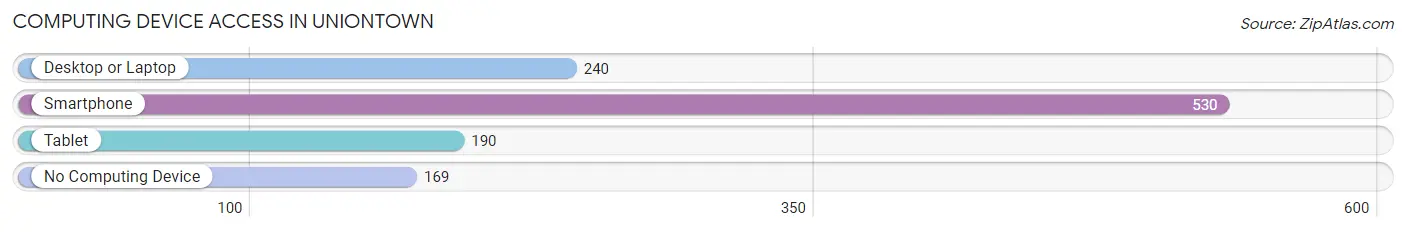
| Device Type | # Households | % Households |
| Desktop or Laptop | 240 | 34.3% |
| Smartphone | 530 | 75.8% |
| Tablet | 190 | 27.2% |
| No Computing Device | 169 | 24.2% |
| Total | 699 | 100.0% |
Internet Access in Uniontown
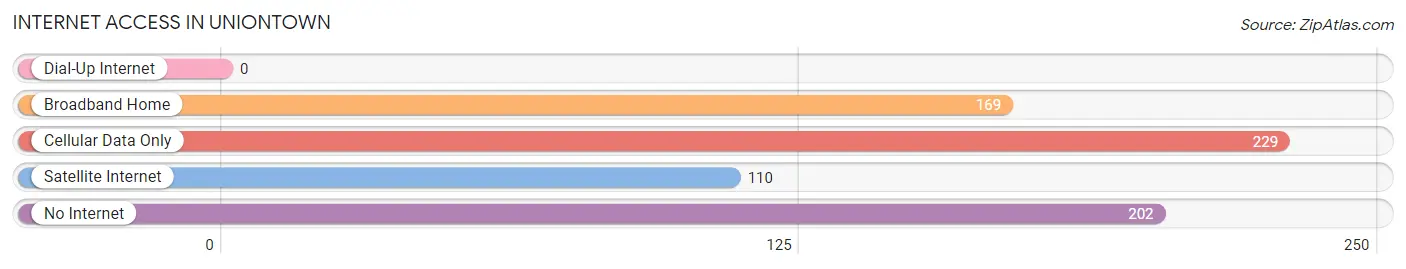
| Internet Type | # Households | % Households |
| Dial-Up Internet | 0 | 0.0% |
| Broadband Home | 169 | 24.2% |
| Cellular Data Only | 229 | 32.8% |
| Satellite Internet | 110 | 15.7% |
| No Internet | 202 | 28.9% |
| Total | 699 | 100.0% |
Uniontown Summary
Introduction
Uniontown is a small town located in Perry County, Alabama. It is situated on the banks of the Tombigbee River, and is the county seat of Perry County. The town was founded in 1819 and has a population of approximately 1,500 people. Uniontown is known for its rich history, diverse geography, and vibrant economy. This paper will explore the history, geography, economy, and demographics of Uniontown in 2000 words.
History
Uniontown was founded in 1819 by settlers from the Choctaw Nation. The town was named after the Union Church, which was built in 1820. The church was the first Protestant church in the area and was used as a meeting place for the Choctaw Nation. The town was officially incorporated in 1821 and was the first town in Perry County.
Uniontown was an important trading center during the antebellum period. The town was a major stop on the Tombigbee River, and was a hub for cotton and other goods. The town was also a major stop on the Mobile and Ohio Railroad, which connected the town to Mobile and other cities in the region.
During the Civil War, Uniontown was the site of several battles. The town was occupied by Union forces in 1863 and was the site of the Battle of Uniontown in 1864. The town was also the site of the Battle of Mobile Bay in 1865.
Geography
Uniontown is located in Perry County, Alabama. The town is situated on the banks of the Tombigbee River, and is approximately 30 miles south of Montgomery. The town is located in the Black Belt region of Alabama, and is surrounded by rolling hills and forests. The town is located in a humid subtropical climate zone, and has hot, humid summers and mild winters.
The town is located at the intersection of U.S. Route 80 and Alabama State Route 14. The town is also served by the Uniontown Municipal Airport, which is located just outside of town.
Economy
Uniontown has a diverse economy that is driven by agriculture, manufacturing, and tourism. The town is home to several large agricultural operations, including poultry farms, cattle farms, and timber operations. The town is also home to several manufacturing companies, including a paper mill and a furniture factory.
The town is also a popular tourist destination. The town is home to several historic sites, including the Union Church, the Uniontown Museum, and the Uniontown Cemetery. The town is also home to several outdoor recreation areas, including the Tombigbee River and the Uniontown State Park.
Demographics
As of the 2010 census, Uniontown had a population of 1,500 people. The town is approximately 55% white, 40% African American, and 5% Hispanic. The median household income in the town is $30,000, and the median home value is $90,000. The town has a poverty rate of 22%, and the unemployment rate is 8%.
Conclusion
Uniontown is a small town located in Perry County, Alabama. The town has a rich history, diverse geography, and vibrant economy. The town is home to several large agricultural operations, manufacturing companies, and tourist attractions. The town has a population of 1,500 people, and is approximately 55% white, 40% African American, and 5% Hispanic. The town has a median household income of $30,000 and a median home value of $90,000. Uniontown is an important part of the Black Belt region of Alabama, and is an important part of the state’s economy.
Common Questions
What is Per Capita Income in Uniontown?
Per Capita income in Uniontown is $14,998.
What is the Median Family Income in Uniontown?
Median Family Income in Uniontown is $25,563.
What is the Median Household income in Uniontown?
Median Household Income in Uniontown is $24,355.
What is Inequality or Gini Index in Uniontown?
Inequality or Gini Index in Uniontown is 0.45.
What is the Total Population of Uniontown?
Total Population of Uniontown is 1,754.
What is the Total Male Population of Uniontown?
Total Male Population of Uniontown is 849.
What is the Total Female Population of Uniontown?
Total Female Population of Uniontown is 905.
What is the Ratio of Males per 100 Females in Uniontown?
There are 93.81 Males per 100 Females in Uniontown.
What is the Ratio of Females per 100 Males in Uniontown?
There are 106.60 Females per 100 Males in Uniontown.
What is the Median Population Age in Uniontown?
Median Population Age in Uniontown is 41.2 Years.
What is the Average Family Size in Uniontown
Average Family Size in Uniontown is 3.4 People.
What is the Average Household Size in Uniontown
Average Household Size in Uniontown is 2.5 People.
How Large is the Labor Force in Uniontown?
There are 562 People in the Labor Forcein in Uniontown.
What is the Percentage of People in the Labor Force in Uniontown?
41.5% of People are in the Labor Force in Uniontown.
What is the Unemployment Rate in Uniontown?
Unemployment Rate in Uniontown is 21.0%.