Union Springs, AL Map & Demographics
Union Springs Map
Union Springs Overview
$15,220
PER CAPITA INCOME
$30,682
AVG FAMILY INCOME
$24,921
AVG HOUSEHOLD INCOME
$11,946
FAMILY INCOME DEFICIT
0.47
INEQUALITY / GINI INDEX
3,341
TOTAL POPULATION
1,638
MALE POPULATION
1,703
FEMALE POPULATION
96.18
MALES / 100 FEMALES
103.97
FEMALES / 100 MALES
28.1
MEDIAN AGE
3.8
AVG FAMILY SIZE
3.0
AVG HOUSEHOLD SIZE
1,390
LABOR FORCE [ PEOPLE ]
56.9%
PERCENT IN LABOR FORCE
7.6%
UNEMPLOYMENT RATE
Union Springs Zip Codes
Union Springs Area Codes
Income in Union Springs
Income Overview in Union Springs
Per Capita Income in Union Springs is $15,220, while median incomes of families and households are $30,682 and $24,921 respectively.
| Characteristic | Number | Measure |
| Per Capita Income | 3,341 | $15,220 |
| Median Family Income | 662 | $30,682 |
| Mean Family Income | 662 | $39,455 |
| Median Household Income | 1,101 | $24,921 |
| Mean Household Income | 1,101 | $36,152 |
| Income Deficit | 662 | $11,946 |
| Wage / Income Gap (%) | 3,341 | 0.00% |
| Wage / Income Gap ($) | 3,341 | 100.00¢ per $1 |
| Gini / Inequality Index | 3,341 | 0.47 |
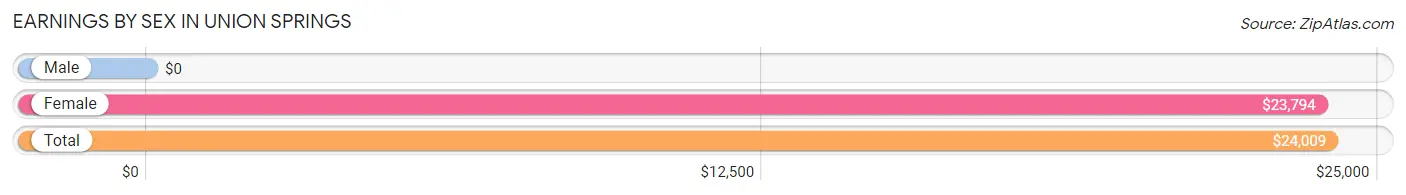
Earnings by Sex in Union Springs
| Sex | Number | Average Earnings |
| Male | 712 (49.6%) | $0 |
| Female | 724 (50.4%) | $23,794 |
| Total | 1,436 (100.0%) | $24,009 |
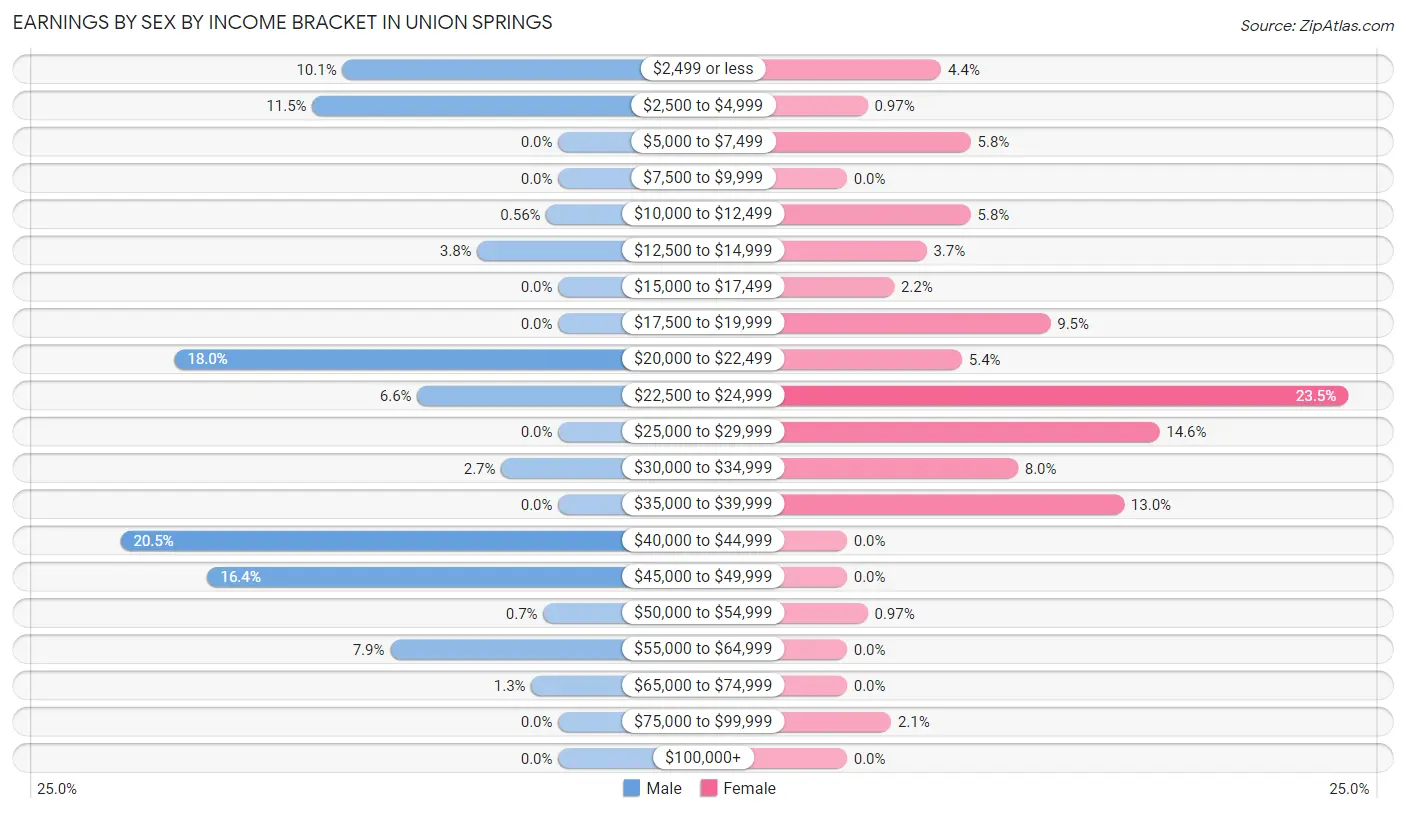
Earnings by Sex by Income Bracket in Union Springs
The most common earnings brackets in Union Springs are $40,000 to $44,999 for men (146 | 20.5%) and $22,500 to $24,999 for women (170 | 23.5%).
| Income | Male | Female |
| $2,499 or less | 72 (10.1%) | 32 (4.4%) |
| $2,500 to $4,999 | 82 (11.5%) | 7 (1.0%) |
| $5,000 to $7,499 | 0 (0.0%) | 42 (5.8%) |
| $7,500 to $9,999 | 0 (0.0%) | 0 (0.0%) |
| $10,000 to $12,499 | 4 (0.6%) | 42 (5.8%) |
| $12,500 to $14,999 | 27 (3.8%) | 27 (3.7%) |
| $15,000 to $17,499 | 0 (0.0%) | 16 (2.2%) |
| $17,500 to $19,999 | 0 (0.0%) | 69 (9.5%) |
| $20,000 to $22,499 | 128 (18.0%) | 39 (5.4%) |
| $22,500 to $24,999 | 47 (6.6%) | 170 (23.5%) |
| $25,000 to $29,999 | 0 (0.0%) | 106 (14.6%) |
| $30,000 to $34,999 | 19 (2.7%) | 58 (8.0%) |
| $35,000 to $39,999 | 0 (0.0%) | 94 (13.0%) |
| $40,000 to $44,999 | 146 (20.5%) | 0 (0.0%) |
| $45,000 to $49,999 | 117 (16.4%) | 0 (0.0%) |
| $50,000 to $54,999 | 5 (0.7%) | 7 (1.0%) |
| $55,000 to $64,999 | 56 (7.9%) | 0 (0.0%) |
| $65,000 to $74,999 | 9 (1.3%) | 0 (0.0%) |
| $75,000 to $99,999 | 0 (0.0%) | 15 (2.1%) |
| $100,000+ | 0 (0.0%) | 0 (0.0%) |
| Total | 712 (100.0%) | 724 (100.0%) |
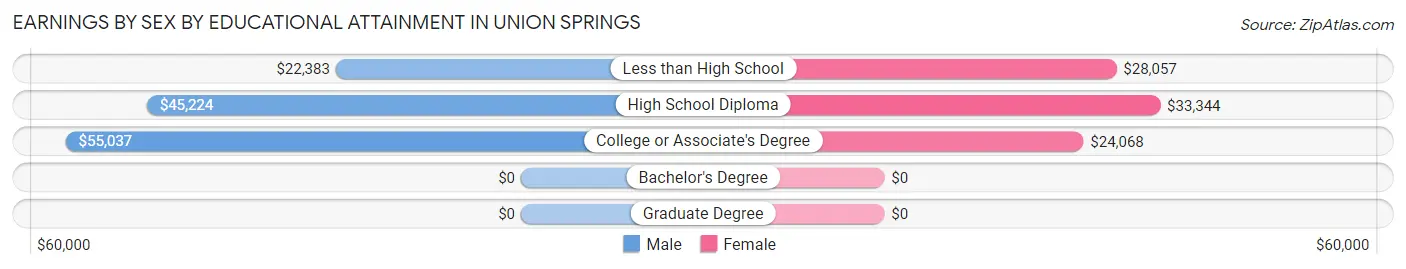
Earnings by Sex by Educational Attainment in Union Springs
Average earnings in Union Springs are $40,237 for men and $24,426 for women, a difference of 39.3%. Men with an educational attainment of college or associate's degree enjoy the highest average annual earnings of $55,037, while those with less than high school education earn the least with $22,383. Women with an educational attainment of high school diploma earn the most with the average annual earnings of $33,344, while those with college or associate's degree education have the smallest earnings of $24,068.
| Educational Attainment | Male Income | Female Income |
| Less than High School | $22,383 | $28,057 |
| High School Diploma | $45,224 | $33,344 |
| College or Associate's Degree | $55,037 | $24,068 |
| Bachelor's Degree | - | - |
| Graduate Degree | - | - |
| Total | $40,237 | $24,426 |
Family Income in Union Springs
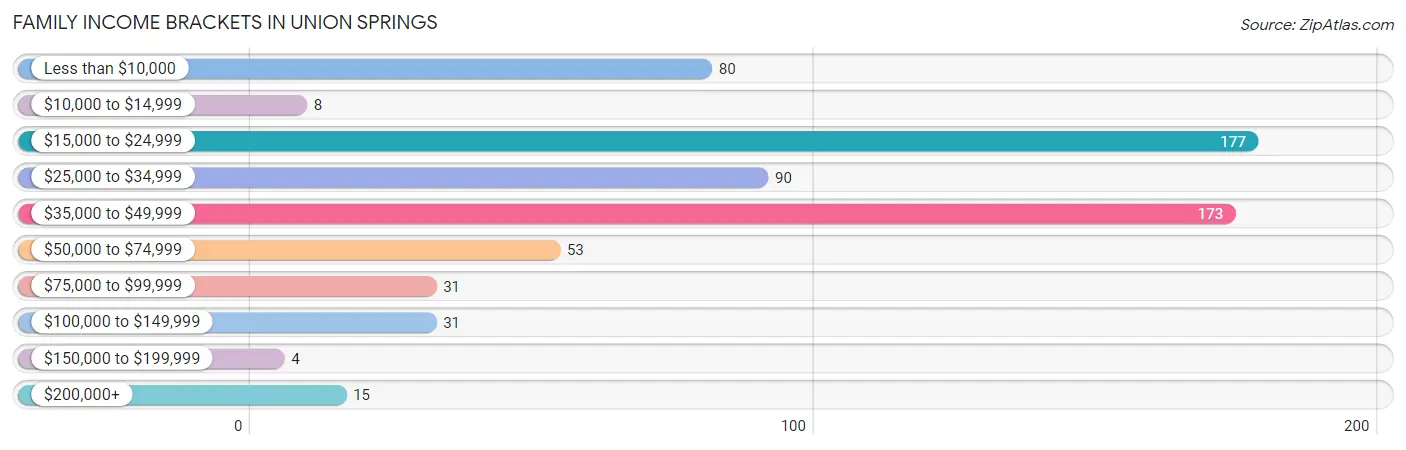
Family Income Brackets in Union Springs
According to the Union Springs family income data, there are 177 families falling into the $15,000 to $24,999 income range, which is the most common income bracket and makes up 26.7% of all families. Conversely, the $150,000 to $199,999 income bracket is the least frequent group with only 4 families (0.6%) belonging to this category.
| Income Bracket | # Families | % Families |
| Less than $10,000 | 80 | 12.1% |
| $10,000 to $14,999 | 8 | 1.2% |
| $15,000 to $24,999 | 177 | 26.7% |
| $25,000 to $34,999 | 90 | 13.6% |
| $35,000 to $49,999 | 173 | 26.1% |
| $50,000 to $74,999 | 53 | 8.0% |
| $75,000 to $99,999 | 31 | 4.7% |
| $100,000 to $149,999 | 31 | 4.7% |
| $150,000 to $199,999 | 4 | 0.6% |
| $200,000+ | 15 | 2.3% |
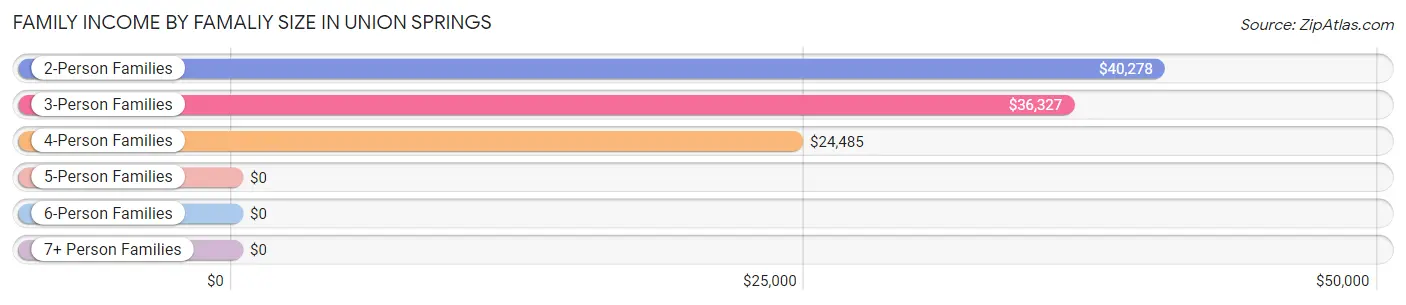
Family Income by Famaliy Size in Union Springs
2-person families (260 | 39.3%) account for the highest median family income in Union Springs with $40,278 per family, while 2-person families (260 | 39.3%) have the highest median income of $20,139 per family member.
| Income Bracket | # Families | Median Income |
| 2-Person Families | 260 (39.3%) | $40,278 |
| 3-Person Families | 96 (14.5%) | $36,327 |
| 4-Person Families | 242 (36.6%) | $24,485 |
| 5-Person Families | 17 (2.6%) | $0 |
| 6-Person Families | 0 (0.0%) | $0 |
| 7+ Person Families | 47 (7.1%) | $0 |
| Total | 662 (100.0%) | $30,682 |
Family Income by Number of Earners in Union Springs
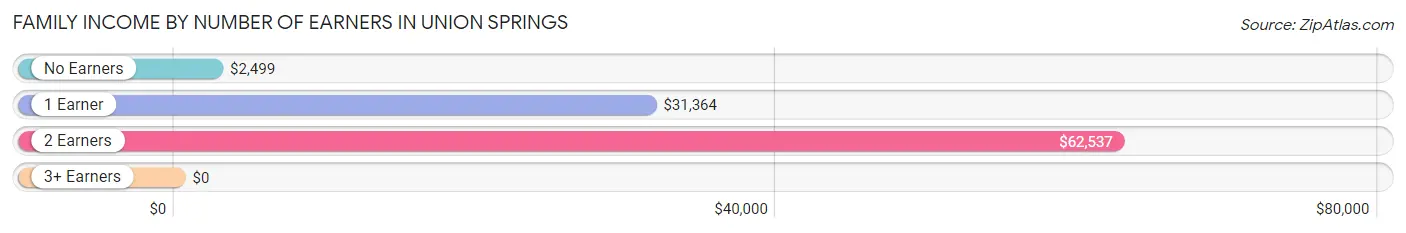
| Number of Earners | # Families | Median Income |
| No Earners | 137 (20.7%) | $2,499 |
| 1 Earner | 304 (45.9%) | $31,364 |
| 2 Earners | 221 (33.4%) | $62,537 |
| 3+ Earners | 0 (0.0%) | $0 |
| Total | 662 (100.0%) | $30,682 |
Household Income in Union Springs
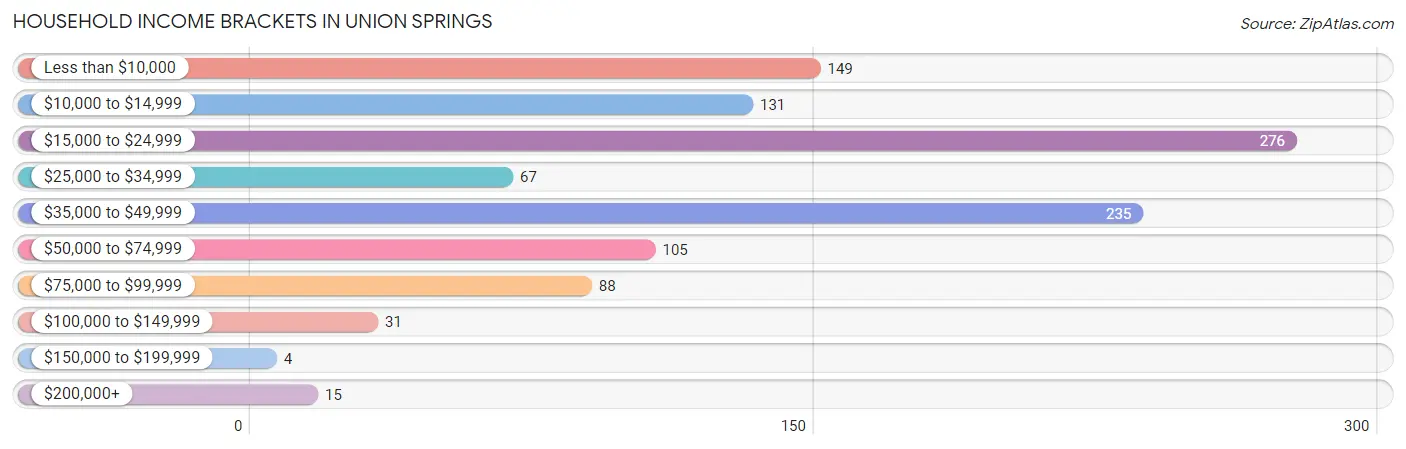
Household Income Brackets in Union Springs
With 276 households falling in the category, the $15,000 to $24,999 income range is the most frequent in Union Springs, accounting for 25.1% of all households. In contrast, only 4 households (0.4%) fall into the $150,000 to $199,999 income bracket, making it the least populous group.
| Income Bracket | # Households | % Households |
| Less than $10,000 | 149 | 13.5% |
| $10,000 to $14,999 | 131 | 11.9% |
| $15,000 to $24,999 | 276 | 25.1% |
| $25,000 to $34,999 | 67 | 6.1% |
| $35,000 to $49,999 | 235 | 21.3% |
| $50,000 to $74,999 | 105 | 9.5% |
| $75,000 to $99,999 | 88 | 8.0% |
| $100,000 to $149,999 | 31 | 2.8% |
| $150,000 to $199,999 | 4 | 0.4% |
| $200,000+ | 15 | 1.4% |
Household Income by Householder Age in Union Springs
The median household income in Union Springs is $24,921, with the highest median household income of $35,815 found in the 25 to 44 years age bracket for the primary householder. A total of 452 households (41.0%) fall into this category. Meanwhile, the 15 to 24 years age bracket for the primary householder has the lowest median household income of $0, with 23 households (2.1%) in this group.
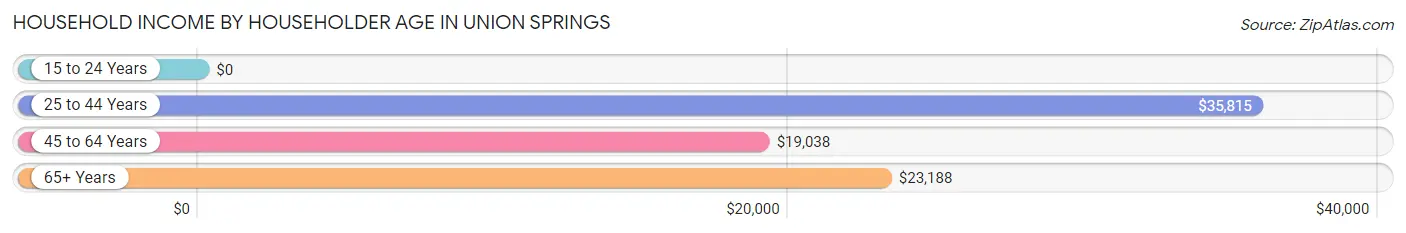
| Income Bracket | # Households | Median Income |
| 15 to 24 Years | 23 (2.1%) | $0 |
| 25 to 44 Years | 452 (41.0%) | $35,815 |
| 45 to 64 Years | 384 (34.9%) | $19,038 |
| 65+ Years | 242 (22.0%) | $23,188 |
| Total | 1,101 (100.0%) | $24,921 |
Poverty in Union Springs
Income Below Poverty by Sex and Age in Union Springs
With 48.2% poverty level for males and 55.0% for females among the residents of Union Springs, 18 to 24 year old males and 5 year old females are the most vulnerable to poverty, with 269 males (100.0%) and 2 females (100.0%) in their respective age groups living below the poverty level.
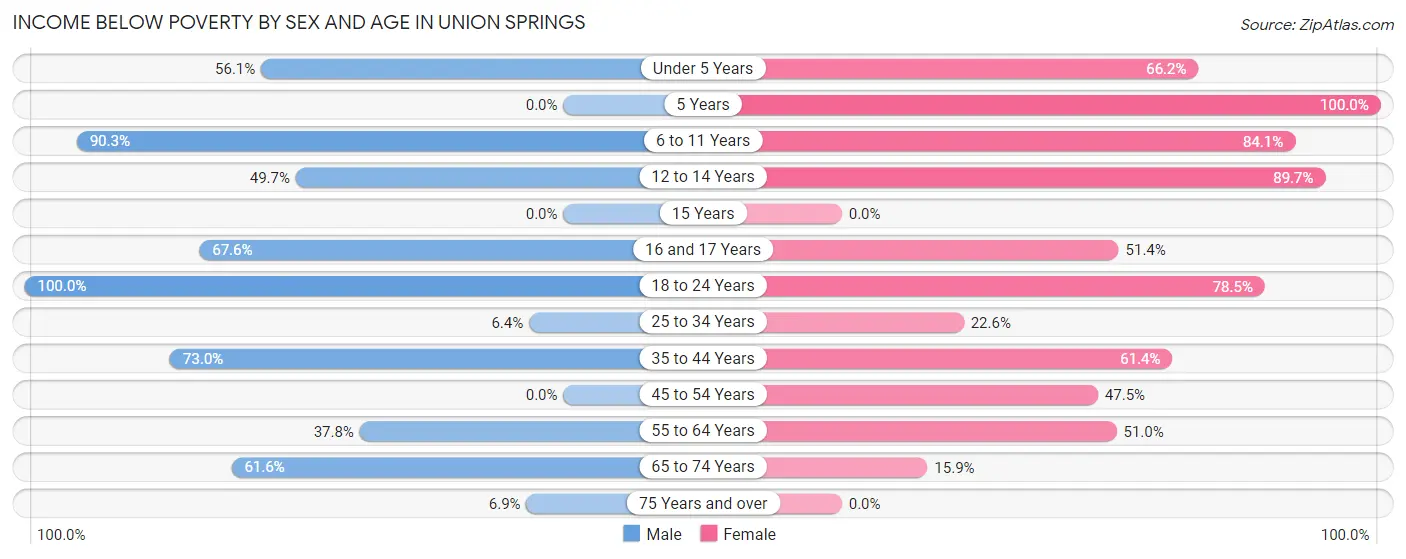
| Age Bracket | Male | Female |
| Under 5 Years | 23 (56.1%) | 178 (66.2%) |
| 5 Years | 0 (0.0%) | 2 (100.0%) |
| 6 to 11 Years | 112 (90.3%) | 143 (84.1%) |
| 12 to 14 Years | 75 (49.7%) | 105 (89.7%) |
| 15 Years | 0 (0.0%) | 0 (0.0%) |
| 16 and 17 Years | 25 (67.6%) | 56 (51.4%) |
| 18 to 24 Years | 269 (100.0%) | 84 (78.5%) |
| 25 to 34 Years | 18 (6.4%) | 62 (22.6%) |
| 35 to 44 Years | 92 (73.0%) | 154 (61.4%) |
| 45 to 54 Years | 0 (0.0%) | 58 (47.5%) |
| 55 to 64 Years | 62 (37.8%) | 77 (51.0%) |
| 65 to 74 Years | 77 (61.6%) | 17 (15.9%) |
| 75 Years and over | 5 (6.9%) | 0 (0.0%) |
| Total | 758 (48.2%) | 936 (55.0%) |
Income Above Poverty by Sex and Age in Union Springs
According to the poverty statistics in Union Springs, males aged 45 to 54 years and females aged 75 years and over are the age groups that are most secure financially, with 100.0% of males and 100.0% of females in these age groups living above the poverty line.
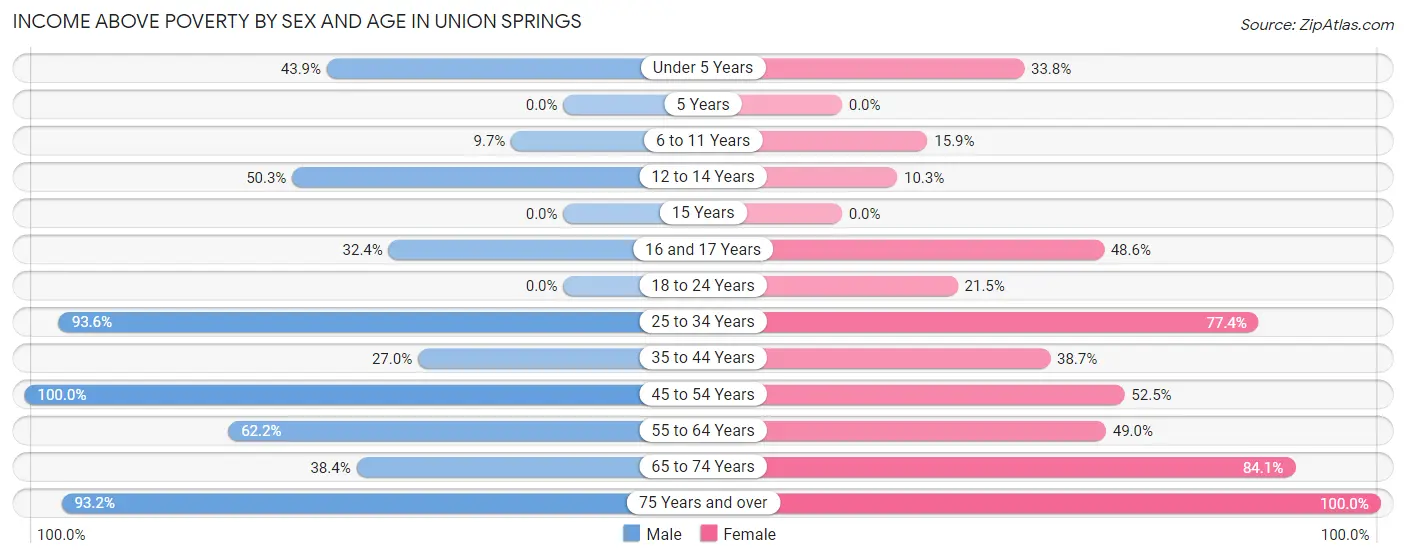
| Age Bracket | Male | Female |
| Under 5 Years | 18 (43.9%) | 91 (33.8%) |
| 5 Years | 0 (0.0%) | 0 (0.0%) |
| 6 to 11 Years | 12 (9.7%) | 27 (15.9%) |
| 12 to 14 Years | 76 (50.3%) | 12 (10.3%) |
| 15 Years | 0 (0.0%) | 0 (0.0%) |
| 16 and 17 Years | 12 (32.4%) | 53 (48.6%) |
| 18 to 24 Years | 0 (0.0%) | 23 (21.5%) |
| 25 to 34 Years | 265 (93.6%) | 212 (77.4%) |
| 35 to 44 Years | 34 (27.0%) | 97 (38.7%) |
| 45 to 54 Years | 179 (100.0%) | 64 (52.5%) |
| 55 to 64 Years | 102 (62.2%) | 74 (49.0%) |
| 65 to 74 Years | 48 (38.4%) | 90 (84.1%) |
| 75 Years and over | 68 (93.1%) | 24 (100.0%) |
| Total | 814 (51.8%) | 767 (45.0%) |
Income Below Poverty Among Married-Couple Families in Union Springs
The poverty statistics for married-couple families in Union Springs show that 33.6% or 83 of the total 247 families live below the poverty line. Families with 5 or more children have the highest poverty rate of 100.0%, comprising of 47 families. On the other hand, families with no children have the lowest poverty rate of 16.9%, which includes 22 families.
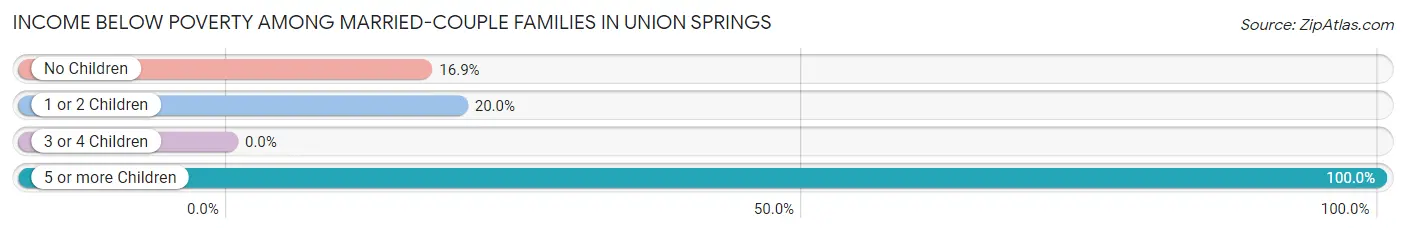
| Children | Above Poverty | Below Poverty |
| No Children | 108 (83.1%) | 22 (16.9%) |
| 1 or 2 Children | 56 (80.0%) | 14 (20.0%) |
| 3 or 4 Children | 0 (0.0%) | 0 (0.0%) |
| 5 or more Children | 0 (0.0%) | 47 (100.0%) |
| Total | 164 (66.4%) | 83 (33.6%) |
Income Below Poverty Among Single-Parent Households in Union Springs
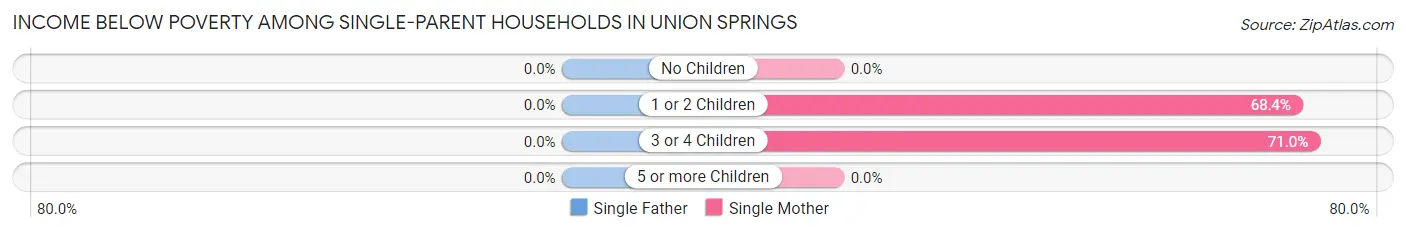
| Children | Single Father | Single Mother |
| No Children | 0 (0.0%) | 0 (0.0%) |
| 1 or 2 Children | 0 (0.0%) | 156 (68.4%) |
| 3 or 4 Children | 0 (0.0%) | 44 (71.0%) |
| 5 or more Children | 0 (0.0%) | 0 (0.0%) |
| Total | 0 (0.0%) | 200 (58.3%) |
Income Below Poverty Among Married-Couple vs Single-Parent Households in Union Springs
The poverty data for Union Springs shows that 83 of the married-couple family households (33.6%) and 200 of the single-parent households (48.2%) are living below the poverty level. Within the married-couple family households, those with 5 or more children have the highest poverty rate, with 47 households (100.0%) falling below the poverty line. Among the single-parent households, those with 3 or 4 children have the highest poverty rate, with 44 household (71.0%) living below poverty.
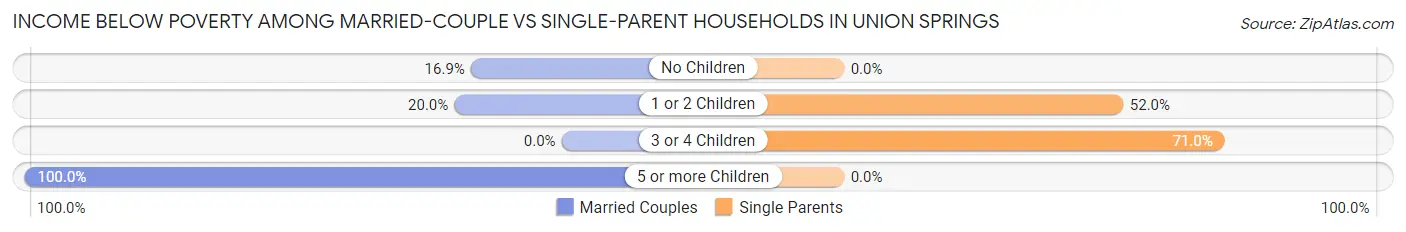
| Children | Married-Couple Families | Single-Parent Households |
| No Children | 22 (16.9%) | 0 (0.0%) |
| 1 or 2 Children | 14 (20.0%) | 156 (52.0%) |
| 3 or 4 Children | 0 (0.0%) | 44 (71.0%) |
| 5 or more Children | 47 (100.0%) | 0 (0.0%) |
| Total | 83 (33.6%) | 200 (48.2%) |
Race in Union Springs
The most populous races in Union Springs are Black / African American (2,231 | 66.8%), Hispanic or Latino (703 | 21.0%), and White / Caucasian (567 | 17.0%).
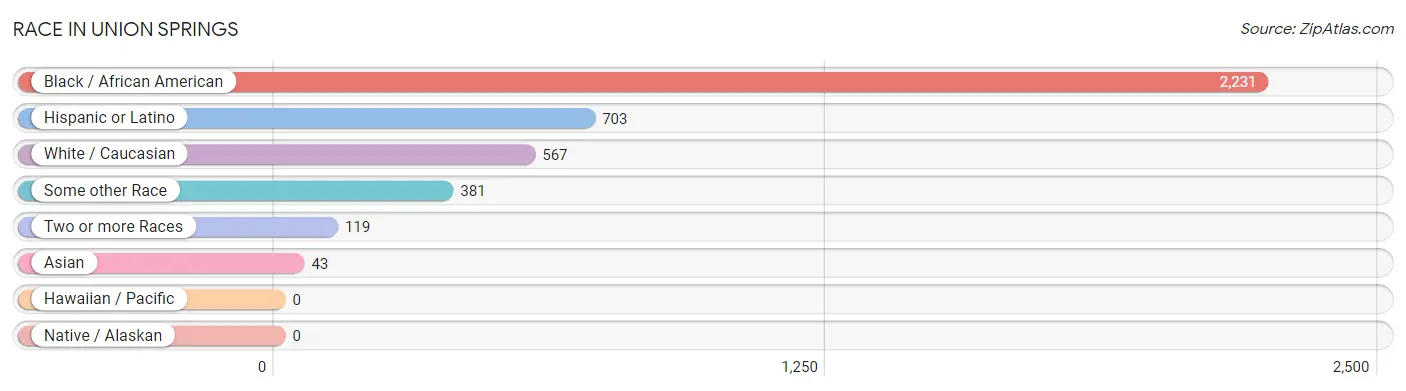
| Race | # Population | % Population |
| Asian | 43 | 1.3% |
| Black / African American | 2,231 | 66.8% |
| Hawaiian / Pacific | 0 | 0.0% |
| Hispanic or Latino | 703 | 21.0% |
| Native / Alaskan | 0 | 0.0% |
| White / Caucasian | 567 | 17.0% |
| Two or more Races | 119 | 3.6% |
| Some other Race | 381 | 11.4% |
| Total | 3,341 | 100.0% |
Ancestry in Union Springs
The most populous ancestries reported in Union Springs are American (444 | 13.3%), Central American (382 | 11.4%), Guatemalan (382 | 11.4%), Mexican (321 | 9.6%), and German (210 | 6.3%), together accounting for 52.0% of all Union Springs residents.
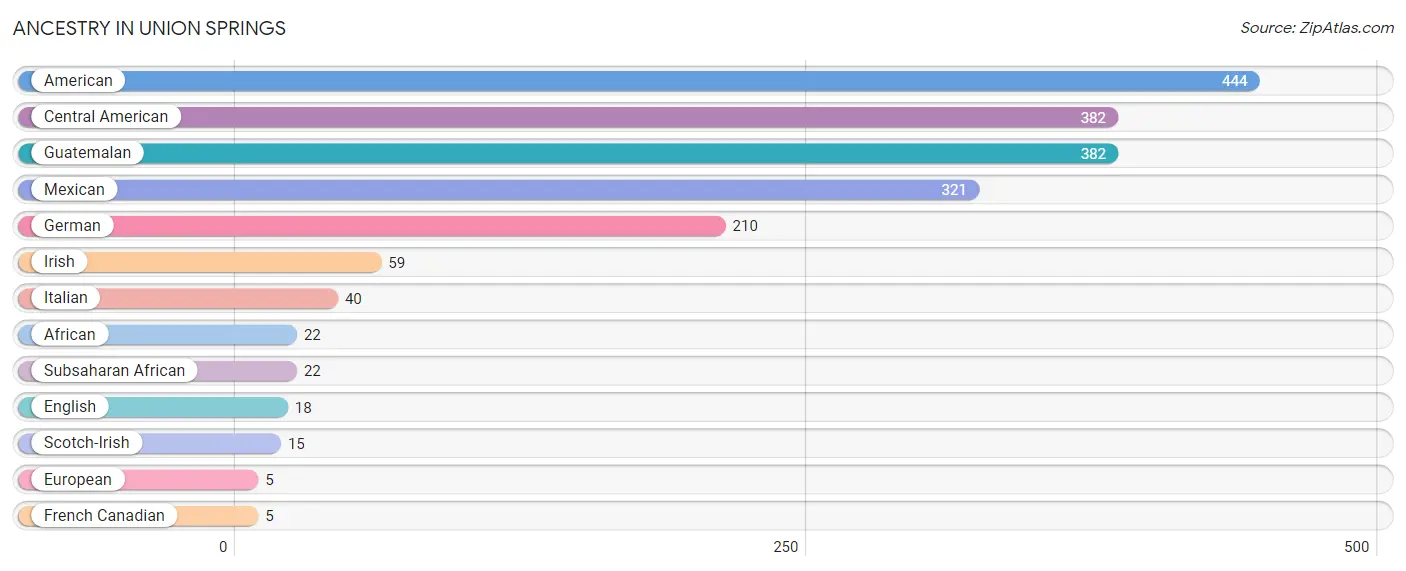
| Ancestry | # Population | % Population |
| African | 22 | 0.7% |
| American | 444 | 13.3% |
| Central American | 382 | 11.4% |
| English | 18 | 0.5% |
| European | 5 | 0.2% |
| French Canadian | 5 | 0.2% |
| German | 210 | 6.3% |
| Guatemalan | 382 | 11.4% |
| Irish | 59 | 1.8% |
| Italian | 40 | 1.2% |
| Mexican | 321 | 9.6% |
| Scotch-Irish | 15 | 0.4% |
| Subsaharan African | 22 | 0.7% | View All 13 Rows |
Immigrants in Union Springs
The most numerous immigrant groups reported in Union Springs came from Central America (321 | 9.6%), Latin America (321 | 9.6%), Guatemala (243 | 7.3%), and Mexico (78 | 2.3%), together accounting for 28.8% of all Union Springs residents.
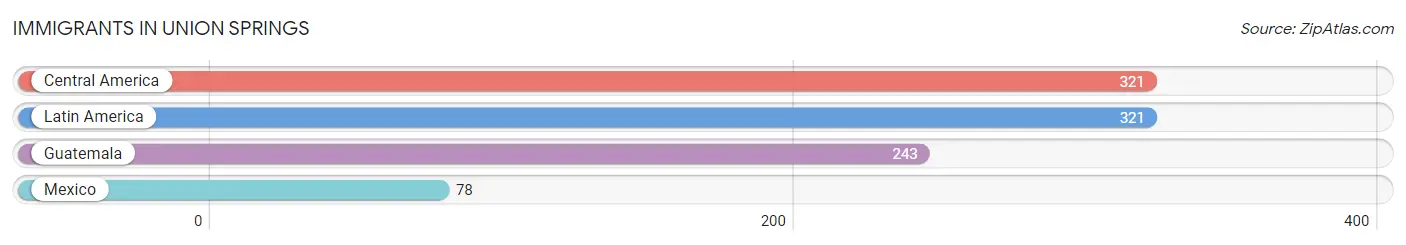
| Immigration Origin | # Population | % Population |
| Central America | 321 | 9.6% |
| Guatemala | 243 | 7.3% |
| Latin America | 321 | 9.6% |
| Mexico | 78 | 2.3% | View All 4 Rows |
Sex and Age in Union Springs
Sex and Age in Union Springs
The most populous age groups in Union Springs are 15 to 19 Years (306 | 18.7%) for men and Under 5 Years (269 | 15.8%) for women.
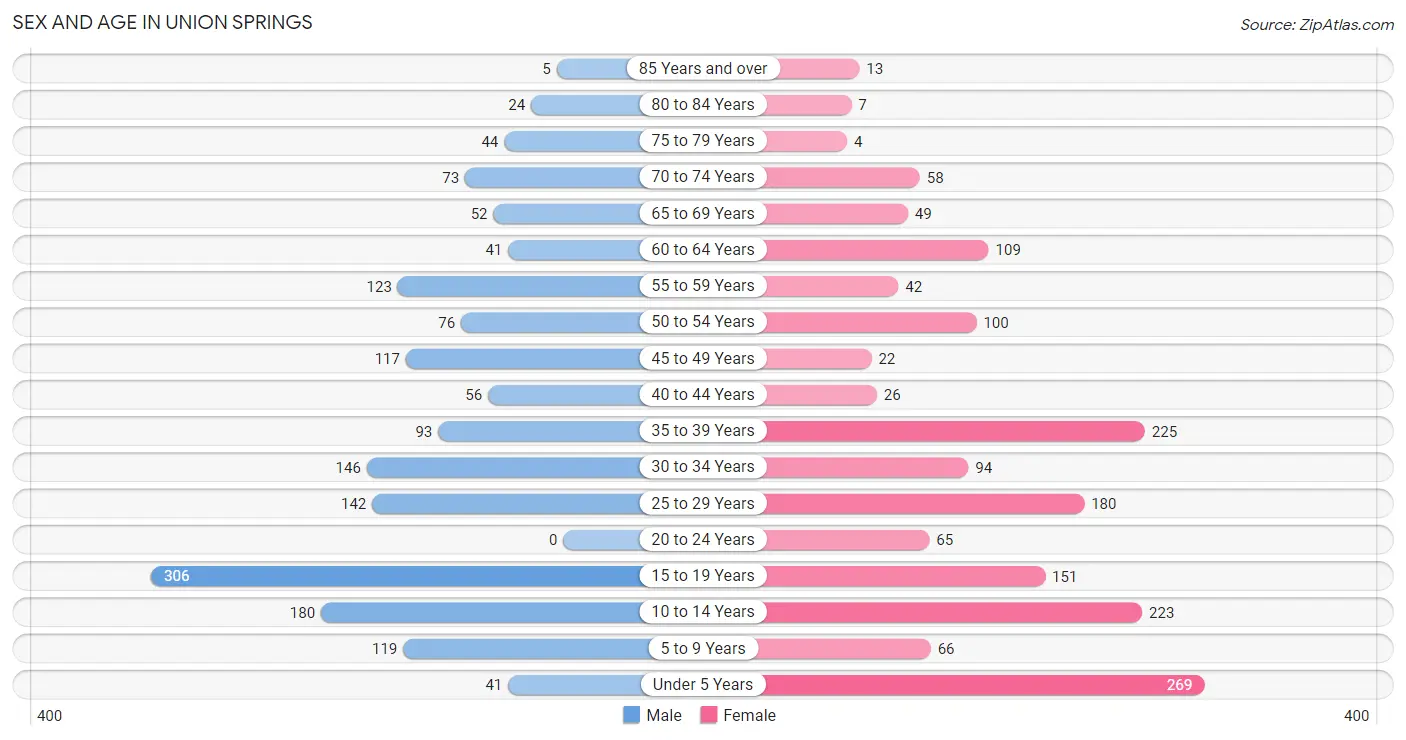
| Age Bracket | Male | Female |
| Under 5 Years | 41 (2.5%) | 269 (15.8%) |
| 5 to 9 Years | 119 (7.3%) | 66 (3.9%) |
| 10 to 14 Years | 180 (11.0%) | 223 (13.1%) |
| 15 to 19 Years | 306 (18.7%) | 151 (8.9%) |
| 20 to 24 Years | 0 (0.0%) | 65 (3.8%) |
| 25 to 29 Years | 142 (8.7%) | 180 (10.6%) |
| 30 to 34 Years | 146 (8.9%) | 94 (5.5%) |
| 35 to 39 Years | 93 (5.7%) | 225 (13.2%) |
| 40 to 44 Years | 56 (3.4%) | 26 (1.5%) |
| 45 to 49 Years | 117 (7.1%) | 22 (1.3%) |
| 50 to 54 Years | 76 (4.6%) | 100 (5.9%) |
| 55 to 59 Years | 123 (7.5%) | 42 (2.5%) |
| 60 to 64 Years | 41 (2.5%) | 109 (6.4%) |
| 65 to 69 Years | 52 (3.2%) | 49 (2.9%) |
| 70 to 74 Years | 73 (4.5%) | 58 (3.4%) |
| 75 to 79 Years | 44 (2.7%) | 4 (0.2%) |
| 80 to 84 Years | 24 (1.5%) | 7 (0.4%) |
| 85 Years and over | 5 (0.3%) | 13 (0.8%) |
| Total | 1,638 (100.0%) | 1,703 (100.0%) |
Families and Households in Union Springs
Median Family Size in Union Springs
The median family size in Union Springs is 3.77 persons per family, with single female/mother families (343 | 51.8%) accounting for the largest median family size of 4.5 persons per family. On the other hand, single male/father families (72 | 10.9%) represent the smallest median family size with 1.83 persons per family.
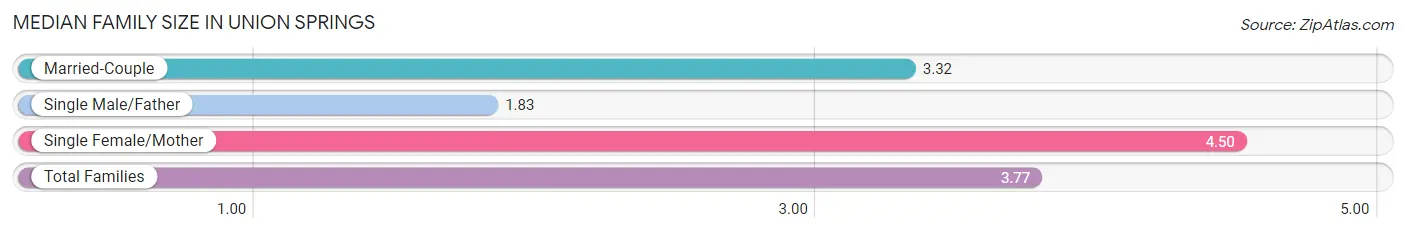
| Family Type | # Families | Family Size |
| Married-Couple | 247 (37.3%) | 3.32 |
| Single Male/Father | 72 (10.9%) | 1.83 |
| Single Female/Mother | 343 (51.8%) | 4.50 |
| Total Families | 662 (100.0%) | 3.77 |
Median Household Size in Union Springs
The median household size in Union Springs is 2.95 persons per household, with single female/mother households (343 | 31.1%) accounting for the largest median household size of 4.6 persons per household. non-family households (439 | 39.9%) represent the smallest median household size with 1.32 persons per household.
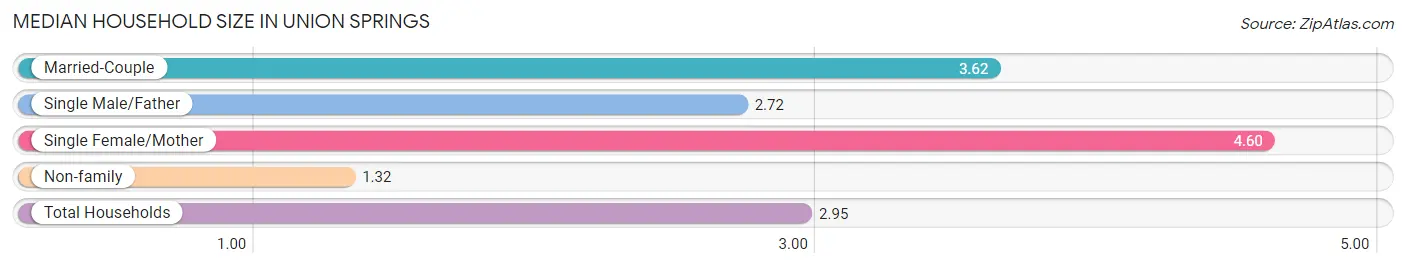
| Household Type | # Households | Household Size |
| Married-Couple | 247 (22.4%) | 3.62 |
| Single Male/Father | 72 (6.5%) | 2.72 |
| Single Female/Mother | 343 (31.1%) | 4.60 |
| Non-family | 439 (39.9%) | 1.32 |
| Total Households | 1,101 (100.0%) | 2.95 |
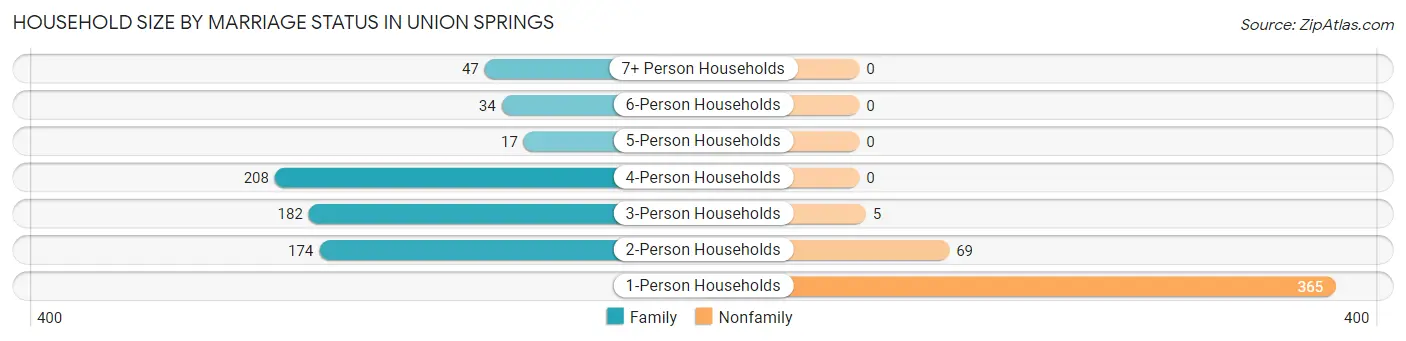
Household Size by Marriage Status in Union Springs
Out of a total of 1,101 households in Union Springs, 662 (60.1%) are family households, while 439 (39.9%) are nonfamily households. The most numerous type of family households are 4-person households, comprising 208, and the most common type of nonfamily households are 1-person households, comprising 365.
| Household Size | Family Households | Nonfamily Households |
| 1-Person Households | - | 365 (33.2%) |
| 2-Person Households | 174 (15.8%) | 69 (6.3%) |
| 3-Person Households | 182 (16.5%) | 5 (0.4%) |
| 4-Person Households | 208 (18.9%) | 0 (0.0%) |
| 5-Person Households | 17 (1.5%) | 0 (0.0%) |
| 6-Person Households | 34 (3.1%) | 0 (0.0%) |
| 7+ Person Households | 47 (4.3%) | 0 (0.0%) |
| Total | 662 (60.1%) | 439 (39.9%) |
Female Fertility in Union Springs
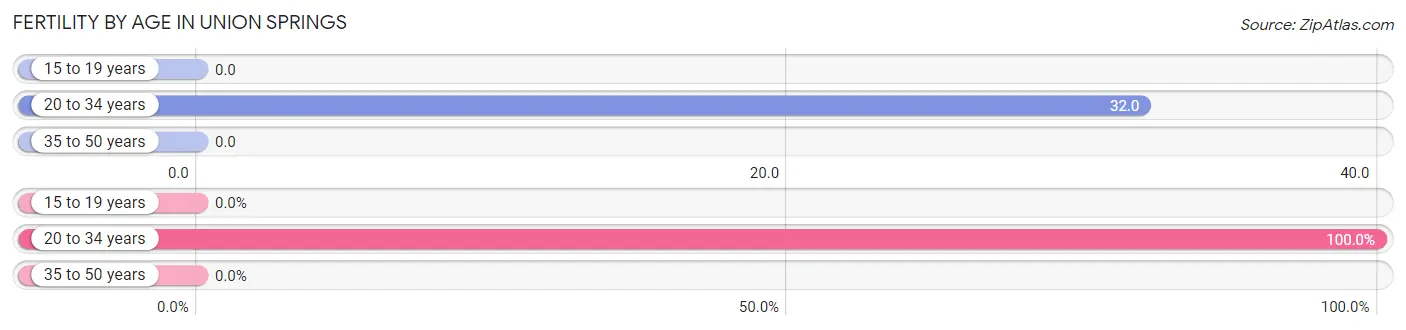
Fertility by Age in Union Springs
Average fertility rate in Union Springs is 14.0 births per 1,000 women. Women in the age bracket of 20 to 34 years have the highest fertility rate with 32.0 births per 1,000 women. Women in the age bracket of 20 to 34 years acount for 100.0% of all women with births.
| Age Bracket | Women with Births | Births / 1,000 Women |
| 15 to 19 years | 0 (0.0%) | 0.0 |
| 20 to 34 years | 11 (100.0%) | 32.0 |
| 35 to 50 years | 0 (0.0%) | 0.0 |
| Total | 11 (100.0%) | 14.0 |
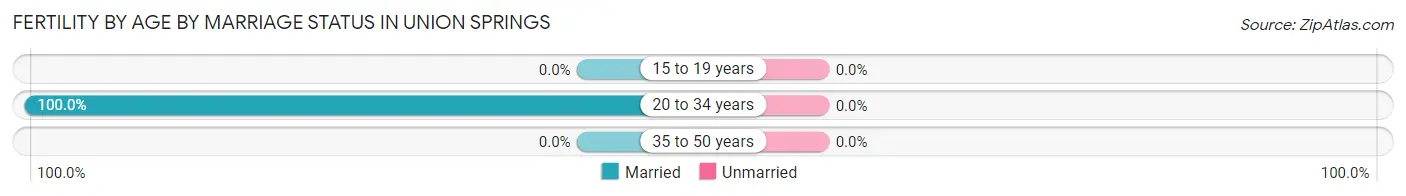
Fertility by Age by Marriage Status in Union Springs
| Age Bracket | Married | Unmarried |
| 15 to 19 years | 0 (0.0%) | 0 (0.0%) |
| 20 to 34 years | 11 (100.0%) | 0 (0.0%) |
| 35 to 50 years | 0 (0.0%) | 0 (0.0%) |
| Total | 11 (100.0%) | 0 (0.0%) |
Fertility by Education in Union Springs
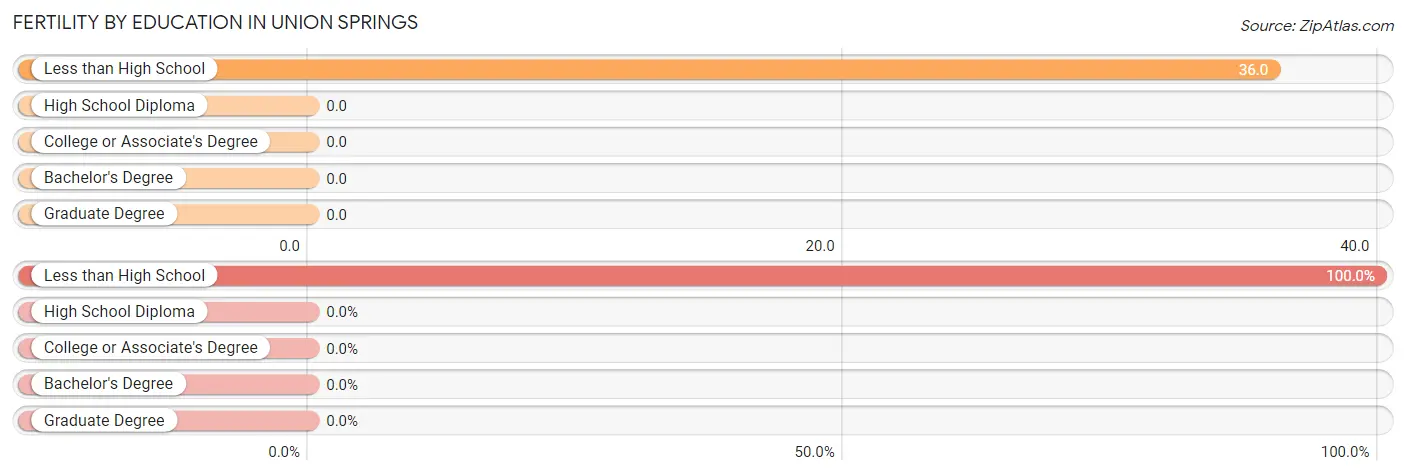
| Educational Attainment | Women with Births | Births / 1,000 Women |
| Less than High School | 11 (100.0%) | 36.0 |
| High School Diploma | 0 (0.0%) | 0.0 |
| College or Associate's Degree | 0 (0.0%) | 0.0 |
| Bachelor's Degree | 0 (0.0%) | 0.0 |
| Graduate Degree | 0 (0.0%) | 0.0 |
| Total | 11 (100.0%) | 14.0 |
Fertility by Education by Marriage Status in Union Springs
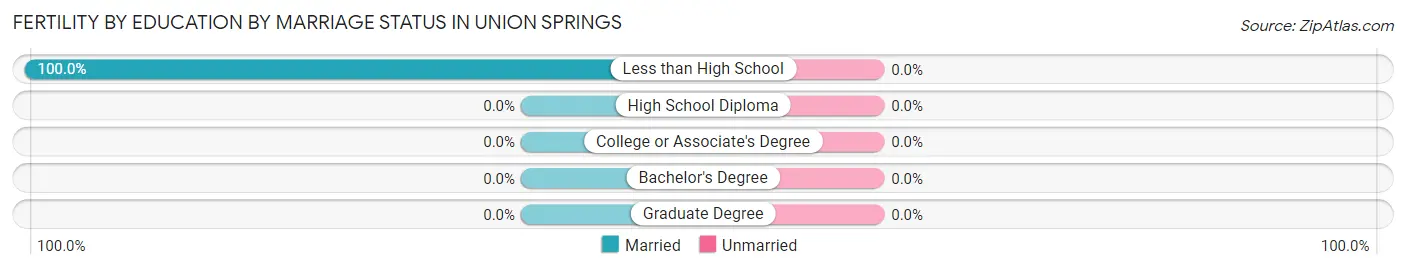
| Educational Attainment | Married | Unmarried |
| Less than High School | 11 (100.0%) | 0 (0.0%) |
| High School Diploma | 0 (0.0%) | 0 (0.0%) |
| College or Associate's Degree | 0 (0.0%) | 0 (0.0%) |
| Bachelor's Degree | 0 (0.0%) | 0 (0.0%) |
| Graduate Degree | 0 (0.0%) | 0 (0.0%) |
| Total | 11 (100.0%) | 0 (0.0%) |
Employment Characteristics in Union Springs
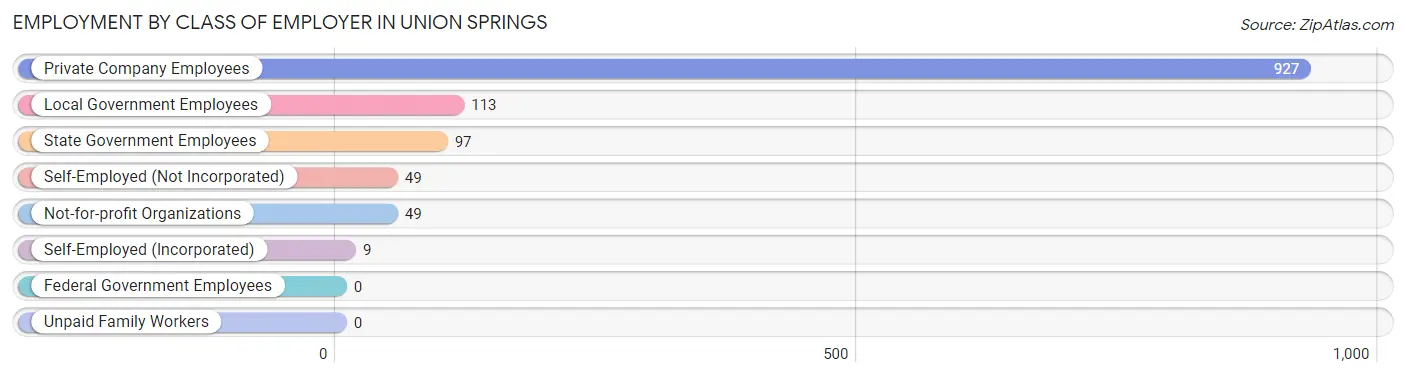
Employment by Class of Employer in Union Springs
Among the 1,244 employed individuals in Union Springs, private company employees (927 | 74.5%), local government employees (113 | 9.1%), and state government employees (97 | 7.8%) make up the most common classes of employment.
| Employer Class | # Employees | % Employees |
| Private Company Employees | 927 | 74.5% |
| Self-Employed (Incorporated) | 9 | 0.7% |
| Self-Employed (Not Incorporated) | 49 | 3.9% |
| Not-for-profit Organizations | 49 | 3.9% |
| Local Government Employees | 113 | 9.1% |
| State Government Employees | 97 | 7.8% |
| Federal Government Employees | 0 | 0.0% |
| Unpaid Family Workers | 0 | 0.0% |
| Total | 1,244 | 100.0% |
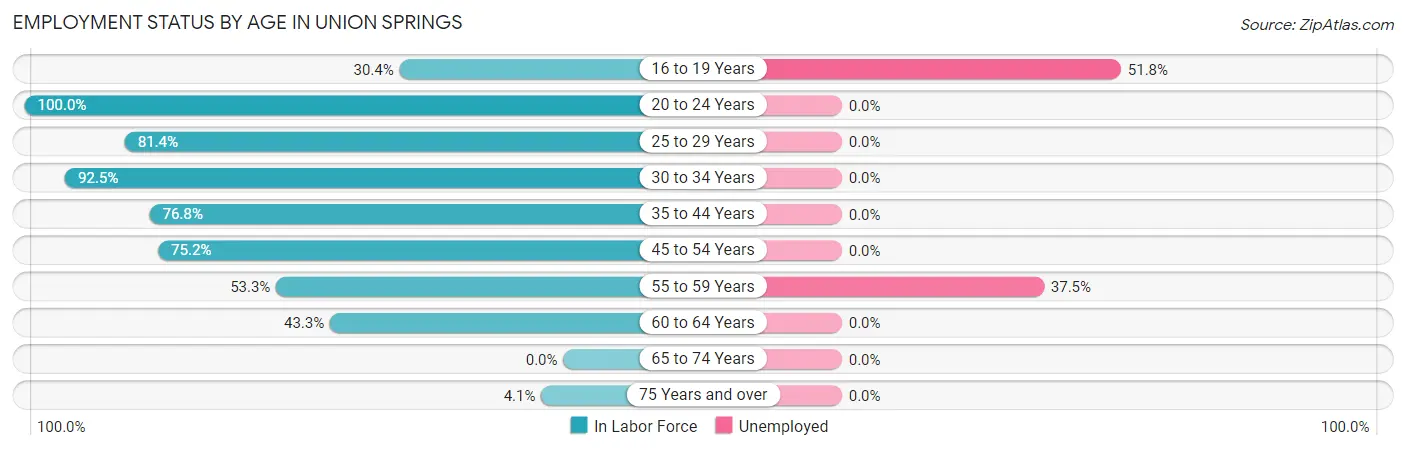
Employment Status by Age in Union Springs
According to the labor force statistics for Union Springs, out of the total population over 16 years of age (2,443), 56.9% or 1,390 individuals are in the labor force, with 7.6% or 106 of them unemployed. The age group with the highest labor force participation rate is 20 to 24 years, with 100.0% or 65 individuals in the labor force. Within the labor force, the 16 to 19 years age range has the highest percentage of unemployed individuals, with 51.8% or 72 of them being unemployed.
| Age Bracket | In Labor Force | Unemployed |
| 16 to 19 Years | 139 (30.4%) | 72 (51.8%) |
| 20 to 24 Years | 65 (100.0%) | 0 (0.0%) |
| 25 to 29 Years | 262 (81.4%) | 0 (0.0%) |
| 30 to 34 Years | 222 (92.5%) | 0 (0.0%) |
| 35 to 44 Years | 307 (76.8%) | 0 (0.0%) |
| 45 to 54 Years | 237 (75.2%) | 0 (0.0%) |
| 55 to 59 Years | 88 (53.3%) | 33 (37.5%) |
| 60 to 64 Years | 65 (43.3%) | 0 (0.0%) |
| 65 to 74 Years | 0 (0.0%) | 0 (0.0%) |
| 75 Years and over | 4 (4.1%) | 0 (0.0%) |
| Total | 1,390 (56.9%) | 106 (7.6%) |
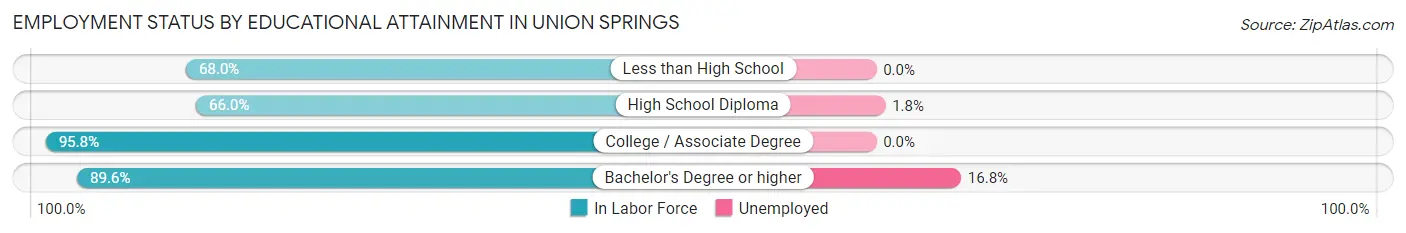
Employment Status by Educational Attainment in Union Springs
According to labor force statistics for Union Springs, 74.2% of individuals (1,181) out of the total population between 25 and 64 years of age (1,592) are in the labor force, with 2.8% or 33 of them being unemployed. The group with the highest labor force participation rate are those with the educational attainment of college / associate degree, with 95.8% or 249 individuals in the labor force. Within the labor force, individuals with bachelor's degree or higher education have the highest percentage of unemployment, with 16.8% or 26 of them being unemployed.
| Educational Attainment | In Labor Force | Unemployed |
| Less than High School | 396 (68.0%) | 0 (0.0%) |
| High School Diploma | 381 (66.0%) | 10 (1.8%) |
| College / Associate Degree | 249 (95.8%) | 0 (0.0%) |
| Bachelor's Degree or higher | 155 (89.6%) | 29 (16.8%) |
| Total | 1,181 (74.2%) | 45 (2.8%) |
Employment Occupations by Sex in Union Springs
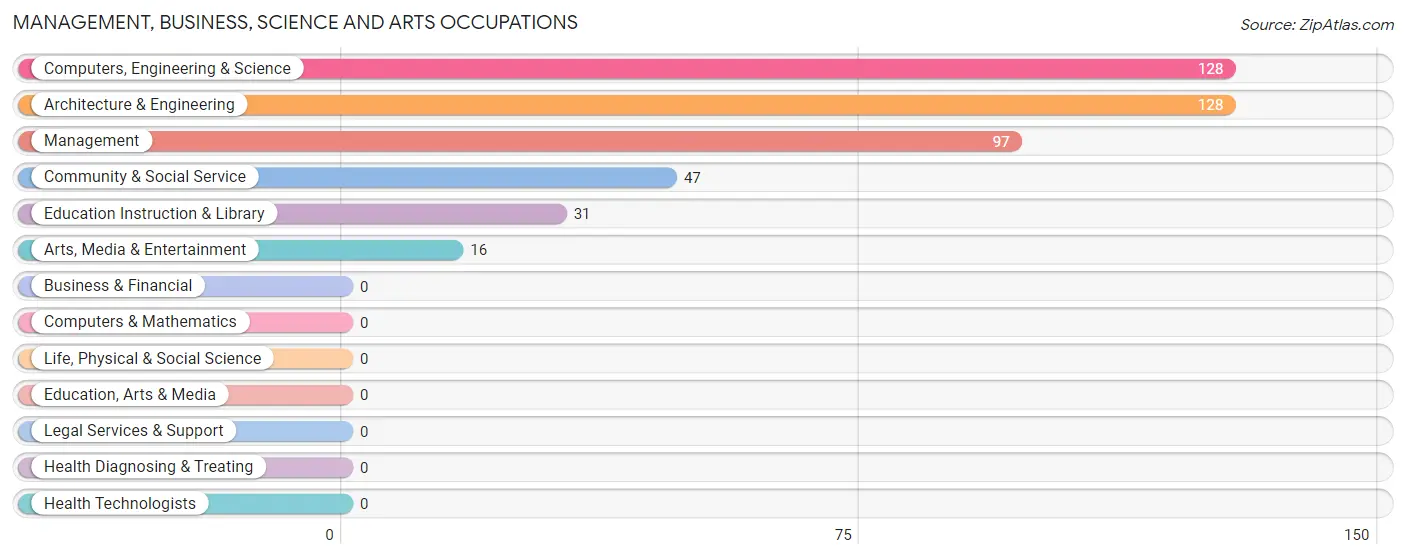
Management, Business, Science and Arts Occupations
The most common Management, Business, Science and Arts occupations in Union Springs are Computers, Engineering & Science (128 | 10.0%), Architecture & Engineering (128 | 10.0%), Management (97 | 7.5%), Community & Social Service (47 | 3.7%), and Education Instruction & Library (31 | 2.4%).
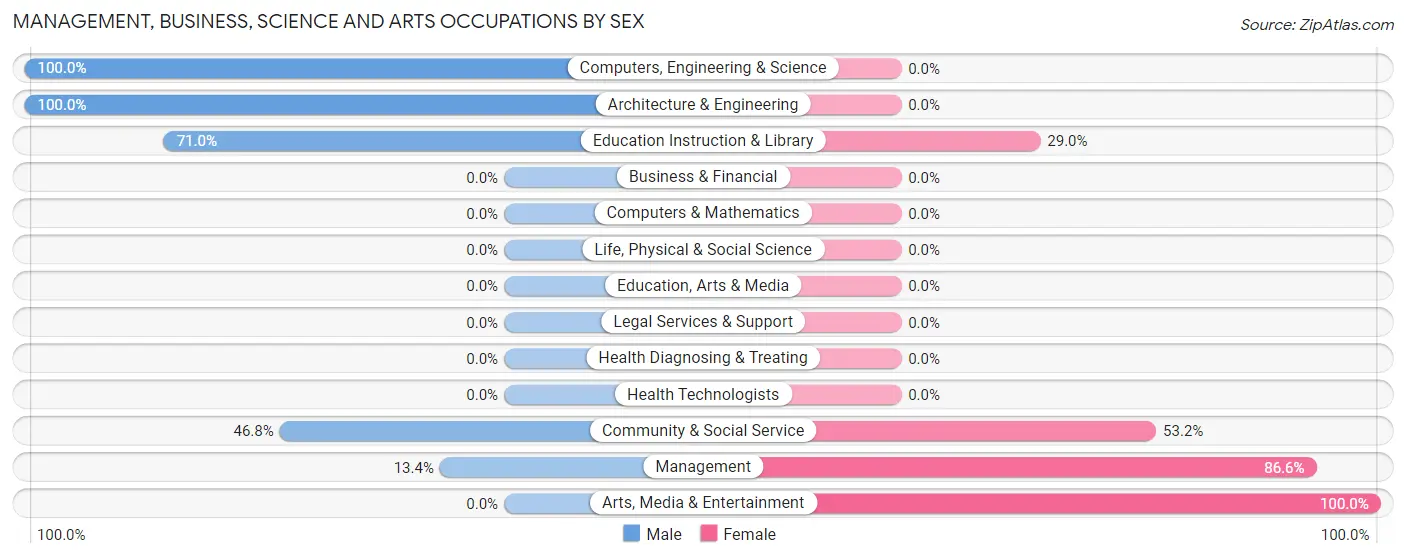
Management, Business, Science and Arts Occupations by Sex
Within the Management, Business, Science and Arts occupations in Union Springs, the most male-oriented occupations are Computers, Engineering & Science (100.0%), Architecture & Engineering (100.0%), and Education Instruction & Library (71.0%), while the most female-oriented occupations are Arts, Media & Entertainment (100.0%), Management (86.6%), and Community & Social Service (53.2%).
| Occupation | Male | Female |
| Management | 13 (13.4%) | 84 (86.6%) |
| Business & Financial | 0 (0.0%) | 0 (0.0%) |
| Computers, Engineering & Science | 128 (100.0%) | 0 (0.0%) |
| Computers & Mathematics | 0 (0.0%) | 0 (0.0%) |
| Architecture & Engineering | 128 (100.0%) | 0 (0.0%) |
| Life, Physical & Social Science | 0 (0.0%) | 0 (0.0%) |
| Community & Social Service | 22 (46.8%) | 25 (53.2%) |
| Education, Arts & Media | 0 (0.0%) | 0 (0.0%) |
| Legal Services & Support | 0 (0.0%) | 0 (0.0%) |
| Education Instruction & Library | 22 (71.0%) | 9 (29.0%) |
| Arts, Media & Entertainment | 0 (0.0%) | 16 (100.0%) |
| Health Diagnosing & Treating | 0 (0.0%) | 0 (0.0%) |
| Health Technologists | 0 (0.0%) | 0 (0.0%) |
| Total (Category) | 163 (59.9%) | 109 (40.1%) |
| Total (Overall) | 567 (44.2%) | 717 (55.8%) |
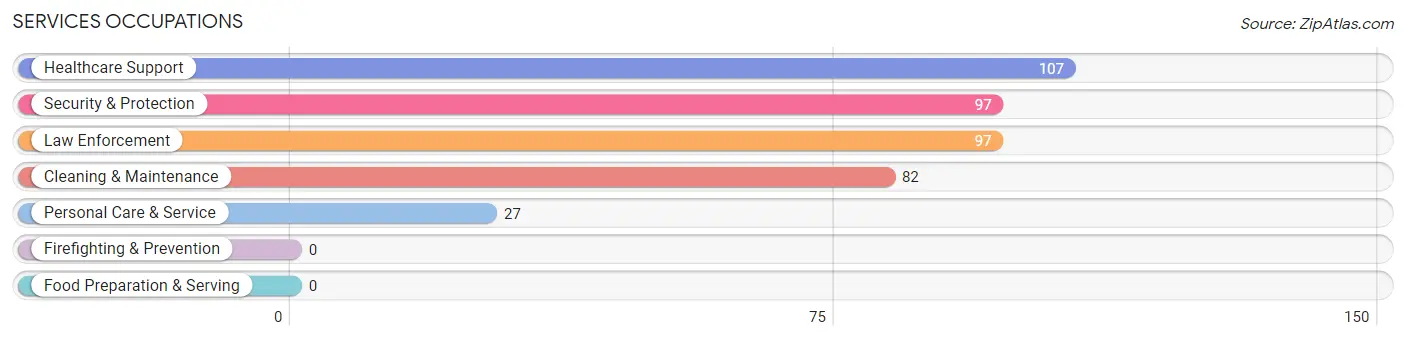
Services Occupations
The most common Services occupations in Union Springs are Healthcare Support (107 | 8.3%), Security & Protection (97 | 7.5%), Law Enforcement (97 | 7.5%), Cleaning & Maintenance (82 | 6.4%), and Personal Care & Service (27 | 2.1%).
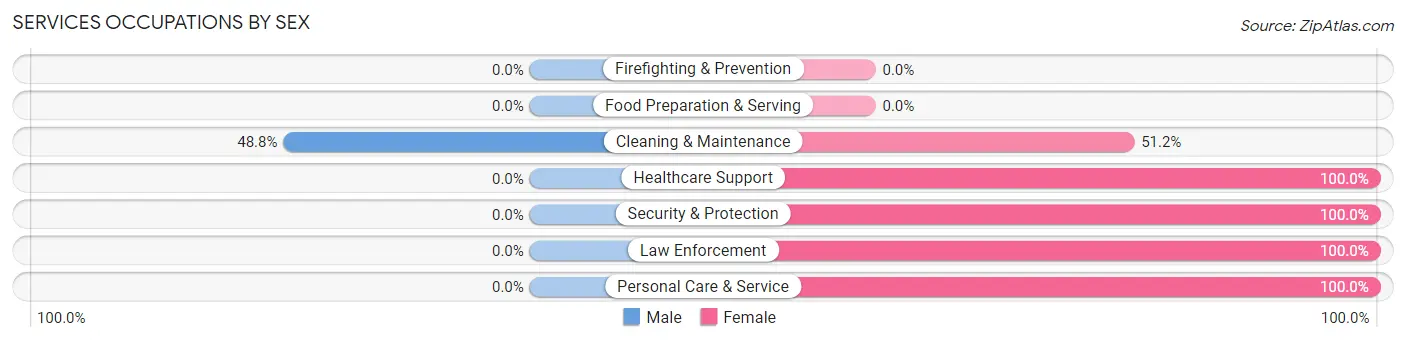
Services Occupations by Sex
| Occupation | Male | Female |
| Healthcare Support | 0 (0.0%) | 107 (100.0%) |
| Security & Protection | 0 (0.0%) | 97 (100.0%) |
| Firefighting & Prevention | 0 (0.0%) | 0 (0.0%) |
| Law Enforcement | 0 (0.0%) | 97 (100.0%) |
| Food Preparation & Serving | 0 (0.0%) | 0 (0.0%) |
| Cleaning & Maintenance | 40 (48.8%) | 42 (51.2%) |
| Personal Care & Service | 0 (0.0%) | 27 (100.0%) |
| Total (Category) | 40 (12.8%) | 273 (87.2%) |
| Total (Overall) | 567 (44.2%) | 717 (55.8%) |
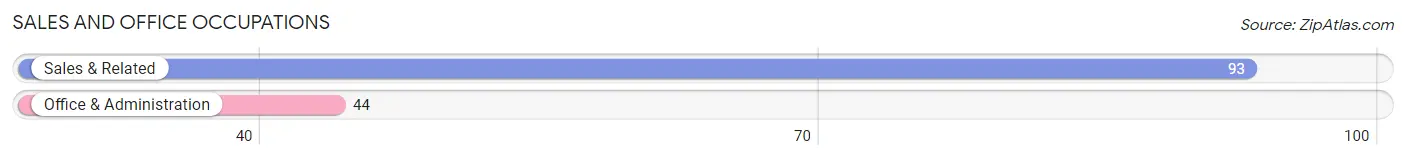
Sales and Office Occupations
The most common Sales and Office occupations in Union Springs are Sales & Related (93 | 7.2%), and Office & Administration (44 | 3.4%).
Sales and Office Occupations by Sex
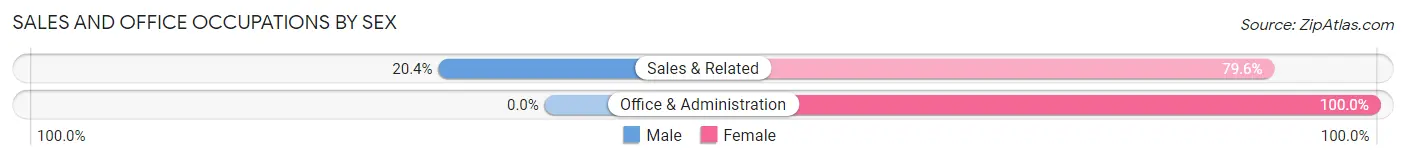
| Occupation | Male | Female |
| Sales & Related | 19 (20.4%) | 74 (79.6%) |
| Office & Administration | 0 (0.0%) | 44 (100.0%) |
| Total (Category) | 19 (13.9%) | 118 (86.1%) |
| Total (Overall) | 567 (44.2%) | 717 (55.8%) |
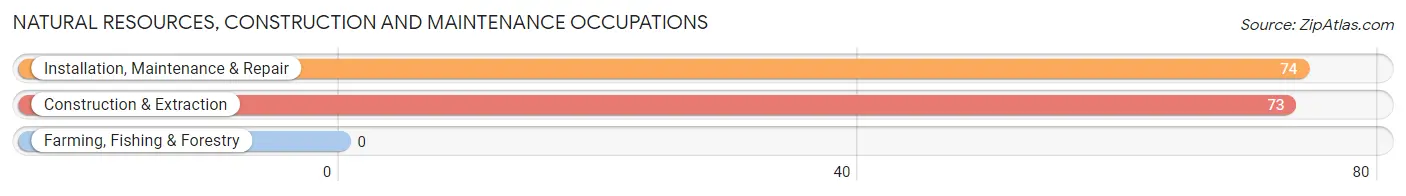
Natural Resources, Construction and Maintenance Occupations
The most common Natural Resources, Construction and Maintenance occupations in Union Springs are Installation, Maintenance & Repair (74 | 5.8%), and Construction & Extraction (73 | 5.7%).
Natural Resources, Construction and Maintenance Occupations by Sex
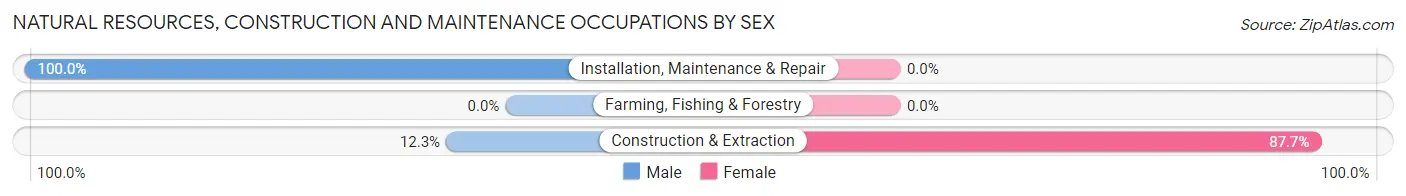
| Occupation | Male | Female |
| Farming, Fishing & Forestry | 0 (0.0%) | 0 (0.0%) |
| Construction & Extraction | 9 (12.3%) | 64 (87.7%) |
| Installation, Maintenance & Repair | 74 (100.0%) | 0 (0.0%) |
| Total (Category) | 83 (56.5%) | 64 (43.5%) |
| Total (Overall) | 567 (44.2%) | 717 (55.8%) |
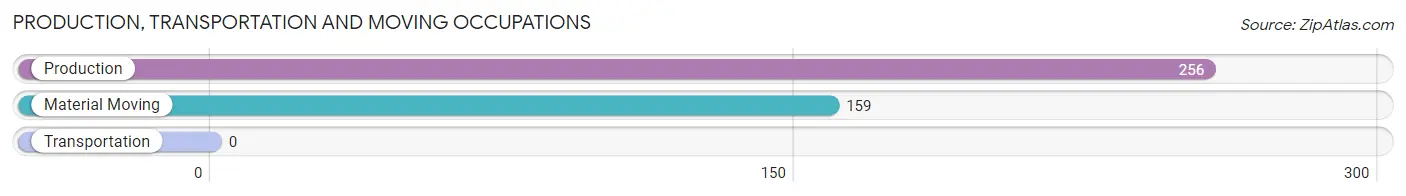
Production, Transportation and Moving Occupations
The most common Production, Transportation and Moving occupations in Union Springs are Production (256 | 19.9%), and Material Moving (159 | 12.4%).
Production, Transportation and Moving Occupations by Sex
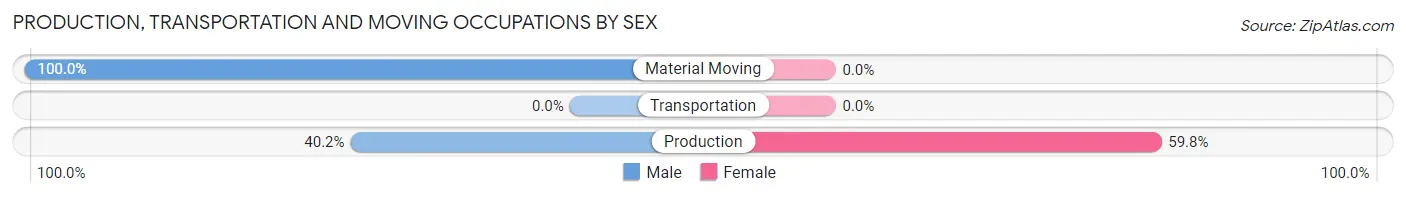
| Occupation | Male | Female |
| Production | 103 (40.2%) | 153 (59.8%) |
| Transportation | 0 (0.0%) | 0 (0.0%) |
| Material Moving | 159 (100.0%) | 0 (0.0%) |
| Total (Category) | 262 (63.1%) | 153 (36.9%) |
| Total (Overall) | 567 (44.2%) | 717 (55.8%) |
Employment Industries by Sex in Union Springs
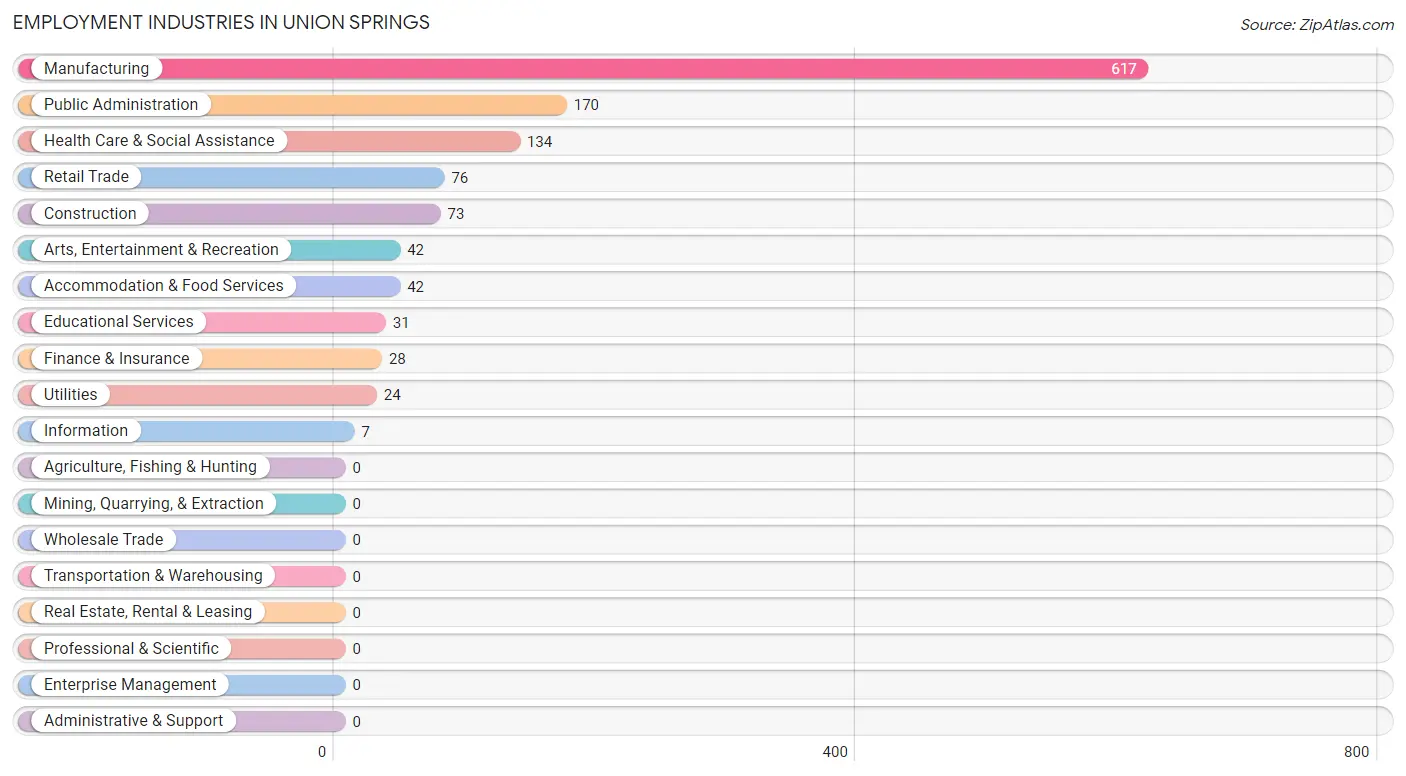
Employment Industries in Union Springs
The major employment industries in Union Springs include Manufacturing (617 | 48.0%), Public Administration (170 | 13.2%), Health Care & Social Assistance (134 | 10.4%), Retail Trade (76 | 5.9%), and Construction (73 | 5.7%).
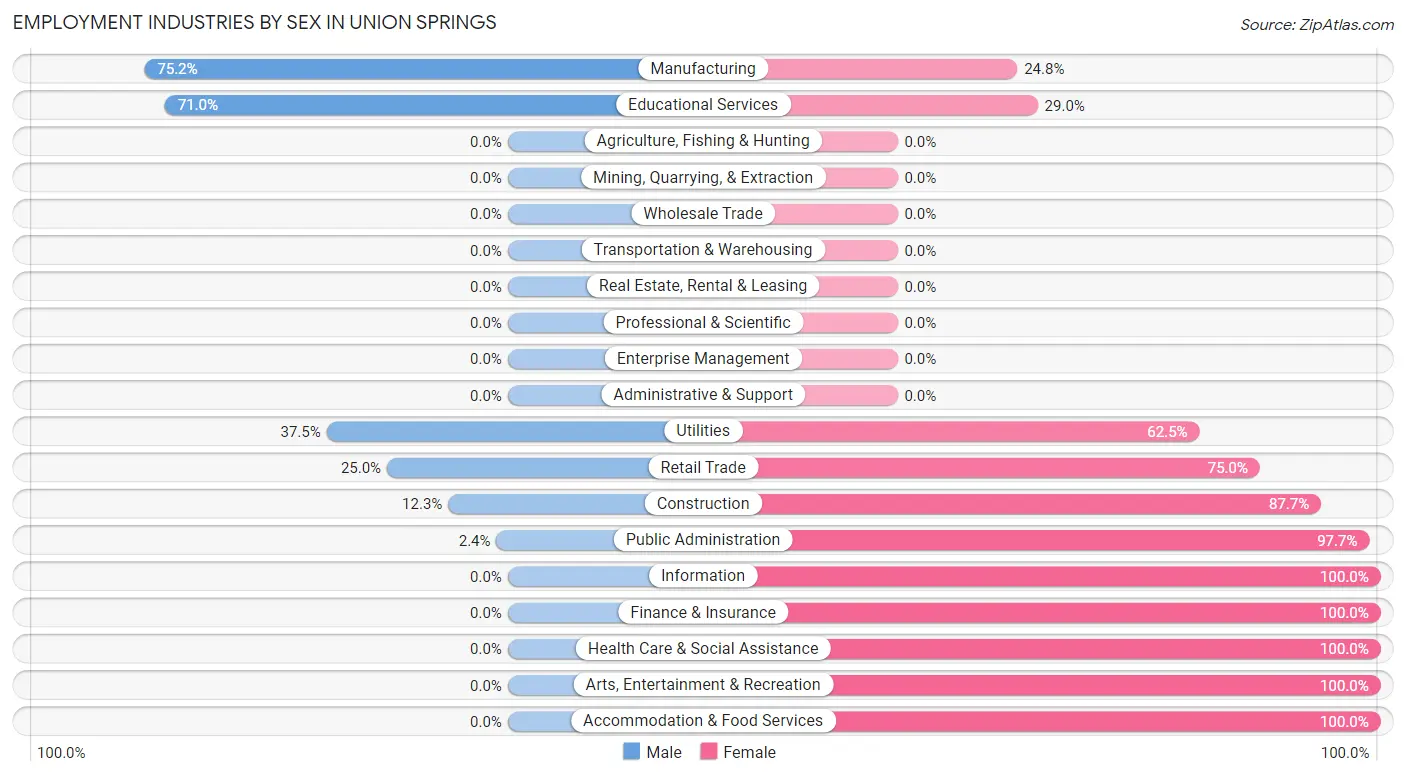
Employment Industries by Sex in Union Springs
The Union Springs industries that see more men than women are Manufacturing (75.2%), Educational Services (71.0%), and Utilities (37.5%), whereas the industries that tend to have a higher number of women are Information (100.0%), Finance & Insurance (100.0%), and Health Care & Social Assistance (100.0%).
| Industry | Male | Female |
| Agriculture, Fishing & Hunting | 0 (0.0%) | 0 (0.0%) |
| Mining, Quarrying, & Extraction | 0 (0.0%) | 0 (0.0%) |
| Construction | 9 (12.3%) | 64 (87.7%) |
| Manufacturing | 464 (75.2%) | 153 (24.8%) |
| Wholesale Trade | 0 (0.0%) | 0 (0.0%) |
| Retail Trade | 19 (25.0%) | 57 (75.0%) |
| Transportation & Warehousing | 0 (0.0%) | 0 (0.0%) |
| Utilities | 9 (37.5%) | 15 (62.5%) |
| Information | 0 (0.0%) | 7 (100.0%) |
| Finance & Insurance | 0 (0.0%) | 28 (100.0%) |
| Real Estate, Rental & Leasing | 0 (0.0%) | 0 (0.0%) |
| Professional & Scientific | 0 (0.0%) | 0 (0.0%) |
| Enterprise Management | 0 (0.0%) | 0 (0.0%) |
| Administrative & Support | 0 (0.0%) | 0 (0.0%) |
| Educational Services | 22 (71.0%) | 9 (29.0%) |
| Health Care & Social Assistance | 0 (0.0%) | 134 (100.0%) |
| Arts, Entertainment & Recreation | 0 (0.0%) | 42 (100.0%) |
| Accommodation & Food Services | 0 (0.0%) | 42 (100.0%) |
| Public Administration | 4 (2.4%) | 166 (97.7%) |
| Total | 567 (44.2%) | 717 (55.8%) |
Education in Union Springs
School Enrollment in Union Springs
The most common levels of schooling among the 994 students in Union Springs are high school (448 | 45.1%), middle school (286 | 28.8%), and elementary school (171 | 17.2%).
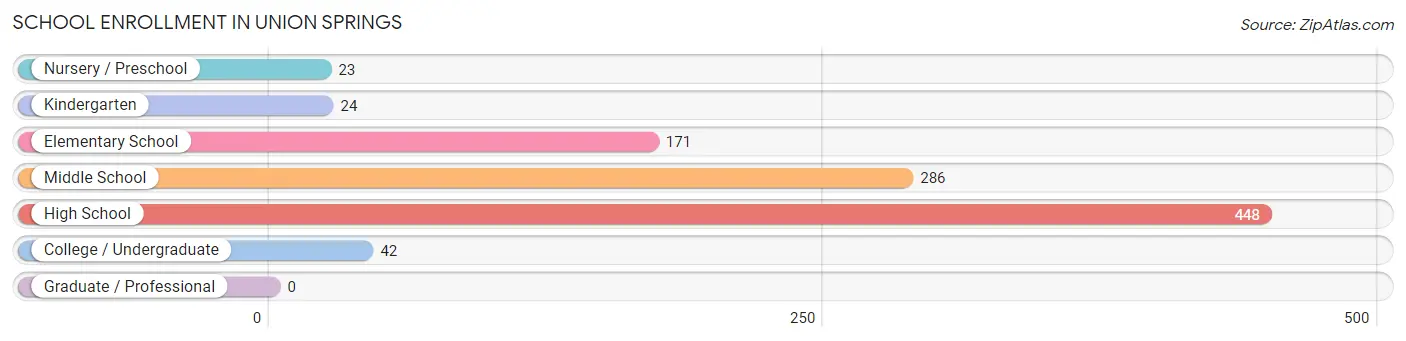
| School Level | # Students | % Students |
| Nursery / Preschool | 23 | 2.3% |
| Kindergarten | 24 | 2.4% |
| Elementary School | 171 | 17.2% |
| Middle School | 286 | 28.8% |
| High School | 448 | 45.1% |
| College / Undergraduate | 42 | 4.2% |
| Graduate / Professional | 0 | 0.0% |
| Total | 994 | 100.0% |
School Enrollment by Age by Funding Source in Union Springs
Out of a total of 994 students who are enrolled in schools in Union Springs, 255 (25.7%) attend a private institution, while the remaining 739 (74.3%) are enrolled in public schools. The age group of 15 to 17 year olds has the highest likelihood of being enrolled in private schools, with 62 (42.5% in the age bracket) enrolled. Conversely, the age group of 3 to 4 year olds has the lowest likelihood of being enrolled in a private school, with 21 (100.0% in the age bracket) attending a public institution.
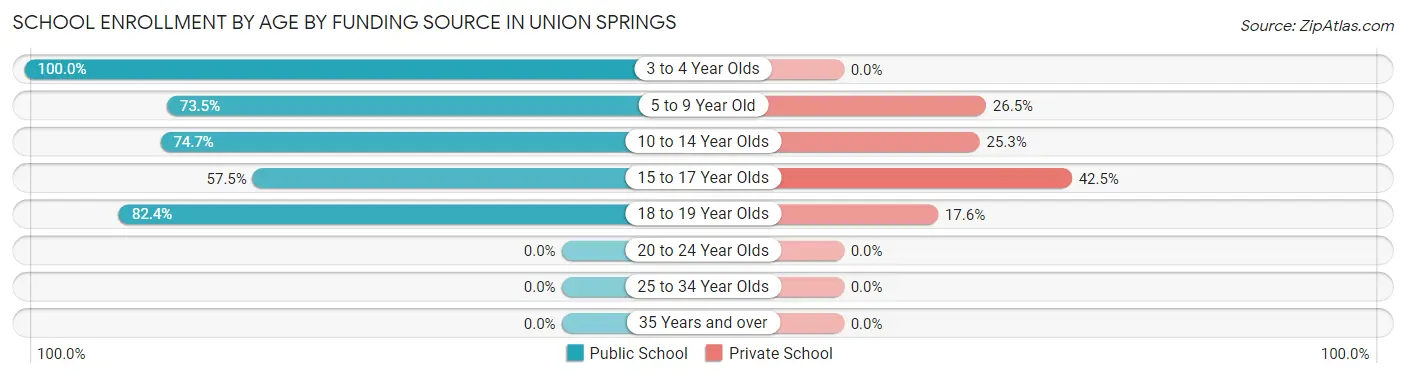
| Age Bracket | Public School | Private School |
| 3 to 4 Year Olds | 21 (100.0%) | 0 (0.0%) |
| 5 to 9 Year Old | 136 (73.5%) | 49 (26.5%) |
| 10 to 14 Year Olds | 301 (74.7%) | 102 (25.3%) |
| 15 to 17 Year Olds | 84 (57.5%) | 62 (42.5%) |
| 18 to 19 Year Olds | 197 (82.4%) | 42 (17.6%) |
| 20 to 24 Year Olds | 0 (0.0%) | 0 (0.0%) |
| 25 to 34 Year Olds | 0 (0.0%) | 0 (0.0%) |
| 35 Years and over | 0 (0.0%) | 0 (0.0%) |
| Total | 739 (74.3%) | 255 (25.7%) |
Educational Attainment by Field of Study in Union Springs
Computers & mathematics (69 | 27.1%), business (55 | 21.6%), engineering (26 | 10.2%), arts & humanities (26 | 10.2%), and communications (25 | 9.8%) are the most common fields of study among 255 individuals in Union Springs who have obtained a bachelor's degree or higher.
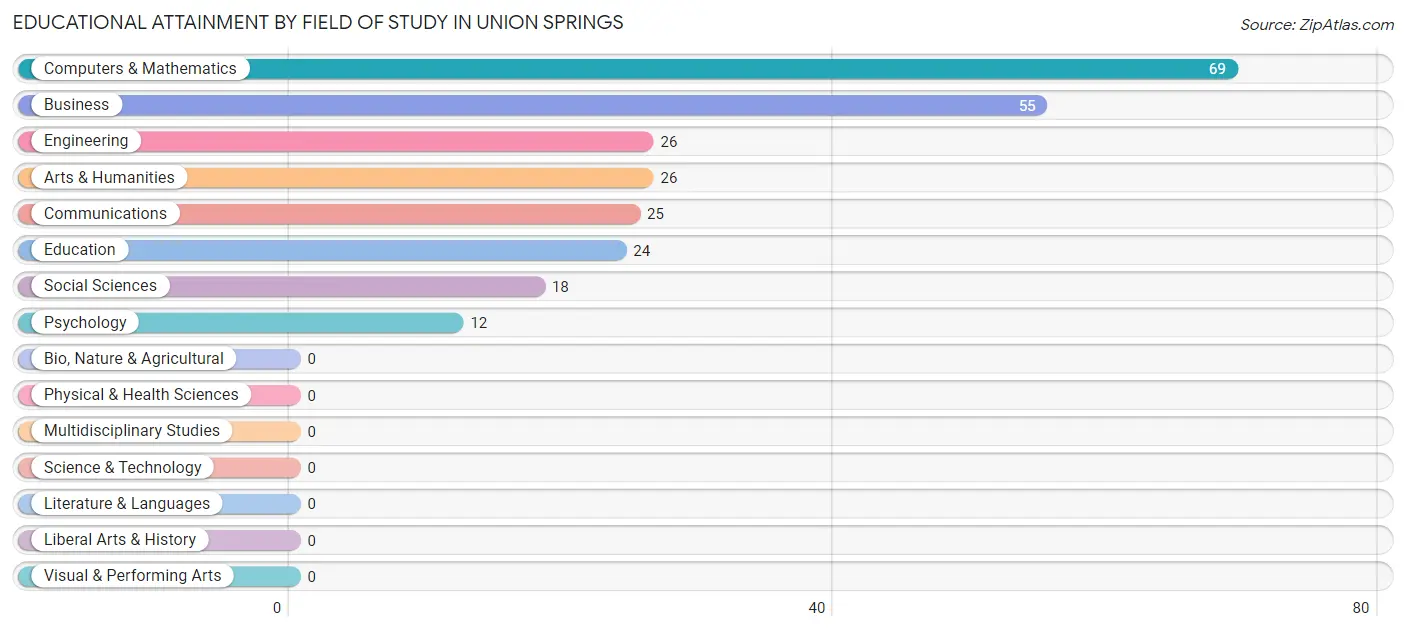
| Field of Study | # Graduates | % Graduates |
| Computers & Mathematics | 69 | 27.1% |
| Bio, Nature & Agricultural | 0 | 0.0% |
| Physical & Health Sciences | 0 | 0.0% |
| Psychology | 12 | 4.7% |
| Social Sciences | 18 | 7.1% |
| Engineering | 26 | 10.2% |
| Multidisciplinary Studies | 0 | 0.0% |
| Science & Technology | 0 | 0.0% |
| Business | 55 | 21.6% |
| Education | 24 | 9.4% |
| Literature & Languages | 0 | 0.0% |
| Liberal Arts & History | 0 | 0.0% |
| Visual & Performing Arts | 0 | 0.0% |
| Communications | 25 | 9.8% |
| Arts & Humanities | 26 | 10.2% |
| Total | 255 | 100.0% |
Transportation & Commute in Union Springs
Vehicle Availability by Sex in Union Springs
The most prevalent vehicle ownership categories in Union Springs are males with 2 vehicles (421, accounting for 80.8%) and females with 2 vehicles (312, making up 59.1%).
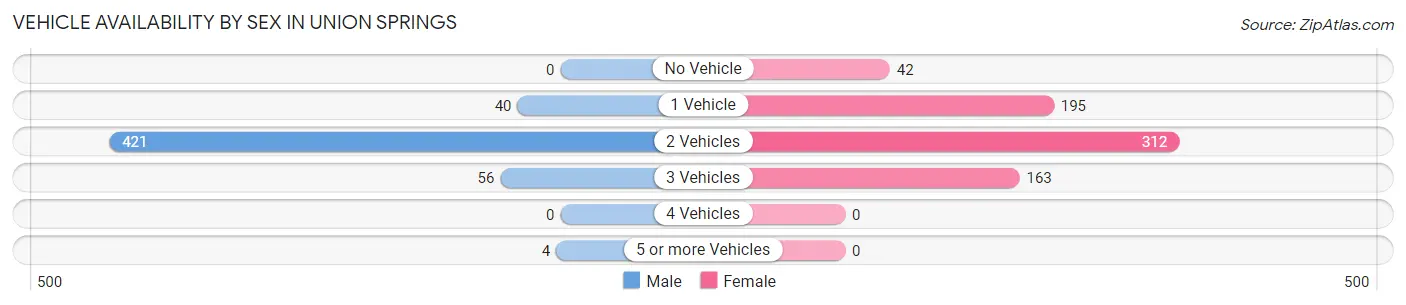
| Vehicles Available | Male | Female |
| No Vehicle | 0 (0.0%) | 42 (5.9%) |
| 1 Vehicle | 40 (7.7%) | 195 (27.4%) |
| 2 Vehicles | 421 (80.8%) | 312 (43.8%) |
| 3 Vehicles | 56 (10.7%) | 163 (22.9%) |
| 4 Vehicles | 0 (0.0%) | 0 (0.0%) |
| 5 or more Vehicles | 4 (0.8%) | 0 (0.0%) |
| Total | 521 (100.0%) | 712 (100.0%) |
Commute Time in Union Springs
The most frequently occuring commute durations in Union Springs are 45 to 59 minutes (360 commuters, 29.1%), 5 to 9 minutes (208 commuters, 16.8%), and 60 to 89 minutes (188 commuters, 15.2%).
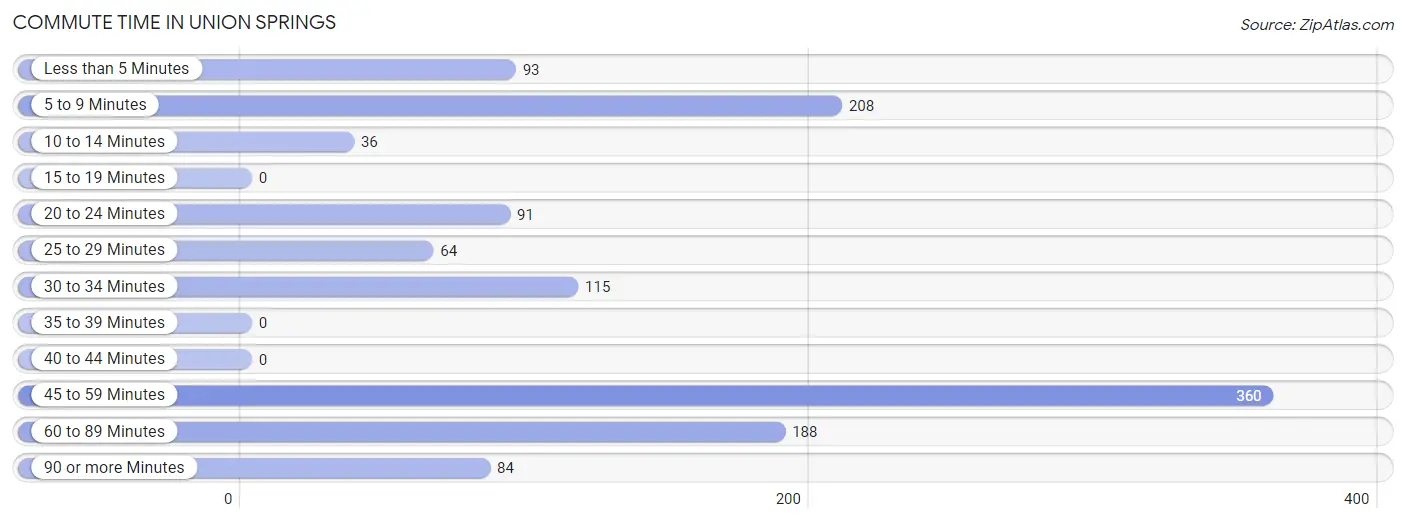
| Commute Time | # Commuters | % Commuters |
| Less than 5 Minutes | 93 | 7.5% |
| 5 to 9 Minutes | 208 | 16.8% |
| 10 to 14 Minutes | 36 | 2.9% |
| 15 to 19 Minutes | 0 | 0.0% |
| 20 to 24 Minutes | 91 | 7.3% |
| 25 to 29 Minutes | 64 | 5.2% |
| 30 to 34 Minutes | 115 | 9.3% |
| 35 to 39 Minutes | 0 | 0.0% |
| 40 to 44 Minutes | 0 | 0.0% |
| 45 to 59 Minutes | 360 | 29.1% |
| 60 to 89 Minutes | 188 | 15.2% |
| 90 or more Minutes | 84 | 6.8% |
Commute Time by Sex in Union Springs
The most common commute times in Union Springs are 45 to 59 minutes (262 commuters, 49.7%) for males and 5 to 9 minutes (166 commuters, 23.3%) for females.
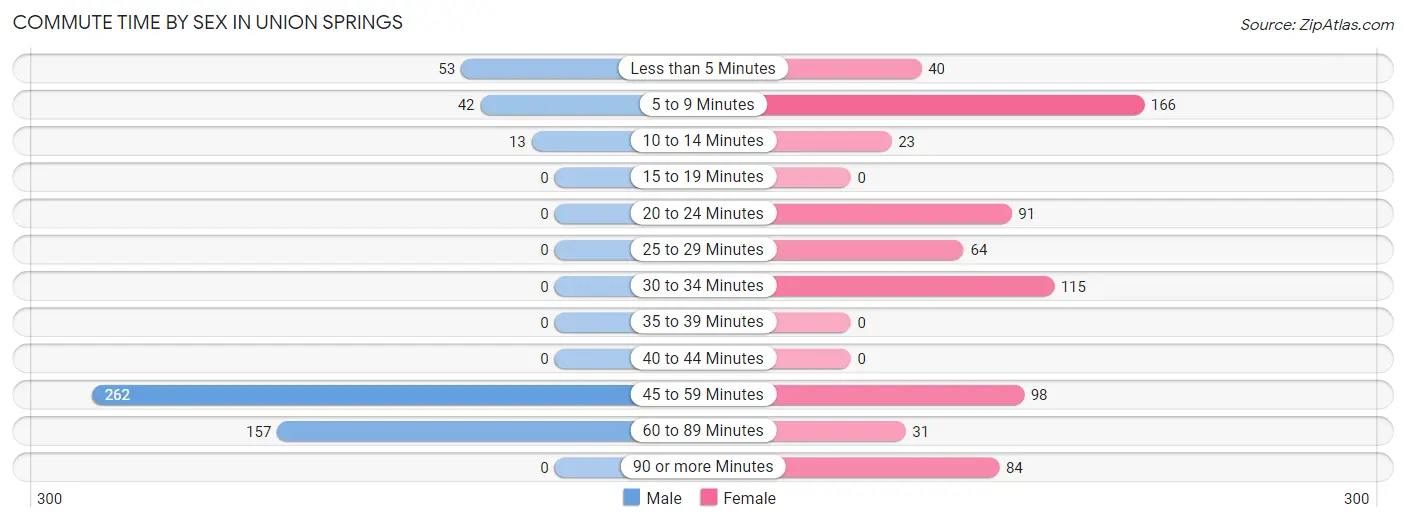
| Commute Time | Male | Female |
| Less than 5 Minutes | 53 (10.1%) | 40 (5.6%) |
| 5 to 9 Minutes | 42 (8.0%) | 166 (23.3%) |
| 10 to 14 Minutes | 13 (2.5%) | 23 (3.2%) |
| 15 to 19 Minutes | 0 (0.0%) | 0 (0.0%) |
| 20 to 24 Minutes | 0 (0.0%) | 91 (12.8%) |
| 25 to 29 Minutes | 0 (0.0%) | 64 (9.0%) |
| 30 to 34 Minutes | 0 (0.0%) | 115 (16.2%) |
| 35 to 39 Minutes | 0 (0.0%) | 0 (0.0%) |
| 40 to 44 Minutes | 0 (0.0%) | 0 (0.0%) |
| 45 to 59 Minutes | 262 (49.7%) | 98 (13.8%) |
| 60 to 89 Minutes | 157 (29.8%) | 31 (4.3%) |
| 90 or more Minutes | 0 (0.0%) | 84 (11.8%) |
Time of Departure to Work by Sex in Union Springs
The most frequent times of departure to work in Union Springs are 12:00 PM to 3:59 PM (180, 34.2%) for males and 6:30 AM to 6:59 AM (218, 30.6%) for females.
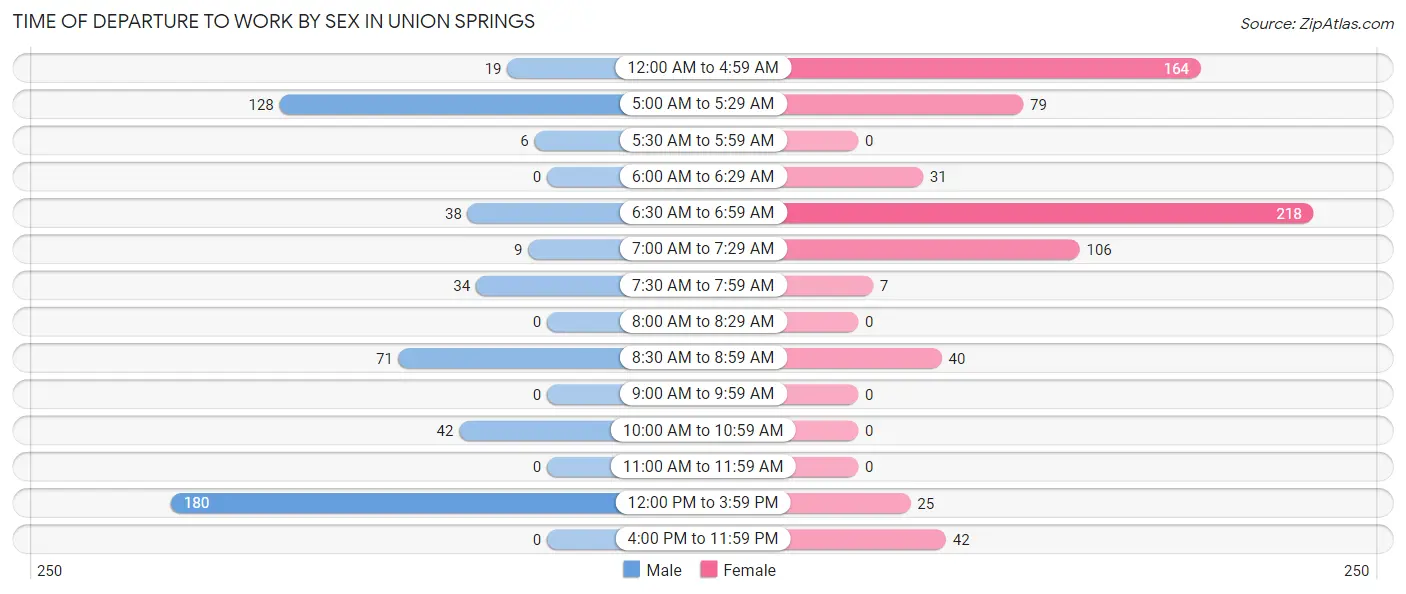
| Time of Departure | Male | Female |
| 12:00 AM to 4:59 AM | 19 (3.6%) | 164 (23.0%) |
| 5:00 AM to 5:29 AM | 128 (24.3%) | 79 (11.1%) |
| 5:30 AM to 5:59 AM | 6 (1.1%) | 0 (0.0%) |
| 6:00 AM to 6:29 AM | 0 (0.0%) | 31 (4.3%) |
| 6:30 AM to 6:59 AM | 38 (7.2%) | 218 (30.6%) |
| 7:00 AM to 7:29 AM | 9 (1.7%) | 106 (14.9%) |
| 7:30 AM to 7:59 AM | 34 (6.5%) | 7 (1.0%) |
| 8:00 AM to 8:29 AM | 0 (0.0%) | 0 (0.0%) |
| 8:30 AM to 8:59 AM | 71 (13.5%) | 40 (5.6%) |
| 9:00 AM to 9:59 AM | 0 (0.0%) | 0 (0.0%) |
| 10:00 AM to 10:59 AM | 42 (8.0%) | 0 (0.0%) |
| 11:00 AM to 11:59 AM | 0 (0.0%) | 0 (0.0%) |
| 12:00 PM to 3:59 PM | 180 (34.2%) | 25 (3.5%) |
| 4:00 PM to 11:59 PM | 0 (0.0%) | 42 (5.9%) |
| Total | 527 (100.0%) | 712 (100.0%) |
Housing Occupancy in Union Springs
Occupancy by Ownership in Union Springs
Of the total 1,101 dwellings in Union Springs, owner-occupied units account for 375 (34.1%), while renter-occupied units make up 726 (65.9%).
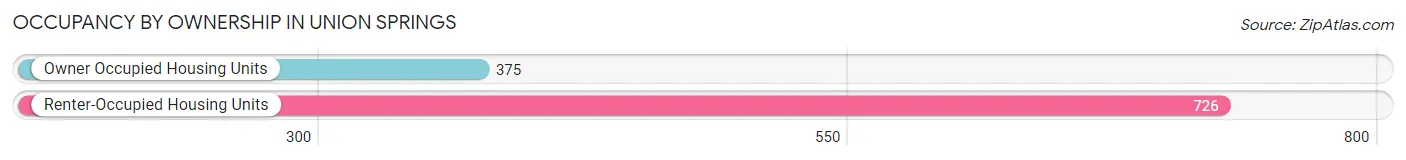
| Occupancy | # Housing Units | % Housing Units |
| Owner Occupied Housing Units | 375 | 34.1% |
| Renter-Occupied Housing Units | 726 | 65.9% |
| Total Occupied Housing Units | 1,101 | 100.0% |
Occupancy by Household Size in Union Springs
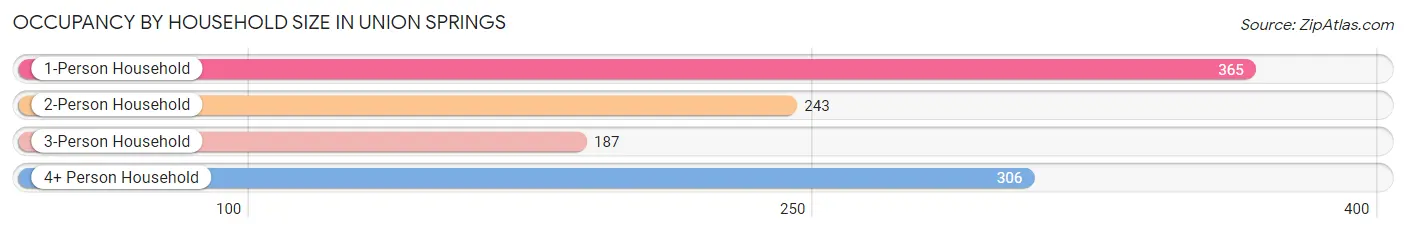
| Household Size | # Housing Units | % Housing Units |
| 1-Person Household | 365 | 33.2% |
| 2-Person Household | 243 | 22.1% |
| 3-Person Household | 187 | 17.0% |
| 4+ Person Household | 306 | 27.8% |
| Total Housing Units | 1,101 | 100.0% |
Occupancy by Ownership by Household Size in Union Springs
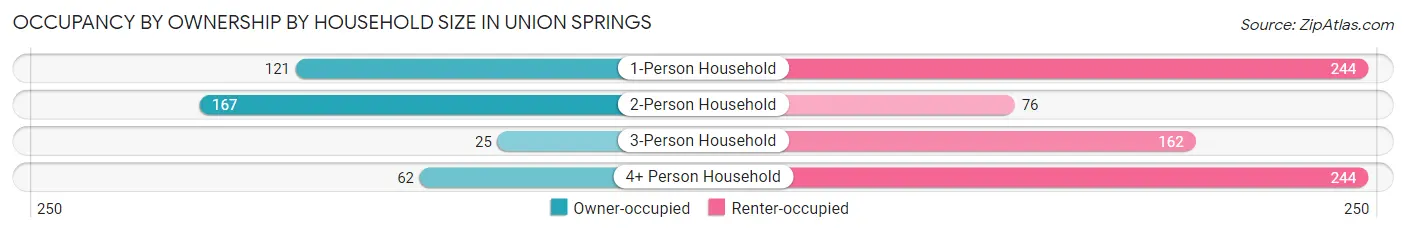
| Household Size | Owner-occupied | Renter-occupied |
| 1-Person Household | 121 (33.2%) | 244 (66.8%) |
| 2-Person Household | 167 (68.7%) | 76 (31.3%) |
| 3-Person Household | 25 (13.4%) | 162 (86.6%) |
| 4+ Person Household | 62 (20.3%) | 244 (79.7%) |
| Total Housing Units | 375 (34.1%) | 726 (65.9%) |
Occupancy by Educational Attainment in Union Springs
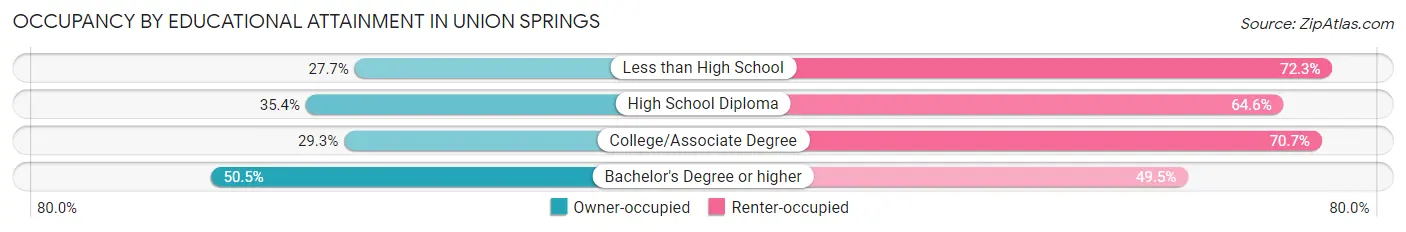
| Household Size | Owner-occupied | Renter-occupied |
| Less than High School | 104 (27.7%) | 272 (72.3%) |
| High School Diploma | 103 (35.4%) | 188 (64.6%) |
| College/Associate Degree | 71 (29.3%) | 171 (70.7%) |
| Bachelor's Degree or higher | 97 (50.5%) | 95 (49.5%) |
Occupancy by Age of Householder in Union Springs
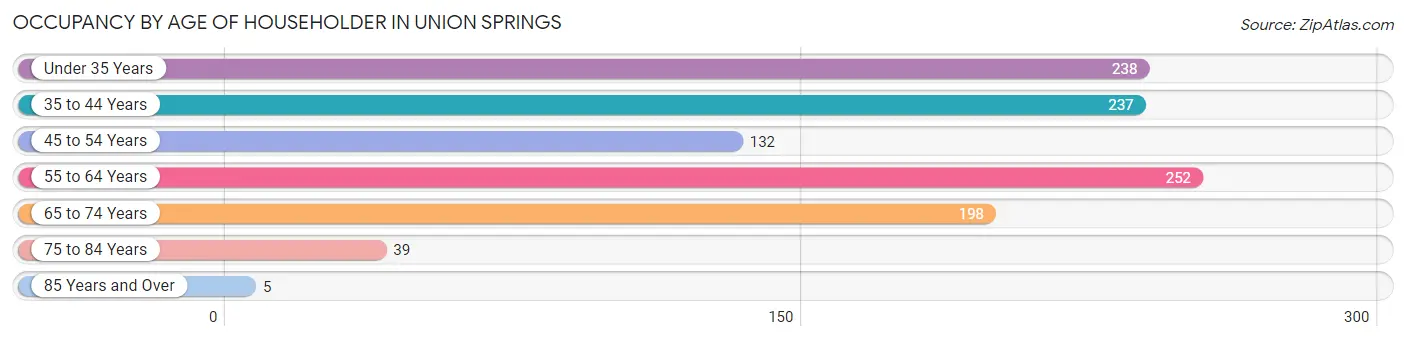
| Age Bracket | # Households | % Households |
| Under 35 Years | 238 | 21.6% |
| 35 to 44 Years | 237 | 21.5% |
| 45 to 54 Years | 132 | 12.0% |
| 55 to 64 Years | 252 | 22.9% |
| 65 to 74 Years | 198 | 18.0% |
| 75 to 84 Years | 39 | 3.5% |
| 85 Years and Over | 5 | 0.4% |
| Total | 1,101 | 100.0% |
Housing Finances in Union Springs
Median Income by Occupancy in Union Springs
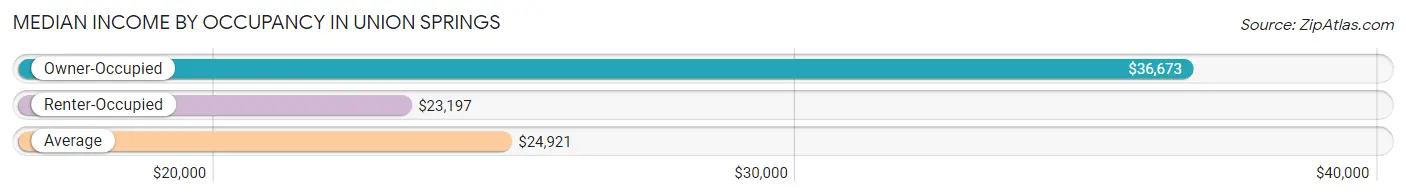
| Occupancy Type | # Households | Median Income |
| Owner-Occupied | 375 (34.1%) | $36,673 |
| Renter-Occupied | 726 (65.9%) | $23,197 |
| Average | 1,101 (100.0%) | $24,921 |
Occupancy by Householder Income Bracket in Union Springs
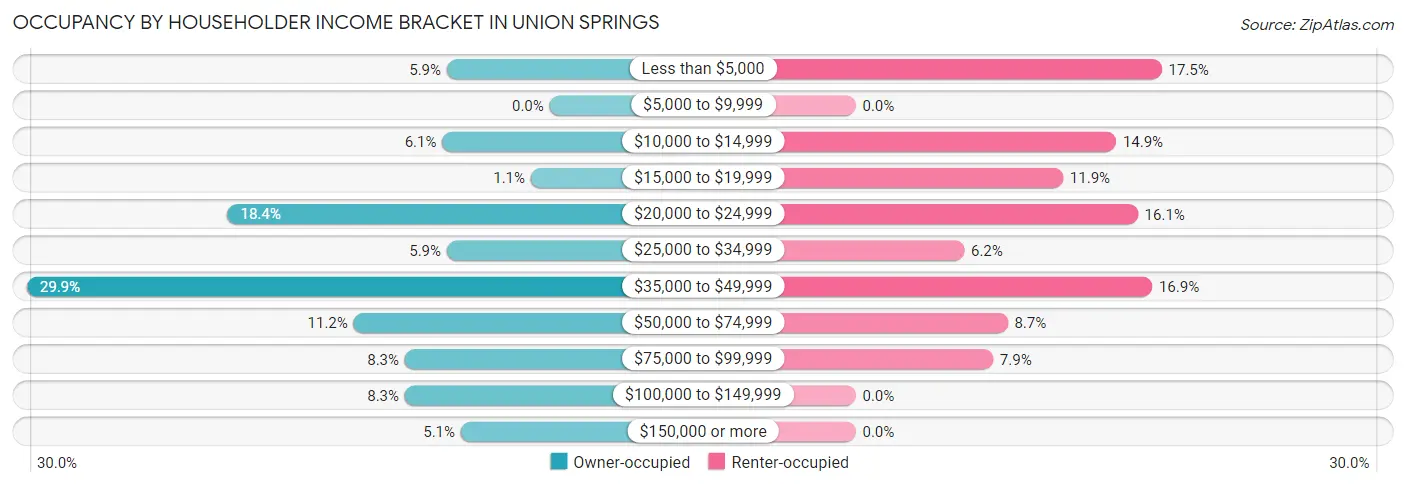
| Income Bracket | Owner-occupied | Renter-occupied |
| Less than $5,000 | 22 (5.9%) | 127 (17.5%) |
| $5,000 to $9,999 | 0 (0.0%) | 0 (0.0%) |
| $10,000 to $14,999 | 23 (6.1%) | 108 (14.9%) |
| $15,000 to $19,999 | 4 (1.1%) | 86 (11.8%) |
| $20,000 to $24,999 | 69 (18.4%) | 117 (16.1%) |
| $25,000 to $34,999 | 22 (5.9%) | 45 (6.2%) |
| $35,000 to $49,999 | 112 (29.9%) | 123 (16.9%) |
| $50,000 to $74,999 | 42 (11.2%) | 63 (8.7%) |
| $75,000 to $99,999 | 31 (8.3%) | 57 (7.9%) |
| $100,000 to $149,999 | 31 (8.3%) | 0 (0.0%) |
| $150,000 or more | 19 (5.1%) | 0 (0.0%) |
| Total | 375 (100.0%) | 726 (100.0%) |
Monthly Housing Cost Tiers in Union Springs
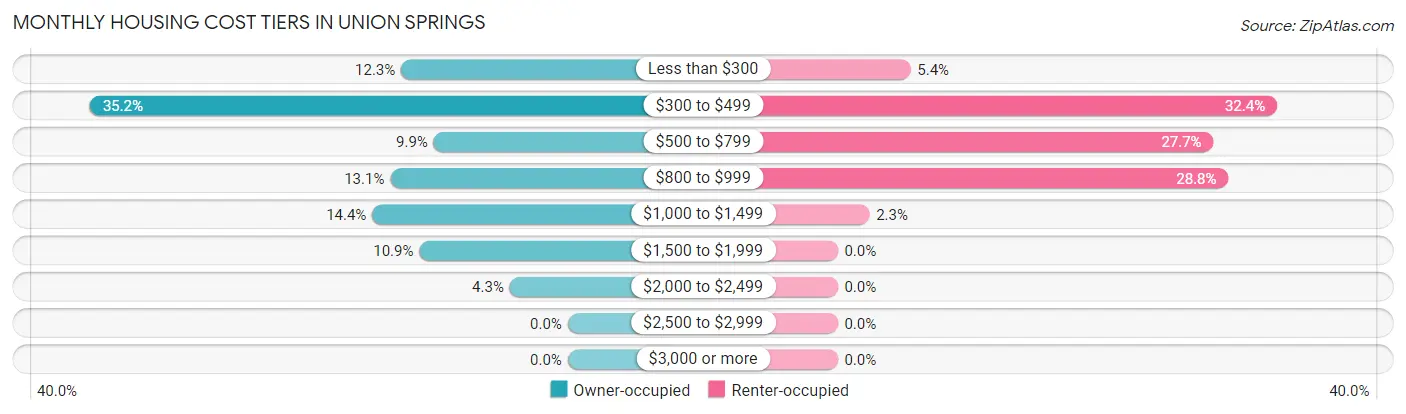
| Monthly Cost | Owner-occupied | Renter-occupied |
| Less than $300 | 46 (12.3%) | 39 (5.4%) |
| $300 to $499 | 132 (35.2%) | 235 (32.4%) |
| $500 to $799 | 37 (9.9%) | 201 (27.7%) |
| $800 to $999 | 49 (13.1%) | 209 (28.8%) |
| $1,000 to $1,499 | 54 (14.4%) | 17 (2.3%) |
| $1,500 to $1,999 | 41 (10.9%) | 0 (0.0%) |
| $2,000 to $2,499 | 16 (4.3%) | 0 (0.0%) |
| $2,500 to $2,999 | 0 (0.0%) | 0 (0.0%) |
| $3,000 or more | 0 (0.0%) | 0 (0.0%) |
| Total | 375 (100.0%) | 726 (100.0%) |
Physical Housing Characteristics in Union Springs
Housing Structures in Union Springs
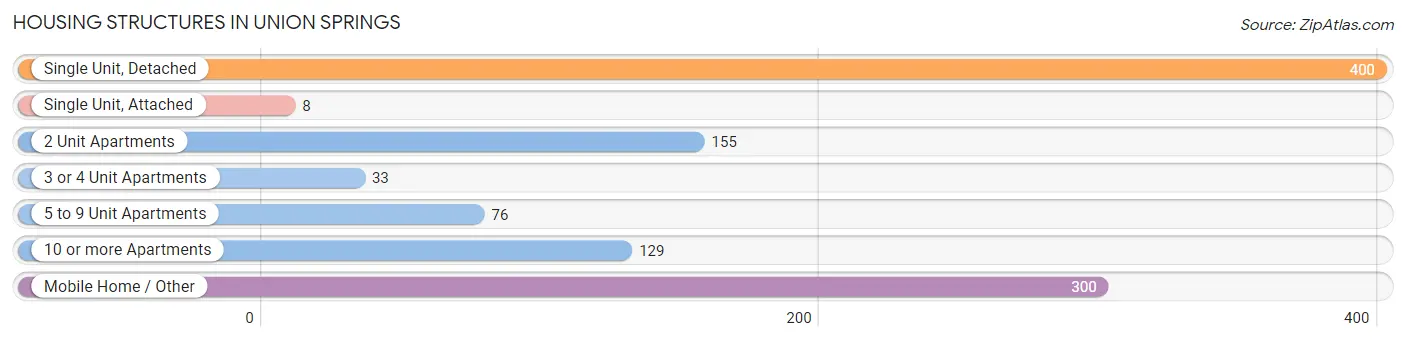
| Structure Type | # Housing Units | % Housing Units |
| Single Unit, Detached | 400 | 36.3% |
| Single Unit, Attached | 8 | 0.7% |
| 2 Unit Apartments | 155 | 14.1% |
| 3 or 4 Unit Apartments | 33 | 3.0% |
| 5 to 9 Unit Apartments | 76 | 6.9% |
| 10 or more Apartments | 129 | 11.7% |
| Mobile Home / Other | 300 | 27.3% |
| Total | 1,101 | 100.0% |
Housing Structures by Occupancy in Union Springs
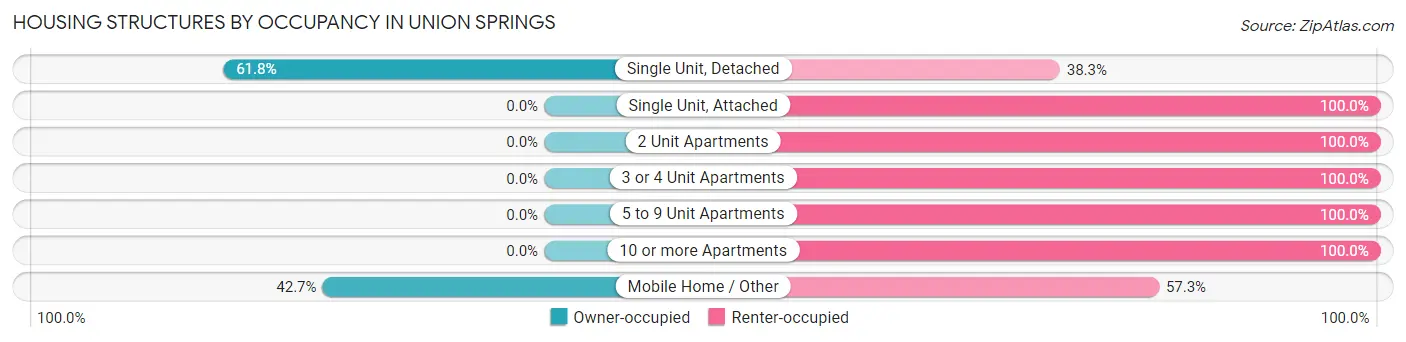
| Structure Type | Owner-occupied | Renter-occupied |
| Single Unit, Detached | 247 (61.8%) | 153 (38.3%) |
| Single Unit, Attached | 0 (0.0%) | 8 (100.0%) |
| 2 Unit Apartments | 0 (0.0%) | 155 (100.0%) |
| 3 or 4 Unit Apartments | 0 (0.0%) | 33 (100.0%) |
| 5 to 9 Unit Apartments | 0 (0.0%) | 76 (100.0%) |
| 10 or more Apartments | 0 (0.0%) | 129 (100.0%) |
| Mobile Home / Other | 128 (42.7%) | 172 (57.3%) |
| Total | 375 (34.1%) | 726 (65.9%) |
Housing Structures by Number of Rooms in Union Springs
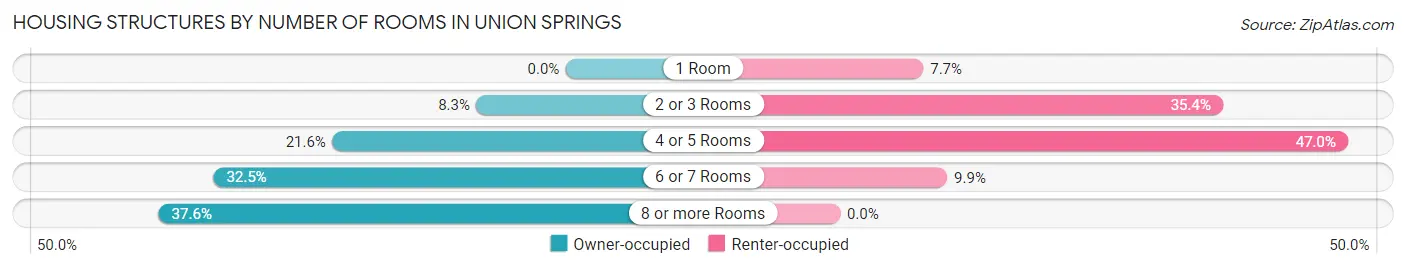
| Number of Rooms | Owner-occupied | Renter-occupied |
| 1 Room | 0 (0.0%) | 56 (7.7%) |
| 2 or 3 Rooms | 31 (8.3%) | 257 (35.4%) |
| 4 or 5 Rooms | 81 (21.6%) | 341 (47.0%) |
| 6 or 7 Rooms | 122 (32.5%) | 72 (9.9%) |
| 8 or more Rooms | 141 (37.6%) | 0 (0.0%) |
| Total | 375 (100.0%) | 726 (100.0%) |
Housing Structure by Heating Type in Union Springs
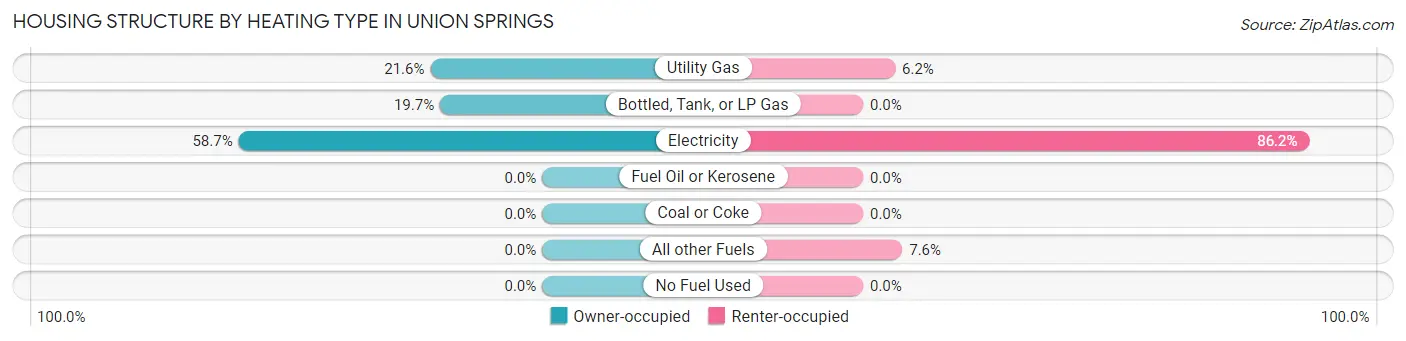
| Heating Type | Owner-occupied | Renter-occupied |
| Utility Gas | 81 (21.6%) | 45 (6.2%) |
| Bottled, Tank, or LP Gas | 74 (19.7%) | 0 (0.0%) |
| Electricity | 220 (58.7%) | 626 (86.2%) |
| Fuel Oil or Kerosene | 0 (0.0%) | 0 (0.0%) |
| Coal or Coke | 0 (0.0%) | 0 (0.0%) |
| All other Fuels | 0 (0.0%) | 55 (7.6%) |
| No Fuel Used | 0 (0.0%) | 0 (0.0%) |
| Total | 375 (100.0%) | 726 (100.0%) |
Household Vehicle Usage in Union Springs
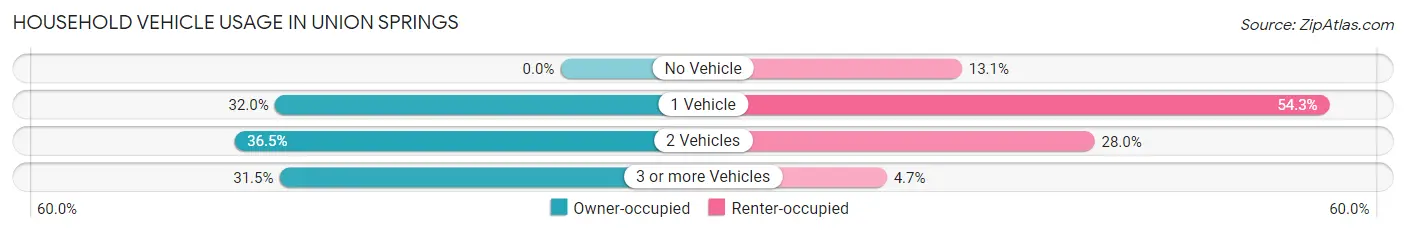
| Vehicles per Household | Owner-occupied | Renter-occupied |
| No Vehicle | 0 (0.0%) | 95 (13.1%) |
| 1 Vehicle | 120 (32.0%) | 394 (54.3%) |
| 2 Vehicles | 137 (36.5%) | 203 (28.0%) |
| 3 or more Vehicles | 118 (31.5%) | 34 (4.7%) |
| Total | 375 (100.0%) | 726 (100.0%) |
Real Estate & Mortgages in Union Springs
Real Estate and Mortgage Overview in Union Springs
| Characteristic | Without Mortgage | With Mortgage |
| Housing Units | 217 | 158 |
| Median Property Value | $76,900 | $109,100 |
| Median Household Income | $35,906 | $15 |
| Monthly Housing Costs | $416 | $0 |
| Real Estate Taxes | $490 | $20 |
Property Value by Mortgage Status in Union Springs
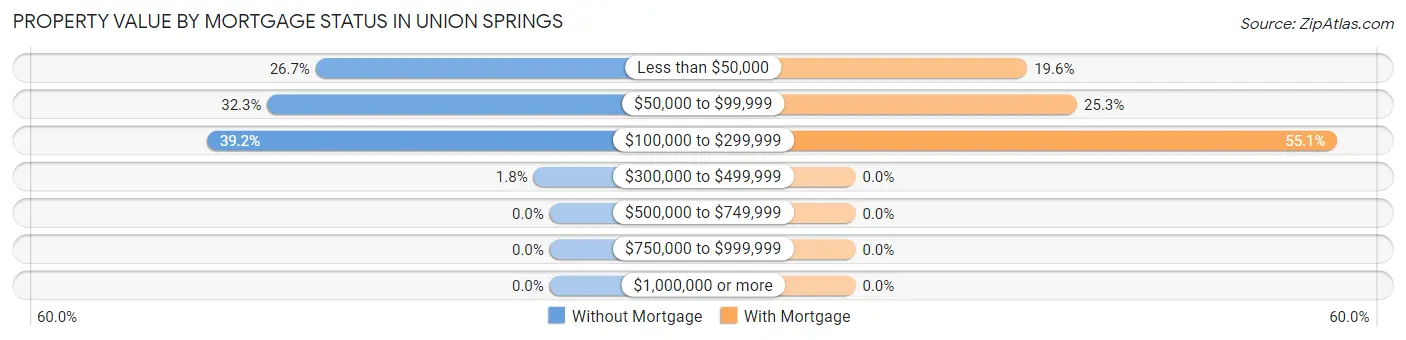
| Property Value | Without Mortgage | With Mortgage |
| Less than $50,000 | 58 (26.7%) | 31 (19.6%) |
| $50,000 to $99,999 | 70 (32.3%) | 40 (25.3%) |
| $100,000 to $299,999 | 85 (39.2%) | 87 (55.1%) |
| $300,000 to $499,999 | 4 (1.8%) | 0 (0.0%) |
| $500,000 to $749,999 | 0 (0.0%) | 0 (0.0%) |
| $750,000 to $999,999 | 0 (0.0%) | 0 (0.0%) |
| $1,000,000 or more | 0 (0.0%) | 0 (0.0%) |
| Total | 217 (100.0%) | 158 (100.0%) |
Household Income by Mortgage Status in Union Springs
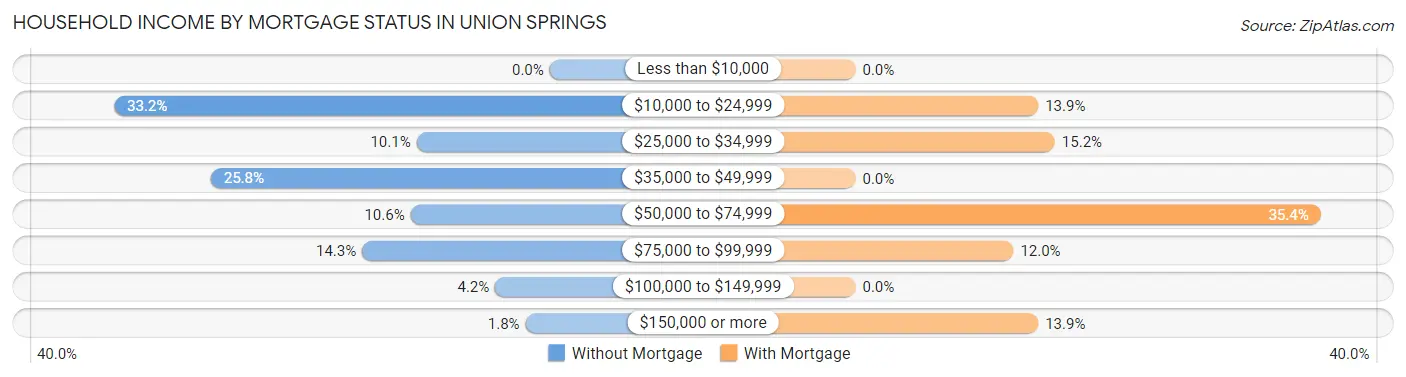
| Household Income | Without Mortgage | With Mortgage |
| Less than $10,000 | 0 (0.0%) | 0 (0.0%) |
| $10,000 to $24,999 | 72 (33.2%) | 22 (13.9%) |
| $25,000 to $34,999 | 22 (10.1%) | 24 (15.2%) |
| $35,000 to $49,999 | 56 (25.8%) | 0 (0.0%) |
| $50,000 to $74,999 | 23 (10.6%) | 56 (35.4%) |
| $75,000 to $99,999 | 31 (14.3%) | 19 (12.0%) |
| $100,000 to $149,999 | 9 (4.2%) | 0 (0.0%) |
| $150,000 or more | 4 (1.8%) | 22 (13.9%) |
| Total | 217 (100.0%) | 158 (100.0%) |
Property Value to Household Income Ratio in Union Springs
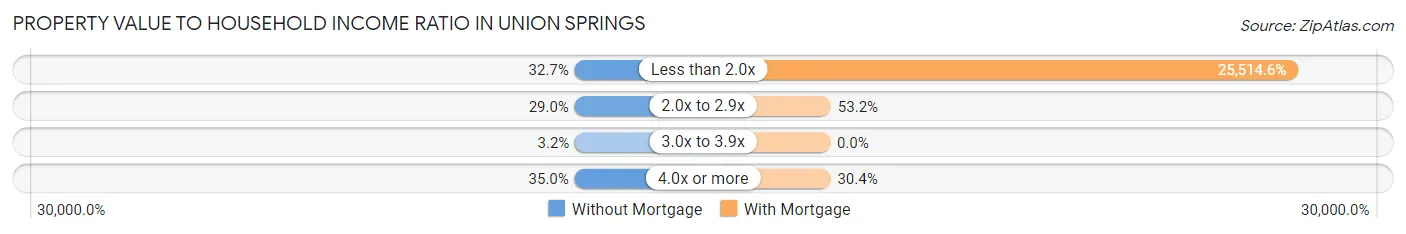
| Value-to-Income Ratio | Without Mortgage | With Mortgage |
| Less than 2.0x | 71 (32.7%) | 40,313 (25,514.6%) |
| 2.0x to 2.9x | 63 (29.0%) | 84 (53.2%) |
| 3.0x to 3.9x | 7 (3.2%) | 0 (0.0%) |
| 4.0x or more | 76 (35.0%) | 48 (30.4%) |
| Total | 217 (100.0%) | 158 (100.0%) |
Real Estate Taxes by Mortgage Status in Union Springs
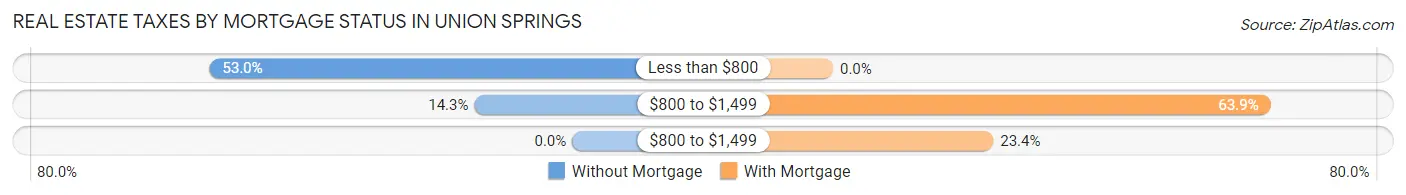
| Property Taxes | Without Mortgage | With Mortgage |
| Less than $800 | 115 (53.0%) | 0 (0.0%) |
| $800 to $1,499 | 31 (14.3%) | 101 (63.9%) |
| $800 to $1,499 | 0 (0.0%) | 37 (23.4%) |
| Total | 217 (100.0%) | 158 (100.0%) |
Health & Disability in Union Springs
Health Insurance Coverage by Age in Union Springs
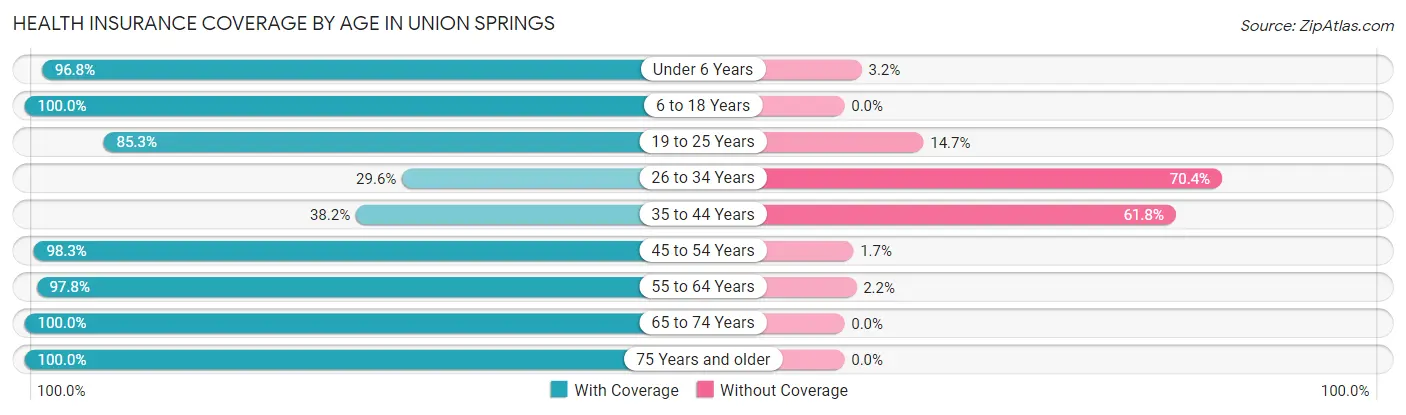
| Age Bracket | With Coverage | Without Coverage |
| Under 6 Years | 302 (96.8%) | 10 (3.2%) |
| 6 to 18 Years | 974 (100.0%) | 0 (0.0%) |
| 19 to 25 Years | 301 (85.3%) | 52 (14.7%) |
| 26 to 34 Years | 100 (29.6%) | 238 (70.4%) |
| 35 to 44 Years | 144 (38.2%) | 233 (61.8%) |
| 45 to 54 Years | 296 (98.3%) | 5 (1.7%) |
| 55 to 64 Years | 308 (97.8%) | 7 (2.2%) |
| 65 to 74 Years | 232 (100.0%) | 0 (0.0%) |
| 75 Years and older | 97 (100.0%) | 0 (0.0%) |
| Total | 2,754 (83.5%) | 545 (16.5%) |
Health Insurance Coverage by Citizenship Status in Union Springs
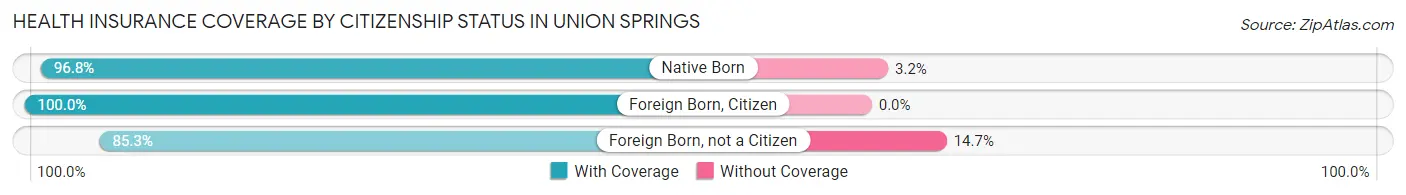
| Citizenship Status | With Coverage | Without Coverage |
| Native Born | 302 (96.8%) | 10 (3.2%) |
| Foreign Born, Citizen | 974 (100.0%) | 0 (0.0%) |
| Foreign Born, not a Citizen | 301 (85.3%) | 52 (14.7%) |
Health Insurance Coverage by Household Income in Union Springs
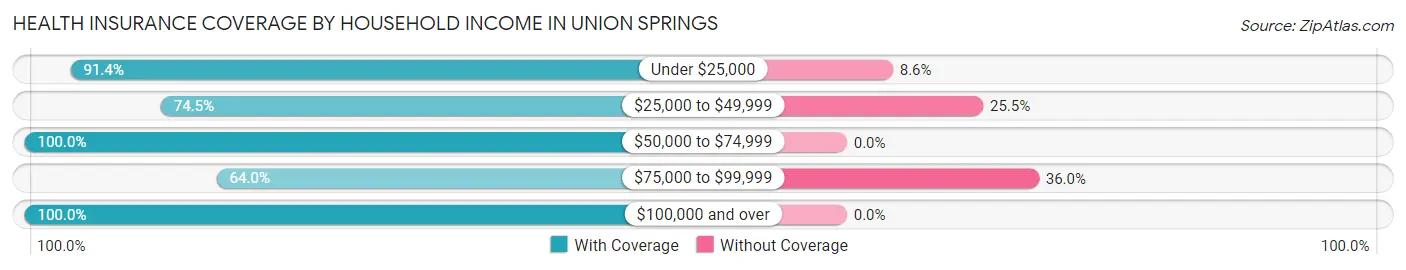
| Household Income | With Coverage | Without Coverage |
| Under $25,000 | 1,357 (91.4%) | 128 (8.6%) |
| $25,000 to $49,999 | 718 (74.5%) | 246 (25.5%) |
| $50,000 to $74,999 | 215 (100.0%) | 0 (0.0%) |
| $75,000 to $99,999 | 283 (64.0%) | 159 (36.0%) |
| $100,000 and over | 143 (100.0%) | 0 (0.0%) |
Public vs Private Health Insurance Coverage by Age in Union Springs
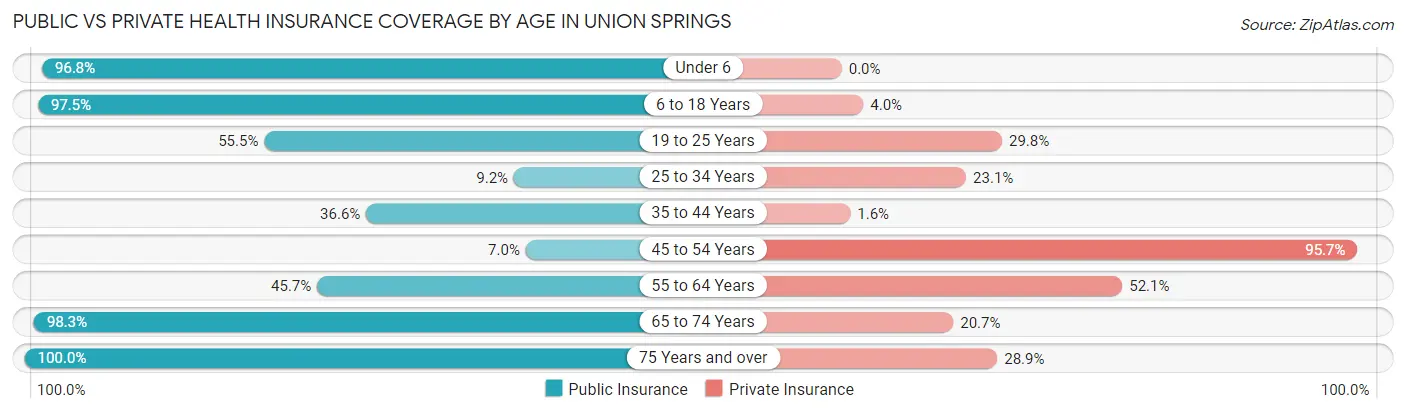
| Age Bracket | Public Insurance | Private Insurance |
| Under 6 | 302 (96.8%) | 0 (0.0%) |
| 6 to 18 Years | 950 (97.5%) | 39 (4.0%) |
| 19 to 25 Years | 196 (55.5%) | 105 (29.7%) |
| 25 to 34 Years | 31 (9.2%) | 78 (23.1%) |
| 35 to 44 Years | 138 (36.6%) | 6 (1.6%) |
| 45 to 54 Years | 21 (7.0%) | 288 (95.7%) |
| 55 to 64 Years | 144 (45.7%) | 164 (52.1%) |
| 65 to 74 Years | 228 (98.3%) | 48 (20.7%) |
| 75 Years and over | 97 (100.0%) | 28 (28.9%) |
| Total | 2,107 (63.9%) | 756 (22.9%) |
Disability Status by Sex by Age in Union Springs
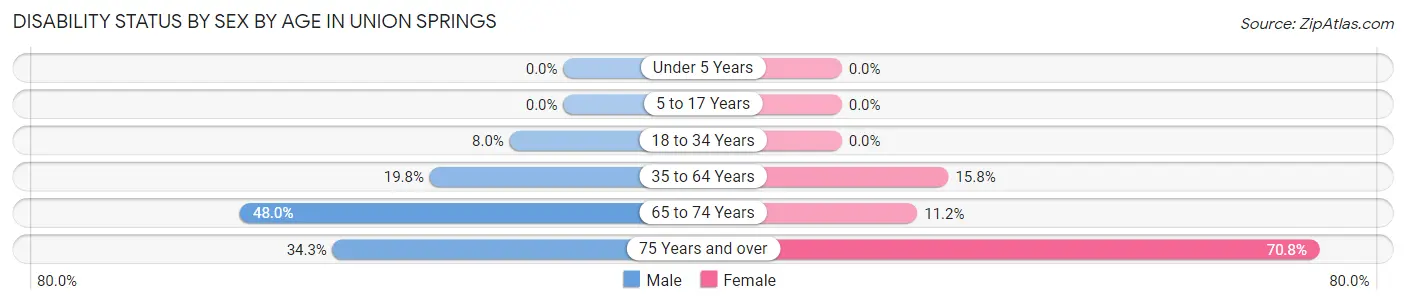
| Age Bracket | Male | Female |
| Under 5 Years | 0 (0.0%) | 0 (0.0%) |
| 5 to 17 Years | 0 (0.0%) | 0 (0.0%) |
| 18 to 34 Years | 44 (8.0%) | 0 (0.0%) |
| 35 to 64 Years | 93 (19.8%) | 83 (15.8%) |
| 65 to 74 Years | 60 (48.0%) | 12 (11.2%) |
| 75 Years and over | 25 (34.3%) | 17 (70.8%) |
Disability Class by Sex by Age in Union Springs
Disability Class: Hearing Difficulty
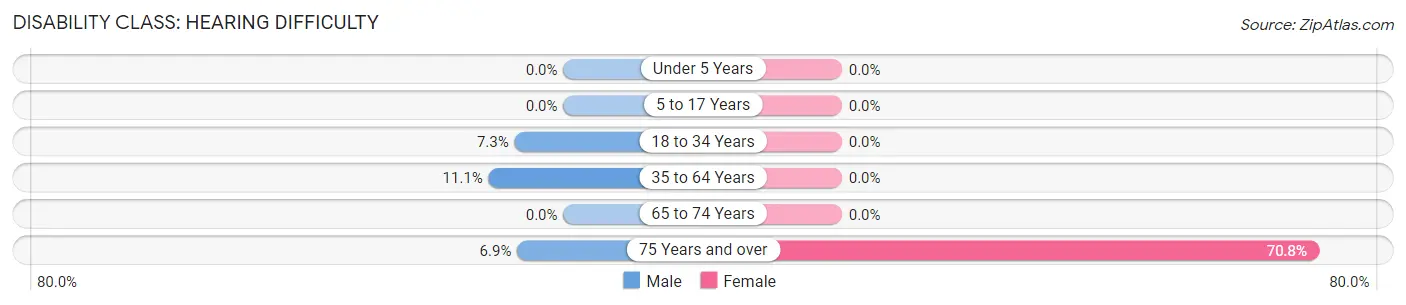
| Age Bracket | Male | Female |
| Under 5 Years | 0 (0.0%) | 0 (0.0%) |
| 5 to 17 Years | 0 (0.0%) | 0 (0.0%) |
| 18 to 34 Years | 40 (7.2%) | 0 (0.0%) |
| 35 to 64 Years | 52 (11.1%) | 0 (0.0%) |
| 65 to 74 Years | 0 (0.0%) | 0 (0.0%) |
| 75 Years and over | 5 (6.9%) | 17 (70.8%) |
Disability Class: Vision Difficulty
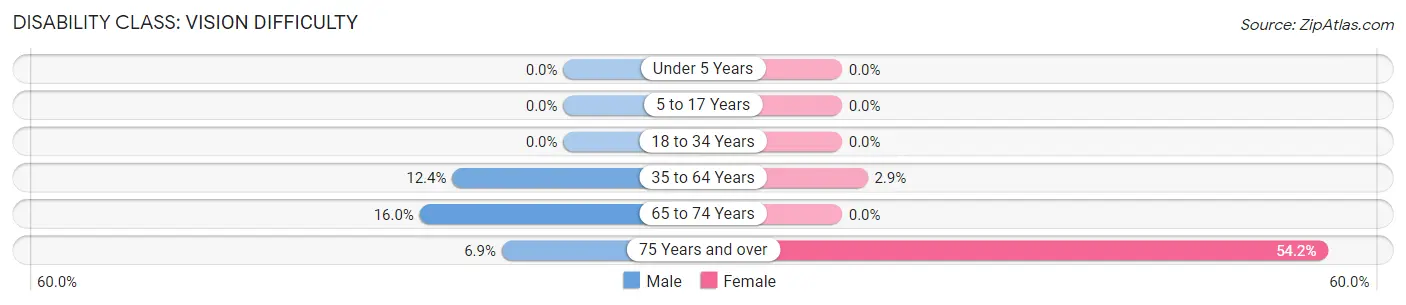
| Age Bracket | Male | Female |
| Under 5 Years | 0 (0.0%) | 0 (0.0%) |
| 5 to 17 Years | 0 (0.0%) | 0 (0.0%) |
| 18 to 34 Years | 0 (0.0%) | 0 (0.0%) |
| 35 to 64 Years | 58 (12.4%) | 15 (2.9%) |
| 65 to 74 Years | 20 (16.0%) | 0 (0.0%) |
| 75 Years and over | 5 (6.9%) | 13 (54.2%) |
Disability Class: Cognitive Difficulty
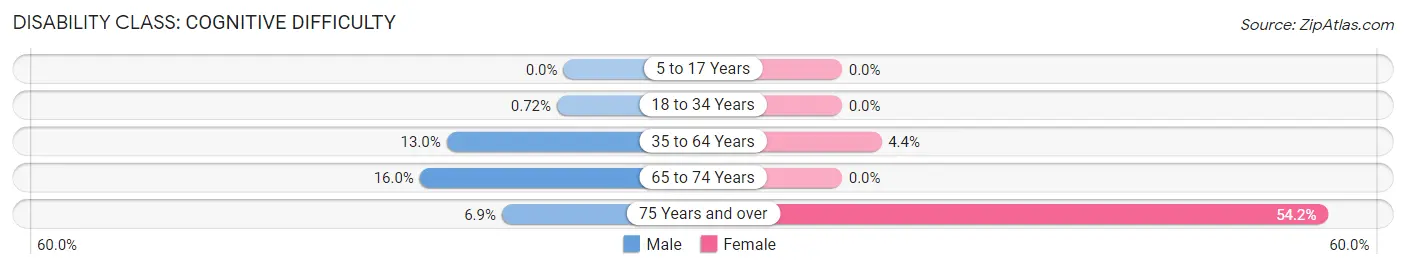
| Age Bracket | Male | Female |
| 5 to 17 Years | 0 (0.0%) | 0 (0.0%) |
| 18 to 34 Years | 4 (0.7%) | 0 (0.0%) |
| 35 to 64 Years | 61 (13.0%) | 23 (4.4%) |
| 65 to 74 Years | 20 (16.0%) | 0 (0.0%) |
| 75 Years and over | 5 (6.9%) | 13 (54.2%) |
Disability Class: Ambulatory Difficulty
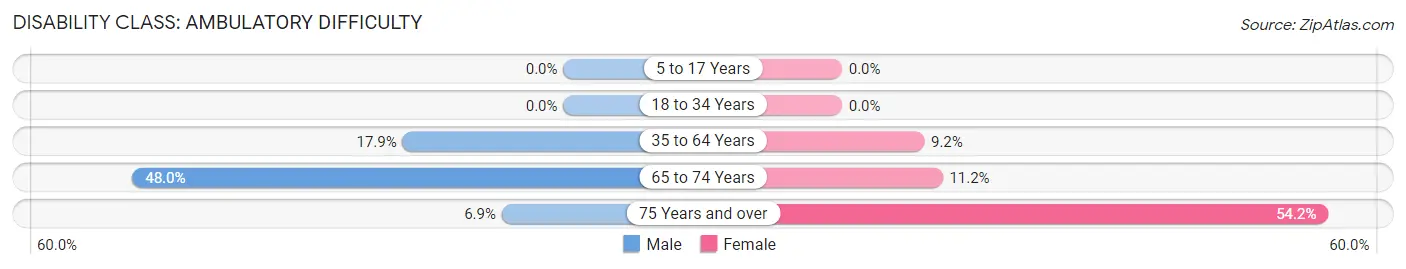
| Age Bracket | Male | Female |
| 5 to 17 Years | 0 (0.0%) | 0 (0.0%) |
| 18 to 34 Years | 0 (0.0%) | 0 (0.0%) |
| 35 to 64 Years | 84 (17.9%) | 48 (9.2%) |
| 65 to 74 Years | 60 (48.0%) | 12 (11.2%) |
| 75 Years and over | 5 (6.9%) | 13 (54.2%) |
Disability Class: Self-Care Difficulty
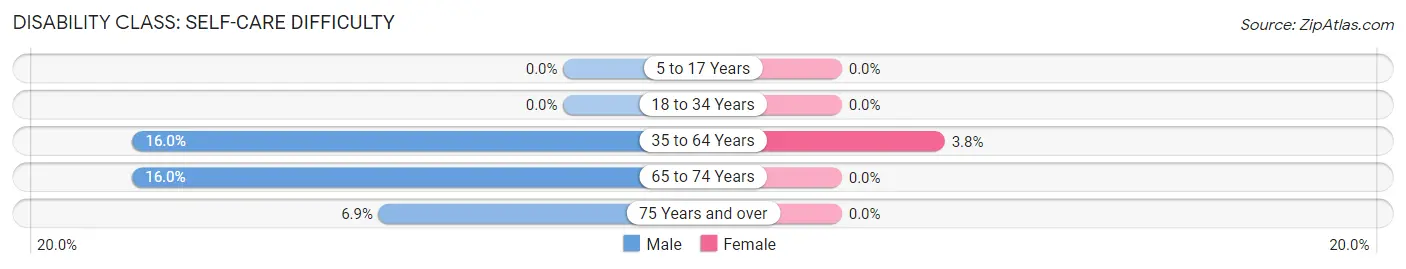
| Age Bracket | Male | Female |
| 5 to 17 Years | 0 (0.0%) | 0 (0.0%) |
| 18 to 34 Years | 0 (0.0%) | 0 (0.0%) |
| 35 to 64 Years | 75 (16.0%) | 20 (3.8%) |
| 65 to 74 Years | 20 (16.0%) | 0 (0.0%) |
| 75 Years and over | 5 (6.9%) | 0 (0.0%) |
Technology Access in Union Springs
Computing Device Access in Union Springs
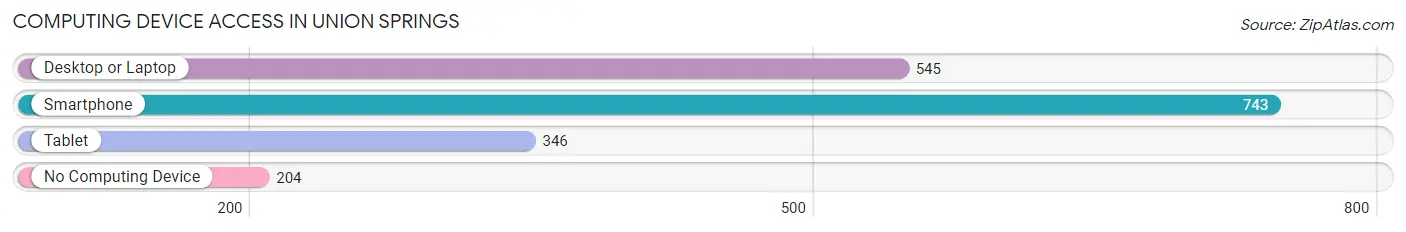
| Device Type | # Households | % Households |
| Desktop or Laptop | 545 | 49.5% |
| Smartphone | 743 | 67.5% |
| Tablet | 346 | 31.4% |
| No Computing Device | 204 | 18.5% |
| Total | 1,101 | 100.0% |
Internet Access in Union Springs
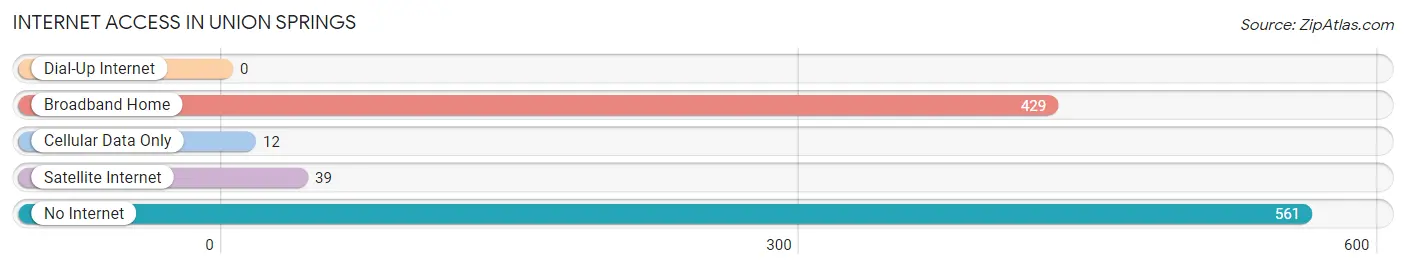
| Internet Type | # Households | % Households |
| Dial-Up Internet | 0 | 0.0% |
| Broadband Home | 429 | 39.0% |
| Cellular Data Only | 12 | 1.1% |
| Satellite Internet | 39 | 3.5% |
| No Internet | 561 | 50.9% |
| Total | 1,101 | 100.0% |
Union Springs Summary
History
Union Springs, Alabama is a small city located in Bullock County, Alabama. It is situated on the banks of the Chattahoochee River, and is the county seat of Bullock County. The city was founded in 1832 and was originally known as “Union Springs Courthouse”. The city was named after the nearby Union Springs, which were located on the banks of the Chattahoochee River.
The city was originally settled by Native Americans, and was later settled by European settlers in the early 1800s. The city was incorporated in 1837, and was the first city in Bullock County. The city was an important trading center for the area, and was a major stop on the stagecoach route between Montgomery and Columbus, Georgia.
During the Civil War, Union Springs was a major supply center for the Confederate Army. The city was also the site of several skirmishes between Union and Confederate forces. After the war, the city was rebuilt and continued to be an important trading center for the area.
In the late 19th century, Union Springs became a popular tourist destination. The city was known for its mineral springs, which were believed to have healing properties. The city also became known for its hunting and fishing opportunities.
Geography
Union Springs is located in Bullock County, Alabama. The city is situated on the banks of the Chattahoochee River, and is located about 30 miles south of Montgomery. The city has a total area of 4.2 square miles, all of which is land.
The city has a humid subtropical climate, with hot, humid summers and mild winters. The average annual temperature is around 68 degrees Fahrenheit, and the average annual precipitation is around 50 inches.
Economy
The economy of Union Springs is largely based on agriculture and tourism. The city is home to several farms, which produce a variety of crops, including cotton, corn, soybeans, and peanuts. The city is also home to several hunting and fishing lodges, which attract tourists from all over the country.
The city is also home to several manufacturing companies, which produce a variety of products, including furniture, clothing, and automotive parts. The city is also home to several retail stores, which sell a variety of goods.
Demographics
As of the 2010 census, the population of Union Springs was 3,912. The racial makeup of the city was 57.3% White, 39.2% African American, 0.3% Native American, 0.2% Asian, 0.1% Pacific Islander, 1.2% from other races, and 1.9% from two or more races. Hispanic or Latino of any race were 2.7% of the population.
The median income for a household in the city was $25,938, and the median income for a family was $31,250. The per capita income for the city was $14,945. About 22.2% of families and 25.2% of the population were below the poverty line, including 33.3% of those under age 18 and 18.2% of those age 65 or over.
Common Questions
What is Per Capita Income in Union Springs?
Per Capita income in Union Springs is $15,220.
What is the Median Family Income in Union Springs?
Median Family Income in Union Springs is $30,682.
What is the Median Household income in Union Springs?
Median Household Income in Union Springs is $24,921.
What is Family Income Deficit in Union Springs?
Family Income Deficit in Union Springs is $11,946.
Families that are below poverty line in Union Springs earn $11,946 less on average than the poverty threshold level.
What is Inequality or Gini Index in Union Springs?
Inequality or Gini Index in Union Springs is 0.47.
What is the Total Population of Union Springs?
Total Population of Union Springs is 3,341.
What is the Total Male Population of Union Springs?
Total Male Population of Union Springs is 1,638.
What is the Total Female Population of Union Springs?
Total Female Population of Union Springs is 1,703.
What is the Ratio of Males per 100 Females in Union Springs?
There are 96.18 Males per 100 Females in Union Springs.
What is the Ratio of Females per 100 Males in Union Springs?
There are 103.97 Females per 100 Males in Union Springs.
What is the Median Population Age in Union Springs?
Median Population Age in Union Springs is 28.1 Years.
What is the Average Family Size in Union Springs
Average Family Size in Union Springs is 3.8 People.
What is the Average Household Size in Union Springs
Average Household Size in Union Springs is 3.0 People.
How Large is the Labor Force in Union Springs?
There are 1,390 People in the Labor Forcein in Union Springs.
What is the Percentage of People in the Labor Force in Union Springs?
56.9% of People are in the Labor Force in Union Springs.
What is the Unemployment Rate in Union Springs?
Unemployment Rate in Union Springs is 7.6%.