Tarrant, AL Map & Demographics
Tarrant Map
Tarrant Overview
$22,706
PER CAPITA INCOME
$55,476
AVG FAMILY INCOME
$37,768
AVG HOUSEHOLD INCOME
11.9%
WAGE / INCOME GAP [ % ]
88.1¢/ $1
WAGE / INCOME GAP [ $ ]
0.45
INEQUALITY / GINI INDEX
6,077
TOTAL POPULATION
2,955
MALE POPULATION
3,122
FEMALE POPULATION
94.65
MALES / 100 FEMALES
105.65
FEMALES / 100 MALES
38.8
MEDIAN AGE
3.0
AVG FAMILY SIZE
2.2
AVG HOUSEHOLD SIZE
3,005
LABOR FORCE [ PEOPLE ]
59.1%
PERCENT IN LABOR FORCE
6.5%
UNEMPLOYMENT RATE
Tarrant Area Codes
Income in Tarrant
Income Overview in Tarrant
Per Capita Income in Tarrant is $22,706, while median incomes of families and households are $55,476 and $37,768 respectively.
| Characteristic | Number | Measure |
| Per Capita Income | 6,077 | $22,706 |
| Median Family Income | 1,384 | $55,476 |
| Mean Family Income | 1,384 | $64,464 |
| Median Household Income | 2,678 | $37,768 |
| Mean Household Income | 2,678 | $50,485 |
| Income Deficit | 1,384 | $0 |
| Wage / Income Gap (%) | 6,077 | 11.86% |
| Wage / Income Gap ($) | 6,077 | 88.14¢ per $1 |
| Gini / Inequality Index | 6,077 | 0.45 |
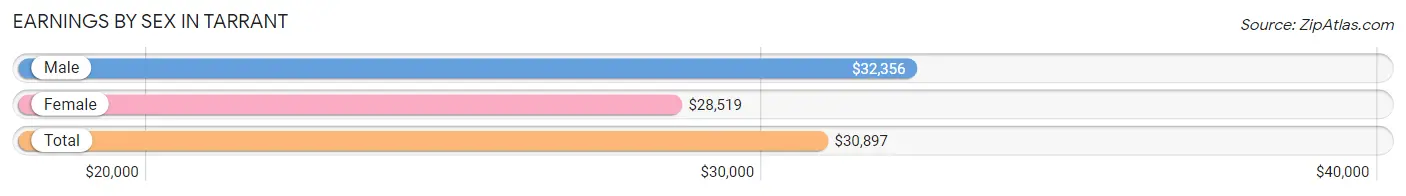
Earnings by Sex in Tarrant
Average Earnings in Tarrant are $30,897, $32,356 for men and $28,519 for women, a difference of 11.9%.
| Sex | Number | Average Earnings |
| Male | 1,769 (60.1%) | $32,356 |
| Female | 1,176 (39.9%) | $28,519 |
| Total | 2,945 (100.0%) | $30,897 |
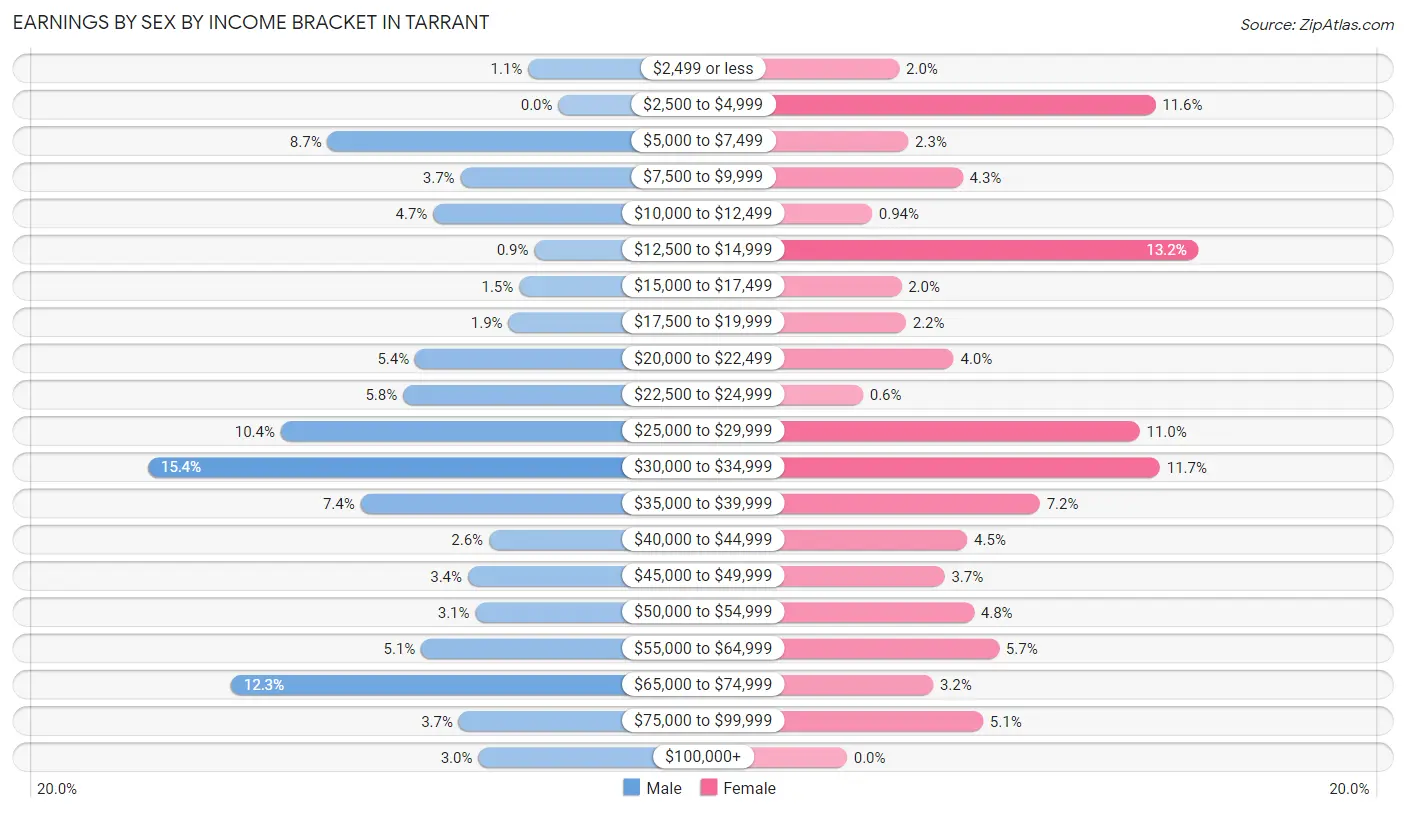
Earnings by Sex by Income Bracket in Tarrant
The most common earnings brackets in Tarrant are $30,000 to $34,999 for men (272 | 15.4%) and $12,500 to $14,999 for women (155 | 13.2%).
| Income | Male | Female |
| $2,499 or less | 20 (1.1%) | 23 (2.0%) |
| $2,500 to $4,999 | 0 (0.0%) | 136 (11.6%) |
| $5,000 to $7,499 | 153 (8.6%) | 27 (2.3%) |
| $7,500 to $9,999 | 65 (3.7%) | 51 (4.3%) |
| $10,000 to $12,499 | 83 (4.7%) | 11 (0.9%) |
| $12,500 to $14,999 | 16 (0.9%) | 155 (13.2%) |
| $15,000 to $17,499 | 26 (1.5%) | 24 (2.0%) |
| $17,500 to $19,999 | 33 (1.9%) | 26 (2.2%) |
| $20,000 to $22,499 | 95 (5.4%) | 47 (4.0%) |
| $22,500 to $24,999 | 103 (5.8%) | 7 (0.6%) |
| $25,000 to $29,999 | 184 (10.4%) | 129 (11.0%) |
| $30,000 to $34,999 | 272 (15.4%) | 138 (11.7%) |
| $35,000 to $39,999 | 131 (7.4%) | 85 (7.2%) |
| $40,000 to $44,999 | 46 (2.6%) | 53 (4.5%) |
| $45,000 to $49,999 | 60 (3.4%) | 43 (3.7%) |
| $50,000 to $54,999 | 55 (3.1%) | 56 (4.8%) |
| $55,000 to $64,999 | 91 (5.1%) | 67 (5.7%) |
| $65,000 to $74,999 | 217 (12.3%) | 38 (3.2%) |
| $75,000 to $99,999 | 66 (3.7%) | 60 (5.1%) |
| $100,000+ | 53 (3.0%) | 0 (0.0%) |
| Total | 1,769 (100.0%) | 1,176 (100.0%) |
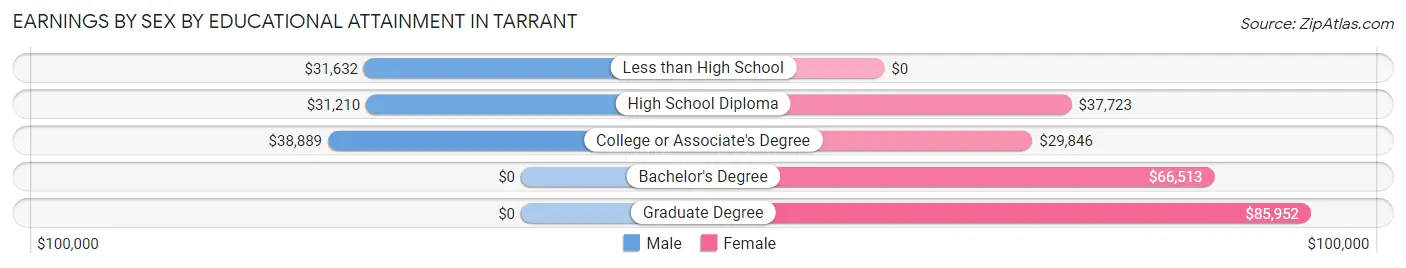
Earnings by Sex by Educational Attainment in Tarrant
Average earnings in Tarrant are $34,641 for men and $32,175 for women, a difference of 7.1%. Men with an educational attainment of college or associate's degree enjoy the highest average annual earnings of $38,889, while those with high school diploma education earn the least with $31,210. Women with an educational attainment of graduate degree earn the most with the average annual earnings of $85,952, while those with college or associate's degree education have the smallest earnings of $29,846.
| Educational Attainment | Male Income | Female Income |
| Less than High School | $31,632 | $0 |
| High School Diploma | $31,210 | $37,723 |
| College or Associate's Degree | $38,889 | $29,846 |
| Bachelor's Degree | - | - |
| Graduate Degree | - | - |
| Total | $34,641 | $32,175 |
Family Income in Tarrant
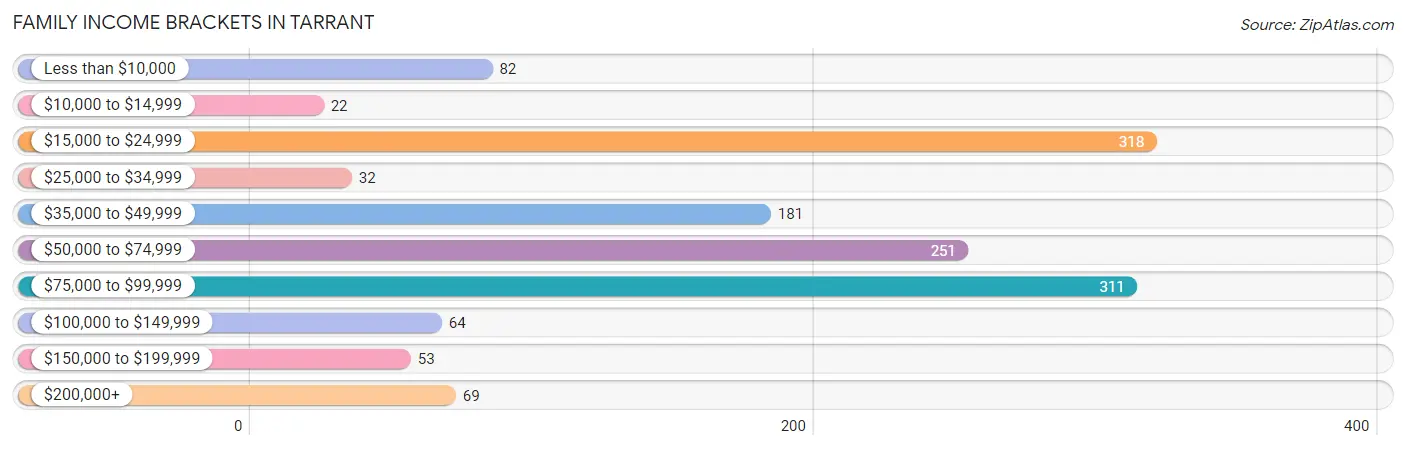
Family Income Brackets in Tarrant
According to the Tarrant family income data, there are 318 families falling into the $15,000 to $24,999 income range, which is the most common income bracket and makes up 23.0% of all families. Conversely, the $10,000 to $14,999 income bracket is the least frequent group with only 22 families (1.6%) belonging to this category.
| Income Bracket | # Families | % Families |
| Less than $10,000 | 82 | 5.9% |
| $10,000 to $14,999 | 22 | 1.6% |
| $15,000 to $24,999 | 318 | 23.0% |
| $25,000 to $34,999 | 32 | 2.3% |
| $35,000 to $49,999 | 181 | 13.1% |
| $50,000 to $74,999 | 251 | 18.1% |
| $75,000 to $99,999 | 311 | 22.5% |
| $100,000 to $149,999 | 64 | 4.6% |
| $150,000 to $199,999 | 53 | 3.8% |
| $200,000+ | 69 | 5.0% |
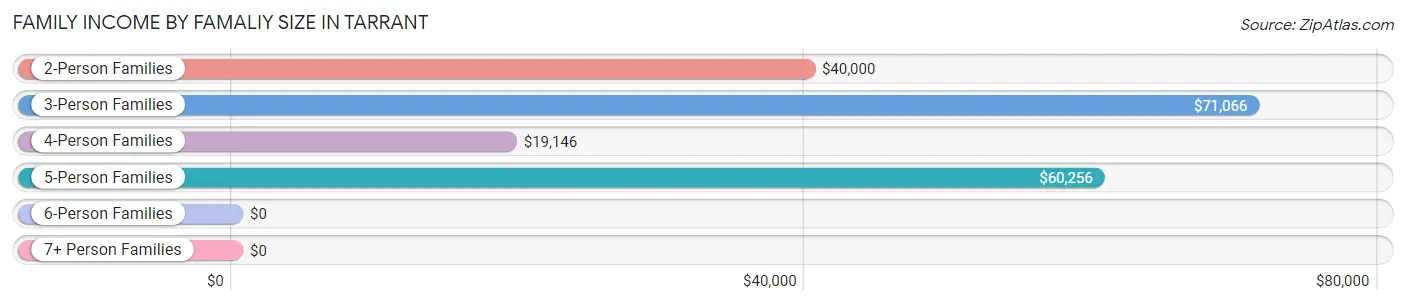
Family Income by Famaliy Size in Tarrant
3-person families (401 | 29.0%) account for the highest median family income in Tarrant with $71,066 per family, while 3-person families (401 | 29.0%) have the highest median income of $23,689 per family member.
| Income Bracket | # Families | Median Income |
| 2-Person Families | 718 (51.9%) | $40,000 |
| 3-Person Families | 401 (29.0%) | $71,066 |
| 4-Person Families | 54 (3.9%) | $19,146 |
| 5-Person Families | 96 (6.9%) | $60,256 |
| 6-Person Families | 115 (8.3%) | $0 |
| 7+ Person Families | 0 (0.0%) | $0 |
| Total | 1,384 (100.0%) | $55,476 |
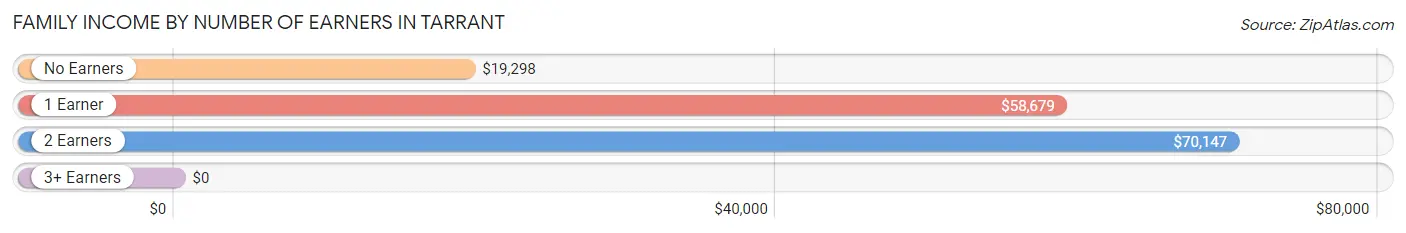
Family Income by Number of Earners in Tarrant
| Number of Earners | # Families | Median Income |
| No Earners | 291 (21.0%) | $19,298 |
| 1 Earner | 389 (28.1%) | $58,679 |
| 2 Earners | 544 (39.3%) | $70,147 |
| 3+ Earners | 160 (11.6%) | $0 |
| Total | 1,384 (100.0%) | $55,476 |
Household Income in Tarrant
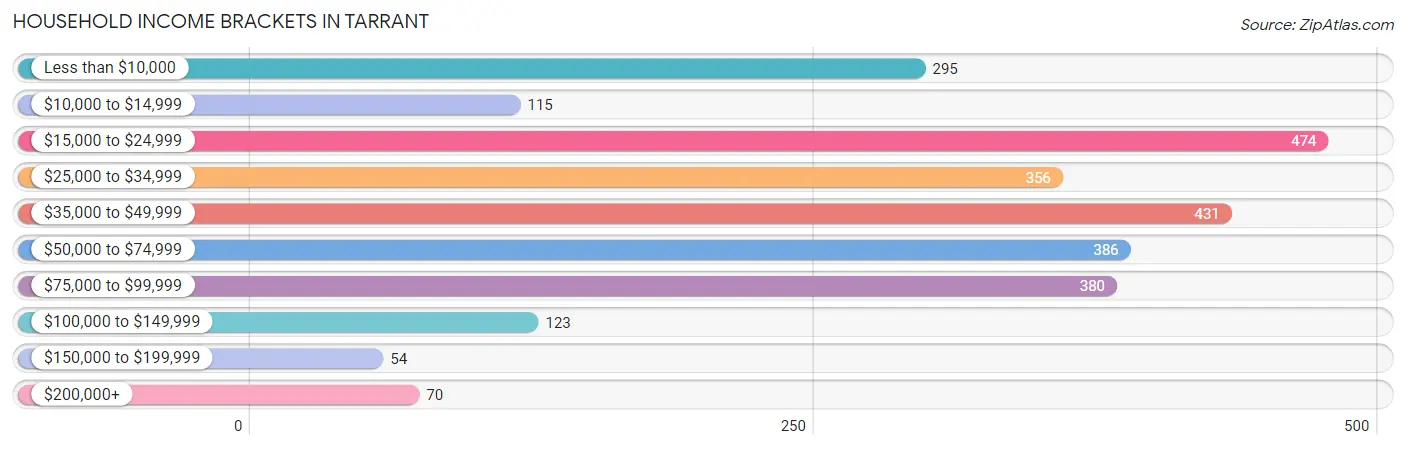
Household Income Brackets in Tarrant
With 474 households falling in the category, the $15,000 to $24,999 income range is the most frequent in Tarrant, accounting for 17.7% of all households. In contrast, only 54 households (2.0%) fall into the $150,000 to $199,999 income bracket, making it the least populous group.
| Income Bracket | # Households | % Households |
| Less than $10,000 | 295 | 11.0% |
| $10,000 to $14,999 | 115 | 4.3% |
| $15,000 to $24,999 | 474 | 17.7% |
| $25,000 to $34,999 | 356 | 13.3% |
| $35,000 to $49,999 | 431 | 16.1% |
| $50,000 to $74,999 | 386 | 14.4% |
| $75,000 to $99,999 | 380 | 14.2% |
| $100,000 to $149,999 | 123 | 4.6% |
| $150,000 to $199,999 | 54 | 2.0% |
| $200,000+ | 70 | 2.6% |
Household Income by Householder Age in Tarrant
The median household income in Tarrant is $37,768, with the highest median household income of $62,866 found in the 15 to 24 years age bracket for the primary householder. A total of 218 households (8.1%) fall into this category. Meanwhile, the 65+ years age bracket for the primary householder has the lowest median household income of $19,220, with 773 households (28.9%) in this group.
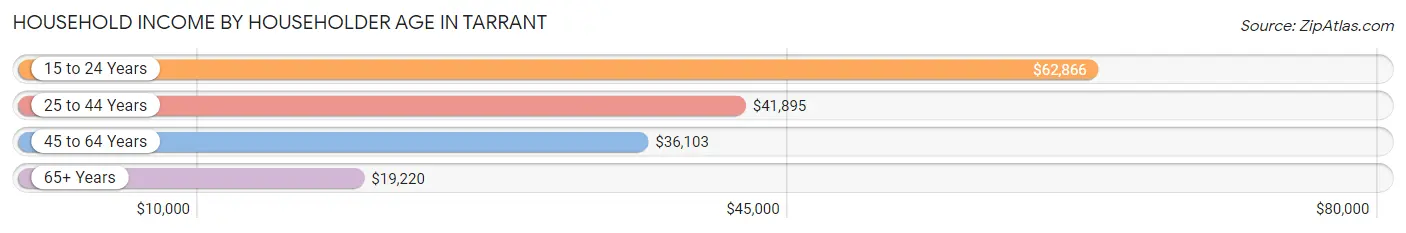
| Income Bracket | # Households | Median Income |
| 15 to 24 Years | 218 (8.1%) | $62,866 |
| 25 to 44 Years | 977 (36.5%) | $41,895 |
| 45 to 64 Years | 710 (26.5%) | $36,103 |
| 65+ Years | 773 (28.9%) | $19,220 |
| Total | 2,678 (100.0%) | $37,768 |
Poverty in Tarrant
Income Below Poverty by Sex and Age in Tarrant
With 20.6% poverty level for males and 36.1% for females among the residents of Tarrant, 15 year old males and 5 year old females are the most vulnerable to poverty, with 6 males (100.0%) and 38 females (80.8%) in their respective age groups living below the poverty level.
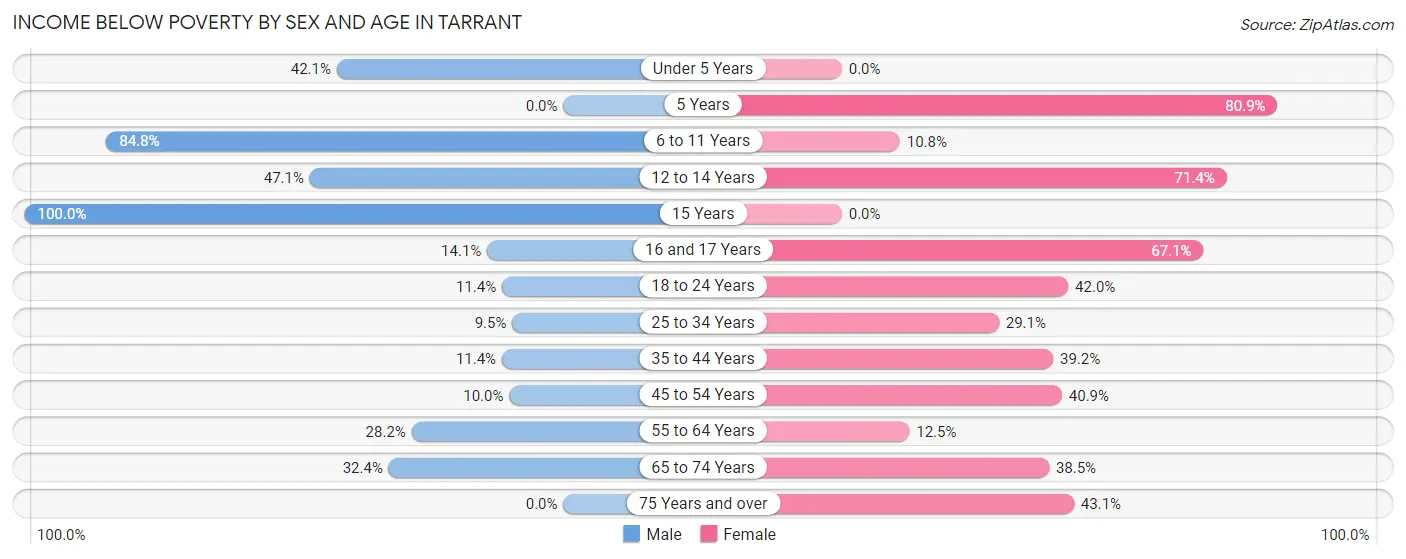
| Age Bracket | Male | Female |
| Under 5 Years | 90 (42.1%) | 0 (0.0%) |
| 5 Years | 0 (0.0%) | 38 (80.8%) |
| 6 to 11 Years | 123 (84.8%) | 17 (10.8%) |
| 12 to 14 Years | 48 (47.1%) | 130 (71.4%) |
| 15 Years | 6 (100.0%) | 0 (0.0%) |
| 16 and 17 Years | 14 (14.1%) | 49 (67.1%) |
| 18 to 24 Years | 42 (11.4%) | 108 (42.0%) |
| 25 to 34 Years | 50 (9.5%) | 102 (29.1%) |
| 35 to 44 Years | 65 (11.4%) | 200 (39.2%) |
| 45 to 54 Years | 23 (10.0%) | 67 (40.8%) |
| 55 to 64 Years | 89 (28.2%) | 56 (12.5%) |
| 65 to 74 Years | 35 (32.4%) | 183 (38.5%) |
| 75 Years and over | 0 (0.0%) | 140 (43.1%) |
| Total | 585 (20.6%) | 1,090 (36.1%) |
Income Above Poverty by Sex and Age in Tarrant
According to the poverty statistics in Tarrant, males aged 5 years and females aged 15 years are the age groups that are most secure financially, with 100.0% of males and 100.0% of females in these age groups living above the poverty line.
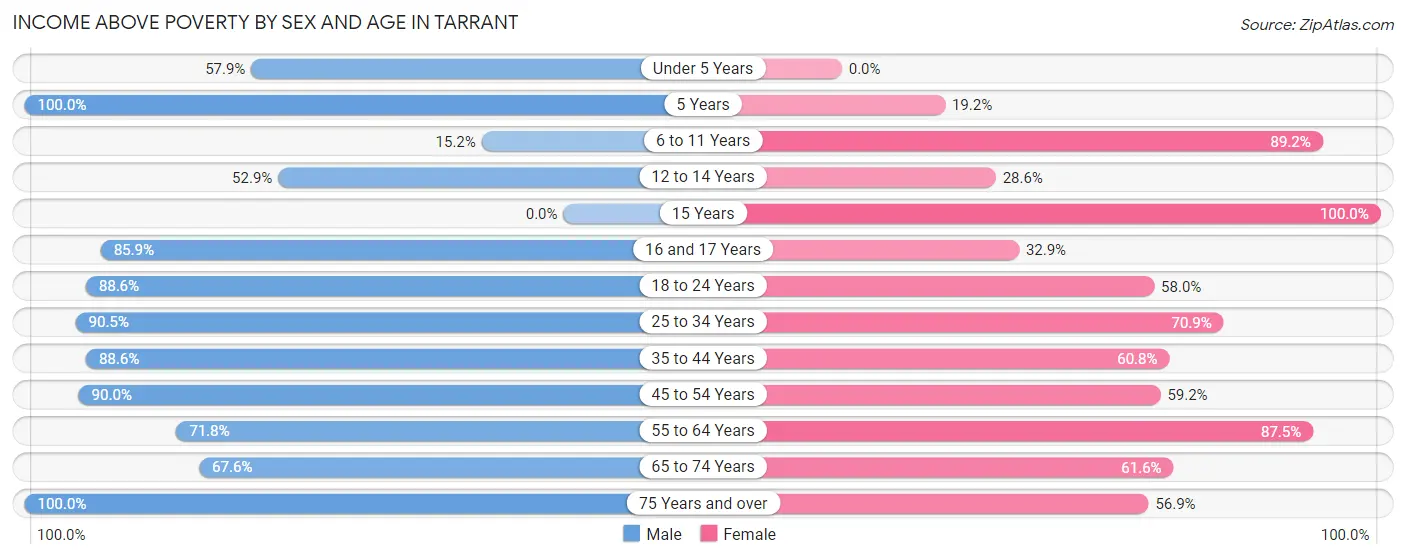
| Age Bracket | Male | Female |
| Under 5 Years | 124 (57.9%) | 0 (0.0%) |
| 5 Years | 88 (100.0%) | 9 (19.2%) |
| 6 to 11 Years | 22 (15.2%) | 141 (89.2%) |
| 12 to 14 Years | 54 (52.9%) | 52 (28.6%) |
| 15 Years | 0 (0.0%) | 26 (100.0%) |
| 16 and 17 Years | 85 (85.9%) | 24 (32.9%) |
| 18 to 24 Years | 327 (88.6%) | 149 (58.0%) |
| 25 to 34 Years | 478 (90.5%) | 248 (70.9%) |
| 35 to 44 Years | 505 (88.6%) | 310 (60.8%) |
| 45 to 54 Years | 206 (90.0%) | 97 (59.2%) |
| 55 to 64 Years | 227 (71.8%) | 391 (87.5%) |
| 65 to 74 Years | 73 (67.6%) | 293 (61.6%) |
| 75 Years and over | 68 (100.0%) | 185 (56.9%) |
| Total | 2,257 (79.4%) | 1,925 (63.8%) |
Income Below Poverty Among Married-Couple Families in Tarrant
The poverty statistics for married-couple families in Tarrant show that 12.1% or 80 of the total 659 families live below the poverty line. Families with 1 or 2 children have the highest poverty rate of 55.2%, comprising of 80 families. On the other hand, families with no children have the lowest poverty rate of 0.0%, which includes 0 families.
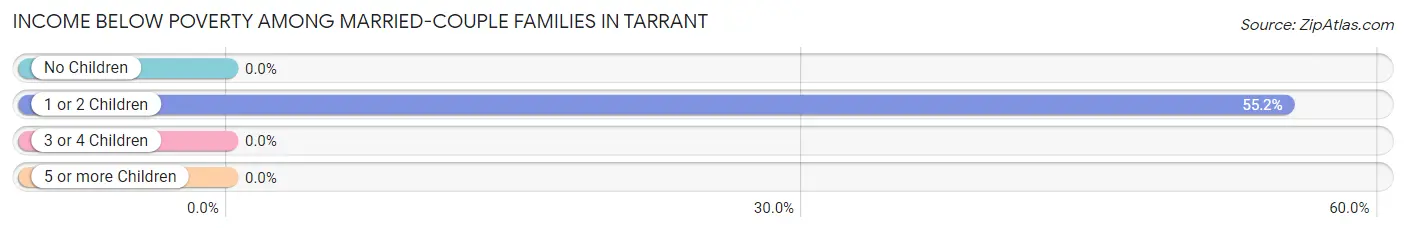
| Children | Above Poverty | Below Poverty |
| No Children | 413 (100.0%) | 0 (0.0%) |
| 1 or 2 Children | 65 (44.8%) | 80 (55.2%) |
| 3 or 4 Children | 101 (100.0%) | 0 (0.0%) |
| 5 or more Children | 0 (0.0%) | 0 (0.0%) |
| Total | 579 (87.9%) | 80 (12.1%) |
Income Below Poverty Among Single-Parent Households in Tarrant
According to the poverty data in Tarrant, 9.3% or 24 single-father households and 59.1% or 276 single-mother households are living below the poverty line. Among single-father households, those with 1 or 2 children have the highest poverty rate, with 24 households (48.0%) experiencing poverty. Likewise, among single-mother households, those with 3 or 4 children have the highest poverty rate, with 51 households (91.1%) falling below the poverty line.
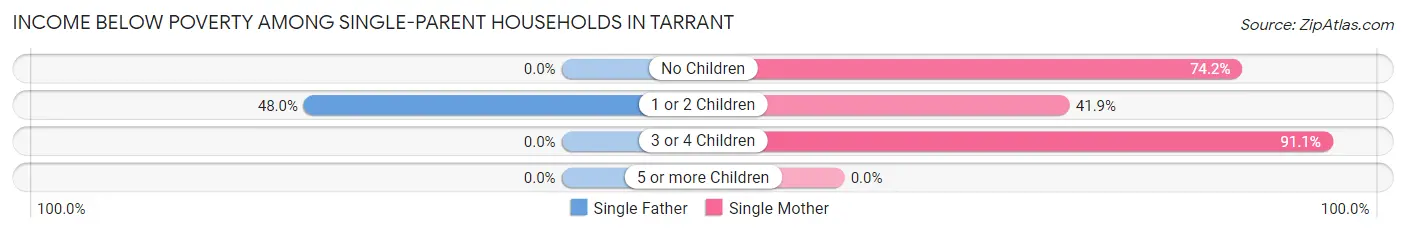
| Children | Single Father | Single Mother |
| No Children | 0 (0.0%) | 121 (74.2%) |
| 1 or 2 Children | 24 (48.0%) | 104 (41.9%) |
| 3 or 4 Children | 0 (0.0%) | 51 (91.1%) |
| 5 or more Children | 0 (0.0%) | 0 (0.0%) |
| Total | 24 (9.3%) | 276 (59.1%) |
Income Below Poverty Among Married-Couple vs Single-Parent Households in Tarrant
The poverty data for Tarrant shows that 80 of the married-couple family households (12.1%) and 300 of the single-parent households (41.4%) are living below the poverty level. Within the married-couple family households, those with 1 or 2 children have the highest poverty rate, with 80 households (55.2%) falling below the poverty line. Among the single-parent households, those with 3 or 4 children have the highest poverty rate, with 51 household (78.5%) living below poverty.
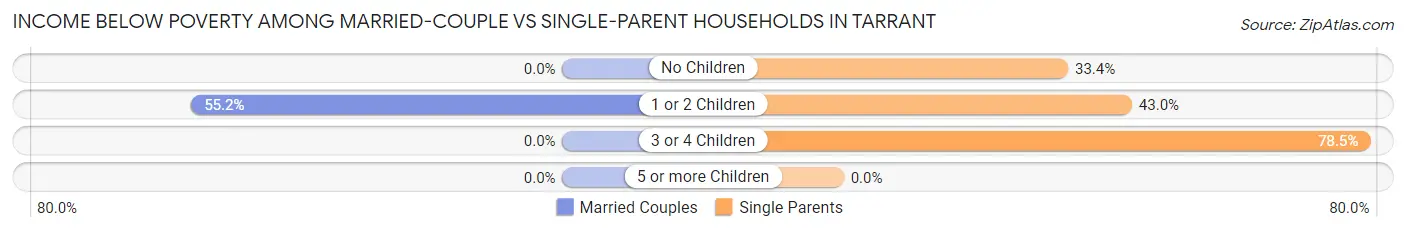
| Children | Married-Couple Families | Single-Parent Households |
| No Children | 0 (0.0%) | 121 (33.4%) |
| 1 or 2 Children | 80 (55.2%) | 128 (42.9%) |
| 3 or 4 Children | 0 (0.0%) | 51 (78.5%) |
| 5 or more Children | 0 (0.0%) | 0 (0.0%) |
| Total | 80 (12.1%) | 300 (41.4%) |
Race in Tarrant
The most populous races in Tarrant are Black / African American (3,049 | 50.2%), White / Caucasian (2,260 | 37.2%), and Hispanic or Latino (816 | 13.4%).

| Race | # Population | % Population |
| Asian | 0 | 0.0% |
| Black / African American | 3,049 | 50.2% |
| Hawaiian / Pacific | 0 | 0.0% |
| Hispanic or Latino | 816 | 13.4% |
| Native / Alaskan | 7 | 0.1% |
| White / Caucasian | 2,260 | 37.2% |
| Two or more Races | 209 | 3.4% |
| Some other Race | 552 | 9.1% |
| Total | 6,077 | 100.0% |
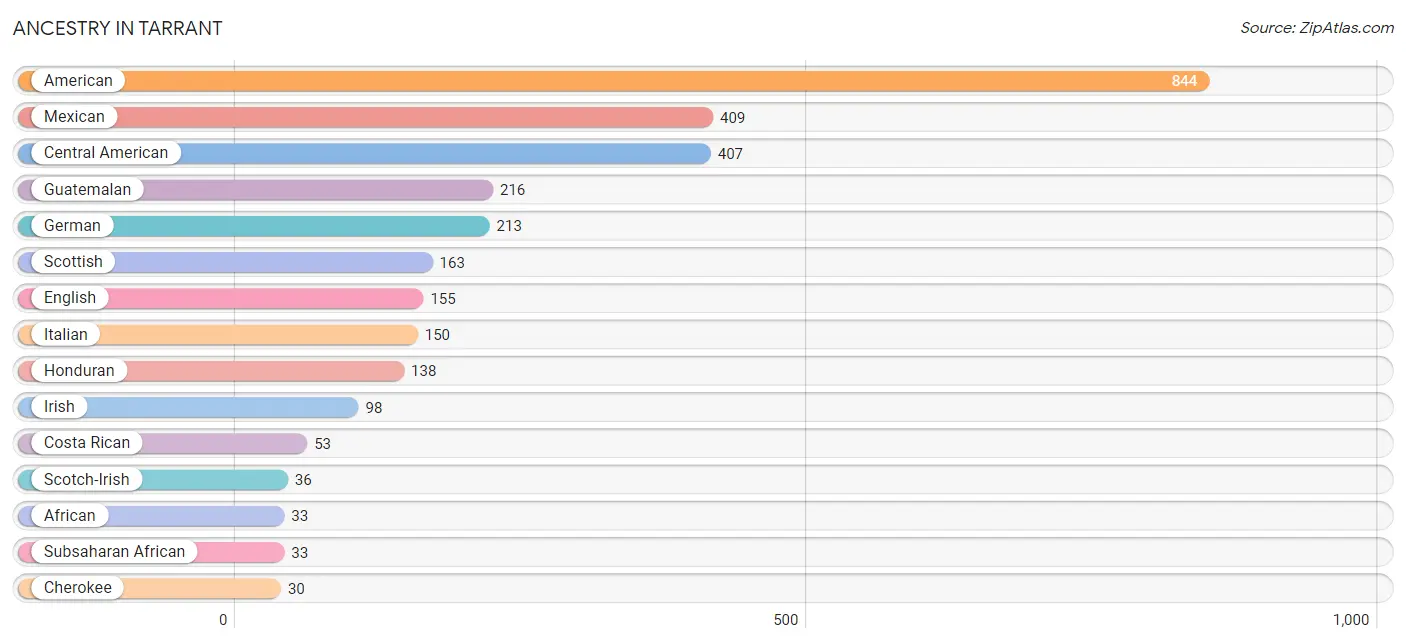
Ancestry in Tarrant
The most populous ancestries reported in Tarrant are American (844 | 13.9%), Mexican (409 | 6.7%), Central American (407 | 6.7%), Guatemalan (216 | 3.5%), and German (213 | 3.5%), together accounting for 34.4% of all Tarrant residents.
| Ancestry | # Population | % Population |
| African | 33 | 0.5% |
| American | 844 | 13.9% |
| Arab | 7 | 0.1% |
| British | 20 | 0.3% |
| Central American | 407 | 6.7% |
| Cherokee | 30 | 0.5% |
| Costa Rican | 53 | 0.9% |
| Dutch | 26 | 0.4% |
| English | 155 | 2.5% |
| European | 29 | 0.5% |
| French | 10 | 0.2% |
| German | 213 | 3.5% |
| Guatemalan | 216 | 3.5% |
| Honduran | 138 | 2.3% |
| Irish | 98 | 1.6% |
| Italian | 150 | 2.5% |
| Mexican | 409 | 6.7% |
| Moroccan | 7 | 0.1% |
| Polish | 16 | 0.3% |
| Scotch-Irish | 36 | 0.6% |
| Scottish | 163 | 2.7% |
| Subsaharan African | 33 | 0.5% |
| Welsh | 21 | 0.4% | View All 23 Rows |
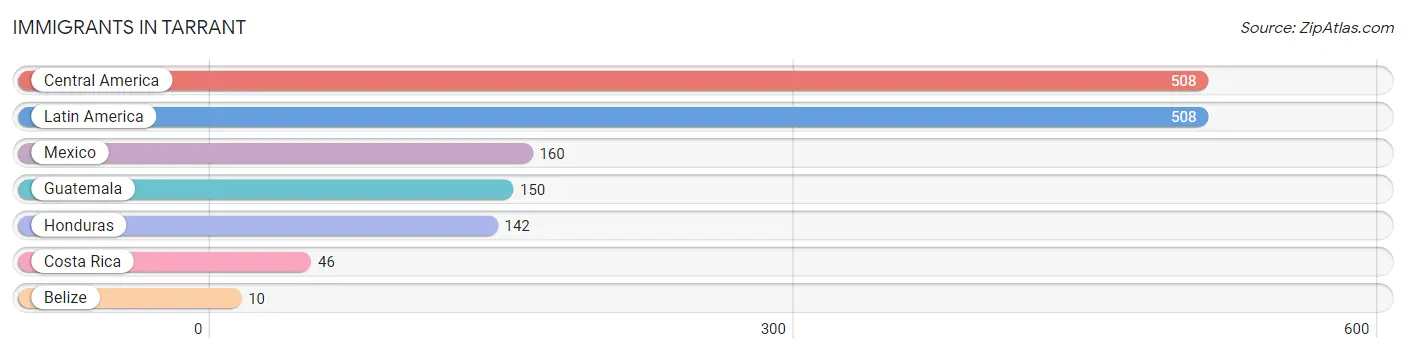
Immigrants in Tarrant
The most numerous immigrant groups reported in Tarrant came from Central America (508 | 8.4%), Latin America (508 | 8.4%), Mexico (160 | 2.6%), Guatemala (150 | 2.5%), and Honduras (142 | 2.3%), together accounting for 24.2% of all Tarrant residents.
| Immigration Origin | # Population | % Population |
| Belize | 10 | 0.2% |
| Central America | 508 | 8.4% |
| Costa Rica | 46 | 0.8% |
| Guatemala | 150 | 2.5% |
| Honduras | 142 | 2.3% |
| Latin America | 508 | 8.4% |
| Mexico | 160 | 2.6% | View All 7 Rows |
Sex and Age in Tarrant
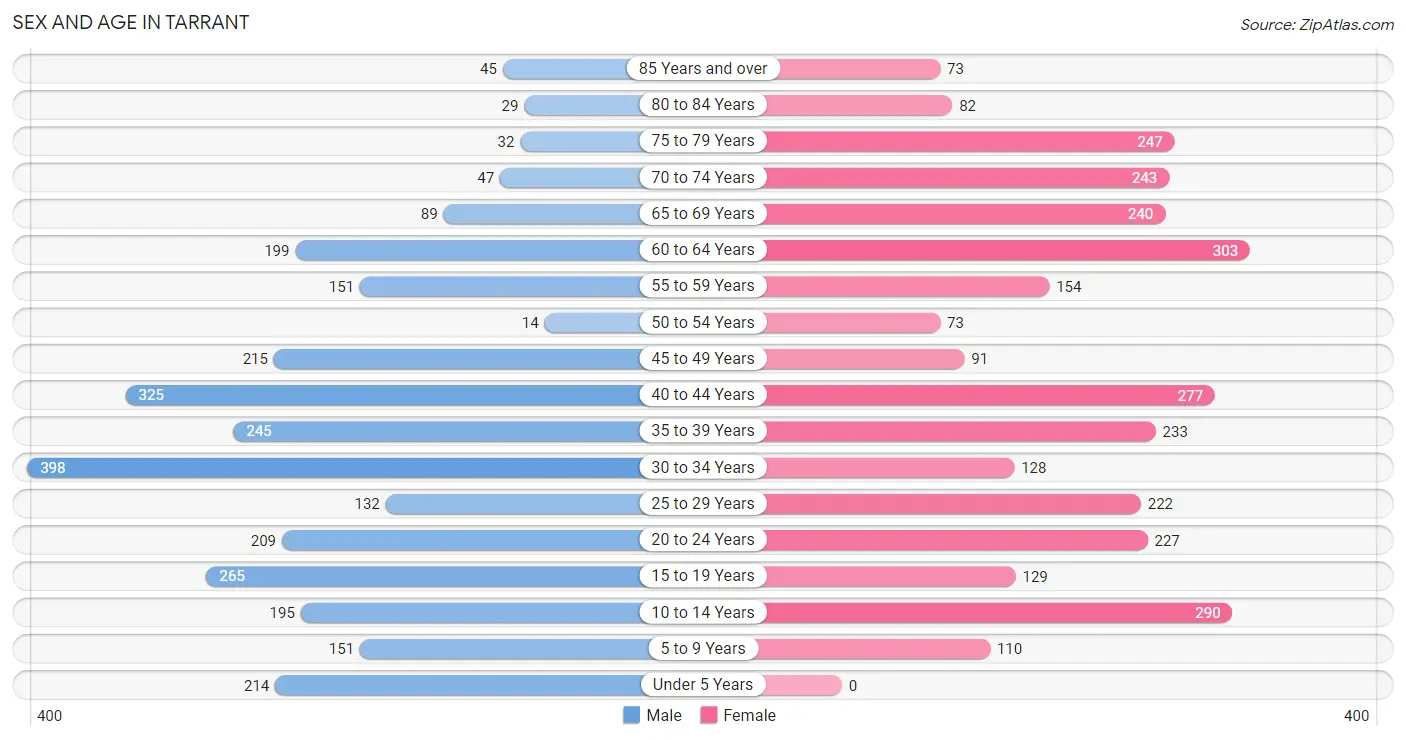
Sex and Age in Tarrant
The most populous age groups in Tarrant are 30 to 34 Years (398 | 13.5%) for men and 60 to 64 Years (303 | 9.7%) for women.
| Age Bracket | Male | Female |
| Under 5 Years | 214 (7.2%) | 0 (0.0%) |
| 5 to 9 Years | 151 (5.1%) | 110 (3.5%) |
| 10 to 14 Years | 195 (6.6%) | 290 (9.3%) |
| 15 to 19 Years | 265 (9.0%) | 129 (4.1%) |
| 20 to 24 Years | 209 (7.1%) | 227 (7.3%) |
| 25 to 29 Years | 132 (4.5%) | 222 (7.1%) |
| 30 to 34 Years | 398 (13.5%) | 128 (4.1%) |
| 35 to 39 Years | 245 (8.3%) | 233 (7.5%) |
| 40 to 44 Years | 325 (11.0%) | 277 (8.9%) |
| 45 to 49 Years | 215 (7.3%) | 91 (2.9%) |
| 50 to 54 Years | 14 (0.5%) | 73 (2.3%) |
| 55 to 59 Years | 151 (5.1%) | 154 (4.9%) |
| 60 to 64 Years | 199 (6.7%) | 303 (9.7%) |
| 65 to 69 Years | 89 (3.0%) | 240 (7.7%) |
| 70 to 74 Years | 47 (1.6%) | 243 (7.8%) |
| 75 to 79 Years | 32 (1.1%) | 247 (7.9%) |
| 80 to 84 Years | 29 (1.0%) | 82 (2.6%) |
| 85 Years and over | 45 (1.5%) | 73 (2.3%) |
| Total | 2,955 (100.0%) | 3,122 (100.0%) |
Families and Households in Tarrant
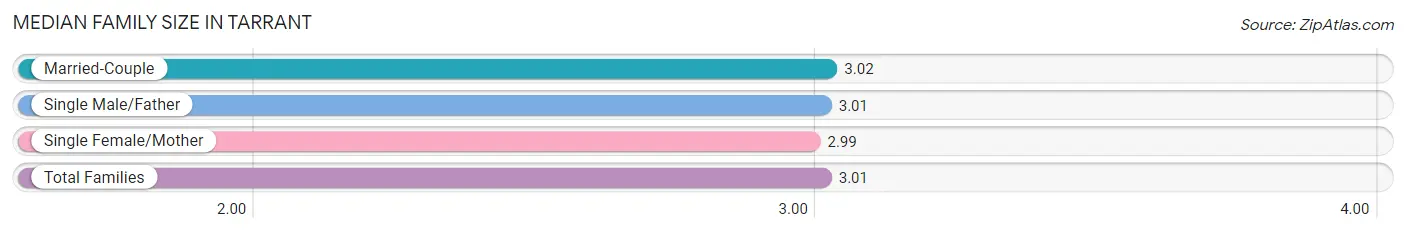
Median Family Size in Tarrant
The median family size in Tarrant is 3.01 persons per family, with married-couple families (659 | 47.6%) accounting for the largest median family size of 3.02 persons per family. On the other hand, single female/mother families (467 | 33.7%) represent the smallest median family size with 2.99 persons per family.
| Family Type | # Families | Family Size |
| Married-Couple | 659 (47.6%) | 3.02 |
| Single Male/Father | 258 (18.6%) | 3.01 |
| Single Female/Mother | 467 (33.7%) | 2.99 |
| Total Families | 1,384 (100.0%) | 3.01 |
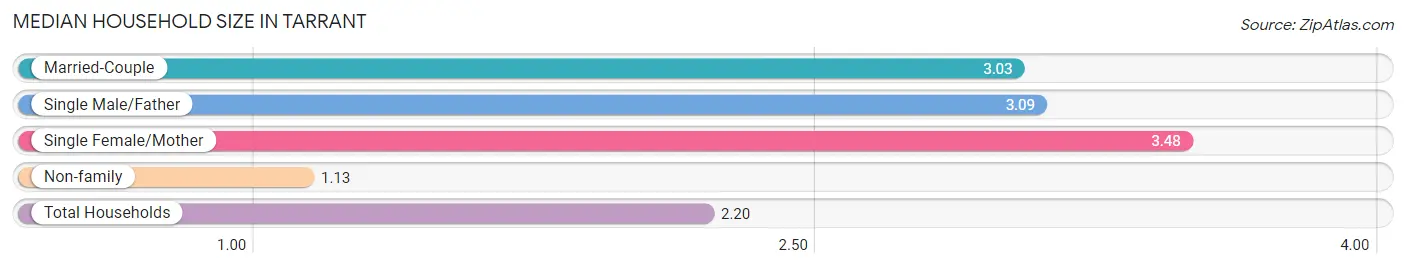
Median Household Size in Tarrant
The median household size in Tarrant is 2.20 persons per household, with single female/mother households (467 | 17.4%) accounting for the largest median household size of 3.48 persons per household. non-family households (1,294 | 48.3%) represent the smallest median household size with 1.13 persons per household.
| Household Type | # Households | Household Size |
| Married-Couple | 659 (24.6%) | 3.03 |
| Single Male/Father | 258 (9.6%) | 3.09 |
| Single Female/Mother | 467 (17.4%) | 3.48 |
| Non-family | 1,294 (48.3%) | 1.13 |
| Total Households | 2,678 (100.0%) | 2.20 |
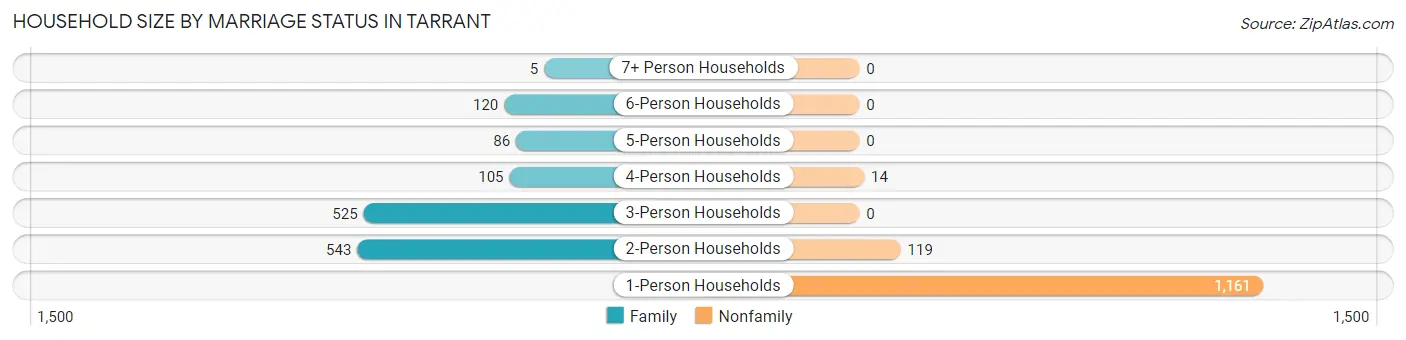
Household Size by Marriage Status in Tarrant
Out of a total of 2,678 households in Tarrant, 1,384 (51.7%) are family households, while 1,294 (48.3%) are nonfamily households. The most numerous type of family households are 2-person households, comprising 543, and the most common type of nonfamily households are 1-person households, comprising 1,161.
| Household Size | Family Households | Nonfamily Households |
| 1-Person Households | - | 1,161 (43.3%) |
| 2-Person Households | 543 (20.3%) | 119 (4.4%) |
| 3-Person Households | 525 (19.6%) | 0 (0.0%) |
| 4-Person Households | 105 (3.9%) | 14 (0.5%) |
| 5-Person Households | 86 (3.2%) | 0 (0.0%) |
| 6-Person Households | 120 (4.5%) | 0 (0.0%) |
| 7+ Person Households | 5 (0.2%) | 0 (0.0%) |
| Total | 1,384 (51.7%) | 1,294 (48.3%) |
Female Fertility in Tarrant
Fertility by Age in Tarrant
Average fertility rate in Tarrant is 39.0 births per 1,000 women. Women in the age bracket of 20 to 34 years have the highest fertility rate with 88.0 births per 1,000 women. Women in the age bracket of 20 to 34 years acount for 100.0% of all women with births.
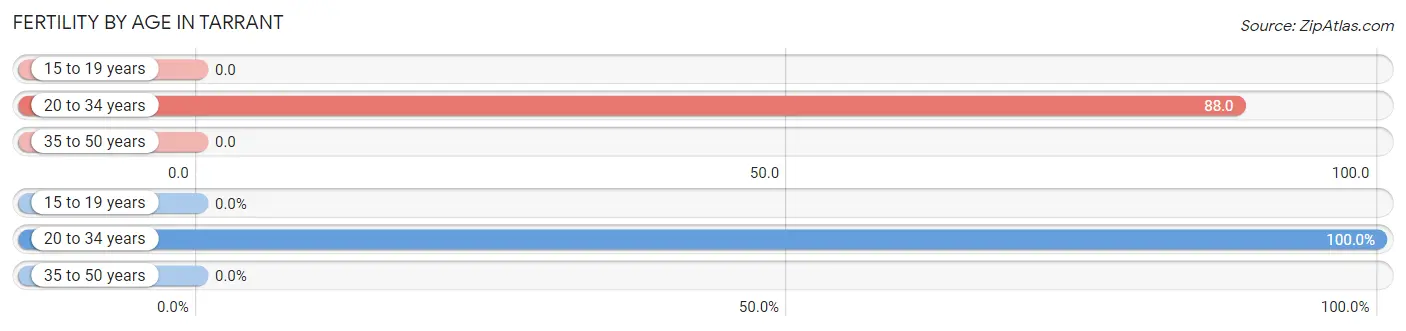
| Age Bracket | Women with Births | Births / 1,000 Women |
| 15 to 19 years | 0 (0.0%) | 0.0 |
| 20 to 34 years | 51 (100.0%) | 88.0 |
| 35 to 50 years | 0 (0.0%) | 0.0 |
| Total | 51 (100.0%) | 39.0 |
Fertility by Age by Marriage Status in Tarrant
9.8% of women with births (51) in Tarrant are married. The highest percentage of unmarried women with births falls into 20 to 34 years age bracket with 90.2% of them unmarried at the time of birth, while the lowest percentage of unmarried women with births belong to 20 to 34 years age bracket with 90.2% of them unmarried.
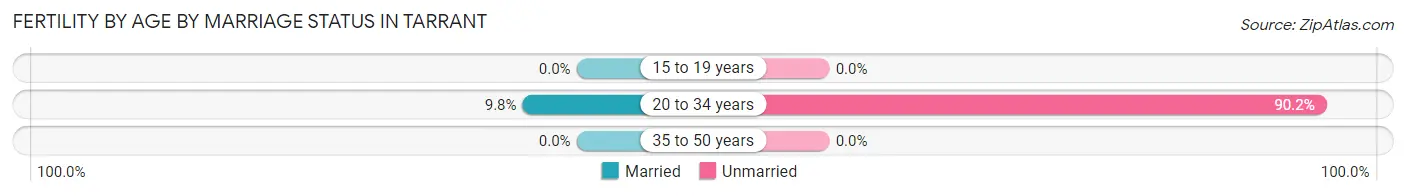
| Age Bracket | Married | Unmarried |
| 15 to 19 years | 0 (0.0%) | 0 (0.0%) |
| 20 to 34 years | 5 (9.8%) | 46 (90.2%) |
| 35 to 50 years | 0 (0.0%) | 0 (0.0%) |
| Total | 5 (9.8%) | 46 (90.2%) |
Fertility by Education in Tarrant
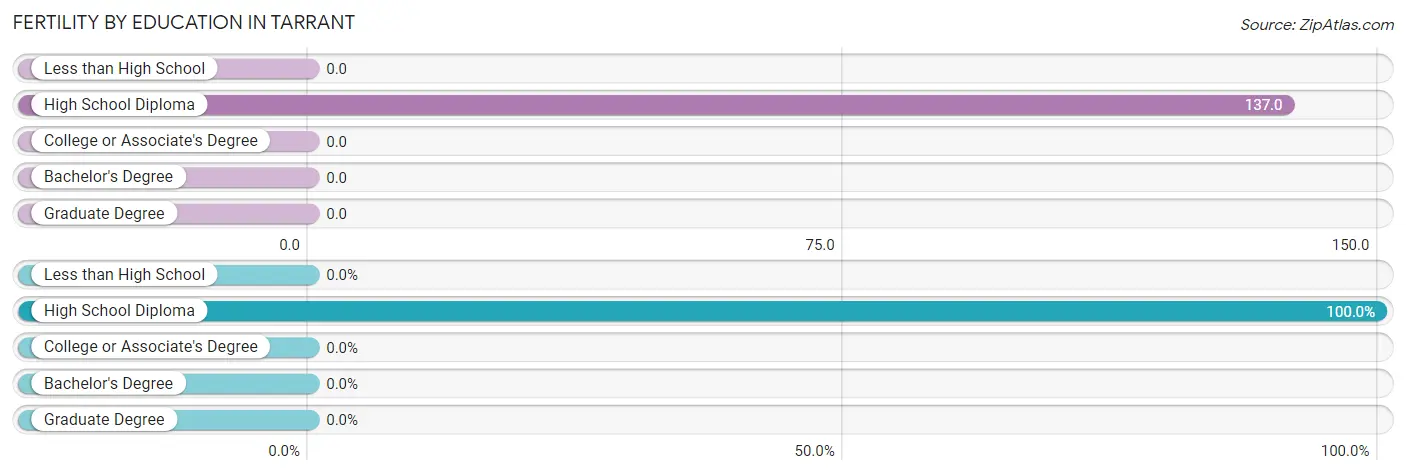
| Educational Attainment | Women with Births | Births / 1,000 Women |
| Less than High School | 0 (0.0%) | 0.0 |
| High School Diploma | 51 (100.0%) | 137.0 |
| College or Associate's Degree | 0 (0.0%) | 0.0 |
| Bachelor's Degree | 0 (0.0%) | 0.0 |
| Graduate Degree | 0 (0.0%) | 0.0 |
| Total | 51 (100.0%) | 39.0 |
Fertility by Education by Marriage Status in Tarrant
90.2% of women with births in Tarrant are unmarried. Women with the educational attainment of high school diploma are most likely to be married with 9.8% of them married at childbirth, while women with the educational attainment of high school diploma are least likely to be married with 90.2% of them unmarried at childbirth.
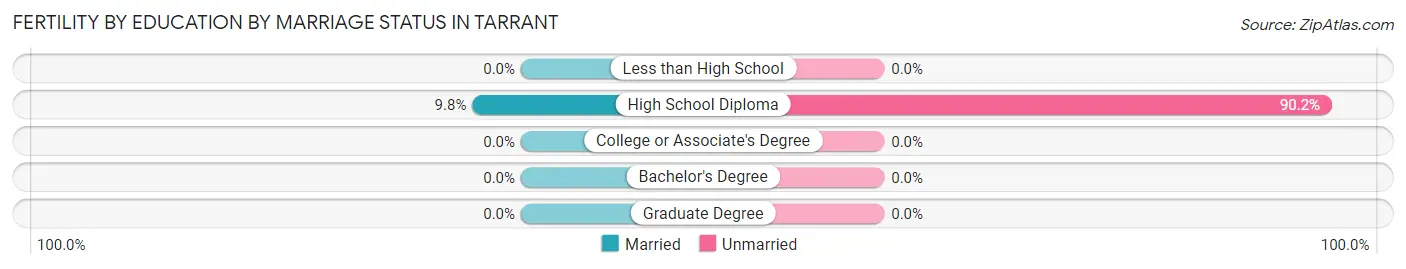
| Educational Attainment | Married | Unmarried |
| Less than High School | 0 (0.0%) | 0 (0.0%) |
| High School Diploma | 5 (9.8%) | 46 (90.2%) |
| College or Associate's Degree | 0 (0.0%) | 0 (0.0%) |
| Bachelor's Degree | 0 (0.0%) | 0 (0.0%) |
| Graduate Degree | 0 (0.0%) | 0 (0.0%) |
| Total | 5 (9.8%) | 46 (90.2%) |
Employment Characteristics in Tarrant
Employment by Class of Employer in Tarrant
Among the 2,810 employed individuals in Tarrant, private company employees (2,304 | 82.0%), not-for-profit organizations (159 | 5.7%), and self-employed (incorporated) (107 | 3.8%) make up the most common classes of employment.
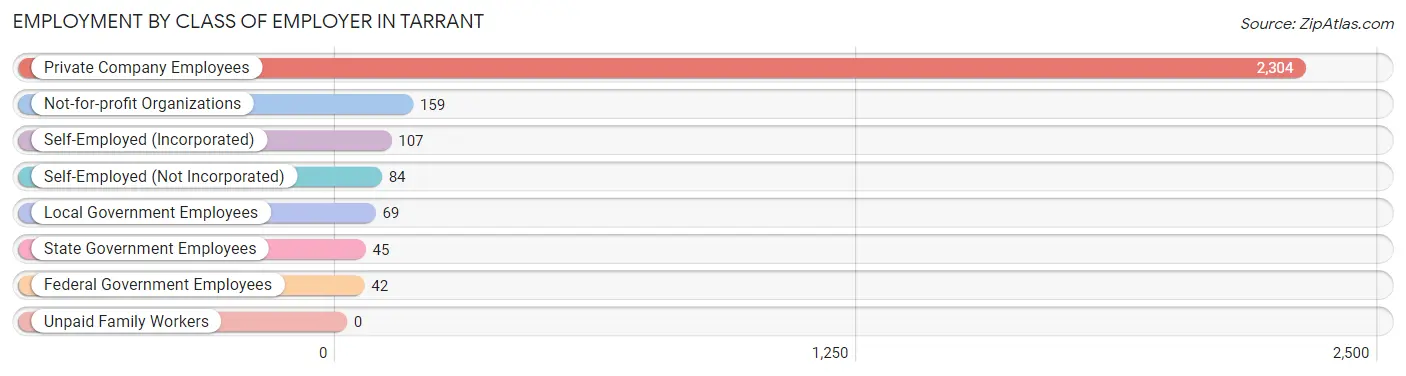
| Employer Class | # Employees | % Employees |
| Private Company Employees | 2,304 | 82.0% |
| Self-Employed (Incorporated) | 107 | 3.8% |
| Self-Employed (Not Incorporated) | 84 | 3.0% |
| Not-for-profit Organizations | 159 | 5.7% |
| Local Government Employees | 69 | 2.5% |
| State Government Employees | 45 | 1.6% |
| Federal Government Employees | 42 | 1.5% |
| Unpaid Family Workers | 0 | 0.0% |
| Total | 2,810 | 100.0% |
Employment Status by Age in Tarrant
According to the labor force statistics for Tarrant, out of the total population over 16 years of age (5,085), 59.1% or 3,005 individuals are in the labor force, with 6.5% or 195 of them unemployed. The age group with the highest labor force participation rate is 20 to 24 years, with 92.0% or 401 individuals in the labor force. Within the labor force, the 60 to 64 years age range has the highest percentage of unemployed individuals, with 12.7% or 13 of them being unemployed.

| Age Bracket | In Labor Force | Unemployed |
| 16 to 19 Years | 236 (65.2%) | 15 (6.4%) |
| 20 to 24 Years | 401 (92.0%) | 29 (7.2%) |
| 25 to 29 Years | 310 (87.6%) | 0 (0.0%) |
| 30 to 34 Years | 459 (87.3%) | 0 (0.0%) |
| 35 to 44 Years | 843 (78.1%) | 103 (12.2%) |
| 45 to 54 Years | 325 (82.7%) | 0 (0.0%) |
| 55 to 59 Years | 122 (40.0%) | 14 (11.5%) |
| 60 to 64 Years | 102 (20.3%) | 13 (12.7%) |
| 65 to 74 Years | 180 (29.1%) | 22 (12.2%) |
| 75 Years and over | 28 (5.5%) | 0 (0.0%) |
| Total | 3,005 (59.1%) | 195 (6.5%) |
Employment Status by Educational Attainment in Tarrant
According to labor force statistics for Tarrant, 68.4% of individuals (2,161) out of the total population between 25 and 64 years of age (3,160) are in the labor force, with 6.0% or 130 of them being unemployed. The group with the highest labor force participation rate are those with the educational attainment of bachelor's degree or higher, with 78.9% or 153 individuals in the labor force. Within the labor force, individuals with less than high school education have the highest percentage of unemployment, with 22.5% or 73 of them being unemployed.
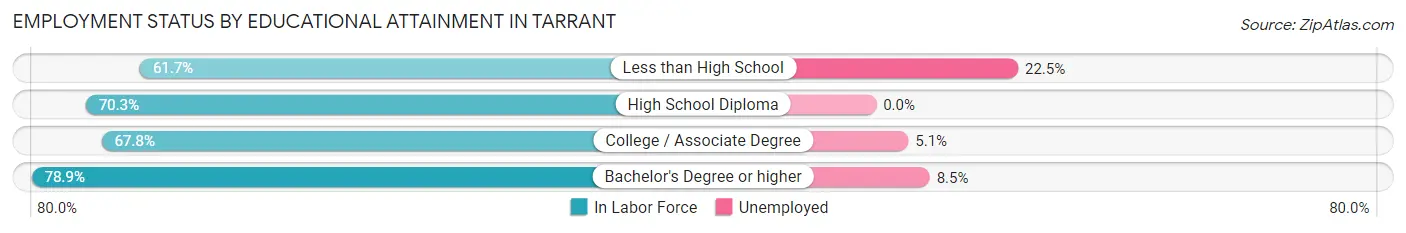
| Educational Attainment | In Labor Force | Unemployed |
| Less than High School | 324 (61.7%) | 118 (22.5%) |
| High School Diploma | 822 (70.3%) | 0 (0.0%) |
| College / Associate Degree | 862 (67.8%) | 65 (5.1%) |
| Bachelor's Degree or higher | 153 (78.9%) | 16 (8.5%) |
| Total | 2,161 (68.4%) | 190 (6.0%) |
Employment Occupations by Sex in Tarrant
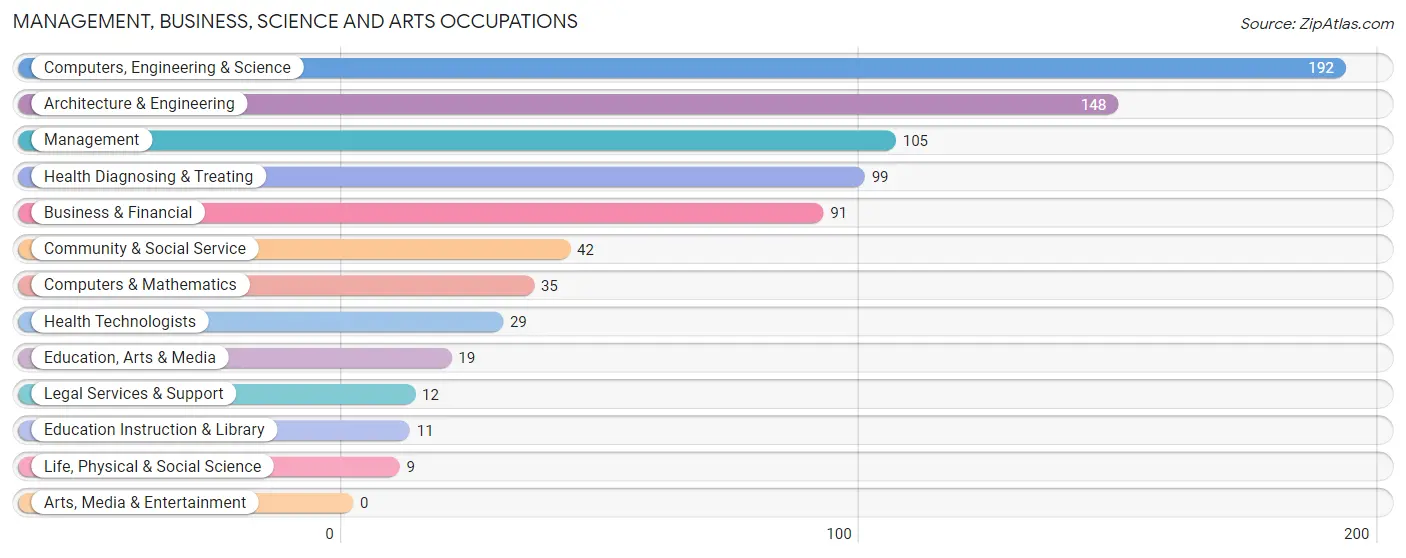
Management, Business, Science and Arts Occupations
The most common Management, Business, Science and Arts occupations in Tarrant are Computers, Engineering & Science (192 | 6.8%), Architecture & Engineering (148 | 5.3%), Management (105 | 3.7%), Health Diagnosing & Treating (99 | 3.5%), and Business & Financial (91 | 3.2%).
Management, Business, Science and Arts Occupations by Sex
Within the Management, Business, Science and Arts occupations in Tarrant, the most male-oriented occupations are Architecture & Engineering (100.0%), Life, Physical & Social Science (100.0%), and Education, Arts & Media (100.0%), while the most female-oriented occupations are Computers & Mathematics (100.0%), Health Diagnosing & Treating (100.0%), and Health Technologists (100.0%).
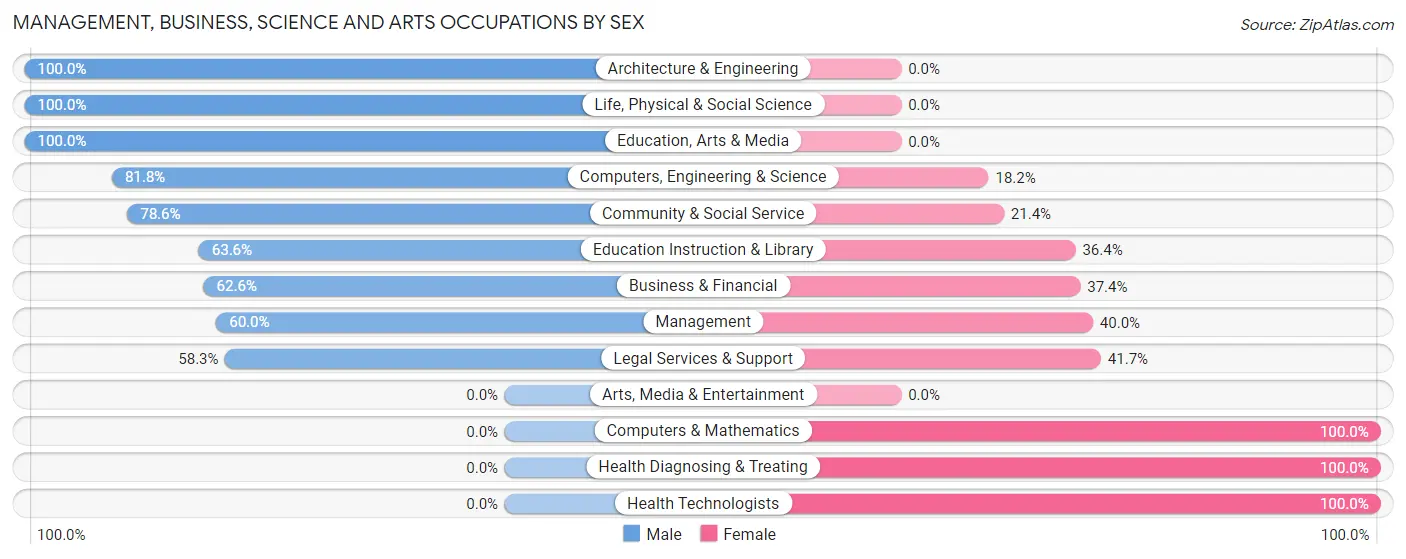
| Occupation | Male | Female |
| Management | 63 (60.0%) | 42 (40.0%) |
| Business & Financial | 57 (62.6%) | 34 (37.4%) |
| Computers, Engineering & Science | 157 (81.8%) | 35 (18.2%) |
| Computers & Mathematics | 0 (0.0%) | 35 (100.0%) |
| Architecture & Engineering | 148 (100.0%) | 0 (0.0%) |
| Life, Physical & Social Science | 9 (100.0%) | 0 (0.0%) |
| Community & Social Service | 33 (78.6%) | 9 (21.4%) |
| Education, Arts & Media | 19 (100.0%) | 0 (0.0%) |
| Legal Services & Support | 7 (58.3%) | 5 (41.7%) |
| Education Instruction & Library | 7 (63.6%) | 4 (36.4%) |
| Arts, Media & Entertainment | 0 (0.0%) | 0 (0.0%) |
| Health Diagnosing & Treating | 0 (0.0%) | 99 (100.0%) |
| Health Technologists | 0 (0.0%) | 29 (100.0%) |
| Total (Category) | 310 (58.6%) | 219 (41.4%) |
| Total (Overall) | 1,672 (59.5%) | 1,138 (40.5%) |
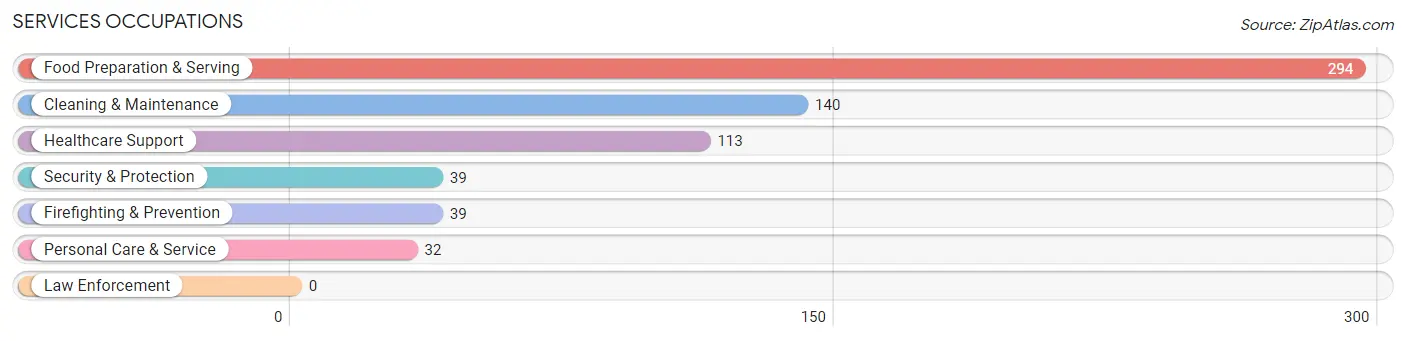
Services Occupations
The most common Services occupations in Tarrant are Food Preparation & Serving (294 | 10.5%), Cleaning & Maintenance (140 | 5.0%), Healthcare Support (113 | 4.0%), Security & Protection (39 | 1.4%), and Firefighting & Prevention (39 | 1.4%).
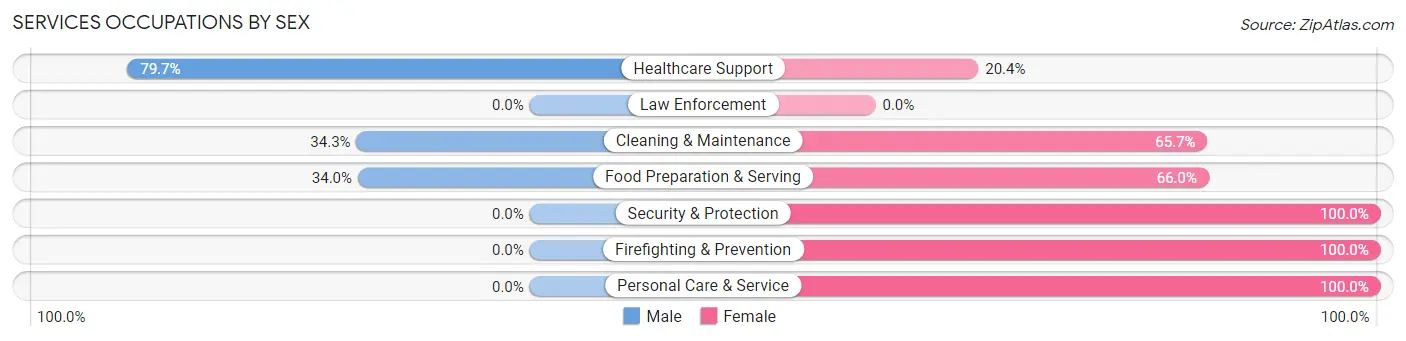
Services Occupations by Sex
Within the Services occupations in Tarrant, the most male-oriented occupations are Healthcare Support (79.6%), Cleaning & Maintenance (34.3%), and Food Preparation & Serving (34.0%), while the most female-oriented occupations are Security & Protection (100.0%), Firefighting & Prevention (100.0%), and Personal Care & Service (100.0%).
| Occupation | Male | Female |
| Healthcare Support | 90 (79.6%) | 23 (20.3%) |
| Security & Protection | 0 (0.0%) | 39 (100.0%) |
| Firefighting & Prevention | 0 (0.0%) | 39 (100.0%) |
| Law Enforcement | 0 (0.0%) | 0 (0.0%) |
| Food Preparation & Serving | 100 (34.0%) | 194 (66.0%) |
| Cleaning & Maintenance | 48 (34.3%) | 92 (65.7%) |
| Personal Care & Service | 0 (0.0%) | 32 (100.0%) |
| Total (Category) | 238 (38.5%) | 380 (61.5%) |
| Total (Overall) | 1,672 (59.5%) | 1,138 (40.5%) |
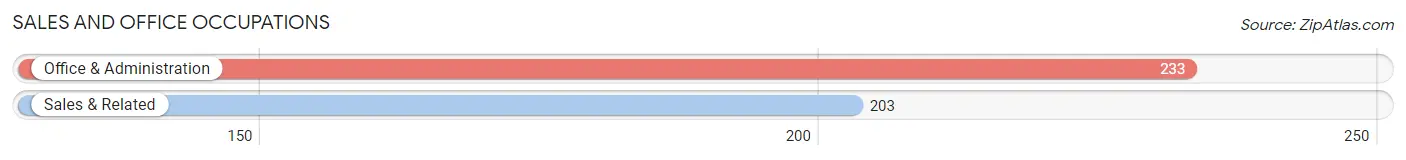
Sales and Office Occupations
The most common Sales and Office occupations in Tarrant are Office & Administration (233 | 8.3%), and Sales & Related (203 | 7.2%).
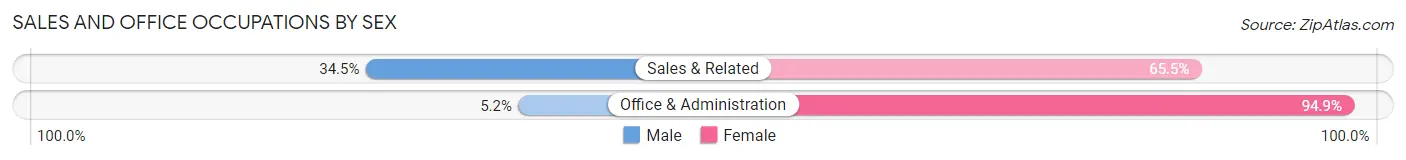
Sales and Office Occupations by Sex
| Occupation | Male | Female |
| Sales & Related | 70 (34.5%) | 133 (65.5%) |
| Office & Administration | 12 (5.1%) | 221 (94.9%) |
| Total (Category) | 82 (18.8%) | 354 (81.2%) |
| Total (Overall) | 1,672 (59.5%) | 1,138 (40.5%) |
Natural Resources, Construction and Maintenance Occupations
The most common Natural Resources, Construction and Maintenance occupations in Tarrant are Construction & Extraction (167 | 5.9%), and Installation, Maintenance & Repair (158 | 5.6%).
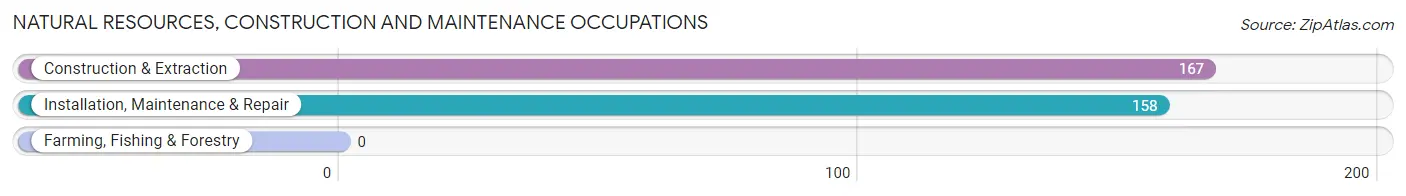
Natural Resources, Construction and Maintenance Occupations by Sex
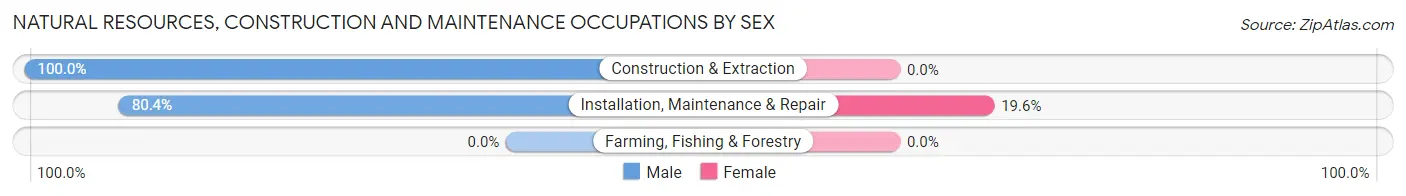
| Occupation | Male | Female |
| Farming, Fishing & Forestry | 0 (0.0%) | 0 (0.0%) |
| Construction & Extraction | 167 (100.0%) | 0 (0.0%) |
| Installation, Maintenance & Repair | 127 (80.4%) | 31 (19.6%) |
| Total (Category) | 294 (90.5%) | 31 (9.5%) |
| Total (Overall) | 1,672 (59.5%) | 1,138 (40.5%) |
Production, Transportation and Moving Occupations
The most common Production, Transportation and Moving occupations in Tarrant are Material Moving (531 | 18.9%), Production (273 | 9.7%), and Transportation (98 | 3.5%).
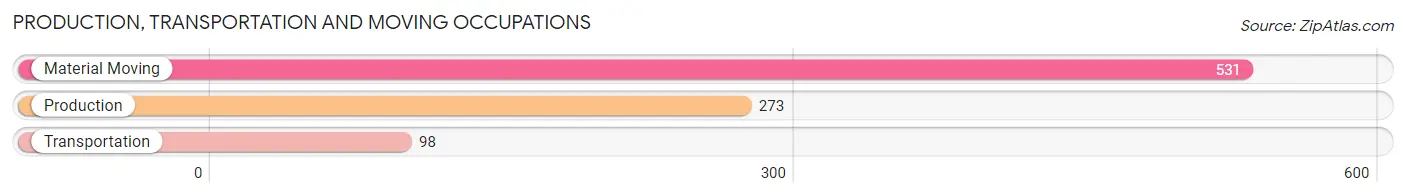
Production, Transportation and Moving Occupations by Sex
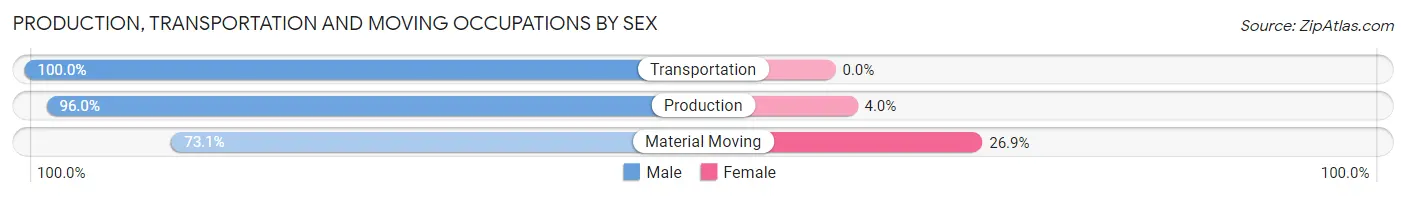
| Occupation | Male | Female |
| Production | 262 (96.0%) | 11 (4.0%) |
| Transportation | 98 (100.0%) | 0 (0.0%) |
| Material Moving | 388 (73.1%) | 143 (26.9%) |
| Total (Category) | 748 (82.9%) | 154 (17.1%) |
| Total (Overall) | 1,672 (59.5%) | 1,138 (40.5%) |
Employment Industries by Sex in Tarrant
Employment Industries in Tarrant
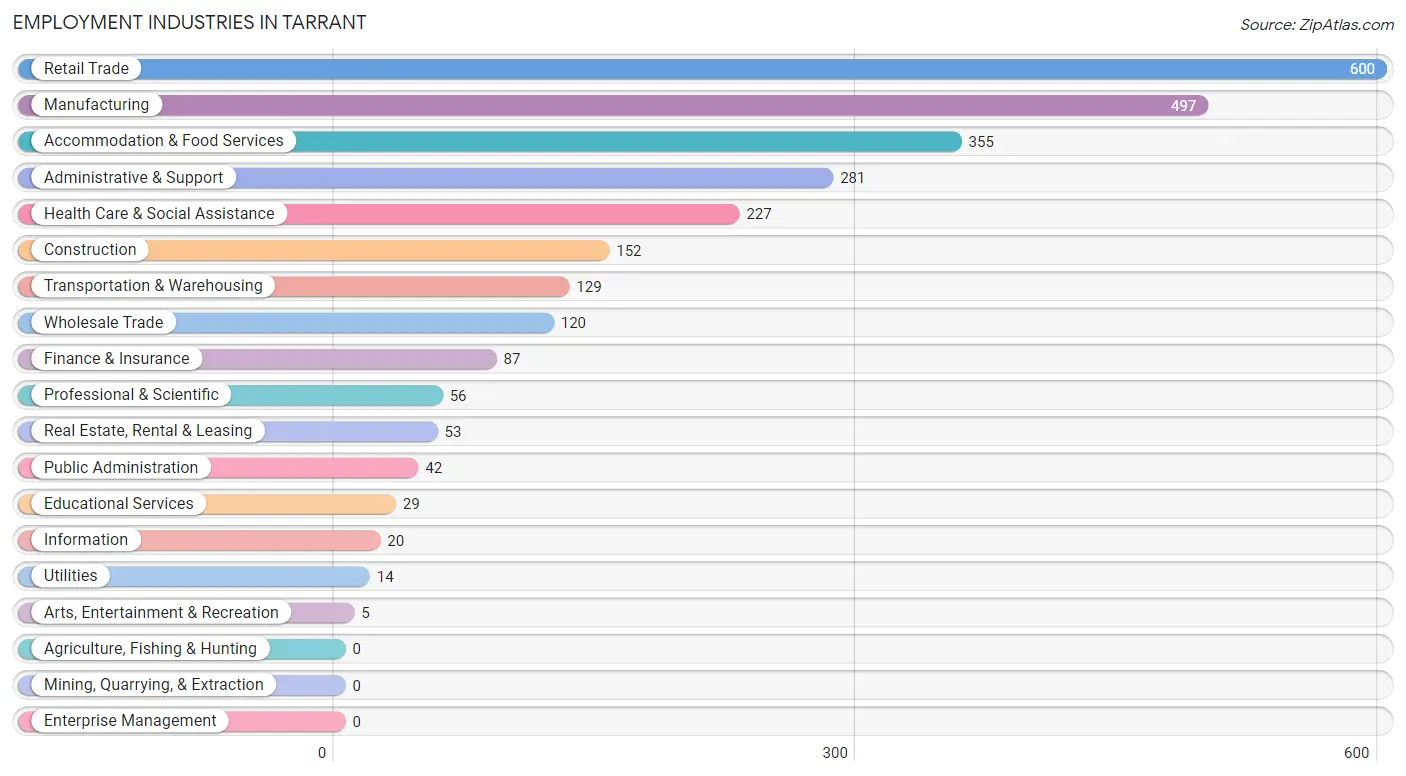
The major employment industries in Tarrant include Retail Trade (600 | 21.3%), Manufacturing (497 | 17.7%), Accommodation & Food Services (355 | 12.6%), Administrative & Support (281 | 10.0%), and Health Care & Social Assistance (227 | 8.1%).
Employment Industries by Sex in Tarrant
The Tarrant industries that see more men than women are Utilities (100.0%), Finance & Insurance (100.0%), and Real Estate, Rental & Leasing (100.0%), whereas the industries that tend to have a higher number of women are Public Administration (90.5%), Accommodation & Food Services (73.2%), and Educational Services (72.4%).
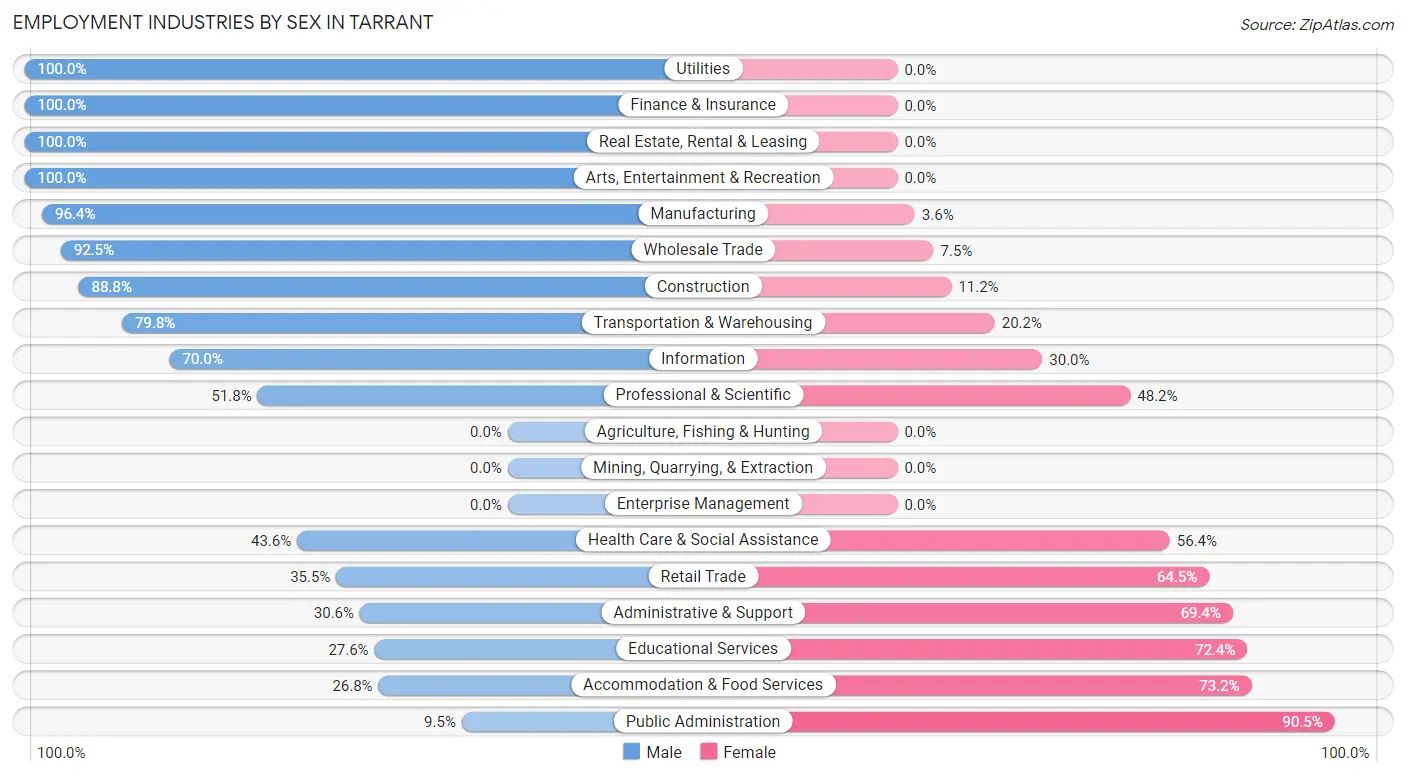
| Industry | Male | Female |
| Agriculture, Fishing & Hunting | 0 (0.0%) | 0 (0.0%) |
| Mining, Quarrying, & Extraction | 0 (0.0%) | 0 (0.0%) |
| Construction | 135 (88.8%) | 17 (11.2%) |
| Manufacturing | 479 (96.4%) | 18 (3.6%) |
| Wholesale Trade | 111 (92.5%) | 9 (7.5%) |
| Retail Trade | 213 (35.5%) | 387 (64.5%) |
| Transportation & Warehousing | 103 (79.8%) | 26 (20.2%) |
| Utilities | 14 (100.0%) | 0 (0.0%) |
| Information | 14 (70.0%) | 6 (30.0%) |
| Finance & Insurance | 87 (100.0%) | 0 (0.0%) |
| Real Estate, Rental & Leasing | 53 (100.0%) | 0 (0.0%) |
| Professional & Scientific | 29 (51.8%) | 27 (48.2%) |
| Enterprise Management | 0 (0.0%) | 0 (0.0%) |
| Administrative & Support | 86 (30.6%) | 195 (69.4%) |
| Educational Services | 8 (27.6%) | 21 (72.4%) |
| Health Care & Social Assistance | 99 (43.6%) | 128 (56.4%) |
| Arts, Entertainment & Recreation | 5 (100.0%) | 0 (0.0%) |
| Accommodation & Food Services | 95 (26.8%) | 260 (73.2%) |
| Public Administration | 4 (9.5%) | 38 (90.5%) |
| Total | 1,672 (59.5%) | 1,138 (40.5%) |
Education in Tarrant
School Enrollment in Tarrant
The most common levels of schooling among the 1,102 students in Tarrant are middle school (354 | 32.1%), high school (244 | 22.1%), and college / undergraduate (235 | 21.3%).
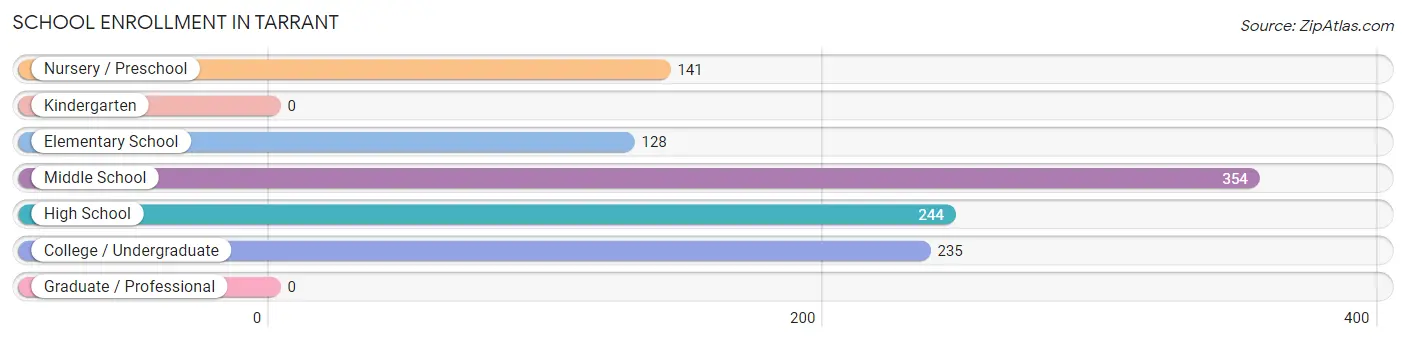
| School Level | # Students | % Students |
| Nursery / Preschool | 141 | 12.8% |
| Kindergarten | 0 | 0.0% |
| Elementary School | 128 | 11.6% |
| Middle School | 354 | 32.1% |
| High School | 244 | 22.1% |
| College / Undergraduate | 235 | 21.3% |
| Graduate / Professional | 0 | 0.0% |
| Total | 1,102 | 100.0% |
School Enrollment by Age by Funding Source in Tarrant
Out of a total of 1,102 students who are enrolled in schools in Tarrant, 161 (14.6%) attend a private institution, while the remaining 941 (85.4%) are enrolled in public schools. The age group of 3 to 4 year olds has the highest likelihood of being enrolled in private schools, with 67 (100.0% in the age bracket) enrolled. Conversely, the age group of 5 to 9 year old has the lowest likelihood of being enrolled in a private school, with 214 (100.0% in the age bracket) attending a public institution.
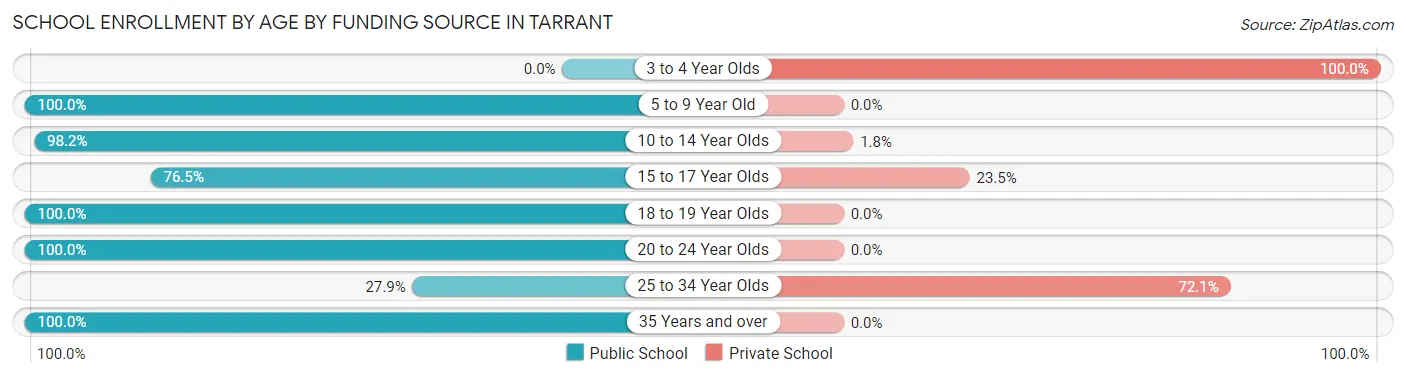
| Age Bracket | Public School | Private School |
| 3 to 4 Year Olds | 0 (0.0%) | 67 (100.0%) |
| 5 to 9 Year Old | 214 (100.0%) | 0 (0.0%) |
| 10 to 14 Year Olds | 387 (98.2%) | 7 (1.8%) |
| 15 to 17 Year Olds | 124 (76.5%) | 38 (23.5%) |
| 18 to 19 Year Olds | 55 (100.0%) | 0 (0.0%) |
| 20 to 24 Year Olds | 74 (100.0%) | 0 (0.0%) |
| 25 to 34 Year Olds | 19 (27.9%) | 49 (72.1%) |
| 35 Years and over | 68 (100.0%) | 0 (0.0%) |
| Total | 941 (85.4%) | 161 (14.6%) |
Educational Attainment by Field of Study in Tarrant
Business (133 | 39.5%), science & technology (61 | 18.1%), liberal arts & history (46 | 13.7%), education (39 | 11.6%), and computers & mathematics (33 | 9.8%) are the most common fields of study among 337 individuals in Tarrant who have obtained a bachelor's degree or higher.
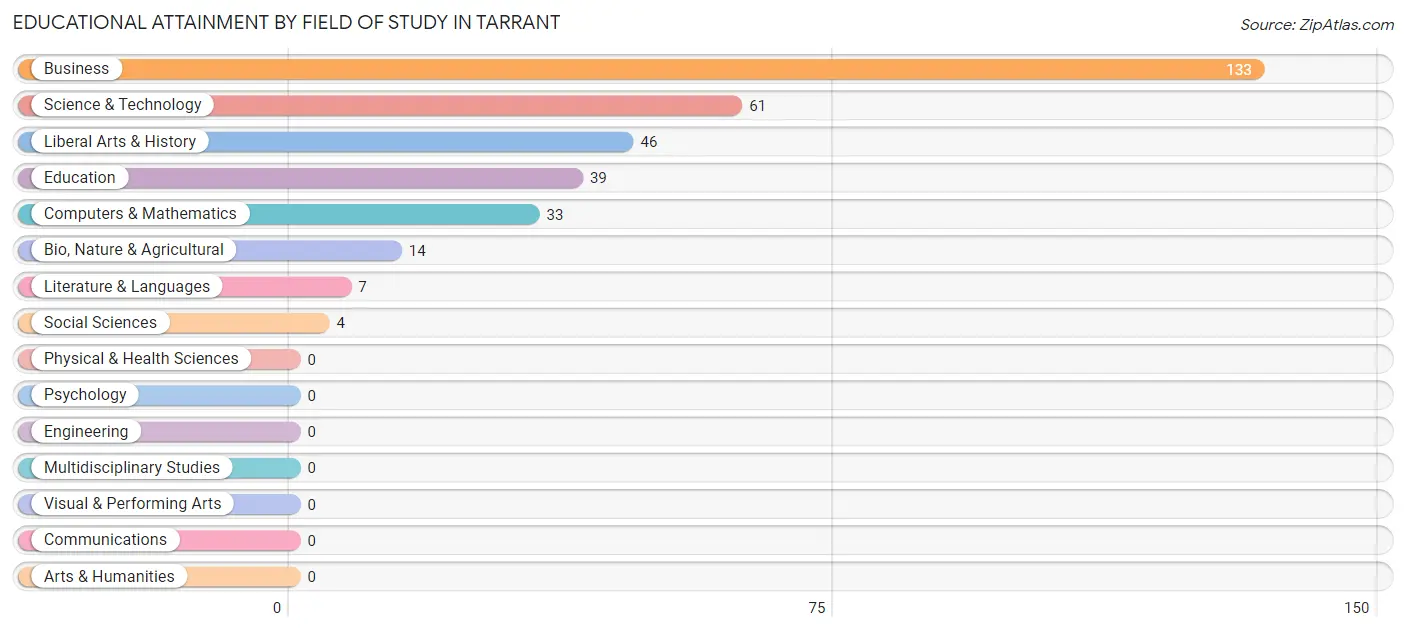
| Field of Study | # Graduates | % Graduates |
| Computers & Mathematics | 33 | 9.8% |
| Bio, Nature & Agricultural | 14 | 4.2% |
| Physical & Health Sciences | 0 | 0.0% |
| Psychology | 0 | 0.0% |
| Social Sciences | 4 | 1.2% |
| Engineering | 0 | 0.0% |
| Multidisciplinary Studies | 0 | 0.0% |
| Science & Technology | 61 | 18.1% |
| Business | 133 | 39.5% |
| Education | 39 | 11.6% |
| Literature & Languages | 7 | 2.1% |
| Liberal Arts & History | 46 | 13.7% |
| Visual & Performing Arts | 0 | 0.0% |
| Communications | 0 | 0.0% |
| Arts & Humanities | 0 | 0.0% |
| Total | 337 | 100.0% |
Transportation & Commute in Tarrant
Vehicle Availability by Sex in Tarrant
The most prevalent vehicle ownership categories in Tarrant are males with 2 vehicles (748, accounting for 44.7%) and females with 2 vehicles (369, making up 65.7%).
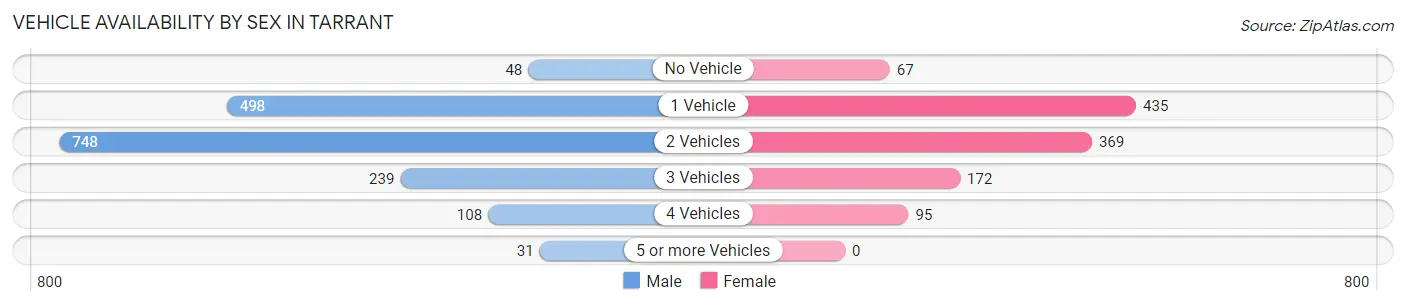
| Vehicles Available | Male | Female |
| No Vehicle | 48 (2.9%) | 67 (5.9%) |
| 1 Vehicle | 498 (29.8%) | 435 (38.2%) |
| 2 Vehicles | 748 (44.7%) | 369 (32.4%) |
| 3 Vehicles | 239 (14.3%) | 172 (15.1%) |
| 4 Vehicles | 108 (6.5%) | 95 (8.4%) |
| 5 or more Vehicles | 31 (1.8%) | 0 (0.0%) |
| Total | 1,672 (100.0%) | 1,138 (100.0%) |
Commute Time in Tarrant
The most frequently occuring commute durations in Tarrant are 30 to 34 minutes (635 commuters, 24.0%), 15 to 19 minutes (604 commuters, 22.8%), and 20 to 24 minutes (385 commuters, 14.5%).
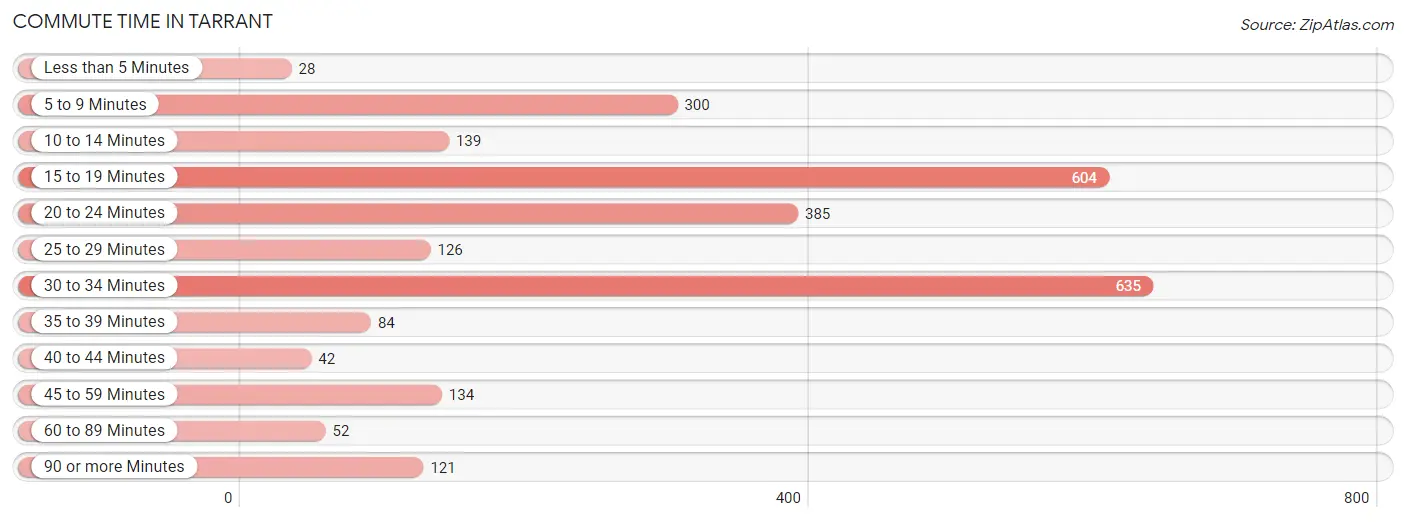
| Commute Time | # Commuters | % Commuters |
| Less than 5 Minutes | 28 | 1.1% |
| 5 to 9 Minutes | 300 | 11.3% |
| 10 to 14 Minutes | 139 | 5.2% |
| 15 to 19 Minutes | 604 | 22.8% |
| 20 to 24 Minutes | 385 | 14.5% |
| 25 to 29 Minutes | 126 | 4.8% |
| 30 to 34 Minutes | 635 | 24.0% |
| 35 to 39 Minutes | 84 | 3.2% |
| 40 to 44 Minutes | 42 | 1.6% |
| 45 to 59 Minutes | 134 | 5.1% |
| 60 to 89 Minutes | 52 | 2.0% |
| 90 or more Minutes | 121 | 4.6% |
Commute Time by Sex in Tarrant
The most common commute times in Tarrant are 30 to 34 minutes (392 commuters, 24.3%) for males and 15 to 19 minutes (321 commuters, 30.9%) for females.
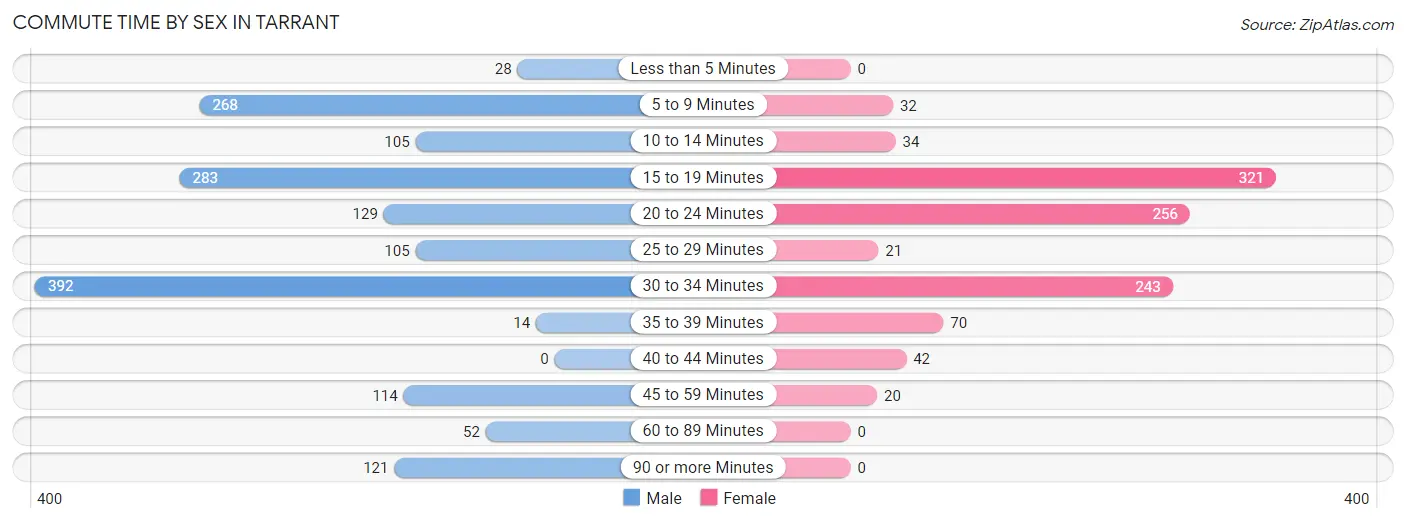
| Commute Time | Male | Female |
| Less than 5 Minutes | 28 (1.7%) | 0 (0.0%) |
| 5 to 9 Minutes | 268 (16.6%) | 32 (3.1%) |
| 10 to 14 Minutes | 105 (6.5%) | 34 (3.3%) |
| 15 to 19 Minutes | 283 (17.6%) | 321 (30.9%) |
| 20 to 24 Minutes | 129 (8.0%) | 256 (24.6%) |
| 25 to 29 Minutes | 105 (6.5%) | 21 (2.0%) |
| 30 to 34 Minutes | 392 (24.3%) | 243 (23.4%) |
| 35 to 39 Minutes | 14 (0.9%) | 70 (6.7%) |
| 40 to 44 Minutes | 0 (0.0%) | 42 (4.0%) |
| 45 to 59 Minutes | 114 (7.1%) | 20 (1.9%) |
| 60 to 89 Minutes | 52 (3.2%) | 0 (0.0%) |
| 90 or more Minutes | 121 (7.5%) | 0 (0.0%) |
Time of Departure to Work by Sex in Tarrant
The most frequent times of departure to work in Tarrant are 12:00 AM to 4:59 AM (322, 20.0%) for males and 7:00 AM to 7:29 AM (173, 16.7%) for females.
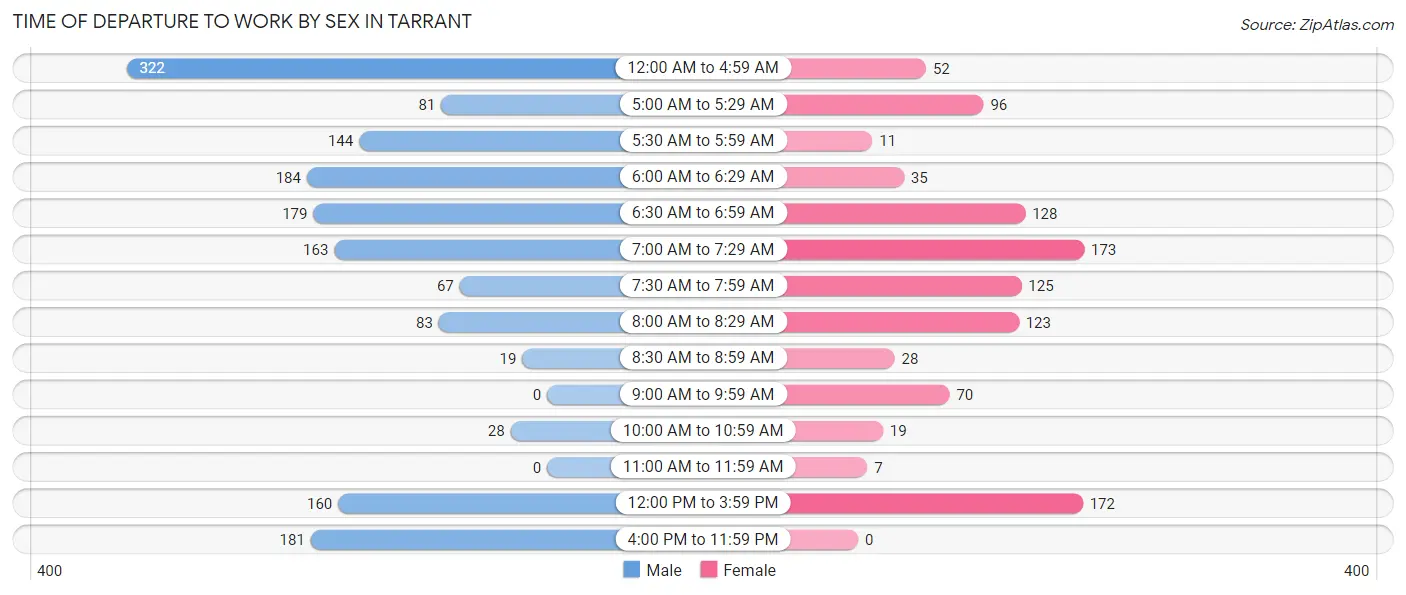
| Time of Departure | Male | Female |
| 12:00 AM to 4:59 AM | 322 (20.0%) | 52 (5.0%) |
| 5:00 AM to 5:29 AM | 81 (5.0%) | 96 (9.2%) |
| 5:30 AM to 5:59 AM | 144 (8.9%) | 11 (1.1%) |
| 6:00 AM to 6:29 AM | 184 (11.4%) | 35 (3.4%) |
| 6:30 AM to 6:59 AM | 179 (11.1%) | 128 (12.3%) |
| 7:00 AM to 7:29 AM | 163 (10.1%) | 173 (16.7%) |
| 7:30 AM to 7:59 AM | 67 (4.2%) | 125 (12.0%) |
| 8:00 AM to 8:29 AM | 83 (5.1%) | 123 (11.8%) |
| 8:30 AM to 8:59 AM | 19 (1.2%) | 28 (2.7%) |
| 9:00 AM to 9:59 AM | 0 (0.0%) | 70 (6.7%) |
| 10:00 AM to 10:59 AM | 28 (1.7%) | 19 (1.8%) |
| 11:00 AM to 11:59 AM | 0 (0.0%) | 7 (0.7%) |
| 12:00 PM to 3:59 PM | 160 (9.9%) | 172 (16.6%) |
| 4:00 PM to 11:59 PM | 181 (11.2%) | 0 (0.0%) |
| Total | 1,611 (100.0%) | 1,039 (100.0%) |
Housing Occupancy in Tarrant
Occupancy by Ownership in Tarrant
Of the total 2,678 dwellings in Tarrant, owner-occupied units account for 1,010 (37.7%), while renter-occupied units make up 1,668 (62.3%).
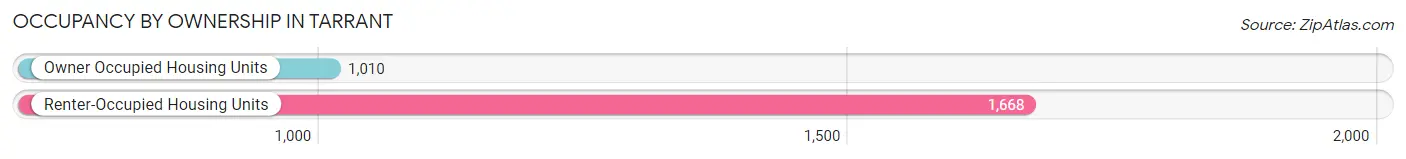
| Occupancy | # Housing Units | % Housing Units |
| Owner Occupied Housing Units | 1,010 | 37.7% |
| Renter-Occupied Housing Units | 1,668 | 62.3% |
| Total Occupied Housing Units | 2,678 | 100.0% |
Occupancy by Household Size in Tarrant
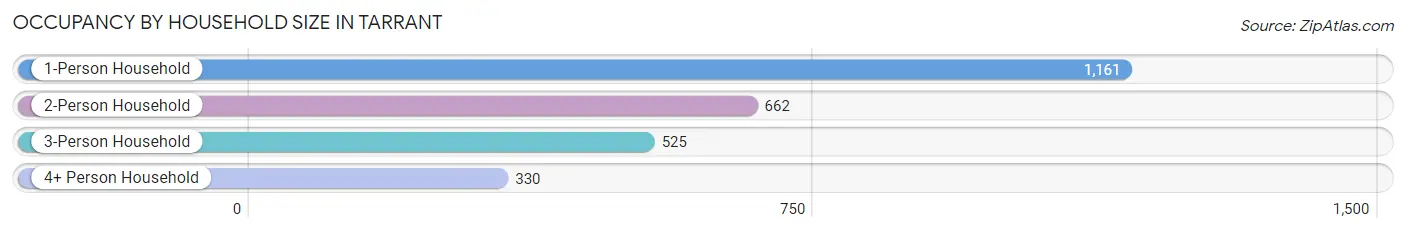
| Household Size | # Housing Units | % Housing Units |
| 1-Person Household | 1,161 | 43.3% |
| 2-Person Household | 662 | 24.7% |
| 3-Person Household | 525 | 19.6% |
| 4+ Person Household | 330 | 12.3% |
| Total Housing Units | 2,678 | 100.0% |
Occupancy by Ownership by Household Size in Tarrant
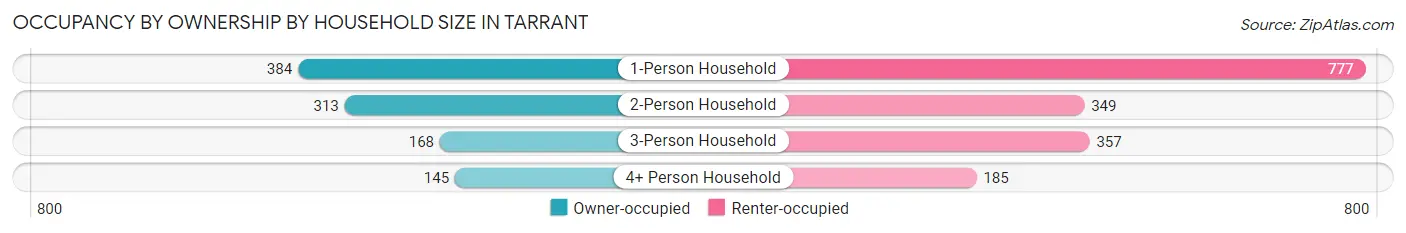
| Household Size | Owner-occupied | Renter-occupied |
| 1-Person Household | 384 (33.1%) | 777 (66.9%) |
| 2-Person Household | 313 (47.3%) | 349 (52.7%) |
| 3-Person Household | 168 (32.0%) | 357 (68.0%) |
| 4+ Person Household | 145 (43.9%) | 185 (56.1%) |
| Total Housing Units | 1,010 (37.7%) | 1,668 (62.3%) |
Occupancy by Educational Attainment in Tarrant
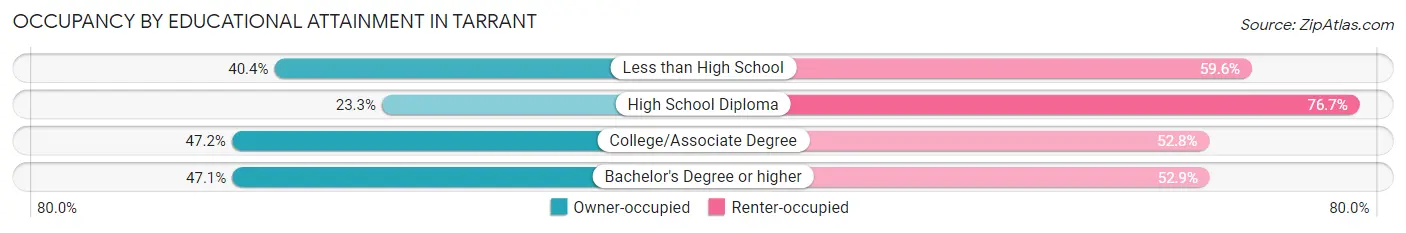
| Household Size | Owner-occupied | Renter-occupied |
| Less than High School | 181 (40.4%) | 267 (59.6%) |
| High School Diploma | 218 (23.3%) | 716 (76.7%) |
| College/Associate Degree | 506 (47.2%) | 567 (52.8%) |
| Bachelor's Degree or higher | 105 (47.1%) | 118 (52.9%) |
Occupancy by Age of Householder in Tarrant
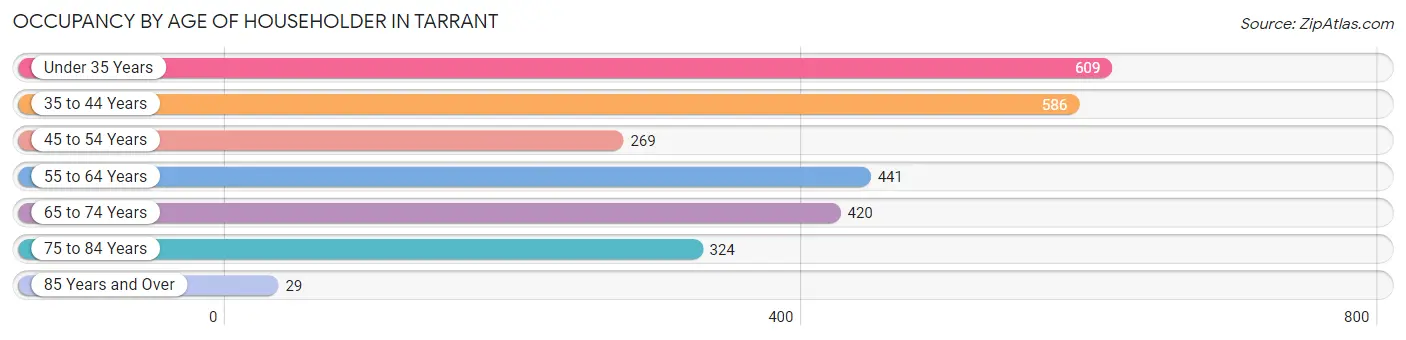
| Age Bracket | # Households | % Households |
| Under 35 Years | 609 | 22.7% |
| 35 to 44 Years | 586 | 21.9% |
| 45 to 54 Years | 269 | 10.0% |
| 55 to 64 Years | 441 | 16.5% |
| 65 to 74 Years | 420 | 15.7% |
| 75 to 84 Years | 324 | 12.1% |
| 85 Years and Over | 29 | 1.1% |
| Total | 2,678 | 100.0% |
Housing Finances in Tarrant
Median Income by Occupancy in Tarrant
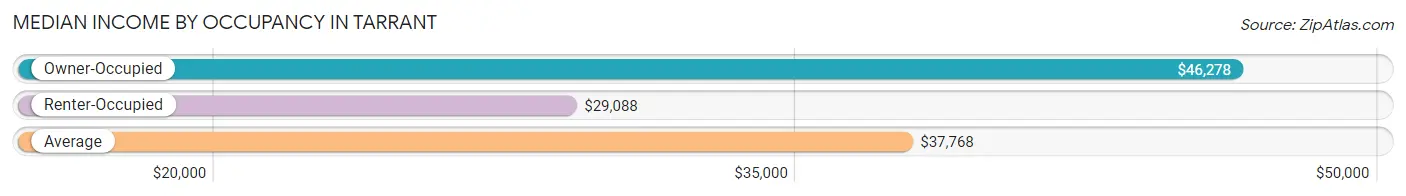
| Occupancy Type | # Households | Median Income |
| Owner-Occupied | 1,010 (37.7%) | $46,278 |
| Renter-Occupied | 1,668 (62.3%) | $29,088 |
| Average | 2,678 (100.0%) | $37,768 |
Occupancy by Householder Income Bracket in Tarrant
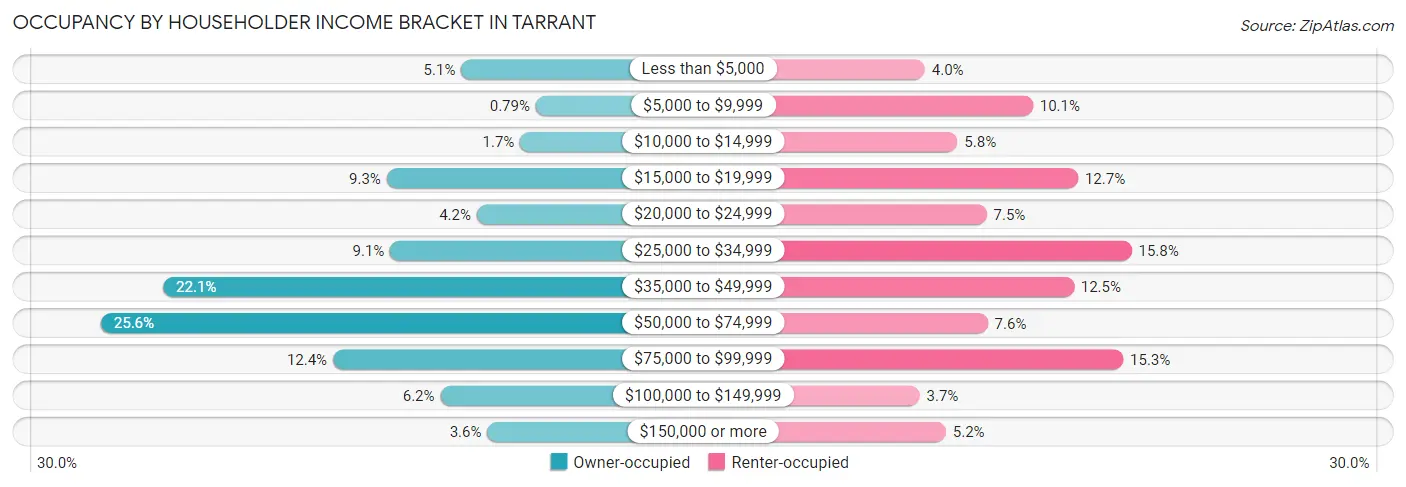
| Income Bracket | Owner-occupied | Renter-occupied |
| Less than $5,000 | 51 (5.1%) | 66 (4.0%) |
| $5,000 to $9,999 | 8 (0.8%) | 169 (10.1%) |
| $10,000 to $14,999 | 17 (1.7%) | 97 (5.8%) |
| $15,000 to $19,999 | 94 (9.3%) | 212 (12.7%) |
| $20,000 to $24,999 | 42 (4.2%) | 125 (7.5%) |
| $25,000 to $34,999 | 92 (9.1%) | 263 (15.8%) |
| $35,000 to $49,999 | 223 (22.1%) | 208 (12.5%) |
| $50,000 to $74,999 | 259 (25.6%) | 126 (7.5%) |
| $75,000 to $99,999 | 125 (12.4%) | 255 (15.3%) |
| $100,000 to $149,999 | 63 (6.2%) | 61 (3.7%) |
| $150,000 or more | 36 (3.6%) | 86 (5.2%) |
| Total | 1,010 (100.0%) | 1,668 (100.0%) |
Monthly Housing Cost Tiers in Tarrant
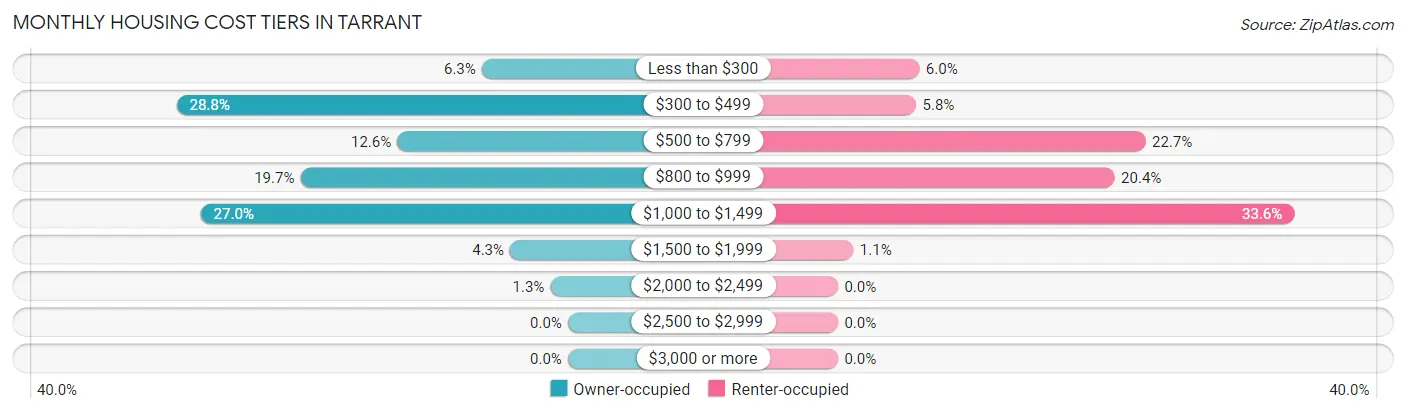
| Monthly Cost | Owner-occupied | Renter-occupied |
| Less than $300 | 64 (6.3%) | 100 (6.0%) |
| $300 to $499 | 291 (28.8%) | 96 (5.8%) |
| $500 to $799 | 127 (12.6%) | 378 (22.7%) |
| $800 to $999 | 199 (19.7%) | 340 (20.4%) |
| $1,000 to $1,499 | 273 (27.0%) | 561 (33.6%) |
| $1,500 to $1,999 | 43 (4.3%) | 19 (1.1%) |
| $2,000 to $2,499 | 13 (1.3%) | 0 (0.0%) |
| $2,500 to $2,999 | 0 (0.0%) | 0 (0.0%) |
| $3,000 or more | 0 (0.0%) | 0 (0.0%) |
| Total | 1,010 (100.0%) | 1,668 (100.0%) |
Physical Housing Characteristics in Tarrant
Housing Structures in Tarrant
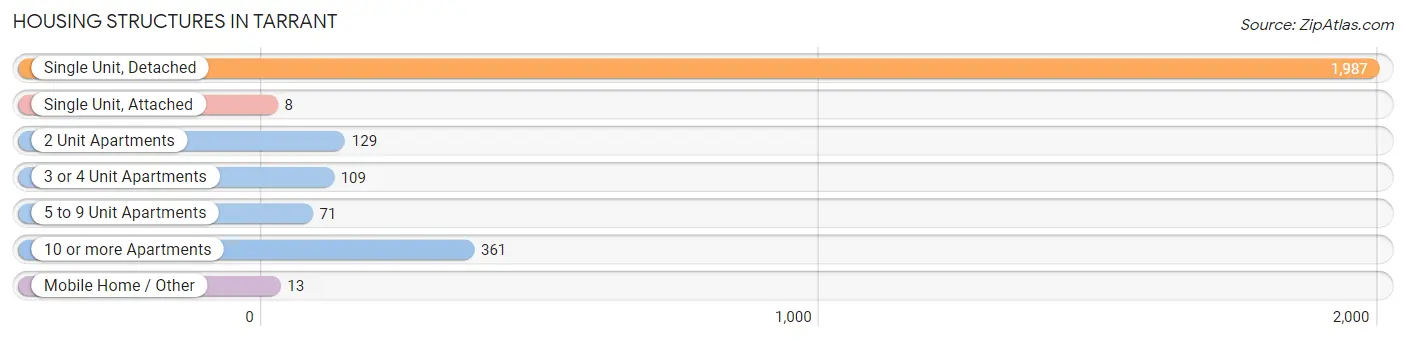
| Structure Type | # Housing Units | % Housing Units |
| Single Unit, Detached | 1,987 | 74.2% |
| Single Unit, Attached | 8 | 0.3% |
| 2 Unit Apartments | 129 | 4.8% |
| 3 or 4 Unit Apartments | 109 | 4.1% |
| 5 to 9 Unit Apartments | 71 | 2.6% |
| 10 or more Apartments | 361 | 13.5% |
| Mobile Home / Other | 13 | 0.5% |
| Total | 2,678 | 100.0% |
Housing Structures by Occupancy in Tarrant
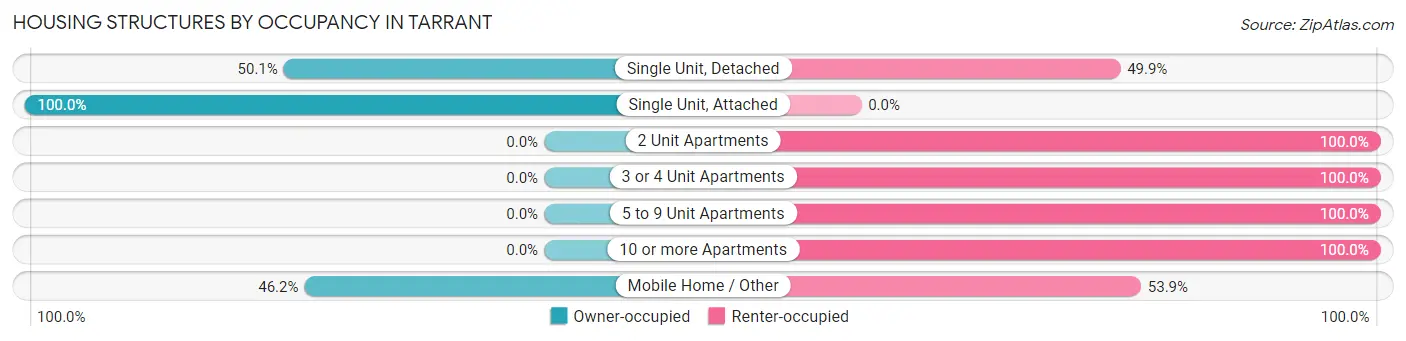
| Structure Type | Owner-occupied | Renter-occupied |
| Single Unit, Detached | 996 (50.1%) | 991 (49.9%) |
| Single Unit, Attached | 8 (100.0%) | 0 (0.0%) |
| 2 Unit Apartments | 0 (0.0%) | 129 (100.0%) |
| 3 or 4 Unit Apartments | 0 (0.0%) | 109 (100.0%) |
| 5 to 9 Unit Apartments | 0 (0.0%) | 71 (100.0%) |
| 10 or more Apartments | 0 (0.0%) | 361 (100.0%) |
| Mobile Home / Other | 6 (46.2%) | 7 (53.8%) |
| Total | 1,010 (37.7%) | 1,668 (62.3%) |
Housing Structures by Number of Rooms in Tarrant
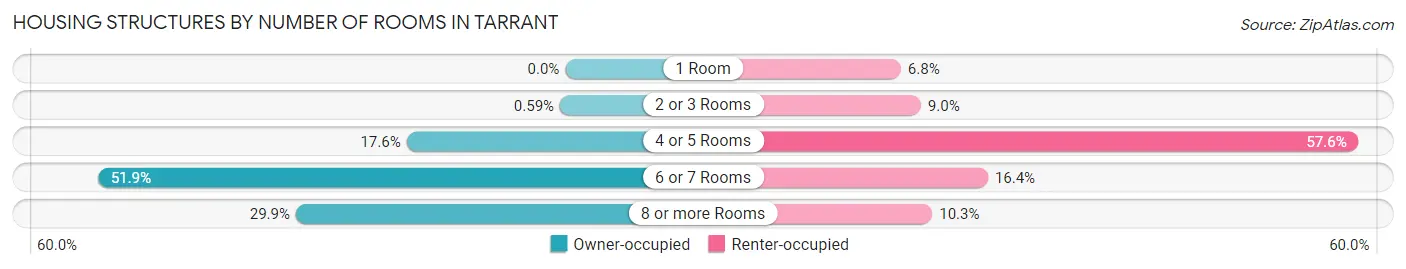
| Number of Rooms | Owner-occupied | Renter-occupied |
| 1 Room | 0 (0.0%) | 113 (6.8%) |
| 2 or 3 Rooms | 6 (0.6%) | 150 (9.0%) |
| 4 or 5 Rooms | 178 (17.6%) | 960 (57.6%) |
| 6 or 7 Rooms | 524 (51.9%) | 274 (16.4%) |
| 8 or more Rooms | 302 (29.9%) | 171 (10.2%) |
| Total | 1,010 (100.0%) | 1,668 (100.0%) |
Housing Structure by Heating Type in Tarrant
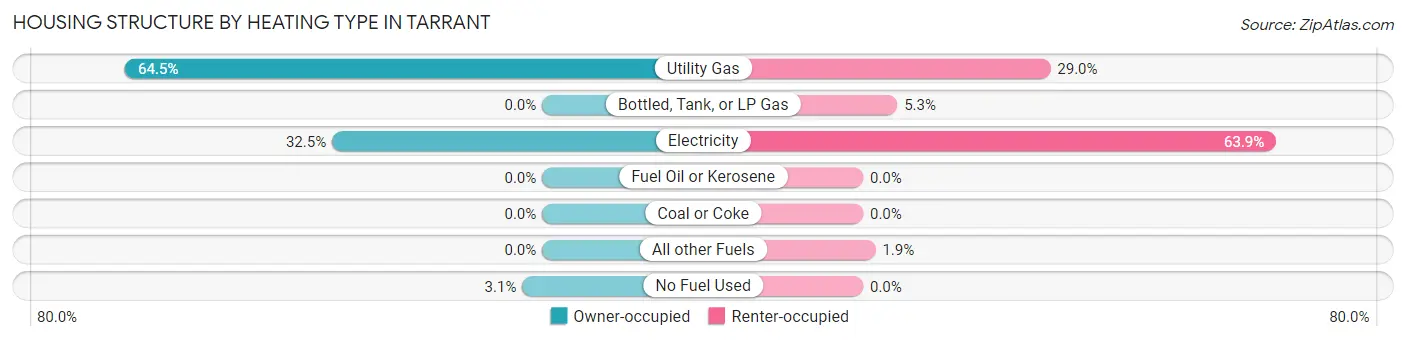
| Heating Type | Owner-occupied | Renter-occupied |
| Utility Gas | 651 (64.5%) | 483 (29.0%) |
| Bottled, Tank, or LP Gas | 0 (0.0%) | 88 (5.3%) |
| Electricity | 328 (32.5%) | 1,065 (63.8%) |
| Fuel Oil or Kerosene | 0 (0.0%) | 0 (0.0%) |
| Coal or Coke | 0 (0.0%) | 0 (0.0%) |
| All other Fuels | 0 (0.0%) | 32 (1.9%) |
| No Fuel Used | 31 (3.1%) | 0 (0.0%) |
| Total | 1,010 (100.0%) | 1,668 (100.0%) |
Household Vehicle Usage in Tarrant
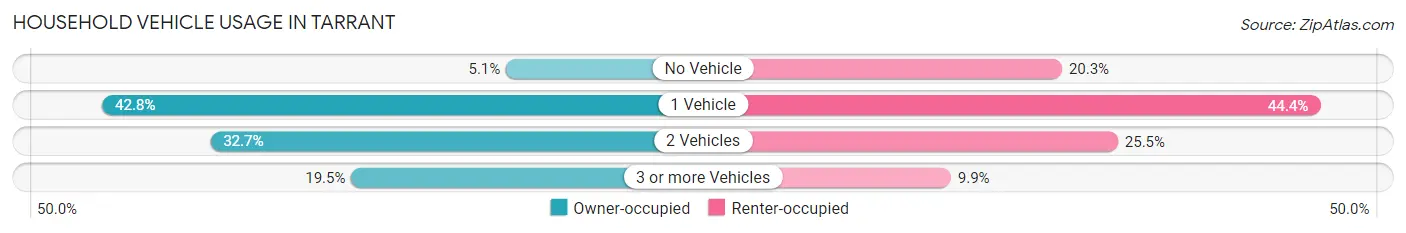
| Vehicles per Household | Owner-occupied | Renter-occupied |
| No Vehicle | 51 (5.1%) | 338 (20.3%) |
| 1 Vehicle | 432 (42.8%) | 740 (44.4%) |
| 2 Vehicles | 330 (32.7%) | 425 (25.5%) |
| 3 or more Vehicles | 197 (19.5%) | 165 (9.9%) |
| Total | 1,010 (100.0%) | 1,668 (100.0%) |
Real Estate & Mortgages in Tarrant
Real Estate and Mortgage Overview in Tarrant
| Characteristic | Without Mortgage | With Mortgage |
| Housing Units | 438 | 572 |
| Median Property Value | $103,400 | $99,200 |
| Median Household Income | $41,239 | $9 |
| Monthly Housing Costs | $379 | $0 |
| Real Estate Taxes | $635 | $24 |
Property Value by Mortgage Status in Tarrant
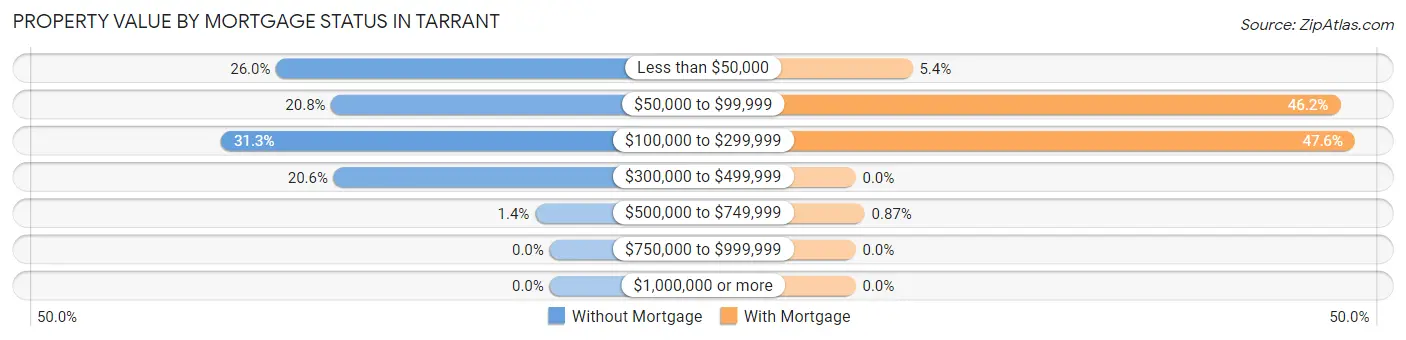
| Property Value | Without Mortgage | With Mortgage |
| Less than $50,000 | 114 (26.0%) | 31 (5.4%) |
| $50,000 to $99,999 | 91 (20.8%) | 264 (46.2%) |
| $100,000 to $299,999 | 137 (31.3%) | 272 (47.5%) |
| $300,000 to $499,999 | 90 (20.5%) | 0 (0.0%) |
| $500,000 to $749,999 | 6 (1.4%) | 5 (0.9%) |
| $750,000 to $999,999 | 0 (0.0%) | 0 (0.0%) |
| $1,000,000 or more | 0 (0.0%) | 0 (0.0%) |
| Total | 438 (100.0%) | 572 (100.0%) |
Household Income by Mortgage Status in Tarrant
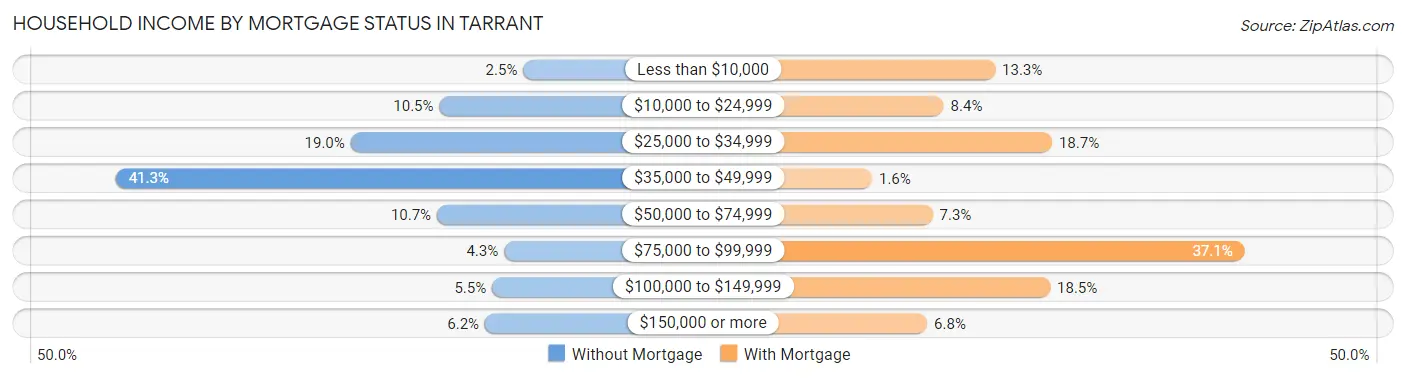
| Household Income | Without Mortgage | With Mortgage |
| Less than $10,000 | 11 (2.5%) | 76 (13.3%) |
| $10,000 to $24,999 | 46 (10.5%) | 48 (8.4%) |
| $25,000 to $34,999 | 83 (19.0%) | 107 (18.7%) |
| $35,000 to $49,999 | 181 (41.3%) | 9 (1.6%) |
| $50,000 to $74,999 | 47 (10.7%) | 42 (7.3%) |
| $75,000 to $99,999 | 19 (4.3%) | 212 (37.1%) |
| $100,000 to $149,999 | 24 (5.5%) | 106 (18.5%) |
| $150,000 or more | 27 (6.2%) | 39 (6.8%) |
| Total | 438 (100.0%) | 572 (100.0%) |
Property Value to Household Income Ratio in Tarrant
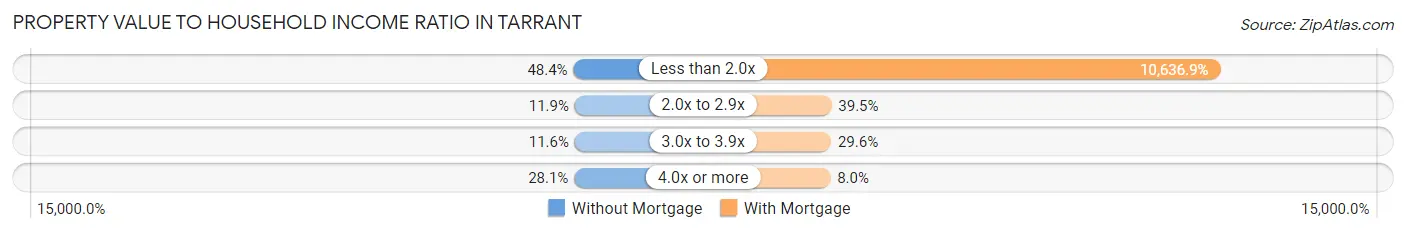
| Value-to-Income Ratio | Without Mortgage | With Mortgage |
| Less than 2.0x | 212 (48.4%) | 60,843 (10,636.9%) |
| 2.0x to 2.9x | 52 (11.9%) | 226 (39.5%) |
| 3.0x to 3.9x | 51 (11.6%) | 169 (29.5%) |
| 4.0x or more | 123 (28.1%) | 46 (8.0%) |
| Total | 438 (100.0%) | 572 (100.0%) |
Real Estate Taxes by Mortgage Status in Tarrant
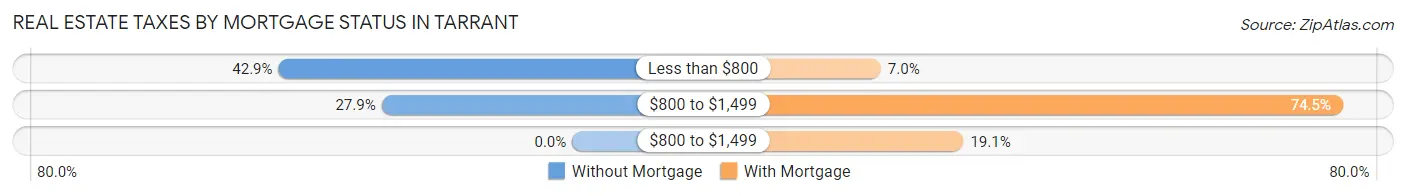
| Property Taxes | Without Mortgage | With Mortgage |
| Less than $800 | 188 (42.9%) | 40 (7.0%) |
| $800 to $1,499 | 122 (27.9%) | 426 (74.5%) |
| $800 to $1,499 | 0 (0.0%) | 109 (19.1%) |
| Total | 438 (100.0%) | 572 (100.0%) |
Health & Disability in Tarrant
Health Insurance Coverage by Age in Tarrant
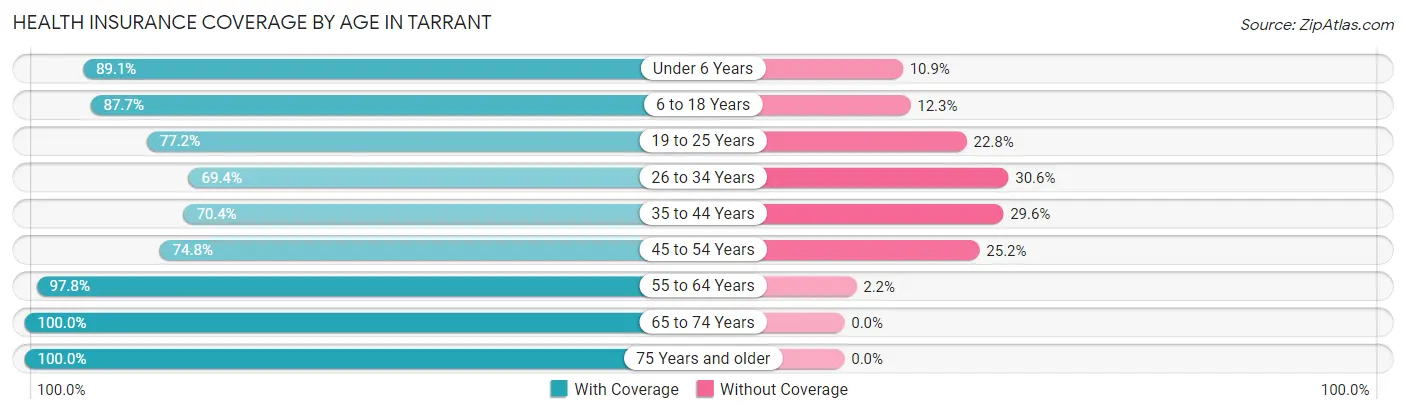
| Age Bracket | With Coverage | Without Coverage |
| Under 6 Years | 311 (89.1%) | 38 (10.9%) |
| 6 to 18 Years | 812 (87.7%) | 114 (12.3%) |
| 19 to 25 Years | 447 (77.2%) | 132 (22.8%) |
| 26 to 34 Years | 565 (69.4%) | 249 (30.6%) |
| 35 to 44 Years | 760 (70.4%) | 320 (29.6%) |
| 45 to 54 Years | 294 (74.8%) | 99 (25.2%) |
| 55 to 64 Years | 746 (97.8%) | 17 (2.2%) |
| 65 to 74 Years | 584 (100.0%) | 0 (0.0%) |
| 75 Years and older | 393 (100.0%) | 0 (0.0%) |
| Total | 4,912 (83.5%) | 969 (16.5%) |
Health Insurance Coverage by Citizenship Status in Tarrant
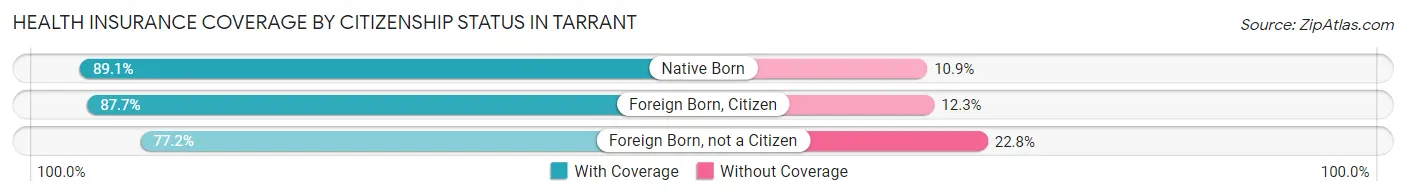
| Citizenship Status | With Coverage | Without Coverage |
| Native Born | 311 (89.1%) | 38 (10.9%) |
| Foreign Born, Citizen | 812 (87.7%) | 114 (12.3%) |
| Foreign Born, not a Citizen | 447 (77.2%) | 132 (22.8%) |
Health Insurance Coverage by Household Income in Tarrant
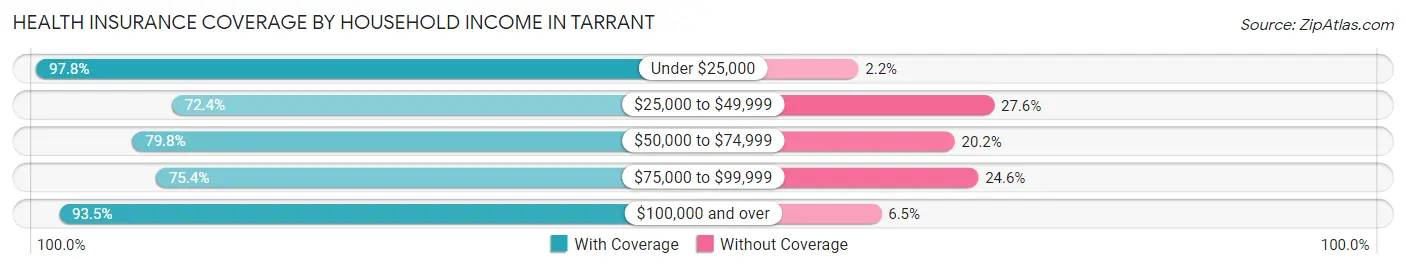
| Household Income | With Coverage | Without Coverage |
| Under $25,000 | 1,452 (97.8%) | 32 (2.2%) |
| $25,000 to $49,999 | 1,152 (72.4%) | 439 (27.6%) |
| $50,000 to $74,999 | 739 (79.8%) | 187 (20.2%) |
| $75,000 to $99,999 | 787 (75.4%) | 257 (24.6%) |
| $100,000 and over | 782 (93.5%) | 54 (6.5%) |
Public vs Private Health Insurance Coverage by Age in Tarrant
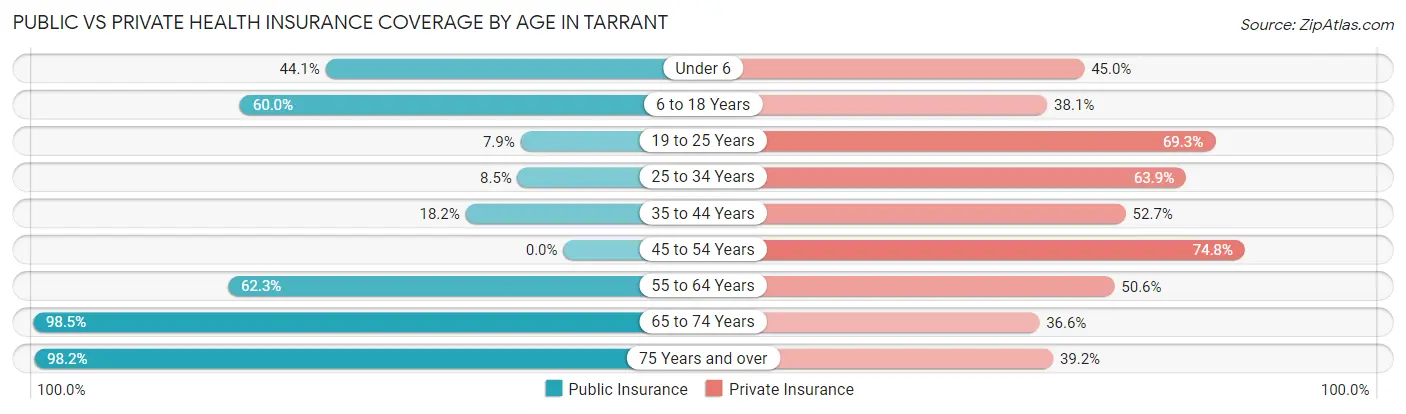
| Age Bracket | Public Insurance | Private Insurance |
| Under 6 | 154 (44.1%) | 157 (45.0%) |
| 6 to 18 Years | 556 (60.0%) | 353 (38.1%) |
| 19 to 25 Years | 46 (7.9%) | 401 (69.3%) |
| 25 to 34 Years | 69 (8.5%) | 520 (63.9%) |
| 35 to 44 Years | 196 (18.1%) | 569 (52.7%) |
| 45 to 54 Years | 0 (0.0%) | 294 (74.8%) |
| 55 to 64 Years | 475 (62.3%) | 386 (50.6%) |
| 65 to 74 Years | 575 (98.5%) | 214 (36.6%) |
| 75 Years and over | 386 (98.2%) | 154 (39.2%) |
| Total | 2,457 (41.8%) | 3,048 (51.8%) |
Disability Status by Sex by Age in Tarrant
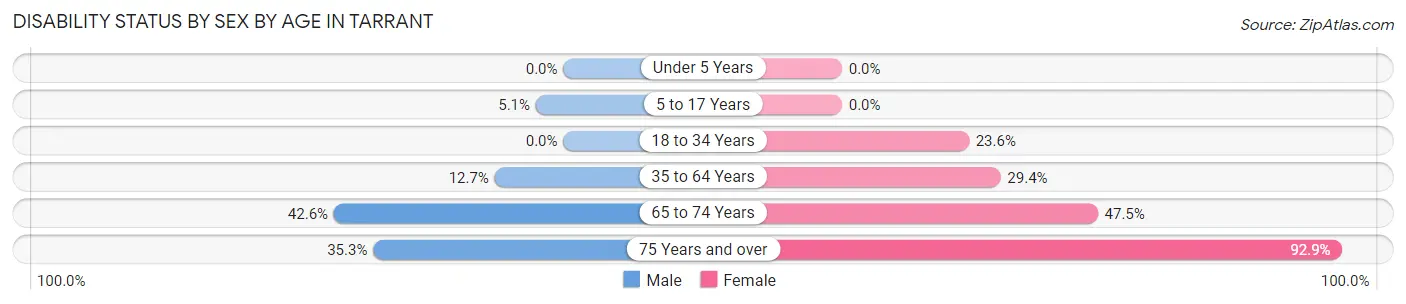
| Age Bracket | Male | Female |
| Under 5 Years | 0 (0.0%) | 0 (0.0%) |
| 5 to 17 Years | 23 (5.1%) | 0 (0.0%) |
| 18 to 34 Years | 0 (0.0%) | 143 (23.6%) |
| 35 to 64 Years | 142 (12.7%) | 330 (29.4%) |
| 65 to 74 Years | 46 (42.6%) | 226 (47.5%) |
| 75 Years and over | 24 (35.3%) | 302 (92.9%) |
Disability Class by Sex by Age in Tarrant
Disability Class: Hearing Difficulty
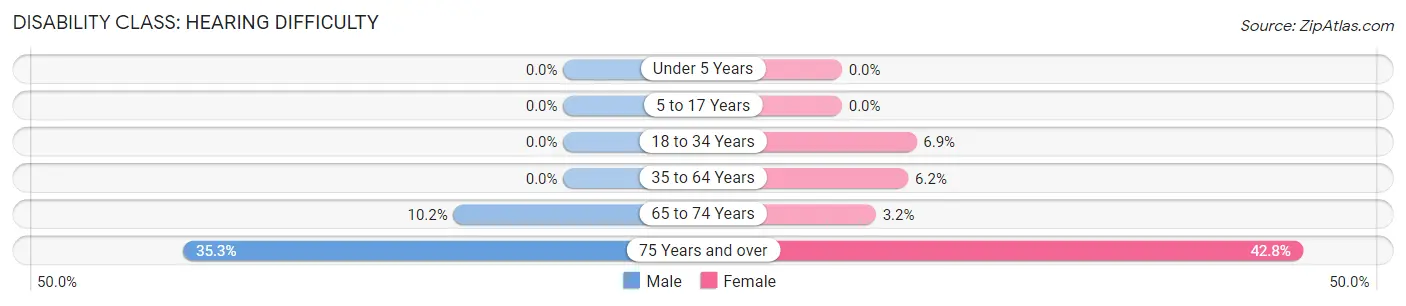
| Age Bracket | Male | Female |
| Under 5 Years | 0 (0.0%) | 0 (0.0%) |
| 5 to 17 Years | 0 (0.0%) | 0 (0.0%) |
| 18 to 34 Years | 0 (0.0%) | 42 (6.9%) |
| 35 to 64 Years | 0 (0.0%) | 69 (6.2%) |
| 65 to 74 Years | 11 (10.2%) | 15 (3.2%) |
| 75 Years and over | 24 (35.3%) | 139 (42.8%) |
Disability Class: Vision Difficulty
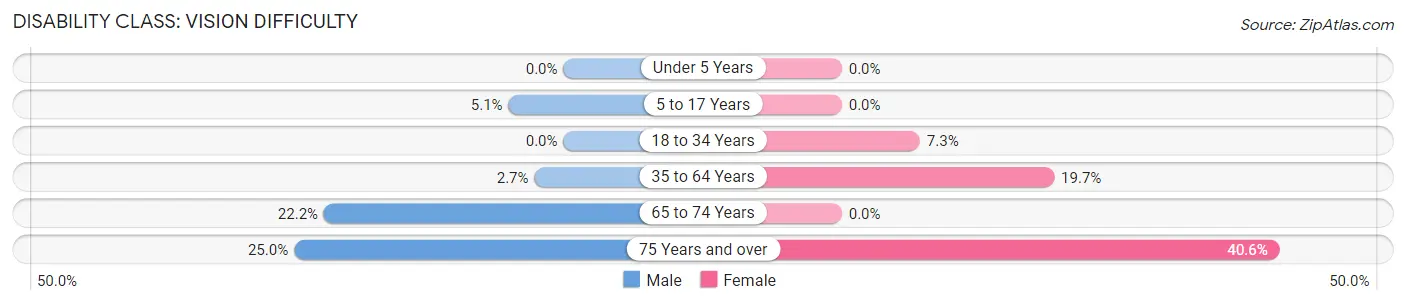
| Age Bracket | Male | Female |
| Under 5 Years | 0 (0.0%) | 0 (0.0%) |
| 5 to 17 Years | 23 (5.1%) | 0 (0.0%) |
| 18 to 34 Years | 0 (0.0%) | 44 (7.2%) |
| 35 to 64 Years | 30 (2.7%) | 221 (19.7%) |
| 65 to 74 Years | 24 (22.2%) | 0 (0.0%) |
| 75 Years and over | 17 (25.0%) | 132 (40.6%) |
Disability Class: Cognitive Difficulty
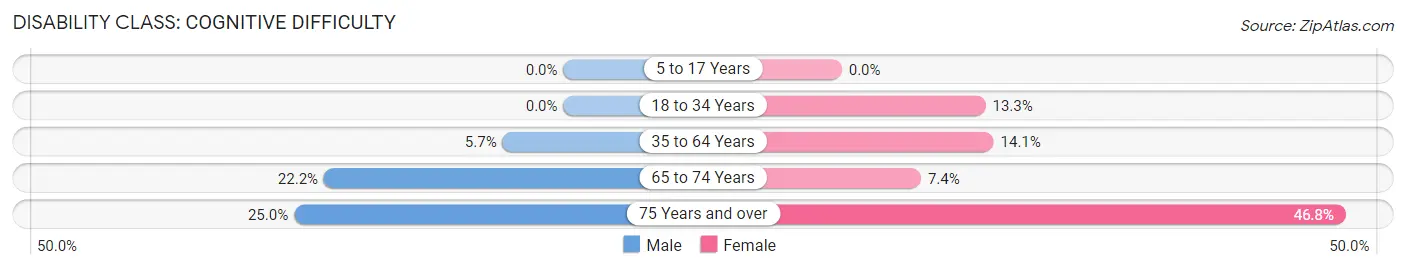
| Age Bracket | Male | Female |
| 5 to 17 Years | 0 (0.0%) | 0 (0.0%) |
| 18 to 34 Years | 0 (0.0%) | 81 (13.3%) |
| 35 to 64 Years | 63 (5.7%) | 158 (14.1%) |
| 65 to 74 Years | 24 (22.2%) | 35 (7.3%) |
| 75 Years and over | 17 (25.0%) | 152 (46.8%) |
Disability Class: Ambulatory Difficulty
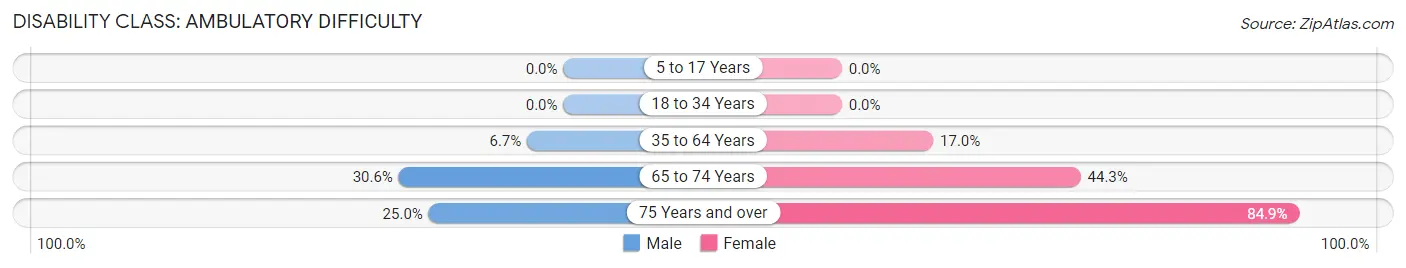
| Age Bracket | Male | Female |
| 5 to 17 Years | 0 (0.0%) | 0 (0.0%) |
| 18 to 34 Years | 0 (0.0%) | 0 (0.0%) |
| 35 to 64 Years | 75 (6.7%) | 190 (17.0%) |
| 65 to 74 Years | 33 (30.6%) | 211 (44.3%) |
| 75 Years and over | 17 (25.0%) | 276 (84.9%) |
Disability Class: Self-Care Difficulty
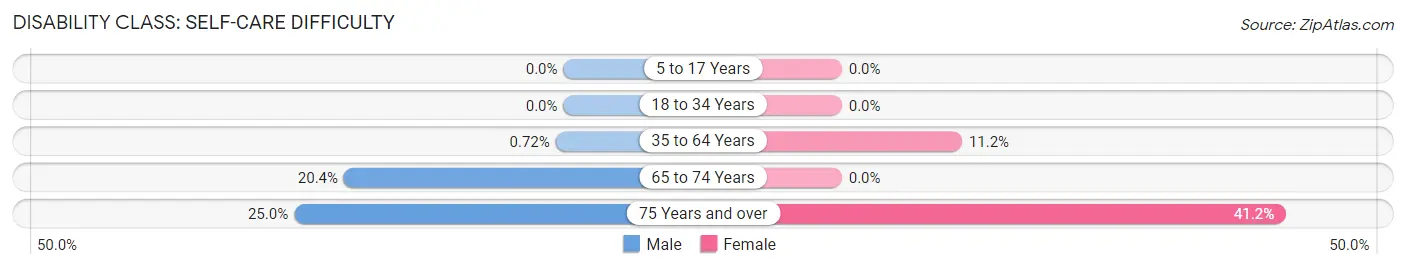
| Age Bracket | Male | Female |
| 5 to 17 Years | 0 (0.0%) | 0 (0.0%) |
| 18 to 34 Years | 0 (0.0%) | 0 (0.0%) |
| 35 to 64 Years | 8 (0.7%) | 125 (11.2%) |
| 65 to 74 Years | 22 (20.4%) | 0 (0.0%) |
| 75 Years and over | 17 (25.0%) | 134 (41.2%) |
Technology Access in Tarrant
Computing Device Access in Tarrant
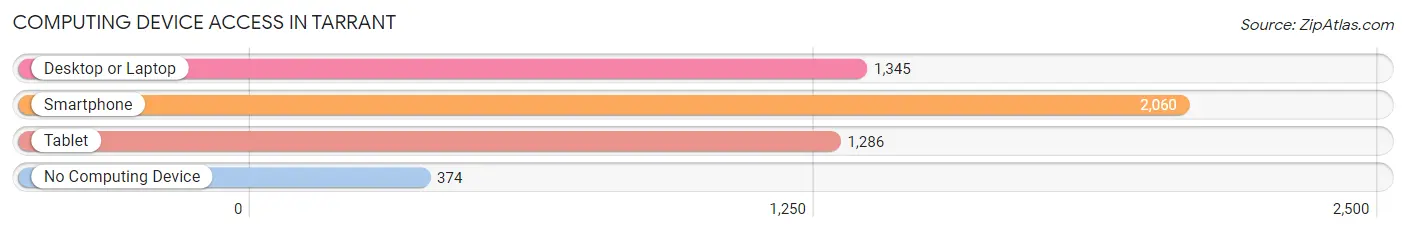
| Device Type | # Households | % Households |
| Desktop or Laptop | 1,345 | 50.2% |
| Smartphone | 2,060 | 76.9% |
| Tablet | 1,286 | 48.0% |
| No Computing Device | 374 | 14.0% |
| Total | 2,678 | 100.0% |
Internet Access in Tarrant
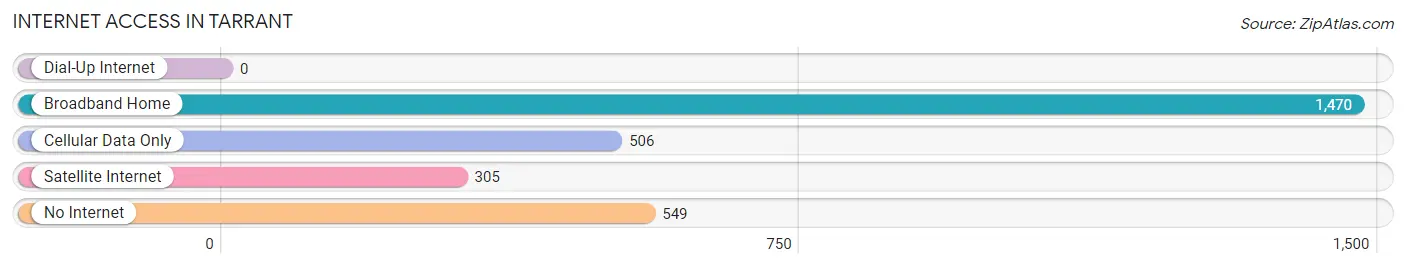
| Internet Type | # Households | % Households |
| Dial-Up Internet | 0 | 0.0% |
| Broadband Home | 1,470 | 54.9% |
| Cellular Data Only | 506 | 18.9% |
| Satellite Internet | 305 | 11.4% |
| No Internet | 549 | 20.5% |
| Total | 2,678 | 100.0% |
Tarrant Summary
Tarrant, Alabama is a small city located in Jefferson County, Alabama. It is part of the Birmingham-Hoover Metropolitan Statistical Area. The city has a population of approximately 8,000 people and is located just north of Birmingham.
History
Tarrant was founded in 1887 by the Tarrant family, who were originally from Georgia. The family purchased land in the area and began to develop it into a small town. The town was named after the family and was incorporated in 1901.
The city grew slowly over the years, but it was not until the 1950s that it began to experience significant growth. This was due to the expansion of the nearby Birmingham-Hoover Metropolitan Statistical Area. The city was also home to a number of manufacturing plants, which provided jobs for many of the residents.
Geography
Tarrant is located in Jefferson County, Alabama. It is situated just north of Birmingham and is bordered by the cities of Fultondale, Gardendale, and Birmingham. The city covers an area of approximately 4.5 square miles and has an elevation of 645 feet.
The city is located in the foothills of the Appalachian Mountains and is part of the Appalachian Plateau. The city is located in a humid subtropical climate zone and experiences hot, humid summers and mild winters.
Economy
Tarrant’s economy is largely based on manufacturing and retail. The city is home to a number of manufacturing plants, including a steel mill, a paper mill, and a plastics plant. These plants provide jobs for many of the city’s residents.
The city is also home to a number of retail stores, including a Walmart Supercenter, a Target, and a number of smaller stores. The city also has a number of restaurants and bars.
Demographics
As of the 2010 census, Tarrant had a population of 8,000 people. The racial makeup of the city was 79.3% White, 16.2% African American, 0.3% Native American, 0.7% Asian, 0.1% Pacific Islander, and 3.4% from other races. Hispanic or Latino of any race were 2.2% of the population.
The median income for a household in the city was $35,000 and the median income for a family was $41,000. The per capita income for the city was $17,000. About 17.3% of families and 20.2% of the population were below the poverty line, including 28.3% of those under age 18 and 11.2% of those age 65 or over.
Tarrant is a small city with a rich history and a diverse population. The city has a strong manufacturing base and a number of retail stores. The city also has a number of restaurants and bars. The city is a great place to live and work and offers a variety of opportunities for its residents.
Common Questions
What is Per Capita Income in Tarrant?
Per Capita income in Tarrant is $22,706.
What is the Median Family Income in Tarrant?
Median Family Income in Tarrant is $55,476.
What is the Median Household income in Tarrant?
Median Household Income in Tarrant is $37,768.
What is Income or Wage Gap in Tarrant?
Income or Wage Gap in Tarrant is 11.9%.
Women in Tarrant earn 88.1 cents for every dollar earned by a man.
What is Inequality or Gini Index in Tarrant?
Inequality or Gini Index in Tarrant is 0.45.
What is the Total Population of Tarrant?
Total Population of Tarrant is 6,077.
What is the Total Male Population of Tarrant?
Total Male Population of Tarrant is 2,955.
What is the Total Female Population of Tarrant?
Total Female Population of Tarrant is 3,122.
What is the Ratio of Males per 100 Females in Tarrant?
There are 94.65 Males per 100 Females in Tarrant.
What is the Ratio of Females per 100 Males in Tarrant?
There are 105.65 Females per 100 Males in Tarrant.
What is the Median Population Age in Tarrant?
Median Population Age in Tarrant is 38.8 Years.
What is the Average Family Size in Tarrant
Average Family Size in Tarrant is 3.0 People.
What is the Average Household Size in Tarrant
Average Household Size in Tarrant is 2.2 People.
How Large is the Labor Force in Tarrant?
There are 3,005 People in the Labor Forcein in Tarrant.
What is the Percentage of People in the Labor Force in Tarrant?
59.1% of People are in the Labor Force in Tarrant.
What is the Unemployment Rate in Tarrant?
Unemployment Rate in Tarrant is 6.5%.