Sylvan Springs, AL Map & Demographics
Sylvan Springs Map
Sylvan Springs Overview
$30,292
PER CAPITA INCOME
$85,714
AVG FAMILY INCOME
$73,482
AVG HOUSEHOLD INCOME
41.6%
WAGE / INCOME GAP [ % ]
58.4¢/ $1
WAGE / INCOME GAP [ $ ]
0.34
INEQUALITY / GINI INDEX
1,521
TOTAL POPULATION
837
MALE POPULATION
684
FEMALE POPULATION
122.37
MALES / 100 FEMALES
81.72
FEMALES / 100 MALES
40.7
MEDIAN AGE
3.1
AVG FAMILY SIZE
2.8
AVG HOUSEHOLD SIZE
633
LABOR FORCE [ PEOPLE ]
51.6%
PERCENT IN LABOR FORCE
8.2%
UNEMPLOYMENT RATE
Sylvan Springs Area Codes
Income in Sylvan Springs
Income Overview in Sylvan Springs
Per Capita Income in Sylvan Springs is $30,292, while median incomes of families and households are $85,714 and $73,482 respectively.
| Characteristic | Number | Measure |
| Per Capita Income | 1,521 | $30,292 |
| Median Family Income | 442 | $85,714 |
| Mean Family Income | 442 | $90,778 |
| Median Household Income | 551 | $73,482 |
| Mean Household Income | 551 | $82,628 |
| Income Deficit | 442 | $0 |
| Wage / Income Gap (%) | 1,521 | 41.56% |
| Wage / Income Gap ($) | 1,521 | 58.44¢ per $1 |
| Gini / Inequality Index | 1,521 | 0.34 |
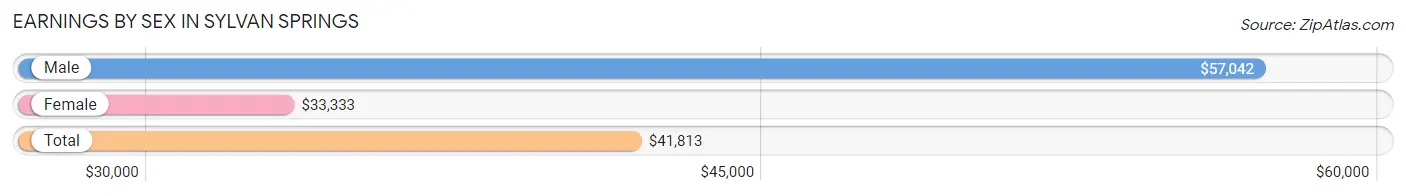
Earnings by Sex in Sylvan Springs
Average Earnings in Sylvan Springs are $41,813, $57,042 for men and $33,333 for women, a difference of 41.6%.
| Sex | Number | Average Earnings |
| Male | 369 (58.3%) | $57,042 |
| Female | 264 (41.7%) | $33,333 |
| Total | 633 (100.0%) | $41,813 |
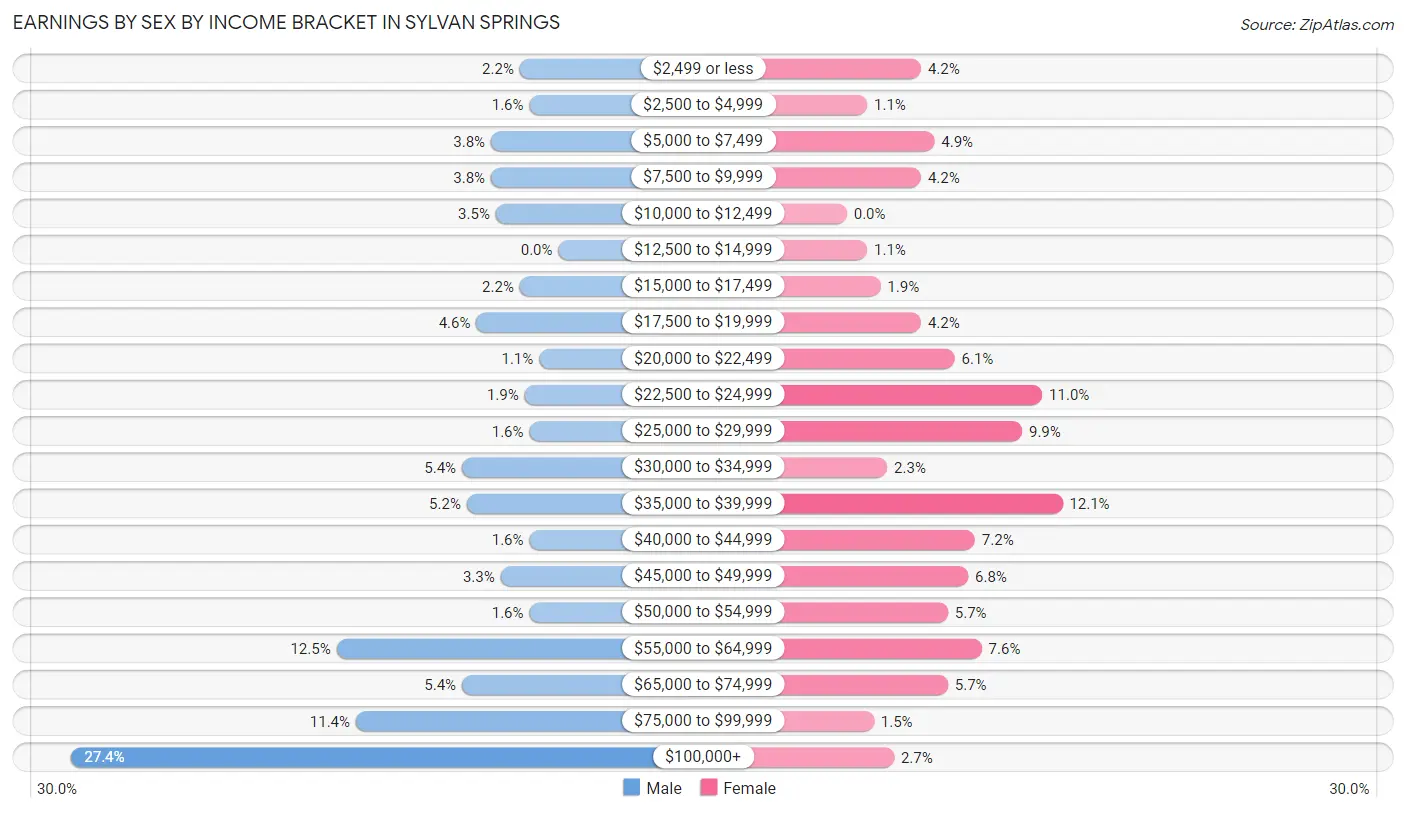
Earnings by Sex by Income Bracket in Sylvan Springs
The most common earnings brackets in Sylvan Springs are $100,000+ for men (101 | 27.4%) and $35,000 to $39,999 for women (32 | 12.1%).
| Income | Male | Female |
| $2,499 or less | 8 (2.2%) | 11 (4.2%) |
| $2,500 to $4,999 | 6 (1.6%) | 3 (1.1%) |
| $5,000 to $7,499 | 14 (3.8%) | 13 (4.9%) |
| $7,500 to $9,999 | 14 (3.8%) | 11 (4.2%) |
| $10,000 to $12,499 | 13 (3.5%) | 0 (0.0%) |
| $12,500 to $14,999 | 0 (0.0%) | 3 (1.1%) |
| $15,000 to $17,499 | 8 (2.2%) | 5 (1.9%) |
| $17,500 to $19,999 | 17 (4.6%) | 11 (4.2%) |
| $20,000 to $22,499 | 4 (1.1%) | 16 (6.1%) |
| $22,500 to $24,999 | 7 (1.9%) | 29 (11.0%) |
| $25,000 to $29,999 | 6 (1.6%) | 26 (9.9%) |
| $30,000 to $34,999 | 20 (5.4%) | 6 (2.3%) |
| $35,000 to $39,999 | 19 (5.1%) | 32 (12.1%) |
| $40,000 to $44,999 | 6 (1.6%) | 19 (7.2%) |
| $45,000 to $49,999 | 12 (3.3%) | 18 (6.8%) |
| $50,000 to $54,999 | 6 (1.6%) | 15 (5.7%) |
| $55,000 to $64,999 | 46 (12.5%) | 20 (7.6%) |
| $65,000 to $74,999 | 20 (5.4%) | 15 (5.7%) |
| $75,000 to $99,999 | 42 (11.4%) | 4 (1.5%) |
| $100,000+ | 101 (27.4%) | 7 (2.6%) |
| Total | 369 (100.0%) | 264 (100.0%) |
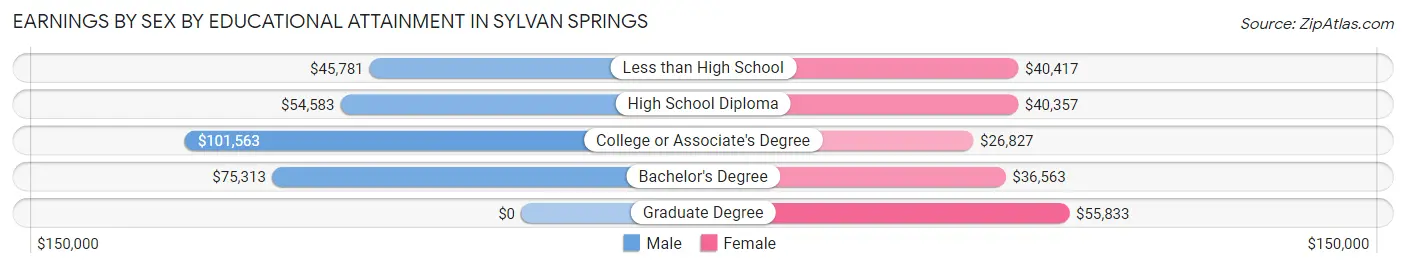
Earnings by Sex by Educational Attainment in Sylvan Springs
Average earnings in Sylvan Springs are $65,156 for men and $38,571 for women, a difference of 40.8%. Men with an educational attainment of college or associate's degree enjoy the highest average annual earnings of $101,563, while those with less than high school education earn the least with $45,781. Women with an educational attainment of graduate degree earn the most with the average annual earnings of $55,833, while those with college or associate's degree education have the smallest earnings of $26,827.
| Educational Attainment | Male Income | Female Income |
| Less than High School | $45,781 | $40,417 |
| High School Diploma | $54,583 | $40,357 |
| College or Associate's Degree | $101,563 | $26,827 |
| Bachelor's Degree | $75,313 | $36,563 |
| Graduate Degree | - | - |
| Total | $65,156 | $38,571 |
Family Income in Sylvan Springs
Family Income Brackets in Sylvan Springs
According to the Sylvan Springs family income data, there are 126 families falling into the $100,000 to $149,999 income range, which is the most common income bracket and makes up 28.5% of all families.
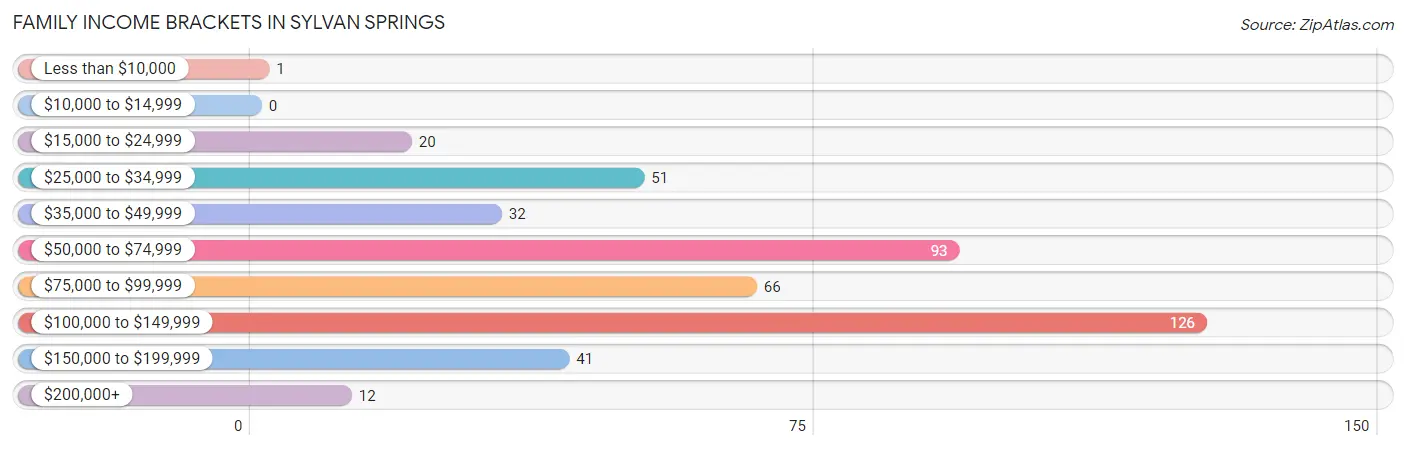
| Income Bracket | # Families | % Families |
| Less than $10,000 | 1 | 0.2% |
| $10,000 to $14,999 | 0 | 0.0% |
| $15,000 to $24,999 | 20 | 4.5% |
| $25,000 to $34,999 | 51 | 11.5% |
| $35,000 to $49,999 | 32 | 7.2% |
| $50,000 to $74,999 | 93 | 21.0% |
| $75,000 to $99,999 | 66 | 14.9% |
| $100,000 to $149,999 | 126 | 28.5% |
| $150,000 to $199,999 | 41 | 9.3% |
| $200,000+ | 12 | 2.7% |
Family Income by Famaliy Size in Sylvan Springs
5-person families (29 | 6.6%) account for the highest median family income in Sylvan Springs with $126,161 per family, while 2-person families (256 | 57.9%) have the highest median income of $40,000 per family member.
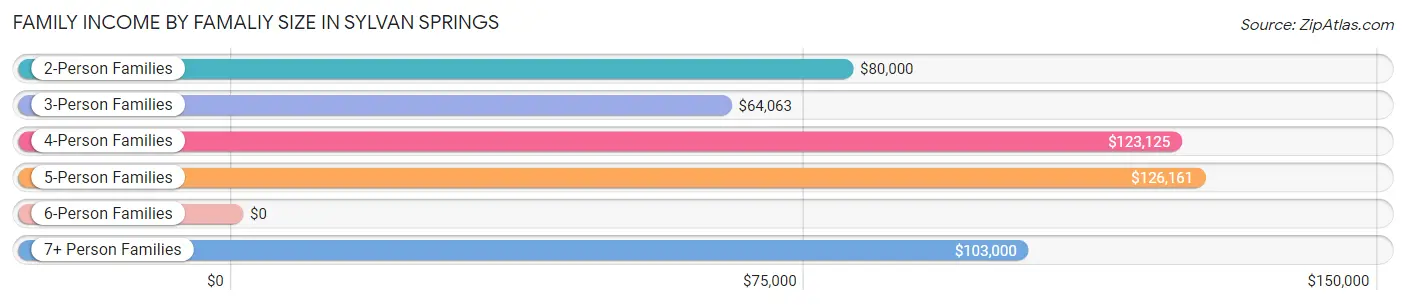
| Income Bracket | # Families | Median Income |
| 2-Person Families | 256 (57.9%) | $80,000 |
| 3-Person Families | 81 (18.3%) | $64,063 |
| 4-Person Families | 49 (11.1%) | $123,125 |
| 5-Person Families | 29 (6.6%) | $126,161 |
| 6-Person Families | 3 (0.7%) | $0 |
| 7+ Person Families | 24 (5.4%) | $103,000 |
| Total | 442 (100.0%) | $85,714 |
Family Income by Number of Earners in Sylvan Springs
The median family income in Sylvan Springs is $85,714, with families comprising 3+ earners (40) having the highest median family income of $133,750, while families with no earners (119) have the lowest median family income of $33,295, accounting for 9.0% and 26.9% of families, respectively.
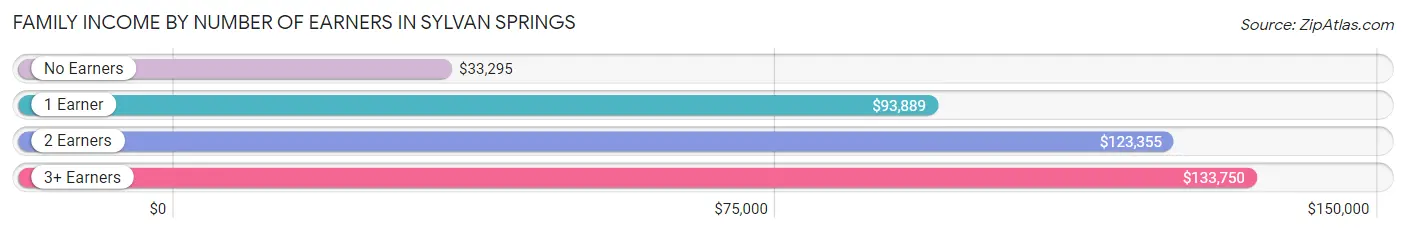
| Number of Earners | # Families | Median Income |
| No Earners | 119 (26.9%) | $33,295 |
| 1 Earner | 150 (33.9%) | $93,889 |
| 2 Earners | 133 (30.1%) | $123,355 |
| 3+ Earners | 40 (9.0%) | $133,750 |
| Total | 442 (100.0%) | $85,714 |
Household Income in Sylvan Springs
Household Income Brackets in Sylvan Springs
With 132 households falling in the category, the $100,000 to $149,999 income range is the most frequent in Sylvan Springs, accounting for 24.0% of all households. In contrast, only 3 households (0.5%) fall into the $10,000 to $14,999 income bracket, making it the least populous group.
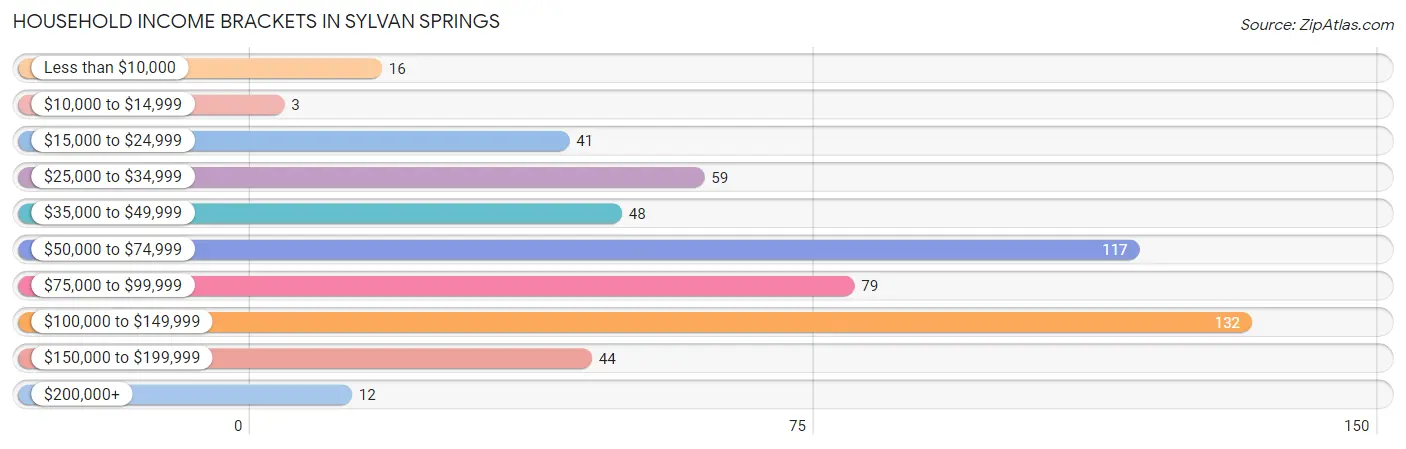
| Income Bracket | # Households | % Households |
| Less than $10,000 | 16 | 2.9% |
| $10,000 to $14,999 | 3 | 0.5% |
| $15,000 to $24,999 | 41 | 7.4% |
| $25,000 to $34,999 | 59 | 10.7% |
| $35,000 to $49,999 | 48 | 8.7% |
| $50,000 to $74,999 | 117 | 21.2% |
| $75,000 to $99,999 | 79 | 14.3% |
| $100,000 to $149,999 | 132 | 24.0% |
| $150,000 to $199,999 | 44 | 8.0% |
| $200,000+ | 12 | 2.2% |
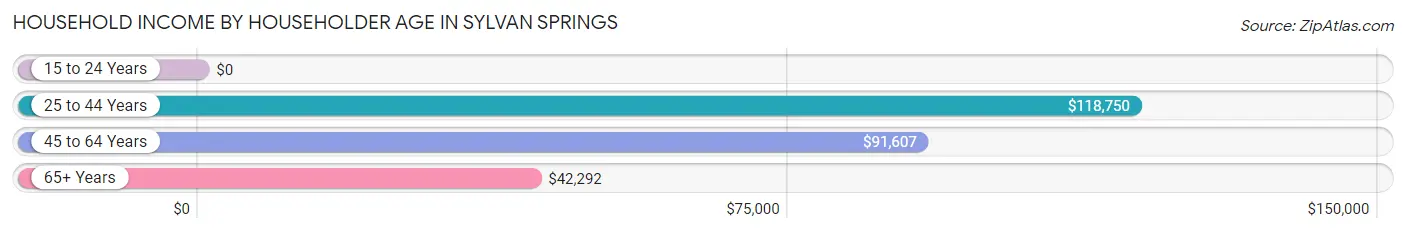
Household Income by Householder Age in Sylvan Springs
The median household income in Sylvan Springs is $73,482, with the highest median household income of $118,750 found in the 25 to 44 years age bracket for the primary householder. A total of 132 households (24.0%) fall into this category. Meanwhile, the 15 to 24 years age bracket for the primary householder has the lowest median household income of $0, with 19 households (3.5%) in this group.
| Income Bracket | # Households | Median Income |
| 15 to 24 Years | 19 (3.5%) | $0 |
| 25 to 44 Years | 132 (24.0%) | $118,750 |
| 45 to 64 Years | 181 (32.9%) | $91,607 |
| 65+ Years | 219 (39.8%) | $42,292 |
| Total | 551 (100.0%) | $73,482 |
Poverty in Sylvan Springs
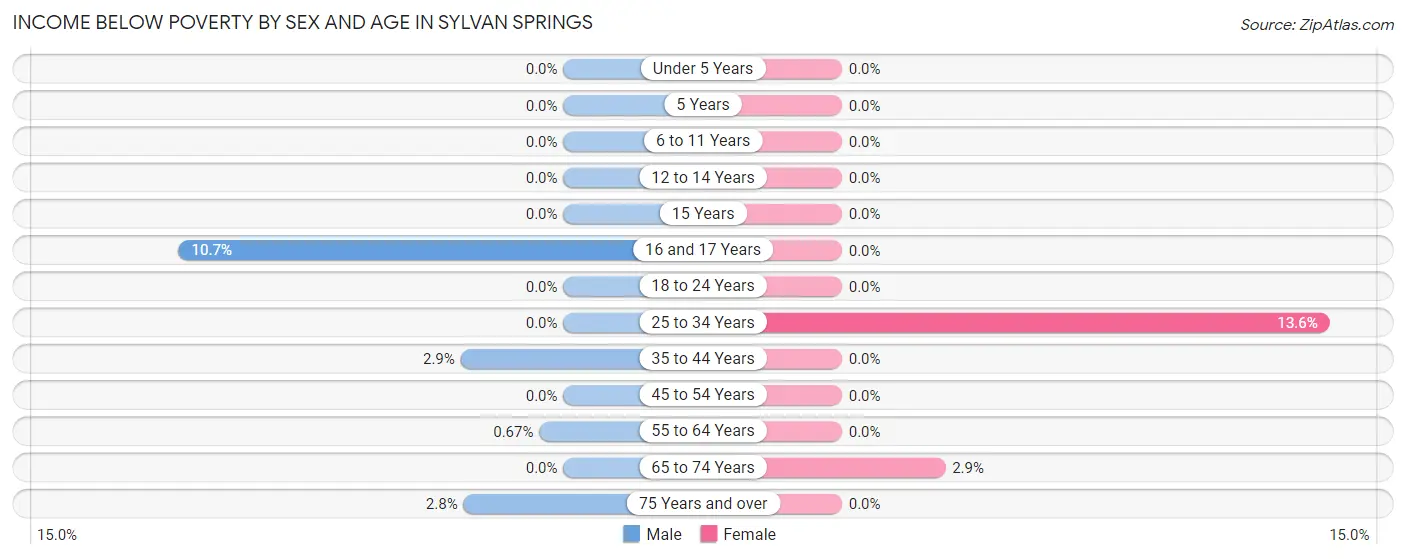
Income Below Poverty by Sex and Age in Sylvan Springs
With 1.2% poverty level for males and 2.1% for females among the residents of Sylvan Springs, 16 and 17 year old males and 25 to 34 year old females are the most vulnerable to poverty, with 3 males (10.7%) and 11 females (13.6%) in their respective age groups living below the poverty level.
| Age Bracket | Male | Female |
| Under 5 Years | 0 (0.0%) | 0 (0.0%) |
| 5 Years | 0 (0.0%) | 0 (0.0%) |
| 6 to 11 Years | 0 (0.0%) | 0 (0.0%) |
| 12 to 14 Years | 0 (0.0%) | 0 (0.0%) |
| 15 Years | 0 (0.0%) | 0 (0.0%) |
| 16 and 17 Years | 3 (10.7%) | 0 (0.0%) |
| 18 to 24 Years | 0 (0.0%) | 0 (0.0%) |
| 25 to 34 Years | 0 (0.0%) | 11 (13.6%) |
| 35 to 44 Years | 3 (2.9%) | 0 (0.0%) |
| 45 to 54 Years | 0 (0.0%) | 0 (0.0%) |
| 55 to 64 Years | 1 (0.7%) | 0 (0.0%) |
| 65 to 74 Years | 0 (0.0%) | 3 (2.9%) |
| 75 Years and over | 3 (2.8%) | 0 (0.0%) |
| Total | 10 (1.2%) | 14 (2.1%) |
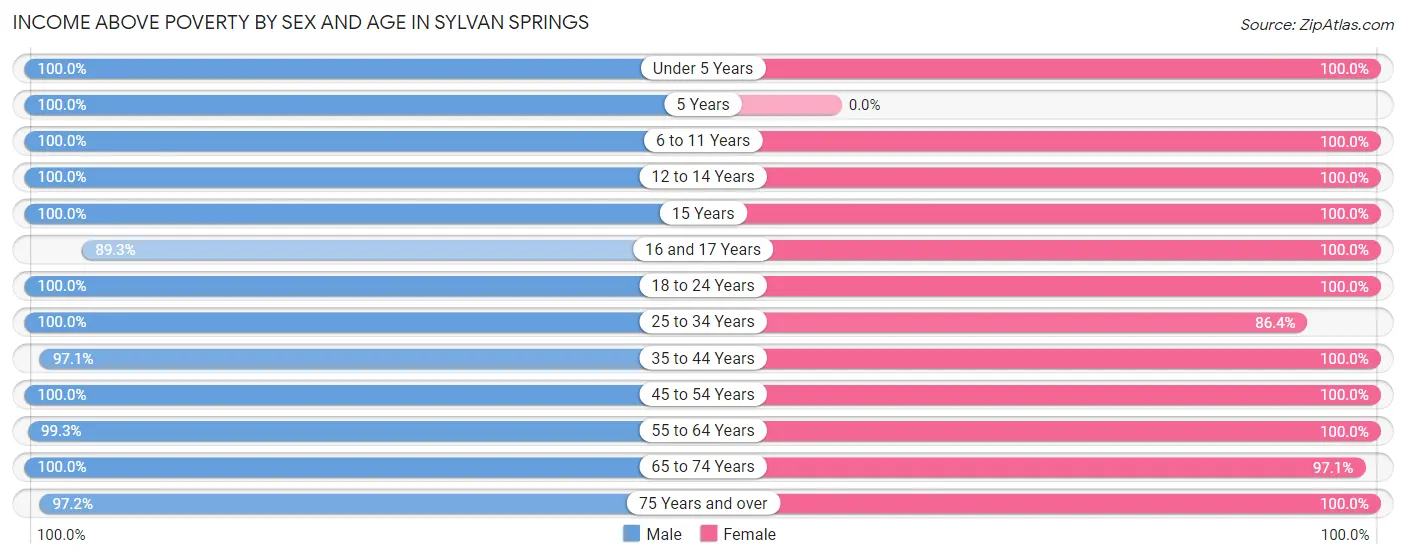
Income Above Poverty by Sex and Age in Sylvan Springs
According to the poverty statistics in Sylvan Springs, males aged under 5 years and females aged under 5 years are the age groups that are most secure financially, with 100.0% of males and 100.0% of females in these age groups living above the poverty line.
| Age Bracket | Male | Female |
| Under 5 Years | 53 (100.0%) | 25 (100.0%) |
| 5 Years | 10 (100.0%) | 0 (0.0%) |
| 6 to 11 Years | 33 (100.0%) | 68 (100.0%) |
| 12 to 14 Years | 33 (100.0%) | 37 (100.0%) |
| 15 Years | 21 (100.0%) | 11 (100.0%) |
| 16 and 17 Years | 25 (89.3%) | 28 (100.0%) |
| 18 to 24 Years | 97 (100.0%) | 56 (100.0%) |
| 25 to 34 Years | 71 (100.0%) | 70 (86.4%) |
| 35 to 44 Years | 102 (97.1%) | 90 (100.0%) |
| 45 to 54 Years | 73 (100.0%) | 39 (100.0%) |
| 55 to 64 Years | 148 (99.3%) | 67 (100.0%) |
| 65 to 74 Years | 52 (100.0%) | 101 (97.1%) |
| 75 Years and over | 105 (97.2%) | 78 (100.0%) |
| Total | 823 (98.8%) | 670 (98.0%) |
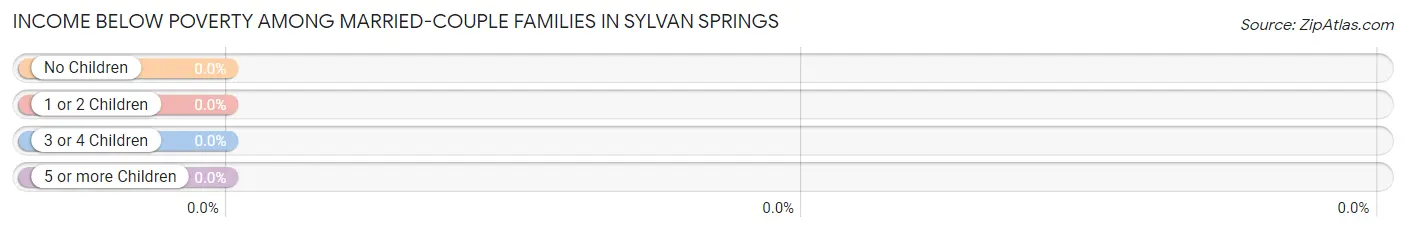
Income Below Poverty Among Married-Couple Families in Sylvan Springs
| Children | Above Poverty | Below Poverty |
| No Children | 197 (100.0%) | 0 (0.0%) |
| 1 or 2 Children | 112 (100.0%) | 0 (0.0%) |
| 3 or 4 Children | 28 (100.0%) | 0 (0.0%) |
| 5 or more Children | 9 (100.0%) | 0 (0.0%) |
| Total | 346 (100.0%) | 0 (0.0%) |
Income Below Poverty Among Single-Parent Households in Sylvan Springs
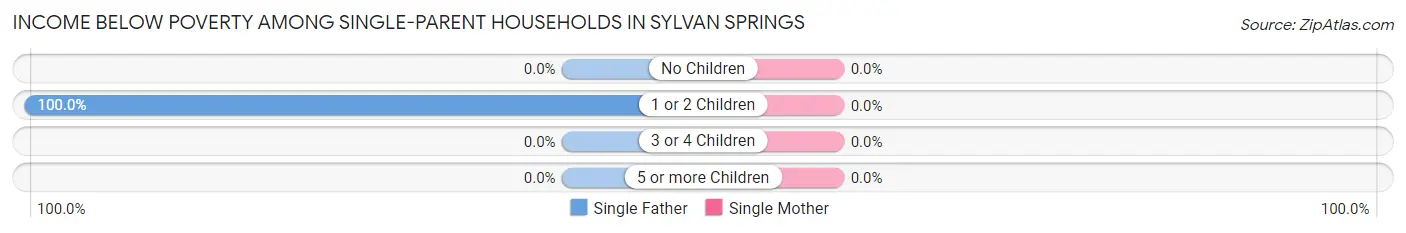
| Children | Single Father | Single Mother |
| No Children | 0 (0.0%) | 0 (0.0%) |
| 1 or 2 Children | 1 (100.0%) | 0 (0.0%) |
| 3 or 4 Children | 0 (0.0%) | 0 (0.0%) |
| 5 or more Children | 0 (0.0%) | 0 (0.0%) |
| Total | 1 (1.3%) | 0 (0.0%) |
Income Below Poverty Among Married-Couple vs Single-Parent Households in Sylvan Springs
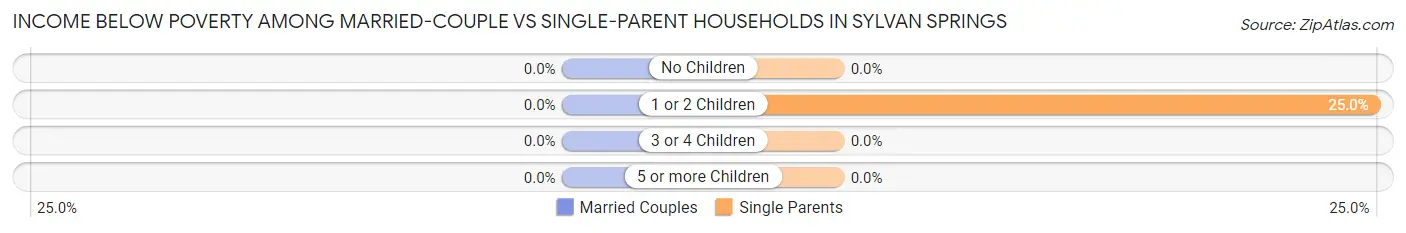
| Children | Married-Couple Families | Single-Parent Households |
| No Children | 0 (0.0%) | 0 (0.0%) |
| 1 or 2 Children | 0 (0.0%) | 1 (25.0%) |
| 3 or 4 Children | 0 (0.0%) | 0 (0.0%) |
| 5 or more Children | 0 (0.0%) | 0 (0.0%) |
| Total | 0 (0.0%) | 1 (1.0%) |
Race in Sylvan Springs
The most populous races in Sylvan Springs are White / Caucasian (1,298 | 85.3%), Two or more Races (125 | 8.2%), and Black / African American (84 | 5.5%).
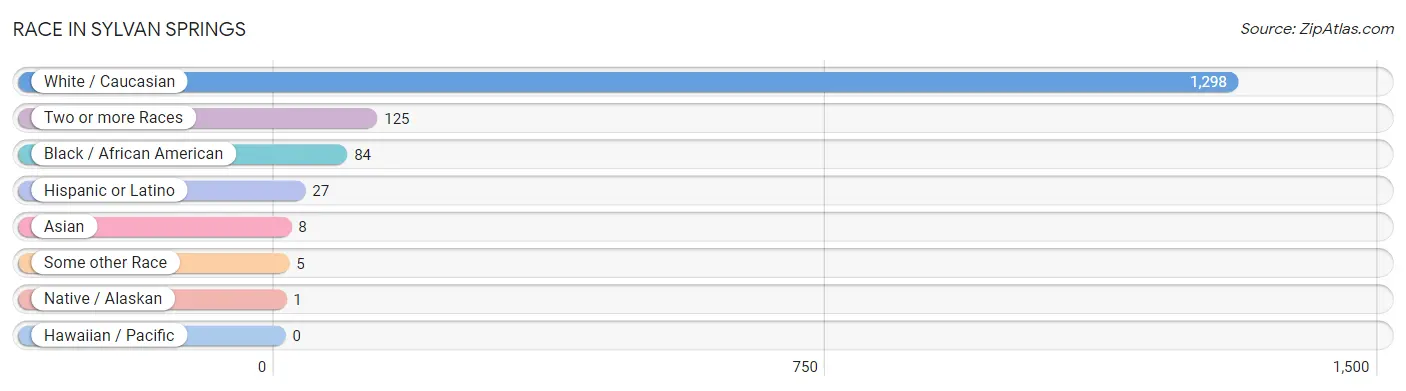
| Race | # Population | % Population |
| Asian | 8 | 0.5% |
| Black / African American | 84 | 5.5% |
| Hawaiian / Pacific | 0 | 0.0% |
| Hispanic or Latino | 27 | 1.8% |
| Native / Alaskan | 1 | 0.1% |
| White / Caucasian | 1,298 | 85.3% |
| Two or more Races | 125 | 8.2% |
| Some other Race | 5 | 0.3% |
| Total | 1,521 | 100.0% |
Ancestry in Sylvan Springs
The most populous ancestries reported in Sylvan Springs are American (289 | 19.0%), English (186 | 12.2%), Irish (89 | 5.9%), Scottish (83 | 5.5%), and German (66 | 4.3%), together accounting for 46.9% of all Sylvan Springs residents.
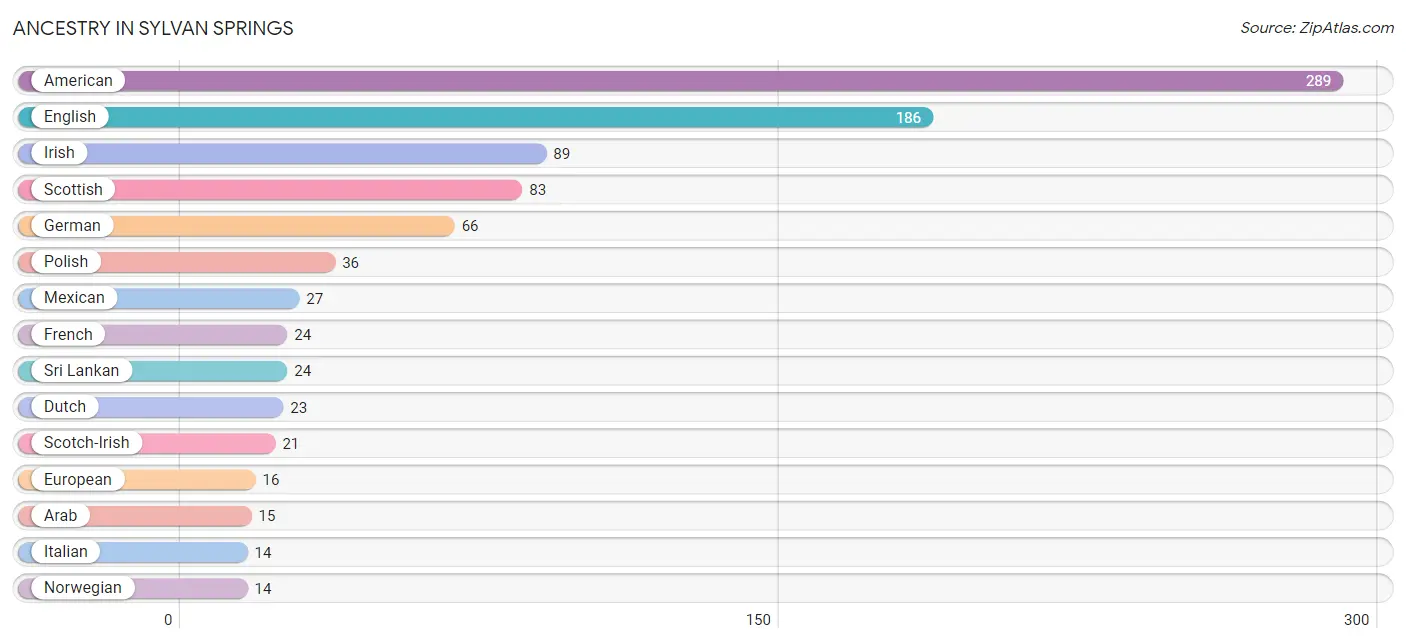
| Ancestry | # Population | % Population |
| African | 5 | 0.3% |
| American | 289 | 19.0% |
| Arab | 15 | 1.0% |
| British | 7 | 0.5% |
| Canadian | 6 | 0.4% |
| Cherokee | 5 | 0.3% |
| Choctaw | 3 | 0.2% |
| Creek | 7 | 0.5% |
| Dutch | 23 | 1.5% |
| Eastern European | 3 | 0.2% |
| English | 186 | 12.2% |
| European | 16 | 1.1% |
| French | 24 | 1.6% |
| French Canadian | 7 | 0.5% |
| German | 66 | 4.3% |
| Hungarian | 4 | 0.3% |
| Irish | 89 | 5.9% |
| Italian | 14 | 0.9% |
| Jordanian | 2 | 0.1% |
| Korean | 8 | 0.5% |
| Lebanese | 13 | 0.9% |
| Mexican | 27 | 1.8% |
| Norwegian | 14 | 0.9% |
| Polish | 36 | 2.4% |
| Scandinavian | 6 | 0.4% |
| Scotch-Irish | 21 | 1.4% |
| Scottish | 83 | 5.5% |
| Sri Lankan | 24 | 1.6% |
| Subsaharan African | 5 | 0.3% |
| Welsh | 3 | 0.2% | View All 30 Rows |
Immigrants in Sylvan Springs
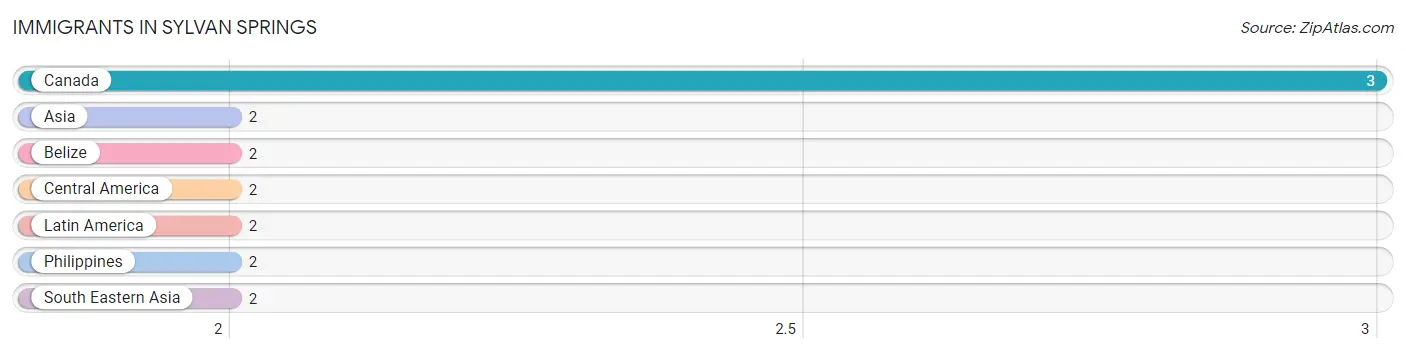
The most numerous immigrant groups reported in Sylvan Springs came from Canada (3 | 0.2%), Asia (2 | 0.1%), Belize (2 | 0.1%), Central America (2 | 0.1%), and Latin America (2 | 0.1%), together accounting for 0.7% of all Sylvan Springs residents.
| Immigration Origin | # Population | % Population |
| Asia | 2 | 0.1% |
| Belize | 2 | 0.1% |
| Canada | 3 | 0.2% |
| Central America | 2 | 0.1% |
| Latin America | 2 | 0.1% |
| Philippines | 2 | 0.1% |
| South Eastern Asia | 2 | 0.1% | View All 7 Rows |
Sex and Age in Sylvan Springs
Sex and Age in Sylvan Springs
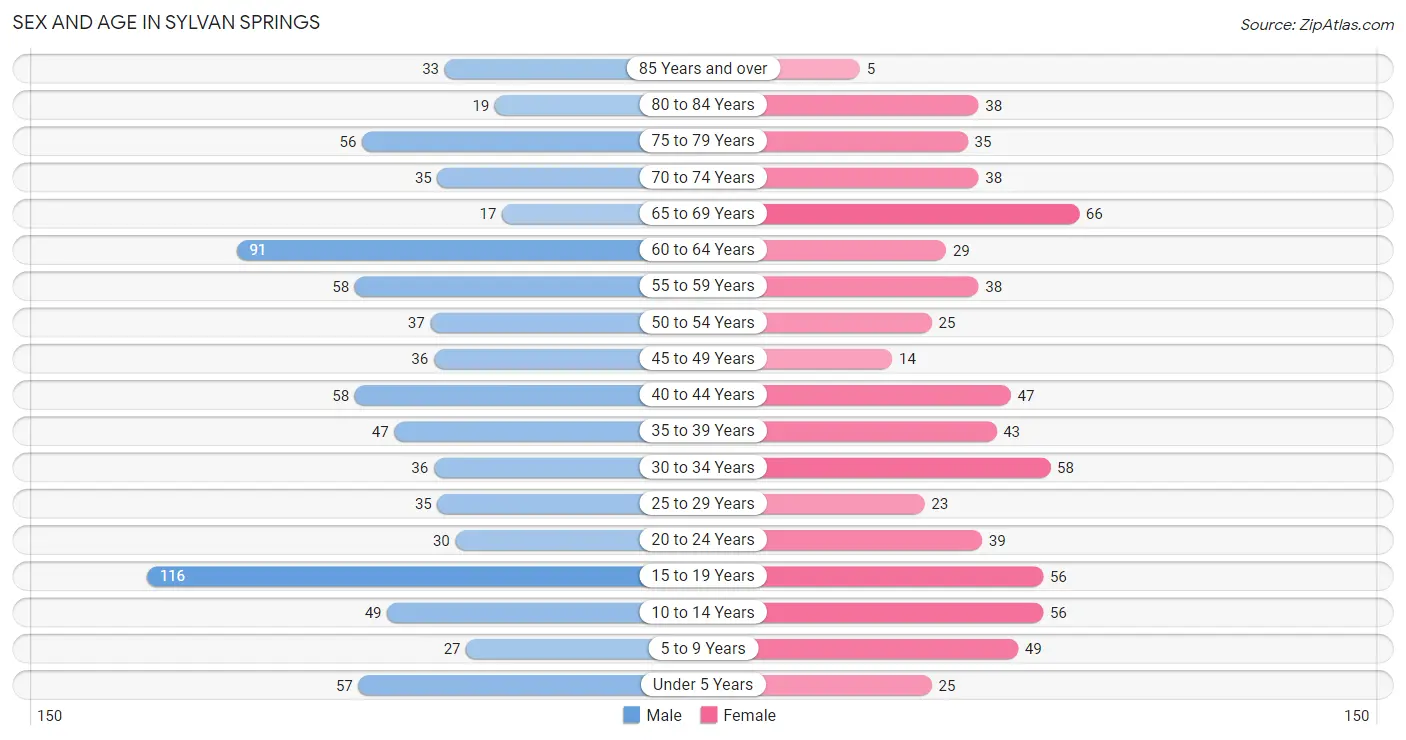
The most populous age groups in Sylvan Springs are 15 to 19 Years (116 | 13.9%) for men and 65 to 69 Years (66 | 9.7%) for women.
| Age Bracket | Male | Female |
| Under 5 Years | 57 (6.8%) | 25 (3.6%) |
| 5 to 9 Years | 27 (3.2%) | 49 (7.2%) |
| 10 to 14 Years | 49 (5.9%) | 56 (8.2%) |
| 15 to 19 Years | 116 (13.9%) | 56 (8.2%) |
| 20 to 24 Years | 30 (3.6%) | 39 (5.7%) |
| 25 to 29 Years | 35 (4.2%) | 23 (3.4%) |
| 30 to 34 Years | 36 (4.3%) | 58 (8.5%) |
| 35 to 39 Years | 47 (5.6%) | 43 (6.3%) |
| 40 to 44 Years | 58 (6.9%) | 47 (6.9%) |
| 45 to 49 Years | 36 (4.3%) | 14 (2.1%) |
| 50 to 54 Years | 37 (4.4%) | 25 (3.6%) |
| 55 to 59 Years | 58 (6.9%) | 38 (5.6%) |
| 60 to 64 Years | 91 (10.9%) | 29 (4.2%) |
| 65 to 69 Years | 17 (2.0%) | 66 (9.7%) |
| 70 to 74 Years | 35 (4.2%) | 38 (5.6%) |
| 75 to 79 Years | 56 (6.7%) | 35 (5.1%) |
| 80 to 84 Years | 19 (2.3%) | 38 (5.6%) |
| 85 Years and over | 33 (3.9%) | 5 (0.7%) |
| Total | 837 (100.0%) | 684 (100.0%) |
Families and Households in Sylvan Springs
Median Family Size in Sylvan Springs
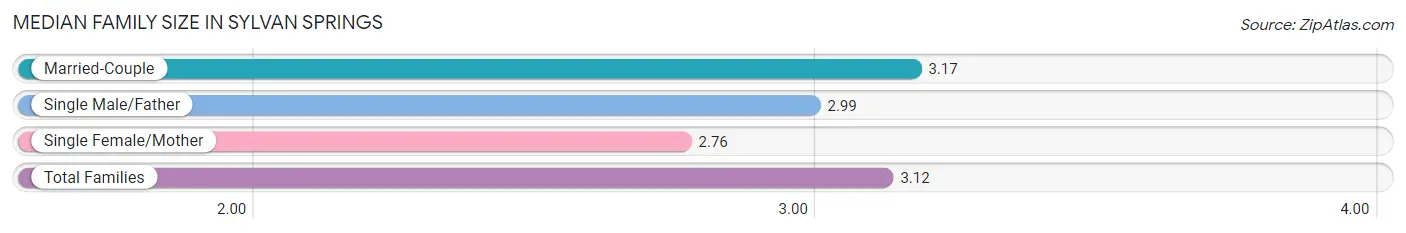
The median family size in Sylvan Springs is 3.12 persons per family, with married-couple families (346 | 78.3%) accounting for the largest median family size of 3.17 persons per family. On the other hand, single female/mother families (17 | 3.8%) represent the smallest median family size with 2.76 persons per family.
| Family Type | # Families | Family Size |
| Married-Couple | 346 (78.3%) | 3.17 |
| Single Male/Father | 79 (17.9%) | 2.99 |
| Single Female/Mother | 17 (3.8%) | 2.76 |
| Total Families | 442 (100.0%) | 3.12 |
Median Household Size in Sylvan Springs
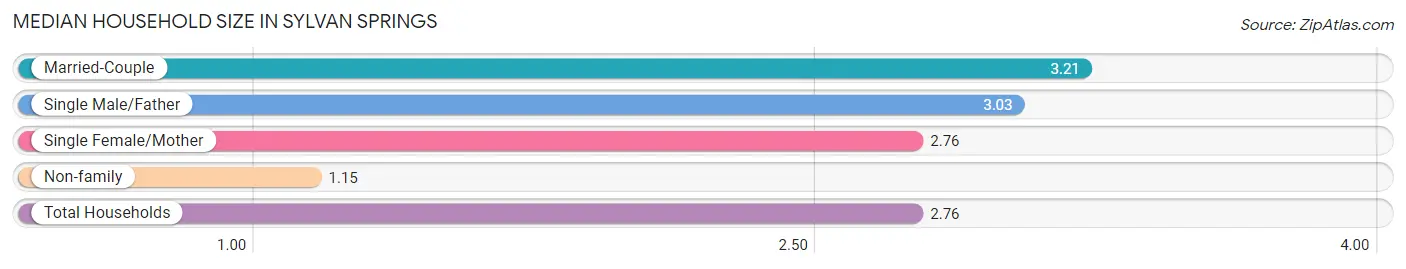
The median household size in Sylvan Springs is 2.76 persons per household, with married-couple households (346 | 62.8%) accounting for the largest median household size of 3.21 persons per household. non-family households (109 | 19.8%) represent the smallest median household size with 1.15 persons per household.
| Household Type | # Households | Household Size |
| Married-Couple | 346 (62.8%) | 3.21 |
| Single Male/Father | 79 (14.3%) | 3.03 |
| Single Female/Mother | 17 (3.1%) | 2.76 |
| Non-family | 109 (19.8%) | 1.15 |
| Total Households | 551 (100.0%) | 2.76 |
Household Size by Marriage Status in Sylvan Springs
Out of a total of 551 households in Sylvan Springs, 442 (80.2%) are family households, while 109 (19.8%) are nonfamily households. The most numerous type of family households are 2-person households, comprising 256, and the most common type of nonfamily households are 1-person households, comprising 93.
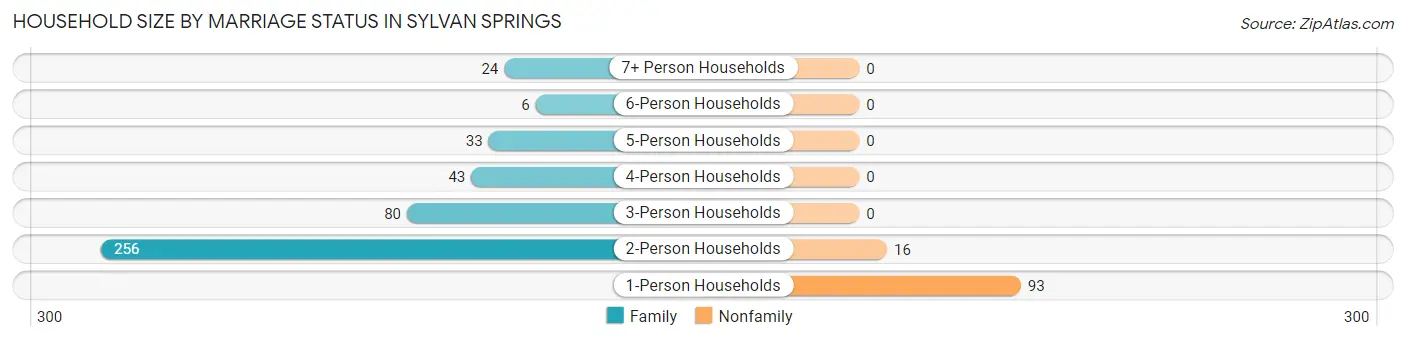
| Household Size | Family Households | Nonfamily Households |
| 1-Person Households | - | 93 (16.9%) |
| 2-Person Households | 256 (46.5%) | 16 (2.9%) |
| 3-Person Households | 80 (14.5%) | 0 (0.0%) |
| 4-Person Households | 43 (7.8%) | 0 (0.0%) |
| 5-Person Households | 33 (6.0%) | 0 (0.0%) |
| 6-Person Households | 6 (1.1%) | 0 (0.0%) |
| 7+ Person Households | 24 (4.4%) | 0 (0.0%) |
| Total | 442 (80.2%) | 109 (19.8%) |
Female Fertility in Sylvan Springs
Fertility by Age in Sylvan Springs
Average fertility rate in Sylvan Springs is 146.0 births per 1,000 women. Women in the age bracket of 20 to 34 years have the highest fertility rate with 350.0 births per 1,000 women. Women in the age bracket of 20 to 34 years acount for 100.0% of all women with births.
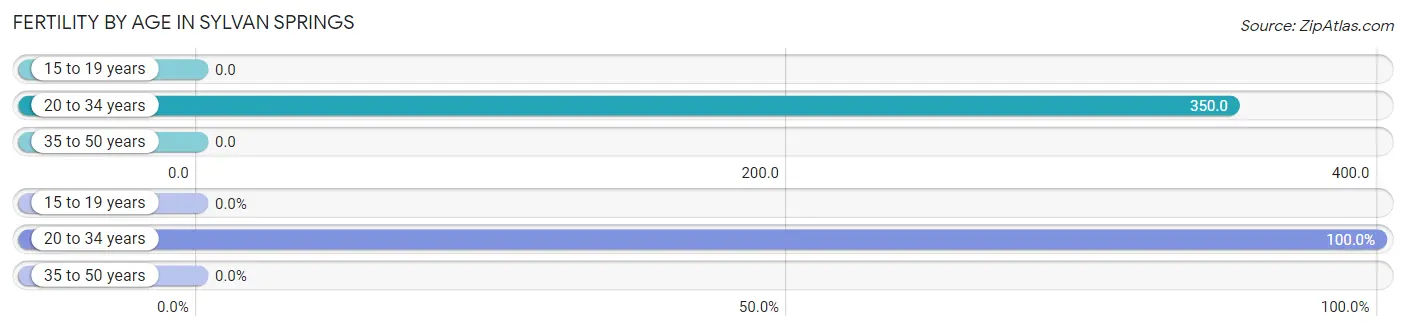
| Age Bracket | Women with Births | Births / 1,000 Women |
| 15 to 19 years | 0 (0.0%) | 0.0 |
| 20 to 34 years | 42 (100.0%) | 350.0 |
| 35 to 50 years | 0 (0.0%) | 0.0 |
| Total | 42 (100.0%) | 146.0 |
Fertility by Age by Marriage Status in Sylvan Springs
76.2% of women with births (42) in Sylvan Springs are married. The highest percentage of unmarried women with births falls into 20 to 34 years age bracket with 23.8% of them unmarried at the time of birth, while the lowest percentage of unmarried women with births belong to 20 to 34 years age bracket with 23.8% of them unmarried.
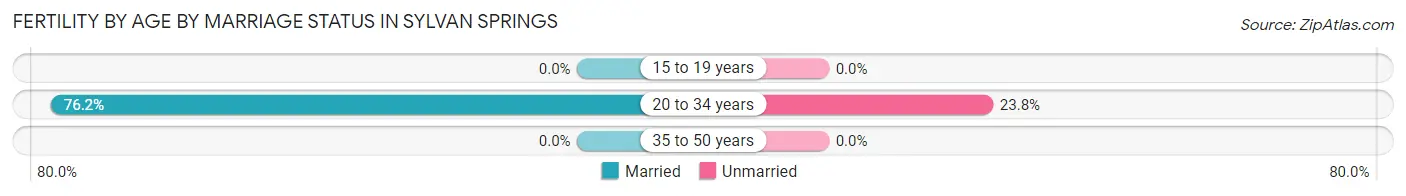
| Age Bracket | Married | Unmarried |
| 15 to 19 years | 0 (0.0%) | 0 (0.0%) |
| 20 to 34 years | 32 (76.2%) | 10 (23.8%) |
| 35 to 50 years | 0 (0.0%) | 0 (0.0%) |
| Total | 32 (76.2%) | 10 (23.8%) |
Fertility by Education in Sylvan Springs
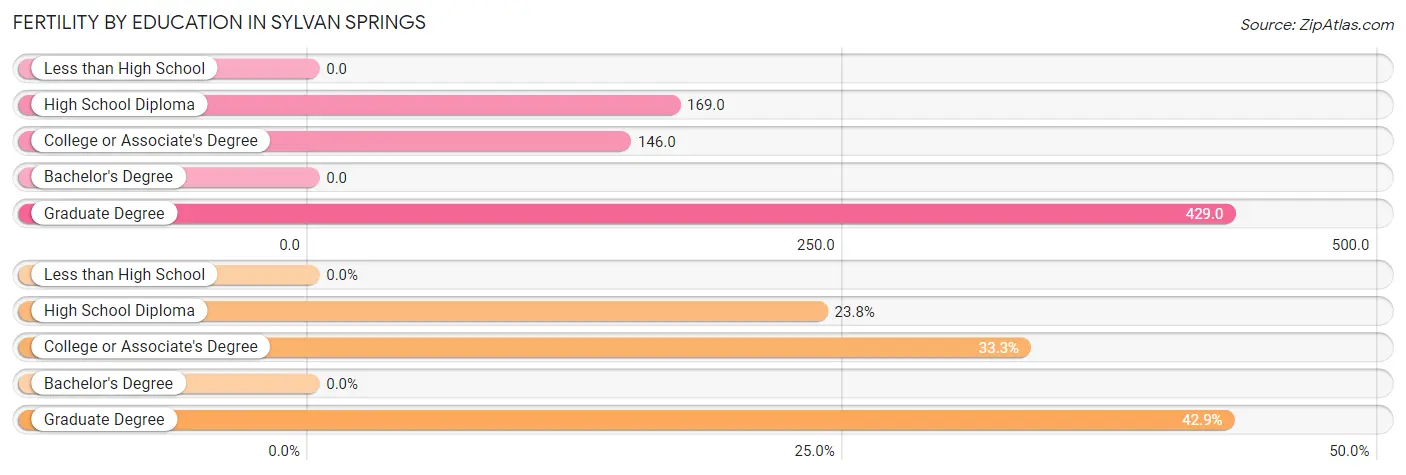
| Educational Attainment | Women with Births | Births / 1,000 Women |
| Less than High School | 0 (0.0%) | 0.0 |
| High School Diploma | 10 (23.8%) | 169.0 |
| College or Associate's Degree | 14 (33.3%) | 146.0 |
| Bachelor's Degree | 0 (0.0%) | 0.0 |
| Graduate Degree | 18 (42.9%) | 429.0 |
| Total | 42 (100.0%) | 146.0 |
Fertility by Education by Marriage Status in Sylvan Springs
23.8% of women with births in Sylvan Springs are unmarried. Women with the educational attainment of college or associate's degree are most likely to be married with 100.0% of them married at childbirth, while women with the educational attainment of high school diploma are least likely to be married with 100.0% of them unmarried at childbirth.
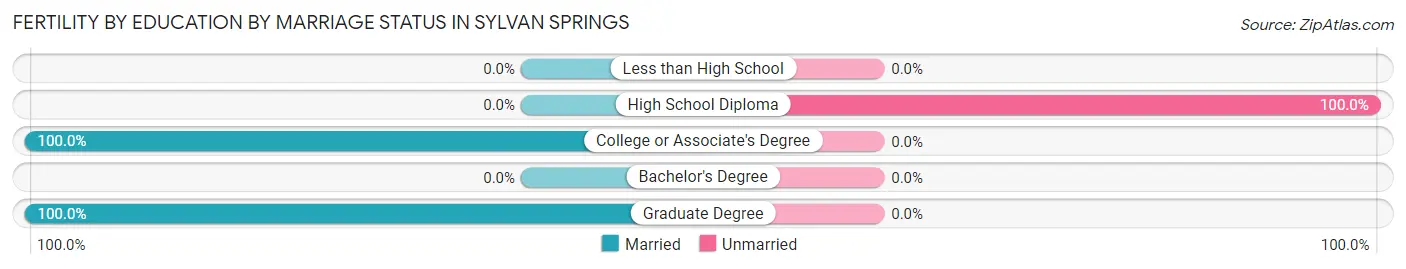
| Educational Attainment | Married | Unmarried |
| Less than High School | 0 (0.0%) | 0 (0.0%) |
| High School Diploma | 0 (0.0%) | 10 (100.0%) |
| College or Associate's Degree | 14 (100.0%) | 0 (0.0%) |
| Bachelor's Degree | 0 (0.0%) | 0 (0.0%) |
| Graduate Degree | 18 (100.0%) | 0 (0.0%) |
| Total | 32 (76.2%) | 10 (23.8%) |
Employment Characteristics in Sylvan Springs
Employment by Class of Employer in Sylvan Springs
Among the 556 employed individuals in Sylvan Springs, private company employees (426 | 76.6%), local government employees (38 | 6.8%), and not-for-profit organizations (35 | 6.3%) make up the most common classes of employment.
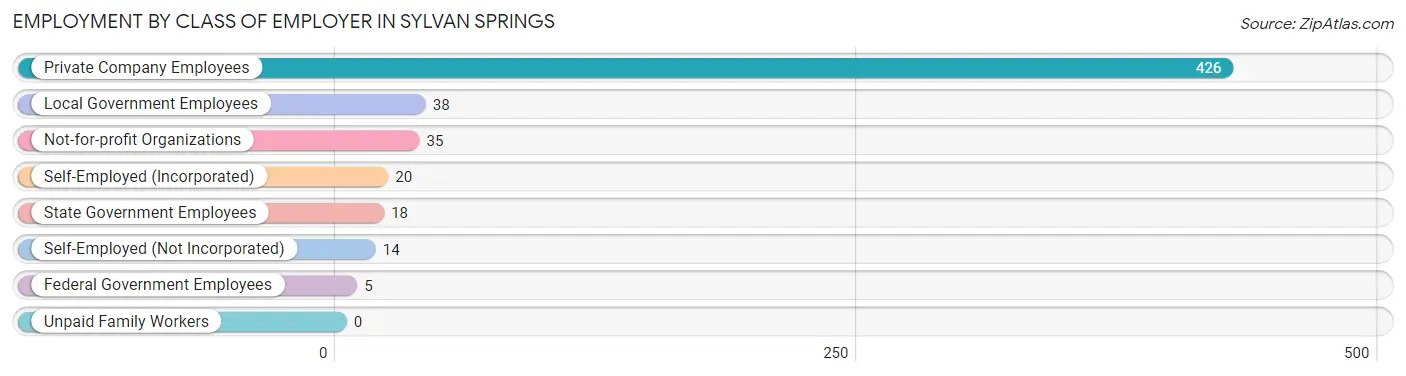
| Employer Class | # Employees | % Employees |
| Private Company Employees | 426 | 76.6% |
| Self-Employed (Incorporated) | 20 | 3.6% |
| Self-Employed (Not Incorporated) | 14 | 2.5% |
| Not-for-profit Organizations | 35 | 6.3% |
| Local Government Employees | 38 | 6.8% |
| State Government Employees | 18 | 3.2% |
| Federal Government Employees | 5 | 0.9% |
| Unpaid Family Workers | 0 | 0.0% |
| Total | 556 | 100.0% |
Employment Status by Age in Sylvan Springs
According to the labor force statistics for Sylvan Springs, out of the total population over 16 years of age (1,226), 51.6% or 633 individuals are in the labor force, with 8.2% or 52 of them unemployed. The age group with the highest labor force participation rate is 20 to 24 years, with 100.0% or 69 individuals in the labor force. Within the labor force, the 75 years and over age range has the highest percentage of unemployed individuals, with 61.5% or 8 of them being unemployed.
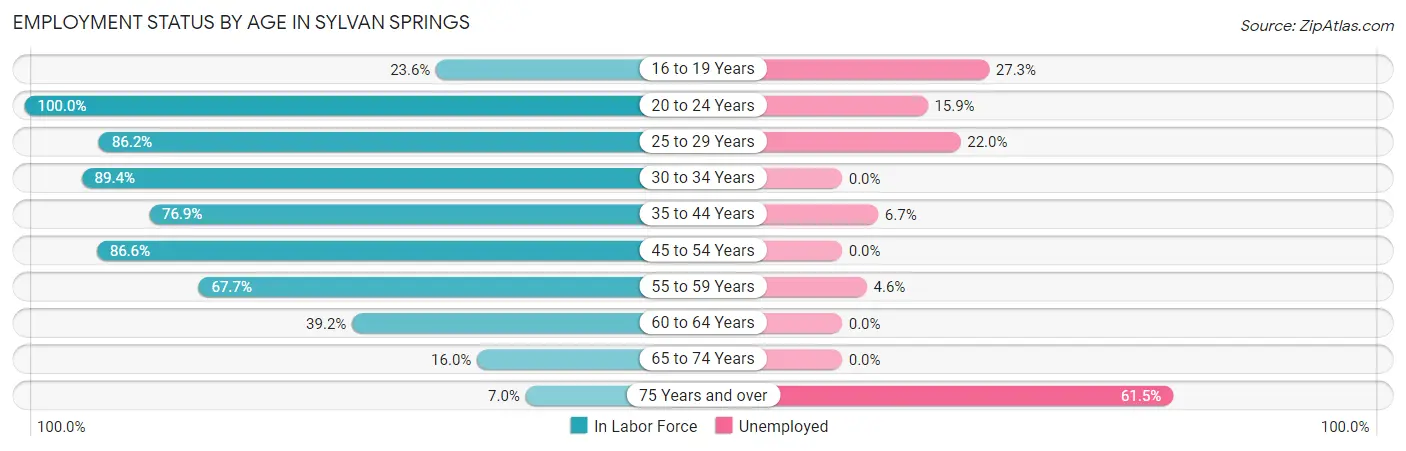
| Age Bracket | In Labor Force | Unemployed |
| 16 to 19 Years | 33 (23.6%) | 9 (27.3%) |
| 20 to 24 Years | 69 (100.0%) | 11 (15.9%) |
| 25 to 29 Years | 50 (86.2%) | 11 (22.0%) |
| 30 to 34 Years | 84 (89.4%) | 0 (0.0%) |
| 35 to 44 Years | 150 (76.9%) | 10 (6.7%) |
| 45 to 54 Years | 97 (86.6%) | 0 (0.0%) |
| 55 to 59 Years | 65 (67.7%) | 3 (4.6%) |
| 60 to 64 Years | 47 (39.2%) | 0 (0.0%) |
| 65 to 74 Years | 25 (16.0%) | 0 (0.0%) |
| 75 Years and over | 13 (7.0%) | 8 (61.5%) |
| Total | 633 (51.6%) | 52 (8.2%) |
Employment Status by Educational Attainment in Sylvan Springs
According to labor force statistics for Sylvan Springs, 73.0% of individuals (493) out of the total population between 25 and 64 years of age (675) are in the labor force, with 4.9% or 24 of them being unemployed. The group with the highest labor force participation rate are those with the educational attainment of college / associate degree, with 84.1% or 190 individuals in the labor force. Within the labor force, individuals with high school diploma education have the highest percentage of unemployment, with 6.6% or 12 of them being unemployed.
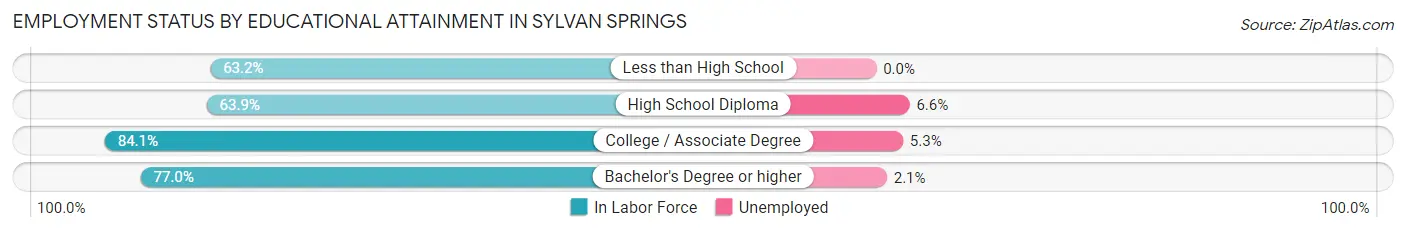
| Educational Attainment | In Labor Force | Unemployed |
| Less than High School | 24 (63.2%) | 0 (0.0%) |
| High School Diploma | 182 (63.9%) | 19 (6.6%) |
| College / Associate Degree | 190 (84.1%) | 12 (5.3%) |
| Bachelor's Degree or higher | 97 (77.0%) | 3 (2.1%) |
| Total | 493 (73.0%) | 33 (4.9%) |
Employment Occupations by Sex in Sylvan Springs
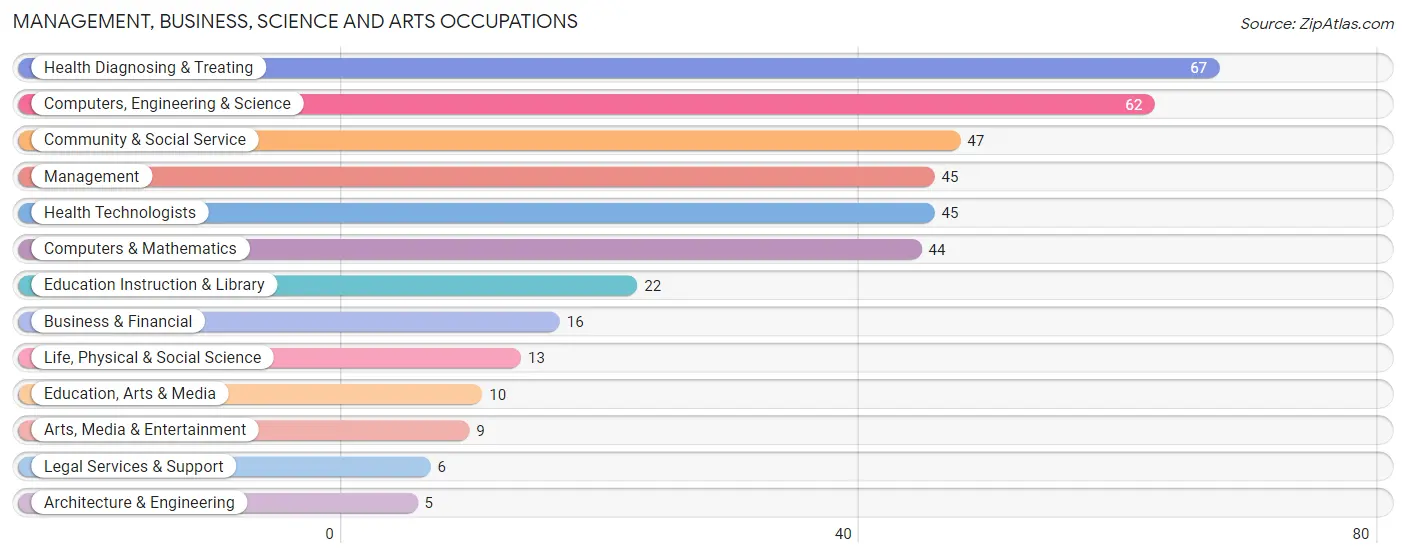
Management, Business, Science and Arts Occupations
The most common Management, Business, Science and Arts occupations in Sylvan Springs are Health Diagnosing & Treating (67 | 11.5%), Computers, Engineering & Science (62 | 10.7%), Community & Social Service (47 | 8.1%), Management (45 | 7.7%), and Health Technologists (45 | 7.7%).
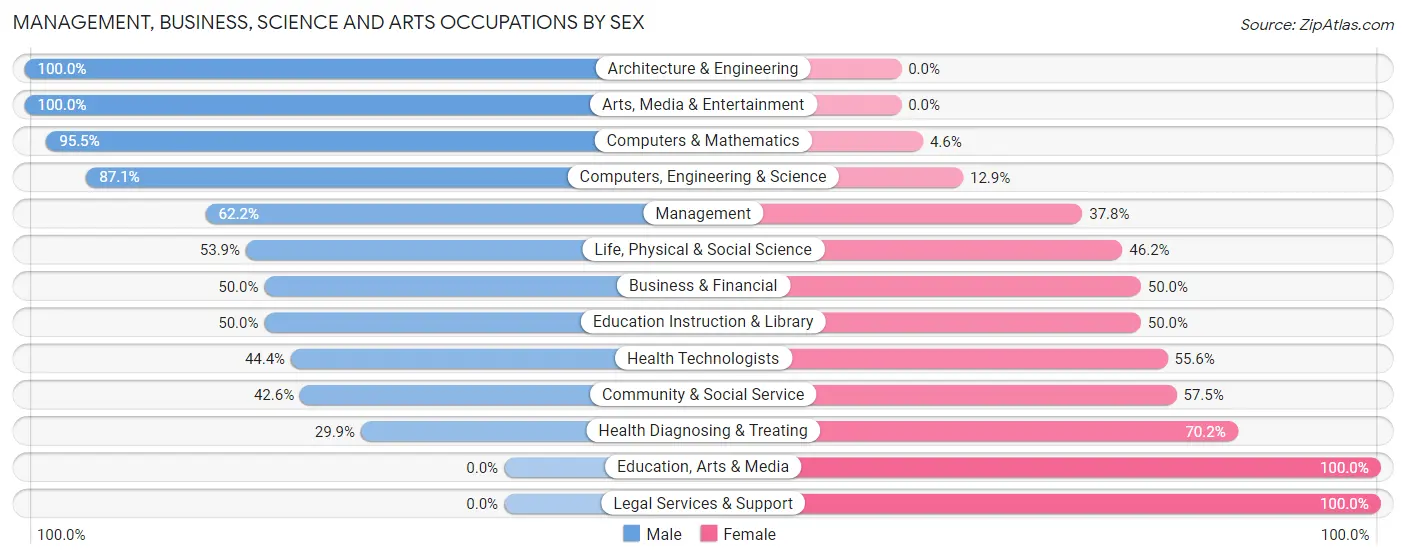
Management, Business, Science and Arts Occupations by Sex
Within the Management, Business, Science and Arts occupations in Sylvan Springs, the most male-oriented occupations are Architecture & Engineering (100.0%), Arts, Media & Entertainment (100.0%), and Computers & Mathematics (95.5%), while the most female-oriented occupations are Education, Arts & Media (100.0%), Legal Services & Support (100.0%), and Health Diagnosing & Treating (70.2%).
| Occupation | Male | Female |
| Management | 28 (62.2%) | 17 (37.8%) |
| Business & Financial | 8 (50.0%) | 8 (50.0%) |
| Computers, Engineering & Science | 54 (87.1%) | 8 (12.9%) |
| Computers & Mathematics | 42 (95.5%) | 2 (4.5%) |
| Architecture & Engineering | 5 (100.0%) | 0 (0.0%) |
| Life, Physical & Social Science | 7 (53.8%) | 6 (46.2%) |
| Community & Social Service | 20 (42.5%) | 27 (57.5%) |
| Education, Arts & Media | 0 (0.0%) | 10 (100.0%) |
| Legal Services & Support | 0 (0.0%) | 6 (100.0%) |
| Education Instruction & Library | 11 (50.0%) | 11 (50.0%) |
| Arts, Media & Entertainment | 9 (100.0%) | 0 (0.0%) |
| Health Diagnosing & Treating | 20 (29.8%) | 47 (70.2%) |
| Health Technologists | 20 (44.4%) | 25 (55.6%) |
| Total (Category) | 130 (54.8%) | 107 (45.2%) |
| Total (Overall) | 325 (55.9%) | 256 (44.1%) |
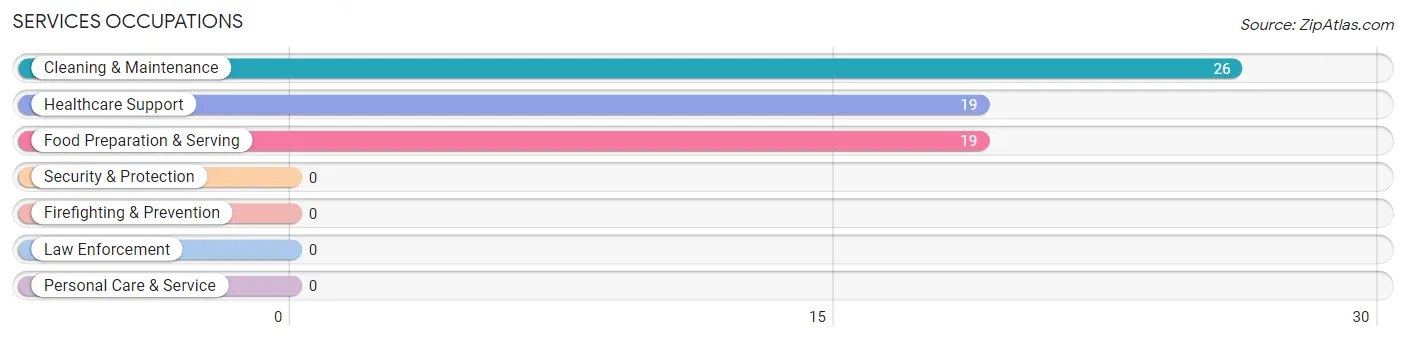
Services Occupations
The most common Services occupations in Sylvan Springs are Cleaning & Maintenance (26 | 4.5%), Healthcare Support (19 | 3.3%), and Food Preparation & Serving (19 | 3.3%).
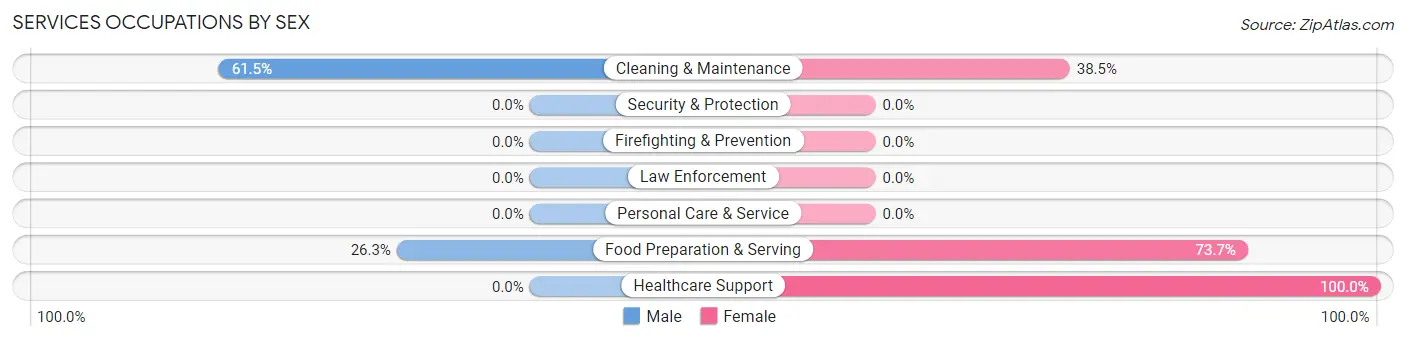
Services Occupations by Sex
Within the Services occupations in Sylvan Springs, the most male-oriented occupations are Cleaning & Maintenance (61.5%), and Food Preparation & Serving (26.3%), while the most female-oriented occupations are Healthcare Support (100.0%), Food Preparation & Serving (73.7%), and Cleaning & Maintenance (38.5%).
| Occupation | Male | Female |
| Healthcare Support | 0 (0.0%) | 19 (100.0%) |
| Security & Protection | 0 (0.0%) | 0 (0.0%) |
| Firefighting & Prevention | 0 (0.0%) | 0 (0.0%) |
| Law Enforcement | 0 (0.0%) | 0 (0.0%) |
| Food Preparation & Serving | 5 (26.3%) | 14 (73.7%) |
| Cleaning & Maintenance | 16 (61.5%) | 10 (38.5%) |
| Personal Care & Service | 0 (0.0%) | 0 (0.0%) |
| Total (Category) | 21 (32.8%) | 43 (67.2%) |
| Total (Overall) | 325 (55.9%) | 256 (44.1%) |
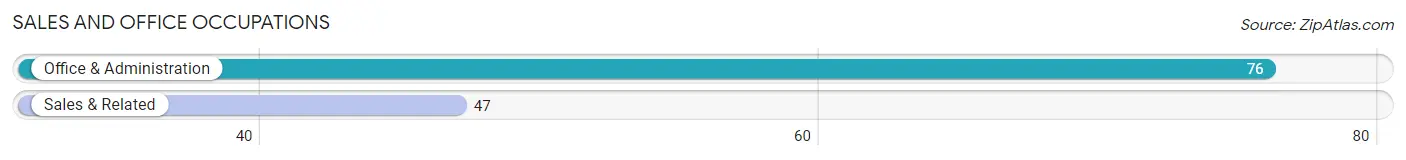
Sales and Office Occupations
The most common Sales and Office occupations in Sylvan Springs are Office & Administration (76 | 13.1%), and Sales & Related (47 | 8.1%).
Sales and Office Occupations by Sex
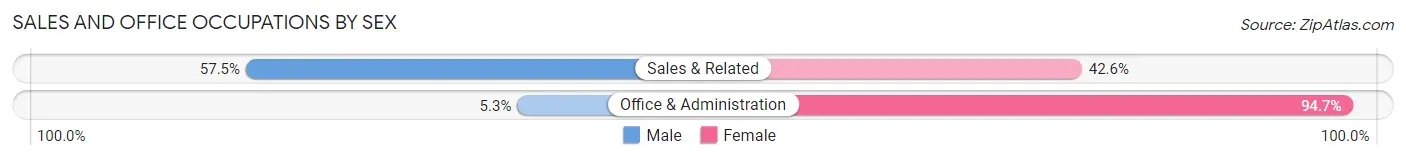
| Occupation | Male | Female |
| Sales & Related | 27 (57.5%) | 20 (42.5%) |
| Office & Administration | 4 (5.3%) | 72 (94.7%) |
| Total (Category) | 31 (25.2%) | 92 (74.8%) |
| Total (Overall) | 325 (55.9%) | 256 (44.1%) |
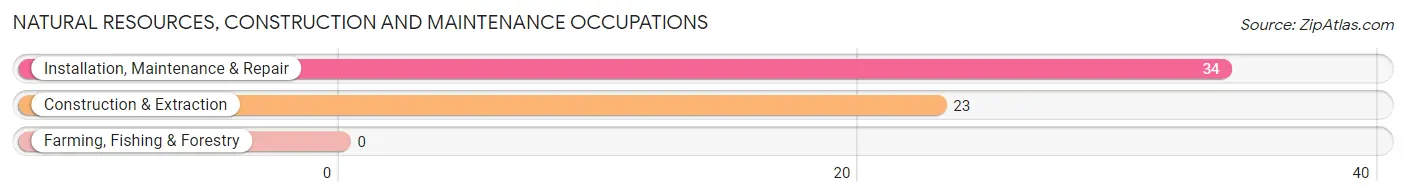
Natural Resources, Construction and Maintenance Occupations
The most common Natural Resources, Construction and Maintenance occupations in Sylvan Springs are Installation, Maintenance & Repair (34 | 5.9%), and Construction & Extraction (23 | 4.0%).
Natural Resources, Construction and Maintenance Occupations by Sex
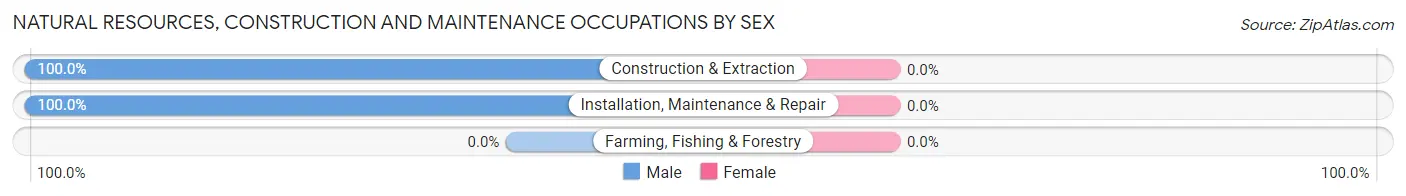
| Occupation | Male | Female |
| Farming, Fishing & Forestry | 0 (0.0%) | 0 (0.0%) |
| Construction & Extraction | 23 (100.0%) | 0 (0.0%) |
| Installation, Maintenance & Repair | 34 (100.0%) | 0 (0.0%) |
| Total (Category) | 57 (100.0%) | 0 (0.0%) |
| Total (Overall) | 325 (55.9%) | 256 (44.1%) |
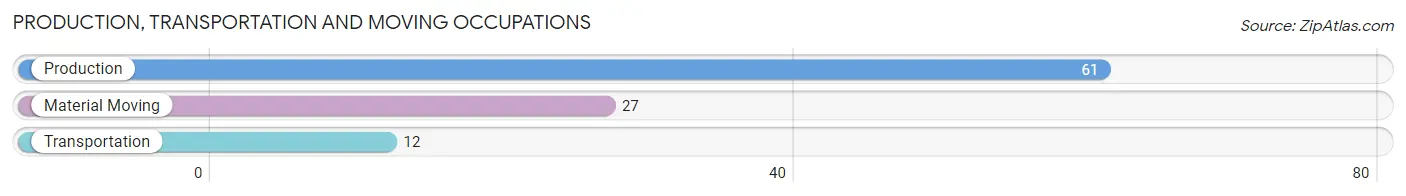
Production, Transportation and Moving Occupations
The most common Production, Transportation and Moving occupations in Sylvan Springs are Production (61 | 10.5%), Material Moving (27 | 4.6%), and Transportation (12 | 2.1%).
Production, Transportation and Moving Occupations by Sex
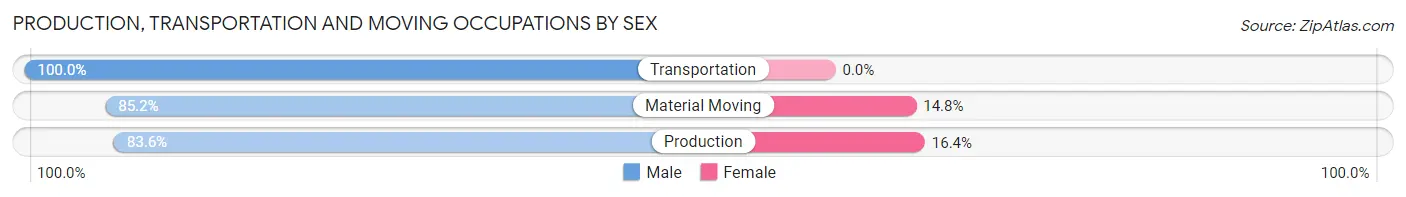
| Occupation | Male | Female |
| Production | 51 (83.6%) | 10 (16.4%) |
| Transportation | 12 (100.0%) | 0 (0.0%) |
| Material Moving | 23 (85.2%) | 4 (14.8%) |
| Total (Category) | 86 (86.0%) | 14 (14.0%) |
| Total (Overall) | 325 (55.9%) | 256 (44.1%) |
Employment Industries by Sex in Sylvan Springs
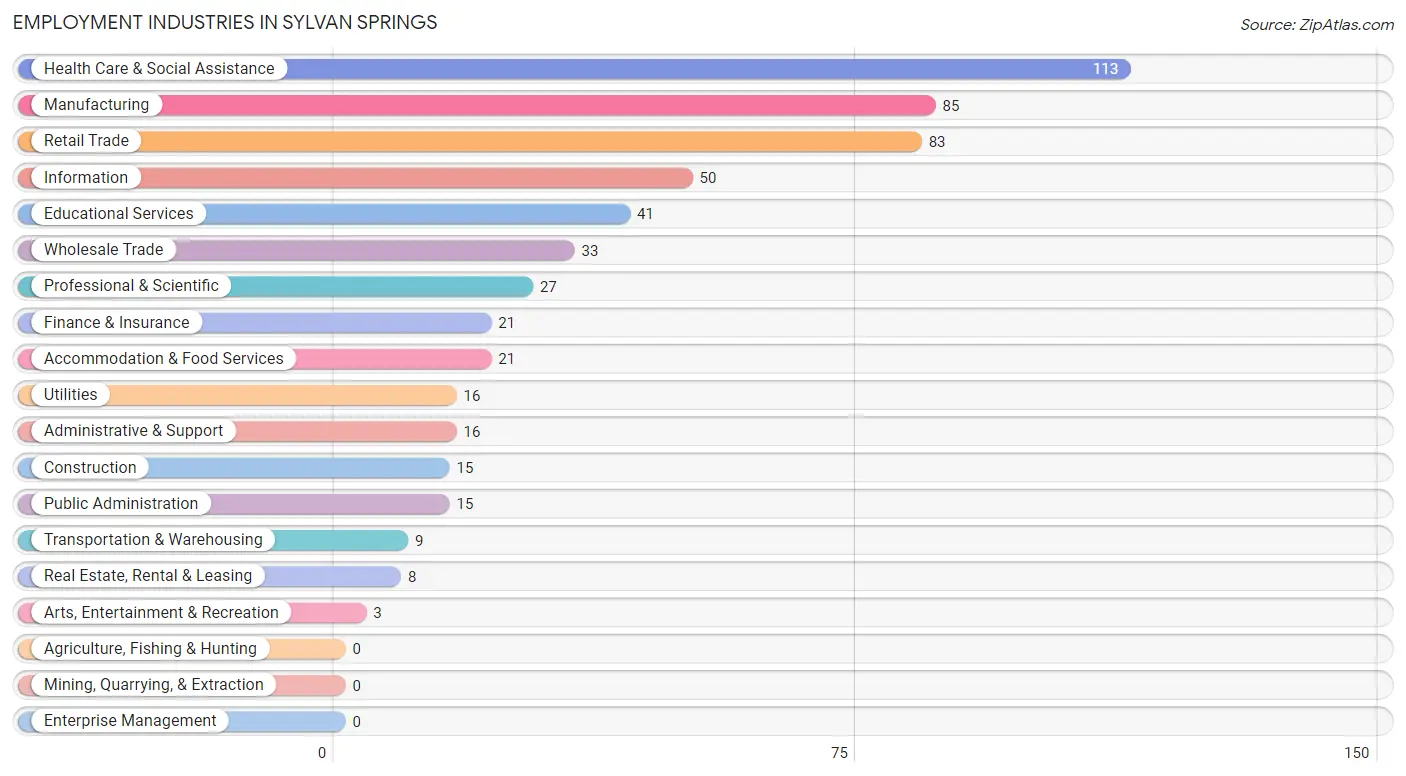
Employment Industries in Sylvan Springs
The major employment industries in Sylvan Springs include Health Care & Social Assistance (113 | 19.5%), Manufacturing (85 | 14.6%), Retail Trade (83 | 14.3%), Information (50 | 8.6%), and Educational Services (41 | 7.1%).
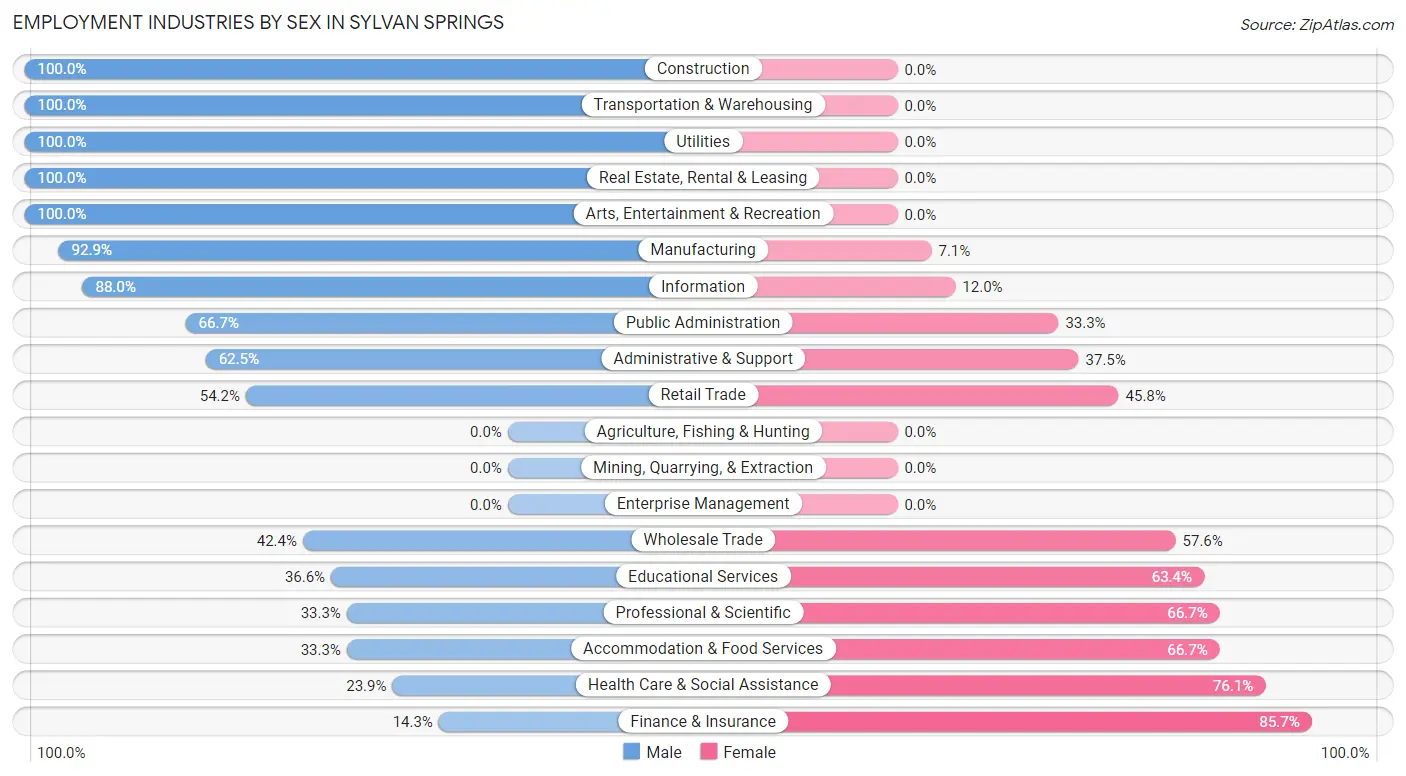
Employment Industries by Sex in Sylvan Springs
The Sylvan Springs industries that see more men than women are Construction (100.0%), Transportation & Warehousing (100.0%), and Utilities (100.0%), whereas the industries that tend to have a higher number of women are Finance & Insurance (85.7%), Health Care & Social Assistance (76.1%), and Professional & Scientific (66.7%).
| Industry | Male | Female |
| Agriculture, Fishing & Hunting | 0 (0.0%) | 0 (0.0%) |
| Mining, Quarrying, & Extraction | 0 (0.0%) | 0 (0.0%) |
| Construction | 15 (100.0%) | 0 (0.0%) |
| Manufacturing | 79 (92.9%) | 6 (7.1%) |
| Wholesale Trade | 14 (42.4%) | 19 (57.6%) |
| Retail Trade | 45 (54.2%) | 38 (45.8%) |
| Transportation & Warehousing | 9 (100.0%) | 0 (0.0%) |
| Utilities | 16 (100.0%) | 0 (0.0%) |
| Information | 44 (88.0%) | 6 (12.0%) |
| Finance & Insurance | 3 (14.3%) | 18 (85.7%) |
| Real Estate, Rental & Leasing | 8 (100.0%) | 0 (0.0%) |
| Professional & Scientific | 9 (33.3%) | 18 (66.7%) |
| Enterprise Management | 0 (0.0%) | 0 (0.0%) |
| Administrative & Support | 10 (62.5%) | 6 (37.5%) |
| Educational Services | 15 (36.6%) | 26 (63.4%) |
| Health Care & Social Assistance | 27 (23.9%) | 86 (76.1%) |
| Arts, Entertainment & Recreation | 3 (100.0%) | 0 (0.0%) |
| Accommodation & Food Services | 7 (33.3%) | 14 (66.7%) |
| Public Administration | 10 (66.7%) | 5 (33.3%) |
| Total | 325 (55.9%) | 256 (44.1%) |
Education in Sylvan Springs
School Enrollment in Sylvan Springs
The most common levels of schooling among the 356 students in Sylvan Springs are high school (113 | 31.7%), college / undergraduate (90 | 25.3%), and middle school (78 | 21.9%).
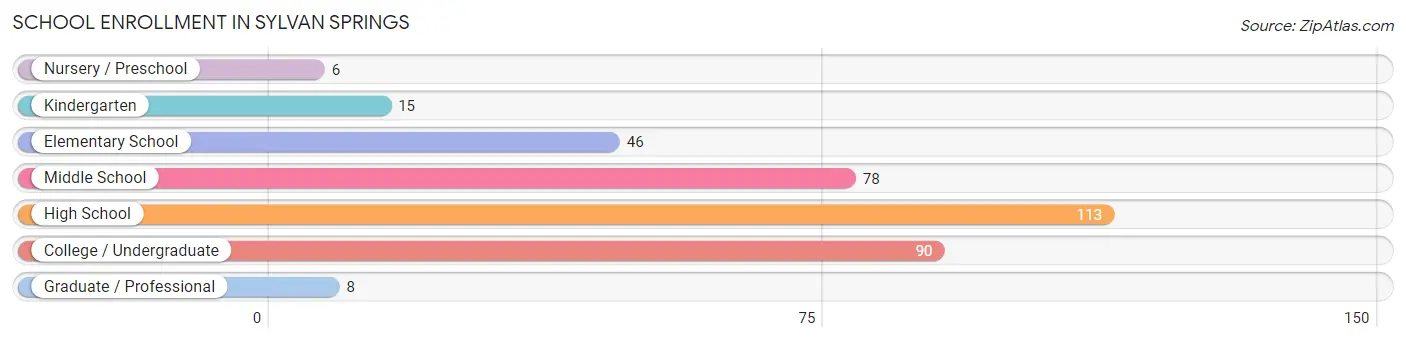
| School Level | # Students | % Students |
| Nursery / Preschool | 6 | 1.7% |
| Kindergarten | 15 | 4.2% |
| Elementary School | 46 | 12.9% |
| Middle School | 78 | 21.9% |
| High School | 113 | 31.7% |
| College / Undergraduate | 90 | 25.3% |
| Graduate / Professional | 8 | 2.2% |
| Total | 356 | 100.0% |
School Enrollment by Age by Funding Source in Sylvan Springs
Out of a total of 356 students who are enrolled in schools in Sylvan Springs, 107 (30.1%) attend a private institution, while the remaining 249 (69.9%) are enrolled in public schools. The age group of 10 to 14 year olds has the highest likelihood of being enrolled in private schools, with 41 (45.6% in the age bracket) enrolled. Conversely, the age group of 3 to 4 year olds has the lowest likelihood of being enrolled in a private school, with 3 (100.0% in the age bracket) attending a public institution.
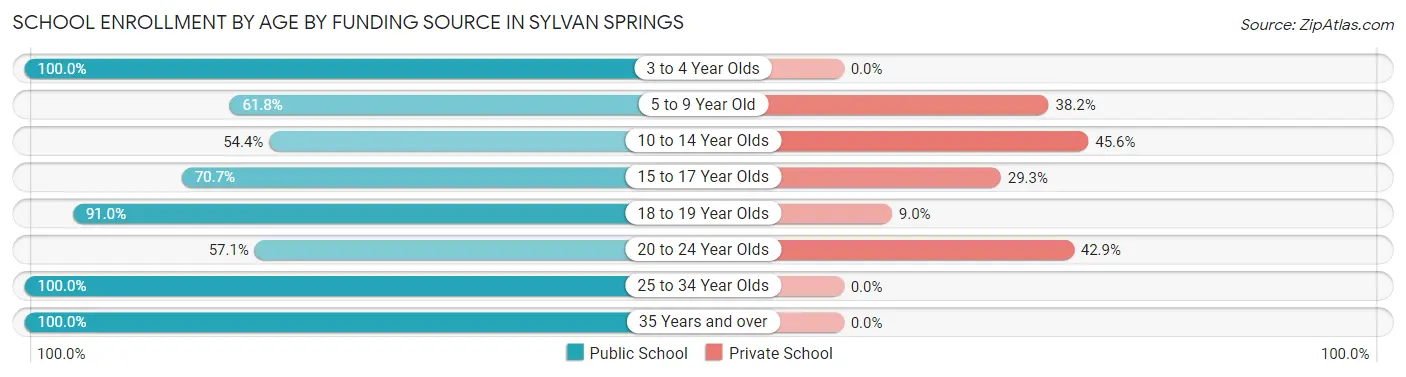
| Age Bracket | Public School | Private School |
| 3 to 4 Year Olds | 3 (100.0%) | 0 (0.0%) |
| 5 to 9 Year Old | 47 (61.8%) | 29 (38.2%) |
| 10 to 14 Year Olds | 49 (54.4%) | 41 (45.6%) |
| 15 to 17 Year Olds | 58 (70.7%) | 24 (29.3%) |
| 18 to 19 Year Olds | 71 (91.0%) | 7 (9.0%) |
| 20 to 24 Year Olds | 8 (57.1%) | 6 (42.9%) |
| 25 to 34 Year Olds | 5 (100.0%) | 0 (0.0%) |
| 35 Years and over | 8 (100.0%) | 0 (0.0%) |
| Total | 249 (69.9%) | 107 (30.1%) |
Educational Attainment by Field of Study in Sylvan Springs
Education (33 | 23.4%), business (29 | 20.6%), bio, nature & agricultural (19 | 13.5%), science & technology (16 | 11.4%), and psychology (11 | 7.8%) are the most common fields of study among 141 individuals in Sylvan Springs who have obtained a bachelor's degree or higher.
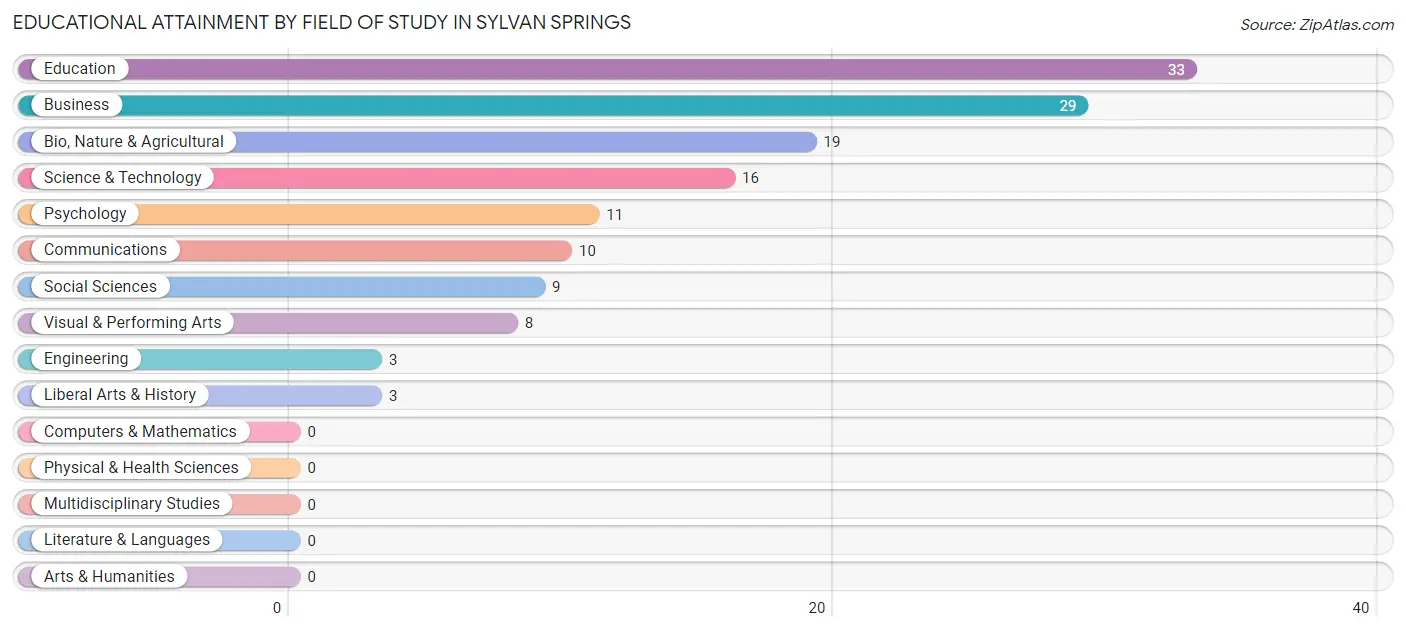
| Field of Study | # Graduates | % Graduates |
| Computers & Mathematics | 0 | 0.0% |
| Bio, Nature & Agricultural | 19 | 13.5% |
| Physical & Health Sciences | 0 | 0.0% |
| Psychology | 11 | 7.8% |
| Social Sciences | 9 | 6.4% |
| Engineering | 3 | 2.1% |
| Multidisciplinary Studies | 0 | 0.0% |
| Science & Technology | 16 | 11.4% |
| Business | 29 | 20.6% |
| Education | 33 | 23.4% |
| Literature & Languages | 0 | 0.0% |
| Liberal Arts & History | 3 | 2.1% |
| Visual & Performing Arts | 8 | 5.7% |
| Communications | 10 | 7.1% |
| Arts & Humanities | 0 | 0.0% |
| Total | 141 | 100.0% |
Transportation & Commute in Sylvan Springs
Vehicle Availability by Sex in Sylvan Springs
The most prevalent vehicle ownership categories in Sylvan Springs are males with 2 vehicles (90, accounting for 28.3%) and females with 2 vehicles (87, making up 37.8%).
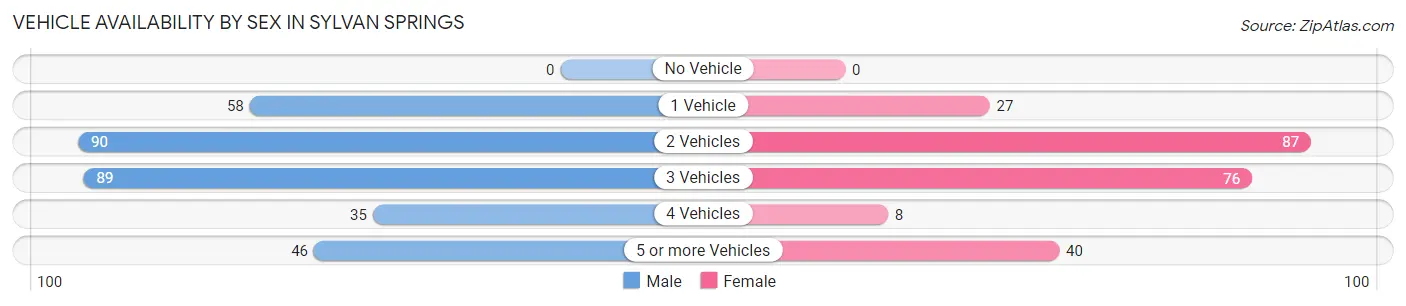
| Vehicles Available | Male | Female |
| No Vehicle | 0 (0.0%) | 0 (0.0%) |
| 1 Vehicle | 58 (18.2%) | 27 (11.3%) |
| 2 Vehicles | 90 (28.3%) | 87 (36.5%) |
| 3 Vehicles | 89 (28.0%) | 76 (31.9%) |
| 4 Vehicles | 35 (11.0%) | 8 (3.4%) |
| 5 or more Vehicles | 46 (14.5%) | 40 (16.8%) |
| Total | 318 (100.0%) | 238 (100.0%) |
Commute Time in Sylvan Springs
The most frequently occuring commute durations in Sylvan Springs are 30 to 34 minutes (122 commuters, 24.2%), 60 to 89 minutes (56 commuters, 11.1%), and 25 to 29 minutes (55 commuters, 10.9%).
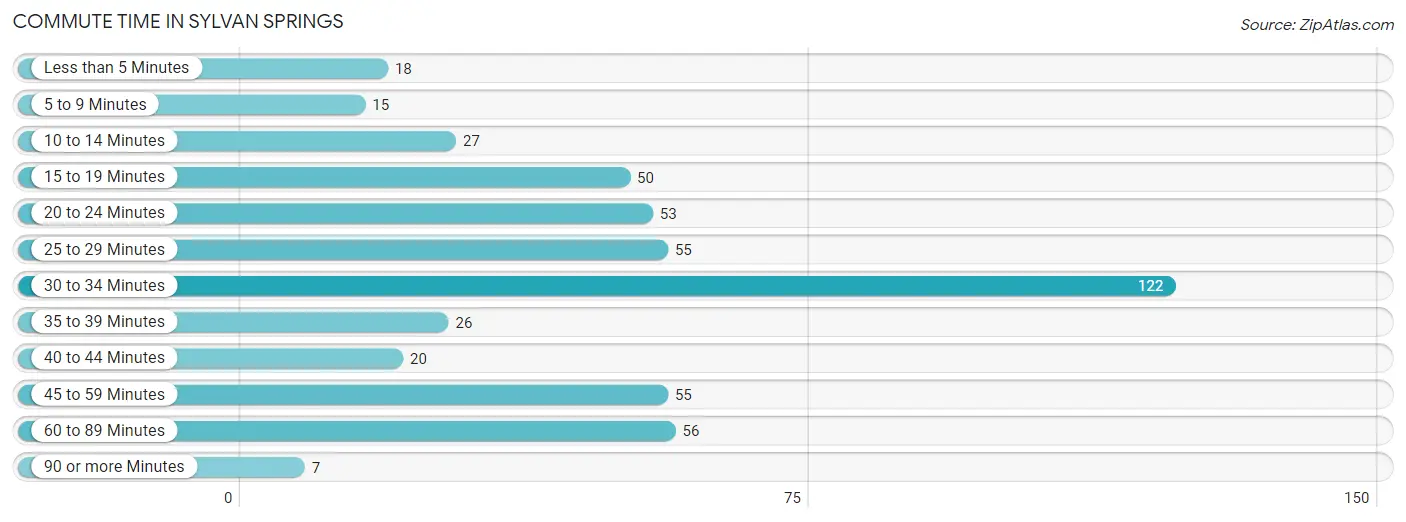
| Commute Time | # Commuters | % Commuters |
| Less than 5 Minutes | 18 | 3.6% |
| 5 to 9 Minutes | 15 | 3.0% |
| 10 to 14 Minutes | 27 | 5.4% |
| 15 to 19 Minutes | 50 | 9.9% |
| 20 to 24 Minutes | 53 | 10.5% |
| 25 to 29 Minutes | 55 | 10.9% |
| 30 to 34 Minutes | 122 | 24.2% |
| 35 to 39 Minutes | 26 | 5.2% |
| 40 to 44 Minutes | 20 | 4.0% |
| 45 to 59 Minutes | 55 | 10.9% |
| 60 to 89 Minutes | 56 | 11.1% |
| 90 or more Minutes | 7 | 1.4% |
Commute Time by Sex in Sylvan Springs
The most common commute times in Sylvan Springs are 30 to 34 minutes (59 commuters, 19.8%) for males and 30 to 34 minutes (63 commuters, 30.6%) for females.
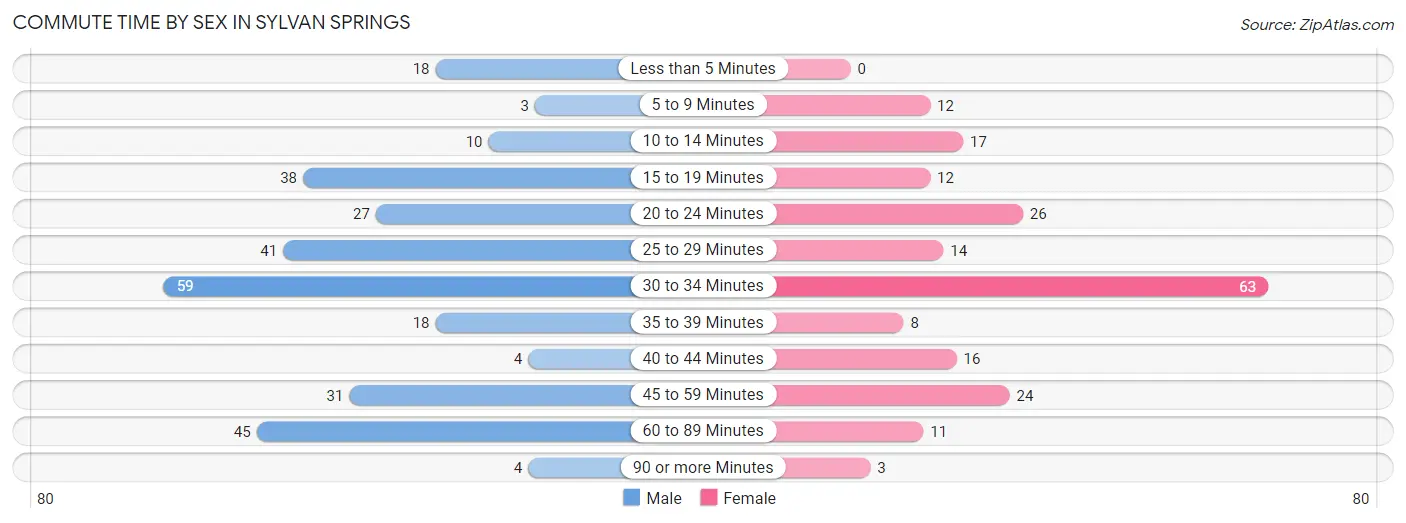
| Commute Time | Male | Female |
| Less than 5 Minutes | 18 (6.0%) | 0 (0.0%) |
| 5 to 9 Minutes | 3 (1.0%) | 12 (5.8%) |
| 10 to 14 Minutes | 10 (3.4%) | 17 (8.3%) |
| 15 to 19 Minutes | 38 (12.8%) | 12 (5.8%) |
| 20 to 24 Minutes | 27 (9.1%) | 26 (12.6%) |
| 25 to 29 Minutes | 41 (13.8%) | 14 (6.8%) |
| 30 to 34 Minutes | 59 (19.8%) | 63 (30.6%) |
| 35 to 39 Minutes | 18 (6.0%) | 8 (3.9%) |
| 40 to 44 Minutes | 4 (1.3%) | 16 (7.8%) |
| 45 to 59 Minutes | 31 (10.4%) | 24 (11.7%) |
| 60 to 89 Minutes | 45 (15.1%) | 11 (5.3%) |
| 90 or more Minutes | 4 (1.3%) | 3 (1.5%) |
Time of Departure to Work by Sex in Sylvan Springs
The most frequent times of departure to work in Sylvan Springs are 4:00 PM to 11:59 PM (70, 23.5%) for males and 6:30 AM to 6:59 AM (46, 22.3%) for females.
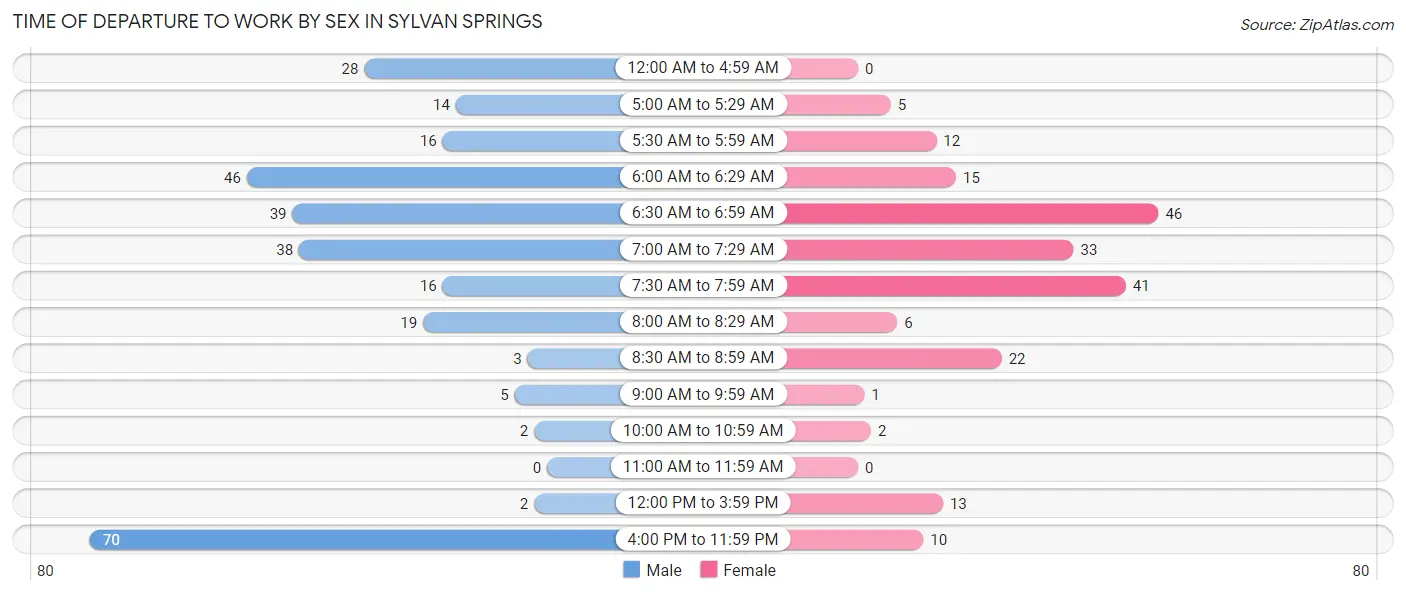
| Time of Departure | Male | Female |
| 12:00 AM to 4:59 AM | 28 (9.4%) | 0 (0.0%) |
| 5:00 AM to 5:29 AM | 14 (4.7%) | 5 (2.4%) |
| 5:30 AM to 5:59 AM | 16 (5.4%) | 12 (5.8%) |
| 6:00 AM to 6:29 AM | 46 (15.4%) | 15 (7.3%) |
| 6:30 AM to 6:59 AM | 39 (13.1%) | 46 (22.3%) |
| 7:00 AM to 7:29 AM | 38 (12.8%) | 33 (16.0%) |
| 7:30 AM to 7:59 AM | 16 (5.4%) | 41 (19.9%) |
| 8:00 AM to 8:29 AM | 19 (6.4%) | 6 (2.9%) |
| 8:30 AM to 8:59 AM | 3 (1.0%) | 22 (10.7%) |
| 9:00 AM to 9:59 AM | 5 (1.7%) | 1 (0.5%) |
| 10:00 AM to 10:59 AM | 2 (0.7%) | 2 (1.0%) |
| 11:00 AM to 11:59 AM | 0 (0.0%) | 0 (0.0%) |
| 12:00 PM to 3:59 PM | 2 (0.7%) | 13 (6.3%) |
| 4:00 PM to 11:59 PM | 70 (23.5%) | 10 (4.9%) |
| Total | 298 (100.0%) | 206 (100.0%) |
Housing Occupancy in Sylvan Springs
Occupancy by Ownership in Sylvan Springs
Of the total 551 dwellings in Sylvan Springs, owner-occupied units account for 482 (87.5%), while renter-occupied units make up 69 (12.5%).
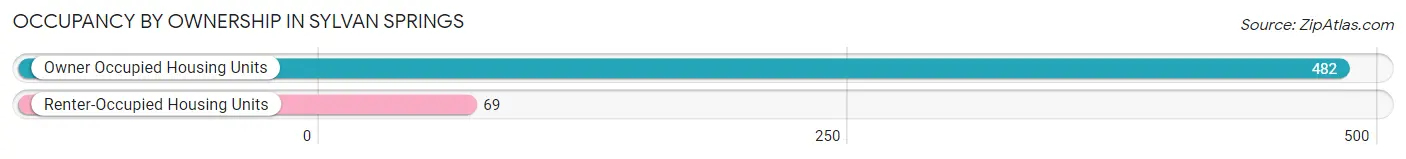
| Occupancy | # Housing Units | % Housing Units |
| Owner Occupied Housing Units | 482 | 87.5% |
| Renter-Occupied Housing Units | 69 | 12.5% |
| Total Occupied Housing Units | 551 | 100.0% |
Occupancy by Household Size in Sylvan Springs
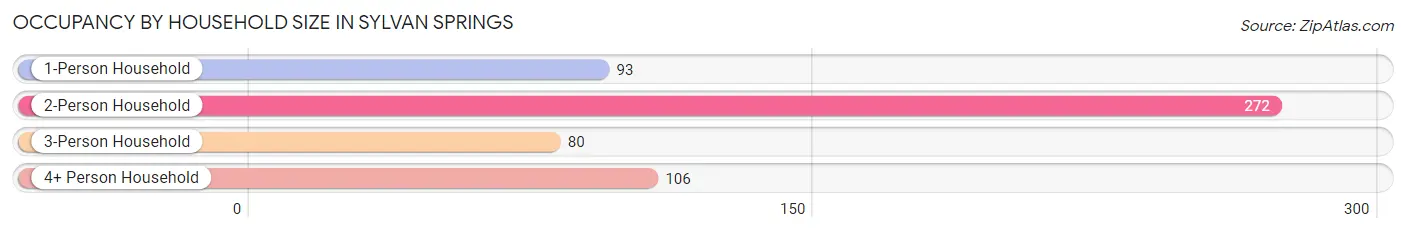
| Household Size | # Housing Units | % Housing Units |
| 1-Person Household | 93 | 16.9% |
| 2-Person Household | 272 | 49.4% |
| 3-Person Household | 80 | 14.5% |
| 4+ Person Household | 106 | 19.2% |
| Total Housing Units | 551 | 100.0% |
Occupancy by Ownership by Household Size in Sylvan Springs
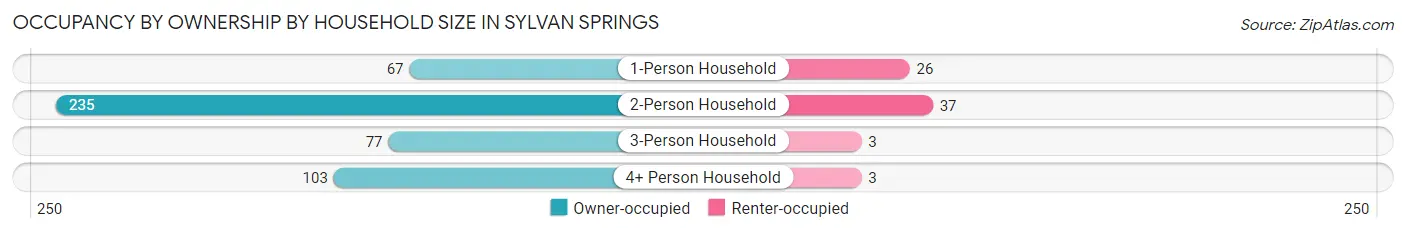
| Household Size | Owner-occupied | Renter-occupied |
| 1-Person Household | 67 (72.0%) | 26 (28.0%) |
| 2-Person Household | 235 (86.4%) | 37 (13.6%) |
| 3-Person Household | 77 (96.3%) | 3 (3.7%) |
| 4+ Person Household | 103 (97.2%) | 3 (2.8%) |
| Total Housing Units | 482 (87.5%) | 69 (12.5%) |
Occupancy by Educational Attainment in Sylvan Springs
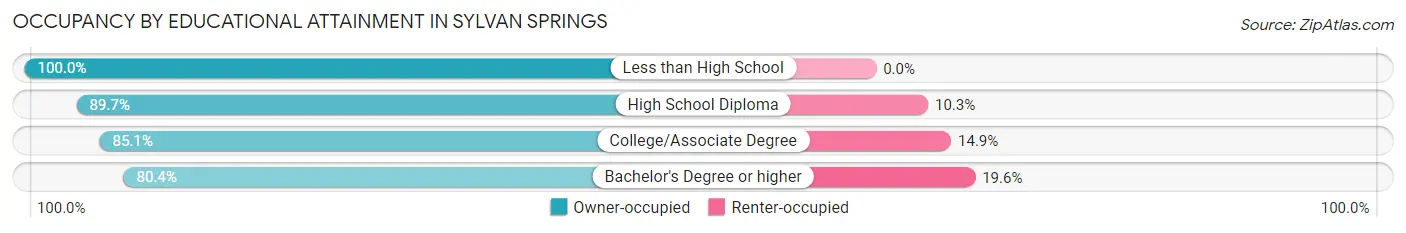
| Household Size | Owner-occupied | Renter-occupied |
| Less than High School | 42 (100.0%) | 0 (0.0%) |
| High School Diploma | 183 (89.7%) | 21 (10.3%) |
| College/Associate Degree | 212 (85.1%) | 37 (14.9%) |
| Bachelor's Degree or higher | 45 (80.4%) | 11 (19.6%) |
Occupancy by Age of Householder in Sylvan Springs
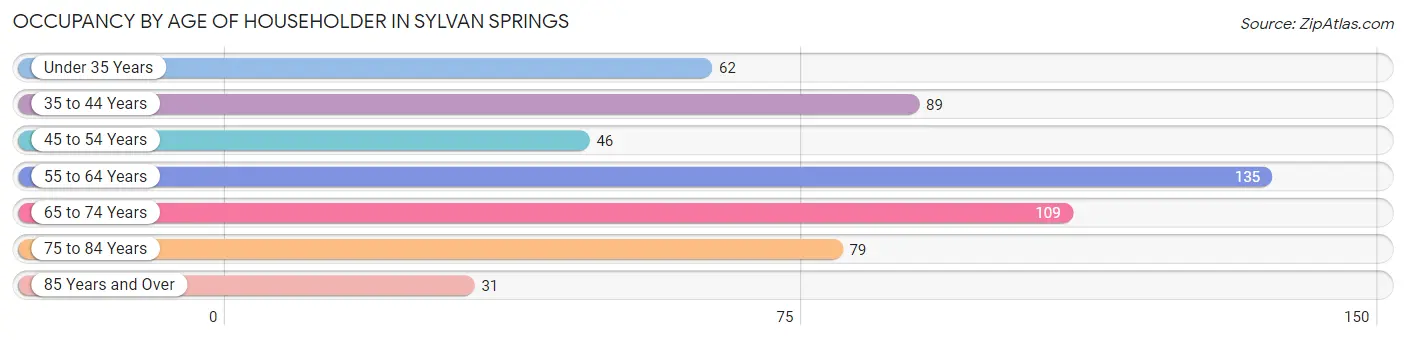
| Age Bracket | # Households | % Households |
| Under 35 Years | 62 | 11.3% |
| 35 to 44 Years | 89 | 16.2% |
| 45 to 54 Years | 46 | 8.4% |
| 55 to 64 Years | 135 | 24.5% |
| 65 to 74 Years | 109 | 19.8% |
| 75 to 84 Years | 79 | 14.3% |
| 85 Years and Over | 31 | 5.6% |
| Total | 551 | 100.0% |
Housing Finances in Sylvan Springs
Median Income by Occupancy in Sylvan Springs
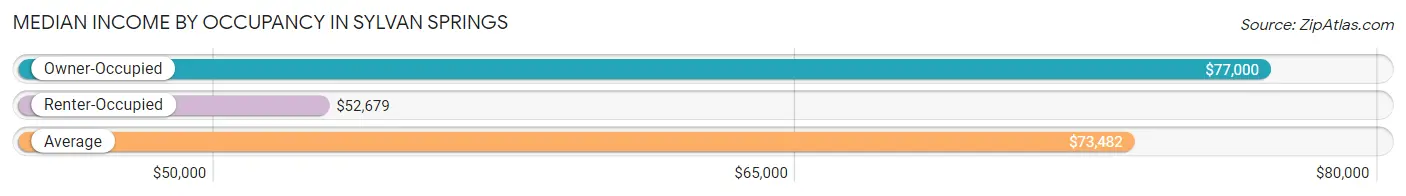
| Occupancy Type | # Households | Median Income |
| Owner-Occupied | 482 (87.5%) | $77,000 |
| Renter-Occupied | 69 (12.5%) | $52,679 |
| Average | 551 (100.0%) | $73,482 |
Occupancy by Householder Income Bracket in Sylvan Springs
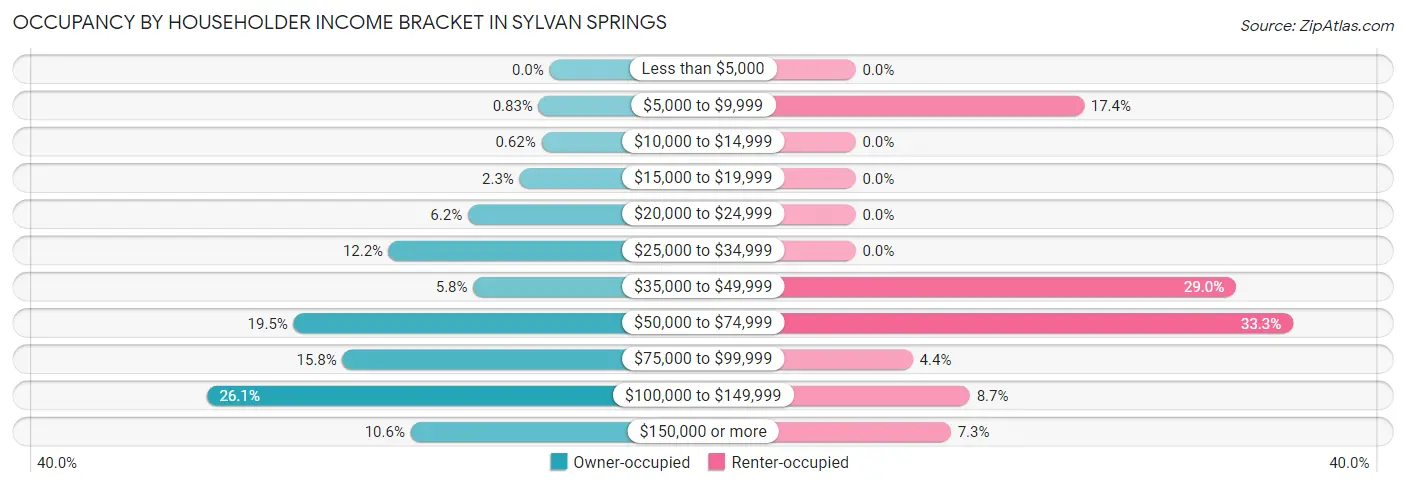
| Income Bracket | Owner-occupied | Renter-occupied |
| Less than $5,000 | 0 (0.0%) | 0 (0.0%) |
| $5,000 to $9,999 | 4 (0.8%) | 12 (17.4%) |
| $10,000 to $14,999 | 3 (0.6%) | 0 (0.0%) |
| $15,000 to $19,999 | 11 (2.3%) | 0 (0.0%) |
| $20,000 to $24,999 | 30 (6.2%) | 0 (0.0%) |
| $25,000 to $34,999 | 59 (12.2%) | 0 (0.0%) |
| $35,000 to $49,999 | 28 (5.8%) | 20 (29.0%) |
| $50,000 to $74,999 | 94 (19.5%) | 23 (33.3%) |
| $75,000 to $99,999 | 76 (15.8%) | 3 (4.3%) |
| $100,000 to $149,999 | 126 (26.1%) | 6 (8.7%) |
| $150,000 or more | 51 (10.6%) | 5 (7.2%) |
| Total | 482 (100.0%) | 69 (100.0%) |
Monthly Housing Cost Tiers in Sylvan Springs
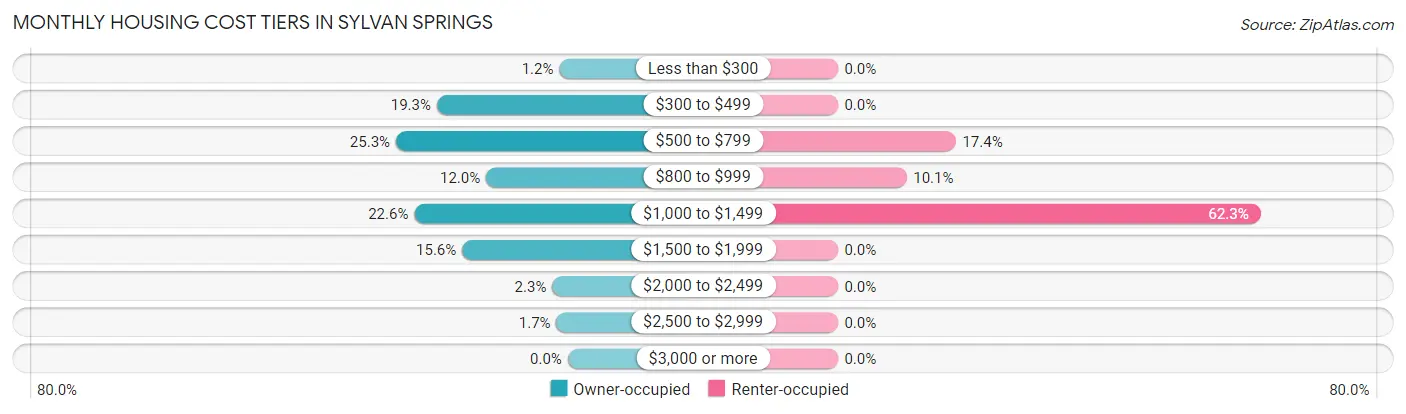
| Monthly Cost | Owner-occupied | Renter-occupied |
| Less than $300 | 6 (1.2%) | 0 (0.0%) |
| $300 to $499 | 93 (19.3%) | 0 (0.0%) |
| $500 to $799 | 122 (25.3%) | 12 (17.4%) |
| $800 to $999 | 58 (12.0%) | 7 (10.1%) |
| $1,000 to $1,499 | 109 (22.6%) | 43 (62.3%) |
| $1,500 to $1,999 | 75 (15.6%) | 0 (0.0%) |
| $2,000 to $2,499 | 11 (2.3%) | 0 (0.0%) |
| $2,500 to $2,999 | 8 (1.7%) | 0 (0.0%) |
| $3,000 or more | 0 (0.0%) | 0 (0.0%) |
| Total | 482 (100.0%) | 69 (100.0%) |
Physical Housing Characteristics in Sylvan Springs
Housing Structures in Sylvan Springs
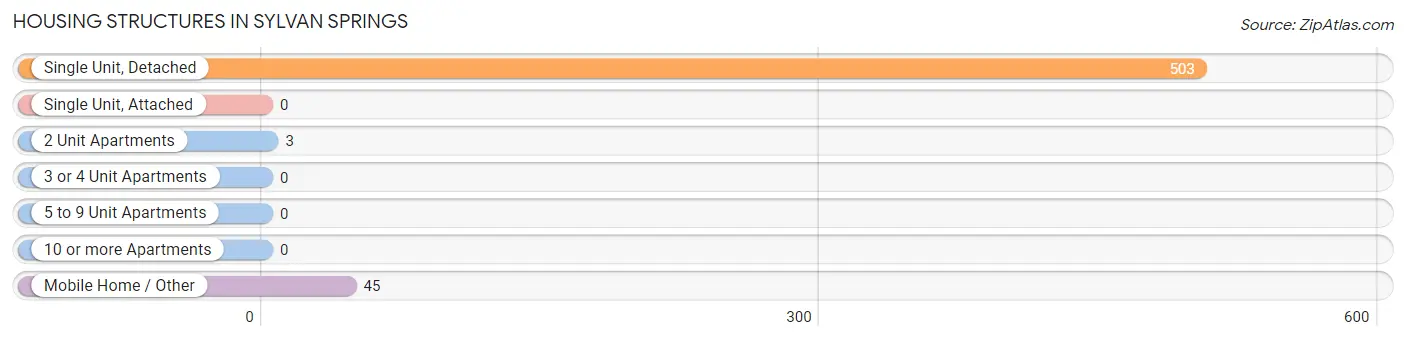
| Structure Type | # Housing Units | % Housing Units |
| Single Unit, Detached | 503 | 91.3% |
| Single Unit, Attached | 0 | 0.0% |
| 2 Unit Apartments | 3 | 0.5% |
| 3 or 4 Unit Apartments | 0 | 0.0% |
| 5 to 9 Unit Apartments | 0 | 0.0% |
| 10 or more Apartments | 0 | 0.0% |
| Mobile Home / Other | 45 | 8.2% |
| Total | 551 | 100.0% |
Housing Structures by Occupancy in Sylvan Springs
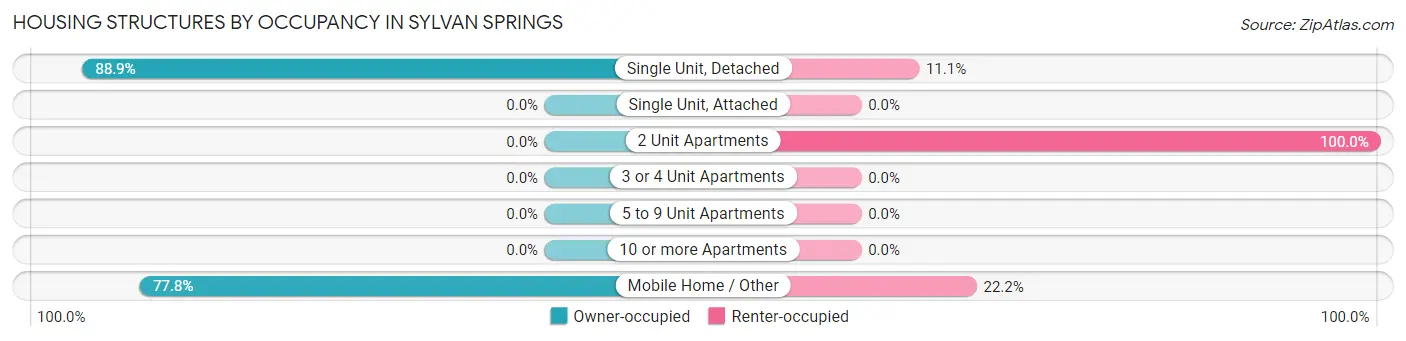
| Structure Type | Owner-occupied | Renter-occupied |
| Single Unit, Detached | 447 (88.9%) | 56 (11.1%) |
| Single Unit, Attached | 0 (0.0%) | 0 (0.0%) |
| 2 Unit Apartments | 0 (0.0%) | 3 (100.0%) |
| 3 or 4 Unit Apartments | 0 (0.0%) | 0 (0.0%) |
| 5 to 9 Unit Apartments | 0 (0.0%) | 0 (0.0%) |
| 10 or more Apartments | 0 (0.0%) | 0 (0.0%) |
| Mobile Home / Other | 35 (77.8%) | 10 (22.2%) |
| Total | 482 (87.5%) | 69 (12.5%) |
Housing Structures by Number of Rooms in Sylvan Springs
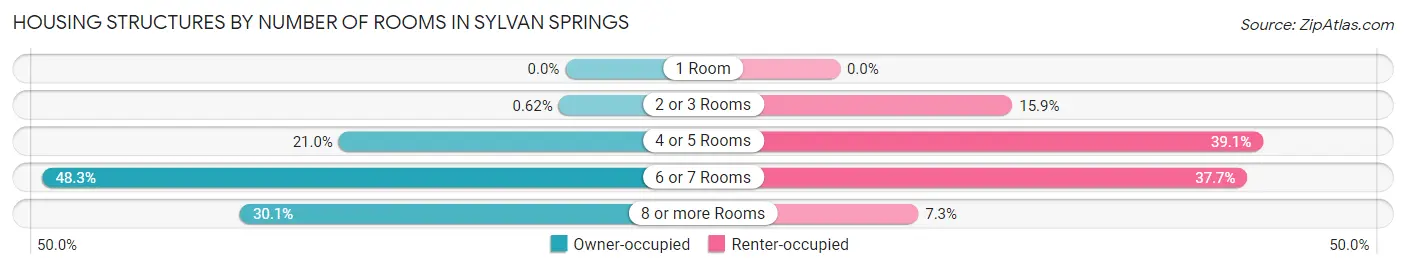
| Number of Rooms | Owner-occupied | Renter-occupied |
| 1 Room | 0 (0.0%) | 0 (0.0%) |
| 2 or 3 Rooms | 3 (0.6%) | 11 (15.9%) |
| 4 or 5 Rooms | 101 (20.9%) | 27 (39.1%) |
| 6 or 7 Rooms | 233 (48.3%) | 26 (37.7%) |
| 8 or more Rooms | 145 (30.1%) | 5 (7.2%) |
| Total | 482 (100.0%) | 69 (100.0%) |
Housing Structure by Heating Type in Sylvan Springs
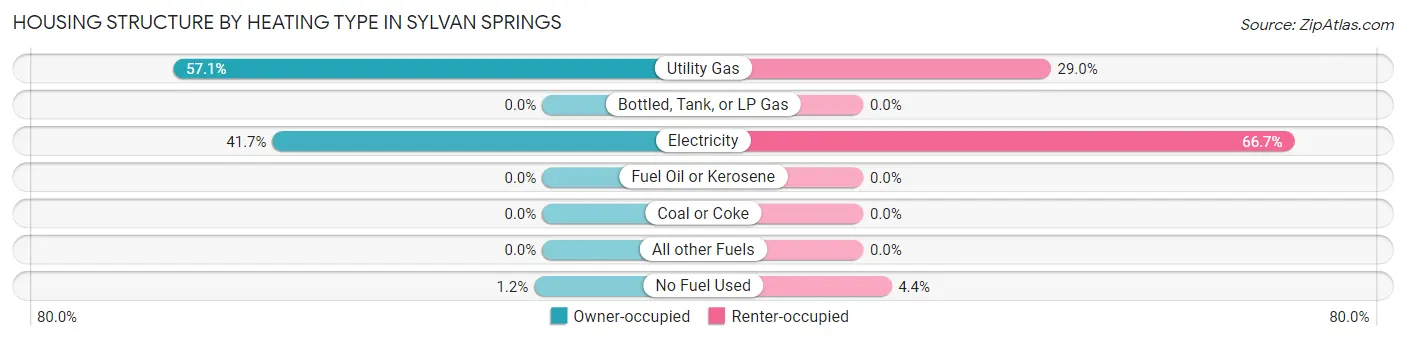
| Heating Type | Owner-occupied | Renter-occupied |
| Utility Gas | 275 (57.1%) | 20 (29.0%) |
| Bottled, Tank, or LP Gas | 0 (0.0%) | 0 (0.0%) |
| Electricity | 201 (41.7%) | 46 (66.7%) |
| Fuel Oil or Kerosene | 0 (0.0%) | 0 (0.0%) |
| Coal or Coke | 0 (0.0%) | 0 (0.0%) |
| All other Fuels | 0 (0.0%) | 0 (0.0%) |
| No Fuel Used | 6 (1.2%) | 3 (4.3%) |
| Total | 482 (100.0%) | 69 (100.0%) |
Household Vehicle Usage in Sylvan Springs
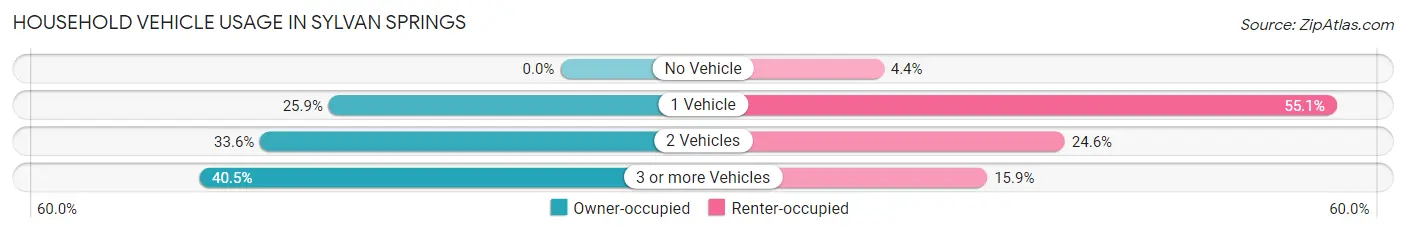
| Vehicles per Household | Owner-occupied | Renter-occupied |
| No Vehicle | 0 (0.0%) | 3 (4.3%) |
| 1 Vehicle | 125 (25.9%) | 38 (55.1%) |
| 2 Vehicles | 162 (33.6%) | 17 (24.6%) |
| 3 or more Vehicles | 195 (40.5%) | 11 (15.9%) |
| Total | 482 (100.0%) | 69 (100.0%) |
Real Estate & Mortgages in Sylvan Springs
Real Estate and Mortgage Overview in Sylvan Springs
| Characteristic | Without Mortgage | With Mortgage |
| Housing Units | 226 | 256 |
| Median Property Value | $190,500 | $193,800 |
| Median Household Income | $64,375 | $38 |
| Monthly Housing Costs | $529 | $0 |
| Real Estate Taxes | $920 | $34 |
Property Value by Mortgage Status in Sylvan Springs
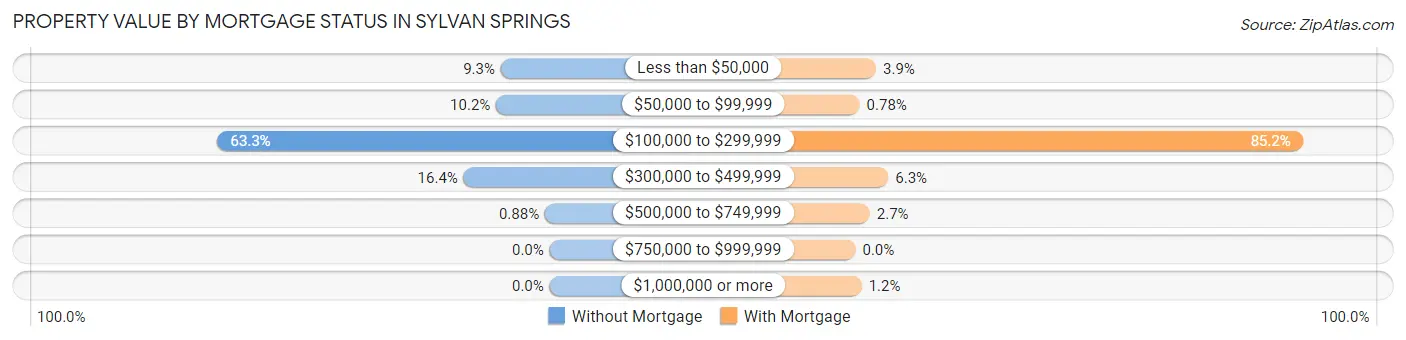
| Property Value | Without Mortgage | With Mortgage |
| Less than $50,000 | 21 (9.3%) | 10 (3.9%) |
| $50,000 to $99,999 | 23 (10.2%) | 2 (0.8%) |
| $100,000 to $299,999 | 143 (63.3%) | 218 (85.2%) |
| $300,000 to $499,999 | 37 (16.4%) | 16 (6.2%) |
| $500,000 to $749,999 | 2 (0.9%) | 7 (2.7%) |
| $750,000 to $999,999 | 0 (0.0%) | 0 (0.0%) |
| $1,000,000 or more | 0 (0.0%) | 3 (1.2%) |
| Total | 226 (100.0%) | 256 (100.0%) |
Household Income by Mortgage Status in Sylvan Springs
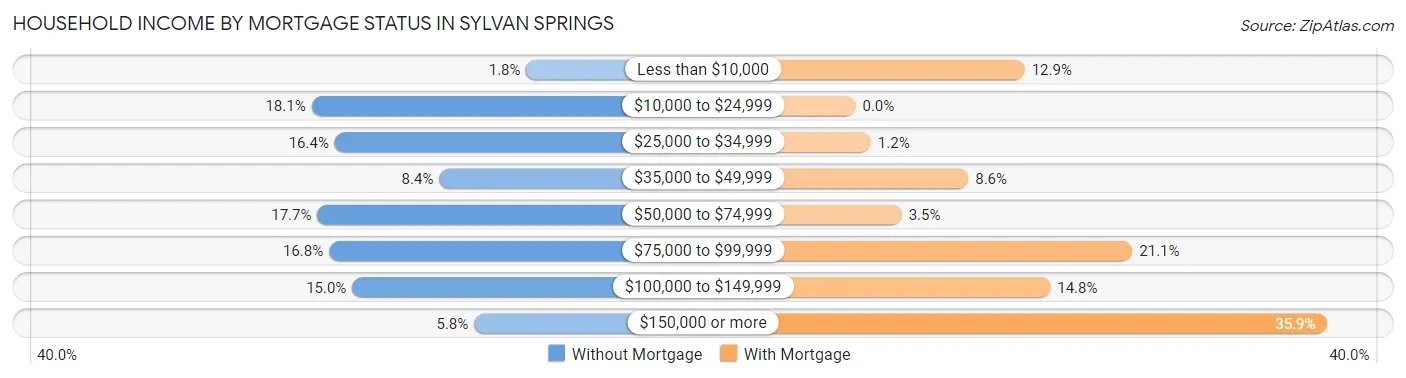
| Household Income | Without Mortgage | With Mortgage |
| Less than $10,000 | 4 (1.8%) | 33 (12.9%) |
| $10,000 to $24,999 | 41 (18.1%) | 0 (0.0%) |
| $25,000 to $34,999 | 37 (16.4%) | 3 (1.2%) |
| $35,000 to $49,999 | 19 (8.4%) | 22 (8.6%) |
| $50,000 to $74,999 | 40 (17.7%) | 9 (3.5%) |
| $75,000 to $99,999 | 38 (16.8%) | 54 (21.1%) |
| $100,000 to $149,999 | 34 (15.0%) | 38 (14.8%) |
| $150,000 or more | 13 (5.8%) | 92 (35.9%) |
| Total | 226 (100.0%) | 256 (100.0%) |
Property Value to Household Income Ratio in Sylvan Springs
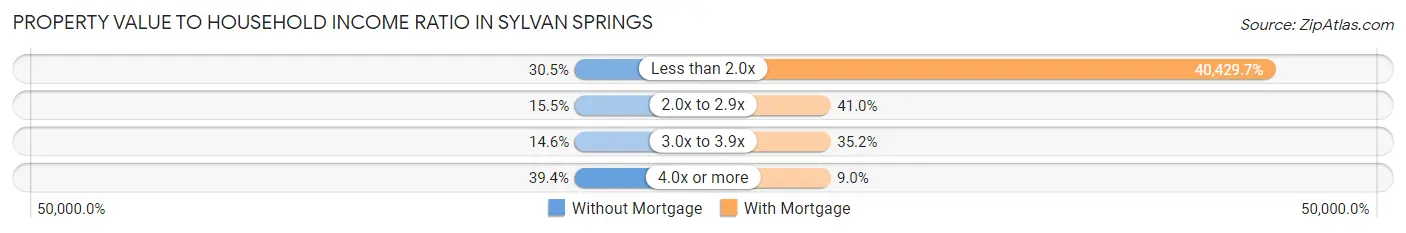
| Value-to-Income Ratio | Without Mortgage | With Mortgage |
| Less than 2.0x | 69 (30.5%) | 103,500 (40,429.7%) |
| 2.0x to 2.9x | 35 (15.5%) | 105 (41.0%) |
| 3.0x to 3.9x | 33 (14.6%) | 90 (35.2%) |
| 4.0x or more | 89 (39.4%) | 23 (9.0%) |
| Total | 226 (100.0%) | 256 (100.0%) |
Real Estate Taxes by Mortgage Status in Sylvan Springs
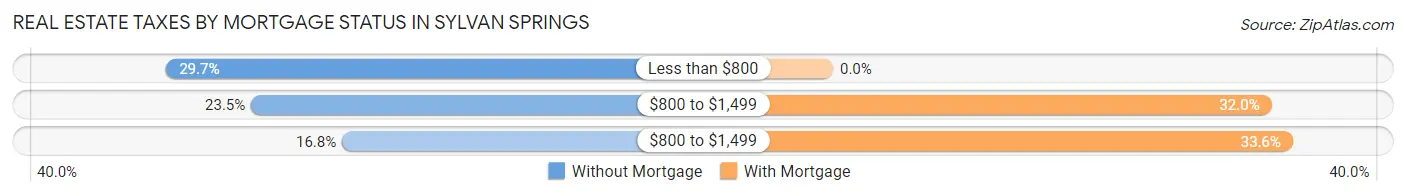
| Property Taxes | Without Mortgage | With Mortgage |
| Less than $800 | 67 (29.6%) | 0 (0.0%) |
| $800 to $1,499 | 53 (23.4%) | 82 (32.0%) |
| $800 to $1,499 | 38 (16.8%) | 86 (33.6%) |
| Total | 226 (100.0%) | 256 (100.0%) |
Health & Disability in Sylvan Springs
Health Insurance Coverage by Age in Sylvan Springs
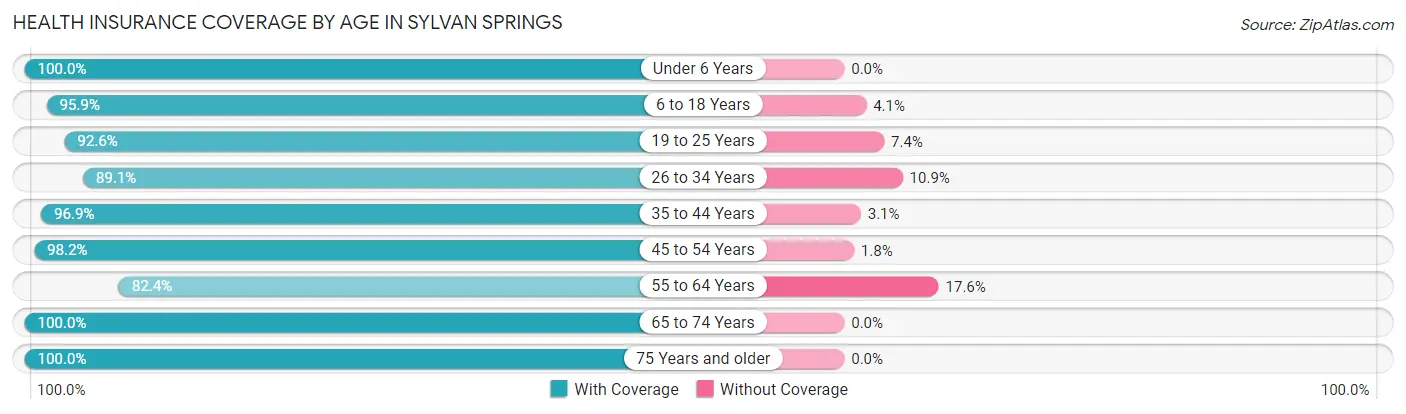
| Age Bracket | With Coverage | Without Coverage |
| Under 6 Years | 92 (100.0%) | 0 (0.0%) |
| 6 to 18 Years | 258 (95.9%) | 11 (4.1%) |
| 19 to 25 Years | 137 (92.6%) | 11 (7.4%) |
| 26 to 34 Years | 131 (89.1%) | 16 (10.9%) |
| 35 to 44 Years | 189 (96.9%) | 6 (3.1%) |
| 45 to 54 Years | 110 (98.2%) | 2 (1.8%) |
| 55 to 64 Years | 178 (82.4%) | 38 (17.6%) |
| 65 to 74 Years | 156 (100.0%) | 0 (0.0%) |
| 75 Years and older | 186 (100.0%) | 0 (0.0%) |
| Total | 1,437 (94.5%) | 84 (5.5%) |
Health Insurance Coverage by Citizenship Status in Sylvan Springs
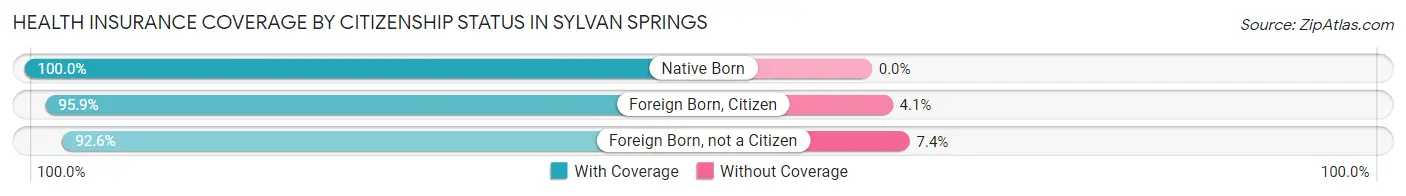
| Citizenship Status | With Coverage | Without Coverage |
| Native Born | 92 (100.0%) | 0 (0.0%) |
| Foreign Born, Citizen | 258 (95.9%) | 11 (4.1%) |
| Foreign Born, not a Citizen | 137 (92.6%) | 11 (7.4%) |
Health Insurance Coverage by Household Income in Sylvan Springs
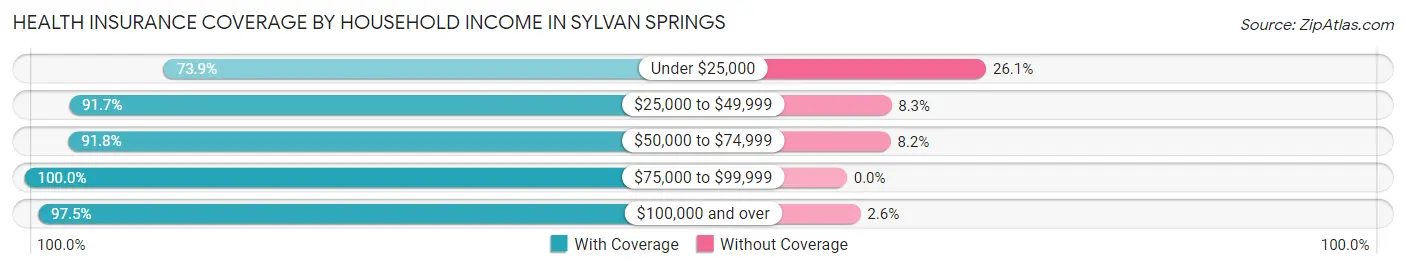
| Household Income | With Coverage | Without Coverage |
| Under $25,000 | 68 (73.9%) | 24 (26.1%) |
| $25,000 to $49,999 | 187 (91.7%) | 17 (8.3%) |
| $50,000 to $74,999 | 291 (91.8%) | 26 (8.2%) |
| $75,000 to $99,999 | 241 (100.0%) | 0 (0.0%) |
| $100,000 and over | 650 (97.5%) | 17 (2.5%) |
Public vs Private Health Insurance Coverage by Age in Sylvan Springs
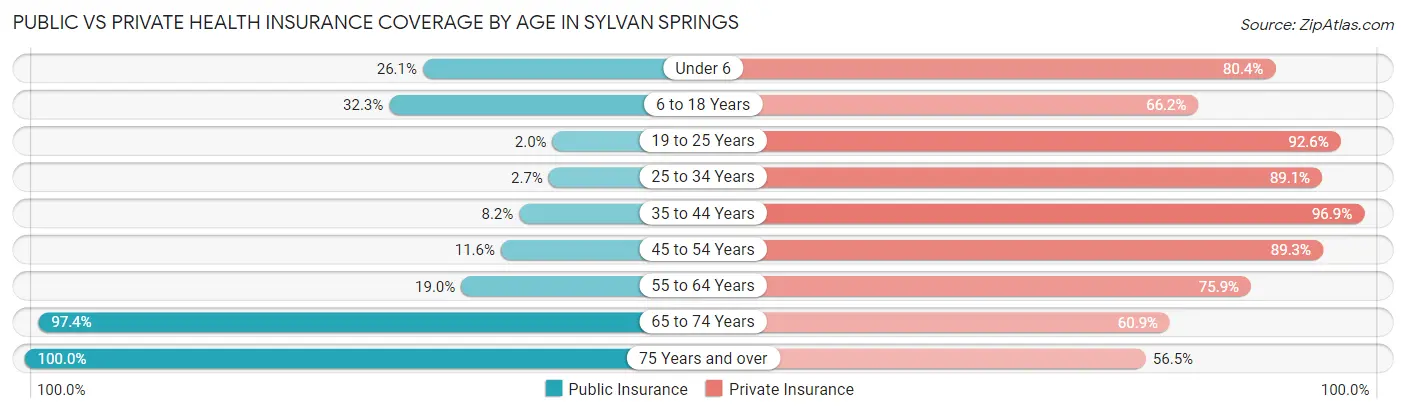
| Age Bracket | Public Insurance | Private Insurance |
| Under 6 | 24 (26.1%) | 74 (80.4%) |
| 6 to 18 Years | 87 (32.3%) | 178 (66.2%) |
| 19 to 25 Years | 3 (2.0%) | 137 (92.6%) |
| 25 to 34 Years | 4 (2.7%) | 131 (89.1%) |
| 35 to 44 Years | 16 (8.2%) | 189 (96.9%) |
| 45 to 54 Years | 13 (11.6%) | 100 (89.3%) |
| 55 to 64 Years | 41 (19.0%) | 164 (75.9%) |
| 65 to 74 Years | 152 (97.4%) | 95 (60.9%) |
| 75 Years and over | 186 (100.0%) | 105 (56.5%) |
| Total | 526 (34.6%) | 1,173 (77.1%) |
Disability Status by Sex by Age in Sylvan Springs
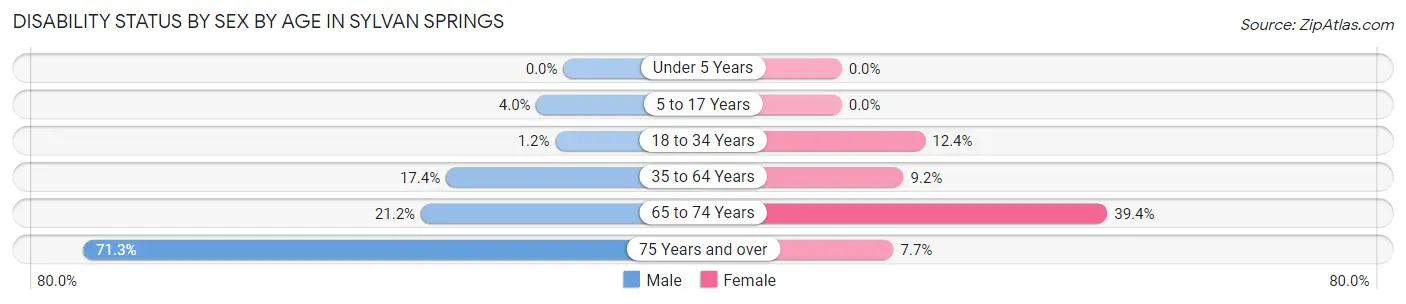
| Age Bracket | Male | Female |
| Under 5 Years | 0 (0.0%) | 0 (0.0%) |
| 5 to 17 Years | 5 (4.0%) | 0 (0.0%) |
| 18 to 34 Years | 2 (1.2%) | 17 (12.4%) |
| 35 to 64 Years | 57 (17.4%) | 18 (9.2%) |
| 65 to 74 Years | 11 (21.1%) | 41 (39.4%) |
| 75 Years and over | 77 (71.3%) | 6 (7.7%) |
Disability Class by Sex by Age in Sylvan Springs
Disability Class: Hearing Difficulty
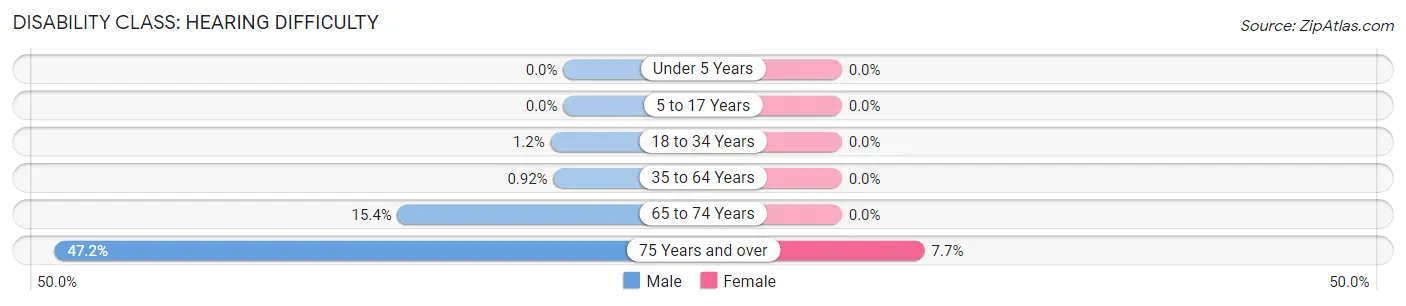
| Age Bracket | Male | Female |
| Under 5 Years | 0 (0.0%) | 0 (0.0%) |
| 5 to 17 Years | 0 (0.0%) | 0 (0.0%) |
| 18 to 34 Years | 2 (1.2%) | 0 (0.0%) |
| 35 to 64 Years | 3 (0.9%) | 0 (0.0%) |
| 65 to 74 Years | 8 (15.4%) | 0 (0.0%) |
| 75 Years and over | 51 (47.2%) | 6 (7.7%) |
Disability Class: Vision Difficulty
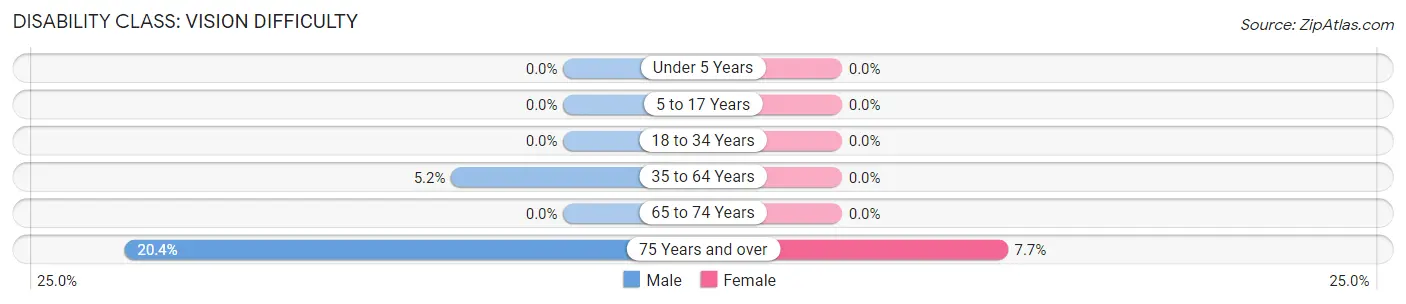
| Age Bracket | Male | Female |
| Under 5 Years | 0 (0.0%) | 0 (0.0%) |
| 5 to 17 Years | 0 (0.0%) | 0 (0.0%) |
| 18 to 34 Years | 0 (0.0%) | 0 (0.0%) |
| 35 to 64 Years | 17 (5.2%) | 0 (0.0%) |
| 65 to 74 Years | 0 (0.0%) | 0 (0.0%) |
| 75 Years and over | 22 (20.4%) | 6 (7.7%) |
Disability Class: Cognitive Difficulty
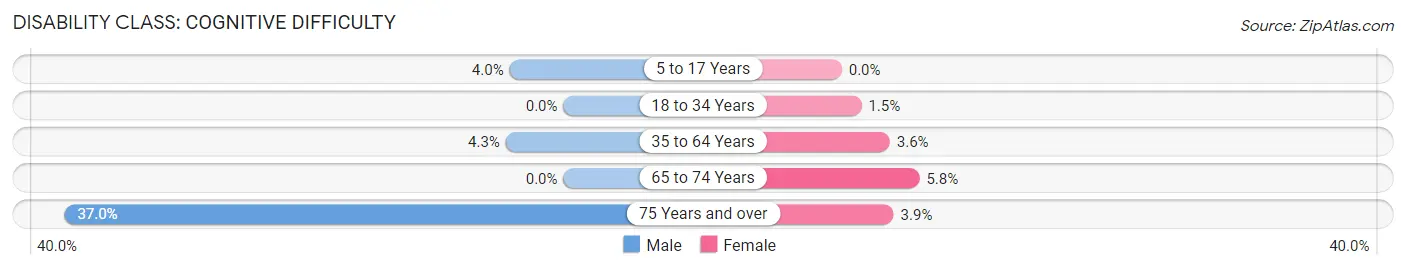
| Age Bracket | Male | Female |
| 5 to 17 Years | 5 (4.0%) | 0 (0.0%) |
| 18 to 34 Years | 0 (0.0%) | 2 (1.5%) |
| 35 to 64 Years | 14 (4.3%) | 7 (3.6%) |
| 65 to 74 Years | 0 (0.0%) | 6 (5.8%) |
| 75 Years and over | 40 (37.0%) | 3 (3.8%) |
Disability Class: Ambulatory Difficulty
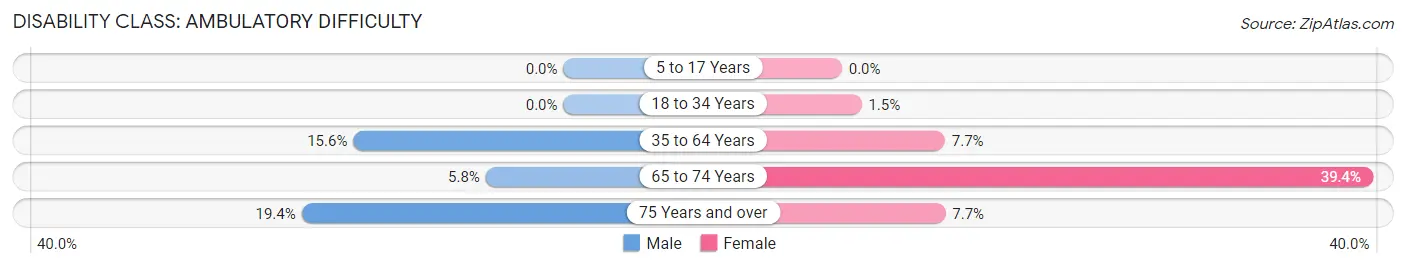
| Age Bracket | Male | Female |
| 5 to 17 Years | 0 (0.0%) | 0 (0.0%) |
| 18 to 34 Years | 0 (0.0%) | 2 (1.5%) |
| 35 to 64 Years | 51 (15.6%) | 15 (7.6%) |
| 65 to 74 Years | 3 (5.8%) | 41 (39.4%) |
| 75 Years and over | 21 (19.4%) | 6 (7.7%) |
Disability Class: Self-Care Difficulty
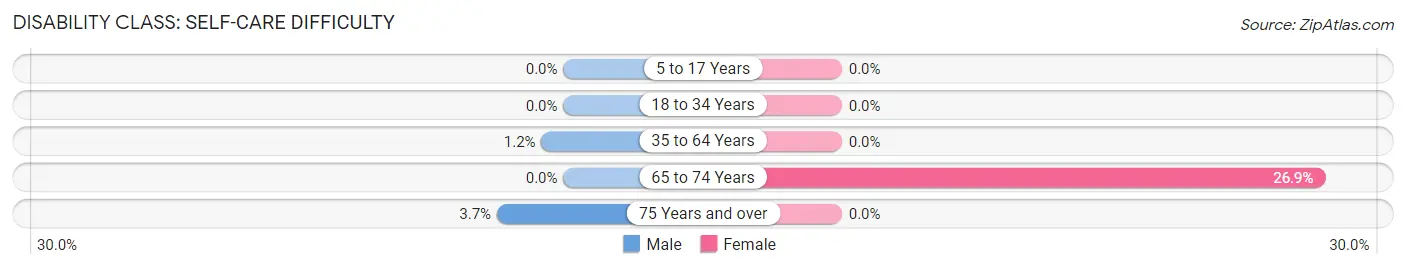
| Age Bracket | Male | Female |
| 5 to 17 Years | 0 (0.0%) | 0 (0.0%) |
| 18 to 34 Years | 0 (0.0%) | 0 (0.0%) |
| 35 to 64 Years | 4 (1.2%) | 0 (0.0%) |
| 65 to 74 Years | 0 (0.0%) | 28 (26.9%) |
| 75 Years and over | 4 (3.7%) | 0 (0.0%) |
Technology Access in Sylvan Springs
Computing Device Access in Sylvan Springs
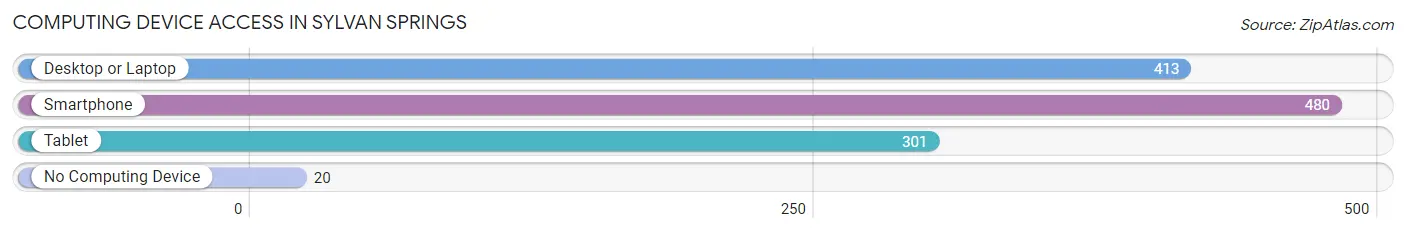
| Device Type | # Households | % Households |
| Desktop or Laptop | 413 | 75.0% |
| Smartphone | 480 | 87.1% |
| Tablet | 301 | 54.6% |
| No Computing Device | 20 | 3.6% |
| Total | 551 | 100.0% |
Internet Access in Sylvan Springs
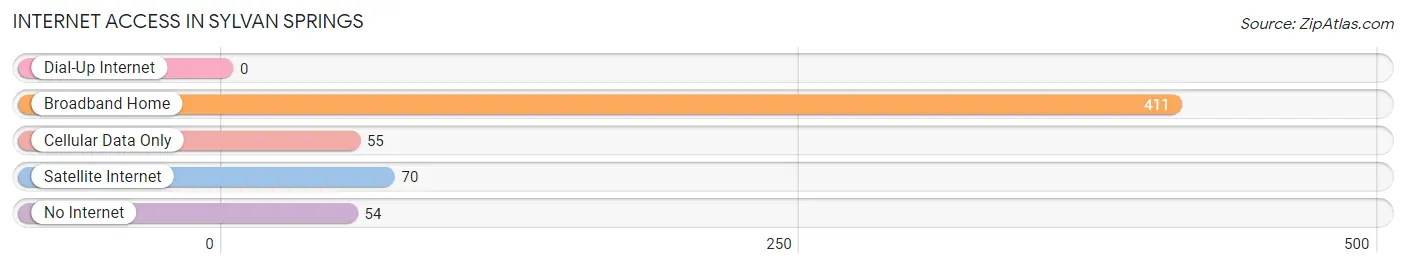
| Internet Type | # Households | % Households |
| Dial-Up Internet | 0 | 0.0% |
| Broadband Home | 411 | 74.6% |
| Cellular Data Only | 55 | 10.0% |
| Satellite Internet | 70 | 12.7% |
| No Internet | 54 | 9.8% |
| Total | 551 | 100.0% |
Sylvan Springs Summary
Sylvan Springs is a small unincorporated community located in Jefferson County, Alabama. It is situated approximately 15 miles northwest of Birmingham and is part of the Birmingham-Hoover Metropolitan Statistical Area. The population of Sylvan Springs was estimated to be 1,845 in 2019.
History
Sylvan Springs was founded in 1887 by the Reverend William H. Sylvester, a Methodist minister. He named the town after his daughter, Sylvan. The town was originally a farming community, but it soon developed into a small industrial center. The first industry in the area was a cotton mill, which was built in 1891. The mill was later replaced by a brick factory, which operated until the 1950s.
In the early 1900s, the town was home to a number of businesses, including a general store, a blacksmith shop, a grist mill, and a sawmill. The town also had a post office, which opened in 1902.
Geography
Sylvan Springs is located in the foothills of the Appalachian Mountains. The town is situated at an elevation of 845 feet above sea level. The terrain is mostly hilly, with some flat areas. The town is located in the watershed of the Black Warrior River.
The climate in Sylvan Springs is humid subtropical, with hot, humid summers and mild winters. The average annual temperature is 64°F, and the average annual precipitation is 56 inches.
Economy
The economy of Sylvan Springs is largely based on agriculture. The town is home to several farms, which produce a variety of crops, including corn, soybeans, and cotton. The town also has a number of small businesses, including restaurants, convenience stores, and auto repair shops.
Demographics
As of the 2010 census, the population of Sylvan Springs was 1,717. The racial makeup of the town was 79.3% White, 17.2% African American, 0.3% Native American, 0.2% Asian, 0.1% Pacific Islander, and 2.9% from other races. The median household income was $37,917, and the median family income was $45,938.
The town is served by the Jefferson County School System. The town has one elementary school, one middle school, and one high school. The town also has a public library.
Conclusion
Sylvan Springs is a small unincorporated community located in Jefferson County, Alabama. It is situated approximately 15 miles northwest of Birmingham and is part of the Birmingham-Hoover Metropolitan Statistical Area. The population of Sylvan Springs was estimated to be 1,845 in 2019. The town is largely agricultural, with some small businesses. The racial makeup of the town is mostly White, with a significant African American population. The median household income is $37,917, and the median family income is $45,938. The town is served by the Jefferson County School System and has a public library.
Common Questions
What is Per Capita Income in Sylvan Springs?
Per Capita income in Sylvan Springs is $30,292.
What is the Median Family Income in Sylvan Springs?
Median Family Income in Sylvan Springs is $85,714.
What is the Median Household income in Sylvan Springs?
Median Household Income in Sylvan Springs is $73,482.
What is Income or Wage Gap in Sylvan Springs?
Income or Wage Gap in Sylvan Springs is 41.6%.
Women in Sylvan Springs earn 58.4 cents for every dollar earned by a man.
What is Inequality or Gini Index in Sylvan Springs?
Inequality or Gini Index in Sylvan Springs is 0.34.
What is the Total Population of Sylvan Springs?
Total Population of Sylvan Springs is 1,521.
What is the Total Male Population of Sylvan Springs?
Total Male Population of Sylvan Springs is 837.
What is the Total Female Population of Sylvan Springs?
Total Female Population of Sylvan Springs is 684.
What is the Ratio of Males per 100 Females in Sylvan Springs?
There are 122.37 Males per 100 Females in Sylvan Springs.
What is the Ratio of Females per 100 Males in Sylvan Springs?
There are 81.72 Females per 100 Males in Sylvan Springs.
What is the Median Population Age in Sylvan Springs?
Median Population Age in Sylvan Springs is 40.7 Years.
What is the Average Family Size in Sylvan Springs
Average Family Size in Sylvan Springs is 3.1 People.
What is the Average Household Size in Sylvan Springs
Average Household Size in Sylvan Springs is 2.8 People.
How Large is the Labor Force in Sylvan Springs?
There are 633 People in the Labor Forcein in Sylvan Springs.
What is the Percentage of People in the Labor Force in Sylvan Springs?
51.6% of People are in the Labor Force in Sylvan Springs.
What is the Unemployment Rate in Sylvan Springs?
Unemployment Rate in Sylvan Springs is 8.2%.