Sterrett, AL Map & Demographics
Sterrett Map
Sterrett Overview
$27,523
PER CAPITA INCOME
$61,250
AVG FAMILY INCOME
$58,594
AVG HOUSEHOLD INCOME
45.9%
WAGE / INCOME GAP [ % ]
54.1¢/ $1
WAGE / INCOME GAP [ $ ]
0.40
INEQUALITY / GINI INDEX
733
TOTAL POPULATION
421
MALE POPULATION
312
FEMALE POPULATION
134.94
MALES / 100 FEMALES
74.11
FEMALES / 100 MALES
49.7
MEDIAN AGE
3.1
AVG FAMILY SIZE
2.4
AVG HOUSEHOLD SIZE
377
LABOR FORCE [ PEOPLE ]
59.7%
PERCENT IN LABOR FORCE
13.3%
UNEMPLOYMENT RATE
Sterrett Zip Codes
Sterrett Area Codes
Income in Sterrett
Income Overview in Sterrett
Per Capita Income in Sterrett is $27,523, while median incomes of families and households are $61,250 and $58,594 respectively.
| Characteristic | Number | Measure |
| Per Capita Income | 733 | $27,523 |
| Median Family Income | 186 | $61,250 |
| Mean Family Income | 186 | $72,275 |
| Median Household Income | 309 | $58,594 |
| Mean Household Income | 309 | $62,994 |
| Income Deficit | 186 | $0 |
| Wage / Income Gap (%) | 733 | 45.91% |
| Wage / Income Gap ($) | 733 | 54.09¢ per $1 |
| Gini / Inequality Index | 733 | 0.40 |
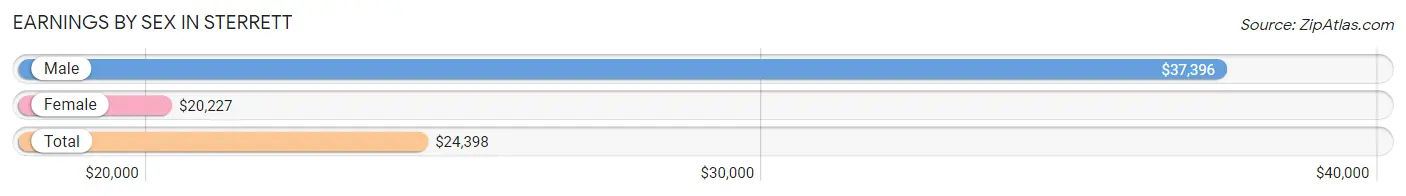
Earnings by Sex in Sterrett
Average Earnings in Sterrett are $24,398, $37,396 for men and $20,227 for women, a difference of 45.9%.
| Sex | Number | Average Earnings |
| Male | 203 (53.8%) | $37,396 |
| Female | 174 (46.2%) | $20,227 |
| Total | 377 (100.0%) | $24,398 |
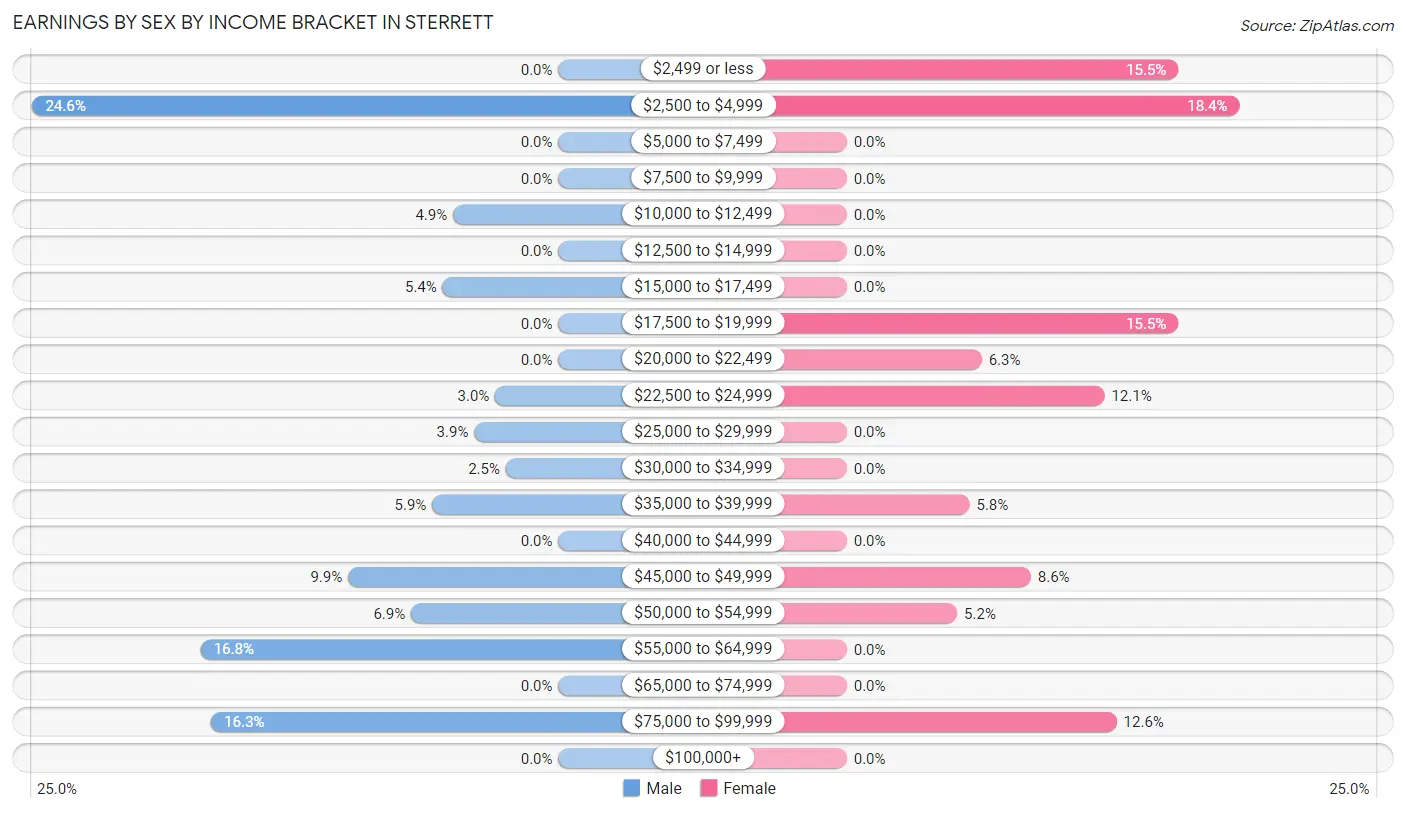
Earnings by Sex by Income Bracket in Sterrett
The most common earnings brackets in Sterrett are $2,500 to $4,999 for men (50 | 24.6%) and $2,500 to $4,999 for women (32 | 18.4%).
| Income | Male | Female |
| $2,499 or less | 0 (0.0%) | 27 (15.5%) |
| $2,500 to $4,999 | 50 (24.6%) | 32 (18.4%) |
| $5,000 to $7,499 | 0 (0.0%) | 0 (0.0%) |
| $7,500 to $9,999 | 0 (0.0%) | 0 (0.0%) |
| $10,000 to $12,499 | 10 (4.9%) | 0 (0.0%) |
| $12,500 to $14,999 | 0 (0.0%) | 0 (0.0%) |
| $15,000 to $17,499 | 11 (5.4%) | 0 (0.0%) |
| $17,500 to $19,999 | 0 (0.0%) | 27 (15.5%) |
| $20,000 to $22,499 | 0 (0.0%) | 11 (6.3%) |
| $22,500 to $24,999 | 6 (3.0%) | 21 (12.1%) |
| $25,000 to $29,999 | 8 (3.9%) | 0 (0.0%) |
| $30,000 to $34,999 | 5 (2.5%) | 0 (0.0%) |
| $35,000 to $39,999 | 12 (5.9%) | 10 (5.8%) |
| $40,000 to $44,999 | 0 (0.0%) | 0 (0.0%) |
| $45,000 to $49,999 | 20 (9.9%) | 15 (8.6%) |
| $50,000 to $54,999 | 14 (6.9%) | 9 (5.2%) |
| $55,000 to $64,999 | 34 (16.8%) | 0 (0.0%) |
| $65,000 to $74,999 | 0 (0.0%) | 0 (0.0%) |
| $75,000 to $99,999 | 33 (16.3%) | 22 (12.6%) |
| $100,000+ | 0 (0.0%) | 0 (0.0%) |
| Total | 203 (100.0%) | 174 (100.0%) |
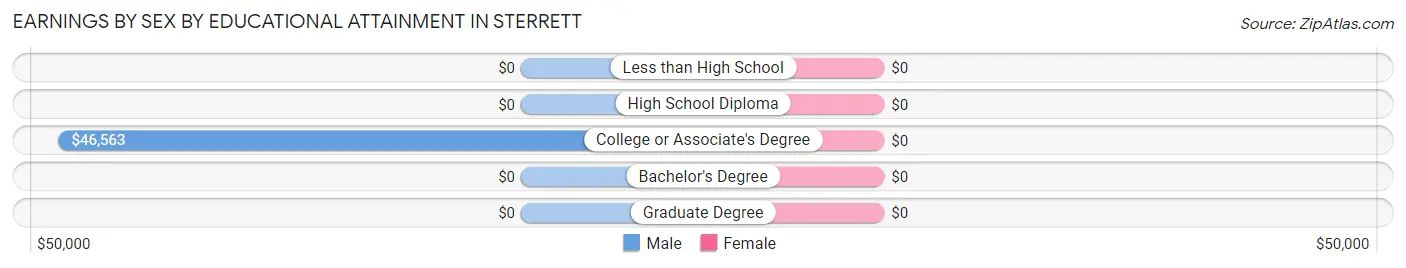
Earnings by Sex by Educational Attainment in Sterrett
| Educational Attainment | Male Income | Female Income |
| Less than High School | - | - |
| High School Diploma | - | - |
| College or Associate's Degree | $46,563 | $0 |
| Bachelor's Degree | - | - |
| Graduate Degree | - | - |
| Total | $54,018 | $22,500 |
Family Income in Sterrett
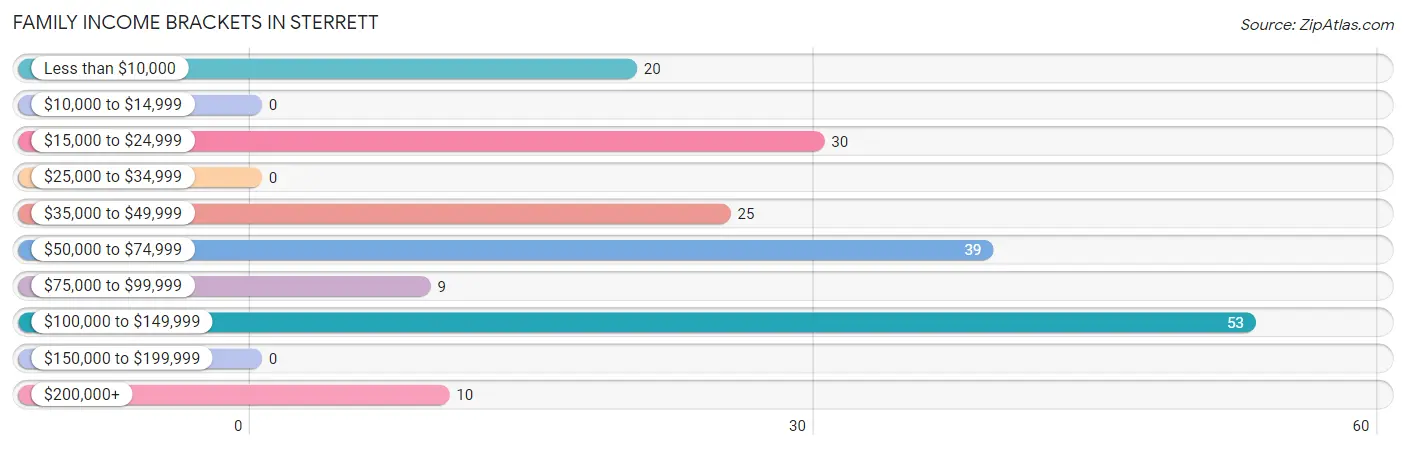
Family Income Brackets in Sterrett
According to the Sterrett family income data, there are 53 families falling into the $100,000 to $149,999 income range, which is the most common income bracket and makes up 28.5% of all families.
| Income Bracket | # Families | % Families |
| Less than $10,000 | 20 | 10.8% |
| $10,000 to $14,999 | 0 | 0.0% |
| $15,000 to $24,999 | 30 | 16.1% |
| $25,000 to $34,999 | 0 | 0.0% |
| $35,000 to $49,999 | 25 | 13.4% |
| $50,000 to $74,999 | 39 | 21.0% |
| $75,000 to $99,999 | 9 | 4.8% |
| $100,000 to $149,999 | 53 | 28.5% |
| $150,000 to $199,999 | 0 | 0.0% |
| $200,000+ | 10 | 5.4% |
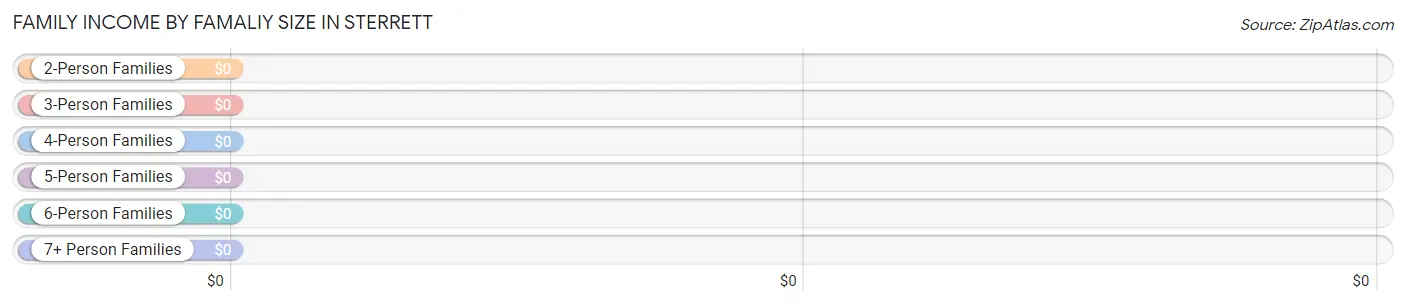
Family Income by Famaliy Size in Sterrett
| Income Bracket | # Families | Median Income |
| 2-Person Families | 112 (60.2%) | $0 |
| 3-Person Families | 49 (26.3%) | $0 |
| 4-Person Families | 7 (3.8%) | $0 |
| 5-Person Families | 0 (0.0%) | $0 |
| 6-Person Families | 0 (0.0%) | $0 |
| 7+ Person Families | 18 (9.7%) | $0 |
| Total | 186 (100.0%) | $61,250 |
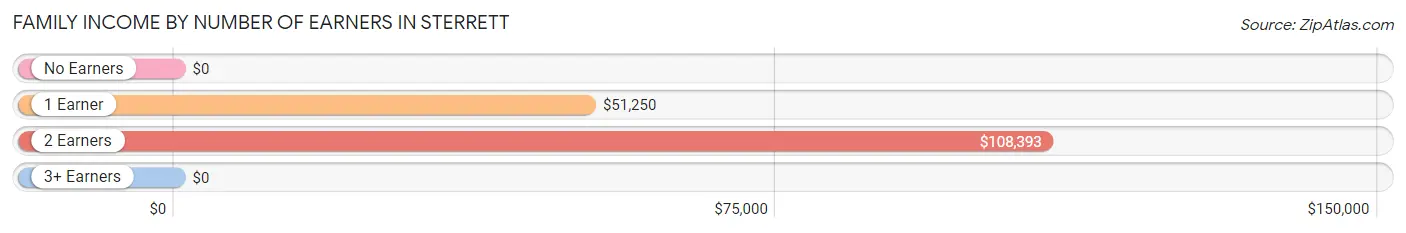
Family Income by Number of Earners in Sterrett
| Number of Earners | # Families | Median Income |
| No Earners | 31 (16.7%) | $0 |
| 1 Earner | 104 (55.9%) | $51,250 |
| 2 Earners | 33 (17.7%) | $108,393 |
| 3+ Earners | 18 (9.7%) | $0 |
| Total | 186 (100.0%) | $61,250 |
Household Income in Sterrett
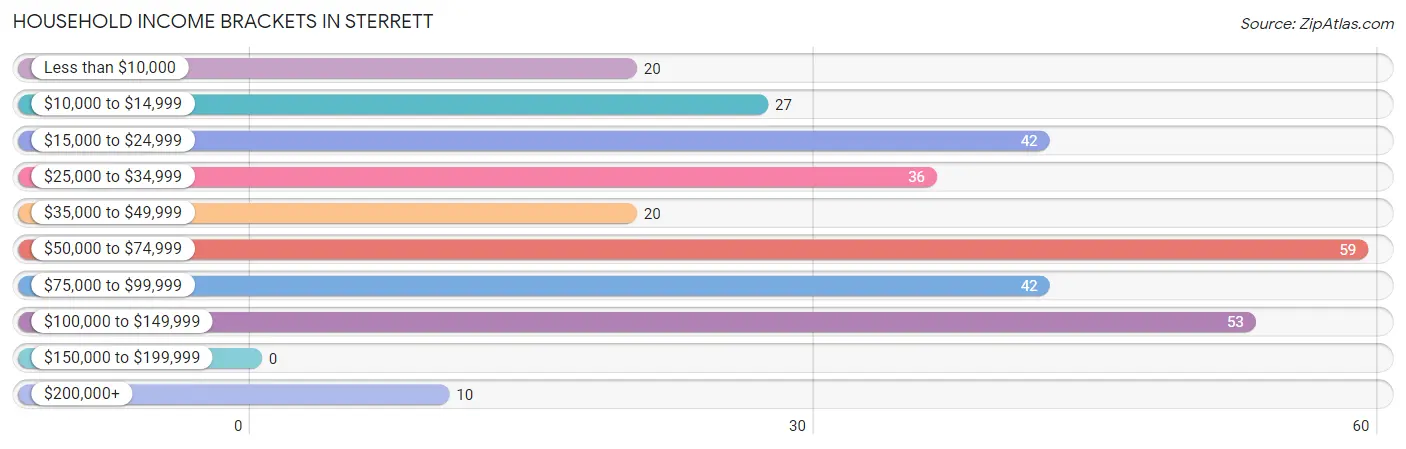
Household Income Brackets in Sterrett
With 59 households falling in the category, the $50,000 to $74,999 income range is the most frequent in Sterrett, accounting for 19.1% of all households.
| Income Bracket | # Households | % Households |
| Less than $10,000 | 20 | 6.5% |
| $10,000 to $14,999 | 27 | 8.7% |
| $15,000 to $24,999 | 42 | 13.6% |
| $25,000 to $34,999 | 36 | 11.7% |
| $35,000 to $49,999 | 20 | 6.5% |
| $50,000 to $74,999 | 59 | 19.1% |
| $75,000 to $99,999 | 42 | 13.6% |
| $100,000 to $149,999 | 53 | 17.2% |
| $150,000 to $199,999 | 0 | 0.0% |
| $200,000+ | 10 | 3.2% |
Household Income by Householder Age in Sterrett
The median household income in Sterrett is $58,594, with the highest median household income of $71,944 found in the 25 to 44 years age bracket for the primary householder. A total of 82 households (26.5%) fall into this category.
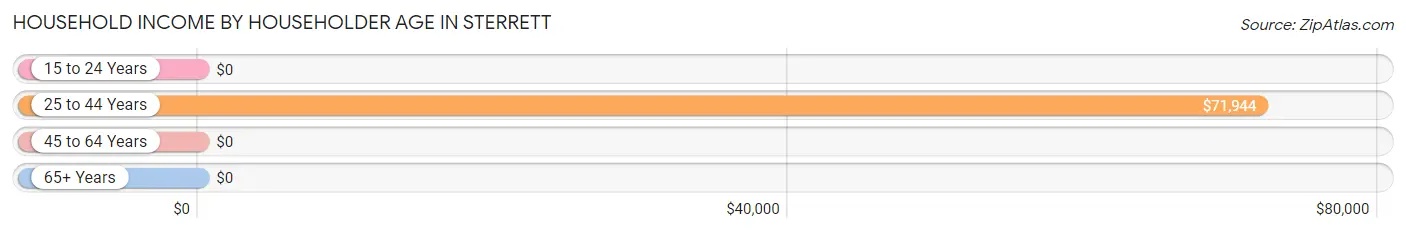
| Income Bracket | # Households | Median Income |
| 15 to 24 Years | 0 (0.0%) | $0 |
| 25 to 44 Years | 82 (26.5%) | $71,944 |
| 45 to 64 Years | 108 (34.9%) | $0 |
| 65+ Years | 119 (38.5%) | $0 |
| Total | 309 (100.0%) | $58,594 |
Poverty in Sterrett
Income Below Poverty by Sex and Age in Sterrett
With 22.3% poverty level for males and 10.9% for females among the residents of Sterrett, 18 to 24 year old males and 55 to 64 year old females are the most vulnerable to poverty, with 50 males (86.2%) and 27 females (52.9%) in their respective age groups living below the poverty level.
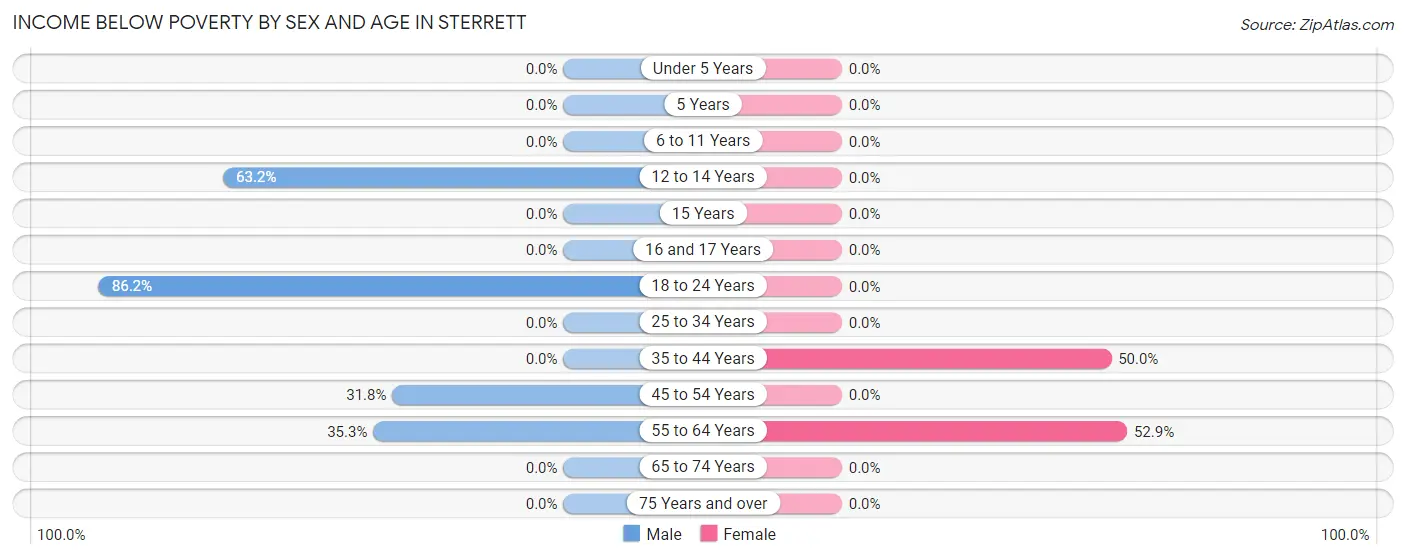
| Age Bracket | Male | Female |
| Under 5 Years | 0 (0.0%) | 0 (0.0%) |
| 5 Years | 0 (0.0%) | 0 (0.0%) |
| 6 to 11 Years | 0 (0.0%) | 0 (0.0%) |
| 12 to 14 Years | 12 (63.2%) | 0 (0.0%) |
| 15 Years | 0 (0.0%) | 0 (0.0%) |
| 16 and 17 Years | 0 (0.0%) | 0 (0.0%) |
| 18 to 24 Years | 50 (86.2%) | 0 (0.0%) |
| 25 to 34 Years | 0 (0.0%) | 0 (0.0%) |
| 35 to 44 Years | 0 (0.0%) | 7 (50.0%) |
| 45 to 54 Years | 20 (31.8%) | 0 (0.0%) |
| 55 to 64 Years | 12 (35.3%) | 27 (52.9%) |
| 65 to 74 Years | 0 (0.0%) | 0 (0.0%) |
| 75 Years and over | 0 (0.0%) | 0 (0.0%) |
| Total | 94 (22.3%) | 34 (10.9%) |
Income Above Poverty by Sex and Age in Sterrett
According to the poverty statistics in Sterrett, males aged under 5 years and females aged 6 to 11 years are the age groups that are most secure financially, with 100.0% of males and 100.0% of females in these age groups living above the poverty line.
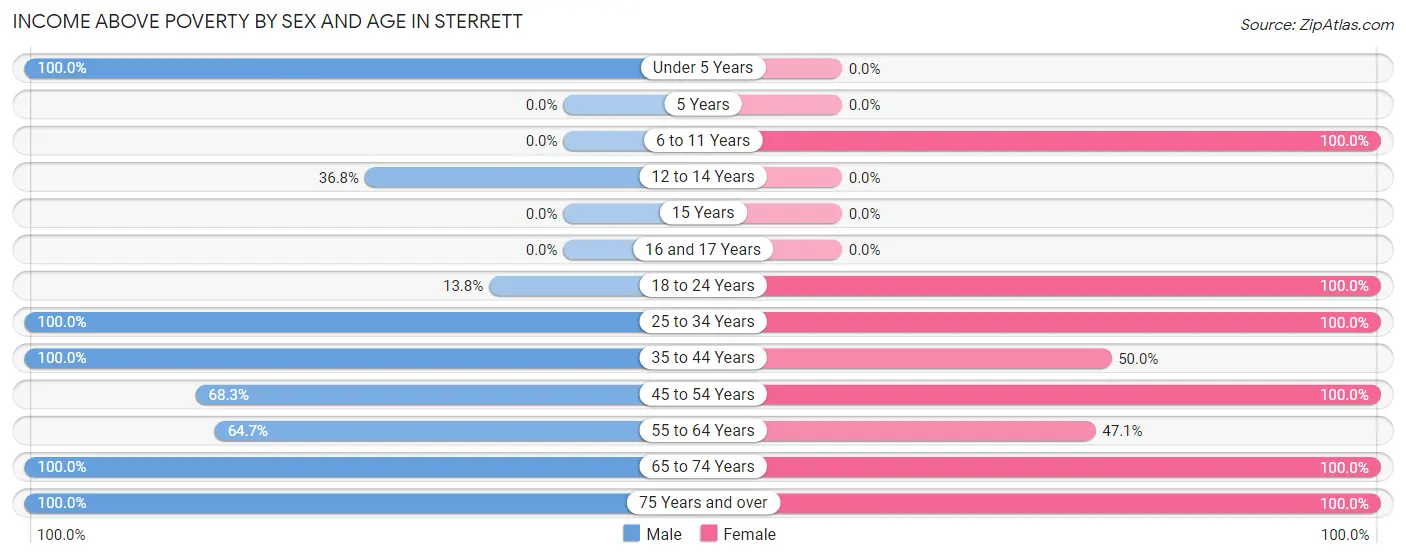
| Age Bracket | Male | Female |
| Under 5 Years | 72 (100.0%) | 0 (0.0%) |
| 5 Years | 0 (0.0%) | 0 (0.0%) |
| 6 to 11 Years | 0 (0.0%) | 11 (100.0%) |
| 12 to 14 Years | 7 (36.8%) | 0 (0.0%) |
| 15 Years | 0 (0.0%) | 0 (0.0%) |
| 16 and 17 Years | 0 (0.0%) | 0 (0.0%) |
| 18 to 24 Years | 8 (13.8%) | 33 (100.0%) |
| 25 to 34 Years | 63 (100.0%) | 65 (100.0%) |
| 35 to 44 Years | 12 (100.0%) | 7 (50.0%) |
| 45 to 54 Years | 43 (68.2%) | 22 (100.0%) |
| 55 to 64 Years | 22 (64.7%) | 24 (47.1%) |
| 65 to 74 Years | 45 (100.0%) | 99 (100.0%) |
| 75 Years and over | 55 (100.0%) | 17 (100.0%) |
| Total | 327 (77.7%) | 278 (89.1%) |
Income Below Poverty Among Married-Couple Families in Sterrett
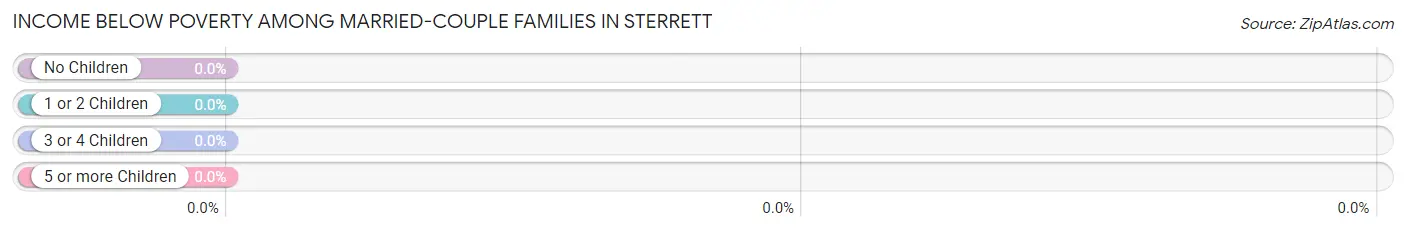
| Children | Above Poverty | Below Poverty |
| No Children | 84 (100.0%) | 0 (0.0%) |
| 1 or 2 Children | 37 (100.0%) | 0 (0.0%) |
| 3 or 4 Children | 0 (0.0%) | 0 (0.0%) |
| 5 or more Children | 0 (0.0%) | 0 (0.0%) |
| Total | 121 (100.0%) | 0 (0.0%) |
Income Below Poverty Among Single-Parent Households in Sterrett
According to the poverty data in Sterrett, 34.5% or 20 single-father households and 100.0% or 7 single-mother households are living below the poverty line. Among single-father households, those with no children have the highest poverty rate, with 20 households (52.6%) experiencing poverty. Likewise, among single-mother households, those with 1 or 2 children have the highest poverty rate, with 7 households (100.0%) falling below the poverty line.
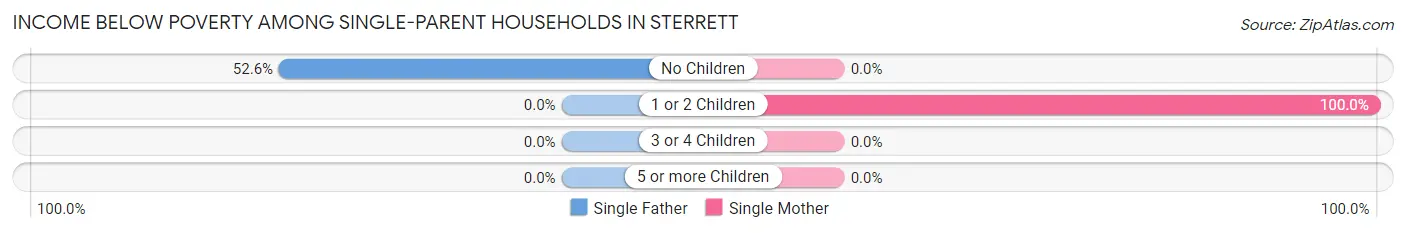
| Children | Single Father | Single Mother |
| No Children | 20 (52.6%) | 0 (0.0%) |
| 1 or 2 Children | 0 (0.0%) | 7 (100.0%) |
| 3 or 4 Children | 0 (0.0%) | 0 (0.0%) |
| 5 or more Children | 0 (0.0%) | 0 (0.0%) |
| Total | 20 (34.5%) | 7 (100.0%) |
Income Below Poverty Among Married-Couple vs Single-Parent Households in Sterrett
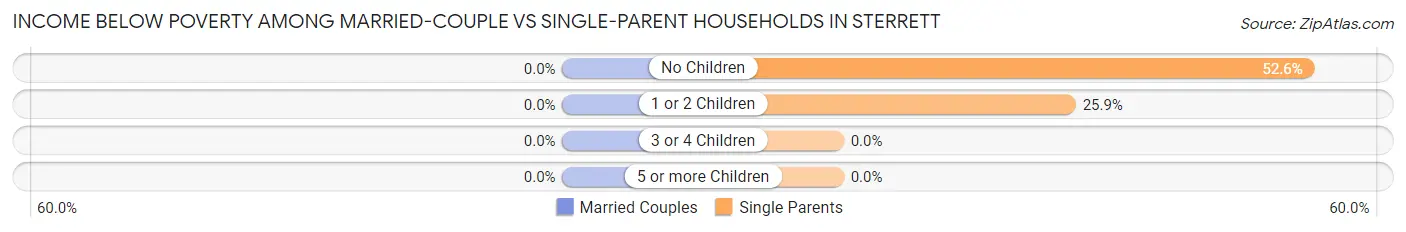
| Children | Married-Couple Families | Single-Parent Households |
| No Children | 0 (0.0%) | 20 (52.6%) |
| 1 or 2 Children | 0 (0.0%) | 7 (25.9%) |
| 3 or 4 Children | 0 (0.0%) | 0 (0.0%) |
| 5 or more Children | 0 (0.0%) | 0 (0.0%) |
| Total | 0 (0.0%) | 27 (41.5%) |
Race in Sterrett
The most populous races in Sterrett are White / Caucasian (642 | 87.6%), Two or more Races (91 | 12.4%), and Hispanic or Latino (19 | 2.6%).
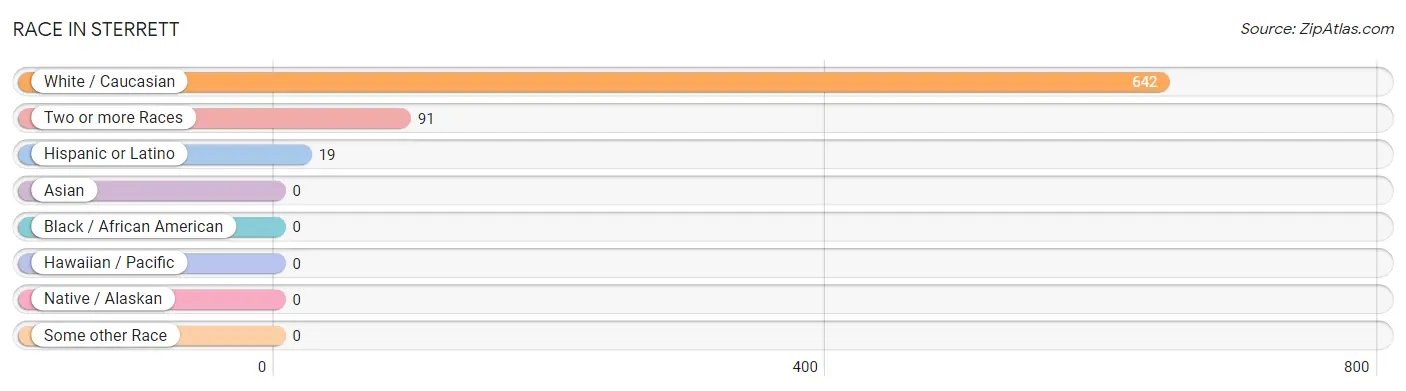
| Race | # Population | % Population |
| Asian | 0 | 0.0% |
| Black / African American | 0 | 0.0% |
| Hawaiian / Pacific | 0 | 0.0% |
| Hispanic or Latino | 19 | 2.6% |
| Native / Alaskan | 0 | 0.0% |
| White / Caucasian | 642 | 87.6% |
| Two or more Races | 91 | 12.4% |
| Some other Race | 0 | 0.0% |
| Total | 733 | 100.0% |
Ancestry in Sterrett
The most populous ancestries reported in Sterrett are German (171 | 23.3%), Irish (154 | 21.0%), English (117 | 16.0%), American (27 | 3.7%), and Norwegian (23 | 3.1%), together accounting for 67.1% of all Sterrett residents.
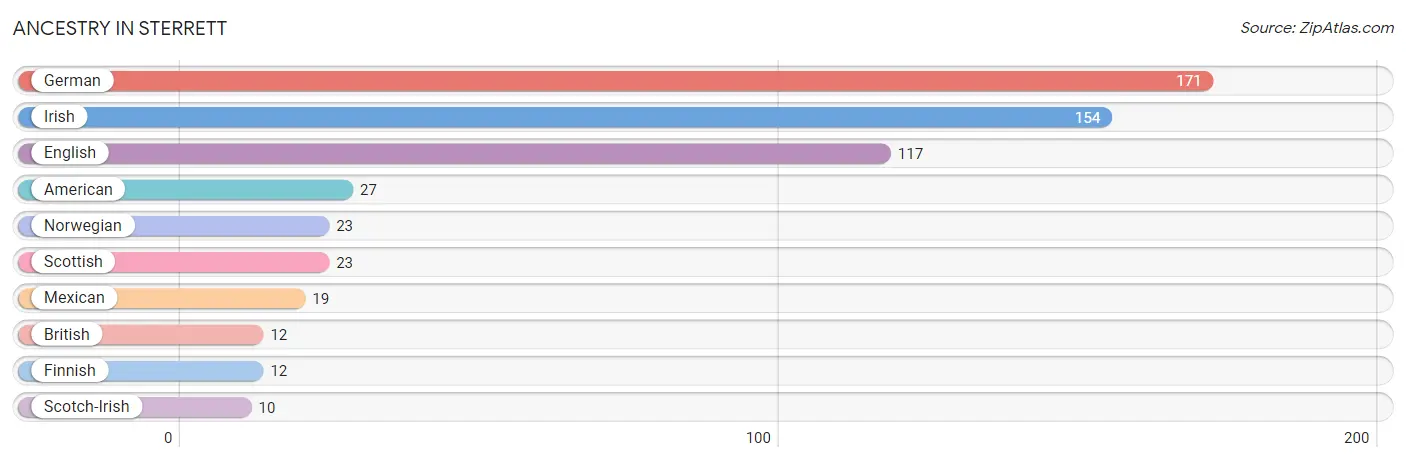
| Ancestry | # Population | % Population |
| American | 27 | 3.7% |
| British | 12 | 1.6% |
| English | 117 | 16.0% |
| Finnish | 12 | 1.6% |
| German | 171 | 23.3% |
| Irish | 154 | 21.0% |
| Mexican | 19 | 2.6% |
| Norwegian | 23 | 3.1% |
| Scotch-Irish | 10 | 1.4% |
| Scottish | 23 | 3.1% | View All 10 Rows |
Immigrants in Sterrett
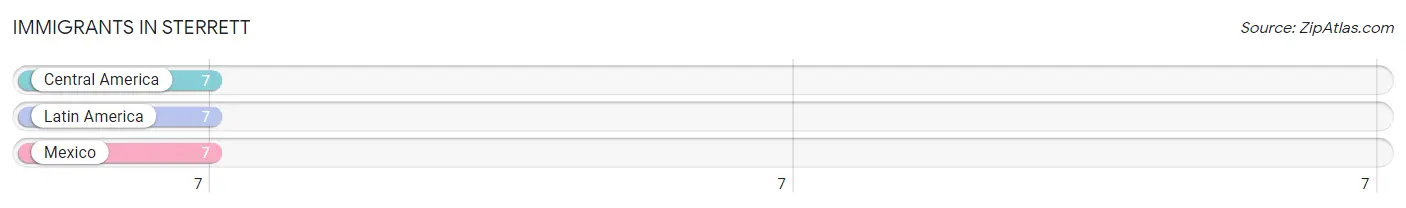
The most numerous immigrant groups reported in Sterrett came from Central America (7 | 0.9%), Latin America (7 | 0.9%), and Mexico (7 | 0.9%), together accounting for 2.8% of all Sterrett residents.
| Immigration Origin | # Population | % Population |
| Central America | 7 | 0.9% |
| Latin America | 7 | 0.9% |
| Mexico | 7 | 0.9% | View All 3 Rows |
Sex and Age in Sterrett
Sex and Age in Sterrett
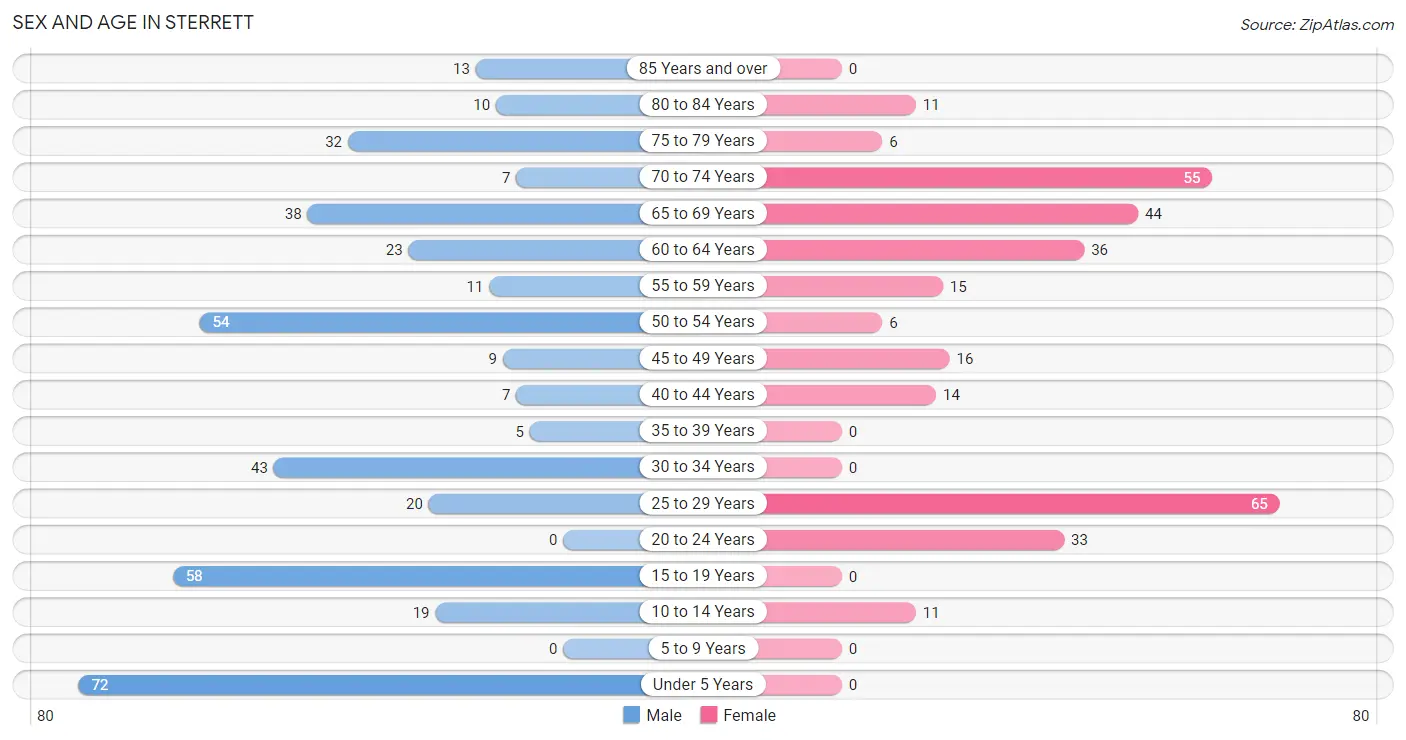
The most populous age groups in Sterrett are Under 5 Years (72 | 17.1%) for men and 25 to 29 Years (65 | 20.8%) for women.
| Age Bracket | Male | Female |
| Under 5 Years | 72 (17.1%) | 0 (0.0%) |
| 5 to 9 Years | 0 (0.0%) | 0 (0.0%) |
| 10 to 14 Years | 19 (4.5%) | 11 (3.5%) |
| 15 to 19 Years | 58 (13.8%) | 0 (0.0%) |
| 20 to 24 Years | 0 (0.0%) | 33 (10.6%) |
| 25 to 29 Years | 20 (4.8%) | 65 (20.8%) |
| 30 to 34 Years | 43 (10.2%) | 0 (0.0%) |
| 35 to 39 Years | 5 (1.2%) | 0 (0.0%) |
| 40 to 44 Years | 7 (1.7%) | 14 (4.5%) |
| 45 to 49 Years | 9 (2.1%) | 16 (5.1%) |
| 50 to 54 Years | 54 (12.8%) | 6 (1.9%) |
| 55 to 59 Years | 11 (2.6%) | 15 (4.8%) |
| 60 to 64 Years | 23 (5.5%) | 36 (11.5%) |
| 65 to 69 Years | 38 (9.0%) | 44 (14.1%) |
| 70 to 74 Years | 7 (1.7%) | 55 (17.6%) |
| 75 to 79 Years | 32 (7.6%) | 6 (1.9%) |
| 80 to 84 Years | 10 (2.4%) | 11 (3.5%) |
| 85 Years and over | 13 (3.1%) | 0 (0.0%) |
| Total | 421 (100.0%) | 312 (100.0%) |
Families and Households in Sterrett
Median Family Size in Sterrett
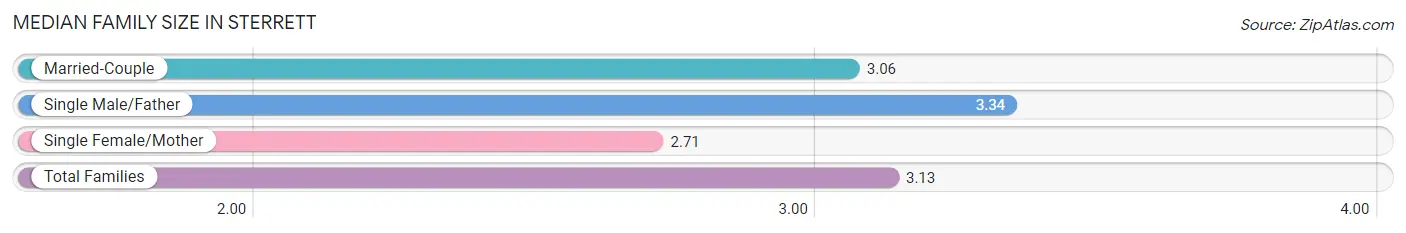
The median family size in Sterrett is 3.13 persons per family, with single male/father families (58 | 31.2%) accounting for the largest median family size of 3.34 persons per family. On the other hand, single female/mother families (7 | 3.8%) represent the smallest median family size with 2.71 persons per family.
| Family Type | # Families | Family Size |
| Married-Couple | 121 (65.0%) | 3.06 |
| Single Male/Father | 58 (31.2%) | 3.34 |
| Single Female/Mother | 7 (3.8%) | 2.71 |
| Total Families | 186 (100.0%) | 3.13 |
Median Household Size in Sterrett
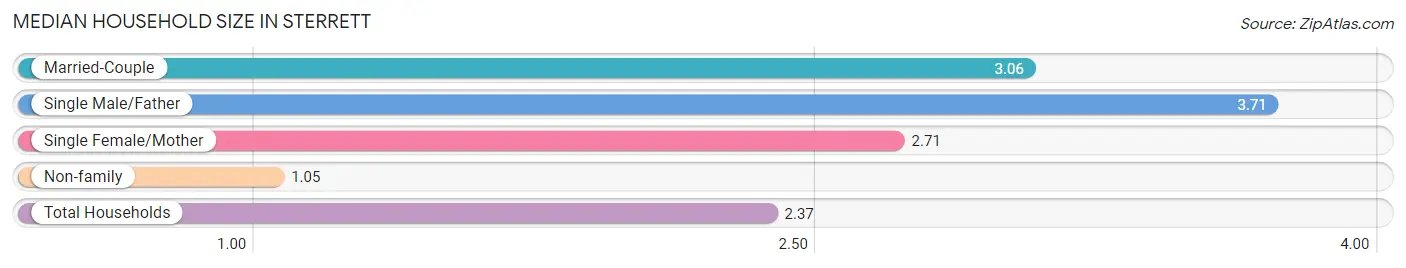
The median household size in Sterrett is 2.37 persons per household, with single male/father households (58 | 18.8%) accounting for the largest median household size of 3.71 persons per household. non-family households (123 | 39.8%) represent the smallest median household size with 1.05 persons per household.
| Household Type | # Households | Household Size |
| Married-Couple | 121 (39.2%) | 3.06 |
| Single Male/Father | 58 (18.8%) | 3.71 |
| Single Female/Mother | 7 (2.3%) | 2.71 |
| Non-family | 123 (39.8%) | 1.05 |
| Total Households | 309 (100.0%) | 2.37 |
Household Size by Marriage Status in Sterrett
Out of a total of 309 households in Sterrett, 186 (60.2%) are family households, while 123 (39.8%) are nonfamily households. The most numerous type of family households are 2-person households, comprising 112, and the most common type of nonfamily households are 1-person households, comprising 111.
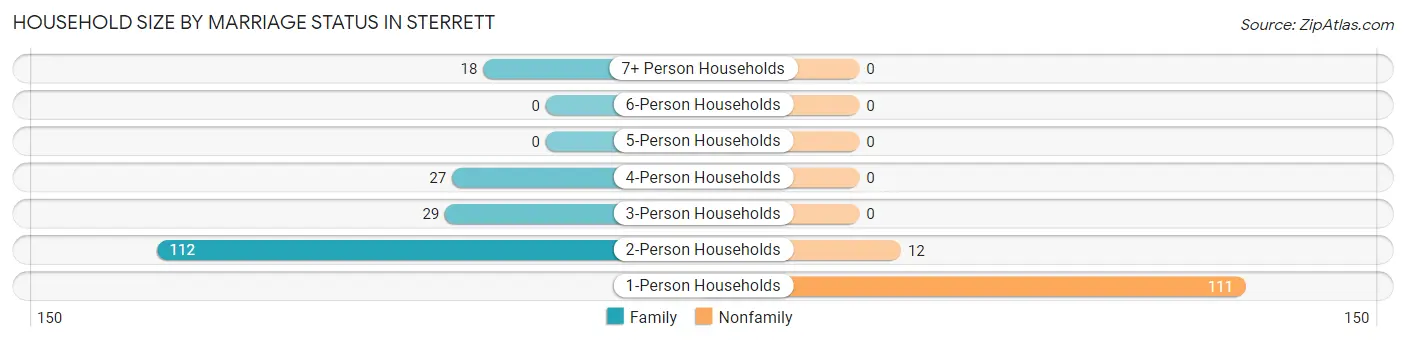
| Household Size | Family Households | Nonfamily Households |
| 1-Person Households | - | 111 (35.9%) |
| 2-Person Households | 112 (36.2%) | 12 (3.9%) |
| 3-Person Households | 29 (9.4%) | 0 (0.0%) |
| 4-Person Households | 27 (8.7%) | 0 (0.0%) |
| 5-Person Households | 0 (0.0%) | 0 (0.0%) |
| 6-Person Households | 0 (0.0%) | 0 (0.0%) |
| 7+ Person Households | 18 (5.8%) | 0 (0.0%) |
| Total | 186 (60.2%) | 123 (39.8%) |
Female Fertility in Sterrett
Fertility by Age in Sterrett
Average fertility rate in Sterrett is 148.0 births per 1,000 women. Women in the age bracket of 35 to 50 years have the highest fertility rate with 233.0 births per 1,000 women. Women in the age bracket of 20 to 34 years acount for 63.2% of all women with births.
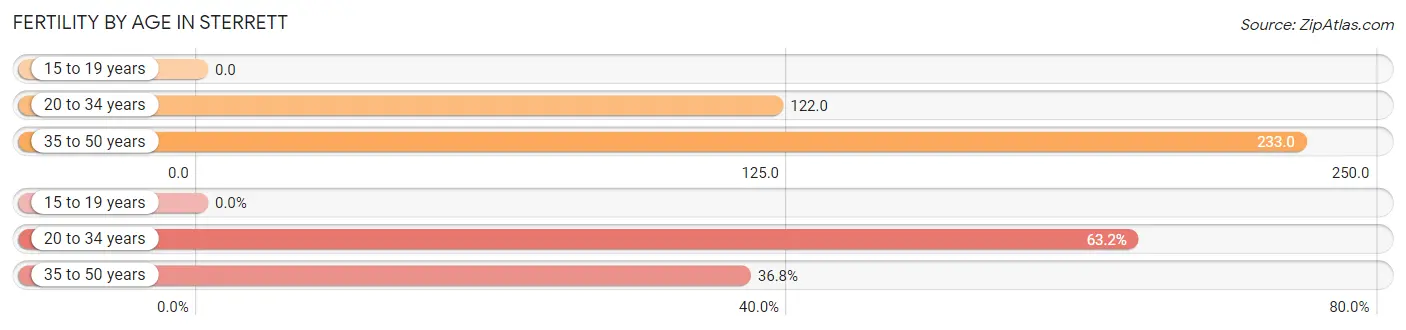
| Age Bracket | Women with Births | Births / 1,000 Women |
| 15 to 19 years | 0 (0.0%) | 0.0 |
| 20 to 34 years | 12 (63.2%) | 122.0 |
| 35 to 50 years | 7 (36.8%) | 233.0 |
| Total | 19 (100.0%) | 148.0 |
Fertility by Age by Marriage Status in Sterrett
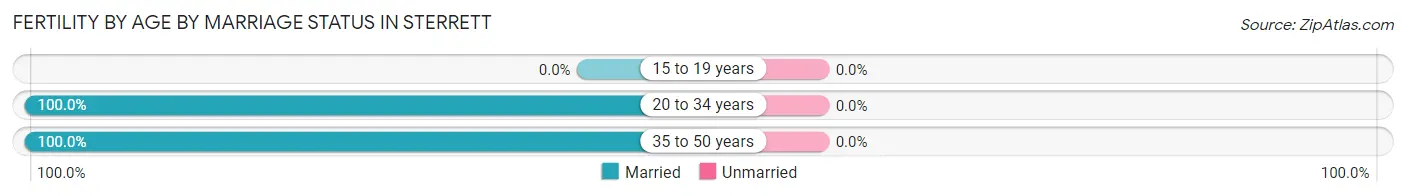
| Age Bracket | Married | Unmarried |
| 15 to 19 years | 0 (0.0%) | 0 (0.0%) |
| 20 to 34 years | 12 (100.0%) | 0 (0.0%) |
| 35 to 50 years | 7 (100.0%) | 0 (0.0%) |
| Total | 19 (100.0%) | 0 (0.0%) |
Fertility by Education in Sterrett
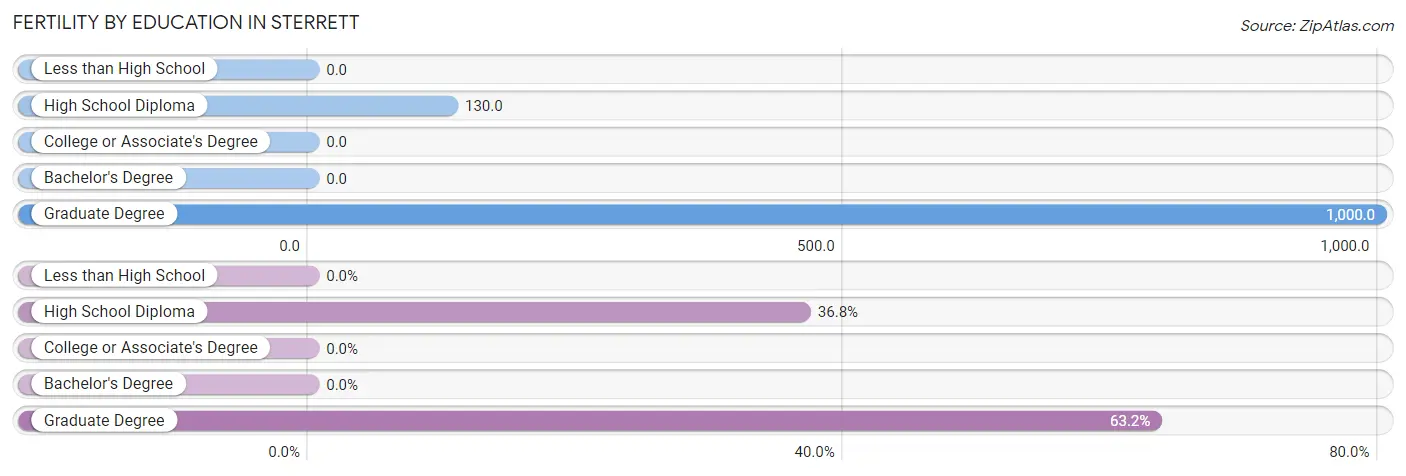
| Educational Attainment | Women with Births | Births / 1,000 Women |
| Less than High School | 0 (0.0%) | 0.0 |
| High School Diploma | 7 (36.8%) | 130.0 |
| College or Associate's Degree | 0 (0.0%) | 0.0 |
| Bachelor's Degree | 0 (0.0%) | 0.0 |
| Graduate Degree | 12 (63.2%) | 1,000.0 |
| Total | 19 (100.0%) | 148.0 |
Fertility by Education by Marriage Status in Sterrett
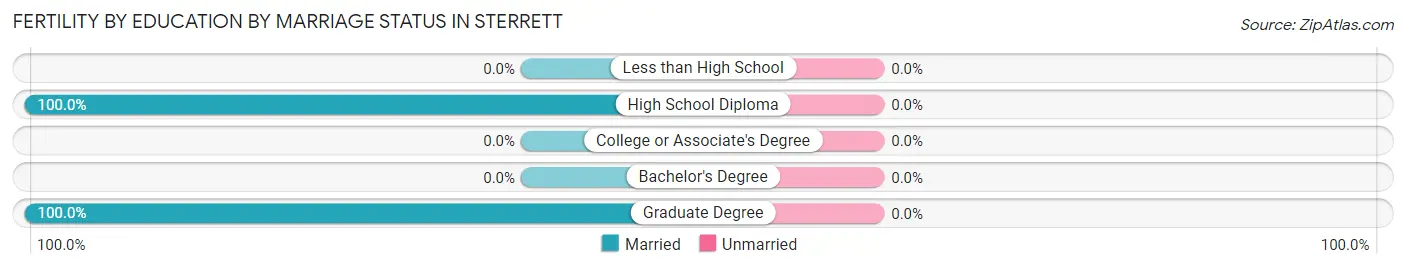
| Educational Attainment | Married | Unmarried |
| Less than High School | 0 (0.0%) | 0 (0.0%) |
| High School Diploma | 7 (100.0%) | 0 (0.0%) |
| College or Associate's Degree | 0 (0.0%) | 0 (0.0%) |
| Bachelor's Degree | 0 (0.0%) | 0 (0.0%) |
| Graduate Degree | 12 (100.0%) | 0 (0.0%) |
| Total | 19 (100.0%) | 0 (0.0%) |
Employment Characteristics in Sterrett
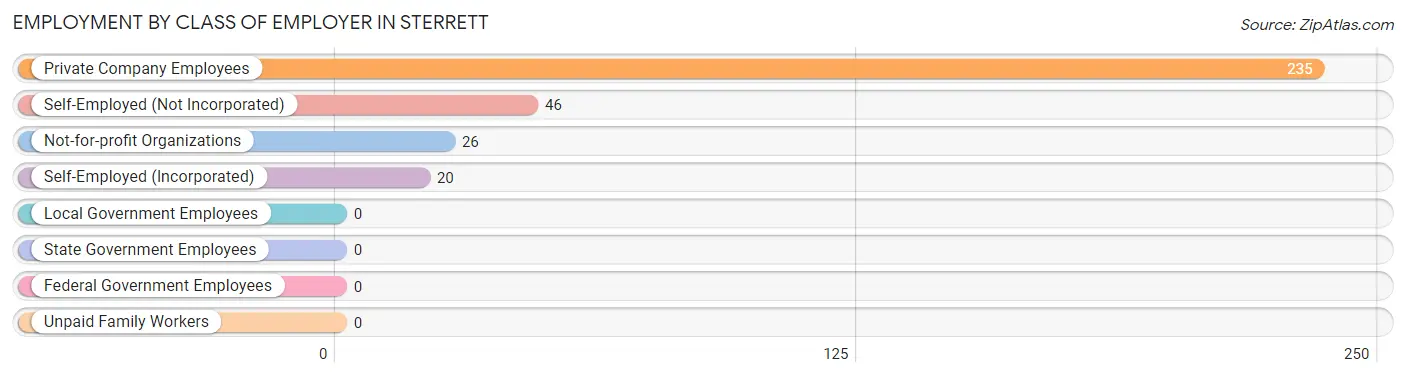
Employment by Class of Employer in Sterrett
Among the 327 employed individuals in Sterrett, private company employees (235 | 71.9%), self-employed (not incorporated) (46 | 14.1%), and not-for-profit organizations (26 | 8.0%) make up the most common classes of employment.
| Employer Class | # Employees | % Employees |
| Private Company Employees | 235 | 71.9% |
| Self-Employed (Incorporated) | 20 | 6.1% |
| Self-Employed (Not Incorporated) | 46 | 14.1% |
| Not-for-profit Organizations | 26 | 8.0% |
| Local Government Employees | 0 | 0.0% |
| State Government Employees | 0 | 0.0% |
| Federal Government Employees | 0 | 0.0% |
| Unpaid Family Workers | 0 | 0.0% |
| Total | 327 | 100.0% |
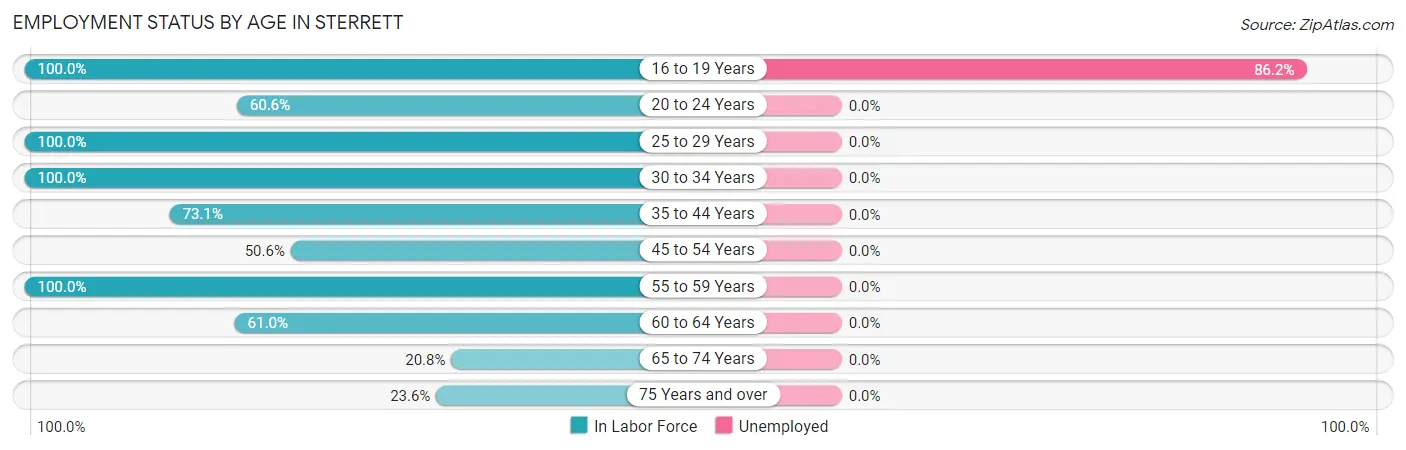
Employment Status by Age in Sterrett
According to the labor force statistics for Sterrett, out of the total population over 16 years of age (631), 59.7% or 377 individuals are in the labor force, with 13.3% or 50 of them unemployed. The age group with the highest labor force participation rate is 16 to 19 years, with 100.0% or 58 individuals in the labor force. Within the labor force, the 16 to 19 years age range has the highest percentage of unemployed individuals, with 86.2% or 50 of them being unemployed.
| Age Bracket | In Labor Force | Unemployed |
| 16 to 19 Years | 58 (100.0%) | 50 (86.2%) |
| 20 to 24 Years | 20 (60.6%) | 0 (0.0%) |
| 25 to 29 Years | 85 (100.0%) | 0 (0.0%) |
| 30 to 34 Years | 43 (100.0%) | 0 (0.0%) |
| 35 to 44 Years | 19 (73.1%) | 0 (0.0%) |
| 45 to 54 Years | 43 (50.6%) | 0 (0.0%) |
| 55 to 59 Years | 26 (100.0%) | 0 (0.0%) |
| 60 to 64 Years | 36 (61.0%) | 0 (0.0%) |
| 65 to 74 Years | 30 (20.8%) | 0 (0.0%) |
| 75 Years and over | 17 (23.6%) | 0 (0.0%) |
| Total | 377 (59.7%) | 50 (13.3%) |
Employment Status by Educational Attainment in Sterrett
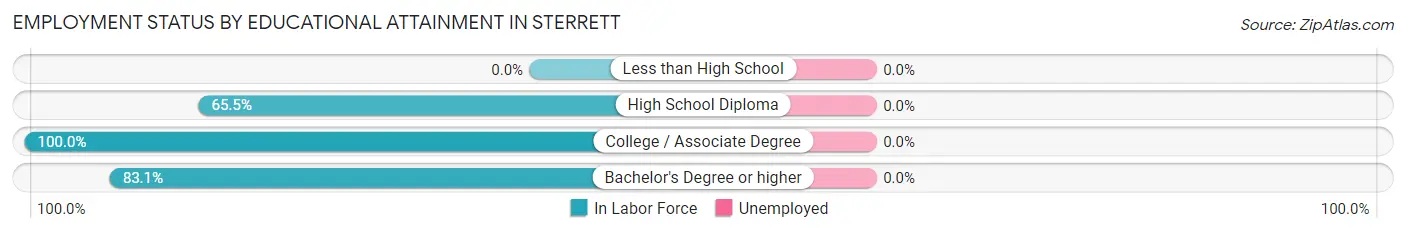
| Educational Attainment | In Labor Force | Unemployed |
| Less than High School | 0 (0.0%) | 0 (0.0%) |
| High School Diploma | 78 (65.5%) | 0 (0.0%) |
| College / Associate Degree | 120 (100.0%) | 0 (0.0%) |
| Bachelor's Degree or higher | 54 (83.1%) | 0 (0.0%) |
| Total | 252 (77.8%) | 0 (0.0%) |
Employment Occupations by Sex in Sterrett
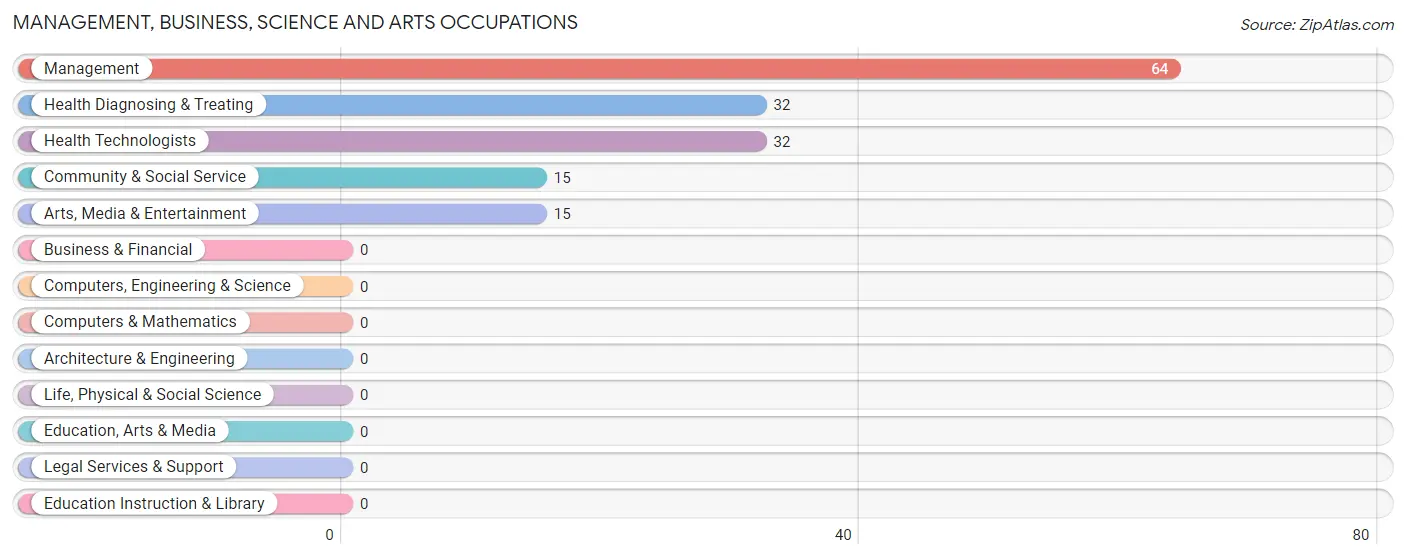
Management, Business, Science and Arts Occupations
The most common Management, Business, Science and Arts occupations in Sterrett are Management (64 | 19.6%), Health Diagnosing & Treating (32 | 9.8%), Health Technologists (32 | 9.8%), Community & Social Service (15 | 4.6%), and Arts, Media & Entertainment (15 | 4.6%).
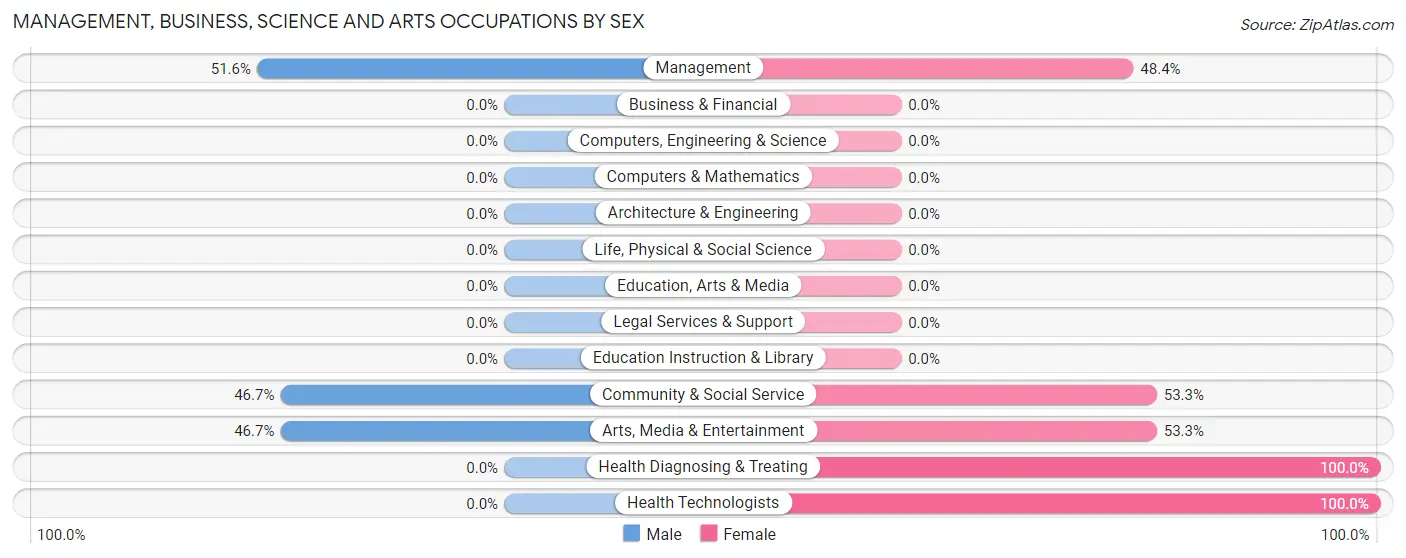
Management, Business, Science and Arts Occupations by Sex
Within the Management, Business, Science and Arts occupations in Sterrett, the most male-oriented occupations are Management (51.6%), Community & Social Service (46.7%), and Arts, Media & Entertainment (46.7%), while the most female-oriented occupations are Health Diagnosing & Treating (100.0%), Health Technologists (100.0%), and Community & Social Service (53.3%).
| Occupation | Male | Female |
| Management | 33 (51.6%) | 31 (48.4%) |
| Business & Financial | 0 (0.0%) | 0 (0.0%) |
| Computers, Engineering & Science | 0 (0.0%) | 0 (0.0%) |
| Computers & Mathematics | 0 (0.0%) | 0 (0.0%) |
| Architecture & Engineering | 0 (0.0%) | 0 (0.0%) |
| Life, Physical & Social Science | 0 (0.0%) | 0 (0.0%) |
| Community & Social Service | 7 (46.7%) | 8 (53.3%) |
| Education, Arts & Media | 0 (0.0%) | 0 (0.0%) |
| Legal Services & Support | 0 (0.0%) | 0 (0.0%) |
| Education Instruction & Library | 0 (0.0%) | 0 (0.0%) |
| Arts, Media & Entertainment | 7 (46.7%) | 8 (53.3%) |
| Health Diagnosing & Treating | 0 (0.0%) | 32 (100.0%) |
| Health Technologists | 0 (0.0%) | 32 (100.0%) |
| Total (Category) | 40 (36.0%) | 71 (64.0%) |
| Total (Overall) | 153 (46.8%) | 174 (53.2%) |
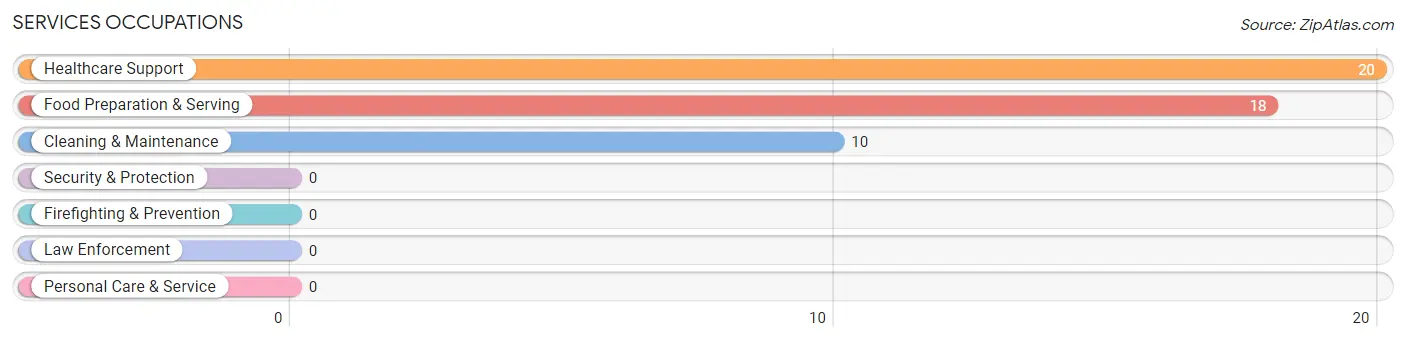
Services Occupations
The most common Services occupations in Sterrett are Healthcare Support (20 | 6.1%), Food Preparation & Serving (18 | 5.5%), and Cleaning & Maintenance (10 | 3.1%).
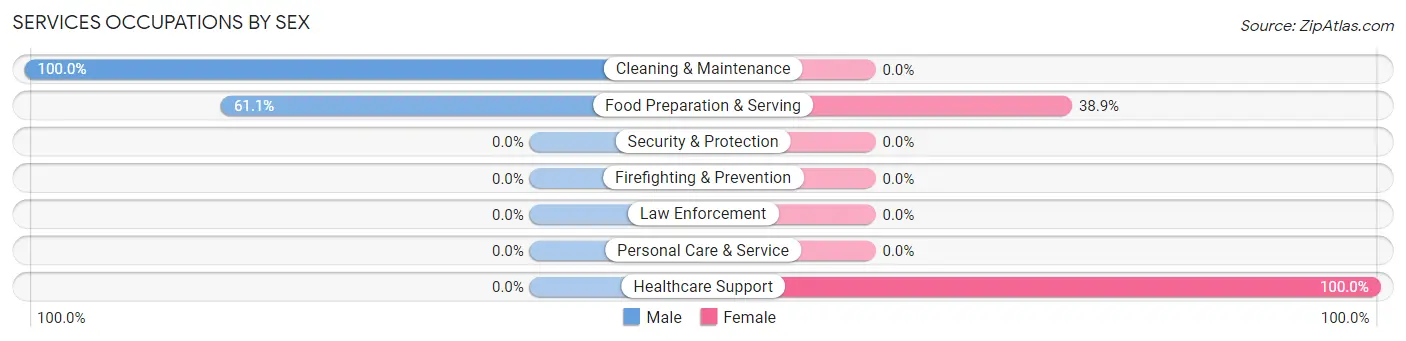
Services Occupations by Sex
Within the Services occupations in Sterrett, the most male-oriented occupations are Cleaning & Maintenance (100.0%), and Food Preparation & Serving (61.1%), while the most female-oriented occupations are Healthcare Support (100.0%), and Food Preparation & Serving (38.9%).
| Occupation | Male | Female |
| Healthcare Support | 0 (0.0%) | 20 (100.0%) |
| Security & Protection | 0 (0.0%) | 0 (0.0%) |
| Firefighting & Prevention | 0 (0.0%) | 0 (0.0%) |
| Law Enforcement | 0 (0.0%) | 0 (0.0%) |
| Food Preparation & Serving | 11 (61.1%) | 7 (38.9%) |
| Cleaning & Maintenance | 10 (100.0%) | 0 (0.0%) |
| Personal Care & Service | 0 (0.0%) | 0 (0.0%) |
| Total (Category) | 21 (43.8%) | 27 (56.2%) |
| Total (Overall) | 153 (46.8%) | 174 (53.2%) |
Sales and Office Occupations
The most common Sales and Office occupations in Sterrett are Office & Administration (53 | 16.2%), and Sales & Related (44 | 13.5%).
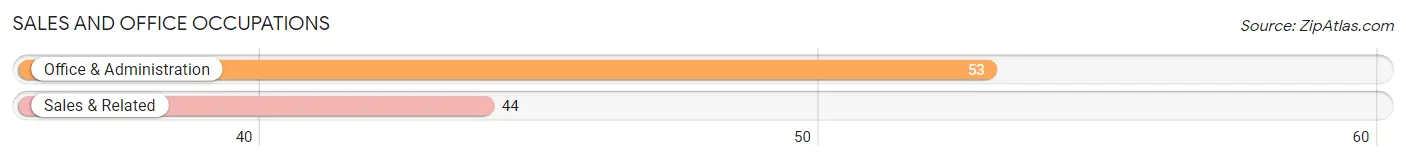
Sales and Office Occupations by Sex
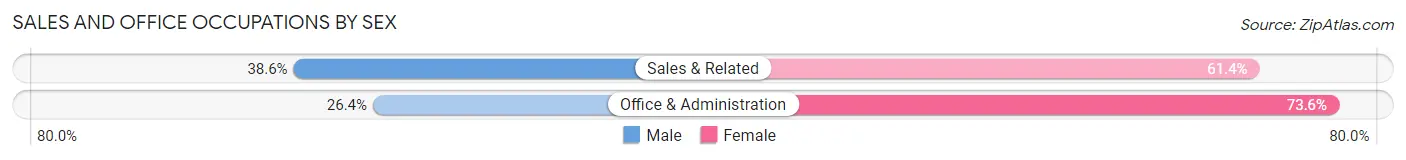
| Occupation | Male | Female |
| Sales & Related | 17 (38.6%) | 27 (61.4%) |
| Office & Administration | 14 (26.4%) | 39 (73.6%) |
| Total (Category) | 31 (32.0%) | 66 (68.0%) |
| Total (Overall) | 153 (46.8%) | 174 (53.2%) |
Natural Resources, Construction and Maintenance Occupations
The most common Natural Resources, Construction and Maintenance occupations in Sterrett are Installation, Maintenance & Repair (18 | 5.5%), and Construction & Extraction (17 | 5.2%).
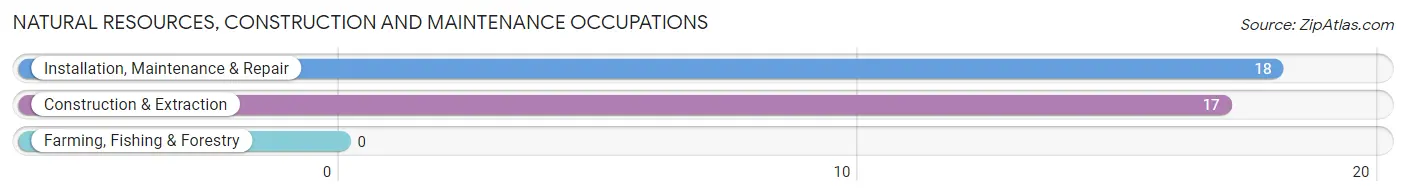
Natural Resources, Construction and Maintenance Occupations by Sex
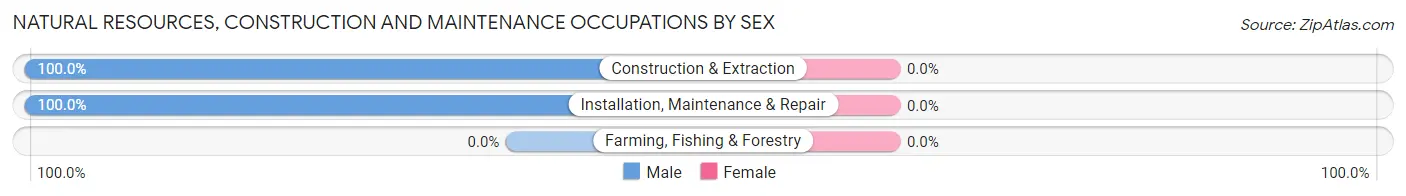
| Occupation | Male | Female |
| Farming, Fishing & Forestry | 0 (0.0%) | 0 (0.0%) |
| Construction & Extraction | 17 (100.0%) | 0 (0.0%) |
| Installation, Maintenance & Repair | 18 (100.0%) | 0 (0.0%) |
| Total (Category) | 35 (100.0%) | 0 (0.0%) |
| Total (Overall) | 153 (46.8%) | 174 (53.2%) |
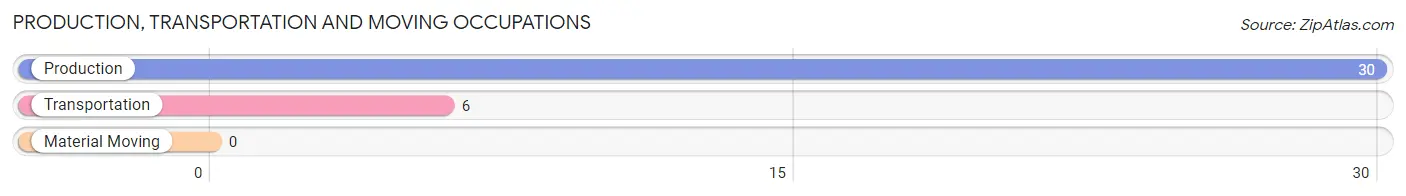
Production, Transportation and Moving Occupations
The most common Production, Transportation and Moving occupations in Sterrett are Production (30 | 9.2%), and Transportation (6 | 1.8%).
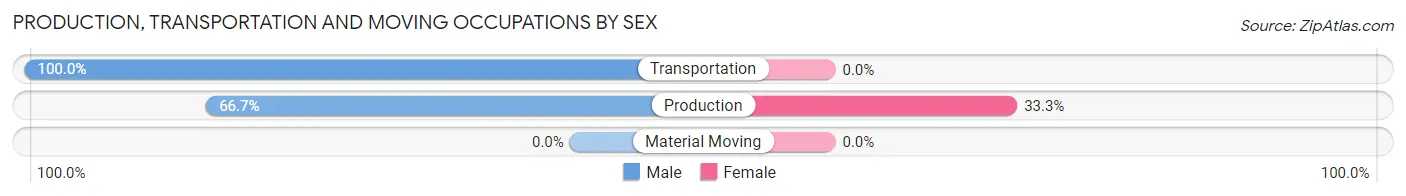
Production, Transportation and Moving Occupations by Sex
| Occupation | Male | Female |
| Production | 20 (66.7%) | 10 (33.3%) |
| Transportation | 6 (100.0%) | 0 (0.0%) |
| Material Moving | 0 (0.0%) | 0 (0.0%) |
| Total (Category) | 26 (72.2%) | 10 (27.8%) |
| Total (Overall) | 153 (46.8%) | 174 (53.2%) |
Employment Industries by Sex in Sterrett
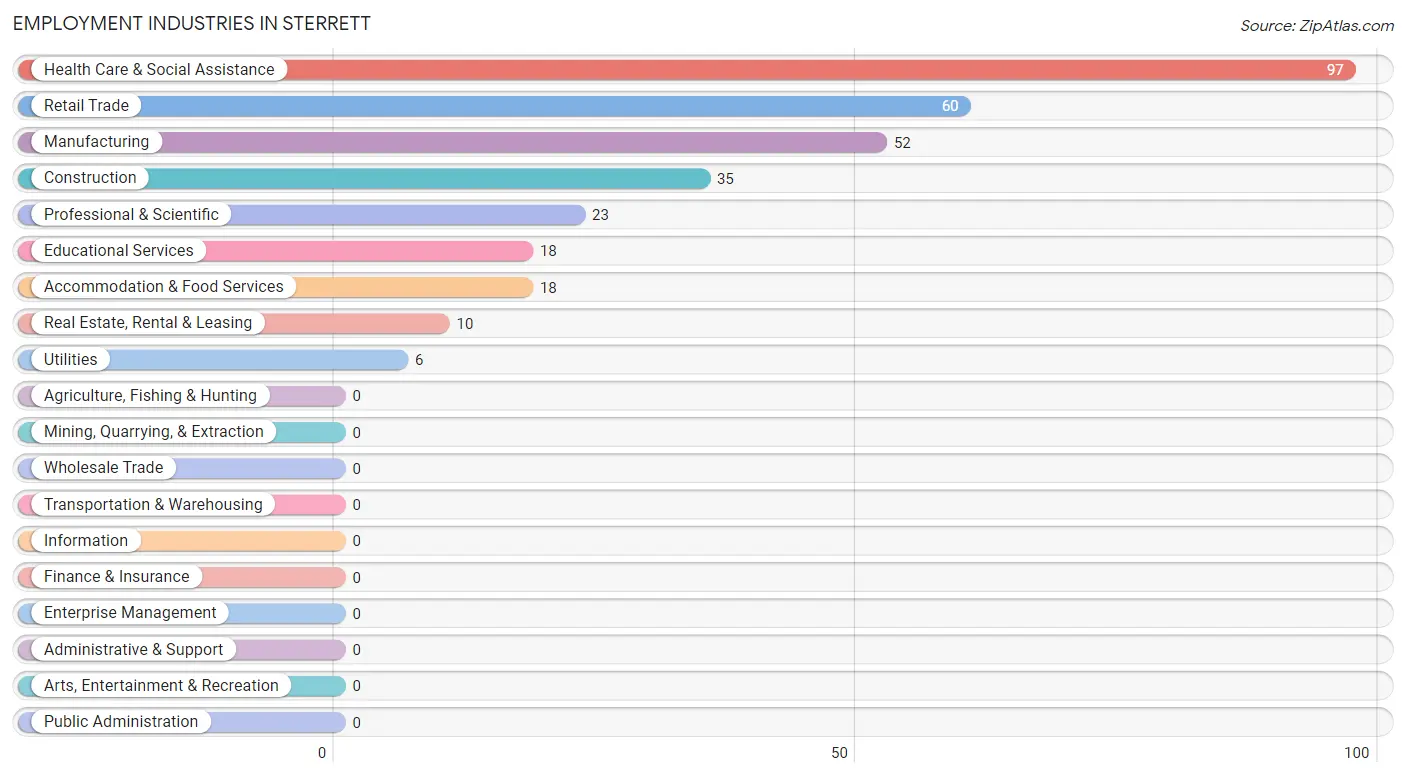
Employment Industries in Sterrett
The major employment industries in Sterrett include Health Care & Social Assistance (97 | 29.7%), Retail Trade (60 | 18.3%), Manufacturing (52 | 15.9%), Construction (35 | 10.7%), and Professional & Scientific (23 | 7.0%).
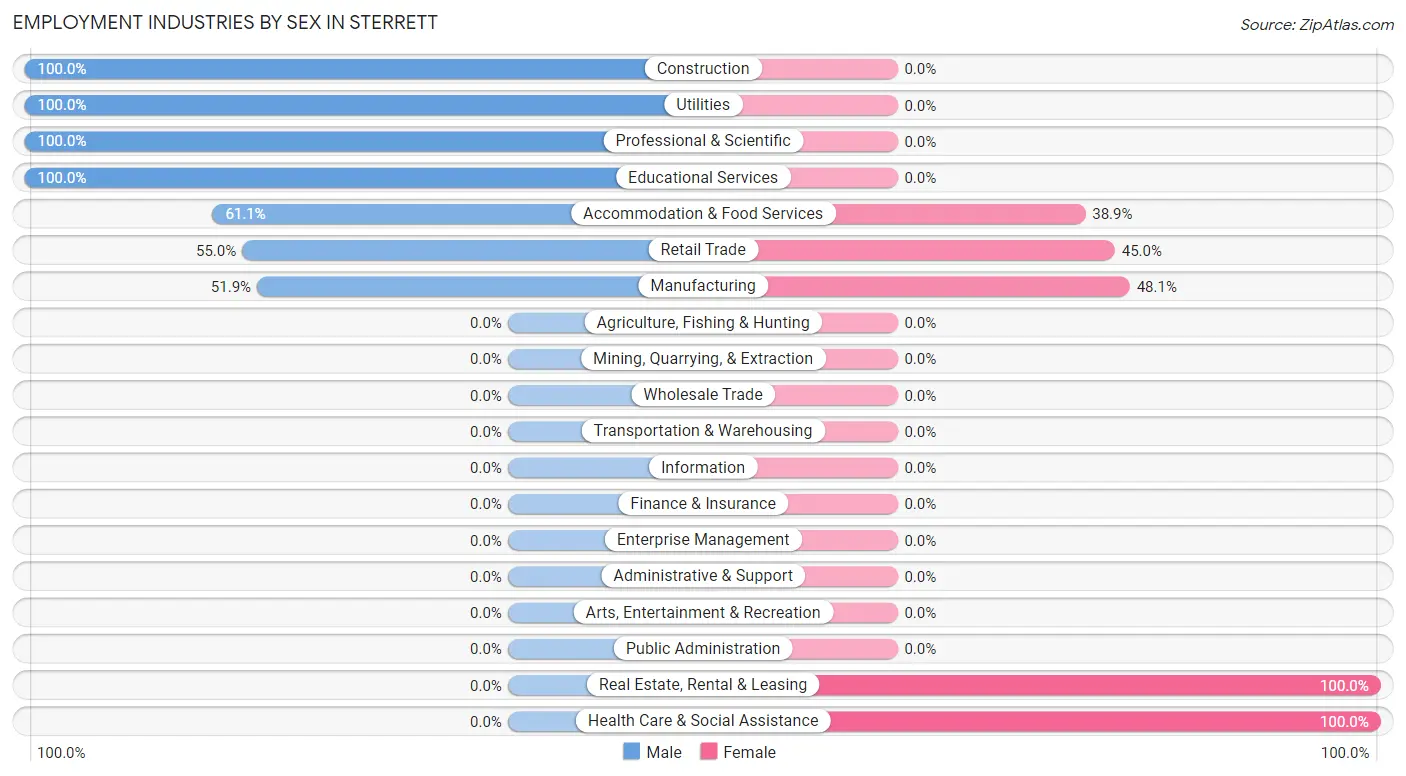
Employment Industries by Sex in Sterrett
The Sterrett industries that see more men than women are Construction (100.0%), Utilities (100.0%), and Professional & Scientific (100.0%), whereas the industries that tend to have a higher number of women are Real Estate, Rental & Leasing (100.0%), Health Care & Social Assistance (100.0%), and Manufacturing (48.1%).
| Industry | Male | Female |
| Agriculture, Fishing & Hunting | 0 (0.0%) | 0 (0.0%) |
| Mining, Quarrying, & Extraction | 0 (0.0%) | 0 (0.0%) |
| Construction | 35 (100.0%) | 0 (0.0%) |
| Manufacturing | 27 (51.9%) | 25 (48.1%) |
| Wholesale Trade | 0 (0.0%) | 0 (0.0%) |
| Retail Trade | 33 (55.0%) | 27 (45.0%) |
| Transportation & Warehousing | 0 (0.0%) | 0 (0.0%) |
| Utilities | 6 (100.0%) | 0 (0.0%) |
| Information | 0 (0.0%) | 0 (0.0%) |
| Finance & Insurance | 0 (0.0%) | 0 (0.0%) |
| Real Estate, Rental & Leasing | 0 (0.0%) | 10 (100.0%) |
| Professional & Scientific | 23 (100.0%) | 0 (0.0%) |
| Enterprise Management | 0 (0.0%) | 0 (0.0%) |
| Administrative & Support | 0 (0.0%) | 0 (0.0%) |
| Educational Services | 18 (100.0%) | 0 (0.0%) |
| Health Care & Social Assistance | 0 (0.0%) | 97 (100.0%) |
| Arts, Entertainment & Recreation | 0 (0.0%) | 0 (0.0%) |
| Accommodation & Food Services | 11 (61.1%) | 7 (38.9%) |
| Public Administration | 0 (0.0%) | 0 (0.0%) |
| Total | 153 (46.8%) | 174 (53.2%) |
Education in Sterrett
School Enrollment in Sterrett
The most common levels of schooling among the 120 students in Sterrett are high school (62 | 51.7%), nursery / preschool (40 | 33.3%), and middle school (18 | 15.0%).
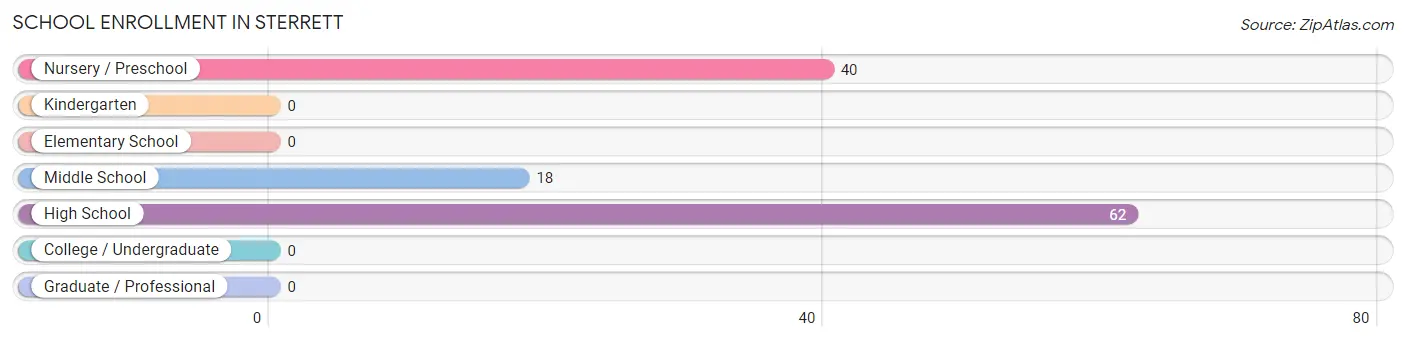
| School Level | # Students | % Students |
| Nursery / Preschool | 40 | 33.3% |
| Kindergarten | 0 | 0.0% |
| Elementary School | 0 | 0.0% |
| Middle School | 18 | 15.0% |
| High School | 62 | 51.7% |
| College / Undergraduate | 0 | 0.0% |
| Graduate / Professional | 0 | 0.0% |
| Total | 120 | 100.0% |
School Enrollment by Age by Funding Source in Sterrett
Out of a total of 120 students who are enrolled in schools in Sterrett, 47 (39.2%) attend a private institution, while the remaining 73 (60.8%) are enrolled in public schools. The age group of 3 to 4 year olds has the highest likelihood of being enrolled in private schools, with 40 (100.0% in the age bracket) enrolled. Conversely, the age group of 18 to 19 year olds has the lowest likelihood of being enrolled in a private school, with 50 (100.0% in the age bracket) attending a public institution.
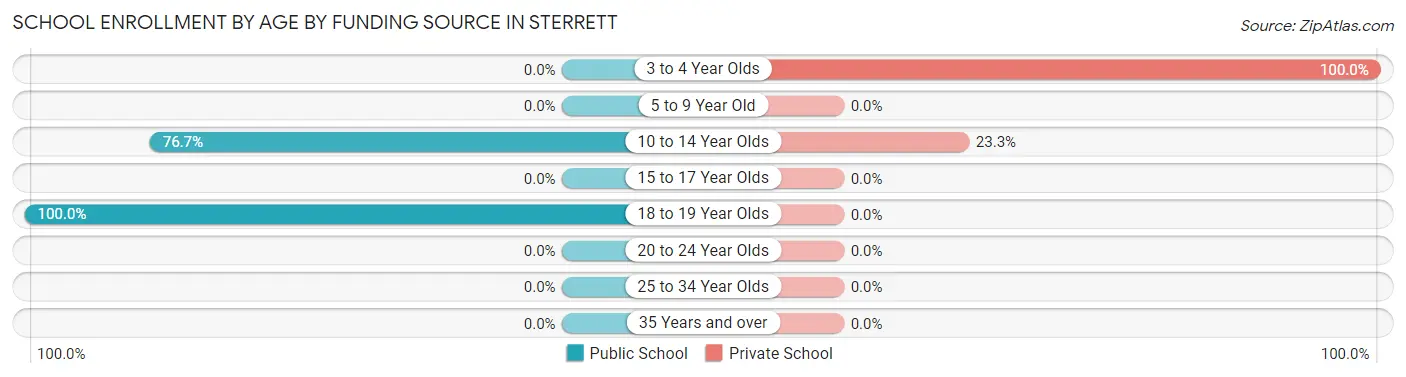
| Age Bracket | Public School | Private School |
| 3 to 4 Year Olds | 0 (0.0%) | 40 (100.0%) |
| 5 to 9 Year Old | 0 (0.0%) | 0 (0.0%) |
| 10 to 14 Year Olds | 23 (76.7%) | 7 (23.3%) |
| 15 to 17 Year Olds | 0 (0.0%) | 0 (0.0%) |
| 18 to 19 Year Olds | 50 (100.0%) | 0 (0.0%) |
| 20 to 24 Year Olds | 0 (0.0%) | 0 (0.0%) |
| 25 to 34 Year Olds | 0 (0.0%) | 0 (0.0%) |
| 35 Years and over | 0 (0.0%) | 0 (0.0%) |
| Total | 73 (60.8%) | 47 (39.2%) |
Educational Attainment by Field of Study in Sterrett
Science & technology (54 | 36.0%), education (23 | 15.3%), communications (23 | 15.3%), computers & mathematics (21 | 14.0%), and physical & health sciences (10 | 6.7%) are the most common fields of study among 150 individuals in Sterrett who have obtained a bachelor's degree or higher.
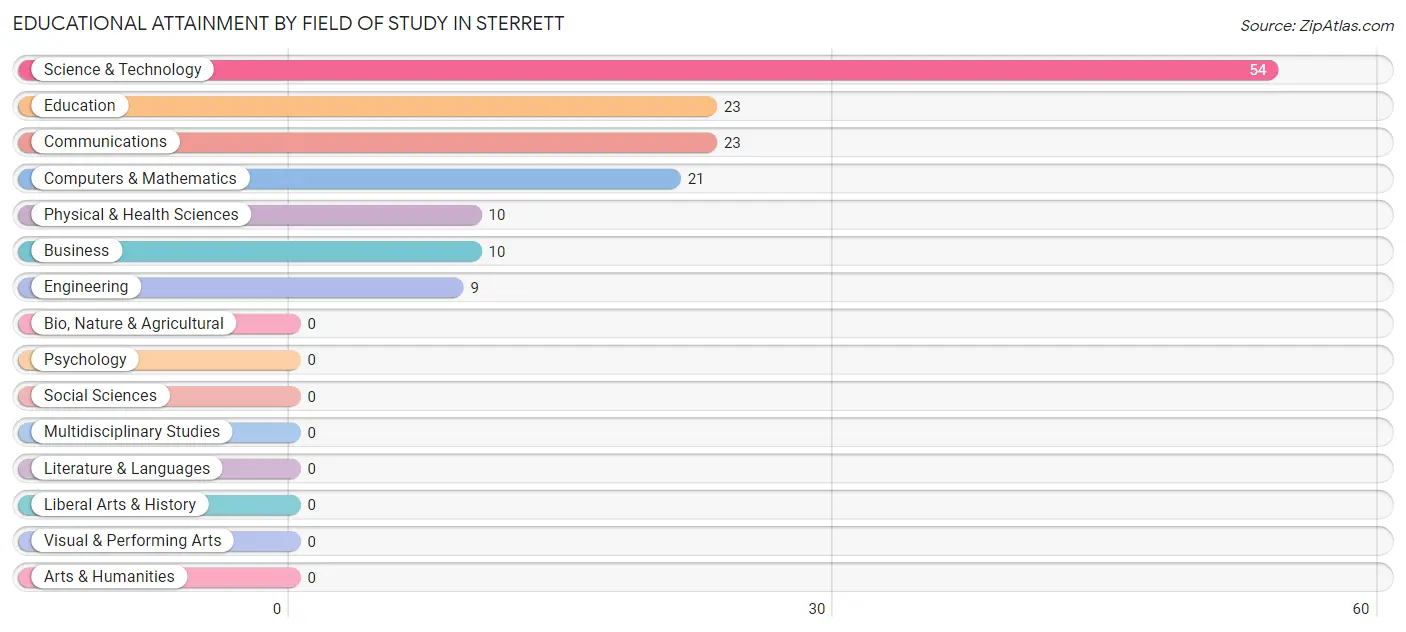
| Field of Study | # Graduates | % Graduates |
| Computers & Mathematics | 21 | 14.0% |
| Bio, Nature & Agricultural | 0 | 0.0% |
| Physical & Health Sciences | 10 | 6.7% |
| Psychology | 0 | 0.0% |
| Social Sciences | 0 | 0.0% |
| Engineering | 9 | 6.0% |
| Multidisciplinary Studies | 0 | 0.0% |
| Science & Technology | 54 | 36.0% |
| Business | 10 | 6.7% |
| Education | 23 | 15.3% |
| Literature & Languages | 0 | 0.0% |
| Liberal Arts & History | 0 | 0.0% |
| Visual & Performing Arts | 0 | 0.0% |
| Communications | 23 | 15.3% |
| Arts & Humanities | 0 | 0.0% |
| Total | 150 | 100.0% |
Transportation & Commute in Sterrett
Vehicle Availability by Sex in Sterrett
The most prevalent vehicle ownership categories in Sterrett are males with 3 vehicles (42, accounting for 27.5%) and females with 3 vehicles (40, making up 24.1%).
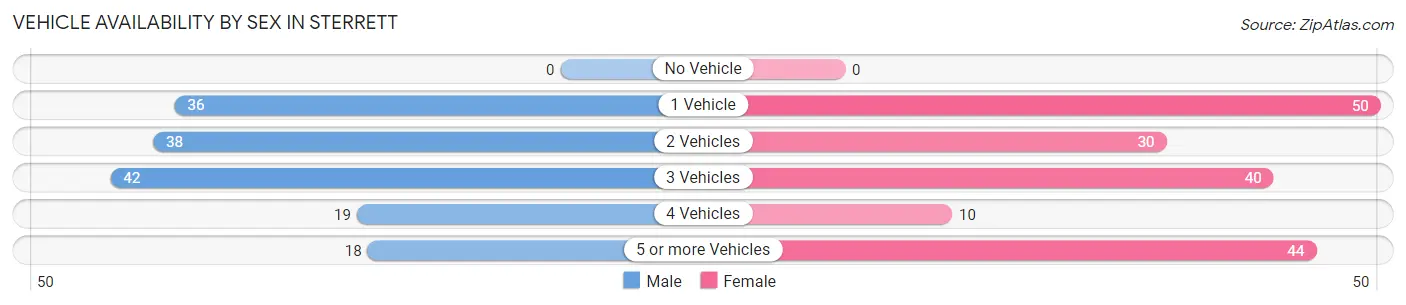
| Vehicles Available | Male | Female |
| No Vehicle | 0 (0.0%) | 0 (0.0%) |
| 1 Vehicle | 36 (23.5%) | 50 (28.7%) |
| 2 Vehicles | 38 (24.8%) | 30 (17.2%) |
| 3 Vehicles | 42 (27.5%) | 40 (23.0%) |
| 4 Vehicles | 19 (12.4%) | 10 (5.8%) |
| 5 or more Vehicles | 18 (11.8%) | 44 (25.3%) |
| Total | 153 (100.0%) | 174 (100.0%) |
Commute Time in Sterrett
The most frequently occuring commute durations in Sterrett are 30 to 34 minutes (94 commuters, 28.7%), 45 to 59 minutes (57 commuters, 17.4%), and 25 to 29 minutes (50 commuters, 15.3%).
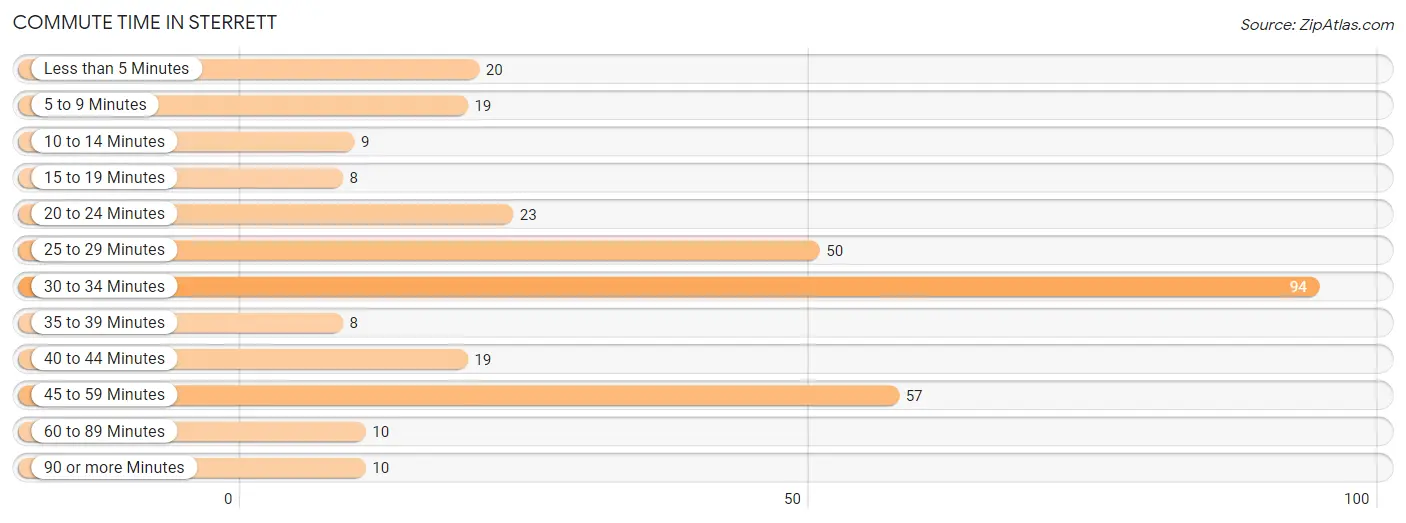
| Commute Time | # Commuters | % Commuters |
| Less than 5 Minutes | 20 | 6.1% |
| 5 to 9 Minutes | 19 | 5.8% |
| 10 to 14 Minutes | 9 | 2.8% |
| 15 to 19 Minutes | 8 | 2.5% |
| 20 to 24 Minutes | 23 | 7.0% |
| 25 to 29 Minutes | 50 | 15.3% |
| 30 to 34 Minutes | 94 | 28.7% |
| 35 to 39 Minutes | 8 | 2.5% |
| 40 to 44 Minutes | 19 | 5.8% |
| 45 to 59 Minutes | 57 | 17.4% |
| 60 to 89 Minutes | 10 | 3.1% |
| 90 or more Minutes | 10 | 3.1% |
Commute Time by Sex in Sterrett
The most common commute times in Sterrett are 30 to 34 minutes (56 commuters, 36.6%) for males and 25 to 29 minutes (50 commuters, 28.7%) for females.
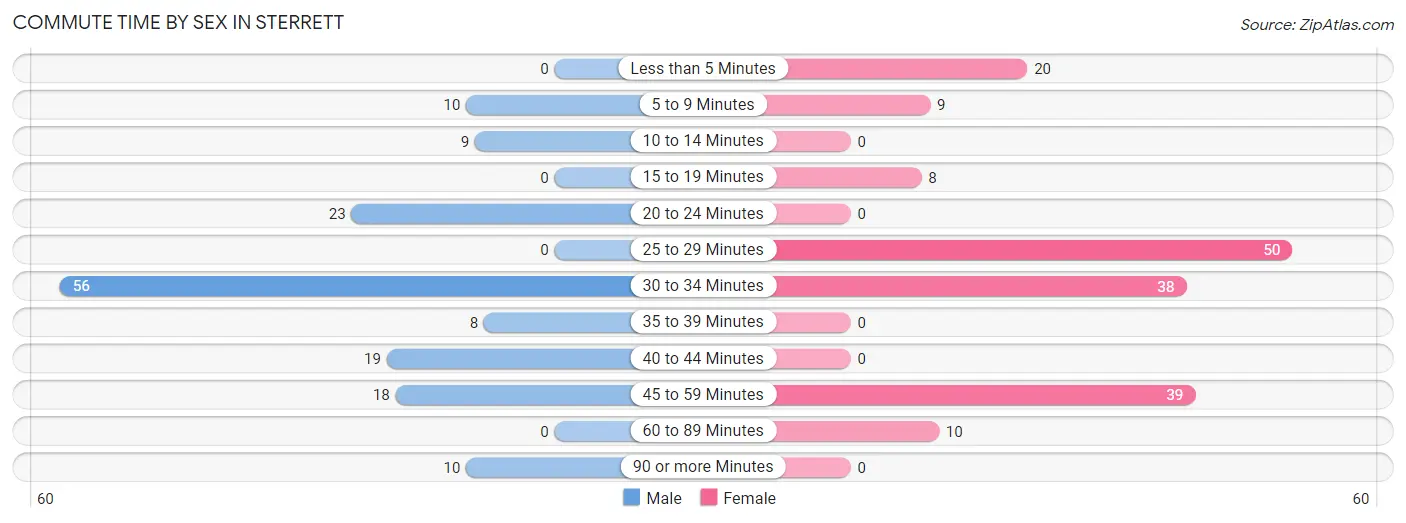
| Commute Time | Male | Female |
| Less than 5 Minutes | 0 (0.0%) | 20 (11.5%) |
| 5 to 9 Minutes | 10 (6.5%) | 9 (5.2%) |
| 10 to 14 Minutes | 9 (5.9%) | 0 (0.0%) |
| 15 to 19 Minutes | 0 (0.0%) | 8 (4.6%) |
| 20 to 24 Minutes | 23 (15.0%) | 0 (0.0%) |
| 25 to 29 Minutes | 0 (0.0%) | 50 (28.7%) |
| 30 to 34 Minutes | 56 (36.6%) | 38 (21.8%) |
| 35 to 39 Minutes | 8 (5.2%) | 0 (0.0%) |
| 40 to 44 Minutes | 19 (12.4%) | 0 (0.0%) |
| 45 to 59 Minutes | 18 (11.8%) | 39 (22.4%) |
| 60 to 89 Minutes | 0 (0.0%) | 10 (5.8%) |
| 90 or more Minutes | 10 (6.5%) | 0 (0.0%) |
Time of Departure to Work by Sex in Sterrett
The most frequent times of departure to work in Sterrett are 6:00 AM to 6:29 AM (46, 30.1%) for males and 6:30 AM to 6:59 AM (64, 36.8%) for females.
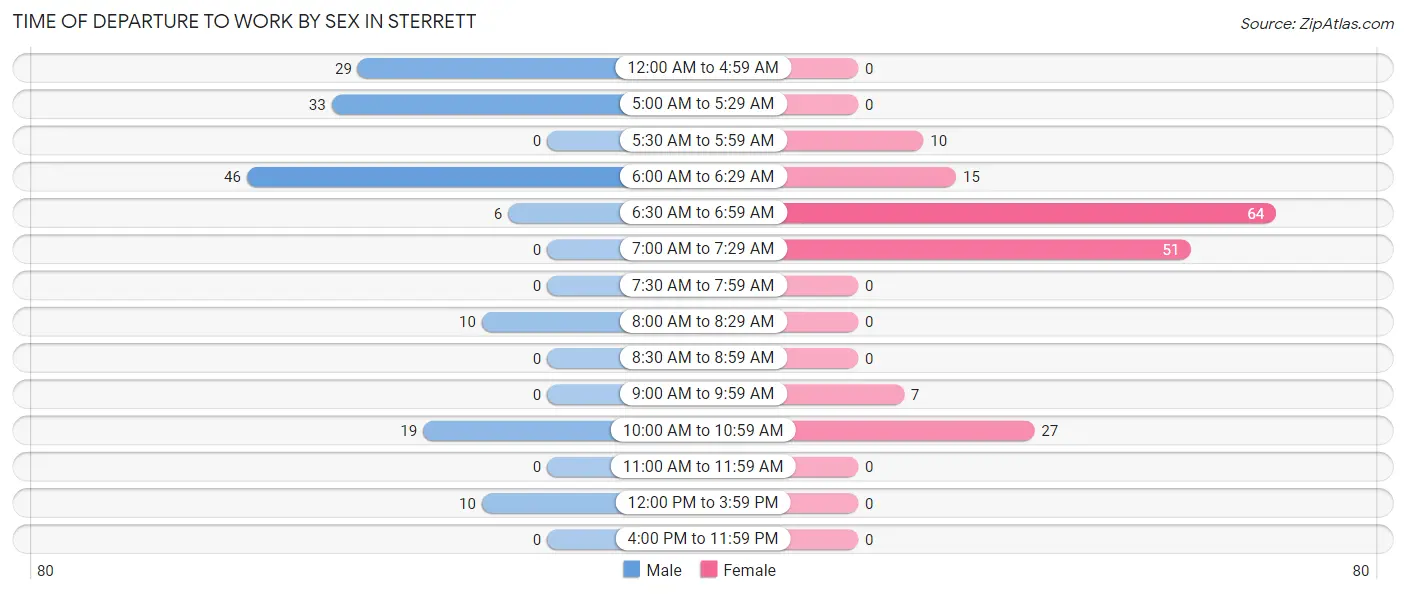
| Time of Departure | Male | Female |
| 12:00 AM to 4:59 AM | 29 (19.0%) | 0 (0.0%) |
| 5:00 AM to 5:29 AM | 33 (21.6%) | 0 (0.0%) |
| 5:30 AM to 5:59 AM | 0 (0.0%) | 10 (5.8%) |
| 6:00 AM to 6:29 AM | 46 (30.1%) | 15 (8.6%) |
| 6:30 AM to 6:59 AM | 6 (3.9%) | 64 (36.8%) |
| 7:00 AM to 7:29 AM | 0 (0.0%) | 51 (29.3%) |
| 7:30 AM to 7:59 AM | 0 (0.0%) | 0 (0.0%) |
| 8:00 AM to 8:29 AM | 10 (6.5%) | 0 (0.0%) |
| 8:30 AM to 8:59 AM | 0 (0.0%) | 0 (0.0%) |
| 9:00 AM to 9:59 AM | 0 (0.0%) | 7 (4.0%) |
| 10:00 AM to 10:59 AM | 19 (12.4%) | 27 (15.5%) |
| 11:00 AM to 11:59 AM | 0 (0.0%) | 0 (0.0%) |
| 12:00 PM to 3:59 PM | 10 (6.5%) | 0 (0.0%) |
| 4:00 PM to 11:59 PM | 0 (0.0%) | 0 (0.0%) |
| Total | 153 (100.0%) | 174 (100.0%) |
Housing Occupancy in Sterrett
Occupancy by Ownership in Sterrett
Of the total 309 dwellings in Sterrett, owner-occupied units account for 309 (100.0%), while renter-occupied units make up 0 (0.0%).
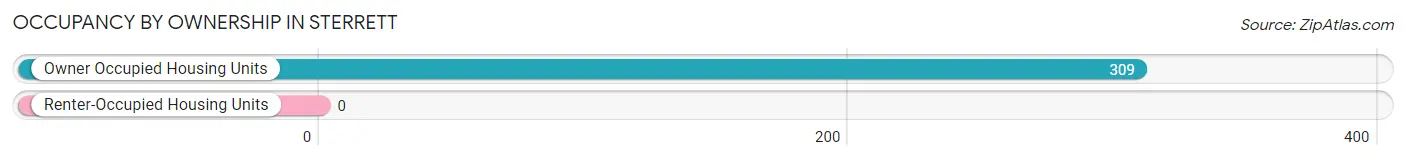
| Occupancy | # Housing Units | % Housing Units |
| Owner Occupied Housing Units | 309 | 100.0% |
| Renter-Occupied Housing Units | 0 | 0.0% |
| Total Occupied Housing Units | 309 | 100.0% |
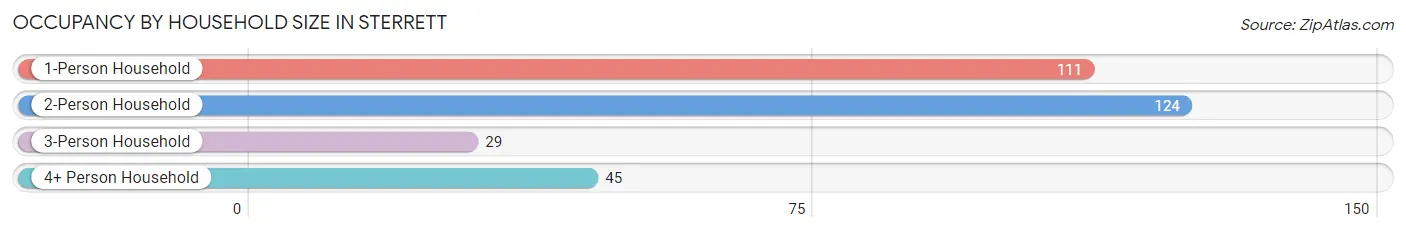
Occupancy by Household Size in Sterrett
| Household Size | # Housing Units | % Housing Units |
| 1-Person Household | 111 | 35.9% |
| 2-Person Household | 124 | 40.1% |
| 3-Person Household | 29 | 9.4% |
| 4+ Person Household | 45 | 14.6% |
| Total Housing Units | 309 | 100.0% |
Occupancy by Ownership by Household Size in Sterrett
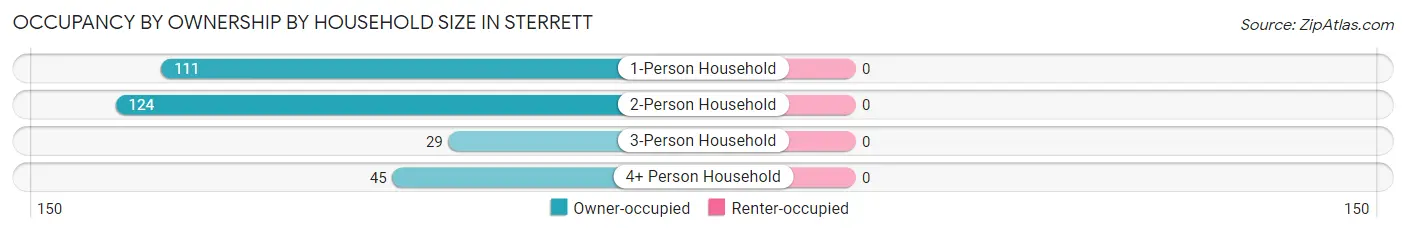
| Household Size | Owner-occupied | Renter-occupied |
| 1-Person Household | 111 (100.0%) | 0 (0.0%) |
| 2-Person Household | 124 (100.0%) | 0 (0.0%) |
| 3-Person Household | 29 (100.0%) | 0 (0.0%) |
| 4+ Person Household | 45 (100.0%) | 0 (0.0%) |
| Total Housing Units | 309 (100.0%) | 0 (0.0%) |
Occupancy by Educational Attainment in Sterrett
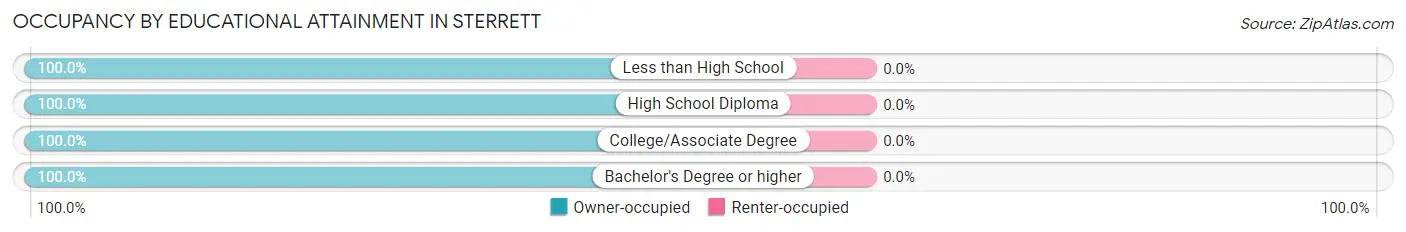
| Household Size | Owner-occupied | Renter-occupied |
| Less than High School | 20 (100.0%) | 0 (0.0%) |
| High School Diploma | 90 (100.0%) | 0 (0.0%) |
| College/Associate Degree | 111 (100.0%) | 0 (0.0%) |
| Bachelor's Degree or higher | 88 (100.0%) | 0 (0.0%) |
Occupancy by Age of Householder in Sterrett
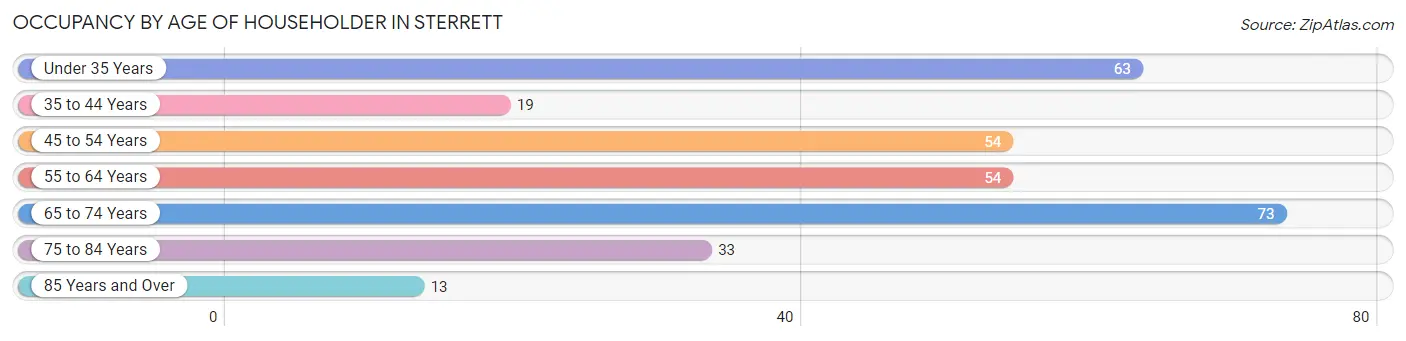
| Age Bracket | # Households | % Households |
| Under 35 Years | 63 | 20.4% |
| 35 to 44 Years | 19 | 6.1% |
| 45 to 54 Years | 54 | 17.5% |
| 55 to 64 Years | 54 | 17.5% |
| 65 to 74 Years | 73 | 23.6% |
| 75 to 84 Years | 33 | 10.7% |
| 85 Years and Over | 13 | 4.2% |
| Total | 309 | 100.0% |
Housing Finances in Sterrett
Median Income by Occupancy in Sterrett
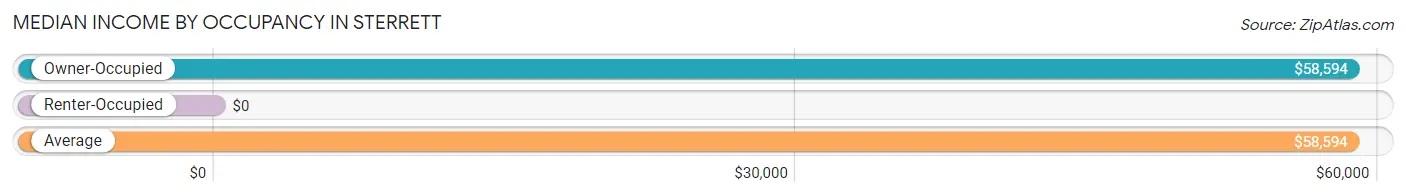
| Occupancy Type | # Households | Median Income |
| Owner-Occupied | 309 (100.0%) | $58,594 |
| Renter-Occupied | 0 (0.0%) | $0 |
| Average | 309 (100.0%) | $58,594 |
Occupancy by Householder Income Bracket in Sterrett
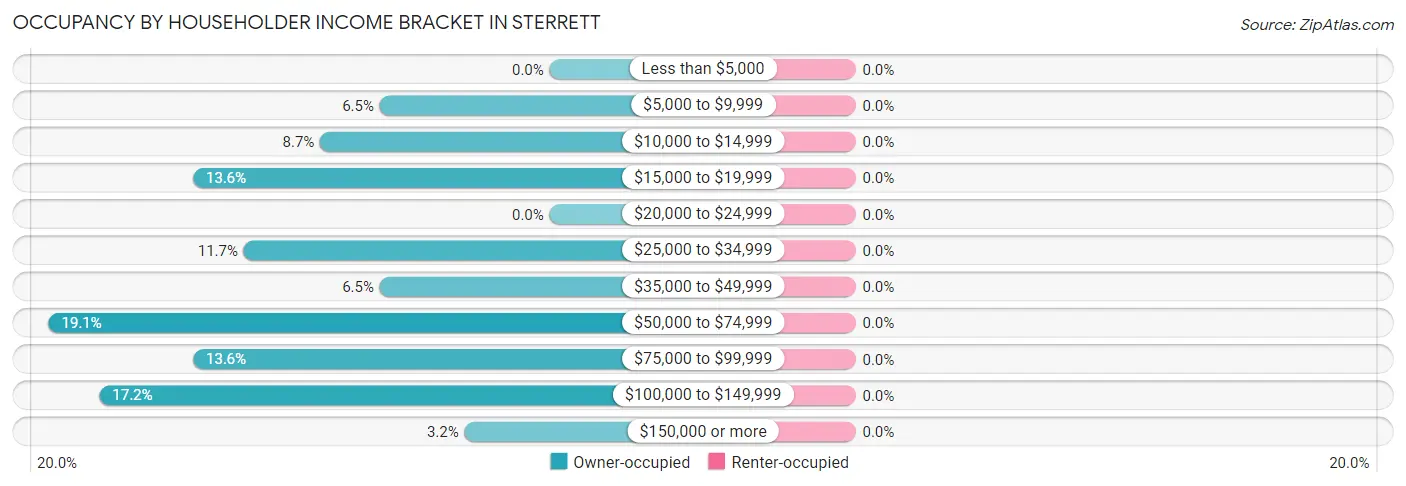
| Income Bracket | Owner-occupied | Renter-occupied |
| Less than $5,000 | 0 (0.0%) | 0 (0.0%) |
| $5,000 to $9,999 | 20 (6.5%) | 0 (0.0%) |
| $10,000 to $14,999 | 27 (8.7%) | 0 (0.0%) |
| $15,000 to $19,999 | 42 (13.6%) | 0 (0.0%) |
| $20,000 to $24,999 | 0 (0.0%) | 0 (0.0%) |
| $25,000 to $34,999 | 36 (11.7%) | 0 (0.0%) |
| $35,000 to $49,999 | 20 (6.5%) | 0 (0.0%) |
| $50,000 to $74,999 | 59 (19.1%) | 0 (0.0%) |
| $75,000 to $99,999 | 42 (13.6%) | 0 (0.0%) |
| $100,000 to $149,999 | 53 (17.2%) | 0 (0.0%) |
| $150,000 or more | 10 (3.2%) | 0 (0.0%) |
| Total | 309 (100.0%) | 0 (0.0%) |
Monthly Housing Cost Tiers in Sterrett
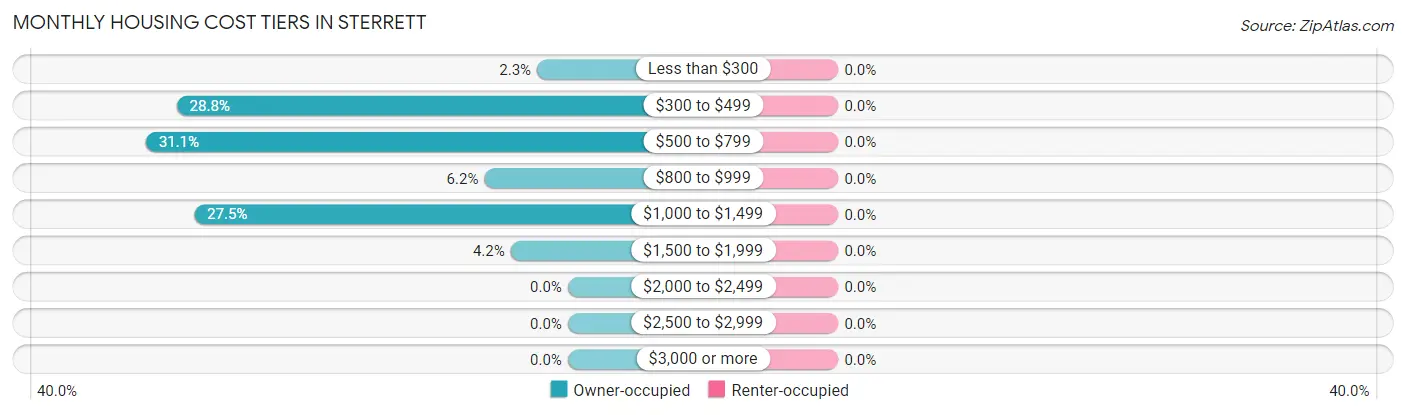
| Monthly Cost | Owner-occupied | Renter-occupied |
| Less than $300 | 7 (2.3%) | 0 (0.0%) |
| $300 to $499 | 89 (28.8%) | 0 (0.0%) |
| $500 to $799 | 96 (31.1%) | 0 (0.0%) |
| $800 to $999 | 19 (6.1%) | 0 (0.0%) |
| $1,000 to $1,499 | 85 (27.5%) | 0 (0.0%) |
| $1,500 to $1,999 | 13 (4.2%) | 0 (0.0%) |
| $2,000 to $2,499 | 0 (0.0%) | 0 (0.0%) |
| $2,500 to $2,999 | 0 (0.0%) | 0 (0.0%) |
| $3,000 or more | 0 (0.0%) | 0 (0.0%) |
| Total | 309 (100.0%) | 0 (0.0%) |
Physical Housing Characteristics in Sterrett
Housing Structures in Sterrett
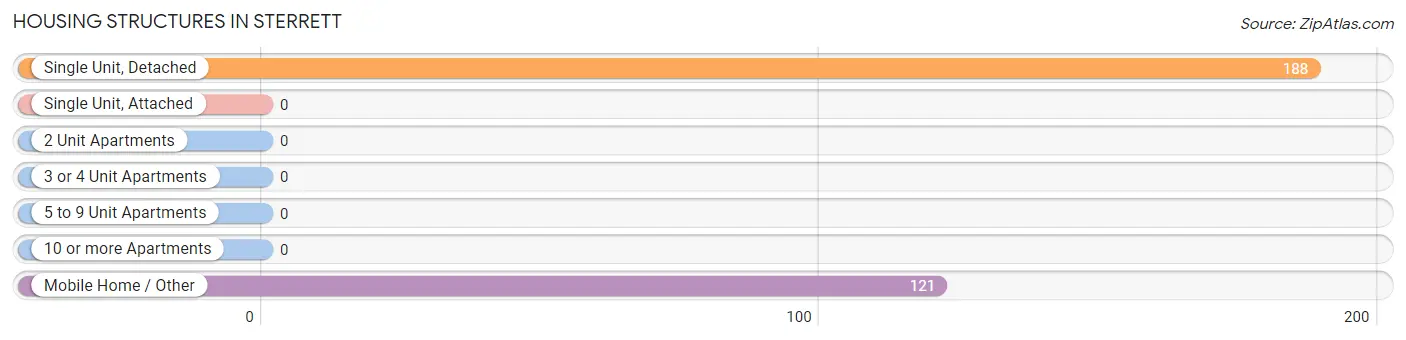
| Structure Type | # Housing Units | % Housing Units |
| Single Unit, Detached | 188 | 60.8% |
| Single Unit, Attached | 0 | 0.0% |
| 2 Unit Apartments | 0 | 0.0% |
| 3 or 4 Unit Apartments | 0 | 0.0% |
| 5 to 9 Unit Apartments | 0 | 0.0% |
| 10 or more Apartments | 0 | 0.0% |
| Mobile Home / Other | 121 | 39.2% |
| Total | 309 | 100.0% |
Housing Structures by Occupancy in Sterrett
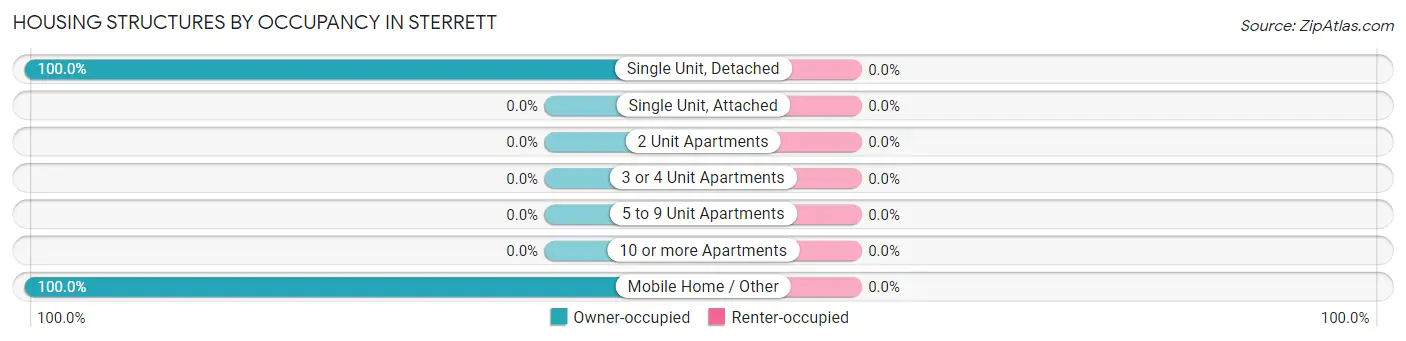
| Structure Type | Owner-occupied | Renter-occupied |
| Single Unit, Detached | 188 (100.0%) | 0 (0.0%) |
| Single Unit, Attached | 0 (0.0%) | 0 (0.0%) |
| 2 Unit Apartments | 0 (0.0%) | 0 (0.0%) |
| 3 or 4 Unit Apartments | 0 (0.0%) | 0 (0.0%) |
| 5 to 9 Unit Apartments | 0 (0.0%) | 0 (0.0%) |
| 10 or more Apartments | 0 (0.0%) | 0 (0.0%) |
| Mobile Home / Other | 121 (100.0%) | 0 (0.0%) |
| Total | 309 (100.0%) | 0 (0.0%) |
Housing Structures by Number of Rooms in Sterrett
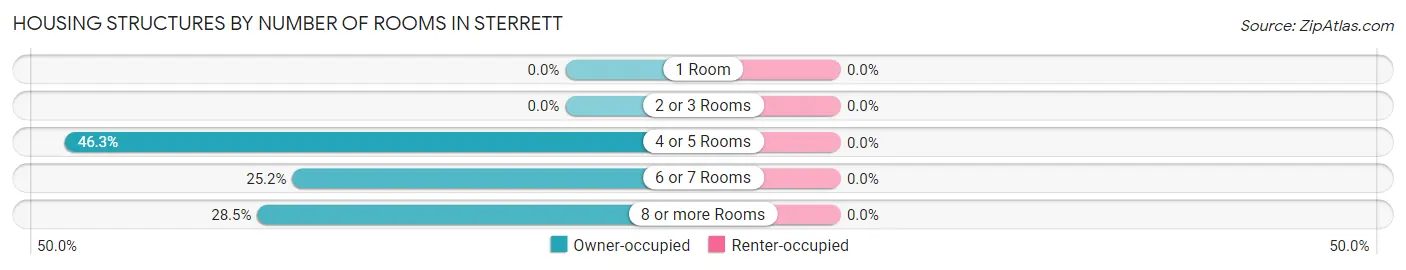
| Number of Rooms | Owner-occupied | Renter-occupied |
| 1 Room | 0 (0.0%) | 0 (0.0%) |
| 2 or 3 Rooms | 0 (0.0%) | 0 (0.0%) |
| 4 or 5 Rooms | 143 (46.3%) | 0 (0.0%) |
| 6 or 7 Rooms | 78 (25.2%) | 0 (0.0%) |
| 8 or more Rooms | 88 (28.5%) | 0 (0.0%) |
| Total | 309 (100.0%) | 0 (0.0%) |
Housing Structure by Heating Type in Sterrett
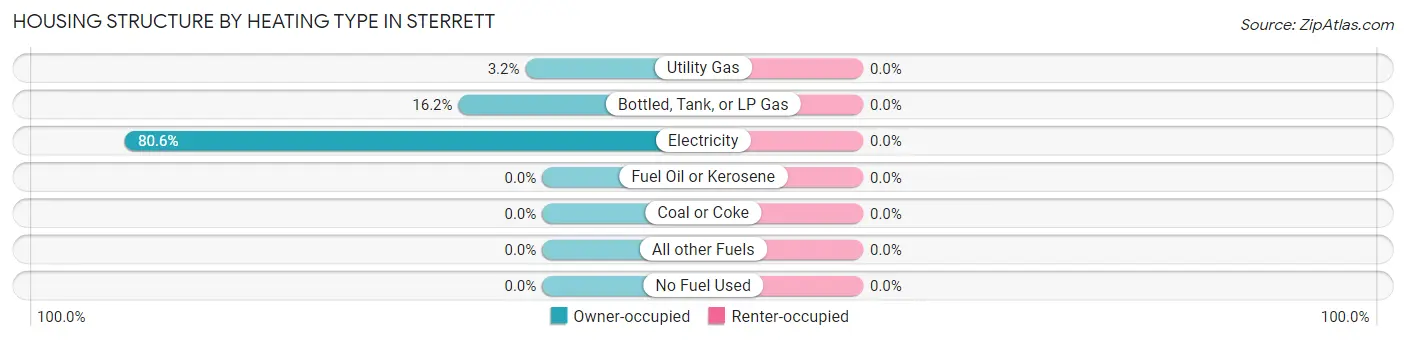
| Heating Type | Owner-occupied | Renter-occupied |
| Utility Gas | 10 (3.2%) | 0 (0.0%) |
| Bottled, Tank, or LP Gas | 50 (16.2%) | 0 (0.0%) |
| Electricity | 249 (80.6%) | 0 (0.0%) |
| Fuel Oil or Kerosene | 0 (0.0%) | 0 (0.0%) |
| Coal or Coke | 0 (0.0%) | 0 (0.0%) |
| All other Fuels | 0 (0.0%) | 0 (0.0%) |
| No Fuel Used | 0 (0.0%) | 0 (0.0%) |
| Total | 309 (100.0%) | 0 (0.0%) |
Household Vehicle Usage in Sterrett
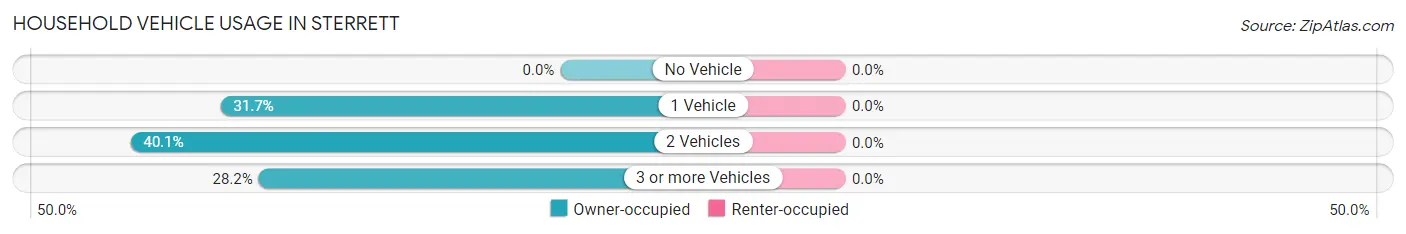
| Vehicles per Household | Owner-occupied | Renter-occupied |
| No Vehicle | 0 (0.0%) | 0 (0.0%) |
| 1 Vehicle | 98 (31.7%) | 0 (0.0%) |
| 2 Vehicles | 124 (40.1%) | 0 (0.0%) |
| 3 or more Vehicles | 87 (28.2%) | 0 (0.0%) |
| Total | 309 (100.0%) | 0 (0.0%) |
Real Estate & Mortgages in Sterrett
Real Estate and Mortgage Overview in Sterrett
| Characteristic | Without Mortgage | With Mortgage |
| Housing Units | 149 | 160 |
| Median Property Value | $325,000 | $162,500 |
| Median Household Income | - | - |
| Monthly Housing Costs | $402 | $0 |
| Real Estate Taxes | - | - |
Property Value by Mortgage Status in Sterrett
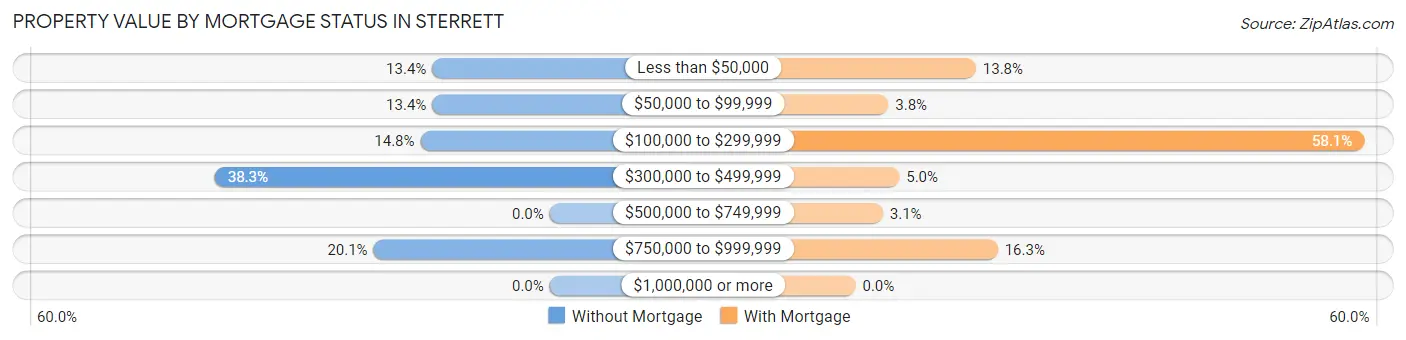
| Property Value | Without Mortgage | With Mortgage |
| Less than $50,000 | 20 (13.4%) | 22 (13.8%) |
| $50,000 to $99,999 | 20 (13.4%) | 6 (3.7%) |
| $100,000 to $299,999 | 22 (14.8%) | 93 (58.1%) |
| $300,000 to $499,999 | 57 (38.3%) | 8 (5.0%) |
| $500,000 to $749,999 | 0 (0.0%) | 5 (3.1%) |
| $750,000 to $999,999 | 30 (20.1%) | 26 (16.3%) |
| $1,000,000 or more | 0 (0.0%) | 0 (0.0%) |
| Total | 149 (100.0%) | 160 (100.0%) |
Household Income by Mortgage Status in Sterrett
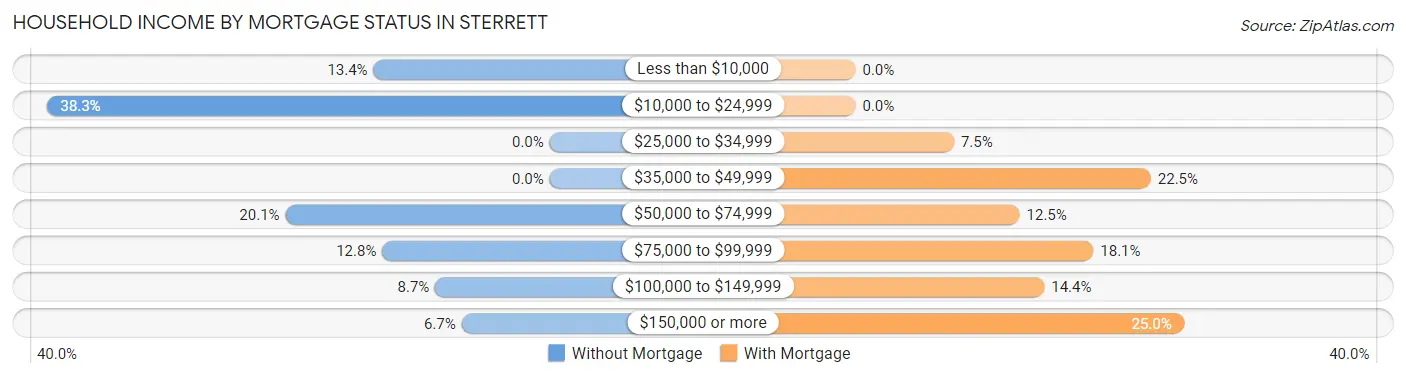
| Household Income | Without Mortgage | With Mortgage |
| Less than $10,000 | 20 (13.4%) | 0 (0.0%) |
| $10,000 to $24,999 | 57 (38.3%) | 0 (0.0%) |
| $25,000 to $34,999 | 0 (0.0%) | 12 (7.5%) |
| $35,000 to $49,999 | 0 (0.0%) | 36 (22.5%) |
| $50,000 to $74,999 | 30 (20.1%) | 20 (12.5%) |
| $75,000 to $99,999 | 19 (12.8%) | 29 (18.1%) |
| $100,000 to $149,999 | 13 (8.7%) | 23 (14.4%) |
| $150,000 or more | 10 (6.7%) | 40 (25.0%) |
| Total | 149 (100.0%) | 160 (100.0%) |
Property Value to Household Income Ratio in Sterrett
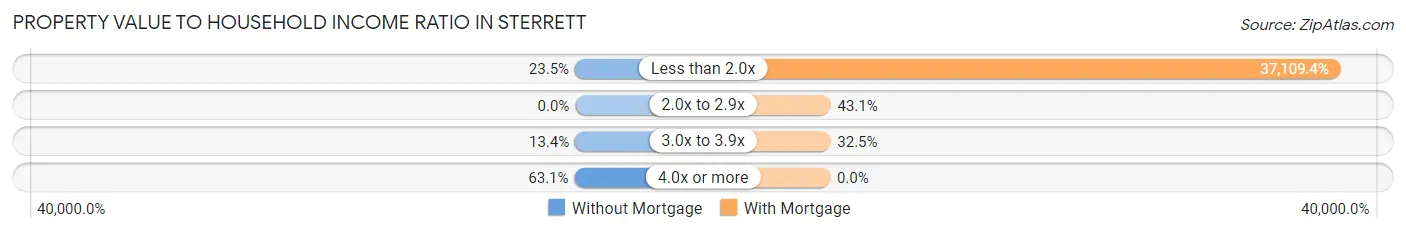
| Value-to-Income Ratio | Without Mortgage | With Mortgage |
| Less than 2.0x | 35 (23.5%) | 59,375 (37,109.4%) |
| 2.0x to 2.9x | 0 (0.0%) | 69 (43.1%) |
| 3.0x to 3.9x | 20 (13.4%) | 52 (32.5%) |
| 4.0x or more | 94 (63.1%) | 0 (0.0%) |
| Total | 149 (100.0%) | 160 (100.0%) |
Real Estate Taxes by Mortgage Status in Sterrett
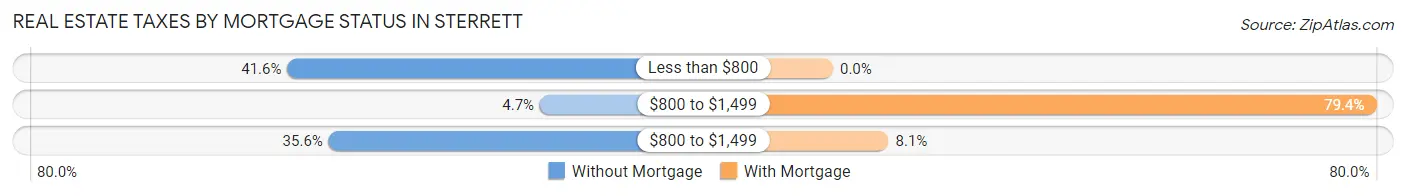
| Property Taxes | Without Mortgage | With Mortgage |
| Less than $800 | 62 (41.6%) | 0 (0.0%) |
| $800 to $1,499 | 7 (4.7%) | 127 (79.4%) |
| $800 to $1,499 | 53 (35.6%) | 13 (8.1%) |
| Total | 149 (100.0%) | 160 (100.0%) |
Health & Disability in Sterrett
Health Insurance Coverage by Age in Sterrett
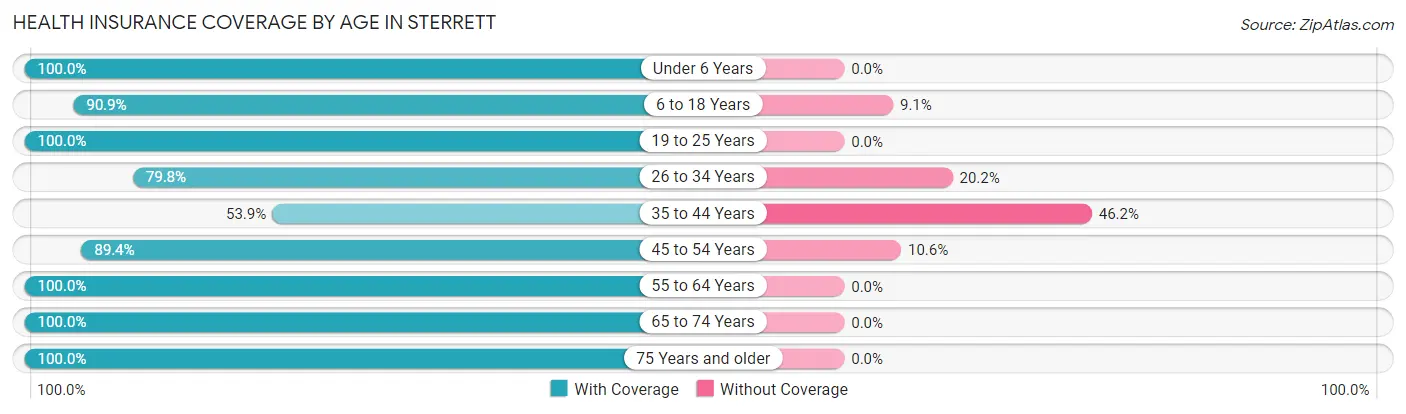
| Age Bracket | With Coverage | Without Coverage |
| Under 6 Years | 72 (100.0%) | 0 (0.0%) |
| 6 to 18 Years | 80 (90.9%) | 8 (9.1%) |
| 19 to 25 Years | 57 (100.0%) | 0 (0.0%) |
| 26 to 34 Years | 83 (79.8%) | 21 (20.2%) |
| 35 to 44 Years | 14 (53.8%) | 12 (46.2%) |
| 45 to 54 Years | 76 (89.4%) | 9 (10.6%) |
| 55 to 64 Years | 85 (100.0%) | 0 (0.0%) |
| 65 to 74 Years | 144 (100.0%) | 0 (0.0%) |
| 75 Years and older | 72 (100.0%) | 0 (0.0%) |
| Total | 683 (93.2%) | 50 (6.8%) |
Health Insurance Coverage by Citizenship Status in Sterrett
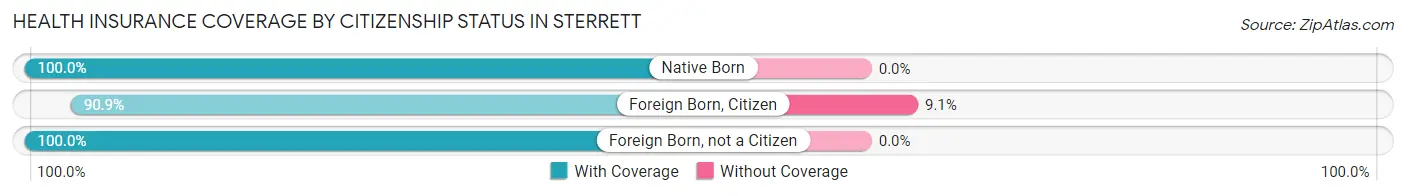
| Citizenship Status | With Coverage | Without Coverage |
| Native Born | 72 (100.0%) | 0 (0.0%) |
| Foreign Born, Citizen | 80 (90.9%) | 8 (9.1%) |
| Foreign Born, not a Citizen | 57 (100.0%) | 0 (0.0%) |
Health Insurance Coverage by Household Income in Sterrett
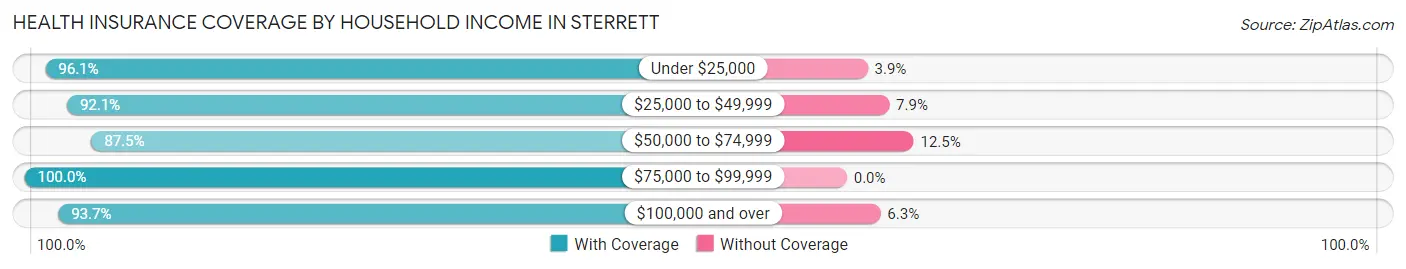
| Household Income | With Coverage | Without Coverage |
| Under $25,000 | 173 (96.1%) | 7 (3.9%) |
| $25,000 to $49,999 | 58 (92.1%) | 5 (7.9%) |
| $50,000 to $74,999 | 147 (87.5%) | 21 (12.5%) |
| $75,000 to $99,999 | 52 (100.0%) | 0 (0.0%) |
| $100,000 and over | 253 (93.7%) | 17 (6.3%) |
Public vs Private Health Insurance Coverage by Age in Sterrett
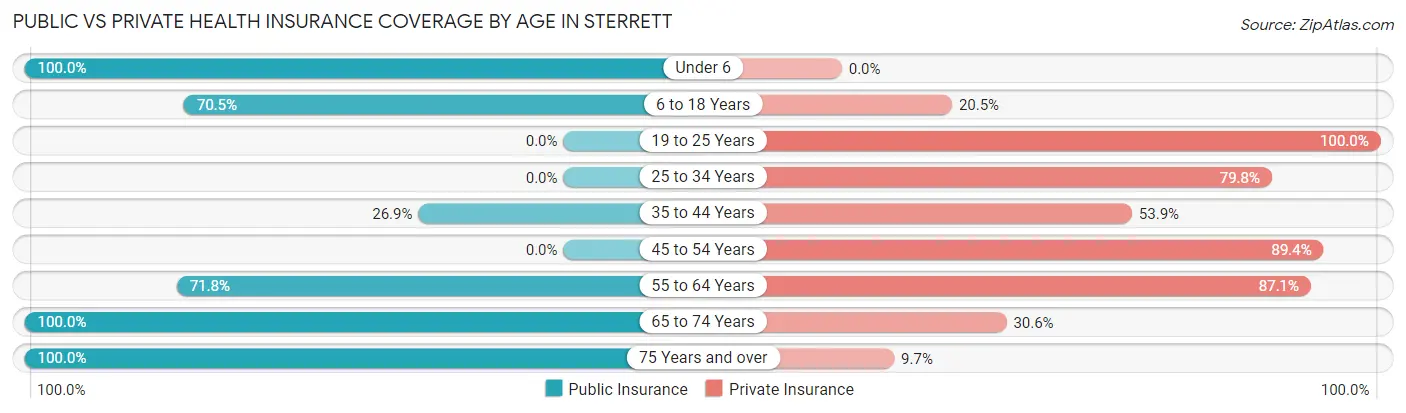
| Age Bracket | Public Insurance | Private Insurance |
| Under 6 | 72 (100.0%) | 0 (0.0%) |
| 6 to 18 Years | 62 (70.5%) | 18 (20.4%) |
| 19 to 25 Years | 0 (0.0%) | 57 (100.0%) |
| 25 to 34 Years | 0 (0.0%) | 83 (79.8%) |
| 35 to 44 Years | 7 (26.9%) | 14 (53.8%) |
| 45 to 54 Years | 0 (0.0%) | 76 (89.4%) |
| 55 to 64 Years | 61 (71.8%) | 74 (87.1%) |
| 65 to 74 Years | 144 (100.0%) | 44 (30.6%) |
| 75 Years and over | 72 (100.0%) | 7 (9.7%) |
| Total | 418 (57.0%) | 373 (50.9%) |
Disability Status by Sex by Age in Sterrett
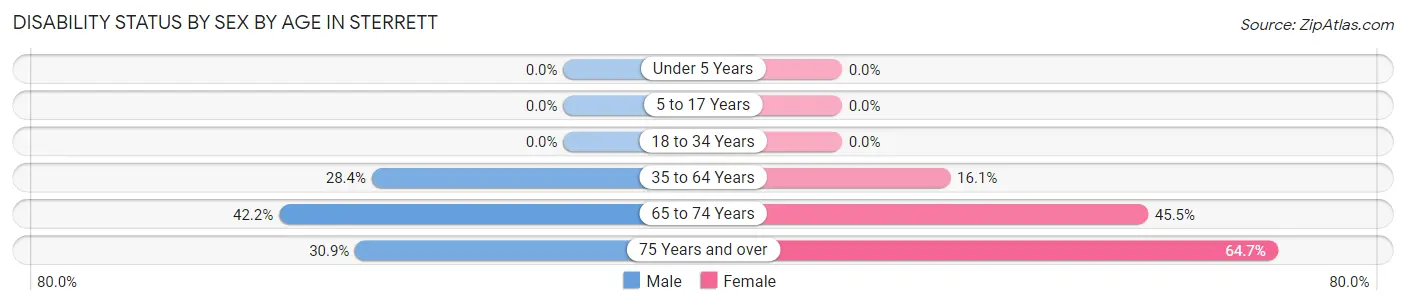
| Age Bracket | Male | Female |
| Under 5 Years | 0 (0.0%) | 0 (0.0%) |
| 5 to 17 Years | 0 (0.0%) | 0 (0.0%) |
| 18 to 34 Years | 0 (0.0%) | 0 (0.0%) |
| 35 to 64 Years | 31 (28.4%) | 14 (16.1%) |
| 65 to 74 Years | 19 (42.2%) | 45 (45.5%) |
| 75 Years and over | 17 (30.9%) | 11 (64.7%) |
Disability Class by Sex by Age in Sterrett
Disability Class: Hearing Difficulty
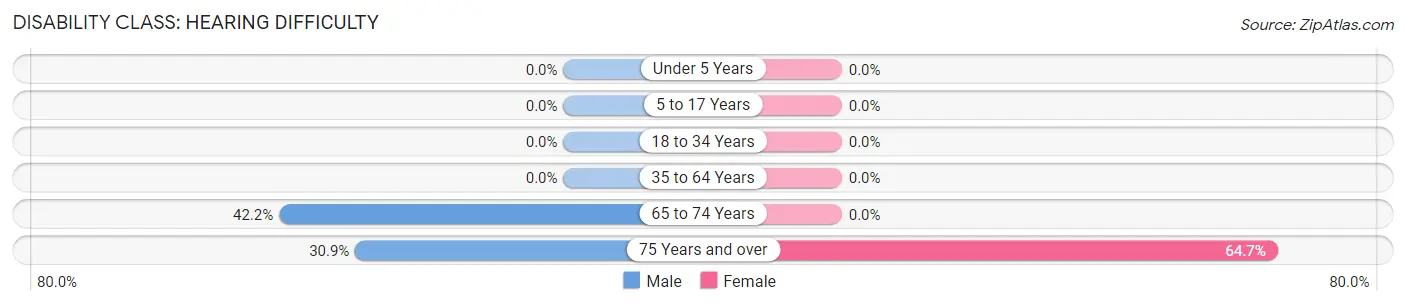
| Age Bracket | Male | Female |
| Under 5 Years | 0 (0.0%) | 0 (0.0%) |
| 5 to 17 Years | 0 (0.0%) | 0 (0.0%) |
| 18 to 34 Years | 0 (0.0%) | 0 (0.0%) |
| 35 to 64 Years | 0 (0.0%) | 0 (0.0%) |
| 65 to 74 Years | 19 (42.2%) | 0 (0.0%) |
| 75 Years and over | 17 (30.9%) | 11 (64.7%) |
Disability Class: Vision Difficulty
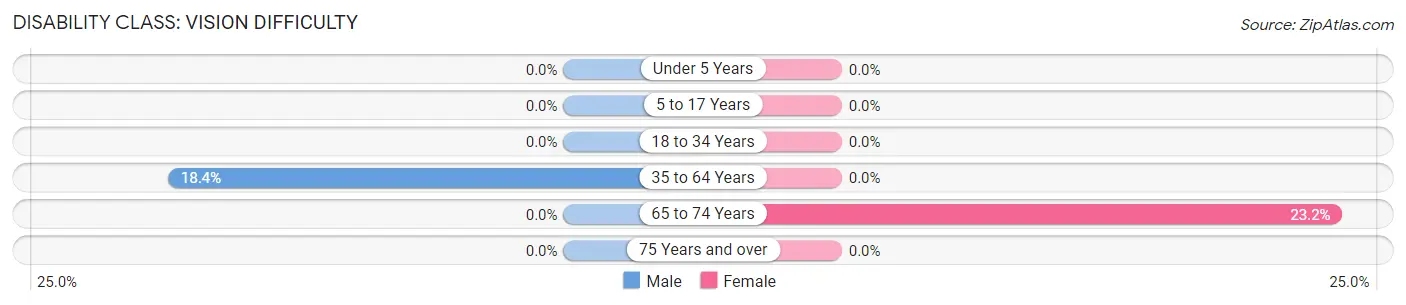
| Age Bracket | Male | Female |
| Under 5 Years | 0 (0.0%) | 0 (0.0%) |
| 5 to 17 Years | 0 (0.0%) | 0 (0.0%) |
| 18 to 34 Years | 0 (0.0%) | 0 (0.0%) |
| 35 to 64 Years | 20 (18.3%) | 0 (0.0%) |
| 65 to 74 Years | 0 (0.0%) | 23 (23.2%) |
| 75 Years and over | 0 (0.0%) | 0 (0.0%) |
Disability Class: Cognitive Difficulty
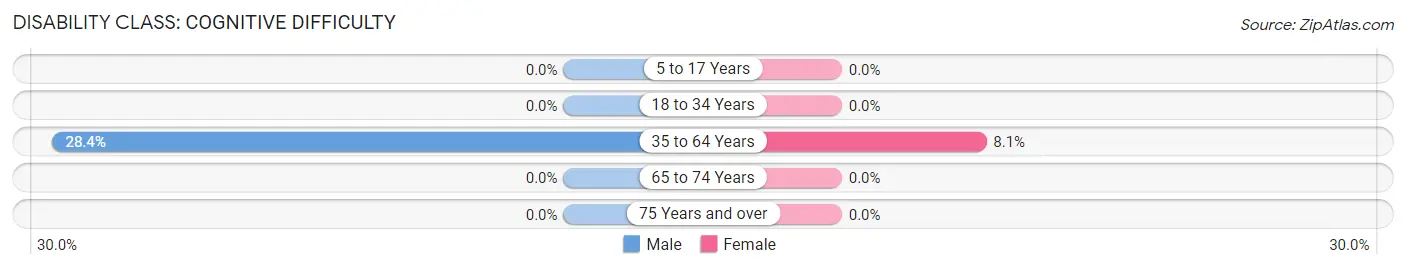
| Age Bracket | Male | Female |
| 5 to 17 Years | 0 (0.0%) | 0 (0.0%) |
| 18 to 34 Years | 0 (0.0%) | 0 (0.0%) |
| 35 to 64 Years | 31 (28.4%) | 7 (8.1%) |
| 65 to 74 Years | 0 (0.0%) | 0 (0.0%) |
| 75 Years and over | 0 (0.0%) | 0 (0.0%) |
Disability Class: Ambulatory Difficulty
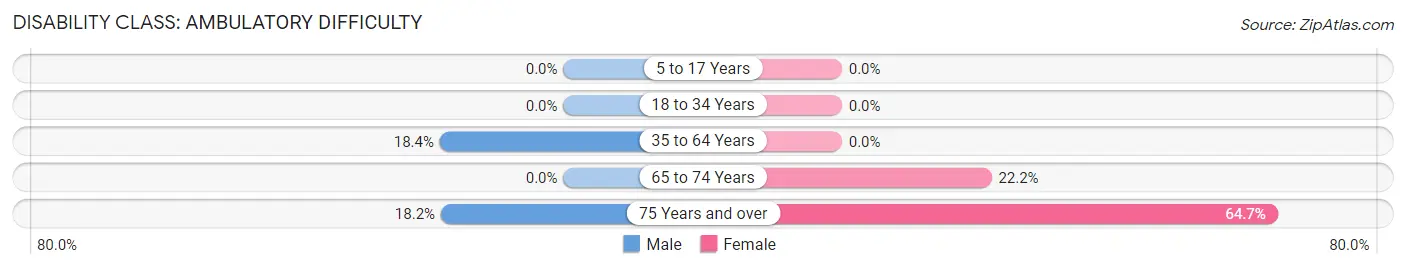
| Age Bracket | Male | Female |
| 5 to 17 Years | 0 (0.0%) | 0 (0.0%) |
| 18 to 34 Years | 0 (0.0%) | 0 (0.0%) |
| 35 to 64 Years | 20 (18.3%) | 0 (0.0%) |
| 65 to 74 Years | 0 (0.0%) | 22 (22.2%) |
| 75 Years and over | 10 (18.2%) | 11 (64.7%) |
Disability Class: Self-Care Difficulty
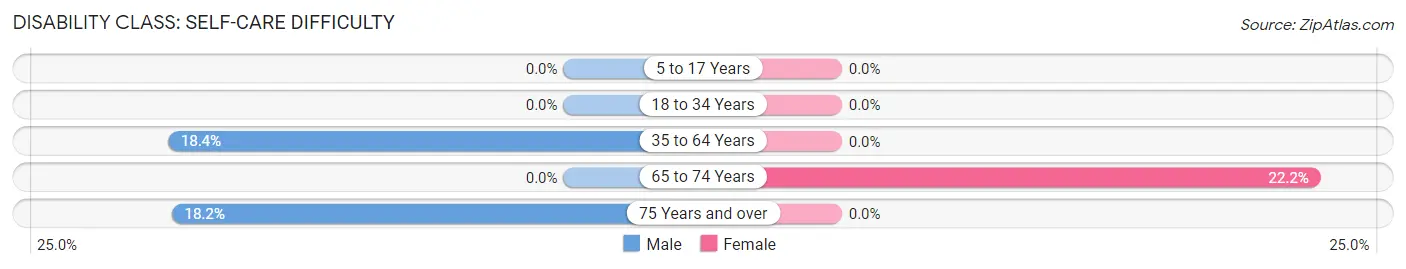
| Age Bracket | Male | Female |
| 5 to 17 Years | 0 (0.0%) | 0 (0.0%) |
| 18 to 34 Years | 0 (0.0%) | 0 (0.0%) |
| 35 to 64 Years | 20 (18.3%) | 0 (0.0%) |
| 65 to 74 Years | 0 (0.0%) | 22 (22.2%) |
| 75 Years and over | 10 (18.2%) | 0 (0.0%) |
Technology Access in Sterrett
Computing Device Access in Sterrett
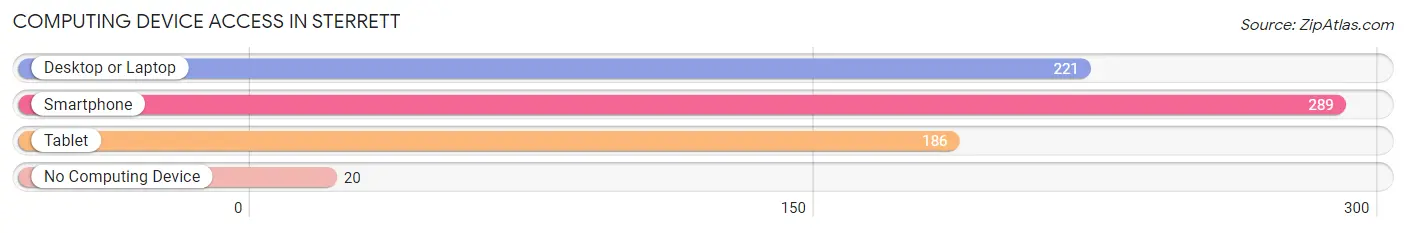
| Device Type | # Households | % Households |
| Desktop or Laptop | 221 | 71.5% |
| Smartphone | 289 | 93.5% |
| Tablet | 186 | 60.2% |
| No Computing Device | 20 | 6.5% |
| Total | 309 | 100.0% |
Internet Access in Sterrett
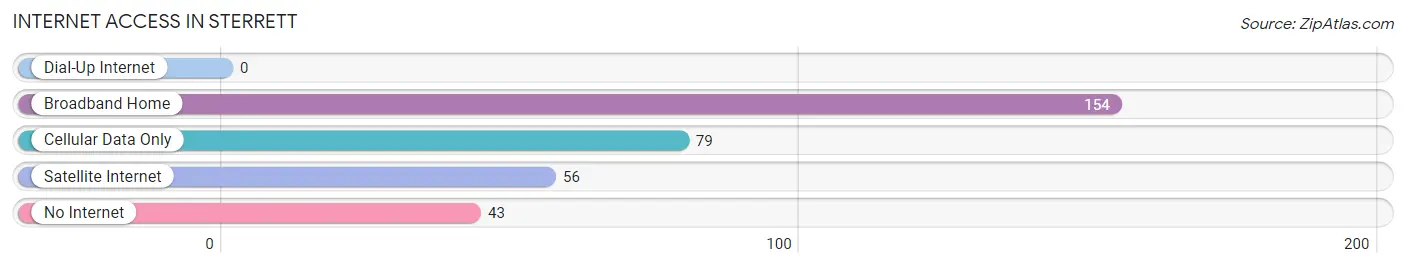
| Internet Type | # Households | % Households |
| Dial-Up Internet | 0 | 0.0% |
| Broadband Home | 154 | 49.8% |
| Cellular Data Only | 79 | 25.6% |
| Satellite Internet | 56 | 18.1% |
| No Internet | 43 | 13.9% |
| Total | 309 | 100.0% |
Sterrett Summary
Sterrett is a small unincorporated community located in Shelby County, Alabama. It is situated approximately 20 miles south of Birmingham and is part of the Birmingham-Hoover Metropolitan Statistical Area. The population of Sterrett was estimated to be 1,845 in 2019.
History
Sterrett was founded in 1883 by William Sterrett, a former Confederate soldier. The town was named after him and was originally a farming community. In the early 1900s, the town began to grow and develop as a result of the coal mining industry. The coal mines provided jobs for many of the town’s residents and helped to fuel the local economy.
In the 1950s, Sterrett began to experience a decline in population as many of the coal mines closed. This decline continued until the late 1980s when the town began to experience a resurgence in population growth. This growth was largely due to the influx of new residents who were attracted to the area’s rural charm and proximity to Birmingham.
Geography
Sterrett is located in the foothills of the Appalachian Mountains in central Alabama. The town is situated on the banks of the Cahaba River and is surrounded by rolling hills and forests. The climate in Sterrett is humid subtropical, with hot summers and mild winters.
Economy
Sterrett’s economy is largely based on agriculture and tourism. The town is home to several farms that produce a variety of crops, including corn, soybeans, and cotton. In addition, Sterrett is home to several small businesses, including restaurants, retail stores, and service providers.
The town is also a popular tourist destination, as it is located close to several major attractions, including the Birmingham Zoo, the Birmingham Botanical Gardens, and the Barber Motorsports Park.
Demographics
As of the 2019 census, the population of Sterrett was estimated to be 1,845. The racial makeup of the town was 94.3% White, 2.2% African American, 0.7% Native American, 0.3% Asian, 0.1% Pacific Islander, and 2.4% from other races. The median household income in Sterrett was $45,938, and the median age was 38.7 years.
Conclusion
Sterrett is a small unincorporated community located in Shelby County, Alabama. It is situated approximately 20 miles south of Birmingham and is part of the Birmingham-Hoover Metropolitan Statistical Area. The town was founded in 1883 and has a population of 1,845 as of 2019. The economy of Sterrett is largely based on agriculture and tourism, and the town is home to several small businesses. The racial makeup of the town is 94.3% White, 2.2% African American, 0.7% Native American, 0.3% Asian, 0.1% Pacific Islander, and 2.4% from other races. The median household income in Sterrett was $45,938, and the median age was 38.7 years.
Common Questions
What is Per Capita Income in Sterrett?
Per Capita income in Sterrett is $27,523.
What is the Median Family Income in Sterrett?
Median Family Income in Sterrett is $61,250.
What is the Median Household income in Sterrett?
Median Household Income in Sterrett is $58,594.
What is Income or Wage Gap in Sterrett?
Income or Wage Gap in Sterrett is 45.9%.
Women in Sterrett earn 54.1 cents for every dollar earned by a man.
What is Inequality or Gini Index in Sterrett?
Inequality or Gini Index in Sterrett is 0.40.
What is the Total Population of Sterrett?
Total Population of Sterrett is 733.
What is the Total Male Population of Sterrett?
Total Male Population of Sterrett is 421.
What is the Total Female Population of Sterrett?
Total Female Population of Sterrett is 312.
What is the Ratio of Males per 100 Females in Sterrett?
There are 134.94 Males per 100 Females in Sterrett.
What is the Ratio of Females per 100 Males in Sterrett?
There are 74.11 Females per 100 Males in Sterrett.
What is the Median Population Age in Sterrett?
Median Population Age in Sterrett is 49.7 Years.
What is the Average Family Size in Sterrett
Average Family Size in Sterrett is 3.1 People.
What is the Average Household Size in Sterrett
Average Household Size in Sterrett is 2.4 People.
How Large is the Labor Force in Sterrett?
There are 377 People in the Labor Forcein in Sterrett.
What is the Percentage of People in the Labor Force in Sterrett?
59.7% of People are in the Labor Force in Sterrett.
What is the Unemployment Rate in Sterrett?
Unemployment Rate in Sterrett is 13.3%.