Spruce Pine, AL Map & Demographics
Spruce Pine Map
Spruce Pine Overview
$22,359
PER CAPITA INCOME
37.5%
WAGE / INCOME GAP [ % ]
62.5¢/ $1
WAGE / INCOME GAP [ $ ]
0.51
INEQUALITY / GINI INDEX
109
TOTAL POPULATION
56
MALE POPULATION
53
FEMALE POPULATION
105.66
MALES / 100 FEMALES
94.64
FEMALES / 100 MALES
46.8
MEDIAN AGE
2.1
AVG FAMILY SIZE
2.1
AVG HOUSEHOLD SIZE
64
LABOR FORCE [ PEOPLE ]
61.5%
PERCENT IN LABOR FORCE
Spruce Pine Zip Codes
Income in Spruce Pine
Income Overview in Spruce Pine
| Characteristic | Number | Measure |
| Per Capita Income | 109 | $22,359 |
| Median Family Income | 51 | $0 |
| Mean Family Income | 51 | $48,886 |
| Median Household Income | 51 | $0 |
| Mean Household Income | 51 | $48,886 |
| Income Deficit | 51 | $0 |
| Wage / Income Gap (%) | 109 | 37.52% |
| Wage / Income Gap ($) | 109 | 62.48¢ per $1 |
| Gini / Inequality Index | 109 | 0.51 |
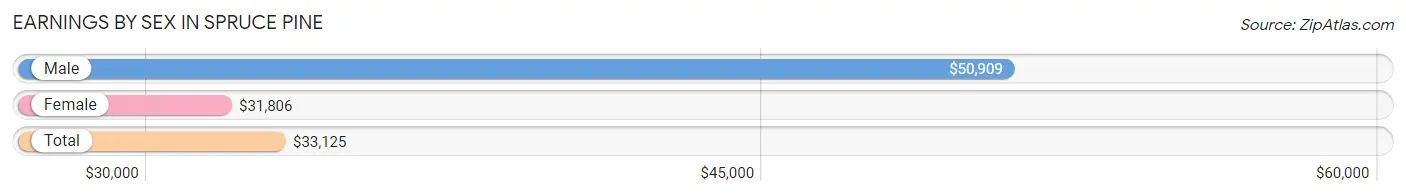
Earnings by Sex in Spruce Pine
Average Earnings in Spruce Pine are $33,125, $50,909 for men and $31,806 for women, a difference of 37.5%.
| Sex | Number | Average Earnings |
| Male | 38 (59.4%) | $50,909 |
| Female | 26 (40.6%) | $31,806 |
| Total | 64 (100.0%) | $33,125 |
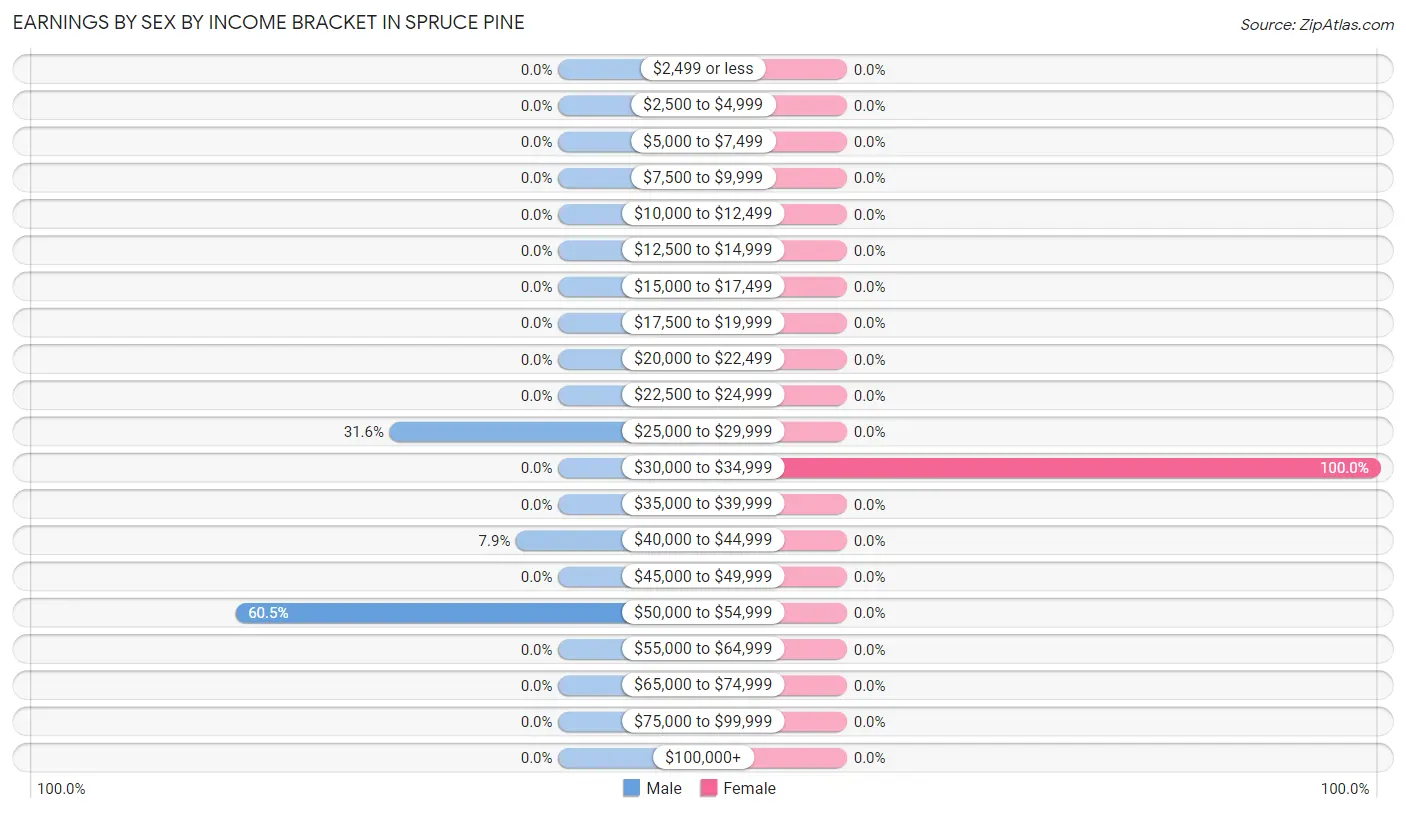
Earnings by Sex by Income Bracket in Spruce Pine
The most common earnings brackets in Spruce Pine are $50,000 to $54,999 for men (23 | 60.5%) and $30,000 to $34,999 for women (26 | 100.0%).
| Income | Male | Female |
| $2,499 or less | 0 (0.0%) | 0 (0.0%) |
| $2,500 to $4,999 | 0 (0.0%) | 0 (0.0%) |
| $5,000 to $7,499 | 0 (0.0%) | 0 (0.0%) |
| $7,500 to $9,999 | 0 (0.0%) | 0 (0.0%) |
| $10,000 to $12,499 | 0 (0.0%) | 0 (0.0%) |
| $12,500 to $14,999 | 0 (0.0%) | 0 (0.0%) |
| $15,000 to $17,499 | 0 (0.0%) | 0 (0.0%) |
| $17,500 to $19,999 | 0 (0.0%) | 0 (0.0%) |
| $20,000 to $22,499 | 0 (0.0%) | 0 (0.0%) |
| $22,500 to $24,999 | 0 (0.0%) | 0 (0.0%) |
| $25,000 to $29,999 | 12 (31.6%) | 0 (0.0%) |
| $30,000 to $34,999 | 0 (0.0%) | 26 (100.0%) |
| $35,000 to $39,999 | 0 (0.0%) | 0 (0.0%) |
| $40,000 to $44,999 | 3 (7.9%) | 0 (0.0%) |
| $45,000 to $49,999 | 0 (0.0%) | 0 (0.0%) |
| $50,000 to $54,999 | 23 (60.5%) | 0 (0.0%) |
| $55,000 to $64,999 | 0 (0.0%) | 0 (0.0%) |
| $65,000 to $74,999 | 0 (0.0%) | 0 (0.0%) |
| $75,000 to $99,999 | 0 (0.0%) | 0 (0.0%) |
| $100,000+ | 0 (0.0%) | 0 (0.0%) |
| Total | 38 (100.0%) | 26 (100.0%) |
Earnings by Sex by Educational Attainment in Spruce Pine
| Educational Attainment | Male Income | Female Income |
| Less than High School | - | - |
| High School Diploma | - | - |
| College or Associate's Degree | - | - |
| Bachelor's Degree | - | - |
| Graduate Degree | - | - |
| Total | $52,273 | $31,806 |
Family Income in Spruce Pine
Family Income Brackets in Spruce Pine
According to the Spruce Pine family income data, there are 24 families falling into the less than $10,000 income range, which is the most common income bracket and makes up 47.1% of all families.

| Income Bracket | # Families | % Families |
| Less than $10,000 | 24 | 47.1% |
| $10,000 to $14,999 | 0 | 0.0% |
| $15,000 to $24,999 | 0 | 0.0% |
| $25,000 to $34,999 | 0 | 0.0% |
| $35,000 to $49,999 | 0 | 0.0% |
| $50,000 to $74,999 | 4 | 7.8% |
| $75,000 to $99,999 | 12 | 23.5% |
| $100,000 to $149,999 | 11 | 21.6% |
| $150,000 to $199,999 | 0 | 0.0% |
| $200,000+ | 0 | 0.0% |
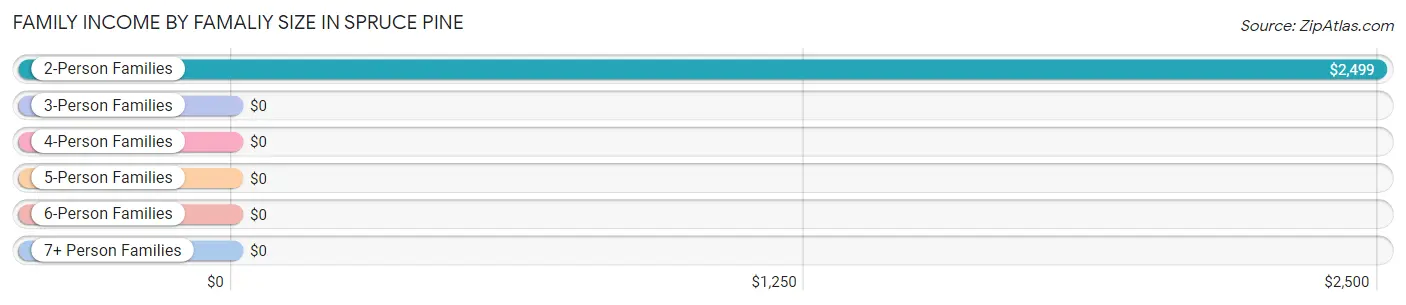
Family Income by Famaliy Size in Spruce Pine
2-person families (36 | 70.6%) account for the highest median family income in Spruce Pine with $2,499 per family, while 2-person families (36 | 70.6%) have the highest median income of $1,250 per family member.
| Income Bracket | # Families | Median Income |
| 2-Person Families | 36 (70.6%) | $2,499 |
| 3-Person Families | 15 (29.4%) | $0 |
| 4-Person Families | 0 (0.0%) | $0 |
| 5-Person Families | 0 (0.0%) | $0 |
| 6-Person Families | 0 (0.0%) | $0 |
| 7+ Person Families | 0 (0.0%) | $0 |
| Total | 51 (100.0%) | $0 |
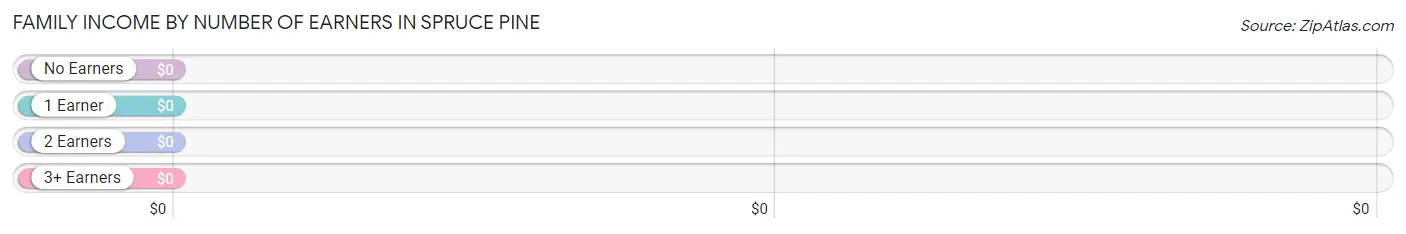
Family Income by Number of Earners in Spruce Pine
| Number of Earners | # Families | Median Income |
| No Earners | 24 (47.1%) | $0 |
| 1 Earner | 0 (0.0%) | $0 |
| 2 Earners | 16 (31.4%) | $0 |
| 3+ Earners | 11 (21.6%) | $0 |
| Total | 51 (100.0%) | $0 |
Household Income in Spruce Pine
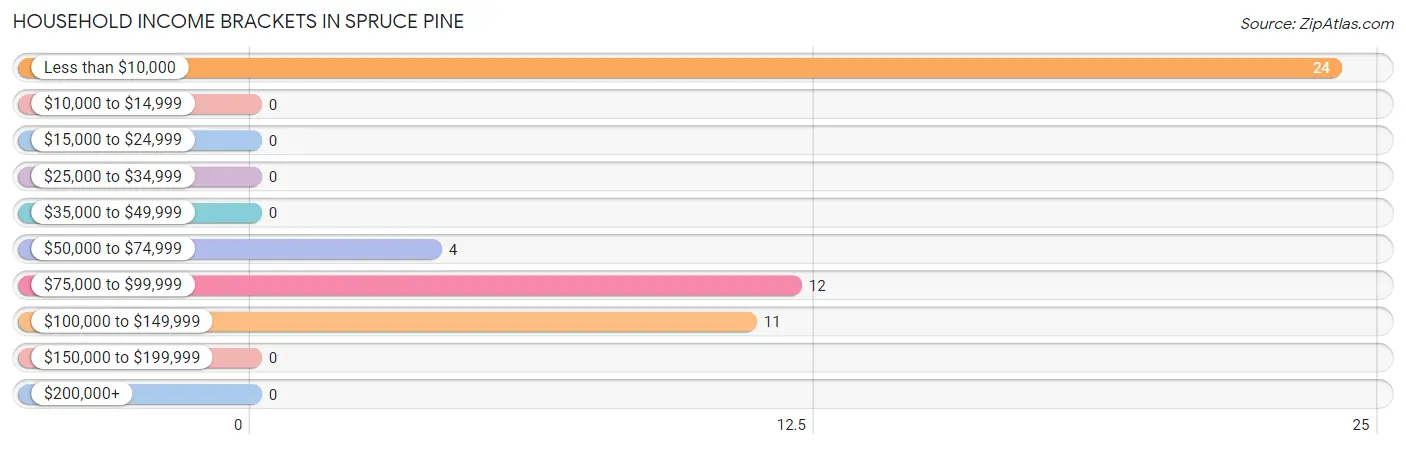
Household Income Brackets in Spruce Pine
With 24 households falling in the category, the less than $10,000 income range is the most frequent in Spruce Pine, accounting for 47.1% of all households.
| Income Bracket | # Households | % Households |
| Less than $10,000 | 24 | 47.1% |
| $10,000 to $14,999 | 0 | 0.0% |
| $15,000 to $24,999 | 0 | 0.0% |
| $25,000 to $34,999 | 0 | 0.0% |
| $35,000 to $49,999 | 0 | 0.0% |
| $50,000 to $74,999 | 4 | 7.8% |
| $75,000 to $99,999 | 12 | 23.5% |
| $100,000 to $149,999 | 11 | 21.6% |
| $150,000 to $199,999 | 0 | 0.0% |
| $200,000+ | 0 | 0.0% |
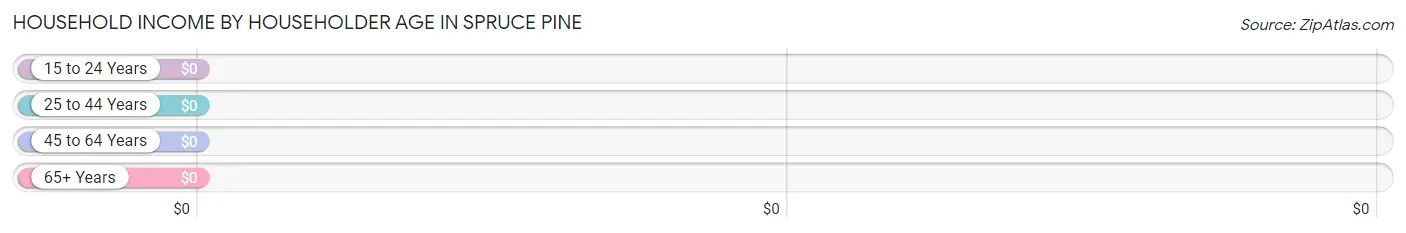
Household Income by Householder Age in Spruce Pine
| Income Bracket | # Households | Median Income |
| 15 to 24 Years | 0 (0.0%) | $0 |
| 25 to 44 Years | 4 (7.8%) | $0 |
| 45 to 64 Years | 34 (66.7%) | $0 |
| 65+ Years | 13 (25.5%) | $0 |
| Total | 51 (100.0%) | $0 |
Poverty in Spruce Pine
Income Below Poverty by Sex and Age in Spruce Pine
With 32.1% poverty level for males and 41.5% for females among the residents of Spruce Pine, 75 year old and over males and 65 to 74 year old females are the most vulnerable to poverty, with 7 males (100.0%) and 13 females (100.0%) in their respective age groups living below the poverty level.
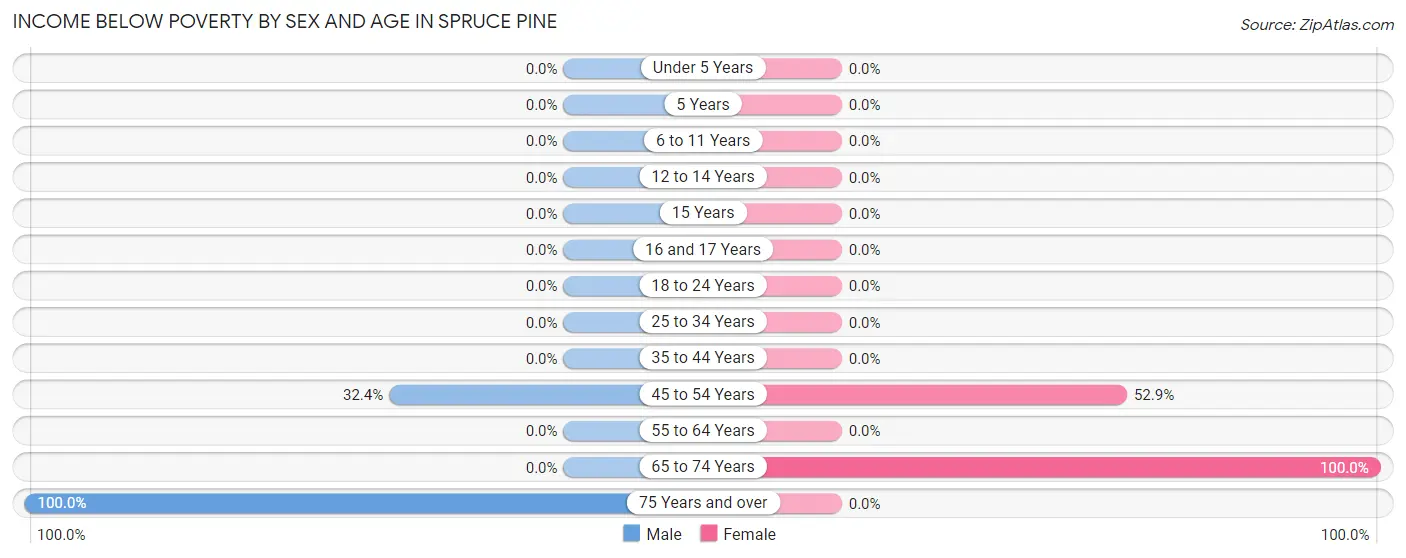
| Age Bracket | Male | Female |
| Under 5 Years | 0 (0.0%) | 0 (0.0%) |
| 5 Years | 0 (0.0%) | 0 (0.0%) |
| 6 to 11 Years | 0 (0.0%) | 0 (0.0%) |
| 12 to 14 Years | 0 (0.0%) | 0 (0.0%) |
| 15 Years | 0 (0.0%) | 0 (0.0%) |
| 16 and 17 Years | 0 (0.0%) | 0 (0.0%) |
| 18 to 24 Years | 0 (0.0%) | 0 (0.0%) |
| 25 to 34 Years | 0 (0.0%) | 0 (0.0%) |
| 35 to 44 Years | 0 (0.0%) | 0 (0.0%) |
| 45 to 54 Years | 11 (32.4%) | 9 (52.9%) |
| 55 to 64 Years | 0 (0.0%) | 0 (0.0%) |
| 65 to 74 Years | 0 (0.0%) | 13 (100.0%) |
| 75 Years and over | 7 (100.0%) | 0 (0.0%) |
| Total | 18 (32.1%) | 22 (41.5%) |
Income Above Poverty by Sex and Age in Spruce Pine
According to the poverty statistics in Spruce Pine, males aged 18 to 24 years and females aged under 5 years are the age groups that are most secure financially, with 100.0% of males and 100.0% of females in these age groups living above the poverty line.
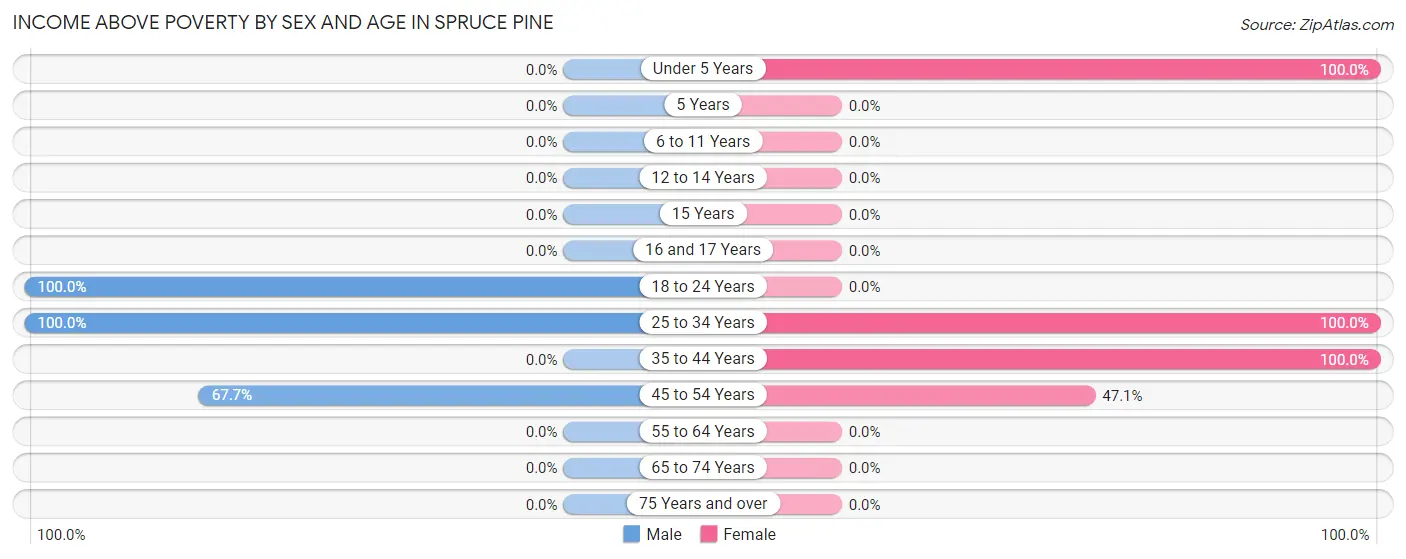
| Age Bracket | Male | Female |
| Under 5 Years | 0 (0.0%) | 5 (100.0%) |
| 5 Years | 0 (0.0%) | 0 (0.0%) |
| 6 to 11 Years | 0 (0.0%) | 0 (0.0%) |
| 12 to 14 Years | 0 (0.0%) | 0 (0.0%) |
| 15 Years | 0 (0.0%) | 0 (0.0%) |
| 16 and 17 Years | 0 (0.0%) | 0 (0.0%) |
| 18 to 24 Years | 12 (100.0%) | 0 (0.0%) |
| 25 to 34 Years | 3 (100.0%) | 4 (100.0%) |
| 35 to 44 Years | 0 (0.0%) | 14 (100.0%) |
| 45 to 54 Years | 23 (67.6%) | 8 (47.1%) |
| 55 to 64 Years | 0 (0.0%) | 0 (0.0%) |
| 65 to 74 Years | 0 (0.0%) | 0 (0.0%) |
| 75 Years and over | 0 (0.0%) | 0 (0.0%) |
| Total | 38 (67.9%) | 31 (58.5%) |
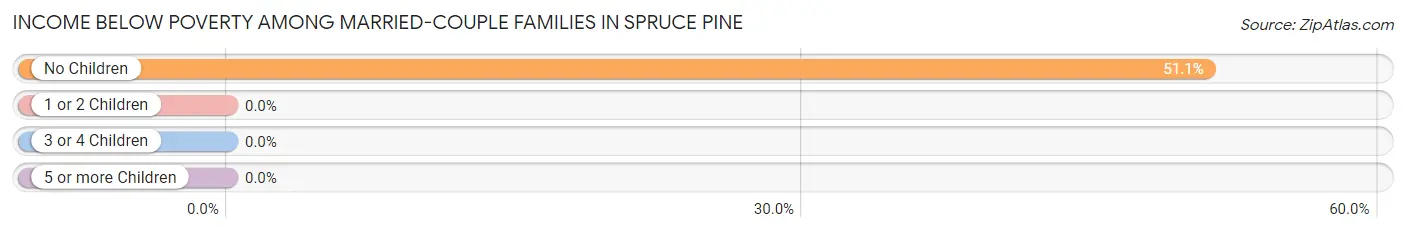
Income Below Poverty Among Married-Couple Families in Spruce Pine
The poverty statistics for married-couple families in Spruce Pine show that 47.1% or 24 of the total 51 families live below the poverty line. Families with no children have the highest poverty rate of 51.1%, comprising of 24 families. On the other hand, families with 1 or 2 children have the lowest poverty rate of 0.0%, which includes 0 families.
| Children | Above Poverty | Below Poverty |
| No Children | 23 (48.9%) | 24 (51.1%) |
| 1 or 2 Children | 4 (100.0%) | 0 (0.0%) |
| 3 or 4 Children | 0 (0.0%) | 0 (0.0%) |
| 5 or more Children | 0 (0.0%) | 0 (0.0%) |
| Total | 27 (52.9%) | 24 (47.1%) |
Income Below Poverty Among Single-Parent Households in Spruce Pine
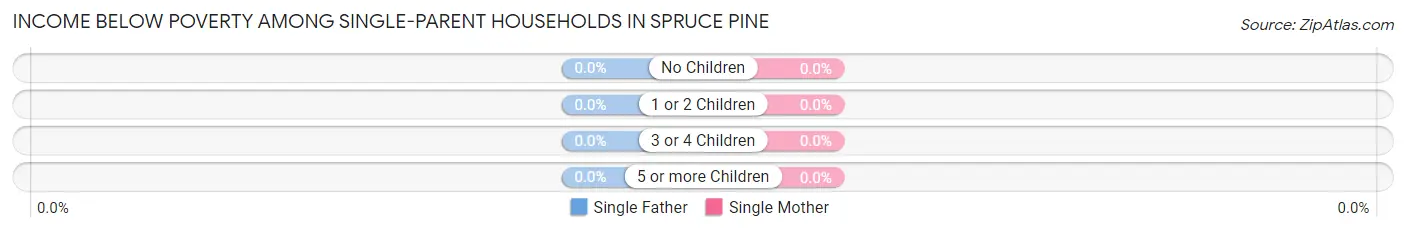
| Children | Single Father | Single Mother |
| No Children | 0 (0.0%) | 0 (0.0%) |
| 1 or 2 Children | 0 (0.0%) | 0 (0.0%) |
| 3 or 4 Children | 0 (0.0%) | 0 (0.0%) |
| 5 or more Children | 0 (0.0%) | 0 (0.0%) |
| Total | 0 (0.0%) | 0 (0.0%) |
Income Below Poverty Among Married-Couple vs Single-Parent Households in Spruce Pine
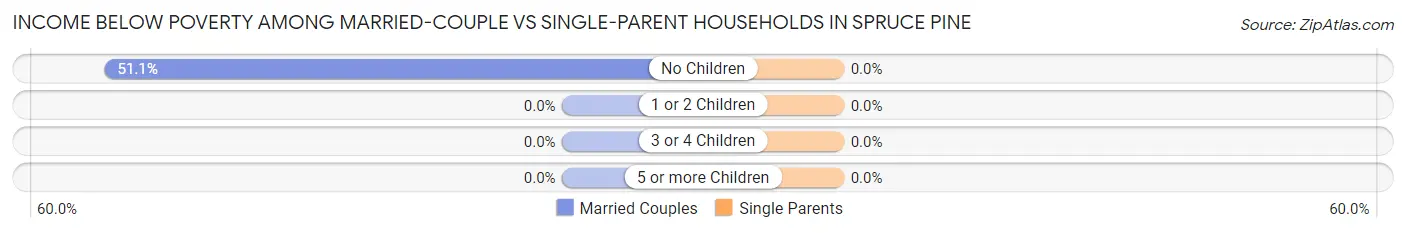
| Children | Married-Couple Families | Single-Parent Households |
| No Children | 24 (51.1%) | 0 (0.0%) |
| 1 or 2 Children | 0 (0.0%) | 0 (0.0%) |
| 3 or 4 Children | 0 (0.0%) | 0 (0.0%) |
| 5 or more Children | 0 (0.0%) | 0 (0.0%) |
| Total | 24 (47.1%) | 0 (0.0%) |
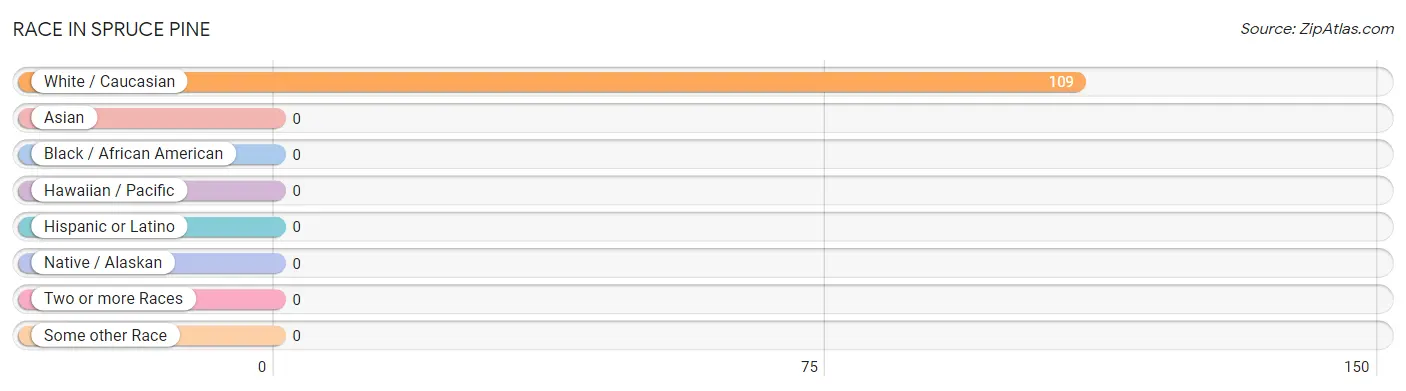
Race in Spruce Pine
The most populous races in Spruce Pine are , and White / Caucasian (109 | 100.0%).
| Race | # Population | % Population |
| Asian | 0 | 0.0% |
| Black / African American | 0 | 0.0% |
| Hawaiian / Pacific | 0 | 0.0% |
| Hispanic or Latino | 0 | 0.0% |
| Native / Alaskan | 0 | 0.0% |
| White / Caucasian | 109 | 100.0% |
| Two or more Races | 0 | 0.0% |
| Some other Race | 0 | 0.0% |
| Total | 109 | 100.0% |
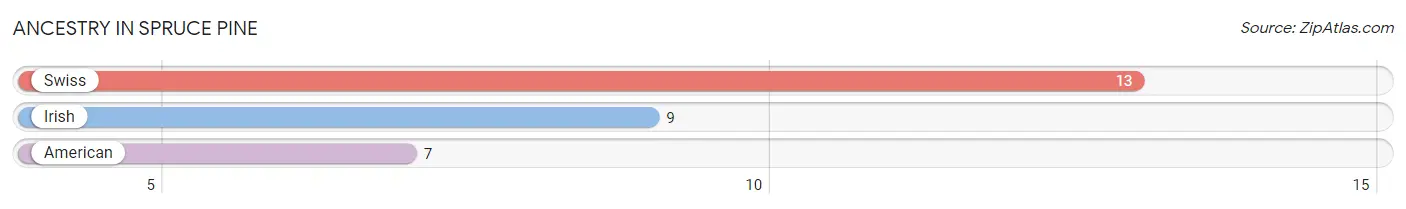
Ancestry in Spruce Pine
The most populous ancestries reported in Spruce Pine are Swiss (13 | 11.9%), Irish (9 | 8.3%), and American (7 | 6.4%), together accounting for 26.6% of all Spruce Pine residents.
| Ancestry | # Population | % Population |
| American | 7 | 6.4% |
| Irish | 9 | 8.3% |
| Swiss | 13 | 11.9% | View All 3 Rows |
Immigrants in Spruce Pine

| Immigration Origin | # Population | % Population | View All 0 Rows |
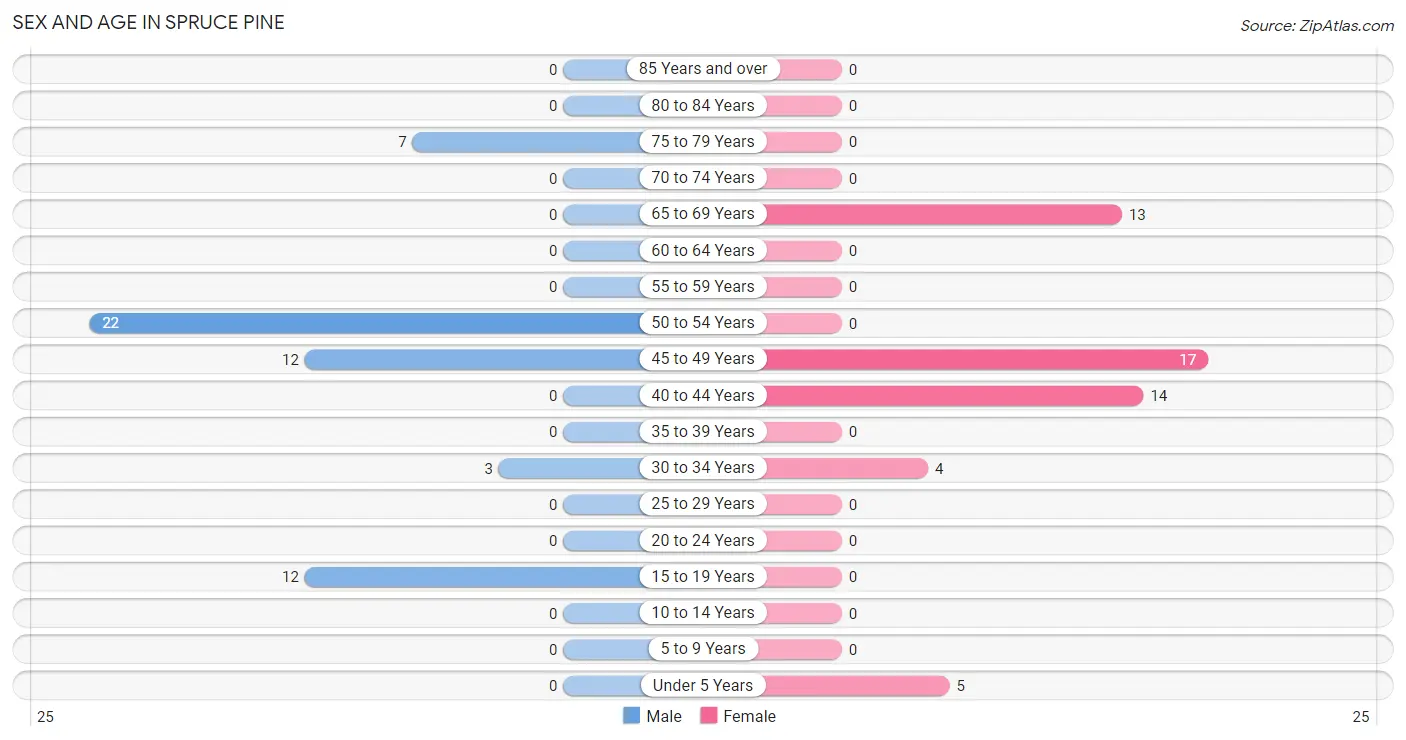
Sex and Age in Spruce Pine
Sex and Age in Spruce Pine
The most populous age groups in Spruce Pine are 50 to 54 Years (22 | 39.3%) for men and 45 to 49 Years (17 | 32.1%) for women.
| Age Bracket | Male | Female |
| Under 5 Years | 0 (0.0%) | 5 (9.4%) |
| 5 to 9 Years | 0 (0.0%) | 0 (0.0%) |
| 10 to 14 Years | 0 (0.0%) | 0 (0.0%) |
| 15 to 19 Years | 12 (21.4%) | 0 (0.0%) |
| 20 to 24 Years | 0 (0.0%) | 0 (0.0%) |
| 25 to 29 Years | 0 (0.0%) | 0 (0.0%) |
| 30 to 34 Years | 3 (5.4%) | 4 (7.5%) |
| 35 to 39 Years | 0 (0.0%) | 0 (0.0%) |
| 40 to 44 Years | 0 (0.0%) | 14 (26.4%) |
| 45 to 49 Years | 12 (21.4%) | 17 (32.1%) |
| 50 to 54 Years | 22 (39.3%) | 0 (0.0%) |
| 55 to 59 Years | 0 (0.0%) | 0 (0.0%) |
| 60 to 64 Years | 0 (0.0%) | 0 (0.0%) |
| 65 to 69 Years | 0 (0.0%) | 13 (24.5%) |
| 70 to 74 Years | 0 (0.0%) | 0 (0.0%) |
| 75 to 79 Years | 7 (12.5%) | 0 (0.0%) |
| 80 to 84 Years | 0 (0.0%) | 0 (0.0%) |
| 85 Years and over | 0 (0.0%) | 0 (0.0%) |
| Total | 56 (100.0%) | 53 (100.0%) |
Families and Households in Spruce Pine
Median Family Size in Spruce Pine
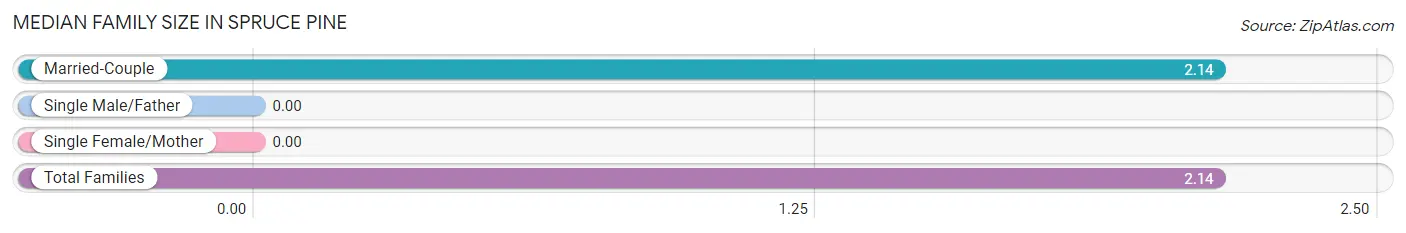
| Family Type | # Families | Family Size |
| Married-Couple | 51 (100.0%) | 2.14 |
| Single Male/Father | 0 (0.0%) | - |
| Single Female/Mother | 0 (0.0%) | - |
| Total Families | 51 (100.0%) | 2.14 |
Median Household Size in Spruce Pine
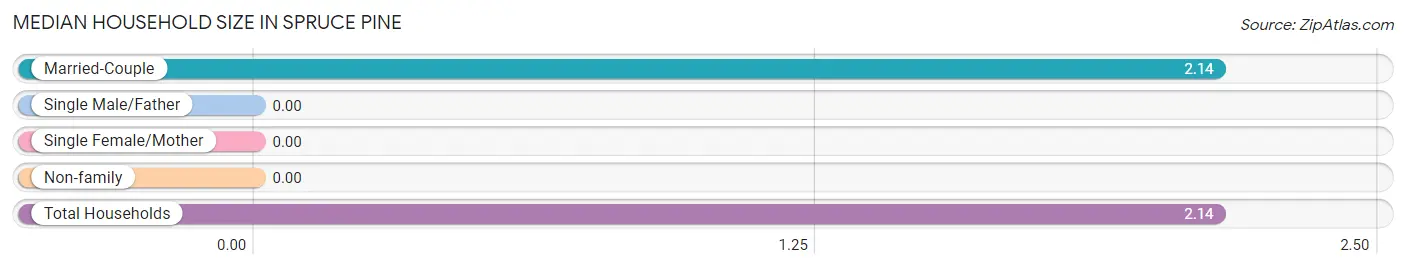
| Household Type | # Households | Household Size |
| Married-Couple | 51 (100.0%) | 2.14 |
| Single Male/Father | 0 (0.0%) | - |
| Single Female/Mother | 0 (0.0%) | - |
| Non-family | 0 (0.0%) | - |
| Total Households | 51 (100.0%) | 2.14 |
Household Size by Marriage Status in Spruce Pine
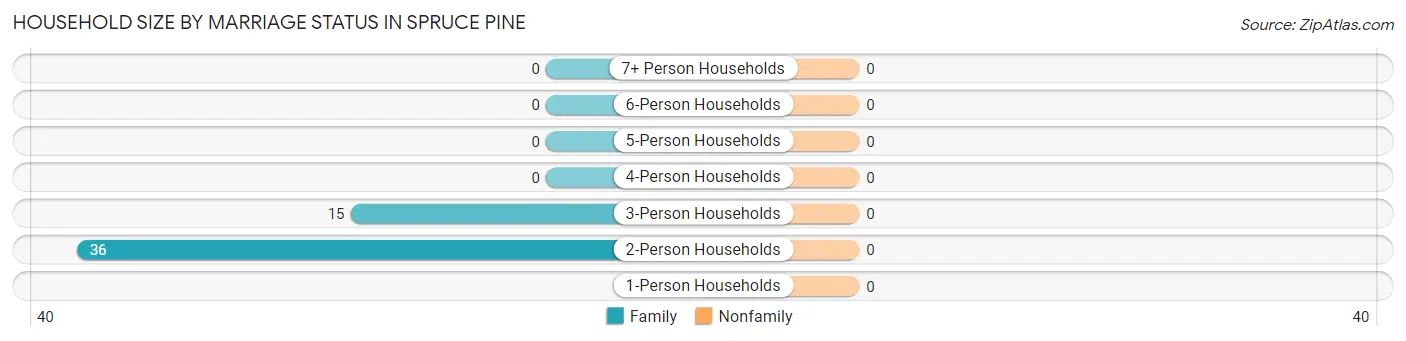
| Household Size | Family Households | Nonfamily Households |
| 1-Person Households | - | 0 (0.0%) |
| 2-Person Households | 36 (70.6%) | 0 (0.0%) |
| 3-Person Households | 15 (29.4%) | 0 (0.0%) |
| 4-Person Households | 0 (0.0%) | 0 (0.0%) |
| 5-Person Households | 0 (0.0%) | 0 (0.0%) |
| 6-Person Households | 0 (0.0%) | 0 (0.0%) |
| 7+ Person Households | 0 (0.0%) | 0 (0.0%) |
| Total | 51 (100.0%) | 0 (0.0%) |
Female Fertility in Spruce Pine
Fertility by Age in Spruce Pine
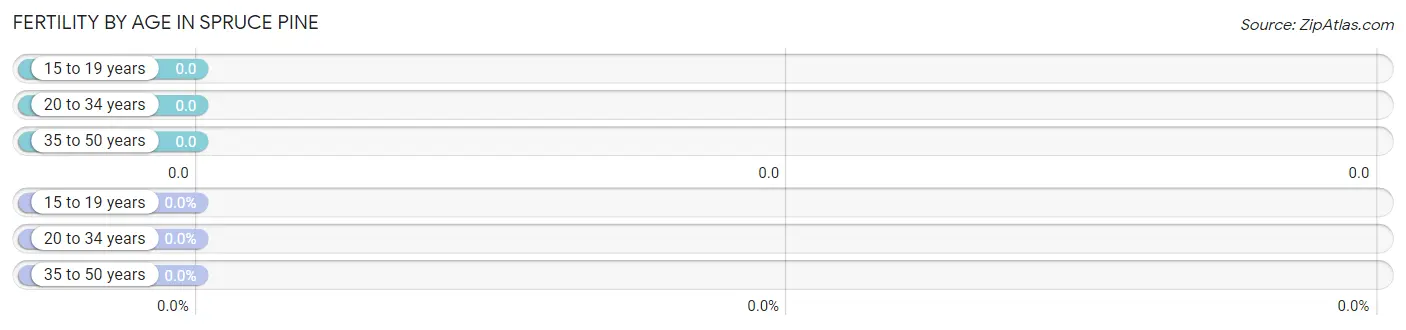
| Age Bracket | Women with Births | Births / 1,000 Women |
| 15 to 19 years | 0 (0.0%) | 0.0 |
| 20 to 34 years | 0 (0.0%) | 0.0 |
| 35 to 50 years | 0 (0.0%) | 0.0 |
| Total | 0 (0.0%) | 0.0 |
Fertility by Age by Marriage Status in Spruce Pine
| Age Bracket | Married | Unmarried |
| 15 to 19 years | 0 (0.0%) | 0 (0.0%) |
| 20 to 34 years | 0 (0.0%) | 0 (0.0%) |
| 35 to 50 years | 0 (0.0%) | 0 (0.0%) |
| Total | 0 (0.0%) | 0 (0.0%) |
Fertility by Education in Spruce Pine
| Educational Attainment | Women with Births | Births / 1,000 Women |
| Less than High School | 0 (0.0%) | 0.0 |
| High School Diploma | 0 (0.0%) | 0.0 |
| College or Associate's Degree | 0 (0.0%) | 0.0 |
| Bachelor's Degree | 0 (0.0%) | 0.0 |
| Graduate Degree | 0 (0.0%) | 0.0 |
| Total | 0 (0.0%) | 0.0 |
Fertility by Education by Marriage Status in Spruce Pine
| Educational Attainment | Married | Unmarried |
| Less than High School | 0 (0.0%) | 0 (0.0%) |
| High School Diploma | 0 (0.0%) | 0 (0.0%) |
| College or Associate's Degree | 0 (0.0%) | 0 (0.0%) |
| Bachelor's Degree | 0 (0.0%) | 0 (0.0%) |
| Graduate Degree | 0 (0.0%) | 0 (0.0%) |
| Total | 0 (0.0%) | 0 (0.0%) |
Employment Characteristics in Spruce Pine
Employment by Class of Employer in Spruce Pine
Among the 64 employed individuals in Spruce Pine, private company employees (52 | 81.2%), and self-employed (incorporated) (12 | 18.8%) make up the most common classes of employment.
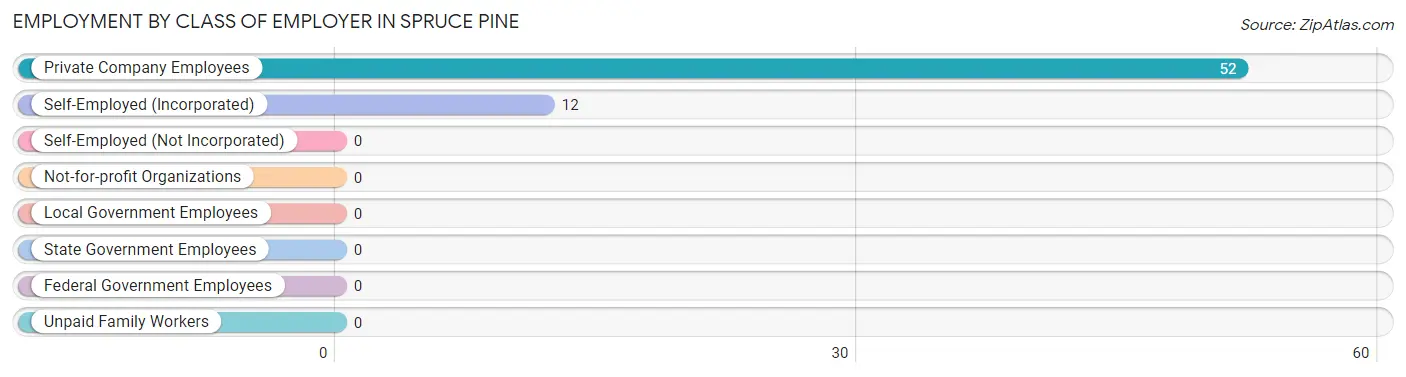
| Employer Class | # Employees | % Employees |
| Private Company Employees | 52 | 81.2% |
| Self-Employed (Incorporated) | 12 | 18.8% |
| Self-Employed (Not Incorporated) | 0 | 0.0% |
| Not-for-profit Organizations | 0 | 0.0% |
| Local Government Employees | 0 | 0.0% |
| State Government Employees | 0 | 0.0% |
| Federal Government Employees | 0 | 0.0% |
| Unpaid Family Workers | 0 | 0.0% |
| Total | 64 | 100.0% |
Employment Status by Age in Spruce Pine
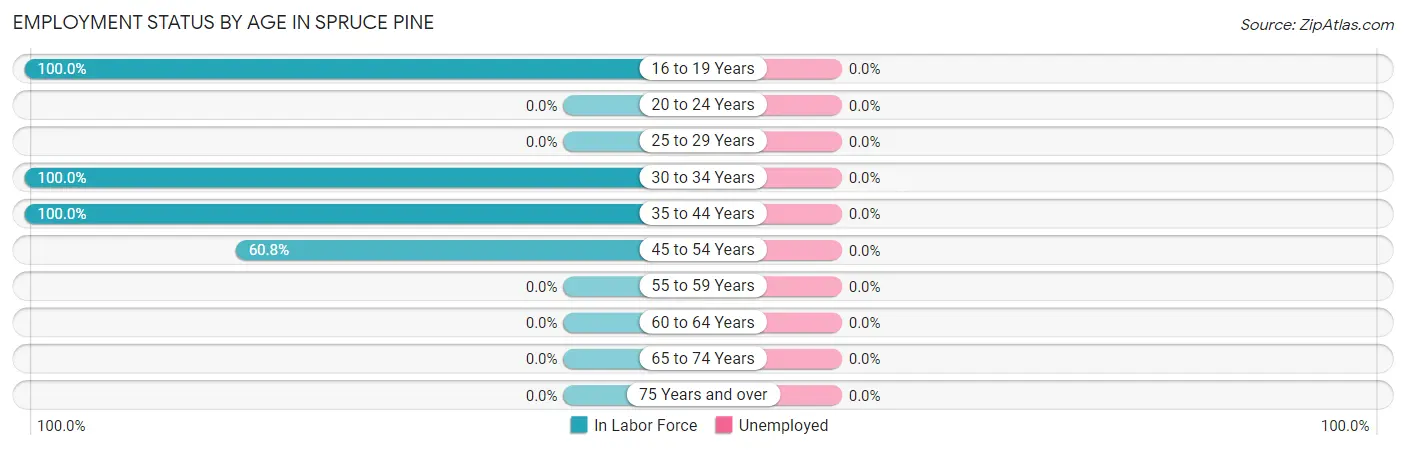
| Age Bracket | In Labor Force | Unemployed |
| 16 to 19 Years | 12 (100.0%) | 0 (0.0%) |
| 20 to 24 Years | 0 (0.0%) | 0 (0.0%) |
| 25 to 29 Years | 0 (0.0%) | 0 (0.0%) |
| 30 to 34 Years | 7 (100.0%) | 0 (0.0%) |
| 35 to 44 Years | 14 (100.0%) | 0 (0.0%) |
| 45 to 54 Years | 31 (60.8%) | 0 (0.0%) |
| 55 to 59 Years | 0 (0.0%) | 0 (0.0%) |
| 60 to 64 Years | 0 (0.0%) | 0 (0.0%) |
| 65 to 74 Years | 0 (0.0%) | 0 (0.0%) |
| 75 Years and over | 0 (0.0%) | 0 (0.0%) |
| Total | 64 (61.5%) | 0 (0.0%) |
Employment Status by Educational Attainment in Spruce Pine
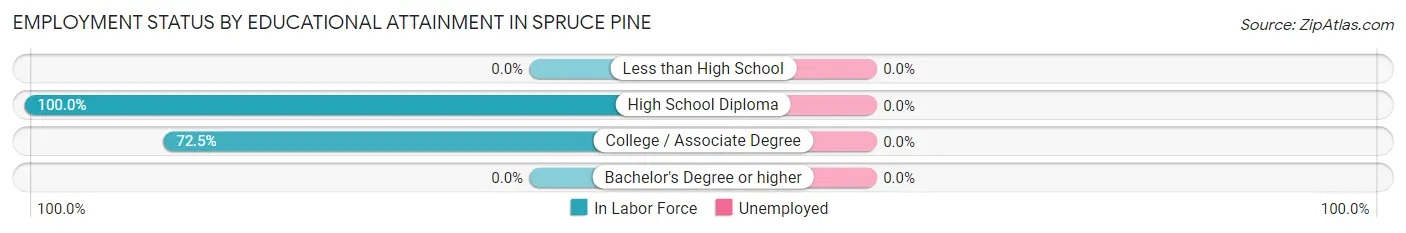
| Educational Attainment | In Labor Force | Unemployed |
| Less than High School | 0 (0.0%) | 0 (0.0%) |
| High School Diploma | 23 (100.0%) | 0 (0.0%) |
| College / Associate Degree | 29 (72.5%) | 0 (0.0%) |
| Bachelor's Degree or higher | 0 (0.0%) | 0 (0.0%) |
| Total | 52 (72.2%) | 0 (0.0%) |
Employment Occupations by Sex in Spruce Pine
Management, Business, Science and Arts Occupations
The most common Management, Business, Science and Arts occupations in Spruce Pine are Management (8 | 12.5%), Health Diagnosing & Treating (4 | 6.2%), and Health Technologists (4 | 6.2%).
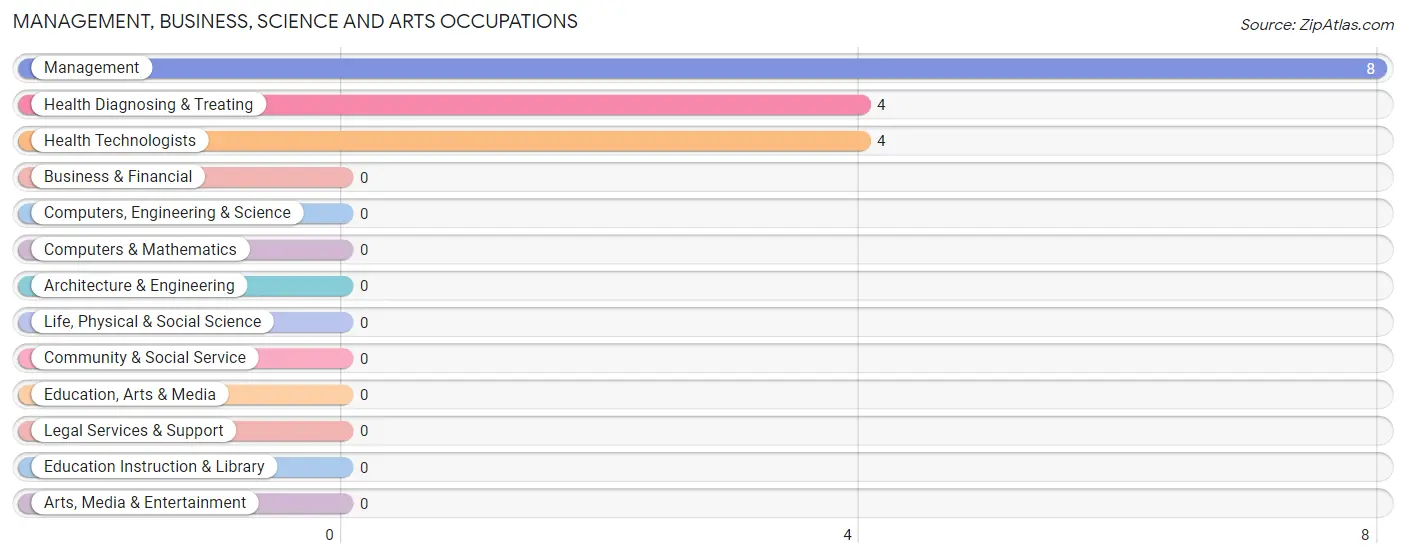
Management, Business, Science and Arts Occupations by Sex
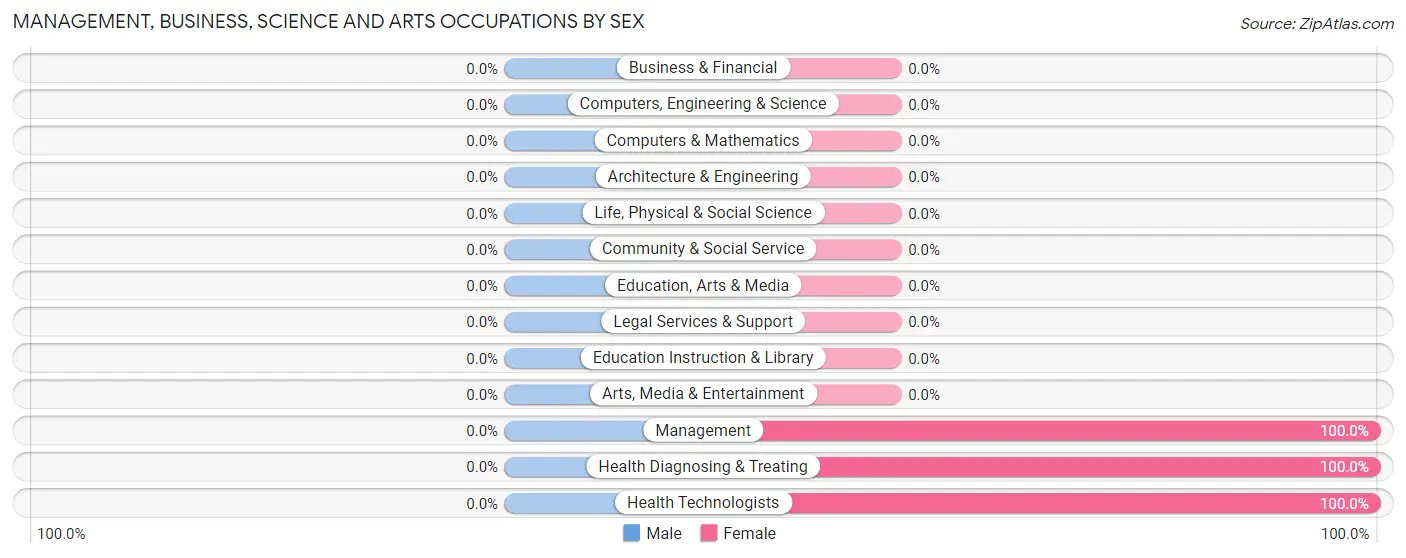
| Occupation | Male | Female |
| Management | 0 (0.0%) | 8 (100.0%) |
| Business & Financial | 0 (0.0%) | 0 (0.0%) |
| Computers, Engineering & Science | 0 (0.0%) | 0 (0.0%) |
| Computers & Mathematics | 0 (0.0%) | 0 (0.0%) |
| Architecture & Engineering | 0 (0.0%) | 0 (0.0%) |
| Life, Physical & Social Science | 0 (0.0%) | 0 (0.0%) |
| Community & Social Service | 0 (0.0%) | 0 (0.0%) |
| Education, Arts & Media | 0 (0.0%) | 0 (0.0%) |
| Legal Services & Support | 0 (0.0%) | 0 (0.0%) |
| Education Instruction & Library | 0 (0.0%) | 0 (0.0%) |
| Arts, Media & Entertainment | 0 (0.0%) | 0 (0.0%) |
| Health Diagnosing & Treating | 0 (0.0%) | 4 (100.0%) |
| Health Technologists | 0 (0.0%) | 4 (100.0%) |
| Total (Category) | 0 (0.0%) | 12 (100.0%) |
| Total (Overall) | 38 (59.4%) | 26 (40.6%) |
Services Occupations
Services Occupations by Sex
| Occupation | Male | Female |
| Healthcare Support | 0 (0.0%) | 0 (0.0%) |
| Security & Protection | 0 (0.0%) | 0 (0.0%) |
| Firefighting & Prevention | 0 (0.0%) | 0 (0.0%) |
| Law Enforcement | 0 (0.0%) | 0 (0.0%) |
| Food Preparation & Serving | 0 (0.0%) | 0 (0.0%) |
| Cleaning & Maintenance | 0 (0.0%) | 0 (0.0%) |
| Personal Care & Service | 0 (0.0%) | 0 (0.0%) |
| Total (Category) | 0 (0.0%) | 0 (0.0%) |
| Total (Overall) | 38 (59.4%) | 26 (40.6%) |
Sales and Office Occupations
The most common Sales and Office occupations in Spruce Pine are , and Sales & Related (12 | 18.8%).

Sales and Office Occupations by Sex
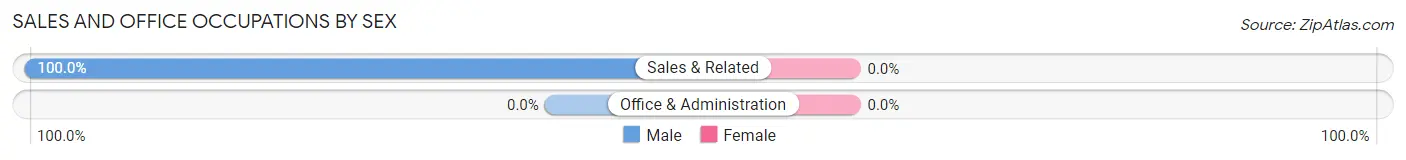
| Occupation | Male | Female |
| Sales & Related | 12 (100.0%) | 0 (0.0%) |
| Office & Administration | 0 (0.0%) | 0 (0.0%) |
| Total (Category) | 12 (100.0%) | 0 (0.0%) |
| Total (Overall) | 38 (59.4%) | 26 (40.6%) |
Natural Resources, Construction and Maintenance Occupations
The most common Natural Resources, Construction and Maintenance occupations in Spruce Pine are , and Installation, Maintenance & Repair (3 | 4.7%).
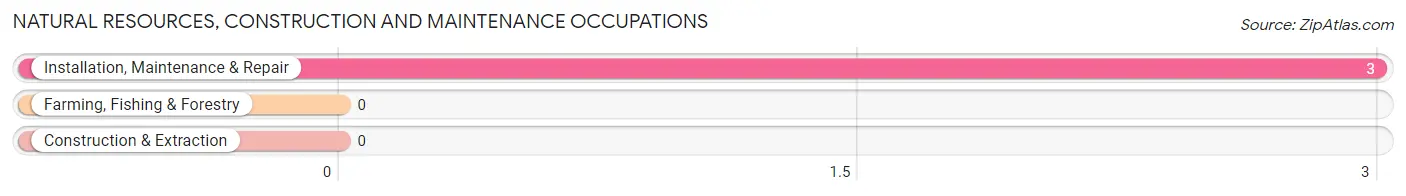
Natural Resources, Construction and Maintenance Occupations by Sex
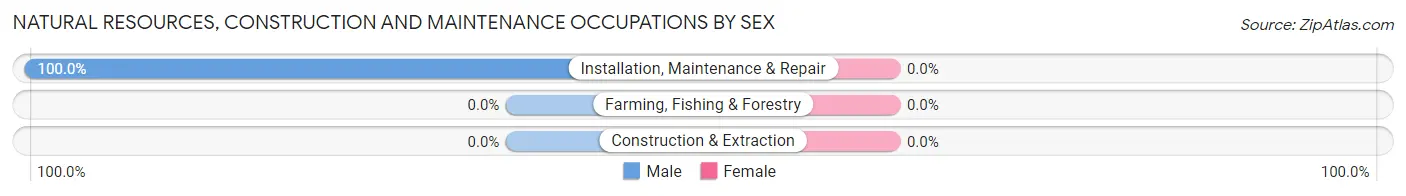
| Occupation | Male | Female |
| Farming, Fishing & Forestry | 0 (0.0%) | 0 (0.0%) |
| Construction & Extraction | 0 (0.0%) | 0 (0.0%) |
| Installation, Maintenance & Repair | 3 (100.0%) | 0 (0.0%) |
| Total (Category) | 3 (100.0%) | 0 (0.0%) |
| Total (Overall) | 38 (59.4%) | 26 (40.6%) |
Production, Transportation and Moving Occupations
The most common Production, Transportation and Moving occupations in Spruce Pine are Production (26 | 40.6%), and Transportation (11 | 17.2%).
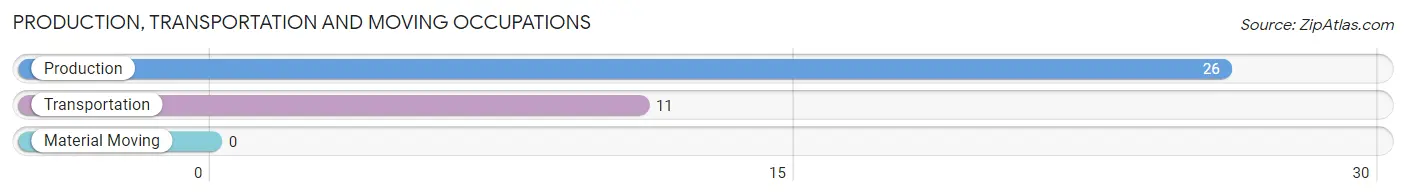
Production, Transportation and Moving Occupations by Sex
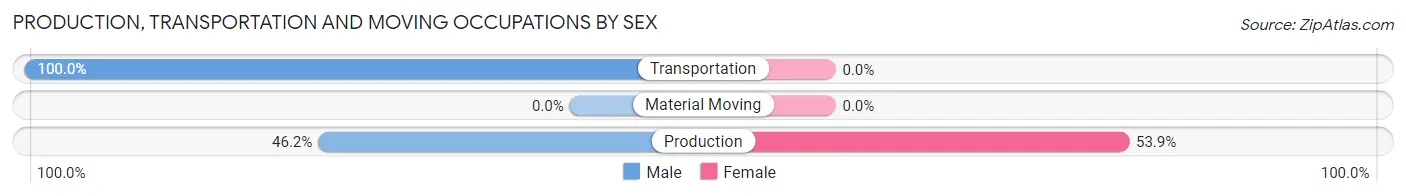
| Occupation | Male | Female |
| Production | 12 (46.2%) | 14 (53.8%) |
| Transportation | 11 (100.0%) | 0 (0.0%) |
| Material Moving | 0 (0.0%) | 0 (0.0%) |
| Total (Category) | 23 (62.2%) | 14 (37.8%) |
| Total (Overall) | 38 (59.4%) | 26 (40.6%) |
Employment Industries by Sex in Spruce Pine
Employment Industries in Spruce Pine
The major employment industries in Spruce Pine include Manufacturing (26 | 40.6%), Retail Trade (15 | 23.4%), Transportation & Warehousing (11 | 17.2%), Finance & Insurance (8 | 12.5%), and Health Care & Social Assistance (4 | 6.2%).
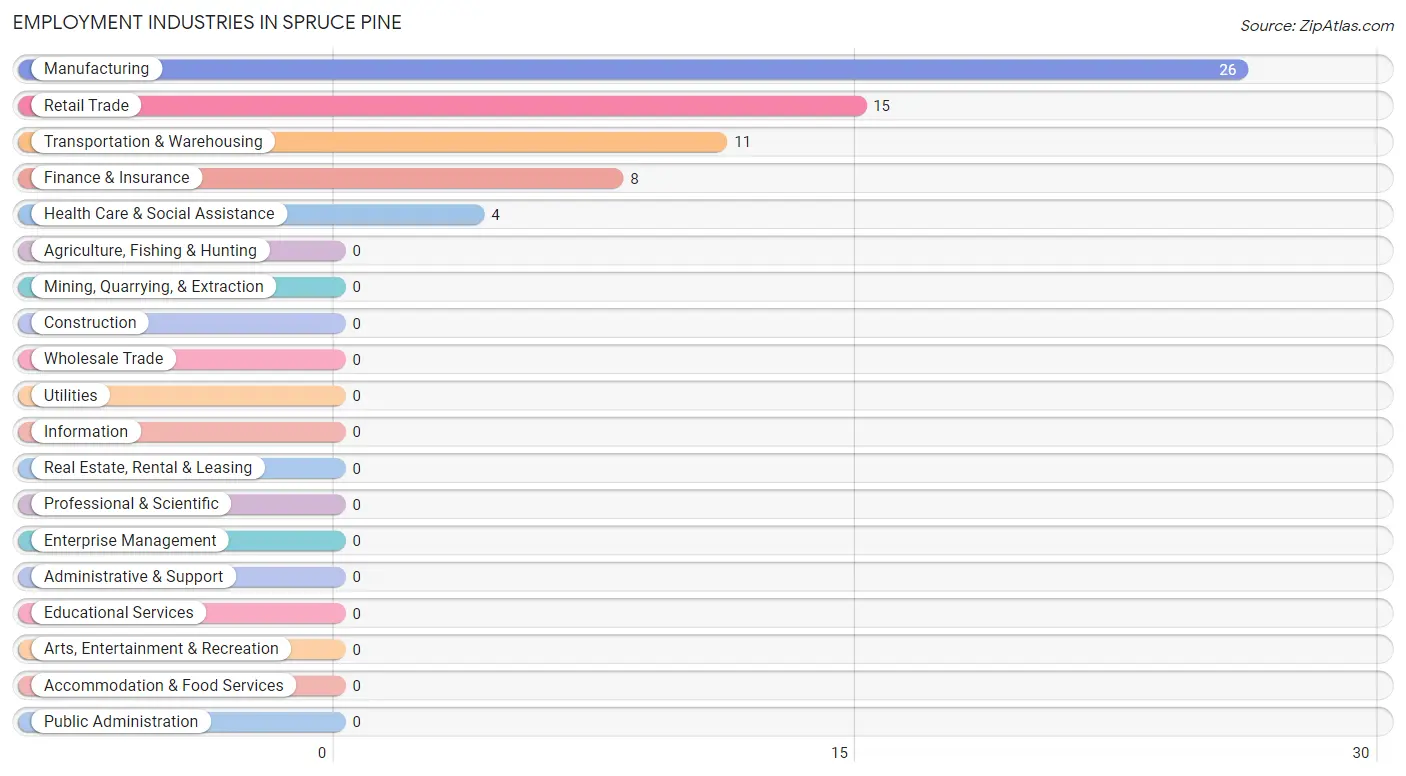
Employment Industries by Sex in Spruce Pine
The Spruce Pine industries that see more men than women are Retail Trade (100.0%), Transportation & Warehousing (100.0%), and Manufacturing (46.2%), whereas the industries that tend to have a higher number of women are Finance & Insurance (100.0%), Health Care & Social Assistance (100.0%), and Manufacturing (53.8%).
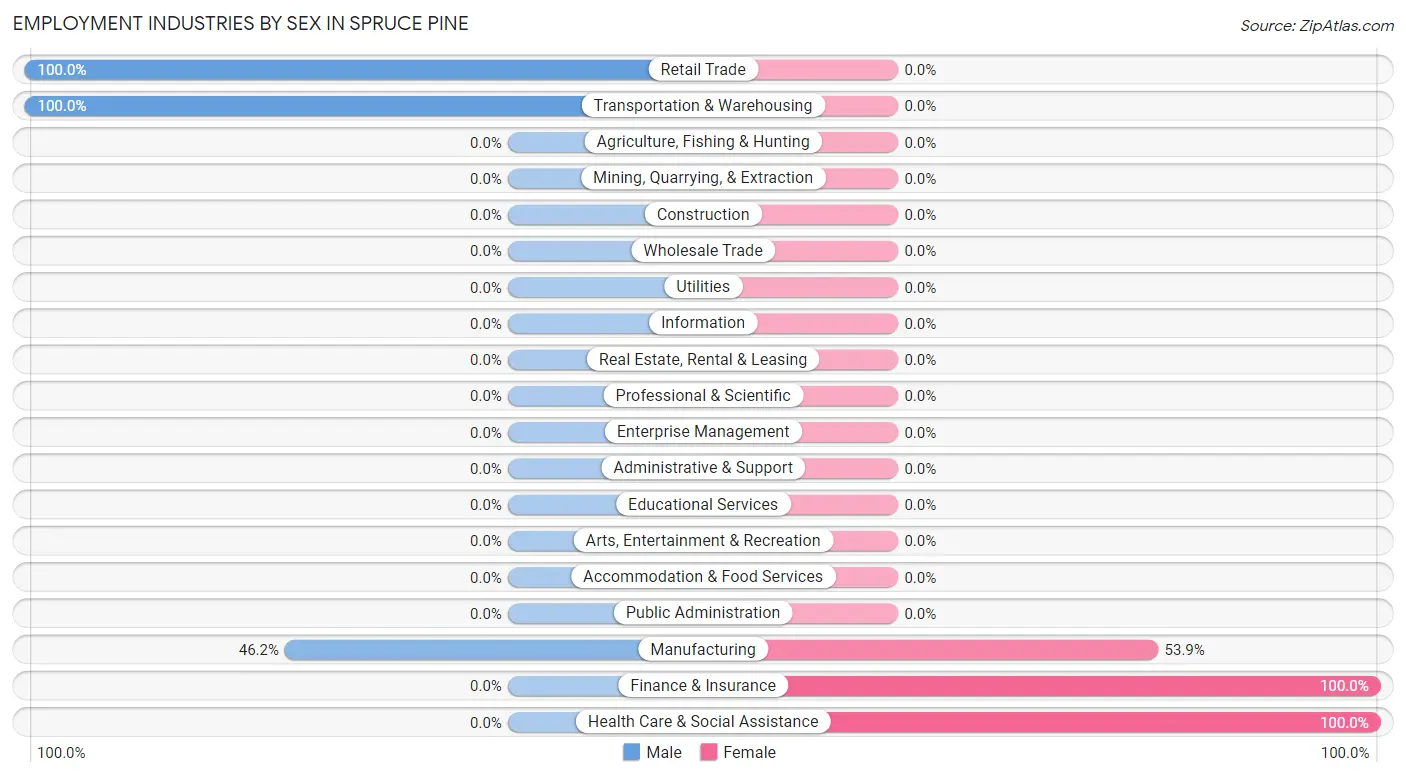
| Industry | Male | Female |
| Agriculture, Fishing & Hunting | 0 (0.0%) | 0 (0.0%) |
| Mining, Quarrying, & Extraction | 0 (0.0%) | 0 (0.0%) |
| Construction | 0 (0.0%) | 0 (0.0%) |
| Manufacturing | 12 (46.2%) | 14 (53.8%) |
| Wholesale Trade | 0 (0.0%) | 0 (0.0%) |
| Retail Trade | 15 (100.0%) | 0 (0.0%) |
| Transportation & Warehousing | 11 (100.0%) | 0 (0.0%) |
| Utilities | 0 (0.0%) | 0 (0.0%) |
| Information | 0 (0.0%) | 0 (0.0%) |
| Finance & Insurance | 0 (0.0%) | 8 (100.0%) |
| Real Estate, Rental & Leasing | 0 (0.0%) | 0 (0.0%) |
| Professional & Scientific | 0 (0.0%) | 0 (0.0%) |
| Enterprise Management | 0 (0.0%) | 0 (0.0%) |
| Administrative & Support | 0 (0.0%) | 0 (0.0%) |
| Educational Services | 0 (0.0%) | 0 (0.0%) |
| Health Care & Social Assistance | 0 (0.0%) | 4 (100.0%) |
| Arts, Entertainment & Recreation | 0 (0.0%) | 0 (0.0%) |
| Accommodation & Food Services | 0 (0.0%) | 0 (0.0%) |
| Public Administration | 0 (0.0%) | 0 (0.0%) |
| Total | 38 (59.4%) | 26 (40.6%) |
Education in Spruce Pine
School Enrollment in Spruce Pine
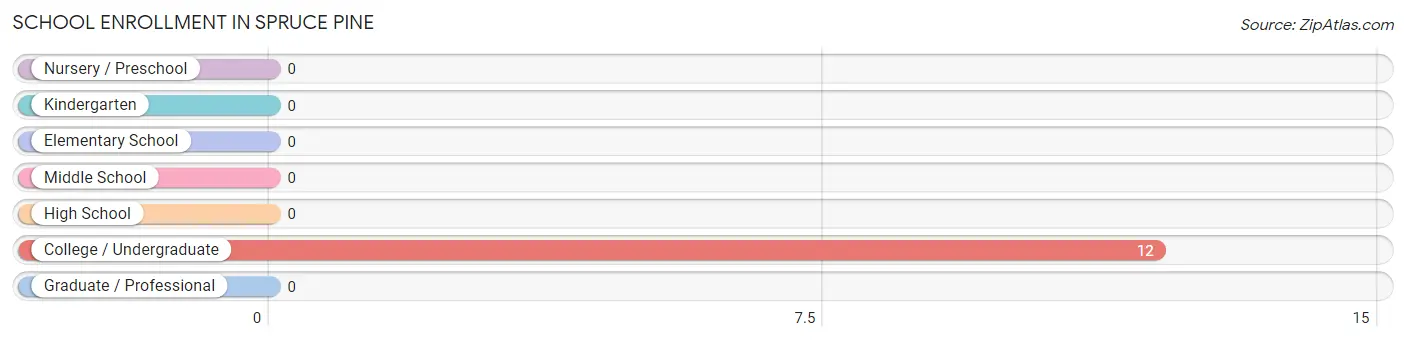
| School Level | # Students | % Students |
| Nursery / Preschool | 0 | 0.0% |
| Kindergarten | 0 | 0.0% |
| Elementary School | 0 | 0.0% |
| Middle School | 0 | 0.0% |
| High School | 0 | 0.0% |
| College / Undergraduate | 12 | 100.0% |
| Graduate / Professional | 0 | 0.0% |
| Total | 12 | 100.0% |
School Enrollment by Age by Funding Source in Spruce Pine
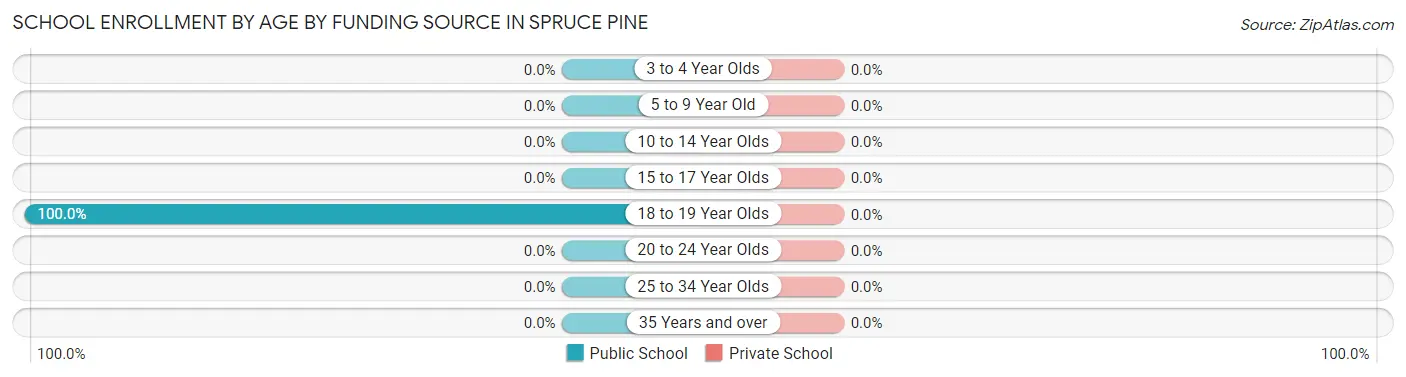
| Age Bracket | Public School | Private School |
| 3 to 4 Year Olds | 0 (0.0%) | 0 (0.0%) |
| 5 to 9 Year Old | 0 (0.0%) | 0 (0.0%) |
| 10 to 14 Year Olds | 0 (0.0%) | 0 (0.0%) |
| 15 to 17 Year Olds | 0 (0.0%) | 0 (0.0%) |
| 18 to 19 Year Olds | 12 (100.0%) | 0 (0.0%) |
| 20 to 24 Year Olds | 0 (0.0%) | 0 (0.0%) |
| 25 to 34 Year Olds | 0 (0.0%) | 0 (0.0%) |
| 35 Years and over | 0 (0.0%) | 0 (0.0%) |
| Total | 12 (100.0%) | 0 (0.0%) |
Educational Attainment by Field of Study in Spruce Pine
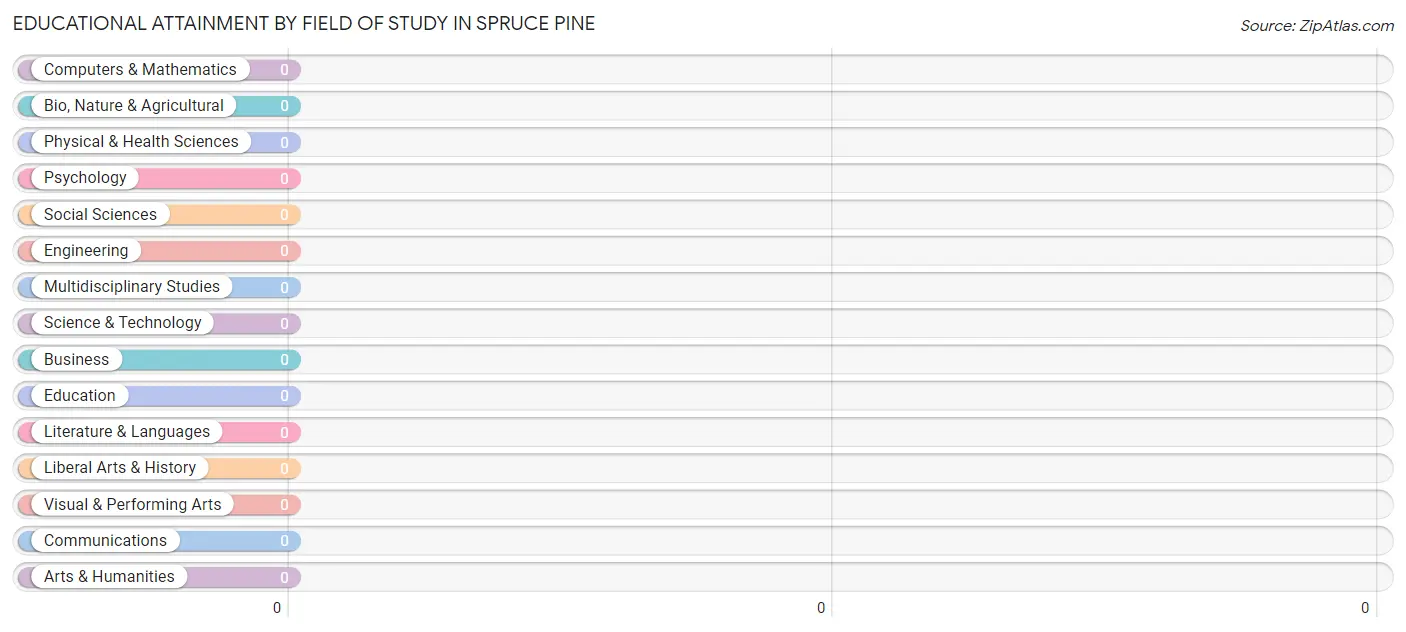
| Field of Study | # Graduates | % Graduates |
| Computers & Mathematics | 0 | 0.0% |
| Bio, Nature & Agricultural | 0 | 0.0% |
| Physical & Health Sciences | 0 | 0.0% |
| Psychology | 0 | 0.0% |
| Social Sciences | 0 | 0.0% |
| Engineering | 0 | 0.0% |
| Multidisciplinary Studies | 0 | 0.0% |
| Science & Technology | 0 | 0.0% |
| Business | 0 | 0.0% |
| Education | 0 | 0.0% |
| Literature & Languages | 0 | 0.0% |
| Liberal Arts & History | 0 | 0.0% |
| Visual & Performing Arts | 0 | 0.0% |
| Communications | 0 | 0.0% |
| Arts & Humanities | 0 | 0.0% |
| Total | 0 | 0.0% |
Transportation & Commute in Spruce Pine
Vehicle Availability by Sex in Spruce Pine
The most prevalent vehicle ownership categories in Spruce Pine are males with 4 vehicles (23, accounting for 60.5%) and females with 4 vehicles (14, making up 88.5%).
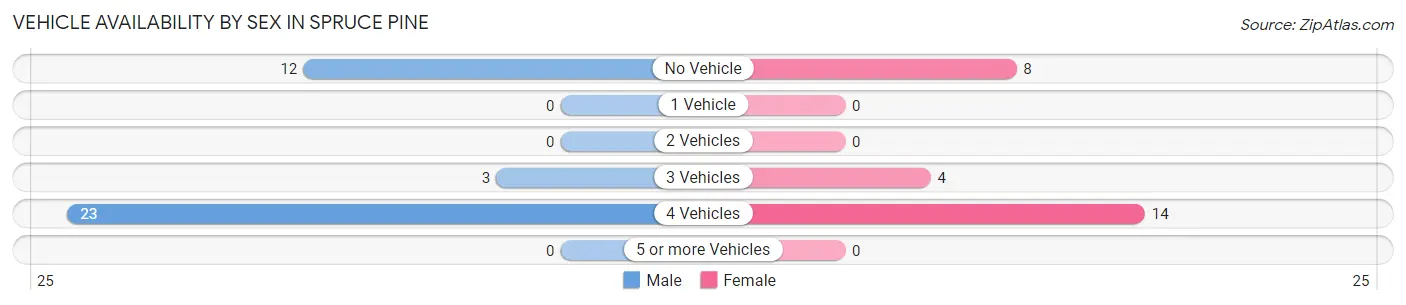
| Vehicles Available | Male | Female |
| No Vehicle | 12 (31.6%) | 8 (30.8%) |
| 1 Vehicle | 0 (0.0%) | 0 (0.0%) |
| 2 Vehicles | 0 (0.0%) | 0 (0.0%) |
| 3 Vehicles | 3 (7.9%) | 4 (15.4%) |
| 4 Vehicles | 23 (60.5%) | 14 (53.8%) |
| 5 or more Vehicles | 0 (0.0%) | 0 (0.0%) |
| Total | 38 (100.0%) | 26 (100.0%) |
Commute Time in Spruce Pine
The most frequently occuring commute durations in Spruce Pine are 5 to 9 minutes (37 commuters, 57.8%), less than 5 minutes (12 commuters, 18.8%), and 30 to 34 minutes (8 commuters, 12.5%).
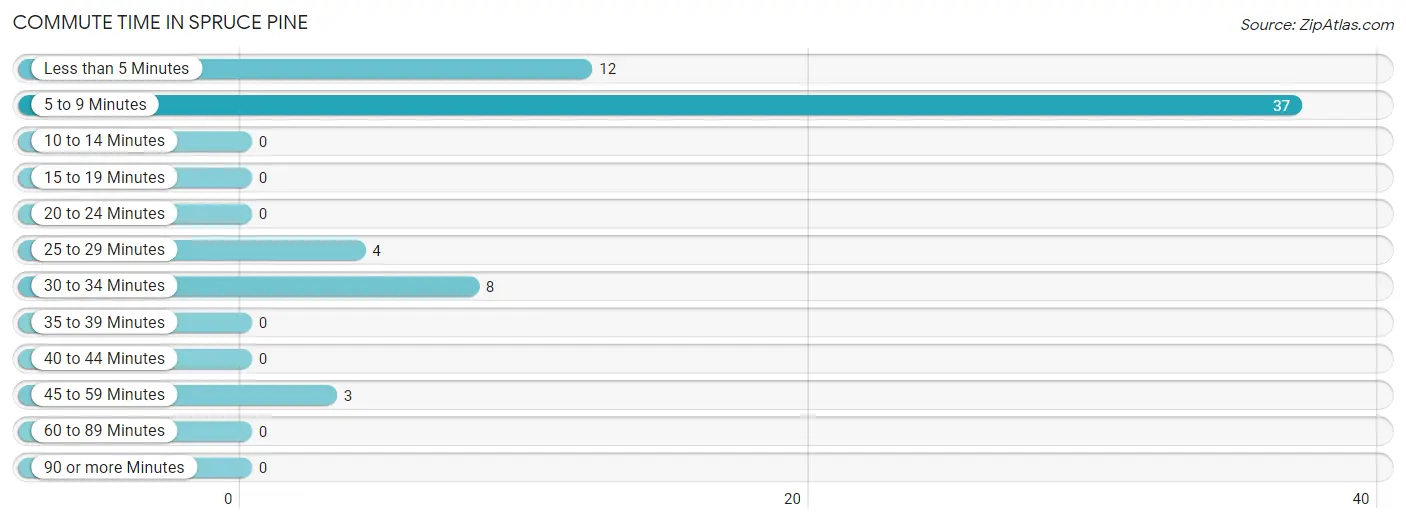
| Commute Time | # Commuters | % Commuters |
| Less than 5 Minutes | 12 | 18.8% |
| 5 to 9 Minutes | 37 | 57.8% |
| 10 to 14 Minutes | 0 | 0.0% |
| 15 to 19 Minutes | 0 | 0.0% |
| 20 to 24 Minutes | 0 | 0.0% |
| 25 to 29 Minutes | 4 | 6.2% |
| 30 to 34 Minutes | 8 | 12.5% |
| 35 to 39 Minutes | 0 | 0.0% |
| 40 to 44 Minutes | 0 | 0.0% |
| 45 to 59 Minutes | 3 | 4.7% |
| 60 to 89 Minutes | 0 | 0.0% |
| 90 or more Minutes | 0 | 0.0% |
Commute Time by Sex in Spruce Pine
The most common commute times in Spruce Pine are 5 to 9 minutes (23 commuters, 60.5%) for males and 5 to 9 minutes (14 commuters, 53.8%) for females.
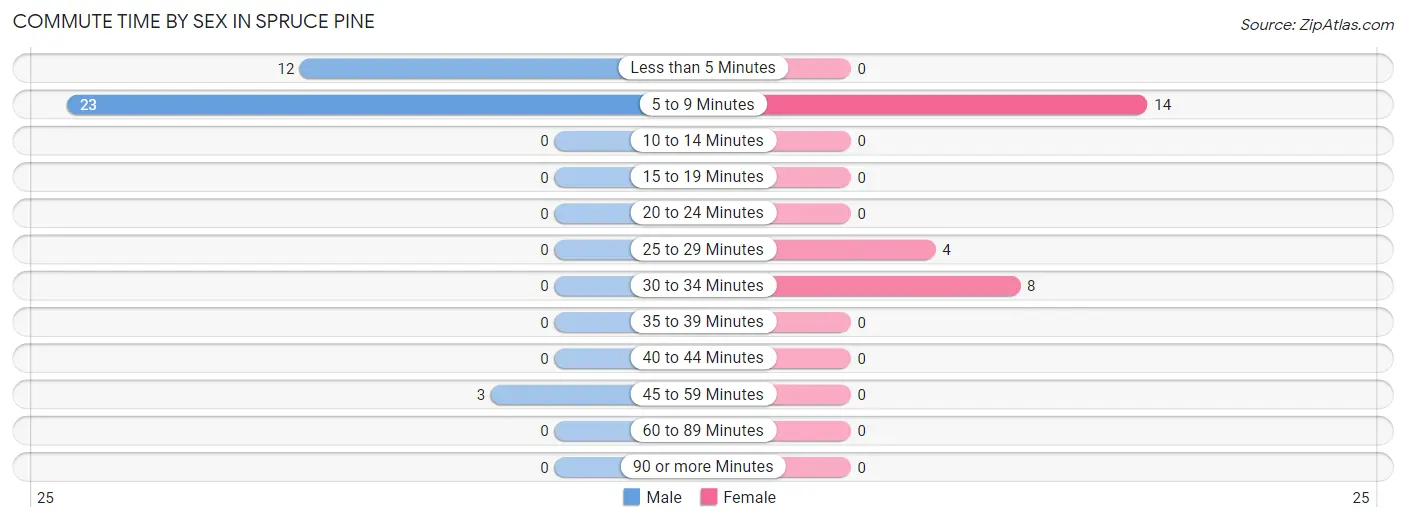
| Commute Time | Male | Female |
| Less than 5 Minutes | 12 (31.6%) | 0 (0.0%) |
| 5 to 9 Minutes | 23 (60.5%) | 14 (53.8%) |
| 10 to 14 Minutes | 0 (0.0%) | 0 (0.0%) |
| 15 to 19 Minutes | 0 (0.0%) | 0 (0.0%) |
| 20 to 24 Minutes | 0 (0.0%) | 0 (0.0%) |
| 25 to 29 Minutes | 0 (0.0%) | 4 (15.4%) |
| 30 to 34 Minutes | 0 (0.0%) | 8 (30.8%) |
| 35 to 39 Minutes | 0 (0.0%) | 0 (0.0%) |
| 40 to 44 Minutes | 0 (0.0%) | 0 (0.0%) |
| 45 to 59 Minutes | 3 (7.9%) | 0 (0.0%) |
| 60 to 89 Minutes | 0 (0.0%) | 0 (0.0%) |
| 90 or more Minutes | 0 (0.0%) | 0 (0.0%) |
Time of Departure to Work by Sex in Spruce Pine
The most frequent times of departure to work in Spruce Pine are 12:00 AM to 4:59 AM (14, 36.8%) for males and 12:00 AM to 4:59 AM (14, 53.8%) for females.
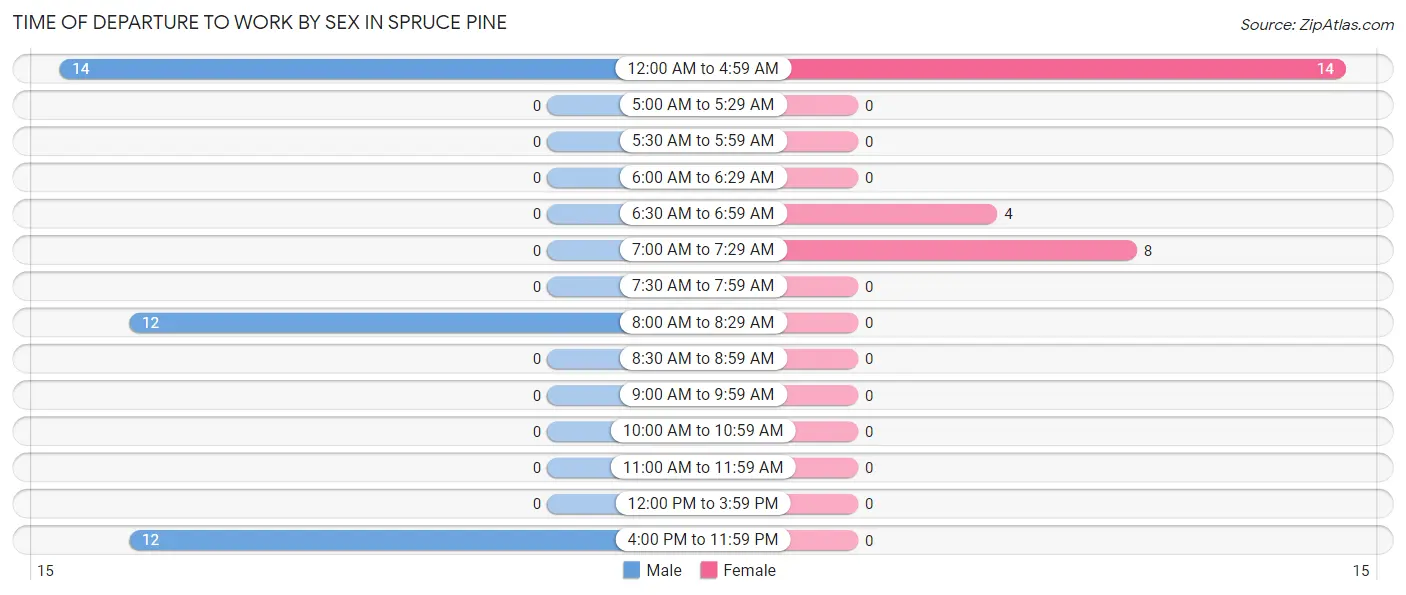
| Time of Departure | Male | Female |
| 12:00 AM to 4:59 AM | 14 (36.8%) | 14 (53.8%) |
| 5:00 AM to 5:29 AM | 0 (0.0%) | 0 (0.0%) |
| 5:30 AM to 5:59 AM | 0 (0.0%) | 0 (0.0%) |
| 6:00 AM to 6:29 AM | 0 (0.0%) | 0 (0.0%) |
| 6:30 AM to 6:59 AM | 0 (0.0%) | 4 (15.4%) |
| 7:00 AM to 7:29 AM | 0 (0.0%) | 8 (30.8%) |
| 7:30 AM to 7:59 AM | 0 (0.0%) | 0 (0.0%) |
| 8:00 AM to 8:29 AM | 12 (31.6%) | 0 (0.0%) |
| 8:30 AM to 8:59 AM | 0 (0.0%) | 0 (0.0%) |
| 9:00 AM to 9:59 AM | 0 (0.0%) | 0 (0.0%) |
| 10:00 AM to 10:59 AM | 0 (0.0%) | 0 (0.0%) |
| 11:00 AM to 11:59 AM | 0 (0.0%) | 0 (0.0%) |
| 12:00 PM to 3:59 PM | 0 (0.0%) | 0 (0.0%) |
| 4:00 PM to 11:59 PM | 12 (31.6%) | 0 (0.0%) |
| Total | 38 (100.0%) | 26 (100.0%) |
Housing Occupancy in Spruce Pine
Occupancy by Ownership in Spruce Pine
Of the total 51 dwellings in Spruce Pine, owner-occupied units account for 51 (100.0%), while renter-occupied units make up 0 (0.0%).
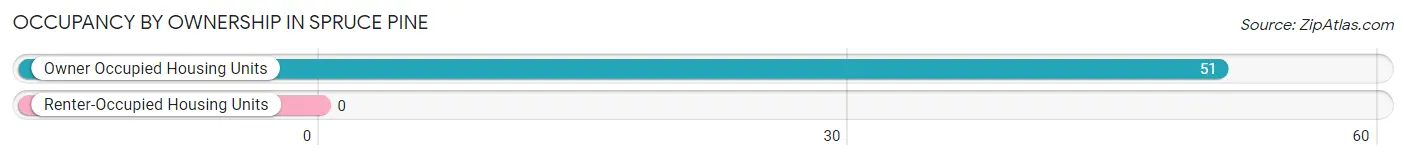
| Occupancy | # Housing Units | % Housing Units |
| Owner Occupied Housing Units | 51 | 100.0% |
| Renter-Occupied Housing Units | 0 | 0.0% |
| Total Occupied Housing Units | 51 | 100.0% |
Occupancy by Household Size in Spruce Pine
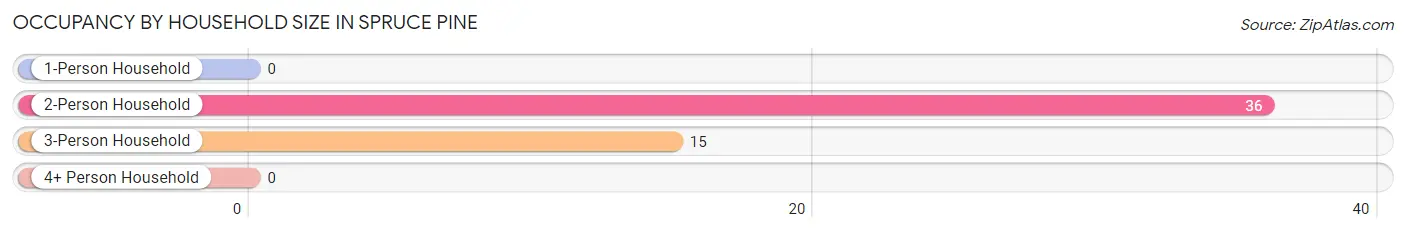
| Household Size | # Housing Units | % Housing Units |
| 1-Person Household | 0 | 0.0% |
| 2-Person Household | 36 | 70.6% |
| 3-Person Household | 15 | 29.4% |
| 4+ Person Household | 0 | 0.0% |
| Total Housing Units | 51 | 100.0% |
Occupancy by Ownership by Household Size in Spruce Pine
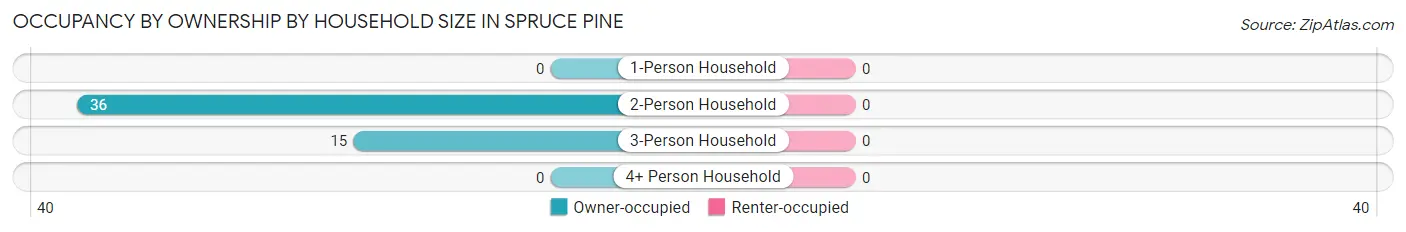
| Household Size | Owner-occupied | Renter-occupied |
| 1-Person Household | 0 (0.0%) | 0 (0.0%) |
| 2-Person Household | 36 (100.0%) | 0 (0.0%) |
| 3-Person Household | 15 (100.0%) | 0 (0.0%) |
| 4+ Person Household | 0 (0.0%) | 0 (0.0%) |
| Total Housing Units | 51 (100.0%) | 0 (0.0%) |
Occupancy by Educational Attainment in Spruce Pine
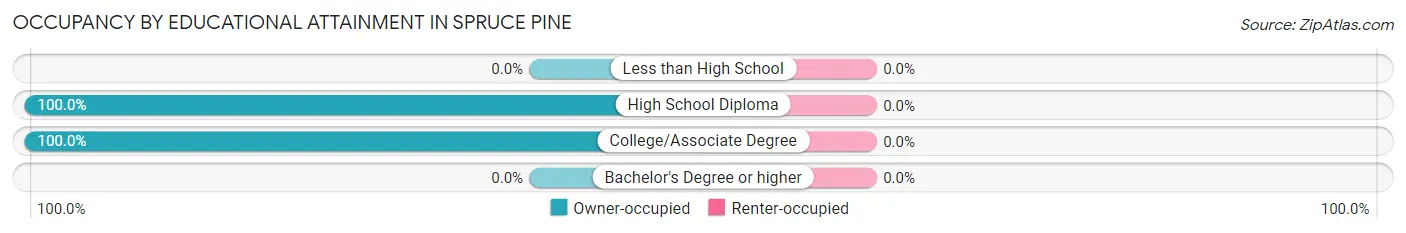
| Household Size | Owner-occupied | Renter-occupied |
| Less than High School | 0 (0.0%) | 0 (0.0%) |
| High School Diploma | 12 (100.0%) | 0 (0.0%) |
| College/Associate Degree | 39 (100.0%) | 0 (0.0%) |
| Bachelor's Degree or higher | 0 (0.0%) | 0 (0.0%) |
Occupancy by Age of Householder in Spruce Pine
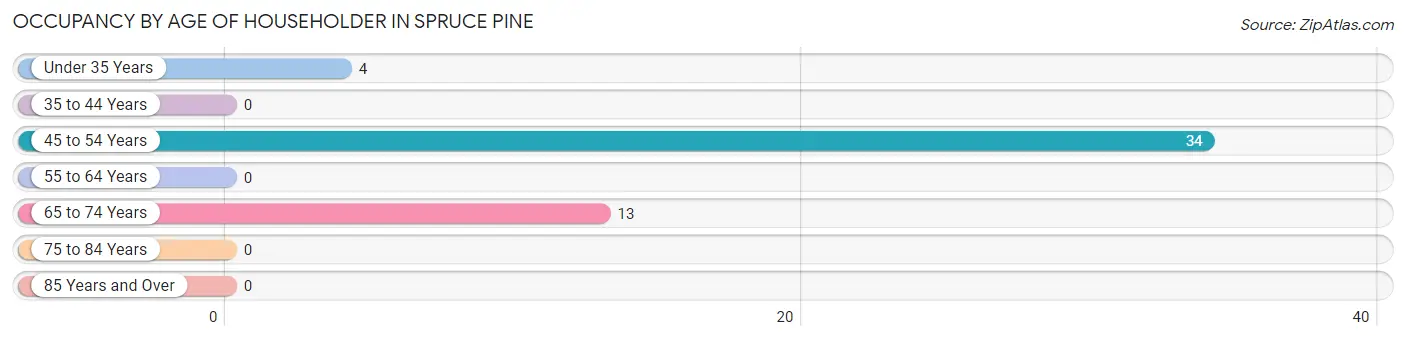
| Age Bracket | # Households | % Households |
| Under 35 Years | 4 | 7.8% |
| 35 to 44 Years | 0 | 0.0% |
| 45 to 54 Years | 34 | 66.7% |
| 55 to 64 Years | 0 | 0.0% |
| 65 to 74 Years | 13 | 25.5% |
| 75 to 84 Years | 0 | 0.0% |
| 85 Years and Over | 0 | 0.0% |
| Total | 51 | 100.0% |
Housing Finances in Spruce Pine
Median Income by Occupancy in Spruce Pine
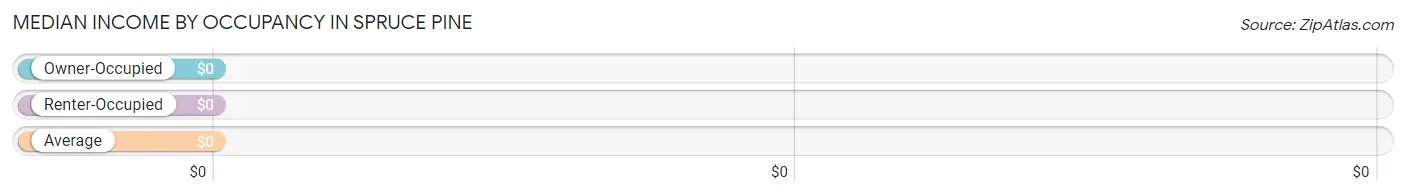
| Occupancy Type | # Households | Median Income |
| Owner-Occupied | 51 (100.0%) | $0 |
| Renter-Occupied | 0 (0.0%) | $0 |
| Average | 51 (100.0%) | $0 |
Occupancy by Householder Income Bracket in Spruce Pine
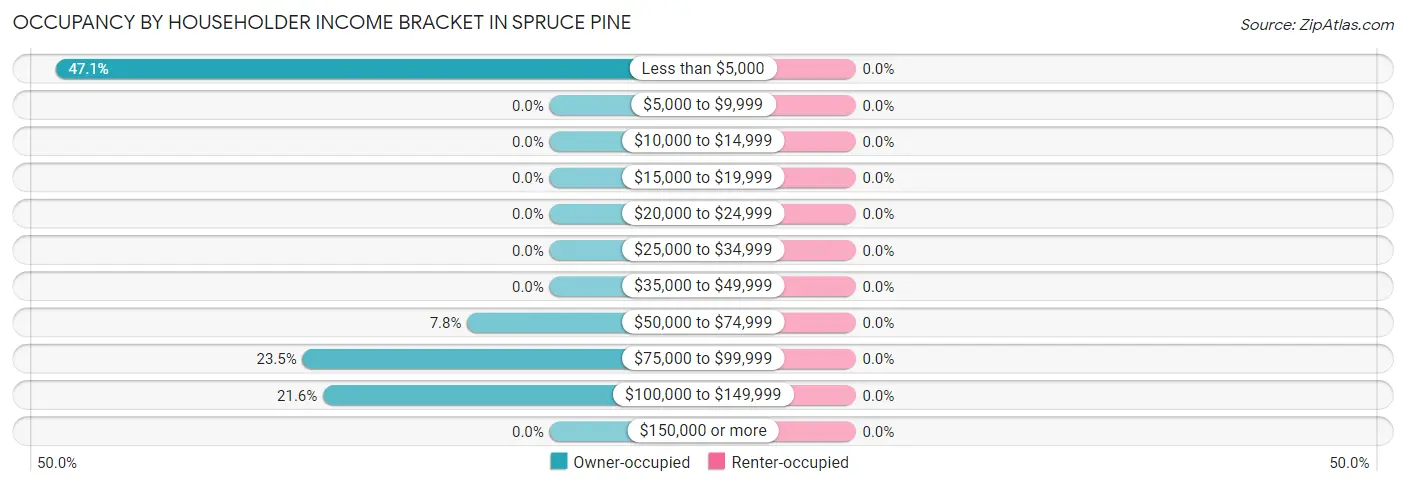
| Income Bracket | Owner-occupied | Renter-occupied |
| Less than $5,000 | 24 (47.1%) | 0 (0.0%) |
| $5,000 to $9,999 | 0 (0.0%) | 0 (0.0%) |
| $10,000 to $14,999 | 0 (0.0%) | 0 (0.0%) |
| $15,000 to $19,999 | 0 (0.0%) | 0 (0.0%) |
| $20,000 to $24,999 | 0 (0.0%) | 0 (0.0%) |
| $25,000 to $34,999 | 0 (0.0%) | 0 (0.0%) |
| $35,000 to $49,999 | 0 (0.0%) | 0 (0.0%) |
| $50,000 to $74,999 | 4 (7.8%) | 0 (0.0%) |
| $75,000 to $99,999 | 12 (23.5%) | 0 (0.0%) |
| $100,000 to $149,999 | 11 (21.6%) | 0 (0.0%) |
| $150,000 or more | 0 (0.0%) | 0 (0.0%) |
| Total | 51 (100.0%) | 0 (0.0%) |
Monthly Housing Cost Tiers in Spruce Pine
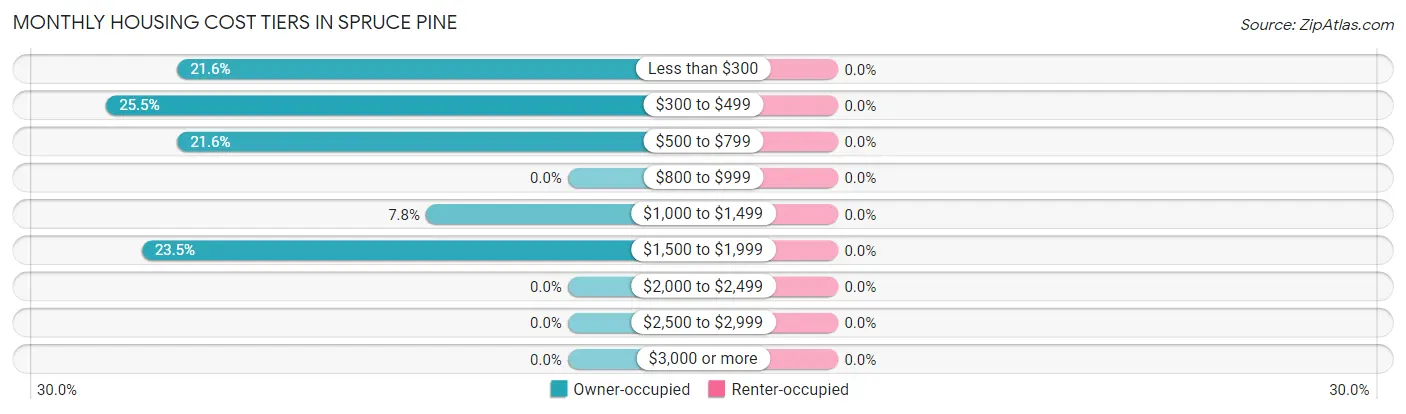
| Monthly Cost | Owner-occupied | Renter-occupied |
| Less than $300 | 11 (21.6%) | 0 (0.0%) |
| $300 to $499 | 13 (25.5%) | 0 (0.0%) |
| $500 to $799 | 11 (21.6%) | 0 (0.0%) |
| $800 to $999 | 0 (0.0%) | 0 (0.0%) |
| $1,000 to $1,499 | 4 (7.8%) | 0 (0.0%) |
| $1,500 to $1,999 | 12 (23.5%) | 0 (0.0%) |
| $2,000 to $2,499 | 0 (0.0%) | 0 (0.0%) |
| $2,500 to $2,999 | 0 (0.0%) | 0 (0.0%) |
| $3,000 or more | 0 (0.0%) | 0 (0.0%) |
| Total | 51 (100.0%) | 0 (0.0%) |
Physical Housing Characteristics in Spruce Pine
Housing Structures in Spruce Pine
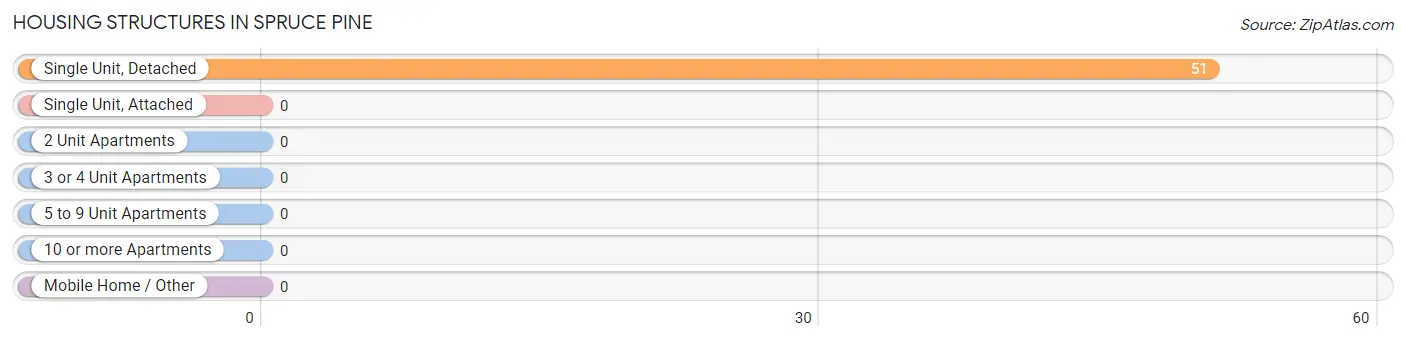
| Structure Type | # Housing Units | % Housing Units |
| Single Unit, Detached | 51 | 100.0% |
| Single Unit, Attached | 0 | 0.0% |
| 2 Unit Apartments | 0 | 0.0% |
| 3 or 4 Unit Apartments | 0 | 0.0% |
| 5 to 9 Unit Apartments | 0 | 0.0% |
| 10 or more Apartments | 0 | 0.0% |
| Mobile Home / Other | 0 | 0.0% |
| Total | 51 | 100.0% |
Housing Structures by Occupancy in Spruce Pine
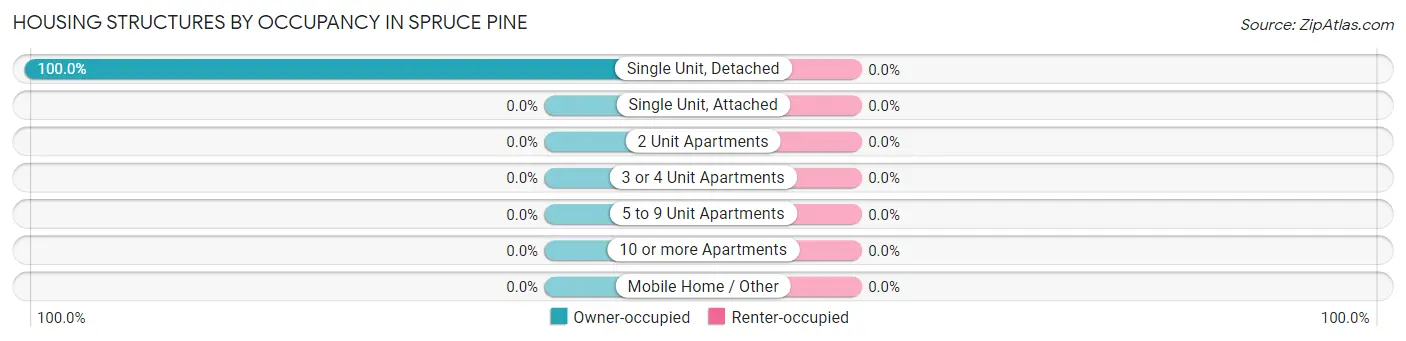
| Structure Type | Owner-occupied | Renter-occupied |
| Single Unit, Detached | 51 (100.0%) | 0 (0.0%) |
| Single Unit, Attached | 0 (0.0%) | 0 (0.0%) |
| 2 Unit Apartments | 0 (0.0%) | 0 (0.0%) |
| 3 or 4 Unit Apartments | 0 (0.0%) | 0 (0.0%) |
| 5 to 9 Unit Apartments | 0 (0.0%) | 0 (0.0%) |
| 10 or more Apartments | 0 (0.0%) | 0 (0.0%) |
| Mobile Home / Other | 0 (0.0%) | 0 (0.0%) |
| Total | 51 (100.0%) | 0 (0.0%) |
Housing Structures by Number of Rooms in Spruce Pine
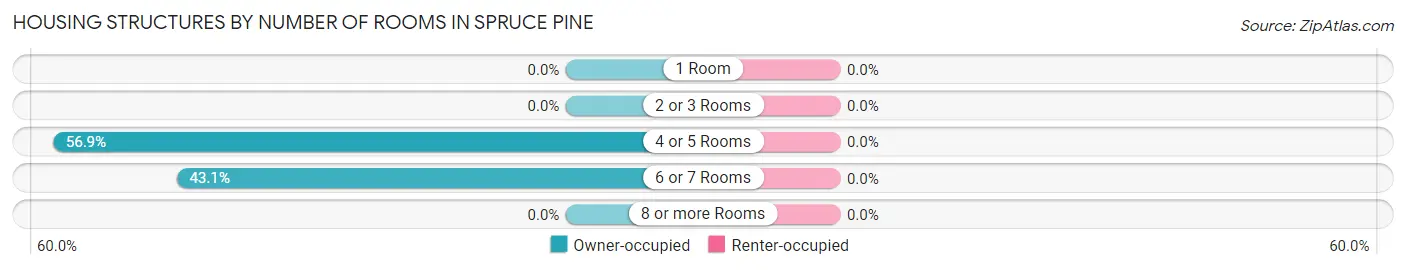
| Number of Rooms | Owner-occupied | Renter-occupied |
| 1 Room | 0 (0.0%) | 0 (0.0%) |
| 2 or 3 Rooms | 0 (0.0%) | 0 (0.0%) |
| 4 or 5 Rooms | 29 (56.9%) | 0 (0.0%) |
| 6 or 7 Rooms | 22 (43.1%) | 0 (0.0%) |
| 8 or more Rooms | 0 (0.0%) | 0 (0.0%) |
| Total | 51 (100.0%) | 0 (0.0%) |
Housing Structure by Heating Type in Spruce Pine
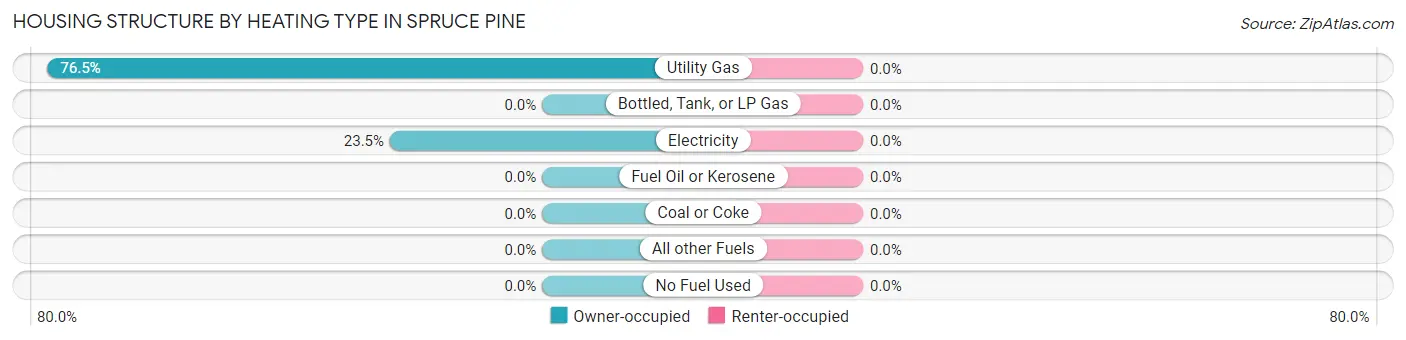
| Heating Type | Owner-occupied | Renter-occupied |
| Utility Gas | 39 (76.5%) | 0 (0.0%) |
| Bottled, Tank, or LP Gas | 0 (0.0%) | 0 (0.0%) |
| Electricity | 12 (23.5%) | 0 (0.0%) |
| Fuel Oil or Kerosene | 0 (0.0%) | 0 (0.0%) |
| Coal or Coke | 0 (0.0%) | 0 (0.0%) |
| All other Fuels | 0 (0.0%) | 0 (0.0%) |
| No Fuel Used | 0 (0.0%) | 0 (0.0%) |
| Total | 51 (100.0%) | 0 (0.0%) |
Household Vehicle Usage in Spruce Pine
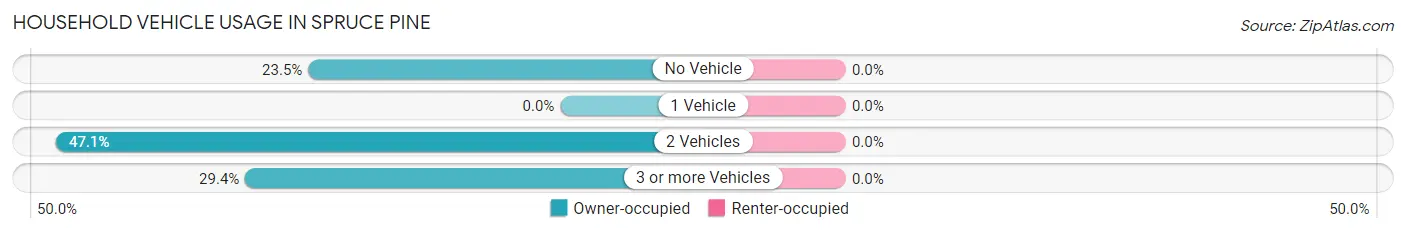
| Vehicles per Household | Owner-occupied | Renter-occupied |
| No Vehicle | 12 (23.5%) | 0 (0.0%) |
| 1 Vehicle | 0 (0.0%) | 0 (0.0%) |
| 2 Vehicles | 24 (47.1%) | 0 (0.0%) |
| 3 or more Vehicles | 15 (29.4%) | 0 (0.0%) |
| Total | 51 (100.0%) | 0 (0.0%) |
Real Estate & Mortgages in Spruce Pine
Real Estate and Mortgage Overview in Spruce Pine
| Characteristic | Without Mortgage | With Mortgage |
| Housing Units | 24 | 27 |
| Median Property Value | - | - |
| Median Household Income | - | - |
| Monthly Housing Costs | - | - |
| Real Estate Taxes | - | - |
Property Value by Mortgage Status in Spruce Pine
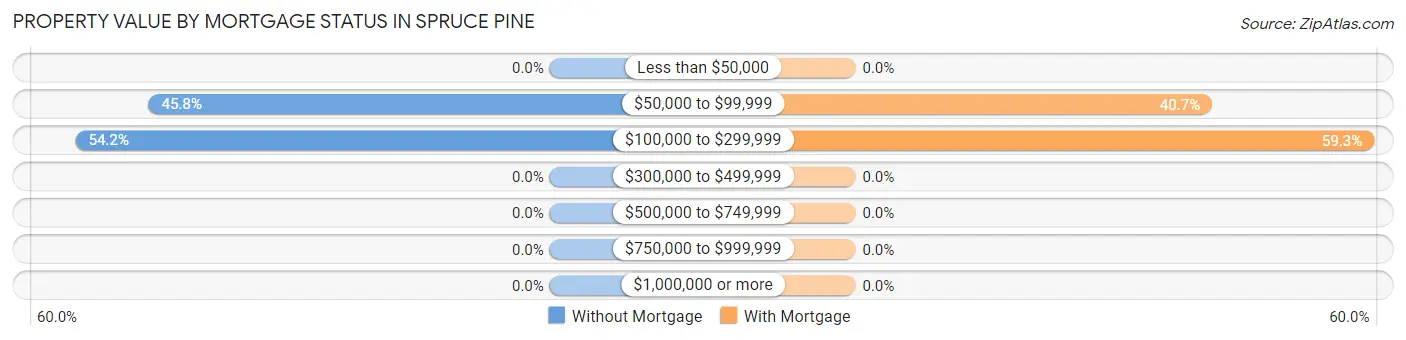
| Property Value | Without Mortgage | With Mortgage |
| Less than $50,000 | 0 (0.0%) | 0 (0.0%) |
| $50,000 to $99,999 | 11 (45.8%) | 11 (40.7%) |
| $100,000 to $299,999 | 13 (54.2%) | 16 (59.3%) |
| $300,000 to $499,999 | 0 (0.0%) | 0 (0.0%) |
| $500,000 to $749,999 | 0 (0.0%) | 0 (0.0%) |
| $750,000 to $999,999 | 0 (0.0%) | 0 (0.0%) |
| $1,000,000 or more | 0 (0.0%) | 0 (0.0%) |
| Total | 24 (100.0%) | 27 (100.0%) |
Household Income by Mortgage Status in Spruce Pine
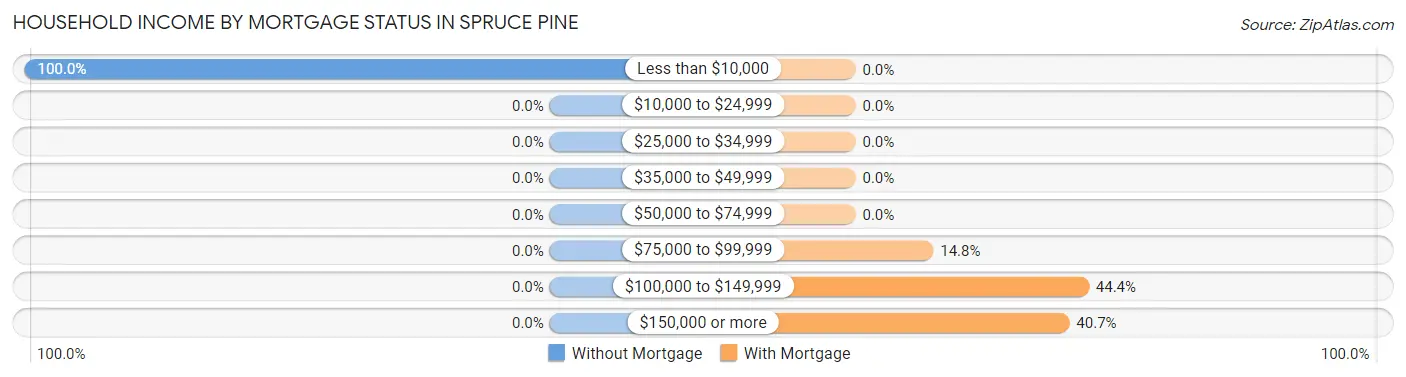
| Household Income | Without Mortgage | With Mortgage |
| Less than $10,000 | 24 (100.0%) | 0 (0.0%) |
| $10,000 to $24,999 | 0 (0.0%) | 0 (0.0%) |
| $25,000 to $34,999 | 0 (0.0%) | 0 (0.0%) |
| $35,000 to $49,999 | 0 (0.0%) | 0 (0.0%) |
| $50,000 to $74,999 | 0 (0.0%) | 0 (0.0%) |
| $75,000 to $99,999 | 0 (0.0%) | 4 (14.8%) |
| $100,000 to $149,999 | 0 (0.0%) | 12 (44.4%) |
| $150,000 or more | 0 (0.0%) | 11 (40.7%) |
| Total | 24 (100.0%) | 27 (100.0%) |
Property Value to Household Income Ratio in Spruce Pine
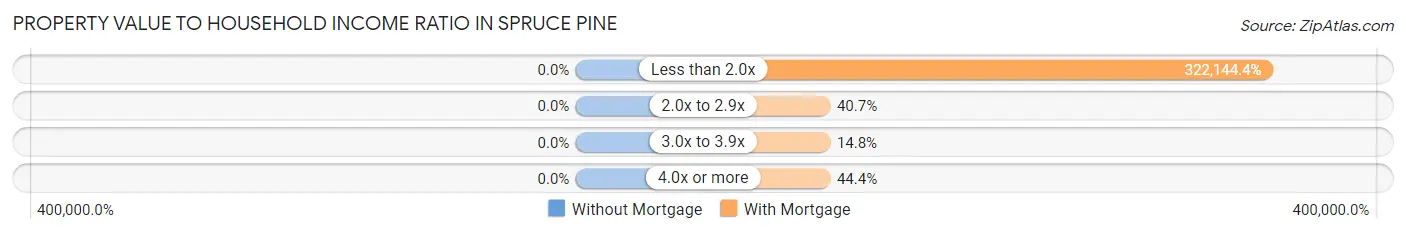
| Value-to-Income Ratio | Without Mortgage | With Mortgage |
| Less than 2.0x | 0 (0.0%) | 86,979 (322,144.4%) |
| 2.0x to 2.9x | 0 (0.0%) | 11 (40.7%) |
| 3.0x to 3.9x | 0 (0.0%) | 4 (14.8%) |
| 4.0x or more | 0 (0.0%) | 12 (44.4%) |
| Total | 24 (100.0%) | 27 (100.0%) |
Real Estate Taxes by Mortgage Status in Spruce Pine
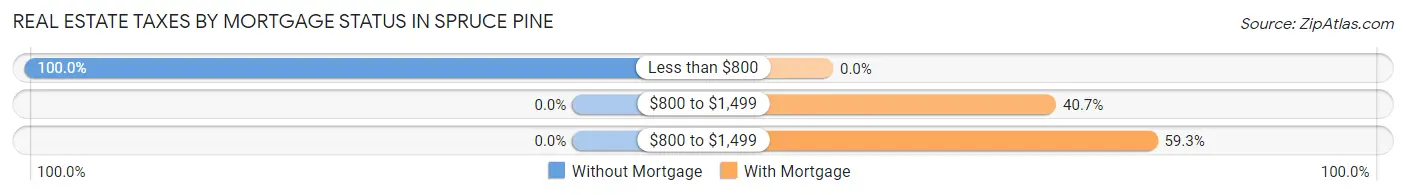
| Property Taxes | Without Mortgage | With Mortgage |
| Less than $800 | 24 (100.0%) | 0 (0.0%) |
| $800 to $1,499 | 0 (0.0%) | 11 (40.7%) |
| $800 to $1,499 | 0 (0.0%) | 16 (59.3%) |
| Total | 24 (100.0%) | 27 (100.0%) |
Health & Disability in Spruce Pine
Health Insurance Coverage by Age in Spruce Pine
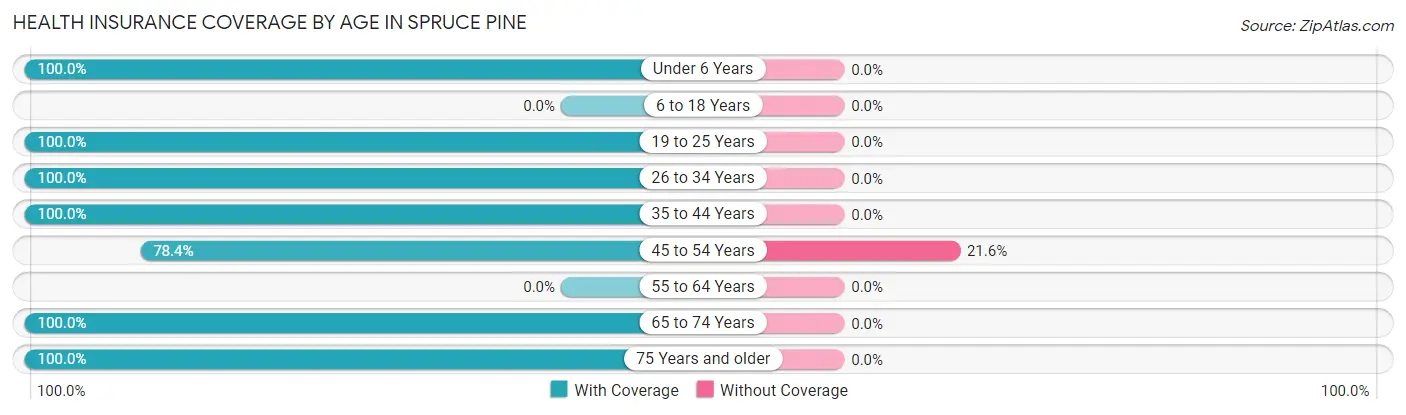
| Age Bracket | With Coverage | Without Coverage |
| Under 6 Years | 5 (100.0%) | 0 (0.0%) |
| 6 to 18 Years | 0 (0.0%) | 0 (0.0%) |
| 19 to 25 Years | 12 (100.0%) | 0 (0.0%) |
| 26 to 34 Years | 7 (100.0%) | 0 (0.0%) |
| 35 to 44 Years | 14 (100.0%) | 0 (0.0%) |
| 45 to 54 Years | 40 (78.4%) | 11 (21.6%) |
| 55 to 64 Years | 0 (0.0%) | 0 (0.0%) |
| 65 to 74 Years | 13 (100.0%) | 0 (0.0%) |
| 75 Years and older | 7 (100.0%) | 0 (0.0%) |
| Total | 98 (89.9%) | 11 (10.1%) |
Health Insurance Coverage by Citizenship Status in Spruce Pine
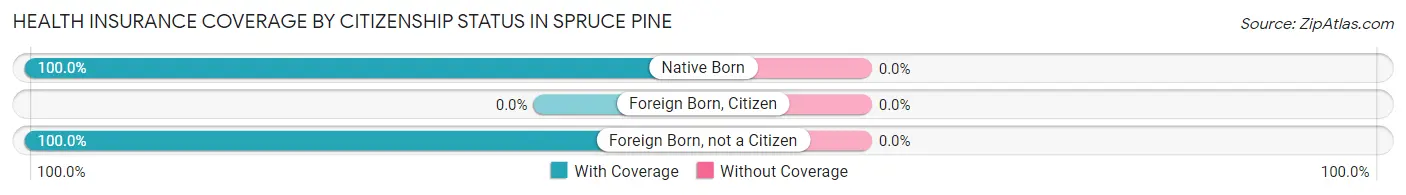
| Citizenship Status | With Coverage | Without Coverage |
| Native Born | 5 (100.0%) | 0 (0.0%) |
| Foreign Born, Citizen | 0 (0.0%) | 0 (0.0%) |
| Foreign Born, not a Citizen | 12 (100.0%) | 0 (0.0%) |
Health Insurance Coverage by Household Income in Spruce Pine
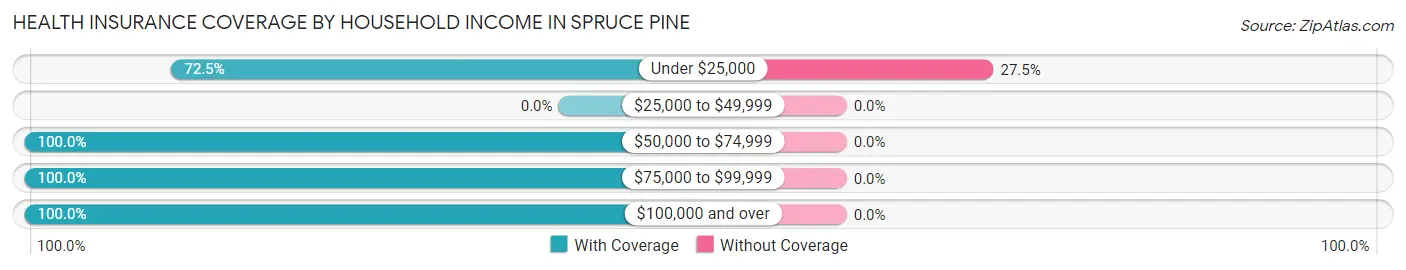
| Household Income | With Coverage | Without Coverage |
| Under $25,000 | 29 (72.5%) | 11 (27.5%) |
| $25,000 to $49,999 | 0 (0.0%) | 0 (0.0%) |
| $50,000 to $74,999 | 12 (100.0%) | 0 (0.0%) |
| $75,000 to $99,999 | 20 (100.0%) | 0 (0.0%) |
| $100,000 and over | 37 (100.0%) | 0 (0.0%) |
Public vs Private Health Insurance Coverage by Age in Spruce Pine
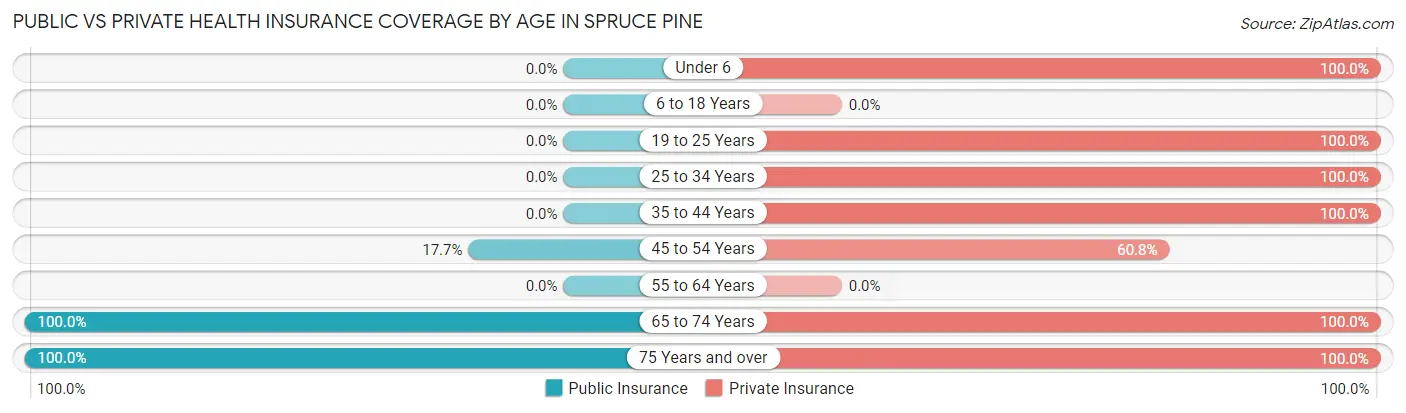
| Age Bracket | Public Insurance | Private Insurance |
| Under 6 | 0 (0.0%) | 5 (100.0%) |
| 6 to 18 Years | 0 (0.0%) | 0 (0.0%) |
| 19 to 25 Years | 0 (0.0%) | 12 (100.0%) |
| 25 to 34 Years | 0 (0.0%) | 7 (100.0%) |
| 35 to 44 Years | 0 (0.0%) | 14 (100.0%) |
| 45 to 54 Years | 9 (17.6%) | 31 (60.8%) |
| 55 to 64 Years | 0 (0.0%) | 0 (0.0%) |
| 65 to 74 Years | 13 (100.0%) | 13 (100.0%) |
| 75 Years and over | 7 (100.0%) | 7 (100.0%) |
| Total | 29 (26.6%) | 89 (81.7%) |
Disability Status by Sex by Age in Spruce Pine
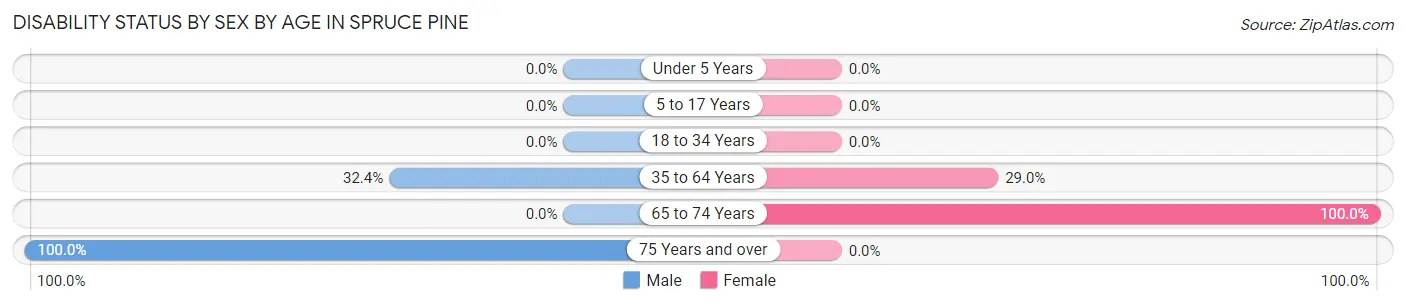
| Age Bracket | Male | Female |
| Under 5 Years | 0 (0.0%) | 0 (0.0%) |
| 5 to 17 Years | 0 (0.0%) | 0 (0.0%) |
| 18 to 34 Years | 0 (0.0%) | 0 (0.0%) |
| 35 to 64 Years | 11 (32.4%) | 9 (29.0%) |
| 65 to 74 Years | 0 (0.0%) | 13 (100.0%) |
| 75 Years and over | 7 (100.0%) | 0 (0.0%) |
Disability Class by Sex by Age in Spruce Pine
Disability Class: Hearing Difficulty
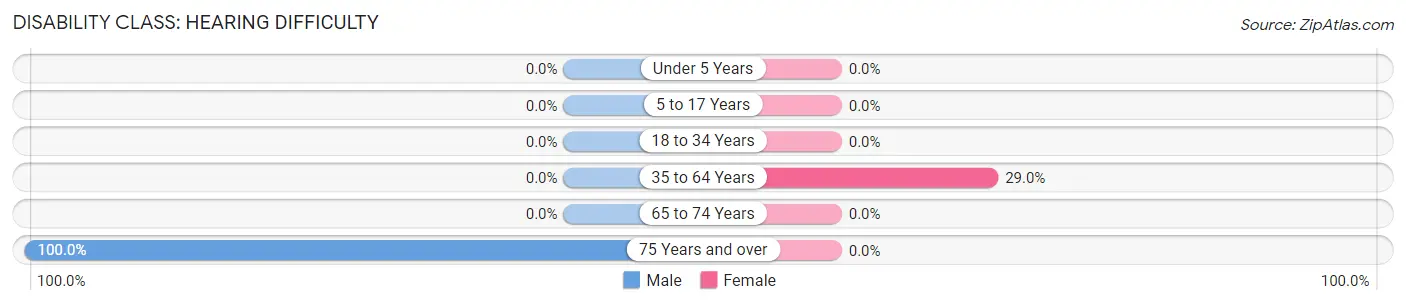
| Age Bracket | Male | Female |
| Under 5 Years | 0 (0.0%) | 0 (0.0%) |
| 5 to 17 Years | 0 (0.0%) | 0 (0.0%) |
| 18 to 34 Years | 0 (0.0%) | 0 (0.0%) |
| 35 to 64 Years | 0 (0.0%) | 9 (29.0%) |
| 65 to 74 Years | 0 (0.0%) | 0 (0.0%) |
| 75 Years and over | 7 (100.0%) | 0 (0.0%) |
Disability Class: Vision Difficulty
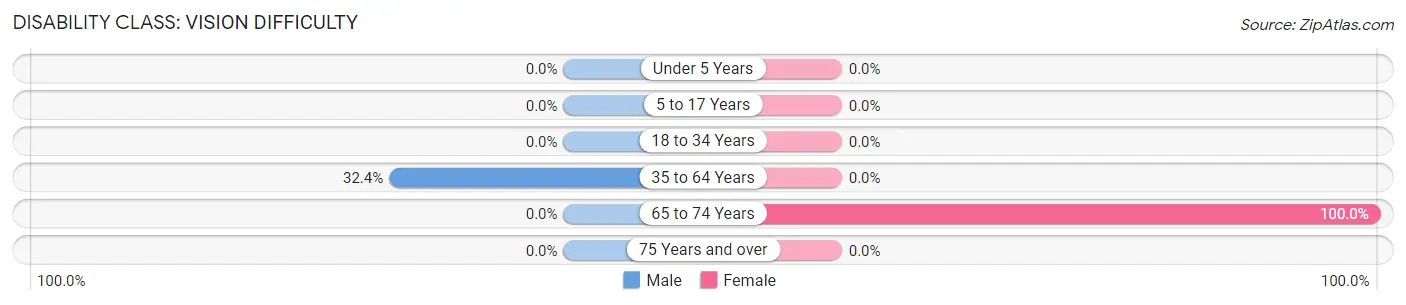
| Age Bracket | Male | Female |
| Under 5 Years | 0 (0.0%) | 0 (0.0%) |
| 5 to 17 Years | 0 (0.0%) | 0 (0.0%) |
| 18 to 34 Years | 0 (0.0%) | 0 (0.0%) |
| 35 to 64 Years | 11 (32.4%) | 0 (0.0%) |
| 65 to 74 Years | 0 (0.0%) | 13 (100.0%) |
| 75 Years and over | 0 (0.0%) | 0 (0.0%) |
Disability Class: Cognitive Difficulty

| Age Bracket | Male | Female |
| 5 to 17 Years | 0 (0.0%) | 0 (0.0%) |
| 18 to 34 Years | 0 (0.0%) | 0 (0.0%) |
| 35 to 64 Years | 0 (0.0%) | 0 (0.0%) |
| 65 to 74 Years | 0 (0.0%) | 0 (0.0%) |
| 75 Years and over | 7 (100.0%) | 0 (0.0%) |
Disability Class: Ambulatory Difficulty
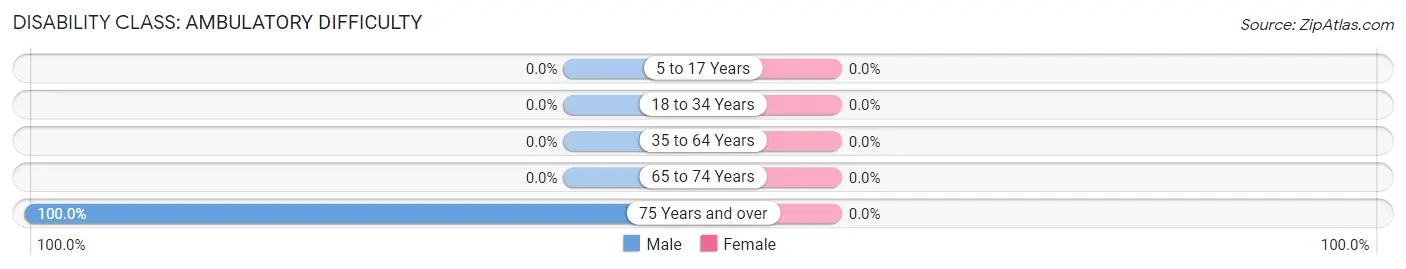
| Age Bracket | Male | Female |
| 5 to 17 Years | 0 (0.0%) | 0 (0.0%) |
| 18 to 34 Years | 0 (0.0%) | 0 (0.0%) |
| 35 to 64 Years | 0 (0.0%) | 0 (0.0%) |
| 65 to 74 Years | 0 (0.0%) | 0 (0.0%) |
| 75 Years and over | 7 (100.0%) | 0 (0.0%) |
Disability Class: Self-Care Difficulty
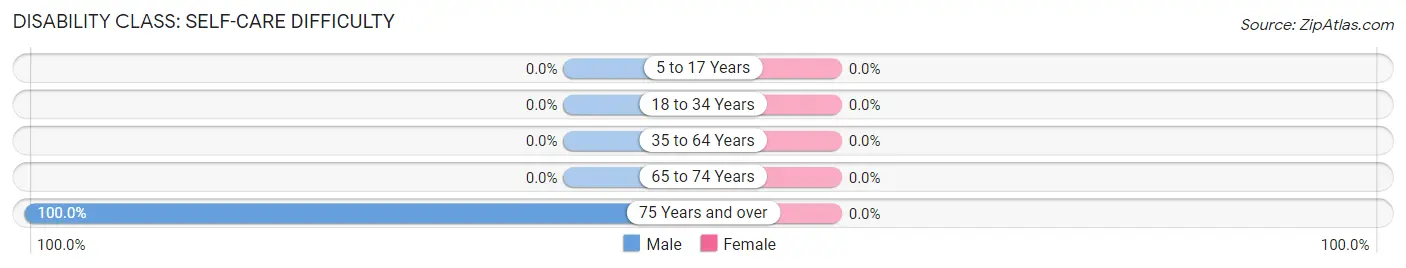
| Age Bracket | Male | Female |
| 5 to 17 Years | 0 (0.0%) | 0 (0.0%) |
| 18 to 34 Years | 0 (0.0%) | 0 (0.0%) |
| 35 to 64 Years | 0 (0.0%) | 0 (0.0%) |
| 65 to 74 Years | 0 (0.0%) | 0 (0.0%) |
| 75 Years and over | 7 (100.0%) | 0 (0.0%) |
Technology Access in Spruce Pine
Computing Device Access in Spruce Pine
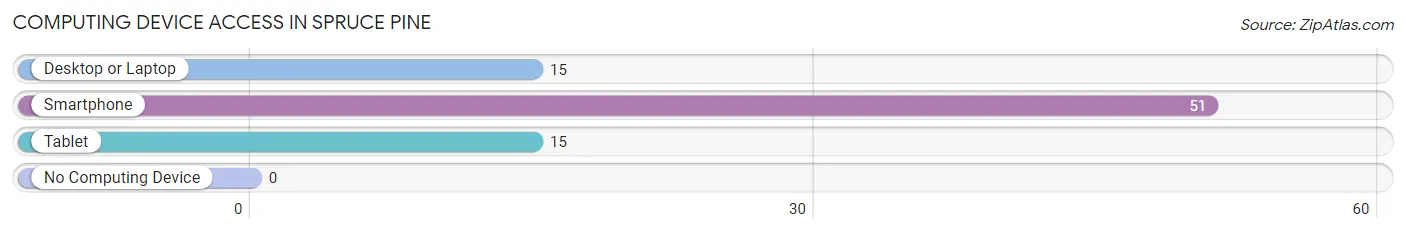
| Device Type | # Households | % Households |
| Desktop or Laptop | 15 | 29.4% |
| Smartphone | 51 | 100.0% |
| Tablet | 15 | 29.4% |
| No Computing Device | 0 | 0.0% |
| Total | 51 | 100.0% |
Internet Access in Spruce Pine
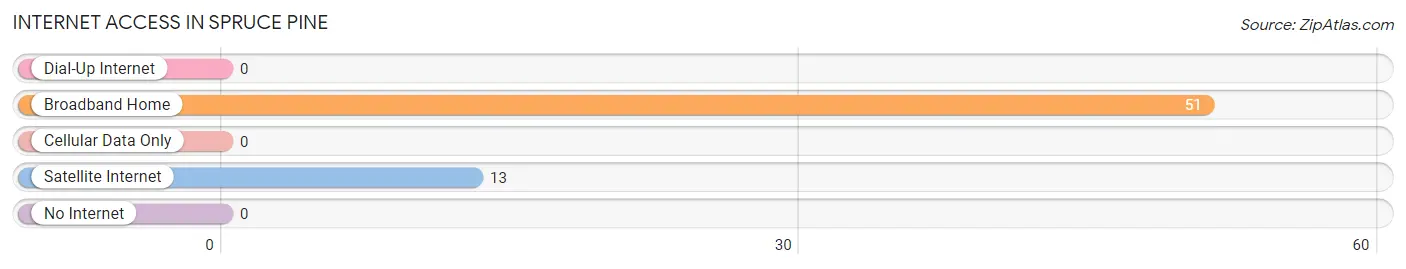
| Internet Type | # Households | % Households |
| Dial-Up Internet | 0 | 0.0% |
| Broadband Home | 51 | 100.0% |
| Cellular Data Only | 0 | 0.0% |
| Satellite Internet | 13 | 25.5% |
| No Internet | 0 | 0.0% |
| Total | 51 | 100.0% |
Spruce Pine Summary
Spruce Pine is a small town located in the Appalachian Mountains of Alabama. It is situated in the northeastern corner of the state, near the Tennessee border. The town has a population of just over 1,000 people and is the county seat of Franklin County.
History
The area that is now Spruce Pine was first settled in the early 1800s by settlers from North Carolina. The town was originally known as "Franklin Crossroads" and was later renamed "Spruce Pine" after the abundance of spruce trees in the area. The town was officially incorporated in 1887.
In the late 1800s, the town became a center for the timber industry. The timber industry was a major source of employment for the town's residents and helped to fuel the local economy.
In the early 1900s, the town began to experience a decline in the timber industry. This led to a decrease in the town's population and economic activity. However, the town was able to rebound in the mid-1900s with the development of the nearby TVA (Tennessee Valley Authority) power plant. The power plant provided jobs and economic stability to the town.
Geography
Spruce Pine is located in the Appalachian Mountains of Alabama. The town is situated in the northeastern corner of the state, near the Tennessee border. The town is located at the intersection of US Highway 72 and Alabama Highway 24.
The town is surrounded by the Bankhead National Forest and is located near the Little Bear Creek Wildlife Management Area. The town is also located near the Tennessee River, which provides recreational opportunities for the town's residents.
Economy
The economy of Spruce Pine is largely based on the timber industry. The town is home to several sawmills and lumber companies, which provide employment for many of the town's residents.
In addition to the timber industry, the town is also home to several small businesses, including restaurants, retail stores, and service providers. The town is also home to a number of manufacturing companies, which provide additional employment opportunities.
Demographics
As of the 2010 census, the population of Spruce Pine was 1,072. The town has a median household income of $30,938 and a median family income of $37,813. The town has a poverty rate of 22.3%.
The town is predominantly white, with 92.3% of the population identifying as white. The town also has a small African American population, with 4.3% of the population identifying as African American. The town also has a small Hispanic population, with 1.7% of the population identifying as Hispanic or Latino.
Conclusion
Spruce Pine is a small town located in the Appalachian Mountains of Alabama. The town has a population of just over 1,000 people and is the county seat of Franklin County. The town's economy is largely based on the timber industry, with several sawmills and lumber companies providing employment for many of the town's residents. The town is predominantly white, with 92.3% of the population identifying as white. The town also has a small African American population, with 4.3% of the population identifying as African American. The town also has a small Hispanic population, with 1.7% of the population identifying as Hispanic or Latino.
Common Questions
What is Per Capita Income in Spruce Pine?
Per Capita income in Spruce Pine is $22,359.
What is Income or Wage Gap in Spruce Pine?
Income or Wage Gap in Spruce Pine is 37.5%.
Women in Spruce Pine earn 62.5 cents for every dollar earned by a man.
What is Inequality or Gini Index in Spruce Pine?
Inequality or Gini Index in Spruce Pine is 0.51.
What is the Total Population of Spruce Pine?
Total Population of Spruce Pine is 109.
What is the Total Male Population of Spruce Pine?
Total Male Population of Spruce Pine is 56.
What is the Total Female Population of Spruce Pine?
Total Female Population of Spruce Pine is 53.
What is the Ratio of Males per 100 Females in Spruce Pine?
There are 105.66 Males per 100 Females in Spruce Pine.
What is the Ratio of Females per 100 Males in Spruce Pine?
There are 94.64 Females per 100 Males in Spruce Pine.
What is the Median Population Age in Spruce Pine?
Median Population Age in Spruce Pine is 46.8 Years.
What is the Average Family Size in Spruce Pine
Average Family Size in Spruce Pine is 2.1 People.
What is the Average Household Size in Spruce Pine
Average Household Size in Spruce Pine is 2.1 People.
How Large is the Labor Force in Spruce Pine?
There are 64 People in the Labor Forcein in Spruce Pine.
What is the Percentage of People in the Labor Force in Spruce Pine?
61.5% of People are in the Labor Force in Spruce Pine.