Slocomb, AL Map & Demographics
Slocomb Map
Slocomb Overview
$22,801
PER CAPITA INCOME
$40,833
AVG FAMILY INCOME
$38,125
AVG HOUSEHOLD INCOME
40.9%
WAGE / INCOME GAP [ % ]
59.1¢/ $1
WAGE / INCOME GAP [ $ ]
$8,104
FAMILY INCOME DEFICIT
0.44
INEQUALITY / GINI INDEX
1,860
TOTAL POPULATION
835
MALE POPULATION
1,025
FEMALE POPULATION
81.46
MALES / 100 FEMALES
122.75
FEMALES / 100 MALES
42.8
MEDIAN AGE
3.0
AVG FAMILY SIZE
2.5
AVG HOUSEHOLD SIZE
884
LABOR FORCE [ PEOPLE ]
53.8%
PERCENT IN LABOR FORCE
4.2%
UNEMPLOYMENT RATE
Slocomb Zip Codes
Slocomb Area Codes
Income in Slocomb
Income Overview in Slocomb
Per Capita Income in Slocomb is $22,801, while median incomes of families and households are $40,833 and $38,125 respectively.
| Characteristic | Number | Measure |
| Per Capita Income | 1,860 | $22,801 |
| Median Family Income | 454 | $40,833 |
| Mean Family Income | 454 | $65,782 |
| Median Household Income | 747 | $38,125 |
| Mean Household Income | 747 | $55,034 |
| Income Deficit | 454 | $8,104 |
| Wage / Income Gap (%) | 1,860 | 40.86% |
| Wage / Income Gap ($) | 1,860 | 59.14¢ per $1 |
| Gini / Inequality Index | 1,860 | 0.44 |
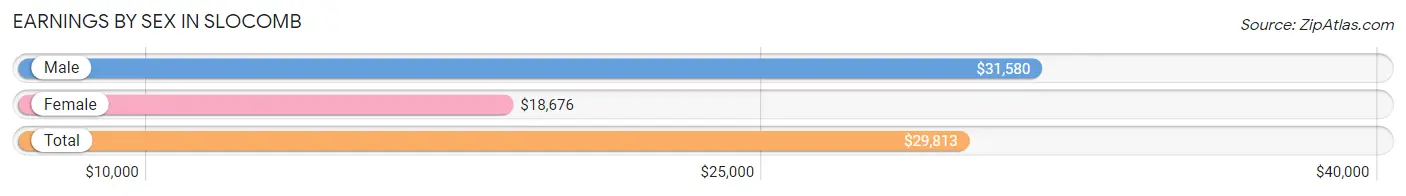
Earnings by Sex in Slocomb
Average Earnings in Slocomb are $29,813, $31,580 for men and $18,676 for women, a difference of 40.9%.
| Sex | Number | Average Earnings |
| Male | 515 (56.4%) | $31,580 |
| Female | 398 (43.6%) | $18,676 |
| Total | 913 (100.0%) | $29,813 |
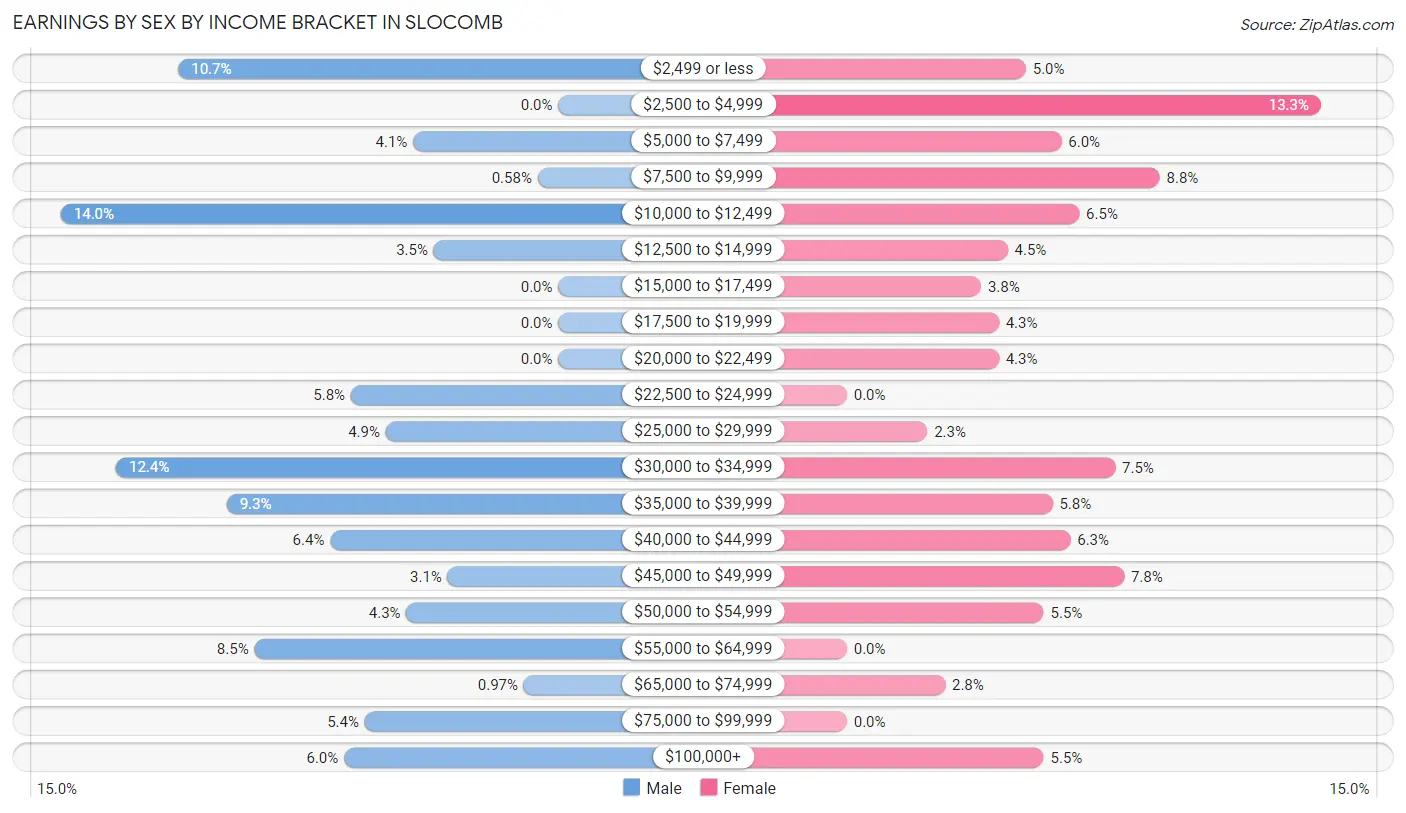
Earnings by Sex by Income Bracket in Slocomb
The most common earnings brackets in Slocomb are $10,000 to $12,499 for men (72 | 14.0%) and $2,500 to $4,999 for women (53 | 13.3%).
| Income | Male | Female |
| $2,499 or less | 55 (10.7%) | 20 (5.0%) |
| $2,500 to $4,999 | 0 (0.0%) | 53 (13.3%) |
| $5,000 to $7,499 | 21 (4.1%) | 24 (6.0%) |
| $7,500 to $9,999 | 3 (0.6%) | 35 (8.8%) |
| $10,000 to $12,499 | 72 (14.0%) | 26 (6.5%) |
| $12,500 to $14,999 | 18 (3.5%) | 18 (4.5%) |
| $15,000 to $17,499 | 0 (0.0%) | 15 (3.8%) |
| $17,500 to $19,999 | 0 (0.0%) | 17 (4.3%) |
| $20,000 to $22,499 | 0 (0.0%) | 17 (4.3%) |
| $22,500 to $24,999 | 30 (5.8%) | 0 (0.0%) |
| $25,000 to $29,999 | 25 (4.9%) | 9 (2.3%) |
| $30,000 to $34,999 | 64 (12.4%) | 30 (7.5%) |
| $35,000 to $39,999 | 48 (9.3%) | 23 (5.8%) |
| $40,000 to $44,999 | 33 (6.4%) | 25 (6.3%) |
| $45,000 to $49,999 | 16 (3.1%) | 31 (7.8%) |
| $50,000 to $54,999 | 22 (4.3%) | 22 (5.5%) |
| $55,000 to $64,999 | 44 (8.5%) | 0 (0.0%) |
| $65,000 to $74,999 | 5 (1.0%) | 11 (2.8%) |
| $75,000 to $99,999 | 28 (5.4%) | 0 (0.0%) |
| $100,000+ | 31 (6.0%) | 22 (5.5%) |
| Total | 515 (100.0%) | 398 (100.0%) |
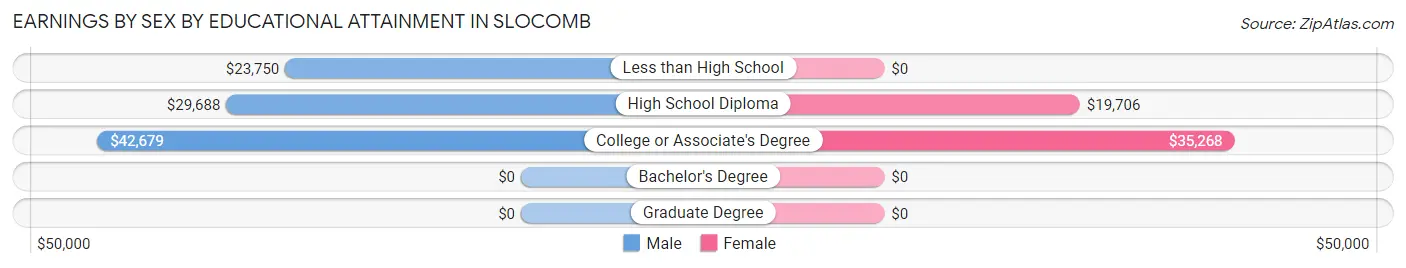
Earnings by Sex by Educational Attainment in Slocomb
Average earnings in Slocomb are $31,831 for men and $27,083 for women, a difference of 14.9%. Men with an educational attainment of college or associate's degree enjoy the highest average annual earnings of $42,679, while those with less than high school education earn the least with $23,750. Women with an educational attainment of college or associate's degree earn the most with the average annual earnings of $35,268, while those with high school diploma education have the smallest earnings of $19,706.
| Educational Attainment | Male Income | Female Income |
| Less than High School | $23,750 | $0 |
| High School Diploma | $29,688 | $19,706 |
| College or Associate's Degree | $42,679 | $35,268 |
| Bachelor's Degree | - | - |
| Graduate Degree | - | - |
| Total | $31,831 | $27,083 |
Family Income in Slocomb
Family Income Brackets in Slocomb
According to the Slocomb family income data, there are 94 families falling into the $50,000 to $74,999 income range, which is the most common income bracket and makes up 20.7% of all families. Conversely, the less than $10,000 income bracket is the least frequent group with only 6 families (1.3%) belonging to this category.
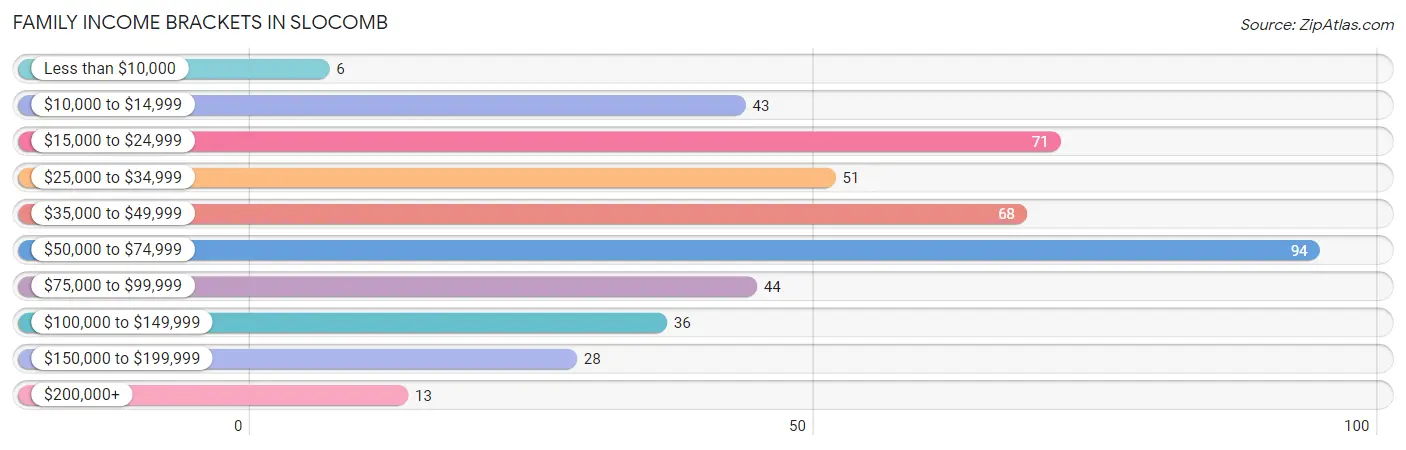
| Income Bracket | # Families | % Families |
| Less than $10,000 | 6 | 1.3% |
| $10,000 to $14,999 | 43 | 9.5% |
| $15,000 to $24,999 | 71 | 15.6% |
| $25,000 to $34,999 | 51 | 11.2% |
| $35,000 to $49,999 | 68 | 15.0% |
| $50,000 to $74,999 | 94 | 20.7% |
| $75,000 to $99,999 | 44 | 9.7% |
| $100,000 to $149,999 | 36 | 7.9% |
| $150,000 to $199,999 | 28 | 6.2% |
| $200,000+ | 13 | 2.9% |
Family Income by Famaliy Size in Slocomb
2-person families (263 | 57.9%) account for the highest median family income in Slocomb with $37,434 per family, while 2-person families (263 | 57.9%) have the highest median income of $18,717 per family member.
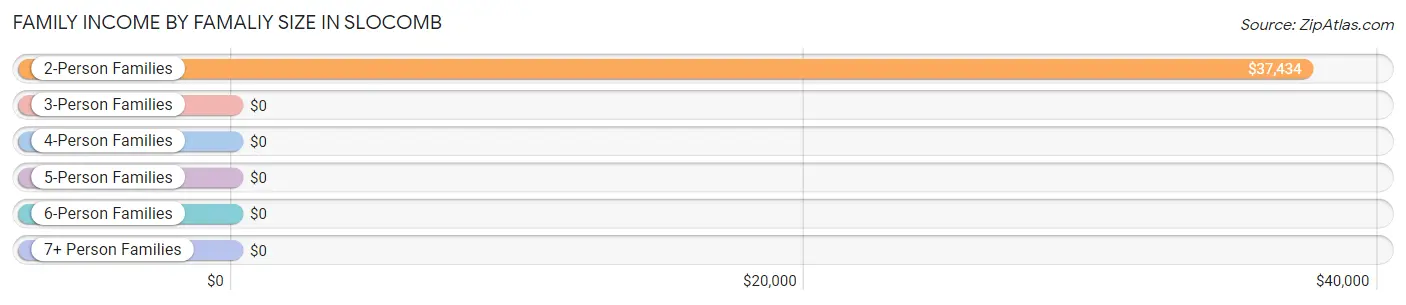
| Income Bracket | # Families | Median Income |
| 2-Person Families | 263 (57.9%) | $37,434 |
| 3-Person Families | 76 (16.7%) | $0 |
| 4-Person Families | 84 (18.5%) | $0 |
| 5-Person Families | 0 (0.0%) | $0 |
| 6-Person Families | 22 (4.9%) | $0 |
| 7+ Person Families | 9 (2.0%) | $0 |
| Total | 454 (100.0%) | $40,833 |
Family Income by Number of Earners in Slocomb
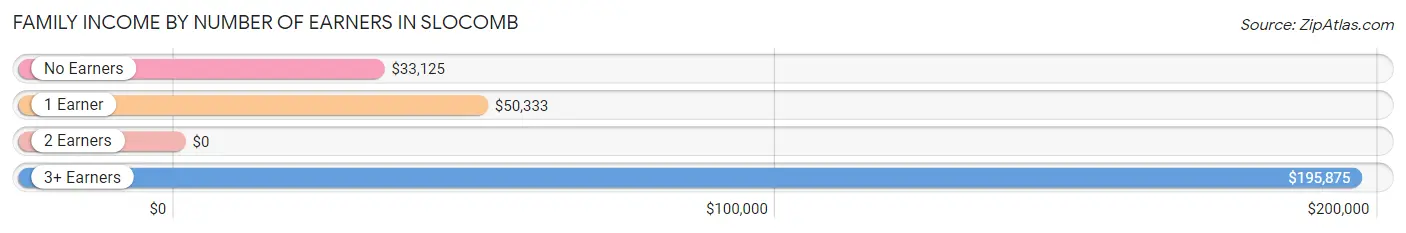
| Number of Earners | # Families | Median Income |
| No Earners | 93 (20.5%) | $33,125 |
| 1 Earner | 156 (34.4%) | $50,333 |
| 2 Earners | 166 (36.6%) | $0 |
| 3+ Earners | 39 (8.6%) | $195,875 |
| Total | 454 (100.0%) | $40,833 |
Household Income in Slocomb
Household Income Brackets in Slocomb
With 171 households falling in the category, the $50,000 to $74,999 income range is the most frequent in Slocomb, accounting for 22.9% of all households. In contrast, only 13 households (1.7%) fall into the $200,000+ income bracket, making it the least populous group.
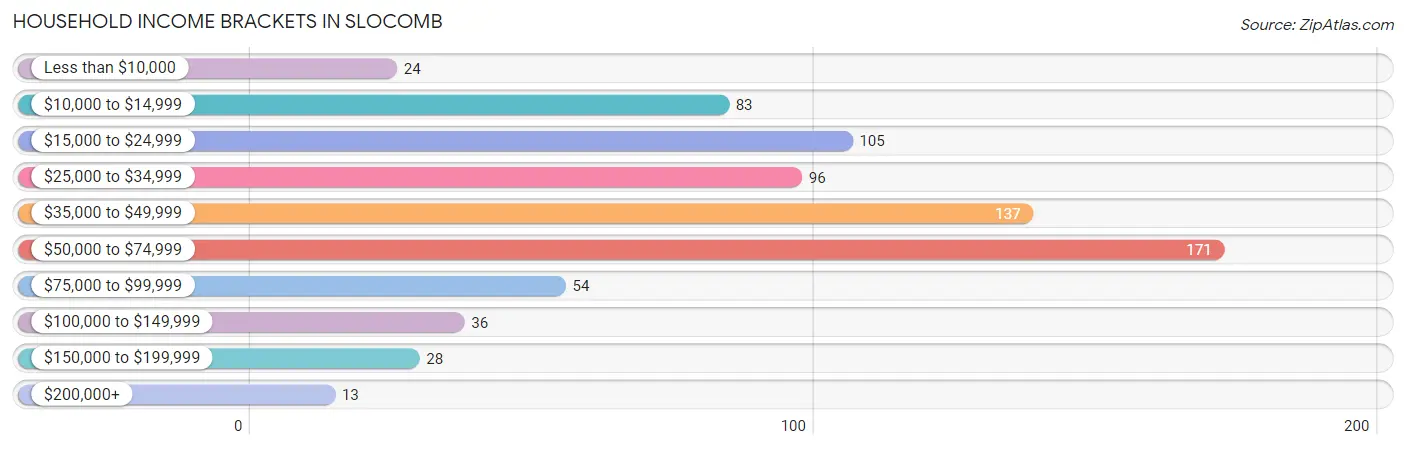
| Income Bracket | # Households | % Households |
| Less than $10,000 | 24 | 3.2% |
| $10,000 to $14,999 | 83 | 11.1% |
| $15,000 to $24,999 | 105 | 14.1% |
| $25,000 to $34,999 | 96 | 12.9% |
| $35,000 to $49,999 | 137 | 18.3% |
| $50,000 to $74,999 | 171 | 22.9% |
| $75,000 to $99,999 | 54 | 7.2% |
| $100,000 to $149,999 | 36 | 4.8% |
| $150,000 to $199,999 | 28 | 3.7% |
| $200,000+ | 13 | 1.7% |
Household Income by Householder Age in Slocomb
The median household income in Slocomb is $38,125, with the highest median household income of $68,472 found in the 15 to 24 years age bracket for the primary householder. A total of 31 households (4.2%) fall into this category. Meanwhile, the 65+ years age bracket for the primary householder has the lowest median household income of $32,875, with 273 households (36.5%) in this group.
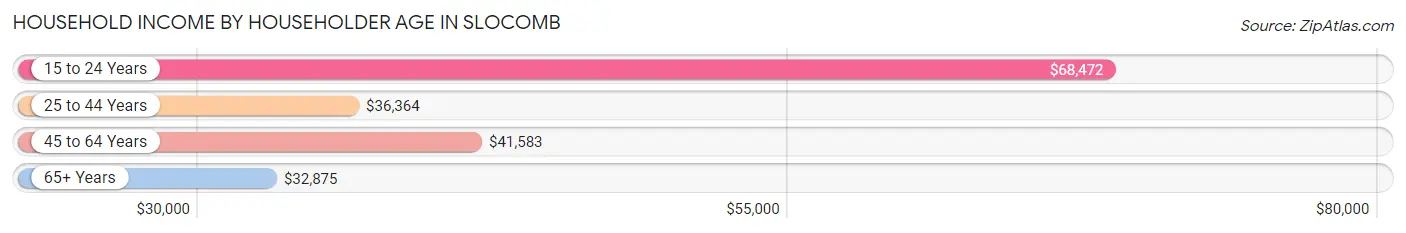
| Income Bracket | # Households | Median Income |
| 15 to 24 Years | 31 (4.2%) | $68,472 |
| 25 to 44 Years | 188 (25.2%) | $36,364 |
| 45 to 64 Years | 255 (34.1%) | $41,583 |
| 65+ Years | 273 (36.5%) | $32,875 |
| Total | 747 (100.0%) | $38,125 |
Poverty in Slocomb
Income Below Poverty by Sex and Age in Slocomb
With 29.0% poverty level for males and 36.8% for females among the residents of Slocomb, 6 to 11 year old males and under 5 year old females are the most vulnerable to poverty, with 46 males (100.0%) and 54 females (81.8%) in their respective age groups living below the poverty level.
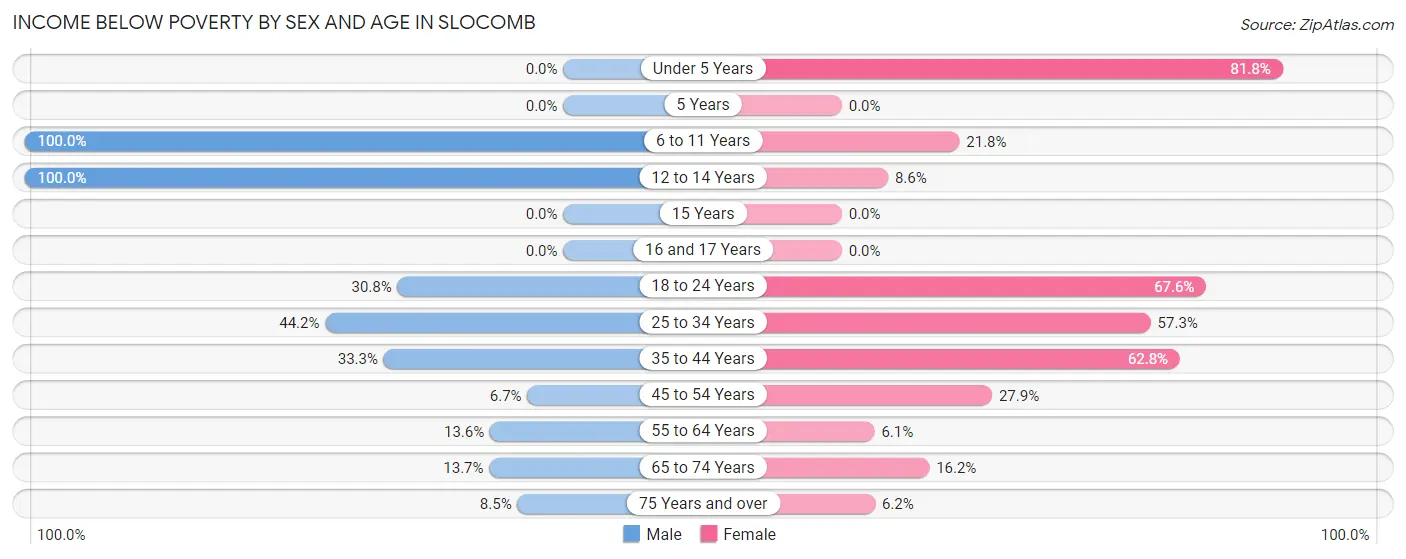
| Age Bracket | Male | Female |
| Under 5 Years | 0 (0.0%) | 54 (81.8%) |
| 5 Years | 0 (0.0%) | 0 (0.0%) |
| 6 to 11 Years | 46 (100.0%) | 12 (21.8%) |
| 12 to 14 Years | 14 (100.0%) | 3 (8.6%) |
| 15 Years | 0 (0.0%) | 0 (0.0%) |
| 16 and 17 Years | 0 (0.0%) | 0 (0.0%) |
| 18 to 24 Years | 16 (30.8%) | 94 (67.6%) |
| 25 to 34 Years | 95 (44.2%) | 43 (57.3%) |
| 35 to 44 Years | 28 (33.3%) | 91 (62.8%) |
| 45 to 54 Years | 8 (6.7%) | 46 (27.9%) |
| 55 to 64 Years | 17 (13.6%) | 6 (6.1%) |
| 65 to 74 Years | 14 (13.7%) | 24 (16.2%) |
| 75 Years and over | 4 (8.5%) | 4 (6.1%) |
| Total | 242 (29.0%) | 377 (36.8%) |
Income Above Poverty by Sex and Age in Slocomb
According to the poverty statistics in Slocomb, males aged under 5 years and females aged 16 and 17 years are the age groups that are most secure financially, with 100.0% of males and 100.0% of females in these age groups living above the poverty line.
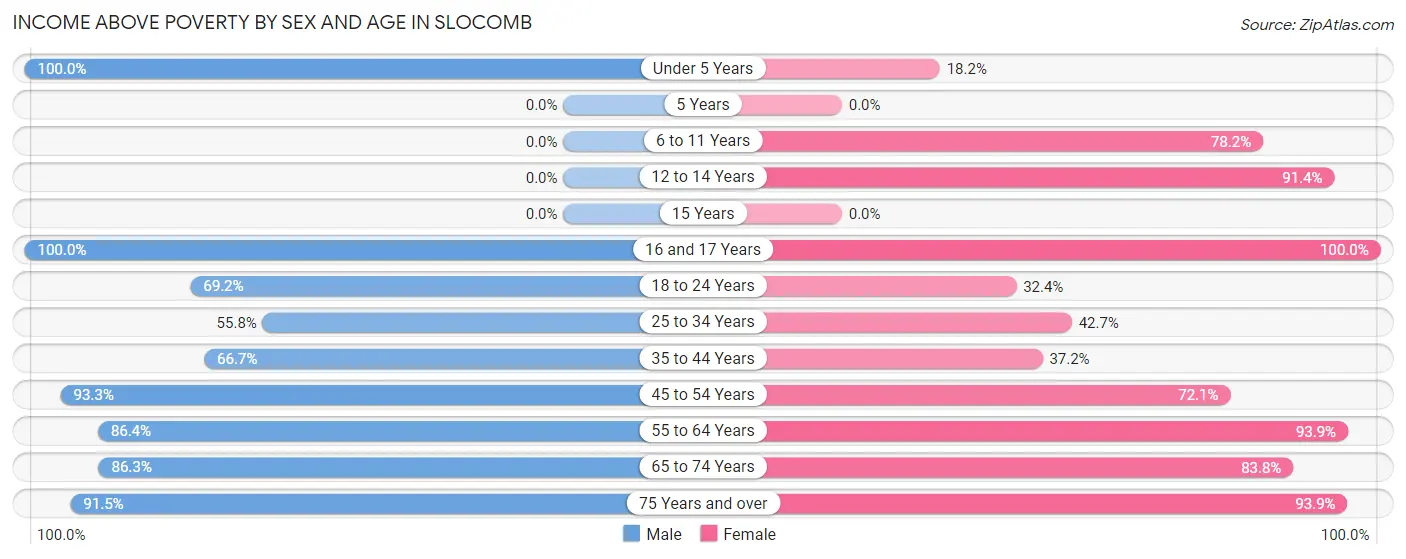
| Age Bracket | Male | Female |
| Under 5 Years | 1 (100.0%) | 12 (18.2%) |
| 5 Years | 0 (0.0%) | 0 (0.0%) |
| 6 to 11 Years | 0 (0.0%) | 43 (78.2%) |
| 12 to 14 Years | 0 (0.0%) | 32 (91.4%) |
| 15 Years | 0 (0.0%) | 0 (0.0%) |
| 16 and 17 Years | 29 (100.0%) | 33 (100.0%) |
| 18 to 24 Years | 36 (69.2%) | 45 (32.4%) |
| 25 to 34 Years | 120 (55.8%) | 32 (42.7%) |
| 35 to 44 Years | 56 (66.7%) | 54 (37.2%) |
| 45 to 54 Years | 112 (93.3%) | 119 (72.1%) |
| 55 to 64 Years | 108 (86.4%) | 93 (93.9%) |
| 65 to 74 Years | 88 (86.3%) | 124 (83.8%) |
| 75 Years and over | 43 (91.5%) | 61 (93.9%) |
| Total | 593 (71.0%) | 648 (63.2%) |
Income Below Poverty Among Married-Couple Families in Slocomb
The poverty statistics for married-couple families in Slocomb show that 9.2% or 31 of the total 337 families live below the poverty line. Families with 3 or 4 children have the highest poverty rate of 100.0%, comprising of 9 families. On the other hand, families with 1 or 2 children have the lowest poverty rate of 1.2%, which includes 1 families.
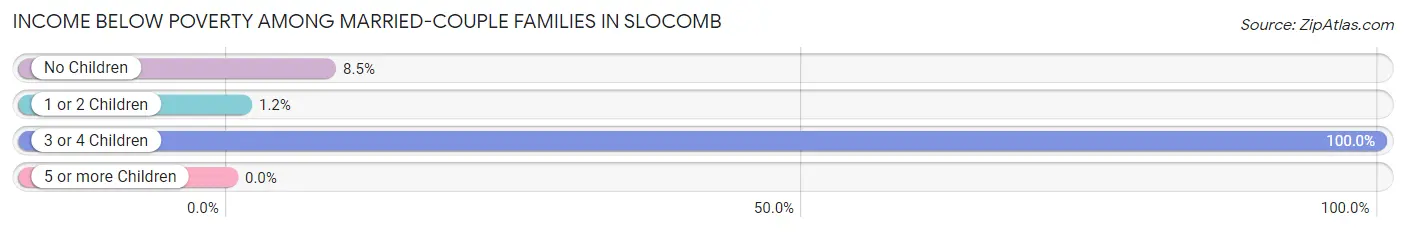
| Children | Above Poverty | Below Poverty |
| No Children | 225 (91.5%) | 21 (8.5%) |
| 1 or 2 Children | 81 (98.8%) | 1 (1.2%) |
| 3 or 4 Children | 0 (0.0%) | 9 (100.0%) |
| 5 or more Children | 0 (0.0%) | 0 (0.0%) |
| Total | 306 (90.8%) | 31 (9.2%) |
Income Below Poverty Among Single-Parent Households in Slocomb
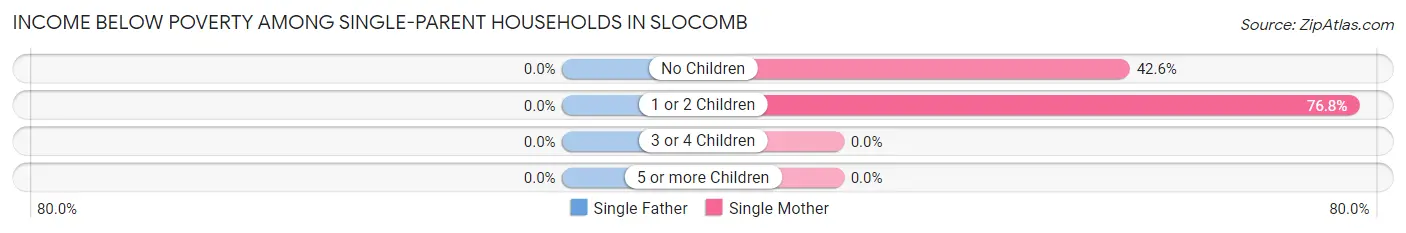
| Children | Single Father | Single Mother |
| No Children | 0 (0.0%) | 26 (42.6%) |
| 1 or 2 Children | 0 (0.0%) | 43 (76.8%) |
| 3 or 4 Children | 0 (0.0%) | 0 (0.0%) |
| 5 or more Children | 0 (0.0%) | 0 (0.0%) |
| Total | 0 (0.0%) | 69 (59.0%) |
Income Below Poverty Among Married-Couple vs Single-Parent Households in Slocomb
The poverty data for Slocomb shows that 31 of the married-couple family households (9.2%) and 69 of the single-parent households (59.0%) are living below the poverty level. Within the married-couple family households, those with 3 or 4 children have the highest poverty rate, with 9 households (100.0%) falling below the poverty line. Among the single-parent households, those with 1 or 2 children have the highest poverty rate, with 43 household (76.8%) living below poverty.
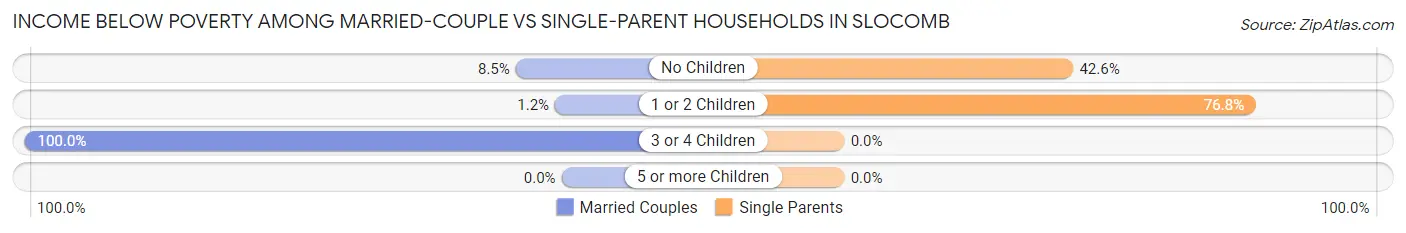
| Children | Married-Couple Families | Single-Parent Households |
| No Children | 21 (8.5%) | 26 (42.6%) |
| 1 or 2 Children | 1 (1.2%) | 43 (76.8%) |
| 3 or 4 Children | 9 (100.0%) | 0 (0.0%) |
| 5 or more Children | 0 (0.0%) | 0 (0.0%) |
| Total | 31 (9.2%) | 69 (59.0%) |
Race in Slocomb
The most populous races in Slocomb are White / Caucasian (1,362 | 73.2%), Black / African American (436 | 23.4%), and Hispanic or Latino (85 | 4.6%).
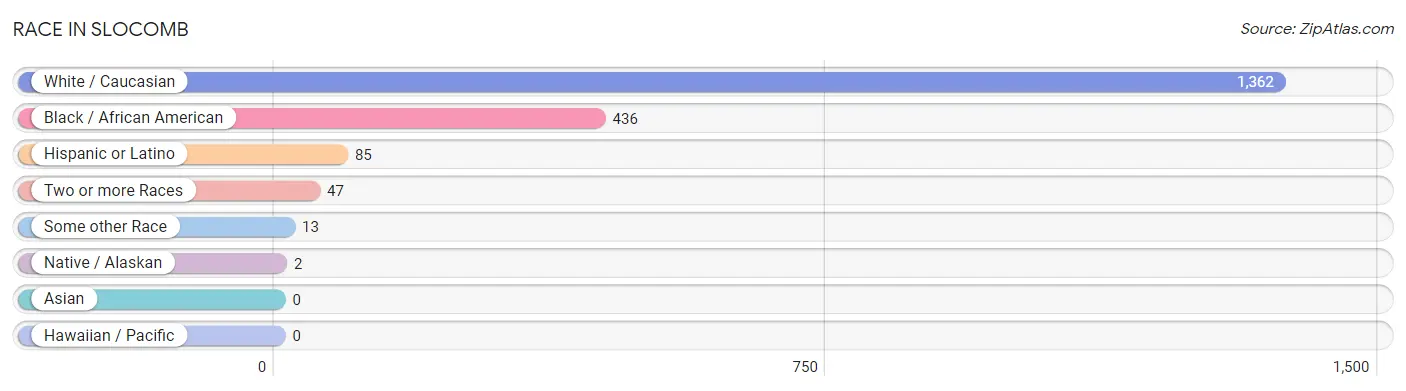
| Race | # Population | % Population |
| Asian | 0 | 0.0% |
| Black / African American | 436 | 23.4% |
| Hawaiian / Pacific | 0 | 0.0% |
| Hispanic or Latino | 85 | 4.6% |
| Native / Alaskan | 2 | 0.1% |
| White / Caucasian | 1,362 | 73.2% |
| Two or more Races | 47 | 2.5% |
| Some other Race | 13 | 0.7% |
| Total | 1,860 | 100.0% |
Ancestry in Slocomb
The most populous ancestries reported in Slocomb are English (341 | 18.3%), Irish (184 | 9.9%), American (159 | 8.6%), Mexican (82 | 4.4%), and German (78 | 4.2%), together accounting for 45.4% of all Slocomb residents.
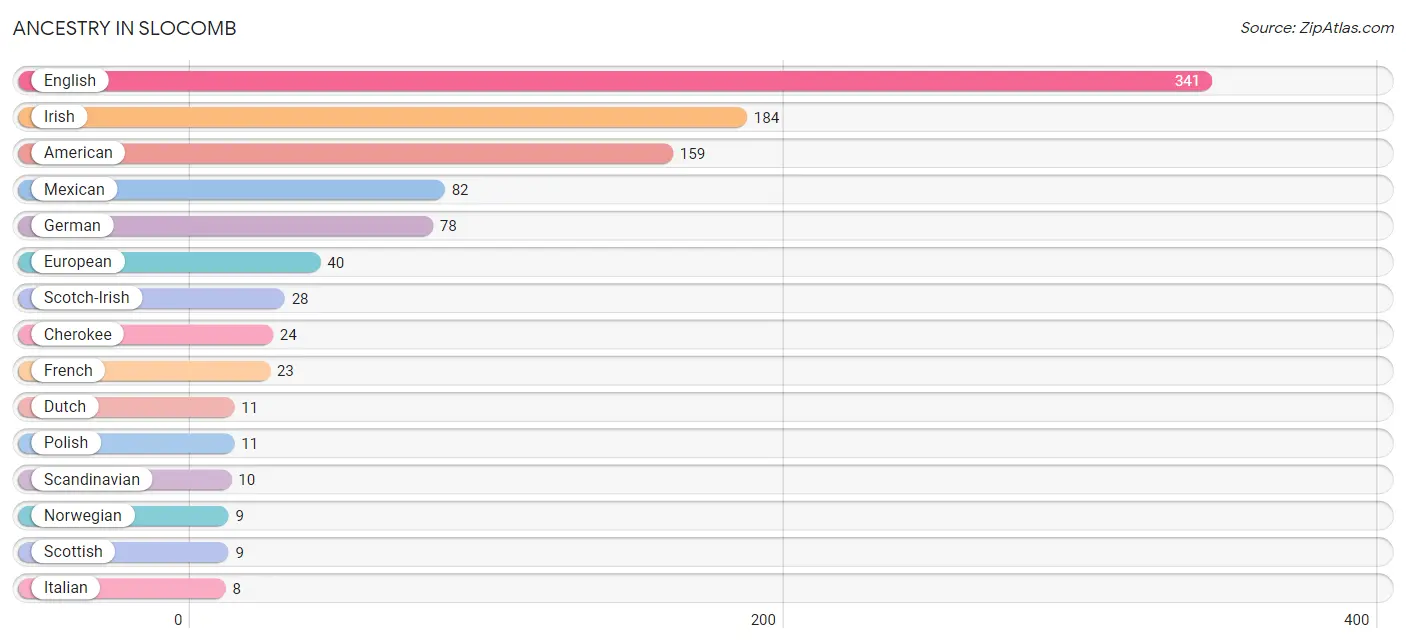
| Ancestry | # Population | % Population |
| American | 159 | 8.6% |
| Austrian | 6 | 0.3% |
| Canadian | 6 | 0.3% |
| Cherokee | 24 | 1.3% |
| Danish | 6 | 0.3% |
| Dutch | 11 | 0.6% |
| English | 341 | 18.3% |
| European | 40 | 2.1% |
| French | 23 | 1.2% |
| German | 78 | 4.2% |
| Irish | 184 | 9.9% |
| Italian | 8 | 0.4% |
| Jamaican | 5 | 0.3% |
| Mexican | 82 | 4.4% |
| Mexican American Indian | 2 | 0.1% |
| Norwegian | 9 | 0.5% |
| Peruvian | 3 | 0.2% |
| Polish | 11 | 0.6% |
| Scandinavian | 10 | 0.5% |
| Scotch-Irish | 28 | 1.5% |
| Scottish | 9 | 0.5% |
| South American | 3 | 0.2% | View All 22 Rows |
Immigrants in Slocomb
The most numerous immigrant groups reported in Slocomb came from Latin America (27 | 1.5%), Central America (19 | 1.0%), Mexico (19 | 1.0%), Caribbean (5 | 0.3%), and Jamaica (5 | 0.3%), together accounting for 4.0% of all Slocomb residents.
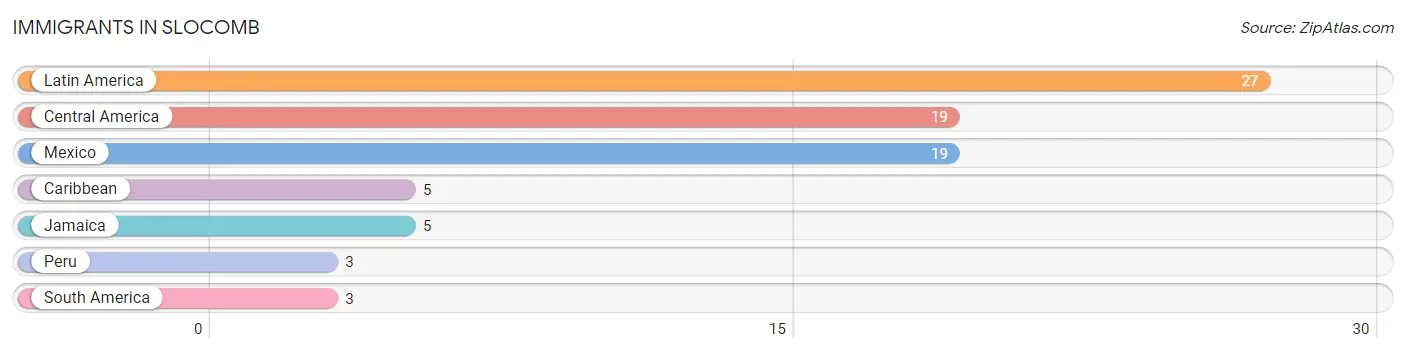
| Immigration Origin | # Population | % Population |
| Caribbean | 5 | 0.3% |
| Central America | 19 | 1.0% |
| Jamaica | 5 | 0.3% |
| Latin America | 27 | 1.5% |
| Mexico | 19 | 1.0% |
| Peru | 3 | 0.2% |
| South America | 3 | 0.2% | View All 7 Rows |
Sex and Age in Slocomb
Sex and Age in Slocomb
The most populous age groups in Slocomb are 25 to 29 Years (158 | 18.9%) for men and 40 to 44 Years (111 | 10.8%) for women.
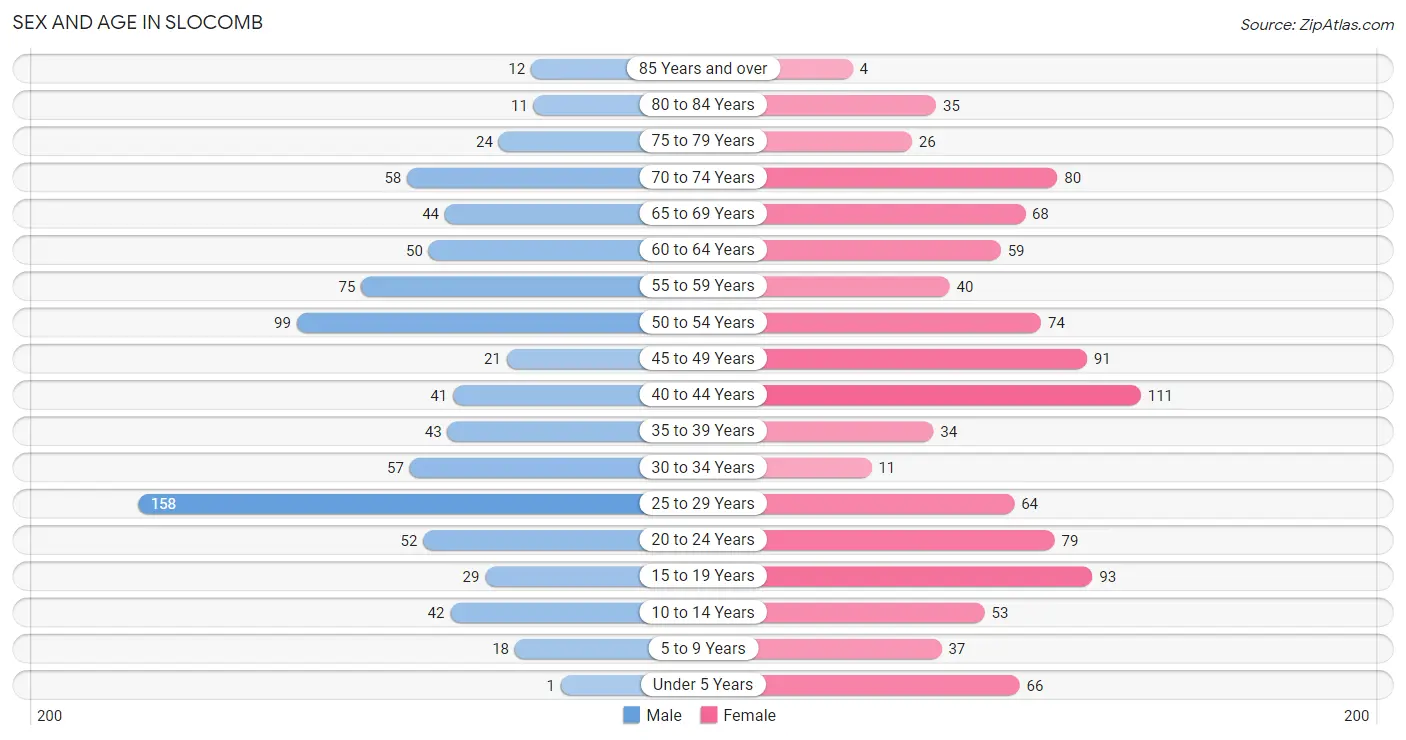
| Age Bracket | Male | Female |
| Under 5 Years | 1 (0.1%) | 66 (6.4%) |
| 5 to 9 Years | 18 (2.2%) | 37 (3.6%) |
| 10 to 14 Years | 42 (5.0%) | 53 (5.2%) |
| 15 to 19 Years | 29 (3.5%) | 93 (9.1%) |
| 20 to 24 Years | 52 (6.2%) | 79 (7.7%) |
| 25 to 29 Years | 158 (18.9%) | 64 (6.2%) |
| 30 to 34 Years | 57 (6.8%) | 11 (1.1%) |
| 35 to 39 Years | 43 (5.1%) | 34 (3.3%) |
| 40 to 44 Years | 41 (4.9%) | 111 (10.8%) |
| 45 to 49 Years | 21 (2.5%) | 91 (8.9%) |
| 50 to 54 Years | 99 (11.9%) | 74 (7.2%) |
| 55 to 59 Years | 75 (9.0%) | 40 (3.9%) |
| 60 to 64 Years | 50 (6.0%) | 59 (5.8%) |
| 65 to 69 Years | 44 (5.3%) | 68 (6.6%) |
| 70 to 74 Years | 58 (7.0%) | 80 (7.8%) |
| 75 to 79 Years | 24 (2.9%) | 26 (2.5%) |
| 80 to 84 Years | 11 (1.3%) | 35 (3.4%) |
| 85 Years and over | 12 (1.4%) | 4 (0.4%) |
| Total | 835 (100.0%) | 1,025 (100.0%) |
Families and Households in Slocomb
Median Family Size in Slocomb
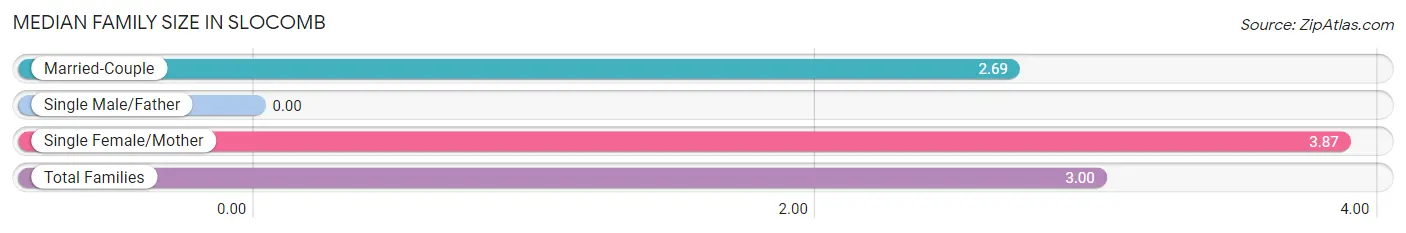
| Family Type | # Families | Family Size |
| Married-Couple | 337 (74.2%) | 2.69 |
| Single Male/Father | 0 (0.0%) | - |
| Single Female/Mother | 117 (25.8%) | 3.87 |
| Total Families | 454 (100.0%) | 3.00 |
Median Household Size in Slocomb
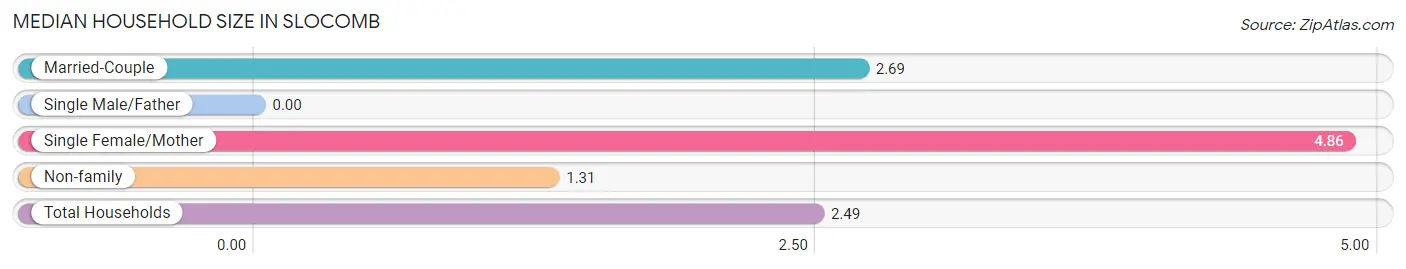
| Household Type | # Households | Household Size |
| Married-Couple | 337 (45.1%) | 2.69 |
| Single Male/Father | 0 (0.0%) | - |
| Single Female/Mother | 117 (15.7%) | 4.86 |
| Non-family | 293 (39.2%) | 1.31 |
| Total Households | 747 (100.0%) | 2.49 |
Household Size by Marriage Status in Slocomb
Out of a total of 747 households in Slocomb, 454 (60.8%) are family households, while 293 (39.2%) are nonfamily households. The most numerous type of family households are 2-person households, comprising 252, and the most common type of nonfamily households are 1-person households, comprising 219.
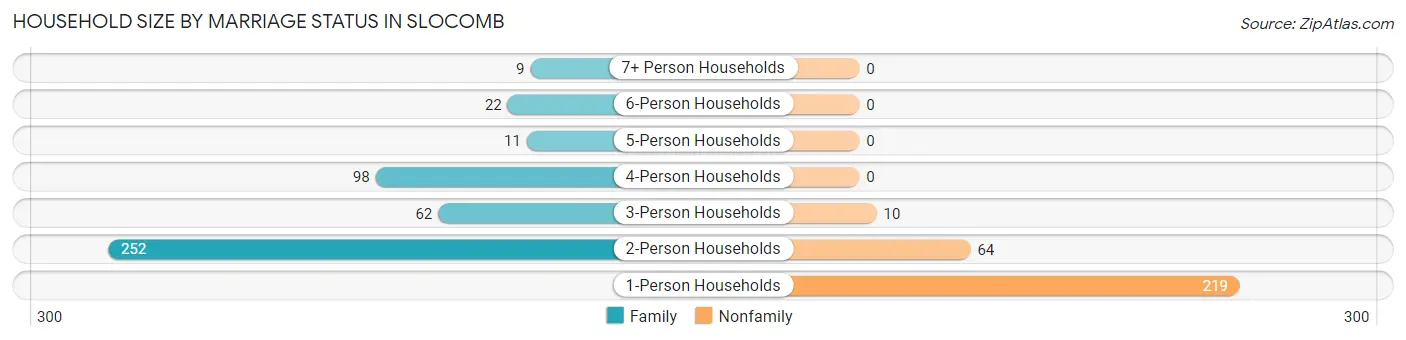
| Household Size | Family Households | Nonfamily Households |
| 1-Person Households | - | 219 (29.3%) |
| 2-Person Households | 252 (33.7%) | 64 (8.6%) |
| 3-Person Households | 62 (8.3%) | 10 (1.3%) |
| 4-Person Households | 98 (13.1%) | 0 (0.0%) |
| 5-Person Households | 11 (1.5%) | 0 (0.0%) |
| 6-Person Households | 22 (2.9%) | 0 (0.0%) |
| 7+ Person Households | 9 (1.2%) | 0 (0.0%) |
| Total | 454 (60.8%) | 293 (39.2%) |
Female Fertility in Slocomb
Fertility by Age in Slocomb
Average fertility rate in Slocomb is 18.0 births per 1,000 women. Women in the age bracket of 20 to 34 years have the highest fertility rate with 58.0 births per 1,000 women. Women in the age bracket of 20 to 34 years acount for 100.0% of all women with births.
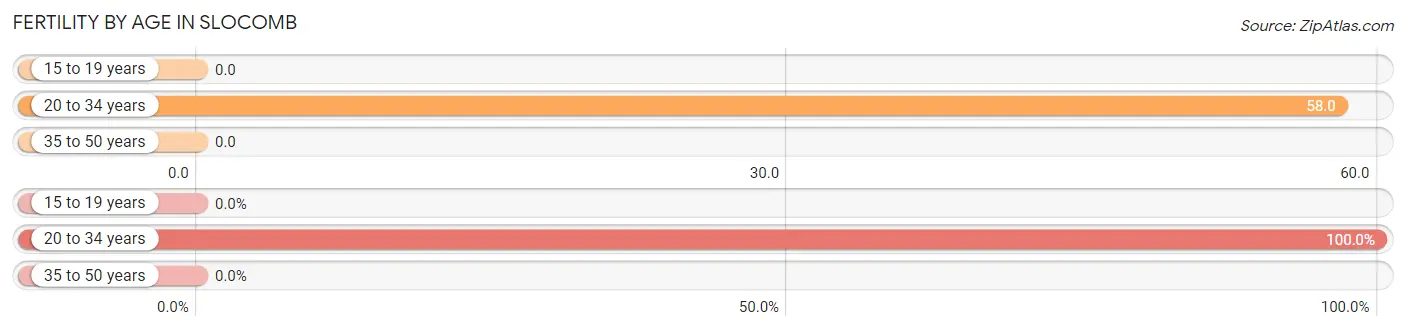
| Age Bracket | Women with Births | Births / 1,000 Women |
| 15 to 19 years | 0 (0.0%) | 0.0 |
| 20 to 34 years | 9 (100.0%) | 58.0 |
| 35 to 50 years | 0 (0.0%) | 0.0 |
| Total | 9 (100.0%) | 18.0 |
Fertility by Age by Marriage Status in Slocomb
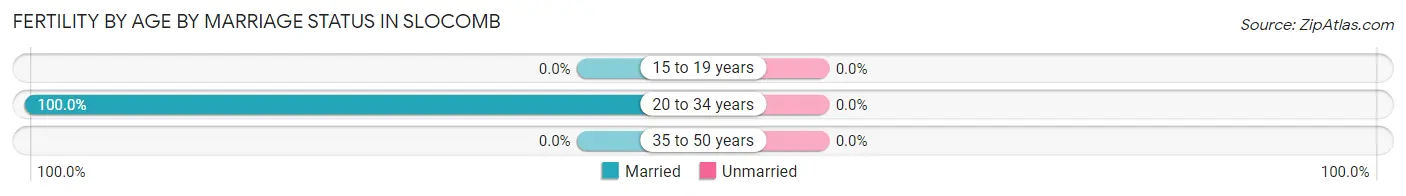
| Age Bracket | Married | Unmarried |
| 15 to 19 years | 0 (0.0%) | 0 (0.0%) |
| 20 to 34 years | 9 (100.0%) | 0 (0.0%) |
| 35 to 50 years | 0 (0.0%) | 0 (0.0%) |
| Total | 9 (100.0%) | 0 (0.0%) |
Fertility by Education in Slocomb
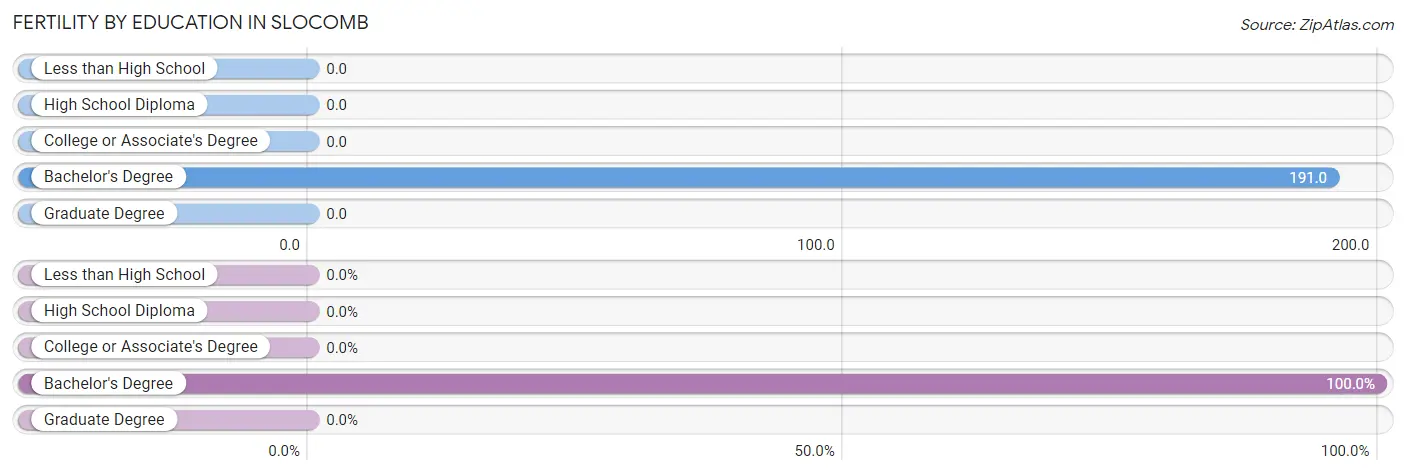
| Educational Attainment | Women with Births | Births / 1,000 Women |
| Less than High School | 0 (0.0%) | 0.0 |
| High School Diploma | 0 (0.0%) | 0.0 |
| College or Associate's Degree | 0 (0.0%) | 0.0 |
| Bachelor's Degree | 9 (100.0%) | 191.0 |
| Graduate Degree | 0 (0.0%) | 0.0 |
| Total | 9 (100.0%) | 18.0 |
Fertility by Education by Marriage Status in Slocomb
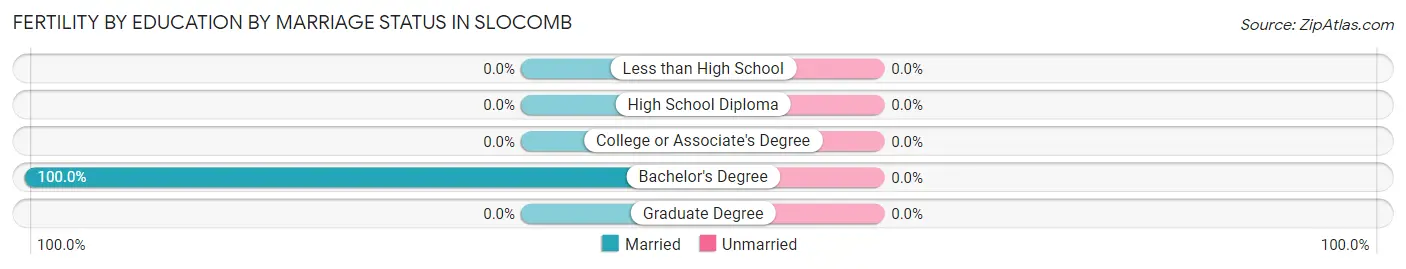
| Educational Attainment | Married | Unmarried |
| Less than High School | 0 (0.0%) | 0 (0.0%) |
| High School Diploma | 0 (0.0%) | 0 (0.0%) |
| College or Associate's Degree | 0 (0.0%) | 0 (0.0%) |
| Bachelor's Degree | 9 (100.0%) | 0 (0.0%) |
| Graduate Degree | 0 (0.0%) | 0 (0.0%) |
| Total | 9 (100.0%) | 0 (0.0%) |
Employment Characteristics in Slocomb
Employment by Class of Employer in Slocomb
Among the 826 employed individuals in Slocomb, private company employees (641 | 77.6%), local government employees (84 | 10.2%), and self-employed (not incorporated) (63 | 7.6%) make up the most common classes of employment.
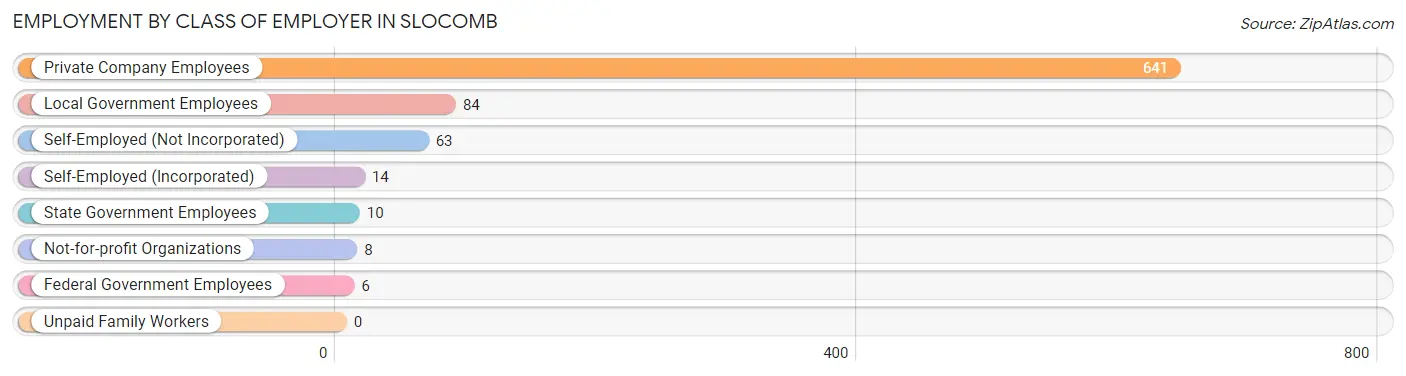
| Employer Class | # Employees | % Employees |
| Private Company Employees | 641 | 77.6% |
| Self-Employed (Incorporated) | 14 | 1.7% |
| Self-Employed (Not Incorporated) | 63 | 7.6% |
| Not-for-profit Organizations | 8 | 1.0% |
| Local Government Employees | 84 | 10.2% |
| State Government Employees | 10 | 1.2% |
| Federal Government Employees | 6 | 0.7% |
| Unpaid Family Workers | 0 | 0.0% |
| Total | 826 | 100.0% |
Employment Status by Age in Slocomb
According to the labor force statistics for Slocomb, out of the total population over 16 years of age (1,643), 53.8% or 884 individuals are in the labor force, with 4.2% or 37 of them unemployed. The age group with the highest labor force participation rate is 30 to 34 years, with 100.0% or 68 individuals in the labor force. Within the labor force, the 35 to 44 years age range has the highest percentage of unemployed individuals, with 12.8% or 14 of them being unemployed.
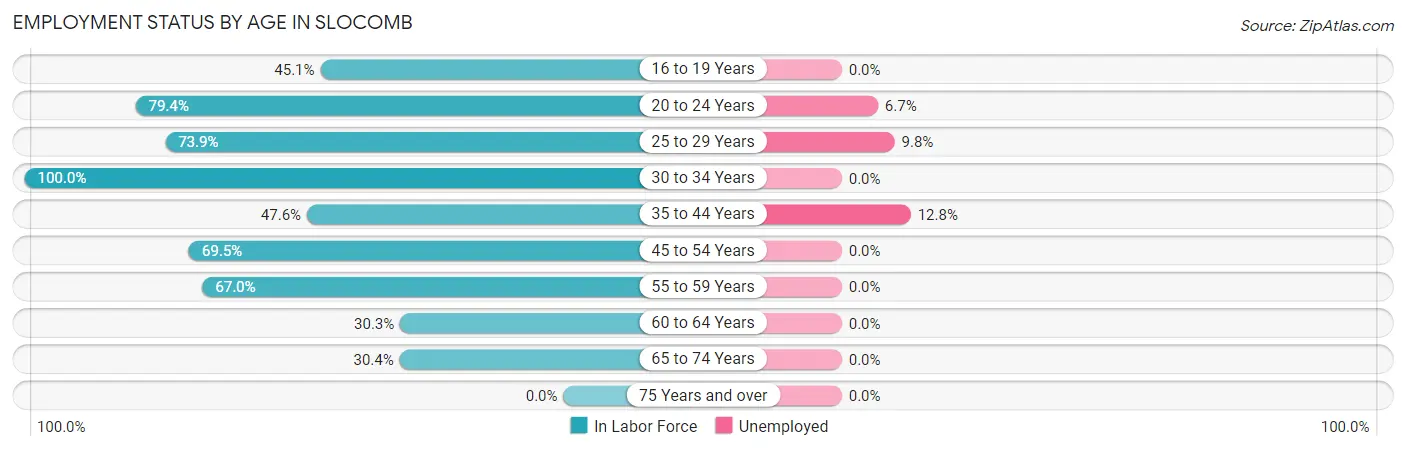
| Age Bracket | In Labor Force | Unemployed |
| 16 to 19 Years | 55 (45.1%) | 0 (0.0%) |
| 20 to 24 Years | 104 (79.4%) | 7 (6.7%) |
| 25 to 29 Years | 164 (73.9%) | 16 (9.8%) |
| 30 to 34 Years | 68 (100.0%) | 0 (0.0%) |
| 35 to 44 Years | 109 (47.6%) | 14 (12.8%) |
| 45 to 54 Years | 198 (69.5%) | 0 (0.0%) |
| 55 to 59 Years | 77 (67.0%) | 0 (0.0%) |
| 60 to 64 Years | 33 (30.3%) | 0 (0.0%) |
| 65 to 74 Years | 76 (30.4%) | 0 (0.0%) |
| 75 Years and over | 0 (0.0%) | 0 (0.0%) |
| Total | 884 (53.8%) | 37 (4.2%) |
Employment Status by Educational Attainment in Slocomb
According to labor force statistics for Slocomb, 63.1% of individuals (649) out of the total population between 25 and 64 years of age (1,028) are in the labor force, with 4.6% or 30 of them being unemployed. The group with the highest labor force participation rate are those with the educational attainment of bachelor's degree or higher, with 73.4% or 80 individuals in the labor force. Within the labor force, individuals with less than high school education have the highest percentage of unemployment, with 24.5% or 23 of them being unemployed.
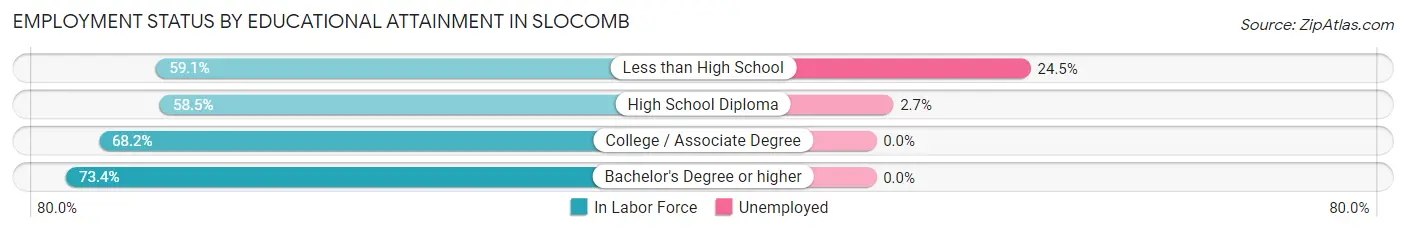
| Educational Attainment | In Labor Force | Unemployed |
| Less than High School | 94 (59.1%) | 39 (24.5%) |
| High School Diploma | 261 (58.5%) | 12 (2.7%) |
| College / Associate Degree | 214 (68.2%) | 0 (0.0%) |
| Bachelor's Degree or higher | 80 (73.4%) | 0 (0.0%) |
| Total | 649 (63.1%) | 47 (4.6%) |
Employment Occupations by Sex in Slocomb
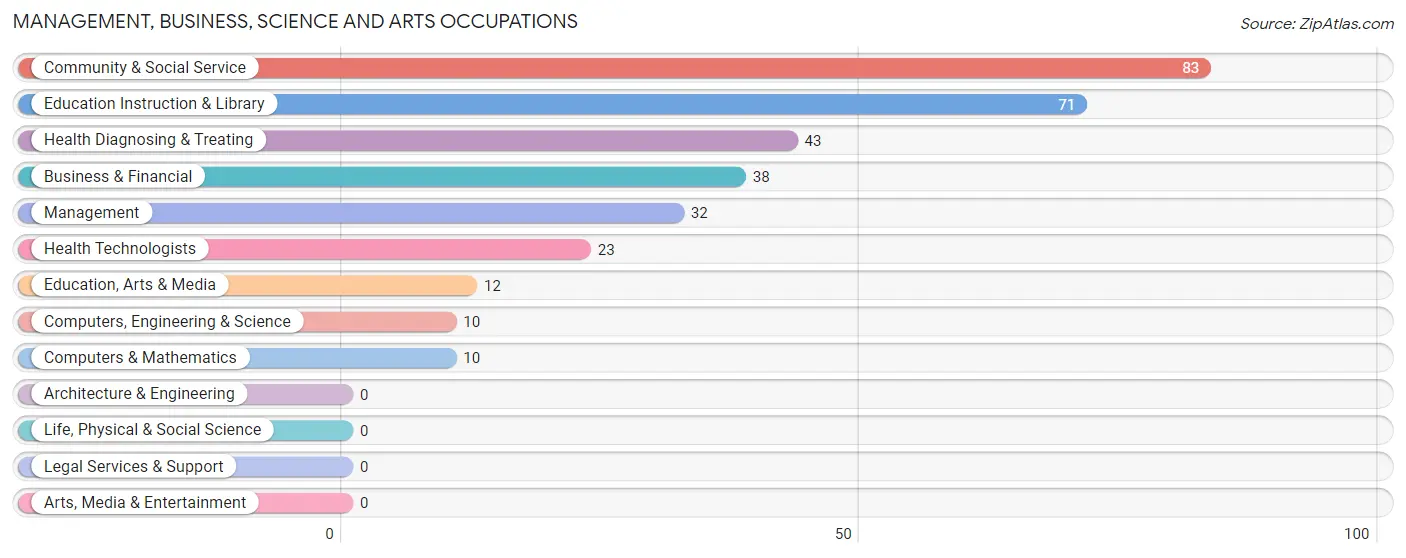
Management, Business, Science and Arts Occupations
The most common Management, Business, Science and Arts occupations in Slocomb are Community & Social Service (83 | 9.8%), Education Instruction & Library (71 | 8.4%), Health Diagnosing & Treating (43 | 5.1%), Business & Financial (38 | 4.5%), and Management (32 | 3.8%).
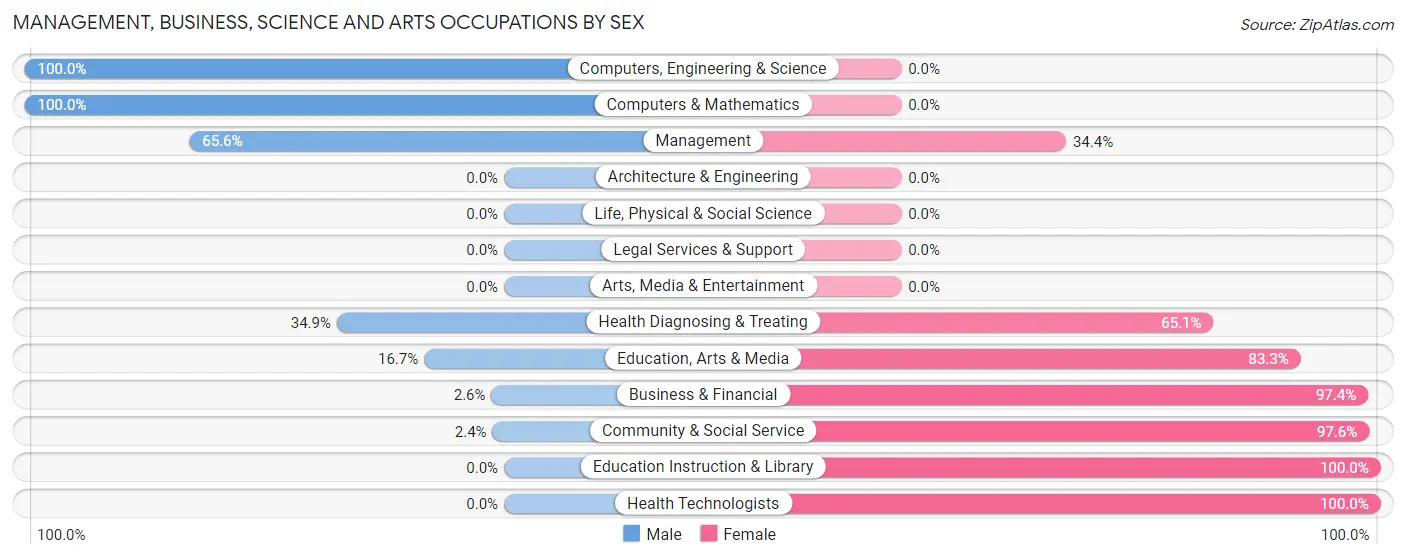
Management, Business, Science and Arts Occupations by Sex
Within the Management, Business, Science and Arts occupations in Slocomb, the most male-oriented occupations are Computers, Engineering & Science (100.0%), Computers & Mathematics (100.0%), and Management (65.6%), while the most female-oriented occupations are Education Instruction & Library (100.0%), Health Technologists (100.0%), and Community & Social Service (97.6%).
| Occupation | Male | Female |
| Management | 21 (65.6%) | 11 (34.4%) |
| Business & Financial | 1 (2.6%) | 37 (97.4%) |
| Computers, Engineering & Science | 10 (100.0%) | 0 (0.0%) |
| Computers & Mathematics | 10 (100.0%) | 0 (0.0%) |
| Architecture & Engineering | 0 (0.0%) | 0 (0.0%) |
| Life, Physical & Social Science | 0 (0.0%) | 0 (0.0%) |
| Community & Social Service | 2 (2.4%) | 81 (97.6%) |
| Education, Arts & Media | 2 (16.7%) | 10 (83.3%) |
| Legal Services & Support | 0 (0.0%) | 0 (0.0%) |
| Education Instruction & Library | 0 (0.0%) | 71 (100.0%) |
| Arts, Media & Entertainment | 0 (0.0%) | 0 (0.0%) |
| Health Diagnosing & Treating | 15 (34.9%) | 28 (65.1%) |
| Health Technologists | 0 (0.0%) | 23 (100.0%) |
| Total (Category) | 49 (23.8%) | 157 (76.2%) |
| Total (Overall) | 466 (55.0%) | 381 (45.0%) |
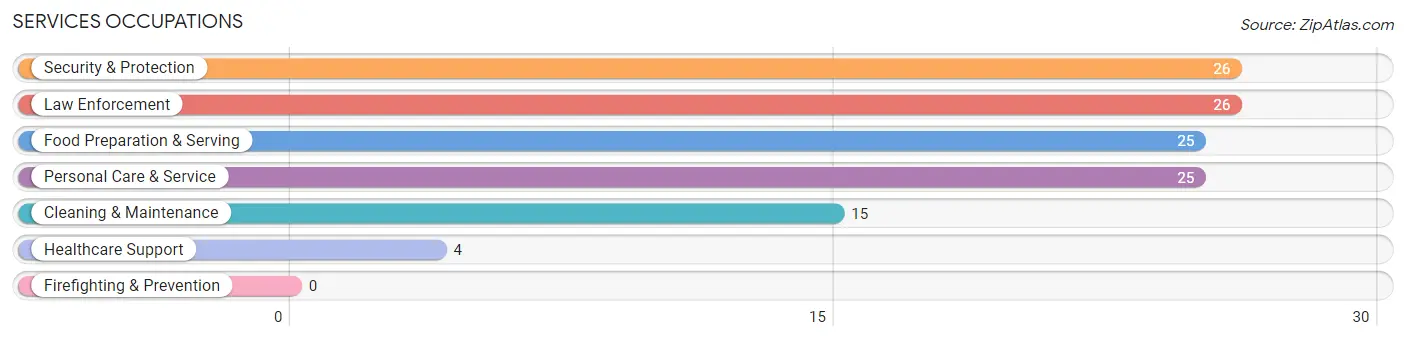
Services Occupations
The most common Services occupations in Slocomb are Security & Protection (26 | 3.1%), Law Enforcement (26 | 3.1%), Food Preparation & Serving (25 | 2.9%), Personal Care & Service (25 | 2.9%), and Cleaning & Maintenance (15 | 1.8%).
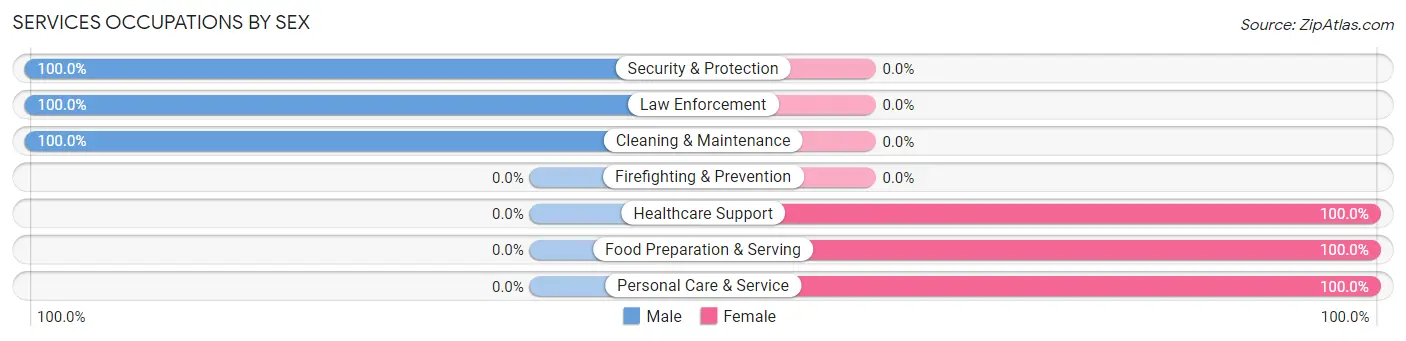
Services Occupations by Sex
Within the Services occupations in Slocomb, the most male-oriented occupations are Security & Protection (100.0%), Law Enforcement (100.0%), and Cleaning & Maintenance (100.0%), while the most female-oriented occupations are Healthcare Support (100.0%), Food Preparation & Serving (100.0%), and Personal Care & Service (100.0%).
| Occupation | Male | Female |
| Healthcare Support | 0 (0.0%) | 4 (100.0%) |
| Security & Protection | 26 (100.0%) | 0 (0.0%) |
| Firefighting & Prevention | 0 (0.0%) | 0 (0.0%) |
| Law Enforcement | 26 (100.0%) | 0 (0.0%) |
| Food Preparation & Serving | 0 (0.0%) | 25 (100.0%) |
| Cleaning & Maintenance | 15 (100.0%) | 0 (0.0%) |
| Personal Care & Service | 0 (0.0%) | 25 (100.0%) |
| Total (Category) | 41 (43.2%) | 54 (56.8%) |
| Total (Overall) | 466 (55.0%) | 381 (45.0%) |
Sales and Office Occupations
The most common Sales and Office occupations in Slocomb are Sales & Related (140 | 16.5%), and Office & Administration (46 | 5.4%).
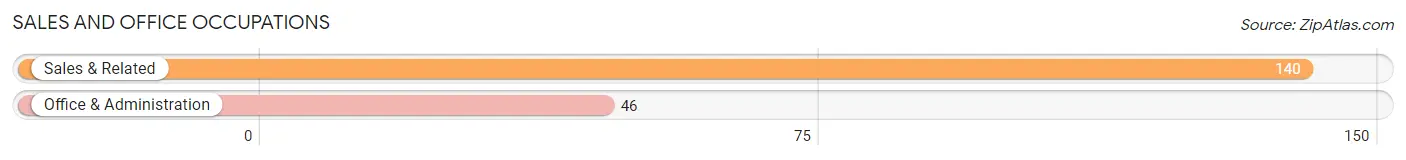
Sales and Office Occupations by Sex
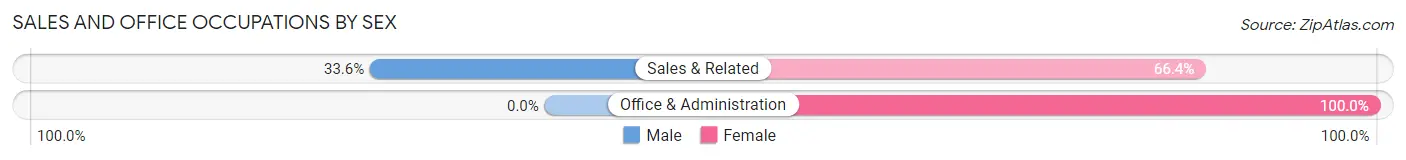
| Occupation | Male | Female |
| Sales & Related | 47 (33.6%) | 93 (66.4%) |
| Office & Administration | 0 (0.0%) | 46 (100.0%) |
| Total (Category) | 47 (25.3%) | 139 (74.7%) |
| Total (Overall) | 466 (55.0%) | 381 (45.0%) |
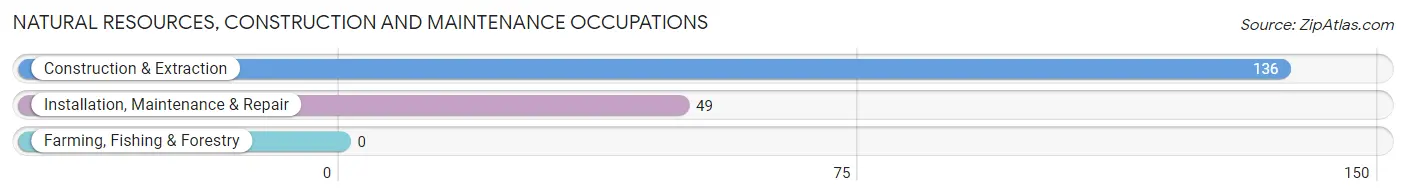
Natural Resources, Construction and Maintenance Occupations
The most common Natural Resources, Construction and Maintenance occupations in Slocomb are Construction & Extraction (136 | 16.1%), and Installation, Maintenance & Repair (49 | 5.8%).
Natural Resources, Construction and Maintenance Occupations by Sex
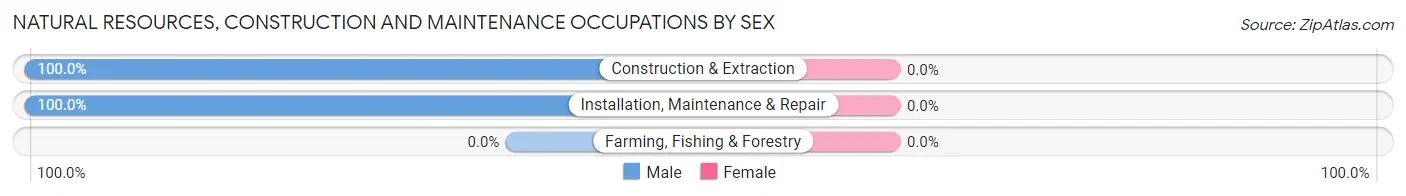
| Occupation | Male | Female |
| Farming, Fishing & Forestry | 0 (0.0%) | 0 (0.0%) |
| Construction & Extraction | 136 (100.0%) | 0 (0.0%) |
| Installation, Maintenance & Repair | 49 (100.0%) | 0 (0.0%) |
| Total (Category) | 185 (100.0%) | 0 (0.0%) |
| Total (Overall) | 466 (55.0%) | 381 (45.0%) |
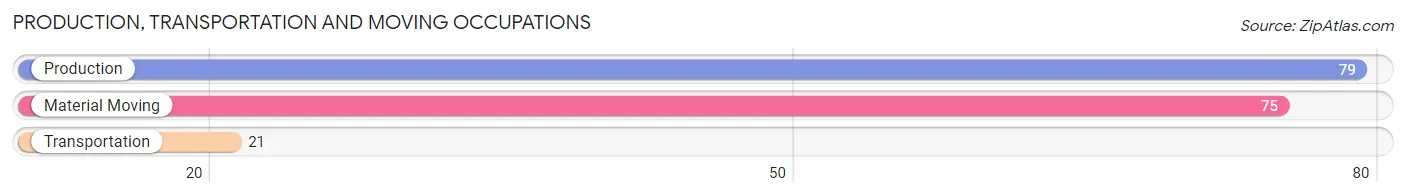
Production, Transportation and Moving Occupations
The most common Production, Transportation and Moving occupations in Slocomb are Production (79 | 9.3%), Material Moving (75 | 8.8%), and Transportation (21 | 2.5%).
Production, Transportation and Moving Occupations by Sex
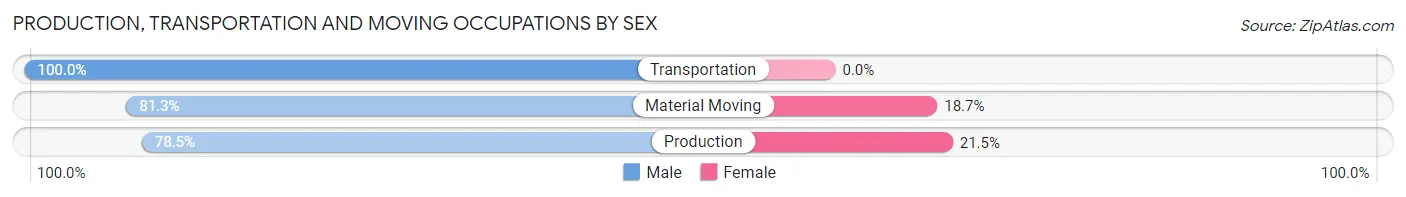
| Occupation | Male | Female |
| Production | 62 (78.5%) | 17 (21.5%) |
| Transportation | 21 (100.0%) | 0 (0.0%) |
| Material Moving | 61 (81.3%) | 14 (18.7%) |
| Total (Category) | 144 (82.3%) | 31 (17.7%) |
| Total (Overall) | 466 (55.0%) | 381 (45.0%) |
Employment Industries by Sex in Slocomb
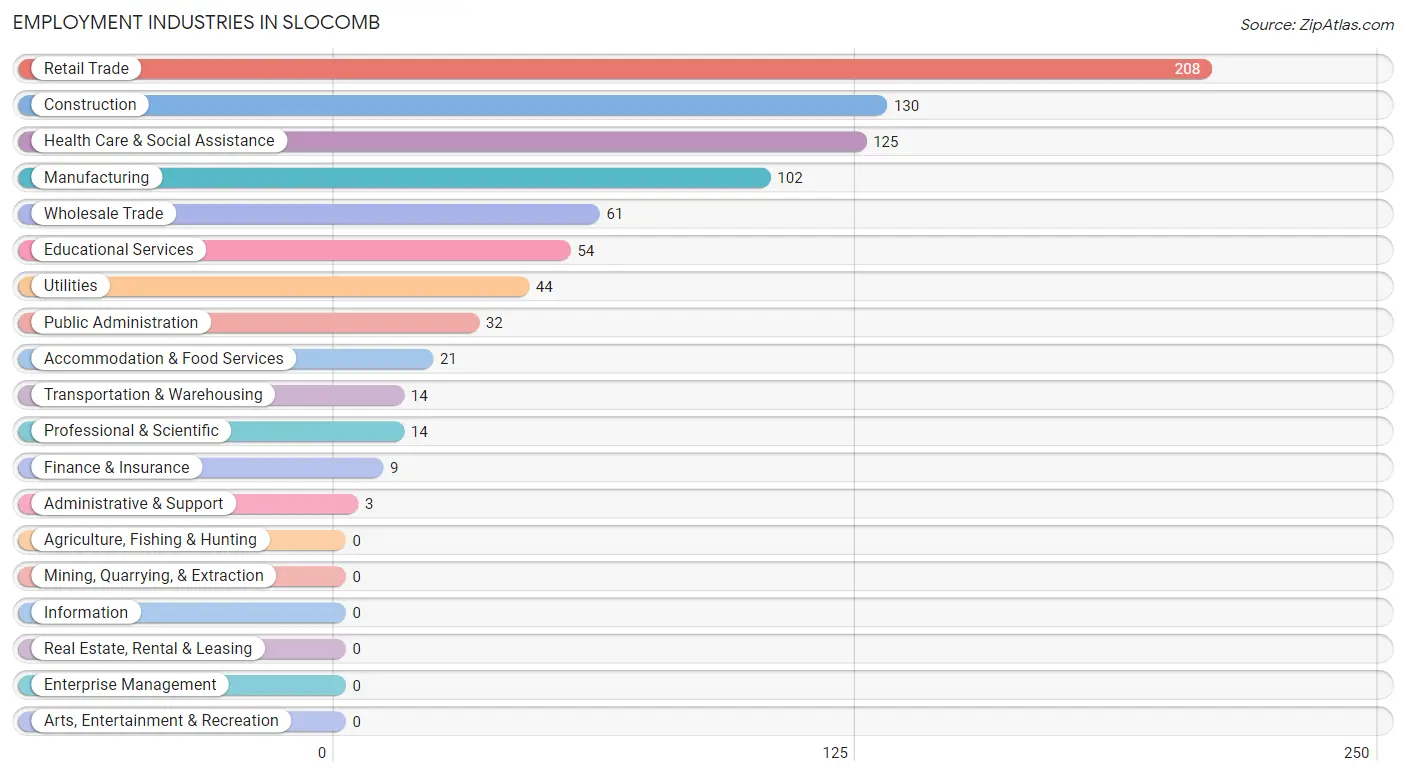
Employment Industries in Slocomb
The major employment industries in Slocomb include Retail Trade (208 | 24.6%), Construction (130 | 15.3%), Health Care & Social Assistance (125 | 14.8%), Manufacturing (102 | 12.0%), and Wholesale Trade (61 | 7.2%).
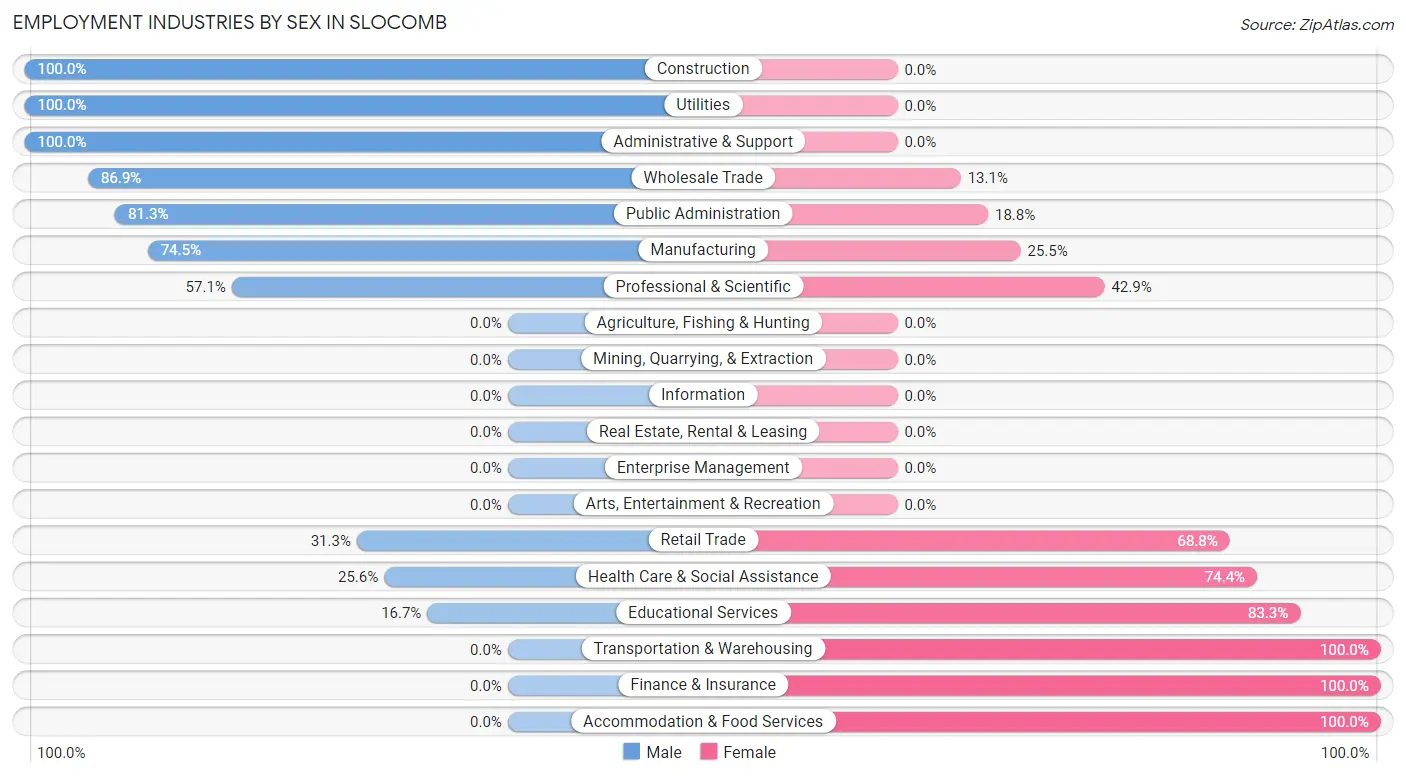
Employment Industries by Sex in Slocomb
The Slocomb industries that see more men than women are Construction (100.0%), Utilities (100.0%), and Administrative & Support (100.0%), whereas the industries that tend to have a higher number of women are Transportation & Warehousing (100.0%), Finance & Insurance (100.0%), and Accommodation & Food Services (100.0%).
| Industry | Male | Female |
| Agriculture, Fishing & Hunting | 0 (0.0%) | 0 (0.0%) |
| Mining, Quarrying, & Extraction | 0 (0.0%) | 0 (0.0%) |
| Construction | 130 (100.0%) | 0 (0.0%) |
| Manufacturing | 76 (74.5%) | 26 (25.5%) |
| Wholesale Trade | 53 (86.9%) | 8 (13.1%) |
| Retail Trade | 65 (31.2%) | 143 (68.8%) |
| Transportation & Warehousing | 0 (0.0%) | 14 (100.0%) |
| Utilities | 44 (100.0%) | 0 (0.0%) |
| Information | 0 (0.0%) | 0 (0.0%) |
| Finance & Insurance | 0 (0.0%) | 9 (100.0%) |
| Real Estate, Rental & Leasing | 0 (0.0%) | 0 (0.0%) |
| Professional & Scientific | 8 (57.1%) | 6 (42.9%) |
| Enterprise Management | 0 (0.0%) | 0 (0.0%) |
| Administrative & Support | 3 (100.0%) | 0 (0.0%) |
| Educational Services | 9 (16.7%) | 45 (83.3%) |
| Health Care & Social Assistance | 32 (25.6%) | 93 (74.4%) |
| Arts, Entertainment & Recreation | 0 (0.0%) | 0 (0.0%) |
| Accommodation & Food Services | 0 (0.0%) | 21 (100.0%) |
| Public Administration | 26 (81.2%) | 6 (18.8%) |
| Total | 466 (55.0%) | 381 (45.0%) |
Education in Slocomb
School Enrollment in Slocomb
The most common levels of schooling among the 314 students in Slocomb are elementary school (69 | 22.0%), middle school (67 | 21.3%), and high school (62 | 19.8%).
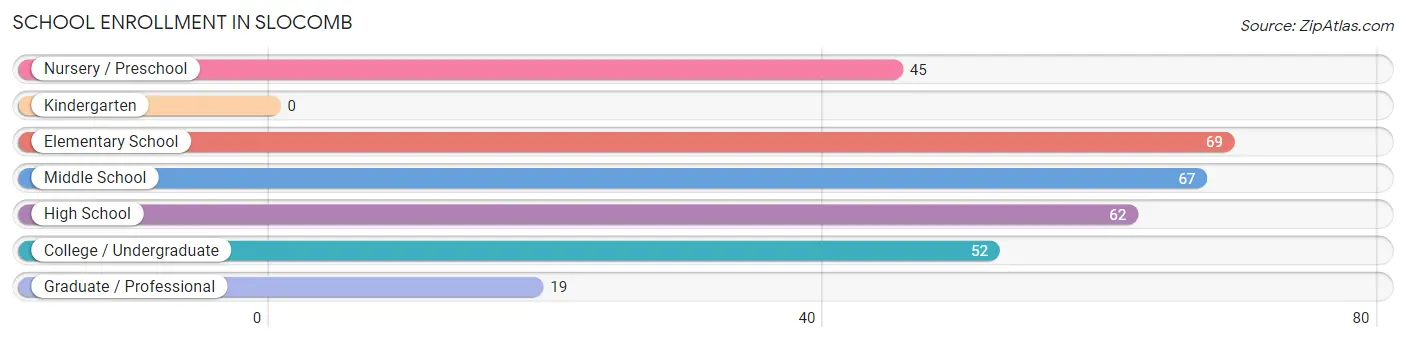
| School Level | # Students | % Students |
| Nursery / Preschool | 45 | 14.3% |
| Kindergarten | 0 | 0.0% |
| Elementary School | 69 | 22.0% |
| Middle School | 67 | 21.3% |
| High School | 62 | 19.8% |
| College / Undergraduate | 52 | 16.6% |
| Graduate / Professional | 19 | 6.0% |
| Total | 314 | 100.0% |
School Enrollment by Age by Funding Source in Slocomb
Out of a total of 314 students who are enrolled in schools in Slocomb, 73 (23.2%) attend a private institution, while the remaining 241 (76.8%) are enrolled in public schools. The age group of 3 to 4 year olds has the highest likelihood of being enrolled in private schools, with 45 (100.0% in the age bracket) enrolled. Conversely, the age group of 5 to 9 year old has the lowest likelihood of being enrolled in a private school, with 55 (100.0% in the age bracket) attending a public institution.
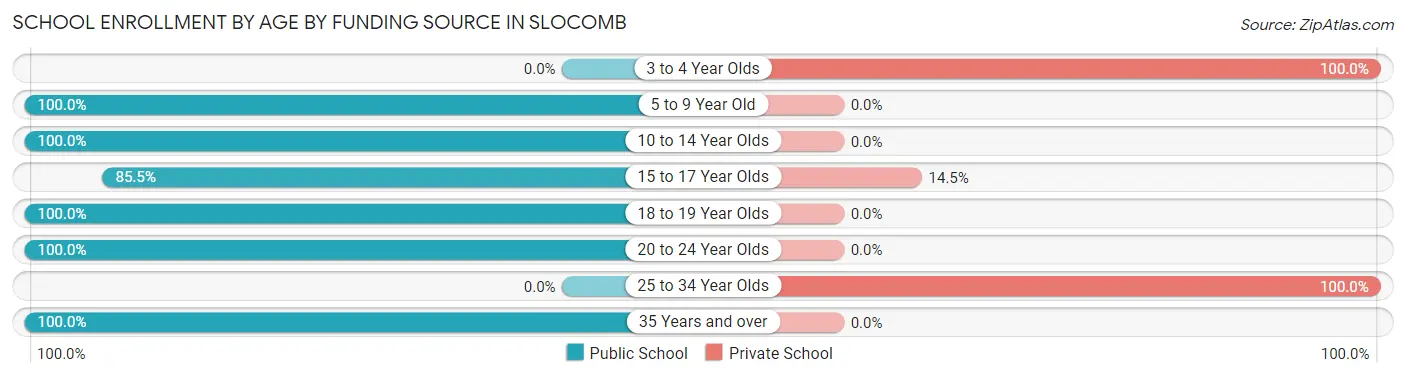
| Age Bracket | Public School | Private School |
| 3 to 4 Year Olds | 0 (0.0%) | 45 (100.0%) |
| 5 to 9 Year Old | 55 (100.0%) | 0 (0.0%) |
| 10 to 14 Year Olds | 81 (100.0%) | 0 (0.0%) |
| 15 to 17 Year Olds | 53 (85.5%) | 9 (14.5%) |
| 18 to 19 Year Olds | 23 (100.0%) | 0 (0.0%) |
| 20 to 24 Year Olds | 24 (100.0%) | 0 (0.0%) |
| 25 to 34 Year Olds | 0 (0.0%) | 19 (100.0%) |
| 35 Years and over | 5 (100.0%) | 0 (0.0%) |
| Total | 241 (76.8%) | 73 (23.2%) |
Educational Attainment by Field of Study in Slocomb
Arts & humanities (49 | 34.3%), science & technology (26 | 18.2%), business (25 | 17.5%), visual & performing arts (19 | 13.3%), and engineering (11 | 7.7%) are the most common fields of study among 143 individuals in Slocomb who have obtained a bachelor's degree or higher.
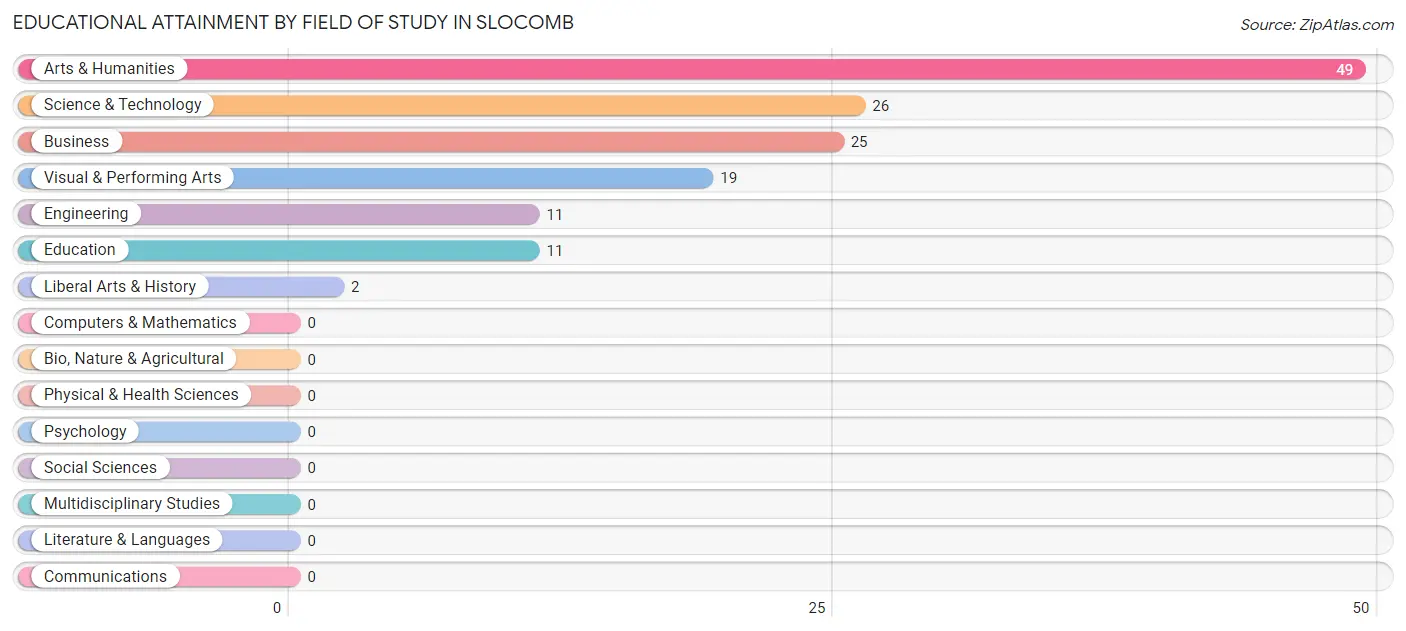
| Field of Study | # Graduates | % Graduates |
| Computers & Mathematics | 0 | 0.0% |
| Bio, Nature & Agricultural | 0 | 0.0% |
| Physical & Health Sciences | 0 | 0.0% |
| Psychology | 0 | 0.0% |
| Social Sciences | 0 | 0.0% |
| Engineering | 11 | 7.7% |
| Multidisciplinary Studies | 0 | 0.0% |
| Science & Technology | 26 | 18.2% |
| Business | 25 | 17.5% |
| Education | 11 | 7.7% |
| Literature & Languages | 0 | 0.0% |
| Liberal Arts & History | 2 | 1.4% |
| Visual & Performing Arts | 19 | 13.3% |
| Communications | 0 | 0.0% |
| Arts & Humanities | 49 | 34.3% |
| Total | 143 | 100.0% |
Transportation & Commute in Slocomb
Vehicle Availability by Sex in Slocomb
The most prevalent vehicle ownership categories in Slocomb are males with 3 vehicles (209, accounting for 46.7%) and females with 3 vehicles (135, making up 55.3%).
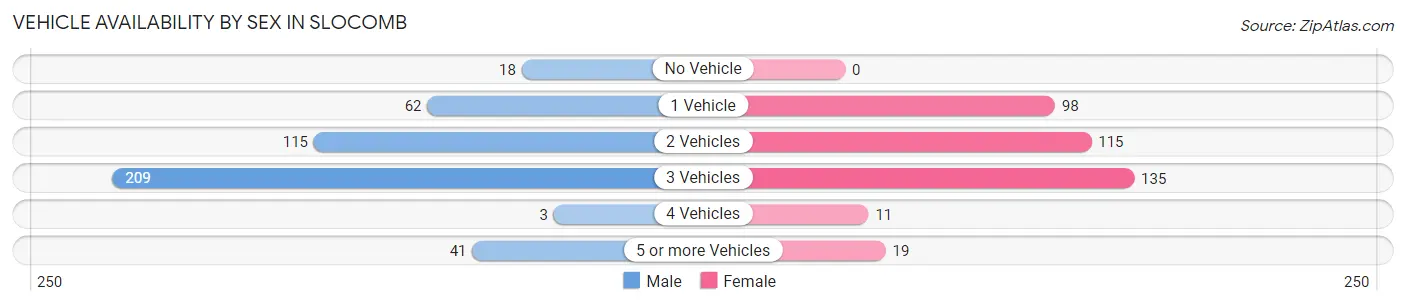
| Vehicles Available | Male | Female |
| No Vehicle | 18 (4.0%) | 0 (0.0%) |
| 1 Vehicle | 62 (13.8%) | 98 (25.9%) |
| 2 Vehicles | 115 (25.7%) | 115 (30.4%) |
| 3 Vehicles | 209 (46.7%) | 135 (35.7%) |
| 4 Vehicles | 3 (0.7%) | 11 (2.9%) |
| 5 or more Vehicles | 41 (9.1%) | 19 (5.0%) |
| Total | 448 (100.0%) | 378 (100.0%) |
Commute Time in Slocomb
The most frequently occuring commute durations in Slocomb are 20 to 24 minutes (221 commuters, 27.5%), 25 to 29 minutes (173 commuters, 21.5%), and 30 to 34 minutes (146 commuters, 18.2%).
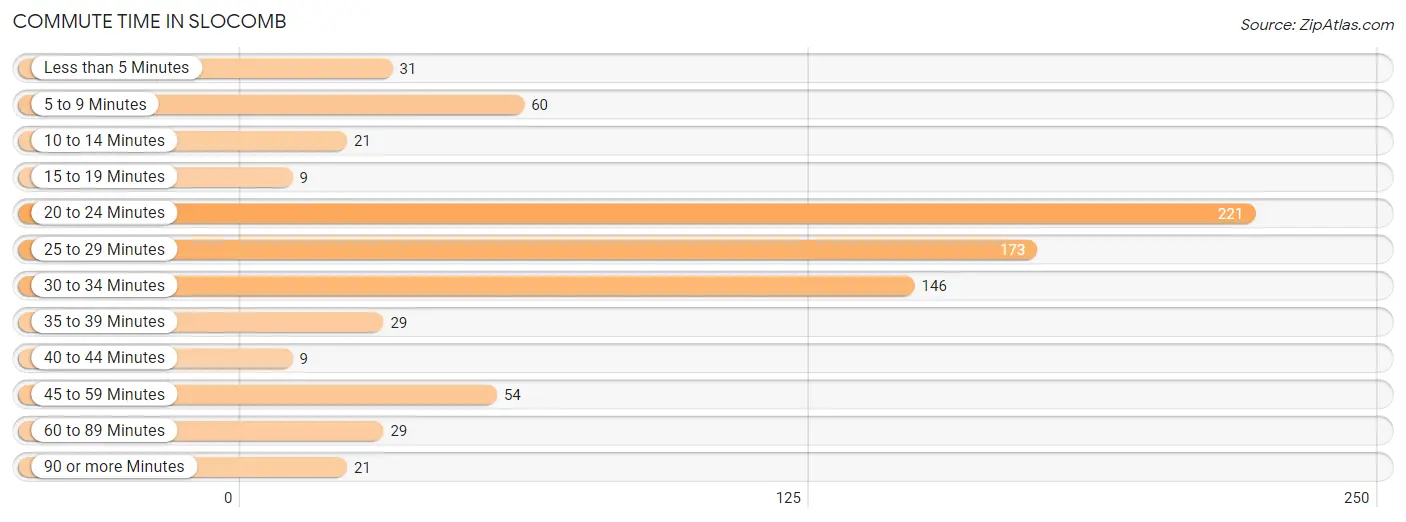
| Commute Time | # Commuters | % Commuters |
| Less than 5 Minutes | 31 | 3.9% |
| 5 to 9 Minutes | 60 | 7.5% |
| 10 to 14 Minutes | 21 | 2.6% |
| 15 to 19 Minutes | 9 | 1.1% |
| 20 to 24 Minutes | 221 | 27.5% |
| 25 to 29 Minutes | 173 | 21.5% |
| 30 to 34 Minutes | 146 | 18.2% |
| 35 to 39 Minutes | 29 | 3.6% |
| 40 to 44 Minutes | 9 | 1.1% |
| 45 to 59 Minutes | 54 | 6.7% |
| 60 to 89 Minutes | 29 | 3.6% |
| 90 or more Minutes | 21 | 2.6% |
Commute Time by Sex in Slocomb
The most common commute times in Slocomb are 20 to 24 minutes (182 commuters, 42.0%) for males and 30 to 34 minutes (114 commuters, 30.8%) for females.
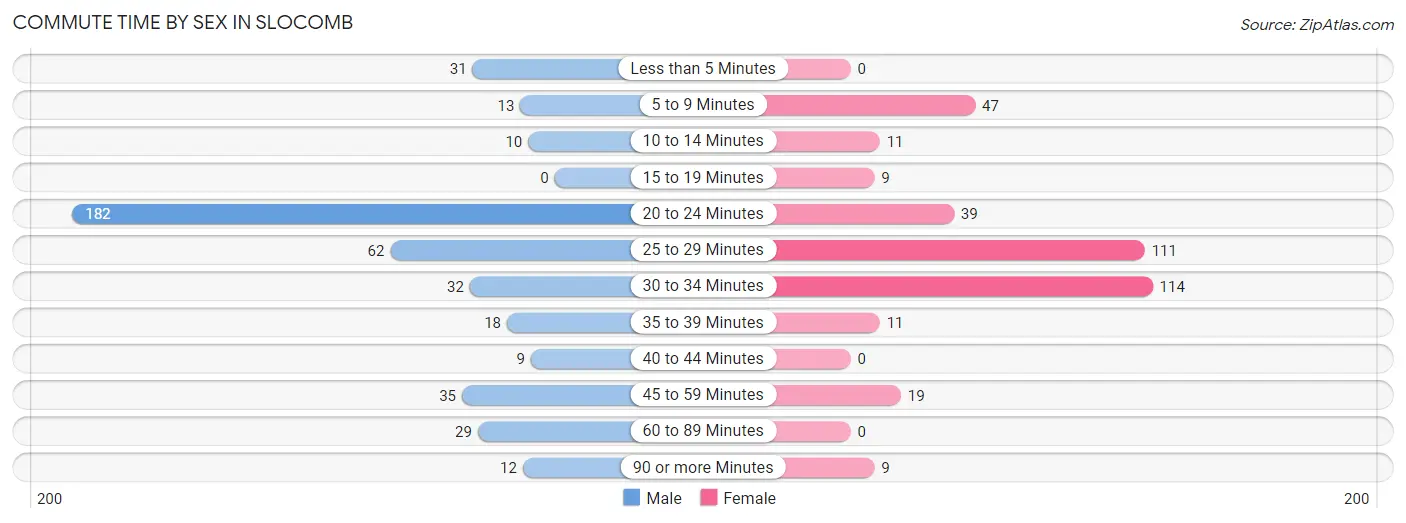
| Commute Time | Male | Female |
| Less than 5 Minutes | 31 (7.2%) | 0 (0.0%) |
| 5 to 9 Minutes | 13 (3.0%) | 47 (12.7%) |
| 10 to 14 Minutes | 10 (2.3%) | 11 (3.0%) |
| 15 to 19 Minutes | 0 (0.0%) | 9 (2.4%) |
| 20 to 24 Minutes | 182 (42.0%) | 39 (10.5%) |
| 25 to 29 Minutes | 62 (14.3%) | 111 (30.0%) |
| 30 to 34 Minutes | 32 (7.4%) | 114 (30.8%) |
| 35 to 39 Minutes | 18 (4.2%) | 11 (3.0%) |
| 40 to 44 Minutes | 9 (2.1%) | 0 (0.0%) |
| 45 to 59 Minutes | 35 (8.1%) | 19 (5.1%) |
| 60 to 89 Minutes | 29 (6.7%) | 0 (0.0%) |
| 90 or more Minutes | 12 (2.8%) | 9 (2.4%) |
Time of Departure to Work by Sex in Slocomb
The most frequent times of departure to work in Slocomb are 6:00 AM to 6:29 AM (91, 21.0%) for males and 12:00 PM to 3:59 PM (100, 27.0%) for females.
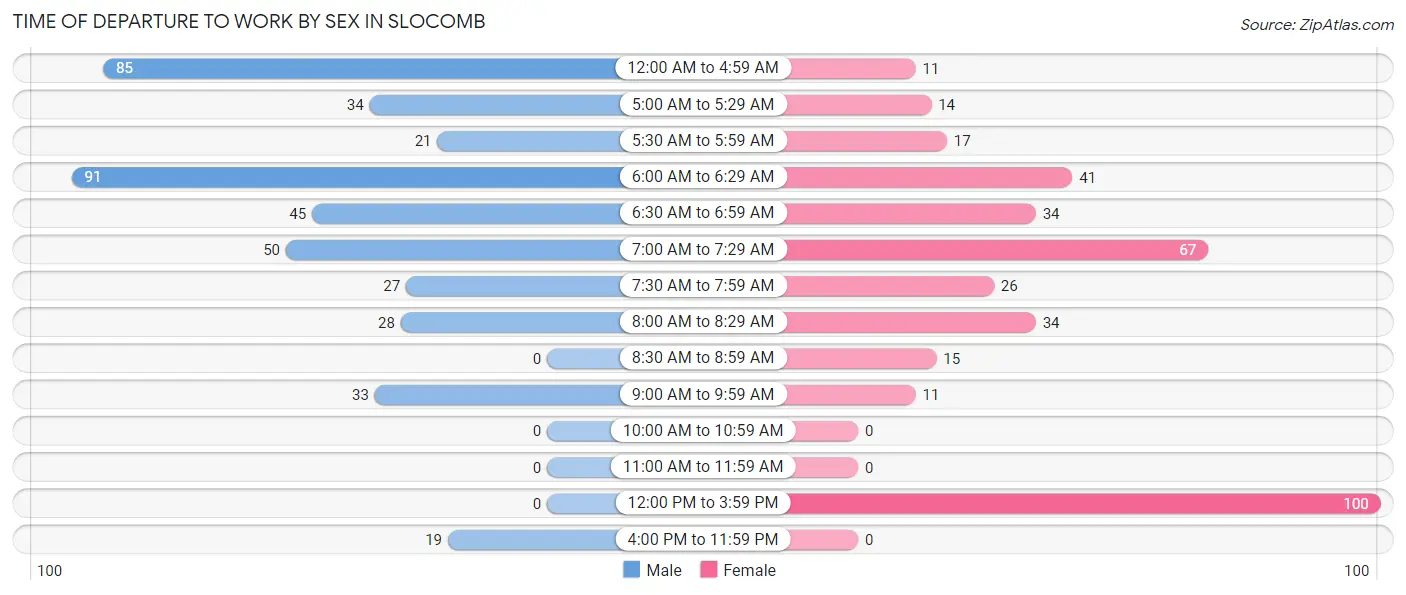
| Time of Departure | Male | Female |
| 12:00 AM to 4:59 AM | 85 (19.6%) | 11 (3.0%) |
| 5:00 AM to 5:29 AM | 34 (7.9%) | 14 (3.8%) |
| 5:30 AM to 5:59 AM | 21 (4.9%) | 17 (4.6%) |
| 6:00 AM to 6:29 AM | 91 (21.0%) | 41 (11.1%) |
| 6:30 AM to 6:59 AM | 45 (10.4%) | 34 (9.2%) |
| 7:00 AM to 7:29 AM | 50 (11.6%) | 67 (18.1%) |
| 7:30 AM to 7:59 AM | 27 (6.2%) | 26 (7.0%) |
| 8:00 AM to 8:29 AM | 28 (6.5%) | 34 (9.2%) |
| 8:30 AM to 8:59 AM | 0 (0.0%) | 15 (4.1%) |
| 9:00 AM to 9:59 AM | 33 (7.6%) | 11 (3.0%) |
| 10:00 AM to 10:59 AM | 0 (0.0%) | 0 (0.0%) |
| 11:00 AM to 11:59 AM | 0 (0.0%) | 0 (0.0%) |
| 12:00 PM to 3:59 PM | 0 (0.0%) | 100 (27.0%) |
| 4:00 PM to 11:59 PM | 19 (4.4%) | 0 (0.0%) |
| Total | 433 (100.0%) | 370 (100.0%) |
Housing Occupancy in Slocomb
Occupancy by Ownership in Slocomb
Of the total 747 dwellings in Slocomb, owner-occupied units account for 465 (62.3%), while renter-occupied units make up 282 (37.8%).
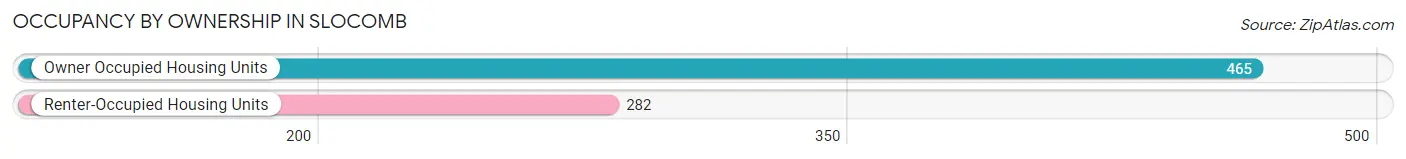
| Occupancy | # Housing Units | % Housing Units |
| Owner Occupied Housing Units | 465 | 62.3% |
| Renter-Occupied Housing Units | 282 | 37.8% |
| Total Occupied Housing Units | 747 | 100.0% |
Occupancy by Household Size in Slocomb
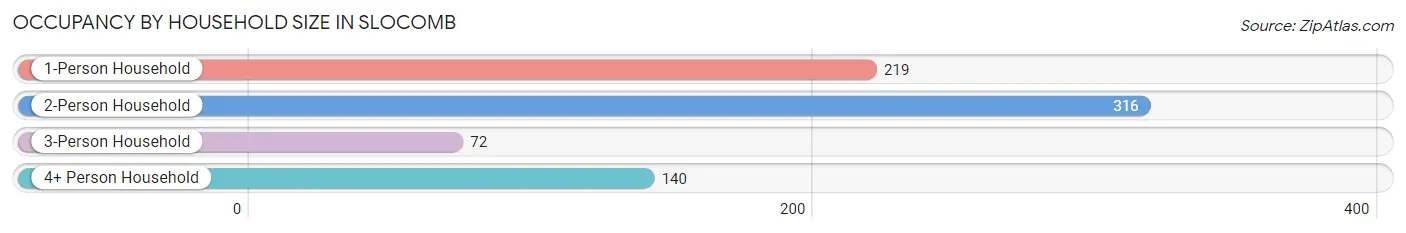
| Household Size | # Housing Units | % Housing Units |
| 1-Person Household | 219 | 29.3% |
| 2-Person Household | 316 | 42.3% |
| 3-Person Household | 72 | 9.6% |
| 4+ Person Household | 140 | 18.7% |
| Total Housing Units | 747 | 100.0% |
Occupancy by Ownership by Household Size in Slocomb
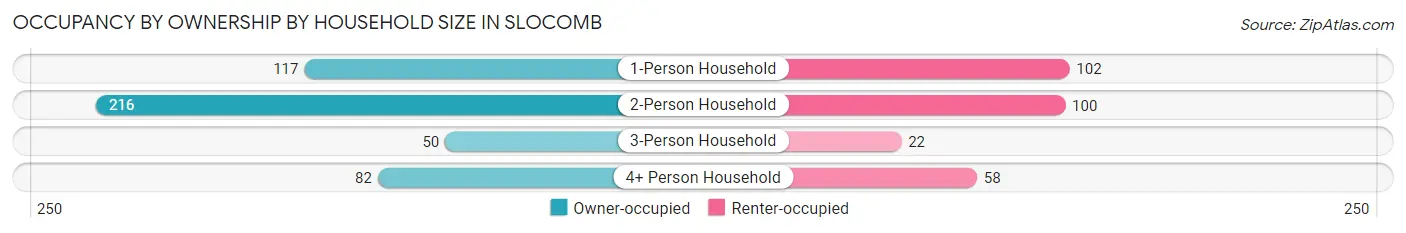
| Household Size | Owner-occupied | Renter-occupied |
| 1-Person Household | 117 (53.4%) | 102 (46.6%) |
| 2-Person Household | 216 (68.3%) | 100 (31.7%) |
| 3-Person Household | 50 (69.4%) | 22 (30.6%) |
| 4+ Person Household | 82 (58.6%) | 58 (41.4%) |
| Total Housing Units | 465 (62.3%) | 282 (37.8%) |
Occupancy by Educational Attainment in Slocomb
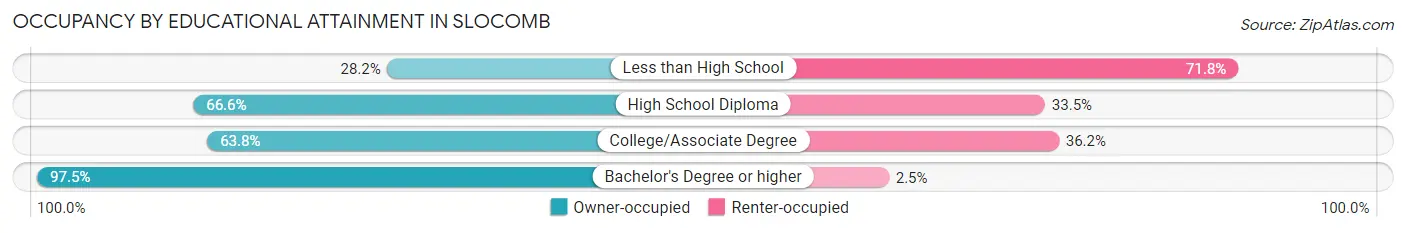
| Household Size | Owner-occupied | Renter-occupied |
| Less than High School | 37 (28.2%) | 94 (71.8%) |
| High School Diploma | 195 (66.5%) | 98 (33.5%) |
| College/Associate Degree | 155 (63.8%) | 88 (36.2%) |
| Bachelor's Degree or higher | 78 (97.5%) | 2 (2.5%) |
Occupancy by Age of Householder in Slocomb
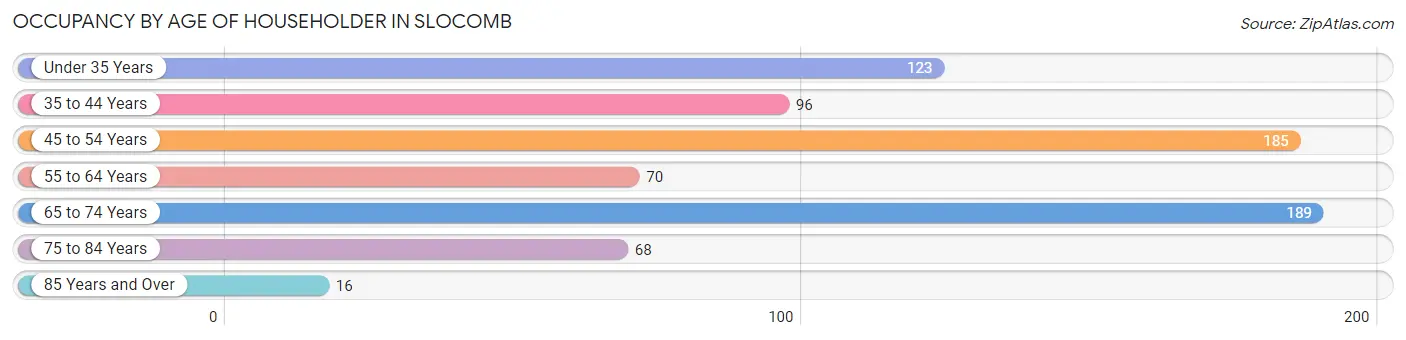
| Age Bracket | # Households | % Households |
| Under 35 Years | 123 | 16.5% |
| 35 to 44 Years | 96 | 12.9% |
| 45 to 54 Years | 185 | 24.8% |
| 55 to 64 Years | 70 | 9.4% |
| 65 to 74 Years | 189 | 25.3% |
| 75 to 84 Years | 68 | 9.1% |
| 85 Years and Over | 16 | 2.1% |
| Total | 747 | 100.0% |
Housing Finances in Slocomb
Median Income by Occupancy in Slocomb
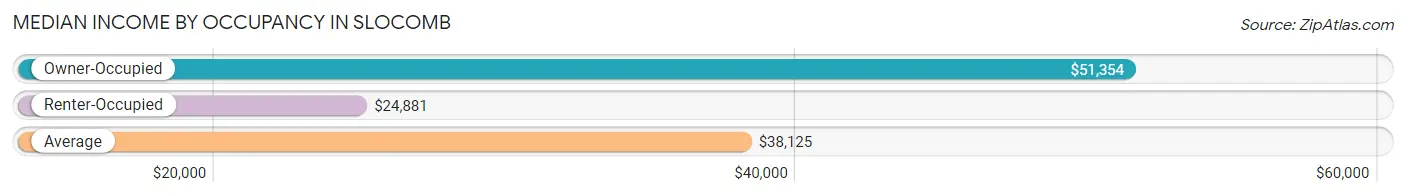
| Occupancy Type | # Households | Median Income |
| Owner-Occupied | 465 (62.3%) | $51,354 |
| Renter-Occupied | 282 (37.8%) | $24,881 |
| Average | 747 (100.0%) | $38,125 |
Occupancy by Householder Income Bracket in Slocomb
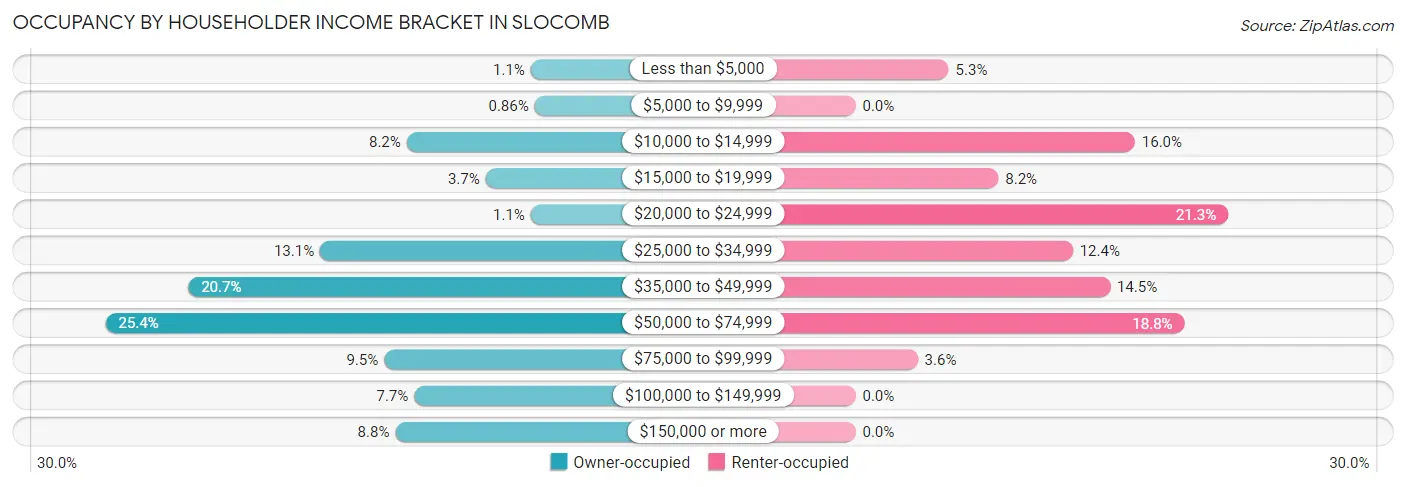
| Income Bracket | Owner-occupied | Renter-occupied |
| Less than $5,000 | 5 (1.1%) | 15 (5.3%) |
| $5,000 to $9,999 | 4 (0.9%) | 0 (0.0%) |
| $10,000 to $14,999 | 38 (8.2%) | 45 (16.0%) |
| $15,000 to $19,999 | 17 (3.7%) | 23 (8.2%) |
| $20,000 to $24,999 | 5 (1.1%) | 60 (21.3%) |
| $25,000 to $34,999 | 61 (13.1%) | 35 (12.4%) |
| $35,000 to $49,999 | 96 (20.6%) | 41 (14.5%) |
| $50,000 to $74,999 | 118 (25.4%) | 53 (18.8%) |
| $75,000 to $99,999 | 44 (9.5%) | 10 (3.5%) |
| $100,000 to $149,999 | 36 (7.7%) | 0 (0.0%) |
| $150,000 or more | 41 (8.8%) | 0 (0.0%) |
| Total | 465 (100.0%) | 282 (100.0%) |
Monthly Housing Cost Tiers in Slocomb
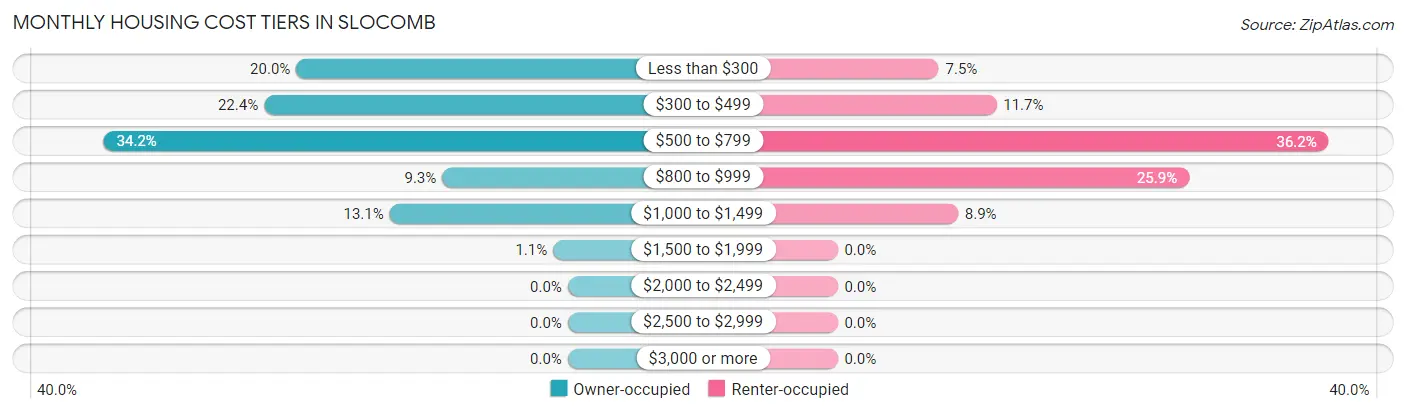
| Monthly Cost | Owner-occupied | Renter-occupied |
| Less than $300 | 93 (20.0%) | 21 (7.4%) |
| $300 to $499 | 104 (22.4%) | 33 (11.7%) |
| $500 to $799 | 159 (34.2%) | 102 (36.2%) |
| $800 to $999 | 43 (9.2%) | 73 (25.9%) |
| $1,000 to $1,499 | 61 (13.1%) | 25 (8.9%) |
| $1,500 to $1,999 | 5 (1.1%) | 0 (0.0%) |
| $2,000 to $2,499 | 0 (0.0%) | 0 (0.0%) |
| $2,500 to $2,999 | 0 (0.0%) | 0 (0.0%) |
| $3,000 or more | 0 (0.0%) | 0 (0.0%) |
| Total | 465 (100.0%) | 282 (100.0%) |
Physical Housing Characteristics in Slocomb
Housing Structures in Slocomb
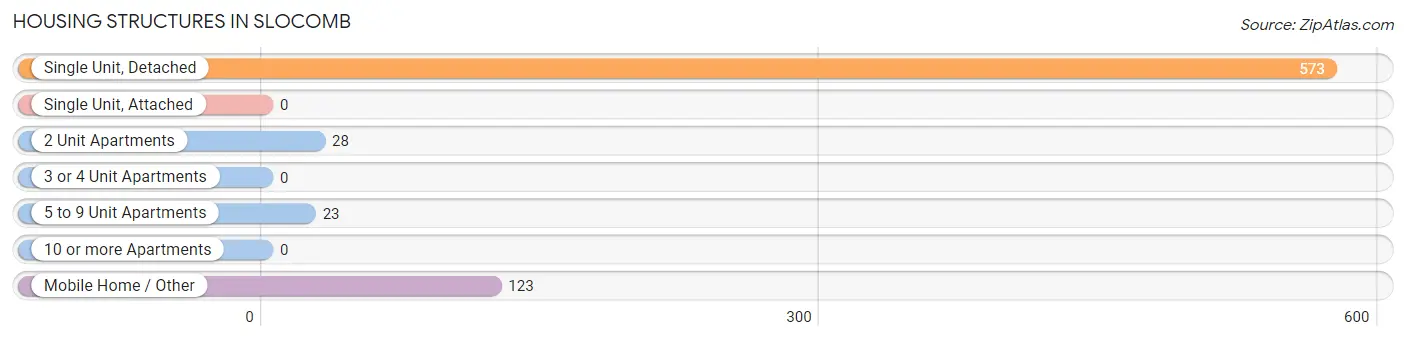
| Structure Type | # Housing Units | % Housing Units |
| Single Unit, Detached | 573 | 76.7% |
| Single Unit, Attached | 0 | 0.0% |
| 2 Unit Apartments | 28 | 3.7% |
| 3 or 4 Unit Apartments | 0 | 0.0% |
| 5 to 9 Unit Apartments | 23 | 3.1% |
| 10 or more Apartments | 0 | 0.0% |
| Mobile Home / Other | 123 | 16.5% |
| Total | 747 | 100.0% |
Housing Structures by Occupancy in Slocomb
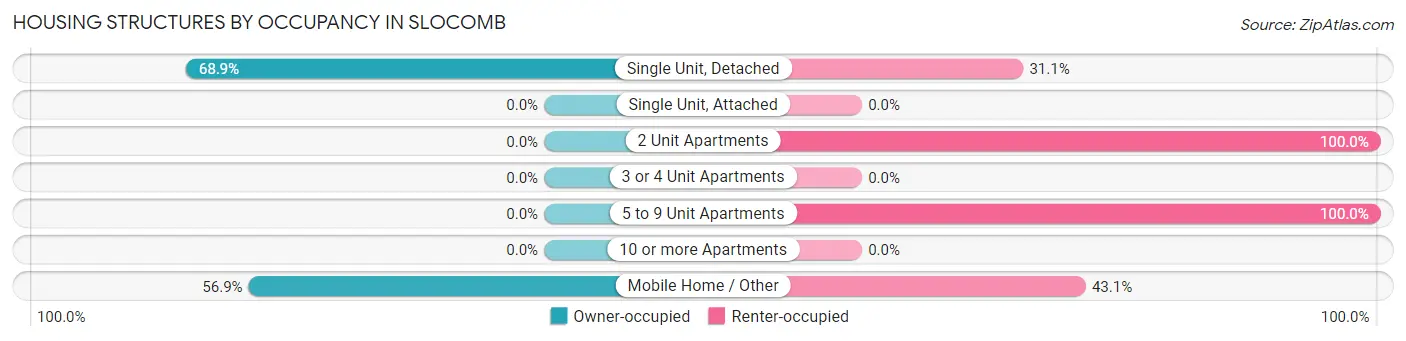
| Structure Type | Owner-occupied | Renter-occupied |
| Single Unit, Detached | 395 (68.9%) | 178 (31.1%) |
| Single Unit, Attached | 0 (0.0%) | 0 (0.0%) |
| 2 Unit Apartments | 0 (0.0%) | 28 (100.0%) |
| 3 or 4 Unit Apartments | 0 (0.0%) | 0 (0.0%) |
| 5 to 9 Unit Apartments | 0 (0.0%) | 23 (100.0%) |
| 10 or more Apartments | 0 (0.0%) | 0 (0.0%) |
| Mobile Home / Other | 70 (56.9%) | 53 (43.1%) |
| Total | 465 (62.3%) | 282 (37.8%) |
Housing Structures by Number of Rooms in Slocomb
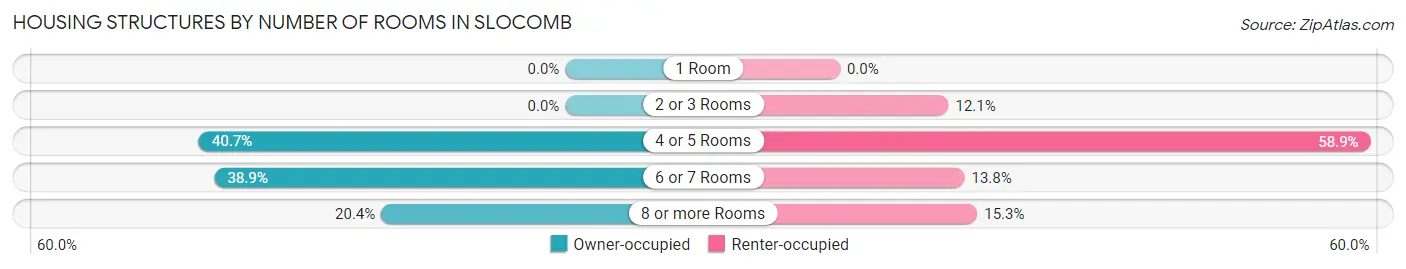
| Number of Rooms | Owner-occupied | Renter-occupied |
| 1 Room | 0 (0.0%) | 0 (0.0%) |
| 2 or 3 Rooms | 0 (0.0%) | 34 (12.1%) |
| 4 or 5 Rooms | 189 (40.6%) | 166 (58.9%) |
| 6 or 7 Rooms | 181 (38.9%) | 39 (13.8%) |
| 8 or more Rooms | 95 (20.4%) | 43 (15.2%) |
| Total | 465 (100.0%) | 282 (100.0%) |
Housing Structure by Heating Type in Slocomb
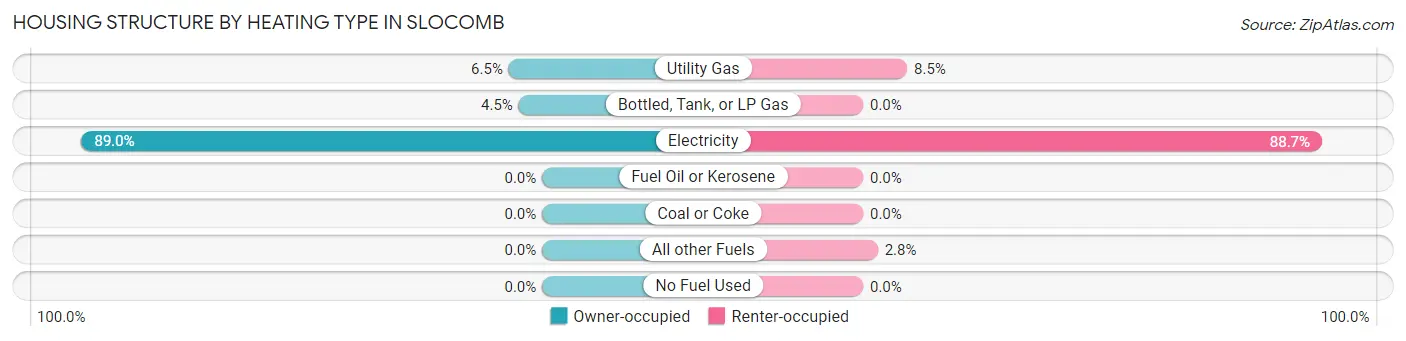
| Heating Type | Owner-occupied | Renter-occupied |
| Utility Gas | 30 (6.5%) | 24 (8.5%) |
| Bottled, Tank, or LP Gas | 21 (4.5%) | 0 (0.0%) |
| Electricity | 414 (89.0%) | 250 (88.6%) |
| Fuel Oil or Kerosene | 0 (0.0%) | 0 (0.0%) |
| Coal or Coke | 0 (0.0%) | 0 (0.0%) |
| All other Fuels | 0 (0.0%) | 8 (2.8%) |
| No Fuel Used | 0 (0.0%) | 0 (0.0%) |
| Total | 465 (100.0%) | 282 (100.0%) |
Household Vehicle Usage in Slocomb
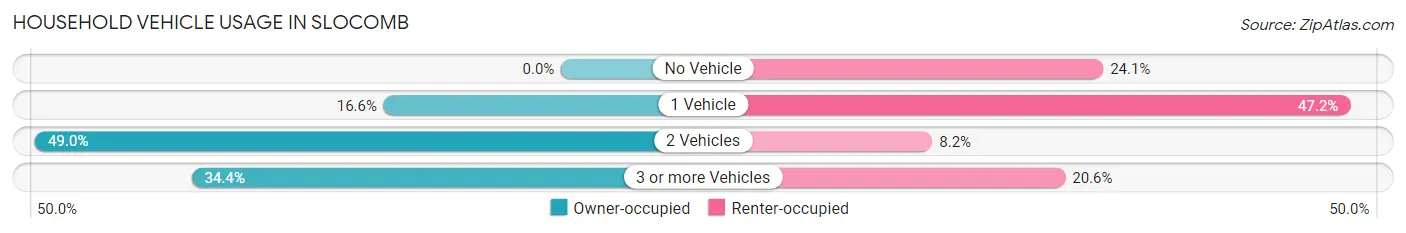
| Vehicles per Household | Owner-occupied | Renter-occupied |
| No Vehicle | 0 (0.0%) | 68 (24.1%) |
| 1 Vehicle | 77 (16.6%) | 133 (47.2%) |
| 2 Vehicles | 228 (49.0%) | 23 (8.2%) |
| 3 or more Vehicles | 160 (34.4%) | 58 (20.6%) |
| Total | 465 (100.0%) | 282 (100.0%) |
Real Estate & Mortgages in Slocomb
Real Estate and Mortgage Overview in Slocomb
| Characteristic | Without Mortgage | With Mortgage |
| Housing Units | 274 | 191 |
| Median Property Value | $88,100 | $96,000 |
| Median Household Income | $57,500 | $10 |
| Monthly Housing Costs | $344 | $0 |
| Real Estate Taxes | $258 | $63 |
Property Value by Mortgage Status in Slocomb
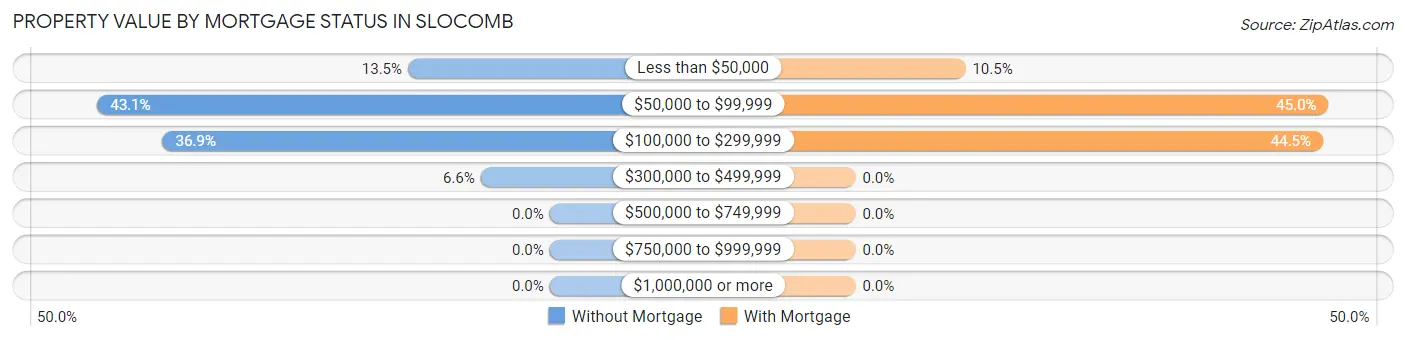
| Property Value | Without Mortgage | With Mortgage |
| Less than $50,000 | 37 (13.5%) | 20 (10.5%) |
| $50,000 to $99,999 | 118 (43.1%) | 86 (45.0%) |
| $100,000 to $299,999 | 101 (36.9%) | 85 (44.5%) |
| $300,000 to $499,999 | 18 (6.6%) | 0 (0.0%) |
| $500,000 to $749,999 | 0 (0.0%) | 0 (0.0%) |
| $750,000 to $999,999 | 0 (0.0%) | 0 (0.0%) |
| $1,000,000 or more | 0 (0.0%) | 0 (0.0%) |
| Total | 274 (100.0%) | 191 (100.0%) |
Household Income by Mortgage Status in Slocomb
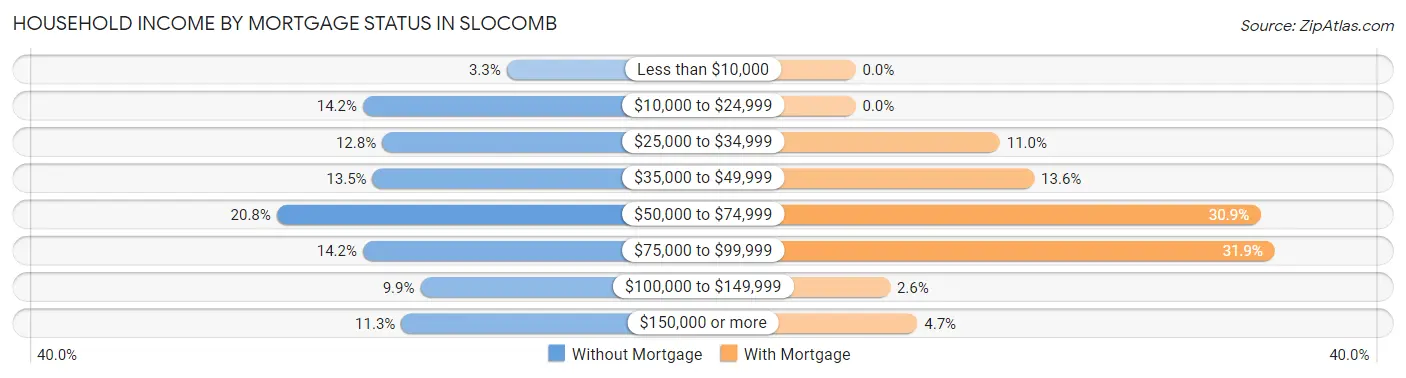
| Household Income | Without Mortgage | With Mortgage |
| Less than $10,000 | 9 (3.3%) | 0 (0.0%) |
| $10,000 to $24,999 | 39 (14.2%) | 0 (0.0%) |
| $25,000 to $34,999 | 35 (12.8%) | 21 (11.0%) |
| $35,000 to $49,999 | 37 (13.5%) | 26 (13.6%) |
| $50,000 to $74,999 | 57 (20.8%) | 59 (30.9%) |
| $75,000 to $99,999 | 39 (14.2%) | 61 (31.9%) |
| $100,000 to $149,999 | 27 (9.9%) | 5 (2.6%) |
| $150,000 or more | 31 (11.3%) | 9 (4.7%) |
| Total | 274 (100.0%) | 191 (100.0%) |
Property Value to Household Income Ratio in Slocomb
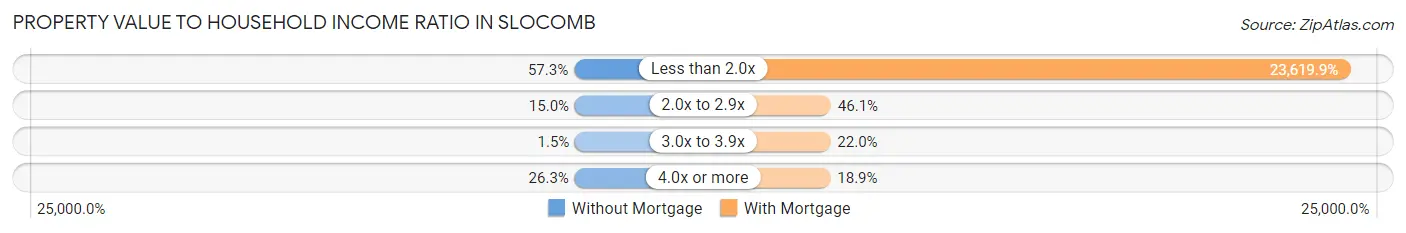
| Value-to-Income Ratio | Without Mortgage | With Mortgage |
| Less than 2.0x | 157 (57.3%) | 45,114 (23,619.9%) |
| 2.0x to 2.9x | 41 (15.0%) | 88 (46.1%) |
| 3.0x to 3.9x | 4 (1.5%) | 42 (22.0%) |
| 4.0x or more | 72 (26.3%) | 36 (18.9%) |
| Total | 274 (100.0%) | 191 (100.0%) |
Real Estate Taxes by Mortgage Status in Slocomb
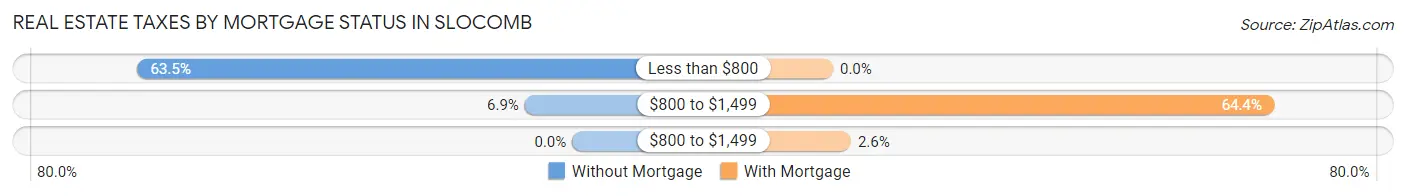
| Property Taxes | Without Mortgage | With Mortgage |
| Less than $800 | 174 (63.5%) | 0 (0.0%) |
| $800 to $1,499 | 19 (6.9%) | 123 (64.4%) |
| $800 to $1,499 | 0 (0.0%) | 5 (2.6%) |
| Total | 274 (100.0%) | 191 (100.0%) |
Health & Disability in Slocomb
Health Insurance Coverage by Age in Slocomb
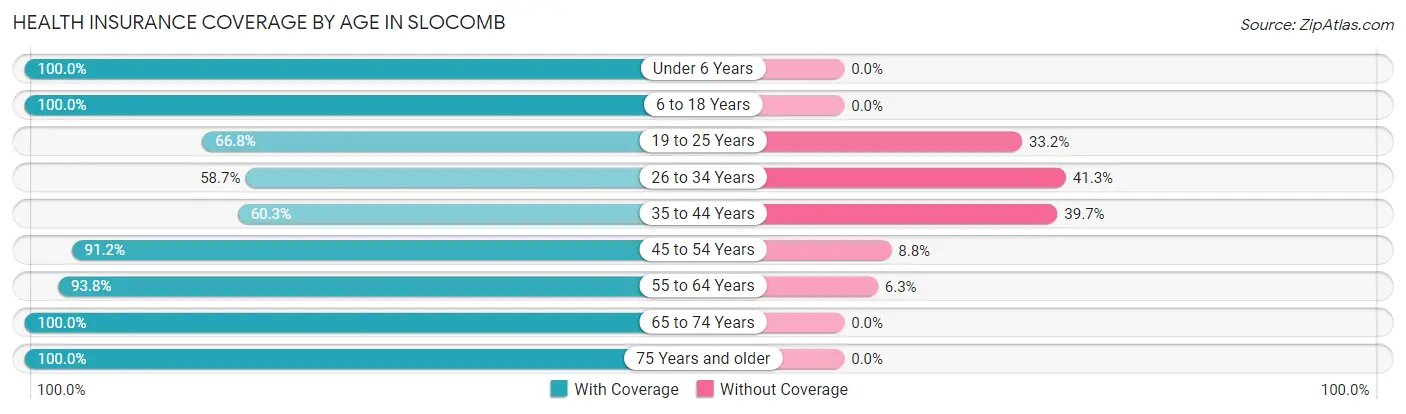
| Age Bracket | With Coverage | Without Coverage |
| Under 6 Years | 67 (100.0%) | 0 (0.0%) |
| 6 to 18 Years | 235 (100.0%) | 0 (0.0%) |
| 19 to 25 Years | 125 (66.8%) | 62 (33.2%) |
| 26 to 34 Years | 159 (58.7%) | 112 (41.3%) |
| 35 to 44 Years | 138 (60.3%) | 91 (39.7%) |
| 45 to 54 Years | 260 (91.2%) | 25 (8.8%) |
| 55 to 64 Years | 210 (93.8%) | 14 (6.2%) |
| 65 to 74 Years | 250 (100.0%) | 0 (0.0%) |
| 75 Years and older | 112 (100.0%) | 0 (0.0%) |
| Total | 1,556 (83.7%) | 304 (16.3%) |
Health Insurance Coverage by Citizenship Status in Slocomb
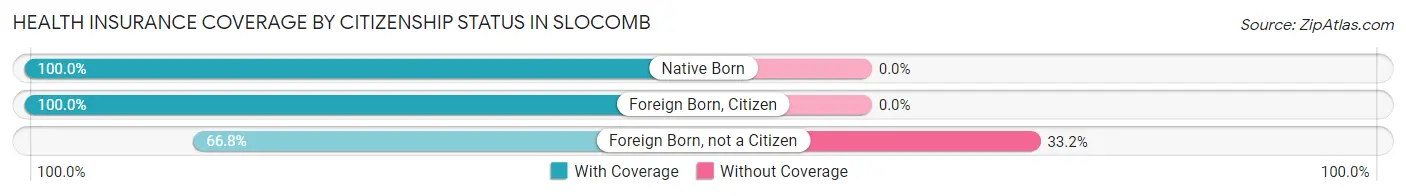
| Citizenship Status | With Coverage | Without Coverage |
| Native Born | 67 (100.0%) | 0 (0.0%) |
| Foreign Born, Citizen | 235 (100.0%) | 0 (0.0%) |
| Foreign Born, not a Citizen | 125 (66.8%) | 62 (33.2%) |
Health Insurance Coverage by Household Income in Slocomb
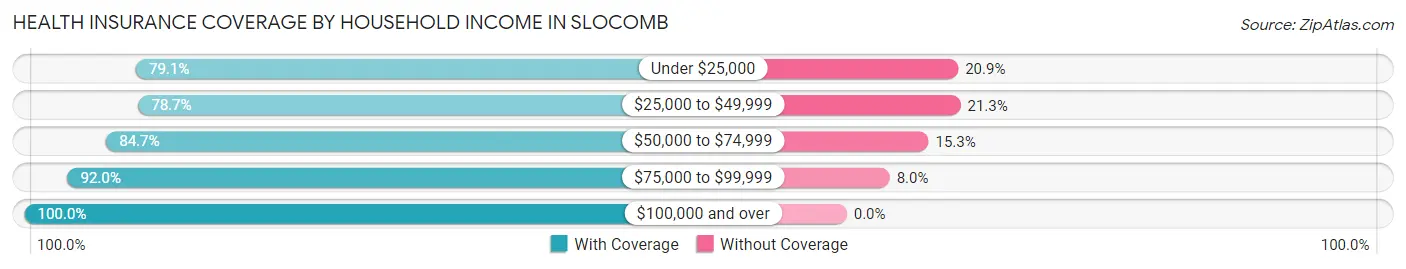
| Household Income | With Coverage | Without Coverage |
| Under $25,000 | 307 (79.1%) | 81 (20.9%) |
| $25,000 to $49,999 | 517 (78.7%) | 140 (21.3%) |
| $50,000 to $74,999 | 409 (84.7%) | 74 (15.3%) |
| $75,000 to $99,999 | 103 (92.0%) | 9 (8.0%) |
| $100,000 and over | 220 (100.0%) | 0 (0.0%) |
Public vs Private Health Insurance Coverage by Age in Slocomb
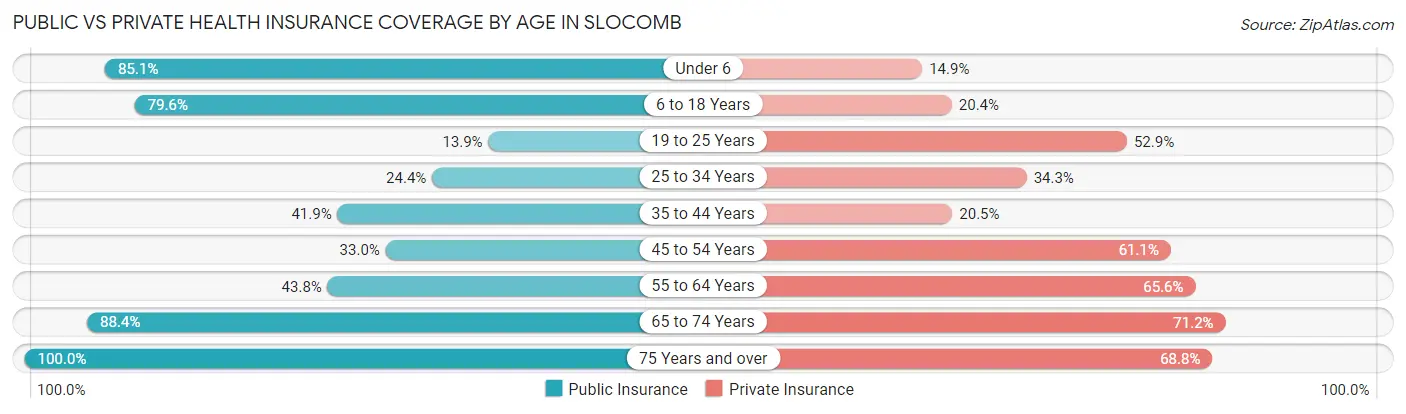
| Age Bracket | Public Insurance | Private Insurance |
| Under 6 | 57 (85.1%) | 10 (14.9%) |
| 6 to 18 Years | 187 (79.6%) | 48 (20.4%) |
| 19 to 25 Years | 26 (13.9%) | 99 (52.9%) |
| 25 to 34 Years | 66 (24.3%) | 93 (34.3%) |
| 35 to 44 Years | 96 (41.9%) | 47 (20.5%) |
| 45 to 54 Years | 94 (33.0%) | 174 (61.1%) |
| 55 to 64 Years | 98 (43.8%) | 147 (65.6%) |
| 65 to 74 Years | 221 (88.4%) | 178 (71.2%) |
| 75 Years and over | 112 (100.0%) | 77 (68.8%) |
| Total | 957 (51.4%) | 873 (46.9%) |
Disability Status by Sex by Age in Slocomb
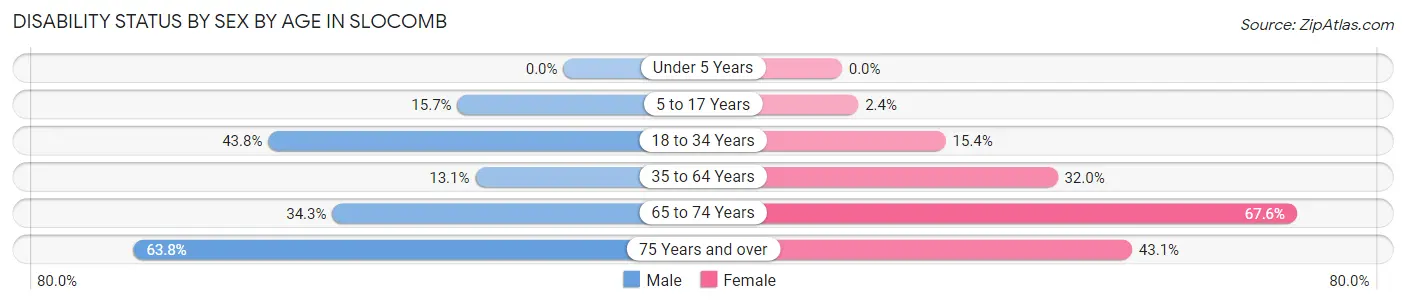
| Age Bracket | Male | Female |
| Under 5 Years | 0 (0.0%) | 0 (0.0%) |
| 5 to 17 Years | 14 (15.7%) | 3 (2.4%) |
| 18 to 34 Years | 117 (43.8%) | 33 (15.4%) |
| 35 to 64 Years | 43 (13.1%) | 131 (32.0%) |
| 65 to 74 Years | 35 (34.3%) | 100 (67.6%) |
| 75 Years and over | 30 (63.8%) | 28 (43.1%) |
Disability Class by Sex by Age in Slocomb
Disability Class: Hearing Difficulty
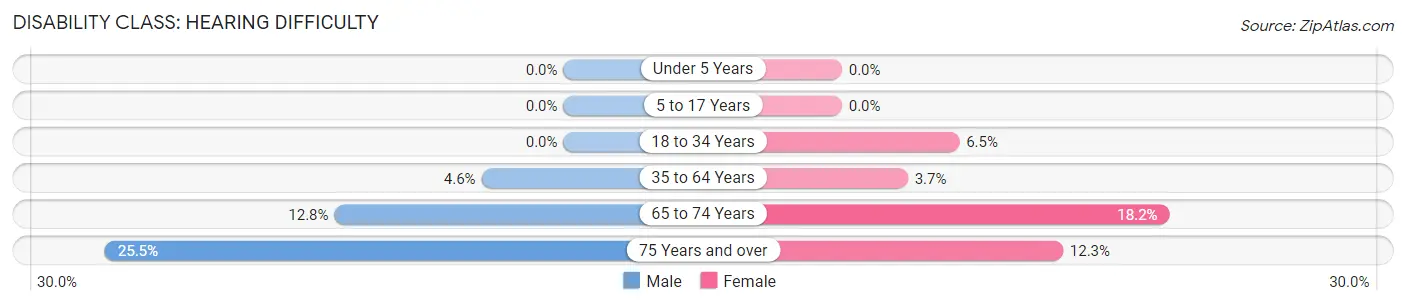
| Age Bracket | Male | Female |
| Under 5 Years | 0 (0.0%) | 0 (0.0%) |
| 5 to 17 Years | 0 (0.0%) | 0 (0.0%) |
| 18 to 34 Years | 0 (0.0%) | 14 (6.5%) |
| 35 to 64 Years | 15 (4.6%) | 15 (3.7%) |
| 65 to 74 Years | 13 (12.8%) | 27 (18.2%) |
| 75 Years and over | 12 (25.5%) | 8 (12.3%) |
Disability Class: Vision Difficulty
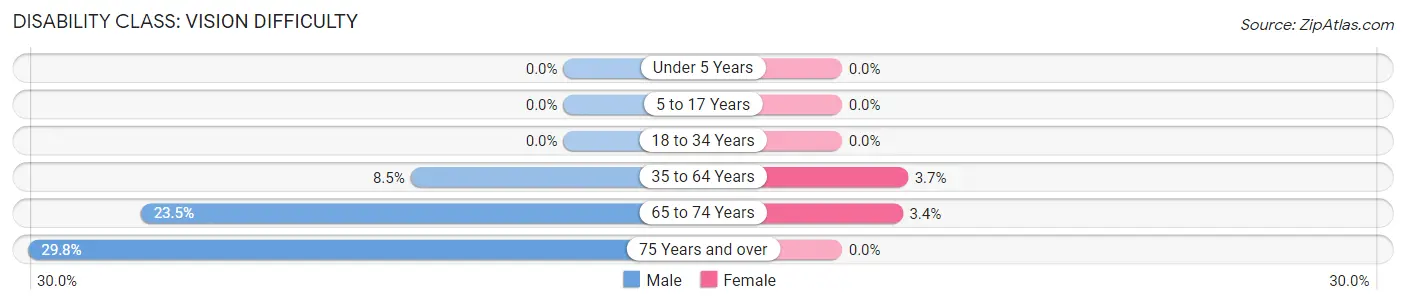
| Age Bracket | Male | Female |
| Under 5 Years | 0 (0.0%) | 0 (0.0%) |
| 5 to 17 Years | 0 (0.0%) | 0 (0.0%) |
| 18 to 34 Years | 0 (0.0%) | 0 (0.0%) |
| 35 to 64 Years | 28 (8.5%) | 15 (3.7%) |
| 65 to 74 Years | 24 (23.5%) | 5 (3.4%) |
| 75 Years and over | 14 (29.8%) | 0 (0.0%) |
Disability Class: Cognitive Difficulty
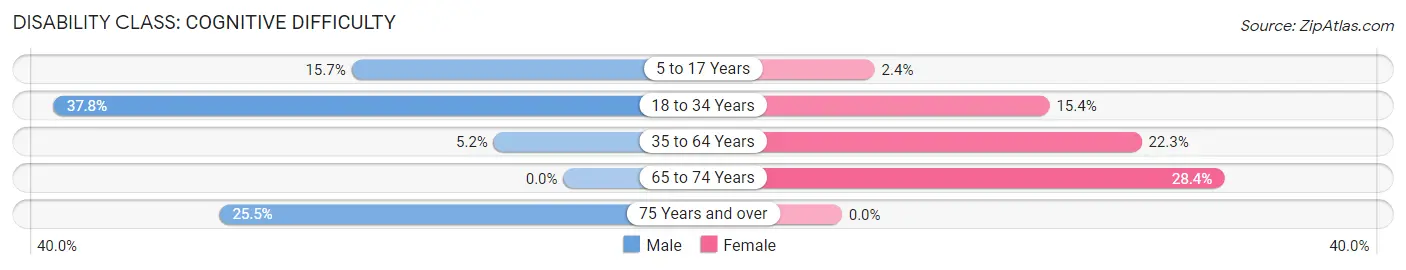
| Age Bracket | Male | Female |
| 5 to 17 Years | 14 (15.7%) | 3 (2.4%) |
| 18 to 34 Years | 101 (37.8%) | 33 (15.4%) |
| 35 to 64 Years | 17 (5.2%) | 91 (22.3%) |
| 65 to 74 Years | 0 (0.0%) | 42 (28.4%) |
| 75 Years and over | 12 (25.5%) | 0 (0.0%) |
Disability Class: Ambulatory Difficulty
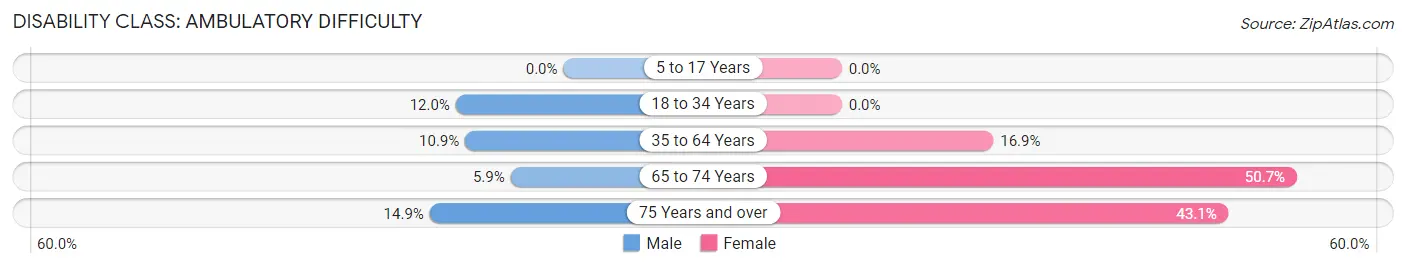
| Age Bracket | Male | Female |
| 5 to 17 Years | 0 (0.0%) | 0 (0.0%) |
| 18 to 34 Years | 32 (12.0%) | 0 (0.0%) |
| 35 to 64 Years | 36 (10.9%) | 69 (16.9%) |
| 65 to 74 Years | 6 (5.9%) | 75 (50.7%) |
| 75 Years and over | 7 (14.9%) | 28 (43.1%) |
Disability Class: Self-Care Difficulty
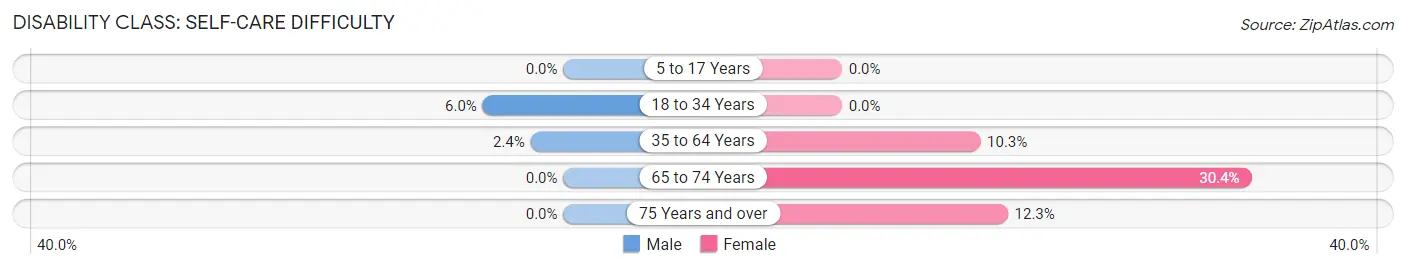
| Age Bracket | Male | Female |
| 5 to 17 Years | 0 (0.0%) | 0 (0.0%) |
| 18 to 34 Years | 16 (6.0%) | 0 (0.0%) |
| 35 to 64 Years | 8 (2.4%) | 42 (10.3%) |
| 65 to 74 Years | 0 (0.0%) | 45 (30.4%) |
| 75 Years and over | 0 (0.0%) | 8 (12.3%) |
Technology Access in Slocomb
Computing Device Access in Slocomb
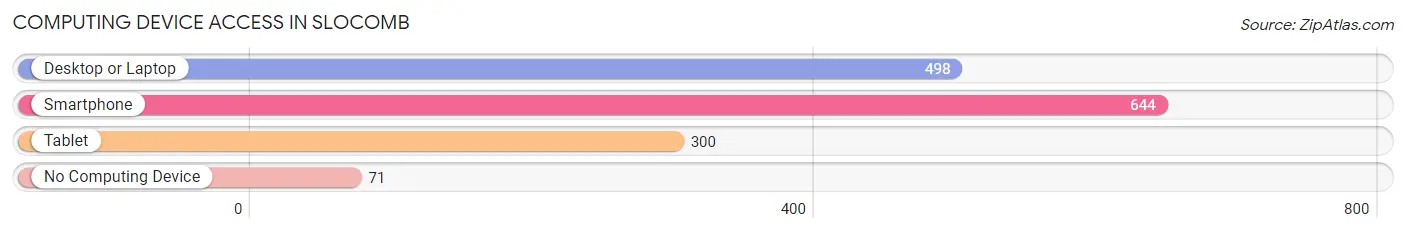
| Device Type | # Households | % Households |
| Desktop or Laptop | 498 | 66.7% |
| Smartphone | 644 | 86.2% |
| Tablet | 300 | 40.2% |
| No Computing Device | 71 | 9.5% |
| Total | 747 | 100.0% |
Internet Access in Slocomb
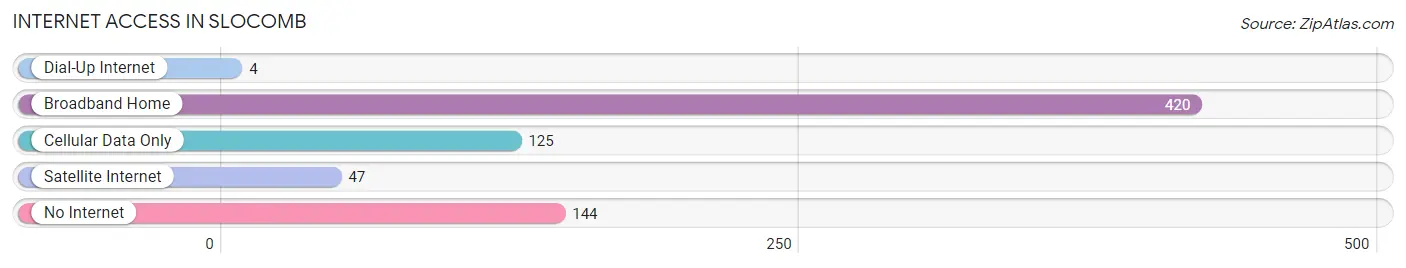
| Internet Type | # Households | % Households |
| Dial-Up Internet | 4 | 0.5% |
| Broadband Home | 420 | 56.2% |
| Cellular Data Only | 125 | 16.7% |
| Satellite Internet | 47 | 6.3% |
| No Internet | 144 | 19.3% |
| Total | 747 | 100.0% |
Slocomb Summary
Slocomb, Alabama is a small town located in the southeastern corner of the state, in Geneva County. It is situated on the banks of the Choctawhatchee River, and is home to a population of approximately 1,500 people. The town was founded in 1883, and was named after the Slocomb family, who were early settlers in the area.
Geography
Slocomb is located in the southeastern corner of Alabama, in Geneva County. It is situated on the banks of the Choctawhatchee River, and is bordered by the cities of Hartford and Samson to the north, and Geneva to the south. The town is located approximately 30 miles from the state capital of Montgomery, and is part of the Dothan metropolitan area. The town has a total area of 1.3 square miles, all of which is land.
Climate
Slocomb has a humid subtropical climate, with hot, humid summers and mild winters. The average annual temperature is around 68 degrees Fahrenheit, with an average high of around 90 degrees in the summer months and an average low of around 40 degrees in the winter months. The town receives an average of around 50 inches of precipitation per year, with most of it falling in the summer months.
Demographics
As of the 2010 census, Slocomb had a population of 1,541 people. The racial makeup of the town was 79.3% White, 18.2% African American, 0.3% Native American, 0.2% Asian, 0.1% Pacific Islander, 0.7% from other races, and 1.4% from two or more races. Hispanic or Latino of any race were 1.7% of the population.
Economy
Slocomb’s economy is largely based on agriculture, with the town being home to several farms and agricultural businesses. The town is also home to several small businesses, including restaurants, retail stores, and service providers. The town is also home to a number of manufacturing companies, including a paper mill and a furniture factory.
History
Slocomb was founded in 1883 by the Slocomb family, who were early settlers in the area. The town was originally known as Slocomb’s Station, and was a stop on the Louisville and Nashville Railroad. The town was officially incorporated in 1887, and the name was changed to Slocomb. The town grew steadily throughout the late 19th and early 20th centuries, and by the 1950s, it had become a thriving agricultural center. The town has remained relatively unchanged since then, and today it is a quiet, rural community.
Common Questions
What is Per Capita Income in Slocomb?
Per Capita income in Slocomb is $22,801.
What is the Median Family Income in Slocomb?
Median Family Income in Slocomb is $40,833.
What is the Median Household income in Slocomb?
Median Household Income in Slocomb is $38,125.
What is Income or Wage Gap in Slocomb?
Income or Wage Gap in Slocomb is 40.9%.
Women in Slocomb earn 59.1 cents for every dollar earned by a man.
What is Family Income Deficit in Slocomb?
Family Income Deficit in Slocomb is $8,104.
Families that are below poverty line in Slocomb earn $8,104 less on average than the poverty threshold level.
What is Inequality or Gini Index in Slocomb?
Inequality or Gini Index in Slocomb is 0.44.
What is the Total Population of Slocomb?
Total Population of Slocomb is 1,860.
What is the Total Male Population of Slocomb?
Total Male Population of Slocomb is 835.
What is the Total Female Population of Slocomb?
Total Female Population of Slocomb is 1,025.
What is the Ratio of Males per 100 Females in Slocomb?
There are 81.46 Males per 100 Females in Slocomb.
What is the Ratio of Females per 100 Males in Slocomb?
There are 122.75 Females per 100 Males in Slocomb.
What is the Median Population Age in Slocomb?
Median Population Age in Slocomb is 42.8 Years.
What is the Average Family Size in Slocomb
Average Family Size in Slocomb is 3.0 People.
What is the Average Household Size in Slocomb
Average Household Size in Slocomb is 2.5 People.
How Large is the Labor Force in Slocomb?
There are 884 People in the Labor Forcein in Slocomb.
What is the Percentage of People in the Labor Force in Slocomb?
53.8% of People are in the Labor Force in Slocomb.
What is the Unemployment Rate in Slocomb?
Unemployment Rate in Slocomb is 4.2%.