Selmont West Selmont, AL Map & Demographics
Selmont West Selmont Map
Selmont West Selmont Overview
$18,069
PER CAPITA INCOME
$38,277
AVG FAMILY INCOME
$35,417
AVG HOUSEHOLD INCOME
22.6%
WAGE / INCOME GAP [ % ]
77.4¢/ $1
WAGE / INCOME GAP [ $ ]
0.35
INEQUALITY / GINI INDEX
1,894
TOTAL POPULATION
710
MALE POPULATION
1,184
FEMALE POPULATION
59.97
MALES / 100 FEMALES
166.76
FEMALES / 100 MALES
31.9
MEDIAN AGE
4.2
AVG FAMILY SIZE
3.2
AVG HOUSEHOLD SIZE
781
LABOR FORCE [ PEOPLE ]
47.8%
PERCENT IN LABOR FORCE
2.9%
UNEMPLOYMENT RATE
Income in Selmont West Selmont
Income Overview in Selmont West Selmont
Per Capita Income in Selmont West Selmont is $18,069, while median incomes of families and households are $38,277 and $35,417 respectively.
| Characteristic | Number | Measure |
| Per Capita Income | 1,894 | $18,069 |
| Median Family Income | 411 | $38,277 |
| Mean Family Income | 411 | $48,030 |
| Median Household Income | 585 | $35,417 |
| Mean Household Income | 585 | $42,050 |
| Income Deficit | 411 | $0 |
| Wage / Income Gap (%) | 1,894 | 22.57% |
| Wage / Income Gap ($) | 1,894 | 77.43¢ per $1 |
| Gini / Inequality Index | 1,894 | 0.35 |
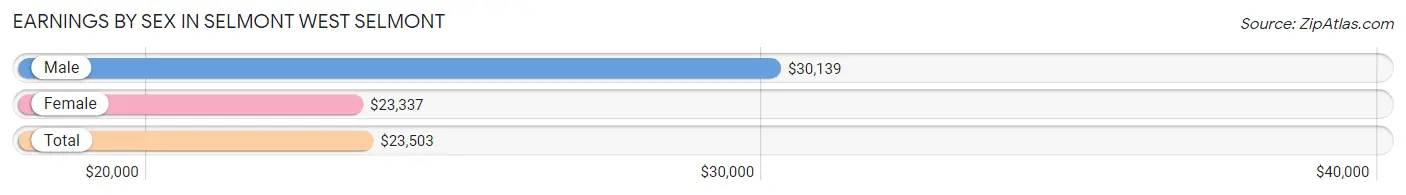
Earnings by Sex in Selmont West Selmont
Average Earnings in Selmont West Selmont are $23,503, $30,139 for men and $23,337 for women, a difference of 22.6%.
| Sex | Number | Average Earnings |
| Male | 221 (29.0%) | $30,139 |
| Female | 542 (71.0%) | $23,337 |
| Total | 763 (100.0%) | $23,503 |
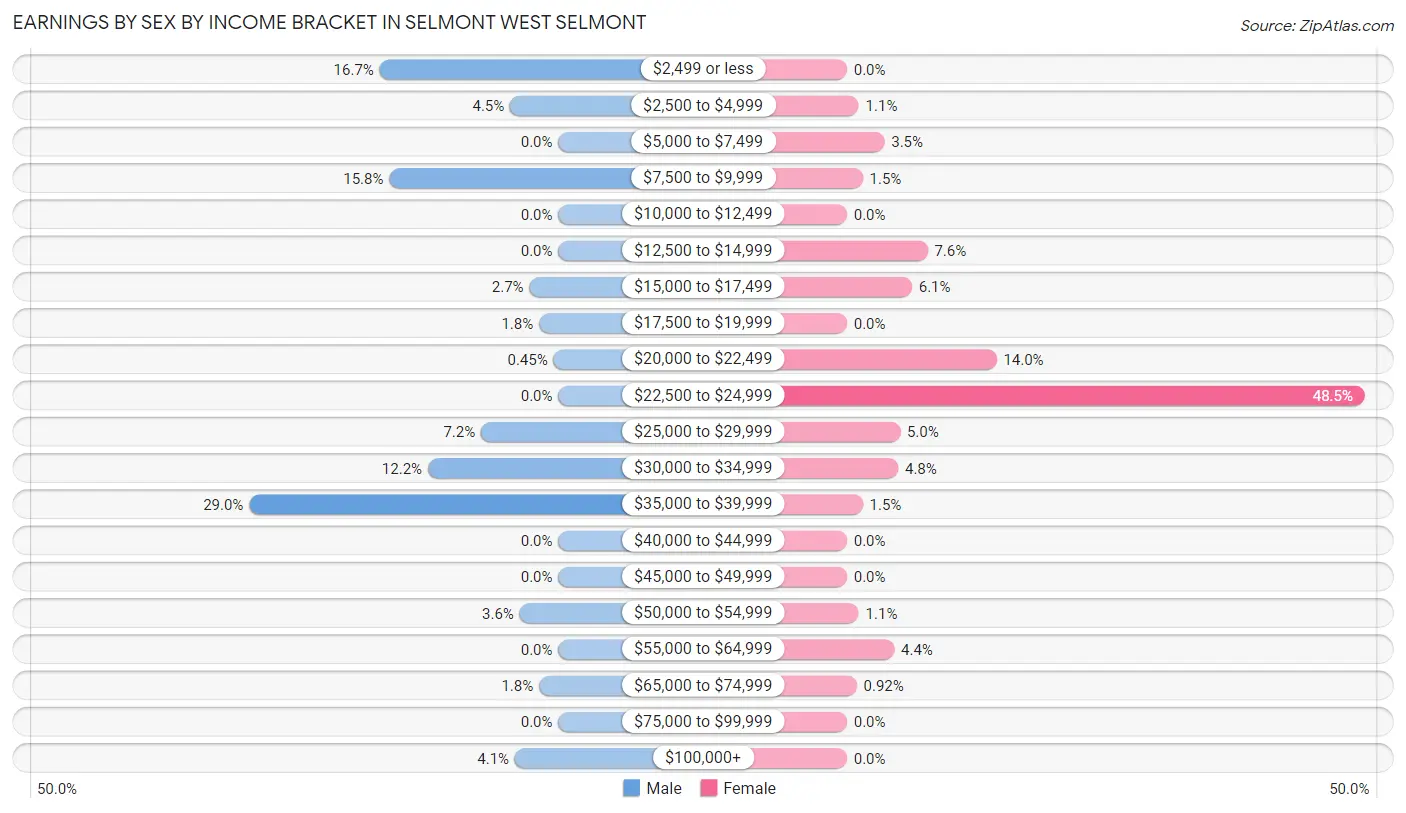
Earnings by Sex by Income Bracket in Selmont West Selmont
The most common earnings brackets in Selmont West Selmont are $35,000 to $39,999 for men (64 | 29.0%) and $22,500 to $24,999 for women (263 | 48.5%).
| Income | Male | Female |
| $2,499 or less | 37 (16.7%) | 0 (0.0%) |
| $2,500 to $4,999 | 10 (4.5%) | 6 (1.1%) |
| $5,000 to $7,499 | 0 (0.0%) | 19 (3.5%) |
| $7,500 to $9,999 | 35 (15.8%) | 8 (1.5%) |
| $10,000 to $12,499 | 0 (0.0%) | 0 (0.0%) |
| $12,500 to $14,999 | 0 (0.0%) | 41 (7.6%) |
| $15,000 to $17,499 | 6 (2.7%) | 33 (6.1%) |
| $17,500 to $19,999 | 4 (1.8%) | 0 (0.0%) |
| $20,000 to $22,499 | 1 (0.4%) | 76 (14.0%) |
| $22,500 to $24,999 | 0 (0.0%) | 263 (48.5%) |
| $25,000 to $29,999 | 16 (7.2%) | 27 (5.0%) |
| $30,000 to $34,999 | 27 (12.2%) | 26 (4.8%) |
| $35,000 to $39,999 | 64 (29.0%) | 8 (1.5%) |
| $40,000 to $44,999 | 0 (0.0%) | 0 (0.0%) |
| $45,000 to $49,999 | 0 (0.0%) | 0 (0.0%) |
| $50,000 to $54,999 | 8 (3.6%) | 6 (1.1%) |
| $55,000 to $64,999 | 0 (0.0%) | 24 (4.4%) |
| $65,000 to $74,999 | 4 (1.8%) | 5 (0.9%) |
| $75,000 to $99,999 | 0 (0.0%) | 0 (0.0%) |
| $100,000+ | 9 (4.1%) | 0 (0.0%) |
| Total | 221 (100.0%) | 542 (100.0%) |
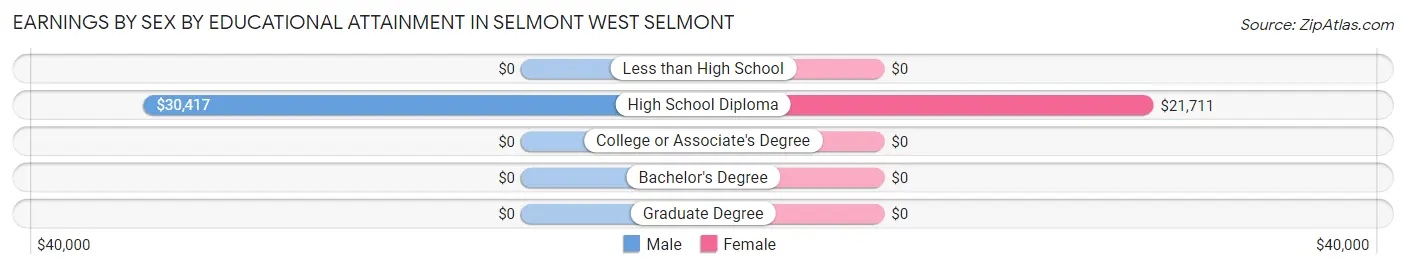
Earnings by Sex by Educational Attainment in Selmont West Selmont
| Educational Attainment | Male Income | Female Income |
| Less than High School | - | - |
| High School Diploma | $30,417 | $21,711 |
| College or Associate's Degree | - | - |
| Bachelor's Degree | - | - |
| Graduate Degree | - | - |
| Total | - | - |
Family Income in Selmont West Selmont
Family Income Brackets in Selmont West Selmont
According to the Selmont West Selmont family income data, there are 135 families falling into the $35,000 to $49,999 income range, which is the most common income bracket and makes up 32.9% of all families.
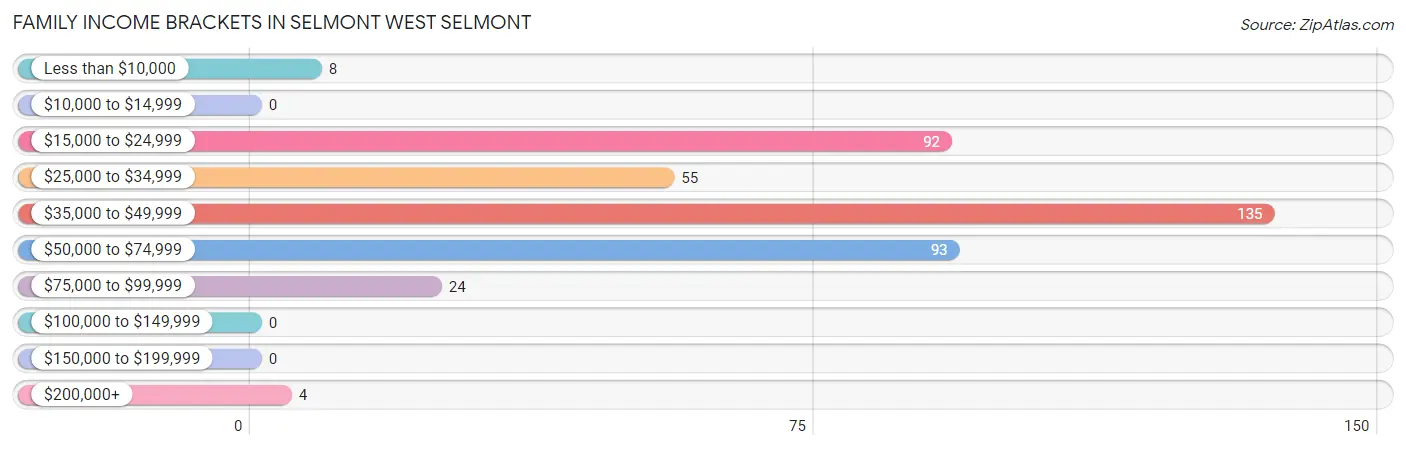
| Income Bracket | # Families | % Families |
| Less than $10,000 | 8 | 1.9% |
| $10,000 to $14,999 | 0 | 0.0% |
| $15,000 to $24,999 | 92 | 22.4% |
| $25,000 to $34,999 | 55 | 13.4% |
| $35,000 to $49,999 | 135 | 32.8% |
| $50,000 to $74,999 | 93 | 22.6% |
| $75,000 to $99,999 | 24 | 5.8% |
| $100,000 to $149,999 | 0 | 0.0% |
| $150,000 to $199,999 | 0 | 0.0% |
| $200,000+ | 4 | 1.0% |
Family Income by Famaliy Size in Selmont West Selmont
3-person families (91 | 22.1%) account for the highest median family income in Selmont West Selmont with $40,189 per family, while 2-person families (186 | 45.3%) have the highest median income of $18,750 per family member.
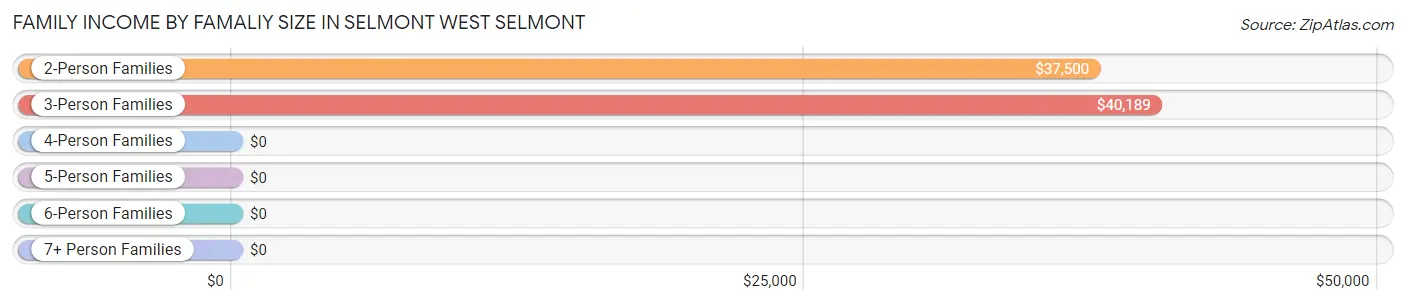
| Income Bracket | # Families | Median Income |
| 2-Person Families | 186 (45.3%) | $37,500 |
| 3-Person Families | 91 (22.1%) | $40,189 |
| 4-Person Families | 90 (21.9%) | $0 |
| 5-Person Families | 0 (0.0%) | $0 |
| 6-Person Families | 44 (10.7%) | $0 |
| 7+ Person Families | 0 (0.0%) | $0 |
| Total | 411 (100.0%) | $38,277 |
Family Income by Number of Earners in Selmont West Selmont
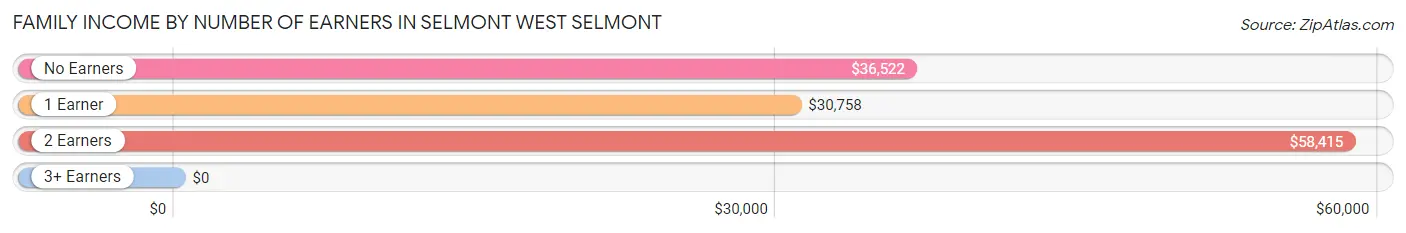
| Number of Earners | # Families | Median Income |
| No Earners | 138 (33.6%) | $36,522 |
| 1 Earner | 120 (29.2%) | $30,758 |
| 2 Earners | 141 (34.3%) | $58,415 |
| 3+ Earners | 12 (2.9%) | $0 |
| Total | 411 (100.0%) | $38,277 |
Household Income in Selmont West Selmont
Household Income Brackets in Selmont West Selmont
With 155 households falling in the category, the $35,000 to $49,999 income range is the most frequent in Selmont West Selmont, accounting for 26.5% of all households.
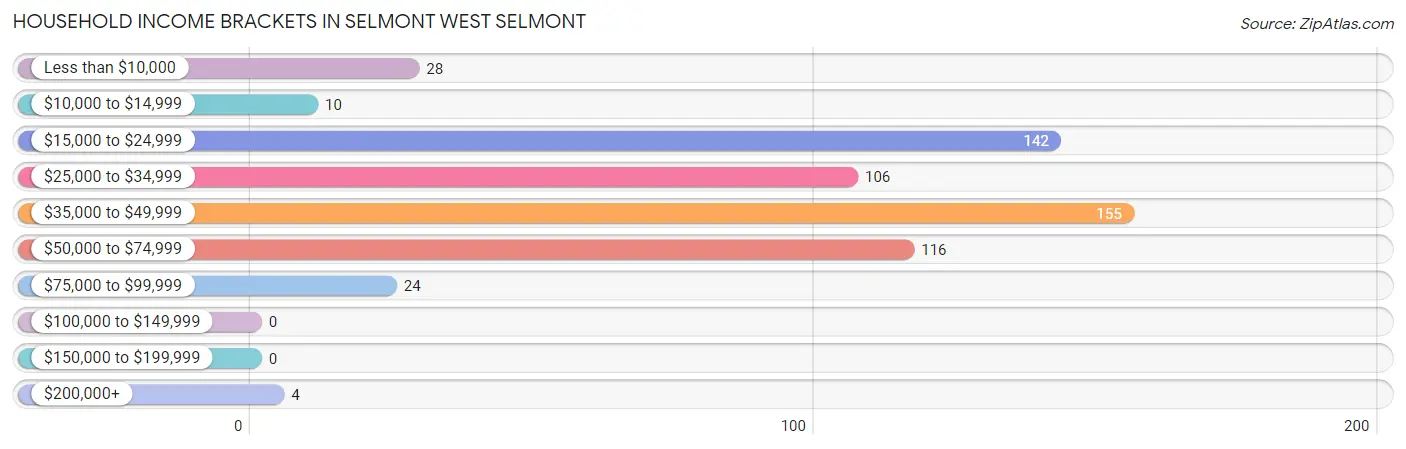
| Income Bracket | # Households | % Households |
| Less than $10,000 | 28 | 4.8% |
| $10,000 to $14,999 | 10 | 1.7% |
| $15,000 to $24,999 | 142 | 24.3% |
| $25,000 to $34,999 | 106 | 18.1% |
| $35,000 to $49,999 | 155 | 26.5% |
| $50,000 to $74,999 | 116 | 19.8% |
| $75,000 to $99,999 | 24 | 4.1% |
| $100,000 to $149,999 | 0 | 0.0% |
| $150,000 to $199,999 | 0 | 0.0% |
| $200,000+ | 4 | 0.7% |
Household Income by Householder Age in Selmont West Selmont
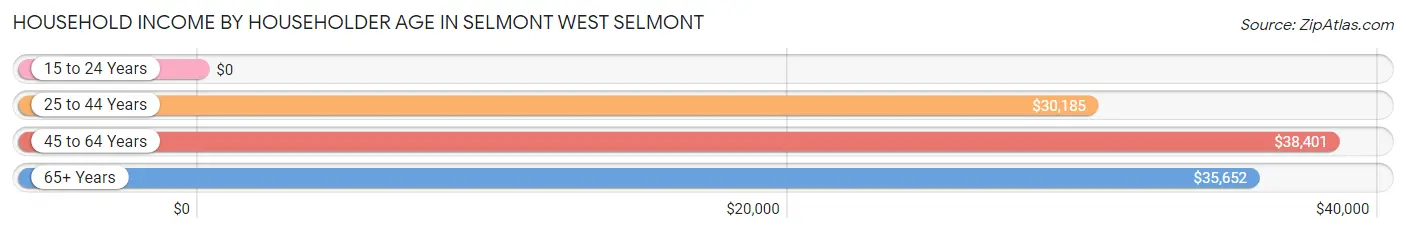
The median household income in Selmont West Selmont is $35,417, with the highest median household income of $38,401 found in the 45 to 64 years age bracket for the primary householder. A total of 213 households (36.4%) fall into this category. Meanwhile, the 15 to 24 years age bracket for the primary householder has the lowest median household income of $0, with 12 households (2.1%) in this group.
| Income Bracket | # Households | Median Income |
| 15 to 24 Years | 12 (2.1%) | $0 |
| 25 to 44 Years | 98 (16.8%) | $30,185 |
| 45 to 64 Years | 213 (36.4%) | $38,401 |
| 65+ Years | 262 (44.8%) | $35,652 |
| Total | 585 (100.0%) | $35,417 |
Poverty in Selmont West Selmont
Income Below Poverty by Sex and Age in Selmont West Selmont
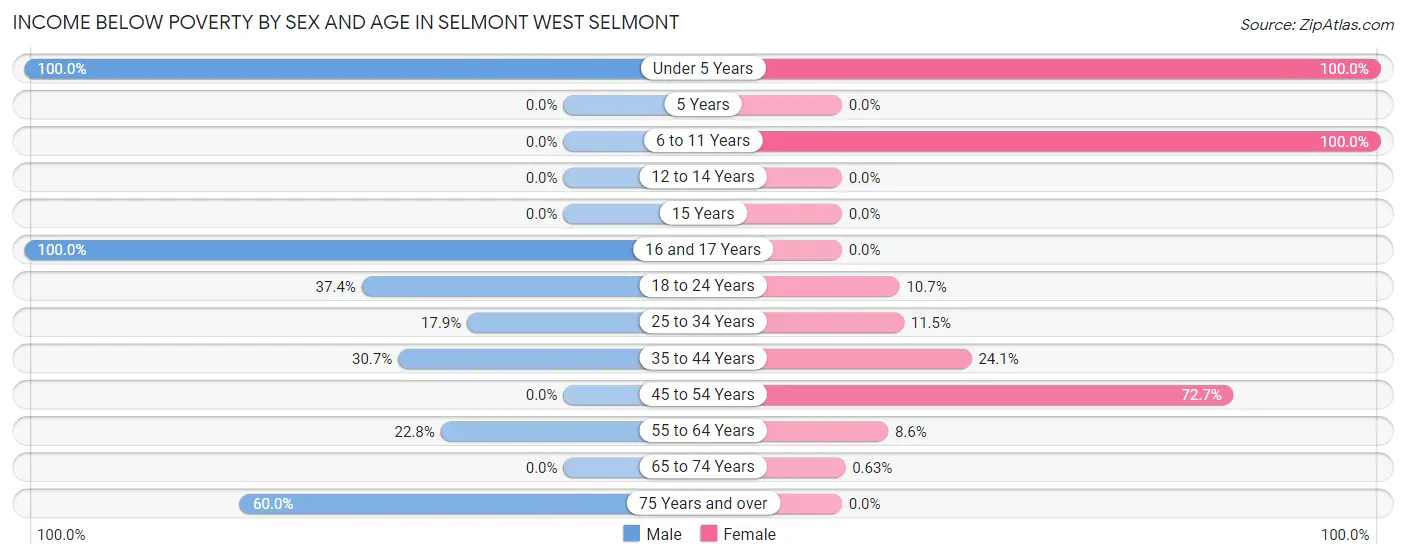
With 37.0% poverty level for males and 21.8% for females among the residents of Selmont West Selmont, under 5 year old males and under 5 year old females are the most vulnerable to poverty, with 83 males (100.0%) and 50 females (100.0%) in their respective age groups living below the poverty level.
| Age Bracket | Male | Female |
| Under 5 Years | 83 (100.0%) | 50 (100.0%) |
| 5 Years | 0 (0.0%) | 0 (0.0%) |
| 6 to 11 Years | 0 (0.0%) | 66 (100.0%) |
| 12 to 14 Years | 0 (0.0%) | 0 (0.0%) |
| 15 Years | 0 (0.0%) | 0 (0.0%) |
| 16 and 17 Years | 31 (100.0%) | 0 (0.0%) |
| 18 to 24 Years | 76 (37.4%) | 6 (10.7%) |
| 25 to 34 Years | 15 (17.9%) | 39 (11.5%) |
| 35 to 44 Years | 31 (30.7%) | 52 (24.1%) |
| 45 to 54 Years | 0 (0.0%) | 32 (72.7%) |
| 55 to 64 Years | 18 (22.8%) | 12 (8.6%) |
| 65 to 74 Years | 0 (0.0%) | 1 (0.6%) |
| 75 Years and over | 9 (60.0%) | 0 (0.0%) |
| Total | 263 (37.0%) | 258 (21.8%) |
Income Above Poverty by Sex and Age in Selmont West Selmont
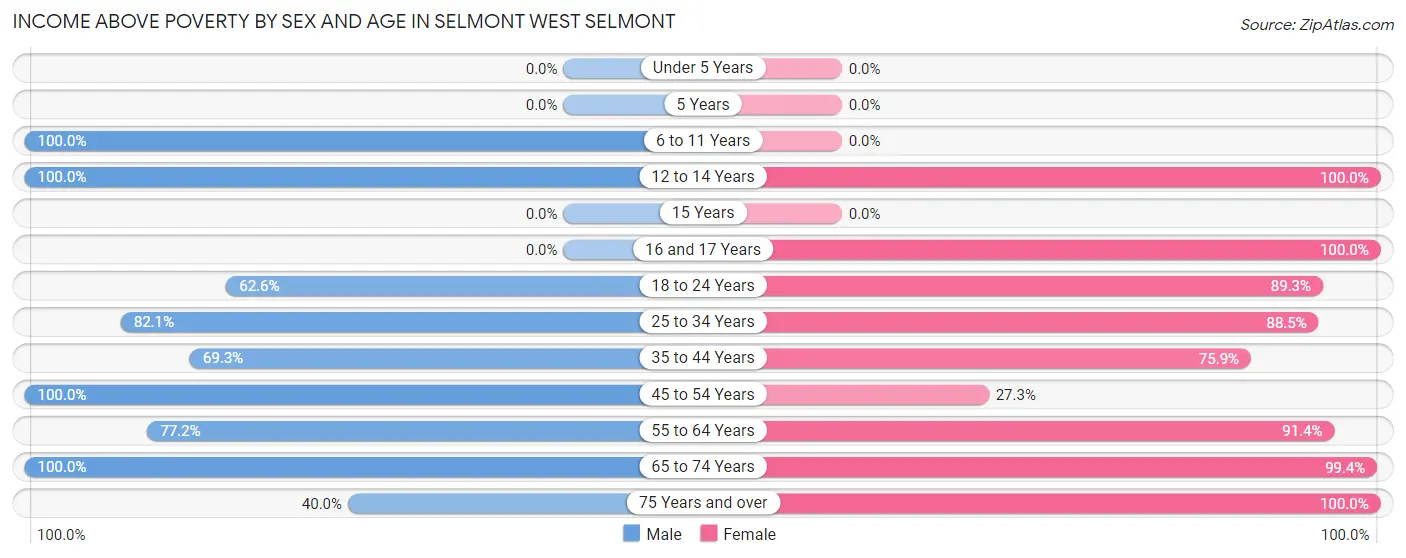
According to the poverty statistics in Selmont West Selmont, males aged 6 to 11 years and females aged 12 to 14 years are the age groups that are most secure financially, with 100.0% of males and 100.0% of females in these age groups living above the poverty line.
| Age Bracket | Male | Female |
| Under 5 Years | 0 (0.0%) | 0 (0.0%) |
| 5 Years | 0 (0.0%) | 0 (0.0%) |
| 6 to 11 Years | 24 (100.0%) | 0 (0.0%) |
| 12 to 14 Years | 14 (100.0%) | 24 (100.0%) |
| 15 Years | 0 (0.0%) | 0 (0.0%) |
| 16 and 17 Years | 0 (0.0%) | 38 (100.0%) |
| 18 to 24 Years | 127 (62.6%) | 50 (89.3%) |
| 25 to 34 Years | 69 (82.1%) | 300 (88.5%) |
| 35 to 44 Years | 70 (69.3%) | 164 (75.9%) |
| 45 to 54 Years | 20 (100.0%) | 12 (27.3%) |
| 55 to 64 Years | 61 (77.2%) | 128 (91.4%) |
| 65 to 74 Years | 56 (100.0%) | 158 (99.4%) |
| 75 Years and over | 6 (40.0%) | 52 (100.0%) |
| Total | 447 (63.0%) | 926 (78.2%) |
Income Below Poverty Among Married-Couple Families in Selmont West Selmont
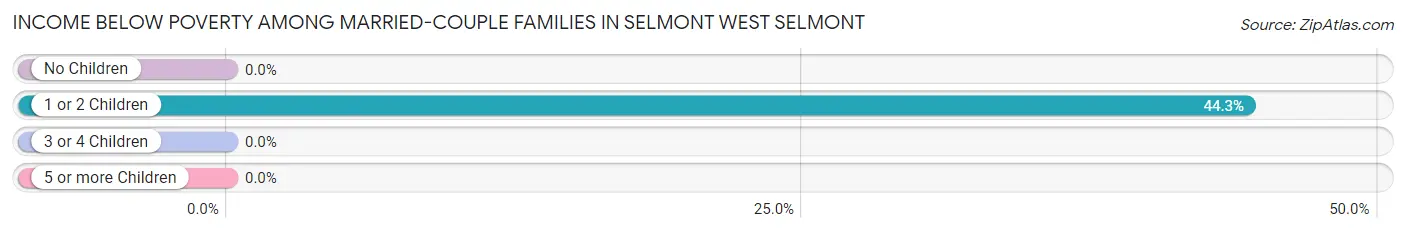
The poverty statistics for married-couple families in Selmont West Selmont show that 25.2% or 31 of the total 123 families live below the poverty line. Families with 1 or 2 children have the highest poverty rate of 44.3%, comprising of 31 families. On the other hand, families with no children have the lowest poverty rate of 0.0%, which includes 0 families.
| Children | Above Poverty | Below Poverty |
| No Children | 53 (100.0%) | 0 (0.0%) |
| 1 or 2 Children | 39 (55.7%) | 31 (44.3%) |
| 3 or 4 Children | 0 (0.0%) | 0 (0.0%) |
| 5 or more Children | 0 (0.0%) | 0 (0.0%) |
| Total | 92 (74.8%) | 31 (25.2%) |
Income Below Poverty Among Single-Parent Households in Selmont West Selmont
According to the poverty data in Selmont West Selmont, 10.8% or 4 single-father households and 19.5% or 49 single-mother households are living below the poverty line. Among single-father households, those with no children have the highest poverty rate, with 4 households (10.8%) experiencing poverty. Likewise, among single-mother households, those with 3 or 4 children have the highest poverty rate, with 32 households (100.0%) falling below the poverty line.
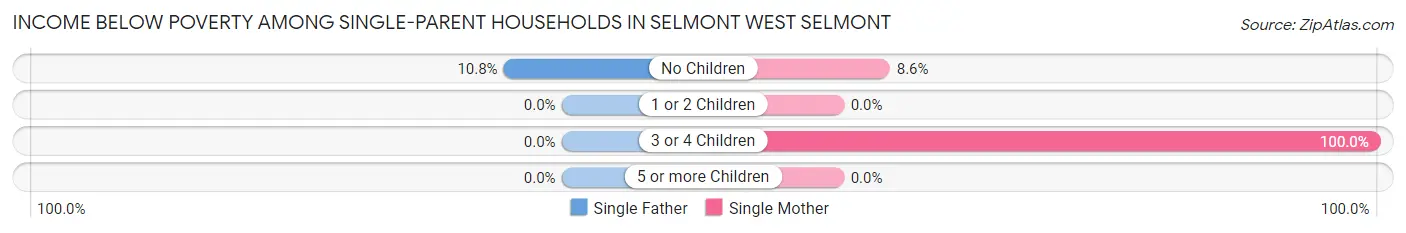
| Children | Single Father | Single Mother |
| No Children | 4 (10.8%) | 17 (8.6%) |
| 1 or 2 Children | 0 (0.0%) | 0 (0.0%) |
| 3 or 4 Children | 0 (0.0%) | 32 (100.0%) |
| 5 or more Children | 0 (0.0%) | 0 (0.0%) |
| Total | 4 (10.8%) | 49 (19.5%) |
Income Below Poverty Among Married-Couple vs Single-Parent Households in Selmont West Selmont
The poverty data for Selmont West Selmont shows that 31 of the married-couple family households (25.2%) and 53 of the single-parent households (18.4%) are living below the poverty level. Within the married-couple family households, those with 1 or 2 children have the highest poverty rate, with 31 households (44.3%) falling below the poverty line. Among the single-parent households, those with 3 or 4 children have the highest poverty rate, with 32 household (100.0%) living below poverty.
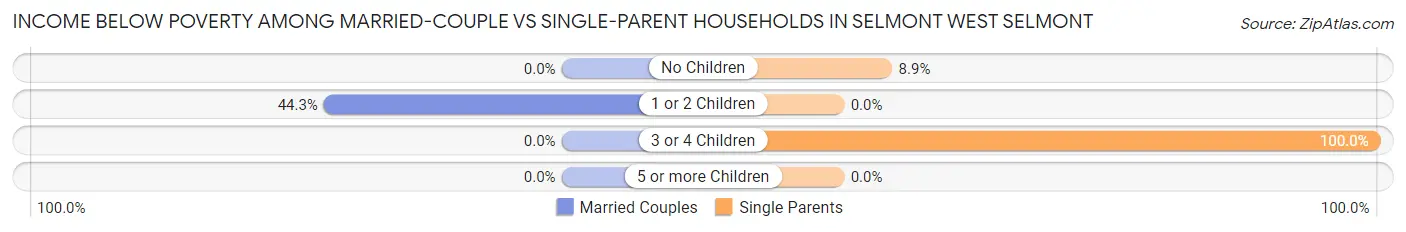
| Children | Married-Couple Families | Single-Parent Households |
| No Children | 0 (0.0%) | 21 (8.9%) |
| 1 or 2 Children | 31 (44.3%) | 0 (0.0%) |
| 3 or 4 Children | 0 (0.0%) | 32 (100.0%) |
| 5 or more Children | 0 (0.0%) | 0 (0.0%) |
| Total | 31 (25.2%) | 53 (18.4%) |
Race in Selmont West Selmont
The most populous races in Selmont West Selmont are Black / African American (1,532 | 80.9%), Two or more Races (319 | 16.8%), and White / Caucasian (42 | 2.2%).
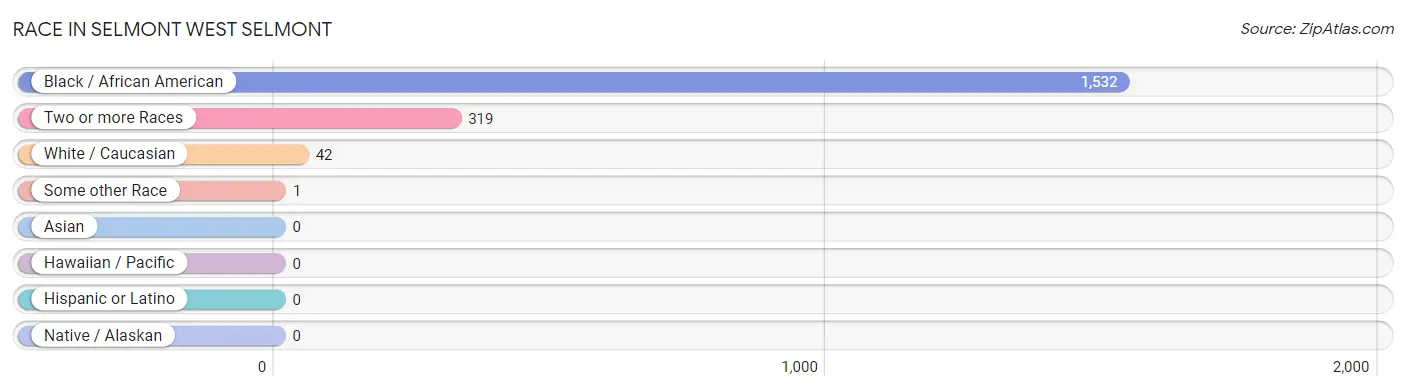
| Race | # Population | % Population |
| Asian | 0 | 0.0% |
| Black / African American | 1,532 | 80.9% |
| Hawaiian / Pacific | 0 | 0.0% |
| Hispanic or Latino | 0 | 0.0% |
| Native / Alaskan | 0 | 0.0% |
| White / Caucasian | 42 | 2.2% |
| Two or more Races | 319 | 16.8% |
| Some other Race | 1 | 0.1% |
| Total | 1,894 | 100.0% |
Ancestry in Selmont West Selmont
The most populous ancestries reported in Selmont West Selmont are English (307 | 16.2%), American (11 | 0.6%), African (9 | 0.5%), Dutch (9 | 0.5%), and Subsaharan African (9 | 0.5%), together accounting for 18.2% of all Selmont West Selmont residents.
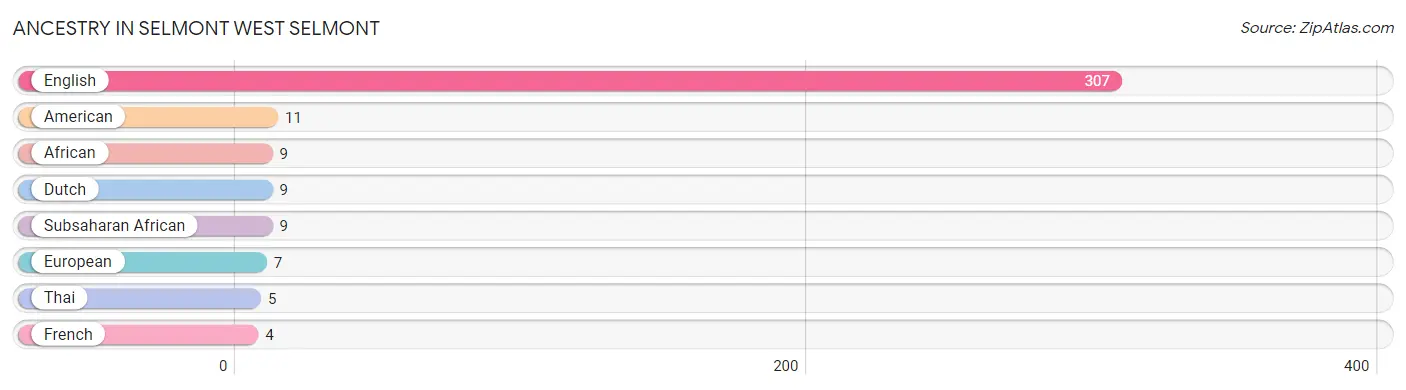
| Ancestry | # Population | % Population |
| African | 9 | 0.5% |
| American | 11 | 0.6% |
| Dutch | 9 | 0.5% |
| English | 307 | 16.2% |
| European | 7 | 0.4% |
| French | 4 | 0.2% |
| Subsaharan African | 9 | 0.5% |
| Thai | 5 | 0.3% | View All 8 Rows |
Immigrants in Selmont West Selmont

| Immigration Origin | # Population | % Population | View All 0 Rows |
Sex and Age in Selmont West Selmont
Sex and Age in Selmont West Selmont
The most populous age groups in Selmont West Selmont are 20 to 24 Years (148 | 20.8%) for men and 25 to 29 Years (321 | 27.1%) for women.
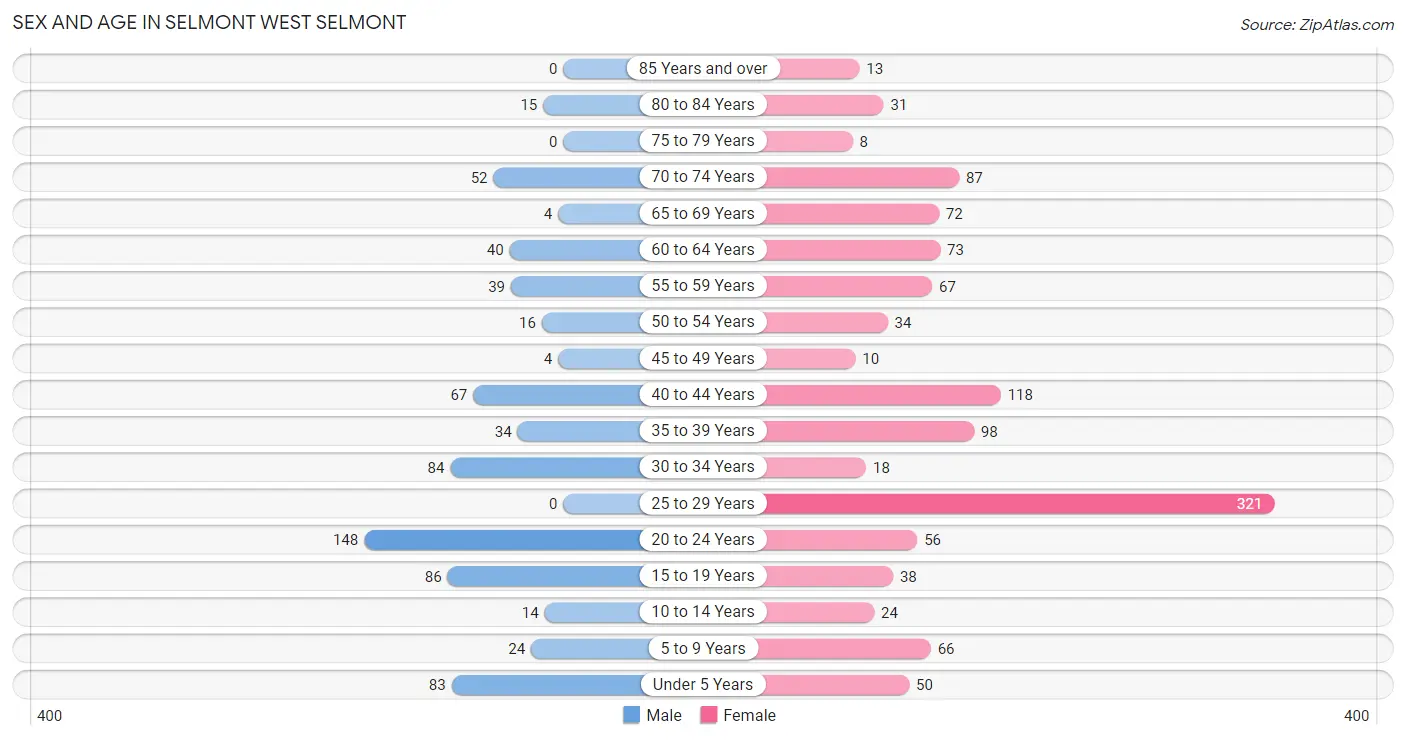
| Age Bracket | Male | Female |
| Under 5 Years | 83 (11.7%) | 50 (4.2%) |
| 5 to 9 Years | 24 (3.4%) | 66 (5.6%) |
| 10 to 14 Years | 14 (2.0%) | 24 (2.0%) |
| 15 to 19 Years | 86 (12.1%) | 38 (3.2%) |
| 20 to 24 Years | 148 (20.8%) | 56 (4.7%) |
| 25 to 29 Years | 0 (0.0%) | 321 (27.1%) |
| 30 to 34 Years | 84 (11.8%) | 18 (1.5%) |
| 35 to 39 Years | 34 (4.8%) | 98 (8.3%) |
| 40 to 44 Years | 67 (9.4%) | 118 (10.0%) |
| 45 to 49 Years | 4 (0.6%) | 10 (0.8%) |
| 50 to 54 Years | 16 (2.2%) | 34 (2.9%) |
| 55 to 59 Years | 39 (5.5%) | 67 (5.7%) |
| 60 to 64 Years | 40 (5.6%) | 73 (6.2%) |
| 65 to 69 Years | 4 (0.6%) | 72 (6.1%) |
| 70 to 74 Years | 52 (7.3%) | 87 (7.3%) |
| 75 to 79 Years | 0 (0.0%) | 8 (0.7%) |
| 80 to 84 Years | 15 (2.1%) | 31 (2.6%) |
| 85 Years and over | 0 (0.0%) | 13 (1.1%) |
| Total | 710 (100.0%) | 1,184 (100.0%) |
Families and Households in Selmont West Selmont
Median Family Size in Selmont West Selmont
The median family size in Selmont West Selmont is 4.17 persons per family, with single female/mother families (251 | 61.1%) accounting for the largest median family size of 4.62 persons per family. On the other hand, single male/father families (37 | 9.0%) represent the smallest median family size with 2.59 persons per family.
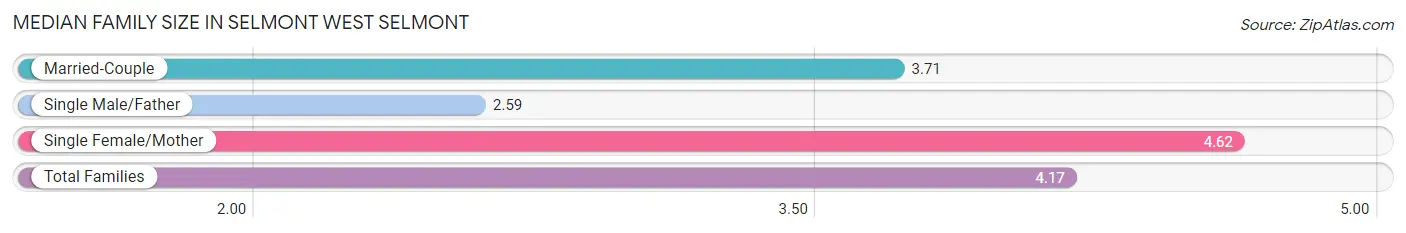
| Family Type | # Families | Family Size |
| Married-Couple | 123 (29.9%) | 3.71 |
| Single Male/Father | 37 (9.0%) | 2.59 |
| Single Female/Mother | 251 (61.1%) | 4.62 |
| Total Families | 411 (100.0%) | 4.17 |
Median Household Size in Selmont West Selmont
The median household size in Selmont West Selmont is 3.24 persons per household, with single female/mother households (251 | 42.9%) accounting for the largest median household size of 4.62 persons per household. non-family households (174 | 29.7%) represent the smallest median household size with 1.03 persons per household.
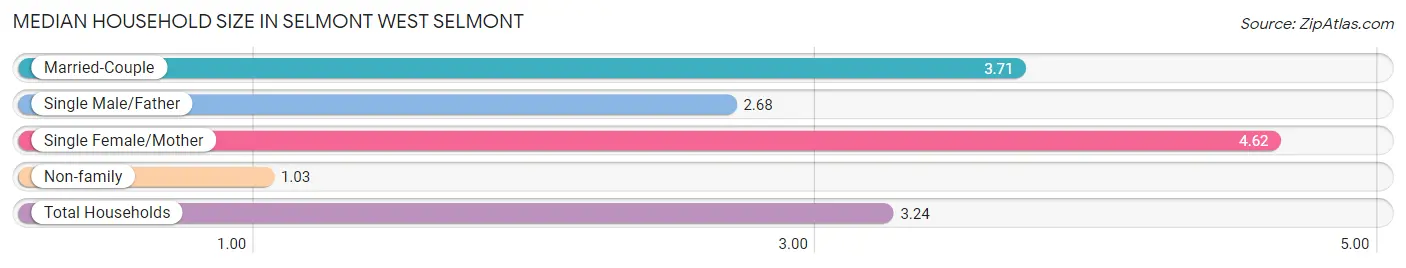
| Household Type | # Households | Household Size |
| Married-Couple | 123 (21.0%) | 3.71 |
| Single Male/Father | 37 (6.3%) | 2.68 |
| Single Female/Mother | 251 (42.9%) | 4.62 |
| Non-family | 174 (29.7%) | 1.03 |
| Total Households | 585 (100.0%) | 3.24 |
Household Size by Marriage Status in Selmont West Selmont
Out of a total of 585 households in Selmont West Selmont, 411 (70.3%) are family households, while 174 (29.7%) are nonfamily households. The most numerous type of family households are 2-person households, comprising 186, and the most common type of nonfamily households are 1-person households, comprising 164.
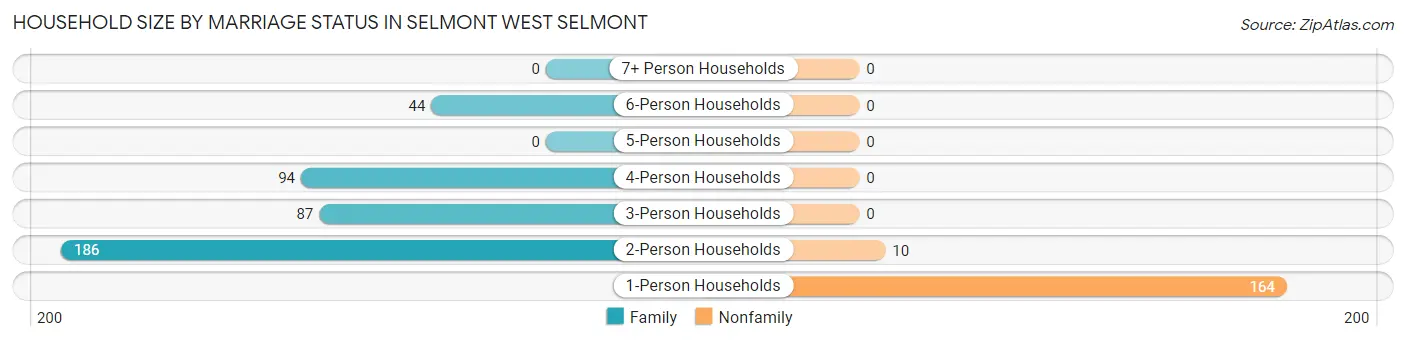
| Household Size | Family Households | Nonfamily Households |
| 1-Person Households | - | 164 (28.0%) |
| 2-Person Households | 186 (31.8%) | 10 (1.7%) |
| 3-Person Households | 87 (14.9%) | 0 (0.0%) |
| 4-Person Households | 94 (16.1%) | 0 (0.0%) |
| 5-Person Households | 0 (0.0%) | 0 (0.0%) |
| 6-Person Households | 44 (7.5%) | 0 (0.0%) |
| 7+ Person Households | 0 (0.0%) | 0 (0.0%) |
| Total | 411 (70.3%) | 174 (29.7%) |
Female Fertility in Selmont West Selmont
Fertility by Age in Selmont West Selmont
| Age Bracket | Women with Births | Births / 1,000 Women |
| 15 to 19 years | 0 (0.0%) | 0.0 |
| 20 to 34 years | 0 (0.0%) | 0.0 |
| 35 to 50 years | 0 (0.0%) | 0.0 |
| Total | 0 (0.0%) | 0.0 |
Fertility by Age by Marriage Status in Selmont West Selmont
| Age Bracket | Married | Unmarried |
| 15 to 19 years | 0 (0.0%) | 0 (0.0%) |
| 20 to 34 years | 0 (0.0%) | 0 (0.0%) |
| 35 to 50 years | 0 (0.0%) | 0 (0.0%) |
| Total | 0 (0.0%) | 0 (0.0%) |
Fertility by Education in Selmont West Selmont
| Educational Attainment | Women with Births | Births / 1,000 Women |
| Less than High School | 0 (0.0%) | 0.0 |
| High School Diploma | 0 (0.0%) | 0.0 |
| College or Associate's Degree | 0 (0.0%) | 0.0 |
| Bachelor's Degree | 0 (0.0%) | 0.0 |
| Graduate Degree | 0 (0.0%) | 0.0 |
| Total | 0 (0.0%) | 0.0 |
Fertility by Education by Marriage Status in Selmont West Selmont
| Educational Attainment | Married | Unmarried |
| Less than High School | 0 (0.0%) | 0 (0.0%) |
| High School Diploma | 0 (0.0%) | 0 (0.0%) |
| College or Associate's Degree | 0 (0.0%) | 0 (0.0%) |
| Bachelor's Degree | 0 (0.0%) | 0 (0.0%) |
| Graduate Degree | 0 (0.0%) | 0 (0.0%) |
| Total | 0 (0.0%) | 0 (0.0%) |
Employment Characteristics in Selmont West Selmont
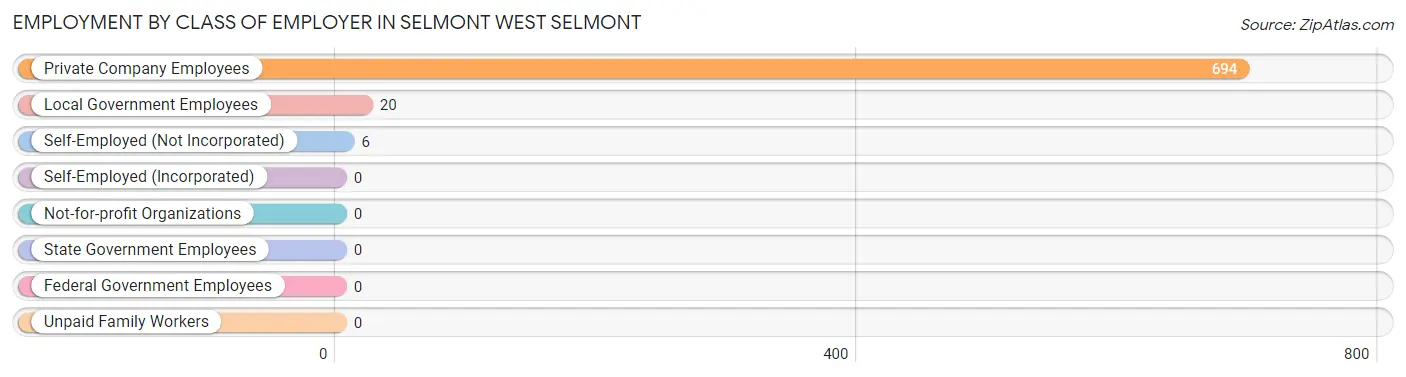
Employment by Class of Employer in Selmont West Selmont
Among the 720 employed individuals in Selmont West Selmont, private company employees (694 | 96.4%), local government employees (20 | 2.8%), and self-employed (not incorporated) (6 | 0.8%) make up the most common classes of employment.
| Employer Class | # Employees | % Employees |
| Private Company Employees | 694 | 96.4% |
| Self-Employed (Incorporated) | 0 | 0.0% |
| Self-Employed (Not Incorporated) | 6 | 0.8% |
| Not-for-profit Organizations | 0 | 0.0% |
| Local Government Employees | 20 | 2.8% |
| State Government Employees | 0 | 0.0% |
| Federal Government Employees | 0 | 0.0% |
| Unpaid Family Workers | 0 | 0.0% |
| Total | 720 | 100.0% |
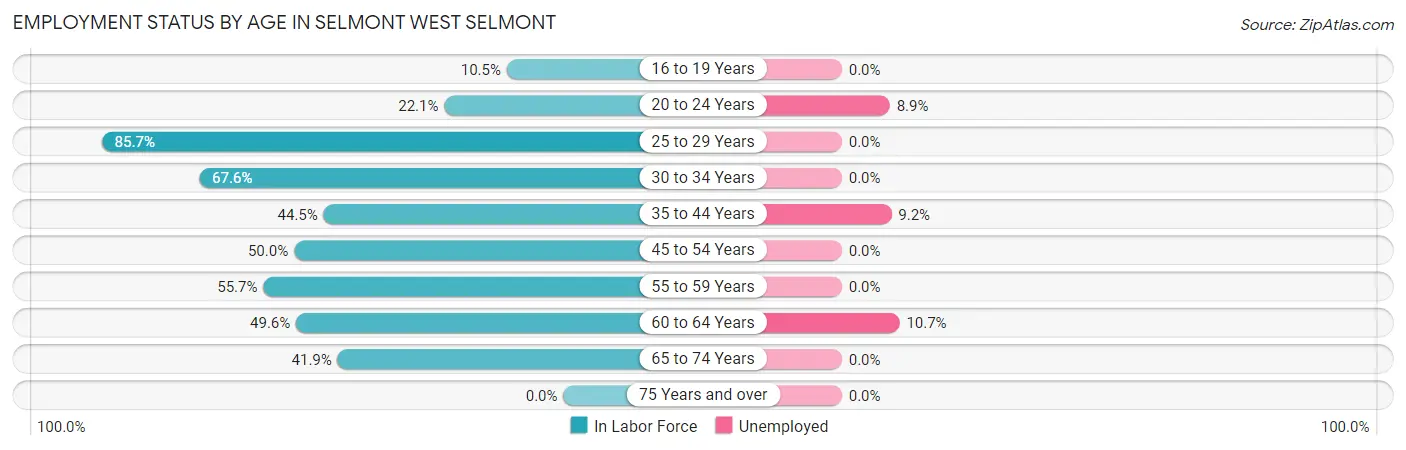
Employment Status by Age in Selmont West Selmont
According to the labor force statistics for Selmont West Selmont, out of the total population over 16 years of age (1,633), 47.8% or 781 individuals are in the labor force, with 2.9% or 23 of them unemployed. The age group with the highest labor force participation rate is 25 to 29 years, with 85.7% or 275 individuals in the labor force. Within the labor force, the 60 to 64 years age range has the highest percentage of unemployed individuals, with 10.7% or 6 of them being unemployed.
| Age Bracket | In Labor Force | Unemployed |
| 16 to 19 Years | 13 (10.5%) | 0 (0.0%) |
| 20 to 24 Years | 45 (22.1%) | 4 (8.9%) |
| 25 to 29 Years | 275 (85.7%) | 0 (0.0%) |
| 30 to 34 Years | 69 (67.6%) | 0 (0.0%) |
| 35 to 44 Years | 141 (44.5%) | 13 (9.2%) |
| 45 to 54 Years | 32 (50.0%) | 0 (0.0%) |
| 55 to 59 Years | 59 (55.7%) | 0 (0.0%) |
| 60 to 64 Years | 56 (49.6%) | 6 (10.7%) |
| 65 to 74 Years | 90 (41.9%) | 0 (0.0%) |
| 75 Years and over | 0 (0.0%) | 0 (0.0%) |
| Total | 781 (47.8%) | 23 (2.9%) |
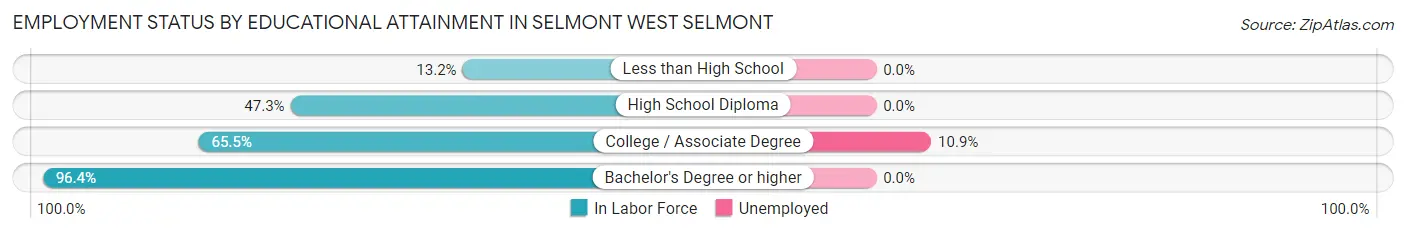
Employment Status by Educational Attainment in Selmont West Selmont
According to labor force statistics for Selmont West Selmont, 61.8% of individuals (632) out of the total population between 25 and 64 years of age (1,023) are in the labor force, with 3.0% or 19 of them being unemployed. The group with the highest labor force participation rate are those with the educational attainment of bachelor's degree or higher, with 96.4% or 241 individuals in the labor force. Within the labor force, individuals with college / associate degree education have the highest percentage of unemployment, with 10.9% or 19 of them being unemployed.
| Educational Attainment | In Labor Force | Unemployed |
| Less than High School | 9 (13.2%) | 0 (0.0%) |
| High School Diploma | 207 (47.3%) | 0 (0.0%) |
| College / Associate Degree | 175 (65.5%) | 29 (10.9%) |
| Bachelor's Degree or higher | 241 (96.4%) | 0 (0.0%) |
| Total | 632 (61.8%) | 31 (3.0%) |
Employment Occupations by Sex in Selmont West Selmont
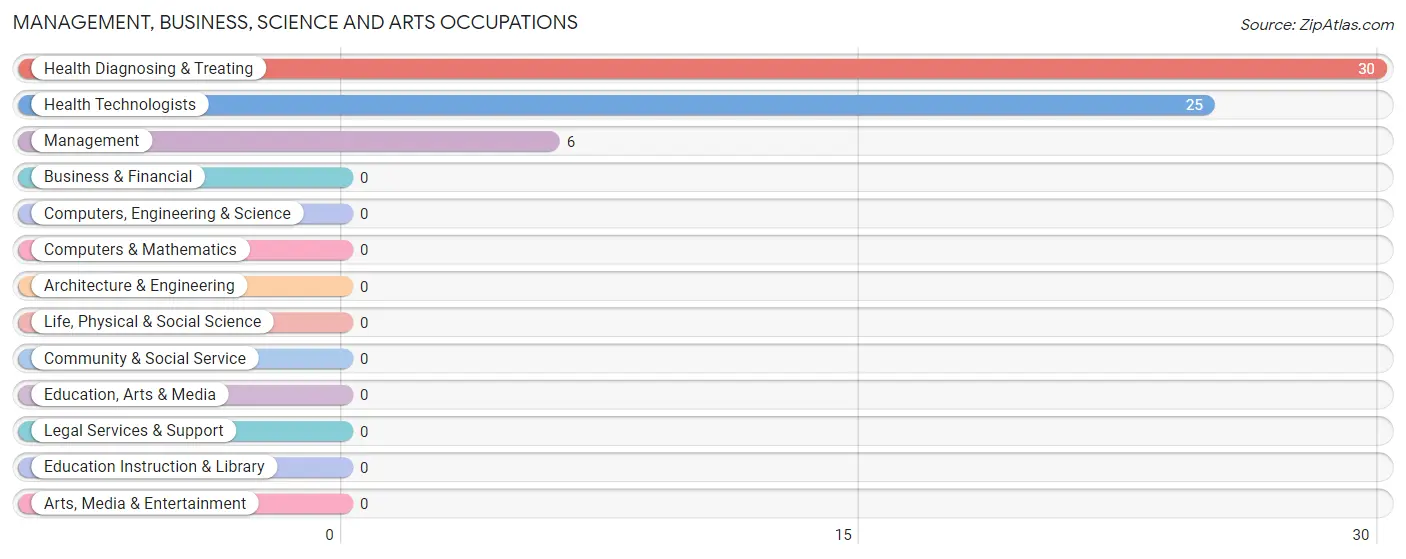
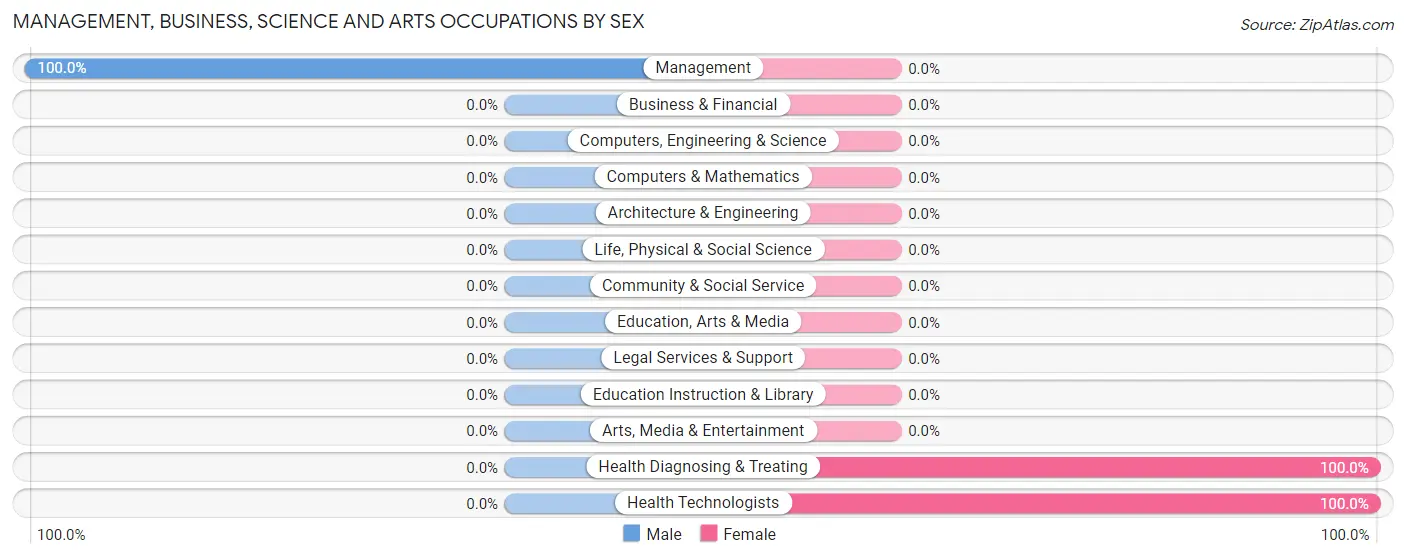
Management, Business, Science and Arts Occupations
The most common Management, Business, Science and Arts occupations in Selmont West Selmont are Health Diagnosing & Treating (30 | 4.0%), Health Technologists (25 | 3.3%), and Management (6 | 0.8%).
Management, Business, Science and Arts Occupations by Sex
| Occupation | Male | Female |
| Management | 6 (100.0%) | 0 (0.0%) |
| Business & Financial | 0 (0.0%) | 0 (0.0%) |
| Computers, Engineering & Science | 0 (0.0%) | 0 (0.0%) |
| Computers & Mathematics | 0 (0.0%) | 0 (0.0%) |
| Architecture & Engineering | 0 (0.0%) | 0 (0.0%) |
| Life, Physical & Social Science | 0 (0.0%) | 0 (0.0%) |
| Community & Social Service | 0 (0.0%) | 0 (0.0%) |
| Education, Arts & Media | 0 (0.0%) | 0 (0.0%) |
| Legal Services & Support | 0 (0.0%) | 0 (0.0%) |
| Education Instruction & Library | 0 (0.0%) | 0 (0.0%) |
| Arts, Media & Entertainment | 0 (0.0%) | 0 (0.0%) |
| Health Diagnosing & Treating | 0 (0.0%) | 30 (100.0%) |
| Health Technologists | 0 (0.0%) | 25 (100.0%) |
| Total (Category) | 6 (16.7%) | 30 (83.3%) |
| Total (Overall) | 221 (29.2%) | 536 (70.8%) |
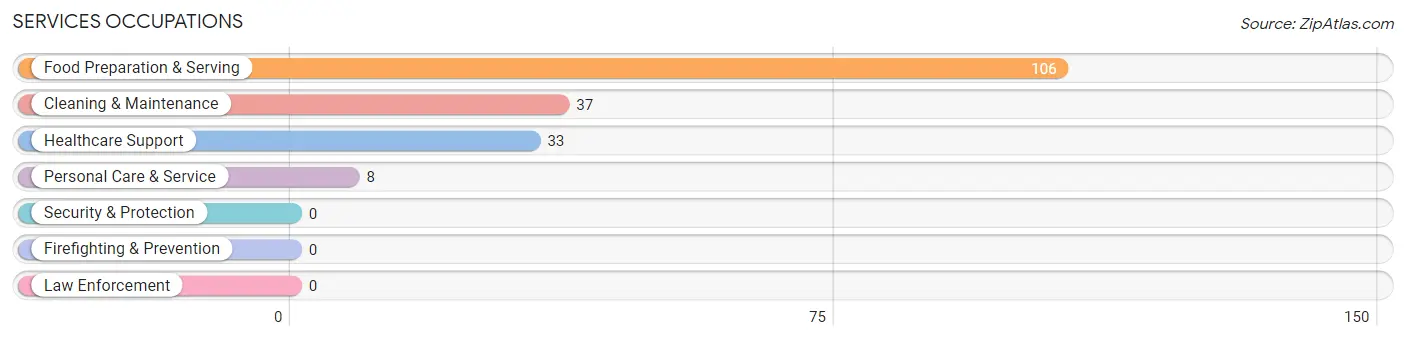
Services Occupations
The most common Services occupations in Selmont West Selmont are Food Preparation & Serving (106 | 14.0%), Cleaning & Maintenance (37 | 4.9%), Healthcare Support (33 | 4.4%), and Personal Care & Service (8 | 1.1%).
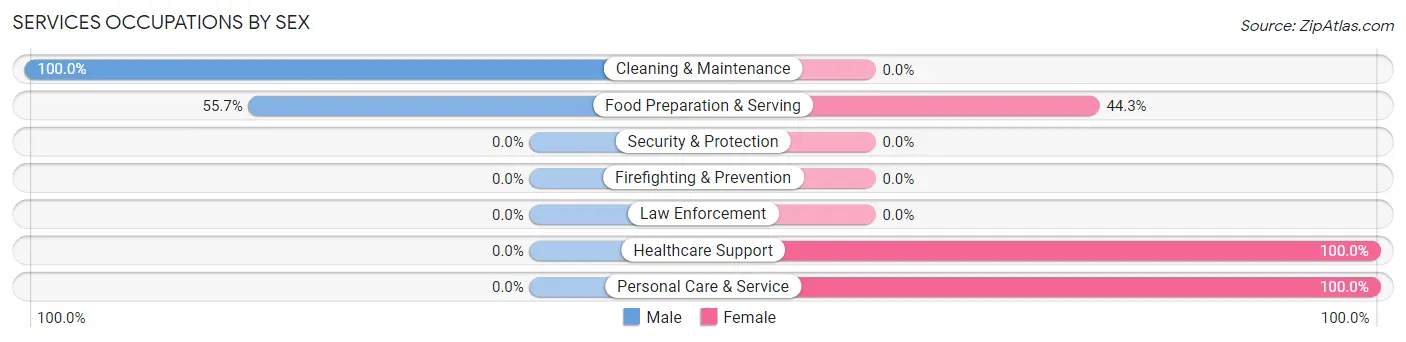
Services Occupations by Sex
Within the Services occupations in Selmont West Selmont, the most male-oriented occupations are Cleaning & Maintenance (100.0%), and Food Preparation & Serving (55.7%), while the most female-oriented occupations are Healthcare Support (100.0%), Personal Care & Service (100.0%), and Food Preparation & Serving (44.3%).
| Occupation | Male | Female |
| Healthcare Support | 0 (0.0%) | 33 (100.0%) |
| Security & Protection | 0 (0.0%) | 0 (0.0%) |
| Firefighting & Prevention | 0 (0.0%) | 0 (0.0%) |
| Law Enforcement | 0 (0.0%) | 0 (0.0%) |
| Food Preparation & Serving | 59 (55.7%) | 47 (44.3%) |
| Cleaning & Maintenance | 37 (100.0%) | 0 (0.0%) |
| Personal Care & Service | 0 (0.0%) | 8 (100.0%) |
| Total (Category) | 96 (52.2%) | 88 (47.8%) |
| Total (Overall) | 221 (29.2%) | 536 (70.8%) |
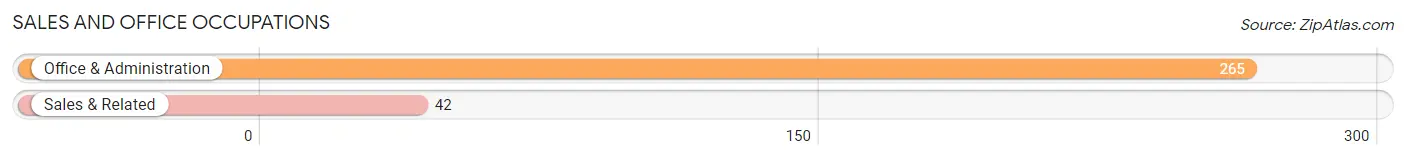
Sales and Office Occupations
The most common Sales and Office occupations in Selmont West Selmont are Office & Administration (265 | 35.0%), and Sales & Related (42 | 5.6%).
Sales and Office Occupations by Sex
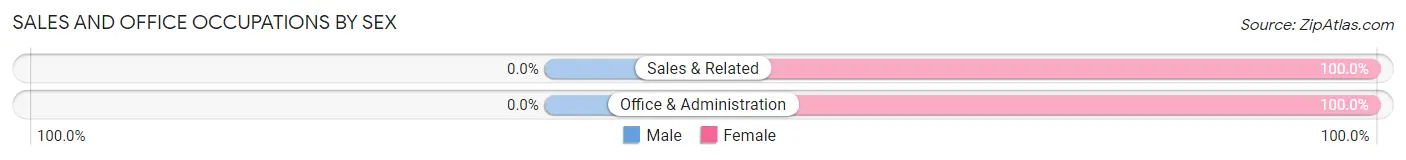
| Occupation | Male | Female |
| Sales & Related | 0 (0.0%) | 42 (100.0%) |
| Office & Administration | 0 (0.0%) | 265 (100.0%) |
| Total (Category) | 0 (0.0%) | 307 (100.0%) |
| Total (Overall) | 221 (29.2%) | 536 (70.8%) |
Natural Resources, Construction and Maintenance Occupations
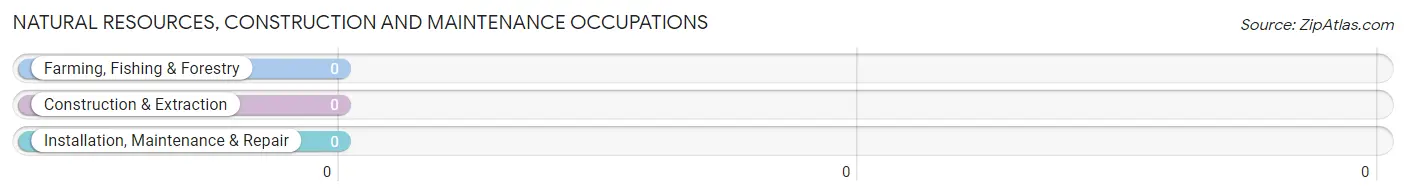
Natural Resources, Construction and Maintenance Occupations by Sex
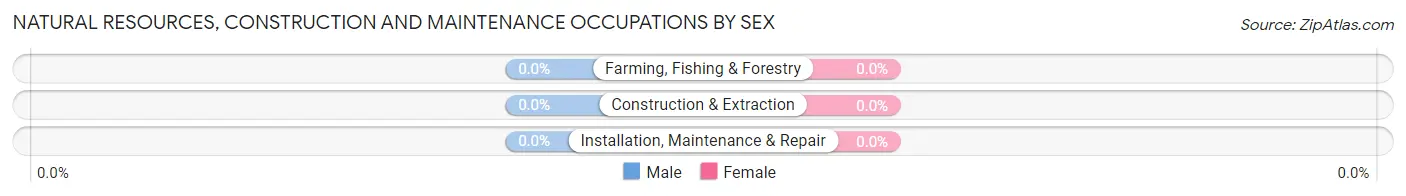
| Occupation | Male | Female |
| Farming, Fishing & Forestry | 0 (0.0%) | 0 (0.0%) |
| Construction & Extraction | 0 (0.0%) | 0 (0.0%) |
| Installation, Maintenance & Repair | 0 (0.0%) | 0 (0.0%) |
| Total (Category) | 0 (0.0%) | 0 (0.0%) |
| Total (Overall) | 221 (29.2%) | 536 (70.8%) |
Production, Transportation and Moving Occupations
The most common Production, Transportation and Moving occupations in Selmont West Selmont are Production (180 | 23.8%), Transportation (36 | 4.8%), and Material Moving (14 | 1.8%).
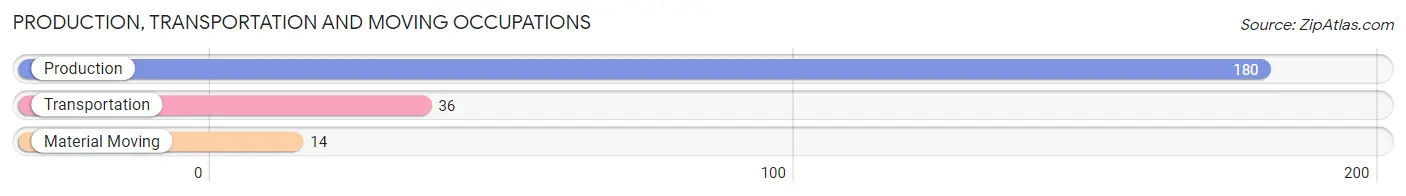
Production, Transportation and Moving Occupations by Sex
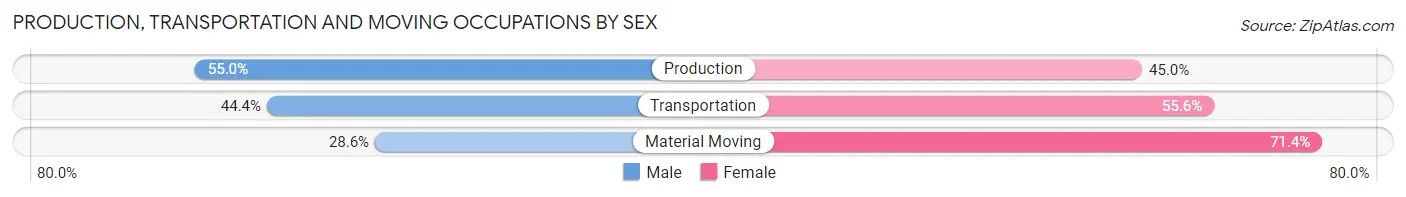
| Occupation | Male | Female |
| Production | 99 (55.0%) | 81 (45.0%) |
| Transportation | 16 (44.4%) | 20 (55.6%) |
| Material Moving | 4 (28.6%) | 10 (71.4%) |
| Total (Category) | 119 (51.7%) | 111 (48.3%) |
| Total (Overall) | 221 (29.2%) | 536 (70.8%) |
Employment Industries by Sex in Selmont West Selmont
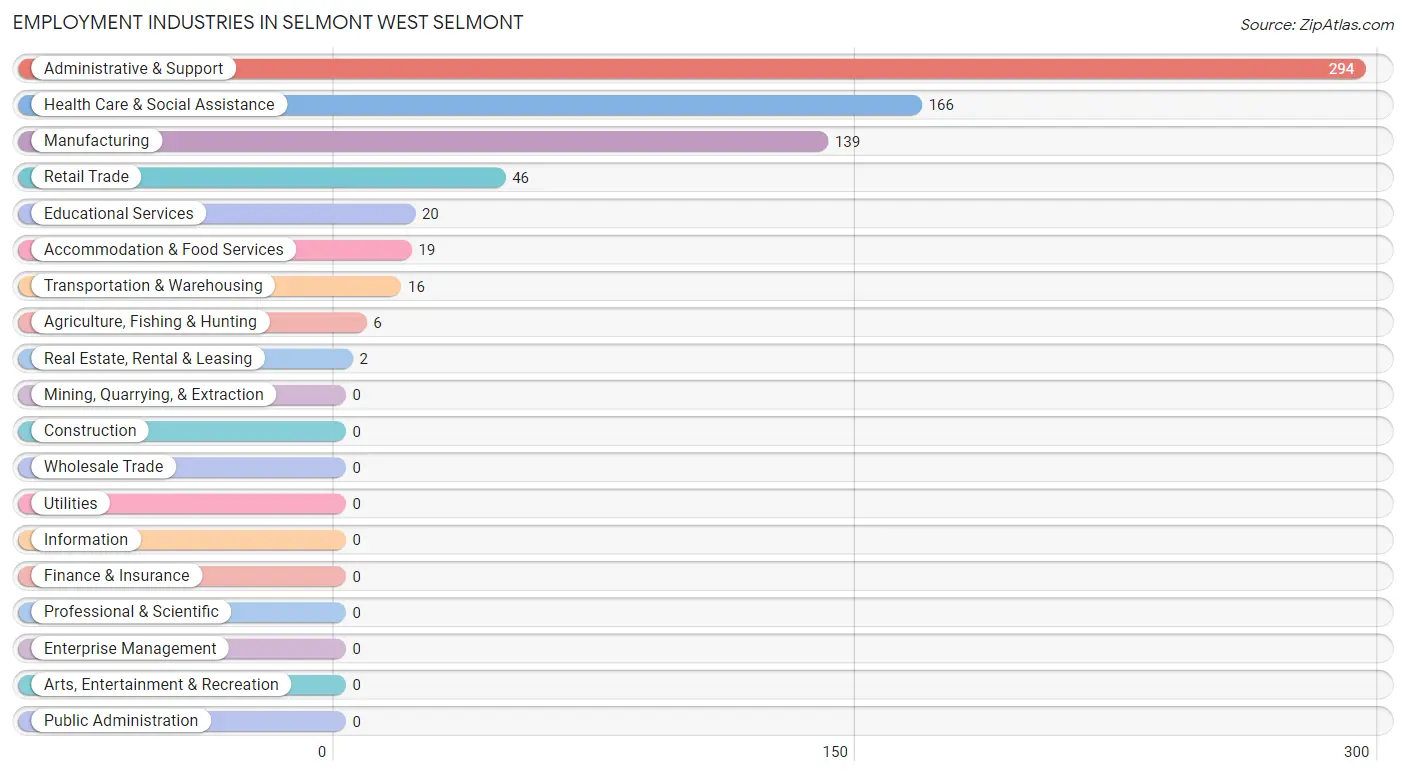
Employment Industries in Selmont West Selmont
The major employment industries in Selmont West Selmont include Administrative & Support (294 | 38.8%), Health Care & Social Assistance (166 | 21.9%), Manufacturing (139 | 18.4%), Retail Trade (46 | 6.1%), and Educational Services (20 | 2.6%).
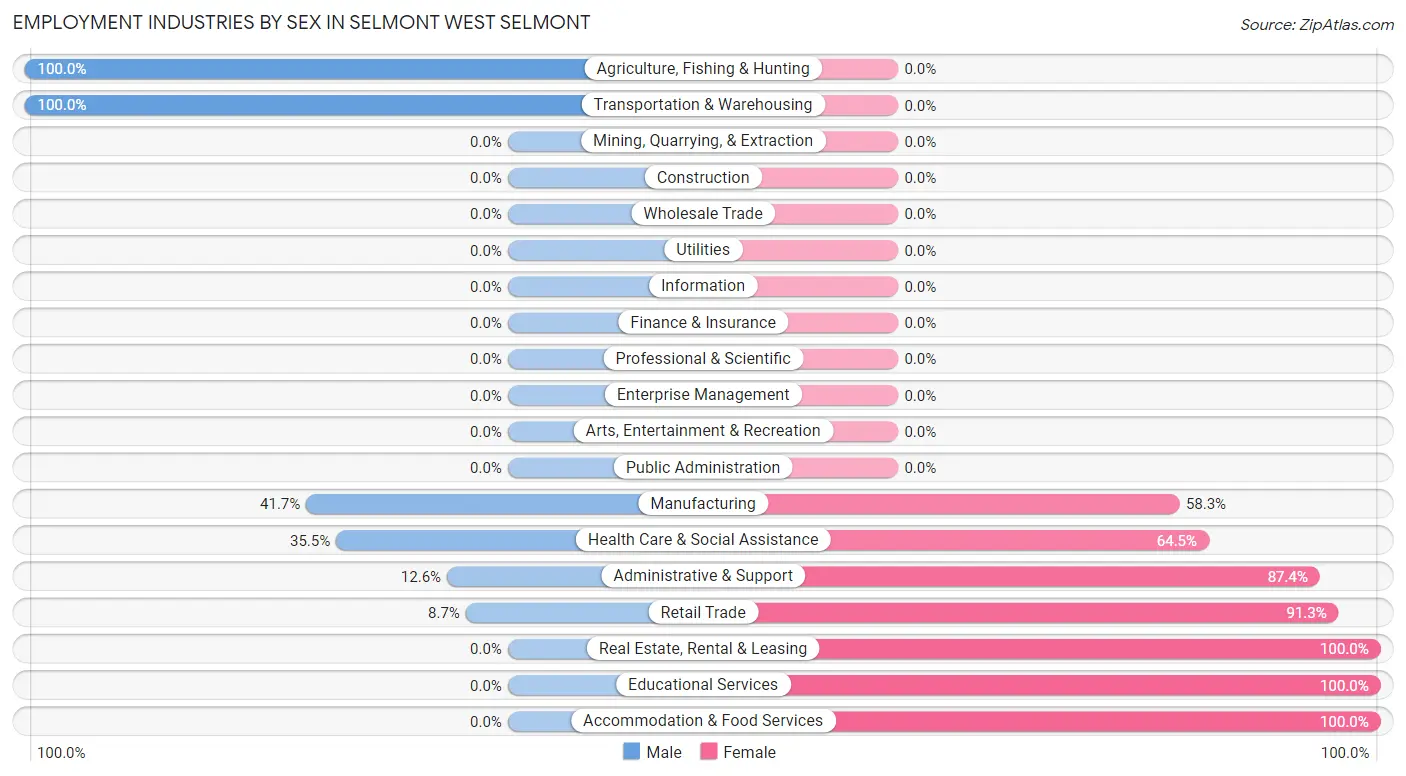
Employment Industries by Sex in Selmont West Selmont
The Selmont West Selmont industries that see more men than women are Agriculture, Fishing & Hunting (100.0%), Transportation & Warehousing (100.0%), and Manufacturing (41.7%), whereas the industries that tend to have a higher number of women are Real Estate, Rental & Leasing (100.0%), Educational Services (100.0%), and Accommodation & Food Services (100.0%).
| Industry | Male | Female |
| Agriculture, Fishing & Hunting | 6 (100.0%) | 0 (0.0%) |
| Mining, Quarrying, & Extraction | 0 (0.0%) | 0 (0.0%) |
| Construction | 0 (0.0%) | 0 (0.0%) |
| Manufacturing | 58 (41.7%) | 81 (58.3%) |
| Wholesale Trade | 0 (0.0%) | 0 (0.0%) |
| Retail Trade | 4 (8.7%) | 42 (91.3%) |
| Transportation & Warehousing | 16 (100.0%) | 0 (0.0%) |
| Utilities | 0 (0.0%) | 0 (0.0%) |
| Information | 0 (0.0%) | 0 (0.0%) |
| Finance & Insurance | 0 (0.0%) | 0 (0.0%) |
| Real Estate, Rental & Leasing | 0 (0.0%) | 2 (100.0%) |
| Professional & Scientific | 0 (0.0%) | 0 (0.0%) |
| Enterprise Management | 0 (0.0%) | 0 (0.0%) |
| Administrative & Support | 37 (12.6%) | 257 (87.4%) |
| Educational Services | 0 (0.0%) | 20 (100.0%) |
| Health Care & Social Assistance | 59 (35.5%) | 107 (64.5%) |
| Arts, Entertainment & Recreation | 0 (0.0%) | 0 (0.0%) |
| Accommodation & Food Services | 0 (0.0%) | 19 (100.0%) |
| Public Administration | 0 (0.0%) | 0 (0.0%) |
| Total | 221 (29.2%) | 536 (70.8%) |
Education in Selmont West Selmont
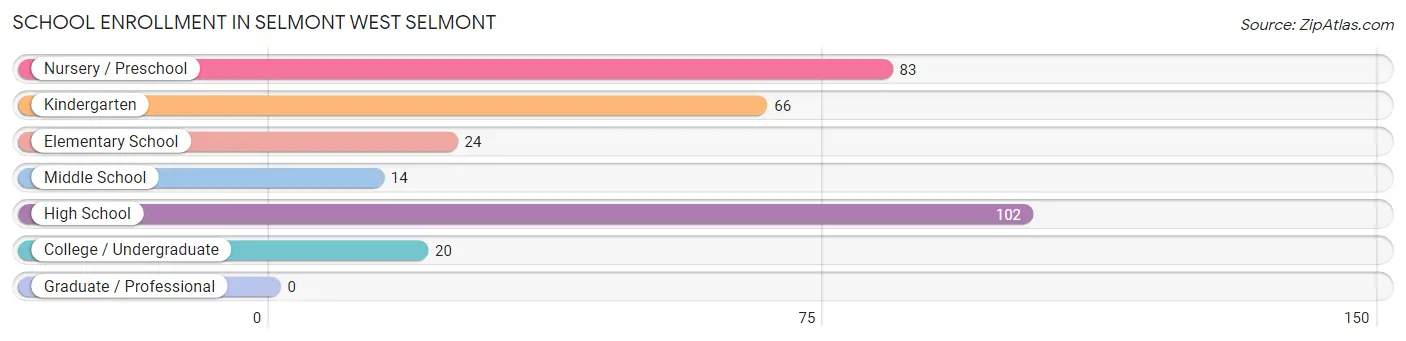
School Enrollment in Selmont West Selmont
The most common levels of schooling among the 309 students in Selmont West Selmont are high school (102 | 33.0%), nursery / preschool (83 | 26.9%), and kindergarten (66 | 21.4%).
| School Level | # Students | % Students |
| Nursery / Preschool | 83 | 26.9% |
| Kindergarten | 66 | 21.4% |
| Elementary School | 24 | 7.8% |
| Middle School | 14 | 4.5% |
| High School | 102 | 33.0% |
| College / Undergraduate | 20 | 6.5% |
| Graduate / Professional | 0 | 0.0% |
| Total | 309 | 100.0% |
School Enrollment by Age by Funding Source in Selmont West Selmont
Out of a total of 309 students who are enrolled in schools in Selmont West Selmont, 120 (38.8%) attend a private institution, while the remaining 189 (61.2%) are enrolled in public schools. The age group of 35 years and over has the highest likelihood of being enrolled in private schools, with 4 (100.0% in the age bracket) enrolled. Conversely, the age group of 10 to 14 year olds has the lowest likelihood of being enrolled in a private school, with 38 (100.0% in the age bracket) attending a public institution.
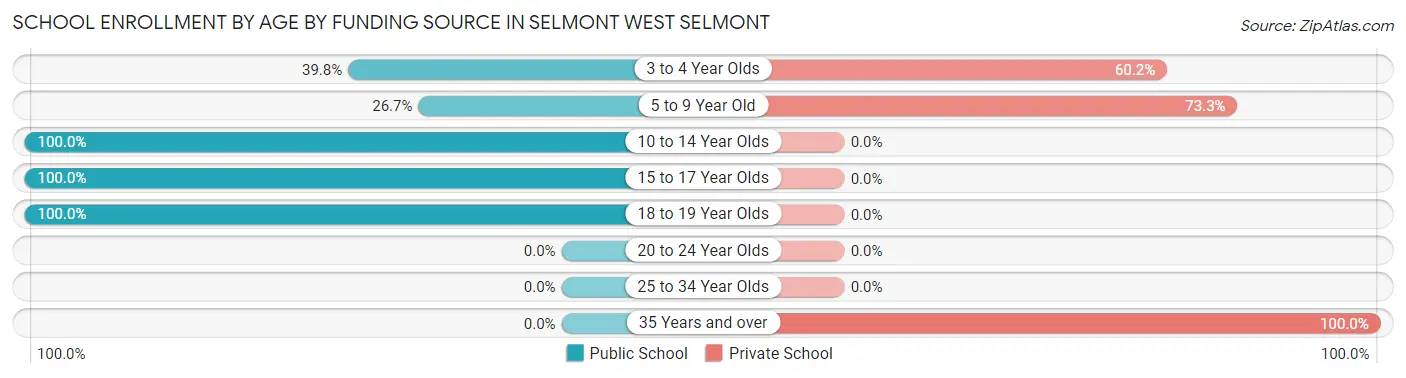
| Age Bracket | Public School | Private School |
| 3 to 4 Year Olds | 33 (39.8%) | 50 (60.2%) |
| 5 to 9 Year Old | 24 (26.7%) | 66 (73.3%) |
| 10 to 14 Year Olds | 38 (100.0%) | 0 (0.0%) |
| 15 to 17 Year Olds | 69 (100.0%) | 0 (0.0%) |
| 18 to 19 Year Olds | 25 (100.0%) | 0 (0.0%) |
| 20 to 24 Year Olds | 0 (0.0%) | 0 (0.0%) |
| 25 to 34 Year Olds | 0 (0.0%) | 0 (0.0%) |
| 35 Years and over | 0 (0.0%) | 4 (100.0%) |
| Total | 189 (61.2%) | 120 (38.8%) |
Educational Attainment by Field of Study in Selmont West Selmont
Science & technology (230 | 89.8%), bio, nature & agricultural (11 | 4.3%), social sciences (9 | 3.5%), and psychology (6 | 2.3%) are the most common fields of study among 256 individuals in Selmont West Selmont who have obtained a bachelor's degree or higher.
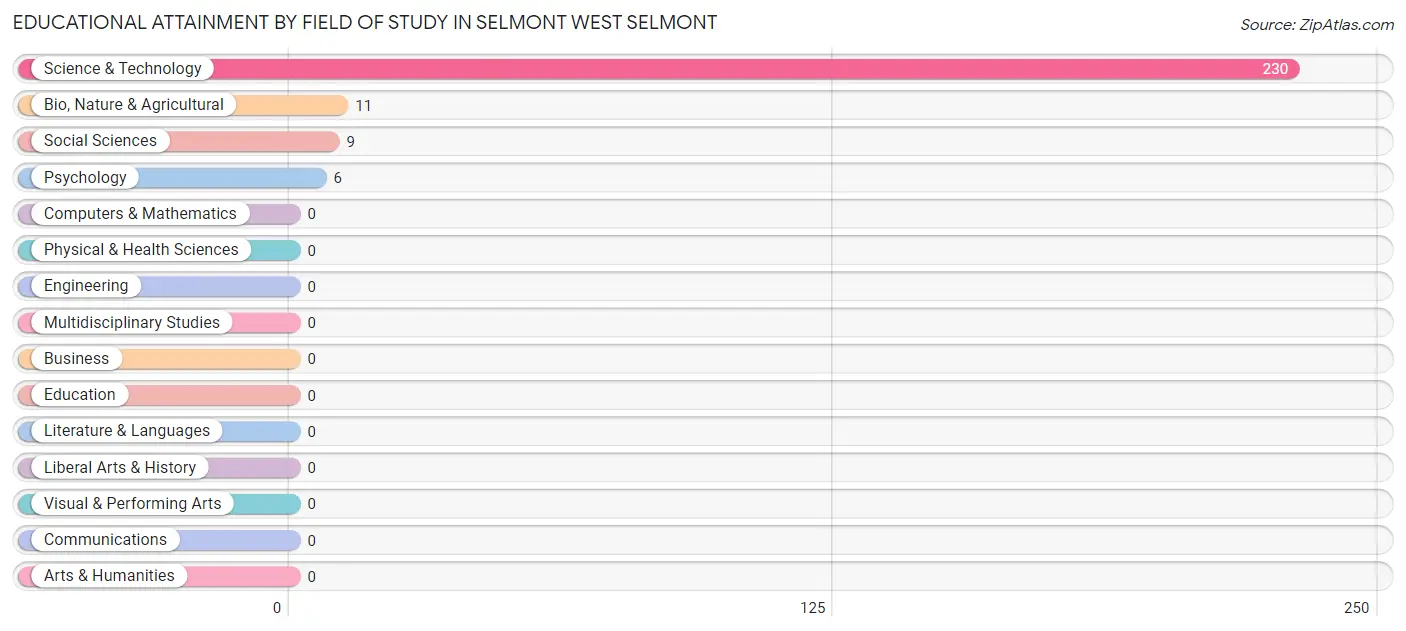
| Field of Study | # Graduates | % Graduates |
| Computers & Mathematics | 0 | 0.0% |
| Bio, Nature & Agricultural | 11 | 4.3% |
| Physical & Health Sciences | 0 | 0.0% |
| Psychology | 6 | 2.3% |
| Social Sciences | 9 | 3.5% |
| Engineering | 0 | 0.0% |
| Multidisciplinary Studies | 0 | 0.0% |
| Science & Technology | 230 | 89.8% |
| Business | 0 | 0.0% |
| Education | 0 | 0.0% |
| Literature & Languages | 0 | 0.0% |
| Liberal Arts & History | 0 | 0.0% |
| Visual & Performing Arts | 0 | 0.0% |
| Communications | 0 | 0.0% |
| Arts & Humanities | 0 | 0.0% |
| Total | 256 | 100.0% |
Transportation & Commute in Selmont West Selmont
Vehicle Availability by Sex in Selmont West Selmont
The most prevalent vehicle ownership categories in Selmont West Selmont are males with 2 vehicles (62, accounting for 33.7%) and females with 2 vehicles (377, making up 11.6%).
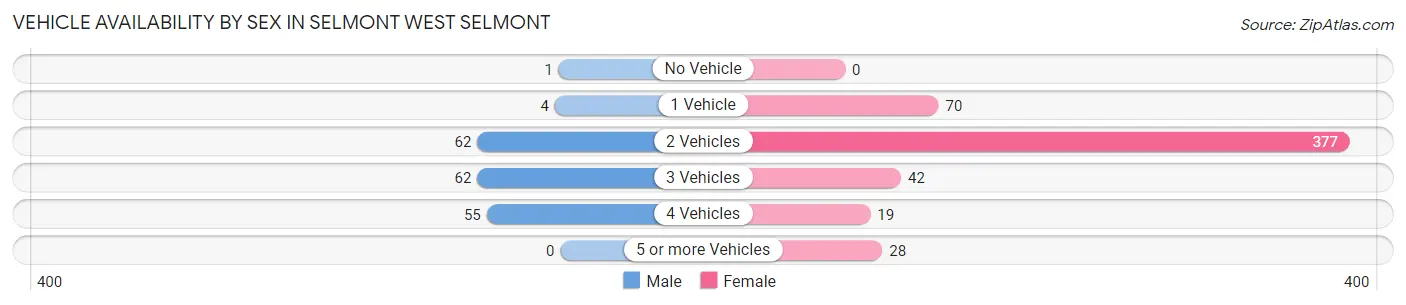
| Vehicles Available | Male | Female |
| No Vehicle | 1 (0.5%) | 0 (0.0%) |
| 1 Vehicle | 4 (2.2%) | 70 (13.1%) |
| 2 Vehicles | 62 (33.7%) | 377 (70.3%) |
| 3 Vehicles | 62 (33.7%) | 42 (7.8%) |
| 4 Vehicles | 55 (29.9%) | 19 (3.5%) |
| 5 or more Vehicles | 0 (0.0%) | 28 (5.2%) |
| Total | 184 (100.0%) | 536 (100.0%) |
Commute Time in Selmont West Selmont
The most frequently occuring commute durations in Selmont West Selmont are 60 to 89 minutes (254 commuters, 35.3%), 15 to 19 minutes (212 commuters, 29.4%), and 20 to 24 minutes (120 commuters, 16.7%).
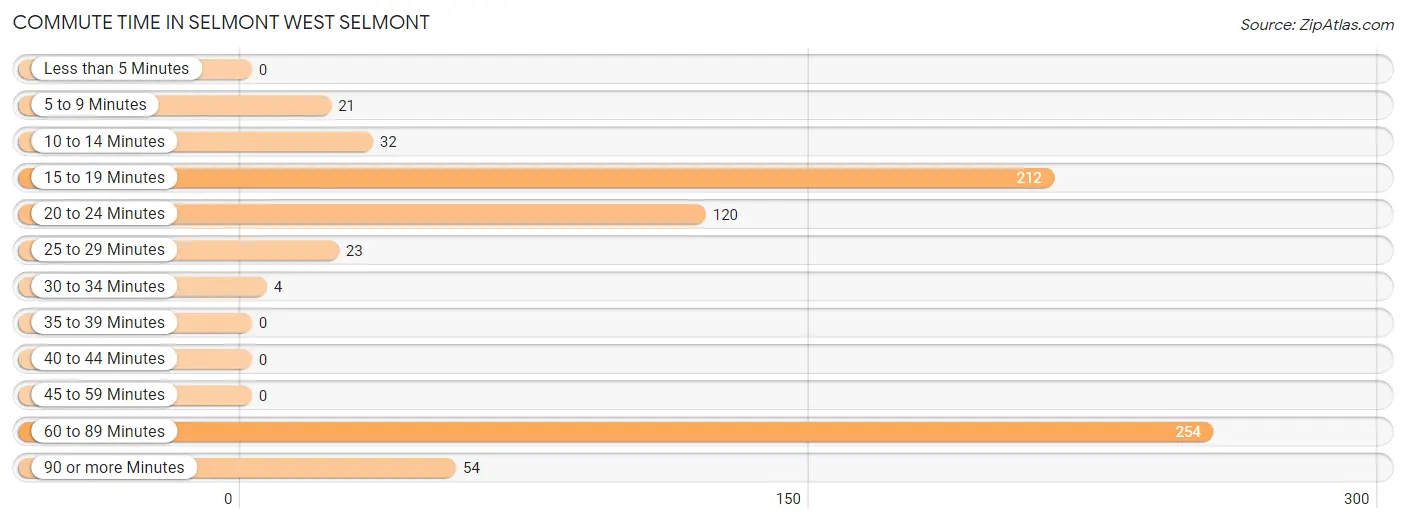
| Commute Time | # Commuters | % Commuters |
| Less than 5 Minutes | 0 | 0.0% |
| 5 to 9 Minutes | 21 | 2.9% |
| 10 to 14 Minutes | 32 | 4.4% |
| 15 to 19 Minutes | 212 | 29.4% |
| 20 to 24 Minutes | 120 | 16.7% |
| 25 to 29 Minutes | 23 | 3.2% |
| 30 to 34 Minutes | 4 | 0.6% |
| 35 to 39 Minutes | 0 | 0.0% |
| 40 to 44 Minutes | 0 | 0.0% |
| 45 to 59 Minutes | 0 | 0.0% |
| 60 to 89 Minutes | 254 | 35.3% |
| 90 or more Minutes | 54 | 7.5% |
Commute Time by Sex in Selmont West Selmont
The most common commute times in Selmont West Selmont are 20 to 24 minutes (81 commuters, 44.0%) for males and 60 to 89 minutes (241 commuters, 45.0%) for females.
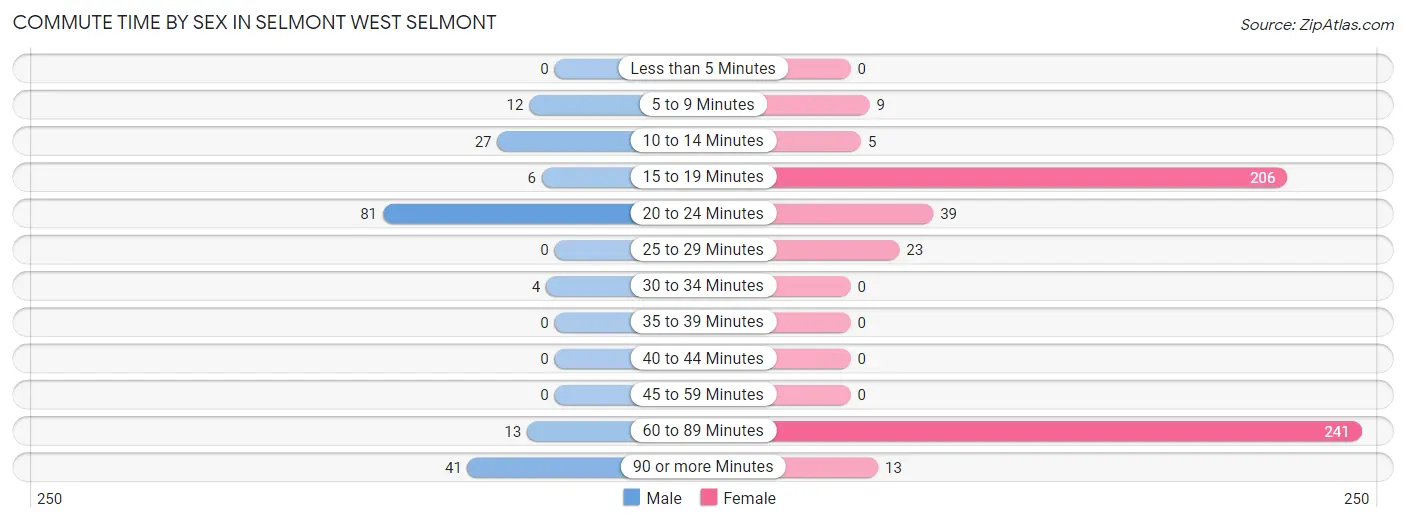
| Commute Time | Male | Female |
| Less than 5 Minutes | 0 (0.0%) | 0 (0.0%) |
| 5 to 9 Minutes | 12 (6.5%) | 9 (1.7%) |
| 10 to 14 Minutes | 27 (14.7%) | 5 (0.9%) |
| 15 to 19 Minutes | 6 (3.3%) | 206 (38.4%) |
| 20 to 24 Minutes | 81 (44.0%) | 39 (7.3%) |
| 25 to 29 Minutes | 0 (0.0%) | 23 (4.3%) |
| 30 to 34 Minutes | 4 (2.2%) | 0 (0.0%) |
| 35 to 39 Minutes | 0 (0.0%) | 0 (0.0%) |
| 40 to 44 Minutes | 0 (0.0%) | 0 (0.0%) |
| 45 to 59 Minutes | 0 (0.0%) | 0 (0.0%) |
| 60 to 89 Minutes | 13 (7.1%) | 241 (45.0%) |
| 90 or more Minutes | 41 (22.3%) | 13 (2.4%) |
Time of Departure to Work by Sex in Selmont West Selmont
The most frequent times of departure to work in Selmont West Selmont are 7:30 AM to 7:59 AM (72, 39.1%) for males and 8:30 AM to 8:59 AM (287, 53.5%) for females.
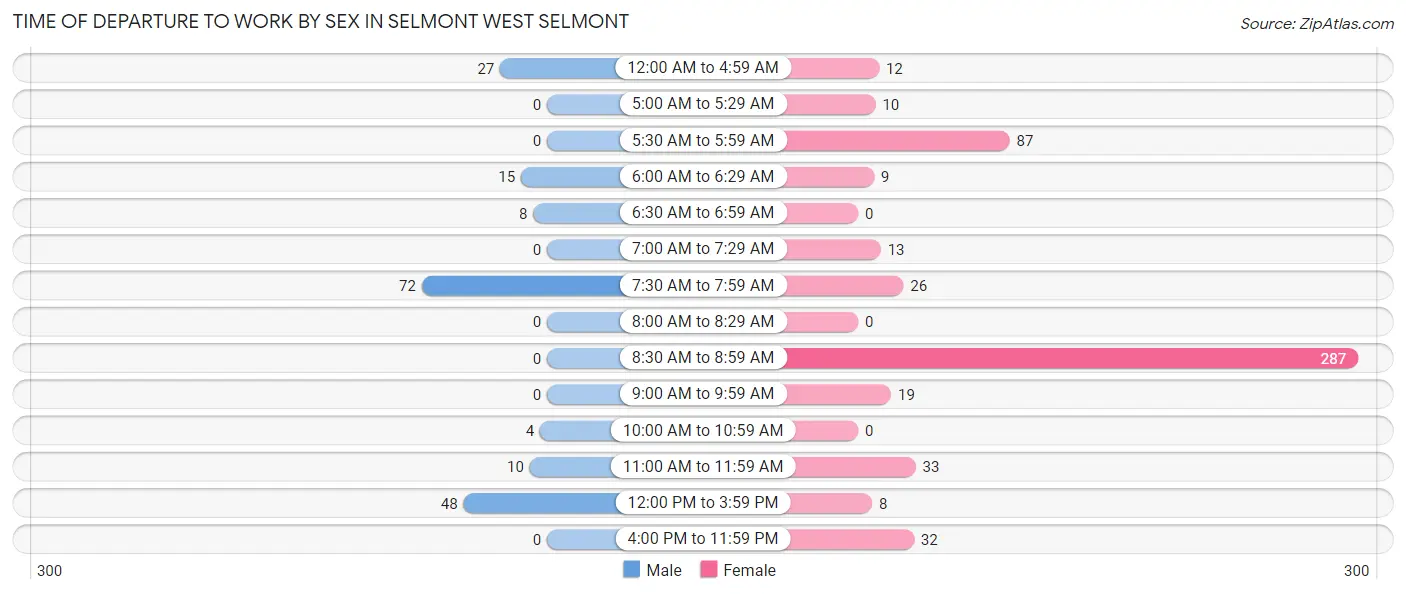
| Time of Departure | Male | Female |
| 12:00 AM to 4:59 AM | 27 (14.7%) | 12 (2.2%) |
| 5:00 AM to 5:29 AM | 0 (0.0%) | 10 (1.9%) |
| 5:30 AM to 5:59 AM | 0 (0.0%) | 87 (16.2%) |
| 6:00 AM to 6:29 AM | 15 (8.2%) | 9 (1.7%) |
| 6:30 AM to 6:59 AM | 8 (4.3%) | 0 (0.0%) |
| 7:00 AM to 7:29 AM | 0 (0.0%) | 13 (2.4%) |
| 7:30 AM to 7:59 AM | 72 (39.1%) | 26 (4.9%) |
| 8:00 AM to 8:29 AM | 0 (0.0%) | 0 (0.0%) |
| 8:30 AM to 8:59 AM | 0 (0.0%) | 287 (53.5%) |
| 9:00 AM to 9:59 AM | 0 (0.0%) | 19 (3.5%) |
| 10:00 AM to 10:59 AM | 4 (2.2%) | 0 (0.0%) |
| 11:00 AM to 11:59 AM | 10 (5.4%) | 33 (6.2%) |
| 12:00 PM to 3:59 PM | 48 (26.1%) | 8 (1.5%) |
| 4:00 PM to 11:59 PM | 0 (0.0%) | 32 (6.0%) |
| Total | 184 (100.0%) | 536 (100.0%) |
Housing Occupancy in Selmont West Selmont
Occupancy by Ownership in Selmont West Selmont
Of the total 585 dwellings in Selmont West Selmont, owner-occupied units account for 499 (85.3%), while renter-occupied units make up 86 (14.7%).
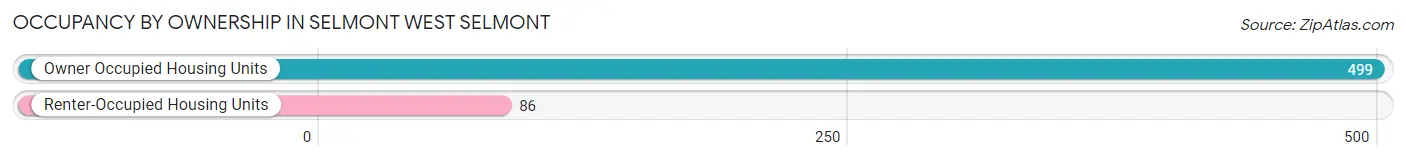
| Occupancy | # Housing Units | % Housing Units |
| Owner Occupied Housing Units | 499 | 85.3% |
| Renter-Occupied Housing Units | 86 | 14.7% |
| Total Occupied Housing Units | 585 | 100.0% |
Occupancy by Household Size in Selmont West Selmont
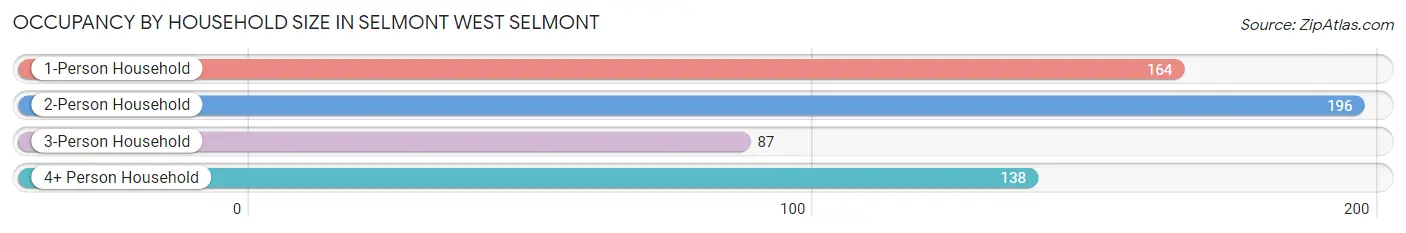
| Household Size | # Housing Units | % Housing Units |
| 1-Person Household | 164 | 28.0% |
| 2-Person Household | 196 | 33.5% |
| 3-Person Household | 87 | 14.9% |
| 4+ Person Household | 138 | 23.6% |
| Total Housing Units | 585 | 100.0% |
Occupancy by Ownership by Household Size in Selmont West Selmont
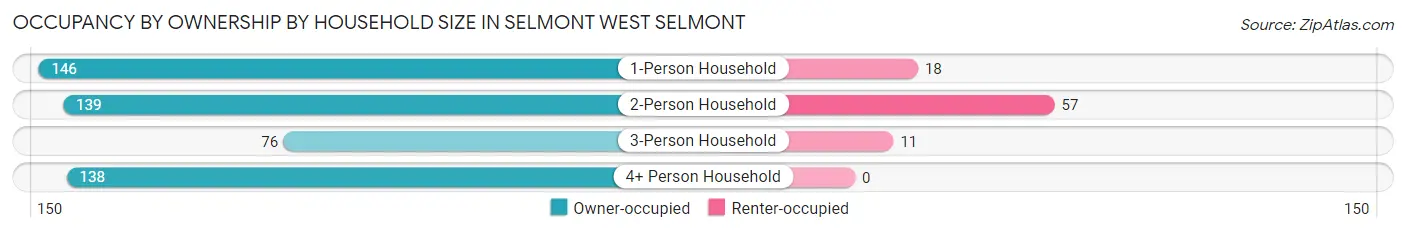
| Household Size | Owner-occupied | Renter-occupied |
| 1-Person Household | 146 (89.0%) | 18 (11.0%) |
| 2-Person Household | 139 (70.9%) | 57 (29.1%) |
| 3-Person Household | 76 (87.4%) | 11 (12.6%) |
| 4+ Person Household | 138 (100.0%) | 0 (0.0%) |
| Total Housing Units | 499 (85.3%) | 86 (14.7%) |
Occupancy by Educational Attainment in Selmont West Selmont
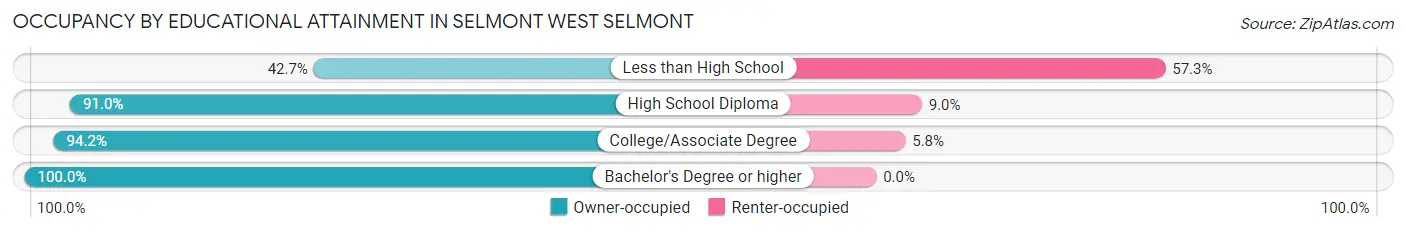
| Household Size | Owner-occupied | Renter-occupied |
| Less than High School | 35 (42.7%) | 47 (57.3%) |
| High School Diploma | 302 (91.0%) | 30 (9.0%) |
| College/Associate Degree | 147 (94.2%) | 9 (5.8%) |
| Bachelor's Degree or higher | 15 (100.0%) | 0 (0.0%) |
Occupancy by Age of Householder in Selmont West Selmont
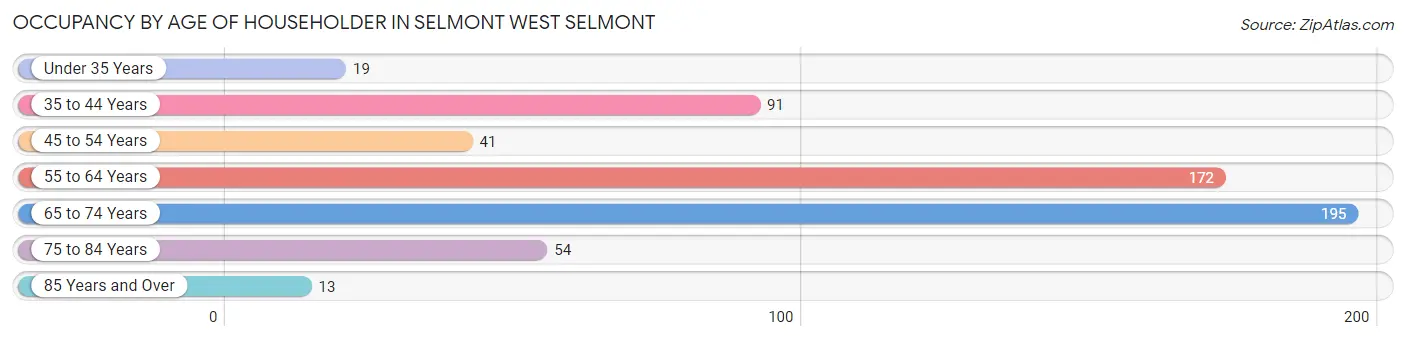
| Age Bracket | # Households | % Households |
| Under 35 Years | 19 | 3.3% |
| 35 to 44 Years | 91 | 15.6% |
| 45 to 54 Years | 41 | 7.0% |
| 55 to 64 Years | 172 | 29.4% |
| 65 to 74 Years | 195 | 33.3% |
| 75 to 84 Years | 54 | 9.2% |
| 85 Years and Over | 13 | 2.2% |
| Total | 585 | 100.0% |
Housing Finances in Selmont West Selmont
Median Income by Occupancy in Selmont West Selmont
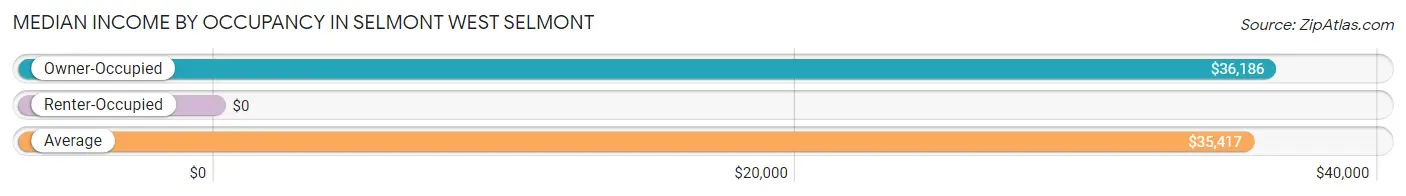
| Occupancy Type | # Households | Median Income |
| Owner-Occupied | 499 (85.3%) | $36,186 |
| Renter-Occupied | 86 (14.7%) | $0 |
| Average | 585 (100.0%) | $35,417 |
Occupancy by Householder Income Bracket in Selmont West Selmont
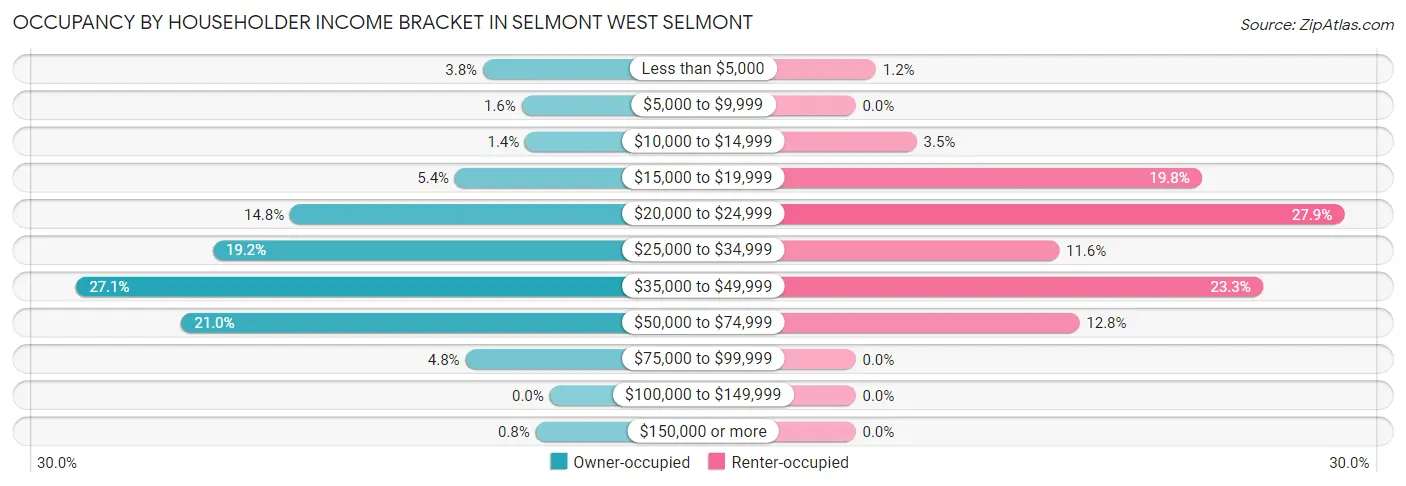
| Income Bracket | Owner-occupied | Renter-occupied |
| Less than $5,000 | 19 (3.8%) | 1 (1.2%) |
| $5,000 to $9,999 | 8 (1.6%) | 0 (0.0%) |
| $10,000 to $14,999 | 7 (1.4%) | 3 (3.5%) |
| $15,000 to $19,999 | 27 (5.4%) | 17 (19.8%) |
| $20,000 to $24,999 | 74 (14.8%) | 24 (27.9%) |
| $25,000 to $34,999 | 96 (19.2%) | 10 (11.6%) |
| $35,000 to $49,999 | 135 (27.1%) | 20 (23.3%) |
| $50,000 to $74,999 | 105 (21.0%) | 11 (12.8%) |
| $75,000 to $99,999 | 24 (4.8%) | 0 (0.0%) |
| $100,000 to $149,999 | 0 (0.0%) | 0 (0.0%) |
| $150,000 or more | 4 (0.8%) | 0 (0.0%) |
| Total | 499 (100.0%) | 86 (100.0%) |
Monthly Housing Cost Tiers in Selmont West Selmont
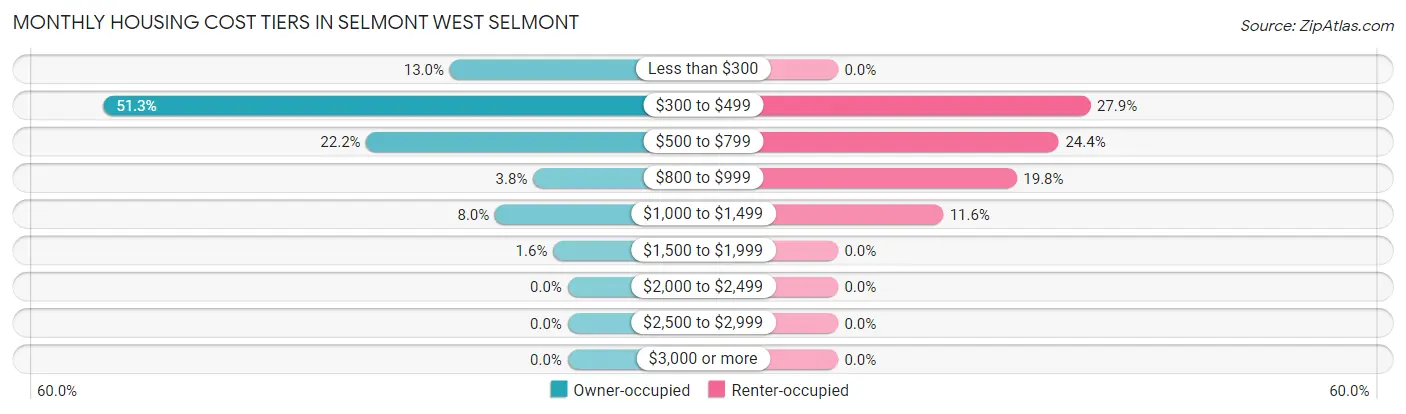
| Monthly Cost | Owner-occupied | Renter-occupied |
| Less than $300 | 65 (13.0%) | 0 (0.0%) |
| $300 to $499 | 256 (51.3%) | 24 (27.9%) |
| $500 to $799 | 111 (22.2%) | 21 (24.4%) |
| $800 to $999 | 19 (3.8%) | 17 (19.8%) |
| $1,000 to $1,499 | 40 (8.0%) | 10 (11.6%) |
| $1,500 to $1,999 | 8 (1.6%) | 0 (0.0%) |
| $2,000 to $2,499 | 0 (0.0%) | 0 (0.0%) |
| $2,500 to $2,999 | 0 (0.0%) | 0 (0.0%) |
| $3,000 or more | 0 (0.0%) | 0 (0.0%) |
| Total | 499 (100.0%) | 86 (100.0%) |
Physical Housing Characteristics in Selmont West Selmont
Housing Structures in Selmont West Selmont
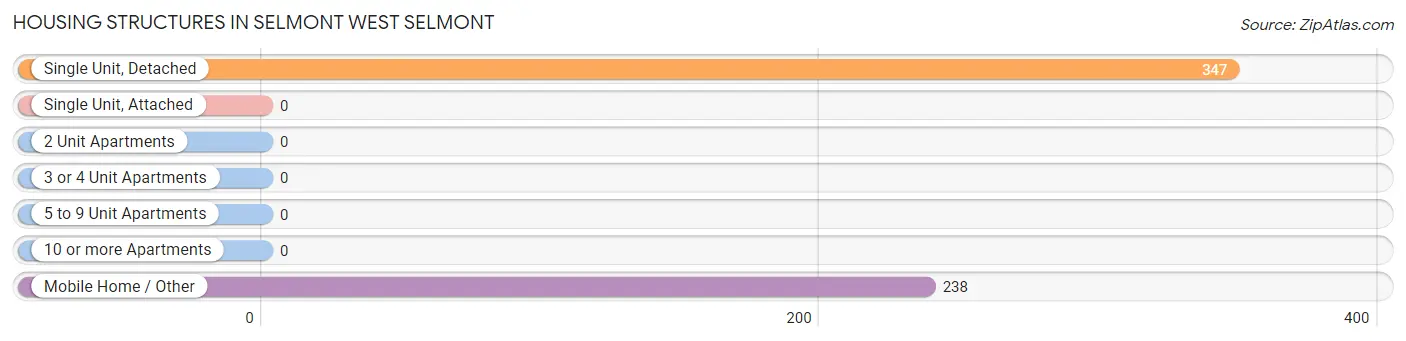
| Structure Type | # Housing Units | % Housing Units |
| Single Unit, Detached | 347 | 59.3% |
| Single Unit, Attached | 0 | 0.0% |
| 2 Unit Apartments | 0 | 0.0% |
| 3 or 4 Unit Apartments | 0 | 0.0% |
| 5 to 9 Unit Apartments | 0 | 0.0% |
| 10 or more Apartments | 0 | 0.0% |
| Mobile Home / Other | 238 | 40.7% |
| Total | 585 | 100.0% |
Housing Structures by Occupancy in Selmont West Selmont
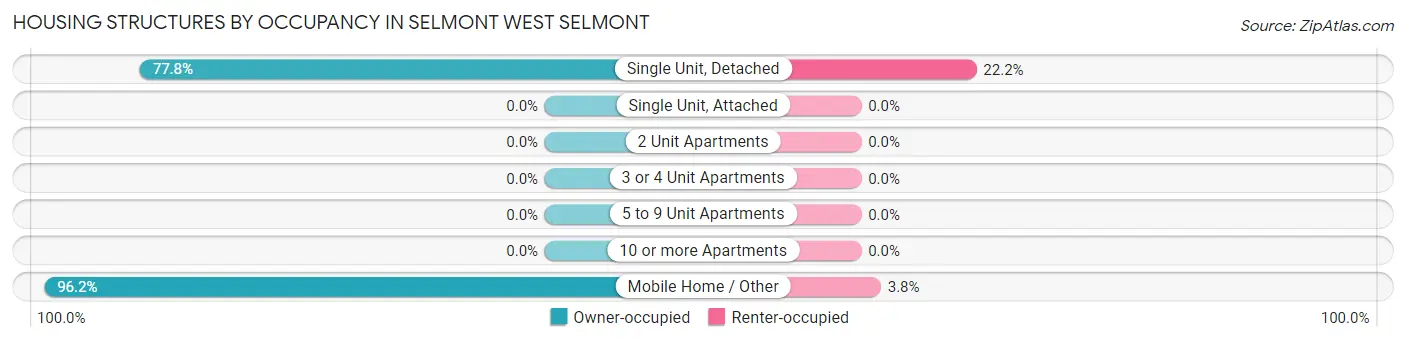
| Structure Type | Owner-occupied | Renter-occupied |
| Single Unit, Detached | 270 (77.8%) | 77 (22.2%) |
| Single Unit, Attached | 0 (0.0%) | 0 (0.0%) |
| 2 Unit Apartments | 0 (0.0%) | 0 (0.0%) |
| 3 or 4 Unit Apartments | 0 (0.0%) | 0 (0.0%) |
| 5 to 9 Unit Apartments | 0 (0.0%) | 0 (0.0%) |
| 10 or more Apartments | 0 (0.0%) | 0 (0.0%) |
| Mobile Home / Other | 229 (96.2%) | 9 (3.8%) |
| Total | 499 (85.3%) | 86 (14.7%) |
Housing Structures by Number of Rooms in Selmont West Selmont
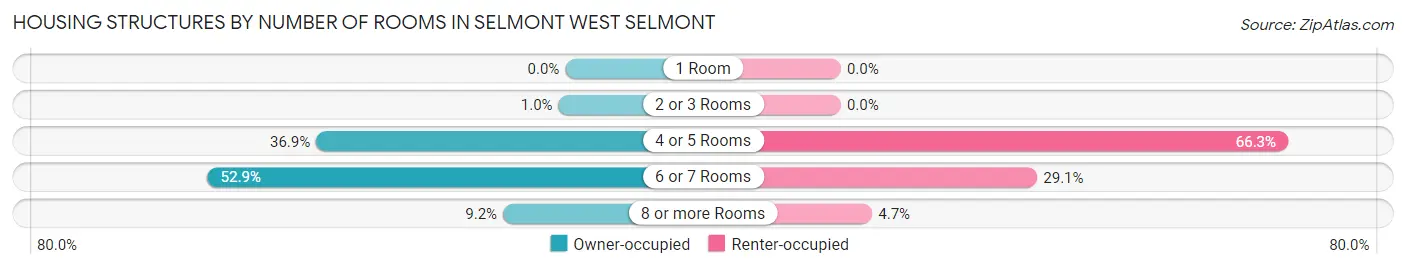
| Number of Rooms | Owner-occupied | Renter-occupied |
| 1 Room | 0 (0.0%) | 0 (0.0%) |
| 2 or 3 Rooms | 5 (1.0%) | 0 (0.0%) |
| 4 or 5 Rooms | 184 (36.9%) | 57 (66.3%) |
| 6 or 7 Rooms | 264 (52.9%) | 25 (29.1%) |
| 8 or more Rooms | 46 (9.2%) | 4 (4.6%) |
| Total | 499 (100.0%) | 86 (100.0%) |
Housing Structure by Heating Type in Selmont West Selmont
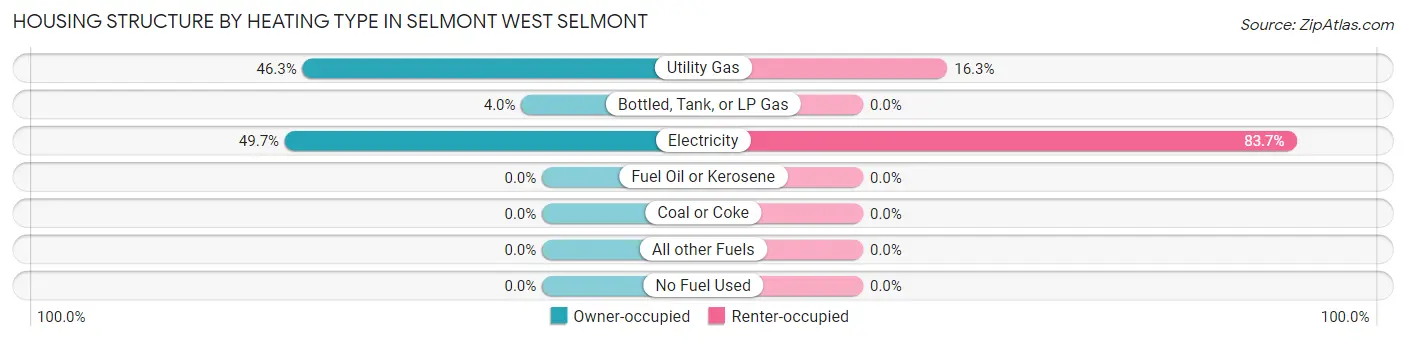
| Heating Type | Owner-occupied | Renter-occupied |
| Utility Gas | 231 (46.3%) | 14 (16.3%) |
| Bottled, Tank, or LP Gas | 20 (4.0%) | 0 (0.0%) |
| Electricity | 248 (49.7%) | 72 (83.7%) |
| Fuel Oil or Kerosene | 0 (0.0%) | 0 (0.0%) |
| Coal or Coke | 0 (0.0%) | 0 (0.0%) |
| All other Fuels | 0 (0.0%) | 0 (0.0%) |
| No Fuel Used | 0 (0.0%) | 0 (0.0%) |
| Total | 499 (100.0%) | 86 (100.0%) |
Household Vehicle Usage in Selmont West Selmont
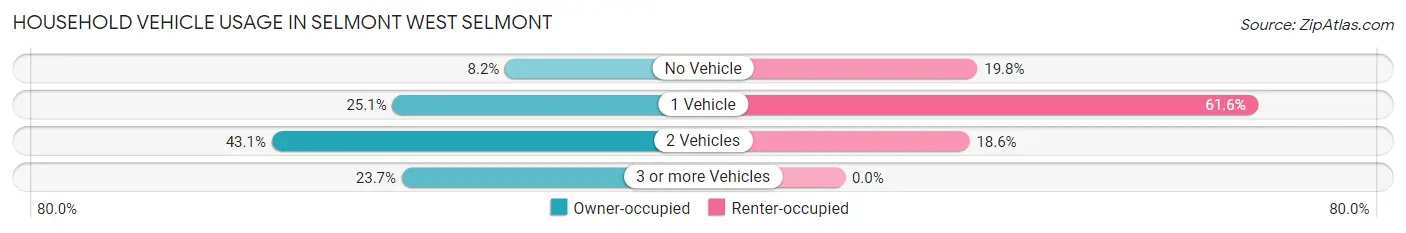
| Vehicles per Household | Owner-occupied | Renter-occupied |
| No Vehicle | 41 (8.2%) | 17 (19.8%) |
| 1 Vehicle | 125 (25.1%) | 53 (61.6%) |
| 2 Vehicles | 215 (43.1%) | 16 (18.6%) |
| 3 or more Vehicles | 118 (23.6%) | 0 (0.0%) |
| Total | 499 (100.0%) | 86 (100.0%) |
Real Estate & Mortgages in Selmont West Selmont
Real Estate and Mortgage Overview in Selmont West Selmont
| Characteristic | Without Mortgage | With Mortgage |
| Housing Units | 393 | 106 |
| Median Property Value | $47,900 | $54,400 |
| Median Household Income | $32,146 | $4 |
| Monthly Housing Costs | $409 | $0 |
| Real Estate Taxes | $241 | $15 |
Property Value by Mortgage Status in Selmont West Selmont
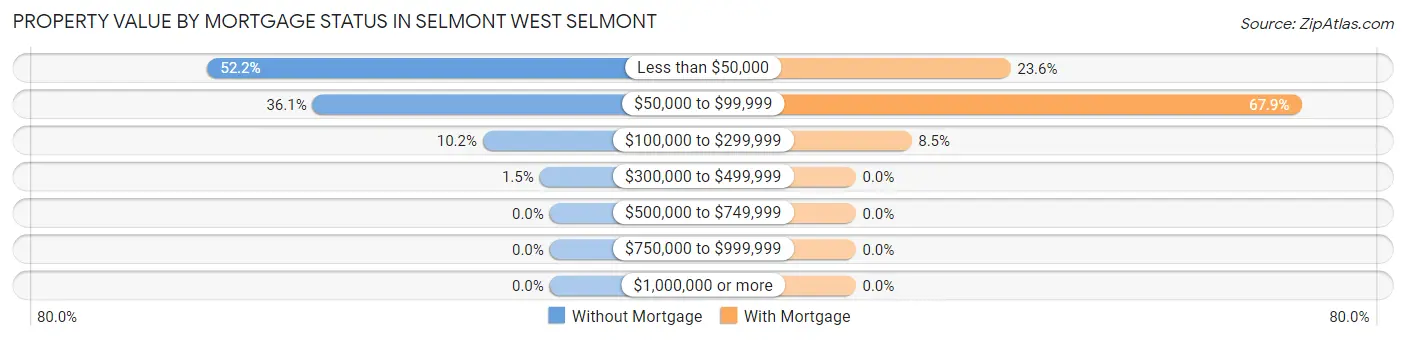
| Property Value | Without Mortgage | With Mortgage |
| Less than $50,000 | 205 (52.2%) | 25 (23.6%) |
| $50,000 to $99,999 | 142 (36.1%) | 72 (67.9%) |
| $100,000 to $299,999 | 40 (10.2%) | 9 (8.5%) |
| $300,000 to $499,999 | 6 (1.5%) | 0 (0.0%) |
| $500,000 to $749,999 | 0 (0.0%) | 0 (0.0%) |
| $750,000 to $999,999 | 0 (0.0%) | 0 (0.0%) |
| $1,000,000 or more | 0 (0.0%) | 0 (0.0%) |
| Total | 393 (100.0%) | 106 (100.0%) |
Household Income by Mortgage Status in Selmont West Selmont
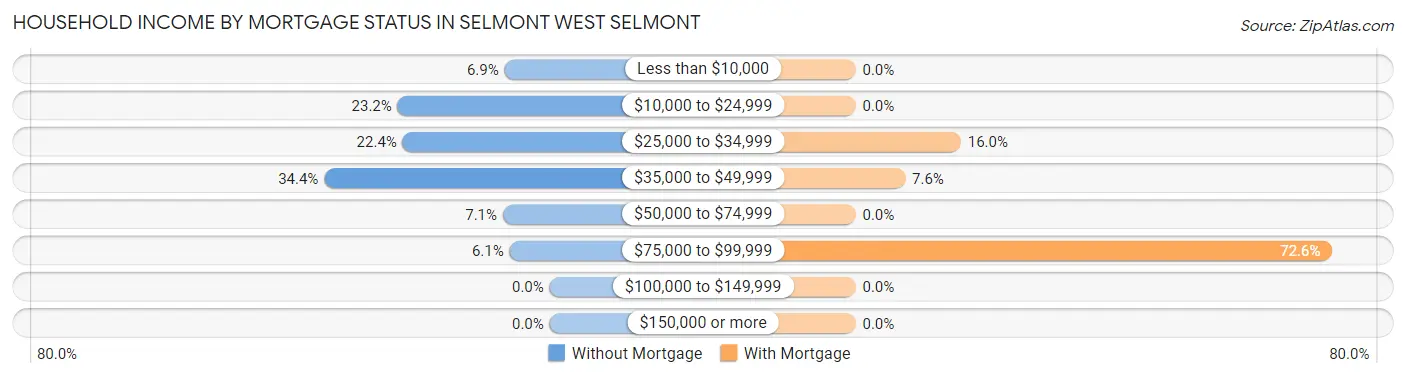
| Household Income | Without Mortgage | With Mortgage |
| Less than $10,000 | 27 (6.9%) | 0 (0.0%) |
| $10,000 to $24,999 | 91 (23.2%) | 0 (0.0%) |
| $25,000 to $34,999 | 88 (22.4%) | 17 (16.0%) |
| $35,000 to $49,999 | 135 (34.4%) | 8 (7.5%) |
| $50,000 to $74,999 | 28 (7.1%) | 0 (0.0%) |
| $75,000 to $99,999 | 24 (6.1%) | 77 (72.6%) |
| $100,000 to $149,999 | 0 (0.0%) | 0 (0.0%) |
| $150,000 or more | 0 (0.0%) | 0 (0.0%) |
| Total | 393 (100.0%) | 106 (100.0%) |
Property Value to Household Income Ratio in Selmont West Selmont
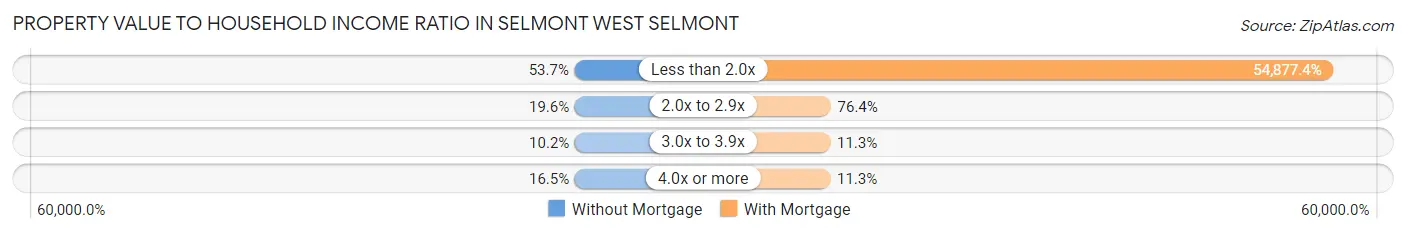
| Value-to-Income Ratio | Without Mortgage | With Mortgage |
| Less than 2.0x | 211 (53.7%) | 58,170 (54,877.4%) |
| 2.0x to 2.9x | 77 (19.6%) | 81 (76.4%) |
| 3.0x to 3.9x | 40 (10.2%) | 12 (11.3%) |
| 4.0x or more | 65 (16.5%) | 12 (11.3%) |
| Total | 393 (100.0%) | 106 (100.0%) |
Real Estate Taxes by Mortgage Status in Selmont West Selmont
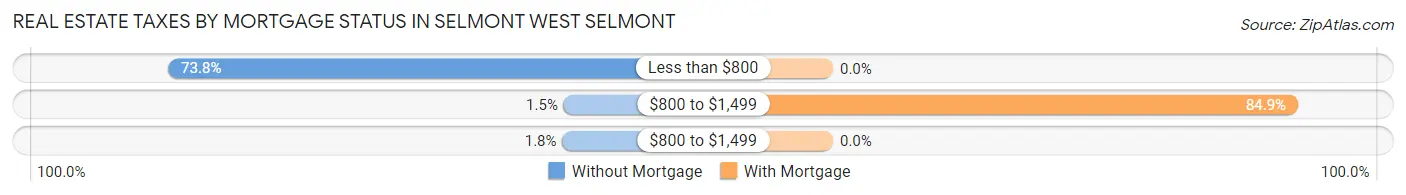
| Property Taxes | Without Mortgage | With Mortgage |
| Less than $800 | 290 (73.8%) | 0 (0.0%) |
| $800 to $1,499 | 6 (1.5%) | 90 (84.9%) |
| $800 to $1,499 | 7 (1.8%) | 0 (0.0%) |
| Total | 393 (100.0%) | 106 (100.0%) |
Health & Disability in Selmont West Selmont
Health Insurance Coverage by Age in Selmont West Selmont
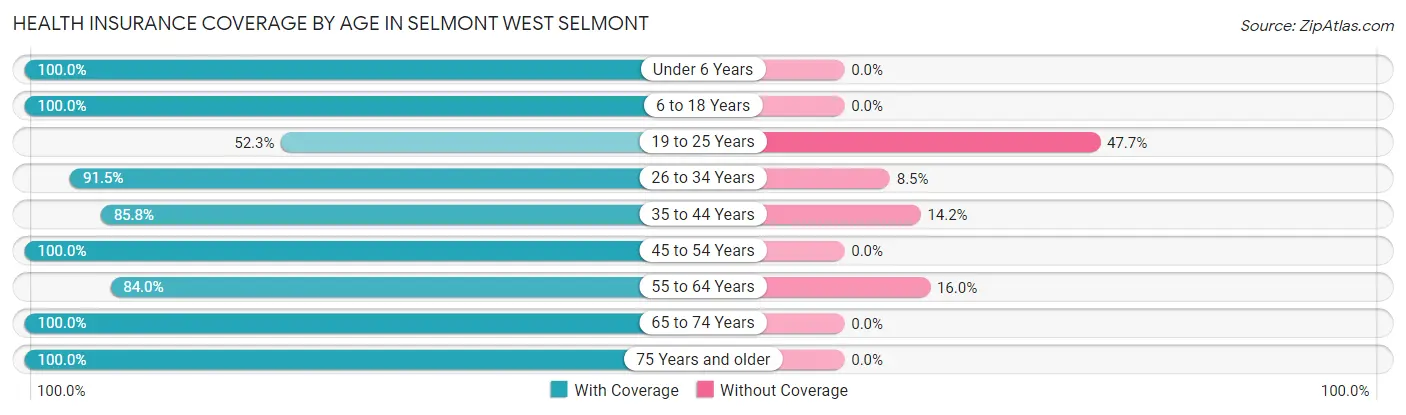
| Age Bracket | With Coverage | Without Coverage |
| Under 6 Years | 133 (100.0%) | 0 (0.0%) |
| 6 to 18 Years | 209 (100.0%) | 0 (0.0%) |
| 19 to 25 Years | 147 (52.3%) | 134 (47.7%) |
| 26 to 34 Years | 356 (91.5%) | 33 (8.5%) |
| 35 to 44 Years | 272 (85.8%) | 45 (14.2%) |
| 45 to 54 Years | 64 (100.0%) | 0 (0.0%) |
| 55 to 64 Years | 184 (84.0%) | 35 (16.0%) |
| 65 to 74 Years | 215 (100.0%) | 0 (0.0%) |
| 75 Years and older | 67 (100.0%) | 0 (0.0%) |
| Total | 1,647 (87.0%) | 247 (13.0%) |
Health Insurance Coverage by Citizenship Status in Selmont West Selmont
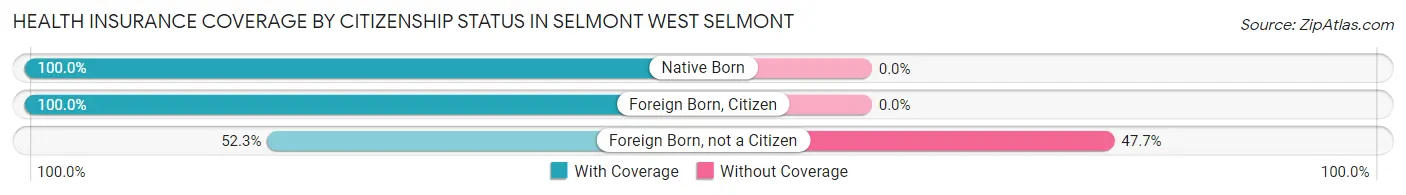
| Citizenship Status | With Coverage | Without Coverage |
| Native Born | 133 (100.0%) | 0 (0.0%) |
| Foreign Born, Citizen | 209 (100.0%) | 0 (0.0%) |
| Foreign Born, not a Citizen | 147 (52.3%) | 134 (47.7%) |
Health Insurance Coverage by Household Income in Selmont West Selmont
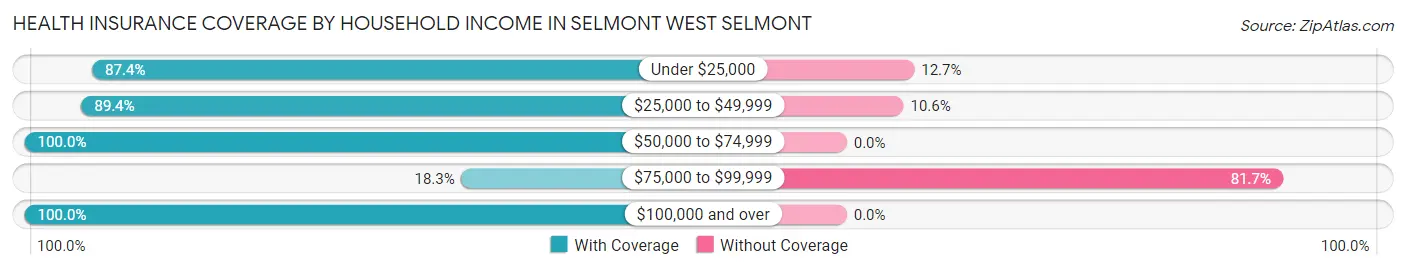
| Household Income | With Coverage | Without Coverage |
| Under $25,000 | 359 (87.4%) | 52 (12.7%) |
| $25,000 to $49,999 | 739 (89.4%) | 88 (10.6%) |
| $50,000 to $74,999 | 507 (100.0%) | 0 (0.0%) |
| $75,000 to $99,999 | 24 (18.3%) | 107 (81.7%) |
| $100,000 and over | 18 (100.0%) | 0 (0.0%) |
Public vs Private Health Insurance Coverage by Age in Selmont West Selmont
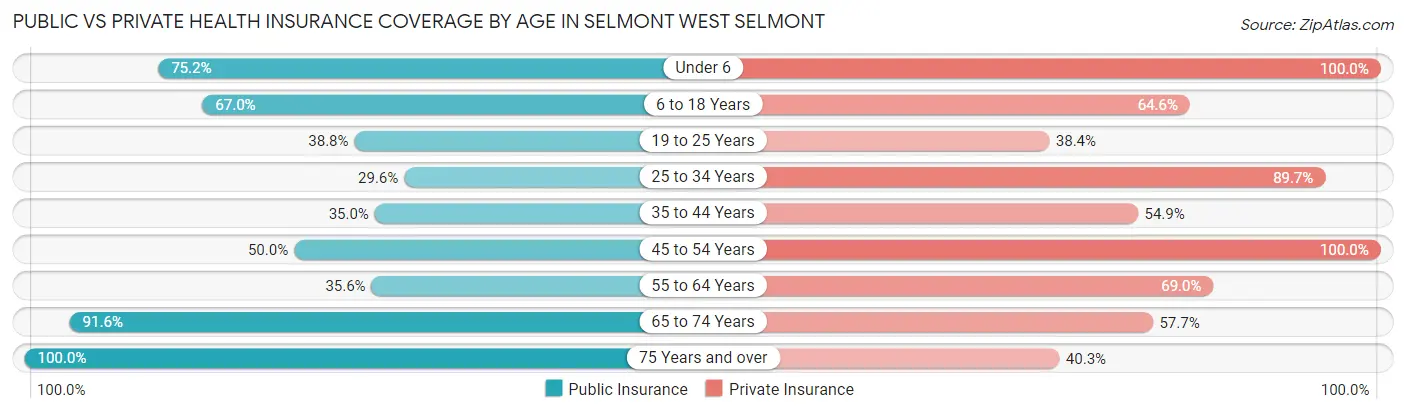
| Age Bracket | Public Insurance | Private Insurance |
| Under 6 | 100 (75.2%) | 133 (100.0%) |
| 6 to 18 Years | 140 (67.0%) | 135 (64.6%) |
| 19 to 25 Years | 109 (38.8%) | 108 (38.4%) |
| 25 to 34 Years | 115 (29.6%) | 349 (89.7%) |
| 35 to 44 Years | 111 (35.0%) | 174 (54.9%) |
| 45 to 54 Years | 32 (50.0%) | 64 (100.0%) |
| 55 to 64 Years | 78 (35.6%) | 151 (69.0%) |
| 65 to 74 Years | 197 (91.6%) | 124 (57.7%) |
| 75 Years and over | 67 (100.0%) | 27 (40.3%) |
| Total | 949 (50.1%) | 1,265 (66.8%) |
Disability Status by Sex by Age in Selmont West Selmont
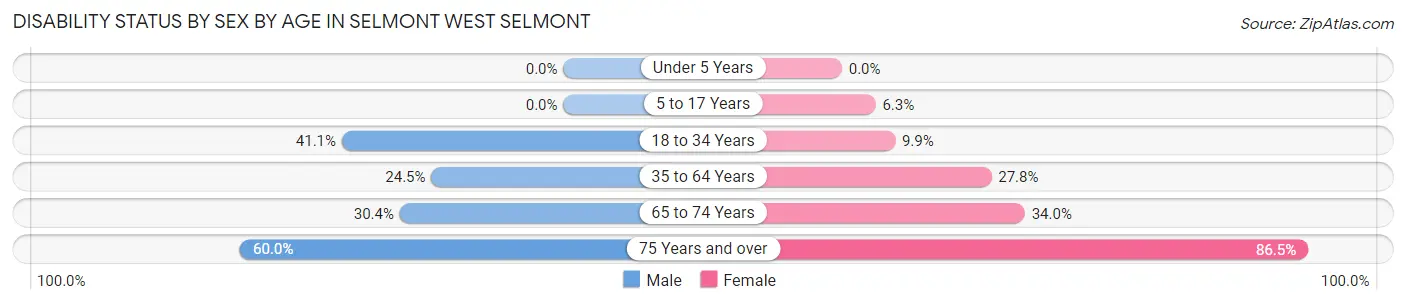
| Age Bracket | Male | Female |
| Under 5 Years | 0 (0.0%) | 0 (0.0%) |
| 5 to 17 Years | 0 (0.0%) | 8 (6.2%) |
| 18 to 34 Years | 118 (41.1%) | 39 (9.9%) |
| 35 to 64 Years | 49 (24.5%) | 111 (27.8%) |
| 65 to 74 Years | 17 (30.4%) | 54 (34.0%) |
| 75 Years and over | 9 (60.0%) | 45 (86.5%) |
Disability Class by Sex by Age in Selmont West Selmont
Disability Class: Hearing Difficulty
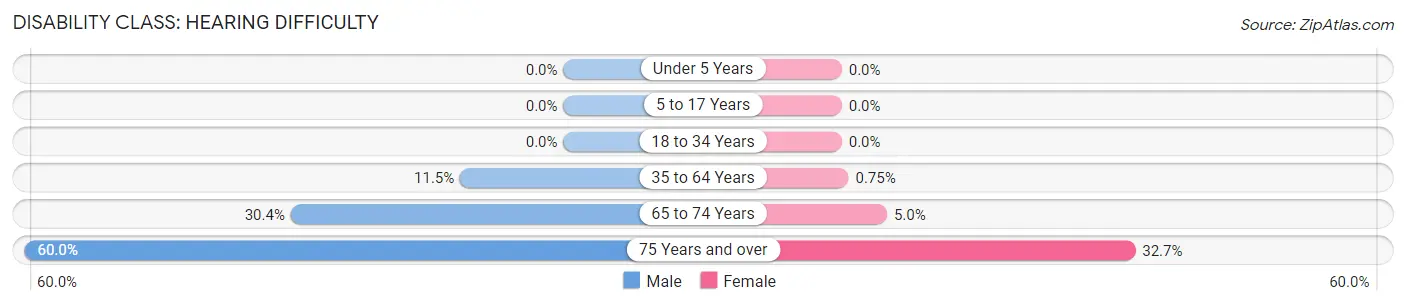
| Age Bracket | Male | Female |
| Under 5 Years | 0 (0.0%) | 0 (0.0%) |
| 5 to 17 Years | 0 (0.0%) | 0 (0.0%) |
| 18 to 34 Years | 0 (0.0%) | 0 (0.0%) |
| 35 to 64 Years | 23 (11.5%) | 3 (0.7%) |
| 65 to 74 Years | 17 (30.4%) | 8 (5.0%) |
| 75 Years and over | 9 (60.0%) | 17 (32.7%) |
Disability Class: Vision Difficulty
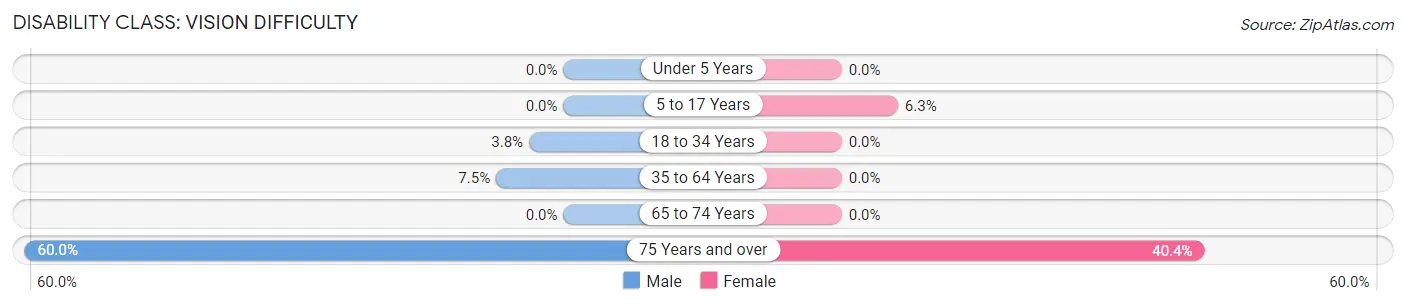
| Age Bracket | Male | Female |
| Under 5 Years | 0 (0.0%) | 0 (0.0%) |
| 5 to 17 Years | 0 (0.0%) | 8 (6.2%) |
| 18 to 34 Years | 11 (3.8%) | 0 (0.0%) |
| 35 to 64 Years | 15 (7.5%) | 0 (0.0%) |
| 65 to 74 Years | 0 (0.0%) | 0 (0.0%) |
| 75 Years and over | 9 (60.0%) | 21 (40.4%) |
Disability Class: Cognitive Difficulty
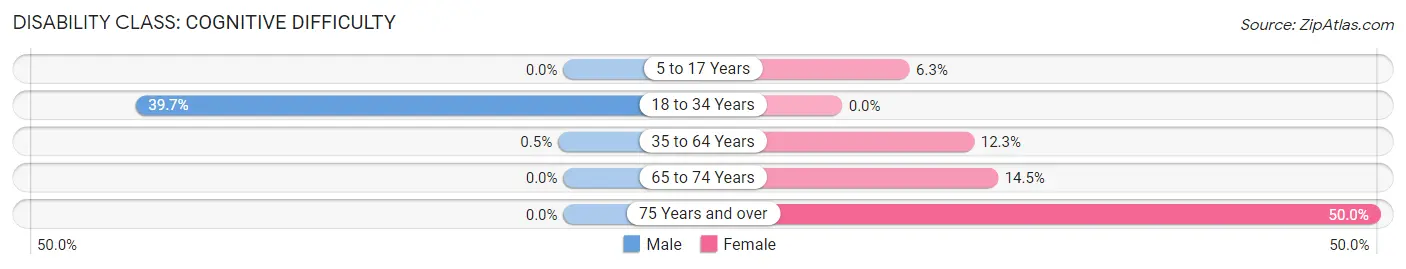
| Age Bracket | Male | Female |
| 5 to 17 Years | 0 (0.0%) | 8 (6.2%) |
| 18 to 34 Years | 114 (39.7%) | 0 (0.0%) |
| 35 to 64 Years | 1 (0.5%) | 49 (12.2%) |
| 65 to 74 Years | 0 (0.0%) | 23 (14.5%) |
| 75 Years and over | 0 (0.0%) | 26 (50.0%) |
Disability Class: Ambulatory Difficulty
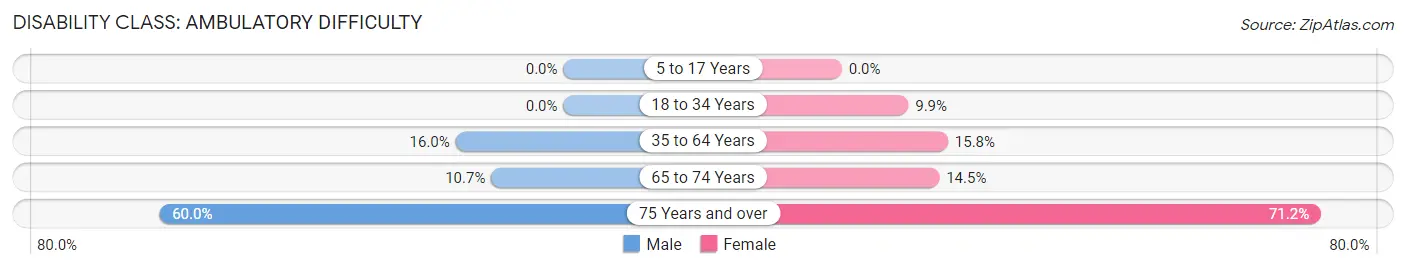
| Age Bracket | Male | Female |
| 5 to 17 Years | 0 (0.0%) | 0 (0.0%) |
| 18 to 34 Years | 0 (0.0%) | 39 (9.9%) |
| 35 to 64 Years | 32 (16.0%) | 63 (15.8%) |
| 65 to 74 Years | 6 (10.7%) | 23 (14.5%) |
| 75 Years and over | 9 (60.0%) | 37 (71.2%) |
Disability Class: Self-Care Difficulty
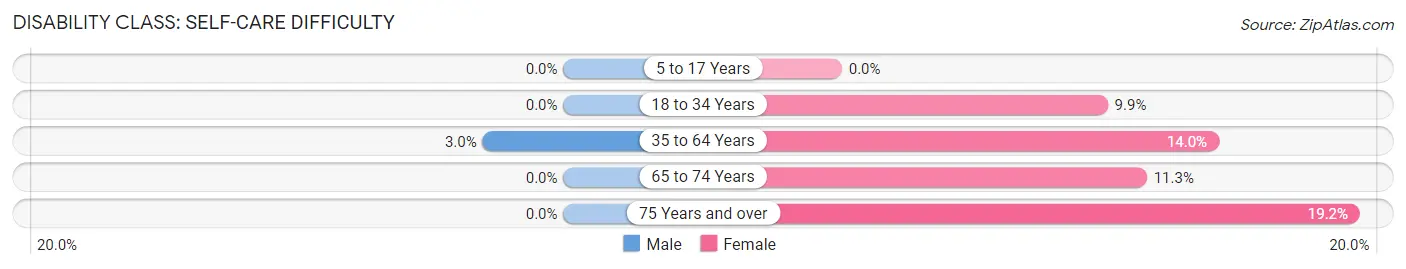
| Age Bracket | Male | Female |
| 5 to 17 Years | 0 (0.0%) | 0 (0.0%) |
| 18 to 34 Years | 0 (0.0%) | 39 (9.9%) |
| 35 to 64 Years | 6 (3.0%) | 56 (14.0%) |
| 65 to 74 Years | 0 (0.0%) | 18 (11.3%) |
| 75 Years and over | 0 (0.0%) | 10 (19.2%) |
Technology Access in Selmont West Selmont
Computing Device Access in Selmont West Selmont
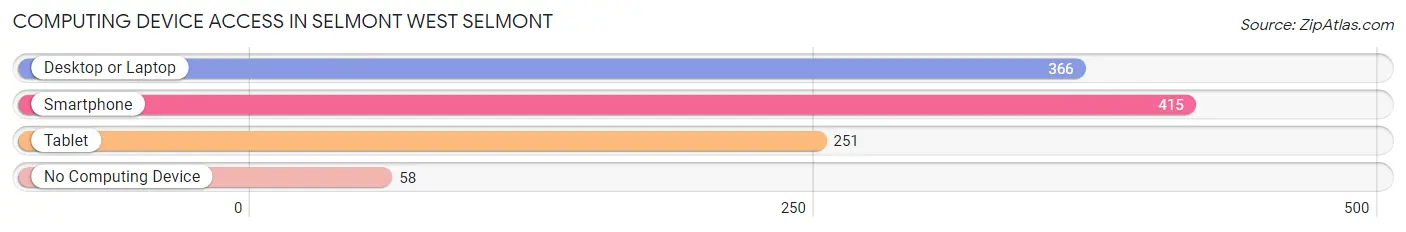
| Device Type | # Households | % Households |
| Desktop or Laptop | 366 | 62.6% |
| Smartphone | 415 | 70.9% |
| Tablet | 251 | 42.9% |
| No Computing Device | 58 | 9.9% |
| Total | 585 | 100.0% |
Internet Access in Selmont West Selmont
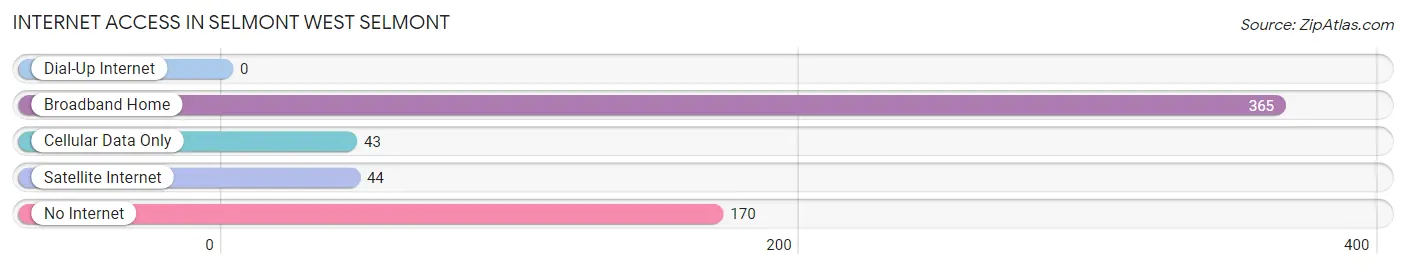
| Internet Type | # Households | % Households |
| Dial-Up Internet | 0 | 0.0% |
| Broadband Home | 365 | 62.4% |
| Cellular Data Only | 43 | 7.3% |
| Satellite Internet | 44 | 7.5% |
| No Internet | 170 | 29.1% |
| Total | 585 | 100.0% |
Selmont West Selmont Summary
Selmont West is a small town located in the state of Alabama, in the United States. It is situated in the southeastern corner of the state, in the Black Belt region. The town is located in Wilcox County, and is part of the Camden Micropolitan Statistical Area. As of the 2010 census, the population of Selmont West was 1,072.
Geography
Selmont West is located at 31°45'25"N 87°17'45"W (31.7569, -87.2958). It is situated in the southeastern corner of the state, in the Black Belt region. The town is located in Wilcox County, and is part of the Camden Micropolitan Statistical Area. The town is situated on the banks of the Alabama River, and is surrounded by rolling hills and forests.
The town has a total area of 1.2 square miles, all of which is land. The terrain is mostly flat, with some rolling hills. The climate is humid subtropical, with hot, humid summers and mild winters.
Demographics
As of the 2010 census, the population of Selmont West was 1,072. The racial makeup of the town was 79.2% White, 19.2% African American, 0.2% Native American, 0.2% Asian, 0.2% from other races, and 0.9% from two or more races. Hispanic or Latino of any race were 0.9% of the population.
The median income for a household in the town was $25,000, and the median income for a family was $30,000. The per capita income for the town was $13,000. About 24.2% of families and 28.2% of the population were below the poverty line, including 37.2% of those under age 18 and 16.2% of those age 65 or over.
Economy
Selmont West is a small, rural town, and the economy is largely based on agriculture. The town is home to several farms, which produce a variety of crops, including cotton, corn, soybeans, and peanuts. The town also has a few small businesses, including a grocery store, a hardware store, and a few restaurants.
The town is also home to a few manufacturing companies, which produce a variety of products, including furniture, clothing, and automotive parts. The town is also home to a few small service businesses, such as auto repair shops and beauty salons.
History
Selmont West was founded in 1820, and was originally known as Selmont. The town was named after the Selmont Plantation, which was owned by the prominent local family of the same name. The town was incorporated in 1887, and was renamed Selmont West in 1895.
The town was a major center of the cotton industry in the late 19th and early 20th centuries. The town was also home to several large plantations, which were worked by African American slaves. After the Civil War, the town's economy shifted to agriculture, and the town became a center for cotton production.
In the late 20th century, the town's economy shifted to manufacturing, and the town became home to several small factories. The town also became a center for the production of furniture and clothing.
Today, Selmont West is a small, rural town, and the economy is largely based on agriculture. The town is home to several farms, which produce a variety of crops, including cotton, corn, soybeans, and peanuts. The town also has a few small businesses, including a grocery store, a hardware store, and a few restaurants.
Common Questions
What is Per Capita Income in Selmont West Selmont?
Per Capita income in Selmont West Selmont is $18,069.
What is the Median Family Income in Selmont West Selmont?
Median Family Income in Selmont West Selmont is $38,277.
What is the Median Household income in Selmont West Selmont?
Median Household Income in Selmont West Selmont is $35,417.
What is Income or Wage Gap in Selmont West Selmont?
Income or Wage Gap in Selmont West Selmont is 22.6%.
Women in Selmont West Selmont earn 77.4 cents for every dollar earned by a man.
What is Inequality or Gini Index in Selmont West Selmont?
Inequality or Gini Index in Selmont West Selmont is 0.35.
What is the Total Population of Selmont West Selmont?
Total Population of Selmont West Selmont is 1,894.
What is the Total Male Population of Selmont West Selmont?
Total Male Population of Selmont West Selmont is 710.
What is the Total Female Population of Selmont West Selmont?
Total Female Population of Selmont West Selmont is 1,184.
What is the Ratio of Males per 100 Females in Selmont West Selmont?
There are 59.97 Males per 100 Females in Selmont West Selmont.
What is the Ratio of Females per 100 Males in Selmont West Selmont?
There are 166.76 Females per 100 Males in Selmont West Selmont.
What is the Median Population Age in Selmont West Selmont?
Median Population Age in Selmont West Selmont is 31.9 Years.
What is the Average Family Size in Selmont West Selmont
Average Family Size in Selmont West Selmont is 4.2 People.
What is the Average Household Size in Selmont West Selmont
Average Household Size in Selmont West Selmont is 3.2 People.
How Large is the Labor Force in Selmont West Selmont?
There are 781 People in the Labor Forcein in Selmont West Selmont.
What is the Percentage of People in the Labor Force in Selmont West Selmont?
47.8% of People are in the Labor Force in Selmont West Selmont.
What is the Unemployment Rate in Selmont West Selmont?
Unemployment Rate in Selmont West Selmont is 2.9%.