Selma, AL Map & Demographics
Selma Map
Selma Overview
$21,575
PER CAPITA INCOME
$46,266
AVG FAMILY INCOME
$31,084
AVG HOUSEHOLD INCOME
9.2%
WAGE / INCOME GAP [ % ]
90.8¢/ $1
WAGE / INCOME GAP [ $ ]
$11,334
FAMILY INCOME DEFICIT
0.51
INEQUALITY / GINI INDEX
17,875
TOTAL POPULATION
7,773
MALE POPULATION
10,102
FEMALE POPULATION
76.95
MALES / 100 FEMALES
129.96
FEMALES / 100 MALES
39.0
MEDIAN AGE
3.5
AVG FAMILY SIZE
2.3
AVG HOUSEHOLD SIZE
7,142
LABOR FORCE [ PEOPLE ]
50.2%
PERCENT IN LABOR FORCE
12.9%
UNEMPLOYMENT RATE
Selma Area Codes
Income in Selma
Income Overview in Selma
Per Capita Income in Selma is $21,575, while median incomes of families and households are $46,266 and $31,084 respectively.
| Characteristic | Number | Measure |
| Per Capita Income | 17,875 | $21,575 |
| Median Family Income | 3,683 | $46,266 |
| Mean Family Income | 3,683 | $61,489 |
| Median Household Income | 7,456 | $31,084 |
| Mean Household Income | 7,456 | $46,763 |
| Income Deficit | 3,683 | $11,334 |
| Wage / Income Gap (%) | 17,875 | 9.18% |
| Wage / Income Gap ($) | 17,875 | 90.82¢ per $1 |
| Gini / Inequality Index | 17,875 | 0.51 |
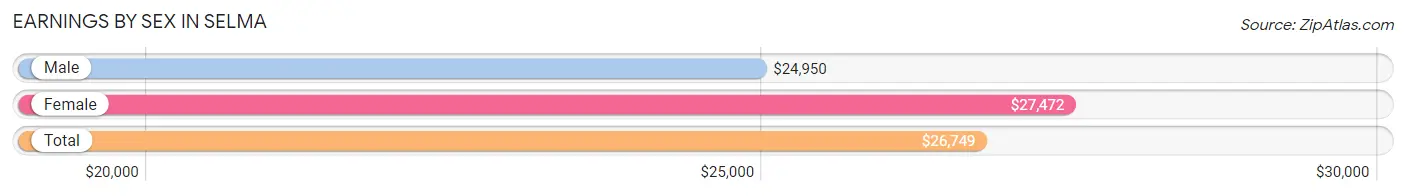
Earnings by Sex in Selma
Average Earnings in Selma are $26,749, $24,950 for men and $27,472 for women, a difference of 9.2%.
| Sex | Number | Average Earnings |
| Male | 3,212 (46.2%) | $24,950 |
| Female | 3,744 (53.8%) | $27,472 |
| Total | 6,956 (100.0%) | $26,749 |
Earnings by Sex by Income Bracket in Selma
The most common earnings brackets in Selma are $22,500 to $24,999 for men (298 | 9.3%) and $30,000 to $34,999 for women (456 | 12.2%).
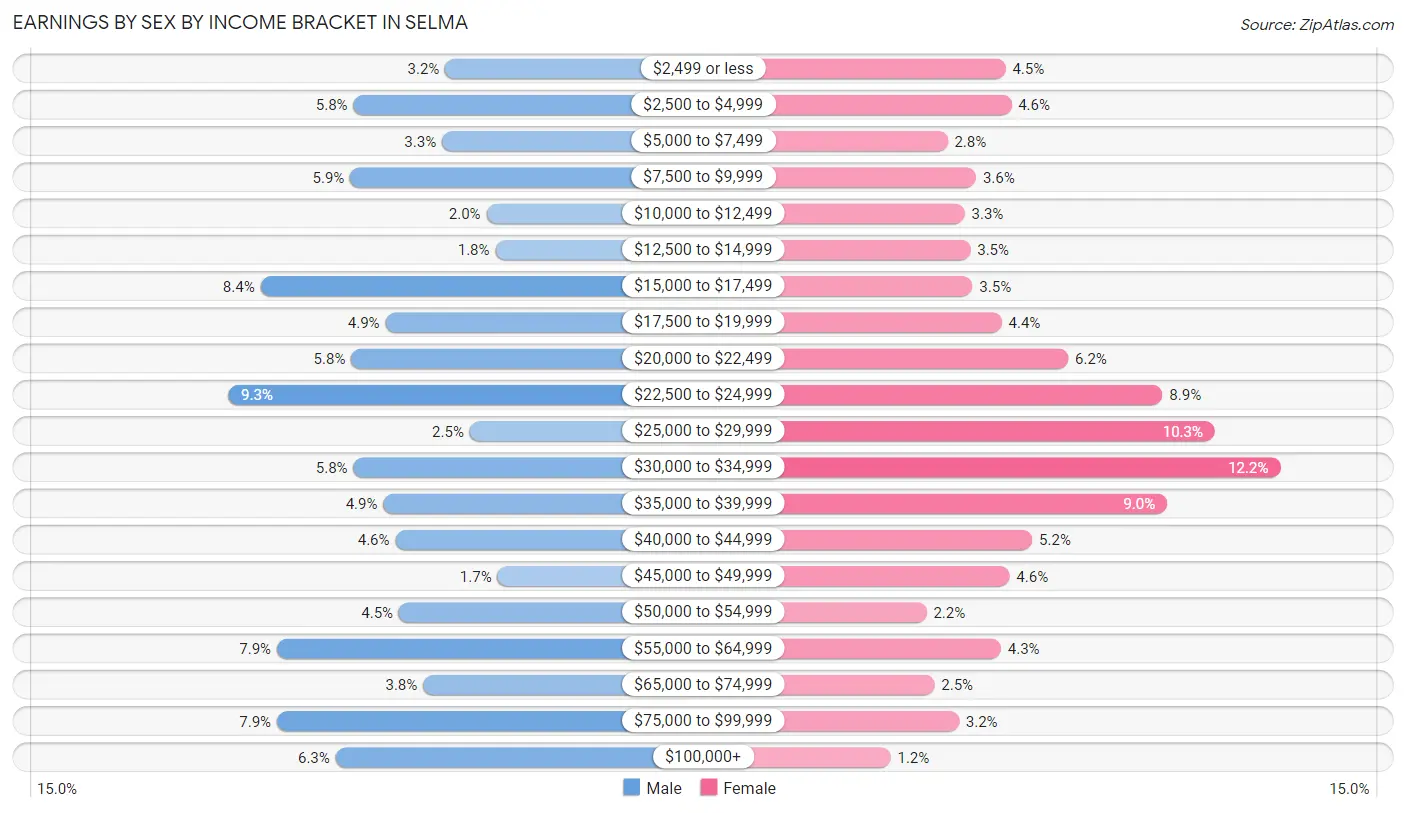
| Income | Male | Female |
| $2,499 or less | 102 (3.2%) | 167 (4.5%) |
| $2,500 to $4,999 | 185 (5.8%) | 173 (4.6%) |
| $5,000 to $7,499 | 105 (3.3%) | 106 (2.8%) |
| $7,500 to $9,999 | 188 (5.9%) | 136 (3.6%) |
| $10,000 to $12,499 | 65 (2.0%) | 124 (3.3%) |
| $12,500 to $14,999 | 57 (1.8%) | 130 (3.5%) |
| $15,000 to $17,499 | 269 (8.4%) | 132 (3.5%) |
| $17,500 to $19,999 | 156 (4.9%) | 163 (4.3%) |
| $20,000 to $22,499 | 187 (5.8%) | 233 (6.2%) |
| $22,500 to $24,999 | 298 (9.3%) | 332 (8.9%) |
| $25,000 to $29,999 | 80 (2.5%) | 387 (10.3%) |
| $30,000 to $34,999 | 185 (5.8%) | 456 (12.2%) |
| $35,000 to $39,999 | 158 (4.9%) | 337 (9.0%) |
| $40,000 to $44,999 | 147 (4.6%) | 195 (5.2%) |
| $45,000 to $49,999 | 55 (1.7%) | 171 (4.6%) |
| $50,000 to $54,999 | 144 (4.5%) | 84 (2.2%) |
| $55,000 to $64,999 | 254 (7.9%) | 162 (4.3%) |
| $65,000 to $74,999 | 122 (3.8%) | 92 (2.5%) |
| $75,000 to $99,999 | 254 (7.9%) | 118 (3.2%) |
| $100,000+ | 201 (6.3%) | 46 (1.2%) |
| Total | 3,212 (100.0%) | 3,744 (100.0%) |
Earnings by Sex by Educational Attainment in Selma
Average earnings in Selma are $33,961 for men and $30,097 for women, a difference of 11.4%. Men with an educational attainment of high school diploma enjoy the highest average annual earnings of $55,114, while those with less than high school education earn the least with $14,808. Women with an educational attainment of graduate degree earn the most with the average annual earnings of $47,321, while those with college or associate's degree education have the smallest earnings of $24,962.
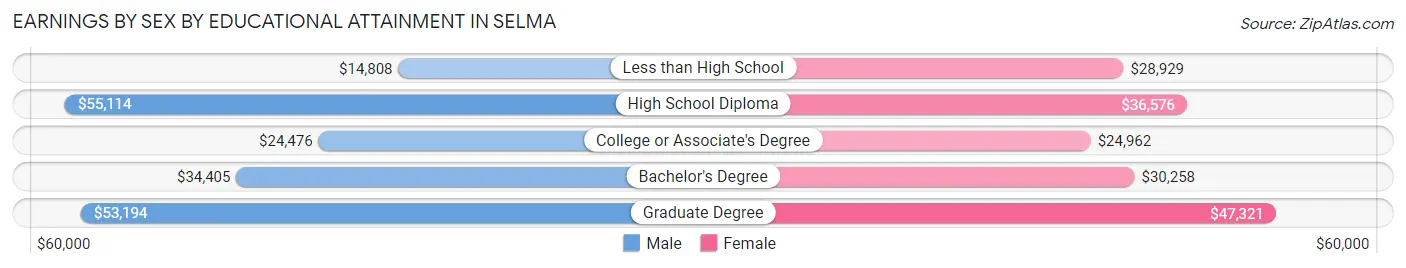
| Educational Attainment | Male Income | Female Income |
| Less than High School | $14,808 | $28,929 |
| High School Diploma | $55,114 | $36,576 |
| College or Associate's Degree | $24,476 | $24,962 |
| Bachelor's Degree | $34,405 | $30,258 |
| Graduate Degree | $53,194 | $47,321 |
| Total | $33,961 | $30,097 |
Family Income in Selma
Family Income Brackets in Selma
According to the Selma family income data, there are 560 families falling into the $35,000 to $49,999 income range, which is the most common income bracket and makes up 15.2% of all families. Conversely, the $200,000+ income bracket is the least frequent group with only 77 families (2.1%) belonging to this category.
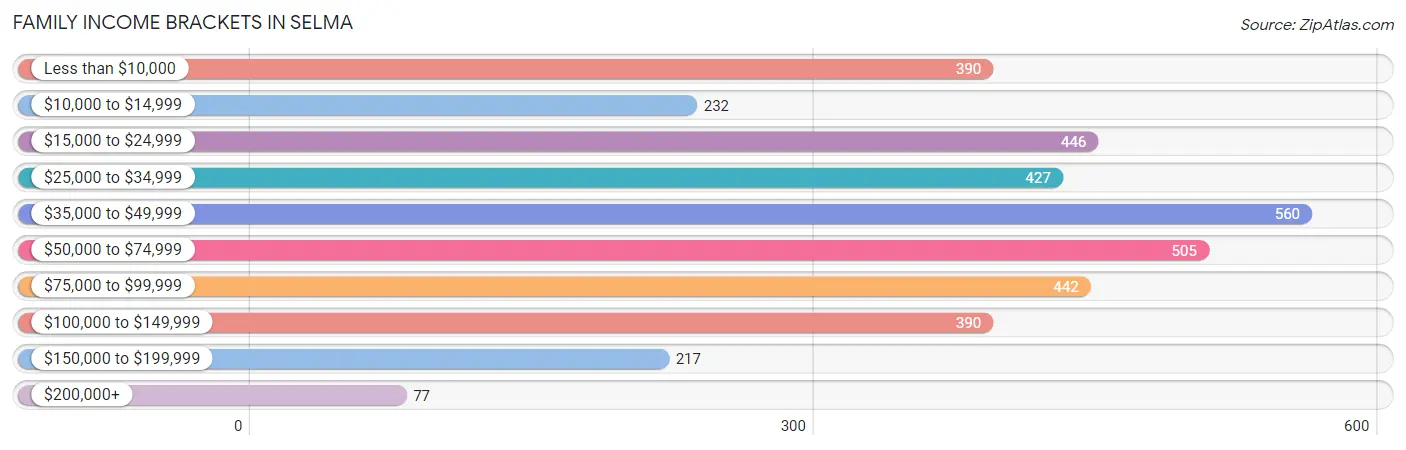
| Income Bracket | # Families | % Families |
| Less than $10,000 | 390 | 10.6% |
| $10,000 to $14,999 | 232 | 6.3% |
| $15,000 to $24,999 | 446 | 12.1% |
| $25,000 to $34,999 | 427 | 11.6% |
| $35,000 to $49,999 | 560 | 15.2% |
| $50,000 to $74,999 | 505 | 13.7% |
| $75,000 to $99,999 | 442 | 12.0% |
| $100,000 to $149,999 | 390 | 10.6% |
| $150,000 to $199,999 | 217 | 5.9% |
| $200,000+ | 77 | 2.1% |
Family Income by Famaliy Size in Selma
4-person families (432 | 11.7%) account for the highest median family income in Selma with $49,805 per family, while 2-person families (1,870 | 50.8%) have the highest median income of $23,382 per family member.
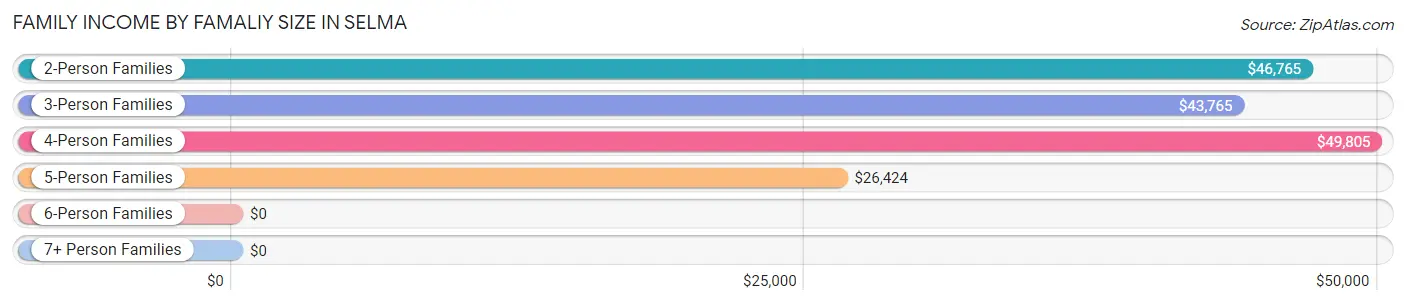
| Income Bracket | # Families | Median Income |
| 2-Person Families | 1,870 (50.8%) | $46,765 |
| 3-Person Families | 1,072 (29.1%) | $43,765 |
| 4-Person Families | 432 (11.7%) | $49,805 |
| 5-Person Families | 195 (5.3%) | $26,424 |
| 6-Person Families | 55 (1.5%) | $0 |
| 7+ Person Families | 59 (1.6%) | $0 |
| Total | 3,683 (100.0%) | $46,266 |
Family Income by Number of Earners in Selma
The median family income in Selma is $46,266, with families comprising 3+ earners (254) having the highest median family income of $97,692, while families with no earners (903) have the lowest median family income of $21,139, accounting for 6.9% and 24.5% of families, respectively.
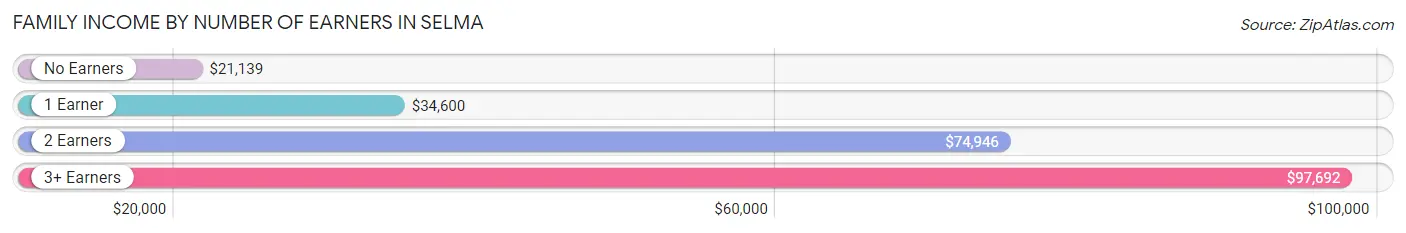
| Number of Earners | # Families | Median Income |
| No Earners | 903 (24.5%) | $21,139 |
| 1 Earner | 1,611 (43.7%) | $34,600 |
| 2 Earners | 915 (24.8%) | $74,946 |
| 3+ Earners | 254 (6.9%) | $97,692 |
| Total | 3,683 (100.0%) | $46,266 |
Household Income in Selma
Household Income Brackets in Selma
With 1,275 households falling in the category, the $15,000 to $24,999 income range is the most frequent in Selma, accounting for 17.1% of all households. In contrast, only 104 households (1.4%) fall into the $200,000+ income bracket, making it the least populous group.
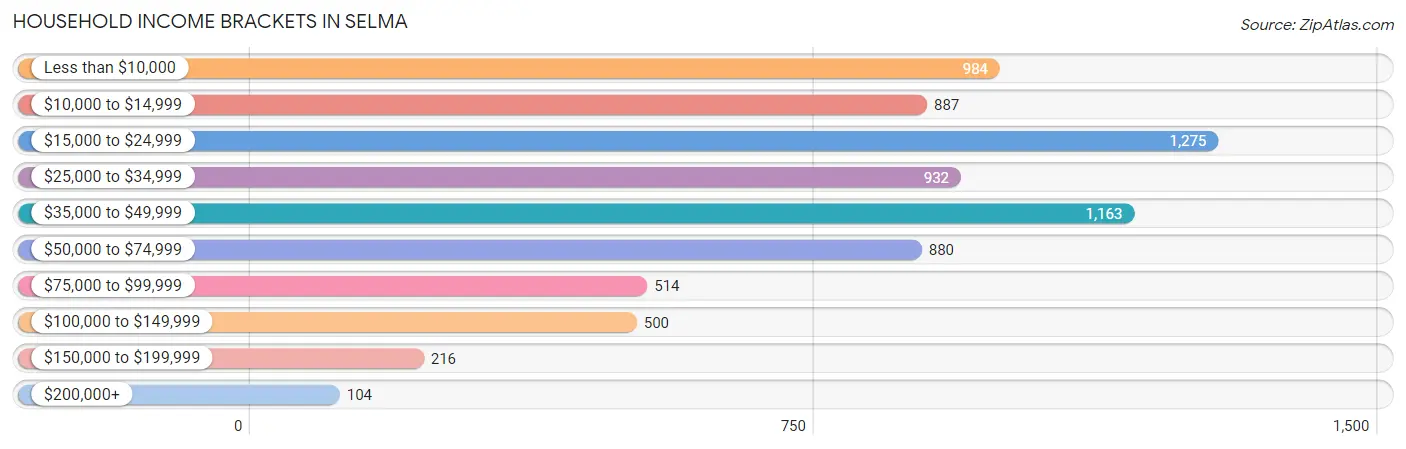
| Income Bracket | # Households | % Households |
| Less than $10,000 | 984 | 13.2% |
| $10,000 to $14,999 | 887 | 11.9% |
| $15,000 to $24,999 | 1,275 | 17.1% |
| $25,000 to $34,999 | 932 | 12.5% |
| $35,000 to $49,999 | 1,163 | 15.6% |
| $50,000 to $74,999 | 880 | 11.8% |
| $75,000 to $99,999 | 514 | 6.9% |
| $100,000 to $149,999 | 500 | 6.7% |
| $150,000 to $199,999 | 216 | 2.9% |
| $200,000+ | 104 | 1.4% |
Household Income by Householder Age in Selma
The median household income in Selma is $31,084, with the highest median household income of $37,956 found in the 25 to 44 years age bracket for the primary householder. A total of 1,635 households (21.9%) fall into this category. Meanwhile, the 15 to 24 years age bracket for the primary householder has the lowest median household income of $0, with 514 households (6.9%) in this group.
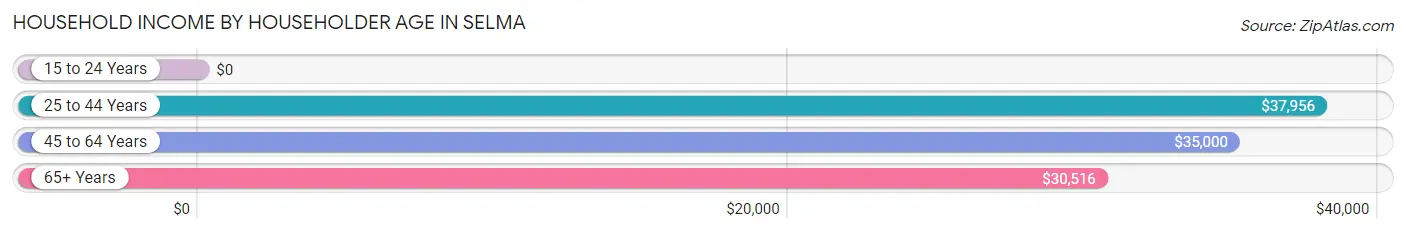
| Income Bracket | # Households | Median Income |
| 15 to 24 Years | 514 (6.9%) | $0 |
| 25 to 44 Years | 1,635 (21.9%) | $37,956 |
| 45 to 64 Years | 2,948 (39.5%) | $35,000 |
| 65+ Years | 2,359 (31.6%) | $30,516 |
| Total | 7,456 (100.0%) | $31,084 |
Poverty in Selma
Income Below Poverty by Sex and Age in Selma
With 22.7% poverty level for males and 34.8% for females among the residents of Selma, under 5 year old males and 5 year old females are the most vulnerable to poverty, with 436 males (76.2%) and 158 females (65.8%) in their respective age groups living below the poverty level.
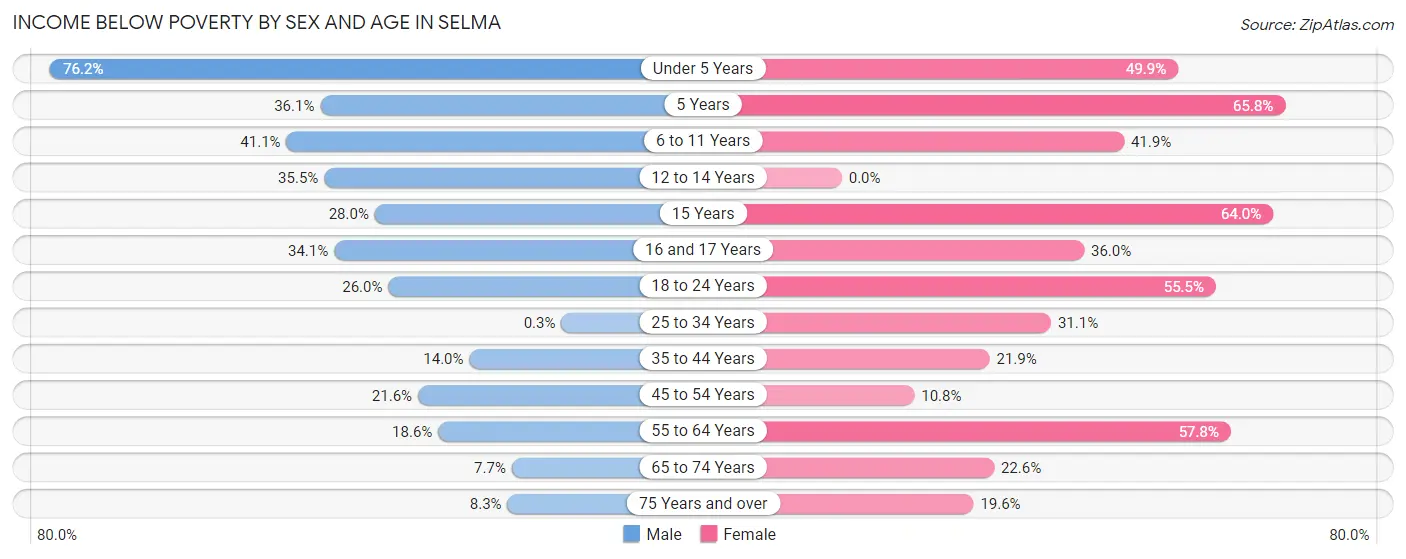
| Age Bracket | Male | Female |
| Under 5 Years | 436 (76.2%) | 334 (49.9%) |
| 5 Years | 74 (36.1%) | 158 (65.8%) |
| 6 to 11 Years | 176 (41.1%) | 212 (41.9%) |
| 12 to 14 Years | 130 (35.5%) | 0 (0.0%) |
| 15 Years | 79 (28.0%) | 57 (64.0%) |
| 16 and 17 Years | 111 (34.1%) | 109 (36.0%) |
| 18 to 24 Years | 170 (26.0%) | 567 (55.5%) |
| 25 to 34 Years | 3 (0.3%) | 319 (31.1%) |
| 35 to 44 Years | 91 (14.0%) | 231 (21.9%) |
| 45 to 54 Years | 162 (21.6%) | 145 (10.8%) |
| 55 to 64 Years | 171 (18.6%) | 905 (57.8%) |
| 65 to 74 Years | 70 (7.7%) | 231 (22.6%) |
| 75 Years and over | 42 (8.3%) | 149 (19.6%) |
| Total | 1,715 (22.7%) | 3,417 (34.8%) |
Income Above Poverty by Sex and Age in Selma
According to the poverty statistics in Selma, males aged 25 to 34 years and females aged 12 to 14 years are the age groups that are most secure financially, with 99.7% of males and 100.0% of females in these age groups living above the poverty line.
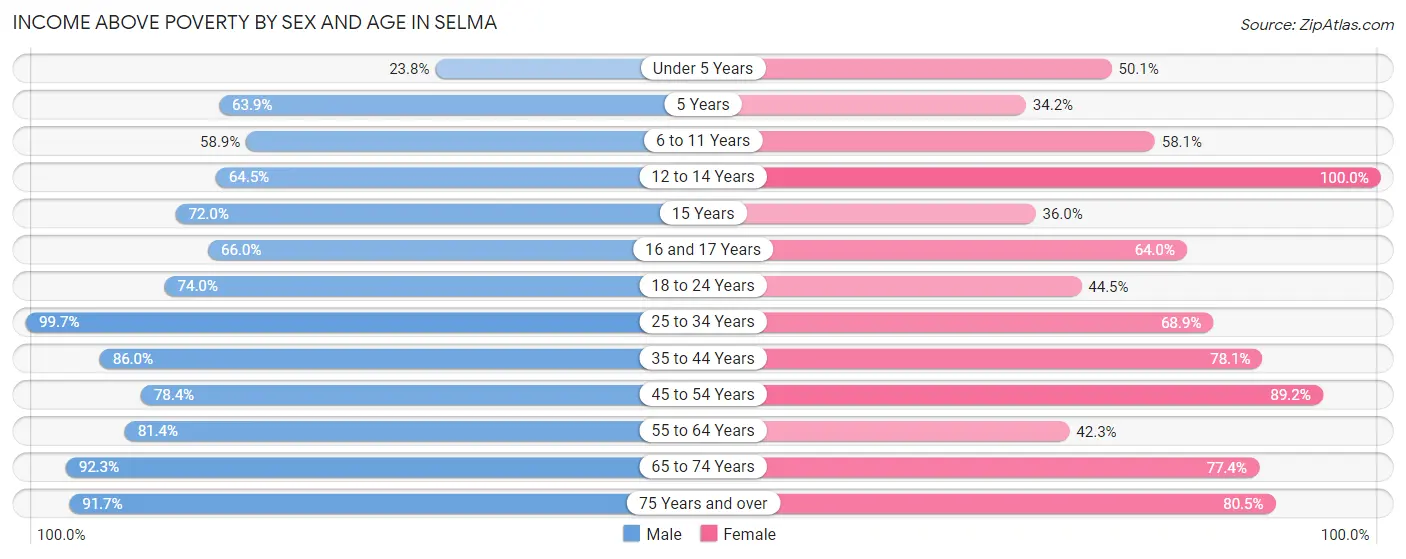
| Age Bracket | Male | Female |
| Under 5 Years | 136 (23.8%) | 335 (50.1%) |
| 5 Years | 131 (63.9%) | 82 (34.2%) |
| 6 to 11 Years | 252 (58.9%) | 294 (58.1%) |
| 12 to 14 Years | 236 (64.5%) | 208 (100.0%) |
| 15 Years | 203 (72.0%) | 32 (36.0%) |
| 16 and 17 Years | 215 (65.9%) | 194 (64.0%) |
| 18 to 24 Years | 484 (74.0%) | 454 (44.5%) |
| 25 to 34 Years | 992 (99.7%) | 708 (68.9%) |
| 35 to 44 Years | 561 (86.0%) | 822 (78.1%) |
| 45 to 54 Years | 588 (78.4%) | 1,201 (89.2%) |
| 55 to 64 Years | 749 (81.4%) | 662 (42.2%) |
| 65 to 74 Years | 844 (92.3%) | 791 (77.4%) |
| 75 Years and over | 464 (91.7%) | 613 (80.4%) |
| Total | 5,855 (77.3%) | 6,396 (65.2%) |
Income Below Poverty Among Married-Couple Families in Selma
The poverty statistics for married-couple families in Selma show that 5.1% or 81 of the total 1,572 families live below the poverty line. Families with no children have the highest poverty rate of 5.6%, comprising of 68 families. On the other hand, families with 3 or 4 children have the lowest poverty rate of 0.0%, which includes 0 families.
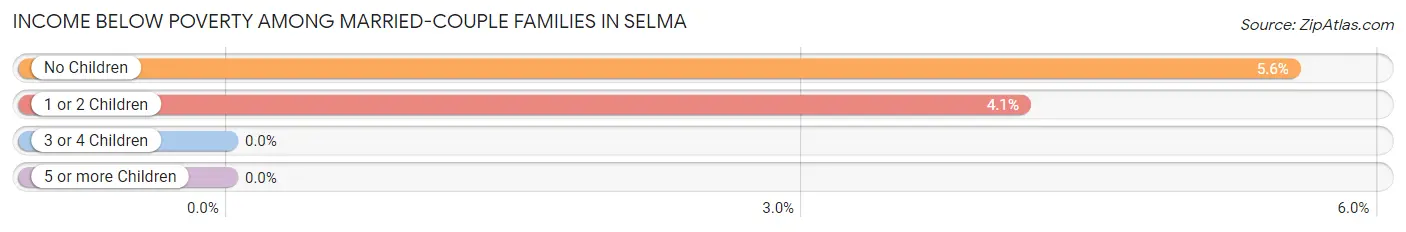
| Children | Above Poverty | Below Poverty |
| No Children | 1,158 (94.5%) | 68 (5.6%) |
| 1 or 2 Children | 301 (95.9%) | 13 (4.1%) |
| 3 or 4 Children | 32 (100.0%) | 0 (0.0%) |
| 5 or more Children | 0 (0.0%) | 0 (0.0%) |
| Total | 1,491 (94.9%) | 81 (5.1%) |
Income Below Poverty Among Single-Parent Households in Selma
According to the poverty data in Selma, 22.3% or 110 single-father households and 45.3% or 732 single-mother households are living below the poverty line. Among single-father households, those with 3 or 4 children have the highest poverty rate, with 12 households (100.0%) experiencing poverty. Likewise, among single-mother households, those with 5 or more children have the highest poverty rate, with 18 households (100.0%) falling below the poverty line.
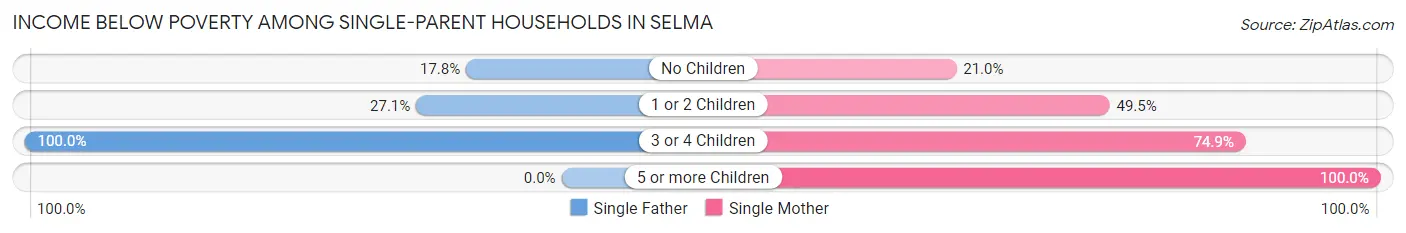
| Children | Single Father | Single Mother |
| No Children | 62 (17.8%) | 95 (21.0%) |
| 1 or 2 Children | 36 (27.1%) | 467 (49.5%) |
| 3 or 4 Children | 12 (100.0%) | 152 (74.9%) |
| 5 or more Children | 0 (0.0%) | 18 (100.0%) |
| Total | 110 (22.3%) | 732 (45.3%) |
Income Below Poverty Among Married-Couple vs Single-Parent Households in Selma
The poverty data for Selma shows that 81 of the married-couple family households (5.1%) and 842 of the single-parent households (39.9%) are living below the poverty level. Within the married-couple family households, those with no children have the highest poverty rate, with 68 households (5.6%) falling below the poverty line. Among the single-parent households, those with 5 or more children have the highest poverty rate, with 18 household (100.0%) living below poverty.
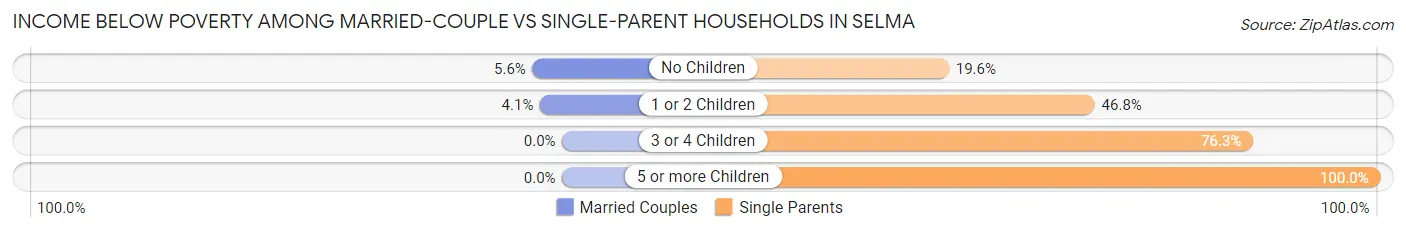
| Children | Married-Couple Families | Single-Parent Households |
| No Children | 68 (5.6%) | 157 (19.6%) |
| 1 or 2 Children | 13 (4.1%) | 503 (46.8%) |
| 3 or 4 Children | 0 (0.0%) | 164 (76.3%) |
| 5 or more Children | 0 (0.0%) | 18 (100.0%) |
| Total | 81 (5.1%) | 842 (39.9%) |
Race in Selma
The most populous races in Selma are Black / African American (14,186 | 79.4%), White / Caucasian (3,082 | 17.2%), and Hispanic or Latino (329 | 1.8%).
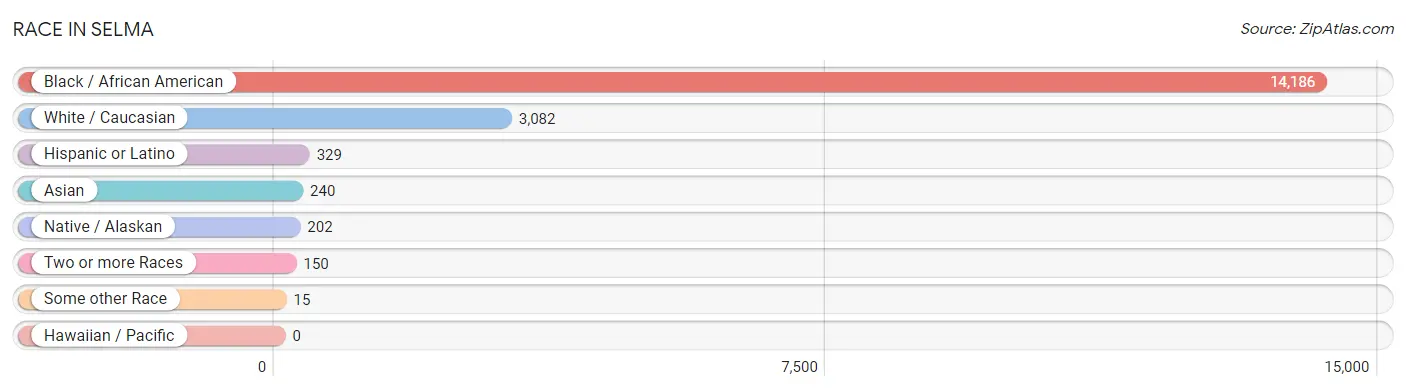
| Race | # Population | % Population |
| Asian | 240 | 1.3% |
| Black / African American | 14,186 | 79.4% |
| Hawaiian / Pacific | 0 | 0.0% |
| Hispanic or Latino | 329 | 1.8% |
| Native / Alaskan | 202 | 1.1% |
| White / Caucasian | 3,082 | 17.2% |
| Two or more Races | 150 | 0.8% |
| Some other Race | 15 | 0.1% |
| Total | 17,875 | 100.0% |
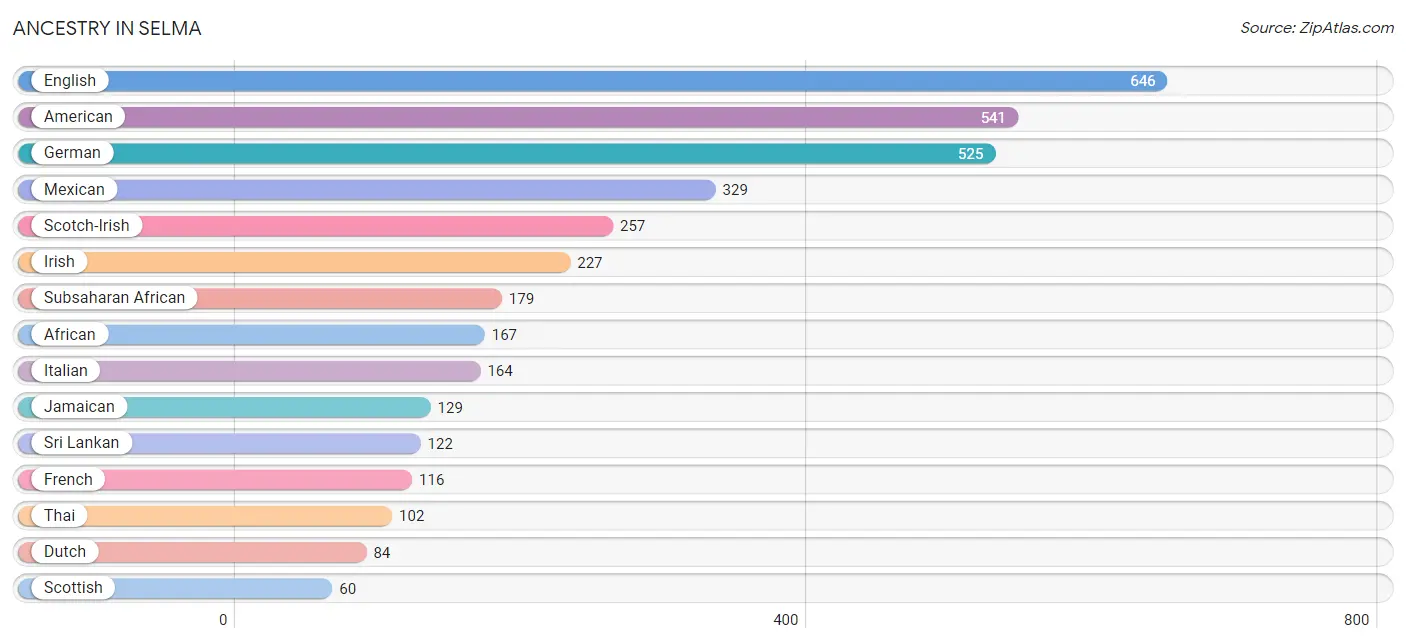
Ancestry in Selma
The most populous ancestries reported in Selma are English (646 | 3.6%), American (541 | 3.0%), German (525 | 2.9%), Mexican (329 | 1.8%), and Scotch-Irish (257 | 1.4%), together accounting for 12.9% of all Selma residents.
| Ancestry | # Population | % Population |
| African | 167 | 0.9% |
| American | 541 | 3.0% |
| Arab | 17 | 0.1% |
| British | 14 | 0.1% |
| Burmese | 6 | 0.0% |
| Cherokee | 1 | 0.0% |
| Creek | 50 | 0.3% |
| Danish | 8 | 0.0% |
| Dutch | 84 | 0.5% |
| Eastern European | 9 | 0.1% |
| English | 646 | 3.6% |
| European | 13 | 0.1% |
| French | 116 | 0.6% |
| French Canadian | 11 | 0.1% |
| German | 525 | 2.9% |
| Irish | 227 | 1.3% |
| Italian | 164 | 0.9% |
| Jamaican | 129 | 0.7% |
| Mexican | 329 | 1.8% |
| Polish | 24 | 0.1% |
| Potawatomi | 37 | 0.2% |
| Pueblo | 21 | 0.1% |
| Scandinavian | 7 | 0.0% |
| Scotch-Irish | 257 | 1.4% |
| Scottish | 60 | 0.3% |
| Sri Lankan | 122 | 0.7% |
| Subsaharan African | 179 | 1.0% |
| Swedish | 50 | 0.3% |
| Swiss | 15 | 0.1% |
| Thai | 102 | 0.6% |
| Welsh | 16 | 0.1% | View All 31 Rows |
Immigrants in Selma
The most numerous immigrant groups reported in Selma came from Asia (184 | 1.0%), South Central Asia (118 | 0.7%), Latin America (107 | 0.6%), India (102 | 0.6%), and Caribbean (100 | 0.6%), together accounting for 3.4% of all Selma residents.
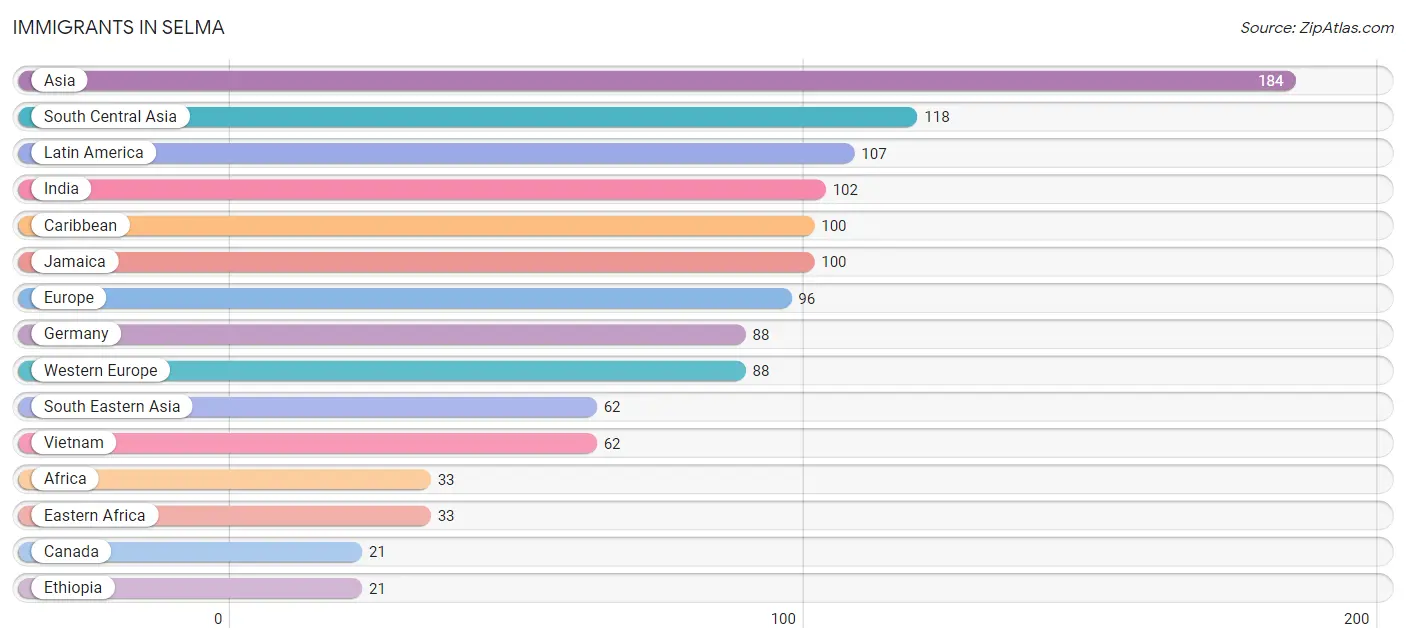
| Immigration Origin | # Population | % Population |
| Africa | 33 | 0.2% |
| Asia | 184 | 1.0% |
| Canada | 21 | 0.1% |
| Caribbean | 100 | 0.6% |
| Central America | 7 | 0.0% |
| Eastern Africa | 33 | 0.2% |
| Ethiopia | 21 | 0.1% |
| Europe | 96 | 0.5% |
| Germany | 88 | 0.5% |
| India | 102 | 0.6% |
| Jamaica | 100 | 0.6% |
| Latin America | 107 | 0.6% |
| Mexico | 7 | 0.0% |
| Northern Europe | 8 | 0.0% |
| Pakistan | 16 | 0.1% |
| South Central Asia | 118 | 0.7% |
| South Eastern Asia | 62 | 0.4% |
| Vietnam | 62 | 0.4% |
| Western Asia | 4 | 0.0% |
| Western Europe | 88 | 0.5% |
| Yemen | 4 | 0.0% | View All 21 Rows |
Sex and Age in Selma
Sex and Age in Selma
The most populous age groups in Selma are 15 to 19 Years (904 | 11.6%) for men and 60 to 64 Years (1,003 | 9.9%) for women.
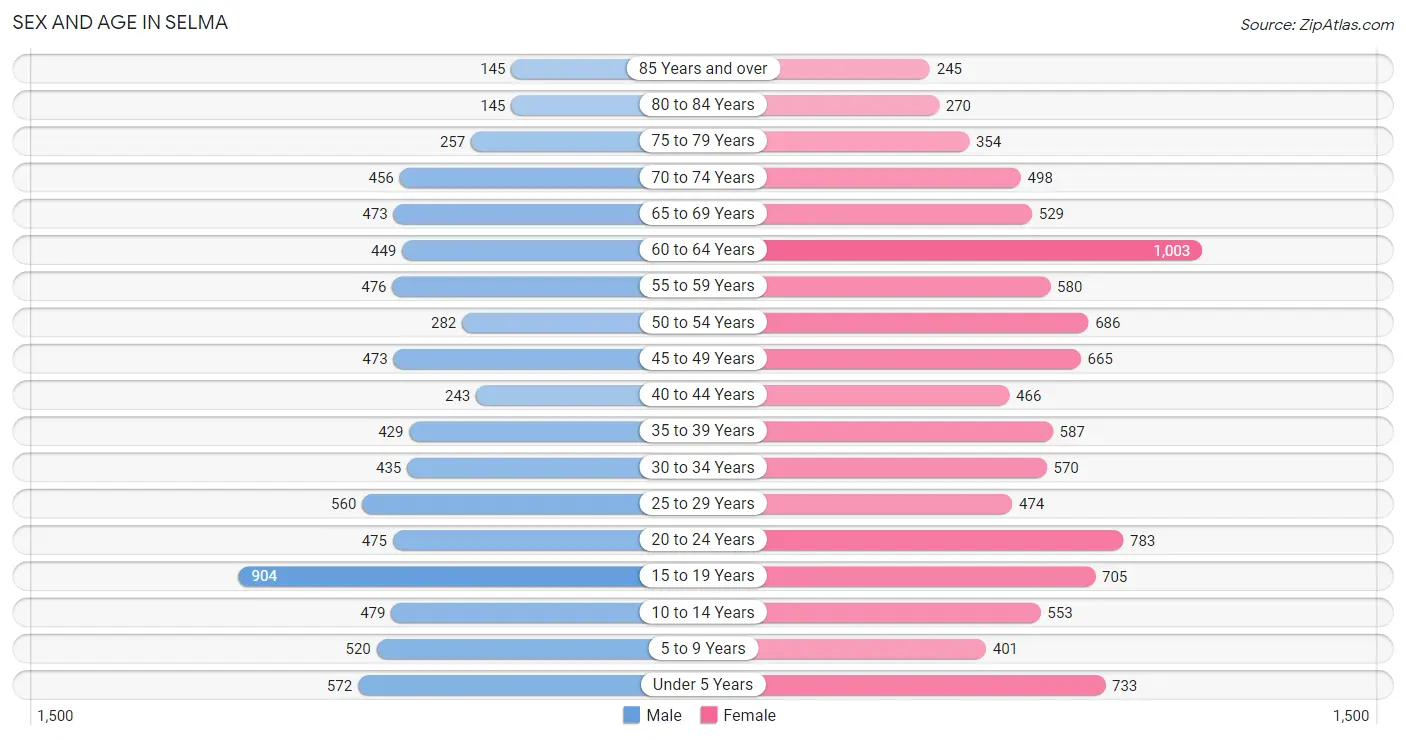
| Age Bracket | Male | Female |
| Under 5 Years | 572 (7.4%) | 733 (7.3%) |
| 5 to 9 Years | 520 (6.7%) | 401 (4.0%) |
| 10 to 14 Years | 479 (6.2%) | 553 (5.5%) |
| 15 to 19 Years | 904 (11.6%) | 705 (7.0%) |
| 20 to 24 Years | 475 (6.1%) | 783 (7.7%) |
| 25 to 29 Years | 560 (7.2%) | 474 (4.7%) |
| 30 to 34 Years | 435 (5.6%) | 570 (5.6%) |
| 35 to 39 Years | 429 (5.5%) | 587 (5.8%) |
| 40 to 44 Years | 243 (3.1%) | 466 (4.6%) |
| 45 to 49 Years | 473 (6.1%) | 665 (6.6%) |
| 50 to 54 Years | 282 (3.6%) | 686 (6.8%) |
| 55 to 59 Years | 476 (6.1%) | 580 (5.7%) |
| 60 to 64 Years | 449 (5.8%) | 1,003 (9.9%) |
| 65 to 69 Years | 473 (6.1%) | 529 (5.2%) |
| 70 to 74 Years | 456 (5.9%) | 498 (4.9%) |
| 75 to 79 Years | 257 (3.3%) | 354 (3.5%) |
| 80 to 84 Years | 145 (1.9%) | 270 (2.7%) |
| 85 Years and over | 145 (1.9%) | 245 (2.4%) |
| Total | 7,773 (100.0%) | 10,102 (100.0%) |
Families and Households in Selma
Median Family Size in Selma
The median family size in Selma is 3.55 persons per family, with single female/mother families (1,617 | 43.9%) accounting for the largest median family size of 4.25 persons per family. On the other hand, single male/father families (494 | 13.4%) represent the smallest median family size with 2.98 persons per family.
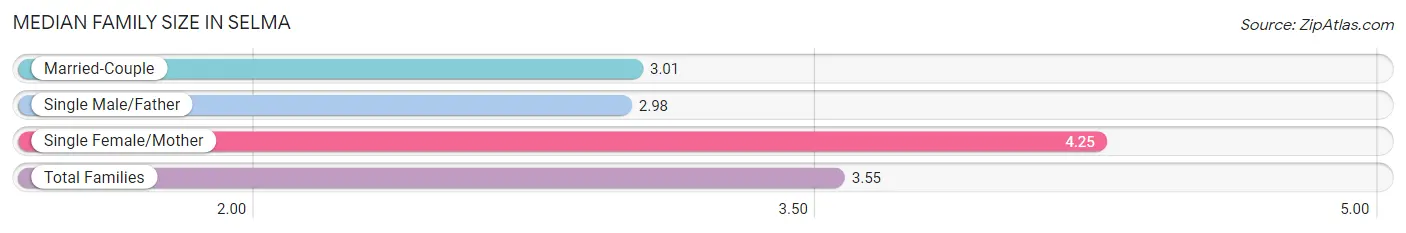
| Family Type | # Families | Family Size |
| Married-Couple | 1,572 (42.7%) | 3.01 |
| Single Male/Father | 494 (13.4%) | 2.98 |
| Single Female/Mother | 1,617 (43.9%) | 4.25 |
| Total Families | 3,683 (100.0%) | 3.55 |
Median Household Size in Selma
The median household size in Selma is 2.33 persons per household, with single female/mother households (1,617 | 21.7%) accounting for the largest median household size of 4.33 persons per household. non-family households (3,773 | 50.6%) represent the smallest median household size with 1.07 persons per household.
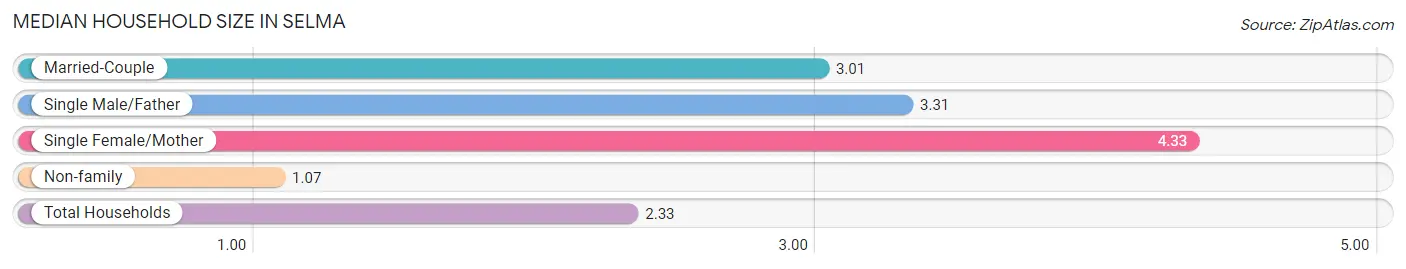
| Household Type | # Households | Household Size |
| Married-Couple | 1,572 (21.1%) | 3.01 |
| Single Male/Father | 494 (6.6%) | 3.31 |
| Single Female/Mother | 1,617 (21.7%) | 4.33 |
| Non-family | 3,773 (50.6%) | 1.07 |
| Total Households | 7,456 (100.0%) | 2.33 |
Household Size by Marriage Status in Selma
Out of a total of 7,456 households in Selma, 3,683 (49.4%) are family households, while 3,773 (50.6%) are nonfamily households. The most numerous type of family households are 2-person households, comprising 1,824, and the most common type of nonfamily households are 1-person households, comprising 3,580.
| Household Size | Family Households | Nonfamily Households |
| 1-Person Households | - | 3,580 (48.0%) |
| 2-Person Households | 1,824 (24.5%) | 193 (2.6%) |
| 3-Person Households | 1,065 (14.3%) | 0 (0.0%) |
| 4-Person Households | 337 (4.5%) | 0 (0.0%) |
| 5-Person Households | 330 (4.4%) | 0 (0.0%) |
| 6-Person Households | 68 (0.9%) | 0 (0.0%) |
| 7+ Person Households | 59 (0.8%) | 0 (0.0%) |
| Total | 3,683 (49.4%) | 3,773 (50.6%) |
Female Fertility in Selma
Fertility by Age in Selma
Average fertility rate in Selma is 32.0 births per 1,000 women. Women in the age bracket of 20 to 34 years have the highest fertility rate with 76.0 births per 1,000 women. Women in the age bracket of 20 to 34 years acount for 100.0% of all women with births.
| Age Bracket | Women with Births | Births / 1,000 Women |
| 15 to 19 years | 0 (0.0%) | 0.0 |
| 20 to 34 years | 138 (100.0%) | 76.0 |
| 35 to 50 years | 0 (0.0%) | 0.0 |
| Total | 138 (100.0%) | 32.0 |
Fertility by Age by Marriage Status in Selma
75.4% of women with births (138) in Selma are married. The highest percentage of unmarried women with births falls into 20 to 34 years age bracket with 24.6% of them unmarried at the time of birth, while the lowest percentage of unmarried women with births belong to 20 to 34 years age bracket with 24.6% of them unmarried.
| Age Bracket | Married | Unmarried |
| 15 to 19 years | 0 (0.0%) | 0 (0.0%) |
| 20 to 34 years | 104 (75.4%) | 34 (24.6%) |
| 35 to 50 years | 0 (0.0%) | 0 (0.0%) |
| Total | 104 (75.4%) | 34 (24.6%) |
Fertility by Education in Selma
Average fertility rate in Selma is 32.0 births per 1,000 women. Women with the education attainment of college or associate's degree have the highest fertility rate of 54.0 births per 1,000 women, while women with the education attainment of less than high school have the lowest fertility at 6.0 births per 1,000 women. Women with the education attainment of college or associate's degree represent 49.3% of all women with births.
| Educational Attainment | Women with Births | Births / 1,000 Women |
| Less than High School | 5 (3.6%) | 6.0 |
| High School Diploma | 50 (36.2%) | 33.0 |
| College or Associate's Degree | 68 (49.3%) | 54.0 |
| Bachelor's Degree | 11 (8.0%) | 21.0 |
| Graduate Degree | 4 (2.9%) | 19.0 |
| Total | 138 (100.0%) | 32.0 |
Fertility by Education by Marriage Status in Selma
24.6% of women with births in Selma are unmarried. Women with the educational attainment of bachelor's degree are most likely to be married with 100.0% of them married at childbirth, while women with the educational attainment of less than high school are least likely to be married with 100.0% of them unmarried at childbirth.
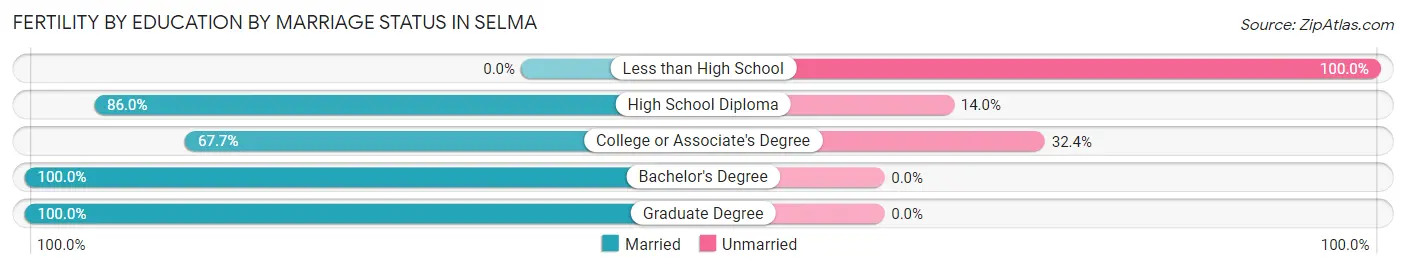
| Educational Attainment | Married | Unmarried |
| Less than High School | 0 (0.0%) | 5 (100.0%) |
| High School Diploma | 43 (86.0%) | 7 (14.0%) |
| College or Associate's Degree | 46 (67.6%) | 22 (32.4%) |
| Bachelor's Degree | 11 (100.0%) | 0 (0.0%) |
| Graduate Degree | 4 (100.0%) | 0 (0.0%) |
| Total | 104 (75.4%) | 34 (24.6%) |
Employment Characteristics in Selma
Employment by Class of Employer in Selma
Among the 6,179 employed individuals in Selma, private company employees (4,477 | 72.5%), local government employees (555 | 9.0%), and state government employees (392 | 6.3%) make up the most common classes of employment.
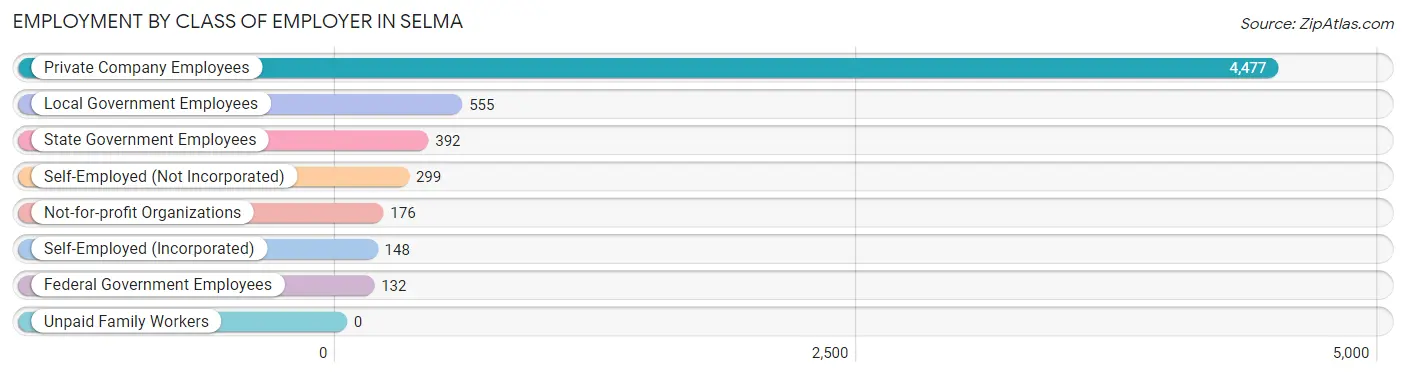
| Employer Class | # Employees | % Employees |
| Private Company Employees | 4,477 | 72.5% |
| Self-Employed (Incorporated) | 148 | 2.4% |
| Self-Employed (Not Incorporated) | 299 | 4.8% |
| Not-for-profit Organizations | 176 | 2.9% |
| Local Government Employees | 555 | 9.0% |
| State Government Employees | 392 | 6.3% |
| Federal Government Employees | 132 | 2.1% |
| Unpaid Family Workers | 0 | 0.0% |
| Total | 6,179 | 100.0% |
Employment Status by Age in Selma
According to the labor force statistics for Selma, out of the total population over 16 years of age (14,227), 50.2% or 7,142 individuals are in the labor force, with 12.9% or 921 of them unemployed. The age group with the highest labor force participation rate is 30 to 34 years, with 92.2% or 927 individuals in the labor force. Within the labor force, the 20 to 24 years age range has the highest percentage of unemployed individuals, with 33.4% or 326 of them being unemployed.
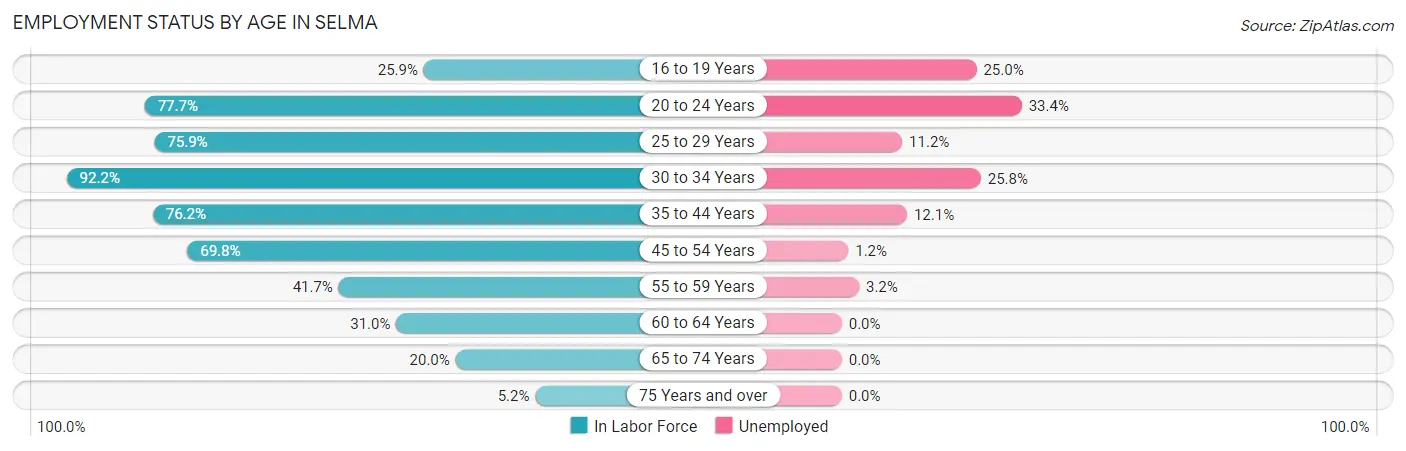
| Age Bracket | In Labor Force | Unemployed |
| 16 to 19 Years | 316 (25.9%) | 79 (25.0%) |
| 20 to 24 Years | 977 (77.7%) | 326 (33.4%) |
| 25 to 29 Years | 785 (75.9%) | 88 (11.2%) |
| 30 to 34 Years | 927 (92.2%) | 239 (25.8%) |
| 35 to 44 Years | 1,314 (76.2%) | 159 (12.1%) |
| 45 to 54 Years | 1,470 (69.8%) | 18 (1.2%) |
| 55 to 59 Years | 440 (41.7%) | 14 (3.2%) |
| 60 to 64 Years | 450 (31.0%) | 0 (0.0%) |
| 65 to 74 Years | 391 (20.0%) | 0 (0.0%) |
| 75 Years and over | 74 (5.2%) | 0 (0.0%) |
| Total | 7,142 (50.2%) | 921 (12.9%) |
Employment Status by Educational Attainment in Selma
According to labor force statistics for Selma, 64.3% of individuals (5,387) out of the total population between 25 and 64 years of age (8,378) are in the labor force, with 9.6% or 517 of them being unemployed. The group with the highest labor force participation rate are those with the educational attainment of bachelor's degree or higher, with 90.5% or 1,328 individuals in the labor force. Within the labor force, individuals with high school diploma education have the highest percentage of unemployment, with 18.2% or 304 of them being unemployed.
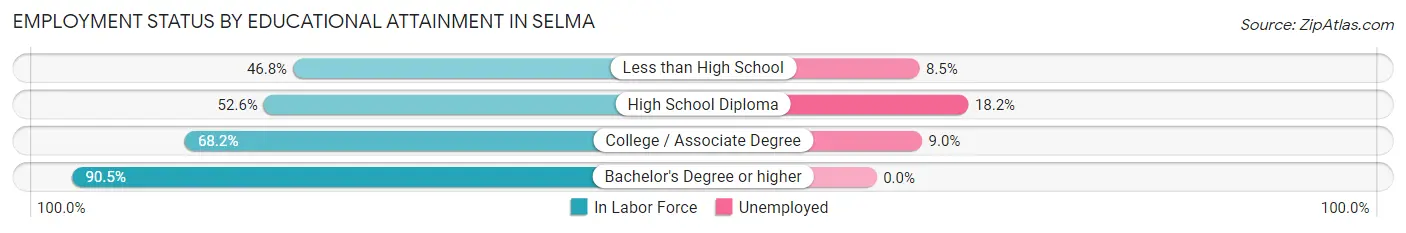
| Educational Attainment | In Labor Force | Unemployed |
| Less than High School | 355 (46.8%) | 64 (8.5%) |
| High School Diploma | 1,671 (52.6%) | 578 (18.2%) |
| College / Associate Degree | 2,030 (68.2%) | 268 (9.0%) |
| Bachelor's Degree or higher | 1,328 (90.5%) | 0 (0.0%) |
| Total | 5,387 (64.3%) | 804 (9.6%) |
Employment Occupations by Sex in Selma
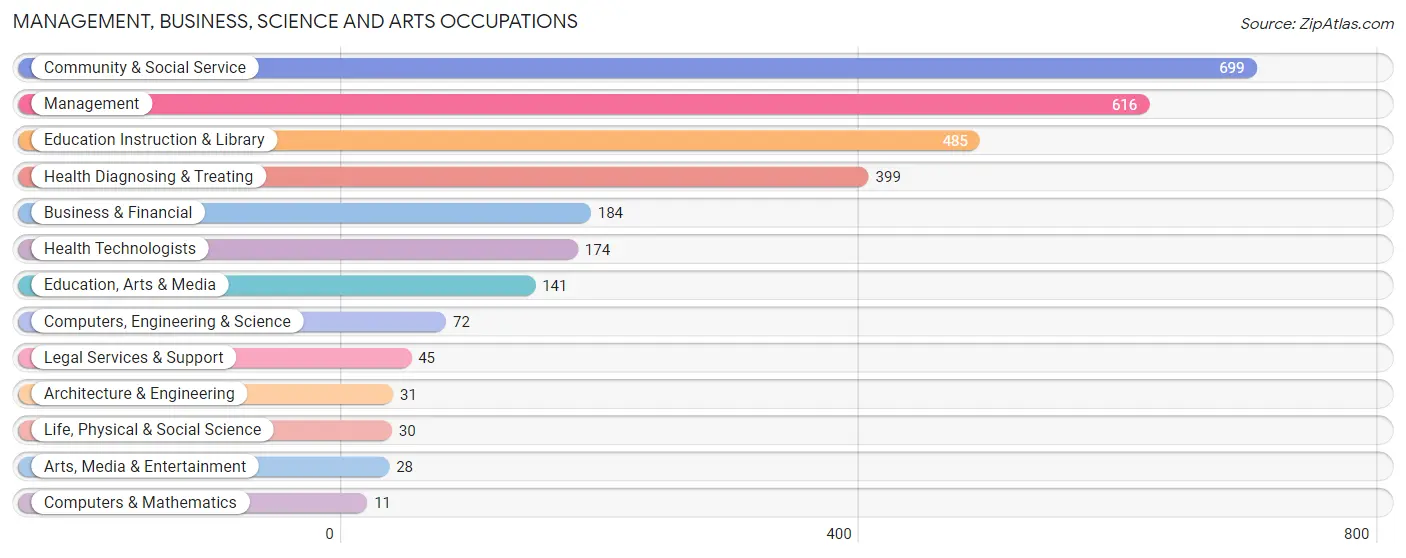
Management, Business, Science and Arts Occupations
The most common Management, Business, Science and Arts occupations in Selma are Community & Social Service (699 | 11.2%), Management (616 | 9.9%), Education Instruction & Library (485 | 7.8%), Health Diagnosing & Treating (399 | 6.4%), and Business & Financial (184 | 3.0%).
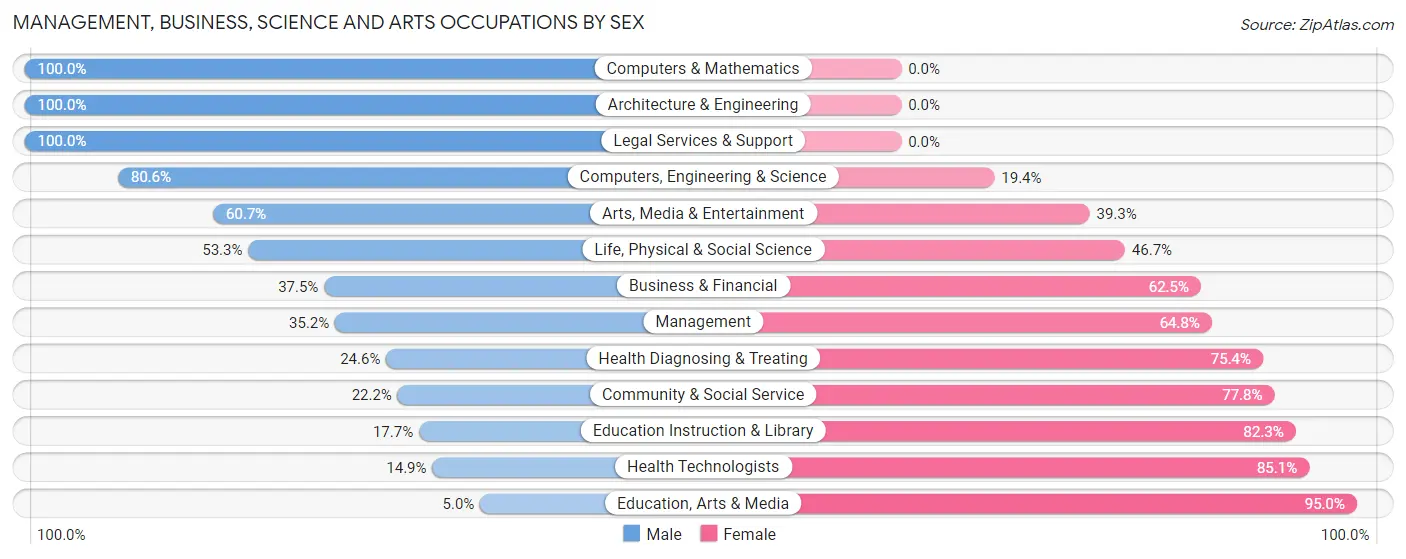
Management, Business, Science and Arts Occupations by Sex
Within the Management, Business, Science and Arts occupations in Selma, the most male-oriented occupations are Computers & Mathematics (100.0%), Architecture & Engineering (100.0%), and Legal Services & Support (100.0%), while the most female-oriented occupations are Education, Arts & Media (95.0%), Health Technologists (85.1%), and Education Instruction & Library (82.3%).
| Occupation | Male | Female |
| Management | 217 (35.2%) | 399 (64.8%) |
| Business & Financial | 69 (37.5%) | 115 (62.5%) |
| Computers, Engineering & Science | 58 (80.6%) | 14 (19.4%) |
| Computers & Mathematics | 11 (100.0%) | 0 (0.0%) |
| Architecture & Engineering | 31 (100.0%) | 0 (0.0%) |
| Life, Physical & Social Science | 16 (53.3%) | 14 (46.7%) |
| Community & Social Service | 155 (22.2%) | 544 (77.8%) |
| Education, Arts & Media | 7 (5.0%) | 134 (95.0%) |
| Legal Services & Support | 45 (100.0%) | 0 (0.0%) |
| Education Instruction & Library | 86 (17.7%) | 399 (82.3%) |
| Arts, Media & Entertainment | 17 (60.7%) | 11 (39.3%) |
| Health Diagnosing & Treating | 98 (24.6%) | 301 (75.4%) |
| Health Technologists | 26 (14.9%) | 148 (85.1%) |
| Total (Category) | 597 (30.3%) | 1,373 (69.7%) |
| Total (Overall) | 2,916 (46.9%) | 3,305 (53.1%) |
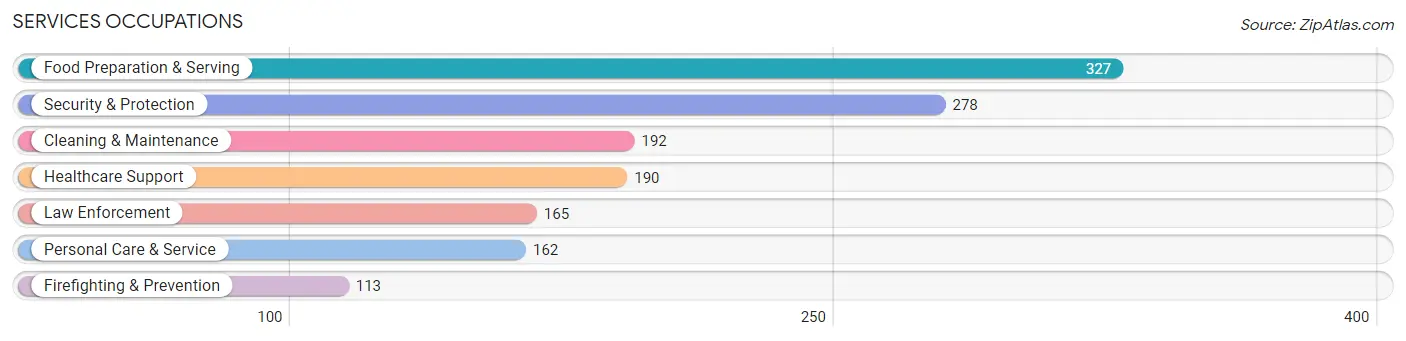
Services Occupations
The most common Services occupations in Selma are Food Preparation & Serving (327 | 5.3%), Security & Protection (278 | 4.5%), Cleaning & Maintenance (192 | 3.1%), Healthcare Support (190 | 3.0%), and Law Enforcement (165 | 2.6%).
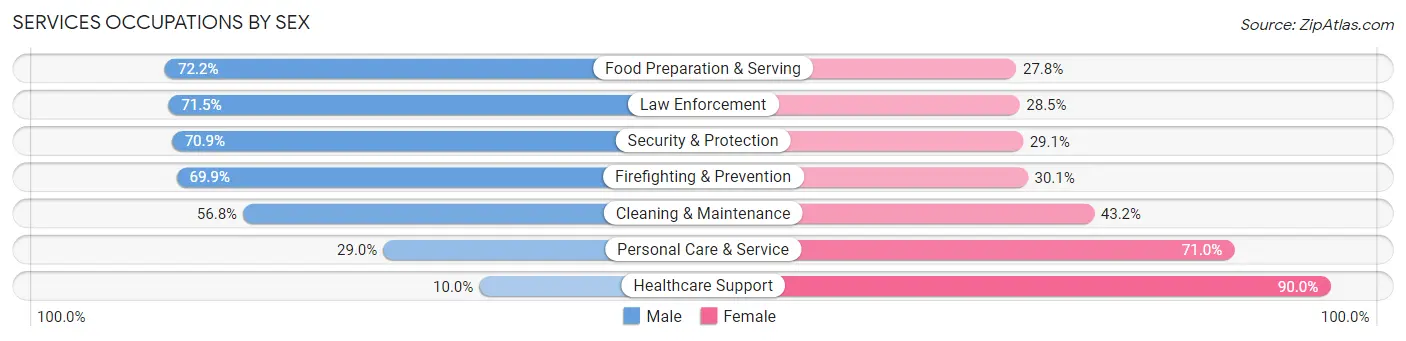
Services Occupations by Sex
Within the Services occupations in Selma, the most male-oriented occupations are Food Preparation & Serving (72.2%), Law Enforcement (71.5%), and Security & Protection (70.9%), while the most female-oriented occupations are Healthcare Support (90.0%), Personal Care & Service (71.0%), and Cleaning & Maintenance (43.2%).
| Occupation | Male | Female |
| Healthcare Support | 19 (10.0%) | 171 (90.0%) |
| Security & Protection | 197 (70.9%) | 81 (29.1%) |
| Firefighting & Prevention | 79 (69.9%) | 34 (30.1%) |
| Law Enforcement | 118 (71.5%) | 47 (28.5%) |
| Food Preparation & Serving | 236 (72.2%) | 91 (27.8%) |
| Cleaning & Maintenance | 109 (56.8%) | 83 (43.2%) |
| Personal Care & Service | 47 (29.0%) | 115 (71.0%) |
| Total (Category) | 608 (52.9%) | 541 (47.1%) |
| Total (Overall) | 2,916 (46.9%) | 3,305 (53.1%) |
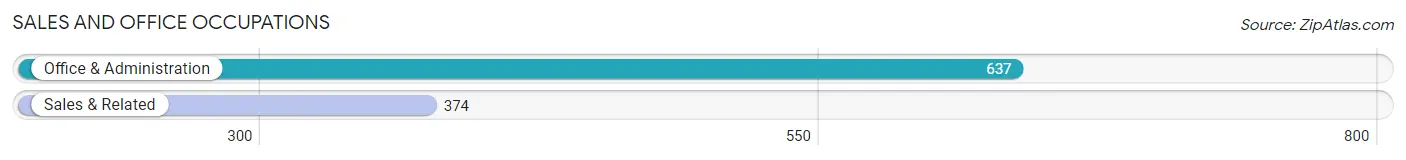
Sales and Office Occupations
The most common Sales and Office occupations in Selma are Office & Administration (637 | 10.2%), and Sales & Related (374 | 6.0%).
Sales and Office Occupations by Sex
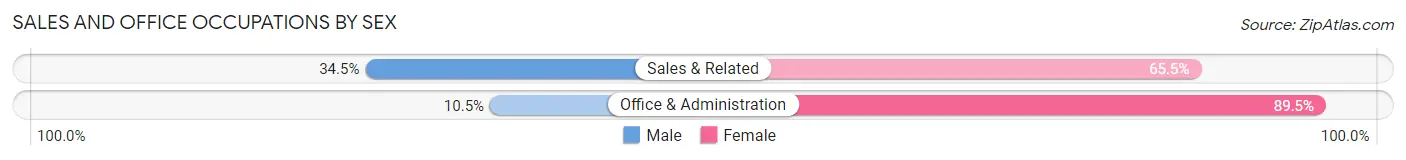
| Occupation | Male | Female |
| Sales & Related | 129 (34.5%) | 245 (65.5%) |
| Office & Administration | 67 (10.5%) | 570 (89.5%) |
| Total (Category) | 196 (19.4%) | 815 (80.6%) |
| Total (Overall) | 2,916 (46.9%) | 3,305 (53.1%) |
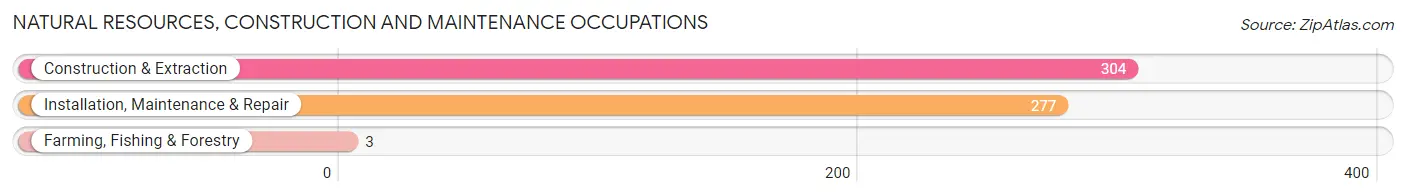
Natural Resources, Construction and Maintenance Occupations
The most common Natural Resources, Construction and Maintenance occupations in Selma are Construction & Extraction (304 | 4.9%), Installation, Maintenance & Repair (277 | 4.4%), and Farming, Fishing & Forestry (3 | 0.1%).
Natural Resources, Construction and Maintenance Occupations by Sex
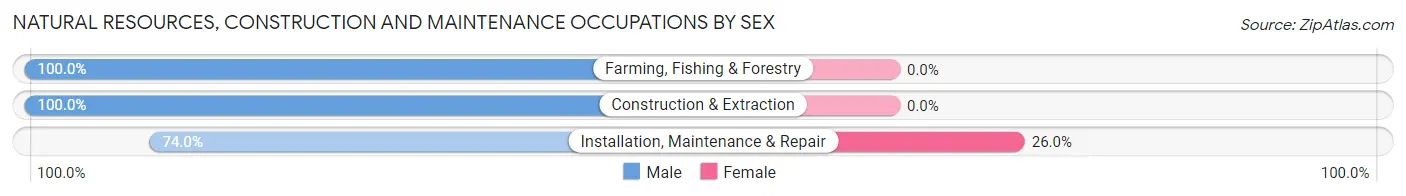
| Occupation | Male | Female |
| Farming, Fishing & Forestry | 3 (100.0%) | 0 (0.0%) |
| Construction & Extraction | 304 (100.0%) | 0 (0.0%) |
| Installation, Maintenance & Repair | 205 (74.0%) | 72 (26.0%) |
| Total (Category) | 512 (87.7%) | 72 (12.3%) |
| Total (Overall) | 2,916 (46.9%) | 3,305 (53.1%) |
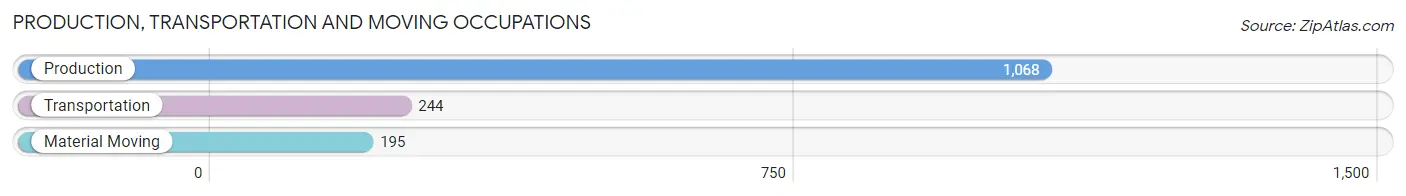
Production, Transportation and Moving Occupations
The most common Production, Transportation and Moving occupations in Selma are Production (1,068 | 17.2%), Transportation (244 | 3.9%), and Material Moving (195 | 3.1%).
Production, Transportation and Moving Occupations by Sex
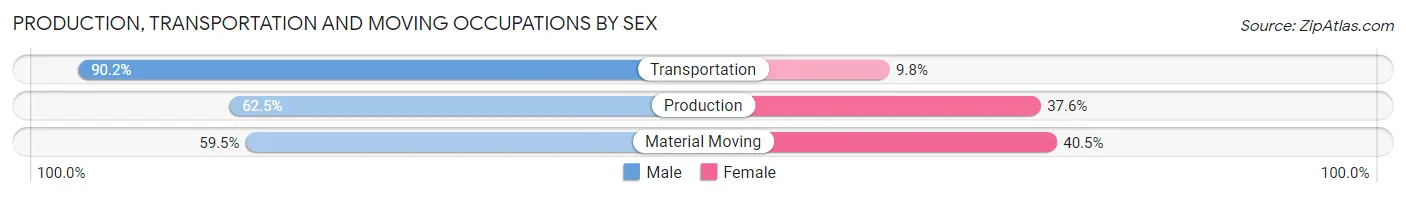
| Occupation | Male | Female |
| Production | 667 (62.5%) | 401 (37.6%) |
| Transportation | 220 (90.2%) | 24 (9.8%) |
| Material Moving | 116 (59.5%) | 79 (40.5%) |
| Total (Category) | 1,003 (66.6%) | 504 (33.4%) |
| Total (Overall) | 2,916 (46.9%) | 3,305 (53.1%) |
Employment Industries by Sex in Selma
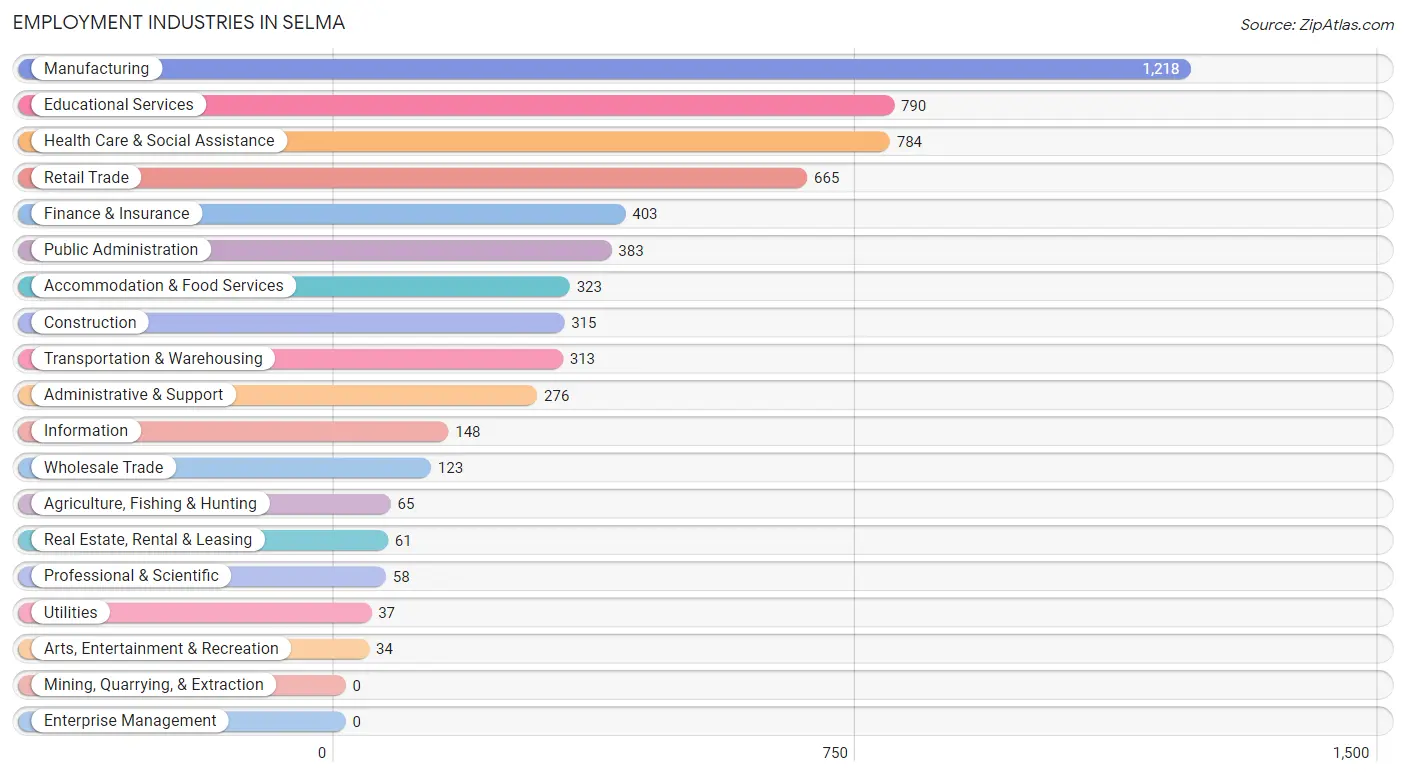
Employment Industries in Selma
The major employment industries in Selma include Manufacturing (1,218 | 19.6%), Educational Services (790 | 12.7%), Health Care & Social Assistance (784 | 12.6%), Retail Trade (665 | 10.7%), and Finance & Insurance (403 | 6.5%).
Employment Industries by Sex in Selma
The Selma industries that see more men than women are Construction (98.7%), Agriculture, Fishing & Hunting (89.2%), and Professional & Scientific (77.6%), whereas the industries that tend to have a higher number of women are Utilities (94.6%), Finance & Insurance (85.4%), and Health Care & Social Assistance (78.8%).
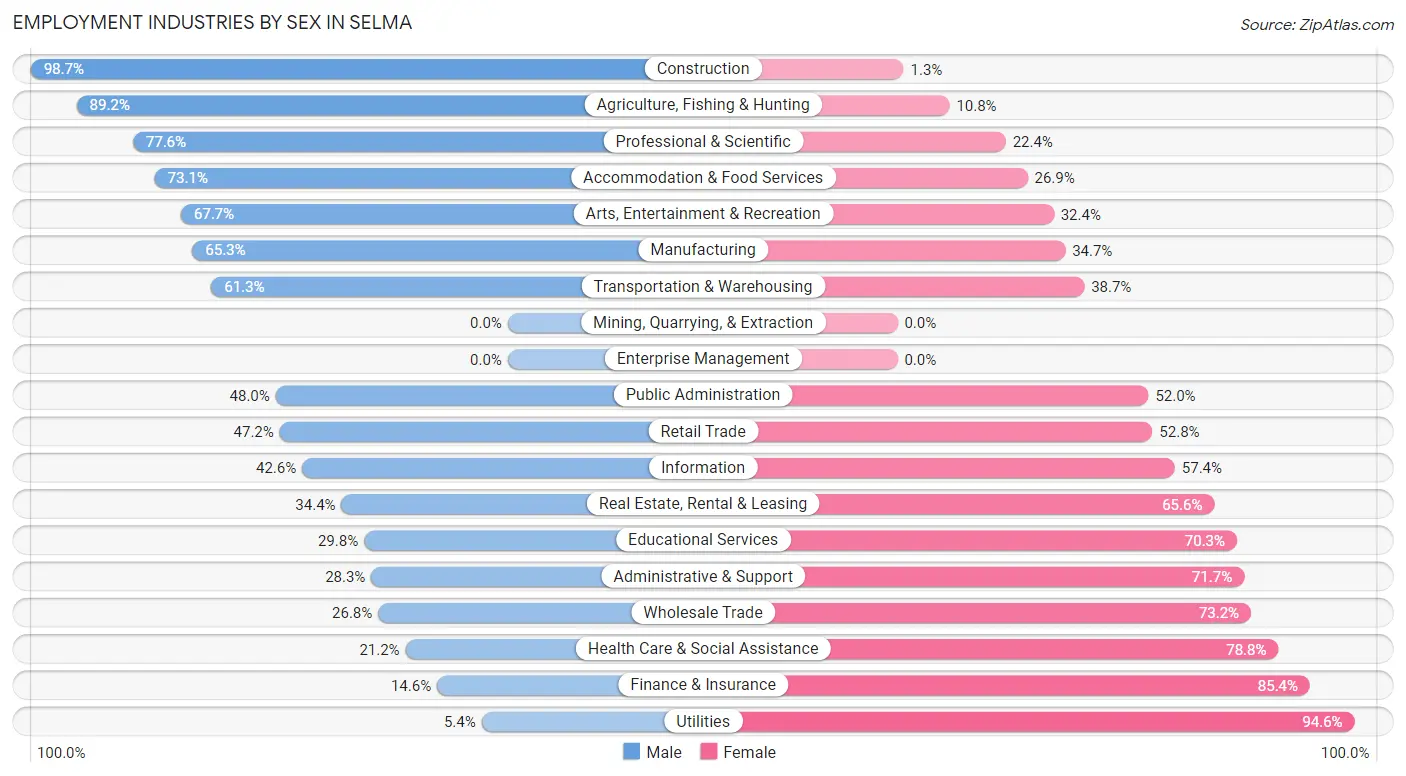
| Industry | Male | Female |
| Agriculture, Fishing & Hunting | 58 (89.2%) | 7 (10.8%) |
| Mining, Quarrying, & Extraction | 0 (0.0%) | 0 (0.0%) |
| Construction | 311 (98.7%) | 4 (1.3%) |
| Manufacturing | 795 (65.3%) | 423 (34.7%) |
| Wholesale Trade | 33 (26.8%) | 90 (73.2%) |
| Retail Trade | 314 (47.2%) | 351 (52.8%) |
| Transportation & Warehousing | 192 (61.3%) | 121 (38.7%) |
| Utilities | 2 (5.4%) | 35 (94.6%) |
| Information | 63 (42.6%) | 85 (57.4%) |
| Finance & Insurance | 59 (14.6%) | 344 (85.4%) |
| Real Estate, Rental & Leasing | 21 (34.4%) | 40 (65.6%) |
| Professional & Scientific | 45 (77.6%) | 13 (22.4%) |
| Enterprise Management | 0 (0.0%) | 0 (0.0%) |
| Administrative & Support | 78 (28.3%) | 198 (71.7%) |
| Educational Services | 235 (29.7%) | 555 (70.3%) |
| Health Care & Social Assistance | 166 (21.2%) | 618 (78.8%) |
| Arts, Entertainment & Recreation | 23 (67.6%) | 11 (32.4%) |
| Accommodation & Food Services | 236 (73.1%) | 87 (26.9%) |
| Public Administration | 184 (48.0%) | 199 (52.0%) |
| Total | 2,916 (46.9%) | 3,305 (53.1%) |
Education in Selma
School Enrollment in Selma
The most common levels of schooling among the 4,469 students in Selma are high school (1,347 | 30.1%), middle school (846 | 18.9%), and nursery / preschool (672 | 15.0%).
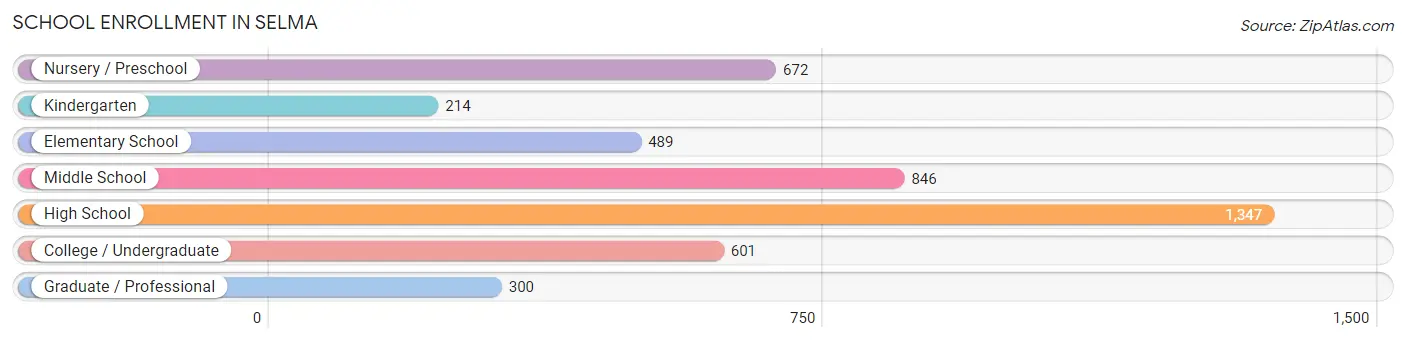
| School Level | # Students | % Students |
| Nursery / Preschool | 672 | 15.0% |
| Kindergarten | 214 | 4.8% |
| Elementary School | 489 | 10.9% |
| Middle School | 846 | 18.9% |
| High School | 1,347 | 30.1% |
| College / Undergraduate | 601 | 13.5% |
| Graduate / Professional | 300 | 6.7% |
| Total | 4,469 | 100.0% |
School Enrollment by Age by Funding Source in Selma
Out of a total of 4,469 students who are enrolled in schools in Selma, 639 (14.3%) attend a private institution, while the remaining 3,830 (85.7%) are enrolled in public schools. The age group of 3 to 4 year olds has the highest likelihood of being enrolled in private schools, with 186 (36.8% in the age bracket) enrolled. Conversely, the age group of 35 years and over has the lowest likelihood of being enrolled in a private school, with 247 (98.8% in the age bracket) attending a public institution.
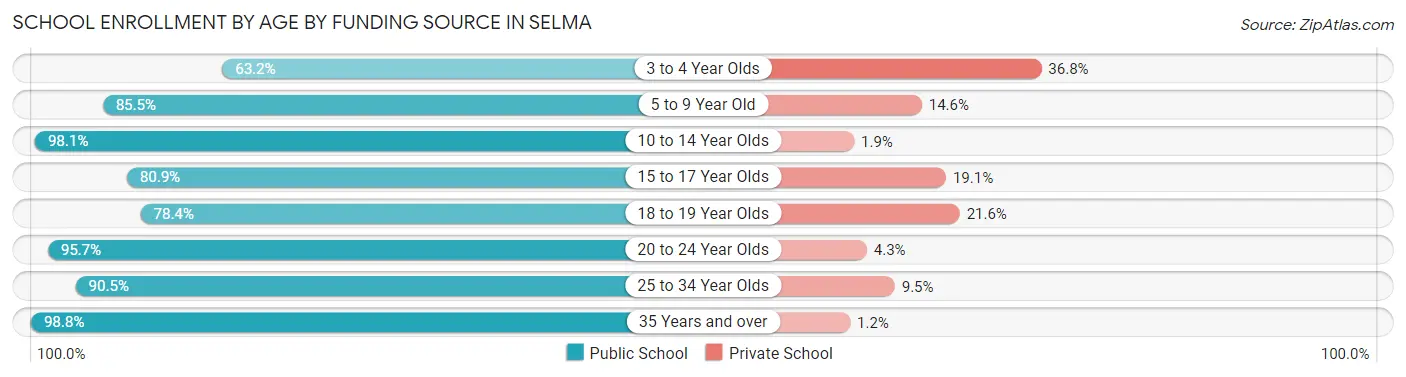
| Age Bracket | Public School | Private School |
| 3 to 4 Year Olds | 319 (63.2%) | 186 (36.8%) |
| 5 to 9 Year Old | 728 (85.5%) | 124 (14.5%) |
| 10 to 14 Year Olds | 1,010 (98.1%) | 20 (1.9%) |
| 15 to 17 Year Olds | 828 (80.9%) | 195 (19.1%) |
| 18 to 19 Year Olds | 301 (78.4%) | 83 (21.6%) |
| 20 to 24 Year Olds | 266 (95.7%) | 12 (4.3%) |
| 25 to 34 Year Olds | 133 (90.5%) | 14 (9.5%) |
| 35 Years and over | 247 (98.8%) | 3 (1.2%) |
| Total | 3,830 (85.7%) | 639 (14.3%) |
Educational Attainment by Field of Study in Selma
Business (697 | 27.7%), education (648 | 25.7%), arts & humanities (248 | 9.8%), social sciences (211 | 8.4%), and science & technology (169 | 6.7%) are the most common fields of study among 2,520 individuals in Selma who have obtained a bachelor's degree or higher.
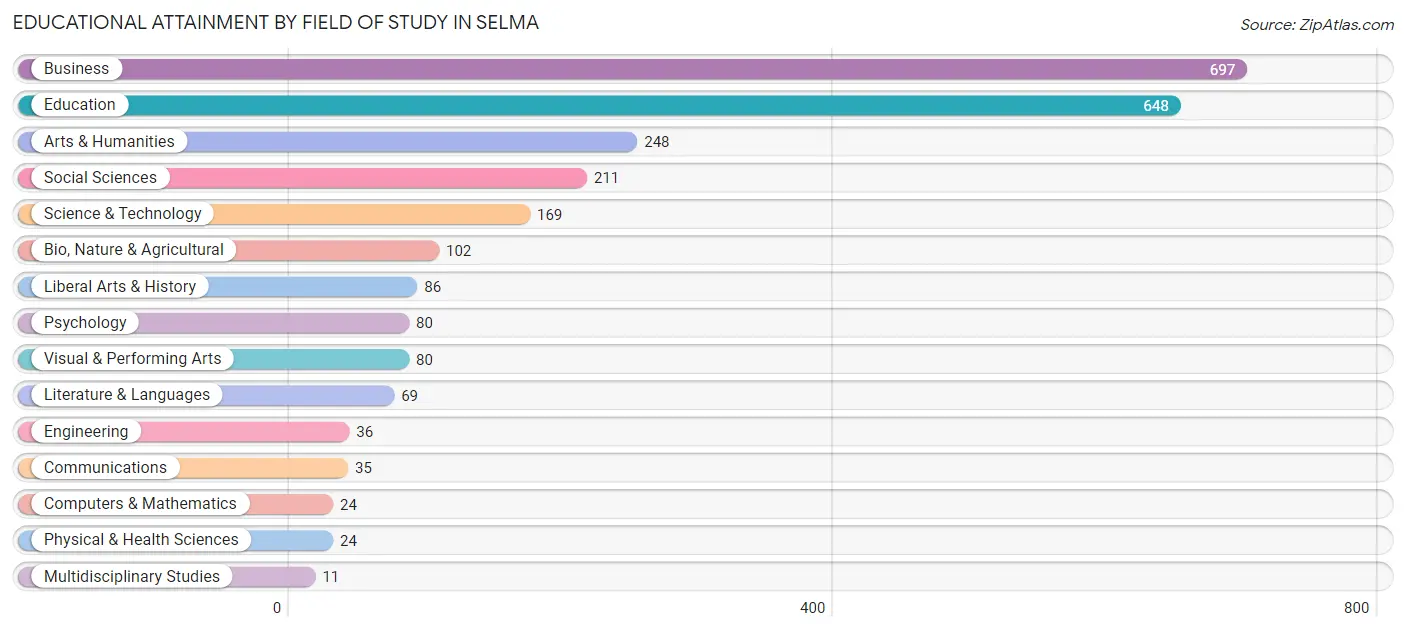
| Field of Study | # Graduates | % Graduates |
| Computers & Mathematics | 24 | 0.9% |
| Bio, Nature & Agricultural | 102 | 4.1% |
| Physical & Health Sciences | 24 | 0.9% |
| Psychology | 80 | 3.2% |
| Social Sciences | 211 | 8.4% |
| Engineering | 36 | 1.4% |
| Multidisciplinary Studies | 11 | 0.4% |
| Science & Technology | 169 | 6.7% |
| Business | 697 | 27.7% |
| Education | 648 | 25.7% |
| Literature & Languages | 69 | 2.7% |
| Liberal Arts & History | 86 | 3.4% |
| Visual & Performing Arts | 80 | 3.2% |
| Communications | 35 | 1.4% |
| Arts & Humanities | 248 | 9.8% |
| Total | 2,520 | 100.0% |
Transportation & Commute in Selma
Vehicle Availability by Sex in Selma
The most prevalent vehicle ownership categories in Selma are males with 2 vehicles (1,135, accounting for 39.9%) and females with 2 vehicles (998, making up 34.6%).
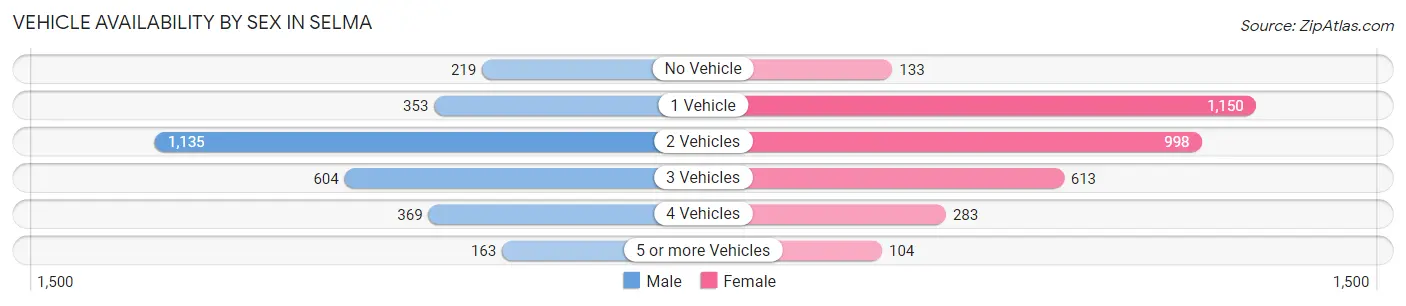
| Vehicles Available | Male | Female |
| No Vehicle | 219 (7.7%) | 133 (4.1%) |
| 1 Vehicle | 353 (12.4%) | 1,150 (35.0%) |
| 2 Vehicles | 1,135 (39.9%) | 998 (30.4%) |
| 3 Vehicles | 604 (21.2%) | 613 (18.7%) |
| 4 Vehicles | 369 (13.0%) | 283 (8.6%) |
| 5 or more Vehicles | 163 (5.7%) | 104 (3.2%) |
| Total | 2,843 (100.0%) | 3,281 (100.0%) |
Commute Time in Selma
The most frequently occuring commute durations in Selma are 15 to 19 minutes (1,374 commuters, 23.3%), 5 to 9 minutes (853 commuters, 14.4%), and 10 to 14 minutes (820 commuters, 13.9%).
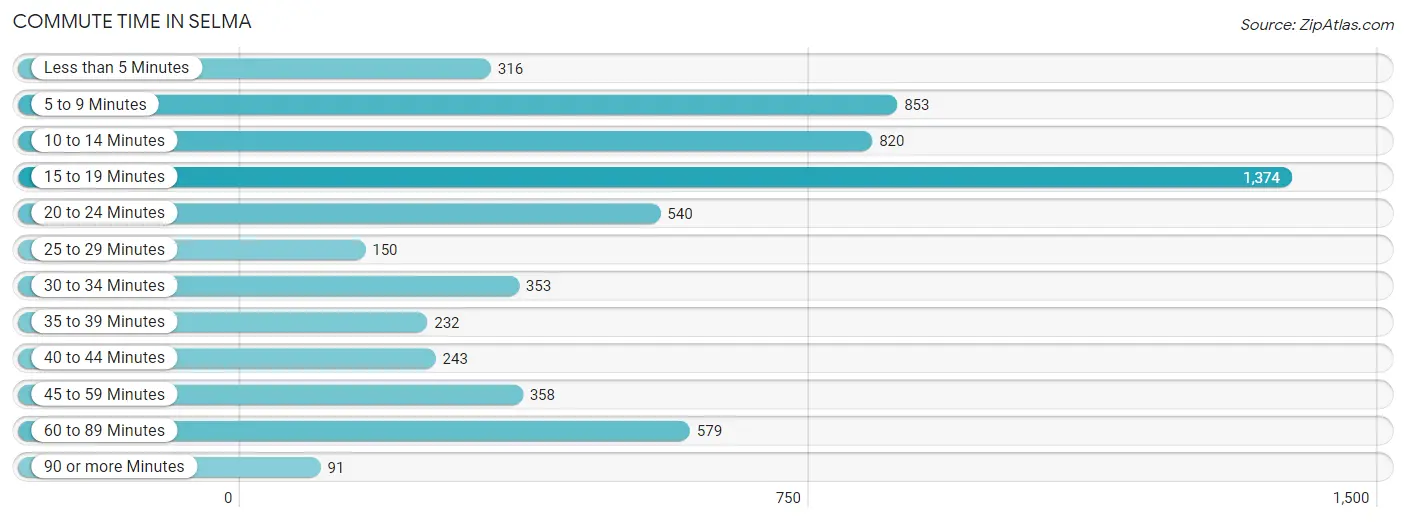
| Commute Time | # Commuters | % Commuters |
| Less than 5 Minutes | 316 | 5.3% |
| 5 to 9 Minutes | 853 | 14.4% |
| 10 to 14 Minutes | 820 | 13.9% |
| 15 to 19 Minutes | 1,374 | 23.3% |
| 20 to 24 Minutes | 540 | 9.1% |
| 25 to 29 Minutes | 150 | 2.5% |
| 30 to 34 Minutes | 353 | 6.0% |
| 35 to 39 Minutes | 232 | 3.9% |
| 40 to 44 Minutes | 243 | 4.1% |
| 45 to 59 Minutes | 358 | 6.1% |
| 60 to 89 Minutes | 579 | 9.8% |
| 90 or more Minutes | 91 | 1.5% |
Commute Time by Sex in Selma
The most common commute times in Selma are 15 to 19 minutes (746 commuters, 26.7%) for males and 15 to 19 minutes (628 commuters, 20.2%) for females.
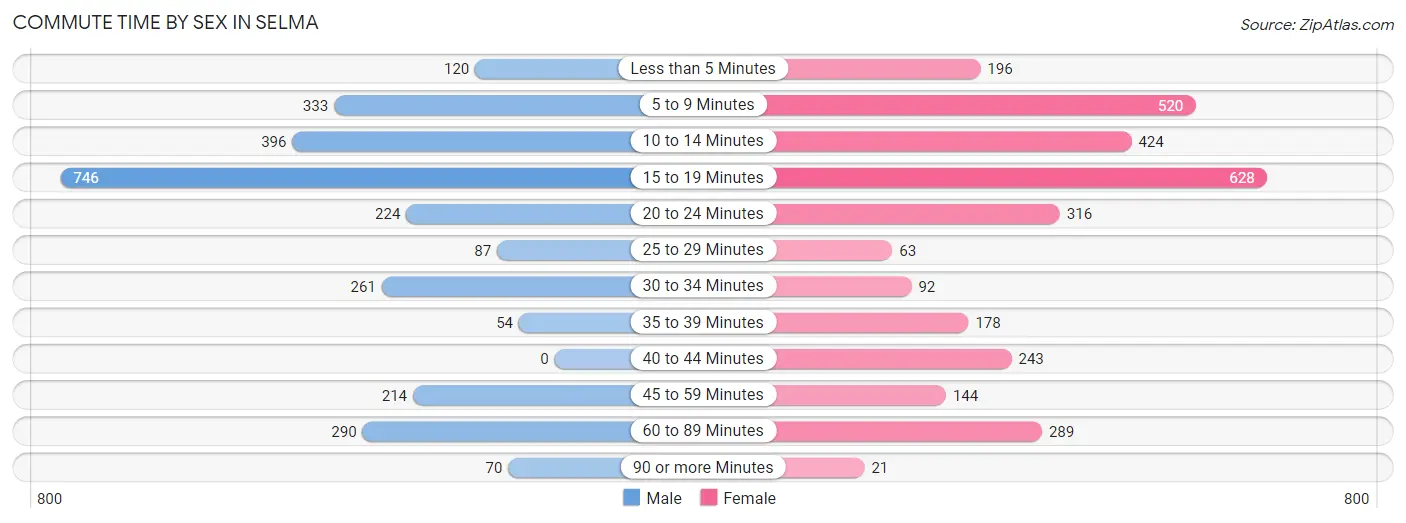
| Commute Time | Male | Female |
| Less than 5 Minutes | 120 (4.3%) | 196 (6.3%) |
| 5 to 9 Minutes | 333 (11.9%) | 520 (16.7%) |
| 10 to 14 Minutes | 396 (14.2%) | 424 (13.6%) |
| 15 to 19 Minutes | 746 (26.7%) | 628 (20.2%) |
| 20 to 24 Minutes | 224 (8.0%) | 316 (10.2%) |
| 25 to 29 Minutes | 87 (3.1%) | 63 (2.0%) |
| 30 to 34 Minutes | 261 (9.3%) | 92 (2.9%) |
| 35 to 39 Minutes | 54 (1.9%) | 178 (5.7%) |
| 40 to 44 Minutes | 0 (0.0%) | 243 (7.8%) |
| 45 to 59 Minutes | 214 (7.7%) | 144 (4.6%) |
| 60 to 89 Minutes | 290 (10.4%) | 289 (9.3%) |
| 90 or more Minutes | 70 (2.5%) | 21 (0.7%) |
Time of Departure to Work by Sex in Selma
The most frequent times of departure to work in Selma are 7:00 AM to 7:29 AM (523, 18.7%) for males and 7:00 AM to 7:29 AM (633, 20.3%) for females.
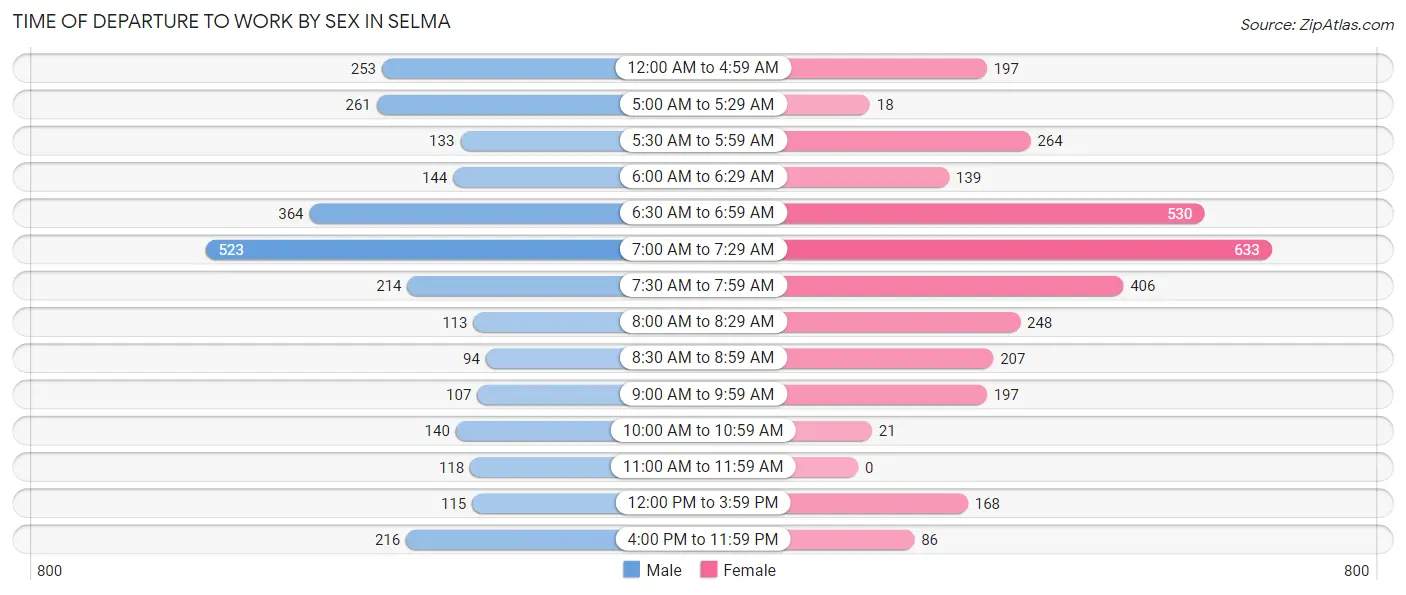
| Time of Departure | Male | Female |
| 12:00 AM to 4:59 AM | 253 (9.0%) | 197 (6.3%) |
| 5:00 AM to 5:29 AM | 261 (9.3%) | 18 (0.6%) |
| 5:30 AM to 5:59 AM | 133 (4.8%) | 264 (8.5%) |
| 6:00 AM to 6:29 AM | 144 (5.1%) | 139 (4.5%) |
| 6:30 AM to 6:59 AM | 364 (13.0%) | 530 (17.0%) |
| 7:00 AM to 7:29 AM | 523 (18.7%) | 633 (20.3%) |
| 7:30 AM to 7:59 AM | 214 (7.7%) | 406 (13.0%) |
| 8:00 AM to 8:29 AM | 113 (4.0%) | 248 (8.0%) |
| 8:30 AM to 8:59 AM | 94 (3.4%) | 207 (6.7%) |
| 9:00 AM to 9:59 AM | 107 (3.8%) | 197 (6.3%) |
| 10:00 AM to 10:59 AM | 140 (5.0%) | 21 (0.7%) |
| 11:00 AM to 11:59 AM | 118 (4.2%) | 0 (0.0%) |
| 12:00 PM to 3:59 PM | 115 (4.1%) | 168 (5.4%) |
| 4:00 PM to 11:59 PM | 216 (7.7%) | 86 (2.8%) |
| Total | 2,795 (100.0%) | 3,114 (100.0%) |
Housing Occupancy in Selma
Occupancy by Ownership in Selma
Of the total 7,456 dwellings in Selma, owner-occupied units account for 3,486 (46.8%), while renter-occupied units make up 3,970 (53.2%).
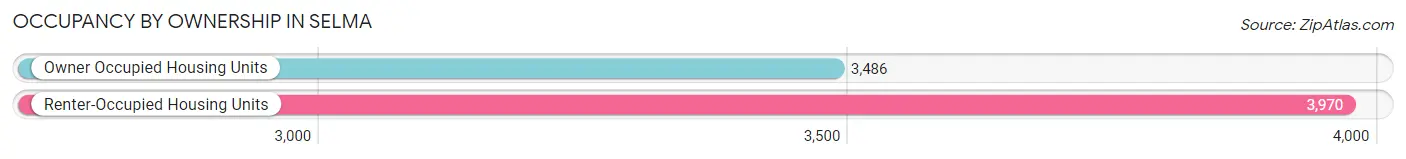
| Occupancy | # Housing Units | % Housing Units |
| Owner Occupied Housing Units | 3,486 | 46.8% |
| Renter-Occupied Housing Units | 3,970 | 53.2% |
| Total Occupied Housing Units | 7,456 | 100.0% |
Occupancy by Household Size in Selma
| Household Size | # Housing Units | % Housing Units |
| 1-Person Household | 3,580 | 48.0% |
| 2-Person Household | 2,017 | 27.1% |
| 3-Person Household | 1,065 | 14.3% |
| 4+ Person Household | 794 | 10.6% |
| Total Housing Units | 7,456 | 100.0% |
Occupancy by Ownership by Household Size in Selma
| Household Size | Owner-occupied | Renter-occupied |
| 1-Person Household | 1,324 (37.0%) | 2,256 (63.0%) |
| 2-Person Household | 1,201 (59.5%) | 816 (40.5%) |
| 3-Person Household | 456 (42.8%) | 609 (57.2%) |
| 4+ Person Household | 505 (63.6%) | 289 (36.4%) |
| Total Housing Units | 3,486 (46.8%) | 3,970 (53.2%) |
Occupancy by Educational Attainment in Selma
| Household Size | Owner-occupied | Renter-occupied |
| Less than High School | 393 (39.1%) | 613 (60.9%) |
| High School Diploma | 1,109 (40.0%) | 1,663 (60.0%) |
| College/Associate Degree | 977 (46.3%) | 1,135 (53.7%) |
| Bachelor's Degree or higher | 1,007 (64.3%) | 559 (35.7%) |
Occupancy by Age of Householder in Selma
| Age Bracket | # Households | % Households |
| Under 35 Years | 1,145 | 15.4% |
| 35 to 44 Years | 1,004 | 13.5% |
| 45 to 54 Years | 1,113 | 14.9% |
| 55 to 64 Years | 1,835 | 24.6% |
| 65 to 74 Years | 1,476 | 19.8% |
| 75 to 84 Years | 709 | 9.5% |
| 85 Years and Over | 174 | 2.3% |
| Total | 7,456 | 100.0% |
Housing Finances in Selma
Median Income by Occupancy in Selma
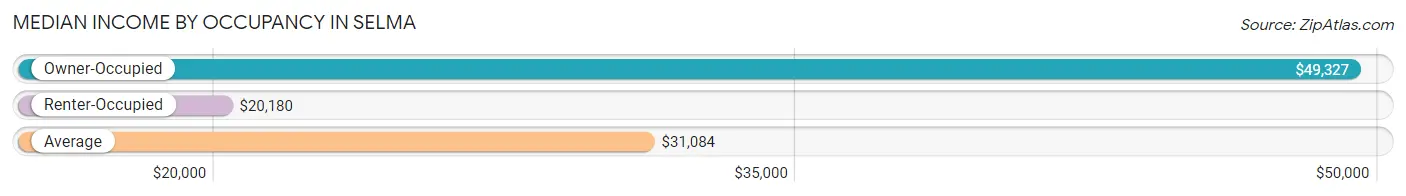
| Occupancy Type | # Households | Median Income |
| Owner-Occupied | 3,486 (46.8%) | $49,327 |
| Renter-Occupied | 3,970 (53.2%) | $20,180 |
| Average | 7,456 (100.0%) | $31,084 |
Occupancy by Householder Income Bracket in Selma
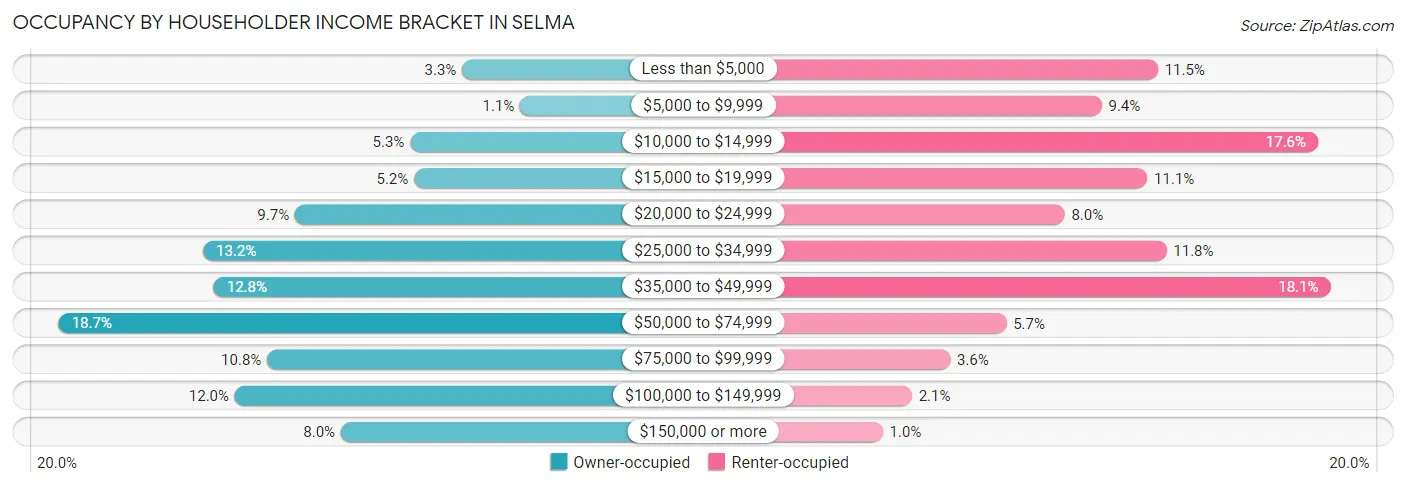
| Income Bracket | Owner-occupied | Renter-occupied |
| Less than $5,000 | 116 (3.3%) | 457 (11.5%) |
| $5,000 to $9,999 | 39 (1.1%) | 372 (9.4%) |
| $10,000 to $14,999 | 185 (5.3%) | 699 (17.6%) |
| $15,000 to $19,999 | 180 (5.2%) | 441 (11.1%) |
| $20,000 to $24,999 | 338 (9.7%) | 316 (8.0%) |
| $25,000 to $34,999 | 460 (13.2%) | 470 (11.8%) |
| $35,000 to $49,999 | 446 (12.8%) | 718 (18.1%) |
| $50,000 to $74,999 | 652 (18.7%) | 228 (5.7%) |
| $75,000 to $99,999 | 375 (10.8%) | 143 (3.6%) |
| $100,000 to $149,999 | 418 (12.0%) | 85 (2.1%) |
| $150,000 or more | 277 (8.0%) | 41 (1.0%) |
| Total | 3,486 (100.0%) | 3,970 (100.0%) |
Monthly Housing Cost Tiers in Selma
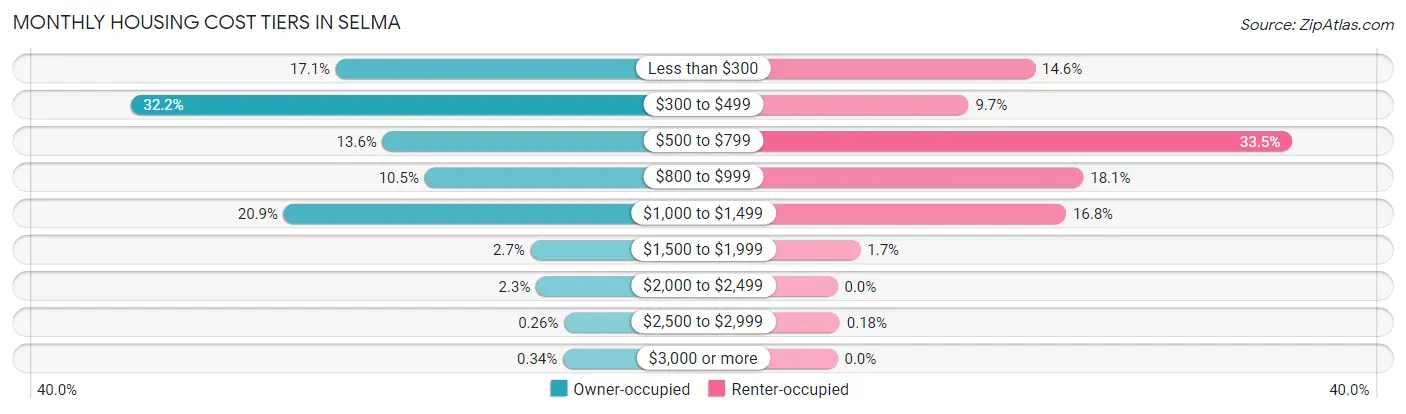
| Monthly Cost | Owner-occupied | Renter-occupied |
| Less than $300 | 595 (17.1%) | 578 (14.6%) |
| $300 to $499 | 1,123 (32.2%) | 383 (9.7%) |
| $500 to $799 | 475 (13.6%) | 1,329 (33.5%) |
| $800 to $999 | 367 (10.5%) | 719 (18.1%) |
| $1,000 to $1,499 | 729 (20.9%) | 668 (16.8%) |
| $1,500 to $1,999 | 95 (2.7%) | 67 (1.7%) |
| $2,000 to $2,499 | 81 (2.3%) | 0 (0.0%) |
| $2,500 to $2,999 | 9 (0.3%) | 7 (0.2%) |
| $3,000 or more | 12 (0.3%) | 0 (0.0%) |
| Total | 3,486 (100.0%) | 3,970 (100.0%) |
Physical Housing Characteristics in Selma
Housing Structures in Selma
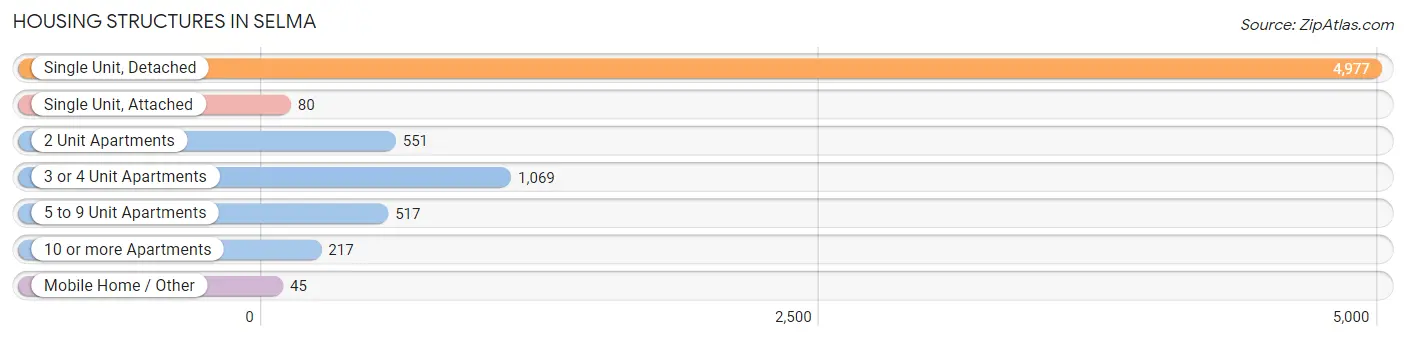
| Structure Type | # Housing Units | % Housing Units |
| Single Unit, Detached | 4,977 | 66.7% |
| Single Unit, Attached | 80 | 1.1% |
| 2 Unit Apartments | 551 | 7.4% |
| 3 or 4 Unit Apartments | 1,069 | 14.3% |
| 5 to 9 Unit Apartments | 517 | 6.9% |
| 10 or more Apartments | 217 | 2.9% |
| Mobile Home / Other | 45 | 0.6% |
| Total | 7,456 | 100.0% |
Housing Structures by Occupancy in Selma
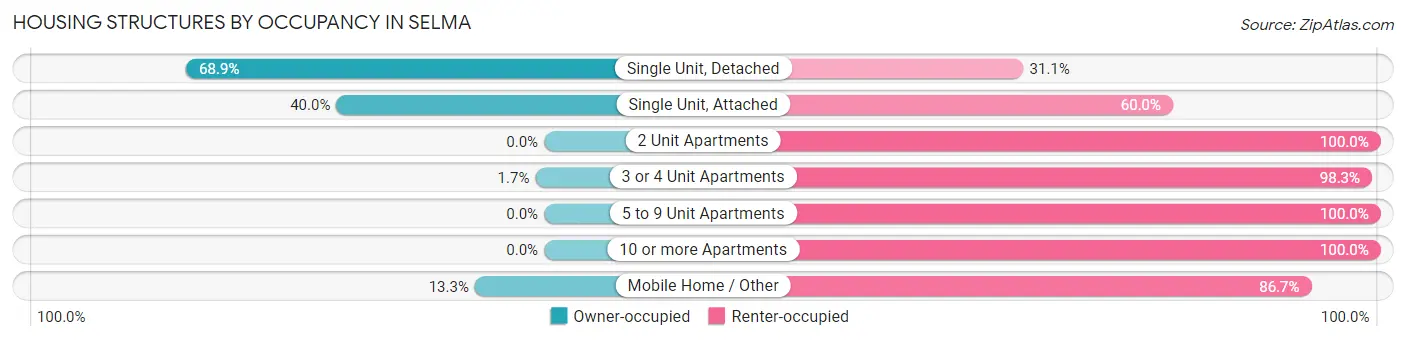
| Structure Type | Owner-occupied | Renter-occupied |
| Single Unit, Detached | 3,430 (68.9%) | 1,547 (31.1%) |
| Single Unit, Attached | 32 (40.0%) | 48 (60.0%) |
| 2 Unit Apartments | 0 (0.0%) | 551 (100.0%) |
| 3 or 4 Unit Apartments | 18 (1.7%) | 1,051 (98.3%) |
| 5 to 9 Unit Apartments | 0 (0.0%) | 517 (100.0%) |
| 10 or more Apartments | 0 (0.0%) | 217 (100.0%) |
| Mobile Home / Other | 6 (13.3%) | 39 (86.7%) |
| Total | 3,486 (46.8%) | 3,970 (53.2%) |
Housing Structures by Number of Rooms in Selma
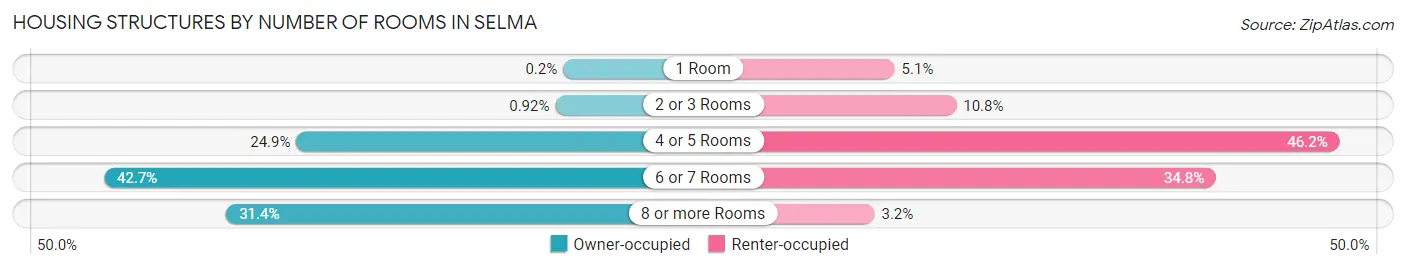
| Number of Rooms | Owner-occupied | Renter-occupied |
| 1 Room | 7 (0.2%) | 201 (5.1%) |
| 2 or 3 Rooms | 32 (0.9%) | 427 (10.8%) |
| 4 or 5 Rooms | 867 (24.9%) | 1,834 (46.2%) |
| 6 or 7 Rooms | 1,487 (42.7%) | 1,381 (34.8%) |
| 8 or more Rooms | 1,093 (31.4%) | 127 (3.2%) |
| Total | 3,486 (100.0%) | 3,970 (100.0%) |
Housing Structure by Heating Type in Selma
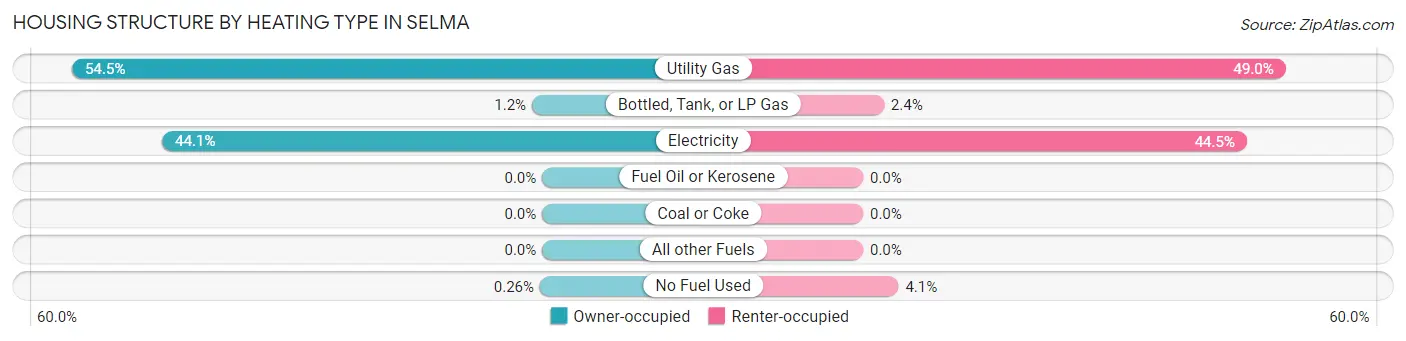
| Heating Type | Owner-occupied | Renter-occupied |
| Utility Gas | 1,900 (54.5%) | 1,945 (49.0%) |
| Bottled, Tank, or LP Gas | 41 (1.2%) | 96 (2.4%) |
| Electricity | 1,536 (44.1%) | 1,766 (44.5%) |
| Fuel Oil or Kerosene | 0 (0.0%) | 0 (0.0%) |
| Coal or Coke | 0 (0.0%) | 0 (0.0%) |
| All other Fuels | 0 (0.0%) | 0 (0.0%) |
| No Fuel Used | 9 (0.3%) | 163 (4.1%) |
| Total | 3,486 (100.0%) | 3,970 (100.0%) |
Household Vehicle Usage in Selma
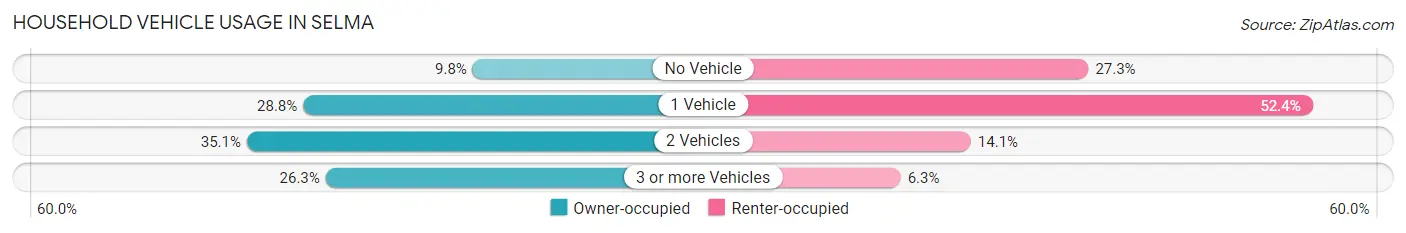
| Vehicles per Household | Owner-occupied | Renter-occupied |
| No Vehicle | 342 (9.8%) | 1,083 (27.3%) |
| 1 Vehicle | 1,004 (28.8%) | 2,079 (52.4%) |
| 2 Vehicles | 1,224 (35.1%) | 560 (14.1%) |
| 3 or more Vehicles | 916 (26.3%) | 248 (6.2%) |
| Total | 3,486 (100.0%) | 3,970 (100.0%) |
Real Estate & Mortgages in Selma
Real Estate and Mortgage Overview in Selma
| Characteristic | Without Mortgage | With Mortgage |
| Housing Units | 2,114 | 1,372 |
| Median Property Value | $70,900 | $120,100 |
| Median Household Income | $39,069 | $215 |
| Monthly Housing Costs | $340 | $12 |
| Real Estate Taxes | $287 | $188 |
Property Value by Mortgage Status in Selma
| Property Value | Without Mortgage | With Mortgage |
| Less than $50,000 | 786 (37.2%) | 75 (5.5%) |
| $50,000 to $99,999 | 717 (33.9%) | 375 (27.3%) |
| $100,000 to $299,999 | 586 (27.7%) | 863 (62.9%) |
| $300,000 to $499,999 | 25 (1.2%) | 21 (1.5%) |
| $500,000 to $749,999 | 0 (0.0%) | 24 (1.8%) |
| $750,000 to $999,999 | 0 (0.0%) | 14 (1.0%) |
| $1,000,000 or more | 0 (0.0%) | 0 (0.0%) |
| Total | 2,114 (100.0%) | 1,372 (100.0%) |
Household Income by Mortgage Status in Selma
| Household Income | Without Mortgage | With Mortgage |
| Less than $10,000 | 119 (5.6%) | 33 (2.4%) |
| $10,000 to $24,999 | 591 (28.0%) | 36 (2.6%) |
| $25,000 to $34,999 | 300 (14.2%) | 112 (8.2%) |
| $35,000 to $49,999 | 229 (10.8%) | 160 (11.7%) |
| $50,000 to $74,999 | 375 (17.7%) | 217 (15.8%) |
| $75,000 to $99,999 | 233 (11.0%) | 277 (20.2%) |
| $100,000 to $149,999 | 205 (9.7%) | 142 (10.3%) |
| $150,000 or more | 62 (2.9%) | 213 (15.5%) |
| Total | 2,114 (100.0%) | 1,372 (100.0%) |
Property Value to Household Income Ratio in Selma
| Value-to-Income Ratio | Without Mortgage | With Mortgage |
| Less than 2.0x | 1,135 (53.7%) | 65,000 (4,737.6%) |
| 2.0x to 2.9x | 454 (21.5%) | 759 (55.3%) |
| 3.0x to 3.9x | 180 (8.5%) | 245 (17.9%) |
| 4.0x or more | 323 (15.3%) | 135 (9.8%) |
| Total | 2,114 (100.0%) | 1,372 (100.0%) |
Real Estate Taxes by Mortgage Status in Selma
| Property Taxes | Without Mortgage | With Mortgage |
| Less than $800 | 1,127 (53.3%) | 0 (0.0%) |
| $800 to $1,499 | 143 (6.8%) | 810 (59.0%) |
| $800 to $1,499 | 114 (5.4%) | 233 (17.0%) |
| Total | 2,114 (100.0%) | 1,372 (100.0%) |
Health & Disability in Selma
Health Insurance Coverage by Age in Selma
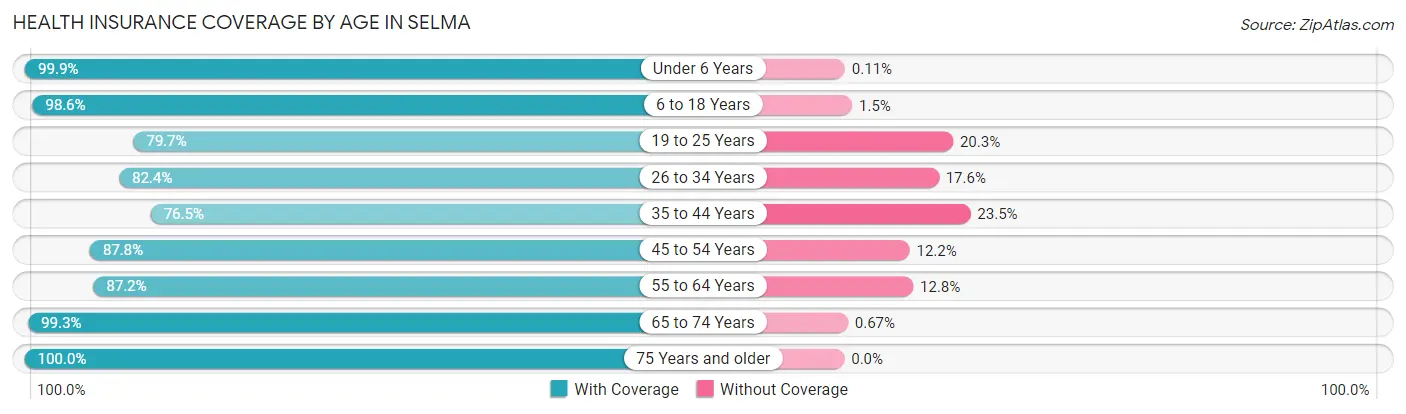
| Age Bracket | With Coverage | Without Coverage |
| Under 6 Years | 1,748 (99.9%) | 2 (0.1%) |
| 6 to 18 Years | 2,792 (98.6%) | 41 (1.5%) |
| 19 to 25 Years | 1,286 (79.7%) | 327 (20.3%) |
| 26 to 34 Years | 1,577 (82.4%) | 337 (17.6%) |
| 35 to 44 Years | 1,304 (76.5%) | 401 (23.5%) |
| 45 to 54 Years | 1,841 (87.8%) | 255 (12.2%) |
| 55 to 64 Years | 2,168 (87.2%) | 319 (12.8%) |
| 65 to 74 Years | 1,923 (99.3%) | 13 (0.7%) |
| 75 Years and older | 1,268 (100.0%) | 0 (0.0%) |
| Total | 15,907 (90.4%) | 1,695 (9.6%) |
Health Insurance Coverage by Citizenship Status in Selma
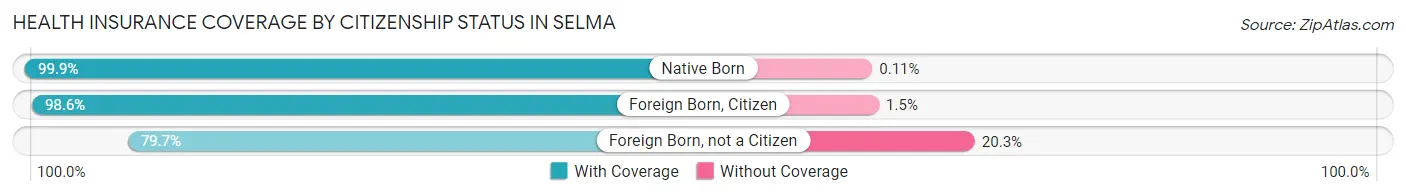
| Citizenship Status | With Coverage | Without Coverage |
| Native Born | 1,748 (99.9%) | 2 (0.1%) |
| Foreign Born, Citizen | 2,792 (98.6%) | 41 (1.5%) |
| Foreign Born, not a Citizen | 1,286 (79.7%) | 327 (20.3%) |
Health Insurance Coverage by Household Income in Selma
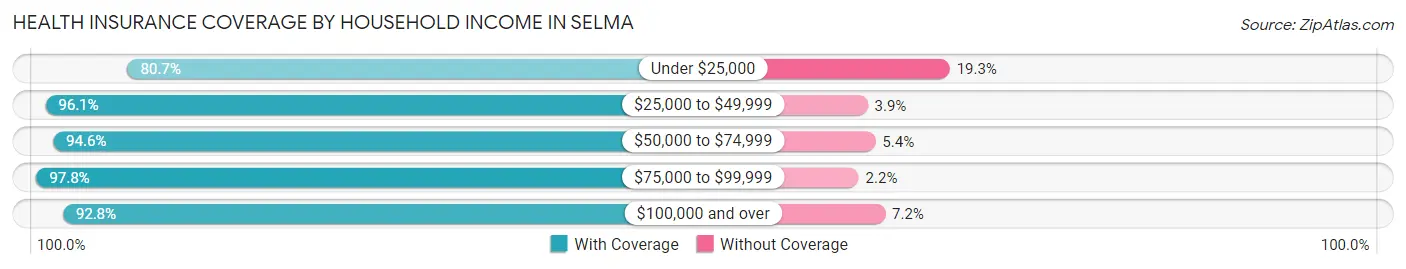
| Household Income | With Coverage | Without Coverage |
| Under $25,000 | 4,744 (80.7%) | 1,133 (19.3%) |
| $25,000 to $49,999 | 4,650 (96.1%) | 188 (3.9%) |
| $50,000 to $74,999 | 2,156 (94.6%) | 122 (5.4%) |
| $75,000 to $99,999 | 1,716 (97.8%) | 39 (2.2%) |
| $100,000 and over | 2,460 (92.8%) | 190 (7.2%) |
Public vs Private Health Insurance Coverage by Age in Selma
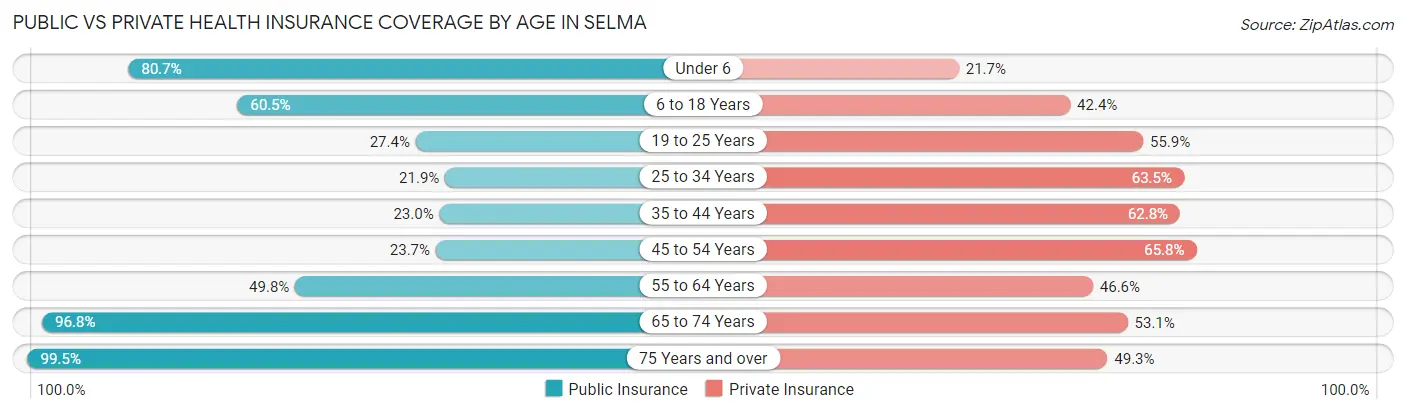
| Age Bracket | Public Insurance | Private Insurance |
| Under 6 | 1,413 (80.7%) | 380 (21.7%) |
| 6 to 18 Years | 1,714 (60.5%) | 1,201 (42.4%) |
| 19 to 25 Years | 442 (27.4%) | 902 (55.9%) |
| 25 to 34 Years | 420 (21.9%) | 1,215 (63.5%) |
| 35 to 44 Years | 392 (23.0%) | 1,070 (62.8%) |
| 45 to 54 Years | 496 (23.7%) | 1,379 (65.8%) |
| 55 to 64 Years | 1,238 (49.8%) | 1,159 (46.6%) |
| 65 to 74 Years | 1,873 (96.8%) | 1,027 (53.0%) |
| 75 Years and over | 1,261 (99.5%) | 625 (49.3%) |
| Total | 9,249 (52.5%) | 8,958 (50.9%) |
Disability Status by Sex by Age in Selma
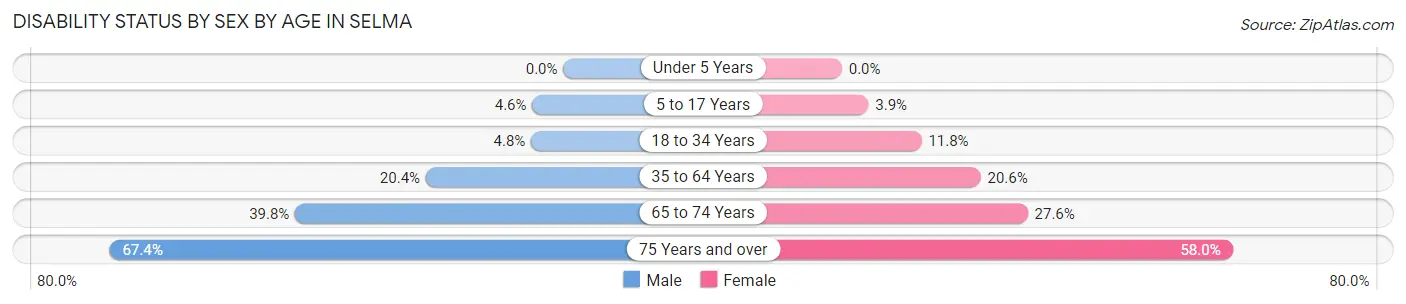
| Age Bracket | Male | Female |
| Under 5 Years | 0 (0.0%) | 0 (0.0%) |
| 5 to 17 Years | 74 (4.6%) | 53 (3.9%) |
| 18 to 34 Years | 83 (4.8%) | 250 (11.8%) |
| 35 to 64 Years | 474 (20.4%) | 817 (20.6%) |
| 65 to 74 Years | 364 (39.8%) | 282 (27.6%) |
| 75 Years and over | 341 (67.4%) | 442 (58.0%) |
Disability Class by Sex by Age in Selma
Disability Class: Hearing Difficulty
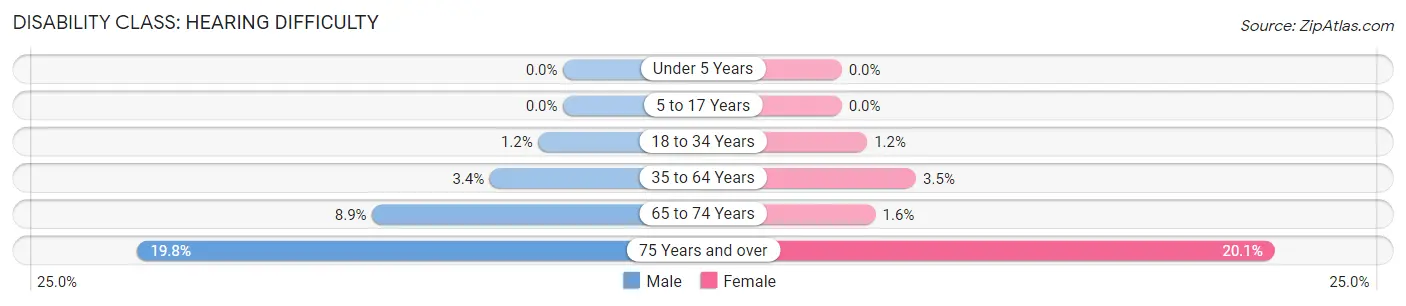
| Age Bracket | Male | Female |
| Under 5 Years | 0 (0.0%) | 0 (0.0%) |
| 5 to 17 Years | 0 (0.0%) | 0 (0.0%) |
| 18 to 34 Years | 20 (1.1%) | 25 (1.2%) |
| 35 to 64 Years | 79 (3.4%) | 137 (3.5%) |
| 65 to 74 Years | 81 (8.9%) | 16 (1.6%) |
| 75 Years and over | 100 (19.8%) | 153 (20.1%) |
Disability Class: Vision Difficulty
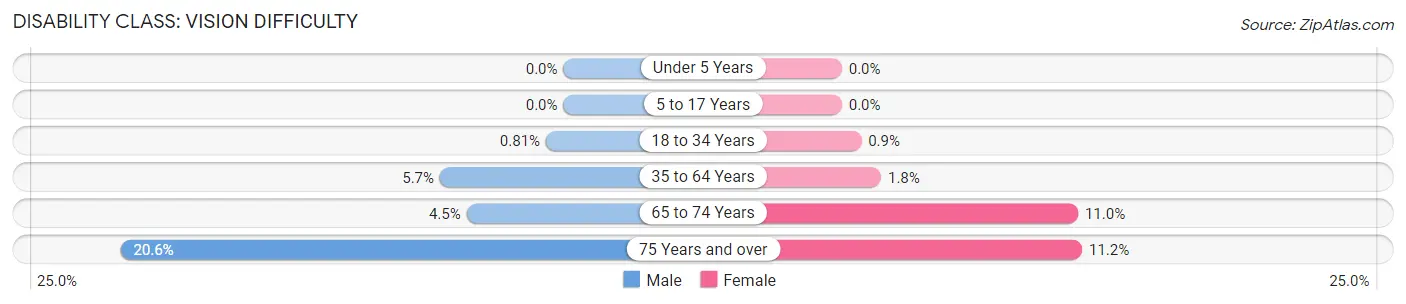
| Age Bracket | Male | Female |
| Under 5 Years | 0 (0.0%) | 0 (0.0%) |
| 5 to 17 Years | 0 (0.0%) | 0 (0.0%) |
| 18 to 34 Years | 14 (0.8%) | 19 (0.9%) |
| 35 to 64 Years | 133 (5.7%) | 72 (1.8%) |
| 65 to 74 Years | 41 (4.5%) | 112 (11.0%) |
| 75 Years and over | 104 (20.5%) | 85 (11.2%) |
Disability Class: Cognitive Difficulty
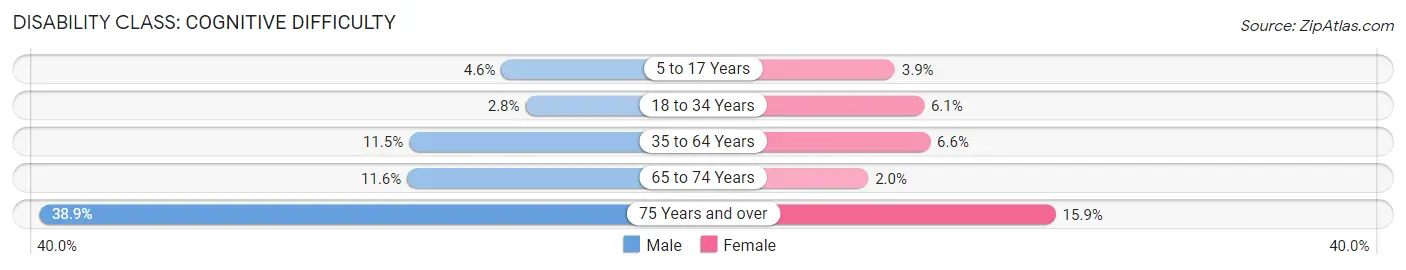
| Age Bracket | Male | Female |
| 5 to 17 Years | 74 (4.6%) | 53 (3.9%) |
| 18 to 34 Years | 49 (2.8%) | 129 (6.1%) |
| 35 to 64 Years | 266 (11.5%) | 260 (6.6%) |
| 65 to 74 Years | 106 (11.6%) | 20 (2.0%) |
| 75 Years and over | 197 (38.9%) | 121 (15.9%) |
Disability Class: Ambulatory Difficulty
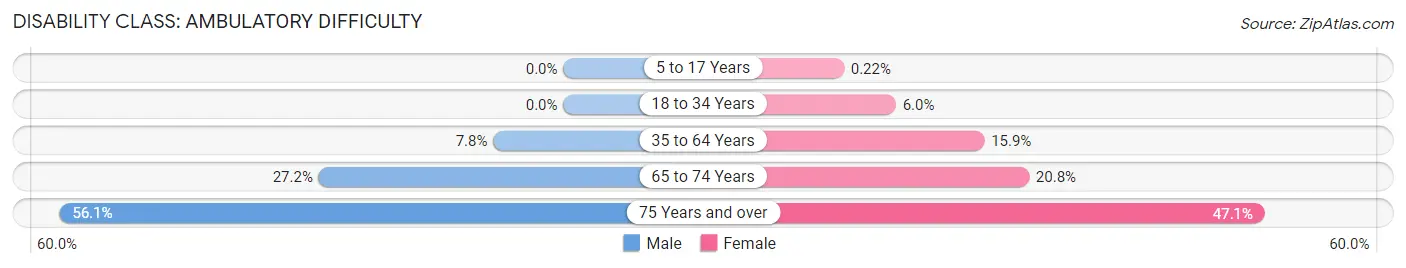
| Age Bracket | Male | Female |
| 5 to 17 Years | 0 (0.0%) | 3 (0.2%) |
| 18 to 34 Years | 0 (0.0%) | 127 (6.0%) |
| 35 to 64 Years | 181 (7.8%) | 629 (15.9%) |
| 65 to 74 Years | 249 (27.2%) | 213 (20.8%) |
| 75 Years and over | 284 (56.1%) | 359 (47.1%) |
Disability Class: Self-Care Difficulty
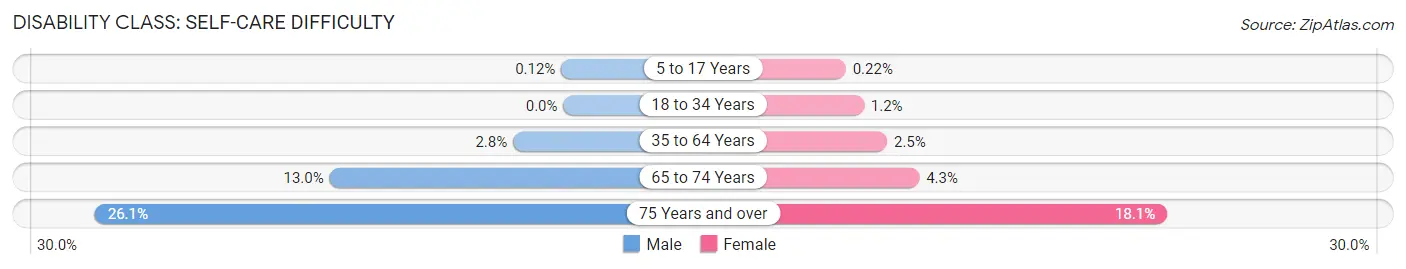
| Age Bracket | Male | Female |
| 5 to 17 Years | 2 (0.1%) | 3 (0.2%) |
| 18 to 34 Years | 0 (0.0%) | 26 (1.2%) |
| 35 to 64 Years | 65 (2.8%) | 100 (2.5%) |
| 65 to 74 Years | 119 (13.0%) | 44 (4.3%) |
| 75 Years and over | 132 (26.1%) | 138 (18.1%) |
Technology Access in Selma
Computing Device Access in Selma
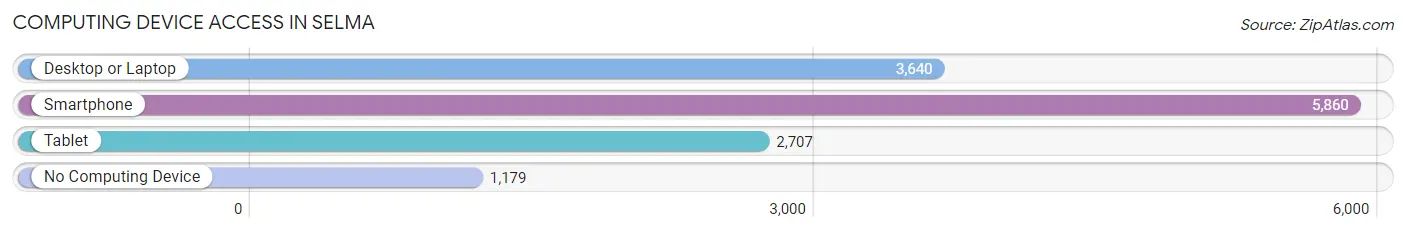
| Device Type | # Households | % Households |
| Desktop or Laptop | 3,640 | 48.8% |
| Smartphone | 5,860 | 78.6% |
| Tablet | 2,707 | 36.3% |
| No Computing Device | 1,179 | 15.8% |
| Total | 7,456 | 100.0% |
Internet Access in Selma
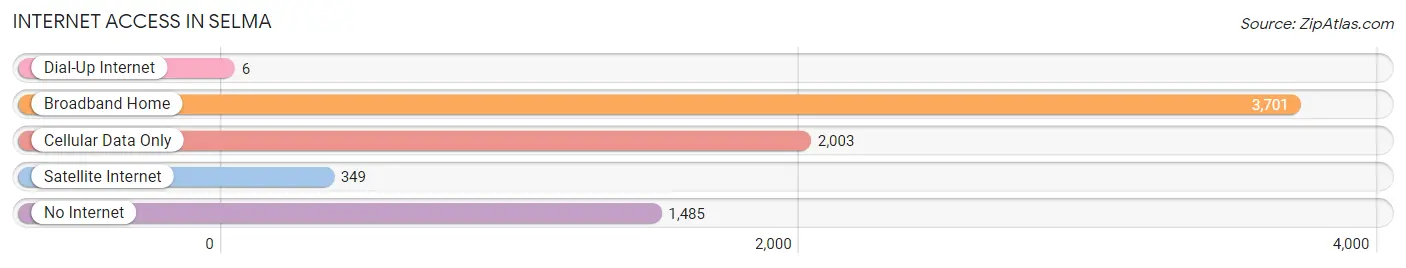
| Internet Type | # Households | % Households |
| Dial-Up Internet | 6 | 0.1% |
| Broadband Home | 3,701 | 49.6% |
| Cellular Data Only | 2,003 | 26.9% |
| Satellite Internet | 349 | 4.7% |
| No Internet | 1,485 | 19.9% |
| Total | 7,456 | 100.0% |
Selma Summary
Selma, Alabama is a city located in Dallas County, Alabama, United States. It is the county seat of Dallas County and is situated on the banks of the Alabama River. The city has a population of 20,756 as of the 2010 census. Selma is the principal city of the Selma Micropolitan Statistical Area, which has a population of 40,824.
History
Selma was founded in 1819 by a group of settlers from the nearby town of Cahawba. The settlers named the town after the Selma Plantation, which was owned by John and William Rufus King. The plantation was named after the Selma River in Italy. The town quickly grew and became an important trading center for the region.
In 1861, Selma was chosen as the site of a Confederate arsenal and was the site of the Battle of Selma in 1865. The battle was a decisive Confederate victory and was the last major battle of the Civil War. After the war, Selma was occupied by Union troops and was the site of the first African-American voting rights march in 1965. The march, which was led by Martin Luther King Jr., was a major event in the civil rights movement.
Geography
Selma is located in central Alabama at the intersection of U.S. Route 80 and State Route 22. The city is situated on the banks of the Alabama River and is surrounded by rolling hills and forests. The city has a total area of 16.2 square miles, of which 16.1 square miles is land and 0.1 square miles is water.
Economy
Selma’s economy is largely based on agriculture and manufacturing. The city is home to several large manufacturing plants, including a Tyson Foods poultry processing plant and a Goodyear Tire and Rubber Company plant. Selma is also home to several large agricultural operations, including cotton, soybean, and corn farms.
The city is also home to several large retail stores, including Walmart, Target, and Lowe’s. Selma is also home to several large medical facilities, including Vaughan Regional Medical Center and Vaughan Regional Medical Center East.
Demographics
As of the 2010 census, Selma had a population of 20,756. The racial makeup of the city was 57.3% African American, 37.7% White, 0.3% Native American, 0.2% Asian, 0.1% Pacific Islander, and 4.4% from two or more races. Hispanic or Latino of any race were 1.7% of the population.
The median income for a household in Selma was $25,945, and the median income for a family was $31,945. The per capita income for the city was $14,945. About 24.3% of the population was below the poverty line.
Selma is served by the Dallas County School District, which consists of seven elementary schools, two middle schools, and two high schools. The city is also home to several private schools, including Selma Christian Academy and Selma Academy.
Common Questions
What is Per Capita Income in Selma?
Per Capita income in Selma is $21,575.
What is the Median Family Income in Selma?
Median Family Income in Selma is $46,266.
What is the Median Household income in Selma?
Median Household Income in Selma is $31,084.
What is Income or Wage Gap in Selma?
Income or Wage Gap in Selma is 9.2%.
Women in Selma earn 90.8 cents for every dollar earned by a man.
What is Family Income Deficit in Selma?
Family Income Deficit in Selma is $11,334.
Families that are below poverty line in Selma earn $11,334 less on average than the poverty threshold level.
What is Inequality or Gini Index in Selma?
Inequality or Gini Index in Selma is 0.51.
What is the Total Population of Selma?
Total Population of Selma is 17,875.
What is the Total Male Population of Selma?
Total Male Population of Selma is 7,773.
What is the Total Female Population of Selma?
Total Female Population of Selma is 10,102.
What is the Ratio of Males per 100 Females in Selma?
There are 76.95 Males per 100 Females in Selma.
What is the Ratio of Females per 100 Males in Selma?
There are 129.96 Females per 100 Males in Selma.
What is the Median Population Age in Selma?
Median Population Age in Selma is 39.0 Years.
What is the Average Family Size in Selma
Average Family Size in Selma is 3.5 People.
What is the Average Household Size in Selma
Average Household Size in Selma is 2.3 People.
How Large is the Labor Force in Selma?
There are 7,142 People in the Labor Forcein in Selma.
What is the Percentage of People in the Labor Force in Selma?
50.2% of People are in the Labor Force in Selma.
What is the Unemployment Rate in Selma?
Unemployment Rate in Selma is 12.9%.