Riverside, AL Map & Demographics
Riverside Map
Riverside Overview
$31,085
PER CAPITA INCOME
$83,500
AVG FAMILY INCOME
$70,208
AVG HOUSEHOLD INCOME
34.2%
WAGE / INCOME GAP [ % ]
65.8¢/ $1
WAGE / INCOME GAP [ $ ]
0.43
INEQUALITY / GINI INDEX
2,409
TOTAL POPULATION
1,099
MALE POPULATION
1,310
FEMALE POPULATION
83.89
MALES / 100 FEMALES
119.20
FEMALES / 100 MALES
42.0
MEDIAN AGE
3.2
AVG FAMILY SIZE
2.6
AVG HOUSEHOLD SIZE
1,192
LABOR FORCE [ PEOPLE ]
60.7%
PERCENT IN LABOR FORCE
5.3%
UNEMPLOYMENT RATE
Riverside Zip Codes
Income in Riverside
Income Overview in Riverside
Per Capita Income in Riverside is $31,085, while median incomes of families and households are $83,500 and $70,208 respectively.
| Characteristic | Number | Measure |
| Per Capita Income | 2,409 | $31,085 |
| Median Family Income | 640 | $83,500 |
| Mean Family Income | 640 | $96,052 |
| Median Household Income | 932 | $70,208 |
| Mean Household Income | 932 | $80,920 |
| Income Deficit | 640 | $0 |
| Wage / Income Gap (%) | 2,409 | 34.17% |
| Wage / Income Gap ($) | 2,409 | 65.83¢ per $1 |
| Gini / Inequality Index | 2,409 | 0.43 |
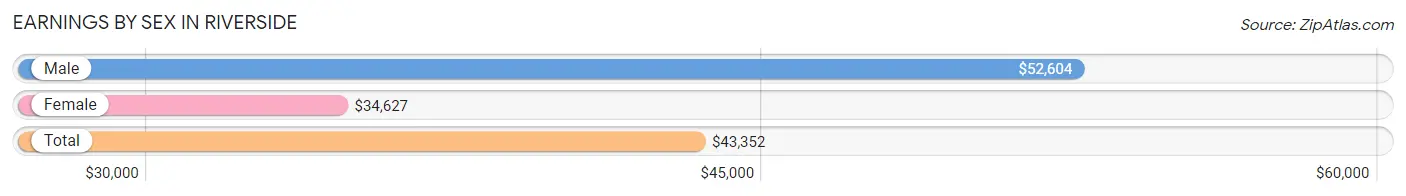
Earnings by Sex in Riverside
Average Earnings in Riverside are $43,352, $52,604 for men and $34,627 for women, a difference of 34.2%.
| Sex | Number | Average Earnings |
| Male | 659 (55.3%) | $52,604 |
| Female | 532 (44.7%) | $34,627 |
| Total | 1,191 (100.0%) | $43,352 |
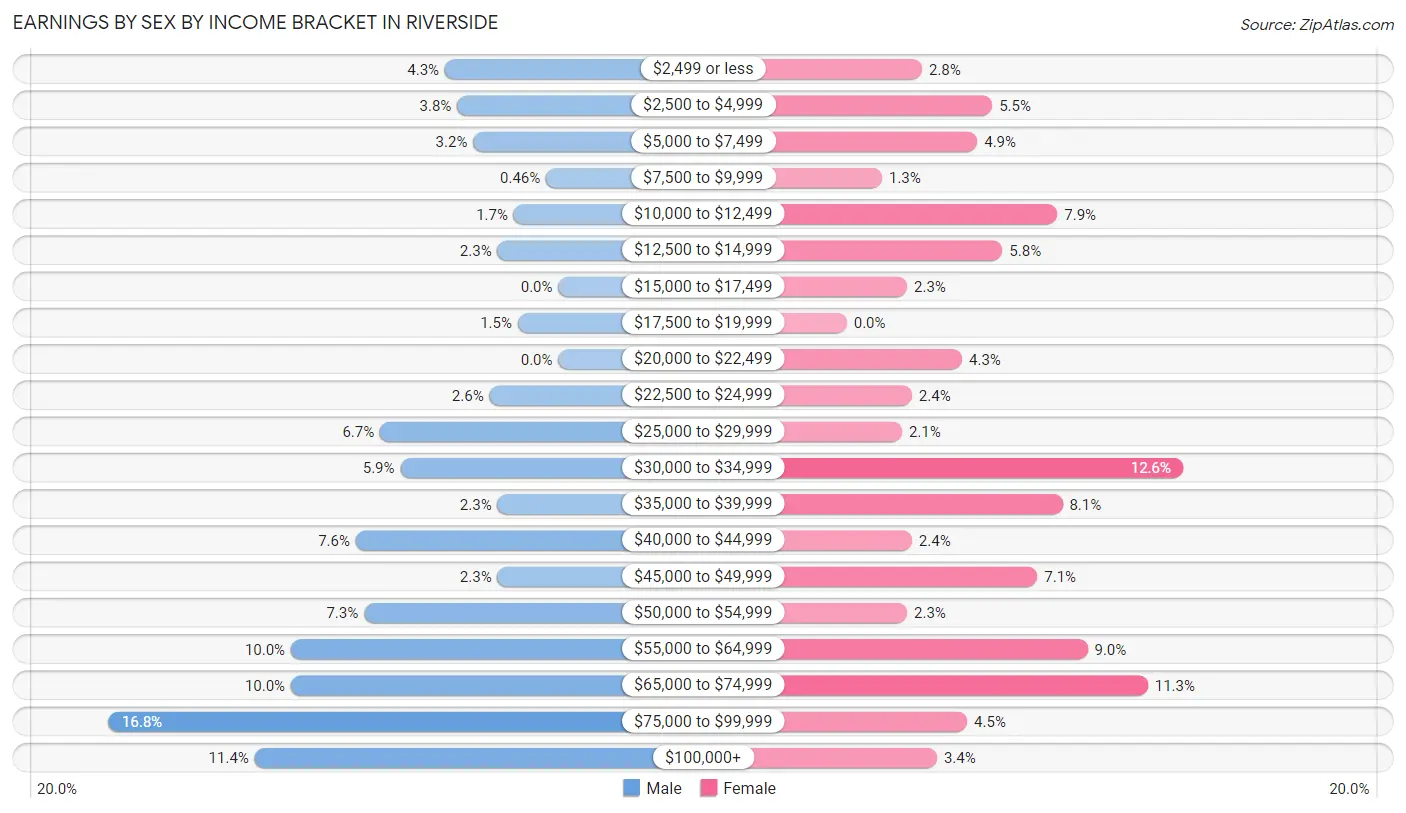
Earnings by Sex by Income Bracket in Riverside
The most common earnings brackets in Riverside are $75,000 to $99,999 for men (111 | 16.8%) and $30,000 to $34,999 for women (67 | 12.6%).
| Income | Male | Female |
| $2,499 or less | 28 (4.3%) | 15 (2.8%) |
| $2,500 to $4,999 | 25 (3.8%) | 29 (5.4%) |
| $5,000 to $7,499 | 21 (3.2%) | 26 (4.9%) |
| $7,500 to $9,999 | 3 (0.5%) | 7 (1.3%) |
| $10,000 to $12,499 | 11 (1.7%) | 42 (7.9%) |
| $12,500 to $14,999 | 15 (2.3%) | 31 (5.8%) |
| $15,000 to $17,499 | 0 (0.0%) | 12 (2.3%) |
| $17,500 to $19,999 | 10 (1.5%) | 0 (0.0%) |
| $20,000 to $22,499 | 0 (0.0%) | 23 (4.3%) |
| $22,500 to $24,999 | 17 (2.6%) | 13 (2.4%) |
| $25,000 to $29,999 | 44 (6.7%) | 11 (2.1%) |
| $30,000 to $34,999 | 39 (5.9%) | 67 (12.6%) |
| $35,000 to $39,999 | 15 (2.3%) | 43 (8.1%) |
| $40,000 to $44,999 | 50 (7.6%) | 13 (2.4%) |
| $45,000 to $49,999 | 15 (2.3%) | 38 (7.1%) |
| $50,000 to $54,999 | 48 (7.3%) | 12 (2.3%) |
| $55,000 to $64,999 | 66 (10.0%) | 48 (9.0%) |
| $65,000 to $74,999 | 66 (10.0%) | 60 (11.3%) |
| $75,000 to $99,999 | 111 (16.8%) | 24 (4.5%) |
| $100,000+ | 75 (11.4%) | 18 (3.4%) |
| Total | 659 (100.0%) | 532 (100.0%) |
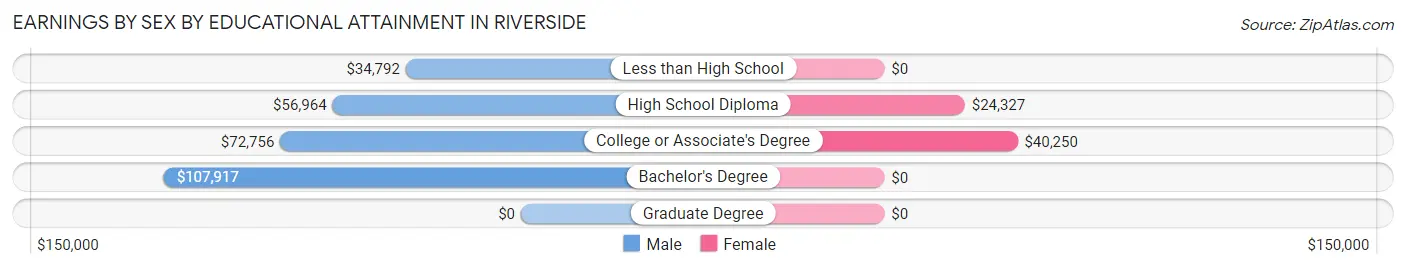
Earnings by Sex by Educational Attainment in Riverside
Average earnings in Riverside are $57,813 for men and $34,571 for women, a difference of 40.2%. Men with an educational attainment of bachelor's degree enjoy the highest average annual earnings of $107,917, while those with less than high school education earn the least with $34,792. Women with an educational attainment of college or associate's degree earn the most with the average annual earnings of $40,250, while those with high school diploma education have the smallest earnings of $24,327.
| Educational Attainment | Male Income | Female Income |
| Less than High School | $34,792 | $0 |
| High School Diploma | $56,964 | $24,327 |
| College or Associate's Degree | $72,756 | $40,250 |
| Bachelor's Degree | $107,917 | $0 |
| Graduate Degree | - | - |
| Total | $57,813 | $34,571 |
Family Income in Riverside
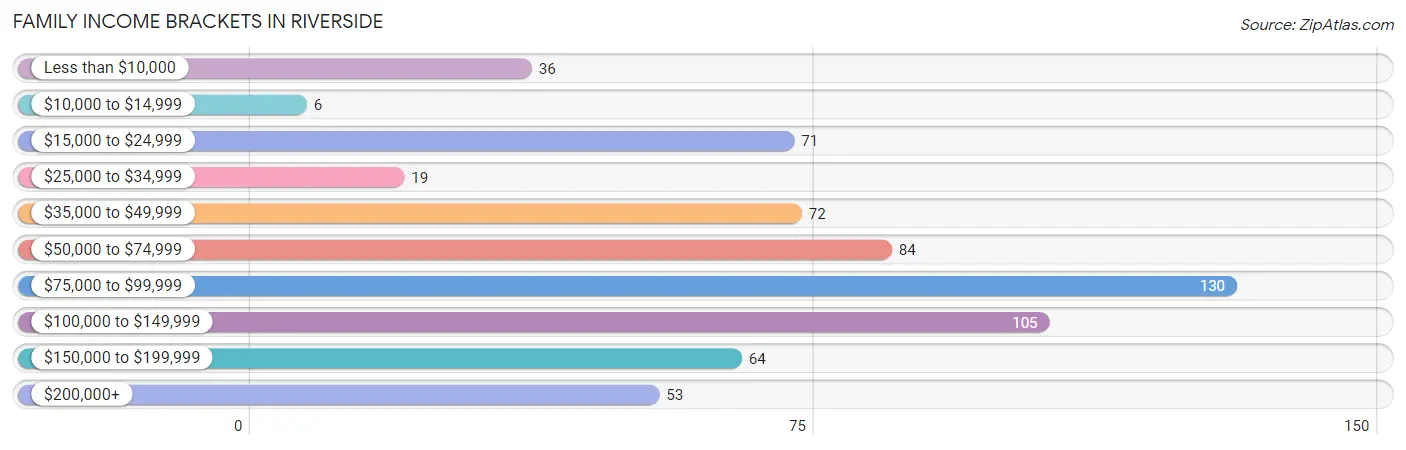
Family Income Brackets in Riverside
According to the Riverside family income data, there are 130 families falling into the $75,000 to $99,999 income range, which is the most common income bracket and makes up 20.3% of all families. Conversely, the $10,000 to $14,999 income bracket is the least frequent group with only 6 families (0.9%) belonging to this category.
| Income Bracket | # Families | % Families |
| Less than $10,000 | 36 | 5.6% |
| $10,000 to $14,999 | 6 | 0.9% |
| $15,000 to $24,999 | 71 | 11.1% |
| $25,000 to $34,999 | 19 | 3.0% |
| $35,000 to $49,999 | 72 | 11.3% |
| $50,000 to $74,999 | 84 | 13.1% |
| $75,000 to $99,999 | 130 | 20.3% |
| $100,000 to $149,999 | 105 | 16.4% |
| $150,000 to $199,999 | 64 | 10.0% |
| $200,000+ | 53 | 8.3% |
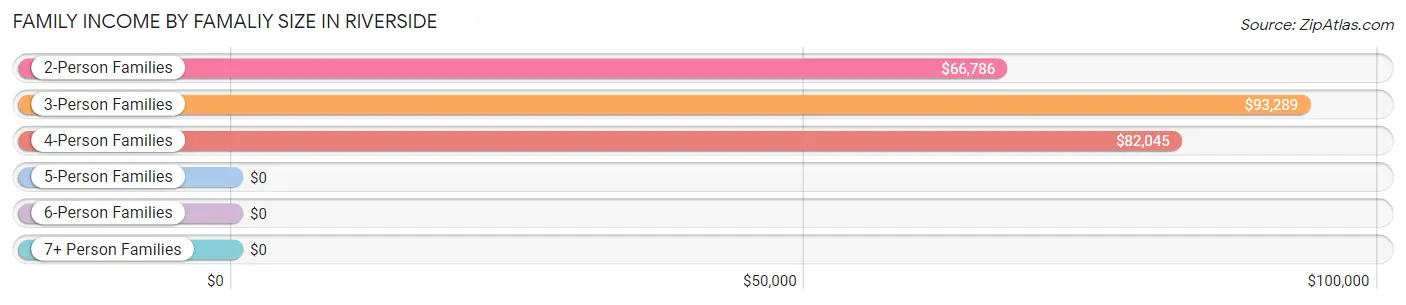
Family Income by Famaliy Size in Riverside
3-person families (142 | 22.2%) account for the highest median family income in Riverside with $93,289 per family, while 2-person families (290 | 45.3%) have the highest median income of $33,393 per family member.
| Income Bracket | # Families | Median Income |
| 2-Person Families | 290 (45.3%) | $66,786 |
| 3-Person Families | 142 (22.2%) | $93,289 |
| 4-Person Families | 138 (21.6%) | $82,045 |
| 5-Person Families | 31 (4.8%) | $0 |
| 6-Person Families | 25 (3.9%) | $0 |
| 7+ Person Families | 14 (2.2%) | $0 |
| Total | 640 (100.0%) | $83,500 |
Family Income by Number of Earners in Riverside
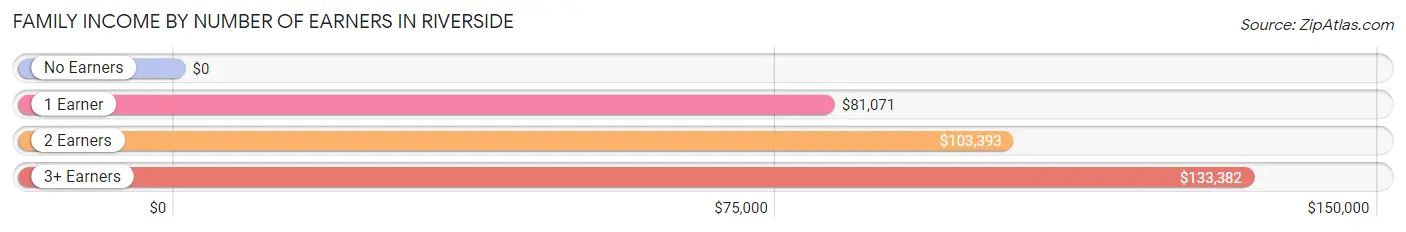
| Number of Earners | # Families | Median Income |
| No Earners | 161 (25.2%) | $0 |
| 1 Earner | 146 (22.8%) | $81,071 |
| 2 Earners | 255 (39.8%) | $103,393 |
| 3+ Earners | 78 (12.2%) | $133,382 |
| Total | 640 (100.0%) | $83,500 |
Household Income in Riverside
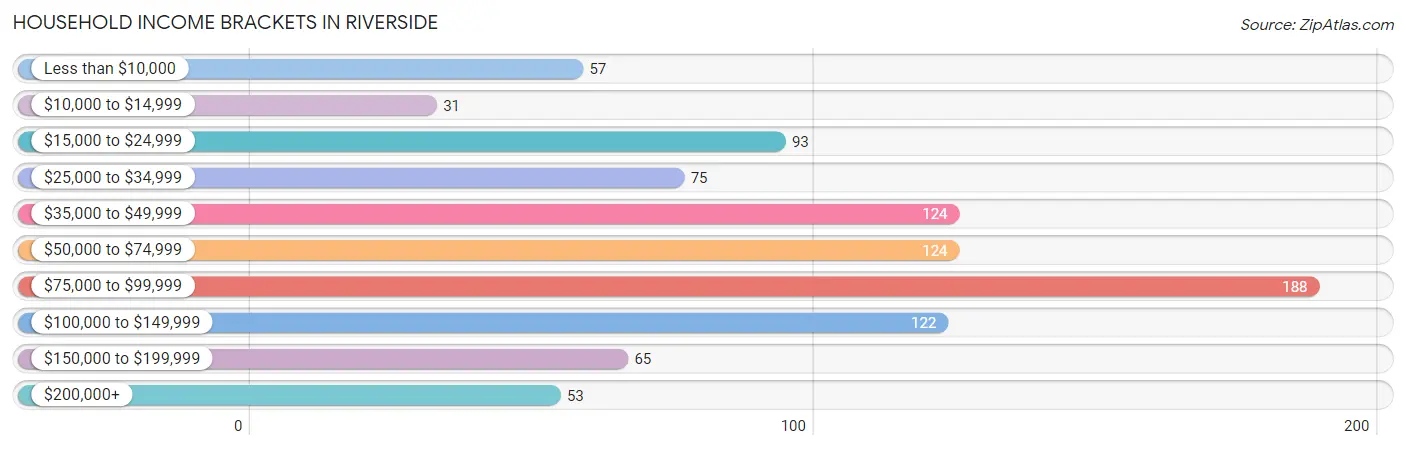
Household Income Brackets in Riverside
With 188 households falling in the category, the $75,000 to $99,999 income range is the most frequent in Riverside, accounting for 20.2% of all households. In contrast, only 31 households (3.3%) fall into the $10,000 to $14,999 income bracket, making it the least populous group.
| Income Bracket | # Households | % Households |
| Less than $10,000 | 57 | 6.1% |
| $10,000 to $14,999 | 31 | 3.3% |
| $15,000 to $24,999 | 93 | 10.0% |
| $25,000 to $34,999 | 75 | 8.0% |
| $35,000 to $49,999 | 124 | 13.3% |
| $50,000 to $74,999 | 124 | 13.3% |
| $75,000 to $99,999 | 188 | 20.2% |
| $100,000 to $149,999 | 122 | 13.1% |
| $150,000 to $199,999 | 65 | 7.0% |
| $200,000+ | 53 | 5.7% |
Household Income by Householder Age in Riverside
The median household income in Riverside is $70,208, with the highest median household income of $81,042 found in the 45 to 64 years age bracket for the primary householder. A total of 334 households (35.8%) fall into this category. Meanwhile, the 15 to 24 years age bracket for the primary householder has the lowest median household income of $0, with 9 households (1.0%) in this group.
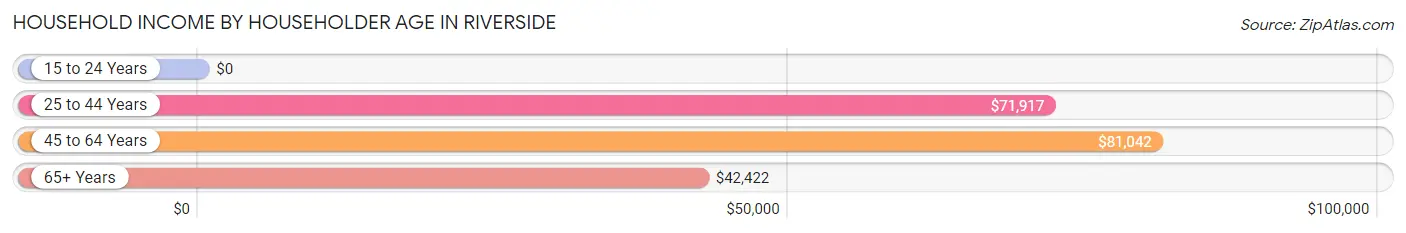
| Income Bracket | # Households | Median Income |
| 15 to 24 Years | 9 (1.0%) | $0 |
| 25 to 44 Years | 354 (38.0%) | $71,917 |
| 45 to 64 Years | 334 (35.8%) | $81,042 |
| 65+ Years | 235 (25.2%) | $42,422 |
| Total | 932 (100.0%) | $70,208 |
Poverty in Riverside
Income Below Poverty by Sex and Age in Riverside
With 10.6% poverty level for males and 19.4% for females among the residents of Riverside, 12 to 14 year old males and 5 year old females are the most vulnerable to poverty, with 18 males (52.9%) and 17 females (100.0%) in their respective age groups living below the poverty level.
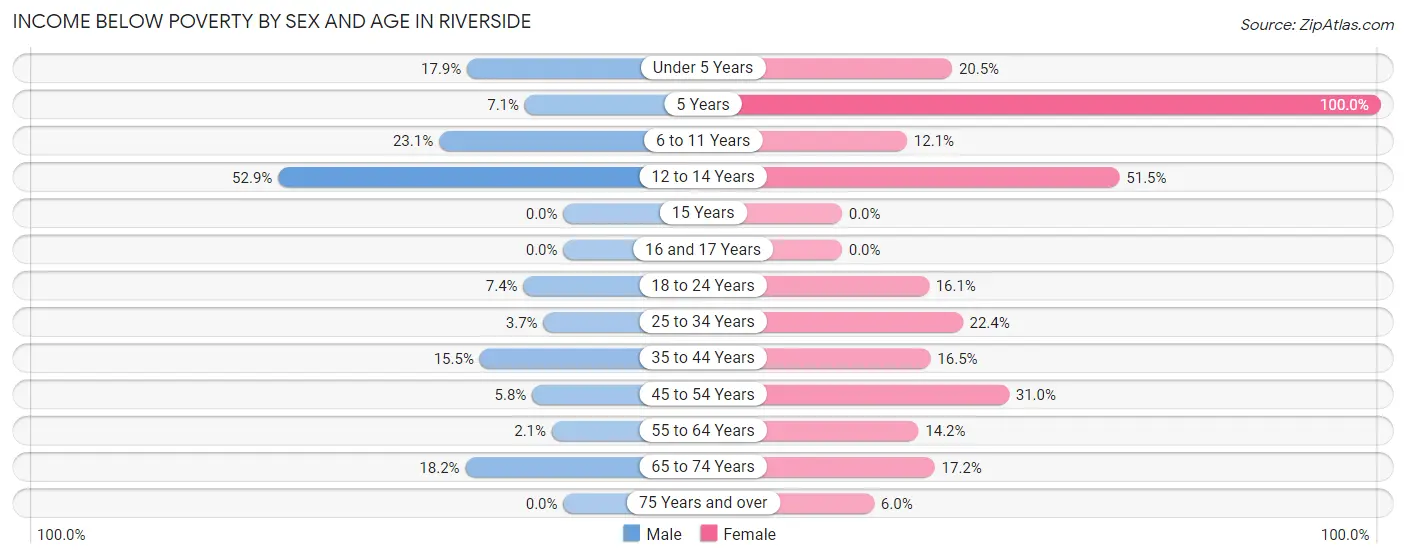
| Age Bracket | Male | Female |
| Under 5 Years | 10 (17.9%) | 18 (20.4%) |
| 5 Years | 4 (7.1%) | 17 (100.0%) |
| 6 to 11 Years | 12 (23.1%) | 11 (12.1%) |
| 12 to 14 Years | 18 (52.9%) | 17 (51.5%) |
| 15 Years | 0 (0.0%) | 0 (0.0%) |
| 16 and 17 Years | 0 (0.0%) | 0 (0.0%) |
| 18 to 24 Years | 8 (7.4%) | 10 (16.1%) |
| 25 to 34 Years | 4 (3.7%) | 52 (22.4%) |
| 35 to 44 Years | 27 (15.5%) | 25 (16.5%) |
| 45 to 54 Years | 10 (5.8%) | 44 (31.0%) |
| 55 to 64 Years | 3 (2.1%) | 26 (14.2%) |
| 65 to 74 Years | 20 (18.2%) | 25 (17.2%) |
| 75 Years and over | 0 (0.0%) | 9 (6.0%) |
| Total | 116 (10.6%) | 254 (19.4%) |
Income Above Poverty by Sex and Age in Riverside
According to the poverty statistics in Riverside, males aged 15 years and females aged 16 and 17 years are the age groups that are most secure financially, with 100.0% of males and 100.0% of females in these age groups living above the poverty line.
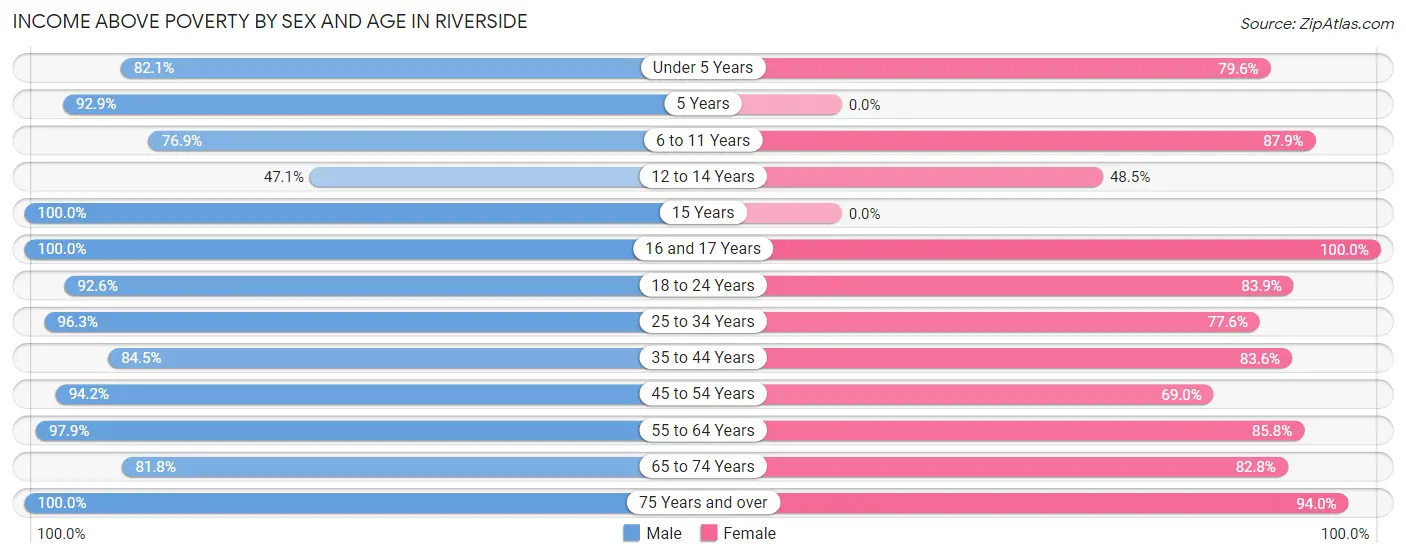
| Age Bracket | Male | Female |
| Under 5 Years | 46 (82.1%) | 70 (79.5%) |
| 5 Years | 52 (92.9%) | 0 (0.0%) |
| 6 to 11 Years | 40 (76.9%) | 80 (87.9%) |
| 12 to 14 Years | 16 (47.1%) | 16 (48.5%) |
| 15 Years | 19 (100.0%) | 0 (0.0%) |
| 16 and 17 Years | 26 (100.0%) | 14 (100.0%) |
| 18 to 24 Years | 100 (92.6%) | 52 (83.9%) |
| 25 to 34 Years | 104 (96.3%) | 180 (77.6%) |
| 35 to 44 Years | 147 (84.5%) | 127 (83.6%) |
| 45 to 54 Years | 163 (94.2%) | 98 (69.0%) |
| 55 to 64 Years | 138 (97.9%) | 157 (85.8%) |
| 65 to 74 Years | 90 (81.8%) | 120 (82.8%) |
| 75 Years and over | 42 (100.0%) | 142 (94.0%) |
| Total | 983 (89.4%) | 1,056 (80.6%) |
Income Below Poverty Among Married-Couple Families in Riverside
The poverty statistics for married-couple families in Riverside show that 10.1% or 43 of the total 427 families live below the poverty line. Families with 3 or 4 children have the highest poverty rate of 56.2%, comprising of 9 families. On the other hand, families with no children have the lowest poverty rate of 5.1%, which includes 13 families.
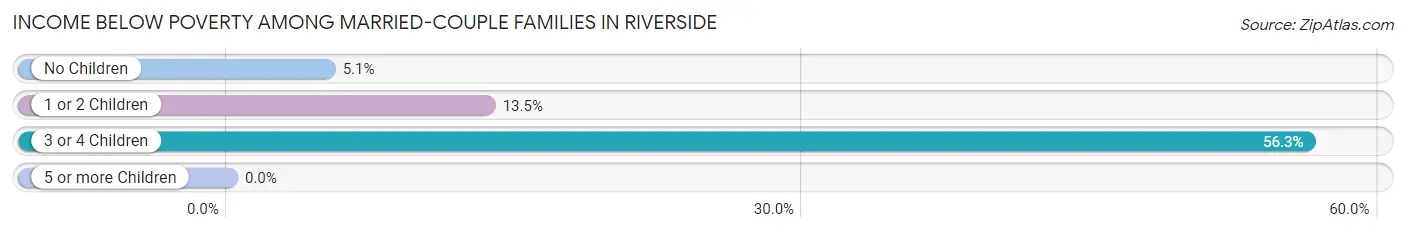
| Children | Above Poverty | Below Poverty |
| No Children | 242 (94.9%) | 13 (5.1%) |
| 1 or 2 Children | 135 (86.5%) | 21 (13.5%) |
| 3 or 4 Children | 7 (43.8%) | 9 (56.2%) |
| 5 or more Children | 0 (0.0%) | 0 (0.0%) |
| Total | 384 (89.9%) | 43 (10.1%) |
Income Below Poverty Among Single-Parent Households in Riverside
According to the poverty data in Riverside, 13.6% or 6 single-father households and 12.4% or 21 single-mother households are living below the poverty line. Among single-father households, those with 1 or 2 children have the highest poverty rate, with 6 households (17.1%) experiencing poverty. Likewise, among single-mother households, those with 3 or 4 children have the highest poverty rate, with 4 households (25.0%) falling below the poverty line.
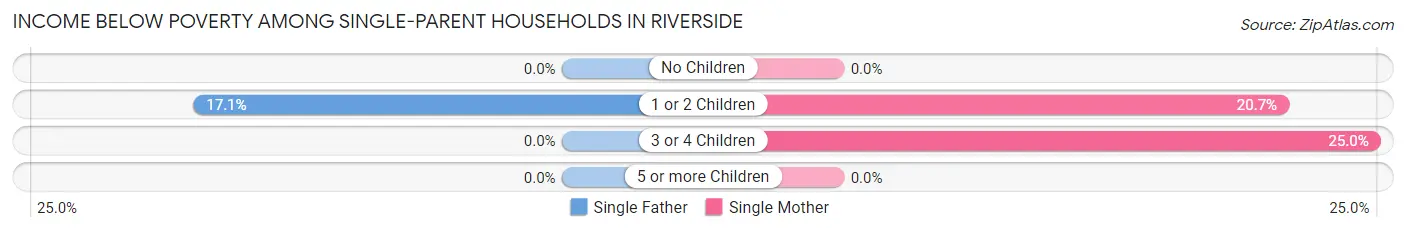
| Children | Single Father | Single Mother |
| No Children | 0 (0.0%) | 0 (0.0%) |
| 1 or 2 Children | 6 (17.1%) | 17 (20.7%) |
| 3 or 4 Children | 0 (0.0%) | 4 (25.0%) |
| 5 or more Children | 0 (0.0%) | 0 (0.0%) |
| Total | 6 (13.6%) | 21 (12.4%) |
Income Below Poverty Among Married-Couple vs Single-Parent Households in Riverside
The poverty data for Riverside shows that 43 of the married-couple family households (10.1%) and 27 of the single-parent households (12.7%) are living below the poverty level. Within the married-couple family households, those with 3 or 4 children have the highest poverty rate, with 9 households (56.2%) falling below the poverty line. Among the single-parent households, those with 3 or 4 children have the highest poverty rate, with 4 household (25.0%) living below poverty.
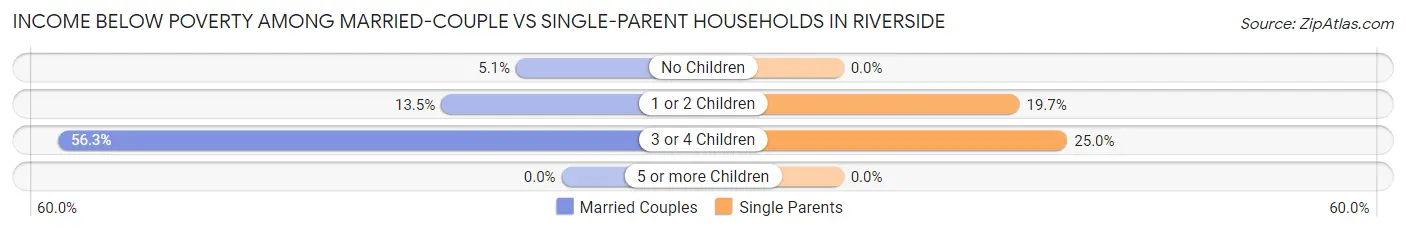
| Children | Married-Couple Families | Single-Parent Households |
| No Children | 13 (5.1%) | 0 (0.0%) |
| 1 or 2 Children | 21 (13.5%) | 23 (19.7%) |
| 3 or 4 Children | 9 (56.2%) | 4 (25.0%) |
| 5 or more Children | 0 (0.0%) | 0 (0.0%) |
| Total | 43 (10.1%) | 27 (12.7%) |
Race in Riverside
The most populous races in Riverside are White / Caucasian (1,970 | 81.8%), Black / African American (326 | 13.5%), and Two or more Races (72 | 3.0%).
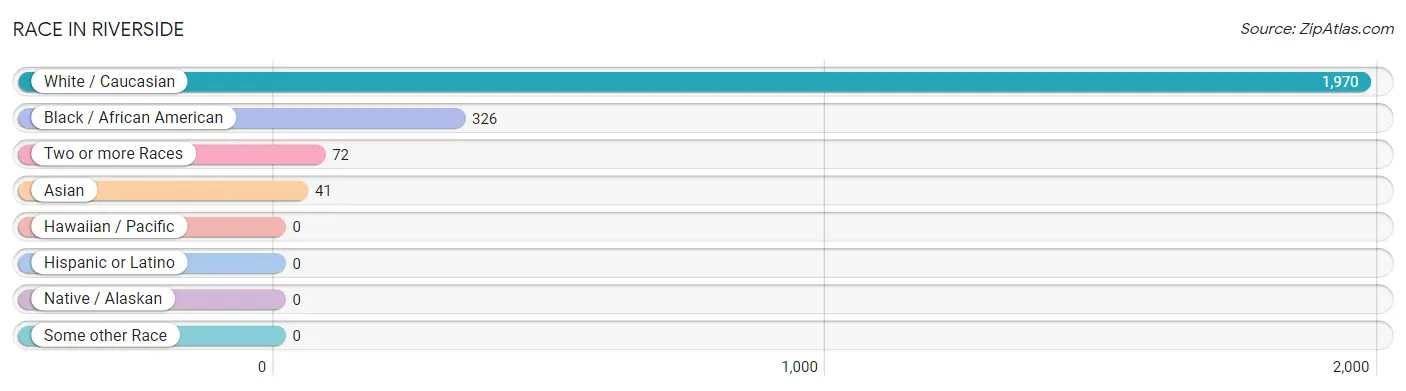
| Race | # Population | % Population |
| Asian | 41 | 1.7% |
| Black / African American | 326 | 13.5% |
| Hawaiian / Pacific | 0 | 0.0% |
| Hispanic or Latino | 0 | 0.0% |
| Native / Alaskan | 0 | 0.0% |
| White / Caucasian | 1,970 | 81.8% |
| Two or more Races | 72 | 3.0% |
| Some other Race | 0 | 0.0% |
| Total | 2,409 | 100.0% |
Ancestry in Riverside
The most populous ancestries reported in Riverside are English (449 | 18.6%), Irish (233 | 9.7%), German (144 | 6.0%), American (128 | 5.3%), and Italian (102 | 4.2%), together accounting for 43.8% of all Riverside residents.
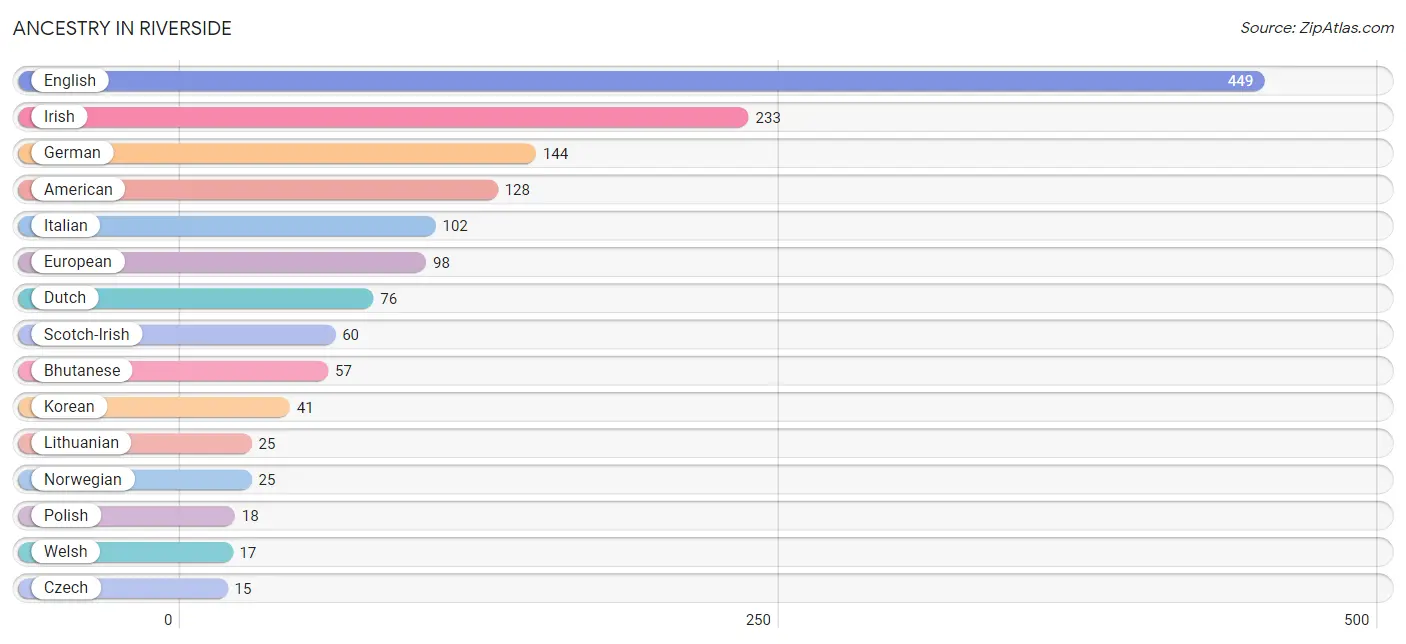
| Ancestry | # Population | % Population |
| African | 2 | 0.1% |
| American | 128 | 5.3% |
| Bhutanese | 57 | 2.4% |
| Cherokee | 7 | 0.3% |
| Czech | 15 | 0.6% |
| Dutch | 76 | 3.2% |
| Eastern European | 6 | 0.3% |
| English | 449 | 18.6% |
| European | 98 | 4.1% |
| French | 5 | 0.2% |
| German | 144 | 6.0% |
| Irish | 233 | 9.7% |
| Italian | 102 | 4.2% |
| Korean | 41 | 1.7% |
| Lithuanian | 25 | 1.0% |
| Norwegian | 25 | 1.0% |
| Polish | 18 | 0.7% |
| Scotch-Irish | 60 | 2.5% |
| Scottish | 1 | 0.0% |
| Subsaharan African | 2 | 0.1% |
| Welsh | 17 | 0.7% | View All 21 Rows |
Immigrants in Riverside

| Immigration Origin | # Population | % Population | View All 0 Rows |
Sex and Age in Riverside
Sex and Age in Riverside
The most populous age groups in Riverside are 45 to 49 Years (102 | 9.3%) for men and 25 to 29 Years (154 | 11.8%) for women.
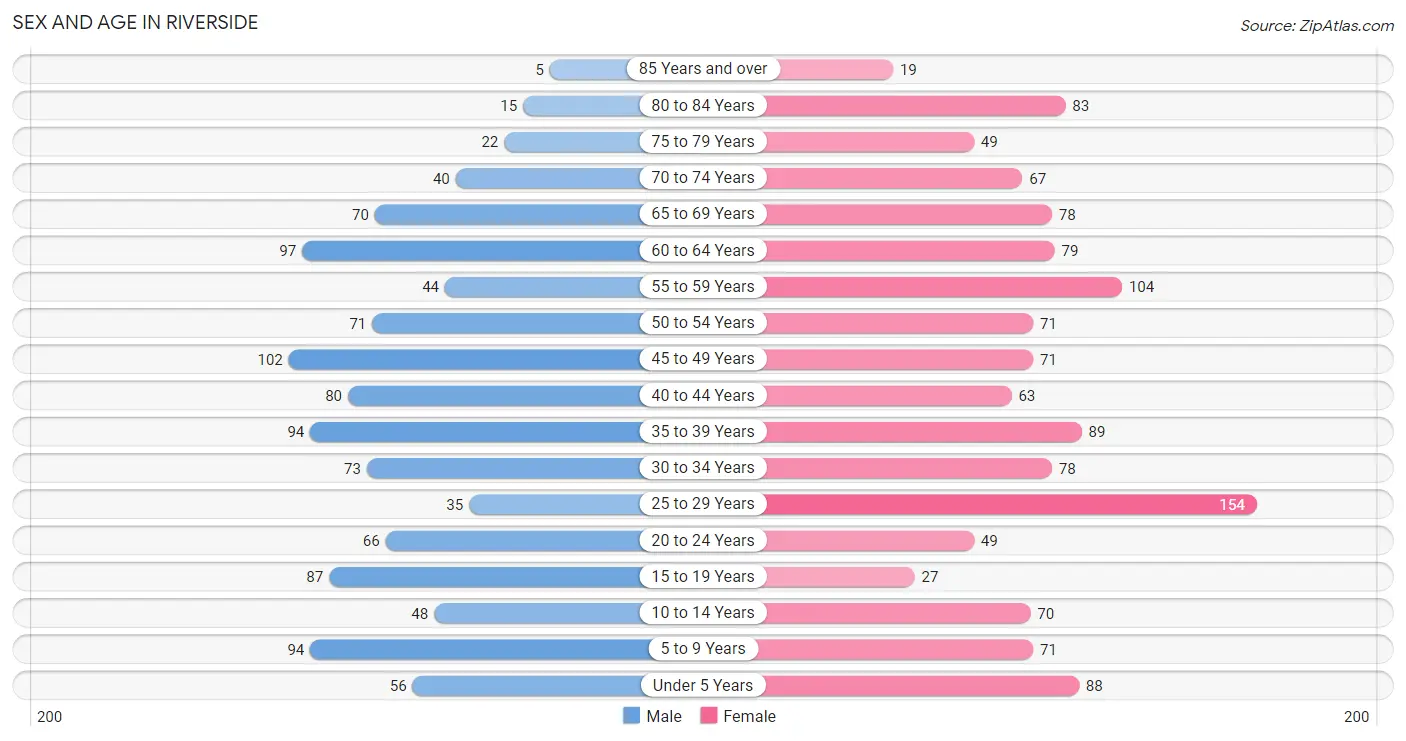
| Age Bracket | Male | Female |
| Under 5 Years | 56 (5.1%) | 88 (6.7%) |
| 5 to 9 Years | 94 (8.6%) | 71 (5.4%) |
| 10 to 14 Years | 48 (4.4%) | 70 (5.3%) |
| 15 to 19 Years | 87 (7.9%) | 27 (2.1%) |
| 20 to 24 Years | 66 (6.0%) | 49 (3.7%) |
| 25 to 29 Years | 35 (3.2%) | 154 (11.8%) |
| 30 to 34 Years | 73 (6.6%) | 78 (5.9%) |
| 35 to 39 Years | 94 (8.6%) | 89 (6.8%) |
| 40 to 44 Years | 80 (7.3%) | 63 (4.8%) |
| 45 to 49 Years | 102 (9.3%) | 71 (5.4%) |
| 50 to 54 Years | 71 (6.5%) | 71 (5.4%) |
| 55 to 59 Years | 44 (4.0%) | 104 (7.9%) |
| 60 to 64 Years | 97 (8.8%) | 79 (6.0%) |
| 65 to 69 Years | 70 (6.4%) | 78 (5.9%) |
| 70 to 74 Years | 40 (3.6%) | 67 (5.1%) |
| 75 to 79 Years | 22 (2.0%) | 49 (3.7%) |
| 80 to 84 Years | 15 (1.4%) | 83 (6.3%) |
| 85 Years and over | 5 (0.4%) | 19 (1.5%) |
| Total | 1,099 (100.0%) | 1,310 (100.0%) |
Families and Households in Riverside
Median Family Size in Riverside
The median family size in Riverside is 3.19 persons per family, with single female/mother families (169 | 26.4%) accounting for the largest median family size of 3.55 persons per family. On the other hand, married-couple families (427 | 66.7%) represent the smallest median family size with 3.05 persons per family.
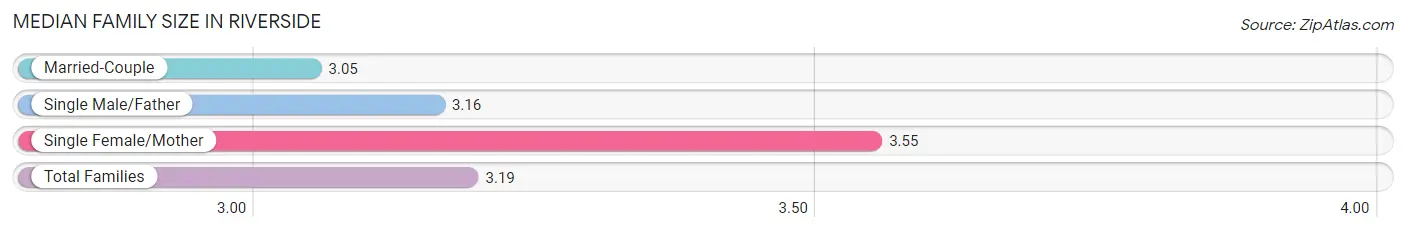
| Family Type | # Families | Family Size |
| Married-Couple | 427 (66.7%) | 3.05 |
| Single Male/Father | 44 (6.9%) | 3.16 |
| Single Female/Mother | 169 (26.4%) | 3.55 |
| Total Families | 640 (100.0%) | 3.19 |
Median Household Size in Riverside
The median household size in Riverside is 2.58 persons per household, with single female/mother households (169 | 18.1%) accounting for the largest median household size of 3.64 persons per household. non-family households (292 | 31.3%) represent the smallest median household size with 1.15 persons per household.
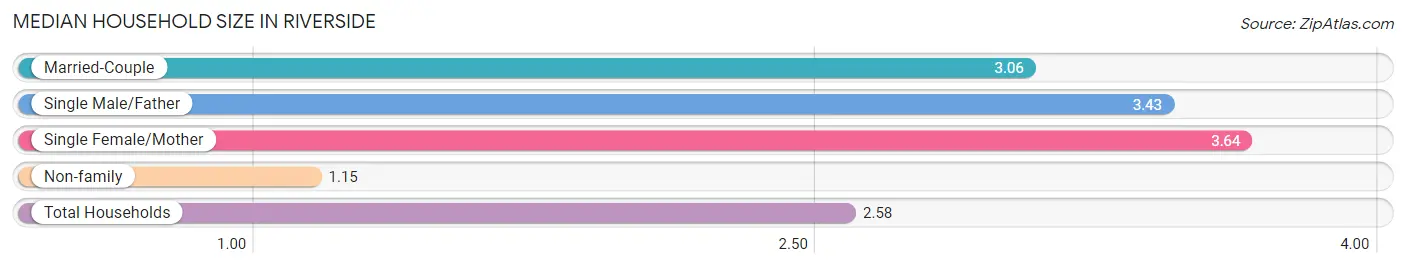
| Household Type | # Households | Household Size |
| Married-Couple | 427 (45.8%) | 3.06 |
| Single Male/Father | 44 (4.7%) | 3.43 |
| Single Female/Mother | 169 (18.1%) | 3.64 |
| Non-family | 292 (31.3%) | 1.15 |
| Total Households | 932 (100.0%) | 2.58 |
Household Size by Marriage Status in Riverside
Out of a total of 932 households in Riverside, 640 (68.7%) are family households, while 292 (31.3%) are nonfamily households. The most numerous type of family households are 2-person households, comprising 267, and the most common type of nonfamily households are 1-person households, comprising 254.
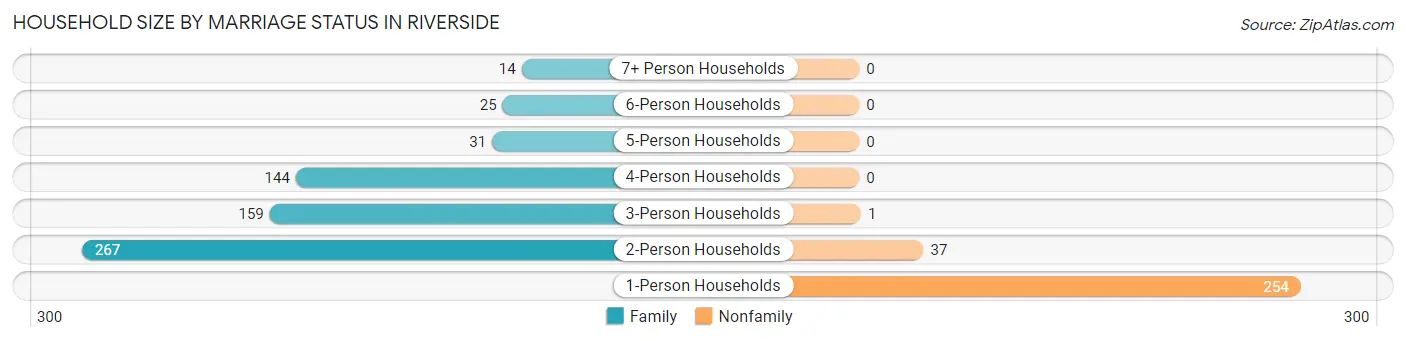
| Household Size | Family Households | Nonfamily Households |
| 1-Person Households | - | 254 (27.3%) |
| 2-Person Households | 267 (28.6%) | 37 (4.0%) |
| 3-Person Households | 159 (17.1%) | 1 (0.1%) |
| 4-Person Households | 144 (15.4%) | 0 (0.0%) |
| 5-Person Households | 31 (3.3%) | 0 (0.0%) |
| 6-Person Households | 25 (2.7%) | 0 (0.0%) |
| 7+ Person Households | 14 (1.5%) | 0 (0.0%) |
| Total | 640 (68.7%) | 292 (31.3%) |
Female Fertility in Riverside
Fertility by Age in Riverside
Average fertility rate in Riverside is 58.0 births per 1,000 women. Women in the age bracket of 20 to 34 years have the highest fertility rate with 110.0 births per 1,000 women. Women in the age bracket of 20 to 34 years acount for 100.0% of all women with births.
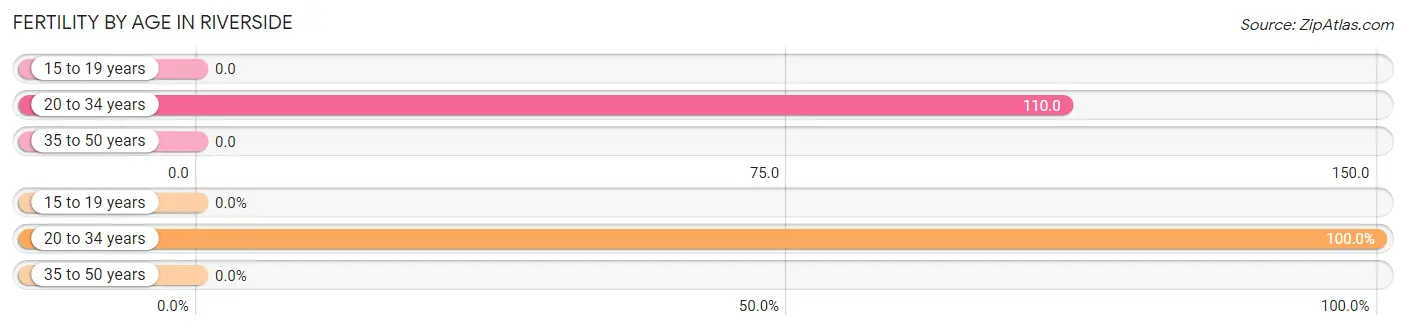
| Age Bracket | Women with Births | Births / 1,000 Women |
| 15 to 19 years | 0 (0.0%) | 0.0 |
| 20 to 34 years | 31 (100.0%) | 110.0 |
| 35 to 50 years | 0 (0.0%) | 0.0 |
| Total | 31 (100.0%) | 58.0 |
Fertility by Age by Marriage Status in Riverside
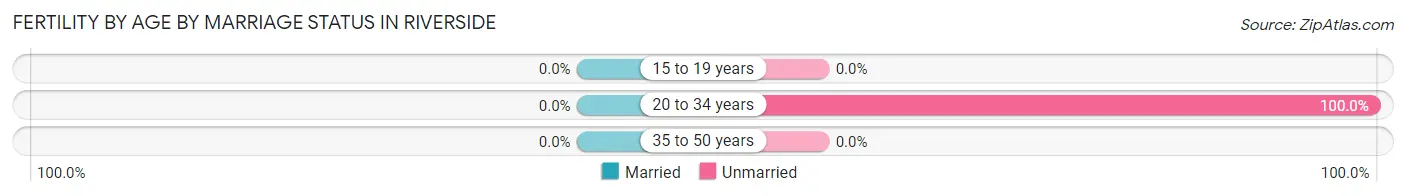
| Age Bracket | Married | Unmarried |
| 15 to 19 years | 0 (0.0%) | 0 (0.0%) |
| 20 to 34 years | 0 (0.0%) | 31 (100.0%) |
| 35 to 50 years | 0 (0.0%) | 0 (0.0%) |
| Total | 0 (0.0%) | 31 (100.0%) |
Fertility by Education in Riverside
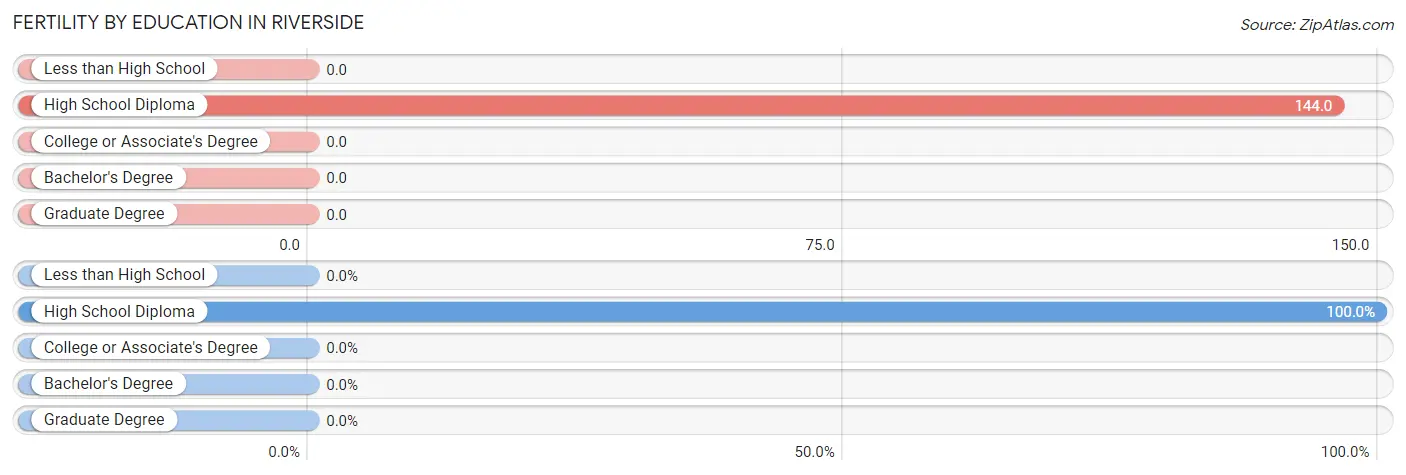
| Educational Attainment | Women with Births | Births / 1,000 Women |
| Less than High School | 0 (0.0%) | 0.0 |
| High School Diploma | 31 (100.0%) | 144.0 |
| College or Associate's Degree | 0 (0.0%) | 0.0 |
| Bachelor's Degree | 0 (0.0%) | 0.0 |
| Graduate Degree | 0 (0.0%) | 0.0 |
| Total | 31 (100.0%) | 58.0 |
Fertility by Education by Marriage Status in Riverside
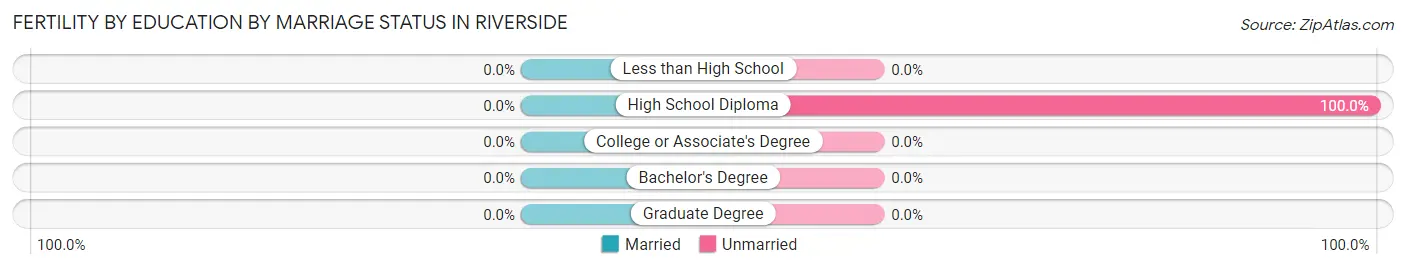
| Educational Attainment | Married | Unmarried |
| Less than High School | 0 (0.0%) | 0 (0.0%) |
| High School Diploma | 0 (0.0%) | 31 (100.0%) |
| College or Associate's Degree | 0 (0.0%) | 0 (0.0%) |
| Bachelor's Degree | 0 (0.0%) | 0 (0.0%) |
| Graduate Degree | 0 (0.0%) | 0 (0.0%) |
| Total | 0 (0.0%) | 31 (100.0%) |
Employment Characteristics in Riverside
Employment by Class of Employer in Riverside
Among the 1,116 employed individuals in Riverside, private company employees (781 | 70.0%), self-employed (not incorporated) (98 | 8.8%), and self-employed (incorporated) (62 | 5.6%) make up the most common classes of employment.
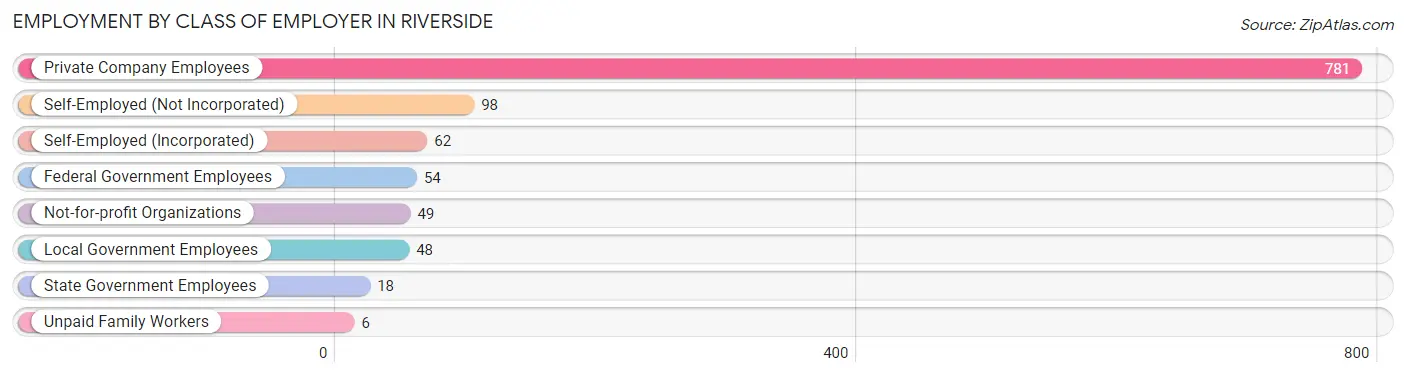
| Employer Class | # Employees | % Employees |
| Private Company Employees | 781 | 70.0% |
| Self-Employed (Incorporated) | 62 | 5.6% |
| Self-Employed (Not Incorporated) | 98 | 8.8% |
| Not-for-profit Organizations | 49 | 4.4% |
| Local Government Employees | 48 | 4.3% |
| State Government Employees | 18 | 1.6% |
| Federal Government Employees | 54 | 4.8% |
| Unpaid Family Workers | 6 | 0.5% |
| Total | 1,116 | 100.0% |
Employment Status by Age in Riverside
According to the labor force statistics for Riverside, out of the total population over 16 years of age (1,963), 60.7% or 1,192 individuals are in the labor force, with 5.3% or 63 of them unemployed. The age group with the highest labor force participation rate is 35 to 44 years, with 90.5% or 295 individuals in the labor force. Within the labor force, the 20 to 24 years age range has the highest percentage of unemployed individuals, with 23.2% or 23 of them being unemployed.
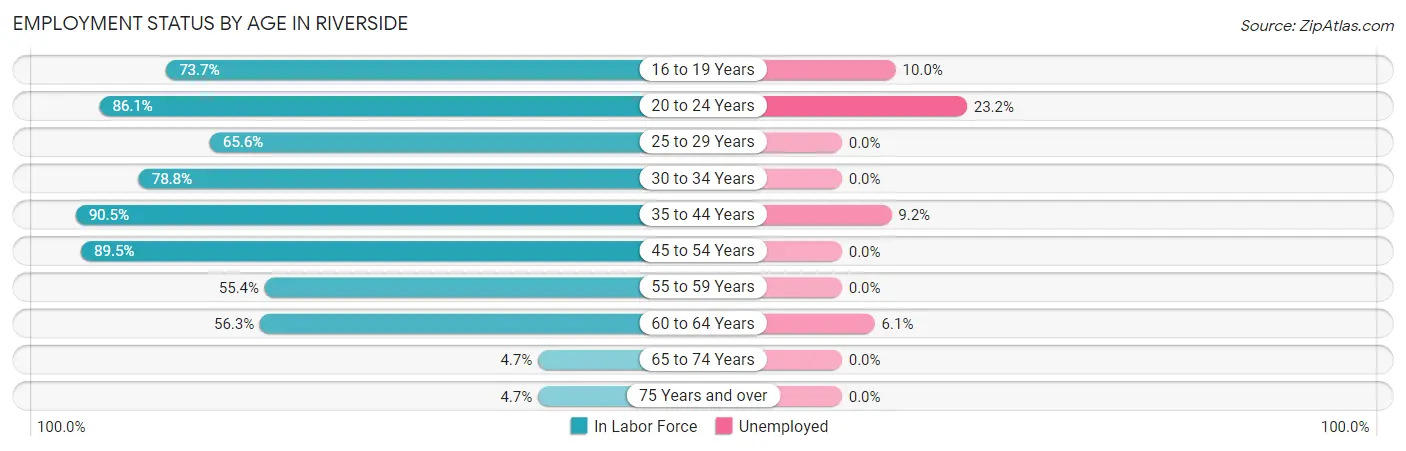
| Age Bracket | In Labor Force | Unemployed |
| 16 to 19 Years | 70 (73.7%) | 7 (10.0%) |
| 20 to 24 Years | 99 (86.1%) | 23 (23.2%) |
| 25 to 29 Years | 124 (65.6%) | 0 (0.0%) |
| 30 to 34 Years | 119 (78.8%) | 0 (0.0%) |
| 35 to 44 Years | 295 (90.5%) | 27 (9.2%) |
| 45 to 54 Years | 282 (89.5%) | 0 (0.0%) |
| 55 to 59 Years | 82 (55.4%) | 0 (0.0%) |
| 60 to 64 Years | 99 (56.3%) | 6 (6.1%) |
| 65 to 74 Years | 12 (4.7%) | 0 (0.0%) |
| 75 Years and over | 9 (4.7%) | 0 (0.0%) |
| Total | 1,192 (60.7%) | 63 (5.3%) |
Employment Status by Educational Attainment in Riverside
According to labor force statistics for Riverside, 76.7% of individuals (1,001) out of the total population between 25 and 64 years of age (1,305) are in the labor force, with 3.3% or 33 of them being unemployed. The group with the highest labor force participation rate are those with the educational attainment of college / associate degree, with 88.1% or 267 individuals in the labor force. Within the labor force, individuals with less than high school education have the highest percentage of unemployment, with 7.9% or 12 of them being unemployed.
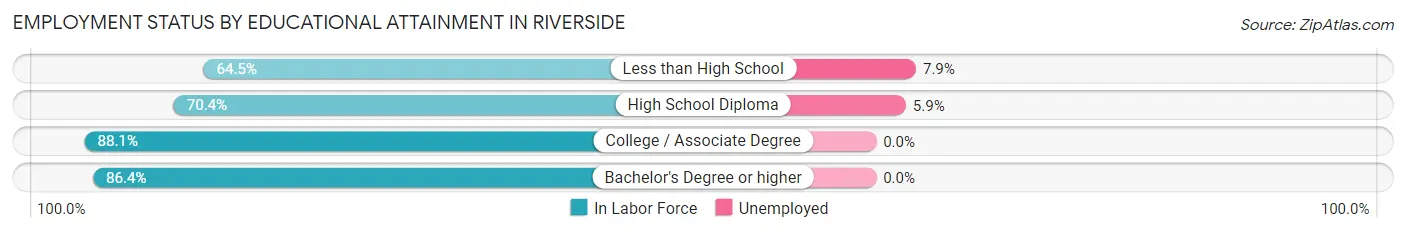
| Educational Attainment | In Labor Force | Unemployed |
| Less than High School | 151 (64.5%) | 18 (7.9%) |
| High School Diploma | 354 (70.4%) | 30 (5.9%) |
| College / Associate Degree | 267 (88.1%) | 0 (0.0%) |
| Bachelor's Degree or higher | 229 (86.4%) | 0 (0.0%) |
| Total | 1,001 (76.7%) | 43 (3.3%) |
Employment Occupations by Sex in Riverside
Management, Business, Science and Arts Occupations
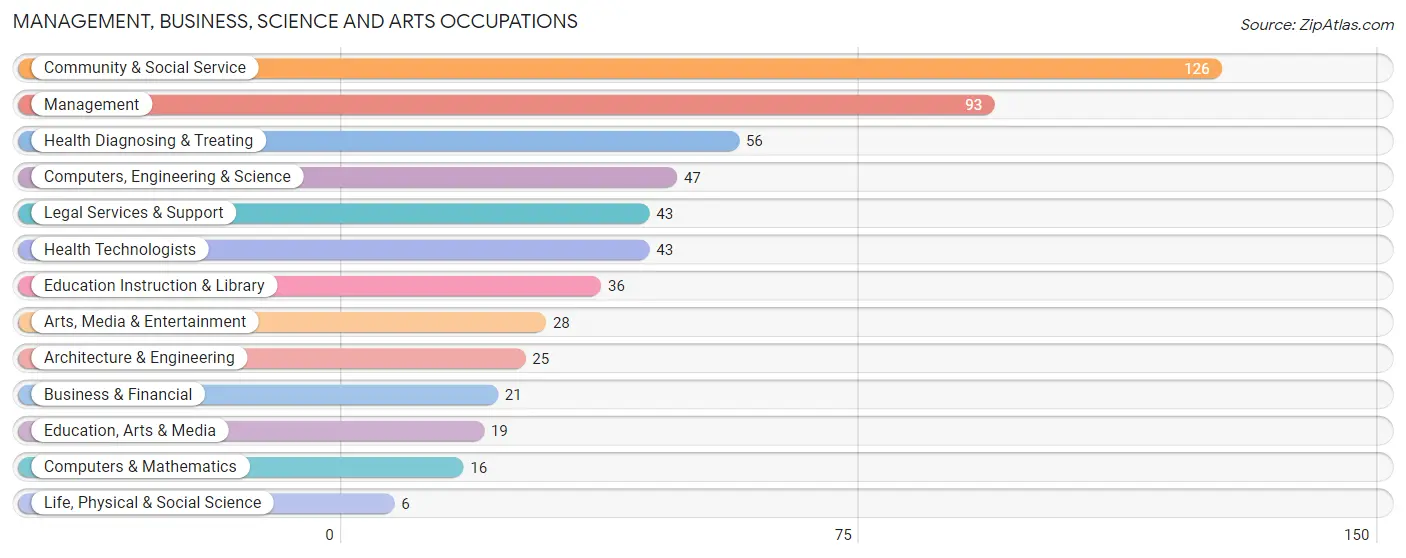
The most common Management, Business, Science and Arts occupations in Riverside are Community & Social Service (126 | 11.2%), Management (93 | 8.2%), Health Diagnosing & Treating (56 | 5.0%), Computers, Engineering & Science (47 | 4.2%), and Legal Services & Support (43 | 3.8%).
Management, Business, Science and Arts Occupations by Sex
Within the Management, Business, Science and Arts occupations in Riverside, the most male-oriented occupations are Computers, Engineering & Science (100.0%), Computers & Mathematics (100.0%), and Architecture & Engineering (100.0%), while the most female-oriented occupations are Business & Financial (100.0%), Education, Arts & Media (100.0%), and Education Instruction & Library (69.4%).
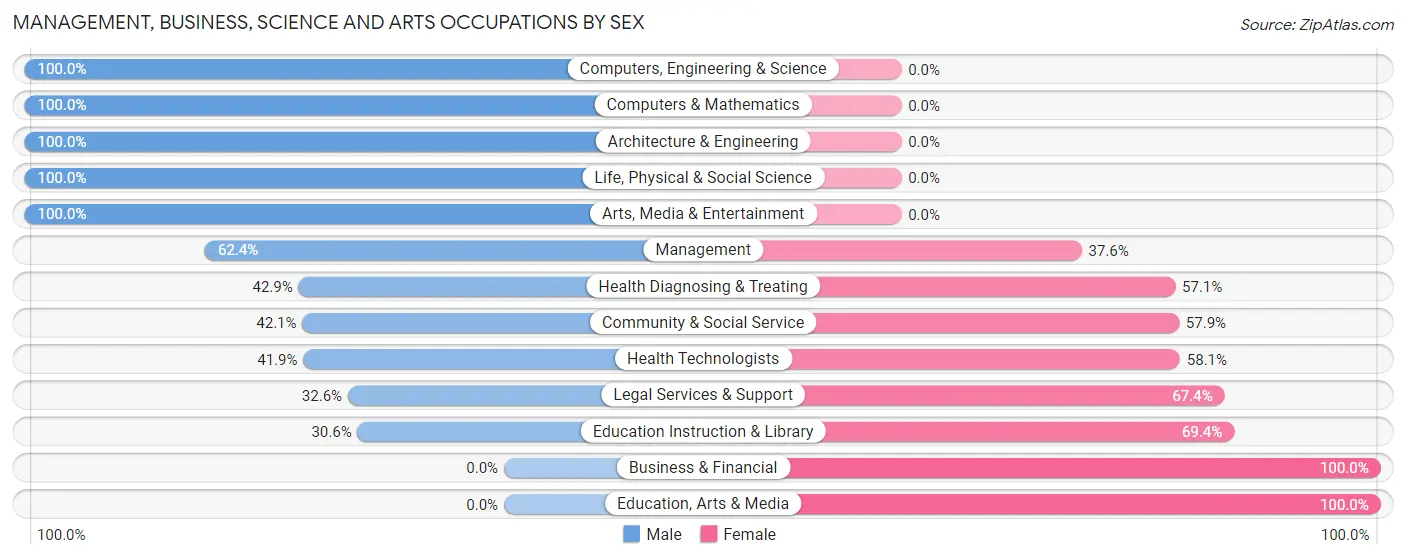
| Occupation | Male | Female |
| Management | 58 (62.4%) | 35 (37.6%) |
| Business & Financial | 0 (0.0%) | 21 (100.0%) |
| Computers, Engineering & Science | 47 (100.0%) | 0 (0.0%) |
| Computers & Mathematics | 16 (100.0%) | 0 (0.0%) |
| Architecture & Engineering | 25 (100.0%) | 0 (0.0%) |
| Life, Physical & Social Science | 6 (100.0%) | 0 (0.0%) |
| Community & Social Service | 53 (42.1%) | 73 (57.9%) |
| Education, Arts & Media | 0 (0.0%) | 19 (100.0%) |
| Legal Services & Support | 14 (32.6%) | 29 (67.4%) |
| Education Instruction & Library | 11 (30.6%) | 25 (69.4%) |
| Arts, Media & Entertainment | 28 (100.0%) | 0 (0.0%) |
| Health Diagnosing & Treating | 24 (42.9%) | 32 (57.1%) |
| Health Technologists | 18 (41.9%) | 25 (58.1%) |
| Total (Category) | 182 (53.1%) | 161 (46.9%) |
| Total (Overall) | 621 (55.0%) | 507 (45.0%) |
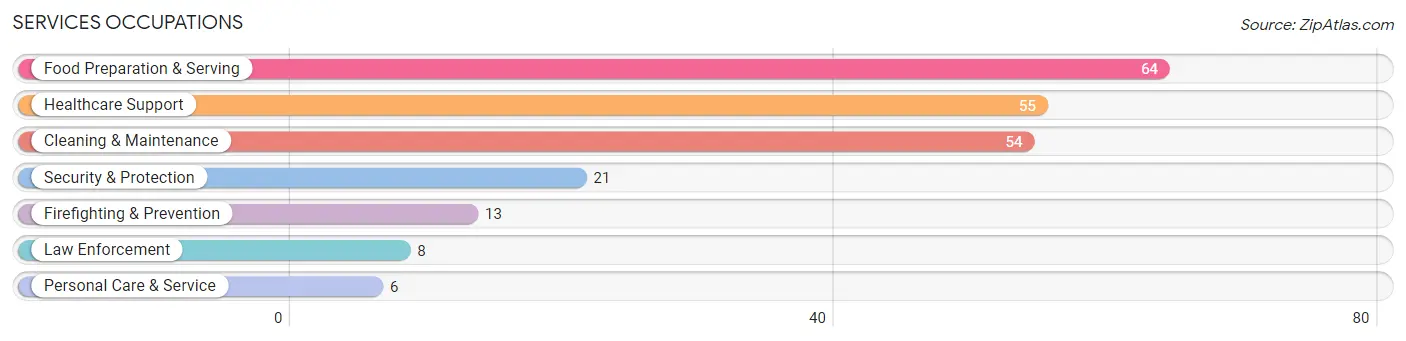
Services Occupations
The most common Services occupations in Riverside are Food Preparation & Serving (64 | 5.7%), Healthcare Support (55 | 4.9%), Cleaning & Maintenance (54 | 4.8%), Security & Protection (21 | 1.9%), and Firefighting & Prevention (13 | 1.1%).
Services Occupations by Sex
Within the Services occupations in Riverside, the most male-oriented occupations are Security & Protection (100.0%), Firefighting & Prevention (100.0%), and Law Enforcement (100.0%), while the most female-oriented occupations are Healthcare Support (89.1%), Food Preparation & Serving (56.2%), and Cleaning & Maintenance (51.8%).
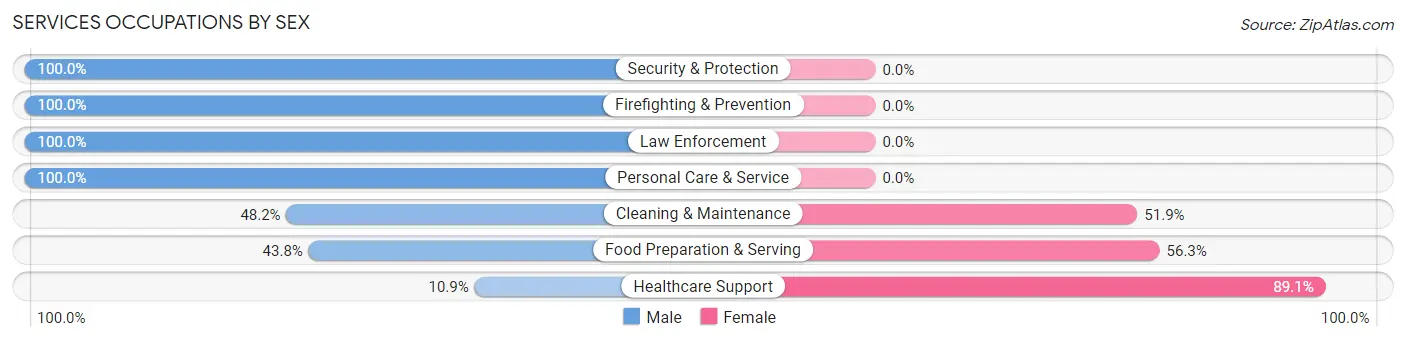
| Occupation | Male | Female |
| Healthcare Support | 6 (10.9%) | 49 (89.1%) |
| Security & Protection | 21 (100.0%) | 0 (0.0%) |
| Firefighting & Prevention | 13 (100.0%) | 0 (0.0%) |
| Law Enforcement | 8 (100.0%) | 0 (0.0%) |
| Food Preparation & Serving | 28 (43.8%) | 36 (56.2%) |
| Cleaning & Maintenance | 26 (48.1%) | 28 (51.8%) |
| Personal Care & Service | 6 (100.0%) | 0 (0.0%) |
| Total (Category) | 87 (43.5%) | 113 (56.5%) |
| Total (Overall) | 621 (55.0%) | 507 (45.0%) |
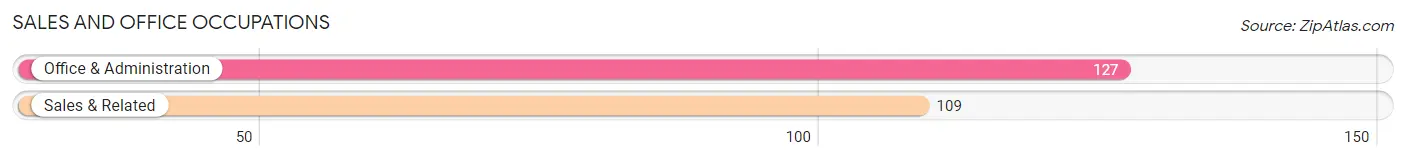
Sales and Office Occupations
The most common Sales and Office occupations in Riverside are Office & Administration (127 | 11.3%), and Sales & Related (109 | 9.7%).
Sales and Office Occupations by Sex
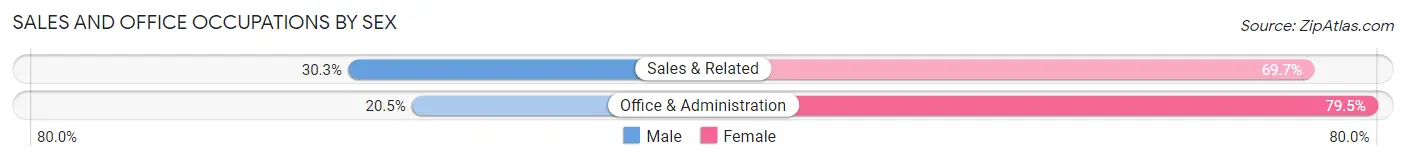
| Occupation | Male | Female |
| Sales & Related | 33 (30.3%) | 76 (69.7%) |
| Office & Administration | 26 (20.5%) | 101 (79.5%) |
| Total (Category) | 59 (25.0%) | 177 (75.0%) |
| Total (Overall) | 621 (55.0%) | 507 (45.0%) |
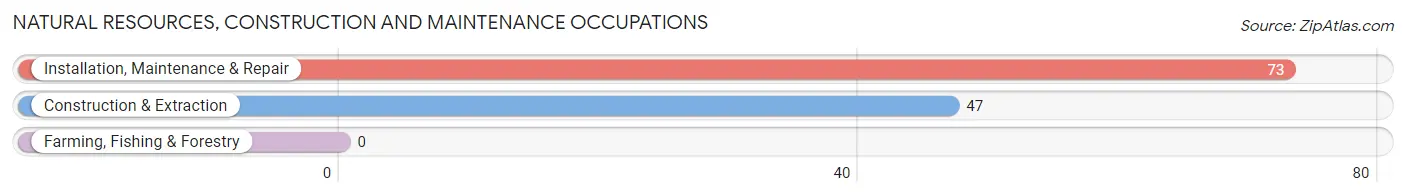
Natural Resources, Construction and Maintenance Occupations
The most common Natural Resources, Construction and Maintenance occupations in Riverside are Installation, Maintenance & Repair (73 | 6.5%), and Construction & Extraction (47 | 4.2%).
Natural Resources, Construction and Maintenance Occupations by Sex
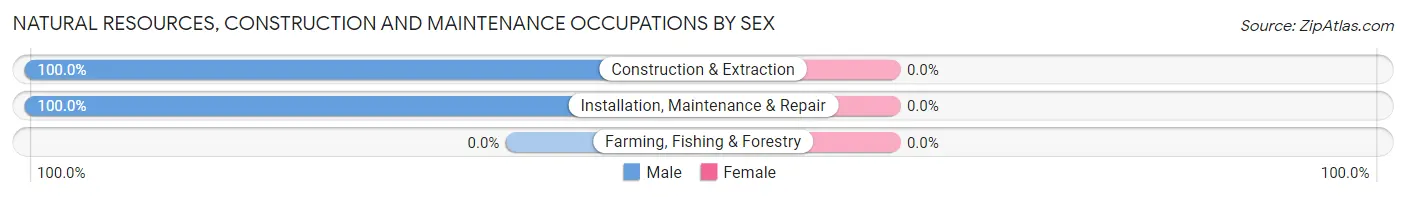
| Occupation | Male | Female |
| Farming, Fishing & Forestry | 0 (0.0%) | 0 (0.0%) |
| Construction & Extraction | 47 (100.0%) | 0 (0.0%) |
| Installation, Maintenance & Repair | 73 (100.0%) | 0 (0.0%) |
| Total (Category) | 120 (100.0%) | 0 (0.0%) |
| Total (Overall) | 621 (55.0%) | 507 (45.0%) |
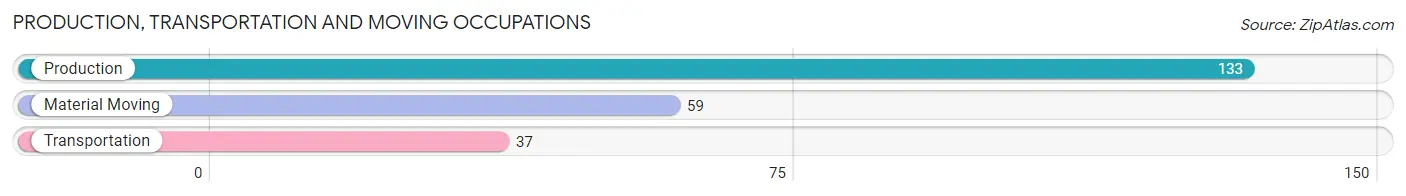
Production, Transportation and Moving Occupations
The most common Production, Transportation and Moving occupations in Riverside are Production (133 | 11.8%), Material Moving (59 | 5.2%), and Transportation (37 | 3.3%).
Production, Transportation and Moving Occupations by Sex
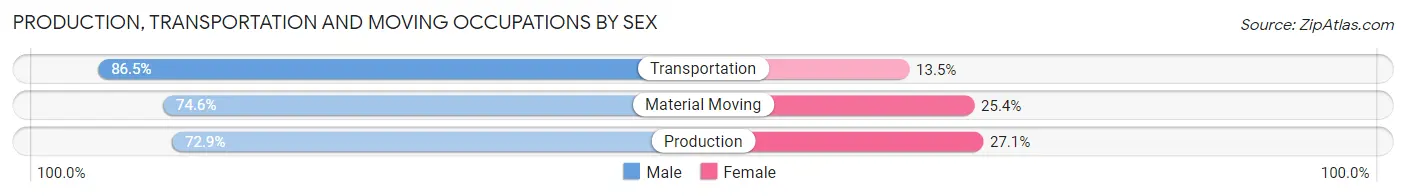
| Occupation | Male | Female |
| Production | 97 (72.9%) | 36 (27.1%) |
| Transportation | 32 (86.5%) | 5 (13.5%) |
| Material Moving | 44 (74.6%) | 15 (25.4%) |
| Total (Category) | 173 (75.5%) | 56 (24.4%) |
| Total (Overall) | 621 (55.0%) | 507 (45.0%) |
Employment Industries by Sex in Riverside
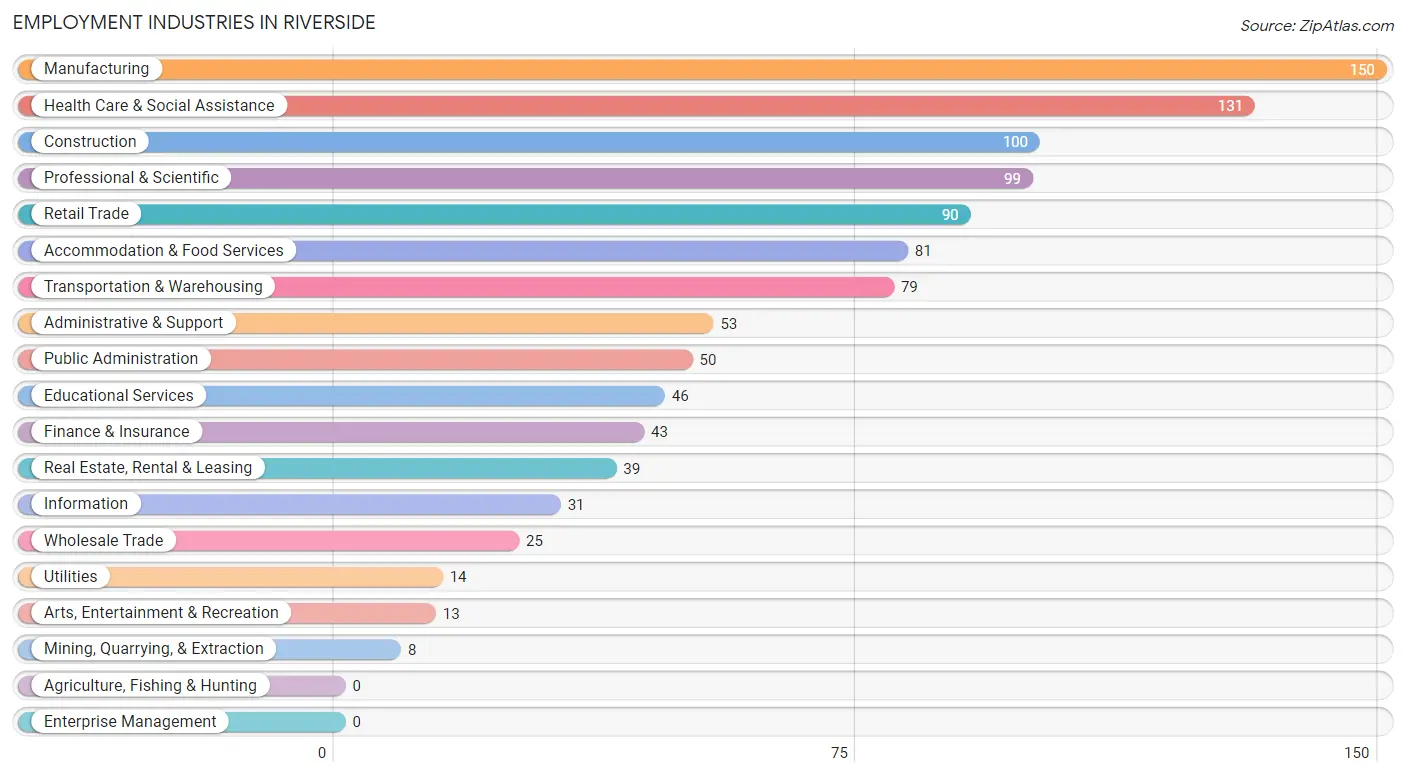
Employment Industries in Riverside
The major employment industries in Riverside include Manufacturing (150 | 13.3%), Health Care & Social Assistance (131 | 11.6%), Construction (100 | 8.9%), Professional & Scientific (99 | 8.8%), and Retail Trade (90 | 8.0%).
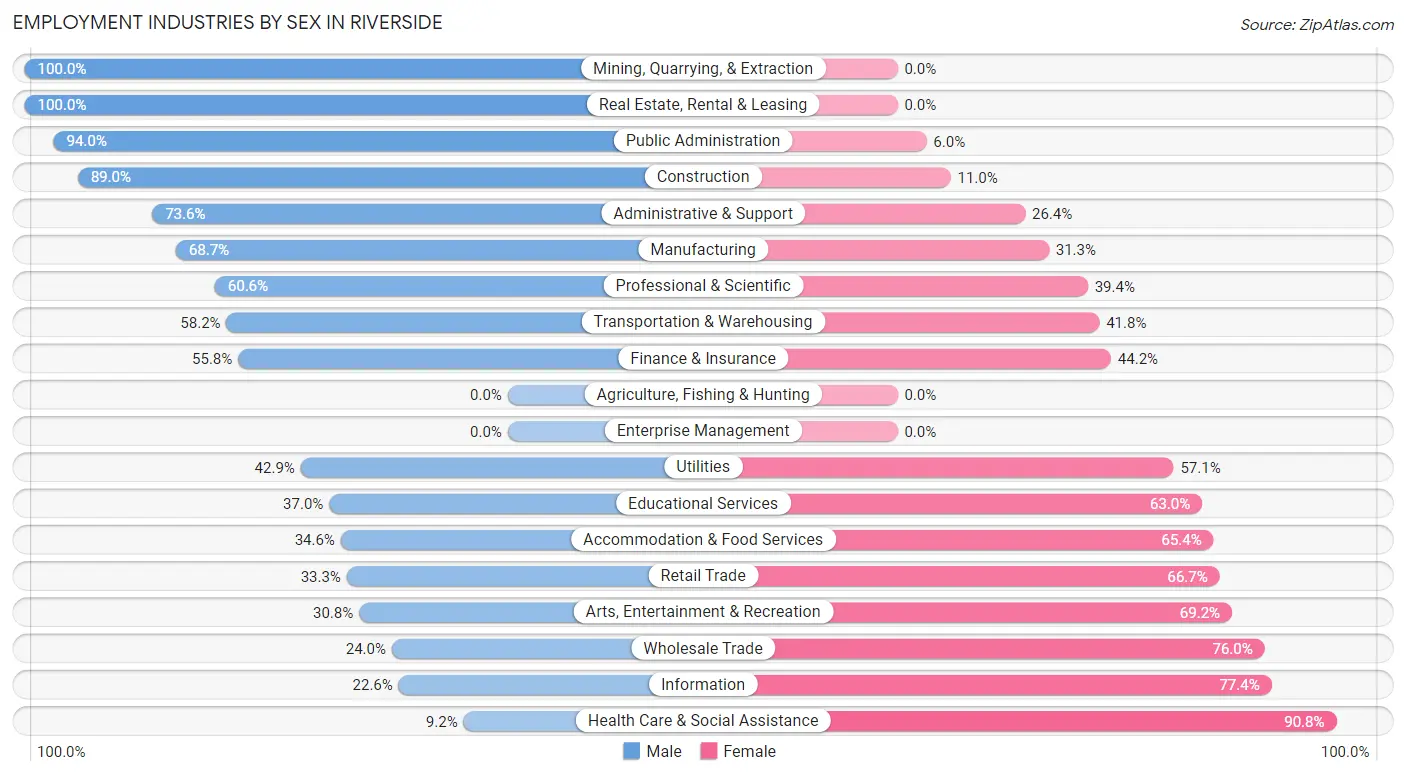
Employment Industries by Sex in Riverside
The Riverside industries that see more men than women are Mining, Quarrying, & Extraction (100.0%), Real Estate, Rental & Leasing (100.0%), and Public Administration (94.0%), whereas the industries that tend to have a higher number of women are Health Care & Social Assistance (90.8%), Information (77.4%), and Wholesale Trade (76.0%).
| Industry | Male | Female |
| Agriculture, Fishing & Hunting | 0 (0.0%) | 0 (0.0%) |
| Mining, Quarrying, & Extraction | 8 (100.0%) | 0 (0.0%) |
| Construction | 89 (89.0%) | 11 (11.0%) |
| Manufacturing | 103 (68.7%) | 47 (31.3%) |
| Wholesale Trade | 6 (24.0%) | 19 (76.0%) |
| Retail Trade | 30 (33.3%) | 60 (66.7%) |
| Transportation & Warehousing | 46 (58.2%) | 33 (41.8%) |
| Utilities | 6 (42.9%) | 8 (57.1%) |
| Information | 7 (22.6%) | 24 (77.4%) |
| Finance & Insurance | 24 (55.8%) | 19 (44.2%) |
| Real Estate, Rental & Leasing | 39 (100.0%) | 0 (0.0%) |
| Professional & Scientific | 60 (60.6%) | 39 (39.4%) |
| Enterprise Management | 0 (0.0%) | 0 (0.0%) |
| Administrative & Support | 39 (73.6%) | 14 (26.4%) |
| Educational Services | 17 (37.0%) | 29 (63.0%) |
| Health Care & Social Assistance | 12 (9.2%) | 119 (90.8%) |
| Arts, Entertainment & Recreation | 4 (30.8%) | 9 (69.2%) |
| Accommodation & Food Services | 28 (34.6%) | 53 (65.4%) |
| Public Administration | 47 (94.0%) | 3 (6.0%) |
| Total | 621 (55.0%) | 507 (45.0%) |
Education in Riverside
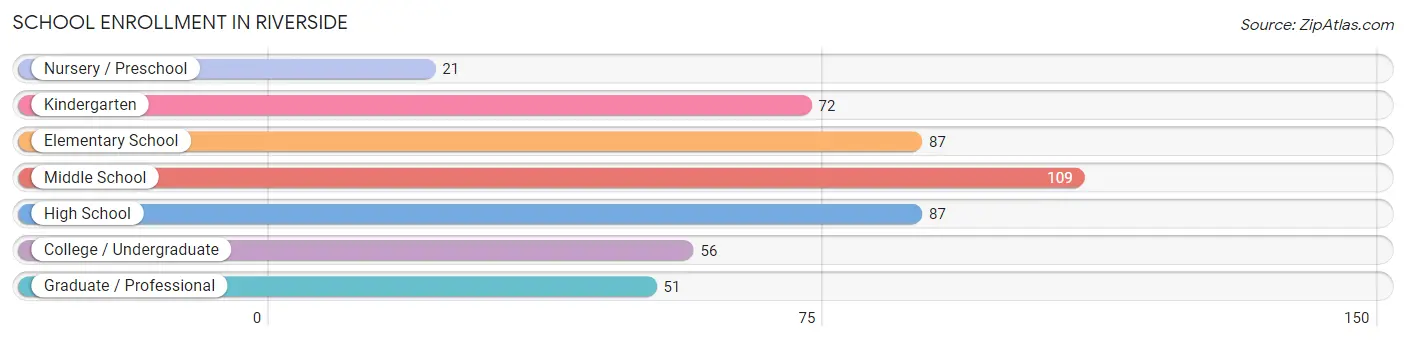
School Enrollment in Riverside
The most common levels of schooling among the 483 students in Riverside are middle school (109 | 22.6%), elementary school (87 | 18.0%), and high school (87 | 18.0%).
| School Level | # Students | % Students |
| Nursery / Preschool | 21 | 4.3% |
| Kindergarten | 72 | 14.9% |
| Elementary School | 87 | 18.0% |
| Middle School | 109 | 22.6% |
| High School | 87 | 18.0% |
| College / Undergraduate | 56 | 11.6% |
| Graduate / Professional | 51 | 10.6% |
| Total | 483 | 100.0% |
School Enrollment by Age by Funding Source in Riverside
Out of a total of 483 students who are enrolled in schools in Riverside, 81 (16.8%) attend a private institution, while the remaining 402 (83.2%) are enrolled in public schools. The age group of 25 to 34 year olds has the highest likelihood of being enrolled in private schools, with 27 (43.5% in the age bracket) enrolled. Conversely, the age group of 20 to 24 year olds has the lowest likelihood of being enrolled in a private school, with 35 (100.0% in the age bracket) attending a public institution.
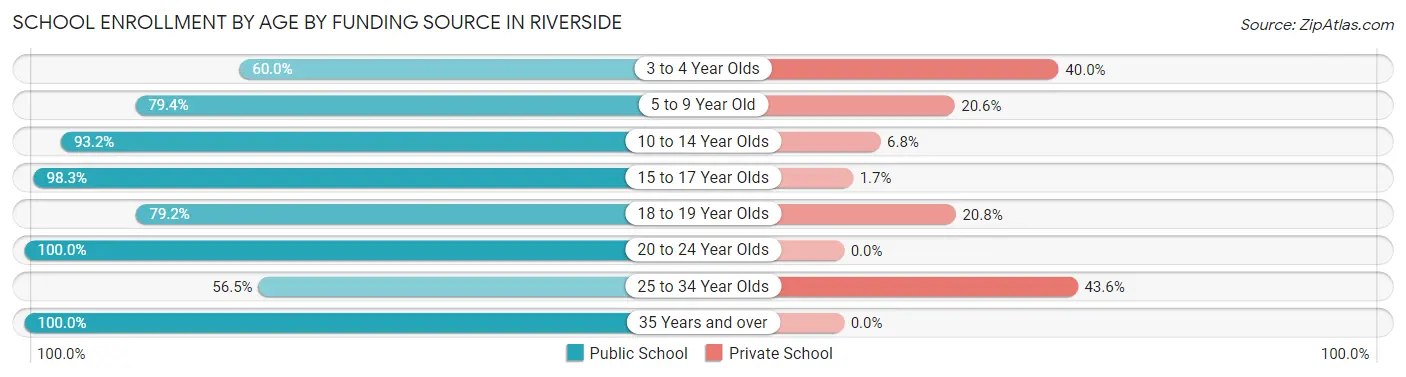
| Age Bracket | Public School | Private School |
| 3 to 4 Year Olds | 9 (60.0%) | 6 (40.0%) |
| 5 to 9 Year Old | 131 (79.4%) | 34 (20.6%) |
| 10 to 14 Year Olds | 110 (93.2%) | 8 (6.8%) |
| 15 to 17 Year Olds | 58 (98.3%) | 1 (1.7%) |
| 18 to 19 Year Olds | 19 (79.2%) | 5 (20.8%) |
| 20 to 24 Year Olds | 35 (100.0%) | 0 (0.0%) |
| 25 to 34 Year Olds | 35 (56.5%) | 27 (43.5%) |
| 35 Years and over | 5 (100.0%) | 0 (0.0%) |
| Total | 402 (83.2%) | 81 (16.8%) |
Educational Attainment by Field of Study in Riverside
Business (59 | 17.6%), science & technology (57 | 17.0%), education (52 | 15.5%), bio, nature & agricultural (45 | 13.4%), and psychology (31 | 9.2%) are the most common fields of study among 336 individuals in Riverside who have obtained a bachelor's degree or higher.
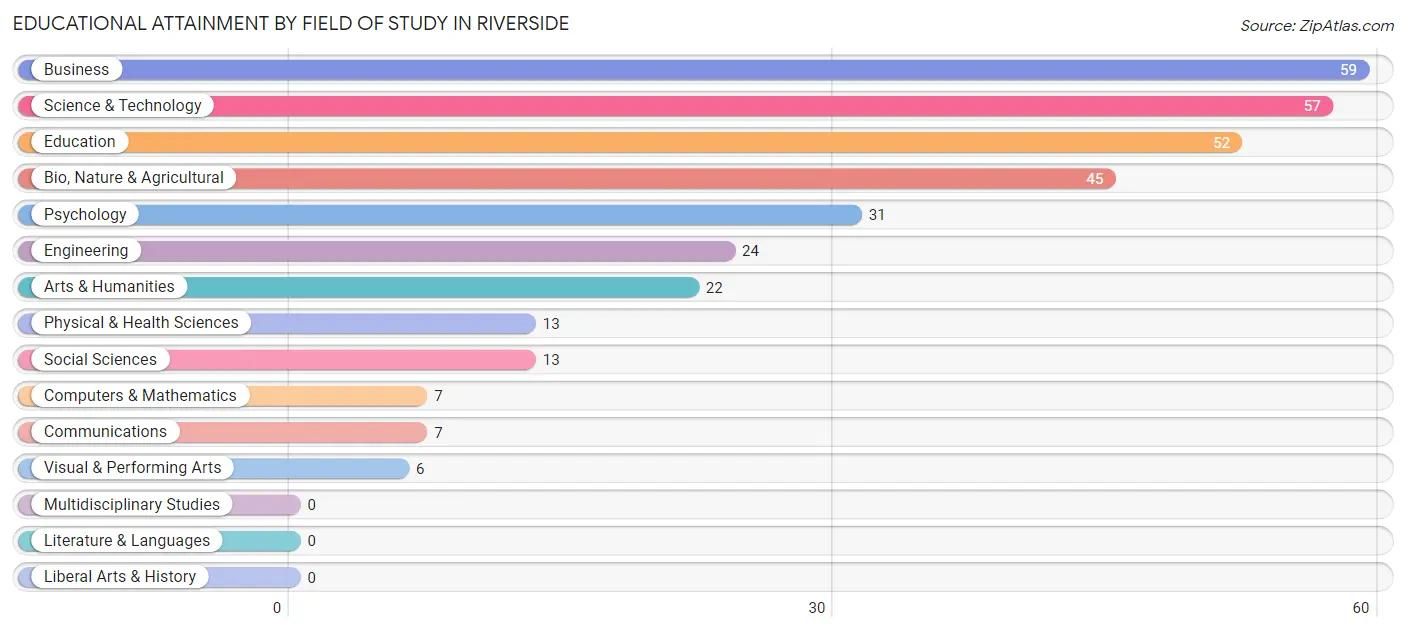
| Field of Study | # Graduates | % Graduates |
| Computers & Mathematics | 7 | 2.1% |
| Bio, Nature & Agricultural | 45 | 13.4% |
| Physical & Health Sciences | 13 | 3.9% |
| Psychology | 31 | 9.2% |
| Social Sciences | 13 | 3.9% |
| Engineering | 24 | 7.1% |
| Multidisciplinary Studies | 0 | 0.0% |
| Science & Technology | 57 | 17.0% |
| Business | 59 | 17.6% |
| Education | 52 | 15.5% |
| Literature & Languages | 0 | 0.0% |
| Liberal Arts & History | 0 | 0.0% |
| Visual & Performing Arts | 6 | 1.8% |
| Communications | 7 | 2.1% |
| Arts & Humanities | 22 | 6.6% |
| Total | 336 | 100.0% |
Transportation & Commute in Riverside
Vehicle Availability by Sex in Riverside
The most prevalent vehicle ownership categories in Riverside are males with 2 vehicles (209, accounting for 34.0%) and females with 2 vehicles (168, making up 41.7%).
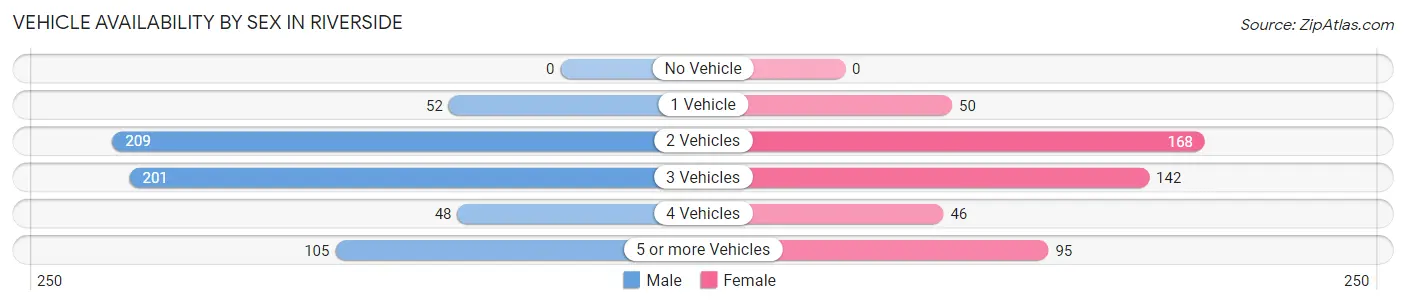
| Vehicles Available | Male | Female |
| No Vehicle | 0 (0.0%) | 0 (0.0%) |
| 1 Vehicle | 52 (8.5%) | 50 (10.0%) |
| 2 Vehicles | 209 (34.0%) | 168 (33.5%) |
| 3 Vehicles | 201 (32.7%) | 142 (28.3%) |
| 4 Vehicles | 48 (7.8%) | 46 (9.2%) |
| 5 or more Vehicles | 105 (17.1%) | 95 (19.0%) |
| Total | 615 (100.0%) | 501 (100.0%) |
Commute Time in Riverside
The most frequently occuring commute durations in Riverside are 10 to 14 minutes (159 commuters, 14.5%), 45 to 59 minutes (159 commuters, 14.5%), and 15 to 19 minutes (145 commuters, 13.2%).
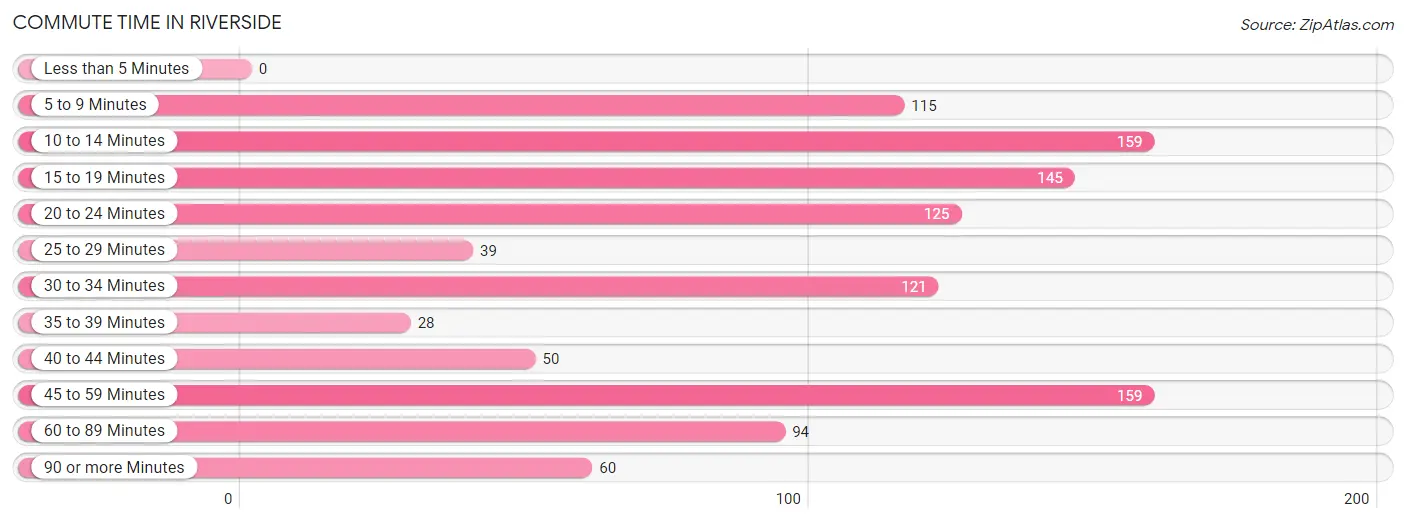
| Commute Time | # Commuters | % Commuters |
| Less than 5 Minutes | 0 | 0.0% |
| 5 to 9 Minutes | 115 | 10.5% |
| 10 to 14 Minutes | 159 | 14.5% |
| 15 to 19 Minutes | 145 | 13.2% |
| 20 to 24 Minutes | 125 | 11.4% |
| 25 to 29 Minutes | 39 | 3.6% |
| 30 to 34 Minutes | 121 | 11.1% |
| 35 to 39 Minutes | 28 | 2.6% |
| 40 to 44 Minutes | 50 | 4.6% |
| 45 to 59 Minutes | 159 | 14.5% |
| 60 to 89 Minutes | 94 | 8.6% |
| 90 or more Minutes | 60 | 5.5% |
Commute Time by Sex in Riverside
The most common commute times in Riverside are 45 to 59 minutes (98 commuters, 16.1%) for males and 15 to 19 minutes (96 commuters, 19.8%) for females.
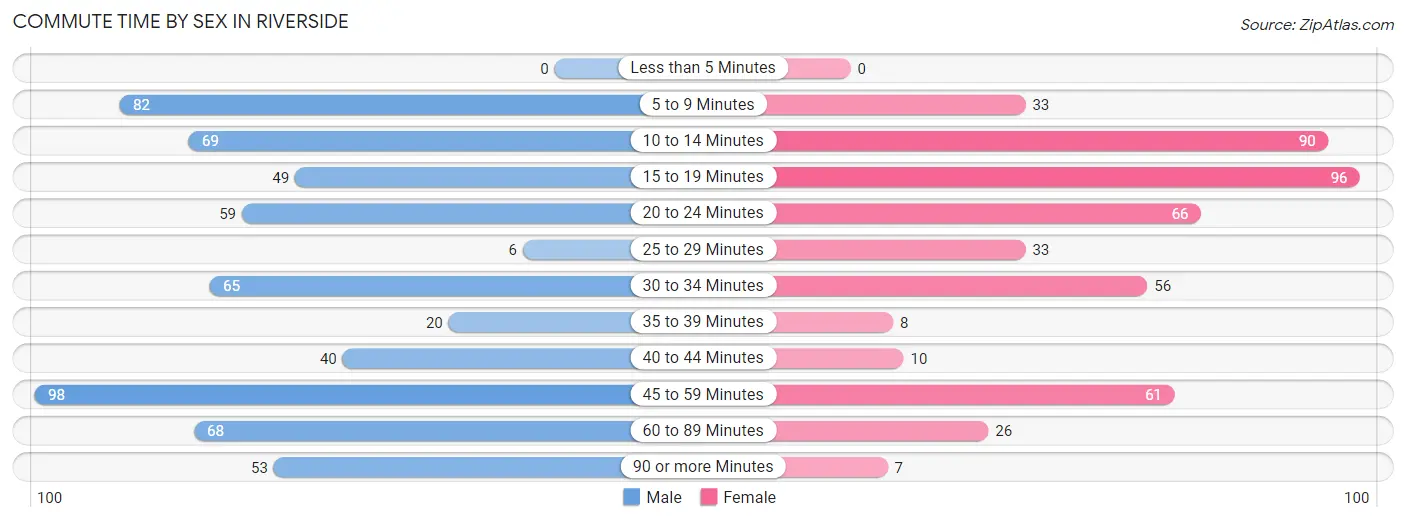
| Commute Time | Male | Female |
| Less than 5 Minutes | 0 (0.0%) | 0 (0.0%) |
| 5 to 9 Minutes | 82 (13.5%) | 33 (6.8%) |
| 10 to 14 Minutes | 69 (11.3%) | 90 (18.5%) |
| 15 to 19 Minutes | 49 (8.1%) | 96 (19.8%) |
| 20 to 24 Minutes | 59 (9.7%) | 66 (13.6%) |
| 25 to 29 Minutes | 6 (1.0%) | 33 (6.8%) |
| 30 to 34 Minutes | 65 (10.7%) | 56 (11.5%) |
| 35 to 39 Minutes | 20 (3.3%) | 8 (1.7%) |
| 40 to 44 Minutes | 40 (6.6%) | 10 (2.1%) |
| 45 to 59 Minutes | 98 (16.1%) | 61 (12.6%) |
| 60 to 89 Minutes | 68 (11.2%) | 26 (5.3%) |
| 90 or more Minutes | 53 (8.7%) | 7 (1.4%) |
Time of Departure to Work by Sex in Riverside
The most frequent times of departure to work in Riverside are 12:00 AM to 4:59 AM (110, 18.1%) for males and 7:00 AM to 7:29 AM (89, 18.3%) for females.
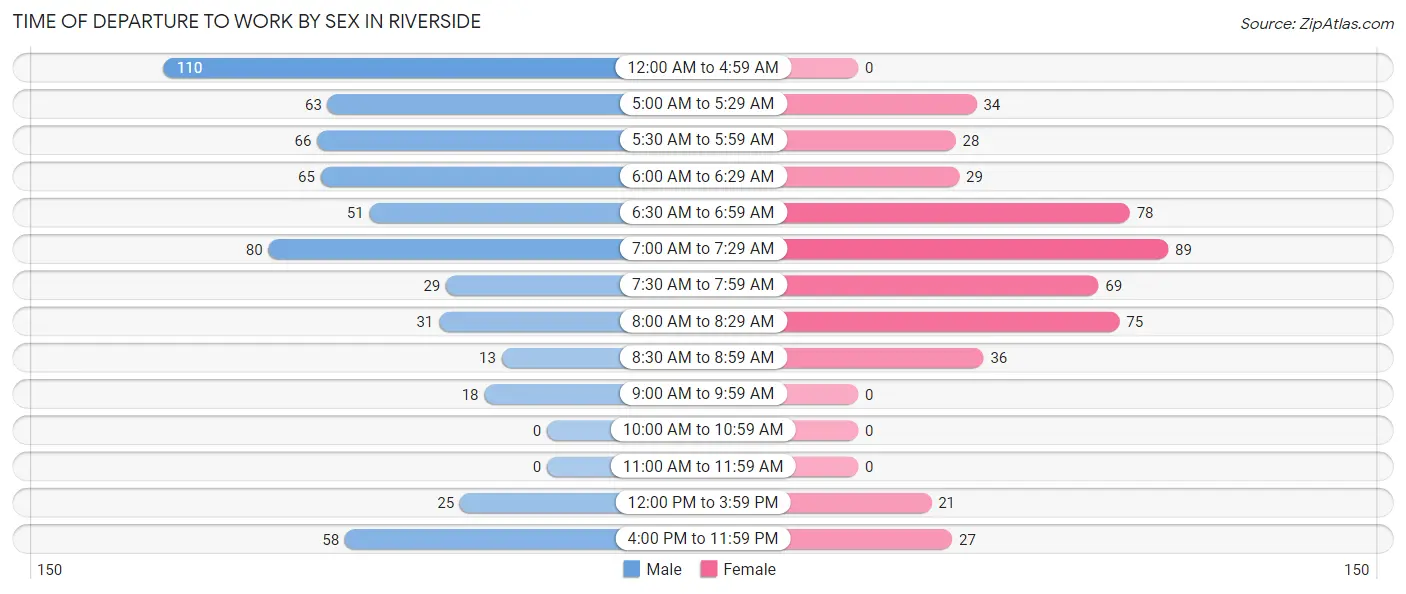
| Time of Departure | Male | Female |
| 12:00 AM to 4:59 AM | 110 (18.1%) | 0 (0.0%) |
| 5:00 AM to 5:29 AM | 63 (10.3%) | 34 (7.0%) |
| 5:30 AM to 5:59 AM | 66 (10.8%) | 28 (5.8%) |
| 6:00 AM to 6:29 AM | 65 (10.7%) | 29 (6.0%) |
| 6:30 AM to 6:59 AM | 51 (8.4%) | 78 (16.1%) |
| 7:00 AM to 7:29 AM | 80 (13.1%) | 89 (18.3%) |
| 7:30 AM to 7:59 AM | 29 (4.8%) | 69 (14.2%) |
| 8:00 AM to 8:29 AM | 31 (5.1%) | 75 (15.4%) |
| 8:30 AM to 8:59 AM | 13 (2.1%) | 36 (7.4%) |
| 9:00 AM to 9:59 AM | 18 (3.0%) | 0 (0.0%) |
| 10:00 AM to 10:59 AM | 0 (0.0%) | 0 (0.0%) |
| 11:00 AM to 11:59 AM | 0 (0.0%) | 0 (0.0%) |
| 12:00 PM to 3:59 PM | 25 (4.1%) | 21 (4.3%) |
| 4:00 PM to 11:59 PM | 58 (9.5%) | 27 (5.6%) |
| Total | 609 (100.0%) | 486 (100.0%) |
Housing Occupancy in Riverside
Occupancy by Ownership in Riverside
Of the total 932 dwellings in Riverside, owner-occupied units account for 726 (77.9%), while renter-occupied units make up 206 (22.1%).
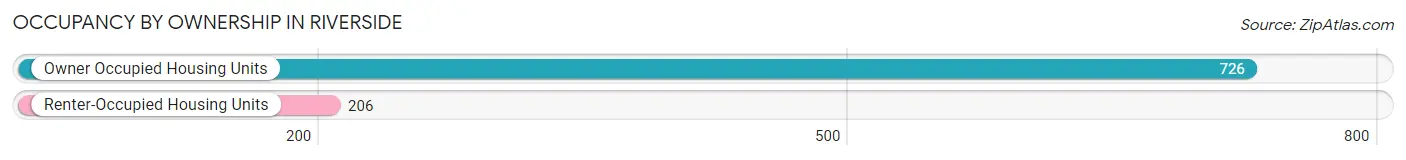
| Occupancy | # Housing Units | % Housing Units |
| Owner Occupied Housing Units | 726 | 77.9% |
| Renter-Occupied Housing Units | 206 | 22.1% |
| Total Occupied Housing Units | 932 | 100.0% |
Occupancy by Household Size in Riverside
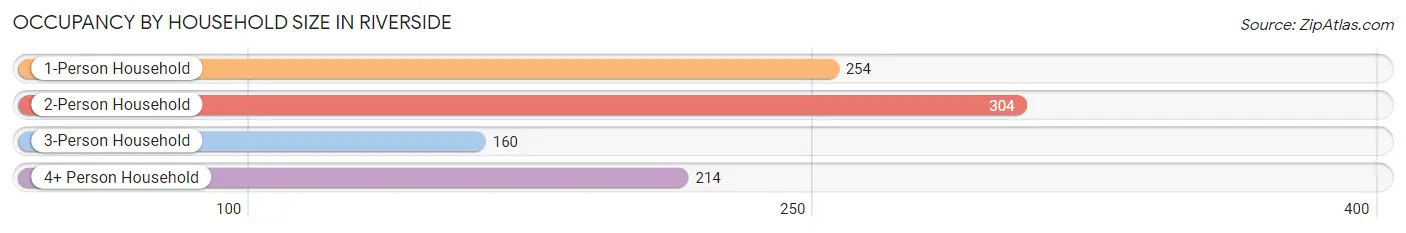
| Household Size | # Housing Units | % Housing Units |
| 1-Person Household | 254 | 27.3% |
| 2-Person Household | 304 | 32.6% |
| 3-Person Household | 160 | 17.2% |
| 4+ Person Household | 214 | 23.0% |
| Total Housing Units | 932 | 100.0% |
Occupancy by Ownership by Household Size in Riverside
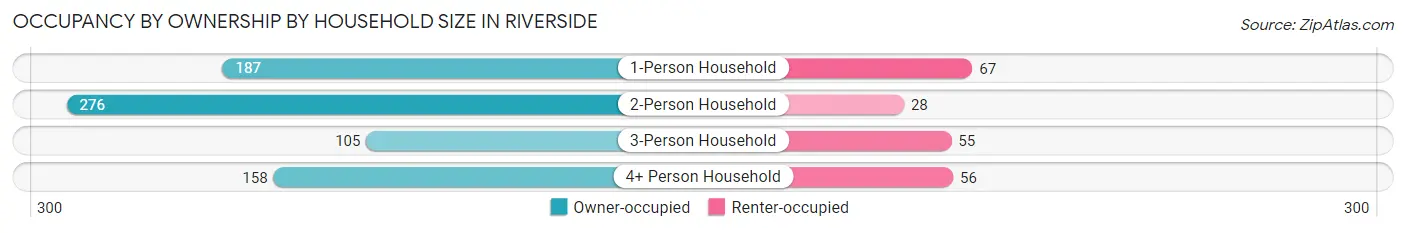
| Household Size | Owner-occupied | Renter-occupied |
| 1-Person Household | 187 (73.6%) | 67 (26.4%) |
| 2-Person Household | 276 (90.8%) | 28 (9.2%) |
| 3-Person Household | 105 (65.6%) | 55 (34.4%) |
| 4+ Person Household | 158 (73.8%) | 56 (26.2%) |
| Total Housing Units | 726 (77.9%) | 206 (22.1%) |
Occupancy by Educational Attainment in Riverside
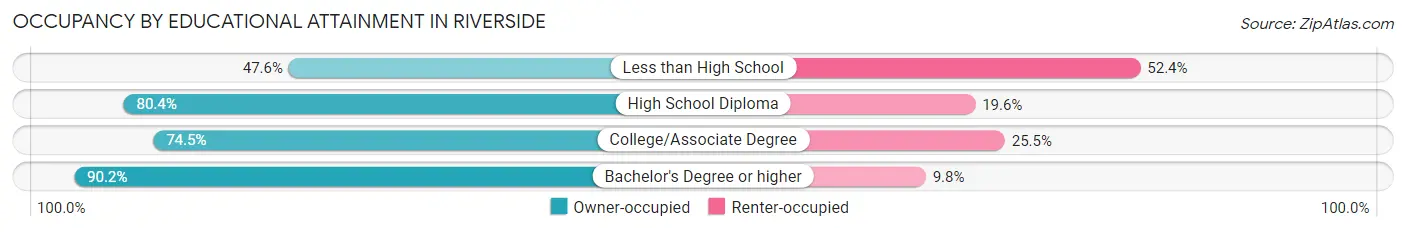
| Household Size | Owner-occupied | Renter-occupied |
| Less than High School | 40 (47.6%) | 44 (52.4%) |
| High School Diploma | 262 (80.4%) | 64 (19.6%) |
| College/Associate Degree | 222 (74.5%) | 76 (25.5%) |
| Bachelor's Degree or higher | 202 (90.2%) | 22 (9.8%) |
Occupancy by Age of Householder in Riverside
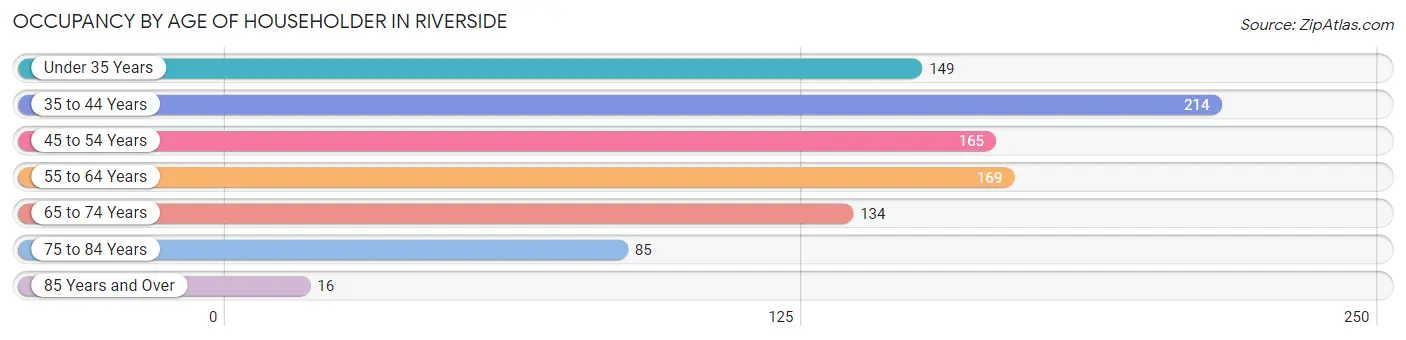
| Age Bracket | # Households | % Households |
| Under 35 Years | 149 | 16.0% |
| 35 to 44 Years | 214 | 23.0% |
| 45 to 54 Years | 165 | 17.7% |
| 55 to 64 Years | 169 | 18.1% |
| 65 to 74 Years | 134 | 14.4% |
| 75 to 84 Years | 85 | 9.1% |
| 85 Years and Over | 16 | 1.7% |
| Total | 932 | 100.0% |
Housing Finances in Riverside
Median Income by Occupancy in Riverside
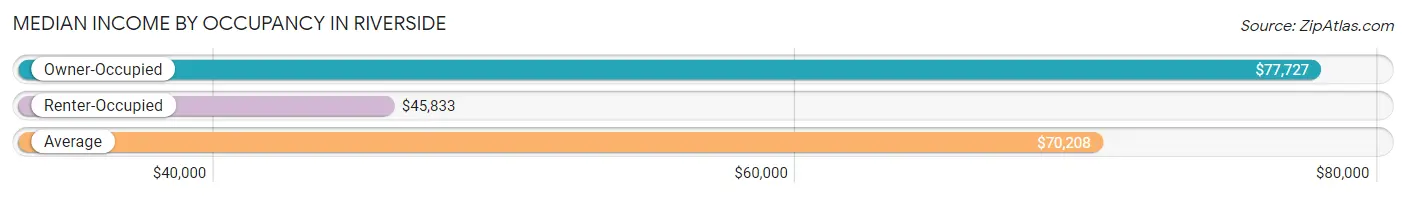
| Occupancy Type | # Households | Median Income |
| Owner-Occupied | 726 (77.9%) | $77,727 |
| Renter-Occupied | 206 (22.1%) | $45,833 |
| Average | 932 (100.0%) | $70,208 |
Occupancy by Householder Income Bracket in Riverside
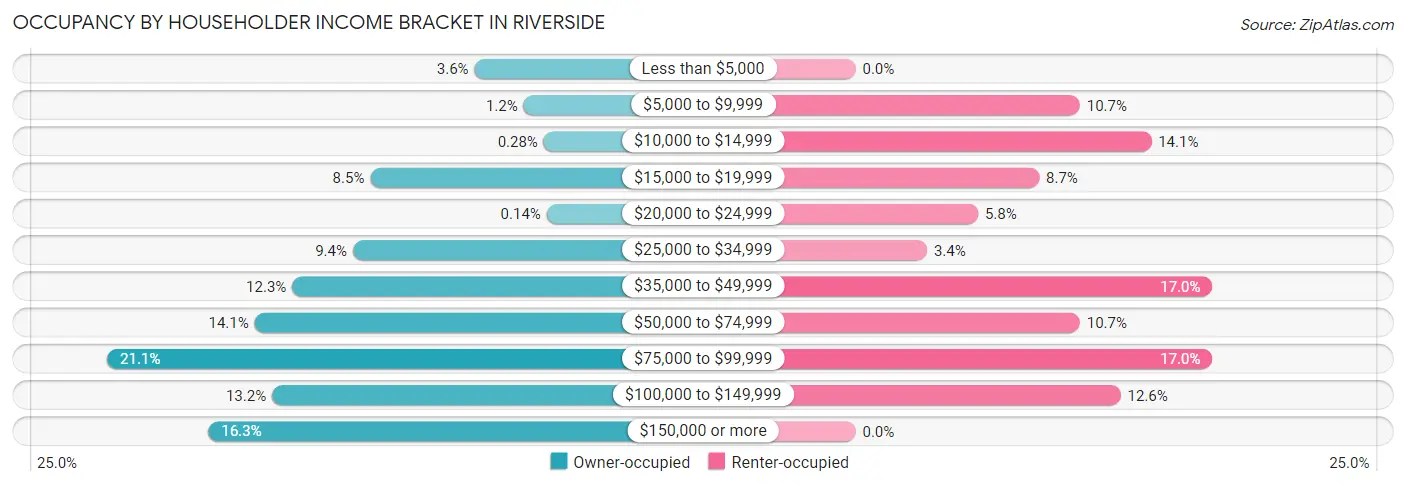
| Income Bracket | Owner-occupied | Renter-occupied |
| Less than $5,000 | 26 (3.6%) | 0 (0.0%) |
| $5,000 to $9,999 | 9 (1.2%) | 22 (10.7%) |
| $10,000 to $14,999 | 2 (0.3%) | 29 (14.1%) |
| $15,000 to $19,999 | 62 (8.5%) | 18 (8.7%) |
| $20,000 to $24,999 | 1 (0.1%) | 12 (5.8%) |
| $25,000 to $34,999 | 68 (9.4%) | 7 (3.4%) |
| $35,000 to $49,999 | 89 (12.3%) | 35 (17.0%) |
| $50,000 to $74,999 | 102 (14.1%) | 22 (10.7%) |
| $75,000 to $99,999 | 153 (21.1%) | 35 (17.0%) |
| $100,000 to $149,999 | 96 (13.2%) | 26 (12.6%) |
| $150,000 or more | 118 (16.3%) | 0 (0.0%) |
| Total | 726 (100.0%) | 206 (100.0%) |
Monthly Housing Cost Tiers in Riverside
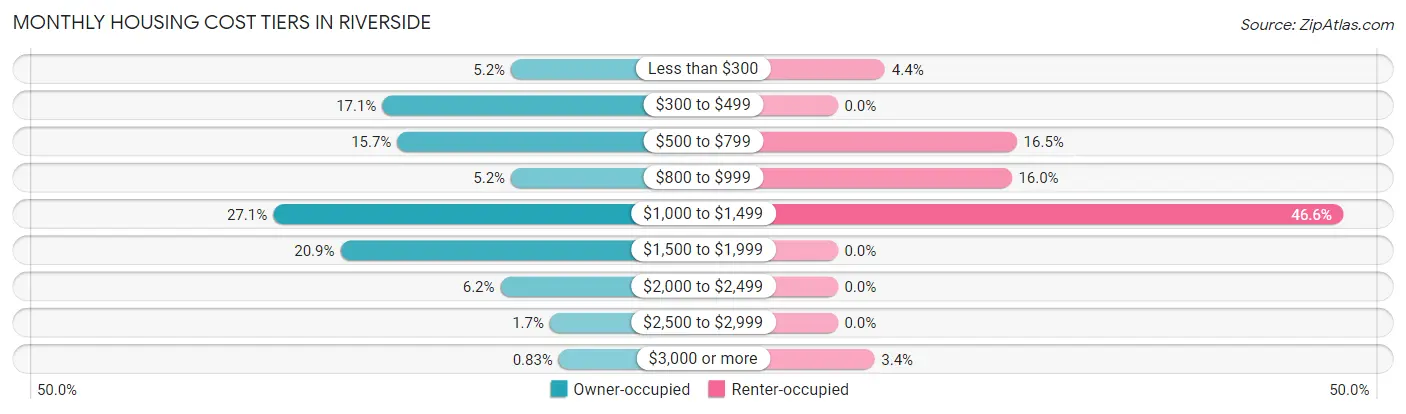
| Monthly Cost | Owner-occupied | Renter-occupied |
| Less than $300 | 38 (5.2%) | 9 (4.4%) |
| $300 to $499 | 124 (17.1%) | 0 (0.0%) |
| $500 to $799 | 114 (15.7%) | 34 (16.5%) |
| $800 to $999 | 38 (5.2%) | 33 (16.0%) |
| $1,000 to $1,499 | 197 (27.1%) | 96 (46.6%) |
| $1,500 to $1,999 | 152 (20.9%) | 0 (0.0%) |
| $2,000 to $2,499 | 45 (6.2%) | 0 (0.0%) |
| $2,500 to $2,999 | 12 (1.7%) | 0 (0.0%) |
| $3,000 or more | 6 (0.8%) | 7 (3.4%) |
| Total | 726 (100.0%) | 206 (100.0%) |
Physical Housing Characteristics in Riverside
Housing Structures in Riverside
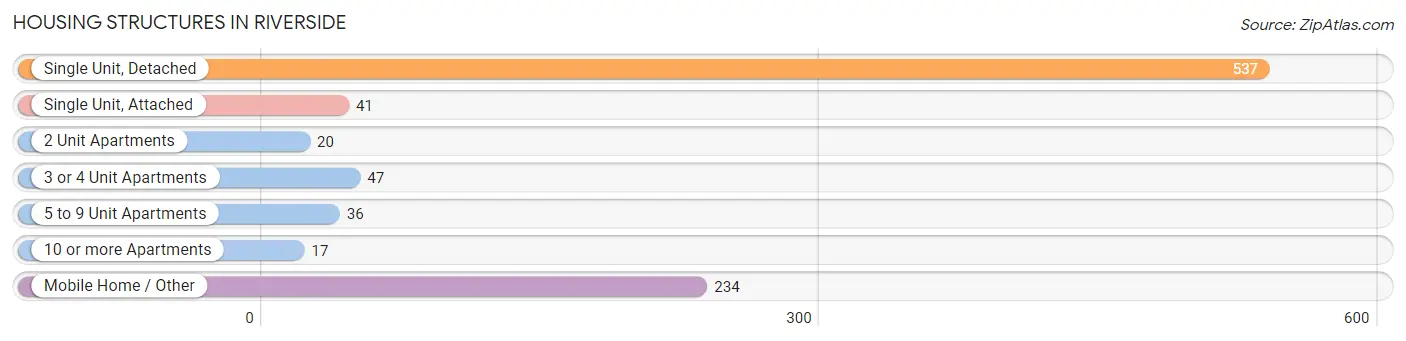
| Structure Type | # Housing Units | % Housing Units |
| Single Unit, Detached | 537 | 57.6% |
| Single Unit, Attached | 41 | 4.4% |
| 2 Unit Apartments | 20 | 2.1% |
| 3 or 4 Unit Apartments | 47 | 5.0% |
| 5 to 9 Unit Apartments | 36 | 3.9% |
| 10 or more Apartments | 17 | 1.8% |
| Mobile Home / Other | 234 | 25.1% |
| Total | 932 | 100.0% |
Housing Structures by Occupancy in Riverside
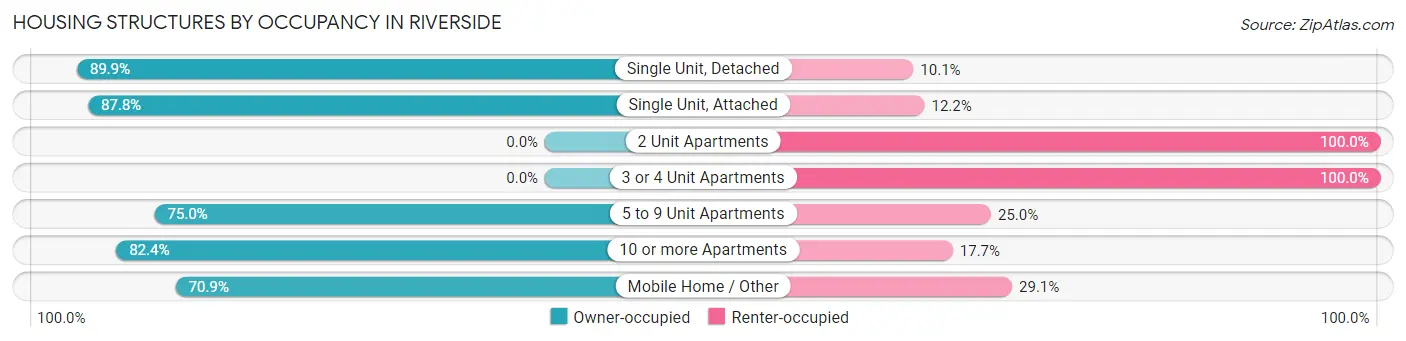
| Structure Type | Owner-occupied | Renter-occupied |
| Single Unit, Detached | 483 (89.9%) | 54 (10.1%) |
| Single Unit, Attached | 36 (87.8%) | 5 (12.2%) |
| 2 Unit Apartments | 0 (0.0%) | 20 (100.0%) |
| 3 or 4 Unit Apartments | 0 (0.0%) | 47 (100.0%) |
| 5 to 9 Unit Apartments | 27 (75.0%) | 9 (25.0%) |
| 10 or more Apartments | 14 (82.4%) | 3 (17.6%) |
| Mobile Home / Other | 166 (70.9%) | 68 (29.1%) |
| Total | 726 (77.9%) | 206 (22.1%) |
Housing Structures by Number of Rooms in Riverside
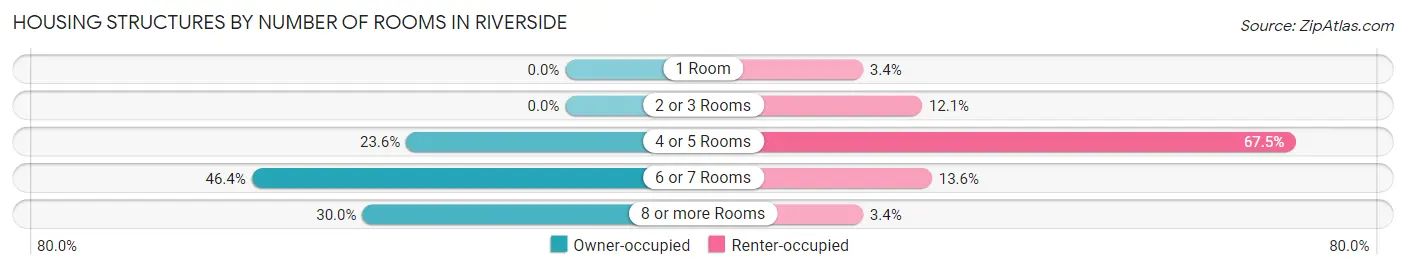
| Number of Rooms | Owner-occupied | Renter-occupied |
| 1 Room | 0 (0.0%) | 7 (3.4%) |
| 2 or 3 Rooms | 0 (0.0%) | 25 (12.1%) |
| 4 or 5 Rooms | 171 (23.5%) | 139 (67.5%) |
| 6 or 7 Rooms | 337 (46.4%) | 28 (13.6%) |
| 8 or more Rooms | 218 (30.0%) | 7 (3.4%) |
| Total | 726 (100.0%) | 206 (100.0%) |
Housing Structure by Heating Type in Riverside
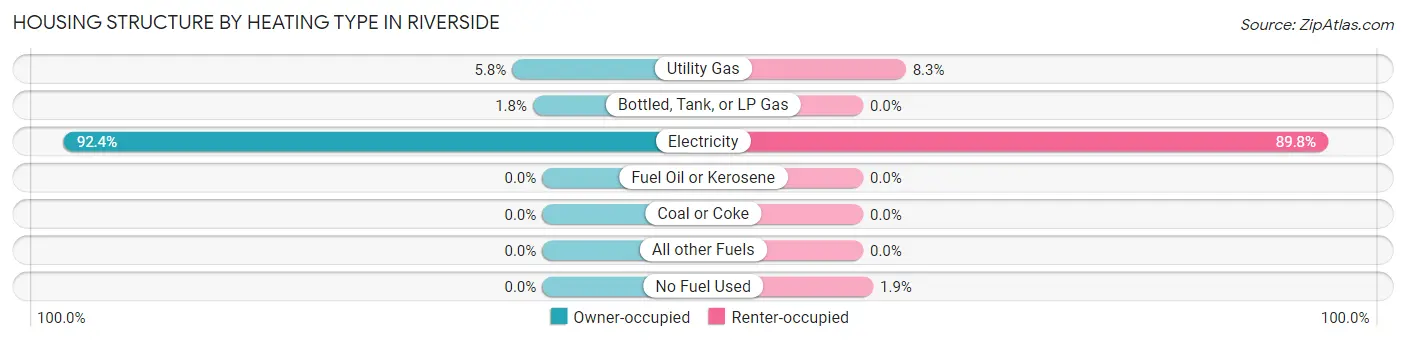
| Heating Type | Owner-occupied | Renter-occupied |
| Utility Gas | 42 (5.8%) | 17 (8.3%) |
| Bottled, Tank, or LP Gas | 13 (1.8%) | 0 (0.0%) |
| Electricity | 671 (92.4%) | 185 (89.8%) |
| Fuel Oil or Kerosene | 0 (0.0%) | 0 (0.0%) |
| Coal or Coke | 0 (0.0%) | 0 (0.0%) |
| All other Fuels | 0 (0.0%) | 0 (0.0%) |
| No Fuel Used | 0 (0.0%) | 4 (1.9%) |
| Total | 726 (100.0%) | 206 (100.0%) |
Household Vehicle Usage in Riverside
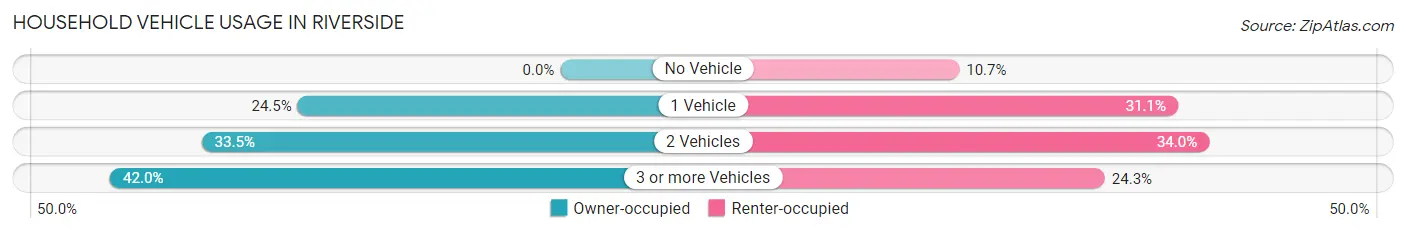
| Vehicles per Household | Owner-occupied | Renter-occupied |
| No Vehicle | 0 (0.0%) | 22 (10.7%) |
| 1 Vehicle | 178 (24.5%) | 64 (31.1%) |
| 2 Vehicles | 243 (33.5%) | 70 (34.0%) |
| 3 or more Vehicles | 305 (42.0%) | 50 (24.3%) |
| Total | 726 (100.0%) | 206 (100.0%) |
Real Estate & Mortgages in Riverside
Real Estate and Mortgage Overview in Riverside
| Characteristic | Without Mortgage | With Mortgage |
| Housing Units | 260 | 466 |
| Median Property Value | $208,000 | $250,500 |
| Median Household Income | $46,000 | $91 |
| Monthly Housing Costs | $461 | $6 |
| Real Estate Taxes | $613 | $31 |
Property Value by Mortgage Status in Riverside
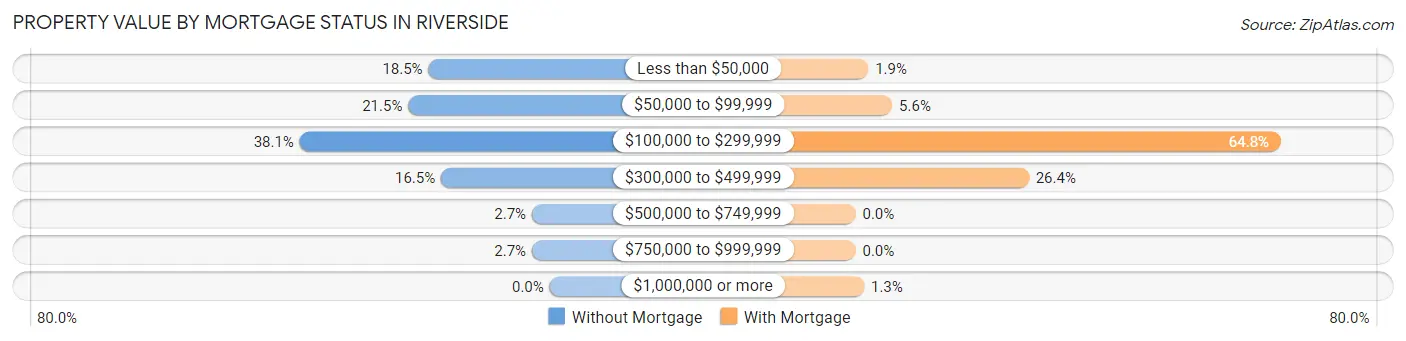
| Property Value | Without Mortgage | With Mortgage |
| Less than $50,000 | 48 (18.5%) | 9 (1.9%) |
| $50,000 to $99,999 | 56 (21.5%) | 26 (5.6%) |
| $100,000 to $299,999 | 99 (38.1%) | 302 (64.8%) |
| $300,000 to $499,999 | 43 (16.5%) | 123 (26.4%) |
| $500,000 to $749,999 | 7 (2.7%) | 0 (0.0%) |
| $750,000 to $999,999 | 7 (2.7%) | 0 (0.0%) |
| $1,000,000 or more | 0 (0.0%) | 6 (1.3%) |
| Total | 260 (100.0%) | 466 (100.0%) |
Household Income by Mortgage Status in Riverside
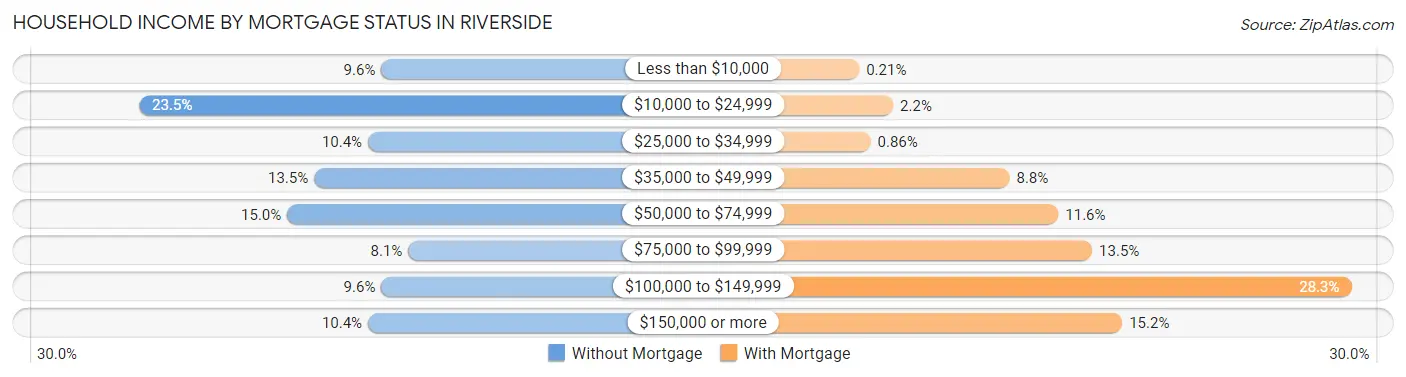
| Household Income | Without Mortgage | With Mortgage |
| Less than $10,000 | 25 (9.6%) | 1 (0.2%) |
| $10,000 to $24,999 | 61 (23.5%) | 10 (2.1%) |
| $25,000 to $34,999 | 27 (10.4%) | 4 (0.9%) |
| $35,000 to $49,999 | 35 (13.5%) | 41 (8.8%) |
| $50,000 to $74,999 | 39 (15.0%) | 54 (11.6%) |
| $75,000 to $99,999 | 21 (8.1%) | 63 (13.5%) |
| $100,000 to $149,999 | 25 (9.6%) | 132 (28.3%) |
| $150,000 or more | 27 (10.4%) | 71 (15.2%) |
| Total | 260 (100.0%) | 466 (100.0%) |
Property Value to Household Income Ratio in Riverside
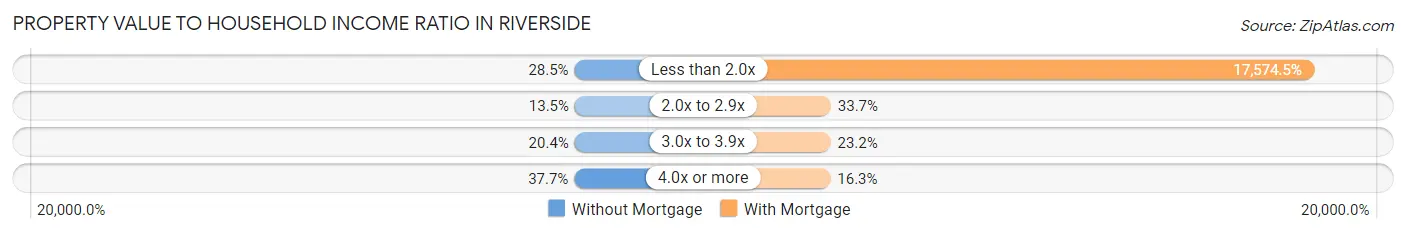
| Value-to-Income Ratio | Without Mortgage | With Mortgage |
| Less than 2.0x | 74 (28.5%) | 81,897 (17,574.5%) |
| 2.0x to 2.9x | 35 (13.5%) | 157 (33.7%) |
| 3.0x to 3.9x | 53 (20.4%) | 108 (23.2%) |
| 4.0x or more | 98 (37.7%) | 76 (16.3%) |
| Total | 260 (100.0%) | 466 (100.0%) |
Real Estate Taxes by Mortgage Status in Riverside
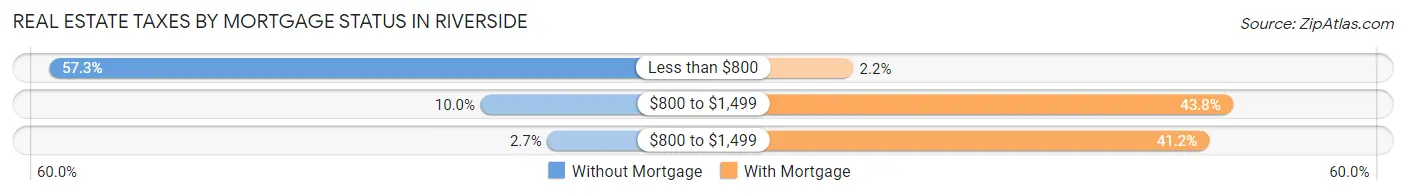
| Property Taxes | Without Mortgage | With Mortgage |
| Less than $800 | 149 (57.3%) | 10 (2.1%) |
| $800 to $1,499 | 26 (10.0%) | 204 (43.8%) |
| $800 to $1,499 | 7 (2.7%) | 192 (41.2%) |
| Total | 260 (100.0%) | 466 (100.0%) |
Health & Disability in Riverside
Health Insurance Coverage by Age in Riverside
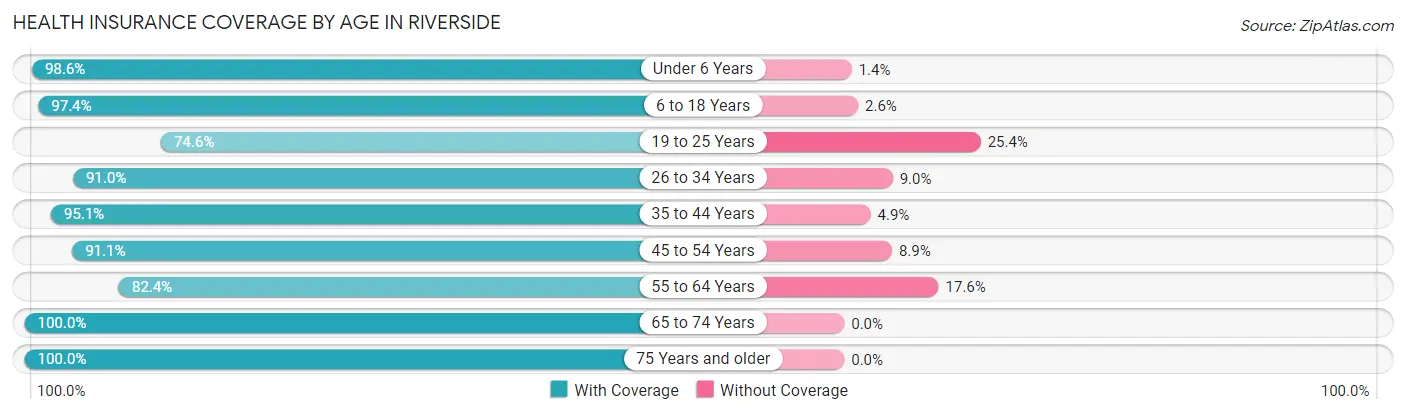
| Age Bracket | With Coverage | Without Coverage |
| Under 6 Years | 214 (98.6%) | 3 (1.4%) |
| 6 to 18 Years | 303 (97.4%) | 8 (2.6%) |
| 19 to 25 Years | 126 (74.6%) | 43 (25.4%) |
| 26 to 34 Years | 272 (91.0%) | 27 (9.0%) |
| 35 to 44 Years | 310 (95.1%) | 16 (4.9%) |
| 45 to 54 Years | 287 (91.1%) | 28 (8.9%) |
| 55 to 64 Years | 267 (82.4%) | 57 (17.6%) |
| 65 to 74 Years | 255 (100.0%) | 0 (0.0%) |
| 75 Years and older | 193 (100.0%) | 0 (0.0%) |
| Total | 2,227 (92.4%) | 182 (7.6%) |
Health Insurance Coverage by Citizenship Status in Riverside
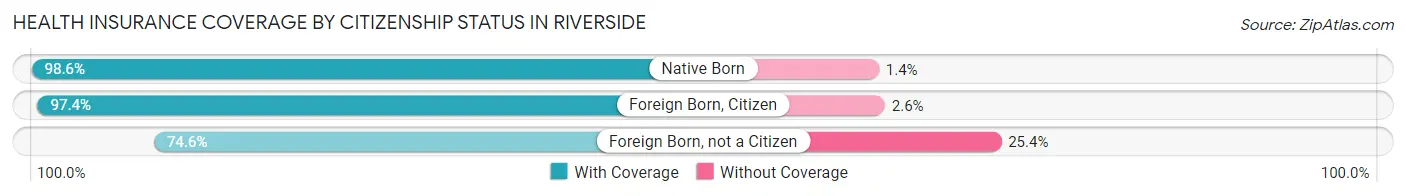
| Citizenship Status | With Coverage | Without Coverage |
| Native Born | 214 (98.6%) | 3 (1.4%) |
| Foreign Born, Citizen | 303 (97.4%) | 8 (2.6%) |
| Foreign Born, not a Citizen | 126 (74.6%) | 43 (25.4%) |
Health Insurance Coverage by Household Income in Riverside
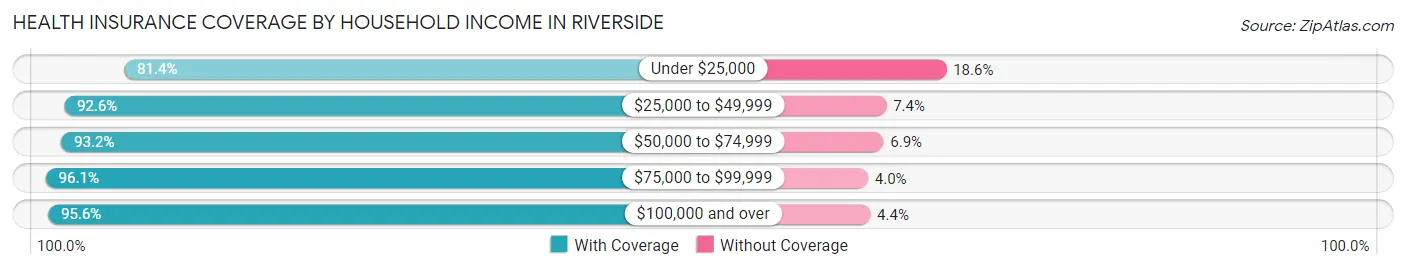
| Household Income | With Coverage | Without Coverage |
| Under $25,000 | 332 (81.4%) | 76 (18.6%) |
| $25,000 to $49,999 | 414 (92.6%) | 33 (7.4%) |
| $50,000 to $74,999 | 272 (93.1%) | 20 (6.9%) |
| $75,000 to $99,999 | 511 (96.1%) | 21 (4.0%) |
| $100,000 and over | 698 (95.6%) | 32 (4.4%) |
Public vs Private Health Insurance Coverage by Age in Riverside
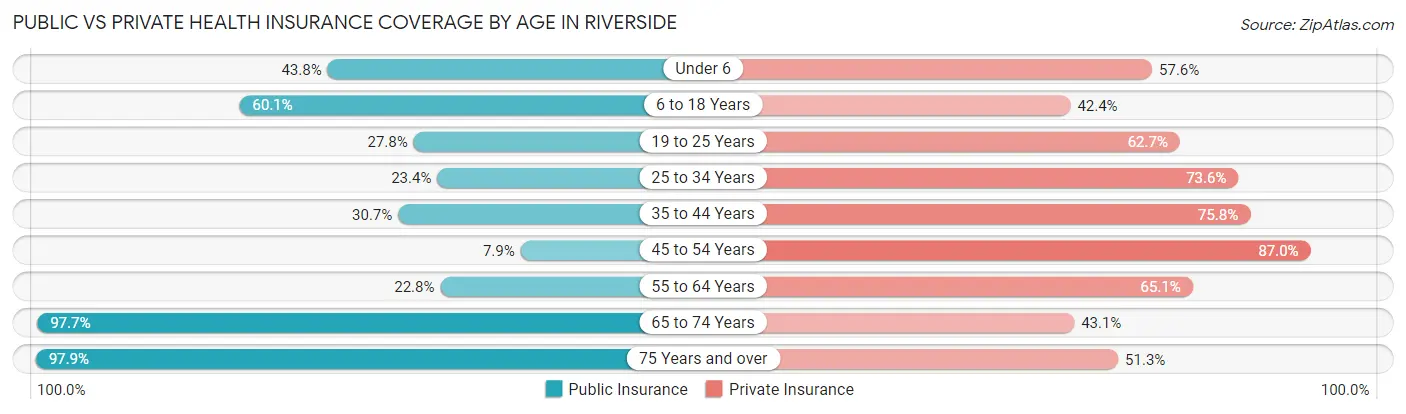
| Age Bracket | Public Insurance | Private Insurance |
| Under 6 | 95 (43.8%) | 125 (57.6%) |
| 6 to 18 Years | 187 (60.1%) | 132 (42.4%) |
| 19 to 25 Years | 47 (27.8%) | 106 (62.7%) |
| 25 to 34 Years | 70 (23.4%) | 220 (73.6%) |
| 35 to 44 Years | 100 (30.7%) | 247 (75.8%) |
| 45 to 54 Years | 25 (7.9%) | 274 (87.0%) |
| 55 to 64 Years | 74 (22.8%) | 211 (65.1%) |
| 65 to 74 Years | 249 (97.7%) | 110 (43.1%) |
| 75 Years and over | 189 (97.9%) | 99 (51.3%) |
| Total | 1,036 (43.0%) | 1,524 (63.3%) |
Disability Status by Sex by Age in Riverside
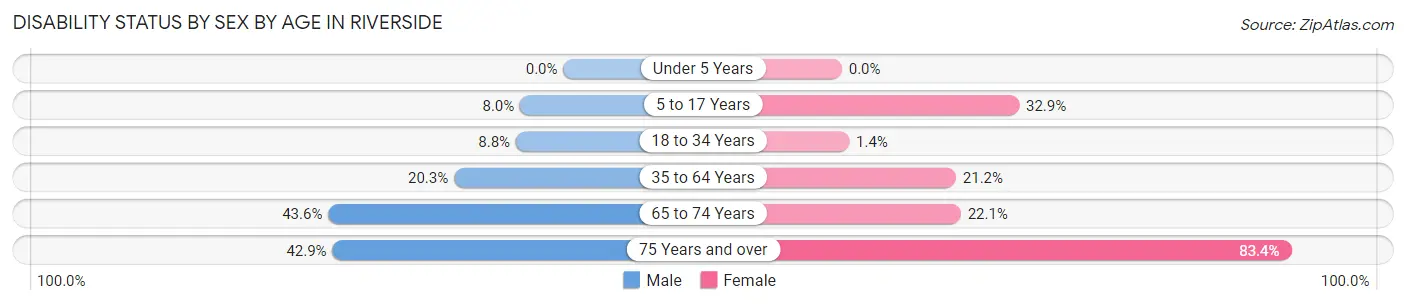
| Age Bracket | Male | Female |
| Under 5 Years | 0 (0.0%) | 0 (0.0%) |
| 5 to 17 Years | 15 (8.0%) | 51 (32.9%) |
| 18 to 34 Years | 19 (8.8%) | 4 (1.4%) |
| 35 to 64 Years | 99 (20.3%) | 101 (21.2%) |
| 65 to 74 Years | 48 (43.6%) | 32 (22.1%) |
| 75 Years and over | 18 (42.9%) | 126 (83.4%) |
Disability Class by Sex by Age in Riverside
Disability Class: Hearing Difficulty
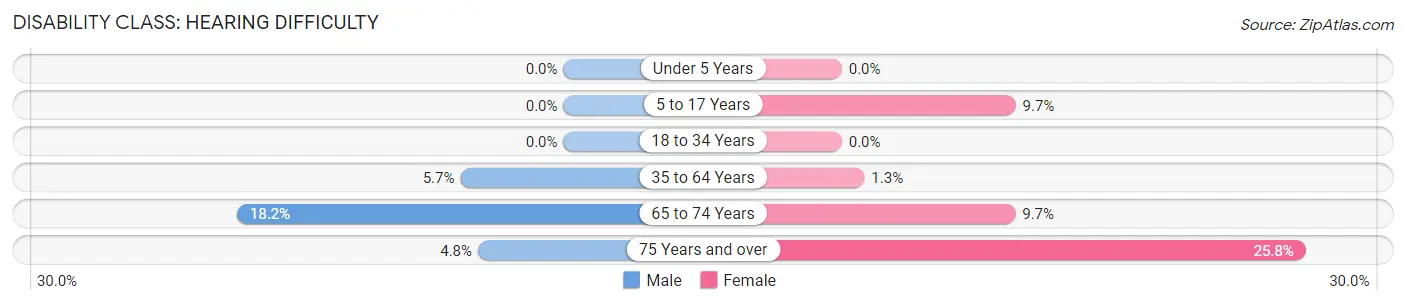
| Age Bracket | Male | Female |
| Under 5 Years | 0 (0.0%) | 0 (0.0%) |
| 5 to 17 Years | 0 (0.0%) | 15 (9.7%) |
| 18 to 34 Years | 0 (0.0%) | 0 (0.0%) |
| 35 to 64 Years | 28 (5.7%) | 6 (1.3%) |
| 65 to 74 Years | 20 (18.2%) | 14 (9.7%) |
| 75 Years and over | 2 (4.8%) | 39 (25.8%) |
Disability Class: Vision Difficulty
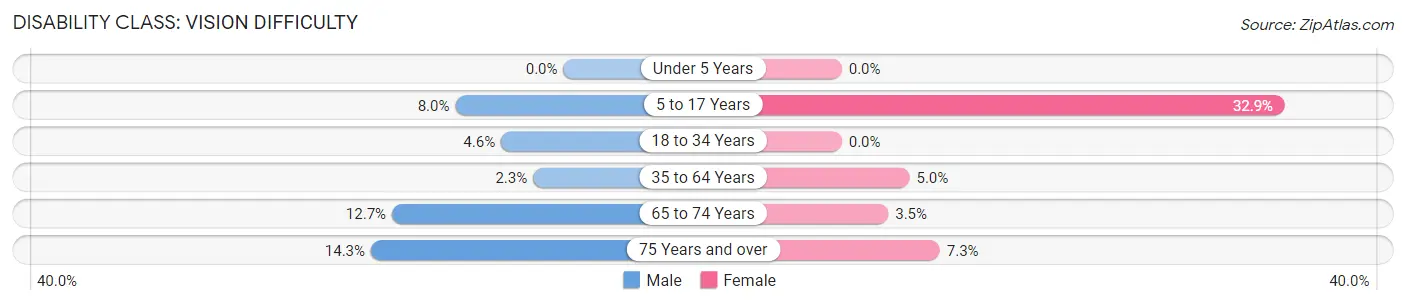
| Age Bracket | Male | Female |
| Under 5 Years | 0 (0.0%) | 0 (0.0%) |
| 5 to 17 Years | 15 (8.0%) | 51 (32.9%) |
| 18 to 34 Years | 10 (4.6%) | 0 (0.0%) |
| 35 to 64 Years | 11 (2.2%) | 24 (5.0%) |
| 65 to 74 Years | 14 (12.7%) | 5 (3.5%) |
| 75 Years and over | 6 (14.3%) | 11 (7.3%) |
Disability Class: Cognitive Difficulty
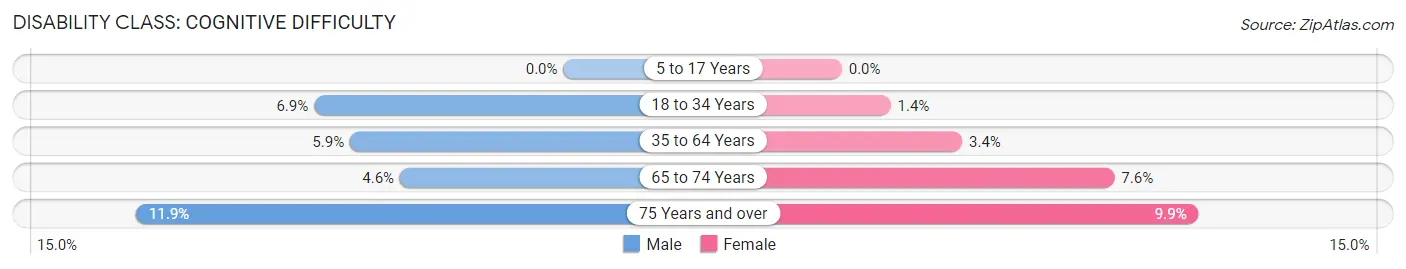
| Age Bracket | Male | Female |
| 5 to 17 Years | 0 (0.0%) | 0 (0.0%) |
| 18 to 34 Years | 15 (6.9%) | 4 (1.4%) |
| 35 to 64 Years | 29 (5.9%) | 16 (3.4%) |
| 65 to 74 Years | 5 (4.5%) | 11 (7.6%) |
| 75 Years and over | 5 (11.9%) | 15 (9.9%) |
Disability Class: Ambulatory Difficulty
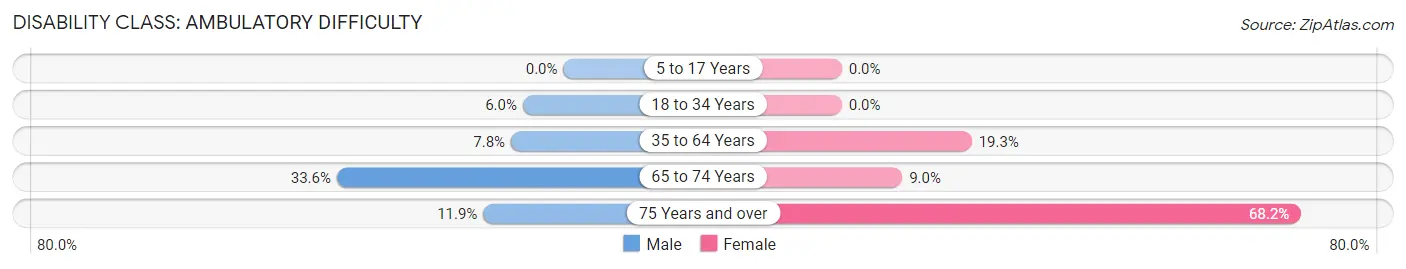
| Age Bracket | Male | Female |
| 5 to 17 Years | 0 (0.0%) | 0 (0.0%) |
| 18 to 34 Years | 13 (6.0%) | 0 (0.0%) |
| 35 to 64 Years | 38 (7.8%) | 92 (19.3%) |
| 65 to 74 Years | 37 (33.6%) | 13 (9.0%) |
| 75 Years and over | 5 (11.9%) | 103 (68.2%) |
Disability Class: Self-Care Difficulty
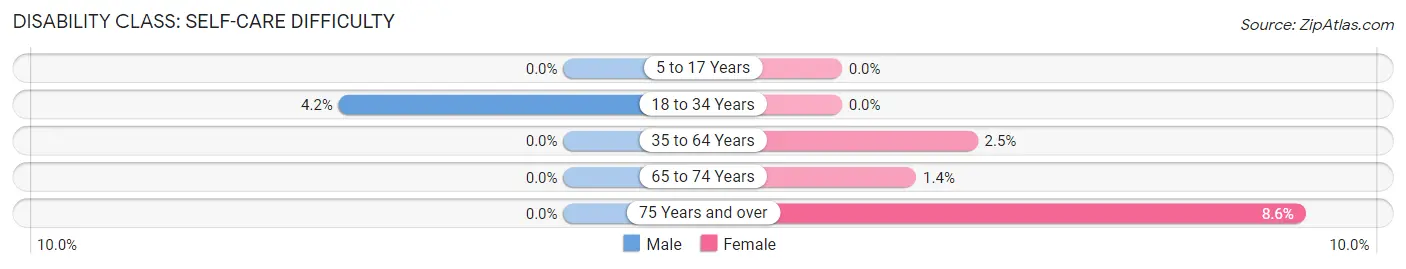
| Age Bracket | Male | Female |
| 5 to 17 Years | 0 (0.0%) | 0 (0.0%) |
| 18 to 34 Years | 9 (4.2%) | 0 (0.0%) |
| 35 to 64 Years | 0 (0.0%) | 12 (2.5%) |
| 65 to 74 Years | 0 (0.0%) | 2 (1.4%) |
| 75 Years and over | 0 (0.0%) | 13 (8.6%) |
Technology Access in Riverside
Computing Device Access in Riverside
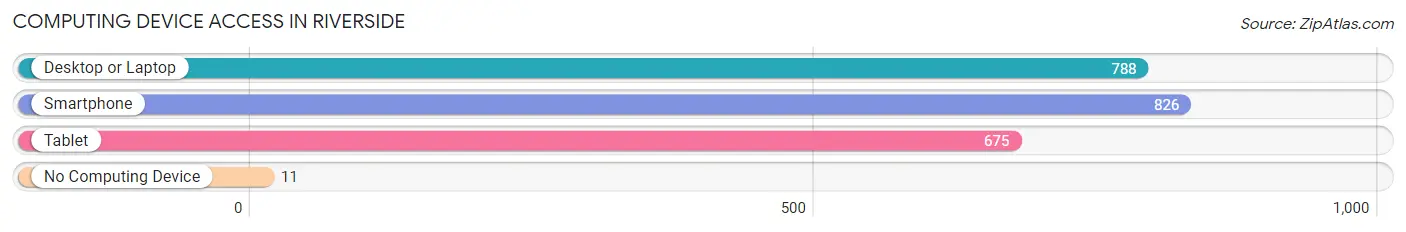
| Device Type | # Households | % Households |
| Desktop or Laptop | 788 | 84.6% |
| Smartphone | 826 | 88.6% |
| Tablet | 675 | 72.4% |
| No Computing Device | 11 | 1.2% |
| Total | 932 | 100.0% |
Internet Access in Riverside
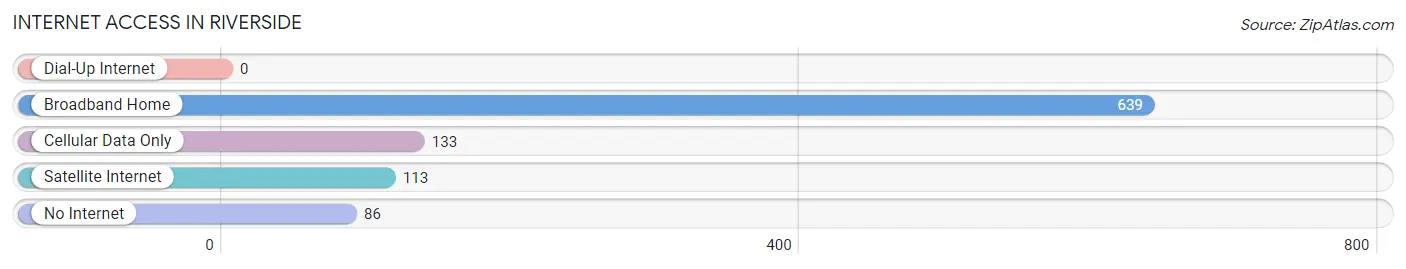
| Internet Type | # Households | % Households |
| Dial-Up Internet | 0 | 0.0% |
| Broadband Home | 639 | 68.6% |
| Cellular Data Only | 133 | 14.3% |
| Satellite Internet | 113 | 12.1% |
| No Internet | 86 | 9.2% |
| Total | 932 | 100.0% |
Riverside Summary
Riverside is a small town located in the northwest corner of Alabama, in the foothills of the Appalachian Mountains. It is situated on the banks of the Coosa River, and is part of the greater Birmingham metropolitan area. The town has a population of approximately 1,500 people, and is known for its rural charm and friendly atmosphere.
History
Riverside was founded in 1818 by settlers from Georgia and Tennessee. The town was originally known as “Riverside Station”, and was a stop on the stagecoach line between Rome, Georgia and Huntsville, Alabama. The town was officially incorporated in 1887, and the name was changed to Riverside.
In the late 19th century, Riverside was a thriving agricultural community, with cotton, corn, and tobacco being the main crops. The town also had a number of small businesses, including a grist mill, a sawmill, and a blacksmith shop.
In the early 20th century, Riverside began to experience a period of growth and prosperity. The town was connected to the outside world by the railroad, and the population began to grow. The town also became a popular tourist destination, with visitors coming to enjoy the scenic beauty of the Coosa River.
Geography
Riverside is located in the northwest corner of Alabama, in the foothills of the Appalachian Mountains. The town is situated on the banks of the Coosa River, and is part of the greater Birmingham metropolitan area. The town is located approximately 30 miles north of Birmingham, and is accessible via Interstate 65.
The town is surrounded by rolling hills and lush forests, and is home to a number of parks and recreational areas. The Coosa River is a popular destination for fishing, boating, and swimming.
Economy
Riverside is a small, rural town, and the economy is largely based on agriculture and tourism. The town is home to a number of small businesses, including restaurants, shops, and service providers. The town is also home to a number of manufacturing companies, including a furniture factory and a paper mill.
The town is also home to a number of educational institutions, including a community college and a technical school. The town is also home to a number of churches, and is a popular destination for religious retreats and conferences.
Demographics
Riverside is a small, rural town, and the population is approximately 1,500 people. The town is predominantly white, with a small African American population. The median household income is approximately $35,000, and the median home value is approximately $100,000. The town is home to a number of churches, and is a popular destination for religious retreats and conferences.
Common Questions
What is Per Capita Income in Riverside?
Per Capita income in Riverside is $31,085.
What is the Median Family Income in Riverside?
Median Family Income in Riverside is $83,500.
What is the Median Household income in Riverside?
Median Household Income in Riverside is $70,208.
What is Income or Wage Gap in Riverside?
Income or Wage Gap in Riverside is 34.2%.
Women in Riverside earn 65.8 cents for every dollar earned by a man.
What is Inequality or Gini Index in Riverside?
Inequality or Gini Index in Riverside is 0.43.
What is the Total Population of Riverside?
Total Population of Riverside is 2,409.
What is the Total Male Population of Riverside?
Total Male Population of Riverside is 1,099.
What is the Total Female Population of Riverside?
Total Female Population of Riverside is 1,310.
What is the Ratio of Males per 100 Females in Riverside?
There are 83.89 Males per 100 Females in Riverside.
What is the Ratio of Females per 100 Males in Riverside?
There are 119.20 Females per 100 Males in Riverside.
What is the Median Population Age in Riverside?
Median Population Age in Riverside is 42.0 Years.
What is the Average Family Size in Riverside
Average Family Size in Riverside is 3.2 People.
What is the Average Household Size in Riverside
Average Household Size in Riverside is 2.6 People.
How Large is the Labor Force in Riverside?
There are 1,192 People in the Labor Forcein in Riverside.
What is the Percentage of People in the Labor Force in Riverside?
60.7% of People are in the Labor Force in Riverside.
What is the Unemployment Rate in Riverside?
Unemployment Rate in Riverside is 5.3%.