River Falls, AL Map & Demographics
River Falls Map
River Falls Overview
$23,150
PER CAPITA INCOME
$46,875
AVG FAMILY INCOME
$34,000
AVG HOUSEHOLD INCOME
18.0%
WAGE / INCOME GAP [ % ]
82.0¢/ $1
WAGE / INCOME GAP [ $ ]
$17,571
FAMILY INCOME DEFICIT
0.43
INEQUALITY / GINI INDEX
500
TOTAL POPULATION
260
MALE POPULATION
240
FEMALE POPULATION
108.33
MALES / 100 FEMALES
92.31
FEMALES / 100 MALES
41.5
MEDIAN AGE
4.0
AVG FAMILY SIZE
2.6
AVG HOUSEHOLD SIZE
210
LABOR FORCE [ PEOPLE ]
50.5%
PERCENT IN LABOR FORCE
31.0%
UNEMPLOYMENT RATE
River Falls Zip Codes
River Falls Area Codes
Income in River Falls
Income Overview in River Falls
Per Capita Income in River Falls is $23,150, while median incomes of families and households are $46,875 and $34,000 respectively.
| Characteristic | Number | Measure |
| Per Capita Income | 500 | $23,150 |
| Median Family Income | 81 | $46,875 |
| Mean Family Income | 81 | $62,973 |
| Median Household Income | 190 | $34,000 |
| Mean Household Income | 190 | $49,794 |
| Income Deficit | 81 | $17,571 |
| Wage / Income Gap (%) | 500 | 18.03% |
| Wage / Income Gap ($) | 500 | 81.97¢ per $1 |
| Gini / Inequality Index | 500 | 0.43 |
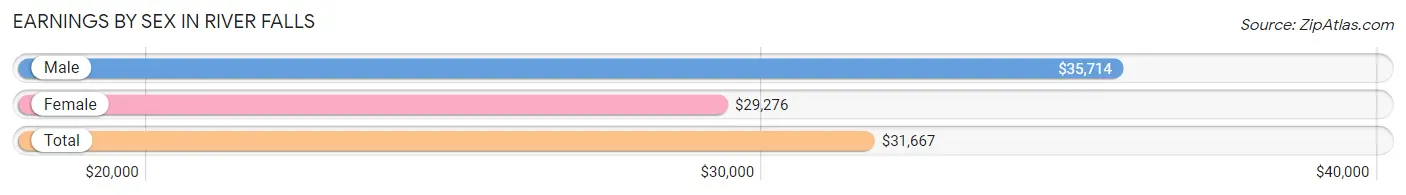
Earnings by Sex in River Falls
Average Earnings in River Falls are $31,667, $35,714 for men and $29,276 for women, a difference of 18.0%.
| Sex | Number | Average Earnings |
| Male | 98 (48.0%) | $35,714 |
| Female | 106 (52.0%) | $29,276 |
| Total | 204 (100.0%) | $31,667 |
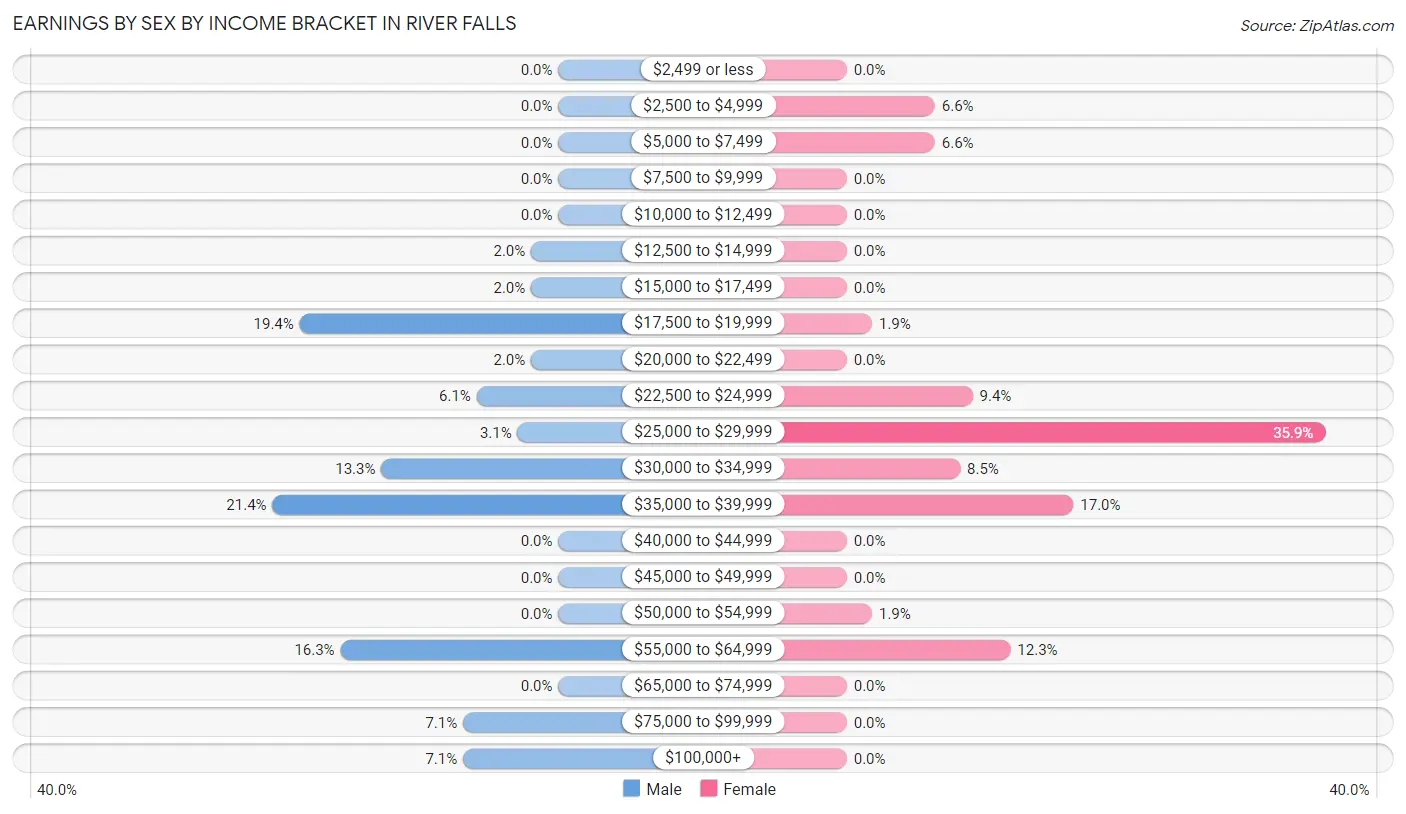
Earnings by Sex by Income Bracket in River Falls
The most common earnings brackets in River Falls are $35,000 to $39,999 for men (21 | 21.4%) and $25,000 to $29,999 for women (38 | 35.8%).
| Income | Male | Female |
| $2,499 or less | 0 (0.0%) | 0 (0.0%) |
| $2,500 to $4,999 | 0 (0.0%) | 7 (6.6%) |
| $5,000 to $7,499 | 0 (0.0%) | 7 (6.6%) |
| $7,500 to $9,999 | 0 (0.0%) | 0 (0.0%) |
| $10,000 to $12,499 | 0 (0.0%) | 0 (0.0%) |
| $12,500 to $14,999 | 2 (2.0%) | 0 (0.0%) |
| $15,000 to $17,499 | 2 (2.0%) | 0 (0.0%) |
| $17,500 to $19,999 | 19 (19.4%) | 2 (1.9%) |
| $20,000 to $22,499 | 2 (2.0%) | 0 (0.0%) |
| $22,500 to $24,999 | 6 (6.1%) | 10 (9.4%) |
| $25,000 to $29,999 | 3 (3.1%) | 38 (35.8%) |
| $30,000 to $34,999 | 13 (13.3%) | 9 (8.5%) |
| $35,000 to $39,999 | 21 (21.4%) | 18 (17.0%) |
| $40,000 to $44,999 | 0 (0.0%) | 0 (0.0%) |
| $45,000 to $49,999 | 0 (0.0%) | 0 (0.0%) |
| $50,000 to $54,999 | 0 (0.0%) | 2 (1.9%) |
| $55,000 to $64,999 | 16 (16.3%) | 13 (12.3%) |
| $65,000 to $74,999 | 0 (0.0%) | 0 (0.0%) |
| $75,000 to $99,999 | 7 (7.1%) | 0 (0.0%) |
| $100,000+ | 7 (7.1%) | 0 (0.0%) |
| Total | 98 (100.0%) | 106 (100.0%) |
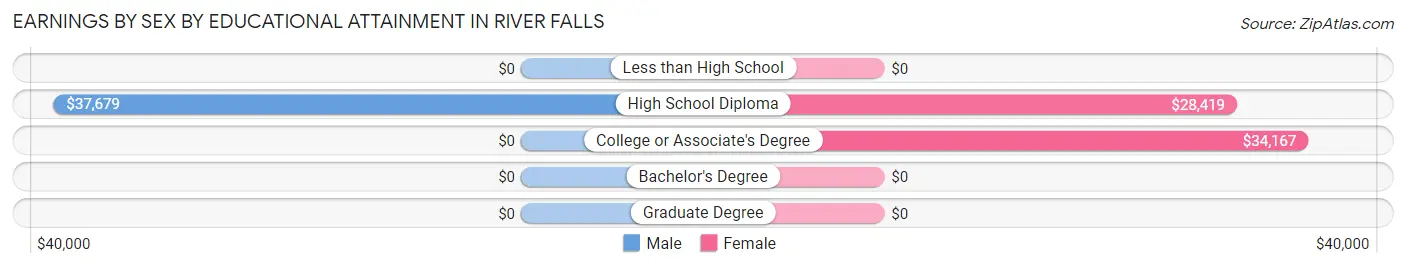
Earnings by Sex by Educational Attainment in River Falls
Average earnings in River Falls are $38,214 for men and $29,276 for women, a difference of 23.4%. Men with an educational attainment of high school diploma enjoy the highest average annual earnings of $37,679, while those with high school diploma education earn the least with $37,679. Women with an educational attainment of college or associate's degree earn the most with the average annual earnings of $34,167, while those with high school diploma education have the smallest earnings of $28,419.
| Educational Attainment | Male Income | Female Income |
| Less than High School | - | - |
| High School Diploma | $37,679 | $28,419 |
| College or Associate's Degree | - | - |
| Bachelor's Degree | - | - |
| Graduate Degree | - | - |
| Total | $38,214 | $29,276 |
Family Income in River Falls
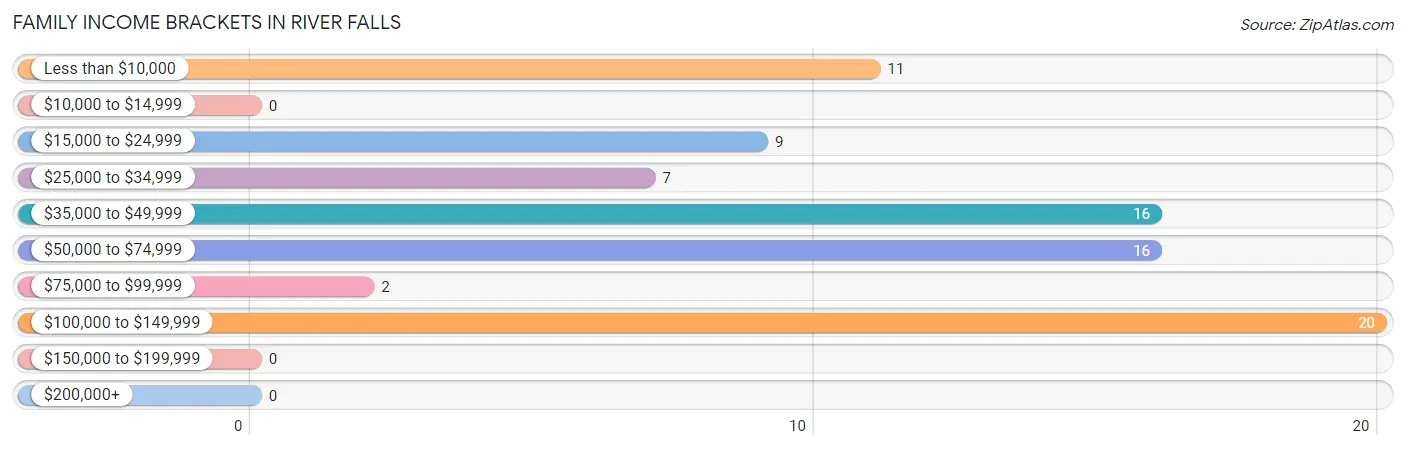
Family Income Brackets in River Falls
According to the River Falls family income data, there are 20 families falling into the $100,000 to $149,999 income range, which is the most common income bracket and makes up 24.7% of all families.
| Income Bracket | # Families | % Families |
| Less than $10,000 | 11 | 13.6% |
| $10,000 to $14,999 | 0 | 0.0% |
| $15,000 to $24,999 | 9 | 11.1% |
| $25,000 to $34,999 | 7 | 8.6% |
| $35,000 to $49,999 | 16 | 19.8% |
| $50,000 to $74,999 | 16 | 19.8% |
| $75,000 to $99,999 | 2 | 2.5% |
| $100,000 to $149,999 | 20 | 24.7% |
| $150,000 to $199,999 | 0 | 0.0% |
| $200,000+ | 0 | 0.0% |
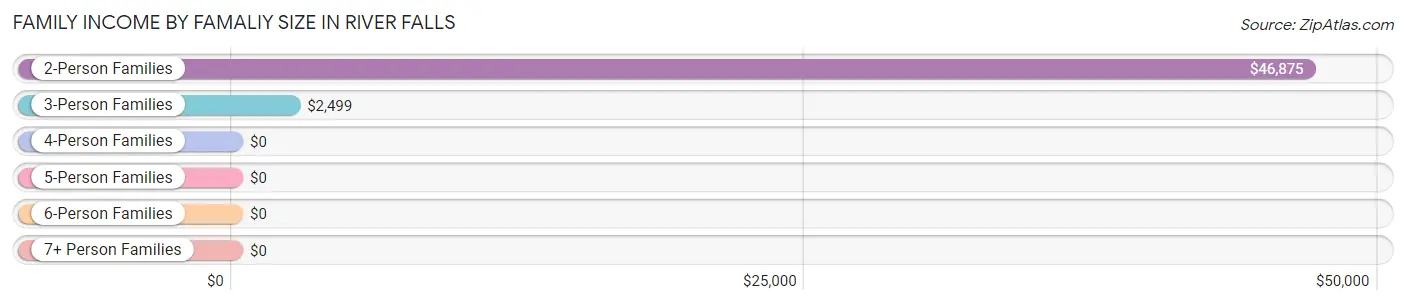
Family Income by Famaliy Size in River Falls
2-person families (37 | 45.7%) account for the highest median family income in River Falls with $46,875 per family, while 2-person families (37 | 45.7%) have the highest median income of $23,438 per family member.
| Income Bracket | # Families | Median Income |
| 2-Person Families | 37 (45.7%) | $46,875 |
| 3-Person Families | 14 (17.3%) | $2,499 |
| 4-Person Families | 30 (37.0%) | $0 |
| 5-Person Families | 0 (0.0%) | $0 |
| 6-Person Families | 0 (0.0%) | $0 |
| 7+ Person Families | 0 (0.0%) | $0 |
| Total | 81 (100.0%) | $46,875 |
Family Income by Number of Earners in River Falls
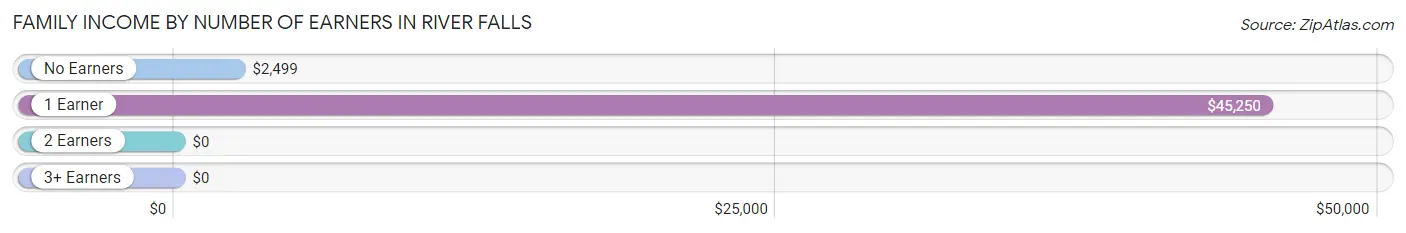
| Number of Earners | # Families | Median Income |
| No Earners | 20 (24.7%) | $2,499 |
| 1 Earner | 36 (44.4%) | $45,250 |
| 2 Earners | 8 (9.9%) | $0 |
| 3+ Earners | 17 (21.0%) | $0 |
| Total | 81 (100.0%) | $46,875 |
Household Income in River Falls
Household Income Brackets in River Falls
With 48 households falling in the category, the $25,000 to $34,999 income range is the most frequent in River Falls, accounting for 25.3% of all households.
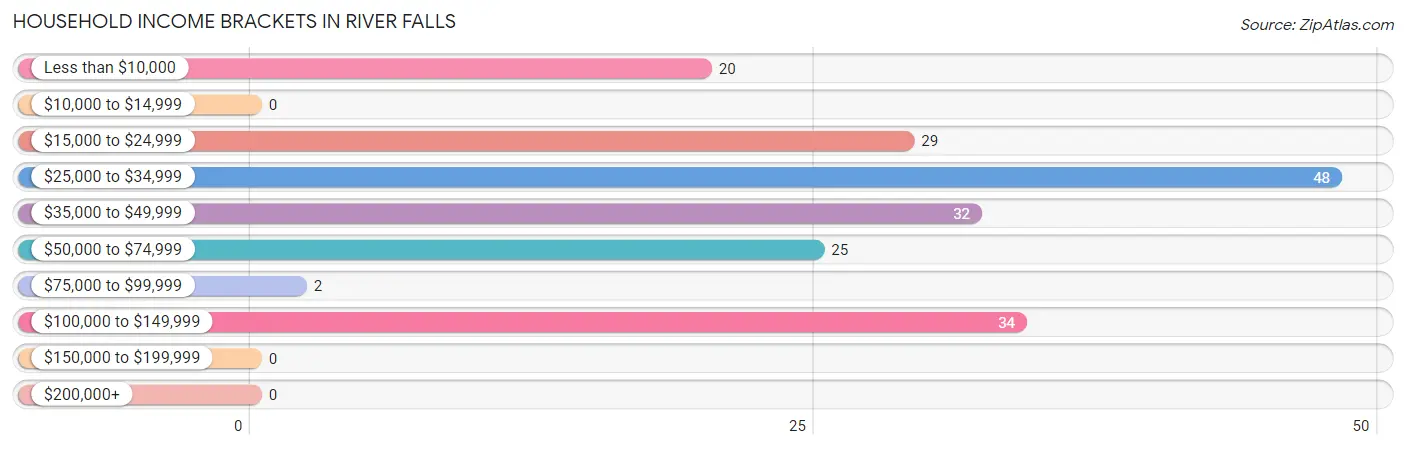
| Income Bracket | # Households | % Households |
| Less than $10,000 | 20 | 10.5% |
| $10,000 to $14,999 | 0 | 0.0% |
| $15,000 to $24,999 | 29 | 15.3% |
| $25,000 to $34,999 | 48 | 25.3% |
| $35,000 to $49,999 | 32 | 16.8% |
| $50,000 to $74,999 | 25 | 13.2% |
| $75,000 to $99,999 | 2 | 1.1% |
| $100,000 to $149,999 | 34 | 17.9% |
| $150,000 to $199,999 | 0 | 0.0% |
| $200,000+ | 0 | 0.0% |
Household Income by Householder Age in River Falls
The median household income in River Falls is $34,000, with the highest median household income of $41,250 found in the 45 to 64 years age bracket for the primary householder. A total of 68 households (35.8%) fall into this category. Meanwhile, the 15 to 24 years age bracket for the primary householder has the lowest median household income of $0, with 5 households (2.6%) in this group.
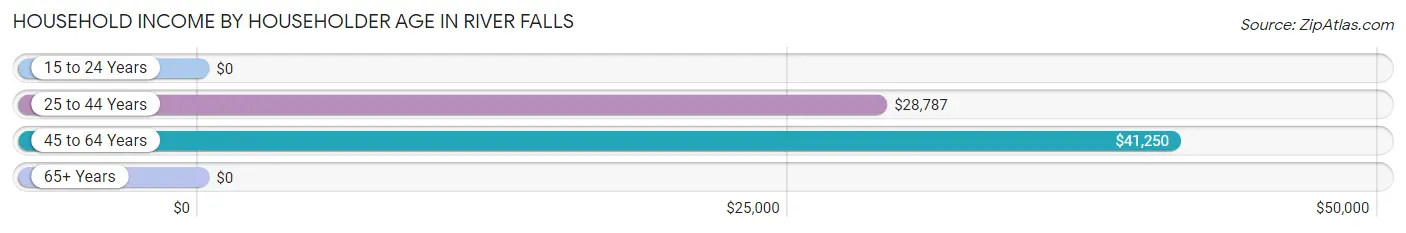
| Income Bracket | # Households | Median Income |
| 15 to 24 Years | 5 (2.6%) | $0 |
| 25 to 44 Years | 55 (28.9%) | $28,787 |
| 45 to 64 Years | 68 (35.8%) | $41,250 |
| 65+ Years | 62 (32.6%) | $0 |
| Total | 190 (100.0%) | $34,000 |
Poverty in River Falls
Income Below Poverty by Sex and Age in River Falls
With 17.5% poverty level for males and 26.7% for females among the residents of River Falls, under 5 year old males and 12 to 14 year old females are the most vulnerable to poverty, with 11 males (100.0%) and 9 females (100.0%) in their respective age groups living below the poverty level.
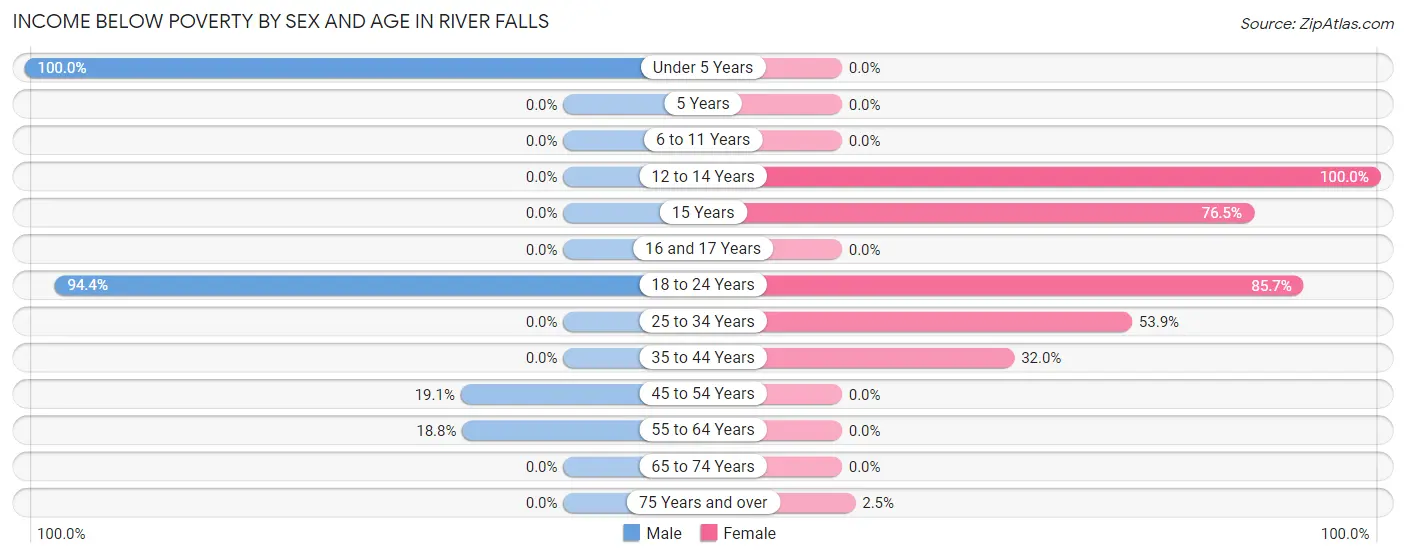
| Age Bracket | Male | Female |
| Under 5 Years | 11 (100.0%) | 0 (0.0%) |
| 5 Years | 0 (0.0%) | 0 (0.0%) |
| 6 to 11 Years | 0 (0.0%) | 0 (0.0%) |
| 12 to 14 Years | 0 (0.0%) | 9 (100.0%) |
| 15 Years | 0 (0.0%) | 13 (76.5%) |
| 16 and 17 Years | 0 (0.0%) | 0 (0.0%) |
| 18 to 24 Years | 17 (94.4%) | 18 (85.7%) |
| 25 to 34 Years | 0 (0.0%) | 7 (53.8%) |
| 35 to 44 Years | 0 (0.0%) | 16 (32.0%) |
| 45 to 54 Years | 4 (19.1%) | 0 (0.0%) |
| 55 to 64 Years | 9 (18.8%) | 0 (0.0%) |
| 65 to 74 Years | 0 (0.0%) | 0 (0.0%) |
| 75 Years and over | 0 (0.0%) | 1 (2.5%) |
| Total | 41 (17.5%) | 64 (26.7%) |
Income Above Poverty by Sex and Age in River Falls
According to the poverty statistics in River Falls, males aged 6 to 11 years and females aged under 5 years are the age groups that are most secure financially, with 100.0% of males and 100.0% of females in these age groups living above the poverty line.
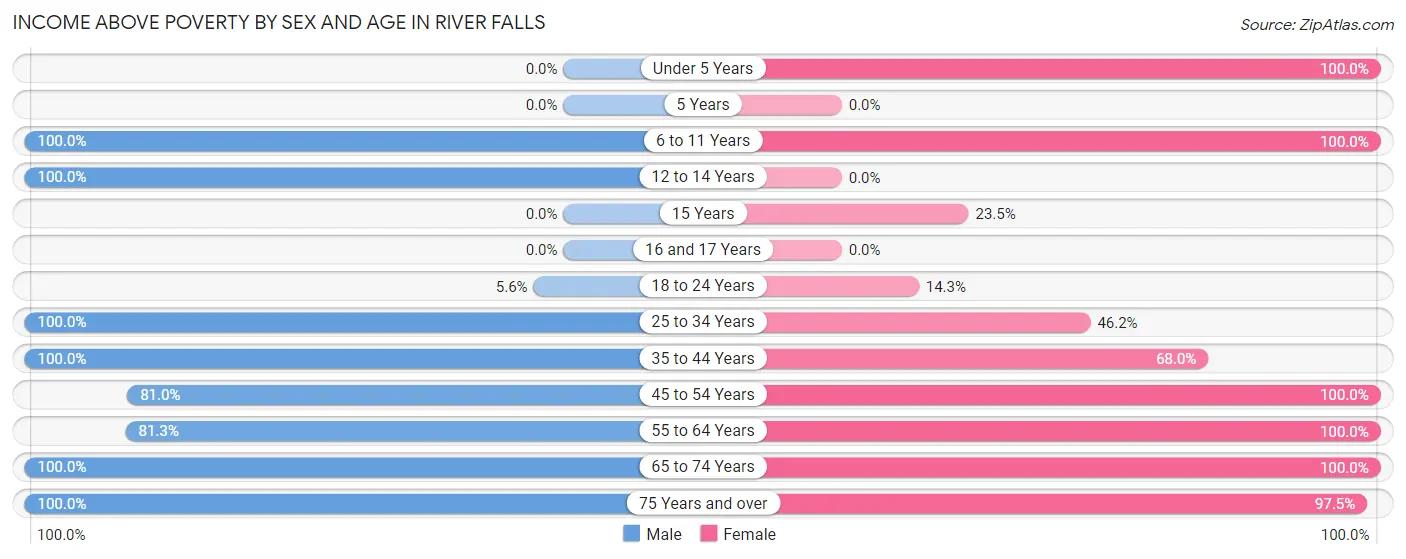
| Age Bracket | Male | Female |
| Under 5 Years | 0 (0.0%) | 8 (100.0%) |
| 5 Years | 0 (0.0%) | 0 (0.0%) |
| 6 to 11 Years | 6 (100.0%) | 2 (100.0%) |
| 12 to 14 Years | 5 (100.0%) | 0 (0.0%) |
| 15 Years | 0 (0.0%) | 4 (23.5%) |
| 16 and 17 Years | 0 (0.0%) | 0 (0.0%) |
| 18 to 24 Years | 1 (5.6%) | 3 (14.3%) |
| 25 to 34 Years | 5 (100.0%) | 6 (46.2%) |
| 35 to 44 Years | 88 (100.0%) | 34 (68.0%) |
| 45 to 54 Years | 17 (80.9%) | 36 (100.0%) |
| 55 to 64 Years | 39 (81.2%) | 30 (100.0%) |
| 65 to 74 Years | 19 (100.0%) | 14 (100.0%) |
| 75 Years and over | 13 (100.0%) | 39 (97.5%) |
| Total | 193 (82.5%) | 176 (73.3%) |
Income Below Poverty Among Married-Couple Families in River Falls
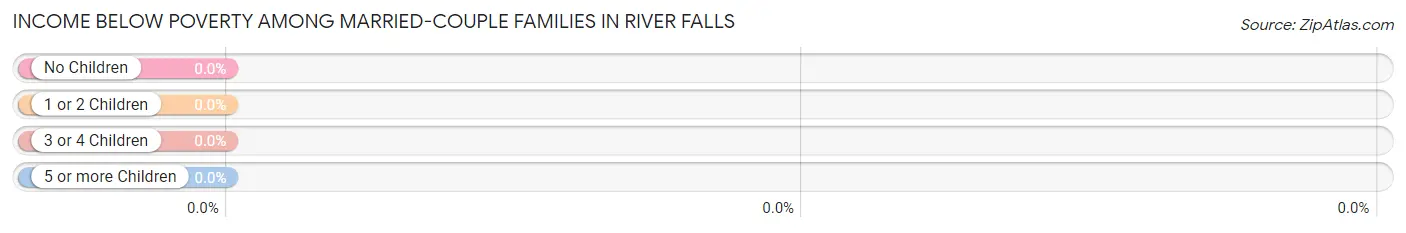
| Children | Above Poverty | Below Poverty |
| No Children | 20 (100.0%) | 0 (0.0%) |
| 1 or 2 Children | 7 (100.0%) | 0 (0.0%) |
| 3 or 4 Children | 0 (0.0%) | 0 (0.0%) |
| 5 or more Children | 0 (0.0%) | 0 (0.0%) |
| Total | 27 (100.0%) | 0 (0.0%) |
Income Below Poverty Among Single-Parent Households in River Falls
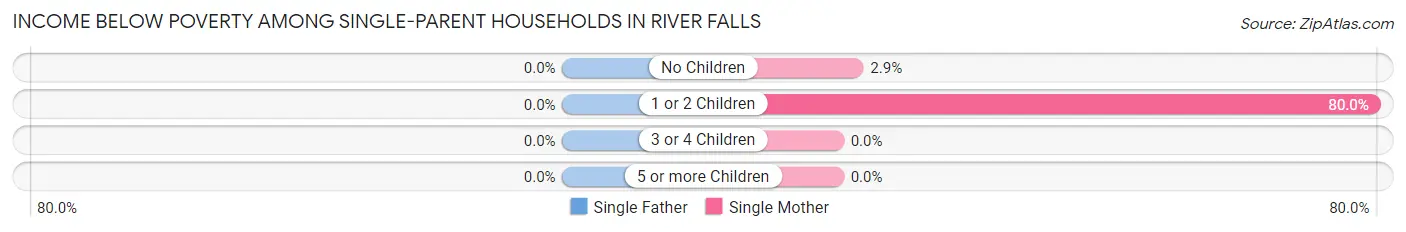
| Children | Single Father | Single Mother |
| No Children | 0 (0.0%) | 1 (2.9%) |
| 1 or 2 Children | 0 (0.0%) | 16 (80.0%) |
| 3 or 4 Children | 0 (0.0%) | 0 (0.0%) |
| 5 or more Children | 0 (0.0%) | 0 (0.0%) |
| Total | 0 (0.0%) | 17 (31.5%) |
Income Below Poverty Among Married-Couple vs Single-Parent Households in River Falls
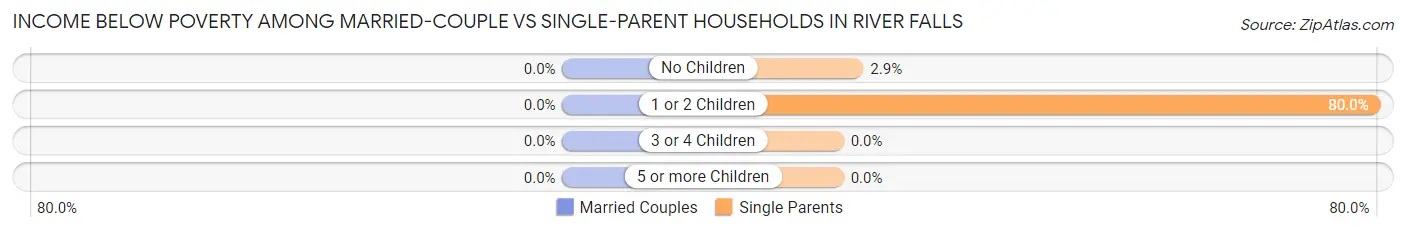
| Children | Married-Couple Families | Single-Parent Households |
| No Children | 0 (0.0%) | 1 (2.9%) |
| 1 or 2 Children | 0 (0.0%) | 16 (80.0%) |
| 3 or 4 Children | 0 (0.0%) | 0 (0.0%) |
| 5 or more Children | 0 (0.0%) | 0 (0.0%) |
| Total | 0 (0.0%) | 17 (31.5%) |
Race in River Falls
The most populous races in River Falls are Black / African American (285 | 57.0%), and White / Caucasian (215 | 43.0%).
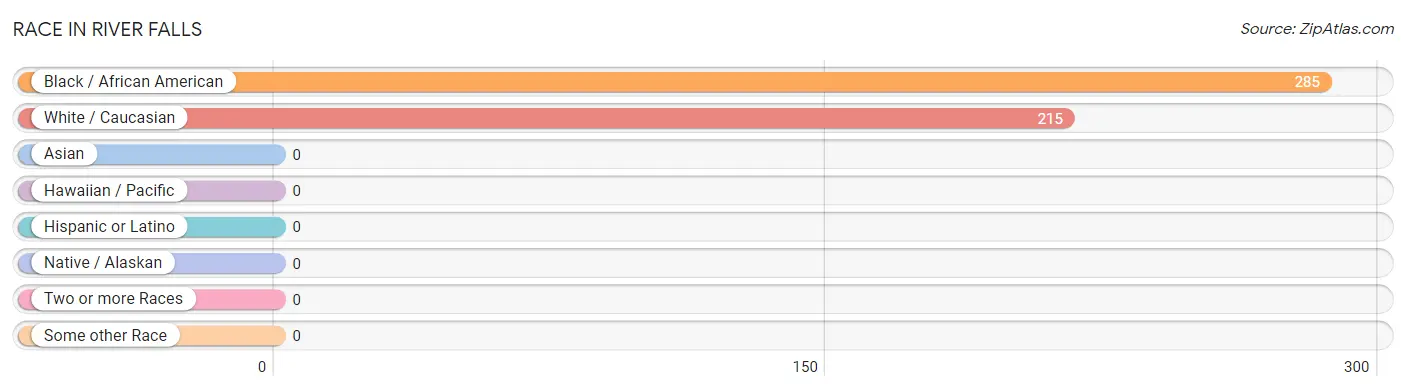
| Race | # Population | % Population |
| Asian | 0 | 0.0% |
| Black / African American | 285 | 57.0% |
| Hawaiian / Pacific | 0 | 0.0% |
| Hispanic or Latino | 0 | 0.0% |
| Native / Alaskan | 0 | 0.0% |
| White / Caucasian | 215 | 43.0% |
| Two or more Races | 0 | 0.0% |
| Some other Race | 0 | 0.0% |
| Total | 500 | 100.0% |
Ancestry in River Falls
The most populous ancestries reported in River Falls are American (43 | 8.6%), Irish (14 | 2.8%), English (8 | 1.6%), African (7 | 1.4%), and Subsaharan African (7 | 1.4%), together accounting for 15.8% of all River Falls residents.
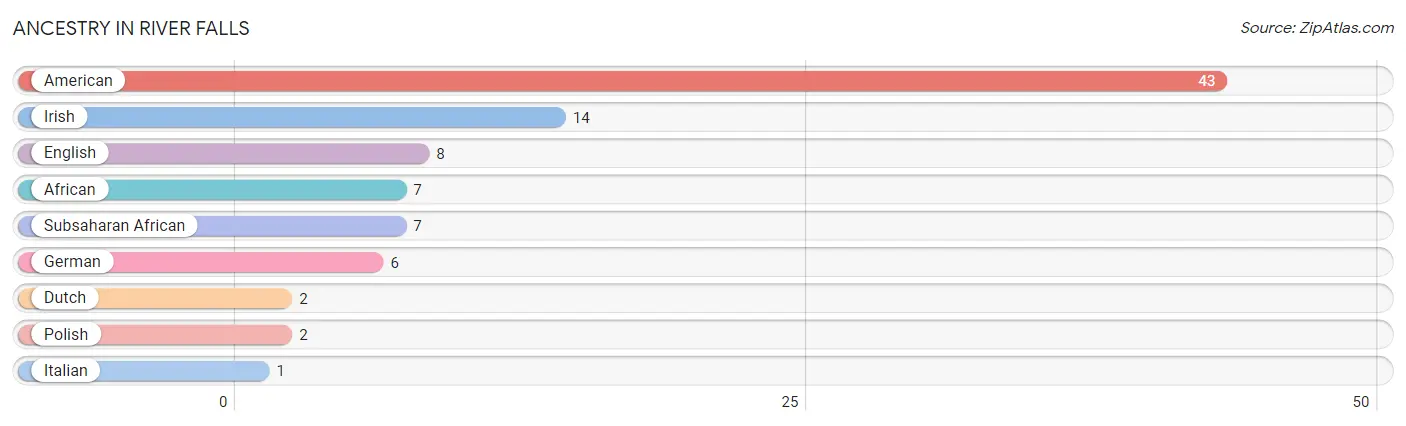
| Ancestry | # Population | % Population |
| African | 7 | 1.4% |
| American | 43 | 8.6% |
| Dutch | 2 | 0.4% |
| English | 8 | 1.6% |
| German | 6 | 1.2% |
| Irish | 14 | 2.8% |
| Italian | 1 | 0.2% |
| Polish | 2 | 0.4% |
| Subsaharan African | 7 | 1.4% | View All 9 Rows |
Immigrants in River Falls

| Immigration Origin | # Population | % Population | View All 0 Rows |
Sex and Age in River Falls
Sex and Age in River Falls
The most populous age groups in River Falls are 40 to 44 Years (88 | 33.9%) for men and 40 to 44 Years (40 | 16.7%) for women.
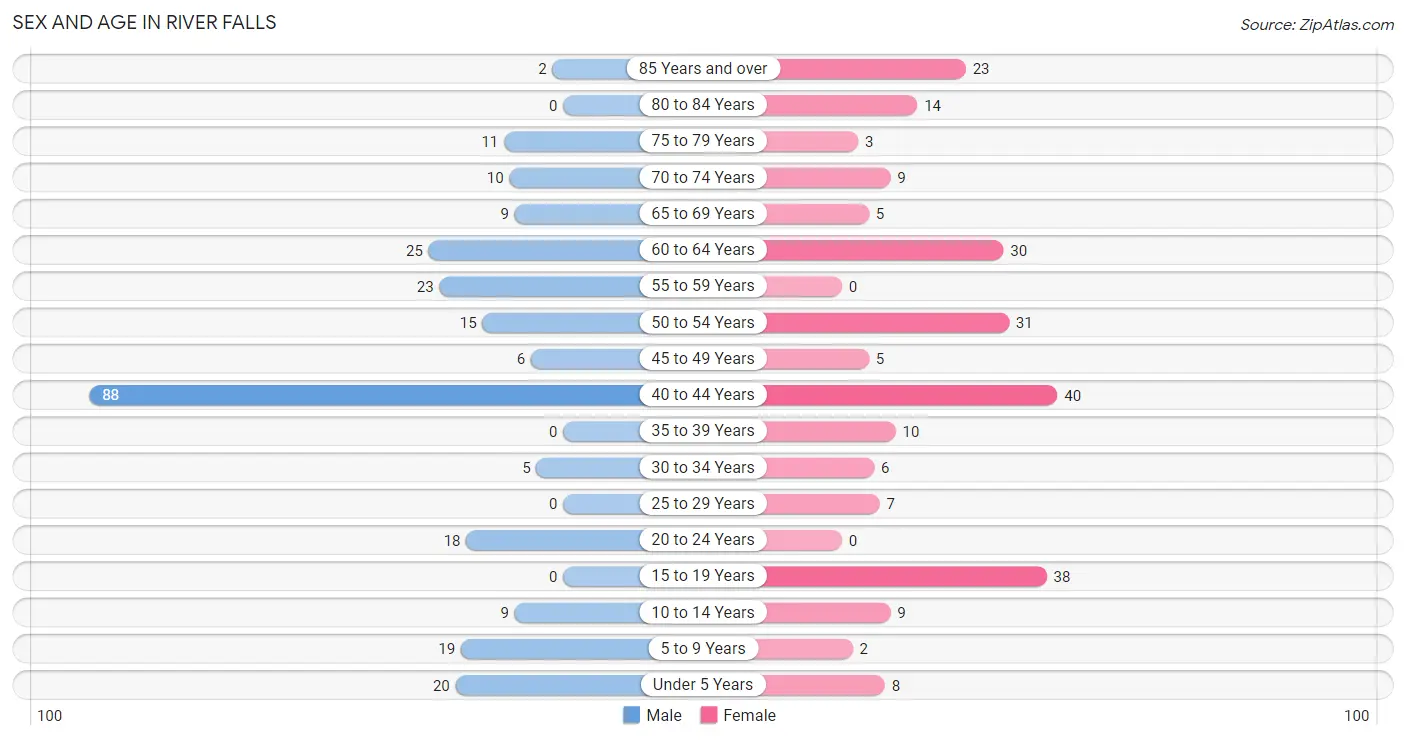
| Age Bracket | Male | Female |
| Under 5 Years | 20 (7.7%) | 8 (3.3%) |
| 5 to 9 Years | 19 (7.3%) | 2 (0.8%) |
| 10 to 14 Years | 9 (3.5%) | 9 (3.7%) |
| 15 to 19 Years | 0 (0.0%) | 38 (15.8%) |
| 20 to 24 Years | 18 (6.9%) | 0 (0.0%) |
| 25 to 29 Years | 0 (0.0%) | 7 (2.9%) |
| 30 to 34 Years | 5 (1.9%) | 6 (2.5%) |
| 35 to 39 Years | 0 (0.0%) | 10 (4.2%) |
| 40 to 44 Years | 88 (33.9%) | 40 (16.7%) |
| 45 to 49 Years | 6 (2.3%) | 5 (2.1%) |
| 50 to 54 Years | 15 (5.8%) | 31 (12.9%) |
| 55 to 59 Years | 23 (8.8%) | 0 (0.0%) |
| 60 to 64 Years | 25 (9.6%) | 30 (12.5%) |
| 65 to 69 Years | 9 (3.5%) | 5 (2.1%) |
| 70 to 74 Years | 10 (3.8%) | 9 (3.7%) |
| 75 to 79 Years | 11 (4.2%) | 3 (1.3%) |
| 80 to 84 Years | 0 (0.0%) | 14 (5.8%) |
| 85 Years and over | 2 (0.8%) | 23 (9.6%) |
| Total | 260 (100.0%) | 240 (100.0%) |
Families and Households in River Falls
Median Family Size in River Falls
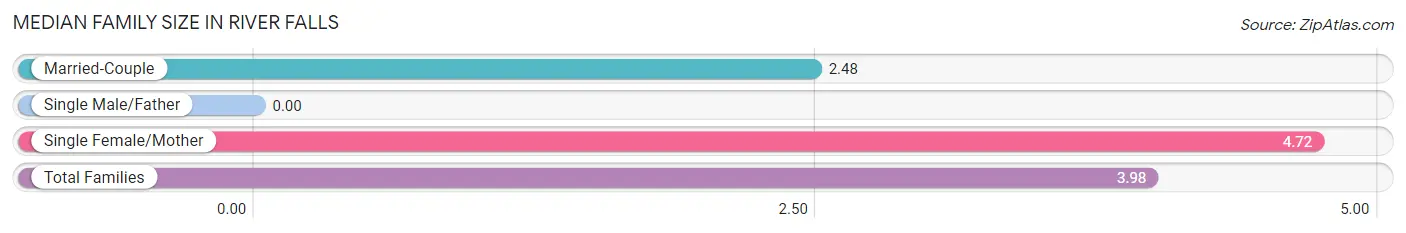
| Family Type | # Families | Family Size |
| Married-Couple | 27 (33.3%) | 2.48 |
| Single Male/Father | 0 (0.0%) | - |
| Single Female/Mother | 54 (66.7%) | 4.72 |
| Total Families | 81 (100.0%) | 3.98 |
Median Household Size in River Falls
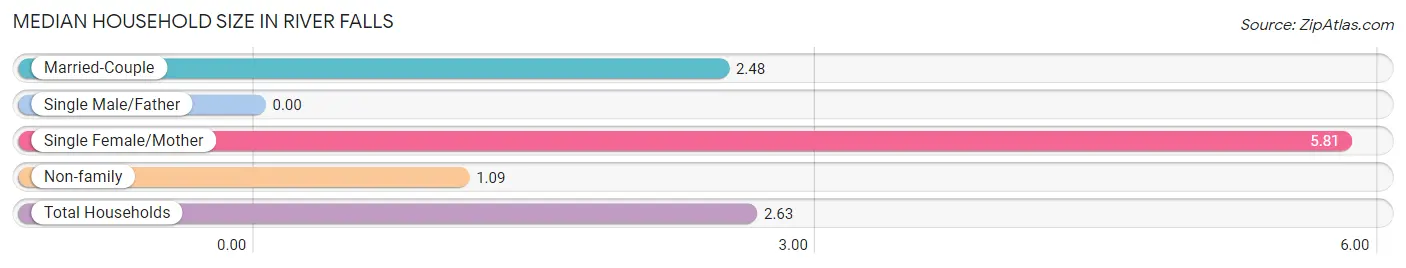
| Household Type | # Households | Household Size |
| Married-Couple | 27 (14.2%) | 2.48 |
| Single Male/Father | 0 (0.0%) | - |
| Single Female/Mother | 54 (28.4%) | 5.81 |
| Non-family | 109 (57.4%) | 1.09 |
| Total Households | 190 (100.0%) | 2.63 |
Household Size by Marriage Status in River Falls
Out of a total of 190 households in River Falls, 81 (42.6%) are family households, while 109 (57.4%) are nonfamily households. The most numerous type of family households are 2-person households, comprising 37, and the most common type of nonfamily households are 1-person households, comprising 101.
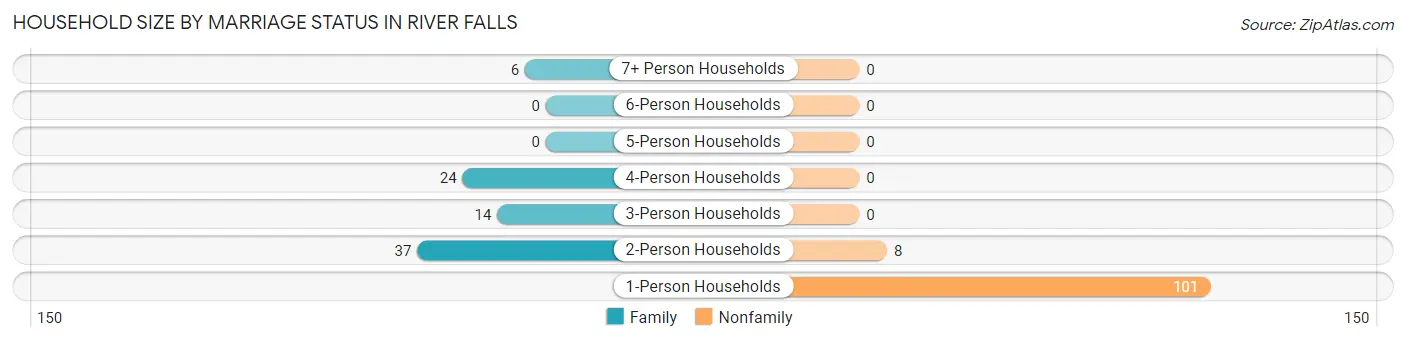
| Household Size | Family Households | Nonfamily Households |
| 1-Person Households | - | 101 (53.2%) |
| 2-Person Households | 37 (19.5%) | 8 (4.2%) |
| 3-Person Households | 14 (7.4%) | 0 (0.0%) |
| 4-Person Households | 24 (12.6%) | 0 (0.0%) |
| 5-Person Households | 0 (0.0%) | 0 (0.0%) |
| 6-Person Households | 0 (0.0%) | 0 (0.0%) |
| 7+ Person Households | 6 (3.2%) | 0 (0.0%) |
| Total | 81 (42.6%) | 109 (57.4%) |
Female Fertility in River Falls
Fertility by Age in River Falls
Average fertility rate in River Falls is 98.0 births per 1,000 women. Women in the age bracket of 15 to 19 years have the highest fertility rate with 289.0 births per 1,000 women. Women in the age bracket of 15 to 19 years acount for 100.0% of all women with births.
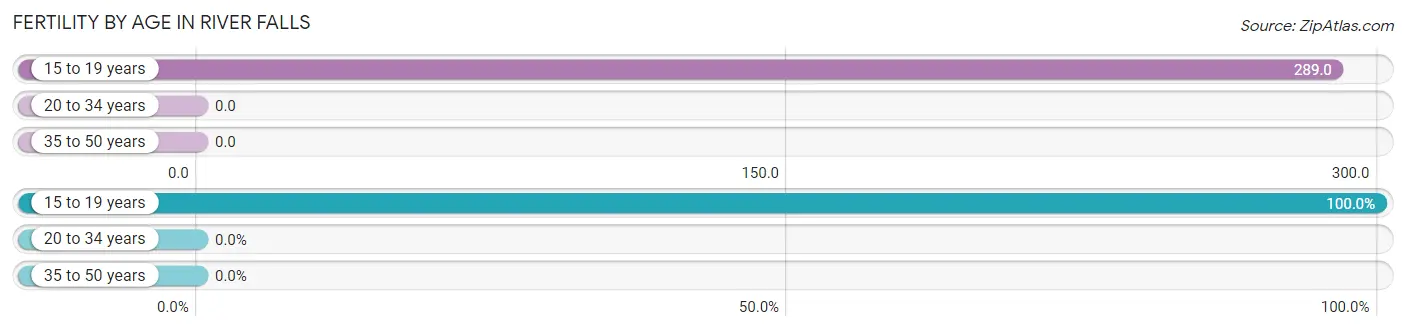
| Age Bracket | Women with Births | Births / 1,000 Women |
| 15 to 19 years | 11 (100.0%) | 289.0 |
| 20 to 34 years | 0 (0.0%) | 0.0 |
| 35 to 50 years | 0 (0.0%) | 0.0 |
| Total | 11 (100.0%) | 98.0 |
Fertility by Age by Marriage Status in River Falls
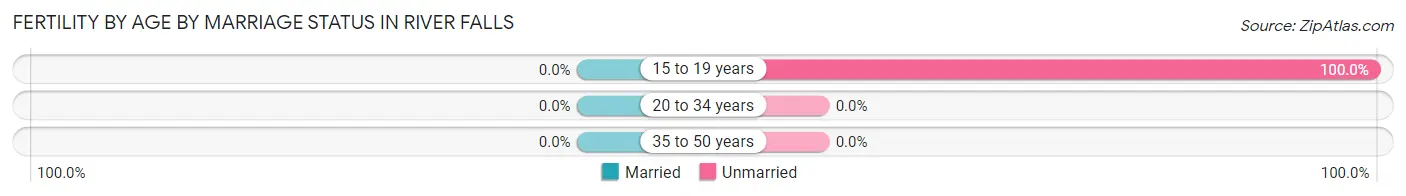
| Age Bracket | Married | Unmarried |
| 15 to 19 years | 0 (0.0%) | 11 (100.0%) |
| 20 to 34 years | 0 (0.0%) | 0 (0.0%) |
| 35 to 50 years | 0 (0.0%) | 0 (0.0%) |
| Total | 0 (0.0%) | 11 (100.0%) |
Fertility by Education in River Falls
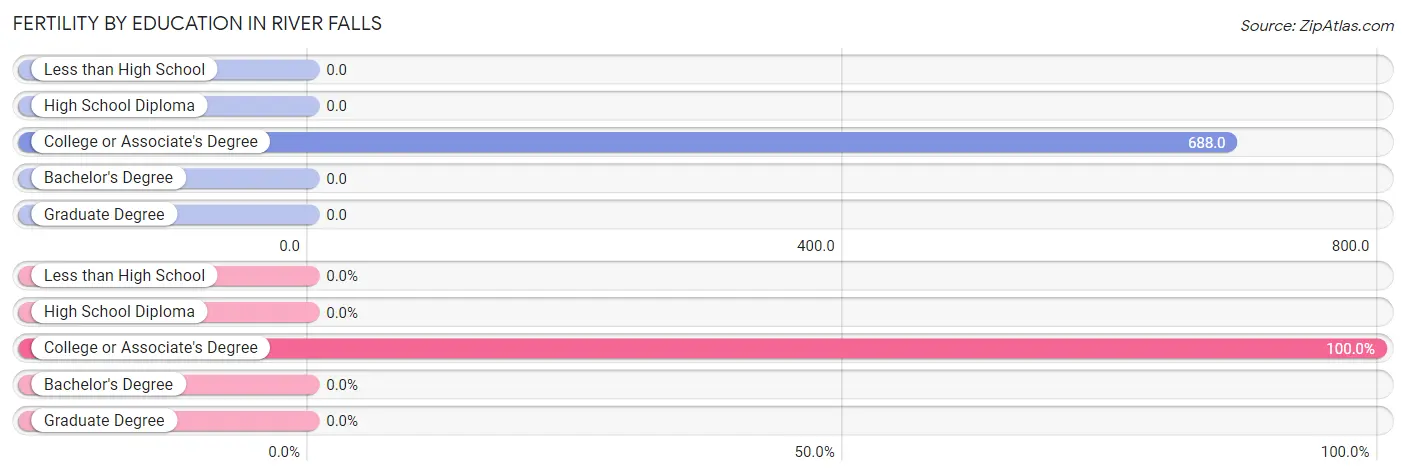
| Educational Attainment | Women with Births | Births / 1,000 Women |
| Less than High School | 0 (0.0%) | 0.0 |
| High School Diploma | 0 (0.0%) | 0.0 |
| College or Associate's Degree | 11 (100.0%) | 688.0 |
| Bachelor's Degree | 0 (0.0%) | 0.0 |
| Graduate Degree | 0 (0.0%) | 0.0 |
| Total | 11 (100.0%) | 98.0 |
Fertility by Education by Marriage Status in River Falls
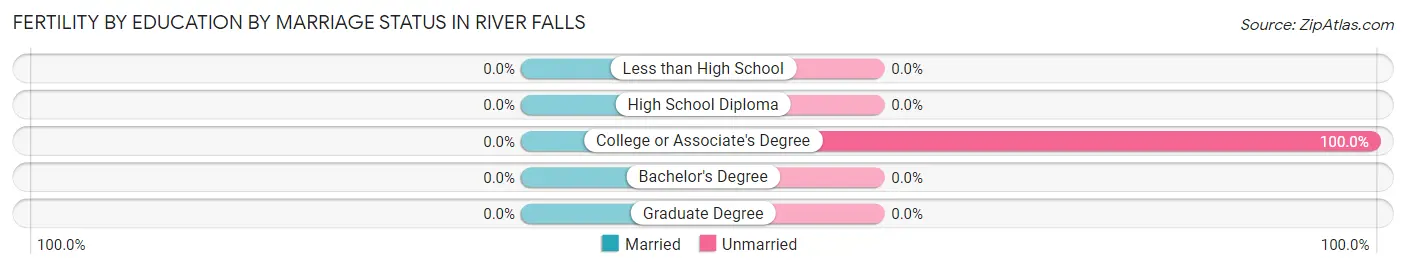
| Educational Attainment | Married | Unmarried |
| Less than High School | 0 (0.0%) | 0 (0.0%) |
| High School Diploma | 0 (0.0%) | 0 (0.0%) |
| College or Associate's Degree | 0 (0.0%) | 11 (100.0%) |
| Bachelor's Degree | 0 (0.0%) | 0 (0.0%) |
| Graduate Degree | 0 (0.0%) | 0 (0.0%) |
| Total | 0 (0.0%) | 11 (100.0%) |
Employment Characteristics in River Falls
Employment by Class of Employer in River Falls
Among the 145 employed individuals in River Falls, private company employees (102 | 70.3%), local government employees (19 | 13.1%), and self-employed (incorporated) (9 | 6.2%) make up the most common classes of employment.
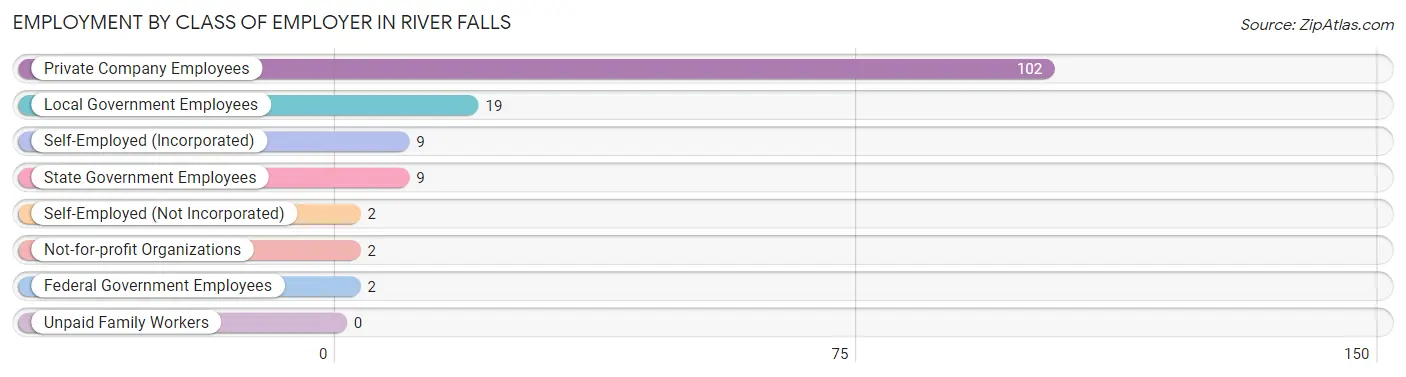
| Employer Class | # Employees | % Employees |
| Private Company Employees | 102 | 70.3% |
| Self-Employed (Incorporated) | 9 | 6.2% |
| Self-Employed (Not Incorporated) | 2 | 1.4% |
| Not-for-profit Organizations | 2 | 1.4% |
| Local Government Employees | 19 | 13.1% |
| State Government Employees | 9 | 6.2% |
| Federal Government Employees | 2 | 1.4% |
| Unpaid Family Workers | 0 | 0.0% |
| Total | 145 | 100.0% |
Employment Status by Age in River Falls
According to the labor force statistics for River Falls, out of the total population over 16 years of age (416), 50.5% or 210 individuals are in the labor force, with 31.0% or 65 of them unemployed. The age group with the highest labor force participation rate is 25 to 29 years, with 100.0% or 7 individuals in the labor force. Within the labor force, the 16 to 19 years age range has the highest percentage of unemployed individuals, with 100.0% or 7 of them being unemployed.
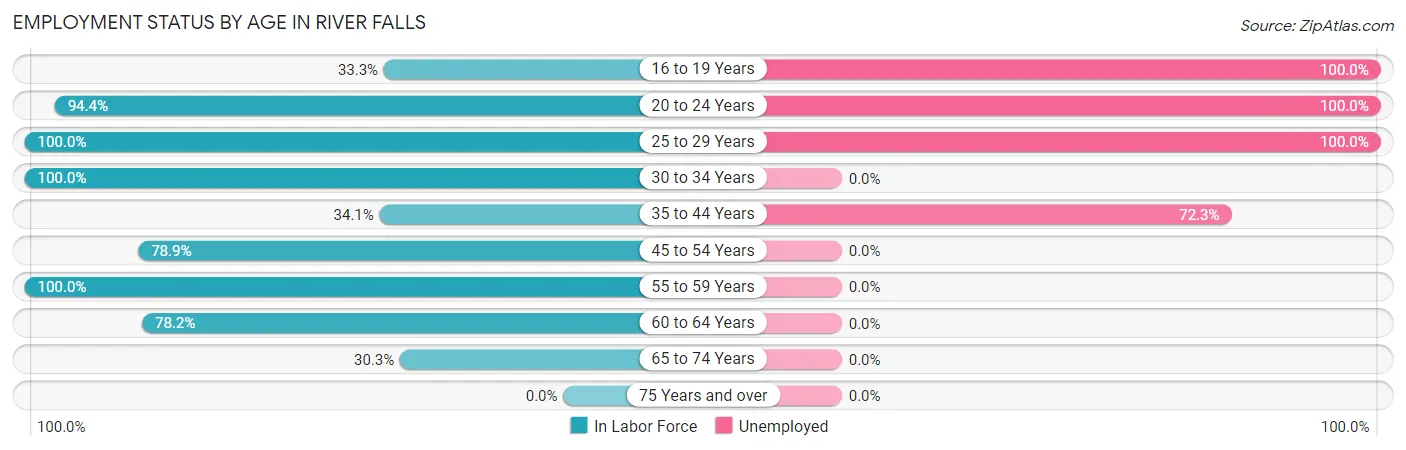
| Age Bracket | In Labor Force | Unemployed |
| 16 to 19 Years | 7 (33.3%) | 7 (100.0%) |
| 20 to 24 Years | 17 (94.4%) | 17 (100.0%) |
| 25 to 29 Years | 7 (100.0%) | 7 (100.0%) |
| 30 to 34 Years | 11 (100.0%) | 0 (0.0%) |
| 35 to 44 Years | 47 (34.1%) | 34 (72.3%) |
| 45 to 54 Years | 45 (78.9%) | 0 (0.0%) |
| 55 to 59 Years | 23 (100.0%) | 0 (0.0%) |
| 60 to 64 Years | 43 (78.2%) | 0 (0.0%) |
| 65 to 74 Years | 10 (30.3%) | 0 (0.0%) |
| 75 Years and over | 0 (0.0%) | 0 (0.0%) |
| Total | 210 (50.5%) | 65 (31.0%) |
Employment Status by Educational Attainment in River Falls
According to labor force statistics for River Falls, 60.5% of individuals (176) out of the total population between 25 and 64 years of age (291) are in the labor force, with 23.3% or 41 of them being unemployed. The group with the highest labor force participation rate are those with the educational attainment of bachelor's degree or higher, with 100.0% or 29 individuals in the labor force. Within the labor force, individuals with high school diploma education have the highest percentage of unemployment, with 50.6% or 41 of them being unemployed.
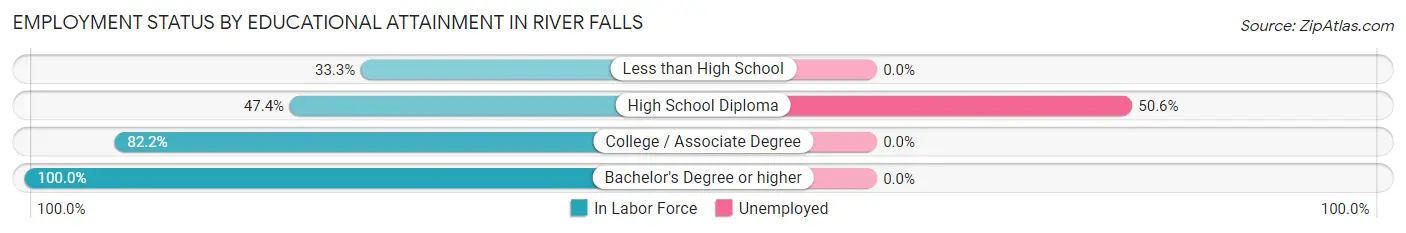
| Educational Attainment | In Labor Force | Unemployed |
| Less than High School | 6 (33.3%) | 0 (0.0%) |
| High School Diploma | 81 (47.4%) | 87 (50.6%) |
| College / Associate Degree | 60 (82.2%) | 0 (0.0%) |
| Bachelor's Degree or higher | 29 (100.0%) | 0 (0.0%) |
| Total | 176 (60.5%) | 68 (23.3%) |
Employment Occupations by Sex in River Falls
Management, Business, Science and Arts Occupations
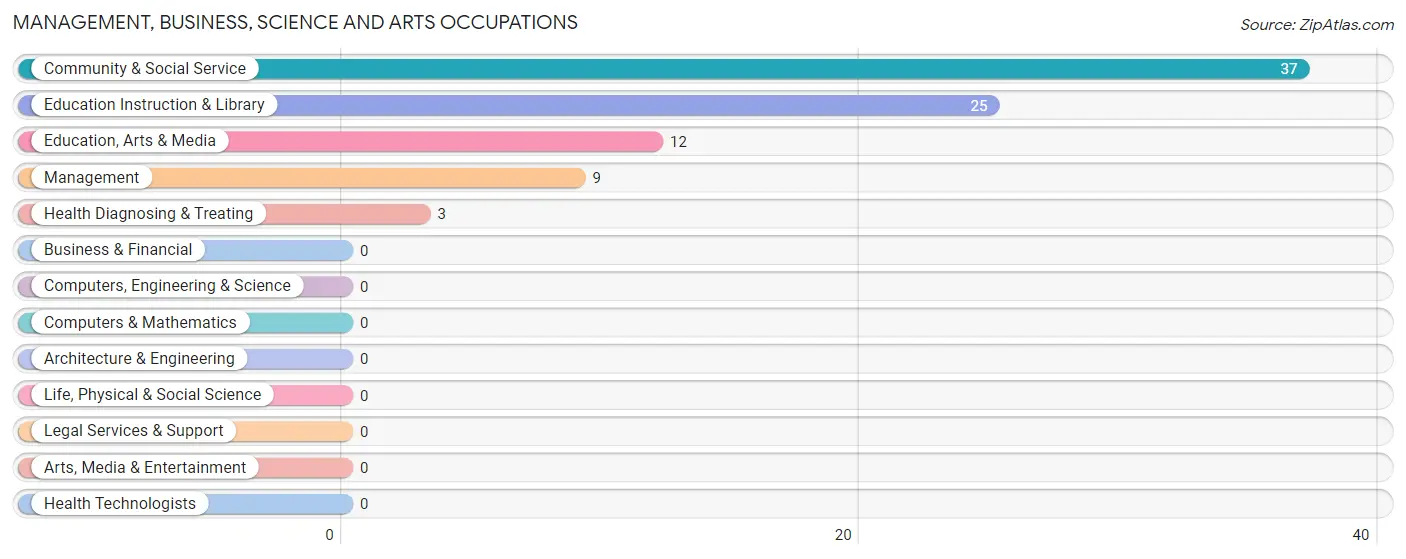
The most common Management, Business, Science and Arts occupations in River Falls are Community & Social Service (37 | 25.5%), Education Instruction & Library (25 | 17.2%), Education, Arts & Media (12 | 8.3%), Management (9 | 6.2%), and Health Diagnosing & Treating (3 | 2.1%).
Management, Business, Science and Arts Occupations by Sex
Within the Management, Business, Science and Arts occupations in River Falls, the most male-oriented occupations are Management (100.0%), Education Instruction & Library (64.0%), and Community & Social Service (48.6%), while the most female-oriented occupations are Health Diagnosing & Treating (100.0%), Education, Arts & Media (83.3%), and Community & Social Service (51.3%).
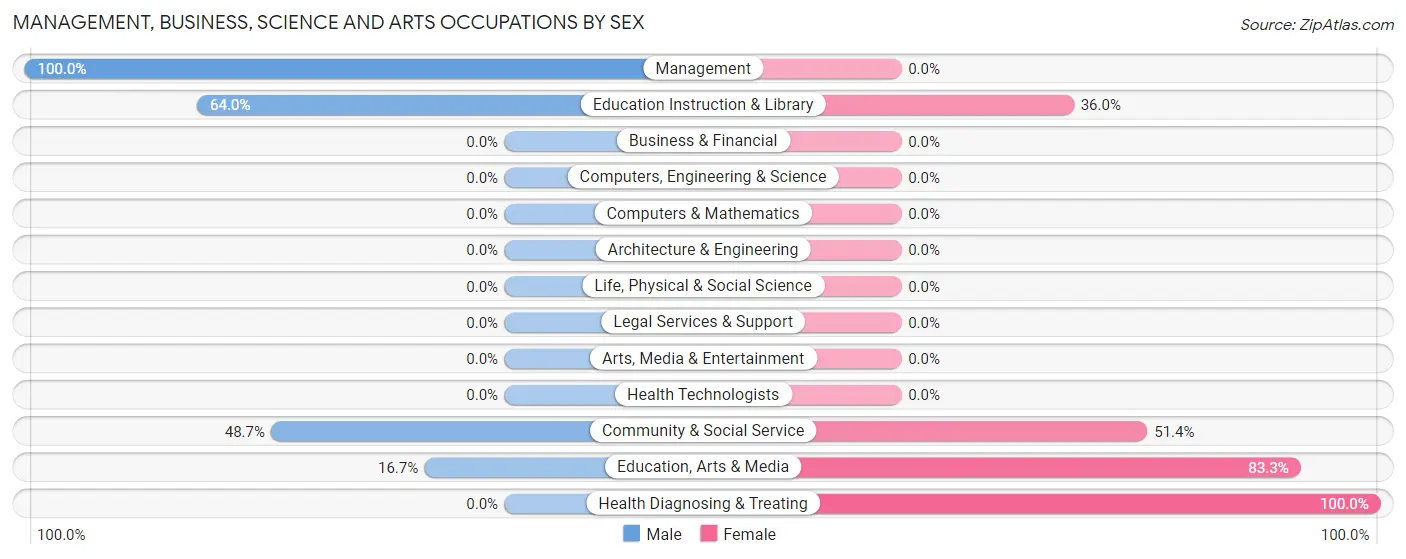
| Occupation | Male | Female |
| Management | 9 (100.0%) | 0 (0.0%) |
| Business & Financial | 0 (0.0%) | 0 (0.0%) |
| Computers, Engineering & Science | 0 (0.0%) | 0 (0.0%) |
| Computers & Mathematics | 0 (0.0%) | 0 (0.0%) |
| Architecture & Engineering | 0 (0.0%) | 0 (0.0%) |
| Life, Physical & Social Science | 0 (0.0%) | 0 (0.0%) |
| Community & Social Service | 18 (48.6%) | 19 (51.3%) |
| Education, Arts & Media | 2 (16.7%) | 10 (83.3%) |
| Legal Services & Support | 0 (0.0%) | 0 (0.0%) |
| Education Instruction & Library | 16 (64.0%) | 9 (36.0%) |
| Arts, Media & Entertainment | 0 (0.0%) | 0 (0.0%) |
| Health Diagnosing & Treating | 0 (0.0%) | 3 (100.0%) |
| Health Technologists | 0 (0.0%) | 0 (0.0%) |
| Total (Category) | 27 (55.1%) | 22 (44.9%) |
| Total (Overall) | 80 (55.2%) | 65 (44.8%) |
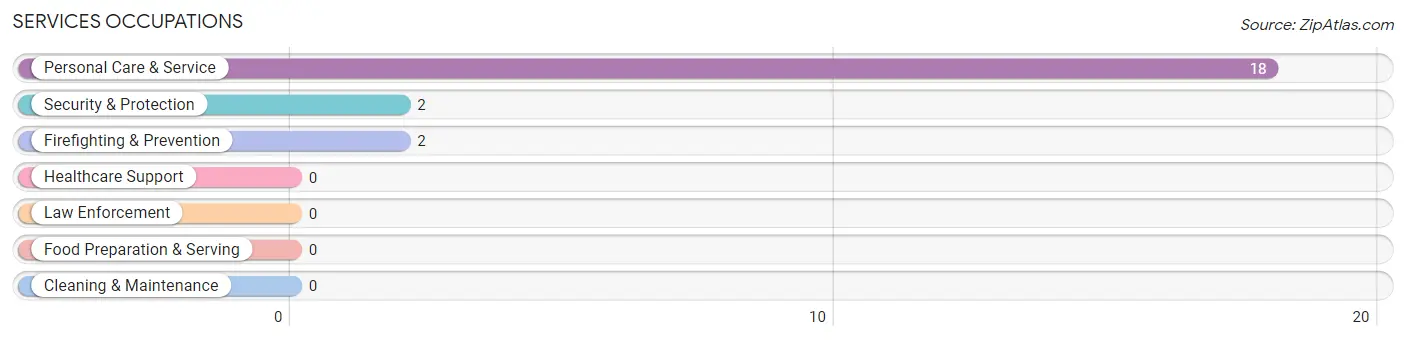
Services Occupations
The most common Services occupations in River Falls are Personal Care & Service (18 | 12.4%), Security & Protection (2 | 1.4%), and Firefighting & Prevention (2 | 1.4%).
Services Occupations by Sex
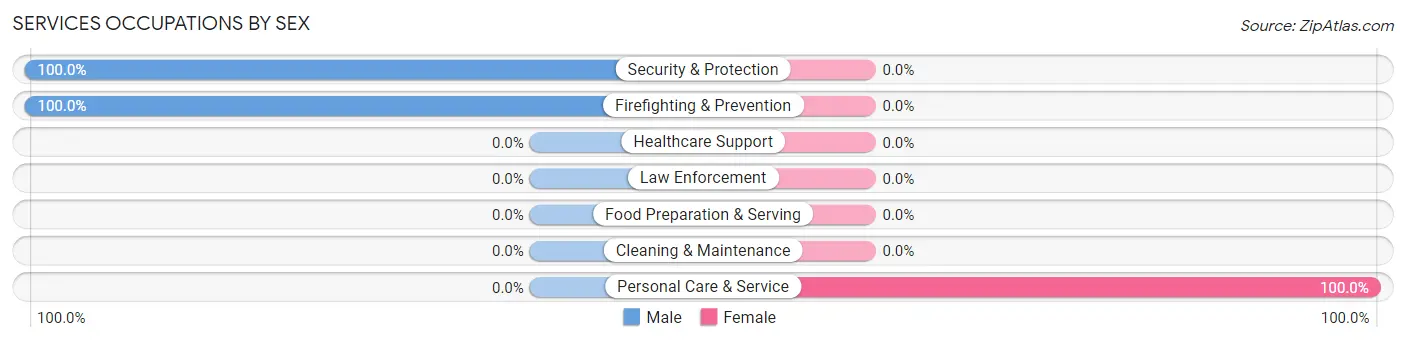
| Occupation | Male | Female |
| Healthcare Support | 0 (0.0%) | 0 (0.0%) |
| Security & Protection | 2 (100.0%) | 0 (0.0%) |
| Firefighting & Prevention | 2 (100.0%) | 0 (0.0%) |
| Law Enforcement | 0 (0.0%) | 0 (0.0%) |
| Food Preparation & Serving | 0 (0.0%) | 0 (0.0%) |
| Cleaning & Maintenance | 0 (0.0%) | 0 (0.0%) |
| Personal Care & Service | 0 (0.0%) | 18 (100.0%) |
| Total (Category) | 2 (10.0%) | 18 (90.0%) |
| Total (Overall) | 80 (55.2%) | 65 (44.8%) |
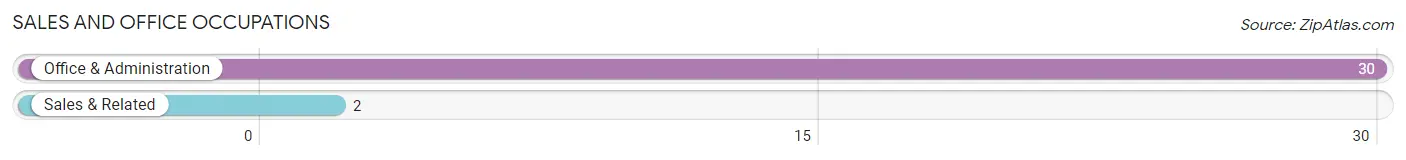
Sales and Office Occupations
The most common Sales and Office occupations in River Falls are Office & Administration (30 | 20.7%), and Sales & Related (2 | 1.4%).
Sales and Office Occupations by Sex
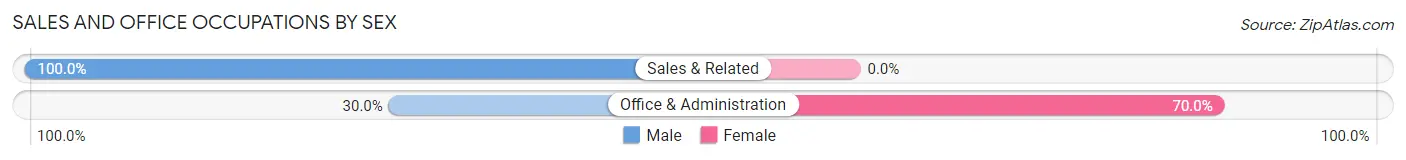
| Occupation | Male | Female |
| Sales & Related | 2 (100.0%) | 0 (0.0%) |
| Office & Administration | 9 (30.0%) | 21 (70.0%) |
| Total (Category) | 11 (34.4%) | 21 (65.6%) |
| Total (Overall) | 80 (55.2%) | 65 (44.8%) |
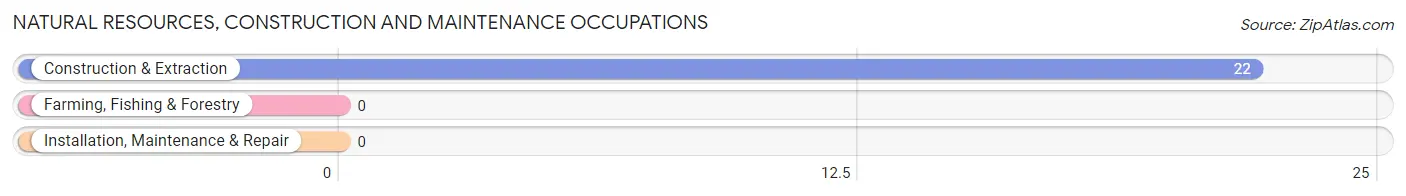
Natural Resources, Construction and Maintenance Occupations
The most common Natural Resources, Construction and Maintenance occupations in River Falls are , and Construction & Extraction (22 | 15.2%).
Natural Resources, Construction and Maintenance Occupations by Sex
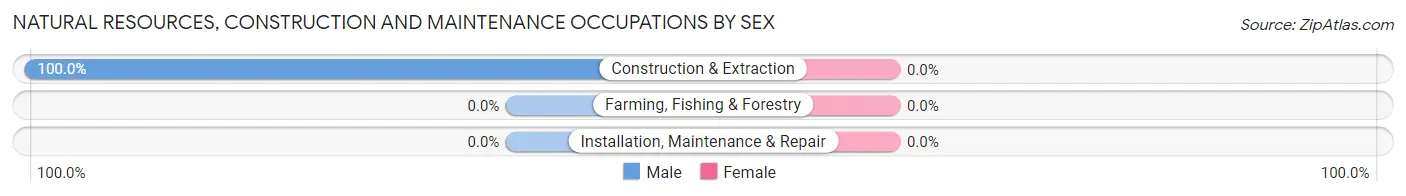
| Occupation | Male | Female |
| Farming, Fishing & Forestry | 0 (0.0%) | 0 (0.0%) |
| Construction & Extraction | 22 (100.0%) | 0 (0.0%) |
| Installation, Maintenance & Repair | 0 (0.0%) | 0 (0.0%) |
| Total (Category) | 22 (100.0%) | 0 (0.0%) |
| Total (Overall) | 80 (55.2%) | 65 (44.8%) |
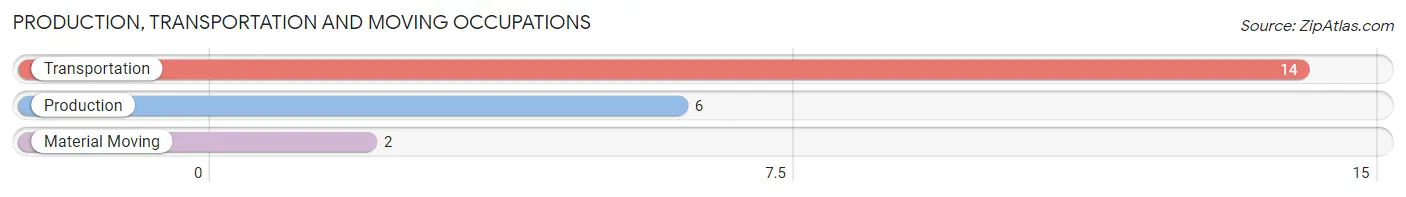
Production, Transportation and Moving Occupations
The most common Production, Transportation and Moving occupations in River Falls are Transportation (14 | 9.7%), Production (6 | 4.1%), and Material Moving (2 | 1.4%).
Production, Transportation and Moving Occupations by Sex
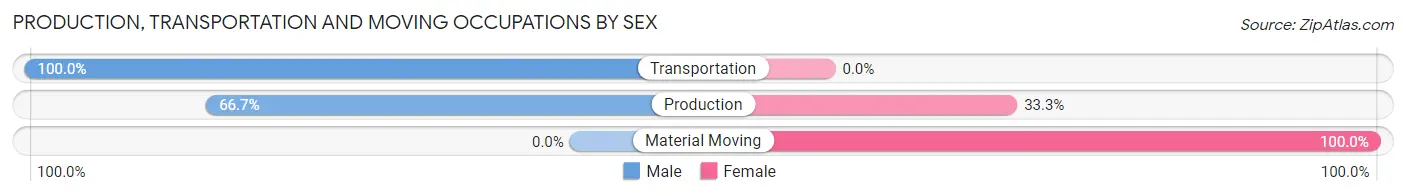
| Occupation | Male | Female |
| Production | 4 (66.7%) | 2 (33.3%) |
| Transportation | 14 (100.0%) | 0 (0.0%) |
| Material Moving | 0 (0.0%) | 2 (100.0%) |
| Total (Category) | 18 (81.8%) | 4 (18.2%) |
| Total (Overall) | 80 (55.2%) | 65 (44.8%) |
Employment Industries by Sex in River Falls
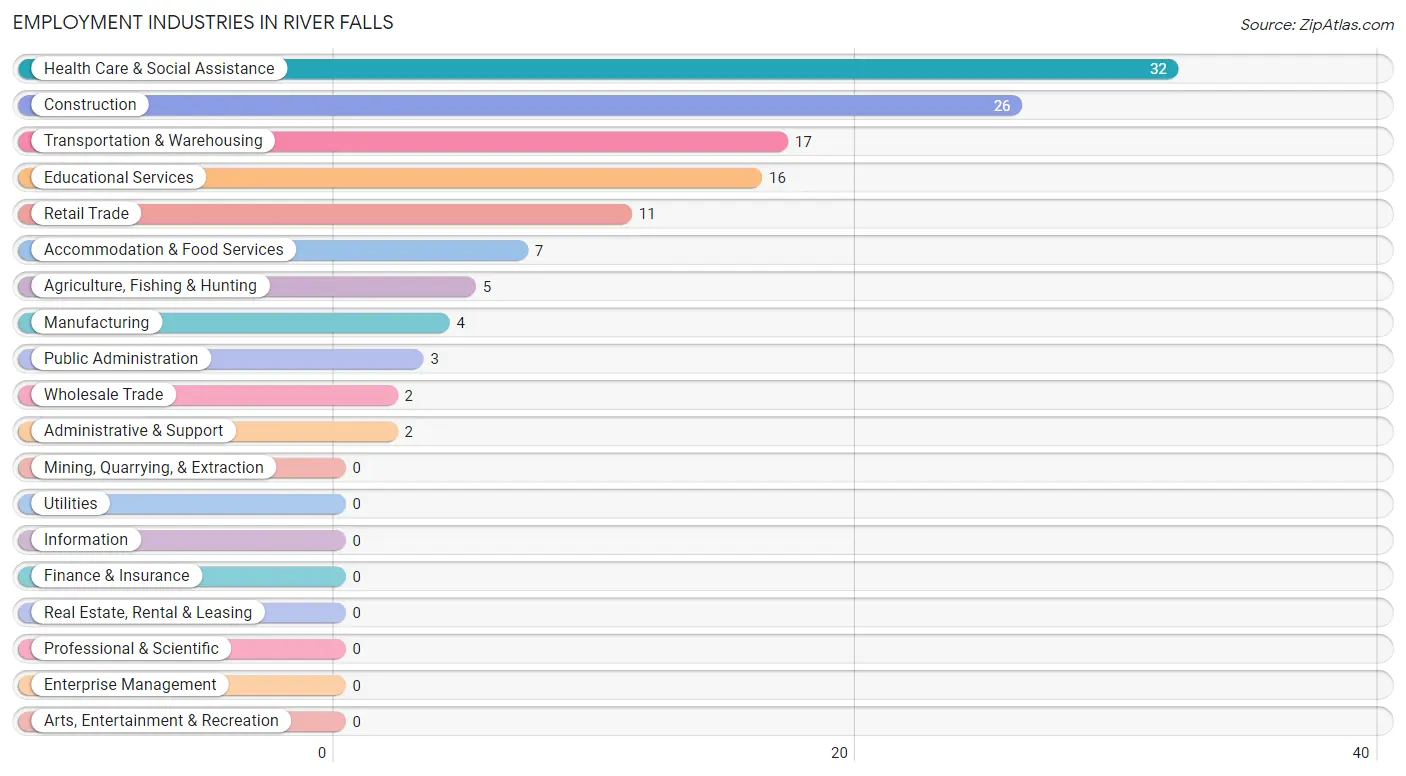
Employment Industries in River Falls
The major employment industries in River Falls include Health Care & Social Assistance (32 | 22.1%), Construction (26 | 17.9%), Transportation & Warehousing (17 | 11.7%), Educational Services (16 | 11.0%), and Retail Trade (11 | 7.6%).
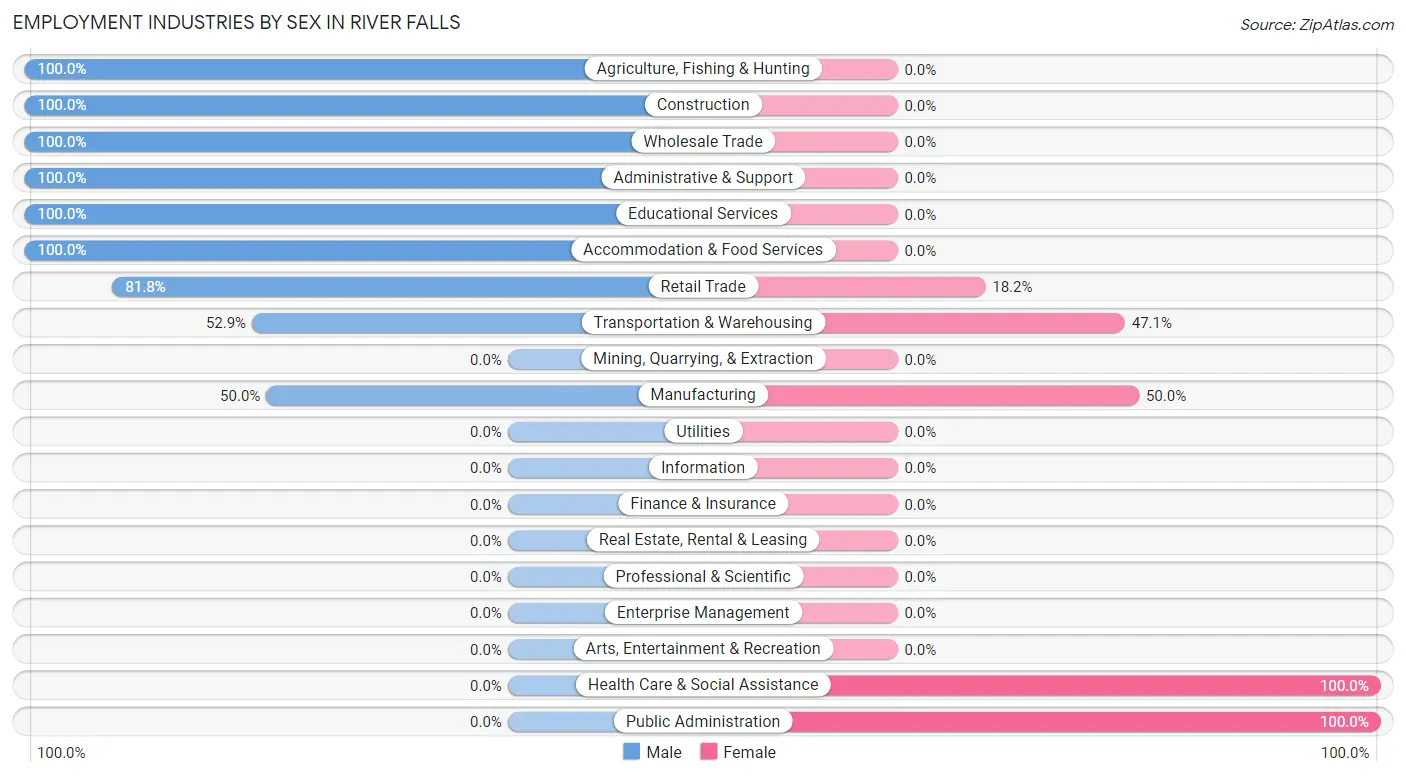
Employment Industries by Sex in River Falls
The River Falls industries that see more men than women are Agriculture, Fishing & Hunting (100.0%), Construction (100.0%), and Wholesale Trade (100.0%), whereas the industries that tend to have a higher number of women are Health Care & Social Assistance (100.0%), Public Administration (100.0%), and Manufacturing (50.0%).
| Industry | Male | Female |
| Agriculture, Fishing & Hunting | 5 (100.0%) | 0 (0.0%) |
| Mining, Quarrying, & Extraction | 0 (0.0%) | 0 (0.0%) |
| Construction | 26 (100.0%) | 0 (0.0%) |
| Manufacturing | 2 (50.0%) | 2 (50.0%) |
| Wholesale Trade | 2 (100.0%) | 0 (0.0%) |
| Retail Trade | 9 (81.8%) | 2 (18.2%) |
| Transportation & Warehousing | 9 (52.9%) | 8 (47.1%) |
| Utilities | 0 (0.0%) | 0 (0.0%) |
| Information | 0 (0.0%) | 0 (0.0%) |
| Finance & Insurance | 0 (0.0%) | 0 (0.0%) |
| Real Estate, Rental & Leasing | 0 (0.0%) | 0 (0.0%) |
| Professional & Scientific | 0 (0.0%) | 0 (0.0%) |
| Enterprise Management | 0 (0.0%) | 0 (0.0%) |
| Administrative & Support | 2 (100.0%) | 0 (0.0%) |
| Educational Services | 16 (100.0%) | 0 (0.0%) |
| Health Care & Social Assistance | 0 (0.0%) | 32 (100.0%) |
| Arts, Entertainment & Recreation | 0 (0.0%) | 0 (0.0%) |
| Accommodation & Food Services | 7 (100.0%) | 0 (0.0%) |
| Public Administration | 0 (0.0%) | 3 (100.0%) |
| Total | 80 (55.2%) | 65 (44.8%) |
Education in River Falls
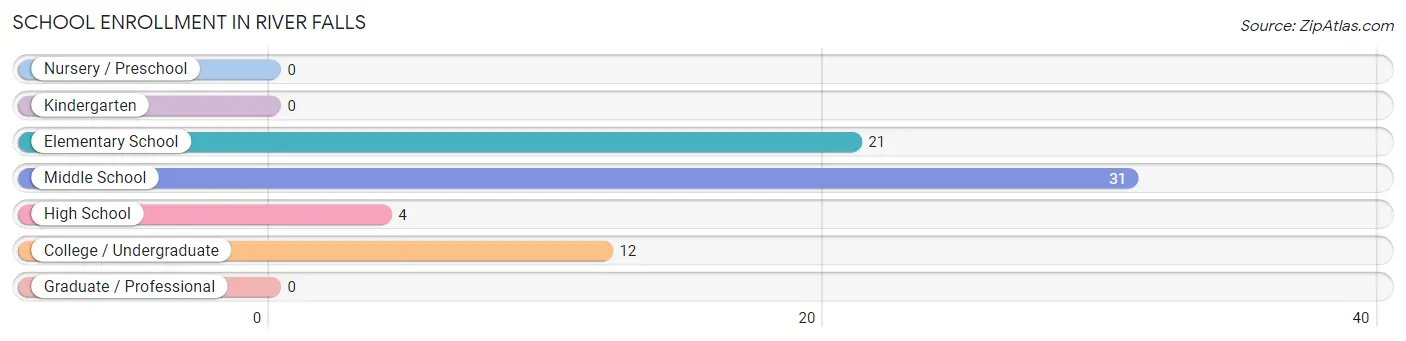
School Enrollment in River Falls
The most common levels of schooling among the 68 students in River Falls are middle school (31 | 45.6%), elementary school (21 | 30.9%), and college / undergraduate (12 | 17.6%).
| School Level | # Students | % Students |
| Nursery / Preschool | 0 | 0.0% |
| Kindergarten | 0 | 0.0% |
| Elementary School | 21 | 30.9% |
| Middle School | 31 | 45.6% |
| High School | 4 | 5.9% |
| College / Undergraduate | 12 | 17.6% |
| Graduate / Professional | 0 | 0.0% |
| Total | 68 | 100.0% |
School Enrollment by Age by Funding Source in River Falls
Out of a total of 68 students who are enrolled in schools in River Falls, 2 (2.9%) attend a private institution, while the remaining 66 (97.1%) are enrolled in public schools. The age group of 5 to 9 year old has the highest likelihood of being enrolled in private schools, with 2 (9.5% in the age bracket) enrolled. Conversely, the age group of 10 to 14 year olds has the lowest likelihood of being enrolled in a private school, with 18 (100.0% in the age bracket) attending a public institution.
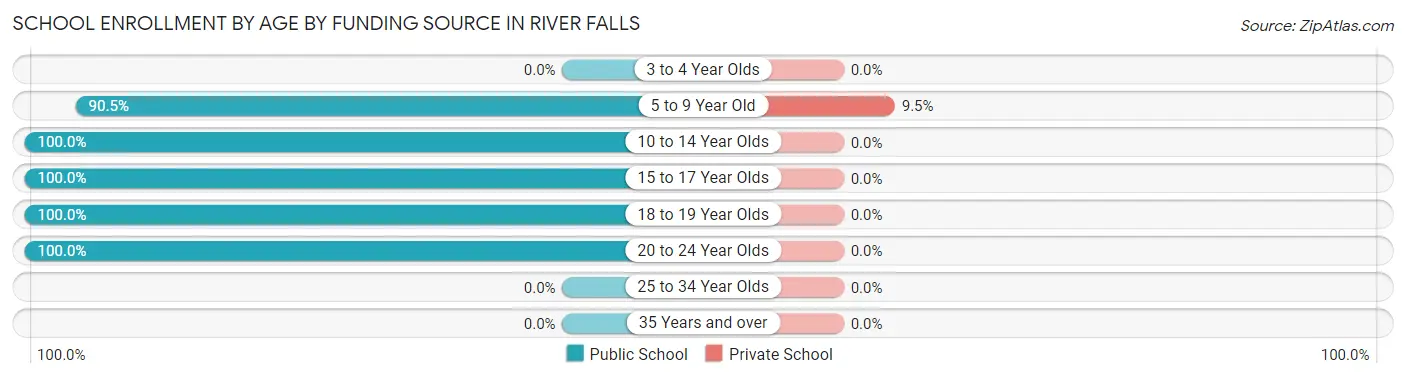
| Age Bracket | Public School | Private School |
| 3 to 4 Year Olds | 0 (0.0%) | 0 (0.0%) |
| 5 to 9 Year Old | 19 (90.5%) | 2 (9.5%) |
| 10 to 14 Year Olds | 18 (100.0%) | 0 (0.0%) |
| 15 to 17 Year Olds | 17 (100.0%) | 0 (0.0%) |
| 18 to 19 Year Olds | 11 (100.0%) | 0 (0.0%) |
| 20 to 24 Year Olds | 1 (100.0%) | 0 (0.0%) |
| 25 to 34 Year Olds | 0 (0.0%) | 0 (0.0%) |
| 35 Years and over | 0 (0.0%) | 0 (0.0%) |
| Total | 66 (97.1%) | 2 (2.9%) |
Educational Attainment by Field of Study in River Falls
Business (19 | 52.8%), arts & humanities (10 | 27.8%), bio, nature & agricultural (5 | 13.9%), and education (2 | 5.6%) are the most common fields of study among 36 individuals in River Falls who have obtained a bachelor's degree or higher.
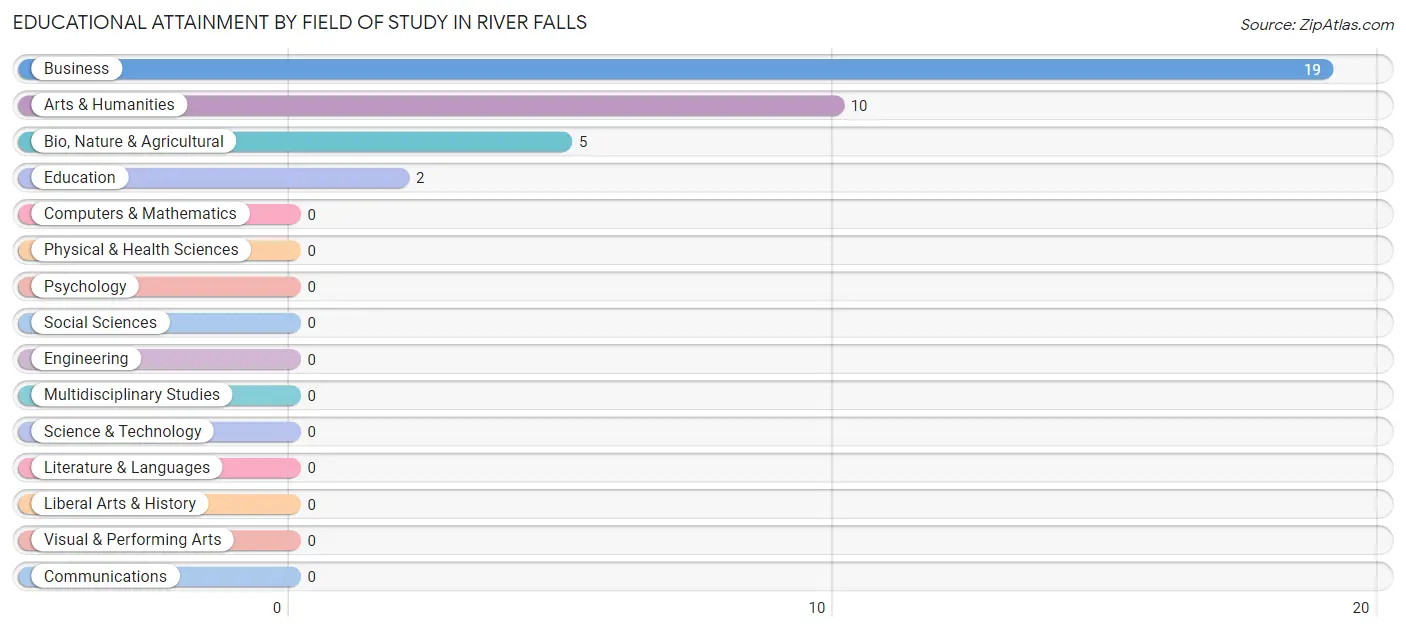
| Field of Study | # Graduates | % Graduates |
| Computers & Mathematics | 0 | 0.0% |
| Bio, Nature & Agricultural | 5 | 13.9% |
| Physical & Health Sciences | 0 | 0.0% |
| Psychology | 0 | 0.0% |
| Social Sciences | 0 | 0.0% |
| Engineering | 0 | 0.0% |
| Multidisciplinary Studies | 0 | 0.0% |
| Science & Technology | 0 | 0.0% |
| Business | 19 | 52.8% |
| Education | 2 | 5.6% |
| Literature & Languages | 0 | 0.0% |
| Liberal Arts & History | 0 | 0.0% |
| Visual & Performing Arts | 0 | 0.0% |
| Communications | 0 | 0.0% |
| Arts & Humanities | 10 | 27.8% |
| Total | 36 | 100.0% |
Transportation & Commute in River Falls
Vehicle Availability by Sex in River Falls
The most prevalent vehicle ownership categories in River Falls are males with 1 vehicle (31, accounting for 38.8%) and females with 1 vehicle (7, making up 47.7%).
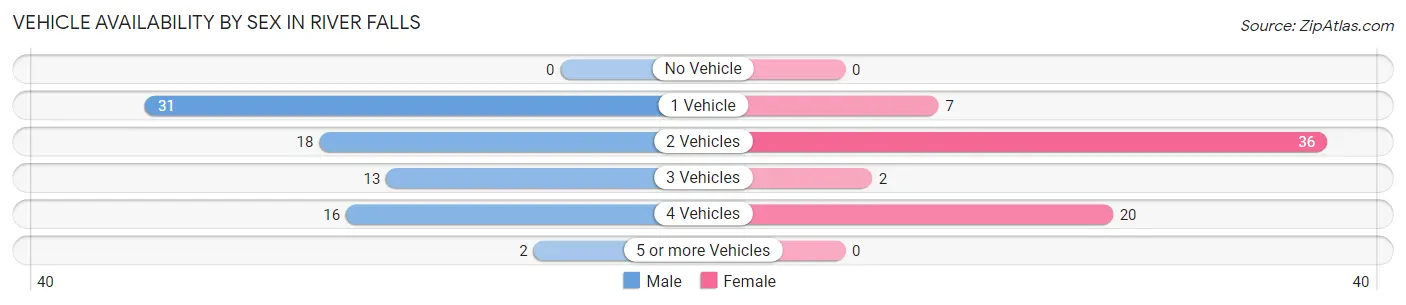
| Vehicles Available | Male | Female |
| No Vehicle | 0 (0.0%) | 0 (0.0%) |
| 1 Vehicle | 31 (38.8%) | 7 (10.8%) |
| 2 Vehicles | 18 (22.5%) | 36 (55.4%) |
| 3 Vehicles | 13 (16.3%) | 2 (3.1%) |
| 4 Vehicles | 16 (20.0%) | 20 (30.8%) |
| 5 or more Vehicles | 2 (2.5%) | 0 (0.0%) |
| Total | 80 (100.0%) | 65 (100.0%) |
Commute Time in River Falls
The most frequently occuring commute durations in River Falls are 15 to 19 minutes (73 commuters, 50.3%), 20 to 24 minutes (27 commuters, 18.6%), and less than 5 minutes (20 commuters, 13.8%).
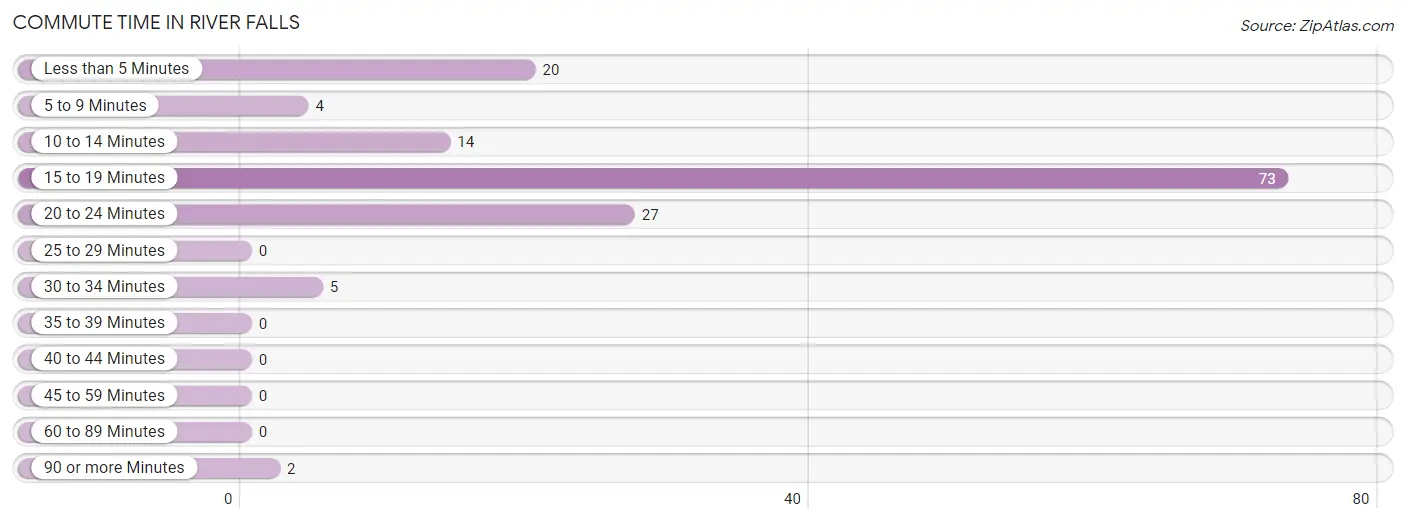
| Commute Time | # Commuters | % Commuters |
| Less than 5 Minutes | 20 | 13.8% |
| 5 to 9 Minutes | 4 | 2.8% |
| 10 to 14 Minutes | 14 | 9.7% |
| 15 to 19 Minutes | 73 | 50.3% |
| 20 to 24 Minutes | 27 | 18.6% |
| 25 to 29 Minutes | 0 | 0.0% |
| 30 to 34 Minutes | 5 | 3.5% |
| 35 to 39 Minutes | 0 | 0.0% |
| 40 to 44 Minutes | 0 | 0.0% |
| 45 to 59 Minutes | 0 | 0.0% |
| 60 to 89 Minutes | 0 | 0.0% |
| 90 or more Minutes | 2 | 1.4% |
Commute Time by Sex in River Falls
The most common commute times in River Falls are 15 to 19 minutes (56 commuters, 70.0%) for males and less than 5 minutes (20 commuters, 30.8%) for females.
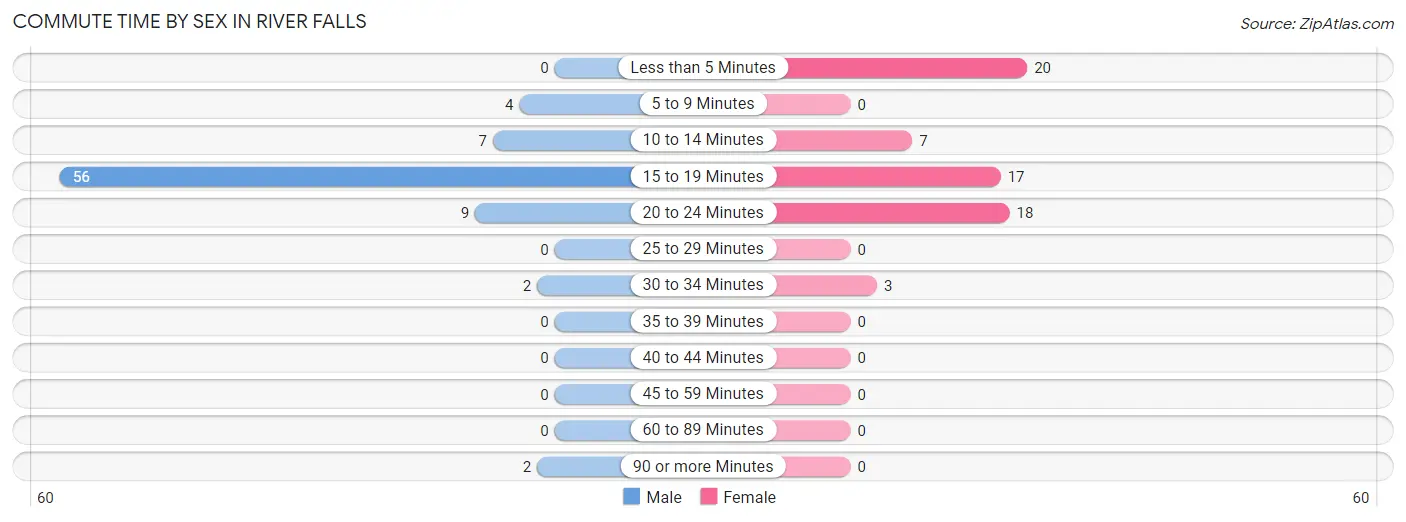
| Commute Time | Male | Female |
| Less than 5 Minutes | 0 (0.0%) | 20 (30.8%) |
| 5 to 9 Minutes | 4 (5.0%) | 0 (0.0%) |
| 10 to 14 Minutes | 7 (8.7%) | 7 (10.8%) |
| 15 to 19 Minutes | 56 (70.0%) | 17 (26.2%) |
| 20 to 24 Minutes | 9 (11.3%) | 18 (27.7%) |
| 25 to 29 Minutes | 0 (0.0%) | 0 (0.0%) |
| 30 to 34 Minutes | 2 (2.5%) | 3 (4.6%) |
| 35 to 39 Minutes | 0 (0.0%) | 0 (0.0%) |
| 40 to 44 Minutes | 0 (0.0%) | 0 (0.0%) |
| 45 to 59 Minutes | 0 (0.0%) | 0 (0.0%) |
| 60 to 89 Minutes | 0 (0.0%) | 0 (0.0%) |
| 90 or more Minutes | 2 (2.5%) | 0 (0.0%) |
Time of Departure to Work by Sex in River Falls
The most frequent times of departure to work in River Falls are 7:00 AM to 7:29 AM (41, 51.2%) for males and 5:00 AM to 5:29 AM (21, 32.3%) for females.
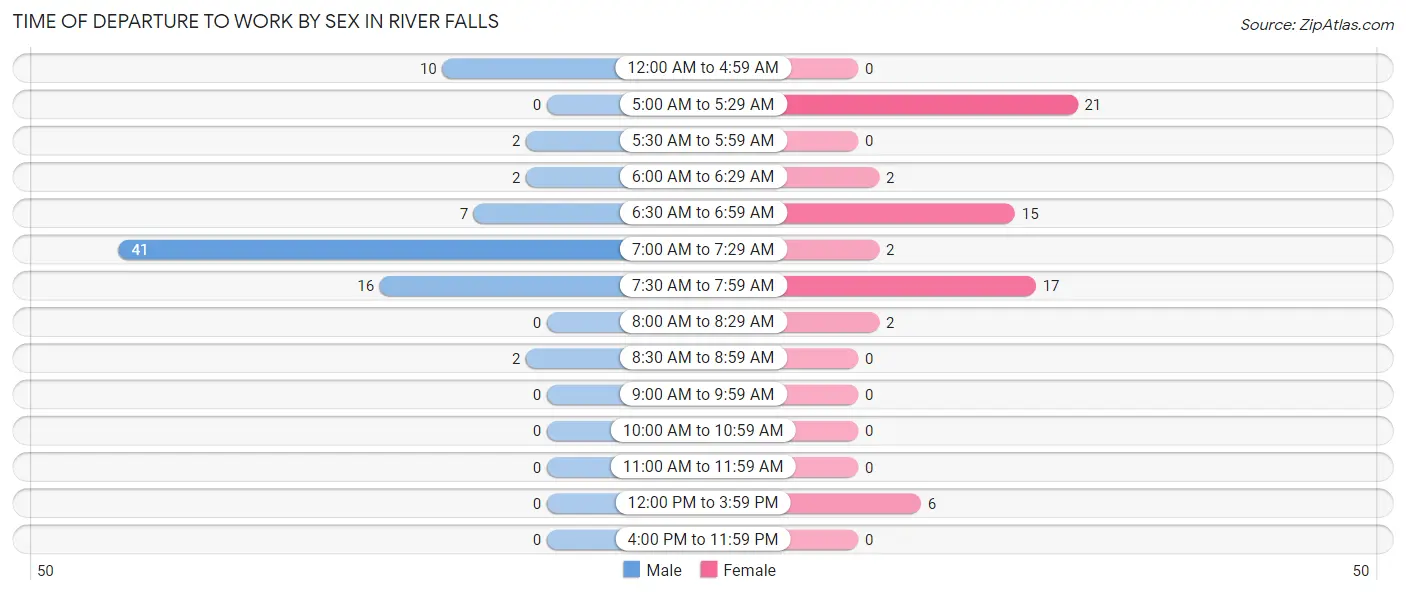
| Time of Departure | Male | Female |
| 12:00 AM to 4:59 AM | 10 (12.5%) | 0 (0.0%) |
| 5:00 AM to 5:29 AM | 0 (0.0%) | 21 (32.3%) |
| 5:30 AM to 5:59 AM | 2 (2.5%) | 0 (0.0%) |
| 6:00 AM to 6:29 AM | 2 (2.5%) | 2 (3.1%) |
| 6:30 AM to 6:59 AM | 7 (8.7%) | 15 (23.1%) |
| 7:00 AM to 7:29 AM | 41 (51.2%) | 2 (3.1%) |
| 7:30 AM to 7:59 AM | 16 (20.0%) | 17 (26.2%) |
| 8:00 AM to 8:29 AM | 0 (0.0%) | 2 (3.1%) |
| 8:30 AM to 8:59 AM | 2 (2.5%) | 0 (0.0%) |
| 9:00 AM to 9:59 AM | 0 (0.0%) | 0 (0.0%) |
| 10:00 AM to 10:59 AM | 0 (0.0%) | 0 (0.0%) |
| 11:00 AM to 11:59 AM | 0 (0.0%) | 0 (0.0%) |
| 12:00 PM to 3:59 PM | 0 (0.0%) | 6 (9.2%) |
| 4:00 PM to 11:59 PM | 0 (0.0%) | 0 (0.0%) |
| Total | 80 (100.0%) | 65 (100.0%) |
Housing Occupancy in River Falls
Occupancy by Ownership in River Falls
Of the total 190 dwellings in River Falls, owner-occupied units account for 118 (62.1%), while renter-occupied units make up 72 (37.9%).
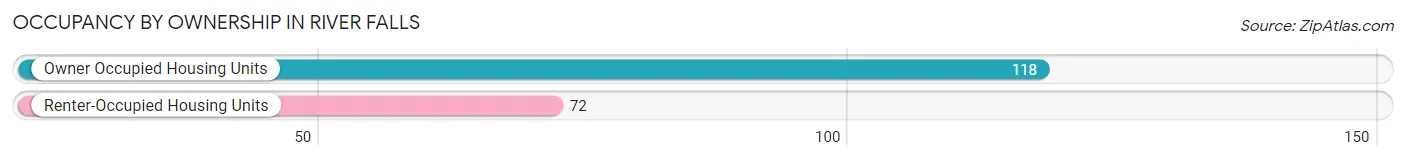
| Occupancy | # Housing Units | % Housing Units |
| Owner Occupied Housing Units | 118 | 62.1% |
| Renter-Occupied Housing Units | 72 | 37.9% |
| Total Occupied Housing Units | 190 | 100.0% |
Occupancy by Household Size in River Falls
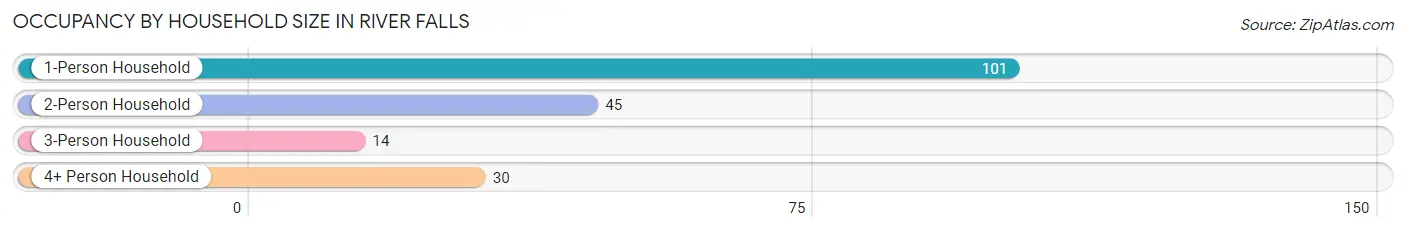
| Household Size | # Housing Units | % Housing Units |
| 1-Person Household | 101 | 53.2% |
| 2-Person Household | 45 | 23.7% |
| 3-Person Household | 14 | 7.4% |
| 4+ Person Household | 30 | 15.8% |
| Total Housing Units | 190 | 100.0% |
Occupancy by Ownership by Household Size in River Falls
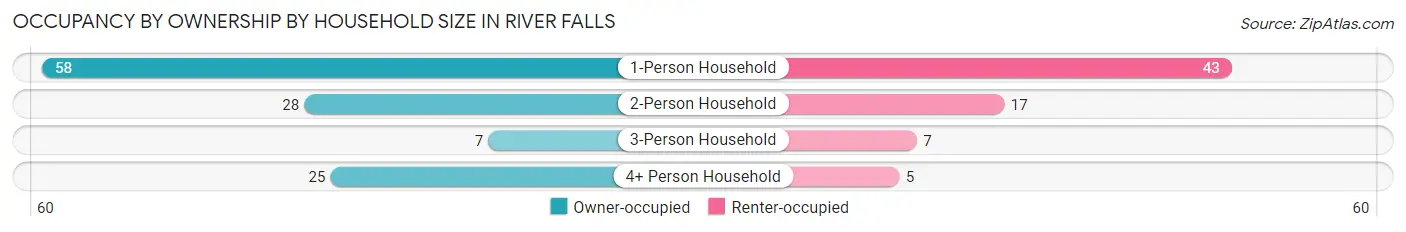
| Household Size | Owner-occupied | Renter-occupied |
| 1-Person Household | 58 (57.4%) | 43 (42.6%) |
| 2-Person Household | 28 (62.2%) | 17 (37.8%) |
| 3-Person Household | 7 (50.0%) | 7 (50.0%) |
| 4+ Person Household | 25 (83.3%) | 5 (16.7%) |
| Total Housing Units | 118 (62.1%) | 72 (37.9%) |
Occupancy by Educational Attainment in River Falls
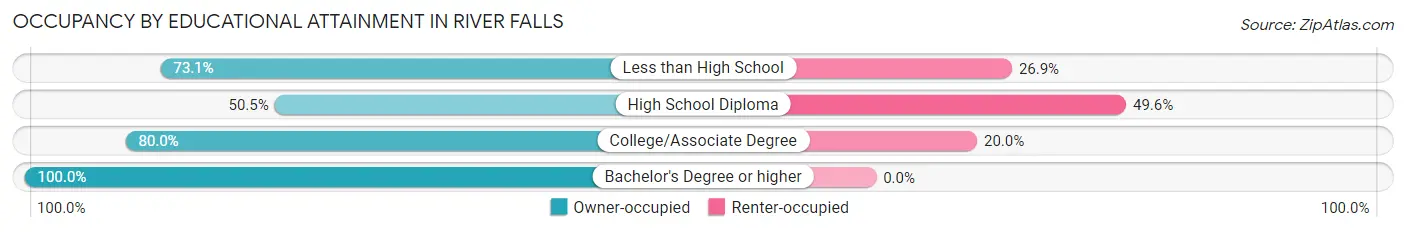
| Household Size | Owner-occupied | Renter-occupied |
| Less than High School | 19 (73.1%) | 7 (26.9%) |
| High School Diploma | 56 (50.4%) | 55 (49.5%) |
| College/Associate Degree | 40 (80.0%) | 10 (20.0%) |
| Bachelor's Degree or higher | 3 (100.0%) | 0 (0.0%) |
Occupancy by Age of Householder in River Falls
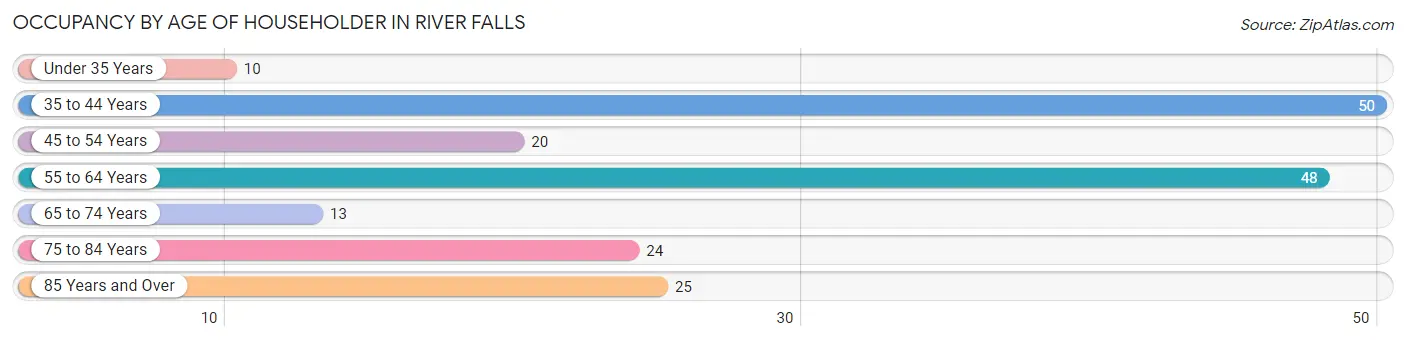
| Age Bracket | # Households | % Households |
| Under 35 Years | 10 | 5.3% |
| 35 to 44 Years | 50 | 26.3% |
| 45 to 54 Years | 20 | 10.5% |
| 55 to 64 Years | 48 | 25.3% |
| 65 to 74 Years | 13 | 6.8% |
| 75 to 84 Years | 24 | 12.6% |
| 85 Years and Over | 25 | 13.2% |
| Total | 190 | 100.0% |
Housing Finances in River Falls
Median Income by Occupancy in River Falls
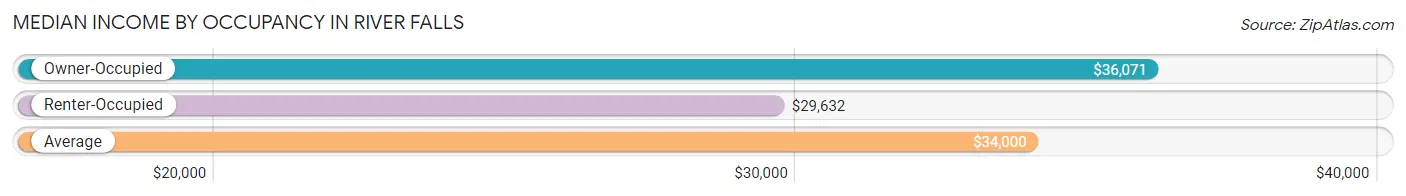
| Occupancy Type | # Households | Median Income |
| Owner-Occupied | 118 (62.1%) | $36,071 |
| Renter-Occupied | 72 (37.9%) | $29,632 |
| Average | 190 (100.0%) | $34,000 |
Occupancy by Householder Income Bracket in River Falls
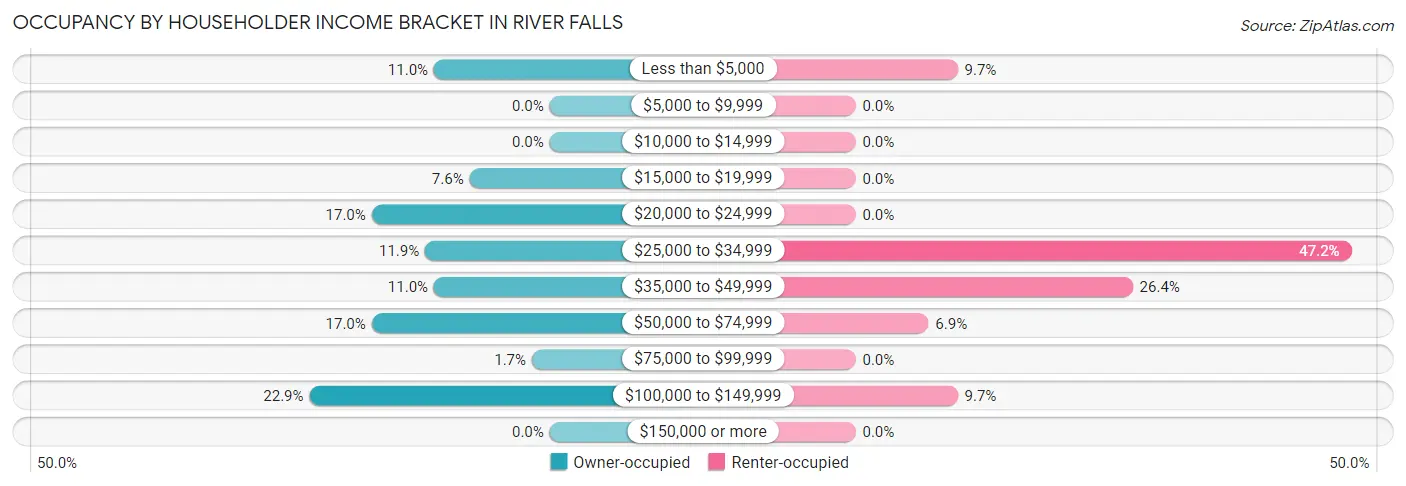
| Income Bracket | Owner-occupied | Renter-occupied |
| Less than $5,000 | 13 (11.0%) | 7 (9.7%) |
| $5,000 to $9,999 | 0 (0.0%) | 0 (0.0%) |
| $10,000 to $14,999 | 0 (0.0%) | 0 (0.0%) |
| $15,000 to $19,999 | 9 (7.6%) | 0 (0.0%) |
| $20,000 to $24,999 | 20 (17.0%) | 0 (0.0%) |
| $25,000 to $34,999 | 14 (11.9%) | 34 (47.2%) |
| $35,000 to $49,999 | 13 (11.0%) | 19 (26.4%) |
| $50,000 to $74,999 | 20 (17.0%) | 5 (6.9%) |
| $75,000 to $99,999 | 2 (1.7%) | 0 (0.0%) |
| $100,000 to $149,999 | 27 (22.9%) | 7 (9.7%) |
| $150,000 or more | 0 (0.0%) | 0 (0.0%) |
| Total | 118 (100.0%) | 72 (100.0%) |
Monthly Housing Cost Tiers in River Falls
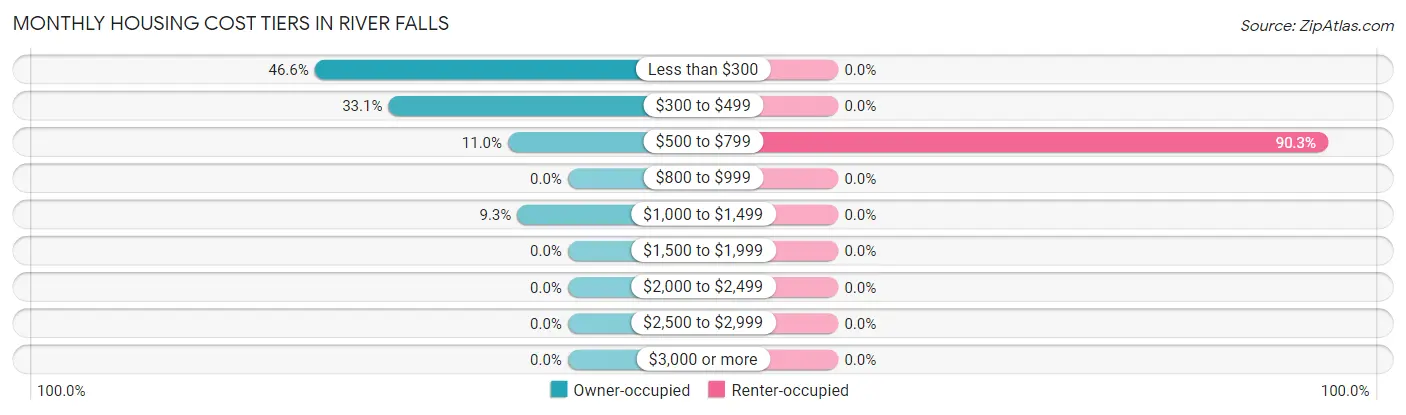
| Monthly Cost | Owner-occupied | Renter-occupied |
| Less than $300 | 55 (46.6%) | 0 (0.0%) |
| $300 to $499 | 39 (33.1%) | 0 (0.0%) |
| $500 to $799 | 13 (11.0%) | 65 (90.3%) |
| $800 to $999 | 0 (0.0%) | 0 (0.0%) |
| $1,000 to $1,499 | 11 (9.3%) | 0 (0.0%) |
| $1,500 to $1,999 | 0 (0.0%) | 0 (0.0%) |
| $2,000 to $2,499 | 0 (0.0%) | 0 (0.0%) |
| $2,500 to $2,999 | 0 (0.0%) | 0 (0.0%) |
| $3,000 or more | 0 (0.0%) | 0 (0.0%) |
| Total | 118 (100.0%) | 72 (100.0%) |
Physical Housing Characteristics in River Falls
Housing Structures in River Falls
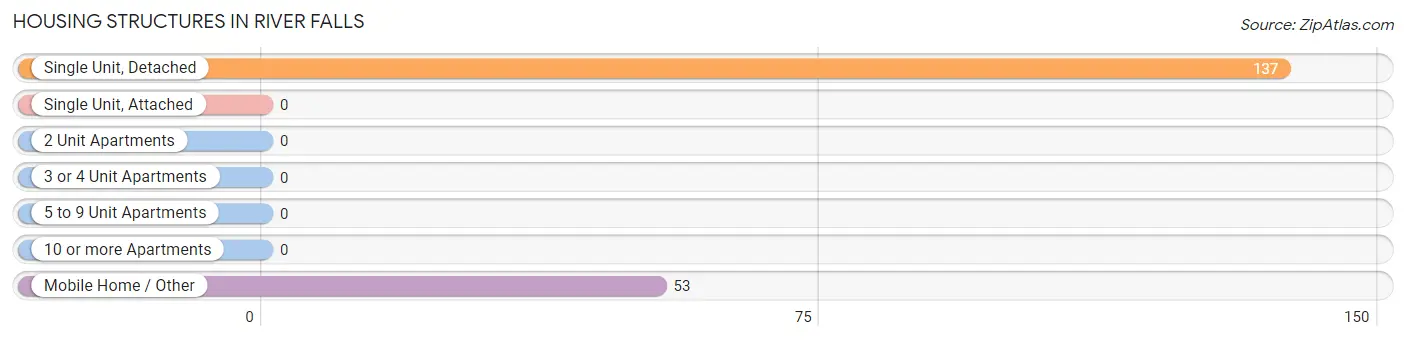
| Structure Type | # Housing Units | % Housing Units |
| Single Unit, Detached | 137 | 72.1% |
| Single Unit, Attached | 0 | 0.0% |
| 2 Unit Apartments | 0 | 0.0% |
| 3 or 4 Unit Apartments | 0 | 0.0% |
| 5 to 9 Unit Apartments | 0 | 0.0% |
| 10 or more Apartments | 0 | 0.0% |
| Mobile Home / Other | 53 | 27.9% |
| Total | 190 | 100.0% |
Housing Structures by Occupancy in River Falls
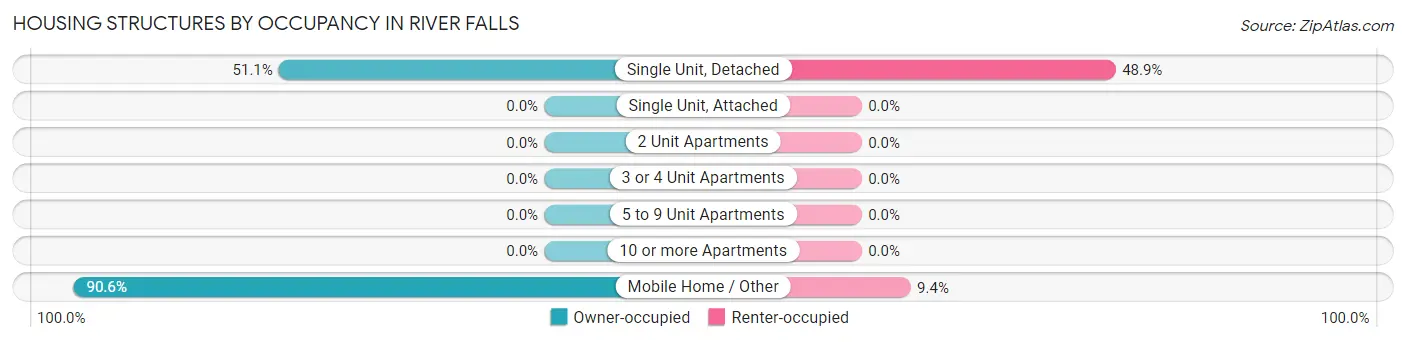
| Structure Type | Owner-occupied | Renter-occupied |
| Single Unit, Detached | 70 (51.1%) | 67 (48.9%) |
| Single Unit, Attached | 0 (0.0%) | 0 (0.0%) |
| 2 Unit Apartments | 0 (0.0%) | 0 (0.0%) |
| 3 or 4 Unit Apartments | 0 (0.0%) | 0 (0.0%) |
| 5 to 9 Unit Apartments | 0 (0.0%) | 0 (0.0%) |
| 10 or more Apartments | 0 (0.0%) | 0 (0.0%) |
| Mobile Home / Other | 48 (90.6%) | 5 (9.4%) |
| Total | 118 (62.1%) | 72 (37.9%) |
Housing Structures by Number of Rooms in River Falls
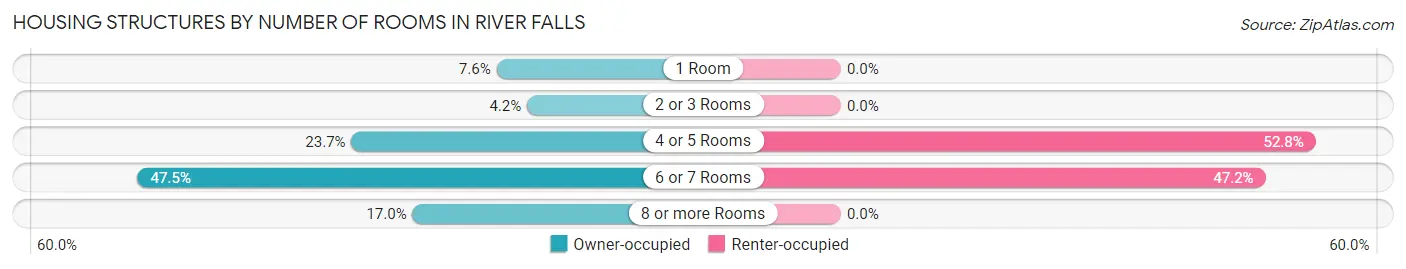
| Number of Rooms | Owner-occupied | Renter-occupied |
| 1 Room | 9 (7.6%) | 0 (0.0%) |
| 2 or 3 Rooms | 5 (4.2%) | 0 (0.0%) |
| 4 or 5 Rooms | 28 (23.7%) | 38 (52.8%) |
| 6 or 7 Rooms | 56 (47.5%) | 34 (47.2%) |
| 8 or more Rooms | 20 (17.0%) | 0 (0.0%) |
| Total | 118 (100.0%) | 72 (100.0%) |
Housing Structure by Heating Type in River Falls
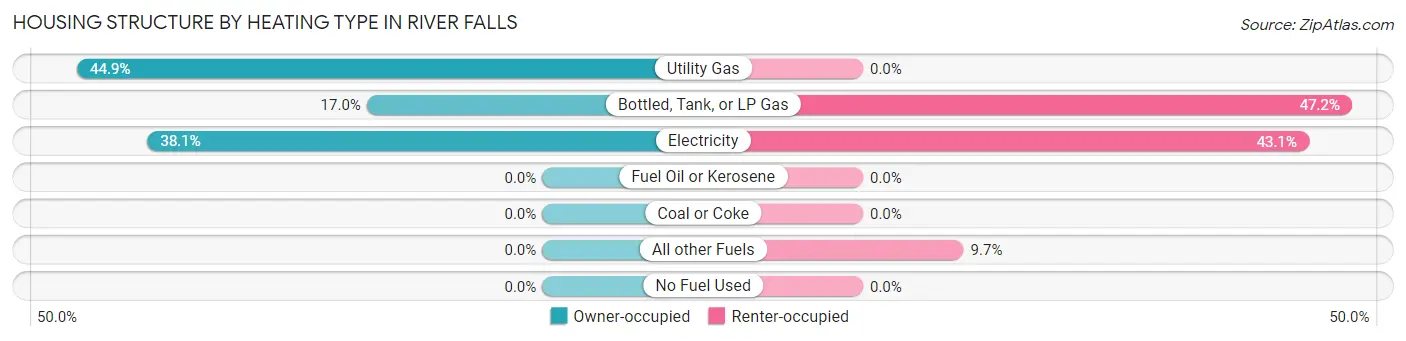
| Heating Type | Owner-occupied | Renter-occupied |
| Utility Gas | 53 (44.9%) | 0 (0.0%) |
| Bottled, Tank, or LP Gas | 20 (17.0%) | 34 (47.2%) |
| Electricity | 45 (38.1%) | 31 (43.1%) |
| Fuel Oil or Kerosene | 0 (0.0%) | 0 (0.0%) |
| Coal or Coke | 0 (0.0%) | 0 (0.0%) |
| All other Fuels | 0 (0.0%) | 7 (9.7%) |
| No Fuel Used | 0 (0.0%) | 0 (0.0%) |
| Total | 118 (100.0%) | 72 (100.0%) |
Household Vehicle Usage in River Falls
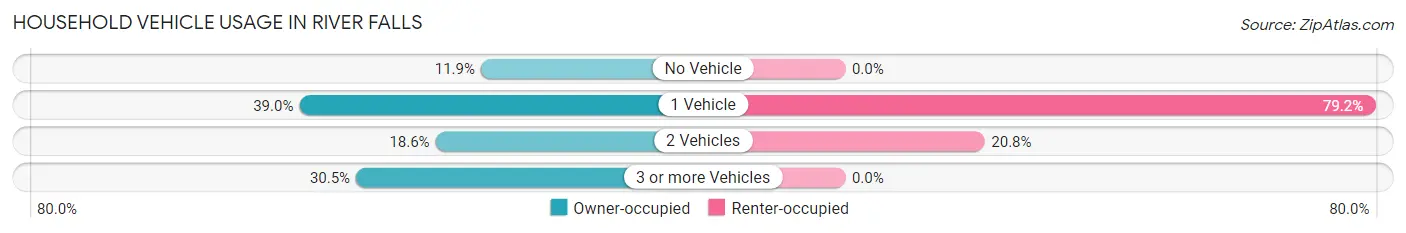
| Vehicles per Household | Owner-occupied | Renter-occupied |
| No Vehicle | 14 (11.9%) | 0 (0.0%) |
| 1 Vehicle | 46 (39.0%) | 57 (79.2%) |
| 2 Vehicles | 22 (18.6%) | 15 (20.8%) |
| 3 or more Vehicles | 36 (30.5%) | 0 (0.0%) |
| Total | 118 (100.0%) | 72 (100.0%) |
Real Estate & Mortgages in River Falls
Real Estate and Mortgage Overview in River Falls
| Characteristic | Without Mortgage | With Mortgage |
| Housing Units | 99 | 19 |
| Median Property Value | $84,400 | $106,300 |
| Median Household Income | $35,893 | $0 |
| Monthly Housing Costs | $273 | $0 |
| Real Estate Taxes | $247 | $3 |
Property Value by Mortgage Status in River Falls
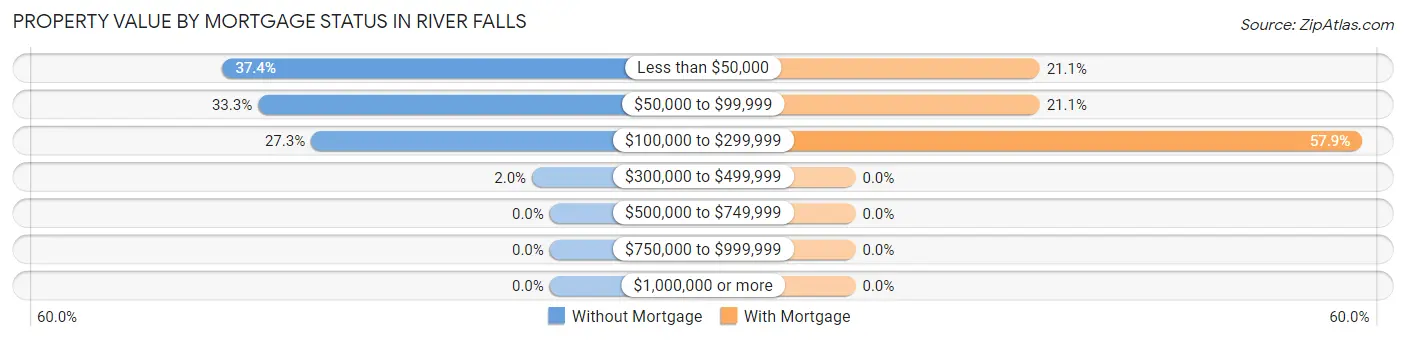
| Property Value | Without Mortgage | With Mortgage |
| Less than $50,000 | 37 (37.4%) | 4 (21.0%) |
| $50,000 to $99,999 | 33 (33.3%) | 4 (21.0%) |
| $100,000 to $299,999 | 27 (27.3%) | 11 (57.9%) |
| $300,000 to $499,999 | 2 (2.0%) | 0 (0.0%) |
| $500,000 to $749,999 | 0 (0.0%) | 0 (0.0%) |
| $750,000 to $999,999 | 0 (0.0%) | 0 (0.0%) |
| $1,000,000 or more | 0 (0.0%) | 0 (0.0%) |
| Total | 99 (100.0%) | 19 (100.0%) |
Household Income by Mortgage Status in River Falls
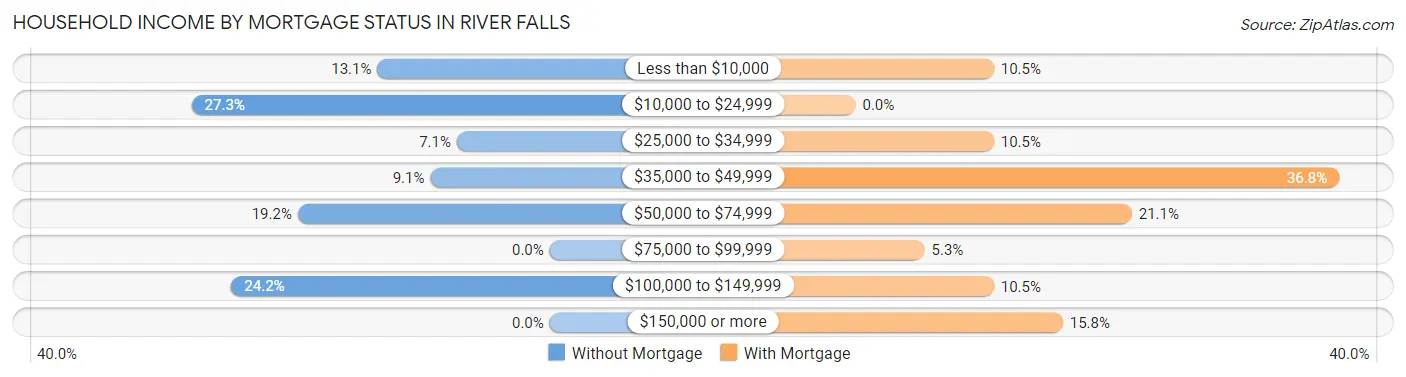
| Household Income | Without Mortgage | With Mortgage |
| Less than $10,000 | 13 (13.1%) | 2 (10.5%) |
| $10,000 to $24,999 | 27 (27.3%) | 0 (0.0%) |
| $25,000 to $34,999 | 7 (7.1%) | 2 (10.5%) |
| $35,000 to $49,999 | 9 (9.1%) | 7 (36.8%) |
| $50,000 to $74,999 | 19 (19.2%) | 4 (21.0%) |
| $75,000 to $99,999 | 0 (0.0%) | 1 (5.3%) |
| $100,000 to $149,999 | 24 (24.2%) | 2 (10.5%) |
| $150,000 or more | 0 (0.0%) | 3 (15.8%) |
| Total | 99 (100.0%) | 19 (100.0%) |
Property Value to Household Income Ratio in River Falls
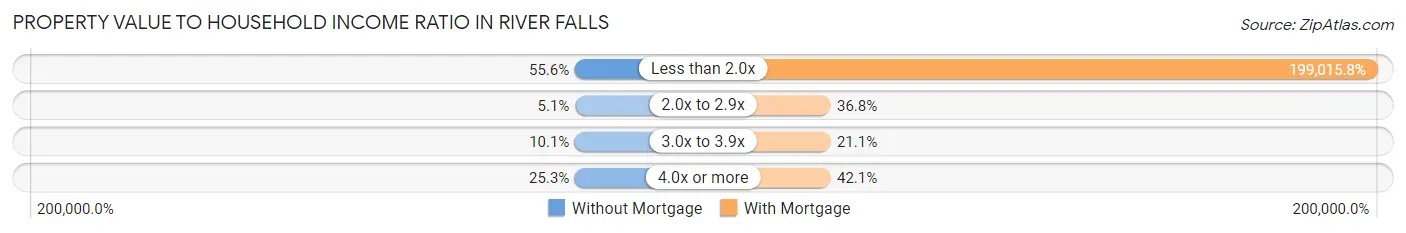
| Value-to-Income Ratio | Without Mortgage | With Mortgage |
| Less than 2.0x | 55 (55.6%) | 37,813 (199,015.8%) |
| 2.0x to 2.9x | 5 (5.1%) | 7 (36.8%) |
| 3.0x to 3.9x | 10 (10.1%) | 4 (21.0%) |
| 4.0x or more | 25 (25.3%) | 8 (42.1%) |
| Total | 99 (100.0%) | 19 (100.0%) |
Real Estate Taxes by Mortgage Status in River Falls
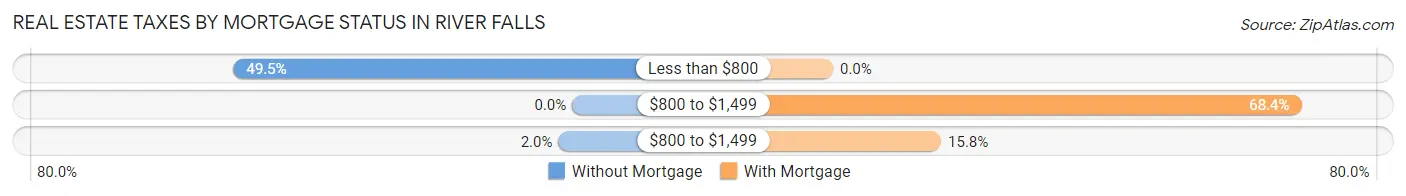
| Property Taxes | Without Mortgage | With Mortgage |
| Less than $800 | 49 (49.5%) | 0 (0.0%) |
| $800 to $1,499 | 0 (0.0%) | 13 (68.4%) |
| $800 to $1,499 | 2 (2.0%) | 3 (15.8%) |
| Total | 99 (100.0%) | 19 (100.0%) |
Health & Disability in River Falls
Health Insurance Coverage by Age in River Falls
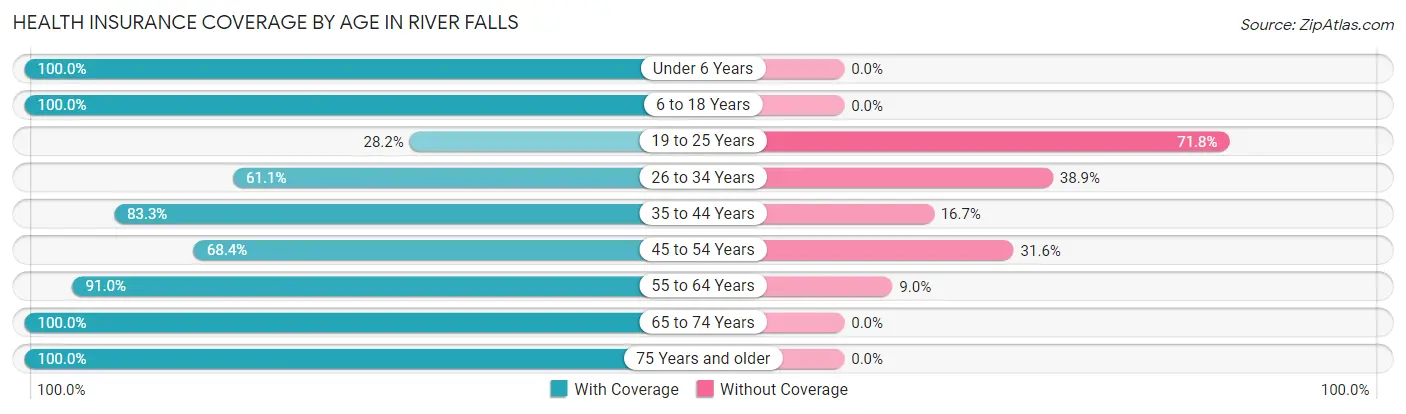
| Age Bracket | With Coverage | Without Coverage |
| Under 6 Years | 28 (100.0%) | 0 (0.0%) |
| 6 to 18 Years | 56 (100.0%) | 0 (0.0%) |
| 19 to 25 Years | 11 (28.2%) | 28 (71.8%) |
| 26 to 34 Years | 11 (61.1%) | 7 (38.9%) |
| 35 to 44 Years | 115 (83.3%) | 23 (16.7%) |
| 45 to 54 Years | 39 (68.4%) | 18 (31.6%) |
| 55 to 64 Years | 71 (91.0%) | 7 (9.0%) |
| 65 to 74 Years | 33 (100.0%) | 0 (0.0%) |
| 75 Years and older | 53 (100.0%) | 0 (0.0%) |
| Total | 417 (83.4%) | 83 (16.6%) |
Health Insurance Coverage by Citizenship Status in River Falls
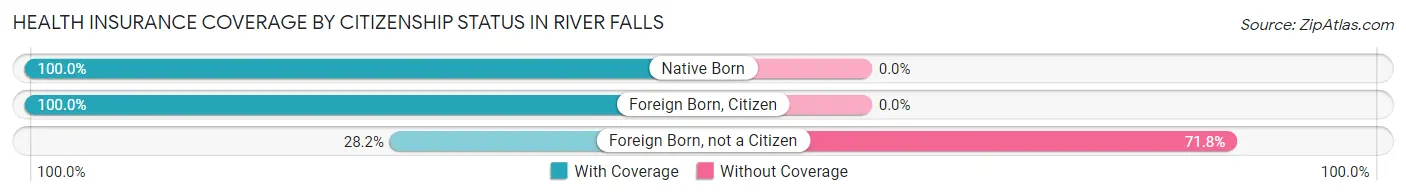
| Citizenship Status | With Coverage | Without Coverage |
| Native Born | 28 (100.0%) | 0 (0.0%) |
| Foreign Born, Citizen | 56 (100.0%) | 0 (0.0%) |
| Foreign Born, not a Citizen | 11 (28.2%) | 28 (71.8%) |
Health Insurance Coverage by Household Income in River Falls
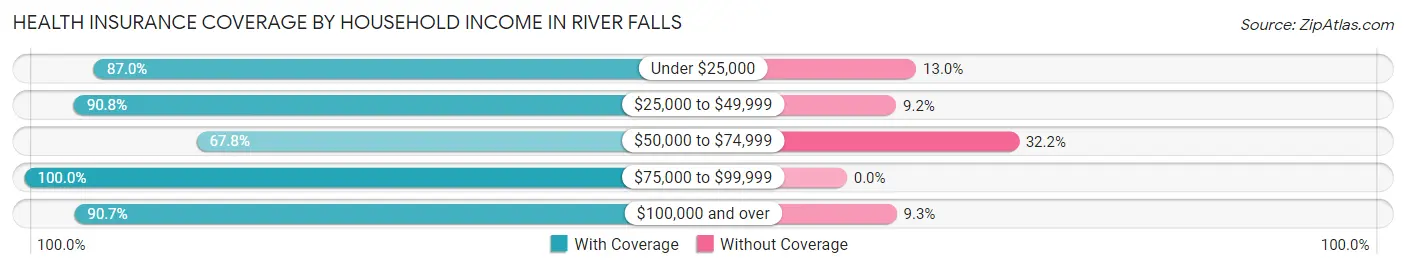
| Household Income | With Coverage | Without Coverage |
| Under $25,000 | 67 (87.0%) | 10 (13.0%) |
| $25,000 to $49,999 | 177 (90.8%) | 18 (9.2%) |
| $50,000 to $74,999 | 101 (67.8%) | 48 (32.2%) |
| $75,000 to $99,999 | 4 (100.0%) | 0 (0.0%) |
| $100,000 and over | 68 (90.7%) | 7 (9.3%) |
Public vs Private Health Insurance Coverage by Age in River Falls
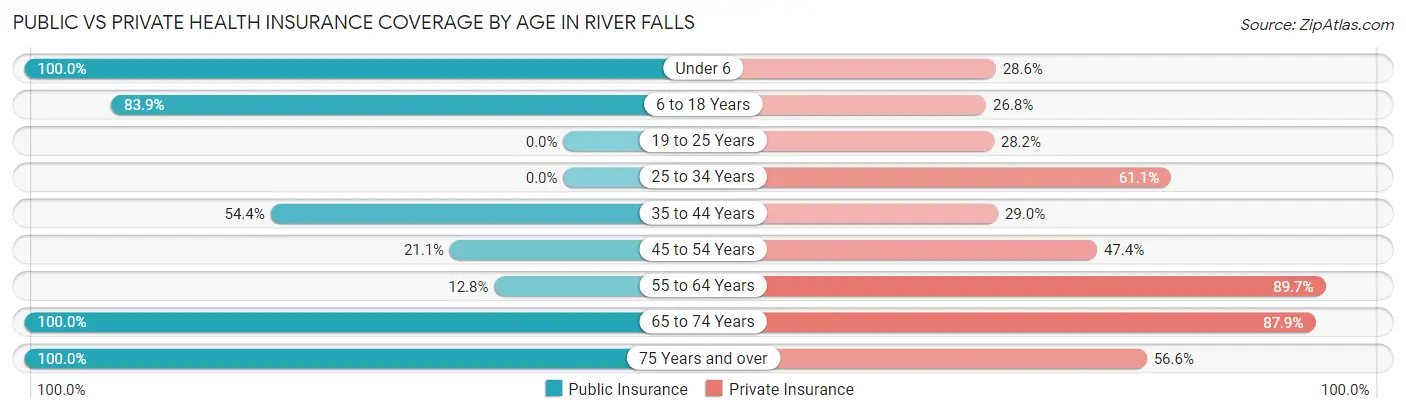
| Age Bracket | Public Insurance | Private Insurance |
| Under 6 | 28 (100.0%) | 8 (28.6%) |
| 6 to 18 Years | 47 (83.9%) | 15 (26.8%) |
| 19 to 25 Years | 0 (0.0%) | 11 (28.2%) |
| 25 to 34 Years | 0 (0.0%) | 11 (61.1%) |
| 35 to 44 Years | 75 (54.3%) | 40 (29.0%) |
| 45 to 54 Years | 12 (21.0%) | 27 (47.4%) |
| 55 to 64 Years | 10 (12.8%) | 70 (89.7%) |
| 65 to 74 Years | 33 (100.0%) | 29 (87.9%) |
| 75 Years and over | 53 (100.0%) | 30 (56.6%) |
| Total | 258 (51.6%) | 241 (48.2%) |
Disability Status by Sex by Age in River Falls
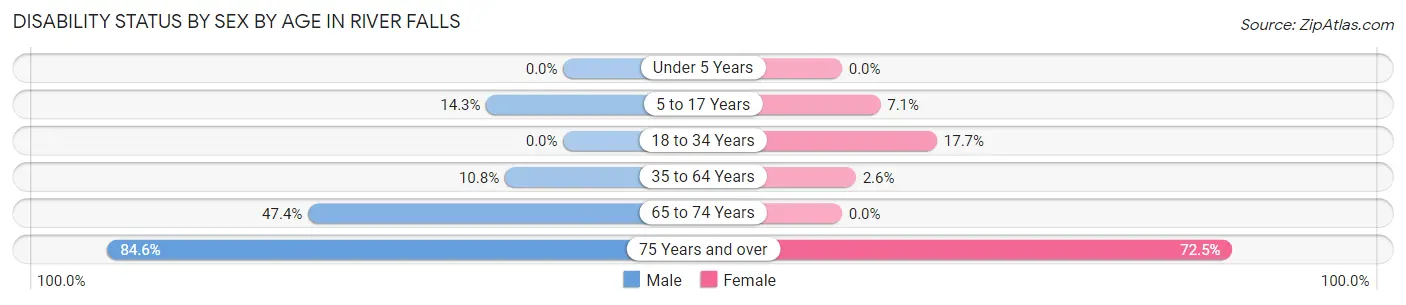
| Age Bracket | Male | Female |
| Under 5 Years | 0 (0.0%) | 0 (0.0%) |
| 5 to 17 Years | 4 (14.3%) | 2 (7.1%) |
| 18 to 34 Years | 0 (0.0%) | 6 (17.6%) |
| 35 to 64 Years | 17 (10.8%) | 3 (2.6%) |
| 65 to 74 Years | 9 (47.4%) | 0 (0.0%) |
| 75 Years and over | 11 (84.6%) | 29 (72.5%) |
Disability Class by Sex by Age in River Falls
Disability Class: Hearing Difficulty
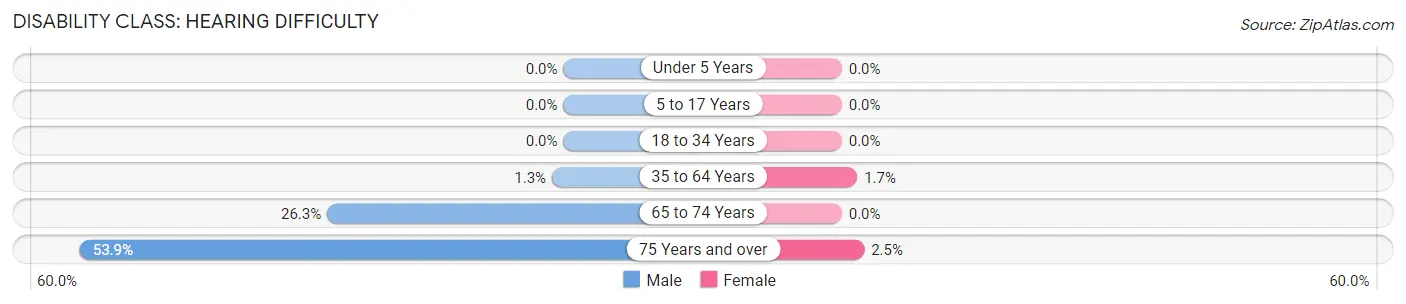
| Age Bracket | Male | Female |
| Under 5 Years | 0 (0.0%) | 0 (0.0%) |
| 5 to 17 Years | 0 (0.0%) | 0 (0.0%) |
| 18 to 34 Years | 0 (0.0%) | 0 (0.0%) |
| 35 to 64 Years | 2 (1.3%) | 2 (1.7%) |
| 65 to 74 Years | 5 (26.3%) | 0 (0.0%) |
| 75 Years and over | 7 (53.8%) | 1 (2.5%) |
Disability Class: Vision Difficulty
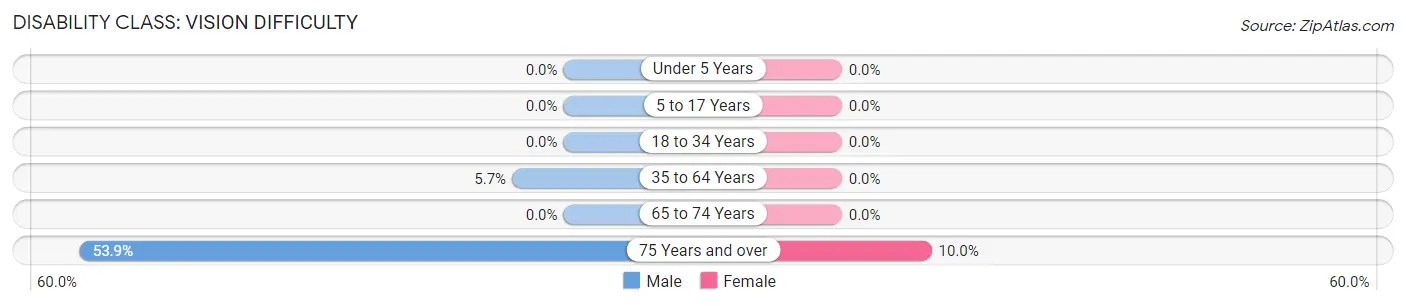
| Age Bracket | Male | Female |
| Under 5 Years | 0 (0.0%) | 0 (0.0%) |
| 5 to 17 Years | 0 (0.0%) | 0 (0.0%) |
| 18 to 34 Years | 0 (0.0%) | 0 (0.0%) |
| 35 to 64 Years | 9 (5.7%) | 0 (0.0%) |
| 65 to 74 Years | 0 (0.0%) | 0 (0.0%) |
| 75 Years and over | 7 (53.8%) | 4 (10.0%) |
Disability Class: Cognitive Difficulty
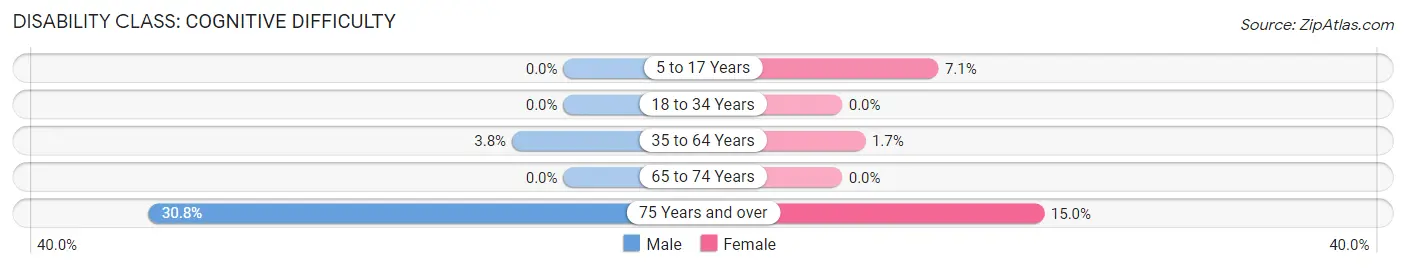
| Age Bracket | Male | Female |
| 5 to 17 Years | 0 (0.0%) | 2 (7.1%) |
| 18 to 34 Years | 0 (0.0%) | 0 (0.0%) |
| 35 to 64 Years | 6 (3.8%) | 2 (1.7%) |
| 65 to 74 Years | 0 (0.0%) | 0 (0.0%) |
| 75 Years and over | 4 (30.8%) | 6 (15.0%) |
Disability Class: Ambulatory Difficulty
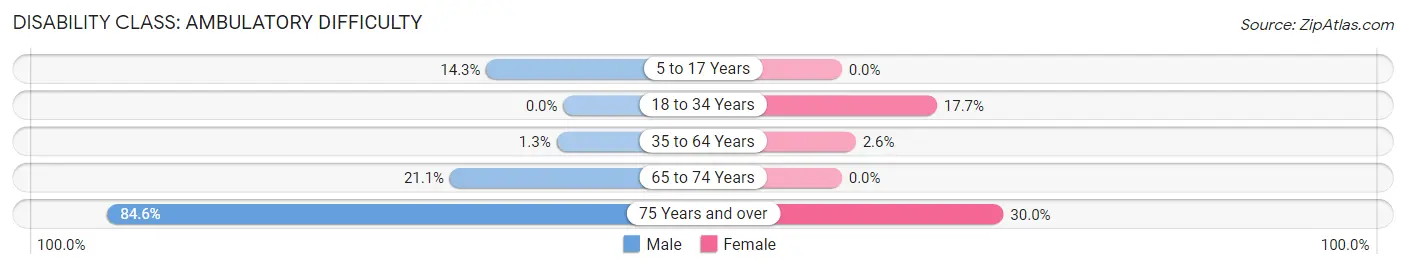
| Age Bracket | Male | Female |
| 5 to 17 Years | 4 (14.3%) | 0 (0.0%) |
| 18 to 34 Years | 0 (0.0%) | 6 (17.6%) |
| 35 to 64 Years | 2 (1.3%) | 3 (2.6%) |
| 65 to 74 Years | 4 (21.0%) | 0 (0.0%) |
| 75 Years and over | 11 (84.6%) | 12 (30.0%) |
Disability Class: Self-Care Difficulty
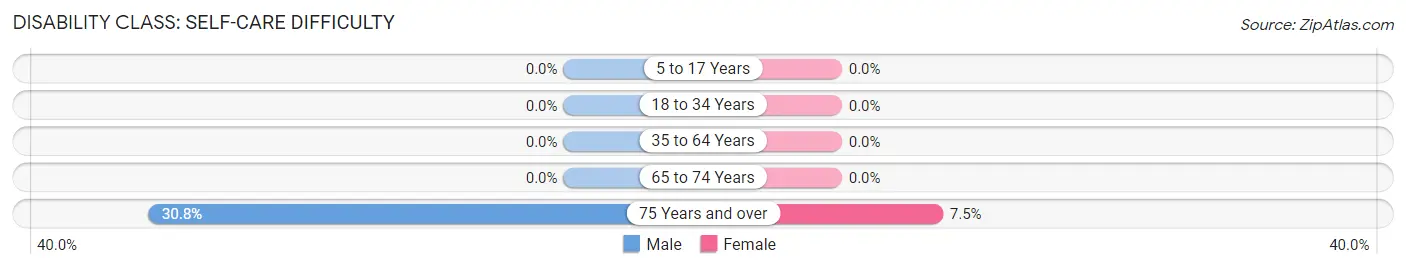
| Age Bracket | Male | Female |
| 5 to 17 Years | 0 (0.0%) | 0 (0.0%) |
| 18 to 34 Years | 0 (0.0%) | 0 (0.0%) |
| 35 to 64 Years | 0 (0.0%) | 0 (0.0%) |
| 65 to 74 Years | 0 (0.0%) | 0 (0.0%) |
| 75 Years and over | 4 (30.8%) | 3 (7.5%) |
Technology Access in River Falls
Computing Device Access in River Falls
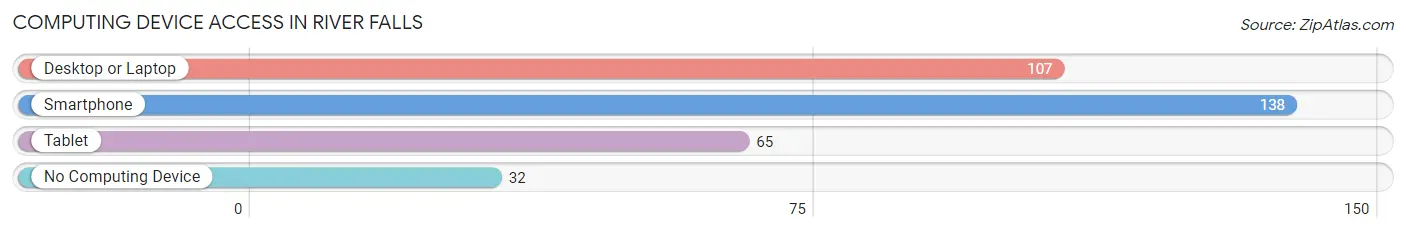
| Device Type | # Households | % Households |
| Desktop or Laptop | 107 | 56.3% |
| Smartphone | 138 | 72.6% |
| Tablet | 65 | 34.2% |
| No Computing Device | 32 | 16.8% |
| Total | 190 | 100.0% |
Internet Access in River Falls
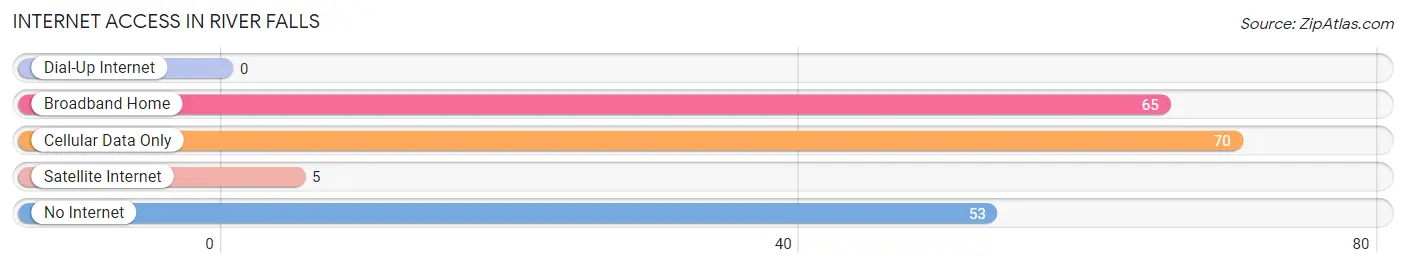
| Internet Type | # Households | % Households |
| Dial-Up Internet | 0 | 0.0% |
| Broadband Home | 65 | 34.2% |
| Cellular Data Only | 70 | 36.8% |
| Satellite Internet | 5 | 2.6% |
| No Internet | 53 | 27.9% |
| Total | 190 | 100.0% |
River Falls Summary
River Falls is a small town located in the state of Alabama, in the United States. It is situated in the northwest corner of the state, in the foothills of the Appalachian Mountains. The town is located in the county of Jackson, and is part of the Huntsville-Decatur Combined Statistical Area. The population of River Falls was estimated to be 1,845 in 2019.
History
The area that is now River Falls was first settled in the early 1800s by settlers from North Carolina and Virginia. The town was originally known as “Falls of the River”, and was later shortened to “River Falls”. The town was officially incorporated in 1887.
River Falls was a small farming community until the early 1900s, when the town began to grow and develop. The town was home to several small businesses, including a sawmill, a gristmill, and a cotton gin. The town also had a post office, a bank, and a hotel.
In the early 1900s, the town began to experience a period of growth and prosperity. The town was home to several churches, a school, and a library. The town also had a movie theater, a bowling alley, and a golf course.
Geography
River Falls is located in the northwest corner of Alabama, in the foothills of the Appalachian Mountains. The town is situated in the county of Jackson, and is part of the Huntsville-Decatur Combined Statistical Area. The town is located at the intersection of US Highway 72 and Alabama State Route 35.
The town is situated on the banks of the Flint River, which flows through the town. The town is surrounded by rolling hills and forests, and is located near the Tennessee River. The town is located approximately 30 miles from Huntsville, and approximately 60 miles from Birmingham.
Economy
The economy of River Falls is largely based on agriculture and tourism. The town is home to several small businesses, including a sawmill, a gristmill, and a cotton gin. The town also has a post office, a bank, and a hotel.
The town is also home to several tourist attractions, including the River Falls Golf Course, the River Falls Museum, and the River Falls Nature Center. The town is also home to several festivals, including the River Falls Festival of the Arts and the River Falls Music Festival.
Demographics
As of 2019, the population of River Falls was estimated to be 1,845. The town has a population that is predominantly white (94.2%), with a small percentage of African Americans (3.2%) and Hispanics (2.6%). The median household income in the town is $41,944, and the median home value is $117,400. The town has a poverty rate of 16.2%.
Conclusion
River Falls is a small town located in the northwest corner of Alabama, in the foothills of the Appalachian Mountains. The town has a population of 1,845, and is predominantly white. The town’s economy is largely based on agriculture and tourism, and the town is home to several small businesses, tourist attractions, and festivals.
Common Questions
What is Per Capita Income in River Falls?
Per Capita income in River Falls is $23,150.
What is the Median Family Income in River Falls?
Median Family Income in River Falls is $46,875.
What is the Median Household income in River Falls?
Median Household Income in River Falls is $34,000.
What is Income or Wage Gap in River Falls?
Income or Wage Gap in River Falls is 18.0%.
Women in River Falls earn 82.0 cents for every dollar earned by a man.
What is Family Income Deficit in River Falls?
Family Income Deficit in River Falls is $17,571.
Families that are below poverty line in River Falls earn $17,571 less on average than the poverty threshold level.
What is Inequality or Gini Index in River Falls?
Inequality or Gini Index in River Falls is 0.43.
What is the Total Population of River Falls?
Total Population of River Falls is 500.
What is the Total Male Population of River Falls?
Total Male Population of River Falls is 260.
What is the Total Female Population of River Falls?
Total Female Population of River Falls is 240.
What is the Ratio of Males per 100 Females in River Falls?
There are 108.33 Males per 100 Females in River Falls.
What is the Ratio of Females per 100 Males in River Falls?
There are 92.31 Females per 100 Males in River Falls.
What is the Median Population Age in River Falls?
Median Population Age in River Falls is 41.5 Years.
What is the Average Family Size in River Falls
Average Family Size in River Falls is 4.0 People.
What is the Average Household Size in River Falls
Average Household Size in River Falls is 2.6 People.
How Large is the Labor Force in River Falls?
There are 210 People in the Labor Forcein in River Falls.
What is the Percentage of People in the Labor Force in River Falls?
50.5% of People are in the Labor Force in River Falls.
What is the Unemployment Rate in River Falls?
Unemployment Rate in River Falls is 31.0%.