Red Level, AL Map & Demographics
Red Level Map
Red Level Overview
$22,312
PER CAPITA INCOME
$68,750
AVG FAMILY INCOME
$41,875
AVG HOUSEHOLD INCOME
0.48
INEQUALITY / GINI INDEX
476
TOTAL POPULATION
235
MALE POPULATION
241
FEMALE POPULATION
97.51
MALES / 100 FEMALES
102.55
FEMALES / 100 MALES
36.3
MEDIAN AGE
4.1
AVG FAMILY SIZE
3.0
AVG HOUSEHOLD SIZE
263
LABOR FORCE [ PEOPLE ]
69.0%
PERCENT IN LABOR FORCE
16.3%
UNEMPLOYMENT RATE
Red Level Zip Codes
Red Level Area Codes
Income in Red Level
Income Overview in Red Level
Per Capita Income in Red Level is $22,312, while median incomes of families and households are $68,750 and $41,875 respectively.
| Characteristic | Number | Measure |
| Per Capita Income | 476 | $22,312 |
| Median Family Income | 100 | $68,750 |
| Mean Family Income | 100 | $80,681 |
| Median Household Income | 159 | $41,875 |
| Mean Household Income | 159 | $61,891 |
| Income Deficit | 100 | $0 |
| Wage / Income Gap (%) | 476 | 0.00% |
| Wage / Income Gap ($) | 476 | 100.00¢ per $1 |
| Gini / Inequality Index | 476 | 0.48 |
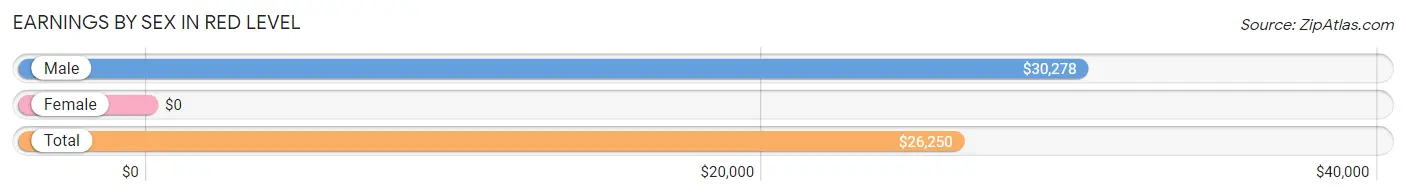
Earnings by Sex in Red Level
| Sex | Number | Average Earnings |
| Male | 134 (58.3%) | $30,278 |
| Female | 96 (41.7%) | $0 |
| Total | 230 (100.0%) | $26,250 |
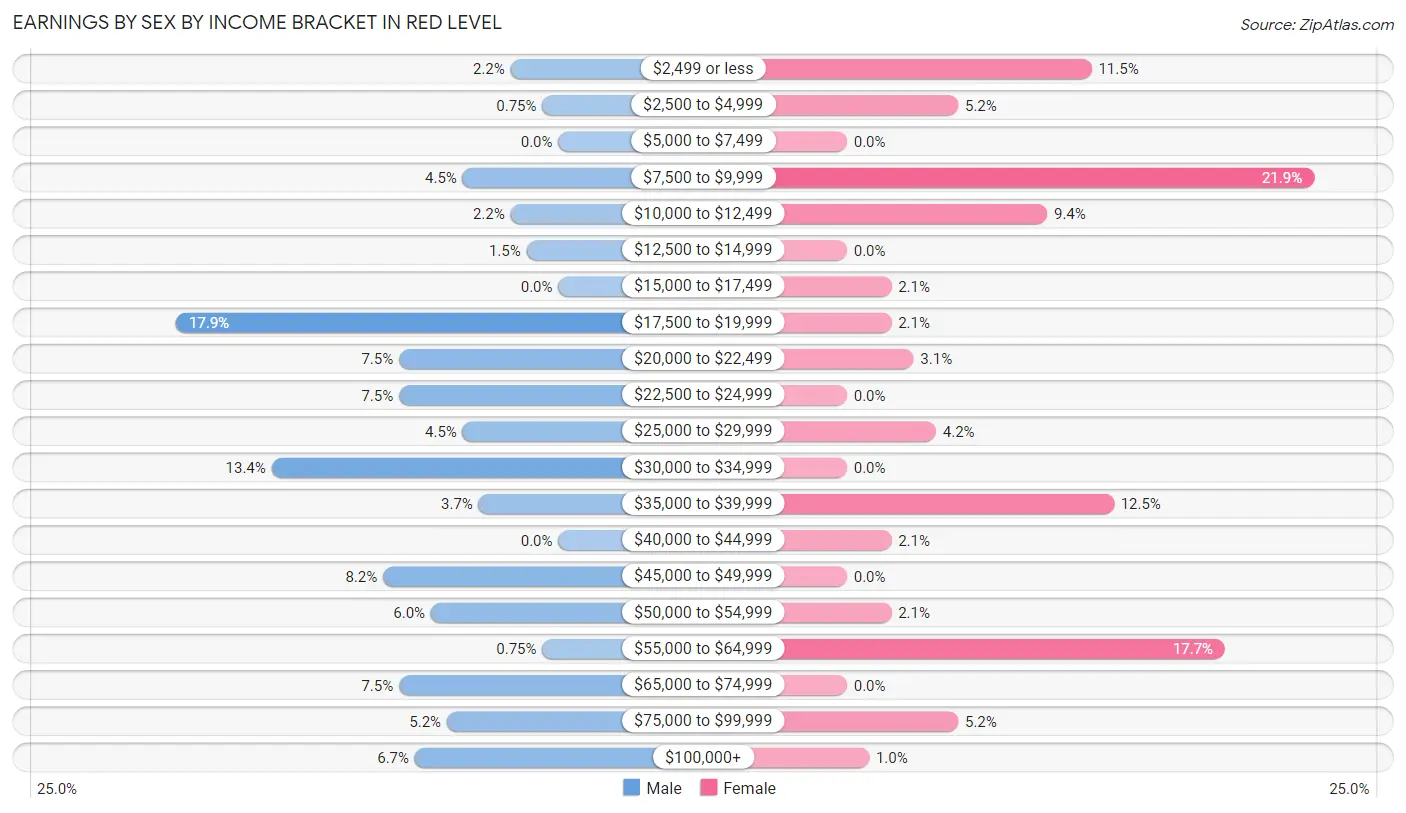
Earnings by Sex by Income Bracket in Red Level
The most common earnings brackets in Red Level are $17,500 to $19,999 for men (24 | 17.9%) and $7,500 to $9,999 for women (21 | 21.9%).
| Income | Male | Female |
| $2,499 or less | 3 (2.2%) | 11 (11.5%) |
| $2,500 to $4,999 | 1 (0.7%) | 5 (5.2%) |
| $5,000 to $7,499 | 0 (0.0%) | 0 (0.0%) |
| $7,500 to $9,999 | 6 (4.5%) | 21 (21.9%) |
| $10,000 to $12,499 | 3 (2.2%) | 9 (9.4%) |
| $12,500 to $14,999 | 2 (1.5%) | 0 (0.0%) |
| $15,000 to $17,499 | 0 (0.0%) | 2 (2.1%) |
| $17,500 to $19,999 | 24 (17.9%) | 2 (2.1%) |
| $20,000 to $22,499 | 10 (7.5%) | 3 (3.1%) |
| $22,500 to $24,999 | 10 (7.5%) | 0 (0.0%) |
| $25,000 to $29,999 | 6 (4.5%) | 4 (4.2%) |
| $30,000 to $34,999 | 18 (13.4%) | 0 (0.0%) |
| $35,000 to $39,999 | 5 (3.7%) | 12 (12.5%) |
| $40,000 to $44,999 | 0 (0.0%) | 2 (2.1%) |
| $45,000 to $49,999 | 11 (8.2%) | 0 (0.0%) |
| $50,000 to $54,999 | 8 (6.0%) | 2 (2.1%) |
| $55,000 to $64,999 | 1 (0.7%) | 17 (17.7%) |
| $65,000 to $74,999 | 10 (7.5%) | 0 (0.0%) |
| $75,000 to $99,999 | 7 (5.2%) | 5 (5.2%) |
| $100,000+ | 9 (6.7%) | 1 (1.0%) |
| Total | 134 (100.0%) | 96 (100.0%) |
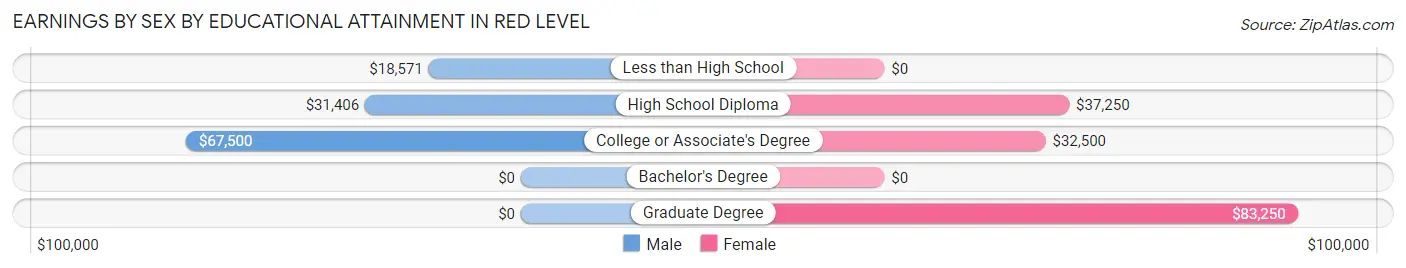
Earnings by Sex by Educational Attainment in Red Level
Average earnings in Red Level are $31,736 for men and $38,958 for women, a difference of 18.5%. Men with an educational attainment of college or associate's degree enjoy the highest average annual earnings of $67,500, while those with less than high school education earn the least with $18,571. Women with an educational attainment of graduate degree earn the most with the average annual earnings of $83,250, while those with college or associate's degree education have the smallest earnings of $32,500.
| Educational Attainment | Male Income | Female Income |
| Less than High School | $18,571 | $0 |
| High School Diploma | $31,406 | $37,250 |
| College or Associate's Degree | $67,500 | $32,500 |
| Bachelor's Degree | - | - |
| Graduate Degree | - | - |
| Total | $31,736 | $38,958 |
Family Income in Red Level
Family Income Brackets in Red Level
According to the Red Level family income data, there are 18 families falling into the $100,000 to $149,999 income range, which is the most common income bracket and makes up 18.0% of all families. Conversely, the $15,000 to $24,999 income bracket is the least frequent group with only 6 families (6.0%) belonging to this category.
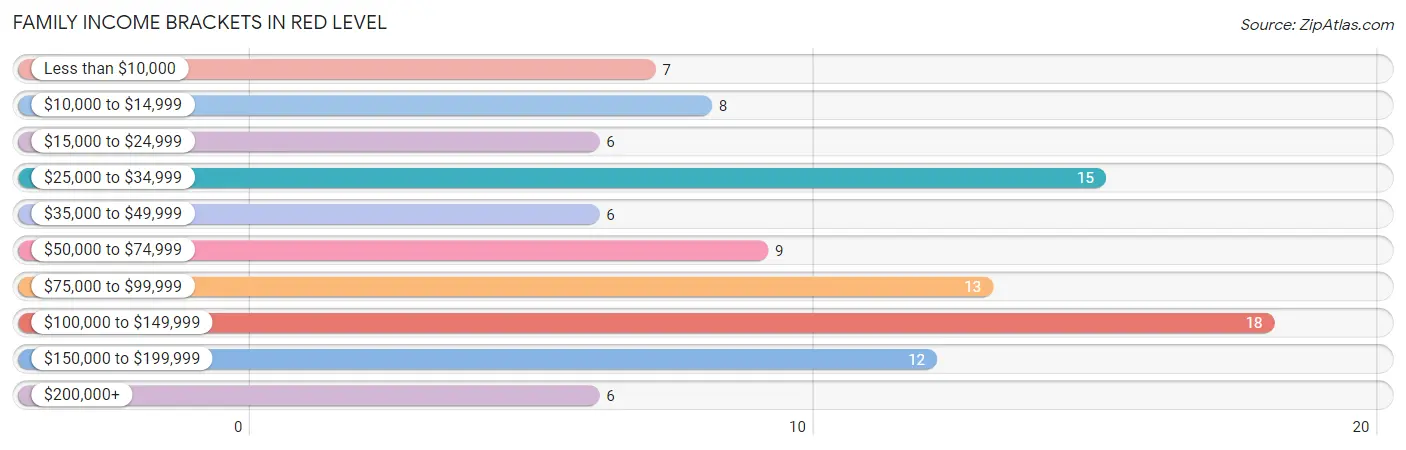
| Income Bracket | # Families | % Families |
| Less than $10,000 | 7 | 7.0% |
| $10,000 to $14,999 | 8 | 8.0% |
| $15,000 to $24,999 | 6 | 6.0% |
| $25,000 to $34,999 | 15 | 15.0% |
| $35,000 to $49,999 | 6 | 6.0% |
| $50,000 to $74,999 | 9 | 9.0% |
| $75,000 to $99,999 | 13 | 13.0% |
| $100,000 to $149,999 | 18 | 18.0% |
| $150,000 to $199,999 | 12 | 12.0% |
| $200,000+ | 6 | 6.0% |
Family Income by Famaliy Size in Red Level
3-person families (31 | 31.0%) account for the highest median family income in Red Level with $165,125 per family, while 3-person families (31 | 31.0%) have the highest median income of $55,042 per family member.
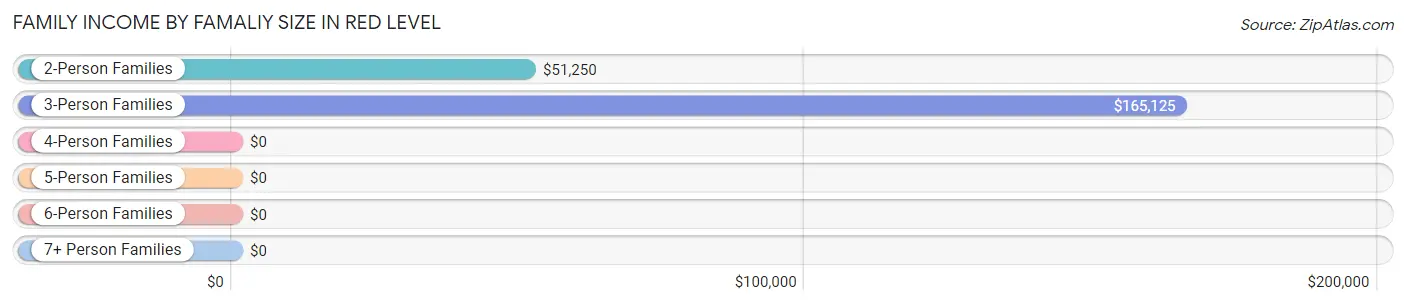
| Income Bracket | # Families | Median Income |
| 2-Person Families | 32 (32.0%) | $51,250 |
| 3-Person Families | 31 (31.0%) | $165,125 |
| 4-Person Families | 27 (27.0%) | $0 |
| 5-Person Families | 2 (2.0%) | $0 |
| 6-Person Families | 0 (0.0%) | $0 |
| 7+ Person Families | 8 (8.0%) | $0 |
| Total | 100 (100.0%) | $68,750 |
Family Income by Number of Earners in Red Level
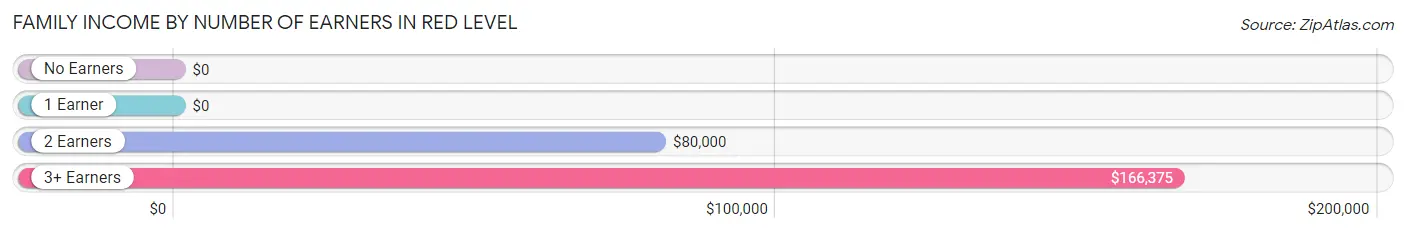
| Number of Earners | # Families | Median Income |
| No Earners | 13 (13.0%) | $0 |
| 1 Earner | 32 (32.0%) | $0 |
| 2 Earners | 34 (34.0%) | $80,000 |
| 3+ Earners | 21 (21.0%) | $166,375 |
| Total | 100 (100.0%) | $68,750 |
Household Income in Red Level
Household Income Brackets in Red Level
With 26 households falling in the category, the $50,000 to $74,999 income range is the most frequent in Red Level, accounting for 16.4% of all households. In contrast, only 6 households (3.8%) fall into the $200,000+ income bracket, making it the least populous group.
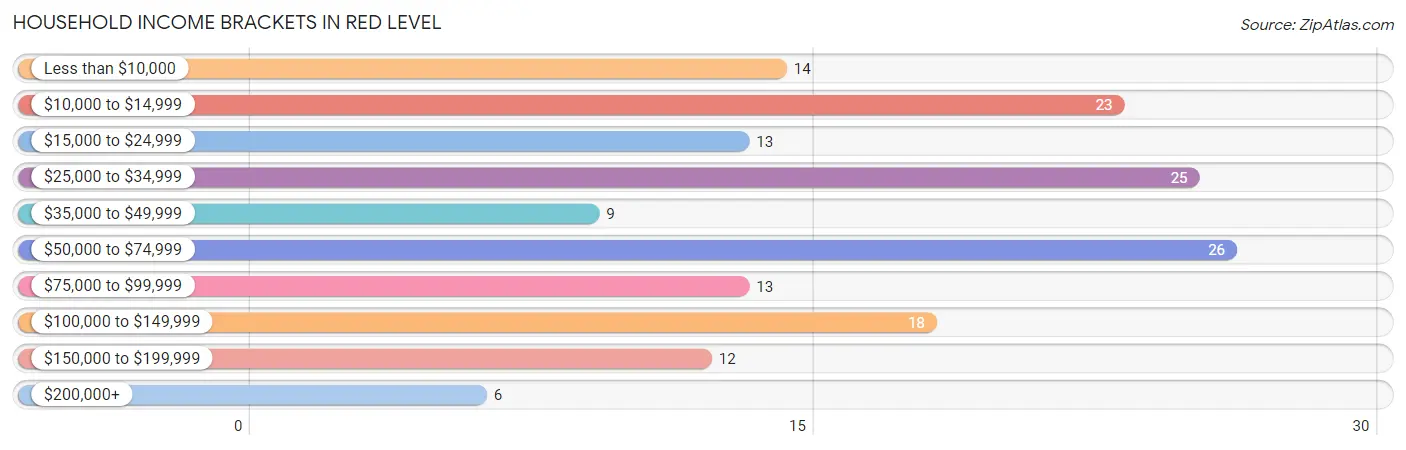
| Income Bracket | # Households | % Households |
| Less than $10,000 | 14 | 8.8% |
| $10,000 to $14,999 | 23 | 14.5% |
| $15,000 to $24,999 | 13 | 8.2% |
| $25,000 to $34,999 | 25 | 15.7% |
| $35,000 to $49,999 | 9 | 5.7% |
| $50,000 to $74,999 | 26 | 16.4% |
| $75,000 to $99,999 | 13 | 8.2% |
| $100,000 to $149,999 | 18 | 11.3% |
| $150,000 to $199,999 | 12 | 7.5% |
| $200,000+ | 6 | 3.8% |
Household Income by Householder Age in Red Level
The median household income in Red Level is $41,875, with the highest median household income of $50,625 found in the 45 to 64 years age bracket for the primary householder. A total of 78 households (49.1%) fall into this category. Meanwhile, the 15 to 24 years age bracket for the primary householder has the lowest median household income of $0, with 5 households (3.1%) in this group.
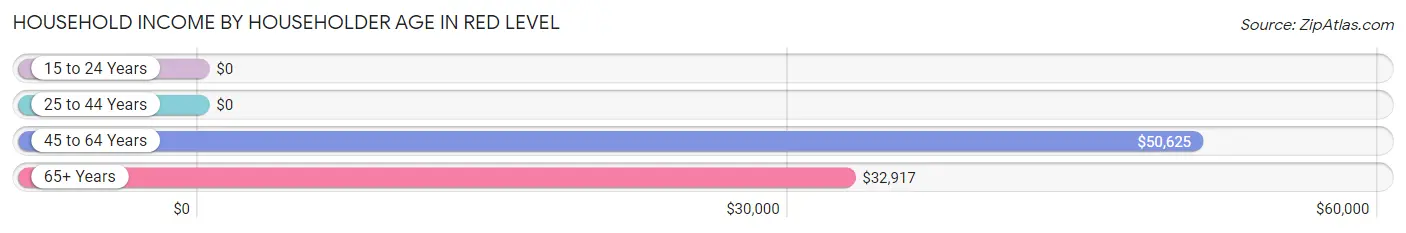
| Income Bracket | # Households | Median Income |
| 15 to 24 Years | 5 (3.1%) | $0 |
| 25 to 44 Years | 49 (30.8%) | $0 |
| 45 to 64 Years | 78 (49.1%) | $50,625 |
| 65+ Years | 27 (17.0%) | $32,917 |
| Total | 159 (100.0%) | $41,875 |
Poverty in Red Level
Income Below Poverty by Sex and Age in Red Level
With 31.9% poverty level for males and 27.8% for females among the residents of Red Level, 12 to 14 year old males and 12 to 14 year old females are the most vulnerable to poverty, with 8 males (100.0%) and 9 females (81.8%) in their respective age groups living below the poverty level.
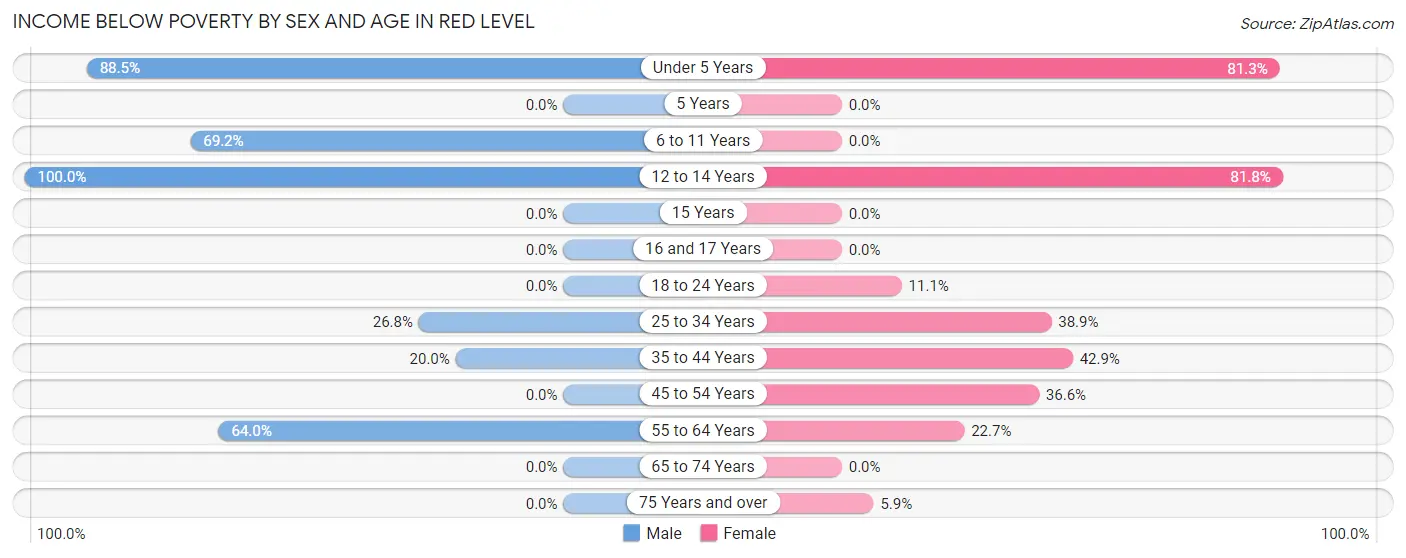
| Age Bracket | Male | Female |
| Under 5 Years | 23 (88.5%) | 13 (81.2%) |
| 5 Years | 0 (0.0%) | 0 (0.0%) |
| 6 to 11 Years | 9 (69.2%) | 0 (0.0%) |
| 12 to 14 Years | 8 (100.0%) | 9 (81.8%) |
| 15 Years | 0 (0.0%) | 0 (0.0%) |
| 16 and 17 Years | 0 (0.0%) | 0 (0.0%) |
| 18 to 24 Years | 0 (0.0%) | 5 (11.1%) |
| 25 to 34 Years | 11 (26.8%) | 7 (38.9%) |
| 35 to 44 Years | 8 (20.0%) | 12 (42.9%) |
| 45 to 54 Years | 0 (0.0%) | 15 (36.6%) |
| 55 to 64 Years | 16 (64.0%) | 5 (22.7%) |
| 65 to 74 Years | 0 (0.0%) | 0 (0.0%) |
| 75 Years and over | 0 (0.0%) | 1 (5.9%) |
| Total | 75 (31.9%) | 67 (27.8%) |
Income Above Poverty by Sex and Age in Red Level
According to the poverty statistics in Red Level, males aged 18 to 24 years and females aged 5 years are the age groups that are most secure financially, with 100.0% of males and 100.0% of females in these age groups living above the poverty line.
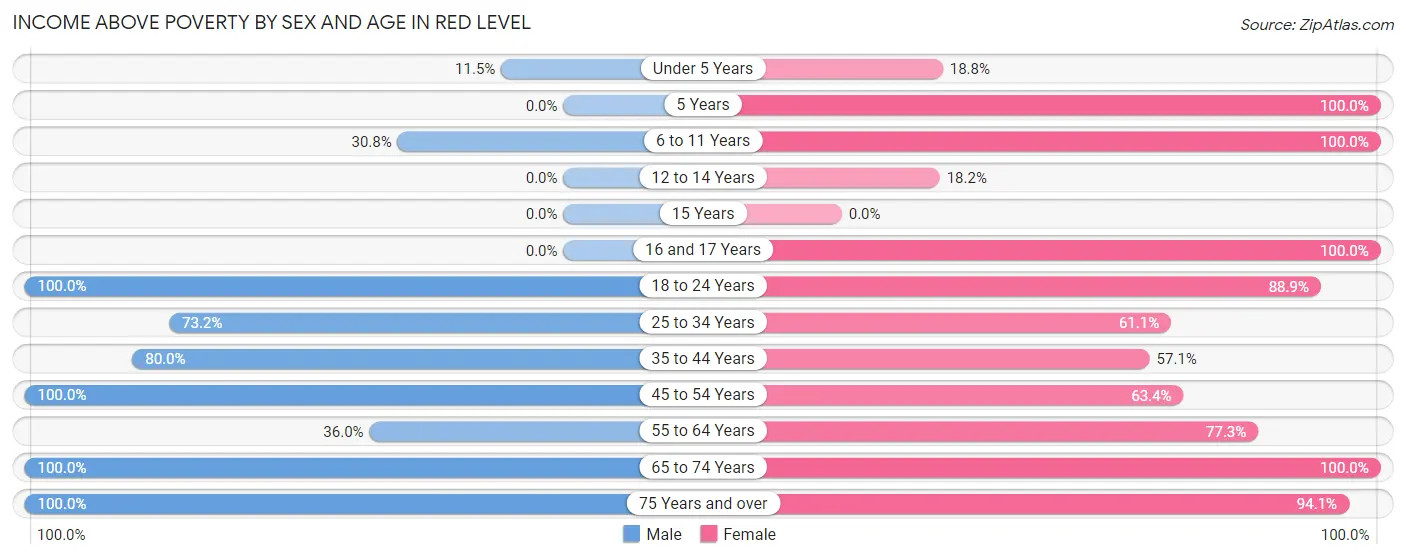
| Age Bracket | Male | Female |
| Under 5 Years | 3 (11.5%) | 3 (18.8%) |
| 5 Years | 0 (0.0%) | 11 (100.0%) |
| 6 to 11 Years | 4 (30.8%) | 10 (100.0%) |
| 12 to 14 Years | 0 (0.0%) | 2 (18.2%) |
| 15 Years | 0 (0.0%) | 0 (0.0%) |
| 16 and 17 Years | 0 (0.0%) | 5 (100.0%) |
| 18 to 24 Years | 31 (100.0%) | 40 (88.9%) |
| 25 to 34 Years | 30 (73.2%) | 11 (61.1%) |
| 35 to 44 Years | 32 (80.0%) | 16 (57.1%) |
| 45 to 54 Years | 34 (100.0%) | 26 (63.4%) |
| 55 to 64 Years | 9 (36.0%) | 17 (77.3%) |
| 65 to 74 Years | 3 (100.0%) | 17 (100.0%) |
| 75 Years and over | 14 (100.0%) | 16 (94.1%) |
| Total | 160 (68.1%) | 174 (72.2%) |
Income Below Poverty Among Married-Couple Families in Red Level
The poverty statistics for married-couple families in Red Level show that 18.9% or 14 of the total 74 families live below the poverty line. Families with 3 or 4 children have the highest poverty rate of 100.0%, comprising of 6 families. On the other hand, families with no children have the lowest poverty rate of 0.0%, which includes 0 families.
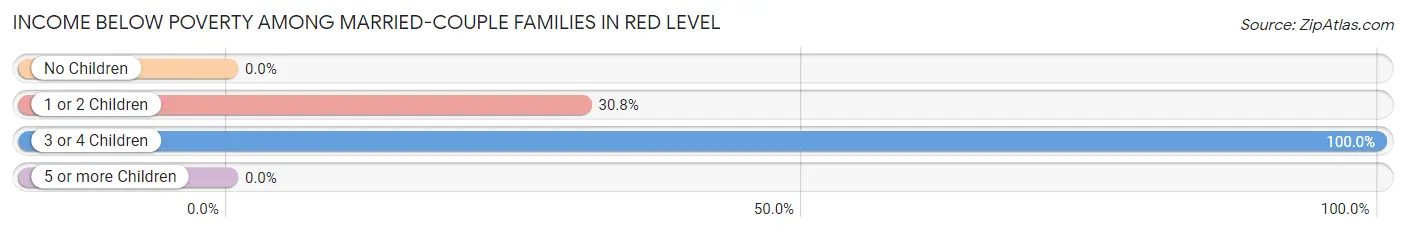
| Children | Above Poverty | Below Poverty |
| No Children | 42 (100.0%) | 0 (0.0%) |
| 1 or 2 Children | 18 (69.2%) | 8 (30.8%) |
| 3 or 4 Children | 0 (0.0%) | 6 (100.0%) |
| 5 or more Children | 0 (0.0%) | 0 (0.0%) |
| Total | 60 (81.1%) | 14 (18.9%) |
Income Below Poverty Among Single-Parent Households in Red Level
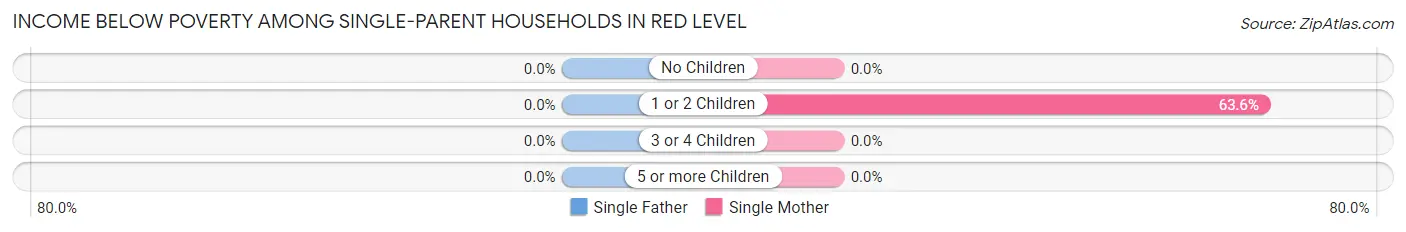
| Children | Single Father | Single Mother |
| No Children | 0 (0.0%) | 0 (0.0%) |
| 1 or 2 Children | 0 (0.0%) | 7 (63.6%) |
| 3 or 4 Children | 0 (0.0%) | 0 (0.0%) |
| 5 or more Children | 0 (0.0%) | 0 (0.0%) |
| Total | 0 (0.0%) | 7 (53.8%) |
Income Below Poverty Among Married-Couple vs Single-Parent Households in Red Level
The poverty data for Red Level shows that 14 of the married-couple family households (18.9%) and 7 of the single-parent households (26.9%) are living below the poverty level. Within the married-couple family households, those with 3 or 4 children have the highest poverty rate, with 6 households (100.0%) falling below the poverty line. Among the single-parent households, those with 1 or 2 children have the highest poverty rate, with 7 household (53.8%) living below poverty.
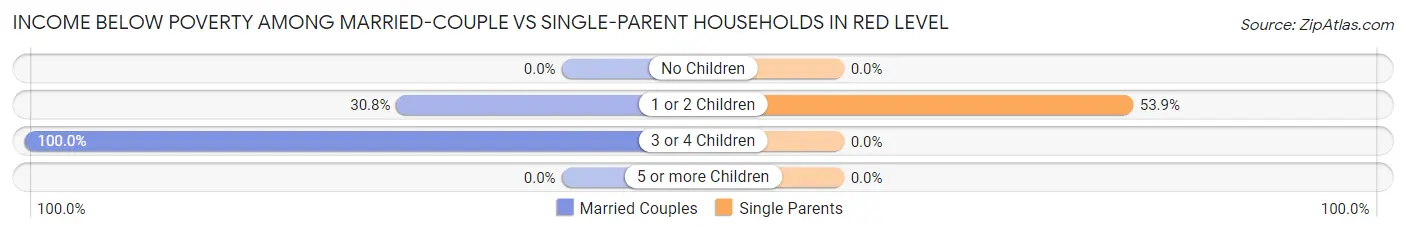
| Children | Married-Couple Families | Single-Parent Households |
| No Children | 0 (0.0%) | 0 (0.0%) |
| 1 or 2 Children | 8 (30.8%) | 7 (53.8%) |
| 3 or 4 Children | 6 (100.0%) | 0 (0.0%) |
| 5 or more Children | 0 (0.0%) | 0 (0.0%) |
| Total | 14 (18.9%) | 7 (26.9%) |
Race in Red Level
The most populous races in Red Level are White / Caucasian (387 | 81.3%), Two or more Races (59 | 12.4%), and Black / African American (30 | 6.3%).
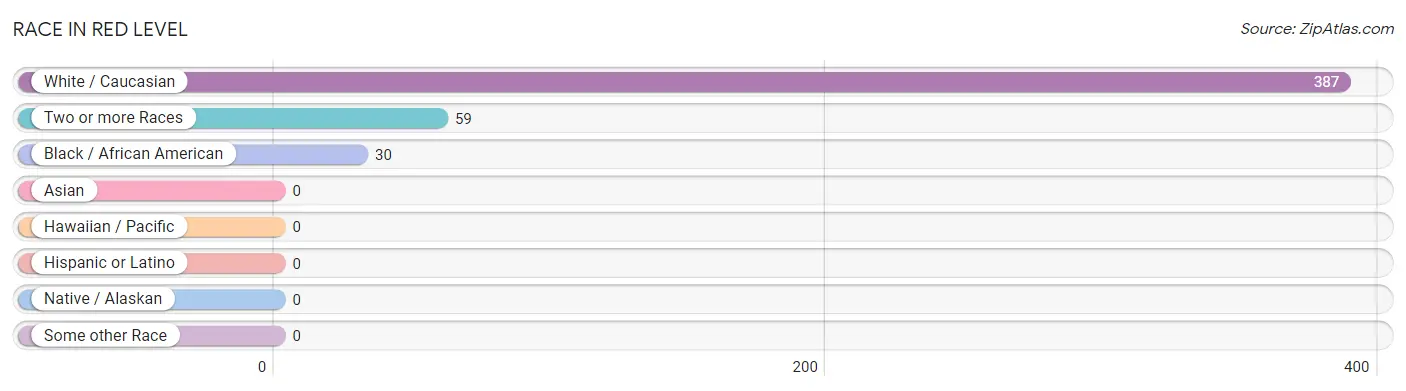
| Race | # Population | % Population |
| Asian | 0 | 0.0% |
| Black / African American | 30 | 6.3% |
| Hawaiian / Pacific | 0 | 0.0% |
| Hispanic or Latino | 0 | 0.0% |
| Native / Alaskan | 0 | 0.0% |
| White / Caucasian | 387 | 81.3% |
| Two or more Races | 59 | 12.4% |
| Some other Race | 0 | 0.0% |
| Total | 476 | 100.0% |
Ancestry in Red Level
The most populous ancestries reported in Red Level are American (51 | 10.7%), English (24 | 5.0%), Irish (17 | 3.6%), German (15 | 3.2%), and Ukrainian (13 | 2.7%), together accounting for 25.2% of all Red Level residents.
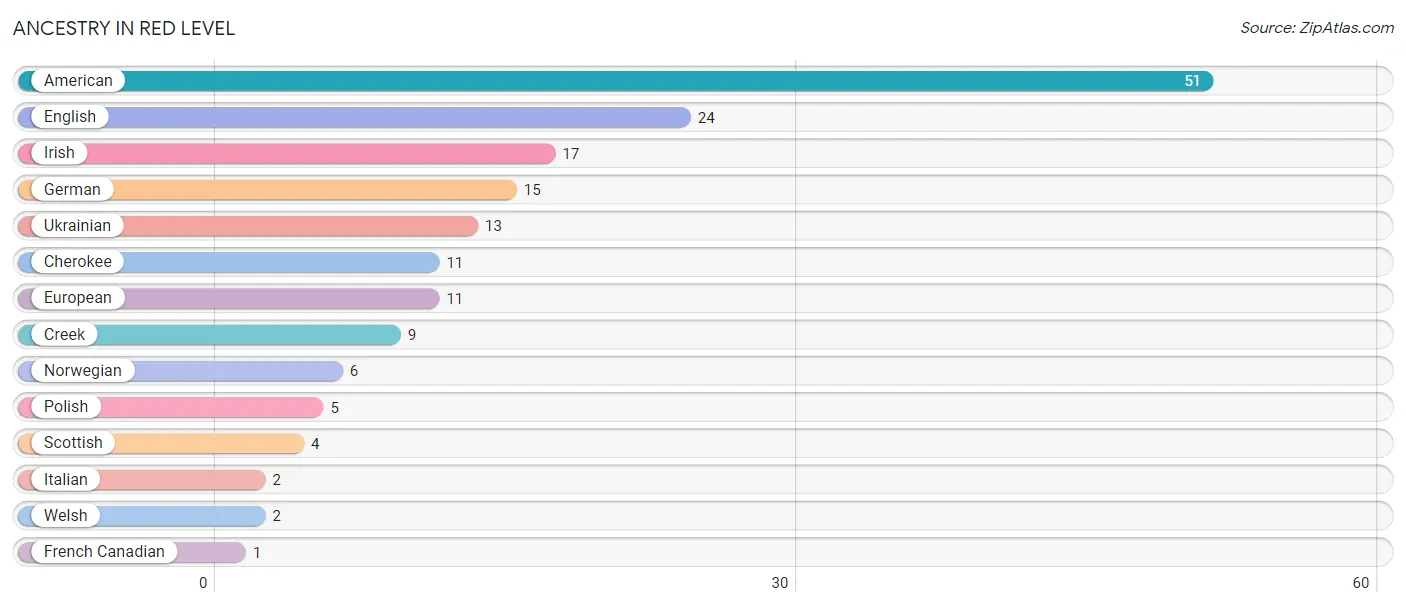
| Ancestry | # Population | % Population |
| American | 51 | 10.7% |
| Cherokee | 11 | 2.3% |
| Creek | 9 | 1.9% |
| English | 24 | 5.0% |
| European | 11 | 2.3% |
| French Canadian | 1 | 0.2% |
| German | 15 | 3.2% |
| Irish | 17 | 3.6% |
| Italian | 2 | 0.4% |
| Norwegian | 6 | 1.3% |
| Polish | 5 | 1.1% |
| Scottish | 4 | 0.8% |
| Ukrainian | 13 | 2.7% |
| Welsh | 2 | 0.4% | View All 14 Rows |
Immigrants in Red Level

| Immigration Origin | # Population | % Population | View All 0 Rows |
Sex and Age in Red Level
Sex and Age in Red Level
The most populous age groups in Red Level are 25 to 29 Years (33 | 14.0%) for men and 20 to 24 Years (45 | 18.7%) for women.
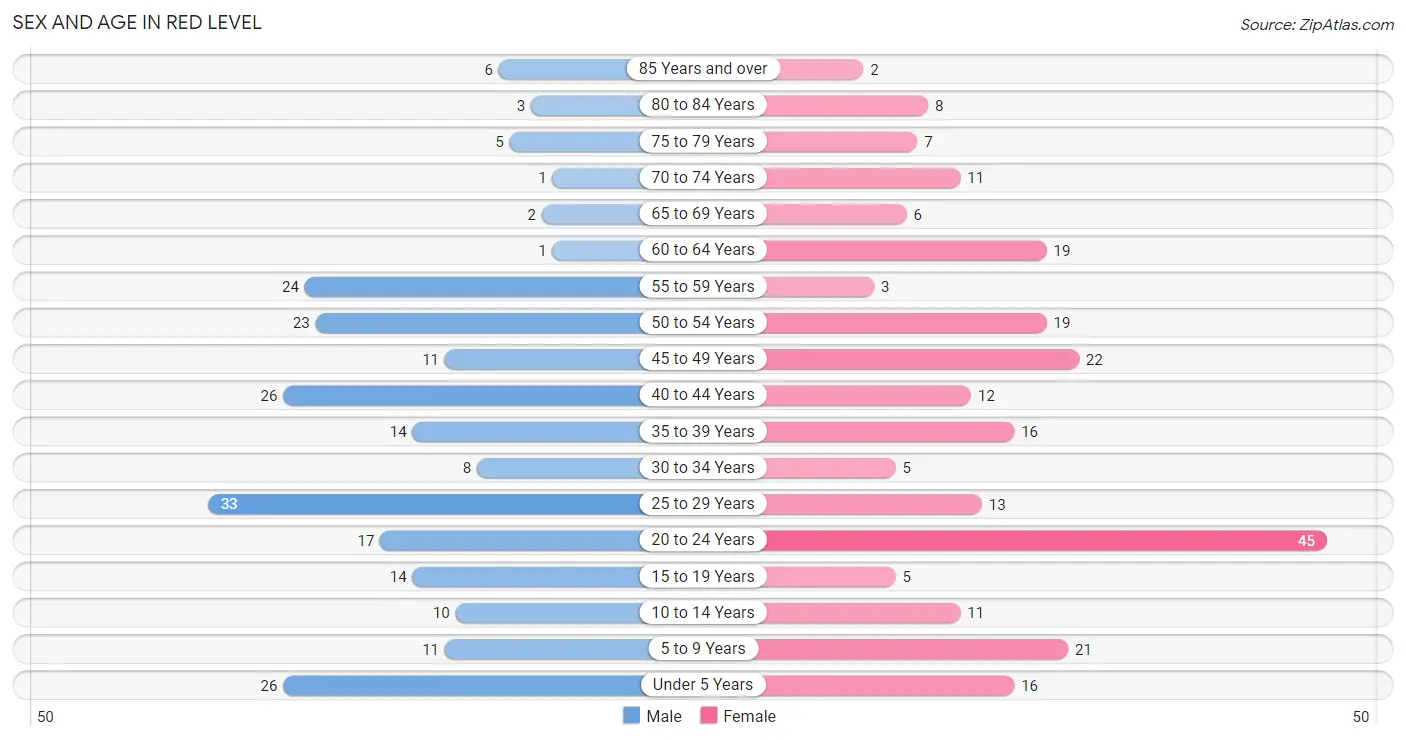
| Age Bracket | Male | Female |
| Under 5 Years | 26 (11.1%) | 16 (6.6%) |
| 5 to 9 Years | 11 (4.7%) | 21 (8.7%) |
| 10 to 14 Years | 10 (4.3%) | 11 (4.6%) |
| 15 to 19 Years | 14 (6.0%) | 5 (2.1%) |
| 20 to 24 Years | 17 (7.2%) | 45 (18.7%) |
| 25 to 29 Years | 33 (14.0%) | 13 (5.4%) |
| 30 to 34 Years | 8 (3.4%) | 5 (2.1%) |
| 35 to 39 Years | 14 (6.0%) | 16 (6.6%) |
| 40 to 44 Years | 26 (11.1%) | 12 (5.0%) |
| 45 to 49 Years | 11 (4.7%) | 22 (9.1%) |
| 50 to 54 Years | 23 (9.8%) | 19 (7.9%) |
| 55 to 59 Years | 24 (10.2%) | 3 (1.2%) |
| 60 to 64 Years | 1 (0.4%) | 19 (7.9%) |
| 65 to 69 Years | 2 (0.9%) | 6 (2.5%) |
| 70 to 74 Years | 1 (0.4%) | 11 (4.6%) |
| 75 to 79 Years | 5 (2.1%) | 7 (2.9%) |
| 80 to 84 Years | 3 (1.3%) | 8 (3.3%) |
| 85 Years and over | 6 (2.5%) | 2 (0.8%) |
| Total | 235 (100.0%) | 241 (100.0%) |
Families and Households in Red Level
Median Family Size in Red Level
The median family size in Red Level is 4.12 persons per family, with married-couple families (74 | 74.0%) accounting for the largest median family size of 4.23 persons per family. On the other hand, single female/mother families (13 | 13.0%) represent the smallest median family size with 3.77 persons per family.
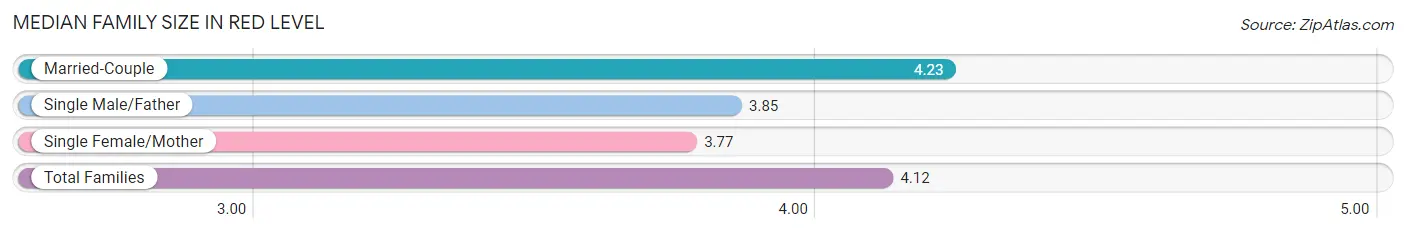
| Family Type | # Families | Family Size |
| Married-Couple | 74 (74.0%) | 4.23 |
| Single Male/Father | 13 (13.0%) | 3.85 |
| Single Female/Mother | 13 (13.0%) | 3.77 |
| Total Families | 100 (100.0%) | 4.12 |
Median Household Size in Red Level
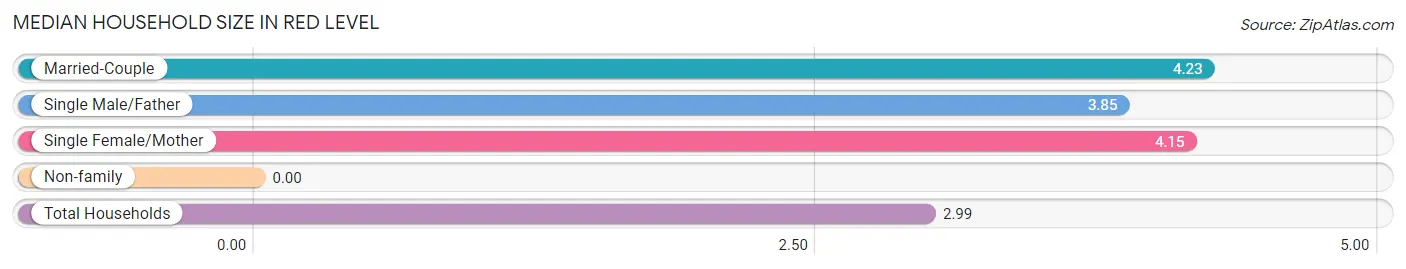
| Household Type | # Households | Household Size |
| Married-Couple | 74 (46.5%) | 4.23 |
| Single Male/Father | 13 (8.2%) | 3.85 |
| Single Female/Mother | 13 (8.2%) | 4.15 |
| Non-family | 59 (37.1%) | - |
| Total Households | 159 (100.0%) | 2.99 |
Household Size by Marriage Status in Red Level
Out of a total of 159 households in Red Level, 100 (62.9%) are family households, while 59 (37.1%) are nonfamily households. The most numerous type of family households are 2-person households, comprising 32, and the most common type of nonfamily households are 1-person households, comprising 59.
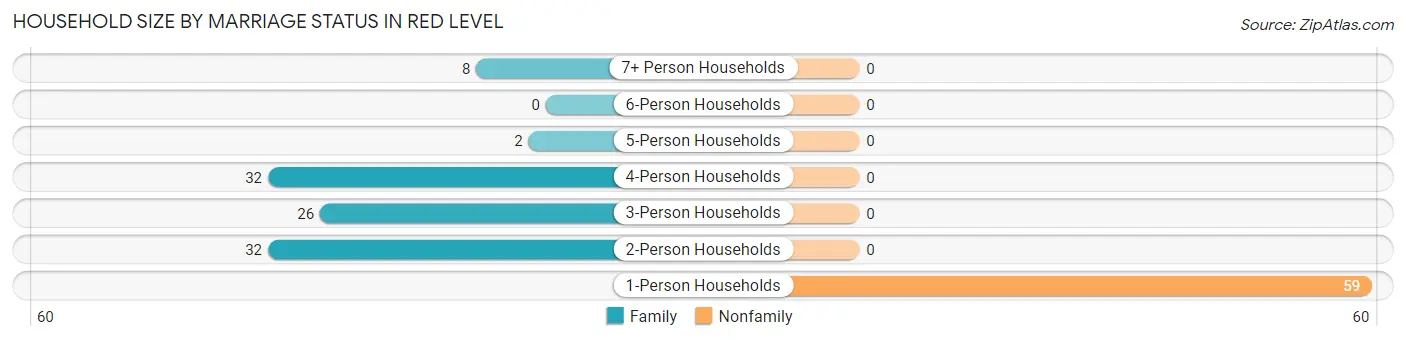
| Household Size | Family Households | Nonfamily Households |
| 1-Person Households | - | 59 (37.1%) |
| 2-Person Households | 32 (20.1%) | 0 (0.0%) |
| 3-Person Households | 26 (16.4%) | 0 (0.0%) |
| 4-Person Households | 32 (20.1%) | 0 (0.0%) |
| 5-Person Households | 2 (1.3%) | 0 (0.0%) |
| 6-Person Households | 0 (0.0%) | 0 (0.0%) |
| 7+ Person Households | 8 (5.0%) | 0 (0.0%) |
| Total | 100 (62.9%) | 59 (37.1%) |
Female Fertility in Red Level
Fertility by Age in Red Level
Average fertility rate in Red Level is 8.0 births per 1,000 women. Women in the age bracket of 35 to 50 years have the highest fertility rate with 19.0 births per 1,000 women. Women in the age bracket of 35 to 50 years acount for 100.0% of all women with births.
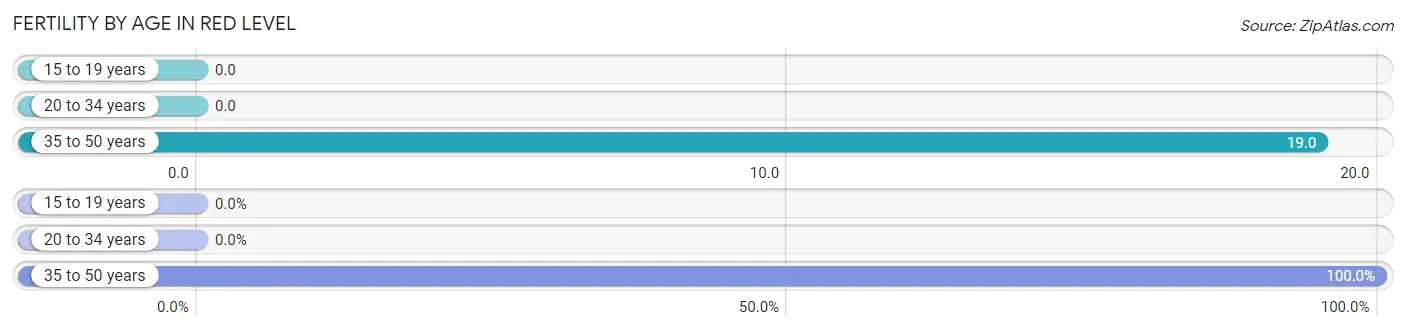
| Age Bracket | Women with Births | Births / 1,000 Women |
| 15 to 19 years | 0 (0.0%) | 0.0 |
| 20 to 34 years | 0 (0.0%) | 0.0 |
| 35 to 50 years | 1 (100.0%) | 19.0 |
| Total | 1 (100.0%) | 8.0 |
Fertility by Age by Marriage Status in Red Level
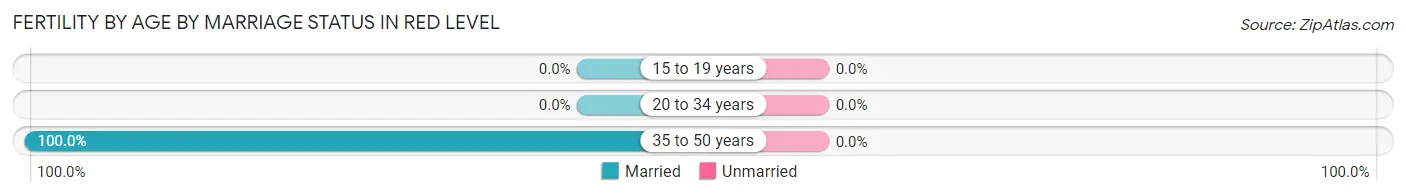
| Age Bracket | Married | Unmarried |
| 15 to 19 years | 0 (0.0%) | 0 (0.0%) |
| 20 to 34 years | 0 (0.0%) | 0 (0.0%) |
| 35 to 50 years | 1 (100.0%) | 0 (0.0%) |
| Total | 1 (100.0%) | 0 (0.0%) |
Fertility by Education in Red Level
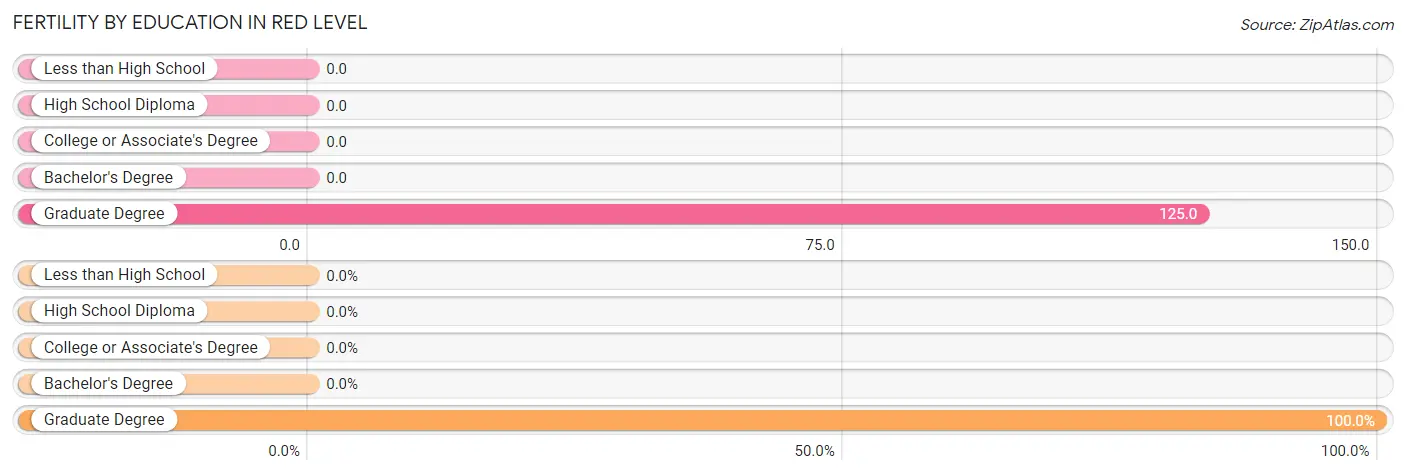
| Educational Attainment | Women with Births | Births / 1,000 Women |
| Less than High School | 0 (0.0%) | 0.0 |
| High School Diploma | 0 (0.0%) | 0.0 |
| College or Associate's Degree | 0 (0.0%) | 0.0 |
| Bachelor's Degree | 0 (0.0%) | 0.0 |
| Graduate Degree | 1 (100.0%) | 125.0 |
| Total | 1 (100.0%) | 8.0 |
Fertility by Education by Marriage Status in Red Level
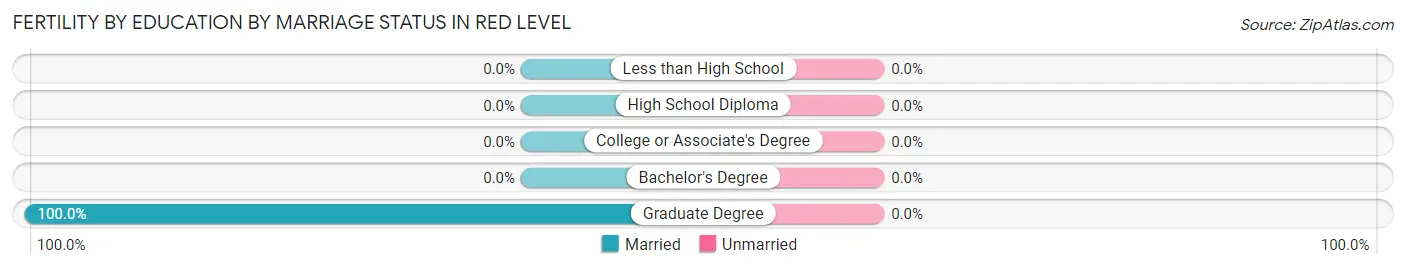
| Educational Attainment | Married | Unmarried |
| Less than High School | 0 (0.0%) | 0 (0.0%) |
| High School Diploma | 0 (0.0%) | 0 (0.0%) |
| College or Associate's Degree | 0 (0.0%) | 0 (0.0%) |
| Bachelor's Degree | 0 (0.0%) | 0 (0.0%) |
| Graduate Degree | 1 (100.0%) | 0 (0.0%) |
| Total | 1 (100.0%) | 0 (0.0%) |
Employment Characteristics in Red Level
Employment by Class of Employer in Red Level
Among the 218 employed individuals in Red Level, private company employees (173 | 79.4%), local government employees (23 | 10.5%), and self-employed (incorporated) (12 | 5.5%) make up the most common classes of employment.
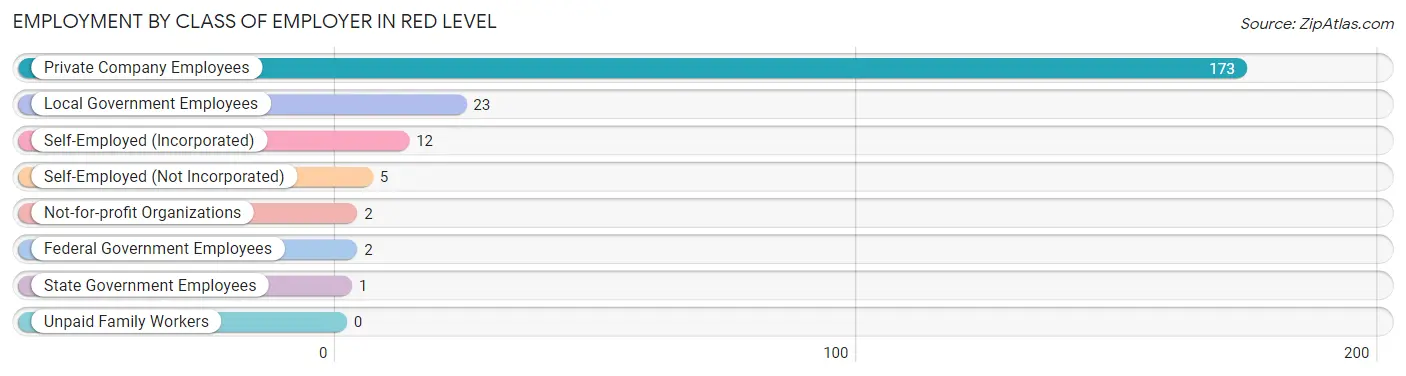
| Employer Class | # Employees | % Employees |
| Private Company Employees | 173 | 79.4% |
| Self-Employed (Incorporated) | 12 | 5.5% |
| Self-Employed (Not Incorporated) | 5 | 2.3% |
| Not-for-profit Organizations | 2 | 0.9% |
| Local Government Employees | 23 | 10.5% |
| State Government Employees | 1 | 0.5% |
| Federal Government Employees | 2 | 0.9% |
| Unpaid Family Workers | 0 | 0.0% |
| Total | 218 | 100.0% |
Employment Status by Age in Red Level
According to the labor force statistics for Red Level, out of the total population over 16 years of age (381), 69.0% or 263 individuals are in the labor force, with 16.3% or 43 of them unemployed. The age group with the highest labor force participation rate is 35 to 44 years, with 91.2% or 62 individuals in the labor force. Within the labor force, the 16 to 19 years age range has the highest percentage of unemployed individuals, with 78.6% or 11 of them being unemployed.
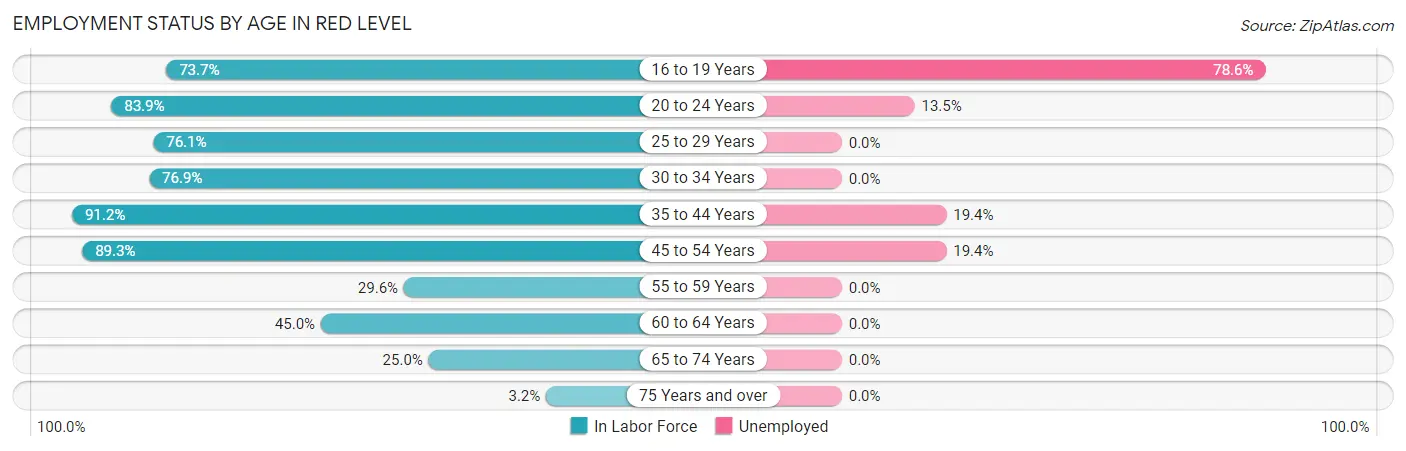
| Age Bracket | In Labor Force | Unemployed |
| 16 to 19 Years | 14 (73.7%) | 11 (78.6%) |
| 20 to 24 Years | 52 (83.9%) | 7 (13.5%) |
| 25 to 29 Years | 35 (76.1%) | 0 (0.0%) |
| 30 to 34 Years | 10 (76.9%) | 0 (0.0%) |
| 35 to 44 Years | 62 (91.2%) | 12 (19.4%) |
| 45 to 54 Years | 67 (89.3%) | 13 (19.4%) |
| 55 to 59 Years | 8 (29.6%) | 0 (0.0%) |
| 60 to 64 Years | 9 (45.0%) | 0 (0.0%) |
| 65 to 74 Years | 5 (25.0%) | 0 (0.0%) |
| 75 Years and over | 1 (3.2%) | 0 (0.0%) |
| Total | 263 (69.0%) | 43 (16.3%) |
Employment Status by Educational Attainment in Red Level
According to labor force statistics for Red Level, 76.7% of individuals (191) out of the total population between 25 and 64 years of age (249) are in the labor force, with 13.1% or 25 of them being unemployed. The group with the highest labor force participation rate are those with the educational attainment of bachelor's degree or higher, with 100.0% or 12 individuals in the labor force. Within the labor force, individuals with high school diploma education have the highest percentage of unemployment, with 19.3% or 21 of them being unemployed.
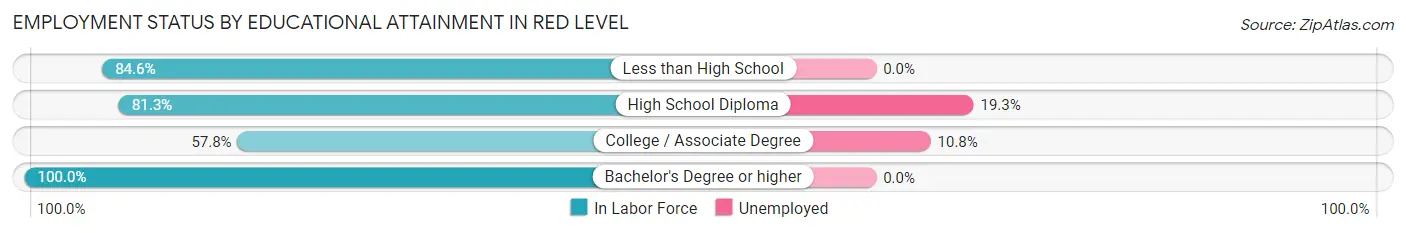
| Educational Attainment | In Labor Force | Unemployed |
| Less than High School | 33 (84.6%) | 0 (0.0%) |
| High School Diploma | 109 (81.3%) | 26 (19.3%) |
| College / Associate Degree | 37 (57.8%) | 7 (10.8%) |
| Bachelor's Degree or higher | 12 (100.0%) | 0 (0.0%) |
| Total | 191 (76.7%) | 33 (13.1%) |
Employment Occupations by Sex in Red Level
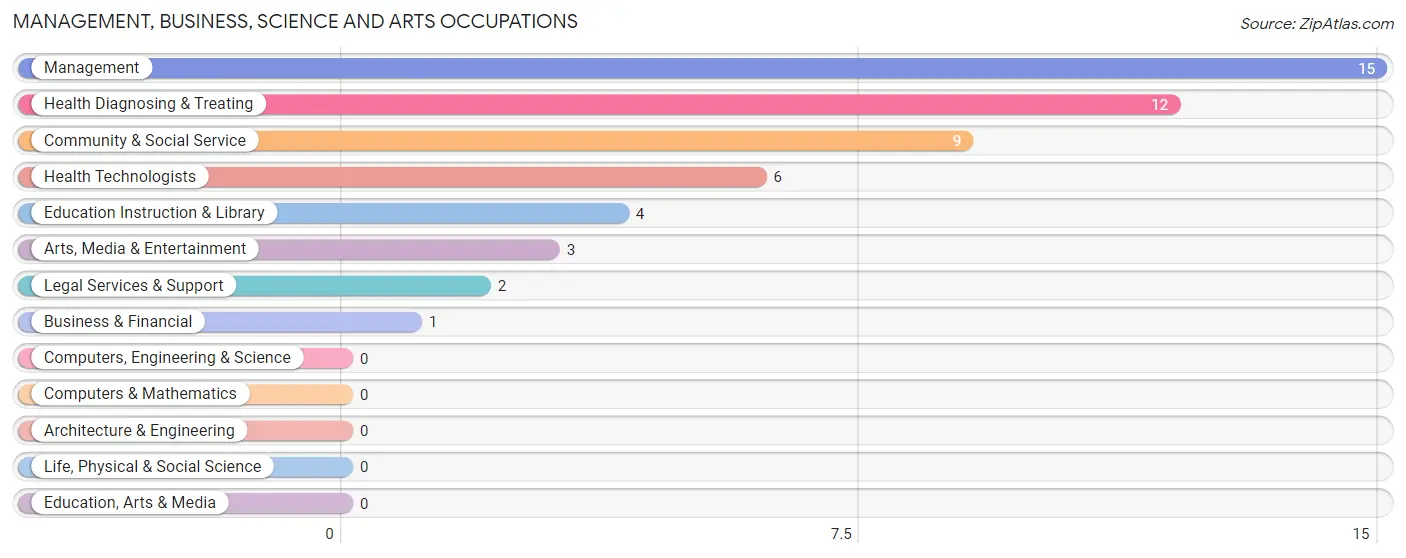
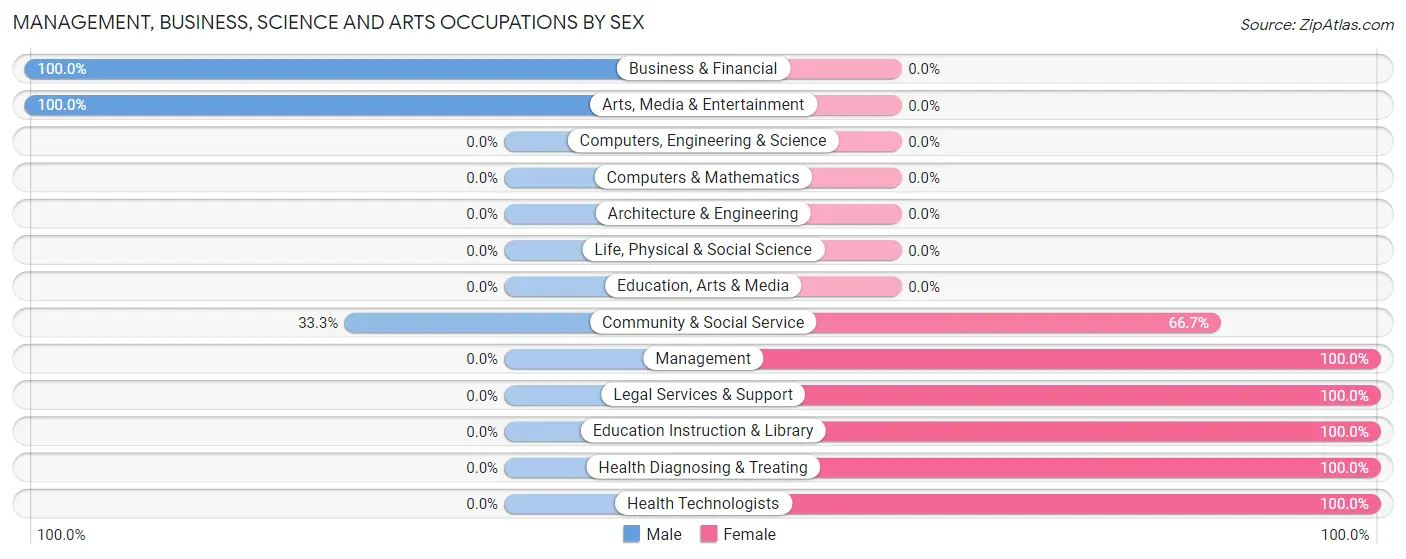
Management, Business, Science and Arts Occupations
The most common Management, Business, Science and Arts occupations in Red Level are Management (15 | 6.8%), Health Diagnosing & Treating (12 | 5.4%), Community & Social Service (9 | 4.1%), Health Technologists (6 | 2.7%), and Education Instruction & Library (4 | 1.8%).
Management, Business, Science and Arts Occupations by Sex
Within the Management, Business, Science and Arts occupations in Red Level, the most male-oriented occupations are Business & Financial (100.0%), Arts, Media & Entertainment (100.0%), and Community & Social Service (33.3%), while the most female-oriented occupations are Management (100.0%), Legal Services & Support (100.0%), and Education Instruction & Library (100.0%).
| Occupation | Male | Female |
| Management | 0 (0.0%) | 15 (100.0%) |
| Business & Financial | 1 (100.0%) | 0 (0.0%) |
| Computers, Engineering & Science | 0 (0.0%) | 0 (0.0%) |
| Computers & Mathematics | 0 (0.0%) | 0 (0.0%) |
| Architecture & Engineering | 0 (0.0%) | 0 (0.0%) |
| Life, Physical & Social Science | 0 (0.0%) | 0 (0.0%) |
| Community & Social Service | 3 (33.3%) | 6 (66.7%) |
| Education, Arts & Media | 0 (0.0%) | 0 (0.0%) |
| Legal Services & Support | 0 (0.0%) | 2 (100.0%) |
| Education Instruction & Library | 0 (0.0%) | 4 (100.0%) |
| Arts, Media & Entertainment | 3 (100.0%) | 0 (0.0%) |
| Health Diagnosing & Treating | 0 (0.0%) | 12 (100.0%) |
| Health Technologists | 0 (0.0%) | 6 (100.0%) |
| Total (Category) | 4 (10.8%) | 33 (89.2%) |
| Total (Overall) | 131 (59.6%) | 89 (40.5%) |
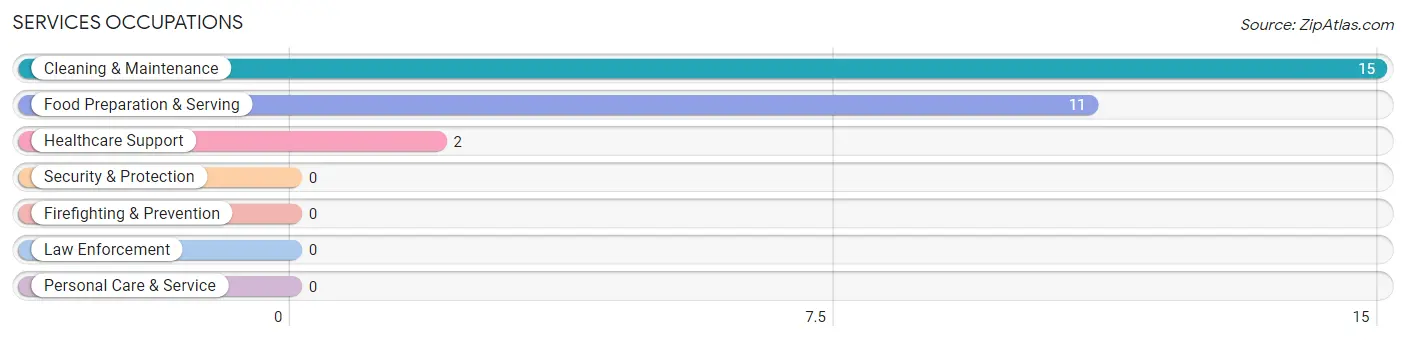
Services Occupations
The most common Services occupations in Red Level are Cleaning & Maintenance (15 | 6.8%), Food Preparation & Serving (11 | 5.0%), and Healthcare Support (2 | 0.9%).
Services Occupations by Sex
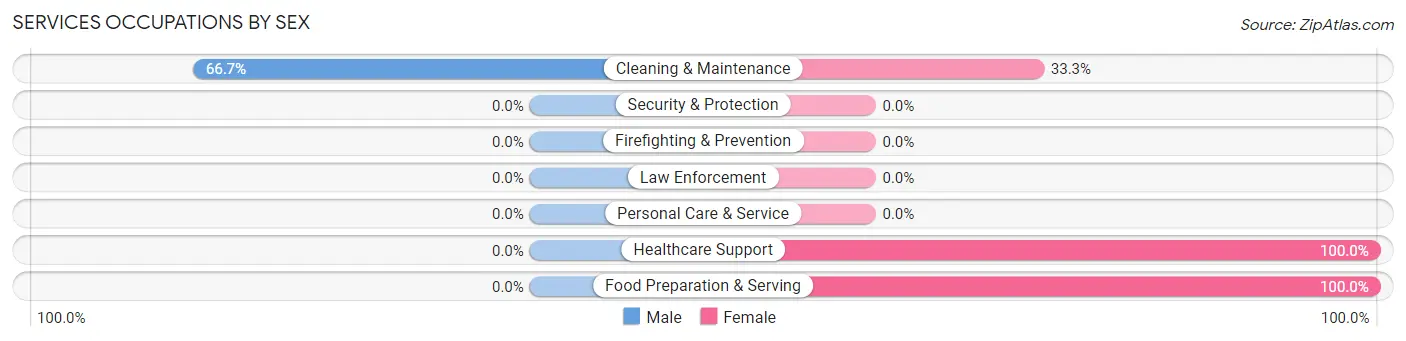
| Occupation | Male | Female |
| Healthcare Support | 0 (0.0%) | 2 (100.0%) |
| Security & Protection | 0 (0.0%) | 0 (0.0%) |
| Firefighting & Prevention | 0 (0.0%) | 0 (0.0%) |
| Law Enforcement | 0 (0.0%) | 0 (0.0%) |
| Food Preparation & Serving | 0 (0.0%) | 11 (100.0%) |
| Cleaning & Maintenance | 10 (66.7%) | 5 (33.3%) |
| Personal Care & Service | 0 (0.0%) | 0 (0.0%) |
| Total (Category) | 10 (35.7%) | 18 (64.3%) |
| Total (Overall) | 131 (59.6%) | 89 (40.5%) |
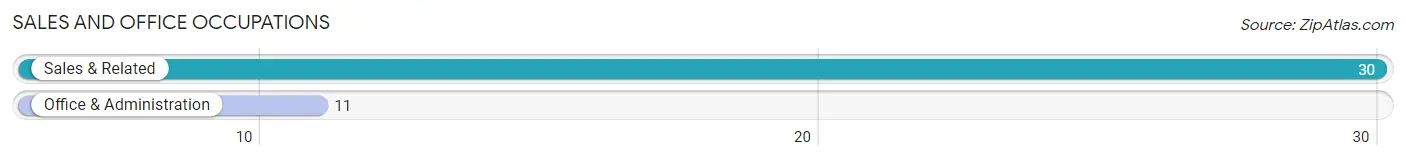
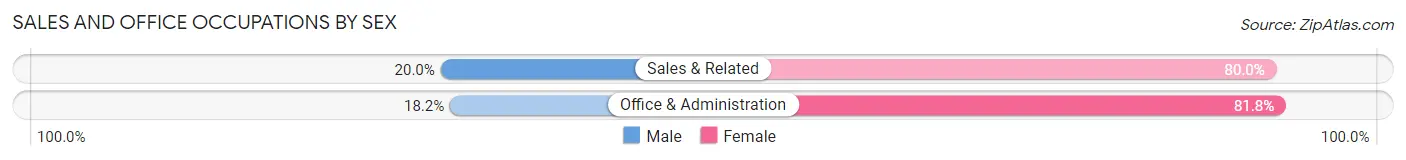
Sales and Office Occupations
The most common Sales and Office occupations in Red Level are Sales & Related (30 | 13.6%), and Office & Administration (11 | 5.0%).
Sales and Office Occupations by Sex
| Occupation | Male | Female |
| Sales & Related | 6 (20.0%) | 24 (80.0%) |
| Office & Administration | 2 (18.2%) | 9 (81.8%) |
| Total (Category) | 8 (19.5%) | 33 (80.5%) |
| Total (Overall) | 131 (59.6%) | 89 (40.5%) |
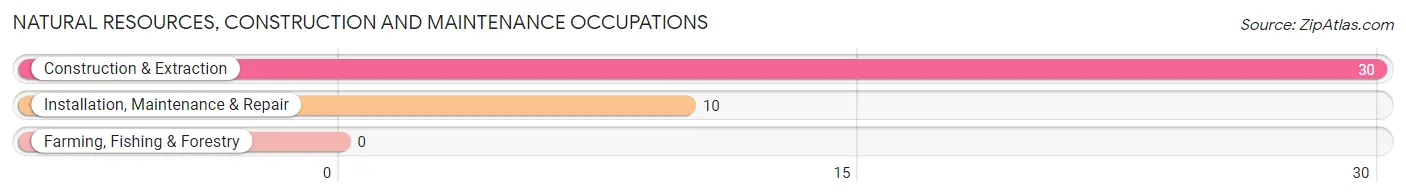
Natural Resources, Construction and Maintenance Occupations
The most common Natural Resources, Construction and Maintenance occupations in Red Level are Construction & Extraction (30 | 13.6%), and Installation, Maintenance & Repair (10 | 4.5%).
Natural Resources, Construction and Maintenance Occupations by Sex
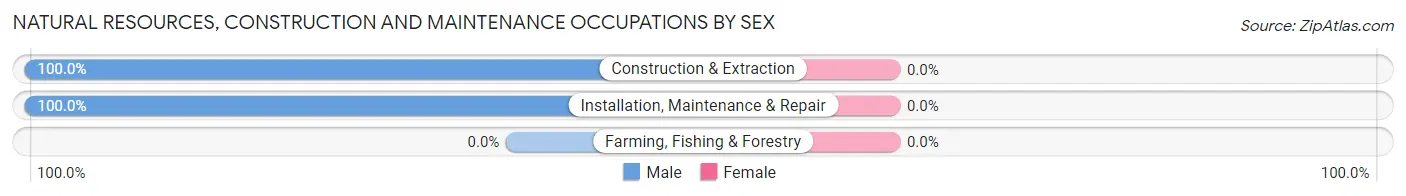
| Occupation | Male | Female |
| Farming, Fishing & Forestry | 0 (0.0%) | 0 (0.0%) |
| Construction & Extraction | 30 (100.0%) | 0 (0.0%) |
| Installation, Maintenance & Repair | 10 (100.0%) | 0 (0.0%) |
| Total (Category) | 40 (100.0%) | 0 (0.0%) |
| Total (Overall) | 131 (59.6%) | 89 (40.5%) |
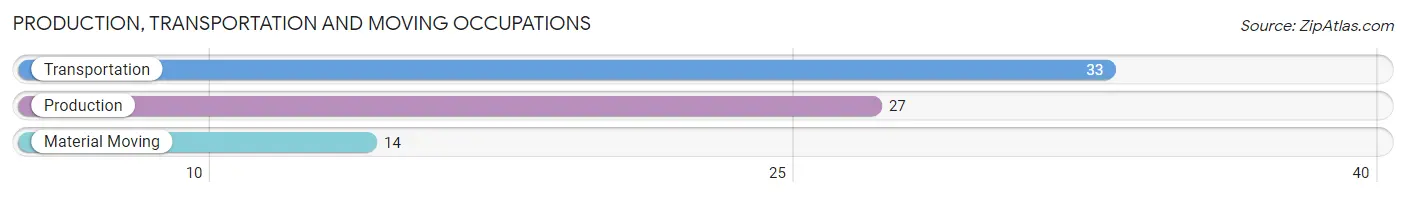
Production, Transportation and Moving Occupations
The most common Production, Transportation and Moving occupations in Red Level are Transportation (33 | 15.0%), Production (27 | 12.3%), and Material Moving (14 | 6.4%).
Production, Transportation and Moving Occupations by Sex
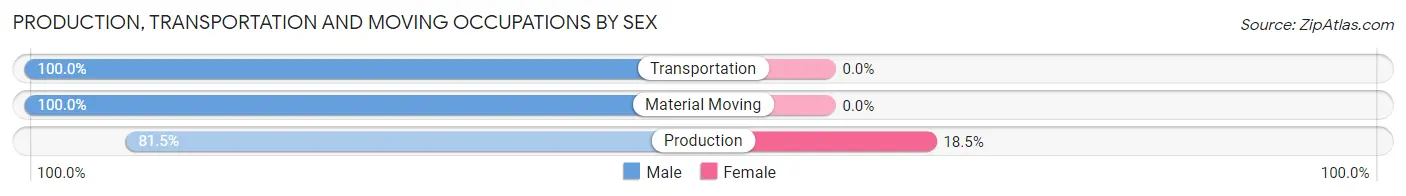
| Occupation | Male | Female |
| Production | 22 (81.5%) | 5 (18.5%) |
| Transportation | 33 (100.0%) | 0 (0.0%) |
| Material Moving | 14 (100.0%) | 0 (0.0%) |
| Total (Category) | 69 (93.2%) | 5 (6.8%) |
| Total (Overall) | 131 (59.6%) | 89 (40.5%) |
Employment Industries by Sex in Red Level
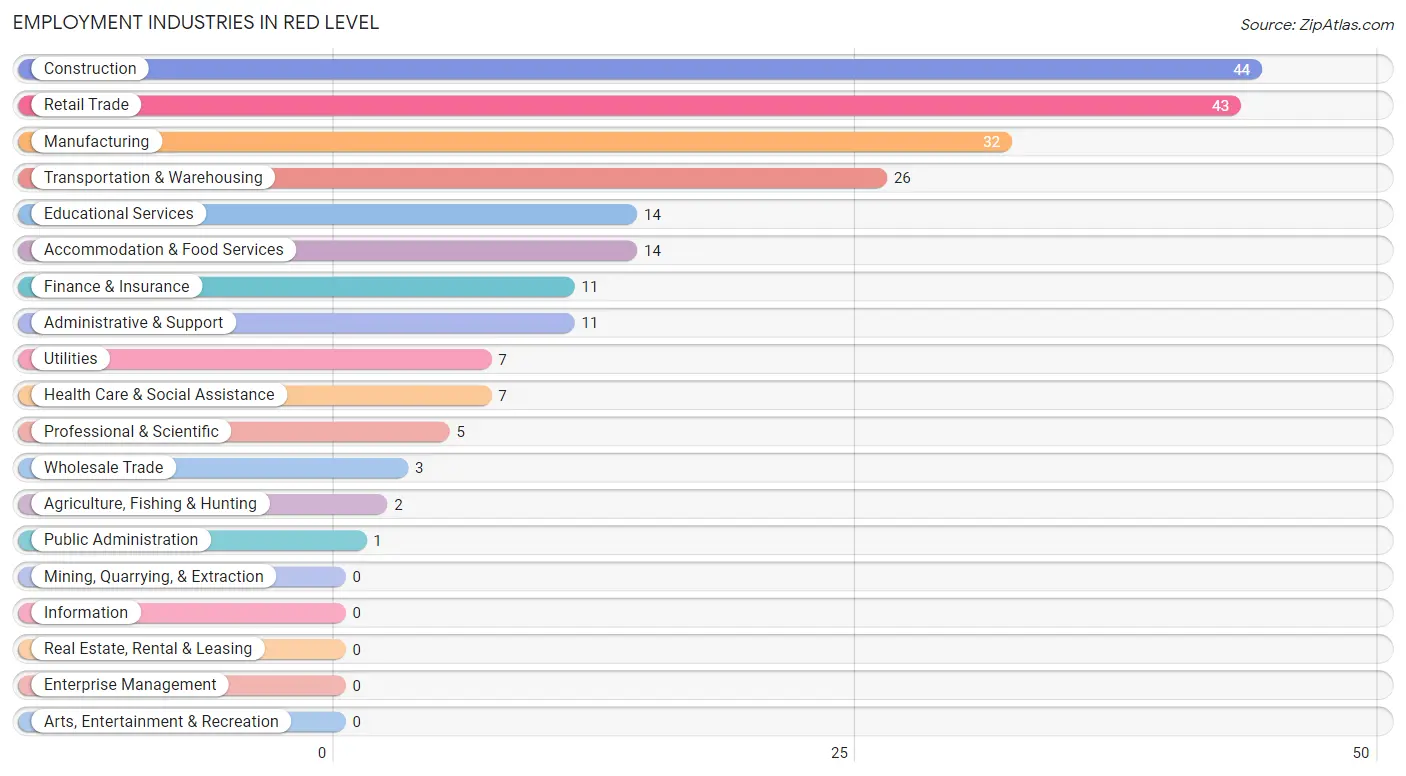
Employment Industries in Red Level
The major employment industries in Red Level include Construction (44 | 20.0%), Retail Trade (43 | 19.6%), Manufacturing (32 | 14.5%), Transportation & Warehousing (26 | 11.8%), and Educational Services (14 | 6.4%).
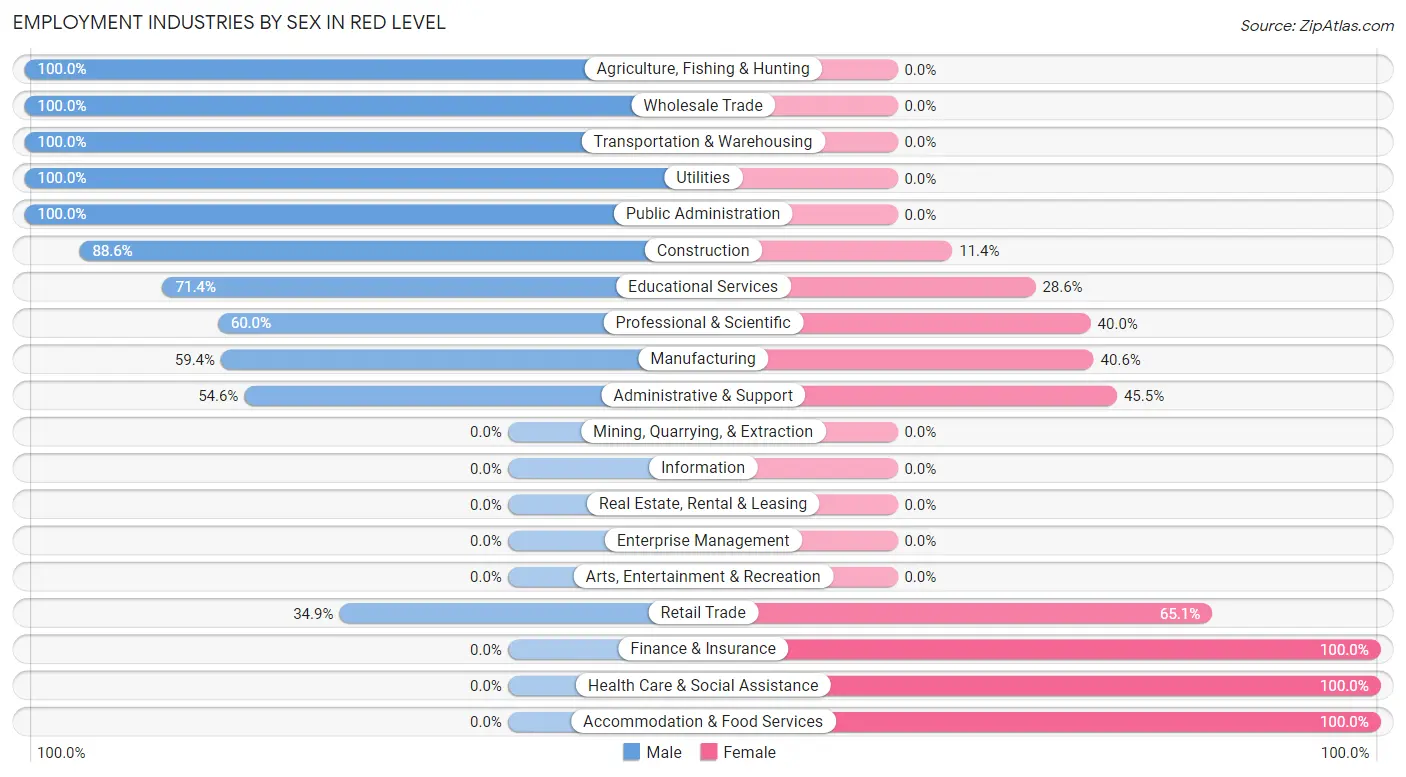
Employment Industries by Sex in Red Level
The Red Level industries that see more men than women are Agriculture, Fishing & Hunting (100.0%), Wholesale Trade (100.0%), and Transportation & Warehousing (100.0%), whereas the industries that tend to have a higher number of women are Finance & Insurance (100.0%), Health Care & Social Assistance (100.0%), and Accommodation & Food Services (100.0%).
| Industry | Male | Female |
| Agriculture, Fishing & Hunting | 2 (100.0%) | 0 (0.0%) |
| Mining, Quarrying, & Extraction | 0 (0.0%) | 0 (0.0%) |
| Construction | 39 (88.6%) | 5 (11.4%) |
| Manufacturing | 19 (59.4%) | 13 (40.6%) |
| Wholesale Trade | 3 (100.0%) | 0 (0.0%) |
| Retail Trade | 15 (34.9%) | 28 (65.1%) |
| Transportation & Warehousing | 26 (100.0%) | 0 (0.0%) |
| Utilities | 7 (100.0%) | 0 (0.0%) |
| Information | 0 (0.0%) | 0 (0.0%) |
| Finance & Insurance | 0 (0.0%) | 11 (100.0%) |
| Real Estate, Rental & Leasing | 0 (0.0%) | 0 (0.0%) |
| Professional & Scientific | 3 (60.0%) | 2 (40.0%) |
| Enterprise Management | 0 (0.0%) | 0 (0.0%) |
| Administrative & Support | 6 (54.5%) | 5 (45.5%) |
| Educational Services | 10 (71.4%) | 4 (28.6%) |
| Health Care & Social Assistance | 0 (0.0%) | 7 (100.0%) |
| Arts, Entertainment & Recreation | 0 (0.0%) | 0 (0.0%) |
| Accommodation & Food Services | 0 (0.0%) | 14 (100.0%) |
| Public Administration | 1 (100.0%) | 0 (0.0%) |
| Total | 131 (59.6%) | 89 (40.5%) |
Education in Red Level
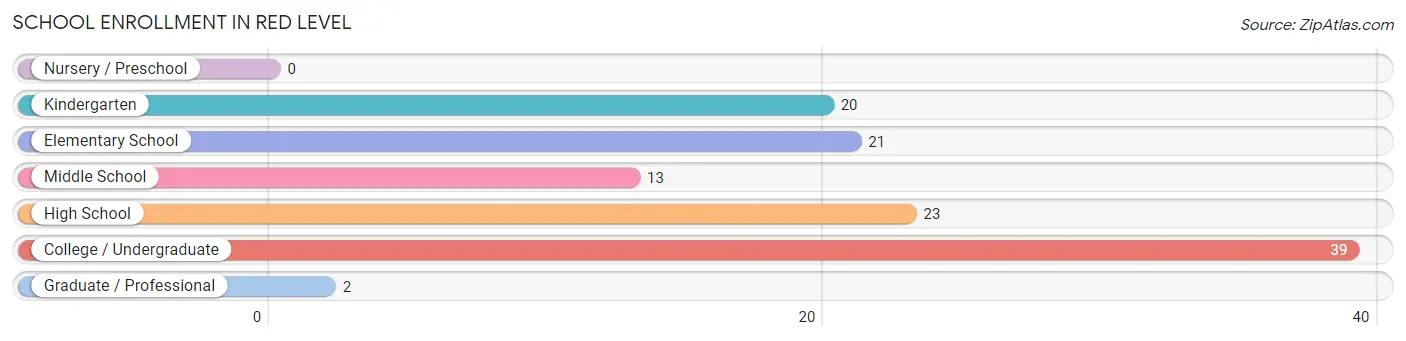
School Enrollment in Red Level
The most common levels of schooling among the 118 students in Red Level are college / undergraduate (39 | 33.1%), high school (23 | 19.5%), and elementary school (21 | 17.8%).
| School Level | # Students | % Students |
| Nursery / Preschool | 0 | 0.0% |
| Kindergarten | 20 | 17.0% |
| Elementary School | 21 | 17.8% |
| Middle School | 13 | 11.0% |
| High School | 23 | 19.5% |
| College / Undergraduate | 39 | 33.1% |
| Graduate / Professional | 2 | 1.7% |
| Total | 118 | 100.0% |
School Enrollment by Age by Funding Source in Red Level
Out of a total of 118 students who are enrolled in schools in Red Level, 6 (5.1%) attend a private institution, while the remaining 112 (94.9%) are enrolled in public schools. The age group of 15 to 17 year olds has the highest likelihood of being enrolled in private schools, with 1 (20.0% in the age bracket) enrolled. Conversely, the age group of 3 to 4 year olds has the lowest likelihood of being enrolled in a private school, with 9 (100.0% in the age bracket) attending a public institution.
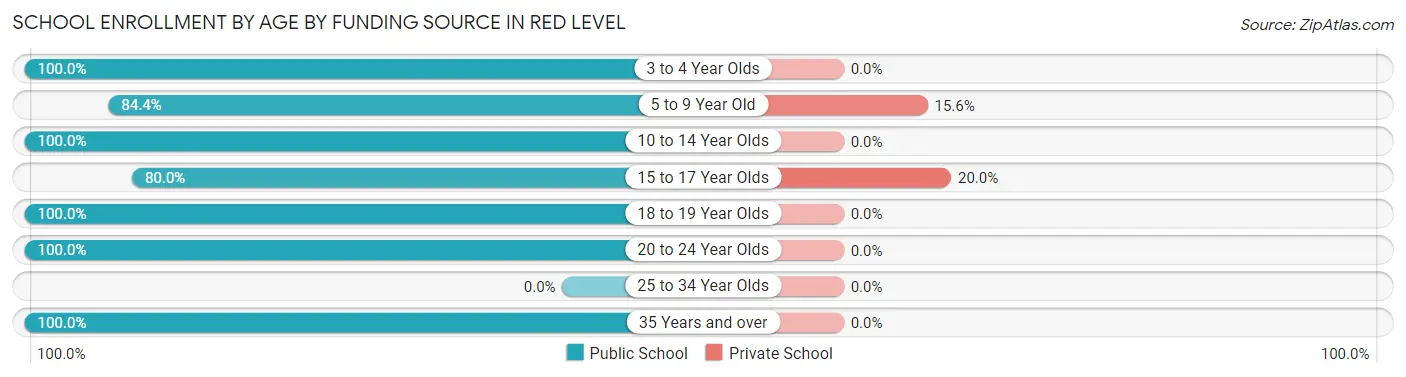
| Age Bracket | Public School | Private School |
| 3 to 4 Year Olds | 9 (100.0%) | 0 (0.0%) |
| 5 to 9 Year Old | 27 (84.4%) | 5 (15.6%) |
| 10 to 14 Year Olds | 21 (100.0%) | 0 (0.0%) |
| 15 to 17 Year Olds | 4 (80.0%) | 1 (20.0%) |
| 18 to 19 Year Olds | 13 (100.0%) | 0 (0.0%) |
| 20 to 24 Year Olds | 30 (100.0%) | 0 (0.0%) |
| 25 to 34 Year Olds | 0 (0.0%) | 0 (0.0%) |
| 35 Years and over | 8 (100.0%) | 0 (0.0%) |
| Total | 112 (94.9%) | 6 (5.1%) |
Educational Attainment by Field of Study in Red Level
Education (8 | 40.0%), science & technology (6 | 30.0%), and business (6 | 30.0%) are the most common fields of study among 20 individuals in Red Level who have obtained a bachelor's degree or higher.
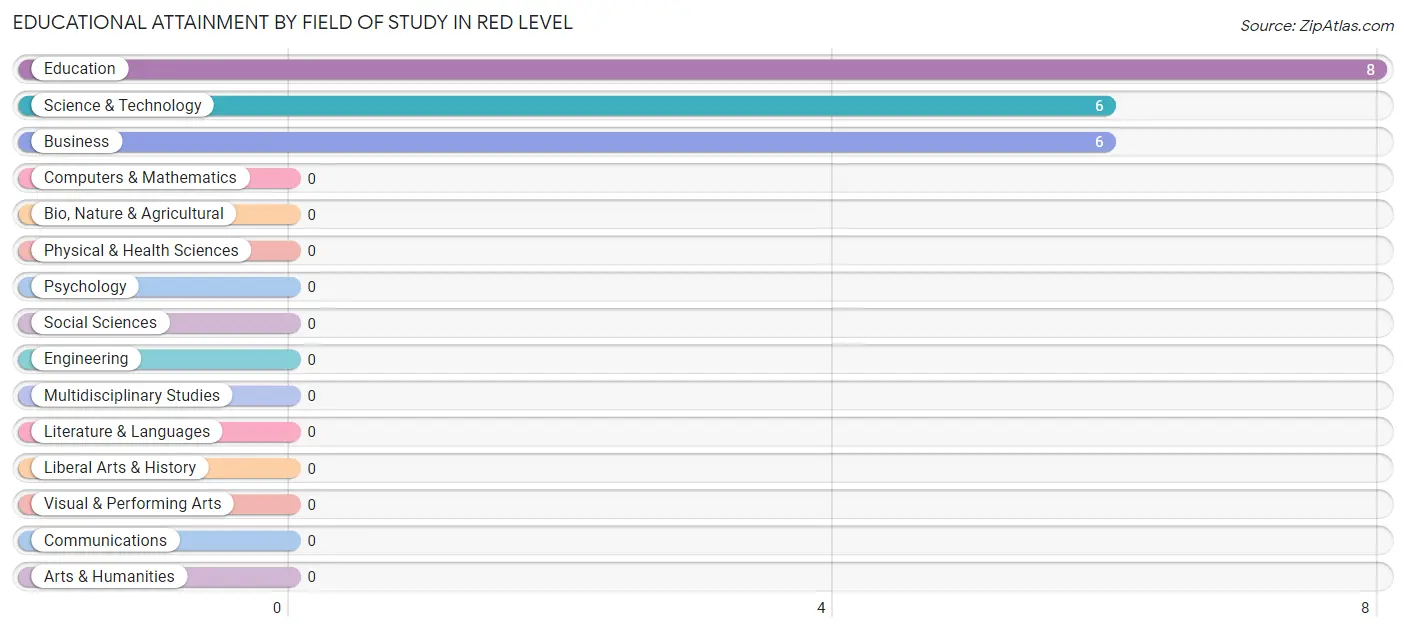
| Field of Study | # Graduates | % Graduates |
| Computers & Mathematics | 0 | 0.0% |
| Bio, Nature & Agricultural | 0 | 0.0% |
| Physical & Health Sciences | 0 | 0.0% |
| Psychology | 0 | 0.0% |
| Social Sciences | 0 | 0.0% |
| Engineering | 0 | 0.0% |
| Multidisciplinary Studies | 0 | 0.0% |
| Science & Technology | 6 | 30.0% |
| Business | 6 | 30.0% |
| Education | 8 | 40.0% |
| Literature & Languages | 0 | 0.0% |
| Liberal Arts & History | 0 | 0.0% |
| Visual & Performing Arts | 0 | 0.0% |
| Communications | 0 | 0.0% |
| Arts & Humanities | 0 | 0.0% |
| Total | 20 | 100.0% |
Transportation & Commute in Red Level
Vehicle Availability by Sex in Red Level
The most prevalent vehicle ownership categories in Red Level are males with 4 vehicles (44, accounting for 33.6%) and females with 4 vehicles (12, making up 50.6%).
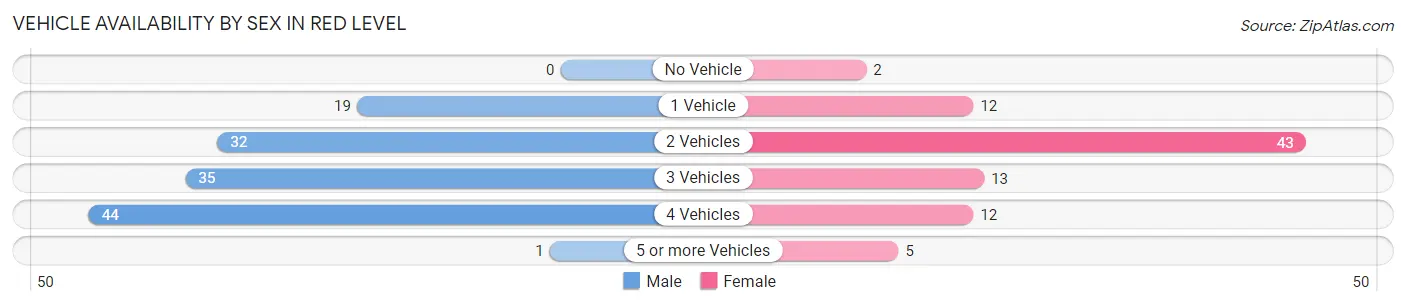
| Vehicles Available | Male | Female |
| No Vehicle | 0 (0.0%) | 2 (2.3%) |
| 1 Vehicle | 19 (14.5%) | 12 (13.8%) |
| 2 Vehicles | 32 (24.4%) | 43 (49.4%) |
| 3 Vehicles | 35 (26.7%) | 13 (14.9%) |
| 4 Vehicles | 44 (33.6%) | 12 (13.8%) |
| 5 or more Vehicles | 1 (0.8%) | 5 (5.8%) |
| Total | 131 (100.0%) | 87 (100.0%) |
Commute Time in Red Level
The most frequently occuring commute durations in Red Level are 15 to 19 minutes (51 commuters, 24.2%), 20 to 24 minutes (39 commuters, 18.5%), and less than 5 minutes (38 commuters, 18.0%).
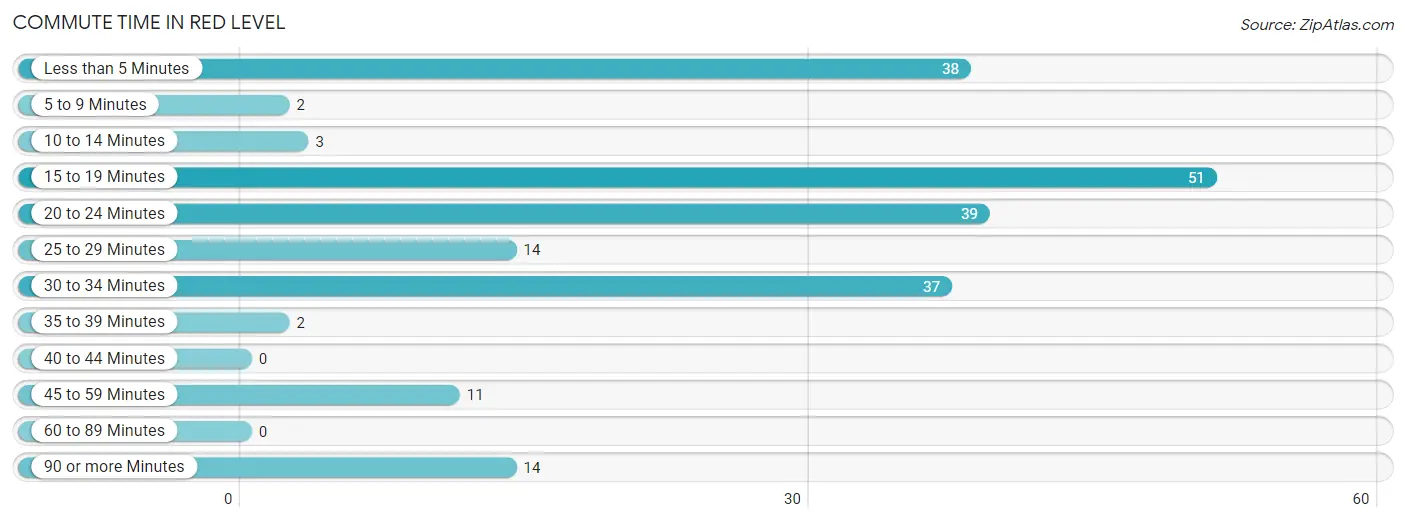
| Commute Time | # Commuters | % Commuters |
| Less than 5 Minutes | 38 | 18.0% |
| 5 to 9 Minutes | 2 | 0.9% |
| 10 to 14 Minutes | 3 | 1.4% |
| 15 to 19 Minutes | 51 | 24.2% |
| 20 to 24 Minutes | 39 | 18.5% |
| 25 to 29 Minutes | 14 | 6.6% |
| 30 to 34 Minutes | 37 | 17.5% |
| 35 to 39 Minutes | 2 | 0.9% |
| 40 to 44 Minutes | 0 | 0.0% |
| 45 to 59 Minutes | 11 | 5.2% |
| 60 to 89 Minutes | 0 | 0.0% |
| 90 or more Minutes | 14 | 6.6% |
Commute Time by Sex in Red Level
The most common commute times in Red Level are less than 5 minutes (34 commuters, 26.4%) for males and 15 to 19 minutes (24 commuters, 29.3%) for females.
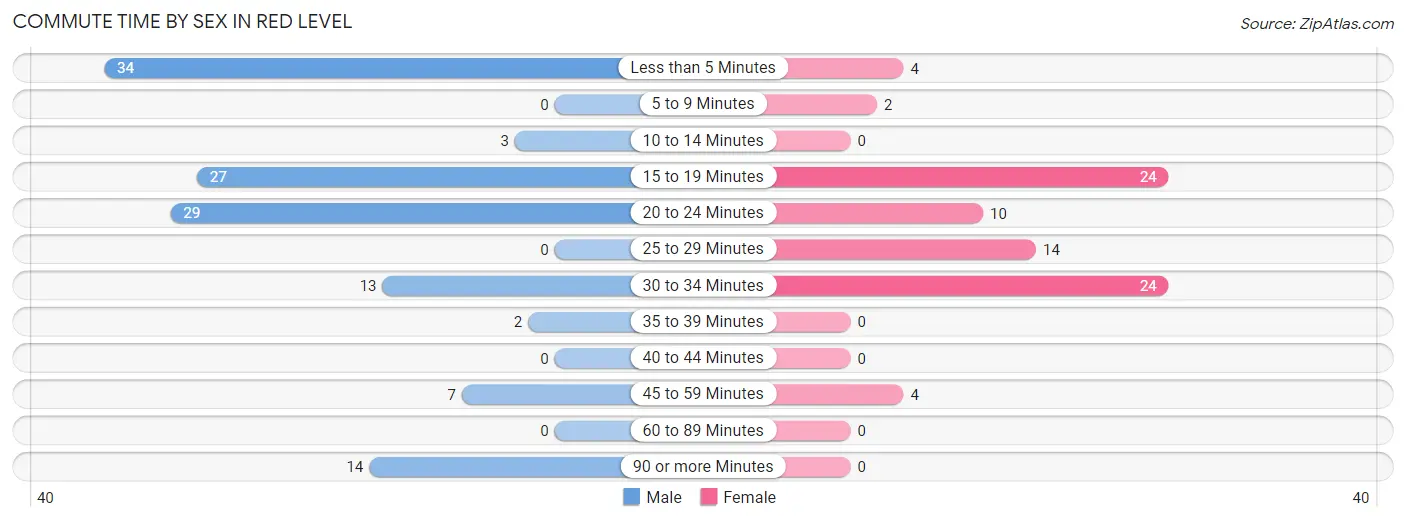
| Commute Time | Male | Female |
| Less than 5 Minutes | 34 (26.4%) | 4 (4.9%) |
| 5 to 9 Minutes | 0 (0.0%) | 2 (2.4%) |
| 10 to 14 Minutes | 3 (2.3%) | 0 (0.0%) |
| 15 to 19 Minutes | 27 (20.9%) | 24 (29.3%) |
| 20 to 24 Minutes | 29 (22.5%) | 10 (12.2%) |
| 25 to 29 Minutes | 0 (0.0%) | 14 (17.1%) |
| 30 to 34 Minutes | 13 (10.1%) | 24 (29.3%) |
| 35 to 39 Minutes | 2 (1.5%) | 0 (0.0%) |
| 40 to 44 Minutes | 0 (0.0%) | 0 (0.0%) |
| 45 to 59 Minutes | 7 (5.4%) | 4 (4.9%) |
| 60 to 89 Minutes | 0 (0.0%) | 0 (0.0%) |
| 90 or more Minutes | 14 (10.8%) | 0 (0.0%) |
Time of Departure to Work by Sex in Red Level
The most frequent times of departure to work in Red Level are 7:00 AM to 7:29 AM (25, 19.4%) for males and 11:00 AM to 11:59 AM (22, 26.8%) for females.
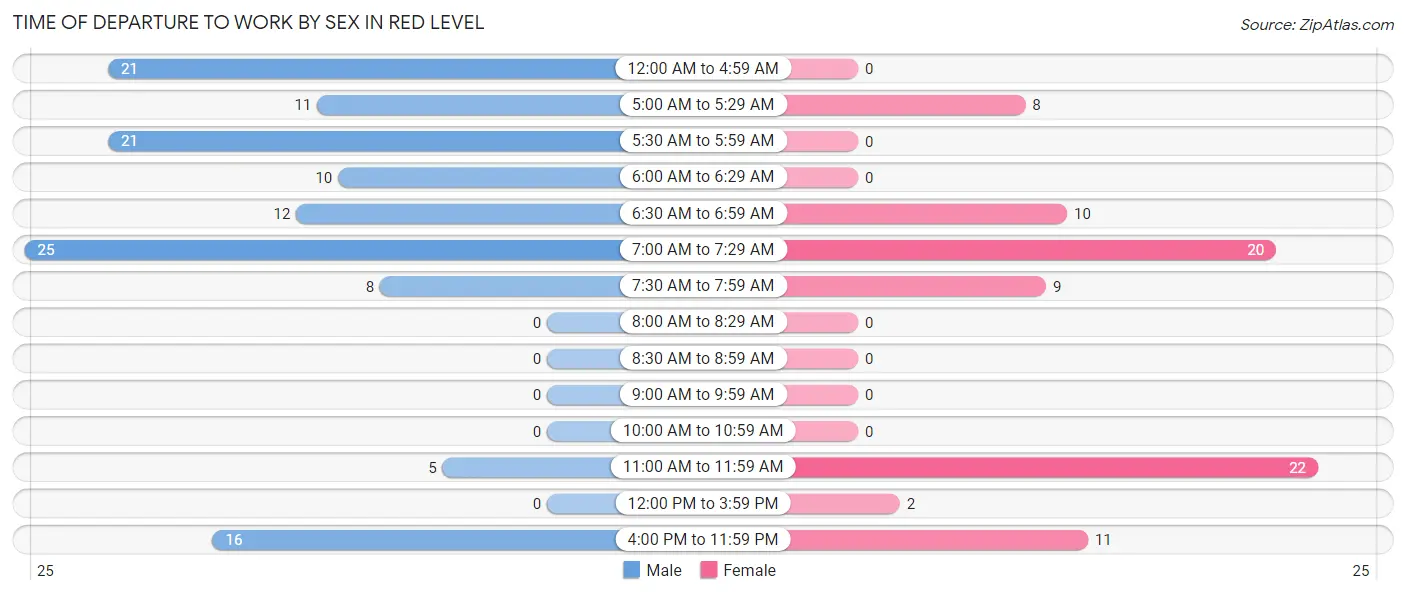
| Time of Departure | Male | Female |
| 12:00 AM to 4:59 AM | 21 (16.3%) | 0 (0.0%) |
| 5:00 AM to 5:29 AM | 11 (8.5%) | 8 (9.8%) |
| 5:30 AM to 5:59 AM | 21 (16.3%) | 0 (0.0%) |
| 6:00 AM to 6:29 AM | 10 (7.7%) | 0 (0.0%) |
| 6:30 AM to 6:59 AM | 12 (9.3%) | 10 (12.2%) |
| 7:00 AM to 7:29 AM | 25 (19.4%) | 20 (24.4%) |
| 7:30 AM to 7:59 AM | 8 (6.2%) | 9 (11.0%) |
| 8:00 AM to 8:29 AM | 0 (0.0%) | 0 (0.0%) |
| 8:30 AM to 8:59 AM | 0 (0.0%) | 0 (0.0%) |
| 9:00 AM to 9:59 AM | 0 (0.0%) | 0 (0.0%) |
| 10:00 AM to 10:59 AM | 0 (0.0%) | 0 (0.0%) |
| 11:00 AM to 11:59 AM | 5 (3.9%) | 22 (26.8%) |
| 12:00 PM to 3:59 PM | 0 (0.0%) | 2 (2.4%) |
| 4:00 PM to 11:59 PM | 16 (12.4%) | 11 (13.4%) |
| Total | 129 (100.0%) | 82 (100.0%) |
Housing Occupancy in Red Level
Occupancy by Ownership in Red Level
Of the total 159 dwellings in Red Level, owner-occupied units account for 121 (76.1%), while renter-occupied units make up 38 (23.9%).
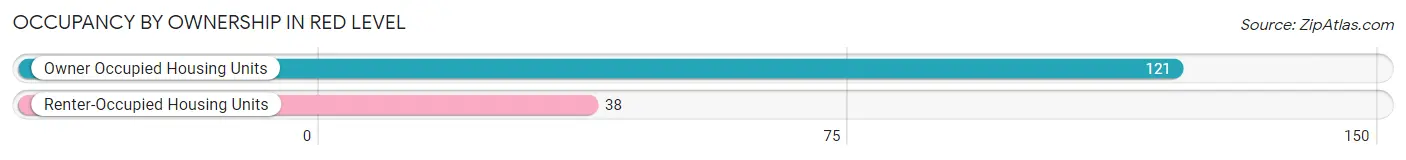
| Occupancy | # Housing Units | % Housing Units |
| Owner Occupied Housing Units | 121 | 76.1% |
| Renter-Occupied Housing Units | 38 | 23.9% |
| Total Occupied Housing Units | 159 | 100.0% |
Occupancy by Household Size in Red Level
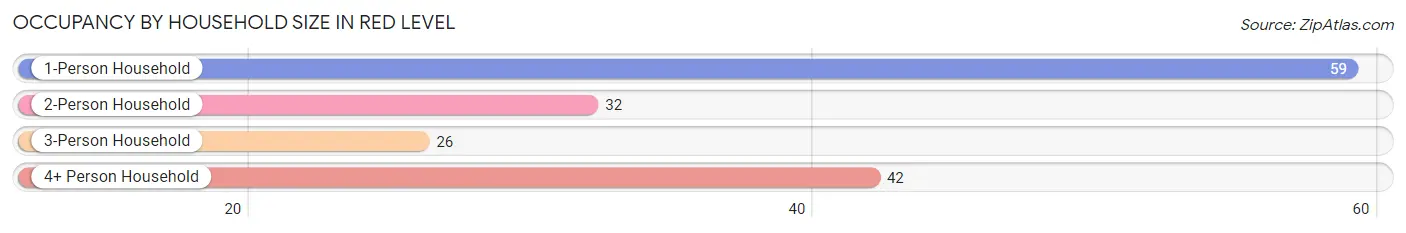
| Household Size | # Housing Units | % Housing Units |
| 1-Person Household | 59 | 37.1% |
| 2-Person Household | 32 | 20.1% |
| 3-Person Household | 26 | 16.4% |
| 4+ Person Household | 42 | 26.4% |
| Total Housing Units | 159 | 100.0% |
Occupancy by Ownership by Household Size in Red Level
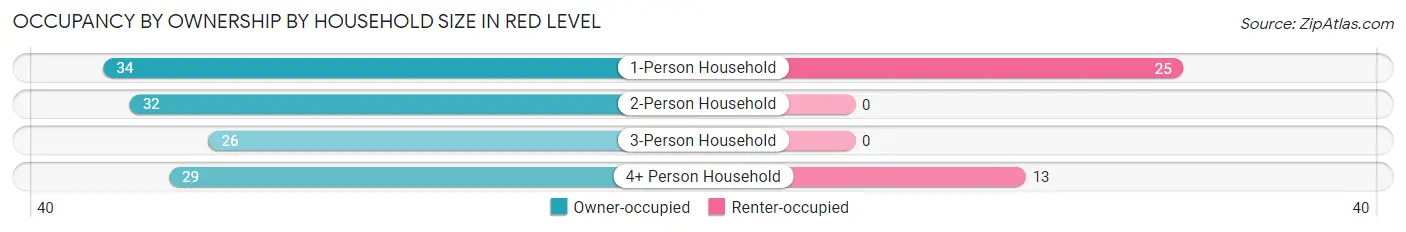
| Household Size | Owner-occupied | Renter-occupied |
| 1-Person Household | 34 (57.6%) | 25 (42.4%) |
| 2-Person Household | 32 (100.0%) | 0 (0.0%) |
| 3-Person Household | 26 (100.0%) | 0 (0.0%) |
| 4+ Person Household | 29 (69.1%) | 13 (30.9%) |
| Total Housing Units | 121 (76.1%) | 38 (23.9%) |
Occupancy by Educational Attainment in Red Level
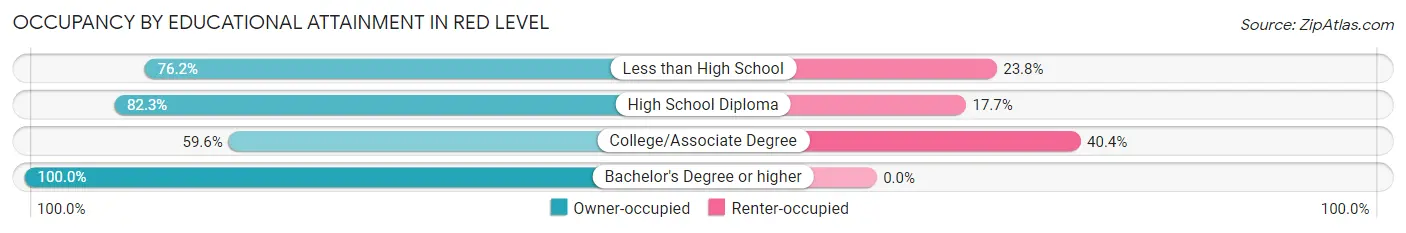
| Household Size | Owner-occupied | Renter-occupied |
| Less than High School | 16 (76.2%) | 5 (23.8%) |
| High School Diploma | 65 (82.3%) | 14 (17.7%) |
| College/Associate Degree | 28 (59.6%) | 19 (40.4%) |
| Bachelor's Degree or higher | 12 (100.0%) | 0 (0.0%) |
Occupancy by Age of Householder in Red Level
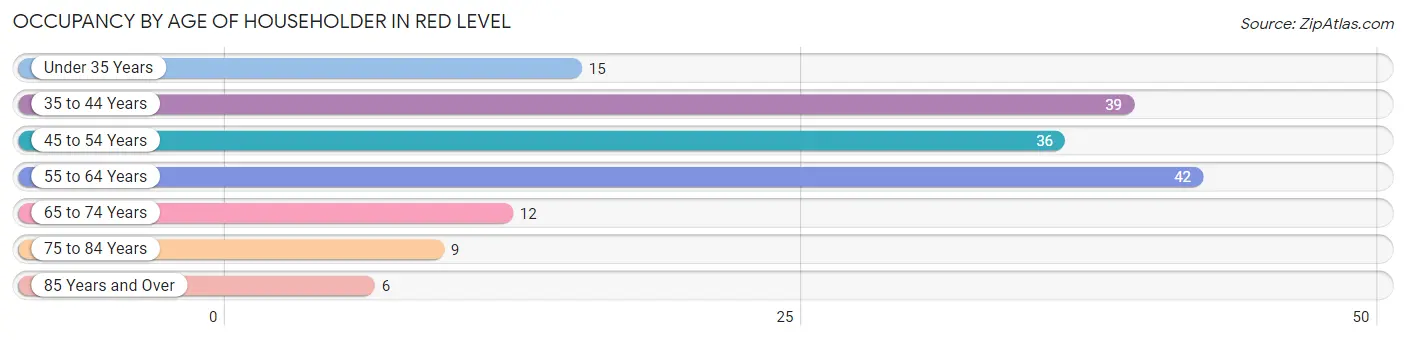
| Age Bracket | # Households | % Households |
| Under 35 Years | 15 | 9.4% |
| 35 to 44 Years | 39 | 24.5% |
| 45 to 54 Years | 36 | 22.6% |
| 55 to 64 Years | 42 | 26.4% |
| 65 to 74 Years | 12 | 7.5% |
| 75 to 84 Years | 9 | 5.7% |
| 85 Years and Over | 6 | 3.8% |
| Total | 159 | 100.0% |
Housing Finances in Red Level
Median Income by Occupancy in Red Level
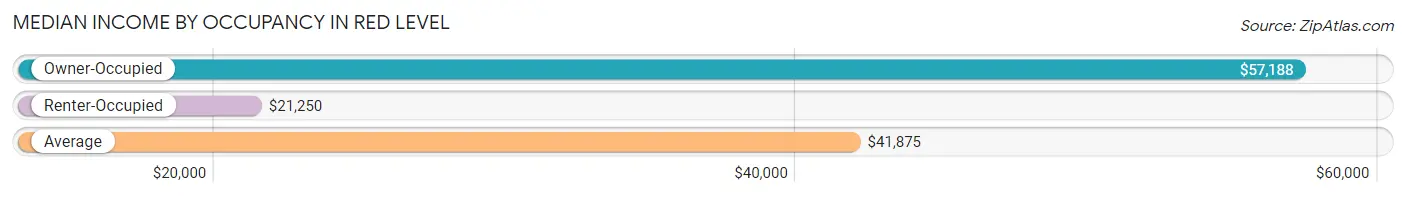
| Occupancy Type | # Households | Median Income |
| Owner-Occupied | 121 (76.1%) | $57,188 |
| Renter-Occupied | 38 (23.9%) | $21,250 |
| Average | 159 (100.0%) | $41,875 |
Occupancy by Householder Income Bracket in Red Level
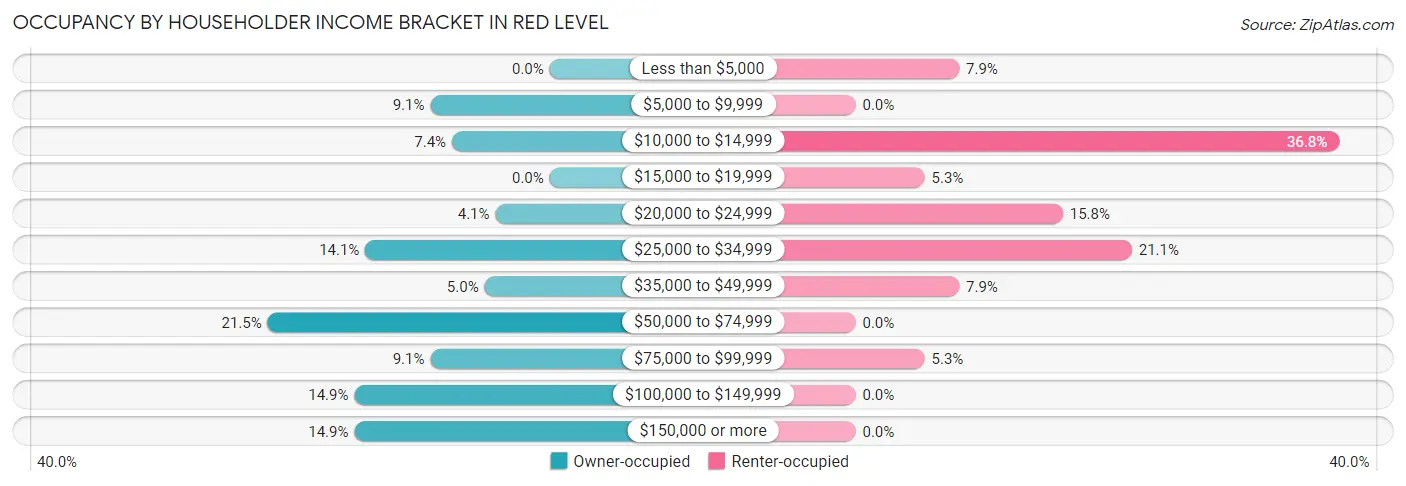
| Income Bracket | Owner-occupied | Renter-occupied |
| Less than $5,000 | 0 (0.0%) | 3 (7.9%) |
| $5,000 to $9,999 | 11 (9.1%) | 0 (0.0%) |
| $10,000 to $14,999 | 9 (7.4%) | 14 (36.8%) |
| $15,000 to $19,999 | 0 (0.0%) | 2 (5.3%) |
| $20,000 to $24,999 | 5 (4.1%) | 6 (15.8%) |
| $25,000 to $34,999 | 17 (14.1%) | 8 (21.0%) |
| $35,000 to $49,999 | 6 (5.0%) | 3 (7.9%) |
| $50,000 to $74,999 | 26 (21.5%) | 0 (0.0%) |
| $75,000 to $99,999 | 11 (9.1%) | 2 (5.3%) |
| $100,000 to $149,999 | 18 (14.9%) | 0 (0.0%) |
| $150,000 or more | 18 (14.9%) | 0 (0.0%) |
| Total | 121 (100.0%) | 38 (100.0%) |
Monthly Housing Cost Tiers in Red Level
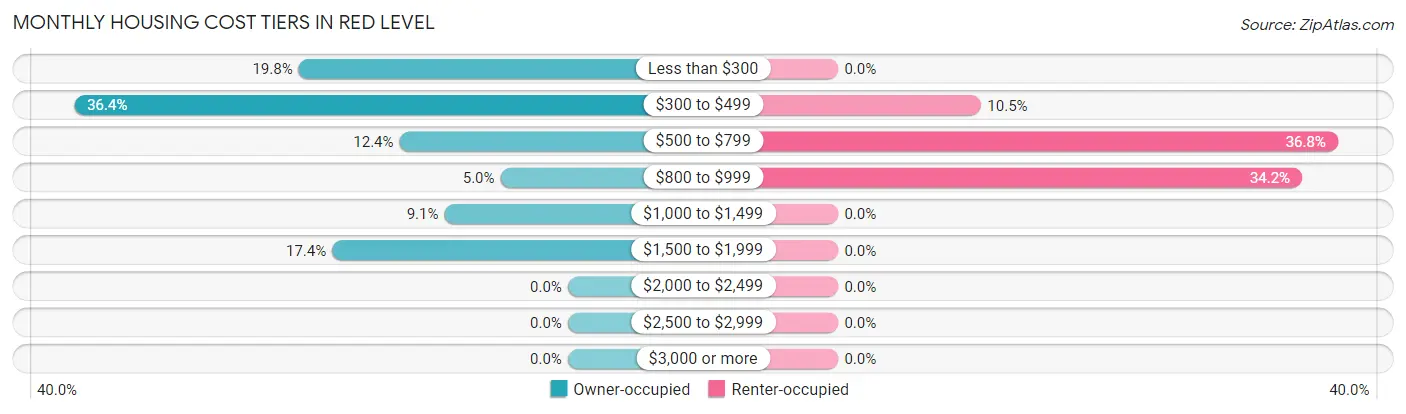
| Monthly Cost | Owner-occupied | Renter-occupied |
| Less than $300 | 24 (19.8%) | 0 (0.0%) |
| $300 to $499 | 44 (36.4%) | 4 (10.5%) |
| $500 to $799 | 15 (12.4%) | 14 (36.8%) |
| $800 to $999 | 6 (5.0%) | 13 (34.2%) |
| $1,000 to $1,499 | 11 (9.1%) | 0 (0.0%) |
| $1,500 to $1,999 | 21 (17.4%) | 0 (0.0%) |
| $2,000 to $2,499 | 0 (0.0%) | 0 (0.0%) |
| $2,500 to $2,999 | 0 (0.0%) | 0 (0.0%) |
| $3,000 or more | 0 (0.0%) | 0 (0.0%) |
| Total | 121 (100.0%) | 38 (100.0%) |
Physical Housing Characteristics in Red Level
Housing Structures in Red Level
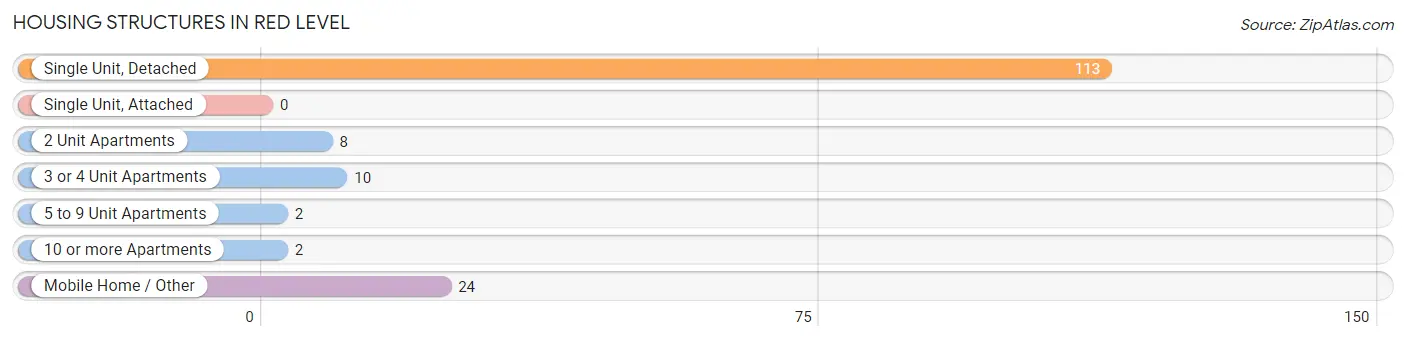
| Structure Type | # Housing Units | % Housing Units |
| Single Unit, Detached | 113 | 71.1% |
| Single Unit, Attached | 0 | 0.0% |
| 2 Unit Apartments | 8 | 5.0% |
| 3 or 4 Unit Apartments | 10 | 6.3% |
| 5 to 9 Unit Apartments | 2 | 1.3% |
| 10 or more Apartments | 2 | 1.3% |
| Mobile Home / Other | 24 | 15.1% |
| Total | 159 | 100.0% |
Housing Structures by Occupancy in Red Level
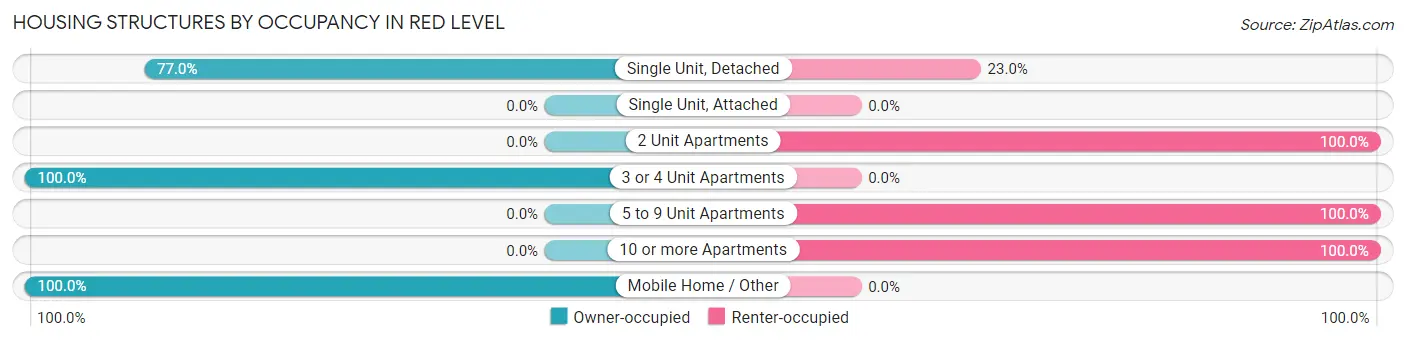
| Structure Type | Owner-occupied | Renter-occupied |
| Single Unit, Detached | 87 (77.0%) | 26 (23.0%) |
| Single Unit, Attached | 0 (0.0%) | 0 (0.0%) |
| 2 Unit Apartments | 0 (0.0%) | 8 (100.0%) |
| 3 or 4 Unit Apartments | 10 (100.0%) | 0 (0.0%) |
| 5 to 9 Unit Apartments | 0 (0.0%) | 2 (100.0%) |
| 10 or more Apartments | 0 (0.0%) | 2 (100.0%) |
| Mobile Home / Other | 24 (100.0%) | 0 (0.0%) |
| Total | 121 (76.1%) | 38 (23.9%) |
Housing Structures by Number of Rooms in Red Level
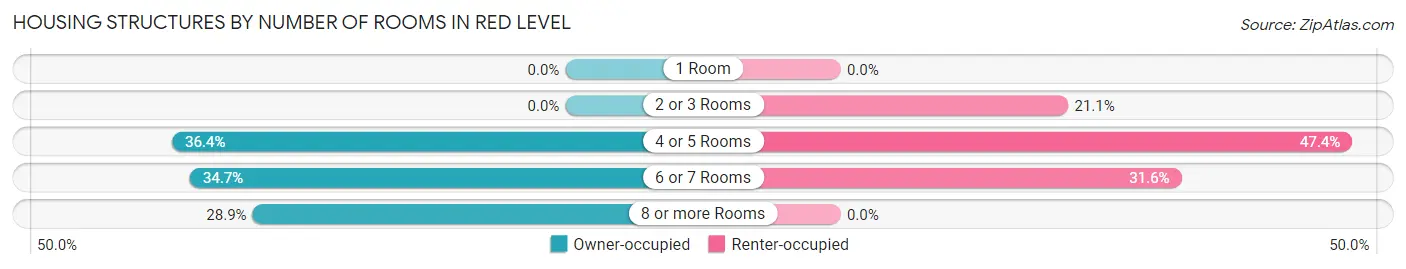
| Number of Rooms | Owner-occupied | Renter-occupied |
| 1 Room | 0 (0.0%) | 0 (0.0%) |
| 2 or 3 Rooms | 0 (0.0%) | 8 (21.0%) |
| 4 or 5 Rooms | 44 (36.4%) | 18 (47.4%) |
| 6 or 7 Rooms | 42 (34.7%) | 12 (31.6%) |
| 8 or more Rooms | 35 (28.9%) | 0 (0.0%) |
| Total | 121 (100.0%) | 38 (100.0%) |
Housing Structure by Heating Type in Red Level
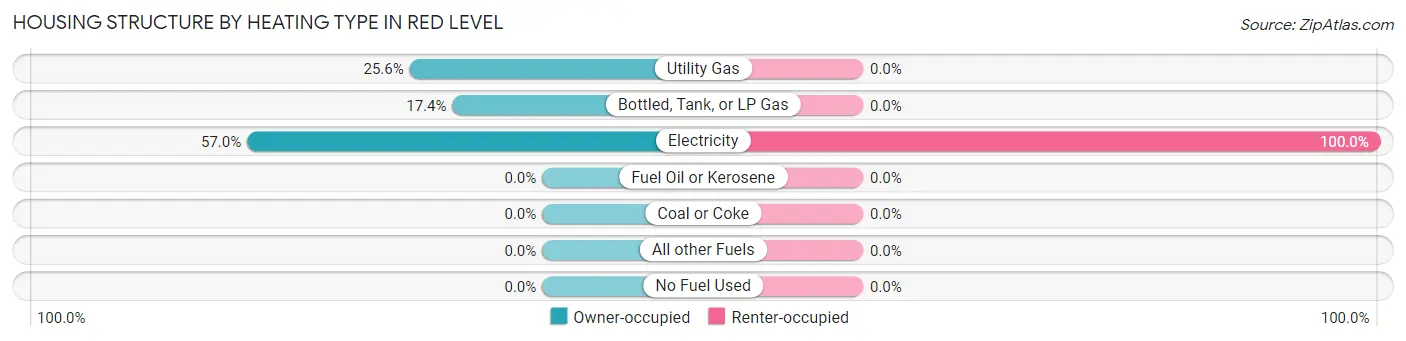
| Heating Type | Owner-occupied | Renter-occupied |
| Utility Gas | 31 (25.6%) | 0 (0.0%) |
| Bottled, Tank, or LP Gas | 21 (17.4%) | 0 (0.0%) |
| Electricity | 69 (57.0%) | 38 (100.0%) |
| Fuel Oil or Kerosene | 0 (0.0%) | 0 (0.0%) |
| Coal or Coke | 0 (0.0%) | 0 (0.0%) |
| All other Fuels | 0 (0.0%) | 0 (0.0%) |
| No Fuel Used | 0 (0.0%) | 0 (0.0%) |
| Total | 121 (100.0%) | 38 (100.0%) |
Household Vehicle Usage in Red Level
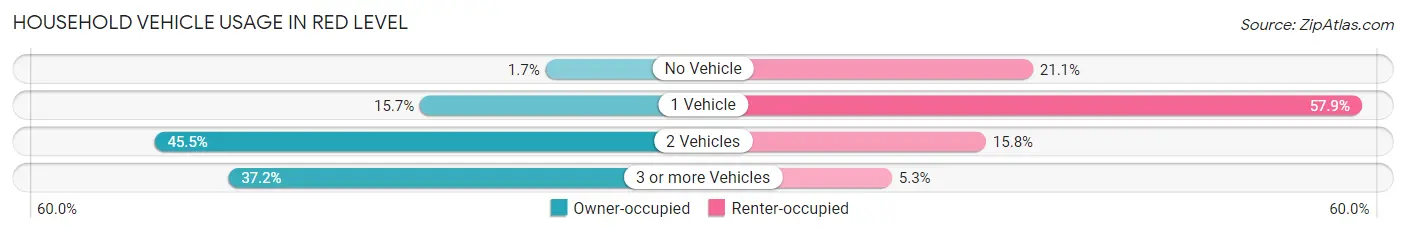
| Vehicles per Household | Owner-occupied | Renter-occupied |
| No Vehicle | 2 (1.7%) | 8 (21.0%) |
| 1 Vehicle | 19 (15.7%) | 22 (57.9%) |
| 2 Vehicles | 55 (45.5%) | 6 (15.8%) |
| 3 or more Vehicles | 45 (37.2%) | 2 (5.3%) |
| Total | 121 (100.0%) | 38 (100.0%) |
Real Estate & Mortgages in Red Level
Real Estate and Mortgage Overview in Red Level
| Characteristic | Without Mortgage | With Mortgage |
| Housing Units | 73 | 48 |
| Median Property Value | $71,000 | $93,300 |
| Median Household Income | $31,875 | $18 |
| Monthly Housing Costs | $366 | $0 |
| Real Estate Taxes | $199 | $5 |
Property Value by Mortgage Status in Red Level
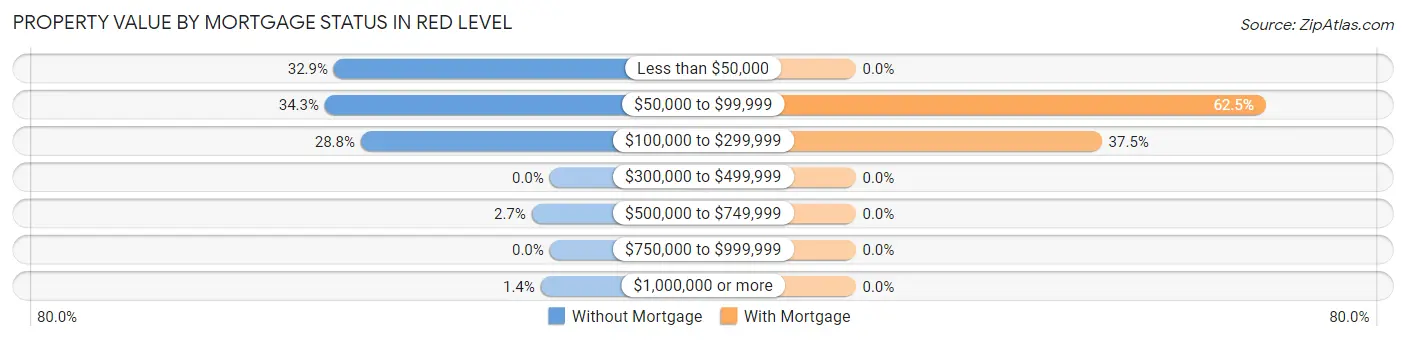
| Property Value | Without Mortgage | With Mortgage |
| Less than $50,000 | 24 (32.9%) | 0 (0.0%) |
| $50,000 to $99,999 | 25 (34.3%) | 30 (62.5%) |
| $100,000 to $299,999 | 21 (28.8%) | 18 (37.5%) |
| $300,000 to $499,999 | 0 (0.0%) | 0 (0.0%) |
| $500,000 to $749,999 | 2 (2.7%) | 0 (0.0%) |
| $750,000 to $999,999 | 0 (0.0%) | 0 (0.0%) |
| $1,000,000 or more | 1 (1.4%) | 0 (0.0%) |
| Total | 73 (100.0%) | 48 (100.0%) |
Household Income by Mortgage Status in Red Level
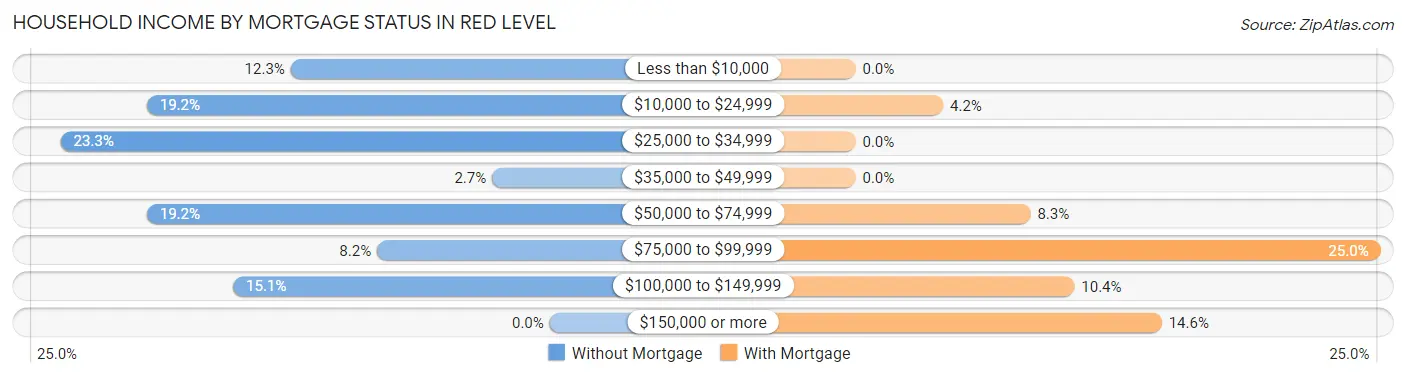
| Household Income | Without Mortgage | With Mortgage |
| Less than $10,000 | 9 (12.3%) | 0 (0.0%) |
| $10,000 to $24,999 | 14 (19.2%) | 2 (4.2%) |
| $25,000 to $34,999 | 17 (23.3%) | 0 (0.0%) |
| $35,000 to $49,999 | 2 (2.7%) | 0 (0.0%) |
| $50,000 to $74,999 | 14 (19.2%) | 4 (8.3%) |
| $75,000 to $99,999 | 6 (8.2%) | 12 (25.0%) |
| $100,000 to $149,999 | 11 (15.1%) | 5 (10.4%) |
| $150,000 or more | 0 (0.0%) | 7 (14.6%) |
| Total | 73 (100.0%) | 48 (100.0%) |
Property Value to Household Income Ratio in Red Level
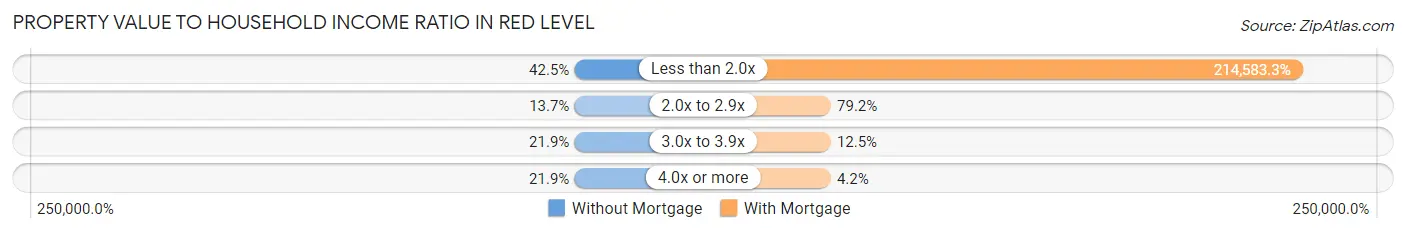
| Value-to-Income Ratio | Without Mortgage | With Mortgage |
| Less than 2.0x | 31 (42.5%) | 103,000 (214,583.3%) |
| 2.0x to 2.9x | 10 (13.7%) | 38 (79.2%) |
| 3.0x to 3.9x | 16 (21.9%) | 6 (12.5%) |
| 4.0x or more | 16 (21.9%) | 2 (4.2%) |
| Total | 73 (100.0%) | 48 (100.0%) |
Real Estate Taxes by Mortgage Status in Red Level
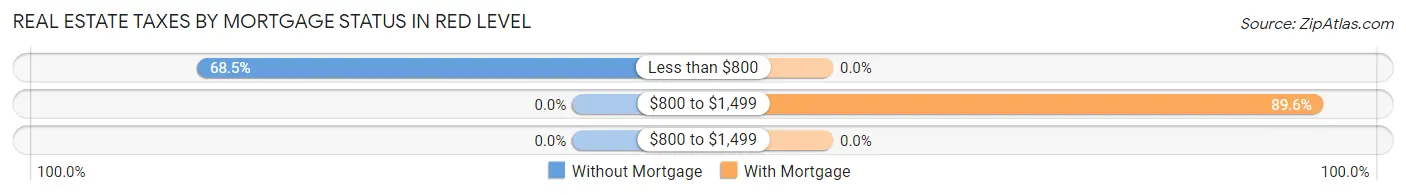
| Property Taxes | Without Mortgage | With Mortgage |
| Less than $800 | 50 (68.5%) | 0 (0.0%) |
| $800 to $1,499 | 0 (0.0%) | 43 (89.6%) |
| $800 to $1,499 | 0 (0.0%) | 0 (0.0%) |
| Total | 73 (100.0%) | 48 (100.0%) |
Health & Disability in Red Level
Health Insurance Coverage by Age in Red Level
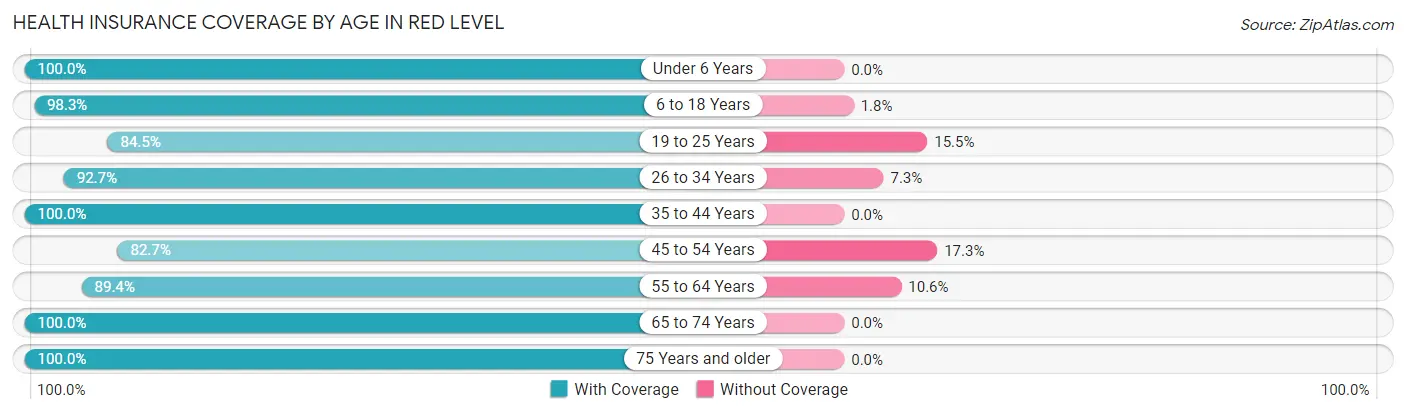
| Age Bracket | With Coverage | Without Coverage |
| Under 6 Years | 53 (100.0%) | 0 (0.0%) |
| 6 to 18 Years | 56 (98.3%) | 1 (1.8%) |
| 19 to 25 Years | 71 (84.5%) | 13 (15.5%) |
| 26 to 34 Years | 38 (92.7%) | 3 (7.3%) |
| 35 to 44 Years | 68 (100.0%) | 0 (0.0%) |
| 45 to 54 Years | 62 (82.7%) | 13 (17.3%) |
| 55 to 64 Years | 42 (89.4%) | 5 (10.6%) |
| 65 to 74 Years | 20 (100.0%) | 0 (0.0%) |
| 75 Years and older | 31 (100.0%) | 0 (0.0%) |
| Total | 441 (92.6%) | 35 (7.3%) |
Health Insurance Coverage by Citizenship Status in Red Level
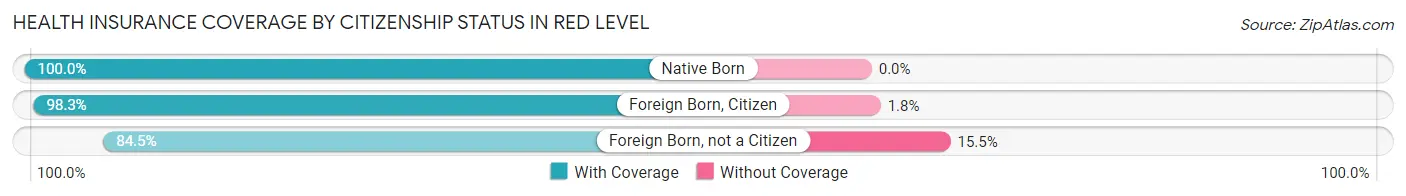
| Citizenship Status | With Coverage | Without Coverage |
| Native Born | 53 (100.0%) | 0 (0.0%) |
| Foreign Born, Citizen | 56 (98.3%) | 1 (1.8%) |
| Foreign Born, not a Citizen | 71 (84.5%) | 13 (15.5%) |
Health Insurance Coverage by Household Income in Red Level
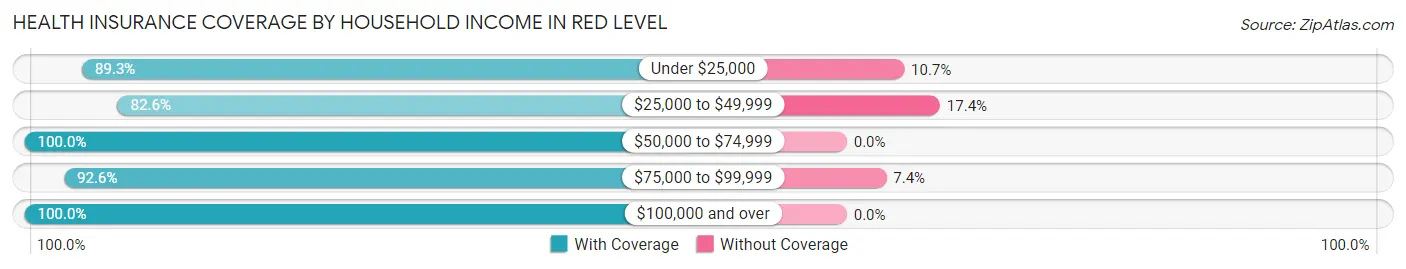
| Household Income | With Coverage | Without Coverage |
| Under $25,000 | 133 (89.3%) | 16 (10.7%) |
| $25,000 to $49,999 | 71 (82.6%) | 15 (17.4%) |
| $50,000 to $74,999 | 39 (100.0%) | 0 (0.0%) |
| $75,000 to $99,999 | 50 (92.6%) | 4 (7.4%) |
| $100,000 and over | 148 (100.0%) | 0 (0.0%) |
Public vs Private Health Insurance Coverage by Age in Red Level
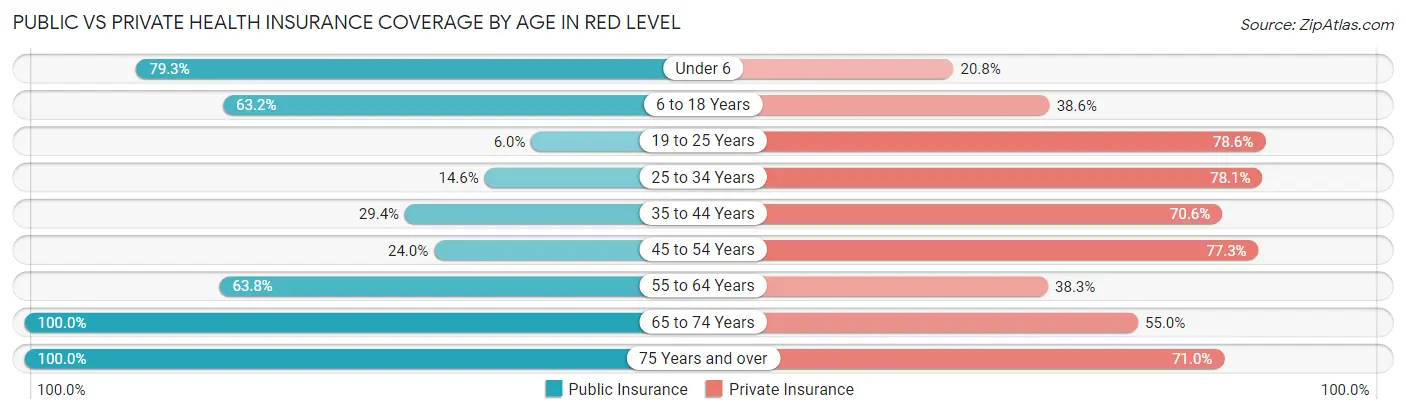
| Age Bracket | Public Insurance | Private Insurance |
| Under 6 | 42 (79.2%) | 11 (20.7%) |
| 6 to 18 Years | 36 (63.2%) | 22 (38.6%) |
| 19 to 25 Years | 5 (5.9%) | 66 (78.6%) |
| 25 to 34 Years | 6 (14.6%) | 32 (78.0%) |
| 35 to 44 Years | 20 (29.4%) | 48 (70.6%) |
| 45 to 54 Years | 18 (24.0%) | 58 (77.3%) |
| 55 to 64 Years | 30 (63.8%) | 18 (38.3%) |
| 65 to 74 Years | 20 (100.0%) | 11 (55.0%) |
| 75 Years and over | 31 (100.0%) | 22 (71.0%) |
| Total | 208 (43.7%) | 288 (60.5%) |
Disability Status by Sex by Age in Red Level
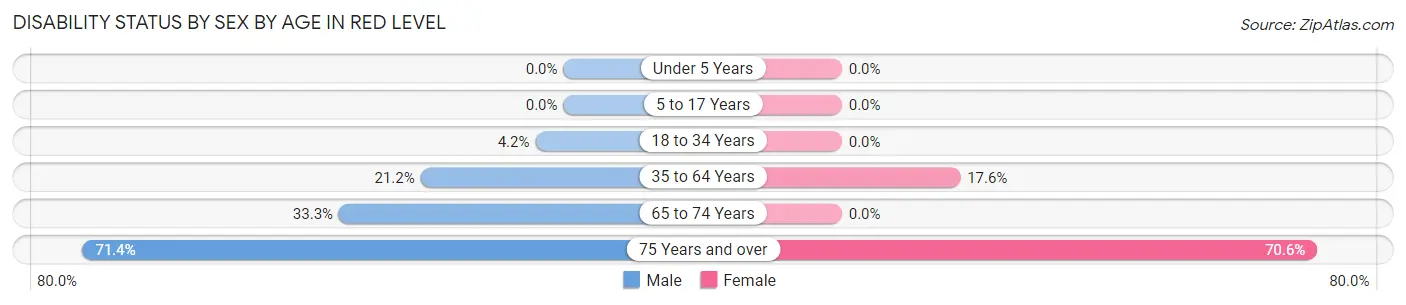
| Age Bracket | Male | Female |
| Under 5 Years | 0 (0.0%) | 0 (0.0%) |
| 5 to 17 Years | 0 (0.0%) | 0 (0.0%) |
| 18 to 34 Years | 3 (4.2%) | 0 (0.0%) |
| 35 to 64 Years | 21 (21.2%) | 16 (17.6%) |
| 65 to 74 Years | 1 (33.3%) | 0 (0.0%) |
| 75 Years and over | 10 (71.4%) | 12 (70.6%) |
Disability Class by Sex by Age in Red Level
Disability Class: Hearing Difficulty
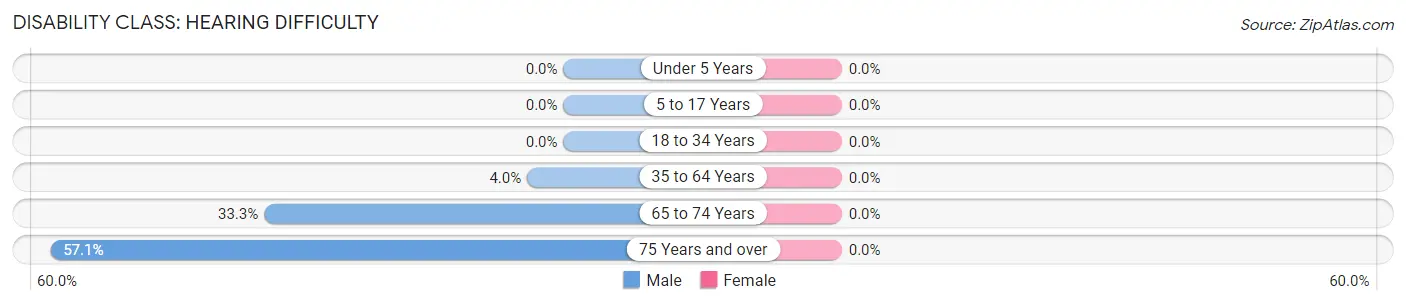
| Age Bracket | Male | Female |
| Under 5 Years | 0 (0.0%) | 0 (0.0%) |
| 5 to 17 Years | 0 (0.0%) | 0 (0.0%) |
| 18 to 34 Years | 0 (0.0%) | 0 (0.0%) |
| 35 to 64 Years | 4 (4.0%) | 0 (0.0%) |
| 65 to 74 Years | 1 (33.3%) | 0 (0.0%) |
| 75 Years and over | 8 (57.1%) | 0 (0.0%) |
Disability Class: Vision Difficulty
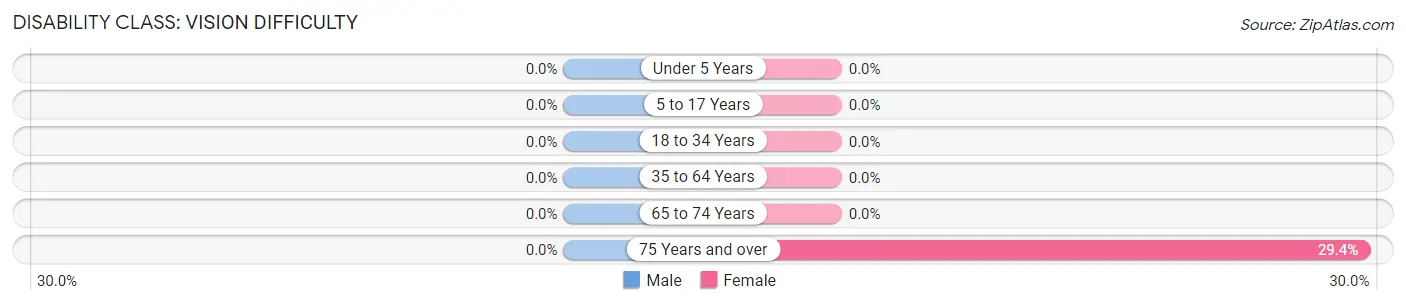
| Age Bracket | Male | Female |
| Under 5 Years | 0 (0.0%) | 0 (0.0%) |
| 5 to 17 Years | 0 (0.0%) | 0 (0.0%) |
| 18 to 34 Years | 0 (0.0%) | 0 (0.0%) |
| 35 to 64 Years | 0 (0.0%) | 0 (0.0%) |
| 65 to 74 Years | 0 (0.0%) | 0 (0.0%) |
| 75 Years and over | 0 (0.0%) | 5 (29.4%) |
Disability Class: Cognitive Difficulty
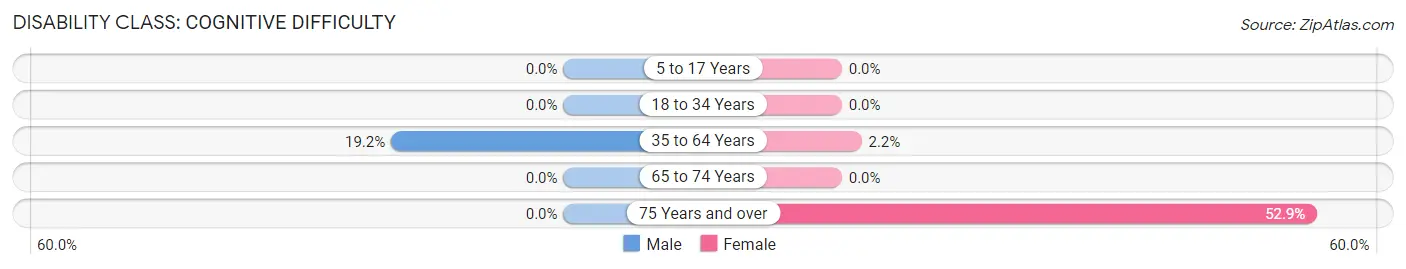
| Age Bracket | Male | Female |
| 5 to 17 Years | 0 (0.0%) | 0 (0.0%) |
| 18 to 34 Years | 0 (0.0%) | 0 (0.0%) |
| 35 to 64 Years | 19 (19.2%) | 2 (2.2%) |
| 65 to 74 Years | 0 (0.0%) | 0 (0.0%) |
| 75 Years and over | 0 (0.0%) | 9 (52.9%) |
Disability Class: Ambulatory Difficulty
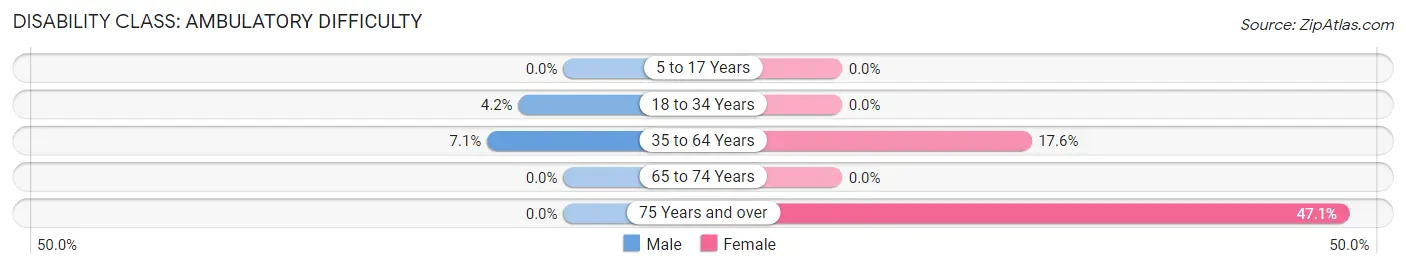
| Age Bracket | Male | Female |
| 5 to 17 Years | 0 (0.0%) | 0 (0.0%) |
| 18 to 34 Years | 3 (4.2%) | 0 (0.0%) |
| 35 to 64 Years | 7 (7.1%) | 16 (17.6%) |
| 65 to 74 Years | 0 (0.0%) | 0 (0.0%) |
| 75 Years and over | 0 (0.0%) | 8 (47.1%) |
Disability Class: Self-Care Difficulty
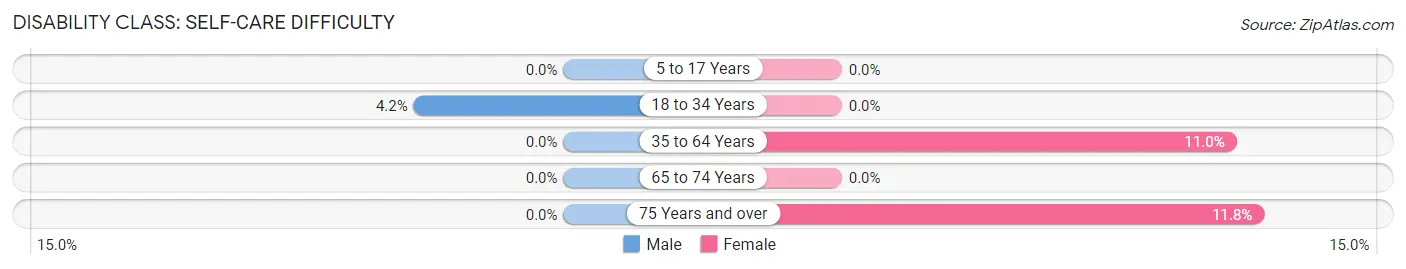
| Age Bracket | Male | Female |
| 5 to 17 Years | 0 (0.0%) | 0 (0.0%) |
| 18 to 34 Years | 3 (4.2%) | 0 (0.0%) |
| 35 to 64 Years | 0 (0.0%) | 10 (11.0%) |
| 65 to 74 Years | 0 (0.0%) | 0 (0.0%) |
| 75 Years and over | 0 (0.0%) | 2 (11.8%) |
Technology Access in Red Level
Computing Device Access in Red Level
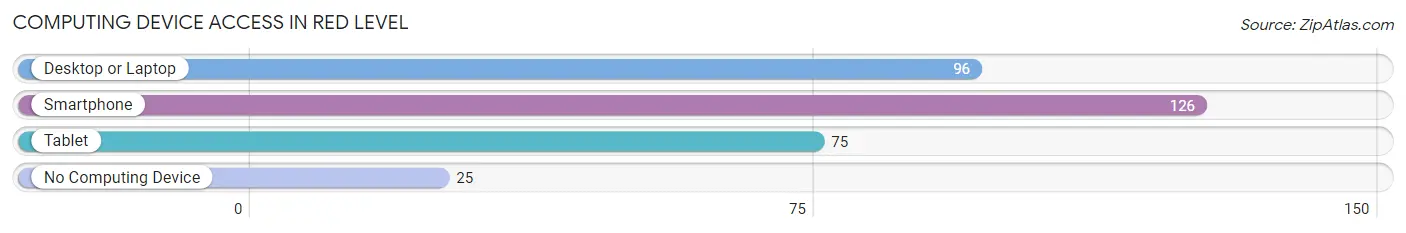
| Device Type | # Households | % Households |
| Desktop or Laptop | 96 | 60.4% |
| Smartphone | 126 | 79.2% |
| Tablet | 75 | 47.2% |
| No Computing Device | 25 | 15.7% |
| Total | 159 | 100.0% |
Internet Access in Red Level
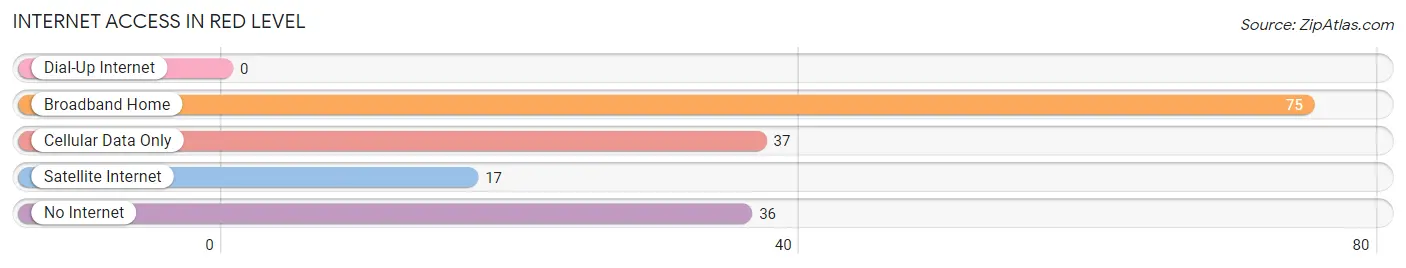
| Internet Type | # Households | % Households |
| Dial-Up Internet | 0 | 0.0% |
| Broadband Home | 75 | 47.2% |
| Cellular Data Only | 37 | 23.3% |
| Satellite Internet | 17 | 10.7% |
| No Internet | 36 | 22.6% |
| Total | 159 | 100.0% |
Red Level Summary
Red Level is a small town located in Covington County, Alabama. It is situated in the southeastern part of the state, about 20 miles south of Andalusia. The town has a population of approximately 1,000 people, and is part of the Andalusia-Opp-Florala Micropolitan Statistical Area.
Geography
Red Level is located at 31°14'25" North, 86°25'45" West (31.240278, -86.429167). It is situated in the southeastern part of Covington County, about 20 miles south of Andalusia. The town is located in the Coastal Plain region of Alabama, and is surrounded by rolling hills and pine forests. The town is situated on the banks of the Conecuh River, which flows through the area.
The climate in Red Level is humid subtropical, with hot, humid summers and mild winters. The average annual temperature is around 68°F, with an average high of around 90°F in the summer and an average low of around 40°F in the winter. The average annual precipitation is around 50 inches.
History
Red Level was founded in 1837 by settlers from Georgia and South Carolina. The town was named for the red clay soil in the area. The town was incorporated in 1845, and the first post office was established in 1846.
In the late 19th century, Red Level was a thriving agricultural community, with cotton, corn, and other crops being grown in the area. The town also had a number of sawmills and gristmills, as well as a number of stores and other businesses.
In the early 20th century, Red Level began to decline as the railroad bypassed the town. The population began to decline, and many of the businesses closed. The town was hit hard by the Great Depression, and many of the residents left in search of work.
Economy
Today, Red Level is a small, rural community. The economy is largely based on agriculture, with cotton, corn, and other crops being grown in the area. The town also has a number of small businesses, including a few restaurants, a grocery store, and a few other retail stores.
Demographics
As of the 2010 census, Red Level had a population of 1,000 people. The racial makeup of the town was 97.2% White, 0.7% African American, 0.3% Native American, 0.2% Asian, and 1.6% from other races. The median household income was $30,000, and the median family income was $35,000.
Red Level is served by the Covington County School District, which includes Red Level Elementary School, Red Level Middle School, and Red Level High School. The town also has a number of churches, including the First Baptist Church of Red Level, the Red Level United Methodist Church, and the Red Level Church of Christ.
Common Questions
What is Per Capita Income in Red Level?
Per Capita income in Red Level is $22,312.
What is the Median Family Income in Red Level?
Median Family Income in Red Level is $68,750.
What is the Median Household income in Red Level?
Median Household Income in Red Level is $41,875.
What is Inequality or Gini Index in Red Level?
Inequality or Gini Index in Red Level is 0.48.
What is the Total Population of Red Level?
Total Population of Red Level is 476.
What is the Total Male Population of Red Level?
Total Male Population of Red Level is 235.
What is the Total Female Population of Red Level?
Total Female Population of Red Level is 241.
What is the Ratio of Males per 100 Females in Red Level?
There are 97.51 Males per 100 Females in Red Level.
What is the Ratio of Females per 100 Males in Red Level?
There are 102.55 Females per 100 Males in Red Level.
What is the Median Population Age in Red Level?
Median Population Age in Red Level is 36.3 Years.
What is the Average Family Size in Red Level
Average Family Size in Red Level is 4.1 People.
What is the Average Household Size in Red Level
Average Household Size in Red Level is 3.0 People.
How Large is the Labor Force in Red Level?
There are 263 People in the Labor Forcein in Red Level.
What is the Percentage of People in the Labor Force in Red Level?
69.0% of People are in the Labor Force in Red Level.
What is the Unemployment Rate in Red Level?
Unemployment Rate in Red Level is 16.3%.