Providence, AL Map & Demographics
Providence Map
Providence Overview
$43,507
PER CAPITA INCOME
$127,750
AVG FAMILY INCOME
$67,750
AVG HOUSEHOLD INCOME
45.4%
WAGE / INCOME GAP [ % ]
54.6¢/ $1
WAGE / INCOME GAP [ $ ]
0.42
INEQUALITY / GINI INDEX
122
TOTAL POPULATION
65
MALE POPULATION
57
FEMALE POPULATION
114.04
MALES / 100 FEMALES
87.69
FEMALES / 100 MALES
58.5
MEDIAN AGE
2.9
AVG FAMILY SIZE
1.9
AVG HOUSEHOLD SIZE
56
LABOR FORCE [ PEOPLE ]
47.1%
PERCENT IN LABOR FORCE
3.6%
UNEMPLOYMENT RATE
Providence Area Codes
Income in Providence
Income Overview in Providence
Per Capita Income in Providence is $43,507, while median incomes of families and households are $127,750 and $67,750 respectively.
| Characteristic | Number | Measure |
| Per Capita Income | 122 | $43,507 |
| Median Family Income | 31 | $127,750 |
| Mean Family Income | 31 | $98,165 |
| Median Household Income | 63 | $67,750 |
| Mean Household Income | 63 | $70,216 |
| Income Deficit | 31 | $0 |
| Wage / Income Gap (%) | 122 | 45.41% |
| Wage / Income Gap ($) | 122 | 54.59¢ per $1 |
| Gini / Inequality Index | 122 | 0.42 |
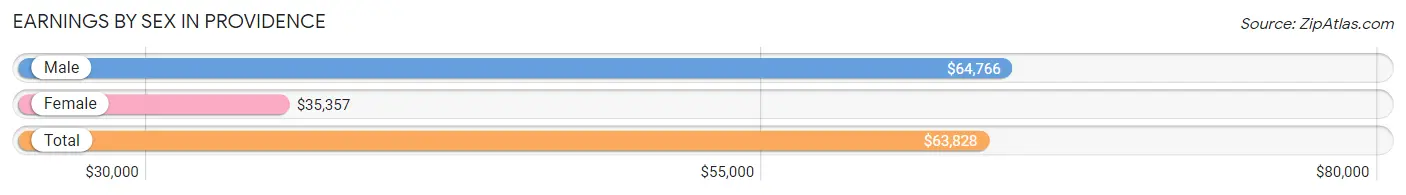
Earnings by Sex in Providence
Average Earnings in Providence are $63,828, $64,766 for men and $35,357 for women, a difference of 45.4%.
| Sex | Number | Average Earnings |
| Male | 41 (69.5%) | $64,766 |
| Female | 18 (30.5%) | $35,357 |
| Total | 59 (100.0%) | $63,828 |
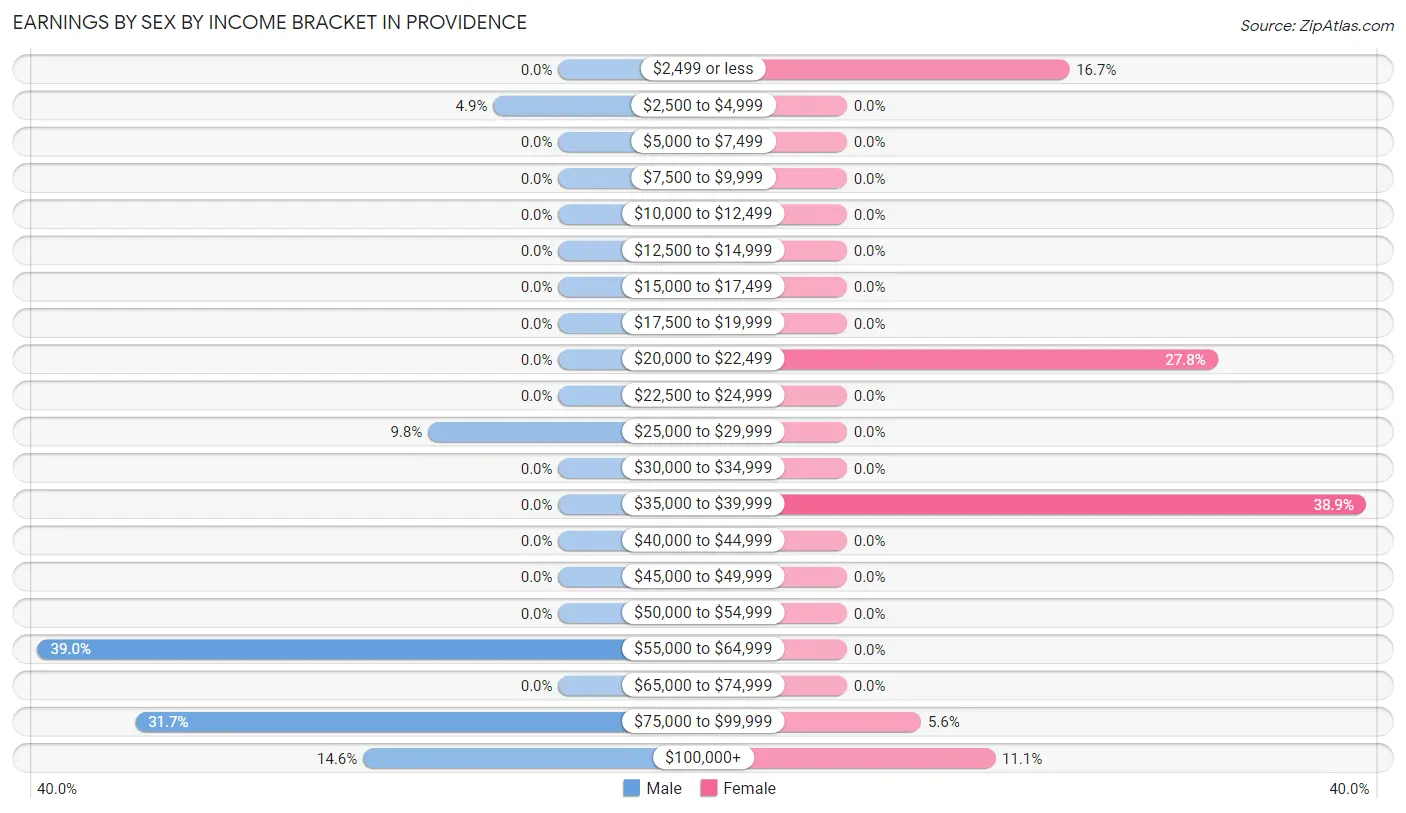
Earnings by Sex by Income Bracket in Providence
The most common earnings brackets in Providence are $55,000 to $64,999 for men (16 | 39.0%) and $35,000 to $39,999 for women (7 | 38.9%).
| Income | Male | Female |
| $2,499 or less | 0 (0.0%) | 3 (16.7%) |
| $2,500 to $4,999 | 2 (4.9%) | 0 (0.0%) |
| $5,000 to $7,499 | 0 (0.0%) | 0 (0.0%) |
| $7,500 to $9,999 | 0 (0.0%) | 0 (0.0%) |
| $10,000 to $12,499 | 0 (0.0%) | 0 (0.0%) |
| $12,500 to $14,999 | 0 (0.0%) | 0 (0.0%) |
| $15,000 to $17,499 | 0 (0.0%) | 0 (0.0%) |
| $17,500 to $19,999 | 0 (0.0%) | 0 (0.0%) |
| $20,000 to $22,499 | 0 (0.0%) | 5 (27.8%) |
| $22,500 to $24,999 | 0 (0.0%) | 0 (0.0%) |
| $25,000 to $29,999 | 4 (9.8%) | 0 (0.0%) |
| $30,000 to $34,999 | 0 (0.0%) | 0 (0.0%) |
| $35,000 to $39,999 | 0 (0.0%) | 7 (38.9%) |
| $40,000 to $44,999 | 0 (0.0%) | 0 (0.0%) |
| $45,000 to $49,999 | 0 (0.0%) | 0 (0.0%) |
| $50,000 to $54,999 | 0 (0.0%) | 0 (0.0%) |
| $55,000 to $64,999 | 16 (39.0%) | 0 (0.0%) |
| $65,000 to $74,999 | 0 (0.0%) | 0 (0.0%) |
| $75,000 to $99,999 | 13 (31.7%) | 1 (5.6%) |
| $100,000+ | 6 (14.6%) | 2 (11.1%) |
| Total | 41 (100.0%) | 18 (100.0%) |
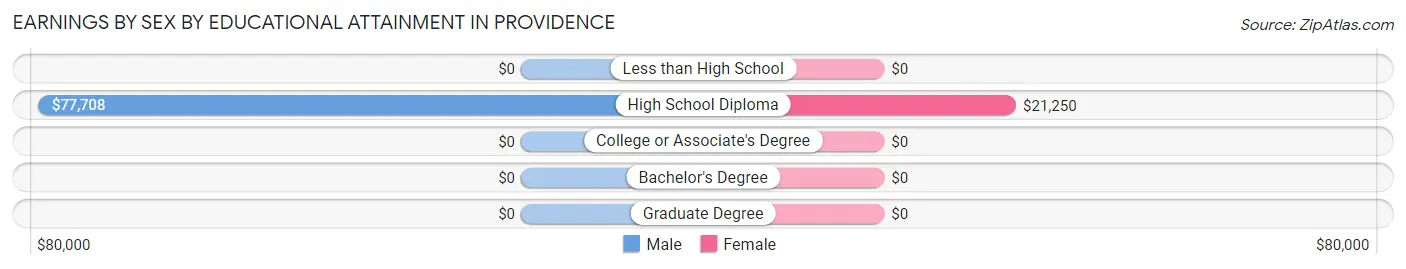
Earnings by Sex by Educational Attainment in Providence
Average earnings in Providence are $64,766 for men and $35,357 for women, a difference of 45.4%. Men with an educational attainment of high school diploma enjoy the highest average annual earnings of $77,708, while those with high school diploma education earn the least with $77,708. Women with an educational attainment of high school diploma earn the most with the average annual earnings of $21,250, while those with high school diploma education have the smallest earnings of $21,250.
| Educational Attainment | Male Income | Female Income |
| Less than High School | - | - |
| High School Diploma | $77,708 | $21,250 |
| College or Associate's Degree | - | - |
| Bachelor's Degree | - | - |
| Graduate Degree | - | - |
| Total | $64,766 | $35,357 |
Family Income in Providence
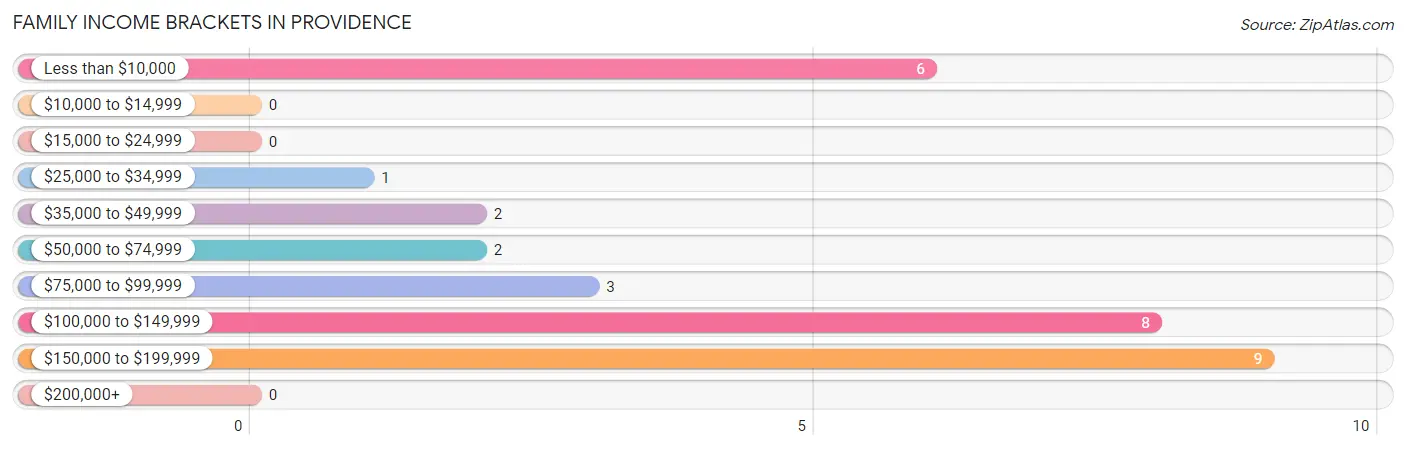
Family Income Brackets in Providence
According to the Providence family income data, there are 9 families falling into the $150,000 to $199,999 income range, which is the most common income bracket and makes up 29.0% of all families.
| Income Bracket | # Families | % Families |
| Less than $10,000 | 6 | 19.4% |
| $10,000 to $14,999 | 0 | 0.0% |
| $15,000 to $24,999 | 0 | 0.0% |
| $25,000 to $34,999 | 1 | 3.2% |
| $35,000 to $49,999 | 2 | 6.5% |
| $50,000 to $74,999 | 2 | 6.5% |
| $75,000 to $99,999 | 3 | 9.7% |
| $100,000 to $149,999 | 8 | 25.8% |
| $150,000 to $199,999 | 9 | 29.0% |
| $200,000+ | 0 | 0.0% |
Family Income by Famaliy Size in Providence
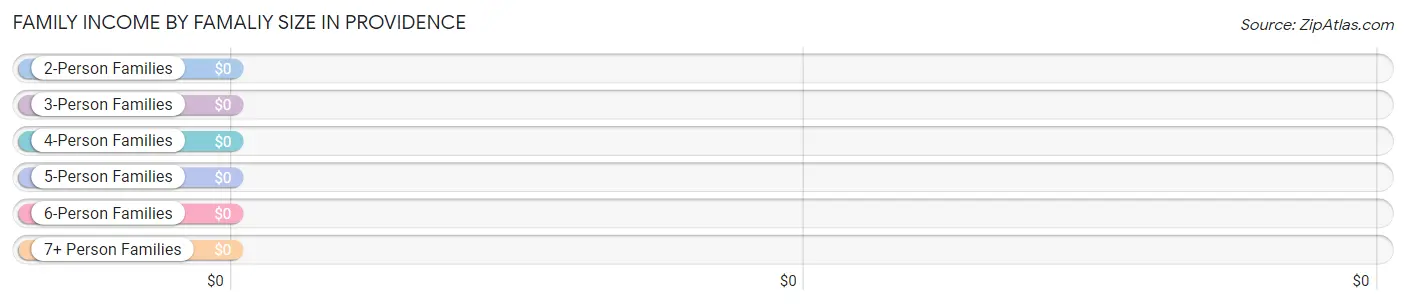
| Income Bracket | # Families | Median Income |
| 2-Person Families | 23 (74.2%) | $0 |
| 3-Person Families | 5 (16.1%) | $0 |
| 4-Person Families | 3 (9.7%) | $0 |
| 5-Person Families | 0 (0.0%) | $0 |
| 6-Person Families | 0 (0.0%) | $0 |
| 7+ Person Families | 0 (0.0%) | $0 |
| Total | 31 (100.0%) | $127,750 |
Family Income by Number of Earners in Providence
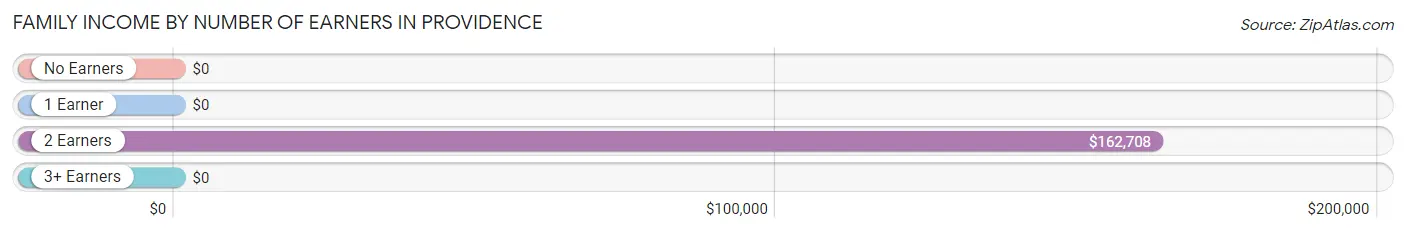
| Number of Earners | # Families | Median Income |
| No Earners | 10 (32.3%) | $0 |
| 1 Earner | 10 (32.3%) | $0 |
| 2 Earners | 11 (35.5%) | $162,708 |
| 3+ Earners | 0 (0.0%) | $0 |
| Total | 31 (100.0%) | $127,750 |
Household Income in Providence
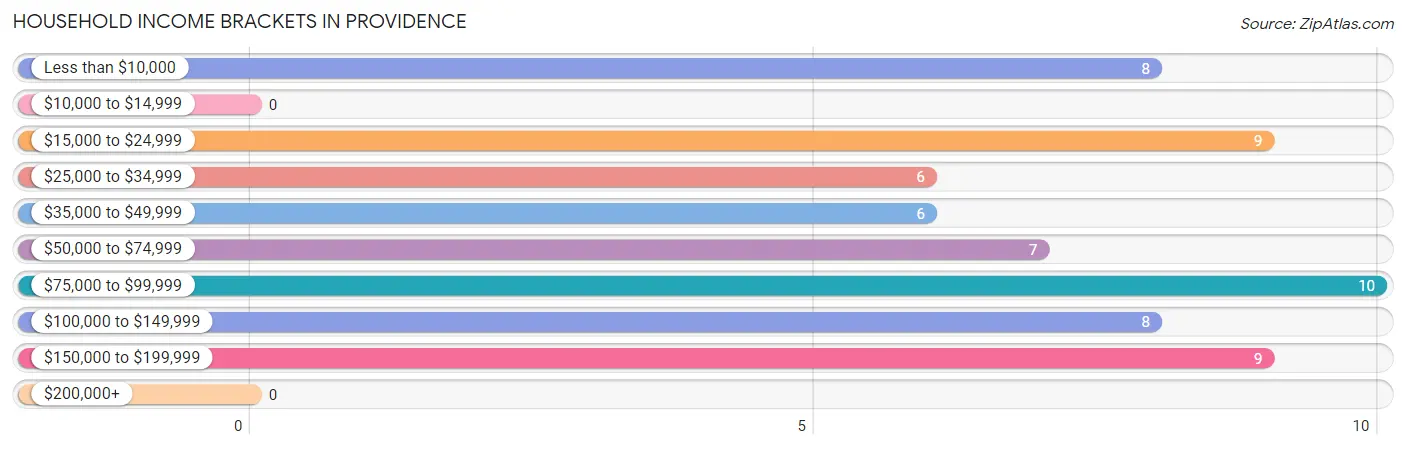
Household Income Brackets in Providence
With 10 households falling in the category, the $75,000 to $99,999 income range is the most frequent in Providence, accounting for 15.9% of all households.
| Income Bracket | # Households | % Households |
| Less than $10,000 | 8 | 12.7% |
| $10,000 to $14,999 | 0 | 0.0% |
| $15,000 to $24,999 | 9 | 14.3% |
| $25,000 to $34,999 | 6 | 9.5% |
| $35,000 to $49,999 | 6 | 9.5% |
| $50,000 to $74,999 | 7 | 11.1% |
| $75,000 to $99,999 | 10 | 15.9% |
| $100,000 to $149,999 | 8 | 12.7% |
| $150,000 to $199,999 | 9 | 14.3% |
| $200,000+ | 0 | 0.0% |
Household Income by Householder Age in Providence
The median household income in Providence is $67,750, with the highest median household income of $69,500 found in the 45 to 64 years age bracket for the primary householder. A total of 34 households (54.0%) fall into this category.
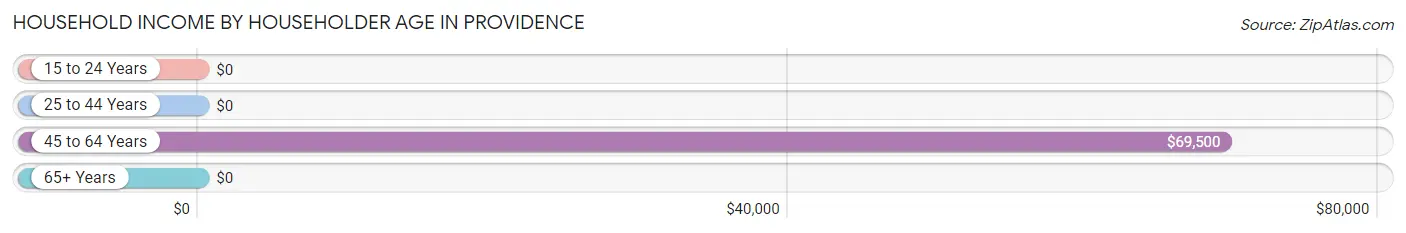
| Income Bracket | # Households | Median Income |
| 15 to 24 Years | 0 (0.0%) | $0 |
| 25 to 44 Years | 0 (0.0%) | $0 |
| 45 to 64 Years | 34 (54.0%) | $69,500 |
| 65+ Years | 29 (46.0%) | $0 |
| Total | 63 (100.0%) | $67,750 |
Poverty in Providence
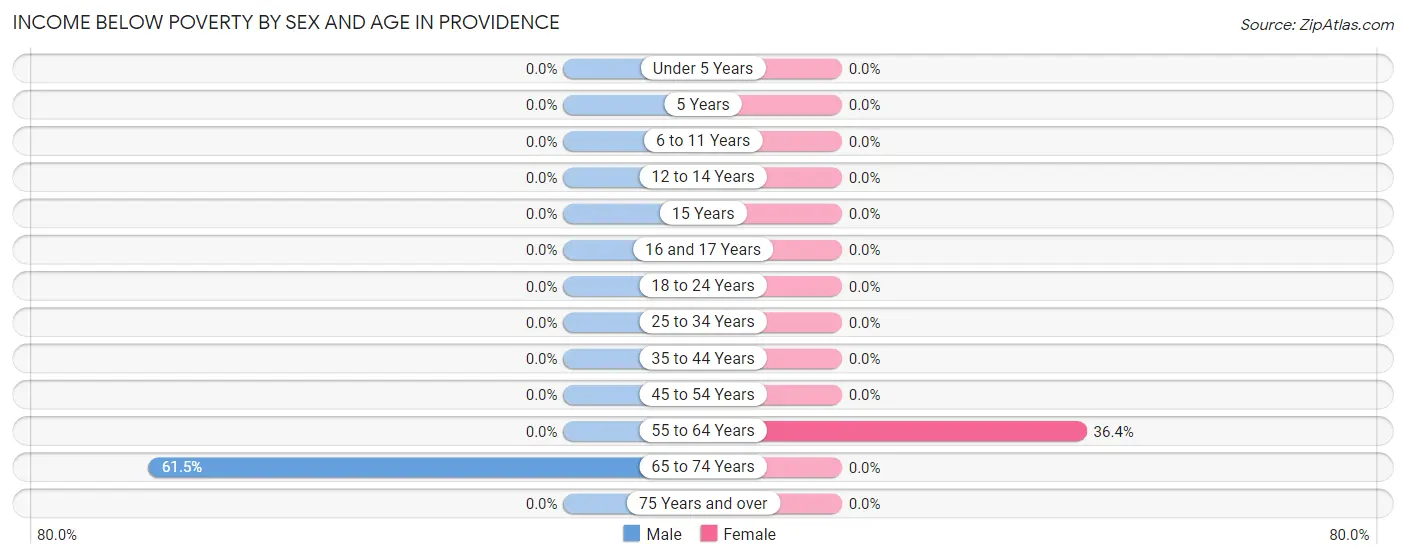
Income Below Poverty by Sex and Age in Providence
With 12.3% poverty level for males and 14.0% for females among the residents of Providence, 65 to 74 year old males and 55 to 64 year old females are the most vulnerable to poverty, with 8 males (61.5%) and 8 females (36.4%) in their respective age groups living below the poverty level.
| Age Bracket | Male | Female |
| Under 5 Years | 0 (0.0%) | 0 (0.0%) |
| 5 Years | 0 (0.0%) | 0 (0.0%) |
| 6 to 11 Years | 0 (0.0%) | 0 (0.0%) |
| 12 to 14 Years | 0 (0.0%) | 0 (0.0%) |
| 15 Years | 0 (0.0%) | 0 (0.0%) |
| 16 and 17 Years | 0 (0.0%) | 0 (0.0%) |
| 18 to 24 Years | 0 (0.0%) | 0 (0.0%) |
| 25 to 34 Years | 0 (0.0%) | 0 (0.0%) |
| 35 to 44 Years | 0 (0.0%) | 0 (0.0%) |
| 45 to 54 Years | 0 (0.0%) | 0 (0.0%) |
| 55 to 64 Years | 0 (0.0%) | 8 (36.4%) |
| 65 to 74 Years | 8 (61.5%) | 0 (0.0%) |
| 75 Years and over | 0 (0.0%) | 0 (0.0%) |
| Total | 8 (12.3%) | 8 (14.0%) |
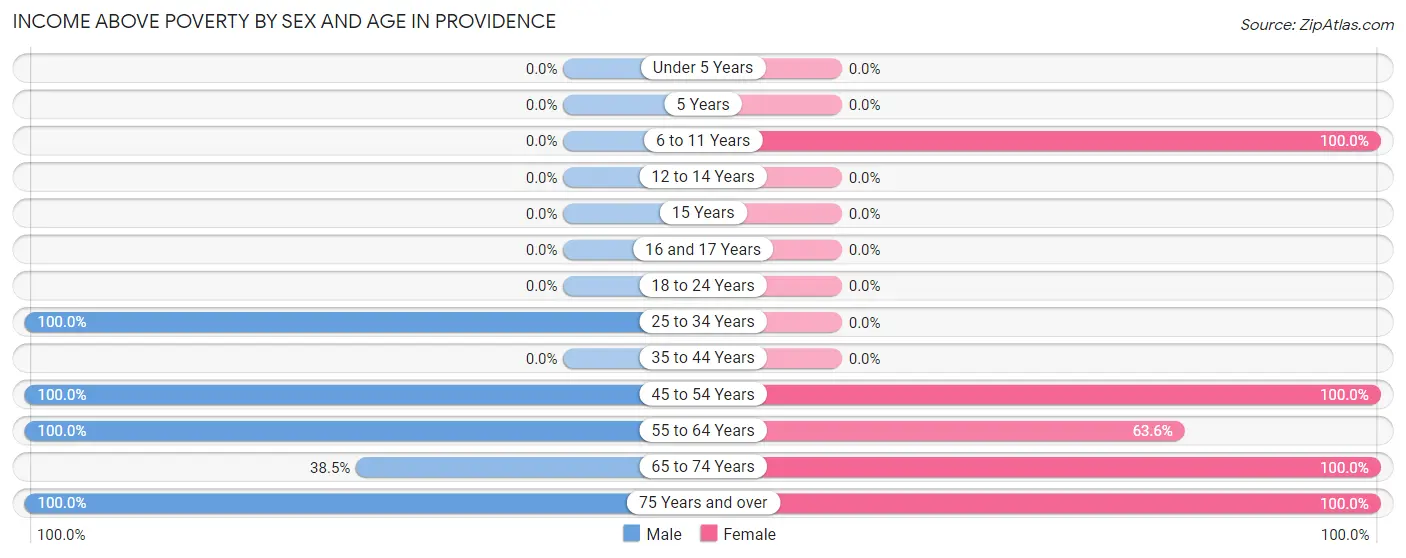
Income Above Poverty by Sex and Age in Providence
According to the poverty statistics in Providence, males aged 25 to 34 years and females aged 6 to 11 years are the age groups that are most secure financially, with 100.0% of males and 100.0% of females in these age groups living above the poverty line.
| Age Bracket | Male | Female |
| Under 5 Years | 0 (0.0%) | 0 (0.0%) |
| 5 Years | 0 (0.0%) | 0 (0.0%) |
| 6 to 11 Years | 0 (0.0%) | 3 (100.0%) |
| 12 to 14 Years | 0 (0.0%) | 0 (0.0%) |
| 15 Years | 0 (0.0%) | 0 (0.0%) |
| 16 and 17 Years | 0 (0.0%) | 0 (0.0%) |
| 18 to 24 Years | 0 (0.0%) | 0 (0.0%) |
| 25 to 34 Years | 6 (100.0%) | 0 (0.0%) |
| 35 to 44 Years | 0 (0.0%) | 0 (0.0%) |
| 45 to 54 Years | 6 (100.0%) | 15 (100.0%) |
| 55 to 64 Years | 30 (100.0%) | 14 (63.6%) |
| 65 to 74 Years | 5 (38.5%) | 8 (100.0%) |
| 75 Years and over | 10 (100.0%) | 9 (100.0%) |
| Total | 57 (87.7%) | 49 (86.0%) |
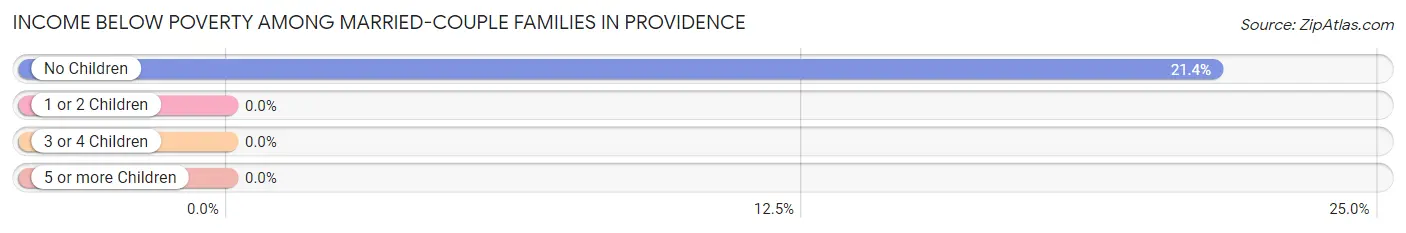
Income Below Poverty Among Married-Couple Families in Providence
The poverty statistics for married-couple families in Providence show that 21.4% or 6 of the total 28 families live below the poverty line. Families with no children have the highest poverty rate of 21.4%, comprising of 6 families. On the other hand, families with no children have the lowest poverty rate of 21.4%, which includes 6 families.
| Children | Above Poverty | Below Poverty |
| No Children | 22 (78.6%) | 6 (21.4%) |
| 1 or 2 Children | 0 (0.0%) | 0 (0.0%) |
| 3 or 4 Children | 0 (0.0%) | 0 (0.0%) |
| 5 or more Children | 0 (0.0%) | 0 (0.0%) |
| Total | 22 (78.6%) | 6 (21.4%) |
Income Below Poverty Among Single-Parent Households in Providence
| Children | Single Father | Single Mother |
| No Children | 0 (0.0%) | 0 (0.0%) |
| 1 or 2 Children | 0 (0.0%) | 0 (0.0%) |
| 3 or 4 Children | 0 (0.0%) | 0 (0.0%) |
| 5 or more Children | 0 (0.0%) | 0 (0.0%) |
| Total | 0 (0.0%) | 0 (0.0%) |
Income Below Poverty Among Married-Couple vs Single-Parent Households in Providence
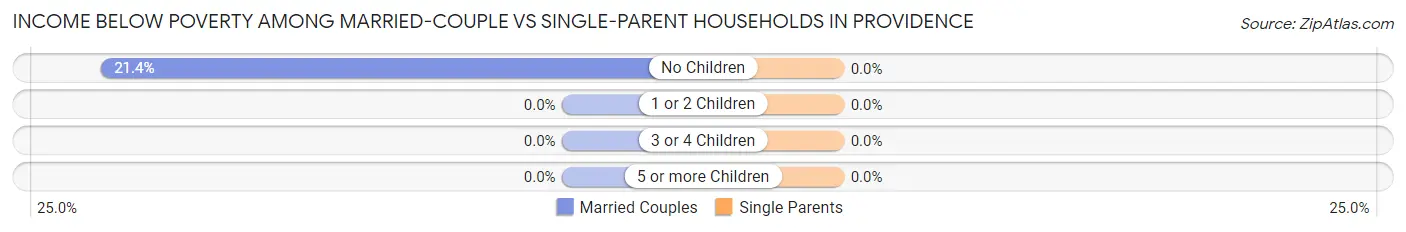
| Children | Married-Couple Families | Single-Parent Households |
| No Children | 6 (21.4%) | 0 (0.0%) |
| 1 or 2 Children | 0 (0.0%) | 0 (0.0%) |
| 3 or 4 Children | 0 (0.0%) | 0 (0.0%) |
| 5 or more Children | 0 (0.0%) | 0 (0.0%) |
| Total | 6 (21.4%) | 0 (0.0%) |
Race in Providence
The most populous races in Providence are White / Caucasian (117 | 95.9%), Black / African American (5 | 4.1%), and Hispanic or Latino (1 | 0.8%).
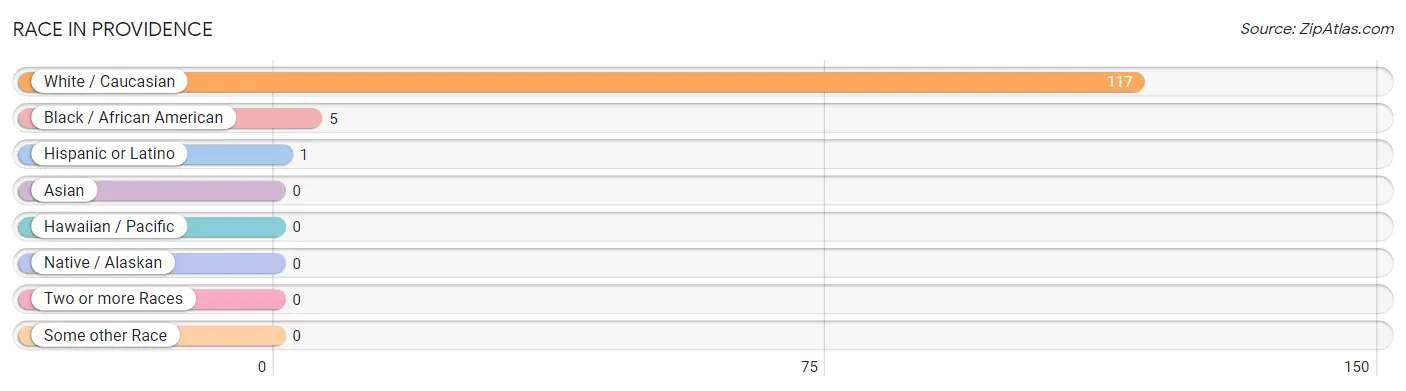
| Race | # Population | % Population |
| Asian | 0 | 0.0% |
| Black / African American | 5 | 4.1% |
| Hawaiian / Pacific | 0 | 0.0% |
| Hispanic or Latino | 1 | 0.8% |
| Native / Alaskan | 0 | 0.0% |
| White / Caucasian | 117 | 95.9% |
| Two or more Races | 0 | 0.0% |
| Some other Race | 0 | 0.0% |
| Total | 122 | 100.0% |
Ancestry in Providence
The most populous ancestries reported in Providence are German (39 | 32.0%), American (29 | 23.8%), Irish (29 | 23.8%), English (6 | 4.9%), and European (2 | 1.6%), together accounting for 86.1% of all Providence residents.
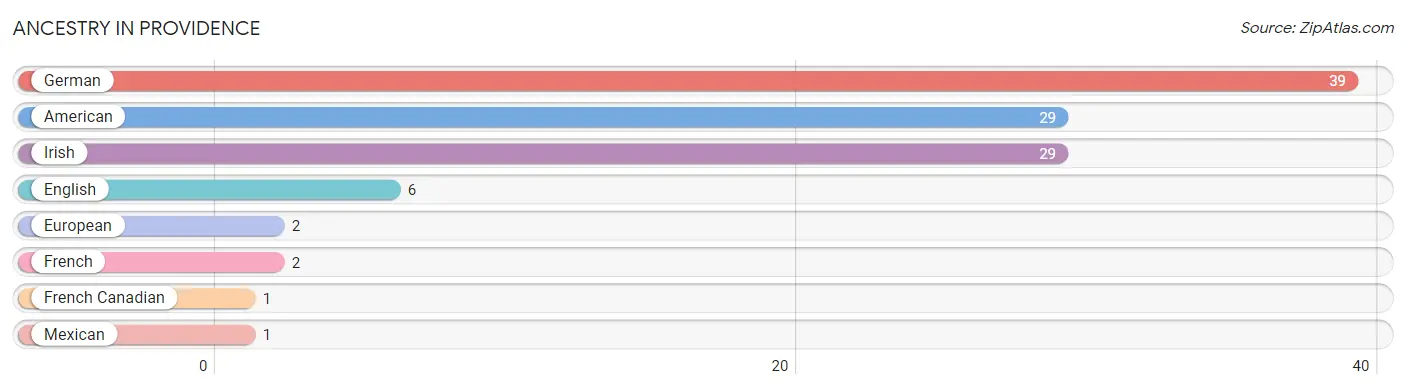
| Ancestry | # Population | % Population |
| American | 29 | 23.8% |
| English | 6 | 4.9% |
| European | 2 | 1.6% |
| French | 2 | 1.6% |
| French Canadian | 1 | 0.8% |
| German | 39 | 32.0% |
| Irish | 29 | 23.8% |
| Mexican | 1 | 0.8% | View All 8 Rows |
Immigrants in Providence

| Immigration Origin | # Population | % Population | View All 0 Rows |
Sex and Age in Providence
Sex and Age in Providence
The most populous age groups in Providence are 55 to 59 Years (28 | 43.1%) for men and 55 to 59 Years (13 | 22.8%) for women.
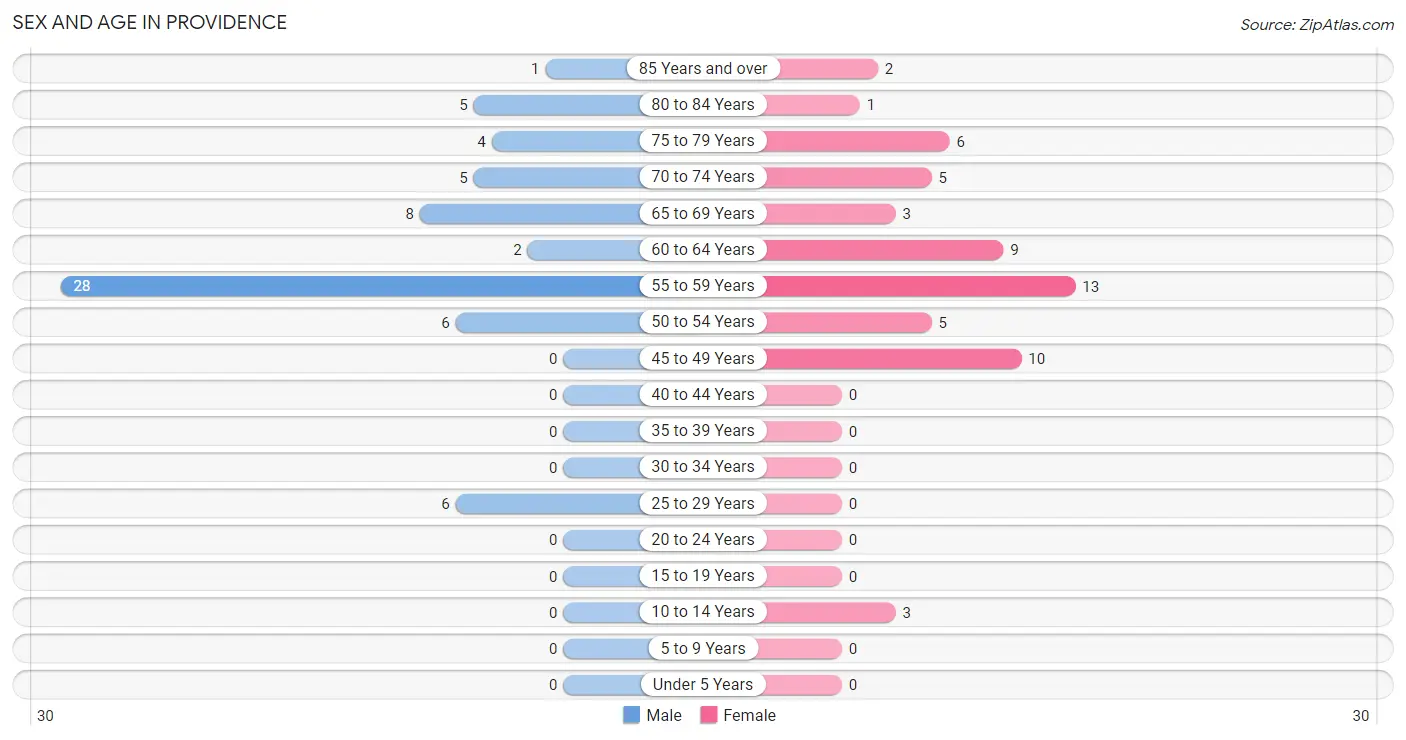
| Age Bracket | Male | Female |
| Under 5 Years | 0 (0.0%) | 0 (0.0%) |
| 5 to 9 Years | 0 (0.0%) | 0 (0.0%) |
| 10 to 14 Years | 0 (0.0%) | 3 (5.3%) |
| 15 to 19 Years | 0 (0.0%) | 0 (0.0%) |
| 20 to 24 Years | 0 (0.0%) | 0 (0.0%) |
| 25 to 29 Years | 6 (9.2%) | 0 (0.0%) |
| 30 to 34 Years | 0 (0.0%) | 0 (0.0%) |
| 35 to 39 Years | 0 (0.0%) | 0 (0.0%) |
| 40 to 44 Years | 0 (0.0%) | 0 (0.0%) |
| 45 to 49 Years | 0 (0.0%) | 10 (17.5%) |
| 50 to 54 Years | 6 (9.2%) | 5 (8.8%) |
| 55 to 59 Years | 28 (43.1%) | 13 (22.8%) |
| 60 to 64 Years | 2 (3.1%) | 9 (15.8%) |
| 65 to 69 Years | 8 (12.3%) | 3 (5.3%) |
| 70 to 74 Years | 5 (7.7%) | 5 (8.8%) |
| 75 to 79 Years | 4 (6.1%) | 6 (10.5%) |
| 80 to 84 Years | 5 (7.7%) | 1 (1.8%) |
| 85 Years and over | 1 (1.5%) | 2 (3.5%) |
| Total | 65 (100.0%) | 57 (100.0%) |
Families and Households in Providence
Median Family Size in Providence
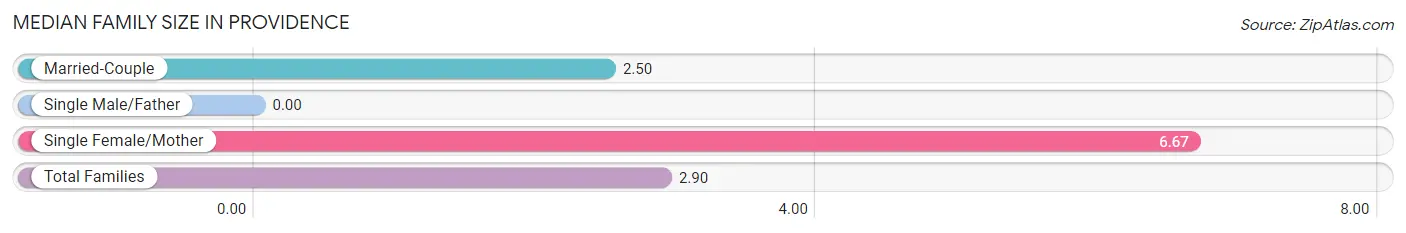
| Family Type | # Families | Family Size |
| Married-Couple | 28 (90.3%) | 2.50 |
| Single Male/Father | 0 (0.0%) | - |
| Single Female/Mother | 3 (9.7%) | 6.67 |
| Total Families | 31 (100.0%) | 2.90 |
Median Household Size in Providence
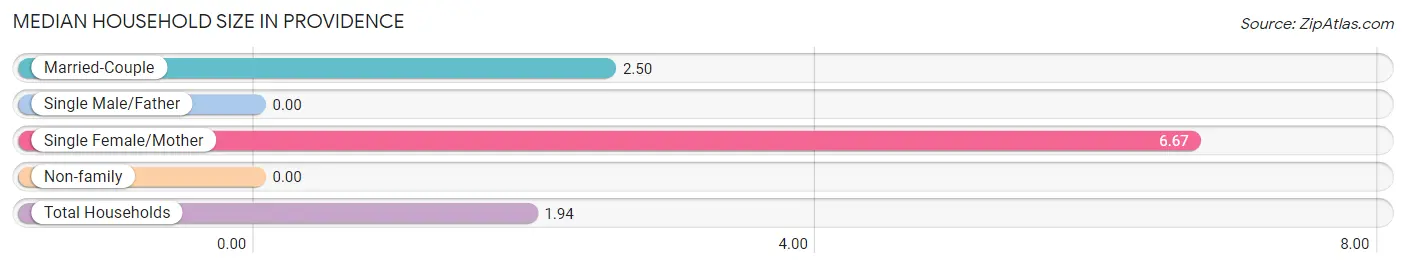
| Household Type | # Households | Household Size |
| Married-Couple | 28 (44.4%) | 2.50 |
| Single Male/Father | 0 (0.0%) | - |
| Single Female/Mother | 3 (4.8%) | 6.67 |
| Non-family | 32 (50.8%) | - |
| Total Households | 63 (100.0%) | 1.94 |
Household Size by Marriage Status in Providence
Out of a total of 63 households in Providence, 31 (49.2%) are family households, while 32 (50.8%) are nonfamily households. The most numerous type of family households are 2-person households, comprising 23, and the most common type of nonfamily households are 1-person households, comprising 32.
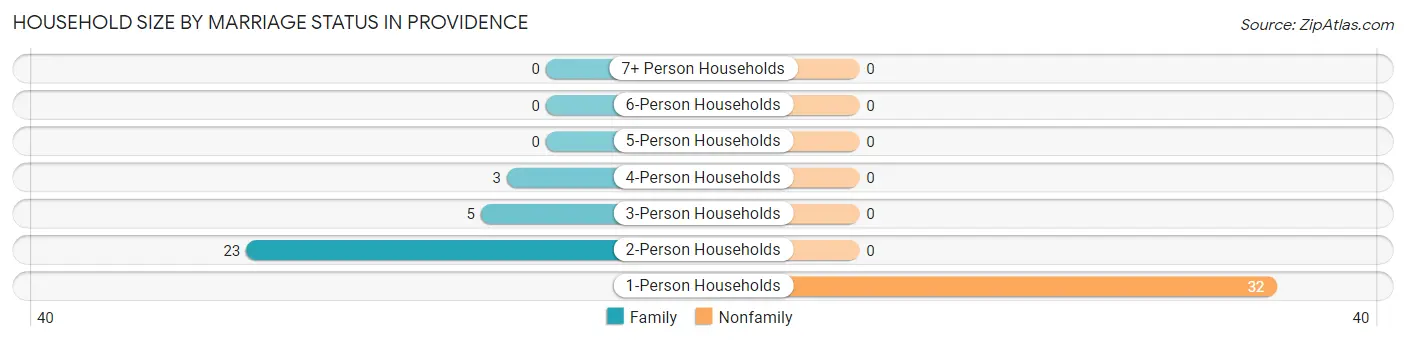
| Household Size | Family Households | Nonfamily Households |
| 1-Person Households | - | 32 (50.8%) |
| 2-Person Households | 23 (36.5%) | 0 (0.0%) |
| 3-Person Households | 5 (7.9%) | 0 (0.0%) |
| 4-Person Households | 3 (4.8%) | 0 (0.0%) |
| 5-Person Households | 0 (0.0%) | 0 (0.0%) |
| 6-Person Households | 0 (0.0%) | 0 (0.0%) |
| 7+ Person Households | 0 (0.0%) | 0 (0.0%) |
| Total | 31 (49.2%) | 32 (50.8%) |
Female Fertility in Providence
Fertility by Age in Providence
| Age Bracket | Women with Births | Births / 1,000 Women |
| 15 to 19 years | 0 (0.0%) | 0.0 |
| 20 to 34 years | 0 (0.0%) | 0.0 |
| 35 to 50 years | 0 (0.0%) | 0.0 |
| Total | 0 (0.0%) | 0.0 |
Fertility by Age by Marriage Status in Providence
| Age Bracket | Married | Unmarried |
| 15 to 19 years | 0 (0.0%) | 0 (0.0%) |
| 20 to 34 years | 0 (0.0%) | 0 (0.0%) |
| 35 to 50 years | 0 (0.0%) | 0 (0.0%) |
| Total | 0 (0.0%) | 0 (0.0%) |
Fertility by Education in Providence
| Educational Attainment | Women with Births | Births / 1,000 Women |
| Less than High School | 0 (0.0%) | 0.0 |
| High School Diploma | 0 (0.0%) | 0.0 |
| College or Associate's Degree | 0 (0.0%) | 0.0 |
| Bachelor's Degree | 0 (0.0%) | 0.0 |
| Graduate Degree | 0 (0.0%) | 0.0 |
| Total | 0 (0.0%) | 0.0 |
Fertility by Education by Marriage Status in Providence
| Educational Attainment | Married | Unmarried |
| Less than High School | 0 (0.0%) | 0 (0.0%) |
| High School Diploma | 0 (0.0%) | 0 (0.0%) |
| College or Associate's Degree | 0 (0.0%) | 0 (0.0%) |
| Bachelor's Degree | 0 (0.0%) | 0 (0.0%) |
| Graduate Degree | 0 (0.0%) | 0 (0.0%) |
| Total | 0 (0.0%) | 0 (0.0%) |
Employment Characteristics in Providence
Employment by Class of Employer in Providence
Among the 54 employed individuals in Providence, private company employees (50 | 92.6%), self-employed (not incorporated) (2 | 3.7%), and state government employees (2 | 3.7%) make up the most common classes of employment.
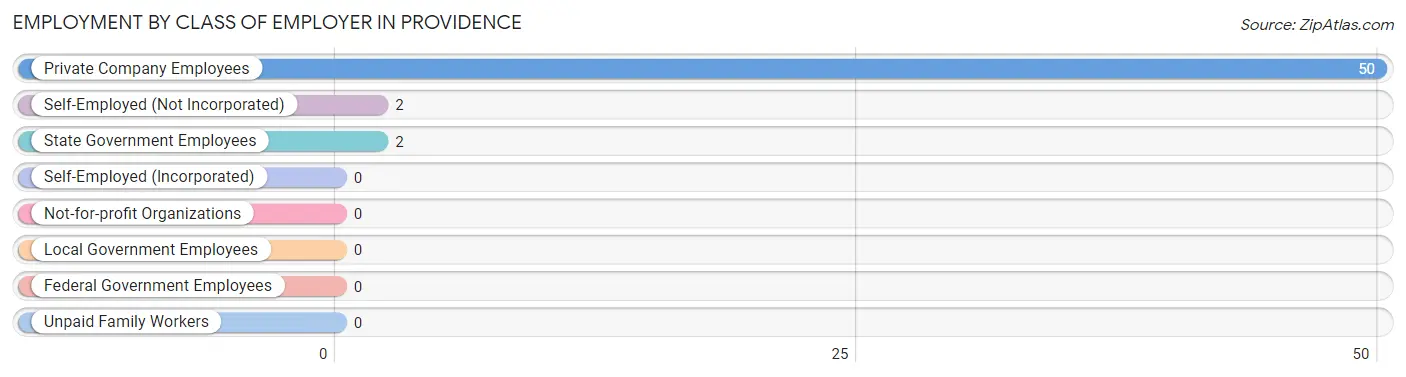
| Employer Class | # Employees | % Employees |
| Private Company Employees | 50 | 92.6% |
| Self-Employed (Incorporated) | 0 | 0.0% |
| Self-Employed (Not Incorporated) | 2 | 3.7% |
| Not-for-profit Organizations | 0 | 0.0% |
| Local Government Employees | 0 | 0.0% |
| State Government Employees | 2 | 3.7% |
| Federal Government Employees | 0 | 0.0% |
| Unpaid Family Workers | 0 | 0.0% |
| Total | 54 | 100.0% |
Employment Status by Age in Providence
According to the labor force statistics for Providence, out of the total population over 16 years of age (119), 47.1% or 56 individuals are in the labor force, with 3.6% or 2 of them unemployed. The age group with the highest labor force participation rate is 25 to 29 years, with 100.0% or 6 individuals in the labor force. Within the labor force, the 60 to 64 years age range has the highest percentage of unemployed individuals, with 22.2% or 2 of them being unemployed.
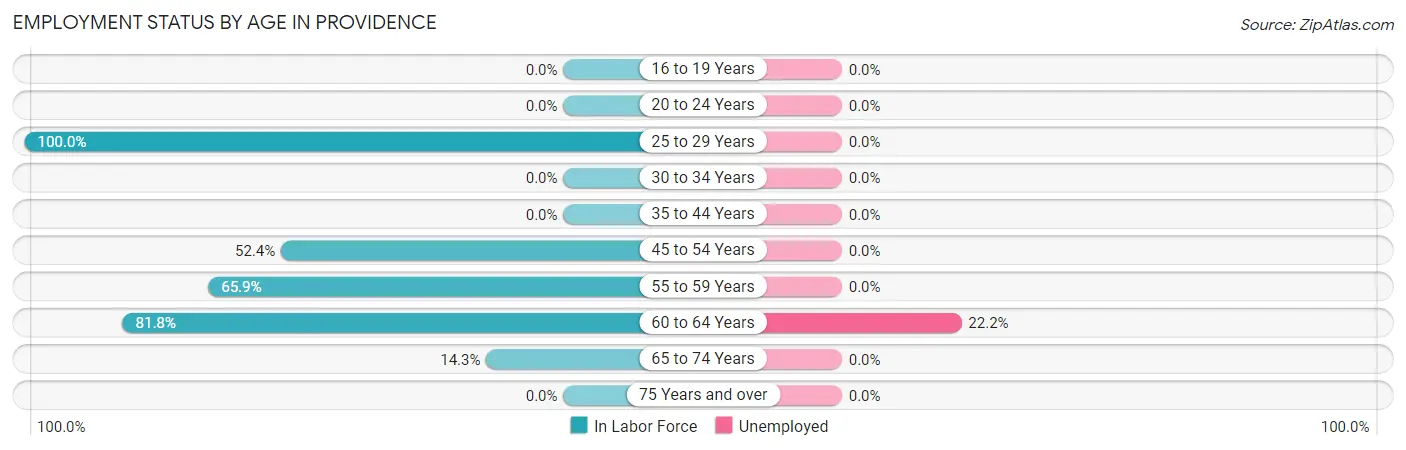
| Age Bracket | In Labor Force | Unemployed |
| 16 to 19 Years | 0 (0.0%) | 0 (0.0%) |
| 20 to 24 Years | 0 (0.0%) | 0 (0.0%) |
| 25 to 29 Years | 6 (100.0%) | 0 (0.0%) |
| 30 to 34 Years | 0 (0.0%) | 0 (0.0%) |
| 35 to 44 Years | 0 (0.0%) | 0 (0.0%) |
| 45 to 54 Years | 11 (52.4%) | 0 (0.0%) |
| 55 to 59 Years | 27 (65.9%) | 0 (0.0%) |
| 60 to 64 Years | 9 (81.8%) | 2 (22.2%) |
| 65 to 74 Years | 3 (14.3%) | 0 (0.0%) |
| 75 Years and over | 0 (0.0%) | 0 (0.0%) |
| Total | 56 (47.1%) | 2 (3.6%) |
Employment Status by Educational Attainment in Providence
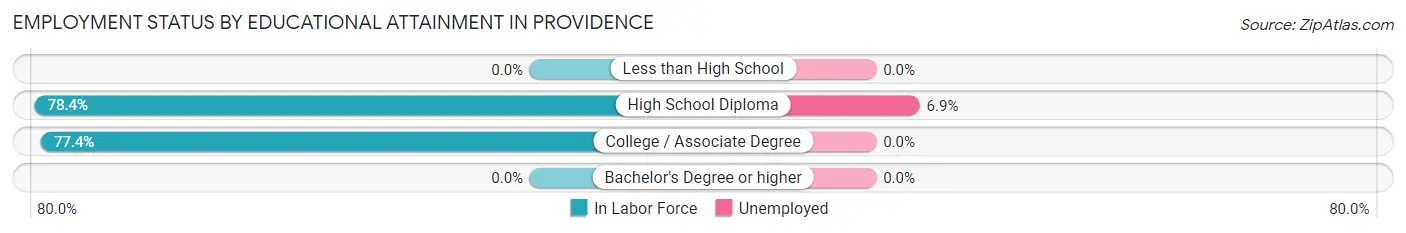
According to labor force statistics for Providence, 67.1% of individuals (53) out of the total population between 25 and 64 years of age (79) are in the labor force, with 3.8% or 2 of them being unemployed. The group with the highest labor force participation rate are those with the educational attainment of high school diploma, with 78.4% or 29 individuals in the labor force. Within the labor force, individuals with high school diploma education have the highest percentage of unemployment, with 6.9% or 2 of them being unemployed.
| Educational Attainment | In Labor Force | Unemployed |
| Less than High School | 0 (0.0%) | 0 (0.0%) |
| High School Diploma | 29 (78.4%) | 3 (6.9%) |
| College / Associate Degree | 24 (77.4%) | 0 (0.0%) |
| Bachelor's Degree or higher | 0 (0.0%) | 0 (0.0%) |
| Total | 53 (67.1%) | 3 (3.8%) |
Employment Occupations by Sex in Providence
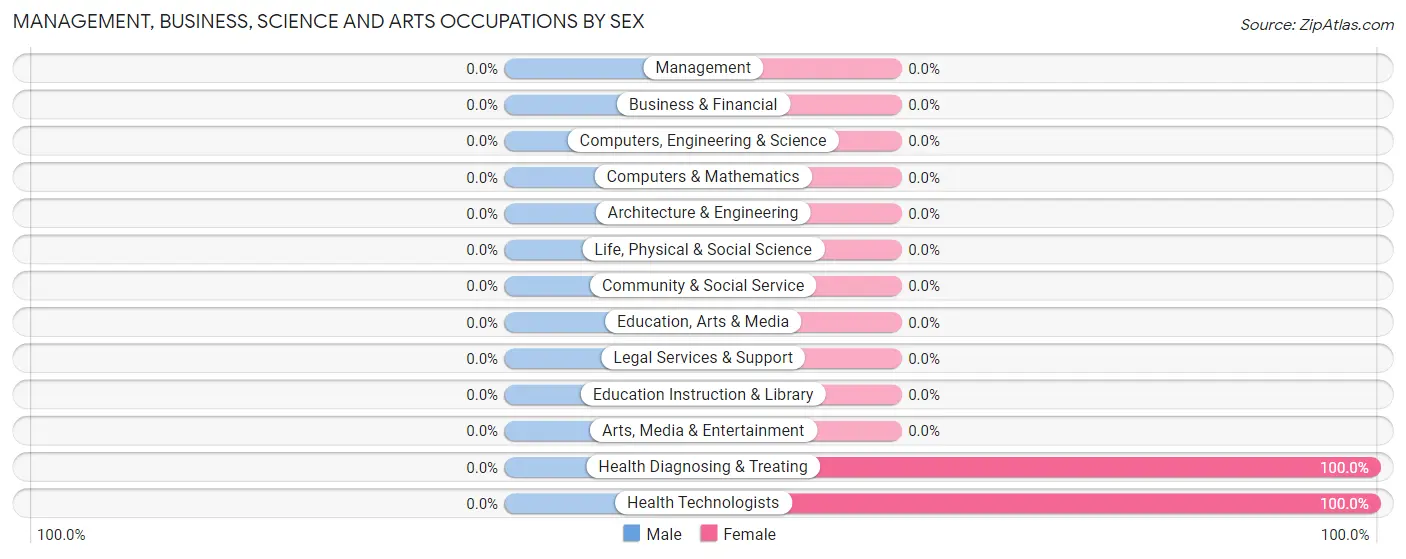
Management, Business, Science and Arts Occupations
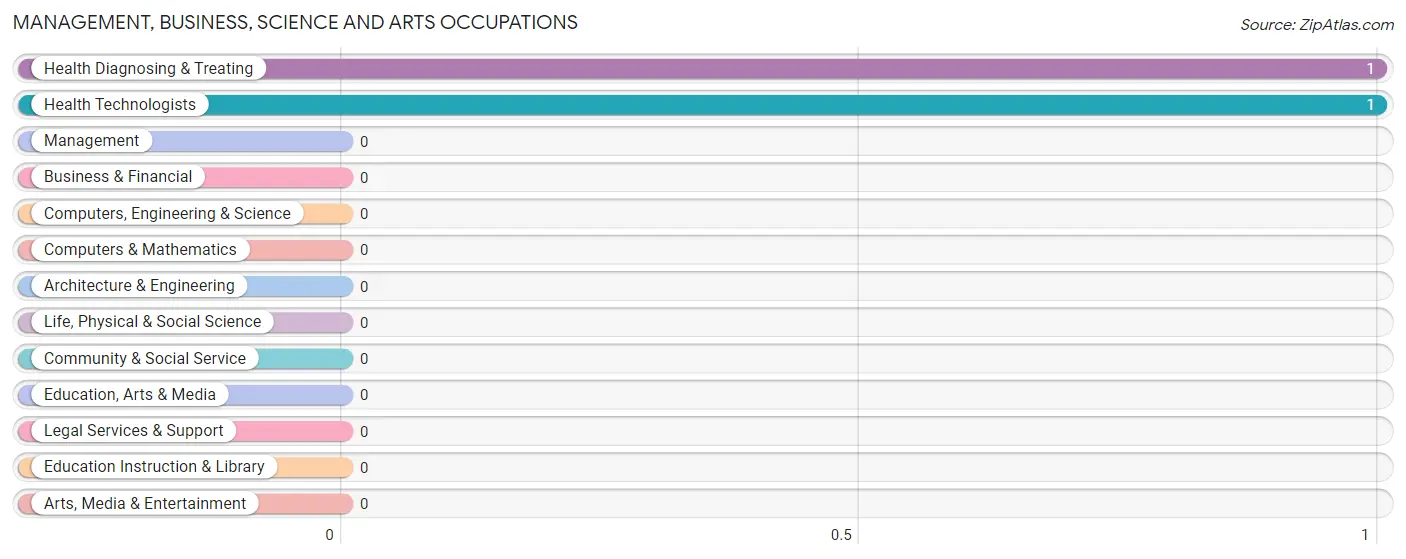
The most common Management, Business, Science and Arts occupations in Providence are Health Diagnosing & Treating (1 | 1.8%), and Health Technologists (1 | 1.8%).
Management, Business, Science and Arts Occupations by Sex
| Occupation | Male | Female |
| Management | 0 (0.0%) | 0 (0.0%) |
| Business & Financial | 0 (0.0%) | 0 (0.0%) |
| Computers, Engineering & Science | 0 (0.0%) | 0 (0.0%) |
| Computers & Mathematics | 0 (0.0%) | 0 (0.0%) |
| Architecture & Engineering | 0 (0.0%) | 0 (0.0%) |
| Life, Physical & Social Science | 0 (0.0%) | 0 (0.0%) |
| Community & Social Service | 0 (0.0%) | 0 (0.0%) |
| Education, Arts & Media | 0 (0.0%) | 0 (0.0%) |
| Legal Services & Support | 0 (0.0%) | 0 (0.0%) |
| Education Instruction & Library | 0 (0.0%) | 0 (0.0%) |
| Arts, Media & Entertainment | 0 (0.0%) | 0 (0.0%) |
| Health Diagnosing & Treating | 0 (0.0%) | 1 (100.0%) |
| Health Technologists | 0 (0.0%) | 1 (100.0%) |
| Total (Category) | 0 (0.0%) | 1 (100.0%) |
| Total (Overall) | 37 (68.5%) | 17 (31.5%) |
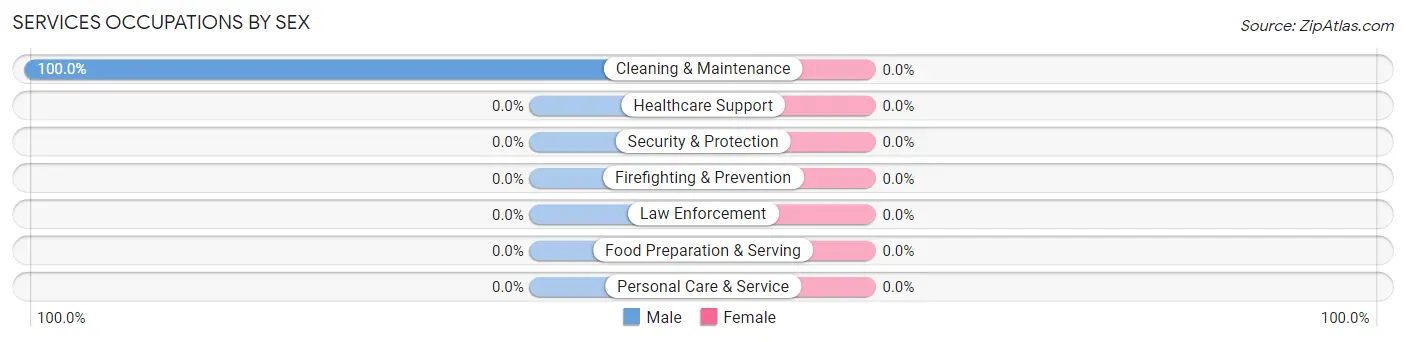
Services Occupations
The most common Services occupations in Providence are , and Cleaning & Maintenance (2 | 3.7%).
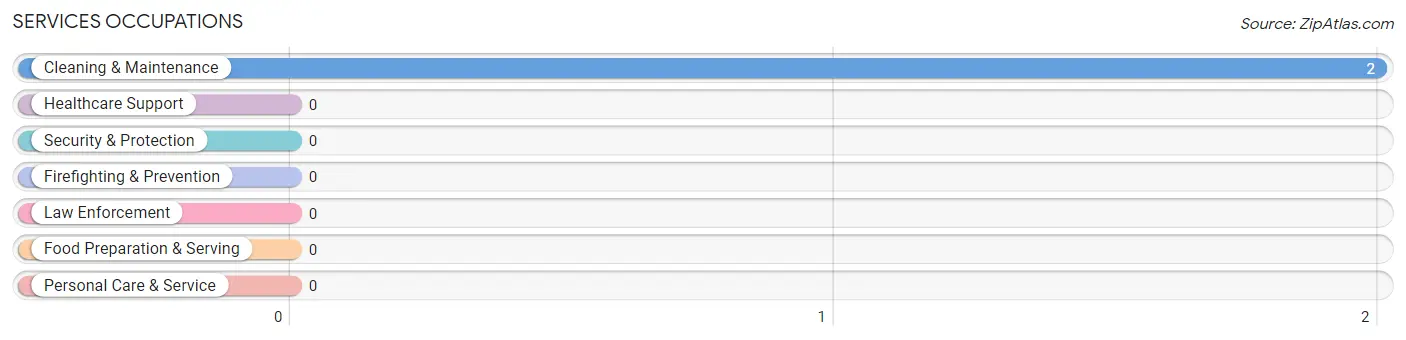
Services Occupations by Sex
| Occupation | Male | Female |
| Healthcare Support | 0 (0.0%) | 0 (0.0%) |
| Security & Protection | 0 (0.0%) | 0 (0.0%) |
| Firefighting & Prevention | 0 (0.0%) | 0 (0.0%) |
| Law Enforcement | 0 (0.0%) | 0 (0.0%) |
| Food Preparation & Serving | 0 (0.0%) | 0 (0.0%) |
| Cleaning & Maintenance | 2 (100.0%) | 0 (0.0%) |
| Personal Care & Service | 0 (0.0%) | 0 (0.0%) |
| Total (Category) | 2 (100.0%) | 0 (0.0%) |
| Total (Overall) | 37 (68.5%) | 17 (31.5%) |
Sales and Office Occupations
The most common Sales and Office occupations in Providence are Office & Administration (14 | 25.9%), and Sales & Related (2 | 3.7%).
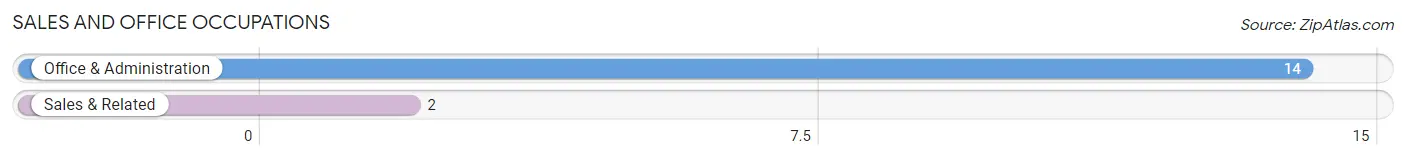
Sales and Office Occupations by Sex
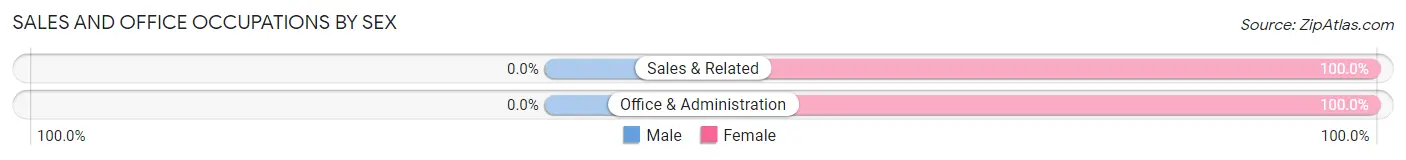
| Occupation | Male | Female |
| Sales & Related | 0 (0.0%) | 2 (100.0%) |
| Office & Administration | 0 (0.0%) | 14 (100.0%) |
| Total (Category) | 0 (0.0%) | 16 (100.0%) |
| Total (Overall) | 37 (68.5%) | 17 (31.5%) |
Natural Resources, Construction and Maintenance Occupations
The most common Natural Resources, Construction and Maintenance occupations in Providence are , and Installation, Maintenance & Repair (16 | 29.6%).

Natural Resources, Construction and Maintenance Occupations by Sex

| Occupation | Male | Female |
| Farming, Fishing & Forestry | 0 (0.0%) | 0 (0.0%) |
| Construction & Extraction | 0 (0.0%) | 0 (0.0%) |
| Installation, Maintenance & Repair | 16 (100.0%) | 0 (0.0%) |
| Total (Category) | 16 (100.0%) | 0 (0.0%) |
| Total (Overall) | 37 (68.5%) | 17 (31.5%) |
Production, Transportation and Moving Occupations
The most common Production, Transportation and Moving occupations in Providence are Production (12 | 22.2%), and Transportation (7 | 13.0%).
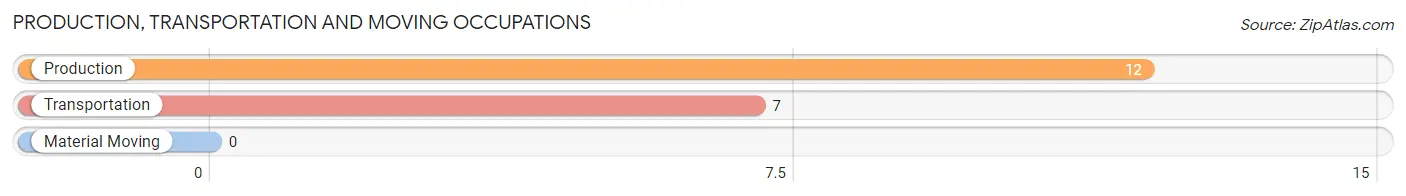
Production, Transportation and Moving Occupations by Sex
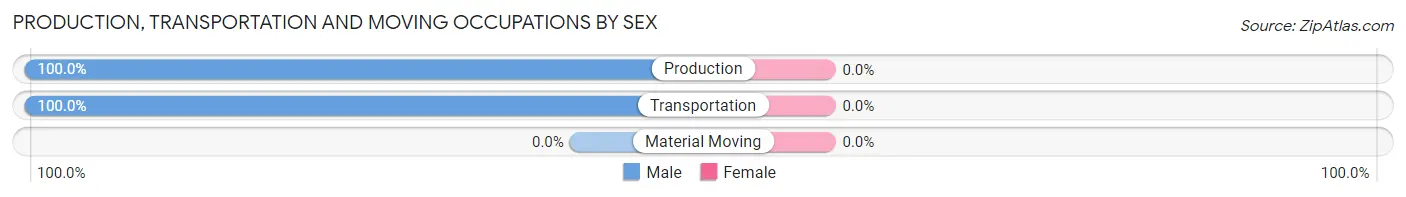
| Occupation | Male | Female |
| Production | 12 (100.0%) | 0 (0.0%) |
| Transportation | 7 (100.0%) | 0 (0.0%) |
| Material Moving | 0 (0.0%) | 0 (0.0%) |
| Total (Category) | 19 (100.0%) | 0 (0.0%) |
| Total (Overall) | 37 (68.5%) | 17 (31.5%) |
Employment Industries by Sex in Providence
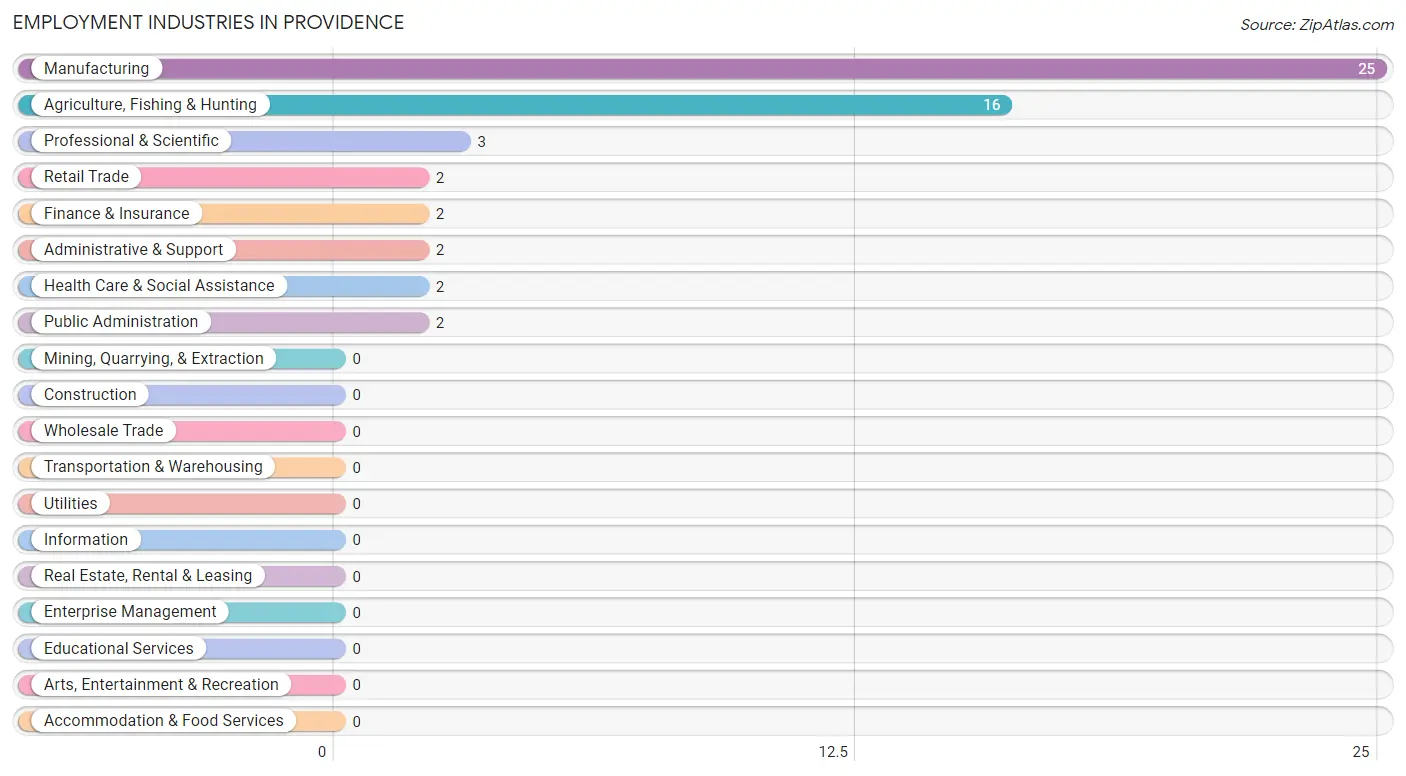
Employment Industries in Providence
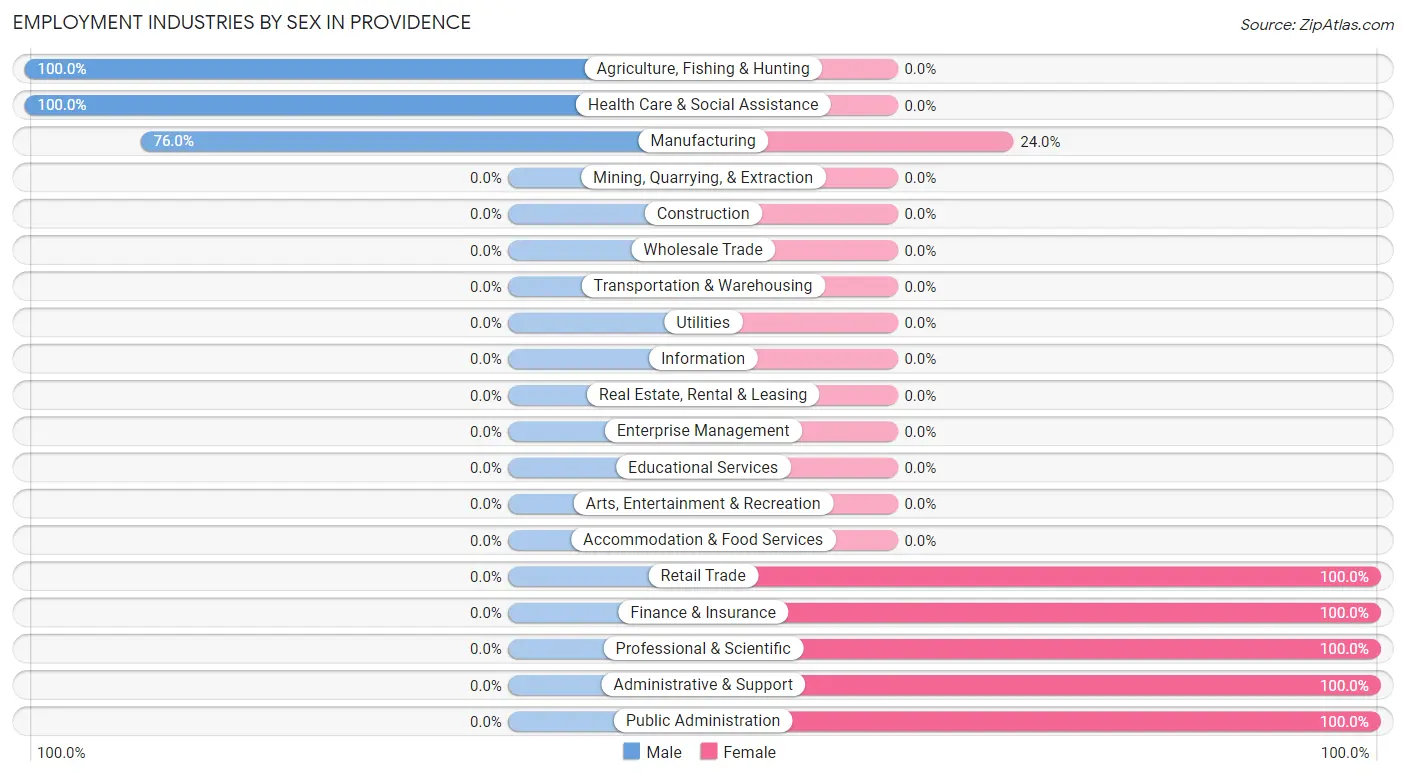
The major employment industries in Providence include Manufacturing (25 | 46.3%), Agriculture, Fishing & Hunting (16 | 29.6%), Professional & Scientific (3 | 5.6%), Retail Trade (2 | 3.7%), and Finance & Insurance (2 | 3.7%).
Employment Industries by Sex in Providence
The Providence industries that see more men than women are Agriculture, Fishing & Hunting (100.0%), Health Care & Social Assistance (100.0%), and Manufacturing (76.0%), whereas the industries that tend to have a higher number of women are Retail Trade (100.0%), Finance & Insurance (100.0%), and Professional & Scientific (100.0%).
| Industry | Male | Female |
| Agriculture, Fishing & Hunting | 16 (100.0%) | 0 (0.0%) |
| Mining, Quarrying, & Extraction | 0 (0.0%) | 0 (0.0%) |
| Construction | 0 (0.0%) | 0 (0.0%) |
| Manufacturing | 19 (76.0%) | 6 (24.0%) |
| Wholesale Trade | 0 (0.0%) | 0 (0.0%) |
| Retail Trade | 0 (0.0%) | 2 (100.0%) |
| Transportation & Warehousing | 0 (0.0%) | 0 (0.0%) |
| Utilities | 0 (0.0%) | 0 (0.0%) |
| Information | 0 (0.0%) | 0 (0.0%) |
| Finance & Insurance | 0 (0.0%) | 2 (100.0%) |
| Real Estate, Rental & Leasing | 0 (0.0%) | 0 (0.0%) |
| Professional & Scientific | 0 (0.0%) | 3 (100.0%) |
| Enterprise Management | 0 (0.0%) | 0 (0.0%) |
| Administrative & Support | 0 (0.0%) | 2 (100.0%) |
| Educational Services | 0 (0.0%) | 0 (0.0%) |
| Health Care & Social Assistance | 2 (100.0%) | 0 (0.0%) |
| Arts, Entertainment & Recreation | 0 (0.0%) | 0 (0.0%) |
| Accommodation & Food Services | 0 (0.0%) | 0 (0.0%) |
| Public Administration | 0 (0.0%) | 2 (100.0%) |
| Total | 37 (68.5%) | 17 (31.5%) |
Education in Providence
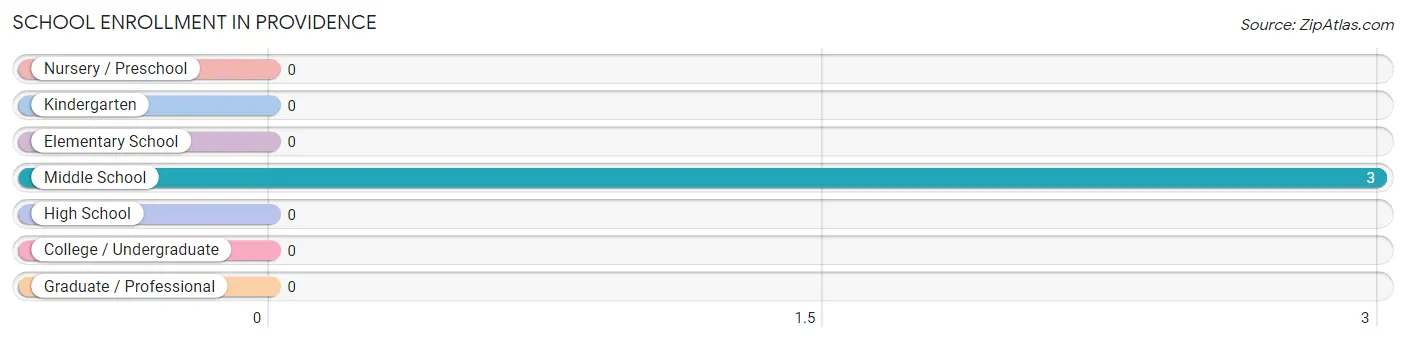
School Enrollment in Providence
| School Level | # Students | % Students |
| Nursery / Preschool | 0 | 0.0% |
| Kindergarten | 0 | 0.0% |
| Elementary School | 0 | 0.0% |
| Middle School | 3 | 100.0% |
| High School | 0 | 0.0% |
| College / Undergraduate | 0 | 0.0% |
| Graduate / Professional | 0 | 0.0% |
| Total | 3 | 100.0% |
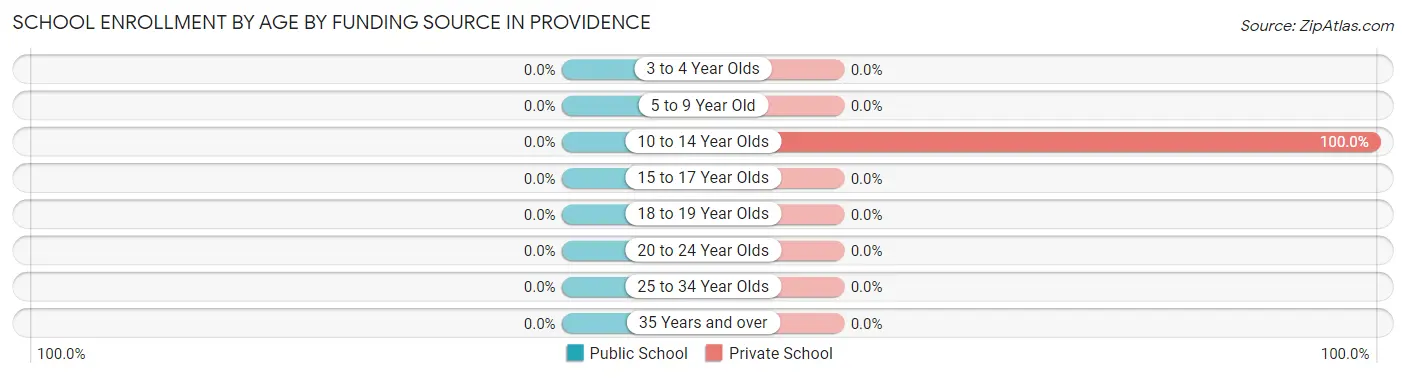
School Enrollment by Age by Funding Source in Providence
| Age Bracket | Public School | Private School |
| 3 to 4 Year Olds | 0 (0.0%) | 0 (0.0%) |
| 5 to 9 Year Old | 0 (0.0%) | 0 (0.0%) |
| 10 to 14 Year Olds | 0 (0.0%) | 3 (100.0%) |
| 15 to 17 Year Olds | 0 (0.0%) | 0 (0.0%) |
| 18 to 19 Year Olds | 0 (0.0%) | 0 (0.0%) |
| 20 to 24 Year Olds | 0 (0.0%) | 0 (0.0%) |
| 25 to 34 Year Olds | 0 (0.0%) | 0 (0.0%) |
| 35 Years and over | 0 (0.0%) | 0 (0.0%) |
| Total | 0 (0.0%) | 3 (100.0%) |
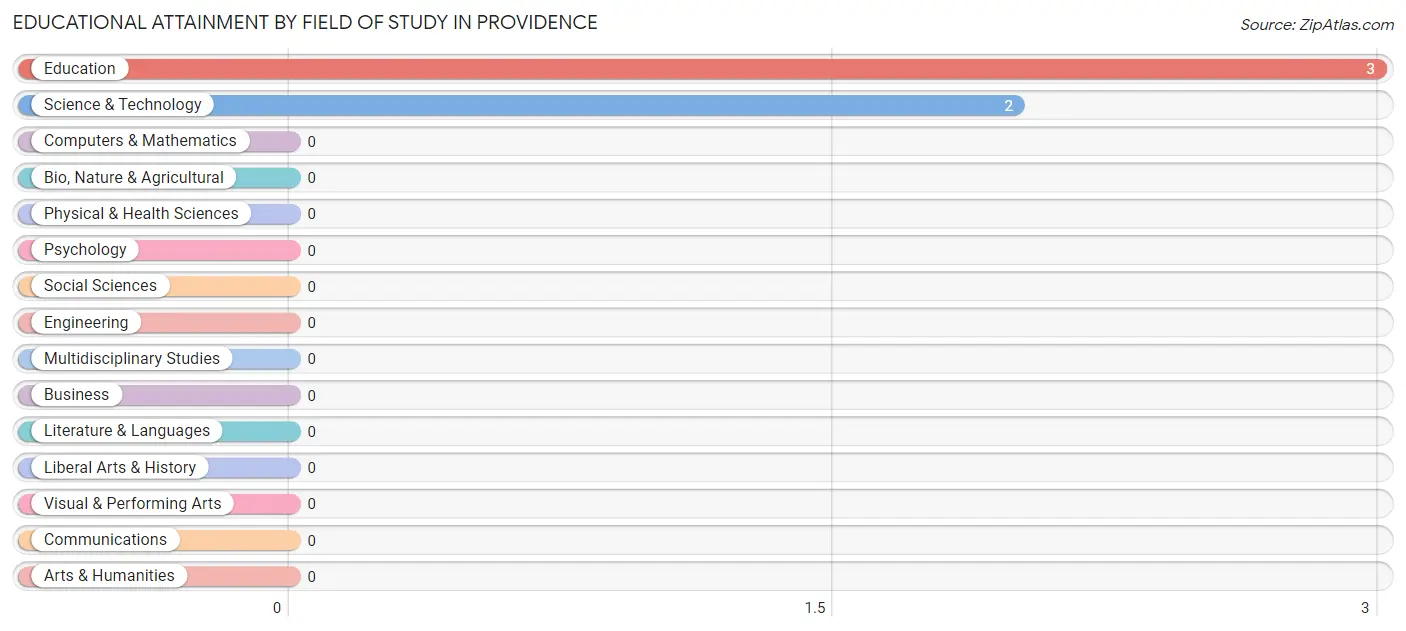
Educational Attainment by Field of Study in Providence
Education (3 | 60.0%), and science & technology (2 | 40.0%) are the most common fields of study among 5 individuals in Providence who have obtained a bachelor's degree or higher.
| Field of Study | # Graduates | % Graduates |
| Computers & Mathematics | 0 | 0.0% |
| Bio, Nature & Agricultural | 0 | 0.0% |
| Physical & Health Sciences | 0 | 0.0% |
| Psychology | 0 | 0.0% |
| Social Sciences | 0 | 0.0% |
| Engineering | 0 | 0.0% |
| Multidisciplinary Studies | 0 | 0.0% |
| Science & Technology | 2 | 40.0% |
| Business | 0 | 0.0% |
| Education | 3 | 60.0% |
| Literature & Languages | 0 | 0.0% |
| Liberal Arts & History | 0 | 0.0% |
| Visual & Performing Arts | 0 | 0.0% |
| Communications | 0 | 0.0% |
| Arts & Humanities | 0 | 0.0% |
| Total | 5 | 100.0% |
Transportation & Commute in Providence
Vehicle Availability by Sex in Providence
The most prevalent vehicle ownership categories in Providence are males with 4 vehicles (22, accounting for 59.5%) and females with 4 vehicles (3, making up 129.4%).
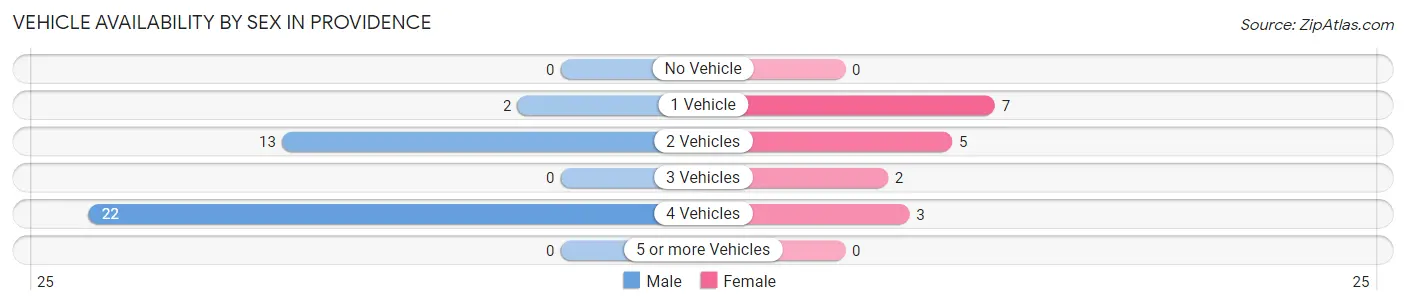
| Vehicles Available | Male | Female |
| No Vehicle | 0 (0.0%) | 0 (0.0%) |
| 1 Vehicle | 2 (5.4%) | 7 (41.2%) |
| 2 Vehicles | 13 (35.1%) | 5 (29.4%) |
| 3 Vehicles | 0 (0.0%) | 2 (11.8%) |
| 4 Vehicles | 22 (59.5%) | 3 (17.6%) |
| 5 or more Vehicles | 0 (0.0%) | 0 (0.0%) |
| Total | 37 (100.0%) | 17 (100.0%) |
Commute Time in Providence
The most frequently occuring commute durations in Providence are 60 to 89 minutes (16 commuters, 29.6%), 15 to 19 minutes (13 commuters, 24.1%), and 10 to 14 minutes (7 commuters, 13.0%).
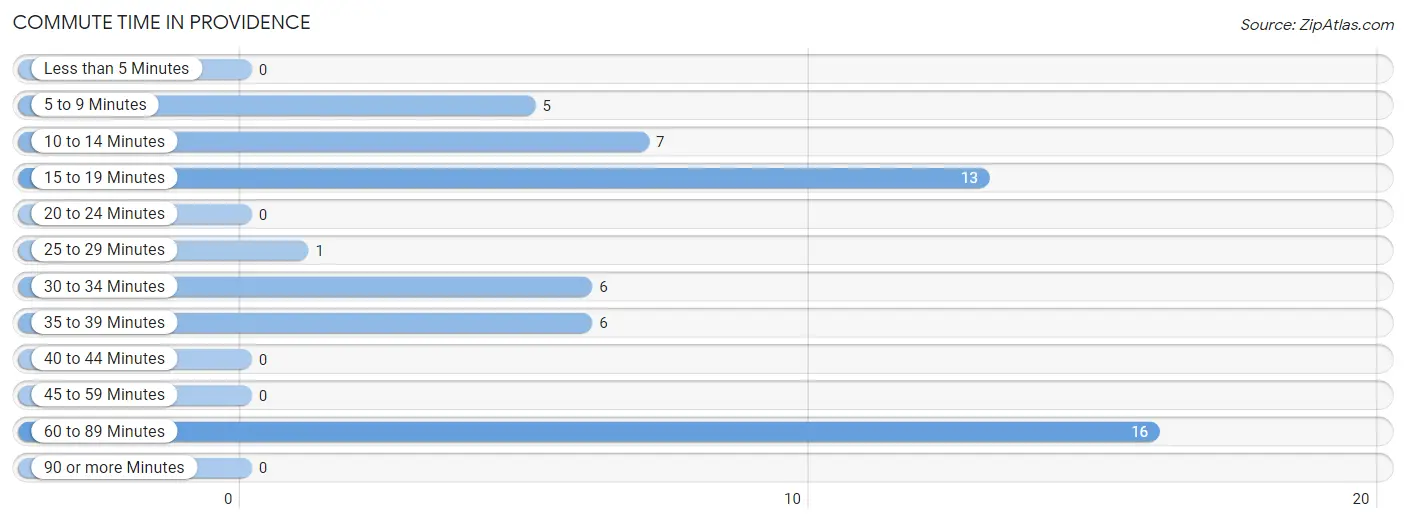
| Commute Time | # Commuters | % Commuters |
| Less than 5 Minutes | 0 | 0.0% |
| 5 to 9 Minutes | 5 | 9.3% |
| 10 to 14 Minutes | 7 | 13.0% |
| 15 to 19 Minutes | 13 | 24.1% |
| 20 to 24 Minutes | 0 | 0.0% |
| 25 to 29 Minutes | 1 | 1.8% |
| 30 to 34 Minutes | 6 | 11.1% |
| 35 to 39 Minutes | 6 | 11.1% |
| 40 to 44 Minutes | 0 | 0.0% |
| 45 to 59 Minutes | 0 | 0.0% |
| 60 to 89 Minutes | 16 | 29.6% |
| 90 or more Minutes | 0 | 0.0% |
Commute Time by Sex in Providence
The most common commute times in Providence are 60 to 89 minutes (16 commuters, 43.2%) for males and 10 to 14 minutes (7 commuters, 41.2%) for females.
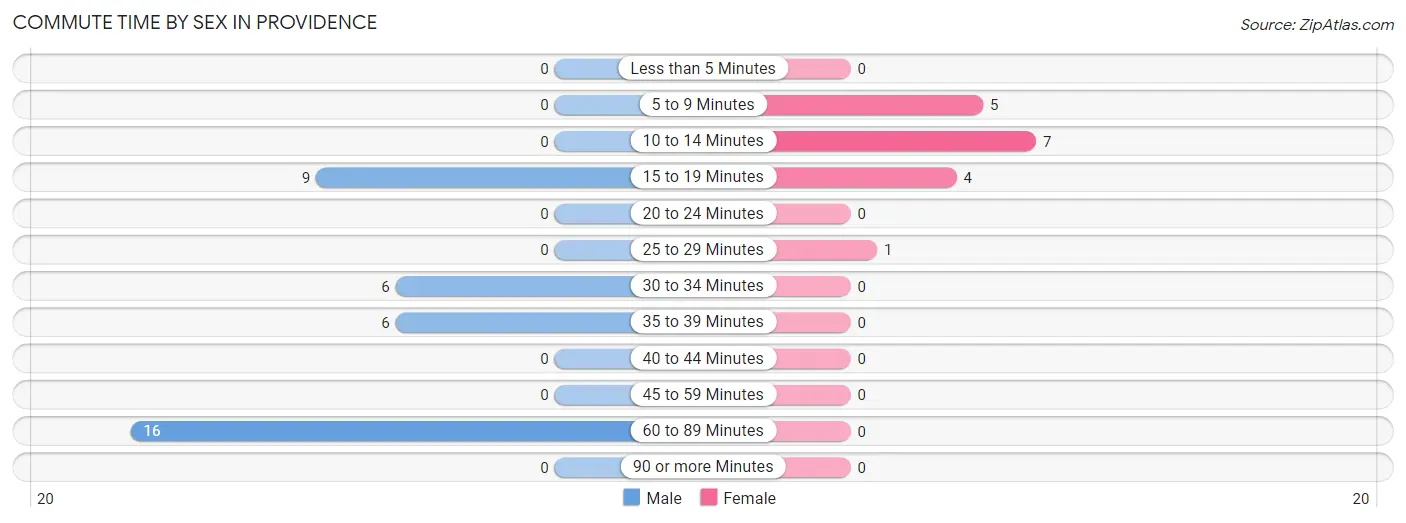
| Commute Time | Male | Female |
| Less than 5 Minutes | 0 (0.0%) | 0 (0.0%) |
| 5 to 9 Minutes | 0 (0.0%) | 5 (29.4%) |
| 10 to 14 Minutes | 0 (0.0%) | 7 (41.2%) |
| 15 to 19 Minutes | 9 (24.3%) | 4 (23.5%) |
| 20 to 24 Minutes | 0 (0.0%) | 0 (0.0%) |
| 25 to 29 Minutes | 0 (0.0%) | 1 (5.9%) |
| 30 to 34 Minutes | 6 (16.2%) | 0 (0.0%) |
| 35 to 39 Minutes | 6 (16.2%) | 0 (0.0%) |
| 40 to 44 Minutes | 0 (0.0%) | 0 (0.0%) |
| 45 to 59 Minutes | 0 (0.0%) | 0 (0.0%) |
| 60 to 89 Minutes | 16 (43.2%) | 0 (0.0%) |
| 90 or more Minutes | 0 (0.0%) | 0 (0.0%) |
Time of Departure to Work by Sex in Providence
The most frequent times of departure to work in Providence are 12:00 AM to 4:59 AM (16, 43.2%) for males and 5:00 AM to 5:29 AM (5, 29.4%) for females.
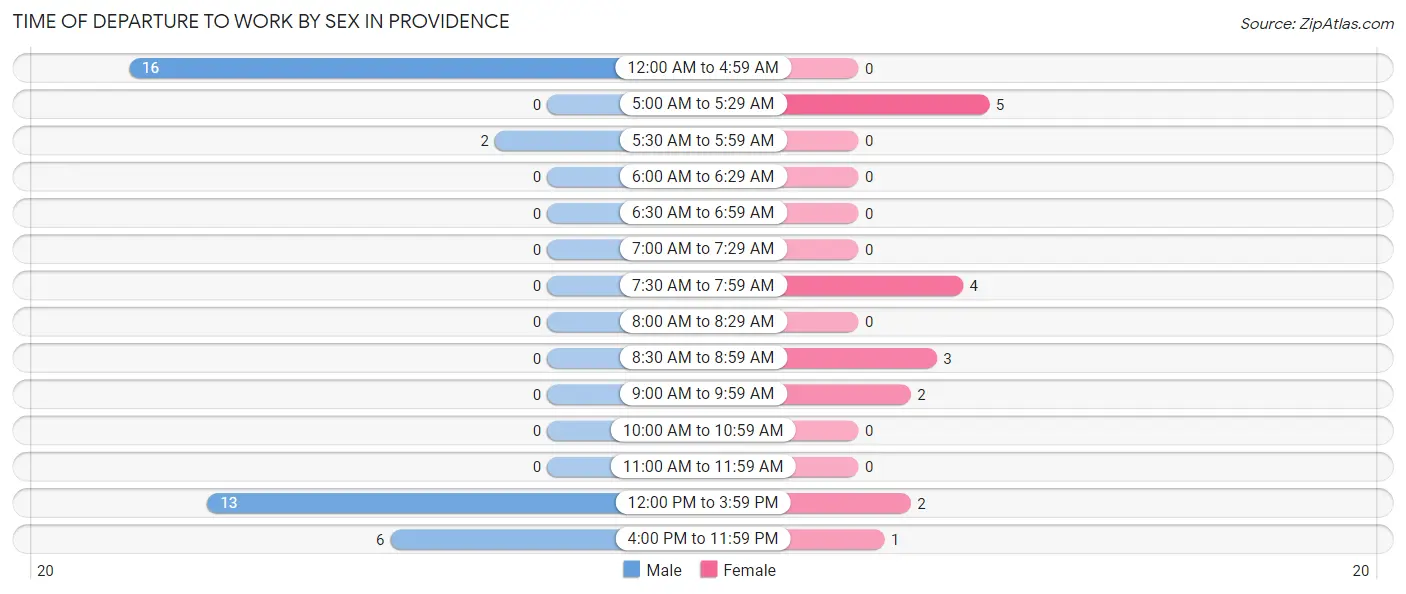
| Time of Departure | Male | Female |
| 12:00 AM to 4:59 AM | 16 (43.2%) | 0 (0.0%) |
| 5:00 AM to 5:29 AM | 0 (0.0%) | 5 (29.4%) |
| 5:30 AM to 5:59 AM | 2 (5.4%) | 0 (0.0%) |
| 6:00 AM to 6:29 AM | 0 (0.0%) | 0 (0.0%) |
| 6:30 AM to 6:59 AM | 0 (0.0%) | 0 (0.0%) |
| 7:00 AM to 7:29 AM | 0 (0.0%) | 0 (0.0%) |
| 7:30 AM to 7:59 AM | 0 (0.0%) | 4 (23.5%) |
| 8:00 AM to 8:29 AM | 0 (0.0%) | 0 (0.0%) |
| 8:30 AM to 8:59 AM | 0 (0.0%) | 3 (17.6%) |
| 9:00 AM to 9:59 AM | 0 (0.0%) | 2 (11.8%) |
| 10:00 AM to 10:59 AM | 0 (0.0%) | 0 (0.0%) |
| 11:00 AM to 11:59 AM | 0 (0.0%) | 0 (0.0%) |
| 12:00 PM to 3:59 PM | 13 (35.1%) | 2 (11.8%) |
| 4:00 PM to 11:59 PM | 6 (16.2%) | 1 (5.9%) |
| Total | 37 (100.0%) | 17 (100.0%) |
Housing Occupancy in Providence
Occupancy by Ownership in Providence
Of the total 63 dwellings in Providence, owner-occupied units account for 61 (96.8%), while renter-occupied units make up 2 (3.2%).
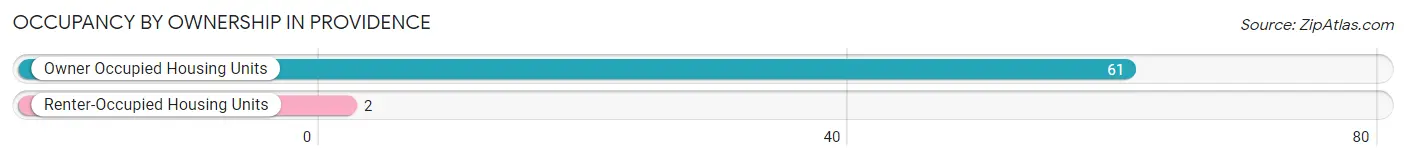
| Occupancy | # Housing Units | % Housing Units |
| Owner Occupied Housing Units | 61 | 96.8% |
| Renter-Occupied Housing Units | 2 | 3.2% |
| Total Occupied Housing Units | 63 | 100.0% |
Occupancy by Household Size in Providence
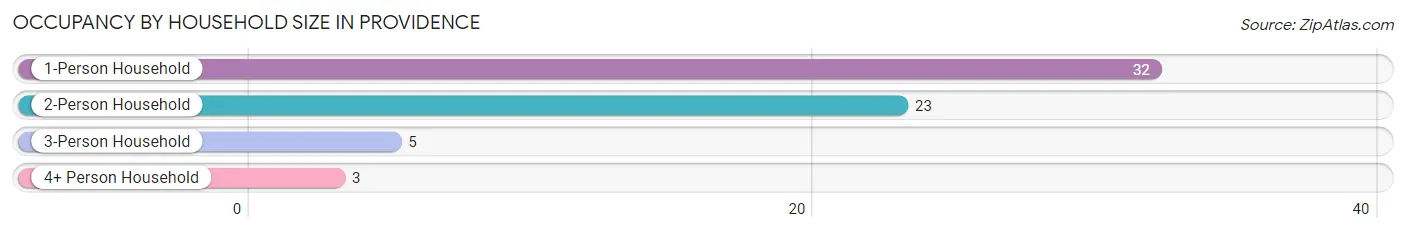
| Household Size | # Housing Units | % Housing Units |
| 1-Person Household | 32 | 50.8% |
| 2-Person Household | 23 | 36.5% |
| 3-Person Household | 5 | 7.9% |
| 4+ Person Household | 3 | 4.8% |
| Total Housing Units | 63 | 100.0% |
Occupancy by Ownership by Household Size in Providence
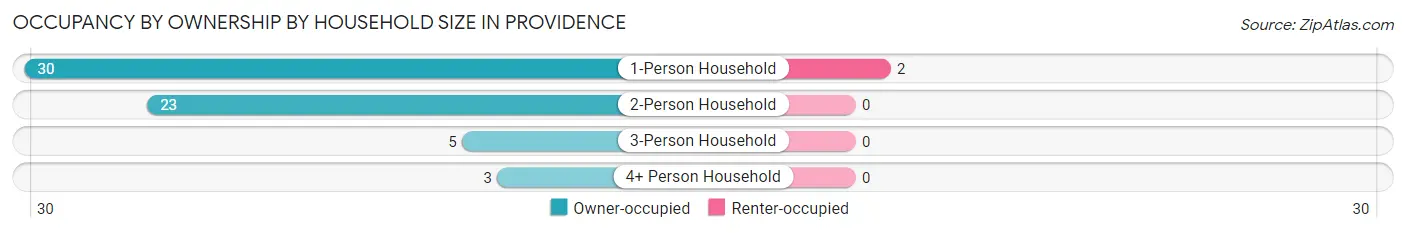
| Household Size | Owner-occupied | Renter-occupied |
| 1-Person Household | 30 (93.8%) | 2 (6.2%) |
| 2-Person Household | 23 (100.0%) | 0 (0.0%) |
| 3-Person Household | 5 (100.0%) | 0 (0.0%) |
| 4+ Person Household | 3 (100.0%) | 0 (0.0%) |
| Total Housing Units | 61 (96.8%) | 2 (3.2%) |
Occupancy by Educational Attainment in Providence
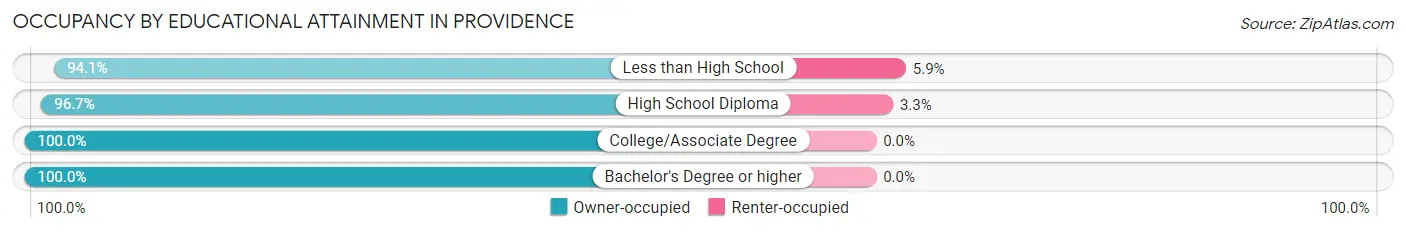
| Household Size | Owner-occupied | Renter-occupied |
| Less than High School | 16 (94.1%) | 1 (5.9%) |
| High School Diploma | 29 (96.7%) | 1 (3.3%) |
| College/Associate Degree | 12 (100.0%) | 0 (0.0%) |
| Bachelor's Degree or higher | 4 (100.0%) | 0 (0.0%) |
Occupancy by Age of Householder in Providence
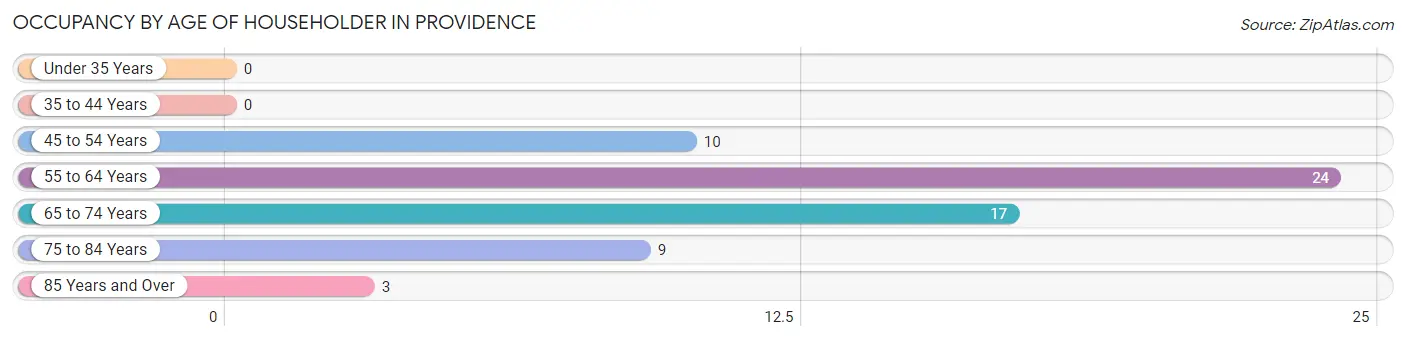
| Age Bracket | # Households | % Households |
| Under 35 Years | 0 | 0.0% |
| 35 to 44 Years | 0 | 0.0% |
| 45 to 54 Years | 10 | 15.9% |
| 55 to 64 Years | 24 | 38.1% |
| 65 to 74 Years | 17 | 27.0% |
| 75 to 84 Years | 9 | 14.3% |
| 85 Years and Over | 3 | 4.8% |
| Total | 63 | 100.0% |
Housing Finances in Providence
Median Income by Occupancy in Providence
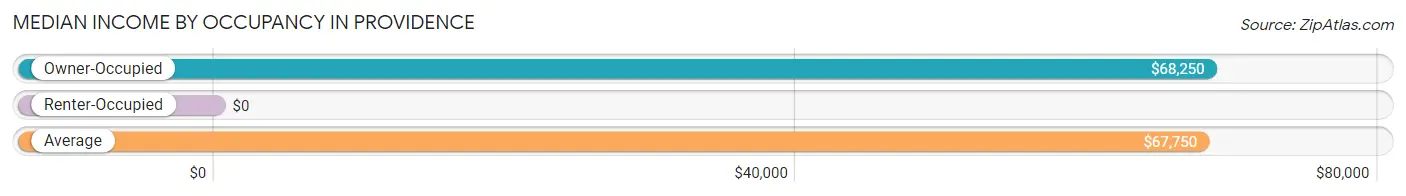
| Occupancy Type | # Households | Median Income |
| Owner-Occupied | 61 (96.8%) | $68,250 |
| Renter-Occupied | 2 (3.2%) | $0 |
| Average | 63 (100.0%) | $67,750 |
Occupancy by Householder Income Bracket in Providence
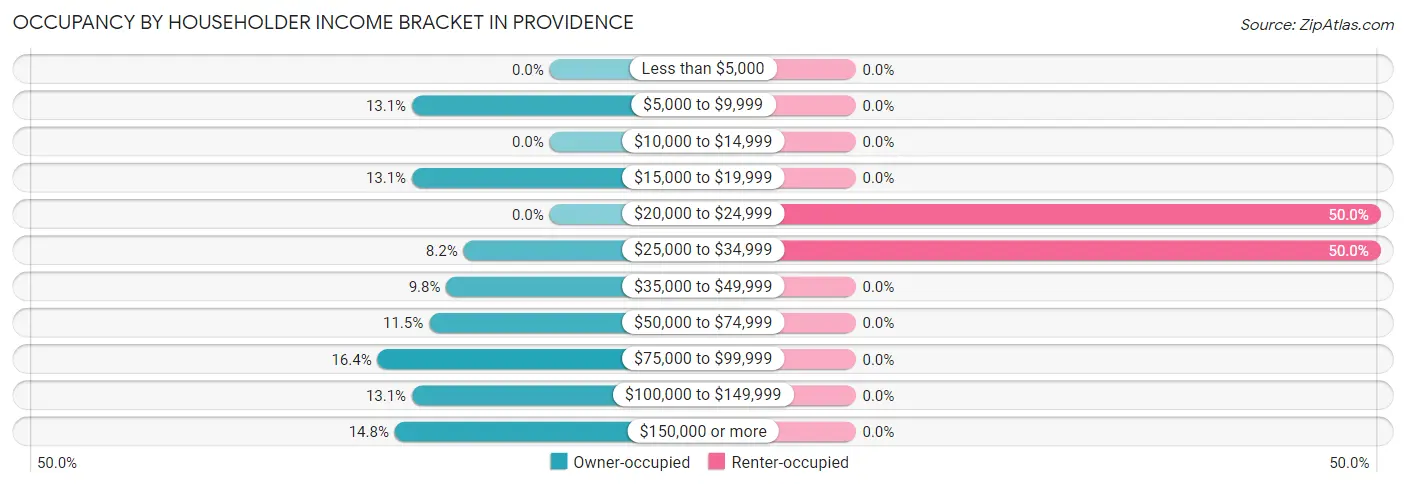
| Income Bracket | Owner-occupied | Renter-occupied |
| Less than $5,000 | 0 (0.0%) | 0 (0.0%) |
| $5,000 to $9,999 | 8 (13.1%) | 0 (0.0%) |
| $10,000 to $14,999 | 0 (0.0%) | 0 (0.0%) |
| $15,000 to $19,999 | 8 (13.1%) | 0 (0.0%) |
| $20,000 to $24,999 | 0 (0.0%) | 1 (50.0%) |
| $25,000 to $34,999 | 5 (8.2%) | 1 (50.0%) |
| $35,000 to $49,999 | 6 (9.8%) | 0 (0.0%) |
| $50,000 to $74,999 | 7 (11.5%) | 0 (0.0%) |
| $75,000 to $99,999 | 10 (16.4%) | 0 (0.0%) |
| $100,000 to $149,999 | 8 (13.1%) | 0 (0.0%) |
| $150,000 or more | 9 (14.7%) | 0 (0.0%) |
| Total | 61 (100.0%) | 2 (100.0%) |
Monthly Housing Cost Tiers in Providence
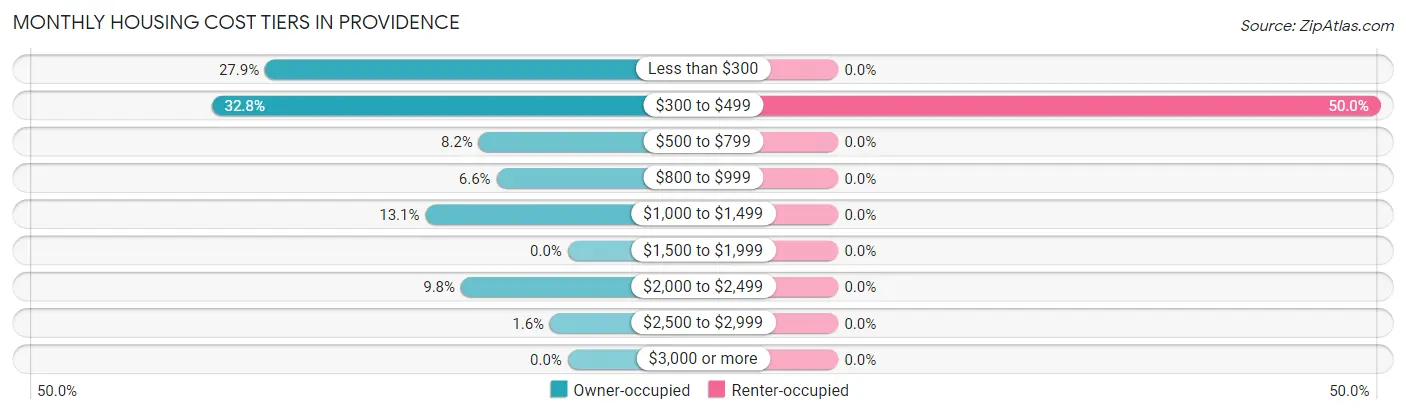
| Monthly Cost | Owner-occupied | Renter-occupied |
| Less than $300 | 17 (27.9%) | 0 (0.0%) |
| $300 to $499 | 20 (32.8%) | 1 (50.0%) |
| $500 to $799 | 5 (8.2%) | 0 (0.0%) |
| $800 to $999 | 4 (6.6%) | 0 (0.0%) |
| $1,000 to $1,499 | 8 (13.1%) | 0 (0.0%) |
| $1,500 to $1,999 | 0 (0.0%) | 0 (0.0%) |
| $2,000 to $2,499 | 6 (9.8%) | 0 (0.0%) |
| $2,500 to $2,999 | 1 (1.6%) | 0 (0.0%) |
| $3,000 or more | 0 (0.0%) | 0 (0.0%) |
| Total | 61 (100.0%) | 2 (100.0%) |
Physical Housing Characteristics in Providence
Housing Structures in Providence
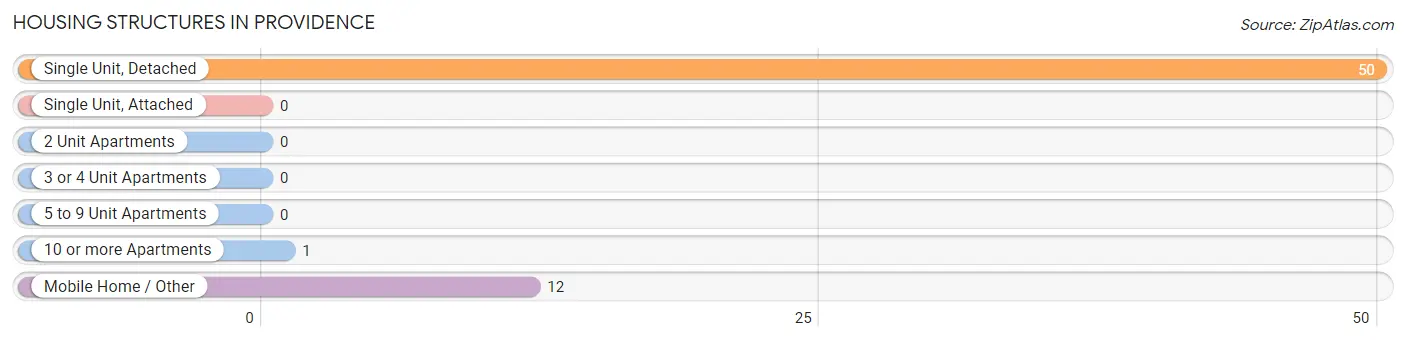
| Structure Type | # Housing Units | % Housing Units |
| Single Unit, Detached | 50 | 79.4% |
| Single Unit, Attached | 0 | 0.0% |
| 2 Unit Apartments | 0 | 0.0% |
| 3 or 4 Unit Apartments | 0 | 0.0% |
| 5 to 9 Unit Apartments | 0 | 0.0% |
| 10 or more Apartments | 1 | 1.6% |
| Mobile Home / Other | 12 | 19.1% |
| Total | 63 | 100.0% |
Housing Structures by Occupancy in Providence
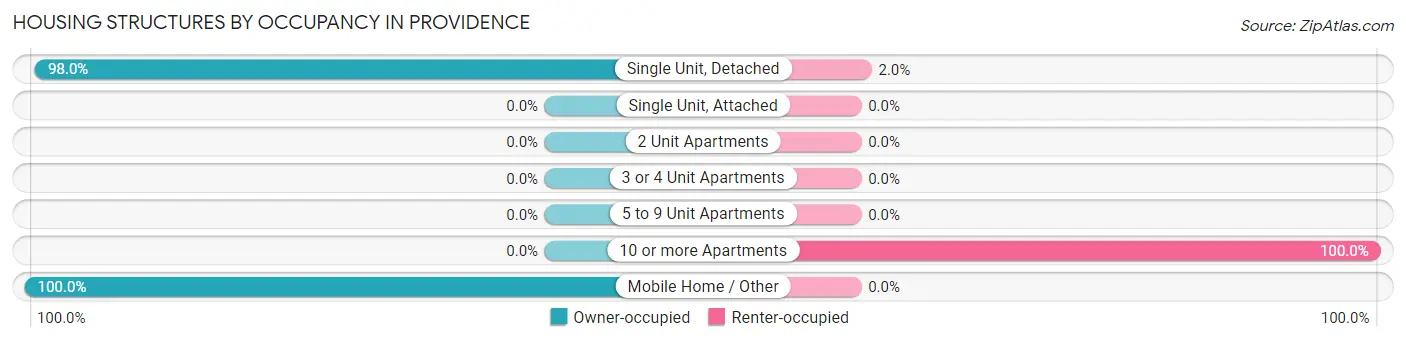
| Structure Type | Owner-occupied | Renter-occupied |
| Single Unit, Detached | 49 (98.0%) | 1 (2.0%) |
| Single Unit, Attached | 0 (0.0%) | 0 (0.0%) |
| 2 Unit Apartments | 0 (0.0%) | 0 (0.0%) |
| 3 or 4 Unit Apartments | 0 (0.0%) | 0 (0.0%) |
| 5 to 9 Unit Apartments | 0 (0.0%) | 0 (0.0%) |
| 10 or more Apartments | 0 (0.0%) | 1 (100.0%) |
| Mobile Home / Other | 12 (100.0%) | 0 (0.0%) |
| Total | 61 (96.8%) | 2 (3.2%) |
Housing Structures by Number of Rooms in Providence
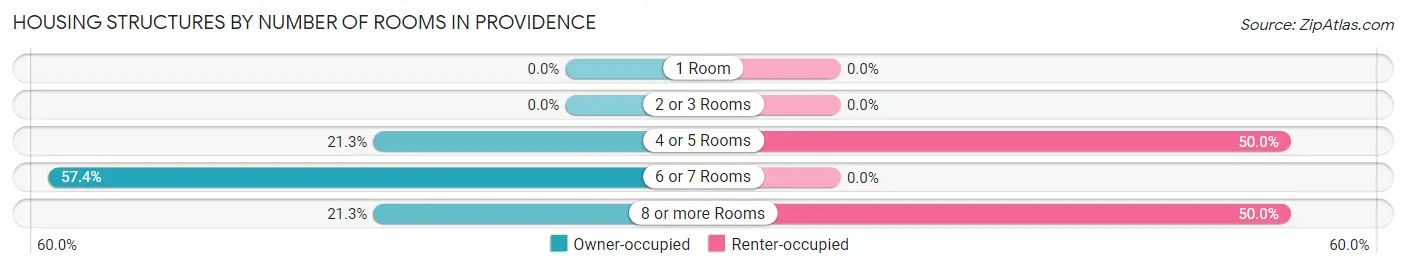
| Number of Rooms | Owner-occupied | Renter-occupied |
| 1 Room | 0 (0.0%) | 0 (0.0%) |
| 2 or 3 Rooms | 0 (0.0%) | 0 (0.0%) |
| 4 or 5 Rooms | 13 (21.3%) | 1 (50.0%) |
| 6 or 7 Rooms | 35 (57.4%) | 0 (0.0%) |
| 8 or more Rooms | 13 (21.3%) | 1 (50.0%) |
| Total | 61 (100.0%) | 2 (100.0%) |
Housing Structure by Heating Type in Providence
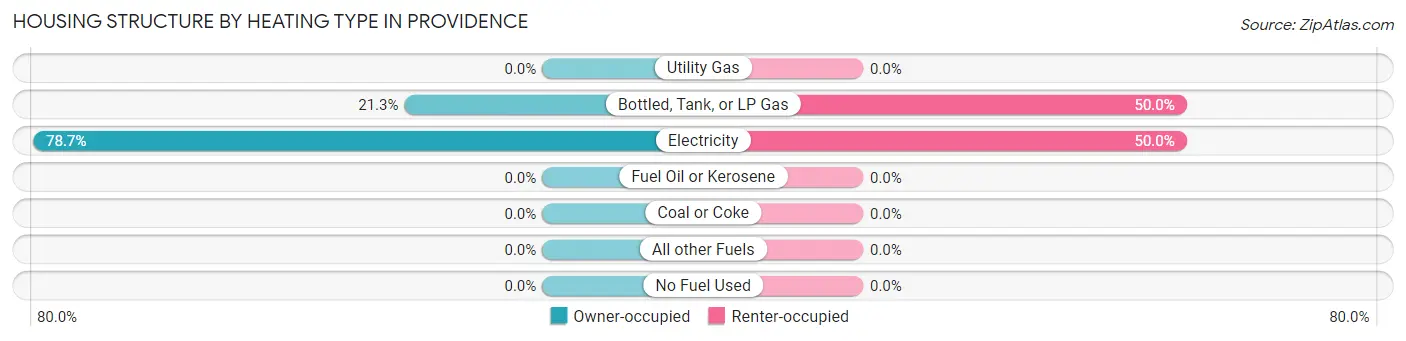
| Heating Type | Owner-occupied | Renter-occupied |
| Utility Gas | 0 (0.0%) | 0 (0.0%) |
| Bottled, Tank, or LP Gas | 13 (21.3%) | 1 (50.0%) |
| Electricity | 48 (78.7%) | 1 (50.0%) |
| Fuel Oil or Kerosene | 0 (0.0%) | 0 (0.0%) |
| Coal or Coke | 0 (0.0%) | 0 (0.0%) |
| All other Fuels | 0 (0.0%) | 0 (0.0%) |
| No Fuel Used | 0 (0.0%) | 0 (0.0%) |
| Total | 61 (100.0%) | 2 (100.0%) |
Household Vehicle Usage in Providence
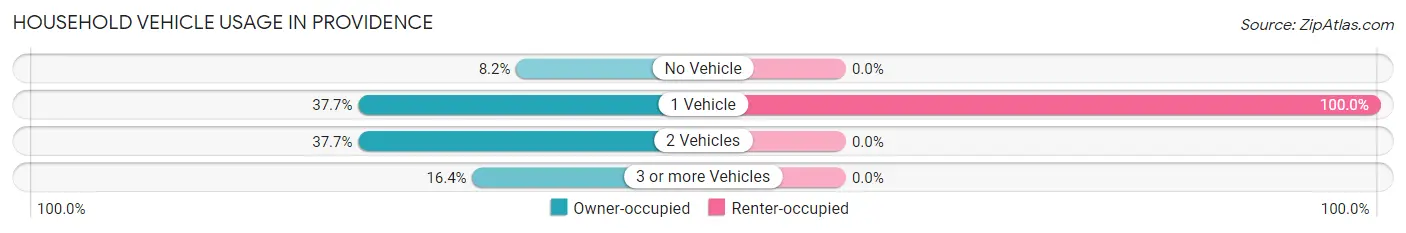
| Vehicles per Household | Owner-occupied | Renter-occupied |
| No Vehicle | 5 (8.2%) | 0 (0.0%) |
| 1 Vehicle | 23 (37.7%) | 2 (100.0%) |
| 2 Vehicles | 23 (37.7%) | 0 (0.0%) |
| 3 or more Vehicles | 10 (16.4%) | 0 (0.0%) |
| Total | 61 (100.0%) | 2 (100.0%) |
Real Estate & Mortgages in Providence
Real Estate and Mortgage Overview in Providence
| Characteristic | Without Mortgage | With Mortgage |
| Housing Units | 40 | 21 |
| Median Property Value | $98,900 | $104,700 |
| Median Household Income | - | - |
| Monthly Housing Costs | $313 | $0 |
| Real Estate Taxes | $350 | $0 |
Property Value by Mortgage Status in Providence
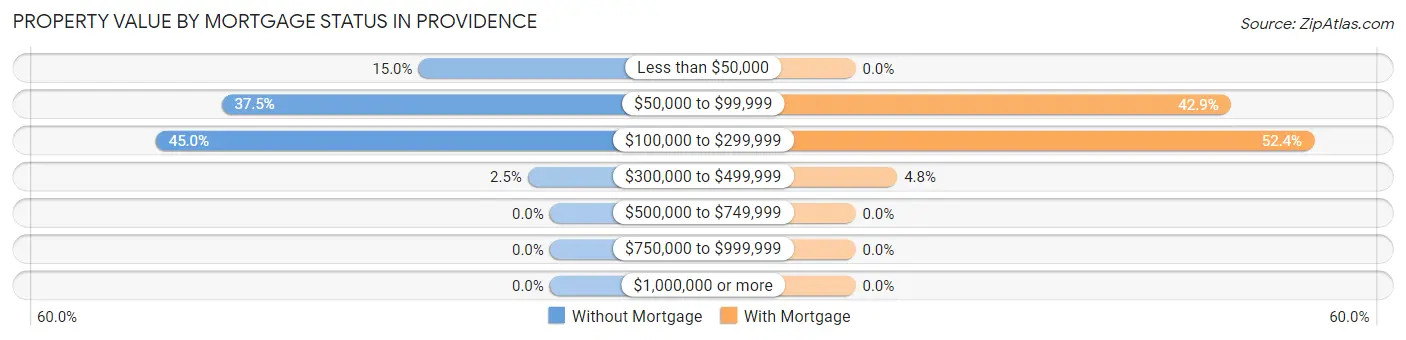
| Property Value | Without Mortgage | With Mortgage |
| Less than $50,000 | 6 (15.0%) | 0 (0.0%) |
| $50,000 to $99,999 | 15 (37.5%) | 9 (42.9%) |
| $100,000 to $299,999 | 18 (45.0%) | 11 (52.4%) |
| $300,000 to $499,999 | 1 (2.5%) | 1 (4.8%) |
| $500,000 to $749,999 | 0 (0.0%) | 0 (0.0%) |
| $750,000 to $999,999 | 0 (0.0%) | 0 (0.0%) |
| $1,000,000 or more | 0 (0.0%) | 0 (0.0%) |
| Total | 40 (100.0%) | 21 (100.0%) |
Household Income by Mortgage Status in Providence
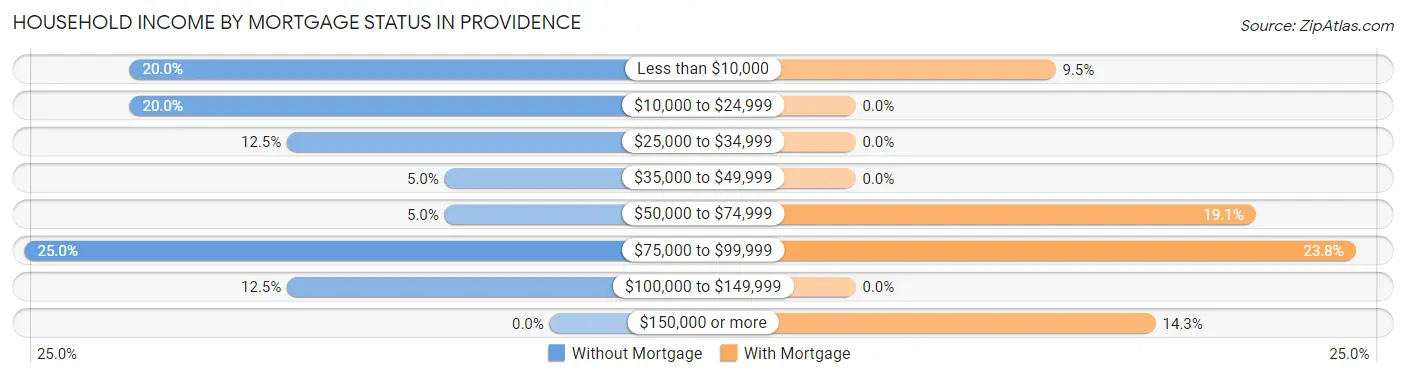
| Household Income | Without Mortgage | With Mortgage |
| Less than $10,000 | 8 (20.0%) | 2 (9.5%) |
| $10,000 to $24,999 | 8 (20.0%) | 0 (0.0%) |
| $25,000 to $34,999 | 5 (12.5%) | 0 (0.0%) |
| $35,000 to $49,999 | 2 (5.0%) | 0 (0.0%) |
| $50,000 to $74,999 | 2 (5.0%) | 4 (19.1%) |
| $75,000 to $99,999 | 10 (25.0%) | 5 (23.8%) |
| $100,000 to $149,999 | 5 (12.5%) | 0 (0.0%) |
| $150,000 or more | 0 (0.0%) | 3 (14.3%) |
| Total | 40 (100.0%) | 21 (100.0%) |
Property Value to Household Income Ratio in Providence
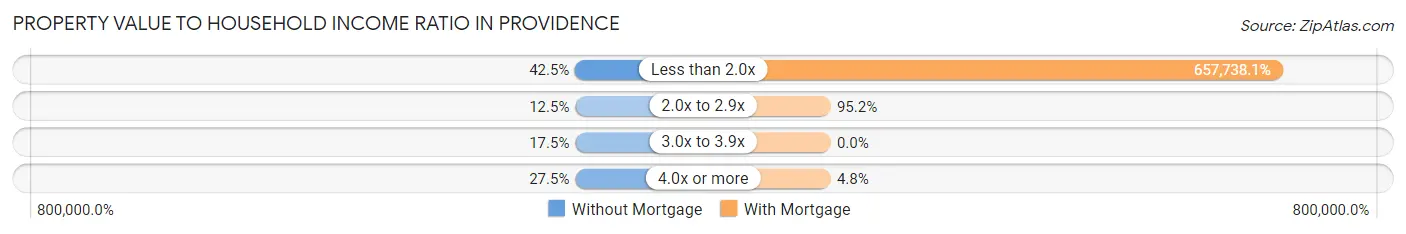
| Value-to-Income Ratio | Without Mortgage | With Mortgage |
| Less than 2.0x | 17 (42.5%) | 138,125 (657,738.1%) |
| 2.0x to 2.9x | 5 (12.5%) | 20 (95.2%) |
| 3.0x to 3.9x | 7 (17.5%) | 0 (0.0%) |
| 4.0x or more | 11 (27.5%) | 1 (4.8%) |
| Total | 40 (100.0%) | 21 (100.0%) |
Real Estate Taxes by Mortgage Status in Providence
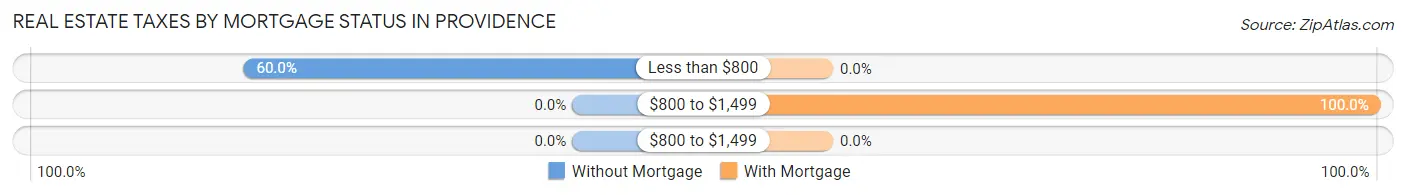
| Property Taxes | Without Mortgage | With Mortgage |
| Less than $800 | 24 (60.0%) | 0 (0.0%) |
| $800 to $1,499 | 0 (0.0%) | 21 (100.0%) |
| $800 to $1,499 | 0 (0.0%) | 0 (0.0%) |
| Total | 40 (100.0%) | 21 (100.0%) |
Health & Disability in Providence
Health Insurance Coverage by Age in Providence
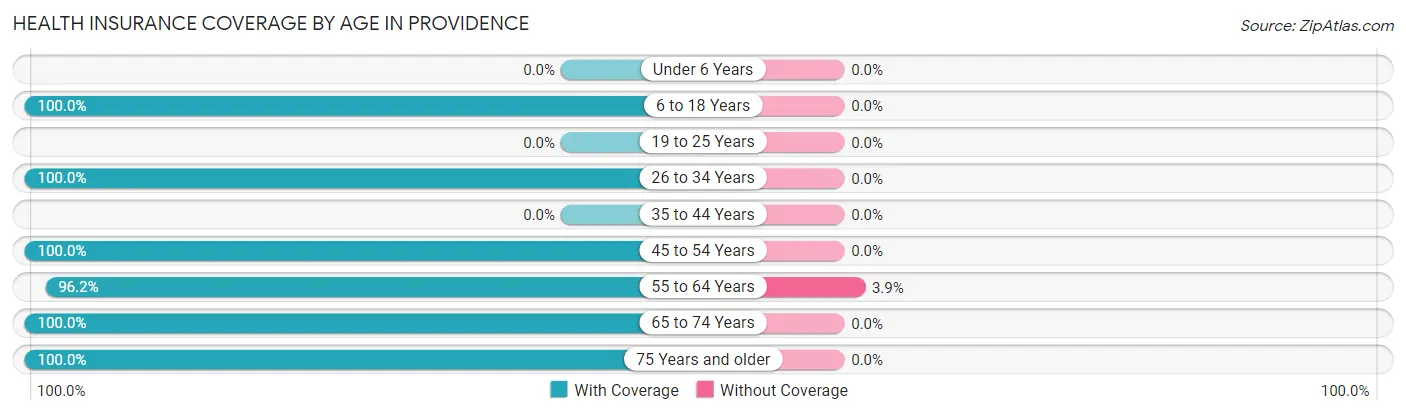
| Age Bracket | With Coverage | Without Coverage |
| Under 6 Years | 0 (0.0%) | 0 (0.0%) |
| 6 to 18 Years | 3 (100.0%) | 0 (0.0%) |
| 19 to 25 Years | 0 (0.0%) | 0 (0.0%) |
| 26 to 34 Years | 6 (100.0%) | 0 (0.0%) |
| 35 to 44 Years | 0 (0.0%) | 0 (0.0%) |
| 45 to 54 Years | 21 (100.0%) | 0 (0.0%) |
| 55 to 64 Years | 50 (96.2%) | 2 (3.8%) |
| 65 to 74 Years | 21 (100.0%) | 0 (0.0%) |
| 75 Years and older | 19 (100.0%) | 0 (0.0%) |
| Total | 120 (98.4%) | 2 (1.6%) |
Health Insurance Coverage by Citizenship Status in Providence
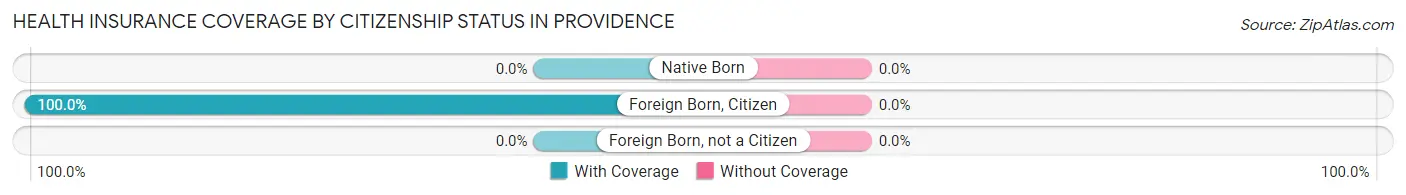
| Citizenship Status | With Coverage | Without Coverage |
| Native Born | 0 (0.0%) | 0 (0.0%) |
| Foreign Born, Citizen | 3 (100.0%) | 0 (0.0%) |
| Foreign Born, not a Citizen | 0 (0.0%) | 0 (0.0%) |
Health Insurance Coverage by Household Income in Providence
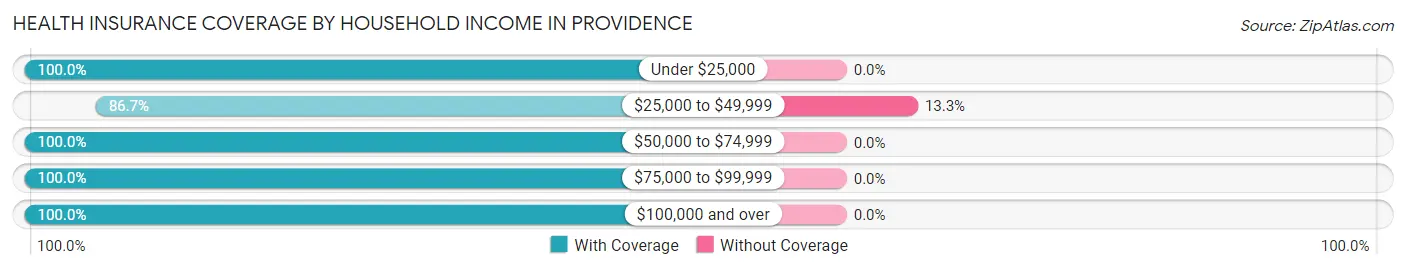
| Household Income | With Coverage | Without Coverage |
| Under $25,000 | 25 (100.0%) | 0 (0.0%) |
| $25,000 to $49,999 | 13 (86.7%) | 2 (13.3%) |
| $50,000 to $74,999 | 9 (100.0%) | 0 (0.0%) |
| $75,000 to $99,999 | 14 (100.0%) | 0 (0.0%) |
| $100,000 and over | 59 (100.0%) | 0 (0.0%) |
Public vs Private Health Insurance Coverage by Age in Providence
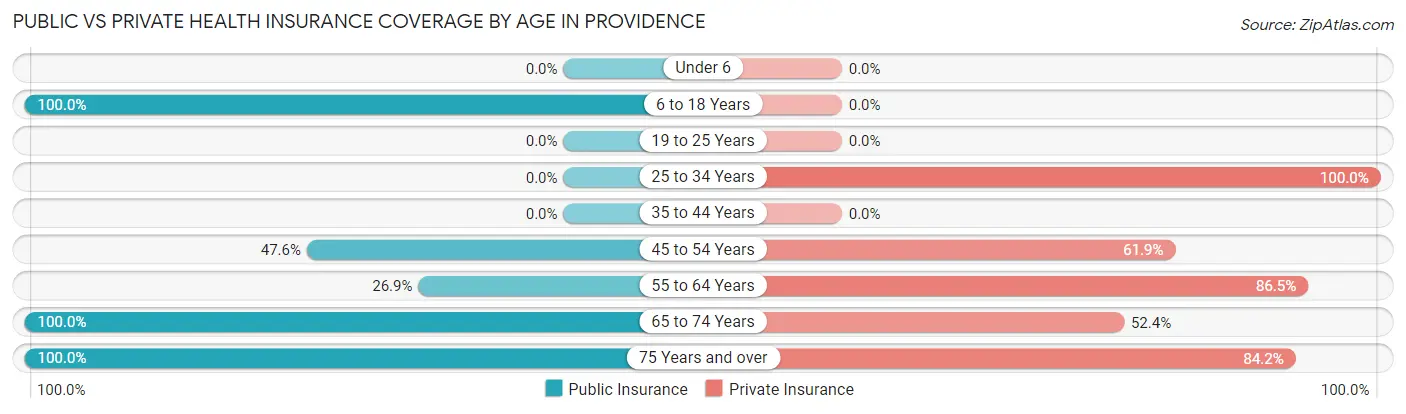
| Age Bracket | Public Insurance | Private Insurance |
| Under 6 | 0 (0.0%) | 0 (0.0%) |
| 6 to 18 Years | 3 (100.0%) | 0 (0.0%) |
| 19 to 25 Years | 0 (0.0%) | 0 (0.0%) |
| 25 to 34 Years | 0 (0.0%) | 6 (100.0%) |
| 35 to 44 Years | 0 (0.0%) | 0 (0.0%) |
| 45 to 54 Years | 10 (47.6%) | 13 (61.9%) |
| 55 to 64 Years | 14 (26.9%) | 45 (86.5%) |
| 65 to 74 Years | 21 (100.0%) | 11 (52.4%) |
| 75 Years and over | 19 (100.0%) | 16 (84.2%) |
| Total | 67 (54.9%) | 91 (74.6%) |
Disability Status by Sex by Age in Providence
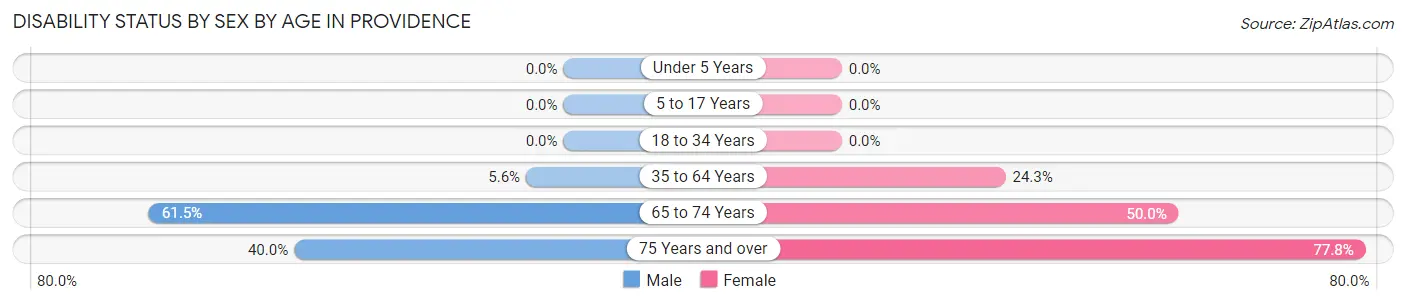
| Age Bracket | Male | Female |
| Under 5 Years | 0 (0.0%) | 0 (0.0%) |
| 5 to 17 Years | 0 (0.0%) | 0 (0.0%) |
| 18 to 34 Years | 0 (0.0%) | 0 (0.0%) |
| 35 to 64 Years | 2 (5.6%) | 9 (24.3%) |
| 65 to 74 Years | 8 (61.5%) | 4 (50.0%) |
| 75 Years and over | 4 (40.0%) | 7 (77.8%) |
Disability Class by Sex by Age in Providence
Disability Class: Hearing Difficulty
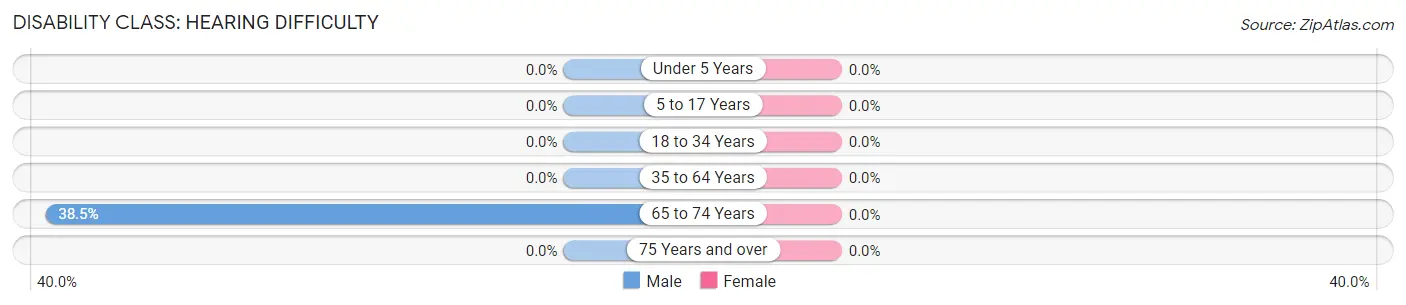
| Age Bracket | Male | Female |
| Under 5 Years | 0 (0.0%) | 0 (0.0%) |
| 5 to 17 Years | 0 (0.0%) | 0 (0.0%) |
| 18 to 34 Years | 0 (0.0%) | 0 (0.0%) |
| 35 to 64 Years | 0 (0.0%) | 0 (0.0%) |
| 65 to 74 Years | 5 (38.5%) | 0 (0.0%) |
| 75 Years and over | 0 (0.0%) | 0 (0.0%) |
Disability Class: Vision Difficulty
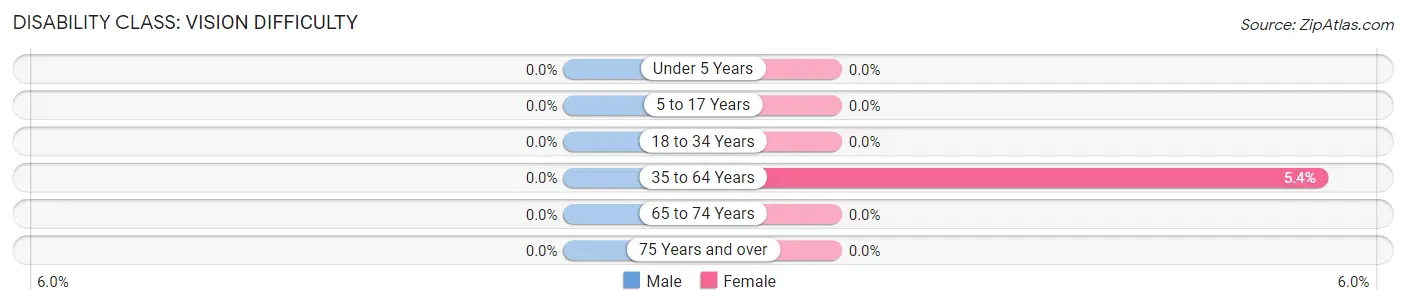
| Age Bracket | Male | Female |
| Under 5 Years | 0 (0.0%) | 0 (0.0%) |
| 5 to 17 Years | 0 (0.0%) | 0 (0.0%) |
| 18 to 34 Years | 0 (0.0%) | 0 (0.0%) |
| 35 to 64 Years | 0 (0.0%) | 2 (5.4%) |
| 65 to 74 Years | 0 (0.0%) | 0 (0.0%) |
| 75 Years and over | 0 (0.0%) | 0 (0.0%) |
Disability Class: Cognitive Difficulty
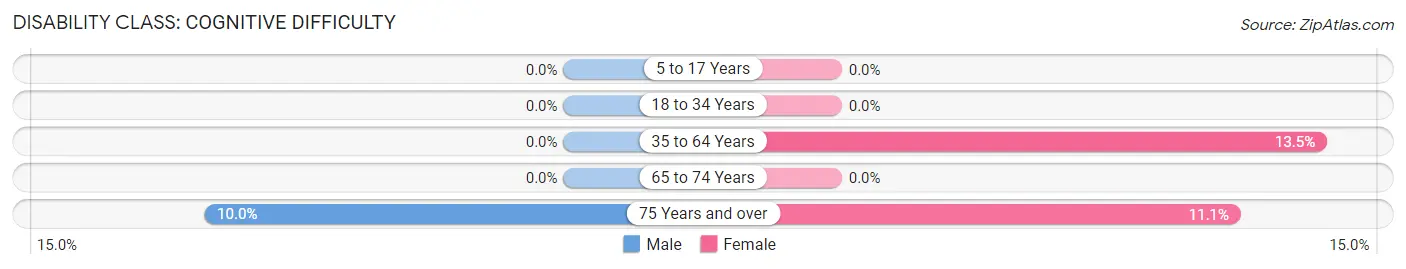
| Age Bracket | Male | Female |
| 5 to 17 Years | 0 (0.0%) | 0 (0.0%) |
| 18 to 34 Years | 0 (0.0%) | 0 (0.0%) |
| 35 to 64 Years | 0 (0.0%) | 5 (13.5%) |
| 65 to 74 Years | 0 (0.0%) | 0 (0.0%) |
| 75 Years and over | 1 (10.0%) | 1 (11.1%) |
Disability Class: Ambulatory Difficulty
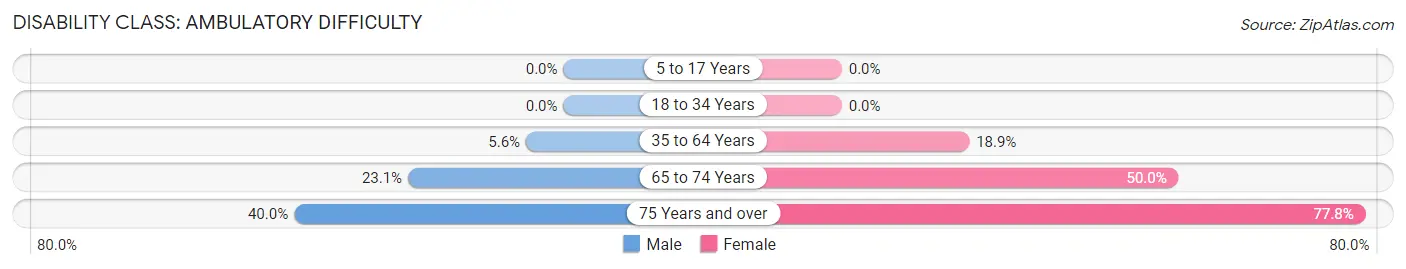
| Age Bracket | Male | Female |
| 5 to 17 Years | 0 (0.0%) | 0 (0.0%) |
| 18 to 34 Years | 0 (0.0%) | 0 (0.0%) |
| 35 to 64 Years | 2 (5.6%) | 7 (18.9%) |
| 65 to 74 Years | 3 (23.1%) | 4 (50.0%) |
| 75 Years and over | 4 (40.0%) | 7 (77.8%) |
Disability Class: Self-Care Difficulty
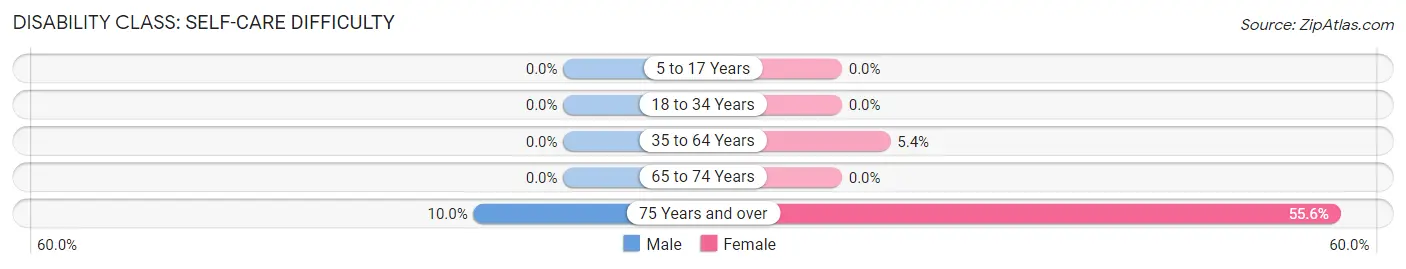
| Age Bracket | Male | Female |
| 5 to 17 Years | 0 (0.0%) | 0 (0.0%) |
| 18 to 34 Years | 0 (0.0%) | 0 (0.0%) |
| 35 to 64 Years | 0 (0.0%) | 2 (5.4%) |
| 65 to 74 Years | 0 (0.0%) | 0 (0.0%) |
| 75 Years and over | 1 (10.0%) | 5 (55.6%) |
Technology Access in Providence
Computing Device Access in Providence
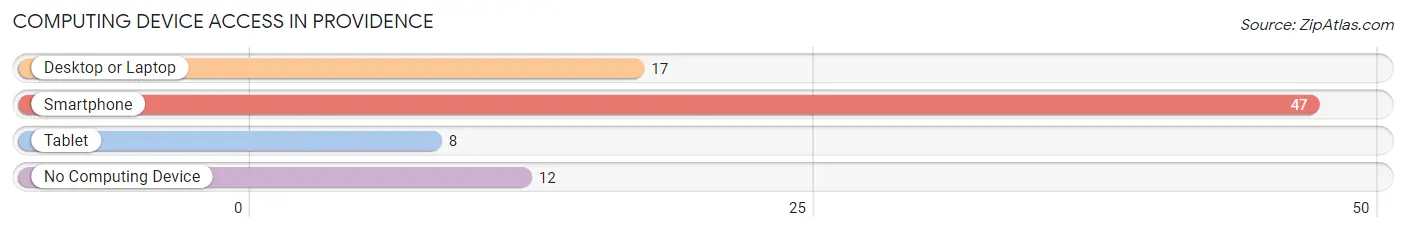
| Device Type | # Households | % Households |
| Desktop or Laptop | 17 | 27.0% |
| Smartphone | 47 | 74.6% |
| Tablet | 8 | 12.7% |
| No Computing Device | 12 | 19.1% |
| Total | 63 | 100.0% |
Internet Access in Providence
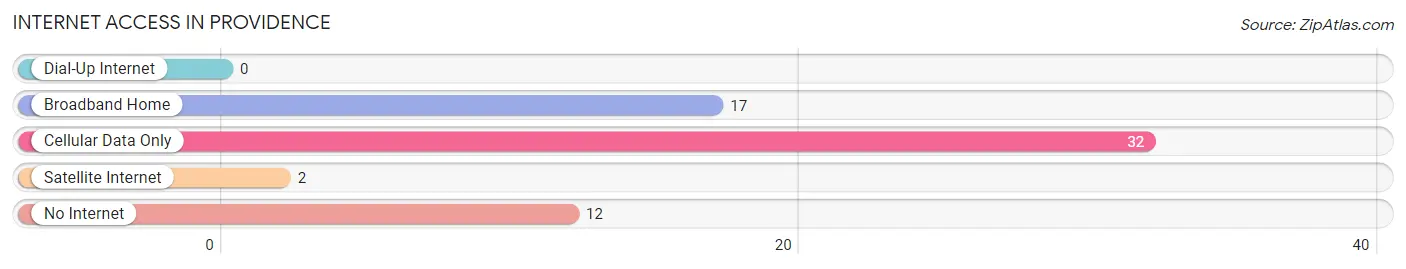
| Internet Type | # Households | % Households |
| Dial-Up Internet | 0 | 0.0% |
| Broadband Home | 17 | 27.0% |
| Cellular Data Only | 32 | 50.8% |
| Satellite Internet | 2 | 3.2% |
| No Internet | 12 | 19.1% |
| Total | 63 | 100.0% |
Providence Summary
Providence is a small town located in Jackson County, Alabama. It is situated in the foothills of the Appalachian Mountains and is part of the larger Jackson County area. The town has a population of approximately 1,000 people and is located about 30 miles north of Birmingham.
History
The town of Providence was founded in 1818 by a group of settlers from North Carolina. The town was named after the biblical city of Providence, Rhode Island. The settlers were attracted to the area due to its fertile soil and abundant natural resources. The town quickly grew and by the mid-1800s, it had become a thriving agricultural center.
The town was also home to several industries, including a cotton mill, a sawmill, and a gristmill. The town was also home to a number of churches, including the Providence Methodist Church, which was founded in 1820.
In the late 1800s, the town began to decline due to the decline of the cotton industry. The town was also affected by the Great Depression and World War II. After the war, the town began to experience a resurgence as new industries moved into the area.
Geography
Providence is located in the foothills of the Appalachian Mountains in Jackson County, Alabama. The town is situated on the banks of the Coosa River and is surrounded by rolling hills and forests. The town is located about 30 miles north of Birmingham and is accessible by US Highway 78.
The town has a total area of 1.2 square miles, all of which is land. The town has a humid subtropical climate, with hot, humid summers and mild winters. The average annual temperature is around 70 degrees Fahrenheit.
Economy
The economy of Providence is largely based on agriculture and manufacturing. The town is home to several farms, which produce a variety of crops, including corn, soybeans, and cotton. The town is also home to several manufacturing companies, which produce a variety of products, including furniture, clothing, and automotive parts.
The town is also home to several small businesses, including restaurants, shops, and service providers. The town is also home to a number of tourist attractions, including the Providence Museum and the Providence Historic District.
Demographics
As of the 2010 census, the population of Providence was 1,000. The town has a population density of 830 people per square mile. The racial makeup of the town is 97.2% White, 0.7% African American, 0.3% Native American, 0.3% Asian, and 1.5% from other races.
The median household income in Providence is $37,500, and the median family income is $45,000. The town has a poverty rate of 16.7%. The town has a high school graduation rate of 87.5%. The town is served by the Jackson County School District.
Common Questions
What is Per Capita Income in Providence?
Per Capita income in Providence is $43,507.
What is the Median Family Income in Providence?
Median Family Income in Providence is $127,750.
What is the Median Household income in Providence?
Median Household Income in Providence is $67,750.
What is Income or Wage Gap in Providence?
Income or Wage Gap in Providence is 45.4%.
Women in Providence earn 54.6 cents for every dollar earned by a man.
What is Inequality or Gini Index in Providence?
Inequality or Gini Index in Providence is 0.42.
What is the Total Population of Providence?
Total Population of Providence is 122.
What is the Total Male Population of Providence?
Total Male Population of Providence is 65.
What is the Total Female Population of Providence?
Total Female Population of Providence is 57.
What is the Ratio of Males per 100 Females in Providence?
There are 114.04 Males per 100 Females in Providence.
What is the Ratio of Females per 100 Males in Providence?
There are 87.69 Females per 100 Males in Providence.
What is the Median Population Age in Providence?
Median Population Age in Providence is 58.5 Years.
What is the Average Family Size in Providence
Average Family Size in Providence is 2.9 People.
What is the Average Household Size in Providence
Average Household Size in Providence is 1.9 People.
How Large is the Labor Force in Providence?
There are 56 People in the Labor Forcein in Providence.
What is the Percentage of People in the Labor Force in Providence?
47.1% of People are in the Labor Force in Providence.
What is the Unemployment Rate in Providence?
Unemployment Rate in Providence is 3.6%.