Opp, AL Map & Demographics
Opp Map
Opp Overview
$25,880
PER CAPITA INCOME
$61,397
AVG FAMILY INCOME
$42,956
AVG HOUSEHOLD INCOME
37.9%
WAGE / INCOME GAP [ % ]
62.1¢/ $1
WAGE / INCOME GAP [ $ ]
0.45
INEQUALITY / GINI INDEX
6,741
TOTAL POPULATION
3,155
MALE POPULATION
3,586
FEMALE POPULATION
87.98
MALES / 100 FEMALES
113.66
FEMALES / 100 MALES
46.8
MEDIAN AGE
3.0
AVG FAMILY SIZE
2.3
AVG HOUSEHOLD SIZE
3,080
LABOR FORCE [ PEOPLE ]
55.9%
PERCENT IN LABOR FORCE
6.0%
UNEMPLOYMENT RATE
Opp Zip Codes
Opp Area Codes
Income in Opp
Income Overview in Opp
Per Capita Income in Opp is $25,880, while median incomes of families and households are $61,397 and $42,956 respectively.
| Characteristic | Number | Measure |
| Per Capita Income | 6,741 | $25,880 |
| Median Family Income | 1,739 | $61,397 |
| Mean Family Income | 1,739 | $74,932 |
| Median Household Income | 2,793 | $42,956 |
| Mean Household Income | 2,793 | $58,994 |
| Income Deficit | 1,739 | $0 |
| Wage / Income Gap (%) | 6,741 | 37.85% |
| Wage / Income Gap ($) | 6,741 | 62.15¢ per $1 |
| Gini / Inequality Index | 6,741 | 0.45 |
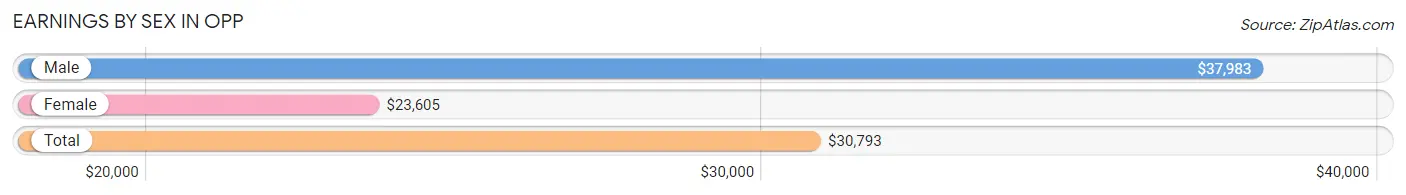
Earnings by Sex in Opp
Average Earnings in Opp are $30,793, $37,983 for men and $23,605 for women, a difference of 37.9%.
| Sex | Number | Average Earnings |
| Male | 1,633 (50.5%) | $37,983 |
| Female | 1,602 (49.5%) | $23,605 |
| Total | 3,235 (100.0%) | $30,793 |
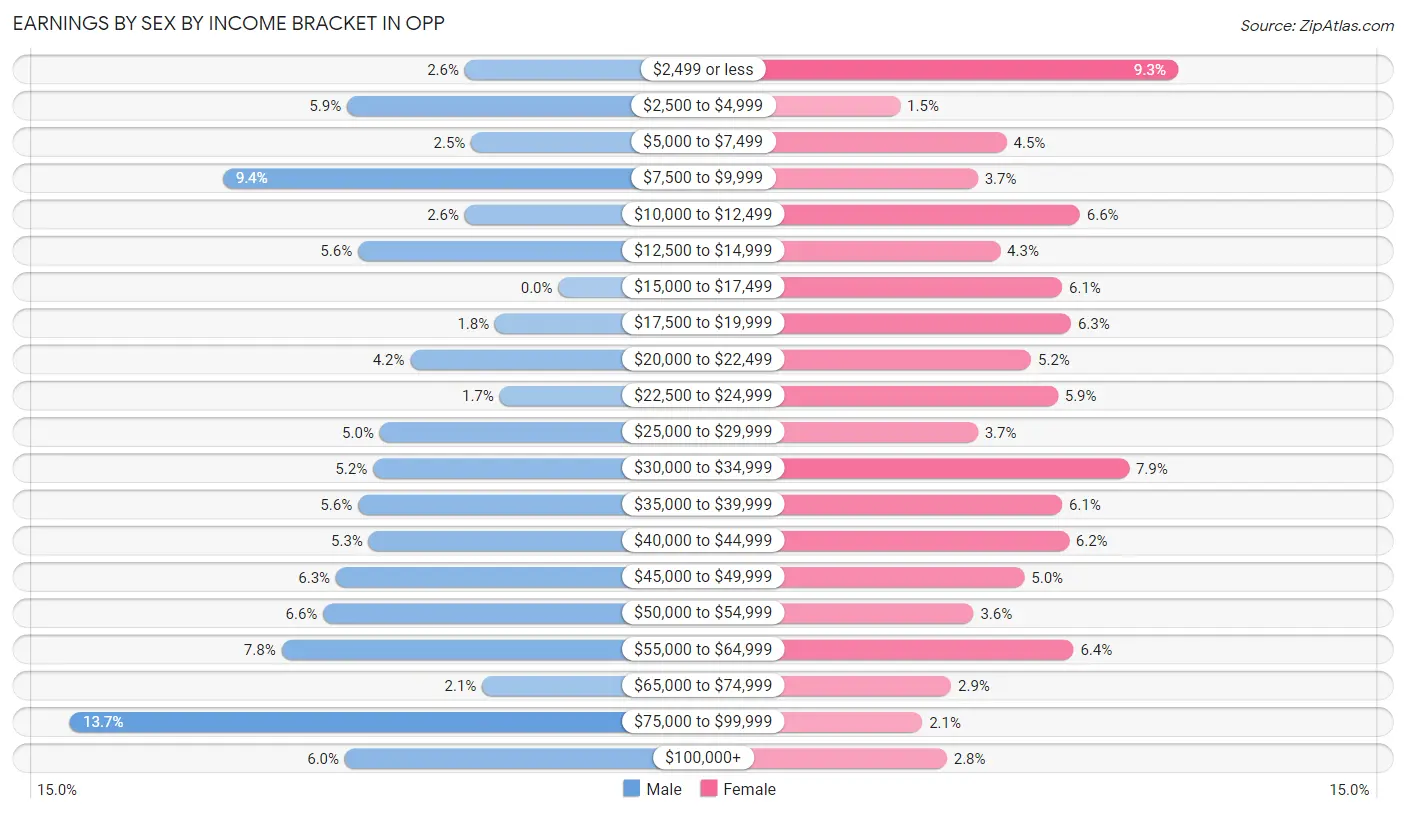
Earnings by Sex by Income Bracket in Opp
The most common earnings brackets in Opp are $75,000 to $99,999 for men (224 | 13.7%) and $2,499 or less for women (149 | 9.3%).
| Income | Male | Female |
| $2,499 or less | 43 (2.6%) | 149 (9.3%) |
| $2,500 to $4,999 | 97 (5.9%) | 24 (1.5%) |
| $5,000 to $7,499 | 40 (2.5%) | 72 (4.5%) |
| $7,500 to $9,999 | 154 (9.4%) | 59 (3.7%) |
| $10,000 to $12,499 | 43 (2.6%) | 105 (6.6%) |
| $12,500 to $14,999 | 92 (5.6%) | 69 (4.3%) |
| $15,000 to $17,499 | 0 (0.0%) | 97 (6.0%) |
| $17,500 to $19,999 | 29 (1.8%) | 101 (6.3%) |
| $20,000 to $22,499 | 68 (4.2%) | 83 (5.2%) |
| $22,500 to $24,999 | 27 (1.7%) | 95 (5.9%) |
| $25,000 to $29,999 | 82 (5.0%) | 59 (3.7%) |
| $30,000 to $34,999 | 85 (5.2%) | 127 (7.9%) |
| $35,000 to $39,999 | 92 (5.6%) | 97 (6.0%) |
| $40,000 to $44,999 | 87 (5.3%) | 100 (6.2%) |
| $45,000 to $49,999 | 102 (6.2%) | 80 (5.0%) |
| $50,000 to $54,999 | 108 (6.6%) | 57 (3.6%) |
| $55,000 to $64,999 | 127 (7.8%) | 102 (6.4%) |
| $65,000 to $74,999 | 35 (2.1%) | 47 (2.9%) |
| $75,000 to $99,999 | 224 (13.7%) | 34 (2.1%) |
| $100,000+ | 98 (6.0%) | 45 (2.8%) |
| Total | 1,633 (100.0%) | 1,602 (100.0%) |
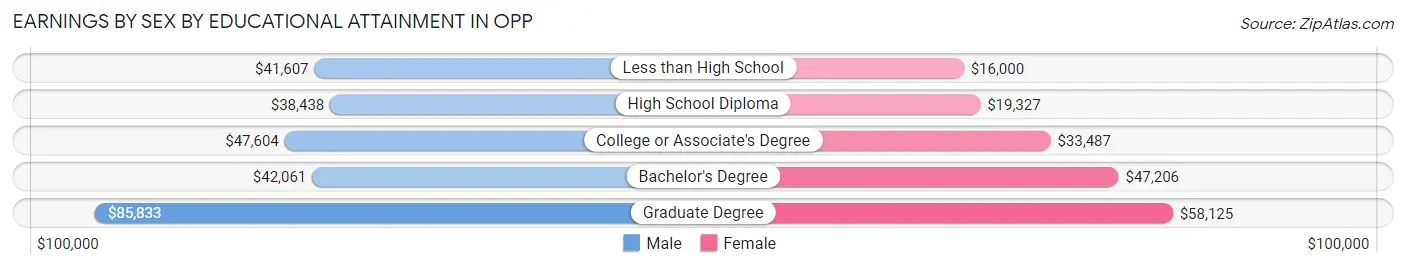
Earnings by Sex by Educational Attainment in Opp
Average earnings in Opp are $45,942 for men and $30,217 for women, a difference of 34.2%. Men with an educational attainment of graduate degree enjoy the highest average annual earnings of $85,833, while those with high school diploma education earn the least with $38,438. Women with an educational attainment of graduate degree earn the most with the average annual earnings of $58,125, while those with less than high school education have the smallest earnings of $16,000.
| Educational Attainment | Male Income | Female Income |
| Less than High School | $41,607 | $16,000 |
| High School Diploma | $38,438 | $19,327 |
| College or Associate's Degree | $47,604 | $33,487 |
| Bachelor's Degree | $42,061 | $47,206 |
| Graduate Degree | $85,833 | $58,125 |
| Total | $45,942 | $30,217 |
Family Income in Opp
Family Income Brackets in Opp
According to the Opp family income data, there are 363 families falling into the $100,000 to $149,999 income range, which is the most common income bracket and makes up 20.9% of all families. Conversely, the $150,000 to $199,999 income bracket is the least frequent group with only 54 families (3.1%) belonging to this category.
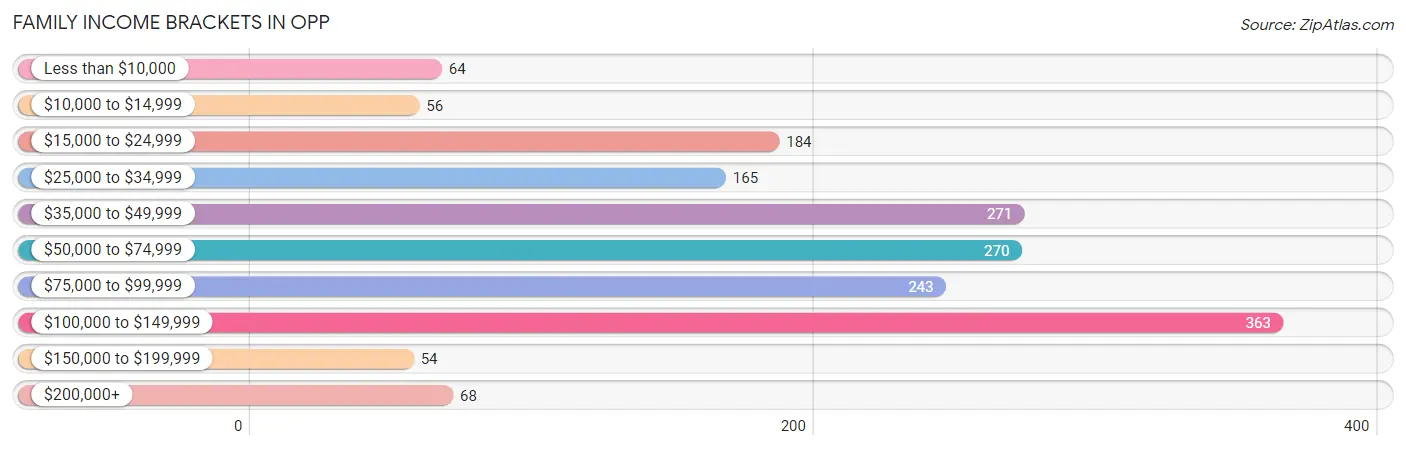
| Income Bracket | # Families | % Families |
| Less than $10,000 | 64 | 3.7% |
| $10,000 to $14,999 | 56 | 3.2% |
| $15,000 to $24,999 | 184 | 10.6% |
| $25,000 to $34,999 | 165 | 9.5% |
| $35,000 to $49,999 | 271 | 15.6% |
| $50,000 to $74,999 | 270 | 15.5% |
| $75,000 to $99,999 | 243 | 14.0% |
| $100,000 to $149,999 | 363 | 20.9% |
| $150,000 to $199,999 | 54 | 3.1% |
| $200,000+ | 68 | 3.9% |
Family Income by Famaliy Size in Opp
4-person families (354 | 20.4%) account for the highest median family income in Opp with $82,600 per family, while 2-person families (949 | 54.6%) have the highest median income of $29,186 per family member.
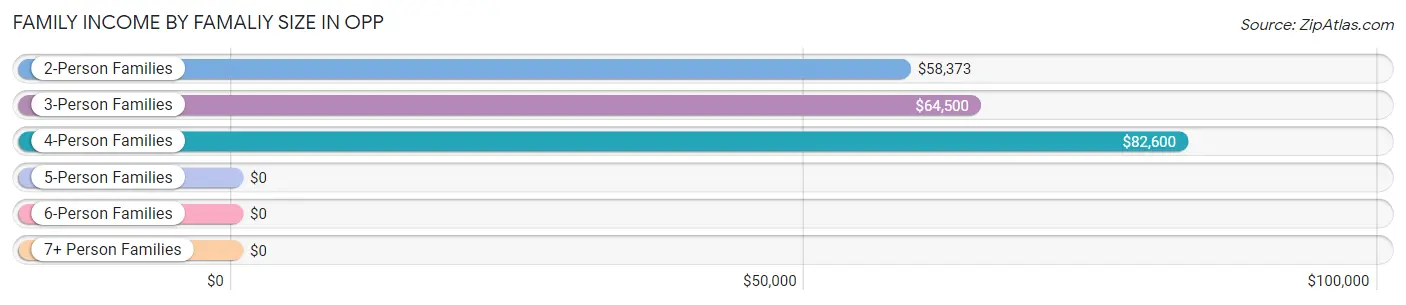
| Income Bracket | # Families | Median Income |
| 2-Person Families | 949 (54.6%) | $58,373 |
| 3-Person Families | 336 (19.3%) | $64,500 |
| 4-Person Families | 354 (20.4%) | $82,600 |
| 5-Person Families | 84 (4.8%) | $0 |
| 6-Person Families | 16 (0.9%) | $0 |
| 7+ Person Families | 0 (0.0%) | $0 |
| Total | 1,739 (100.0%) | $61,397 |
Family Income by Number of Earners in Opp
The median family income in Opp is $61,397, with families comprising 3+ earners (156) having the highest median family income of $143,492, while families with no earners (345) have the lowest median family income of $34,276, accounting for 9.0% and 19.8% of families, respectively.
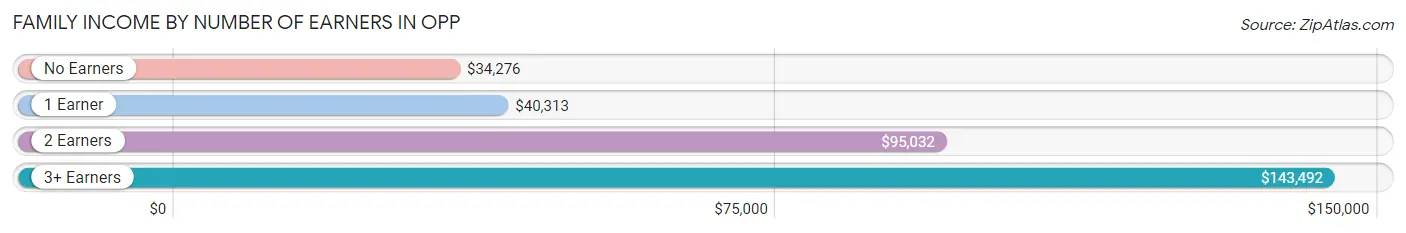
| Number of Earners | # Families | Median Income |
| No Earners | 345 (19.8%) | $34,276 |
| 1 Earner | 481 (27.7%) | $40,313 |
| 2 Earners | 757 (43.5%) | $95,032 |
| 3+ Earners | 156 (9.0%) | $143,492 |
| Total | 1,739 (100.0%) | $61,397 |
Household Income in Opp
Household Income Brackets in Opp
With 427 households falling in the category, the $50,000 to $74,999 income range is the most frequent in Opp, accounting for 15.3% of all households. In contrast, only 53 households (1.9%) fall into the $150,000 to $199,999 income bracket, making it the least populous group.
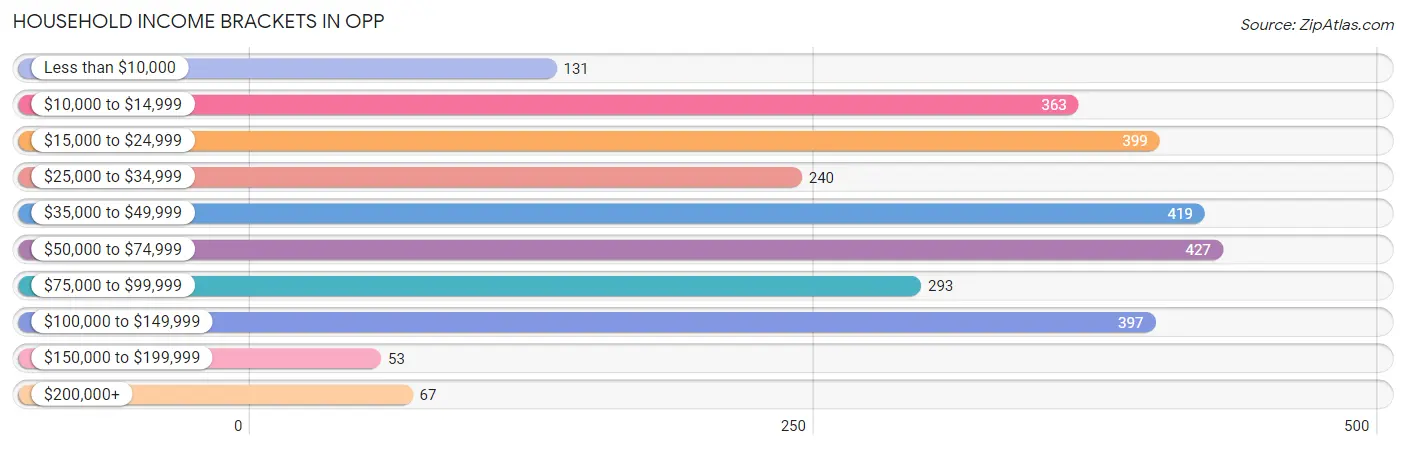
| Income Bracket | # Households | % Households |
| Less than $10,000 | 131 | 4.7% |
| $10,000 to $14,999 | 363 | 13.0% |
| $15,000 to $24,999 | 399 | 14.3% |
| $25,000 to $34,999 | 240 | 8.6% |
| $35,000 to $49,999 | 419 | 15.0% |
| $50,000 to $74,999 | 427 | 15.3% |
| $75,000 to $99,999 | 293 | 10.5% |
| $100,000 to $149,999 | 397 | 14.2% |
| $150,000 to $199,999 | 53 | 1.9% |
| $200,000+ | 67 | 2.4% |
Household Income by Householder Age in Opp
The median household income in Opp is $42,956, with the highest median household income of $57,703 found in the 45 to 64 years age bracket for the primary householder. A total of 1,013 households (36.3%) fall into this category. Meanwhile, the 15 to 24 years age bracket for the primary householder has the lowest median household income of $32,917, with 115 households (4.1%) in this group.
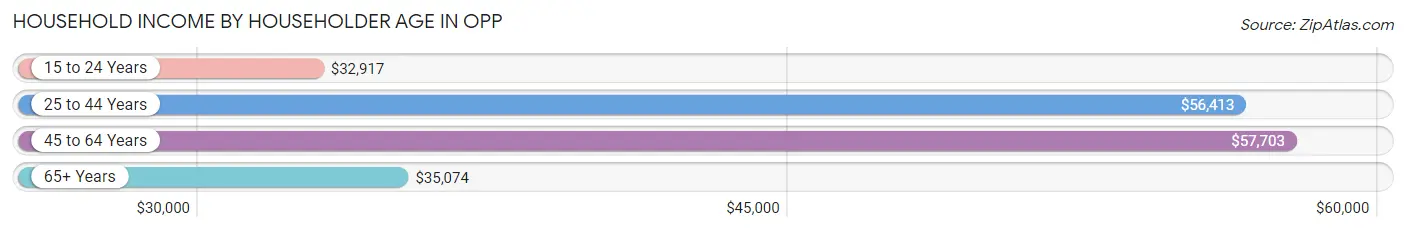
| Income Bracket | # Households | Median Income |
| 15 to 24 Years | 115 (4.1%) | $32,917 |
| 25 to 44 Years | 552 (19.8%) | $56,413 |
| 45 to 64 Years | 1,013 (36.3%) | $57,703 |
| 65+ Years | 1,113 (39.9%) | $35,074 |
| Total | 2,793 (100.0%) | $42,956 |
Poverty in Opp
Income Below Poverty by Sex and Age in Opp
With 11.3% poverty level for males and 25.8% for females among the residents of Opp, 15 year old males and 5 year old females are the most vulnerable to poverty, with 42 males (100.0%) and 35 females (81.4%) in their respective age groups living below the poverty level.
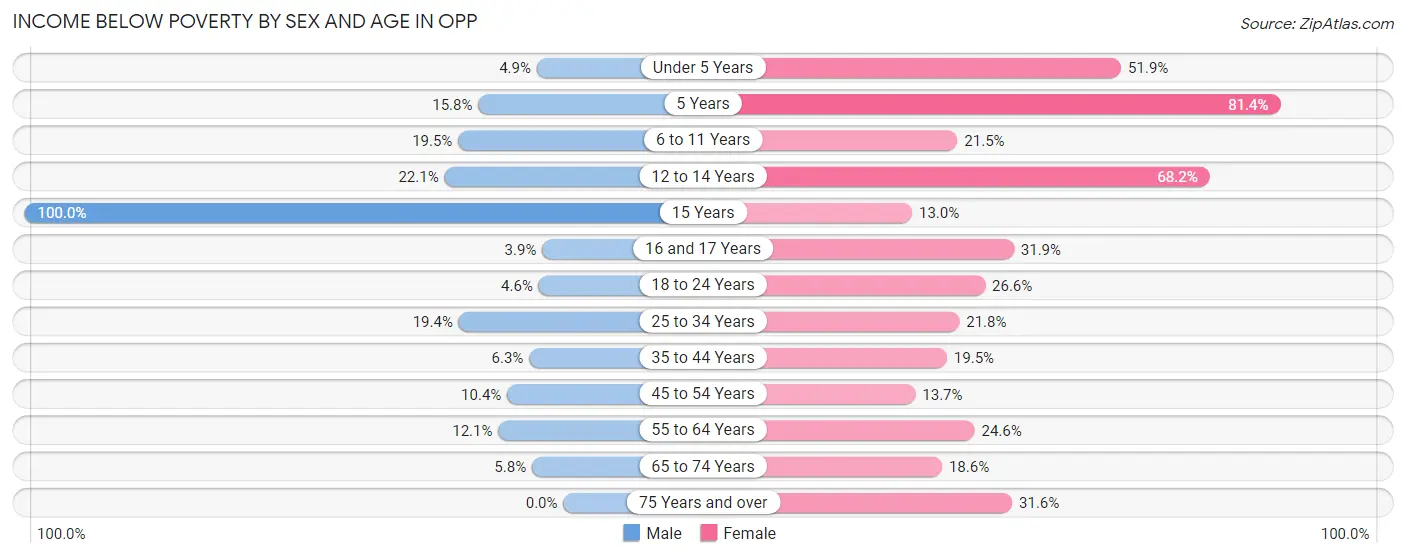
| Age Bracket | Male | Female |
| Under 5 Years | 9 (4.9%) | 70 (51.8%) |
| 5 Years | 18 (15.8%) | 35 (81.4%) |
| 6 to 11 Years | 57 (19.5%) | 53 (21.5%) |
| 12 to 14 Years | 15 (22.1%) | 58 (68.2%) |
| 15 Years | 42 (100.0%) | 3 (13.0%) |
| 16 and 17 Years | 2 (3.9%) | 46 (31.9%) |
| 18 to 24 Years | 18 (4.6%) | 50 (26.6%) |
| 25 to 34 Years | 47 (19.4%) | 77 (21.8%) |
| 35 to 44 Years | 17 (6.3%) | 56 (19.5%) |
| 45 to 54 Years | 48 (10.4%) | 71 (13.7%) |
| 55 to 64 Years | 61 (12.1%) | 103 (24.6%) |
| 65 to 74 Years | 16 (5.8%) | 80 (18.6%) |
| 75 Years and over | 0 (0.0%) | 214 (31.6%) |
| Total | 350 (11.3%) | 916 (25.8%) |
Income Above Poverty by Sex and Age in Opp
According to the poverty statistics in Opp, males aged 75 years and over and females aged 15 years are the age groups that are most secure financially, with 100.0% of males and 87.0% of females in these age groups living above the poverty line.
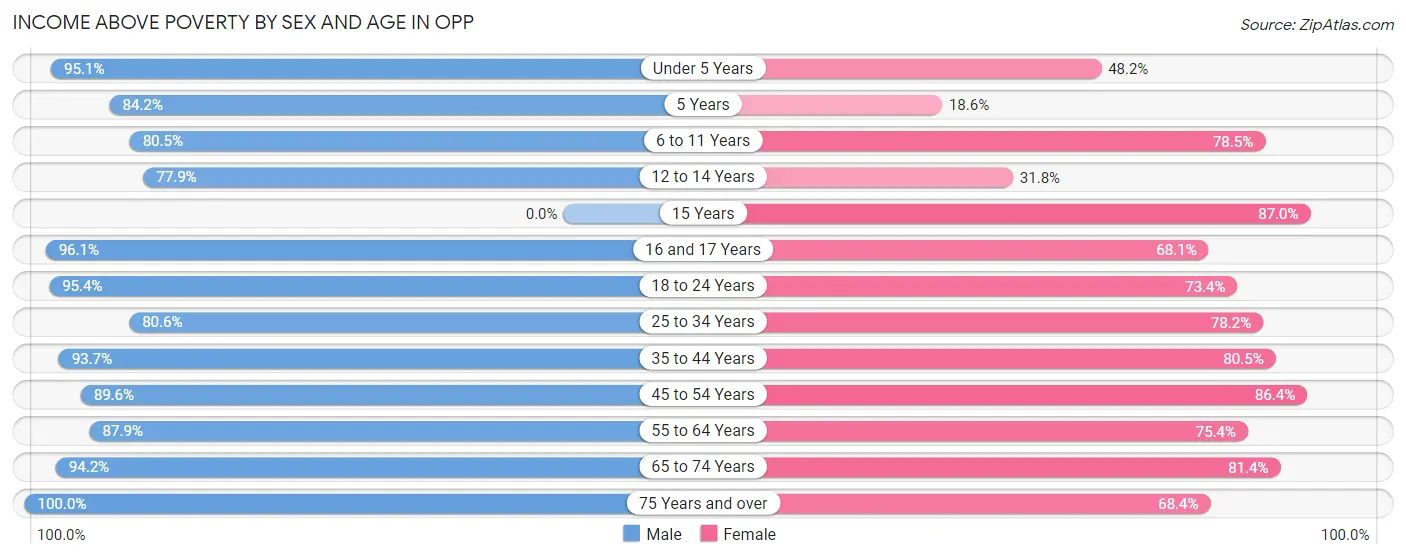
| Age Bracket | Male | Female |
| Under 5 Years | 174 (95.1%) | 65 (48.1%) |
| 5 Years | 96 (84.2%) | 8 (18.6%) |
| 6 to 11 Years | 235 (80.5%) | 194 (78.5%) |
| 12 to 14 Years | 53 (77.9%) | 27 (31.8%) |
| 15 Years | 0 (0.0%) | 20 (87.0%) |
| 16 and 17 Years | 49 (96.1%) | 98 (68.1%) |
| 18 to 24 Years | 376 (95.4%) | 138 (73.4%) |
| 25 to 34 Years | 195 (80.6%) | 276 (78.2%) |
| 35 to 44 Years | 251 (93.7%) | 231 (80.5%) |
| 45 to 54 Years | 412 (89.6%) | 449 (86.4%) |
| 55 to 64 Years | 444 (87.9%) | 315 (75.4%) |
| 65 to 74 Years | 259 (94.2%) | 350 (81.4%) |
| 75 Years and over | 212 (100.0%) | 463 (68.4%) |
| Total | 2,756 (88.7%) | 2,634 (74.2%) |
Income Below Poverty Among Married-Couple Families in Opp
The poverty statistics for married-couple families in Opp show that 6.6% or 83 of the total 1,258 families live below the poverty line. Families with 3 or 4 children have the highest poverty rate of 35.4%, comprising of 29 families. On the other hand, families with no children have the lowest poverty rate of 3.9%, which includes 32 families.
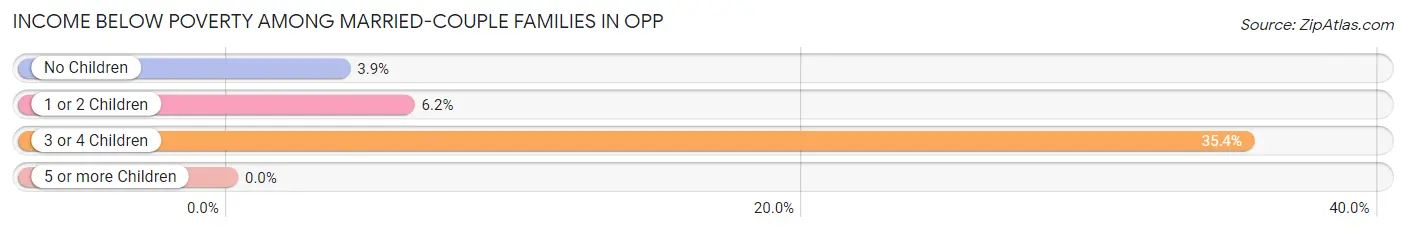
| Children | Above Poverty | Below Poverty |
| No Children | 786 (96.1%) | 32 (3.9%) |
| 1 or 2 Children | 336 (93.9%) | 22 (6.1%) |
| 3 or 4 Children | 53 (64.6%) | 29 (35.4%) |
| 5 or more Children | 0 (0.0%) | 0 (0.0%) |
| Total | 1,175 (93.4%) | 83 (6.6%) |
Income Below Poverty Among Single-Parent Households in Opp
According to the poverty data in Opp, 19.1% or 21 single-father households and 34.2% or 127 single-mother households are living below the poverty line. Among single-father households, those with 1 or 2 children have the highest poverty rate, with 2 households (25.0%) experiencing poverty. Likewise, among single-mother households, those with 1 or 2 children have the highest poverty rate, with 86 households (42.6%) falling below the poverty line.
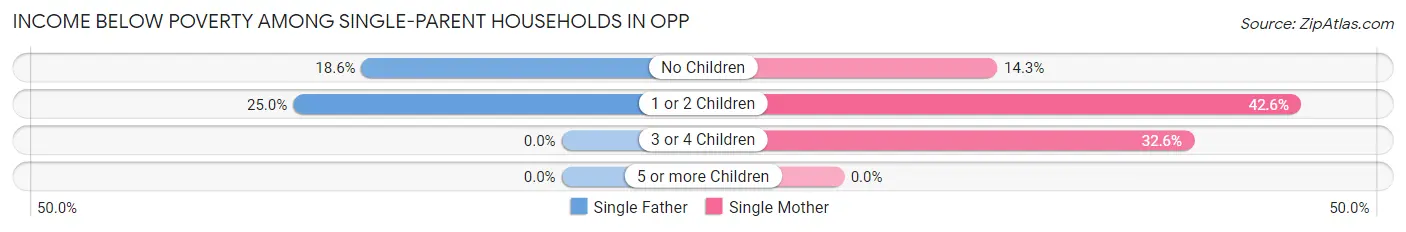
| Children | Single Father | Single Mother |
| No Children | 19 (18.6%) | 11 (14.3%) |
| 1 or 2 Children | 2 (25.0%) | 86 (42.6%) |
| 3 or 4 Children | 0 (0.0%) | 30 (32.6%) |
| 5 or more Children | 0 (0.0%) | 0 (0.0%) |
| Total | 21 (19.1%) | 127 (34.2%) |
Income Below Poverty Among Married-Couple vs Single-Parent Households in Opp
The poverty data for Opp shows that 83 of the married-couple family households (6.6%) and 148 of the single-parent households (30.8%) are living below the poverty level. Within the married-couple family households, those with 3 or 4 children have the highest poverty rate, with 29 households (35.4%) falling below the poverty line. Among the single-parent households, those with 1 or 2 children have the highest poverty rate, with 88 household (41.9%) living below poverty.
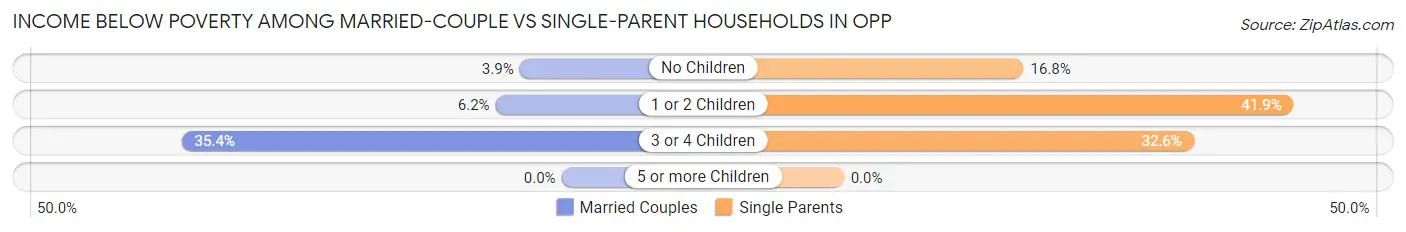
| Children | Married-Couple Families | Single-Parent Households |
| No Children | 32 (3.9%) | 30 (16.8%) |
| 1 or 2 Children | 22 (6.1%) | 88 (41.9%) |
| 3 or 4 Children | 29 (35.4%) | 30 (32.6%) |
| 5 or more Children | 0 (0.0%) | 0 (0.0%) |
| Total | 83 (6.6%) | 148 (30.8%) |
Race in Opp
The most populous races in Opp are White / Caucasian (5,300 | 78.6%), Black / African American (1,216 | 18.0%), and Two or more Races (158 | 2.3%).
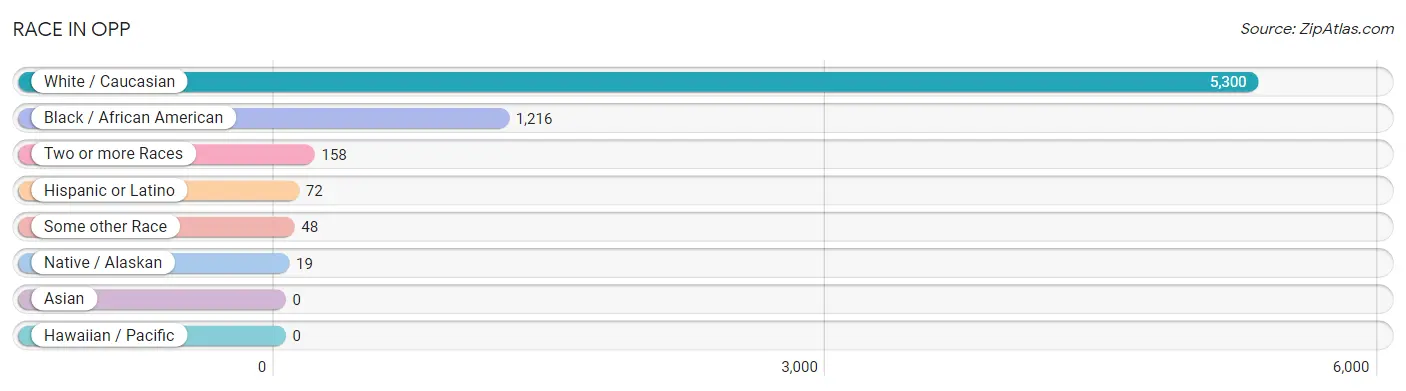
| Race | # Population | % Population |
| Asian | 0 | 0.0% |
| Black / African American | 1,216 | 18.0% |
| Hawaiian / Pacific | 0 | 0.0% |
| Hispanic or Latino | 72 | 1.1% |
| Native / Alaskan | 19 | 0.3% |
| White / Caucasian | 5,300 | 78.6% |
| Two or more Races | 158 | 2.3% |
| Some other Race | 48 | 0.7% |
| Total | 6,741 | 100.0% |
Ancestry in Opp
The most populous ancestries reported in Opp are American (755 | 11.2%), English (714 | 10.6%), Irish (486 | 7.2%), German (271 | 4.0%), and Scotch-Irish (122 | 1.8%), together accounting for 34.8% of all Opp residents.
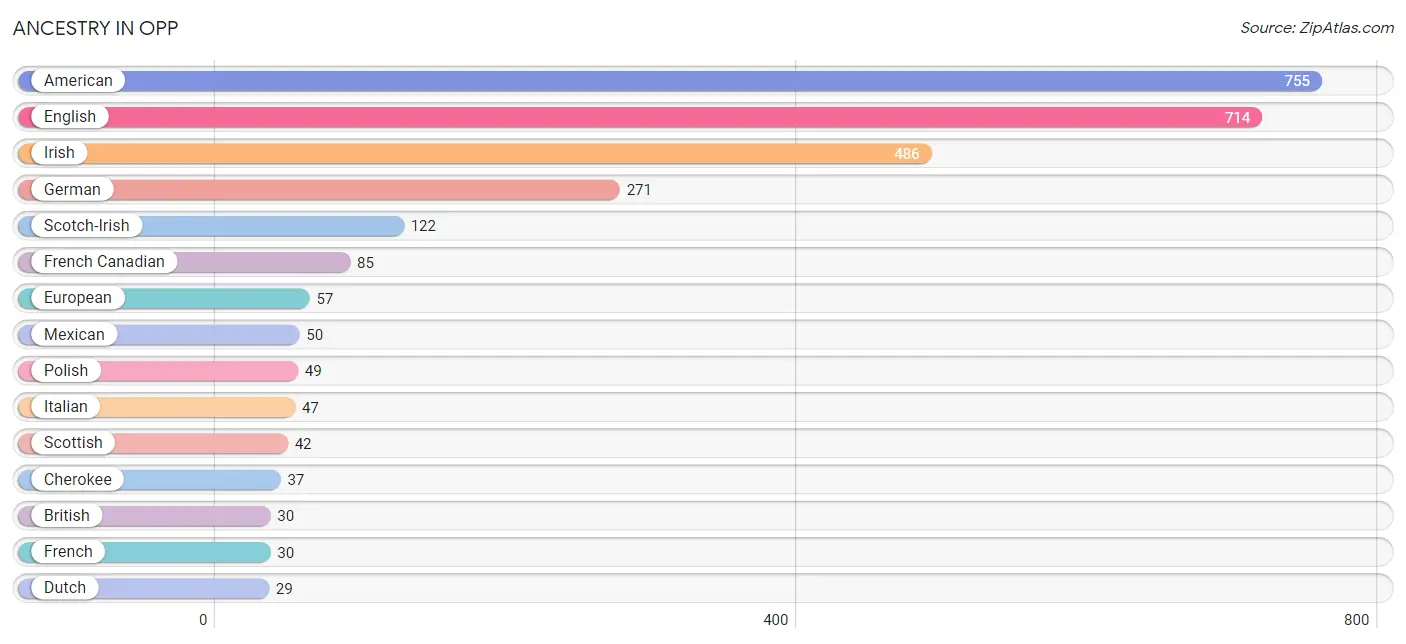
| Ancestry | # Population | % Population |
| American | 755 | 11.2% |
| Austrian | 10 | 0.2% |
| Blackfeet | 3 | 0.0% |
| British | 30 | 0.4% |
| Cajun | 21 | 0.3% |
| Celtic | 12 | 0.2% |
| Cherokee | 37 | 0.5% |
| Creek | 21 | 0.3% |
| Delaware | 13 | 0.2% |
| Dutch | 29 | 0.4% |
| English | 714 | 10.6% |
| European | 57 | 0.9% |
| French | 30 | 0.4% |
| French Canadian | 85 | 1.3% |
| German | 271 | 4.0% |
| Hungarian | 10 | 0.2% |
| Irish | 486 | 7.2% |
| Italian | 47 | 0.7% |
| Korean | 10 | 0.2% |
| Lithuanian | 8 | 0.1% |
| Mexican | 50 | 0.7% |
| Norwegian | 4 | 0.1% |
| Polish | 49 | 0.7% |
| Puerto Rican | 22 | 0.3% |
| Romanian | 17 | 0.3% |
| Scandinavian | 6 | 0.1% |
| Scotch-Irish | 122 | 1.8% |
| Scottish | 42 | 0.6% |
| Swedish | 15 | 0.2% |
| Swiss | 6 | 0.1% |
| Welsh | 6 | 0.1% | View All 31 Rows |
Immigrants in Opp
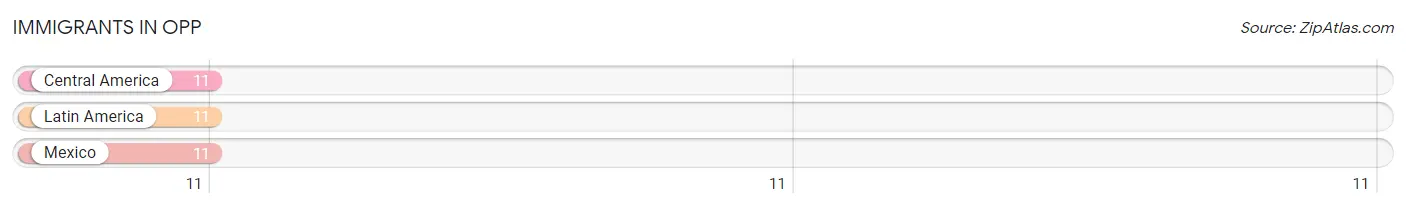
The most numerous immigrant groups reported in Opp came from Central America (11 | 0.2%), Latin America (11 | 0.2%), and Mexico (11 | 0.2%), together accounting for 0.5% of all Opp residents.
| Immigration Origin | # Population | % Population |
| Central America | 11 | 0.2% |
| Latin America | 11 | 0.2% |
| Mexico | 11 | 0.2% | View All 3 Rows |
Sex and Age in Opp
Sex and Age in Opp
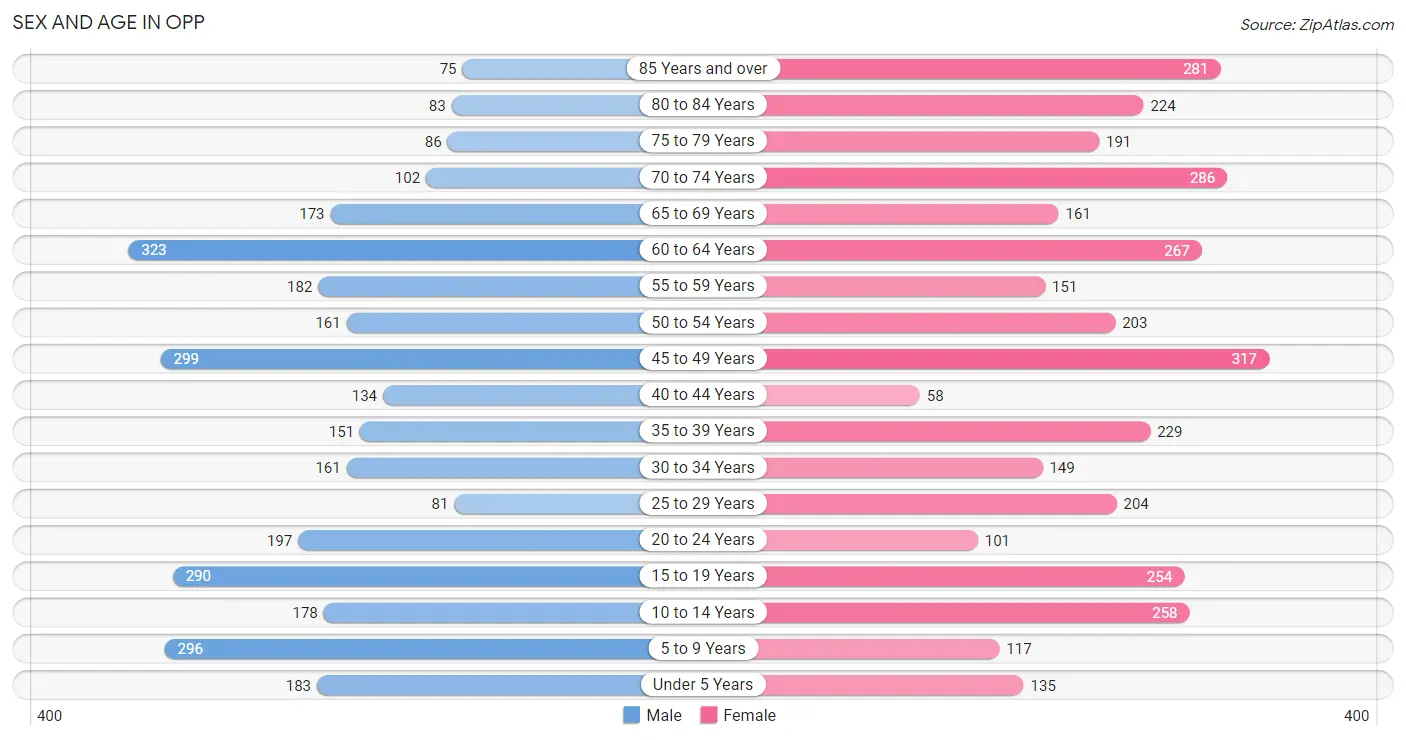
The most populous age groups in Opp are 60 to 64 Years (323 | 10.2%) for men and 45 to 49 Years (317 | 8.8%) for women.
| Age Bracket | Male | Female |
| Under 5 Years | 183 (5.8%) | 135 (3.8%) |
| 5 to 9 Years | 296 (9.4%) | 117 (3.3%) |
| 10 to 14 Years | 178 (5.6%) | 258 (7.2%) |
| 15 to 19 Years | 290 (9.2%) | 254 (7.1%) |
| 20 to 24 Years | 197 (6.2%) | 101 (2.8%) |
| 25 to 29 Years | 81 (2.6%) | 204 (5.7%) |
| 30 to 34 Years | 161 (5.1%) | 149 (4.2%) |
| 35 to 39 Years | 151 (4.8%) | 229 (6.4%) |
| 40 to 44 Years | 134 (4.3%) | 58 (1.6%) |
| 45 to 49 Years | 299 (9.5%) | 317 (8.8%) |
| 50 to 54 Years | 161 (5.1%) | 203 (5.7%) |
| 55 to 59 Years | 182 (5.8%) | 151 (4.2%) |
| 60 to 64 Years | 323 (10.2%) | 267 (7.4%) |
| 65 to 69 Years | 173 (5.5%) | 161 (4.5%) |
| 70 to 74 Years | 102 (3.2%) | 286 (8.0%) |
| 75 to 79 Years | 86 (2.7%) | 191 (5.3%) |
| 80 to 84 Years | 83 (2.6%) | 224 (6.2%) |
| 85 Years and over | 75 (2.4%) | 281 (7.8%) |
| Total | 3,155 (100.0%) | 3,586 (100.0%) |
Families and Households in Opp
Median Family Size in Opp
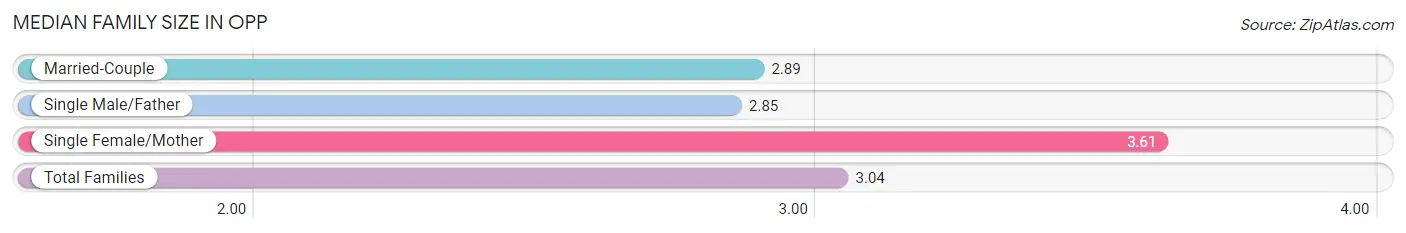
The median family size in Opp is 3.04 persons per family, with single female/mother families (371 | 21.3%) accounting for the largest median family size of 3.61 persons per family. On the other hand, single male/father families (110 | 6.3%) represent the smallest median family size with 2.85 persons per family.
| Family Type | # Families | Family Size |
| Married-Couple | 1,258 (72.3%) | 2.89 |
| Single Male/Father | 110 (6.3%) | 2.85 |
| Single Female/Mother | 371 (21.3%) | 3.61 |
| Total Families | 1,739 (100.0%) | 3.04 |
Median Household Size in Opp
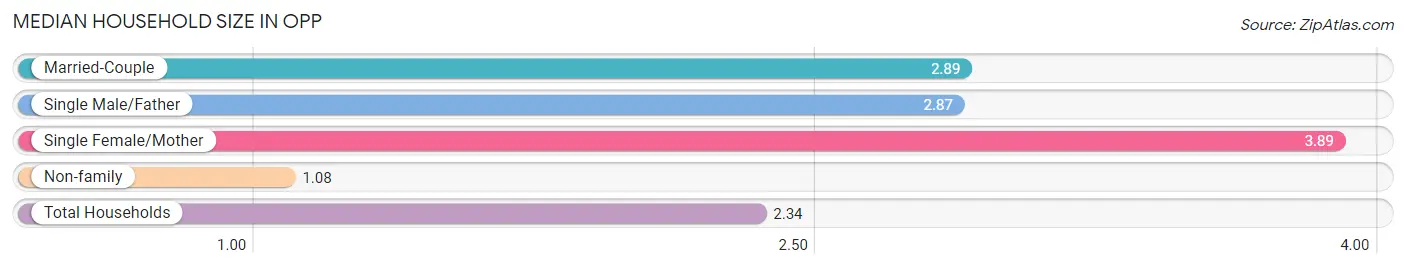
The median household size in Opp is 2.34 persons per household, with single female/mother households (371 | 13.3%) accounting for the largest median household size of 3.89 persons per household. non-family households (1,054 | 37.7%) represent the smallest median household size with 1.08 persons per household.
| Household Type | # Households | Household Size |
| Married-Couple | 1,258 (45.0%) | 2.89 |
| Single Male/Father | 110 (3.9%) | 2.87 |
| Single Female/Mother | 371 (13.3%) | 3.89 |
| Non-family | 1,054 (37.7%) | 1.08 |
| Total Households | 2,793 (100.0%) | 2.34 |
Household Size by Marriage Status in Opp
Out of a total of 2,793 households in Opp, 1,739 (62.3%) are family households, while 1,054 (37.7%) are nonfamily households. The most numerous type of family households are 2-person households, comprising 914, and the most common type of nonfamily households are 1-person households, comprising 989.
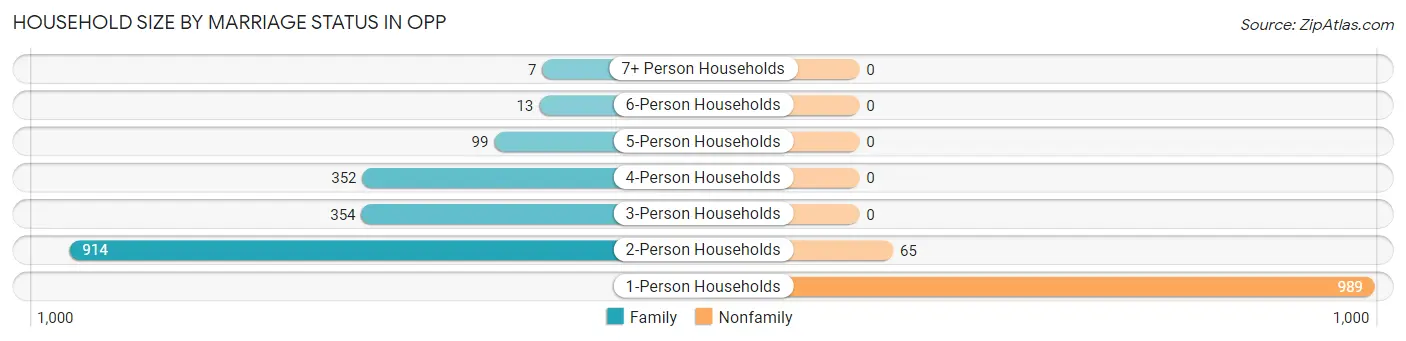
| Household Size | Family Households | Nonfamily Households |
| 1-Person Households | - | 989 (35.4%) |
| 2-Person Households | 914 (32.7%) | 65 (2.3%) |
| 3-Person Households | 354 (12.7%) | 0 (0.0%) |
| 4-Person Households | 352 (12.6%) | 0 (0.0%) |
| 5-Person Households | 99 (3.5%) | 0 (0.0%) |
| 6-Person Households | 13 (0.5%) | 0 (0.0%) |
| 7+ Person Households | 7 (0.3%) | 0 (0.0%) |
| Total | 1,739 (62.3%) | 1,054 (37.7%) |
Female Fertility in Opp
Fertility by Age in Opp
Average fertility rate in Opp is 68.0 births per 1,000 women. Women in the age bracket of 20 to 34 years have the highest fertility rate with 163.0 births per 1,000 women. Women in the age bracket of 20 to 34 years acount for 82.2% of all women with births.

| Age Bracket | Women with Births | Births / 1,000 Women |
| 15 to 19 years | 0 (0.0%) | 0.0 |
| 20 to 34 years | 74 (82.2%) | 163.0 |
| 35 to 50 years | 16 (17.8%) | 26.0 |
| Total | 90 (100.0%) | 68.0 |
Fertility by Age by Marriage Status in Opp
25.6% of women with births (90) in Opp are married. The highest percentage of unmarried women with births falls into 35 to 50 years age bracket with 100.0% of them unmarried at the time of birth, while the lowest percentage of unmarried women with births belong to 20 to 34 years age bracket with 68.9% of them unmarried.
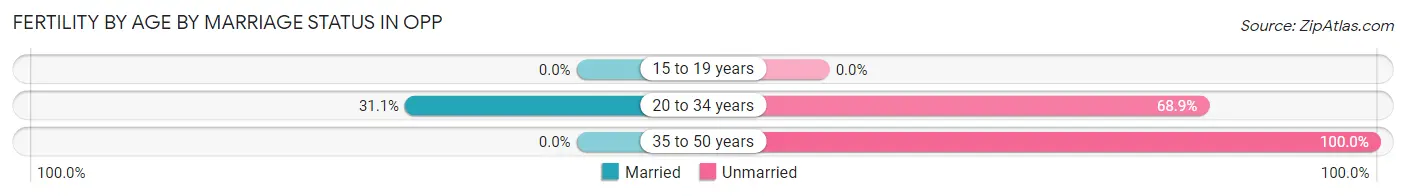
| Age Bracket | Married | Unmarried |
| 15 to 19 years | 0 (0.0%) | 0 (0.0%) |
| 20 to 34 years | 23 (31.1%) | 51 (68.9%) |
| 35 to 50 years | 0 (0.0%) | 16 (100.0%) |
| Total | 23 (25.6%) | 67 (74.4%) |
Fertility by Education in Opp
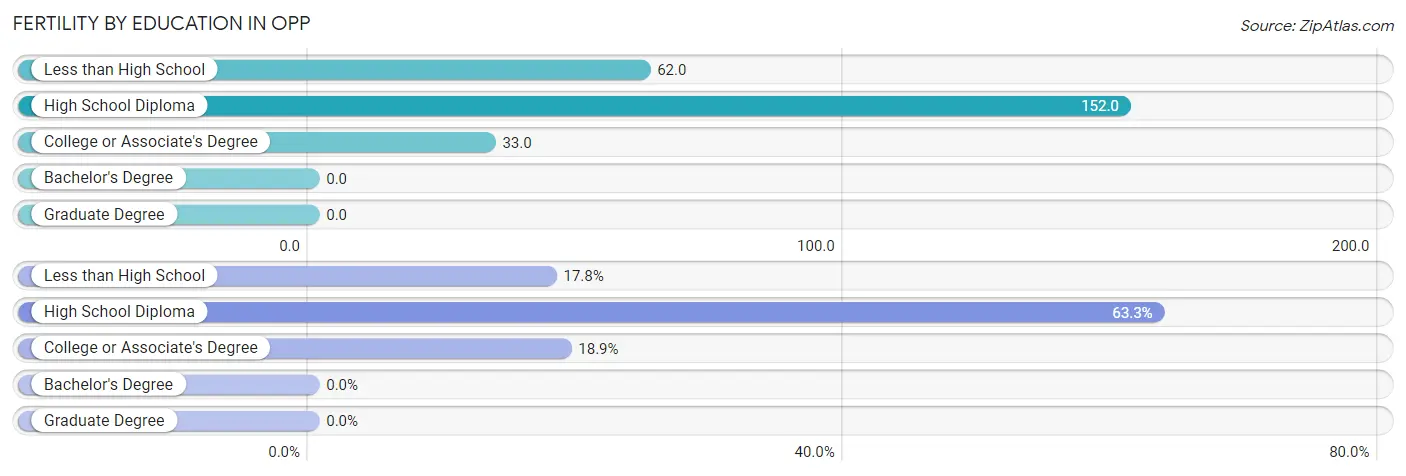
| Educational Attainment | Women with Births | Births / 1,000 Women |
| Less than High School | 16 (17.8%) | 62.0 |
| High School Diploma | 57 (63.3%) | 152.0 |
| College or Associate's Degree | 17 (18.9%) | 33.0 |
| Bachelor's Degree | 0 (0.0%) | 0.0 |
| Graduate Degree | 0 (0.0%) | 0.0 |
| Total | 90 (100.0%) | 68.0 |
Fertility by Education by Marriage Status in Opp
74.4% of women with births in Opp are unmarried. Women with the educational attainment of college or associate's degree are most likely to be married with 100.0% of them married at childbirth, while women with the educational attainment of less than high school are least likely to be married with 100.0% of them unmarried at childbirth.
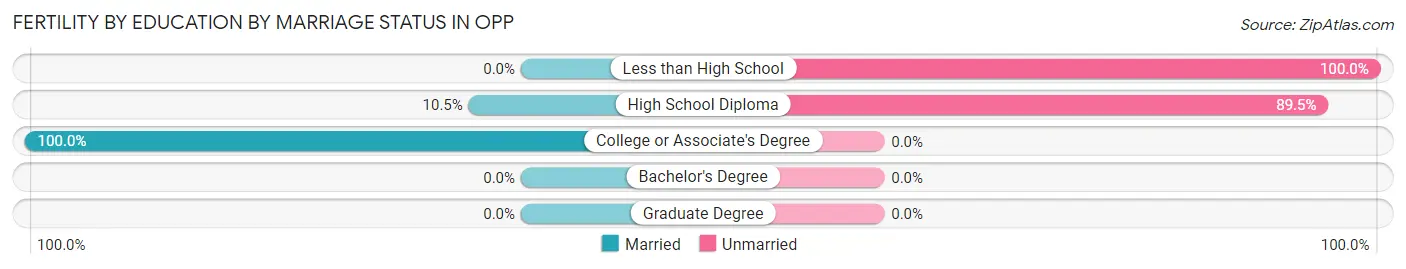
| Educational Attainment | Married | Unmarried |
| Less than High School | 0 (0.0%) | 16 (100.0%) |
| High School Diploma | 6 (10.5%) | 51 (89.5%) |
| College or Associate's Degree | 17 (100.0%) | 0 (0.0%) |
| Bachelor's Degree | 0 (0.0%) | 0 (0.0%) |
| Graduate Degree | 0 (0.0%) | 0 (0.0%) |
| Total | 23 (25.6%) | 67 (74.4%) |
Employment Characteristics in Opp
Employment by Class of Employer in Opp
Among the 2,836 employed individuals in Opp, private company employees (1,898 | 66.9%), local government employees (328 | 11.6%), and not-for-profit organizations (205 | 7.2%) make up the most common classes of employment.
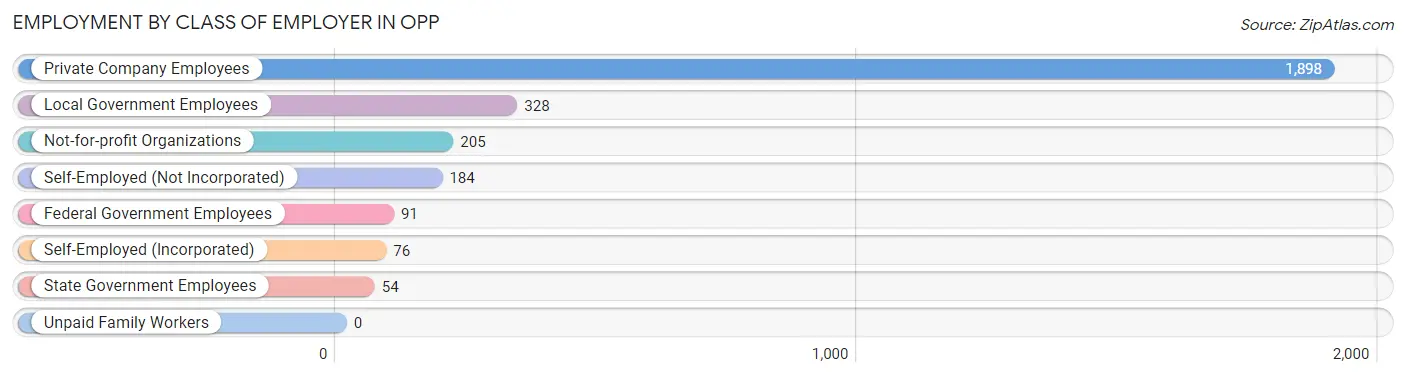
| Employer Class | # Employees | % Employees |
| Private Company Employees | 1,898 | 66.9% |
| Self-Employed (Incorporated) | 76 | 2.7% |
| Self-Employed (Not Incorporated) | 184 | 6.5% |
| Not-for-profit Organizations | 205 | 7.2% |
| Local Government Employees | 328 | 11.6% |
| State Government Employees | 54 | 1.9% |
| Federal Government Employees | 91 | 3.2% |
| Unpaid Family Workers | 0 | 0.0% |
| Total | 2,836 | 100.0% |
Employment Status by Age in Opp
According to the labor force statistics for Opp, out of the total population over 16 years of age (5,509), 55.9% or 3,080 individuals are in the labor force, with 6.0% or 185 of them unemployed. The age group with the highest labor force participation rate is 20 to 24 years, with 86.2% or 257 individuals in the labor force. Within the labor force, the 20 to 24 years age range has the highest percentage of unemployed individuals, with 18.3% or 47 of them being unemployed.
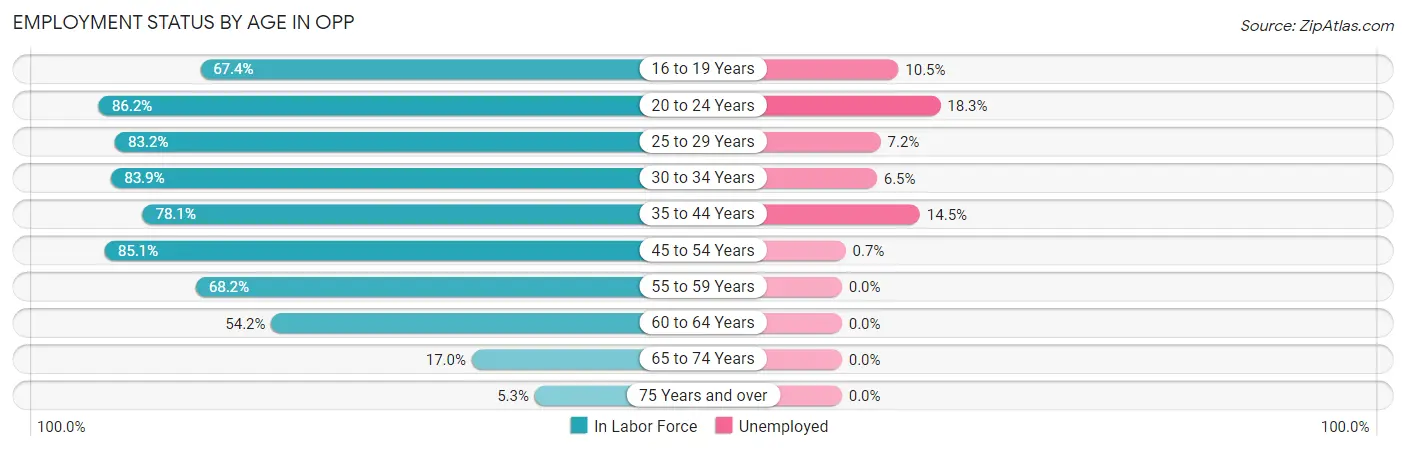
| Age Bracket | In Labor Force | Unemployed |
| 16 to 19 Years | 323 (67.4%) | 34 (10.5%) |
| 20 to 24 Years | 257 (86.2%) | 47 (18.3%) |
| 25 to 29 Years | 237 (83.2%) | 17 (7.2%) |
| 30 to 34 Years | 260 (83.9%) | 17 (6.5%) |
| 35 to 44 Years | 447 (78.1%) | 65 (14.5%) |
| 45 to 54 Years | 834 (85.1%) | 6 (0.7%) |
| 55 to 59 Years | 227 (68.2%) | 0 (0.0%) |
| 60 to 64 Years | 320 (54.2%) | 0 (0.0%) |
| 65 to 74 Years | 123 (17.0%) | 0 (0.0%) |
| 75 Years and over | 50 (5.3%) | 0 (0.0%) |
| Total | 3,080 (55.9%) | 185 (6.0%) |
Employment Status by Educational Attainment in Opp
According to labor force statistics for Opp, 75.7% of individuals (2,324) out of the total population between 25 and 64 years of age (3,070) are in the labor force, with 4.5% or 105 of them being unemployed. The group with the highest labor force participation rate are those with the educational attainment of bachelor's degree or higher, with 92.4% or 462 individuals in the labor force. Within the labor force, individuals with less than high school education have the highest percentage of unemployment, with 10.1% or 22 of them being unemployed.
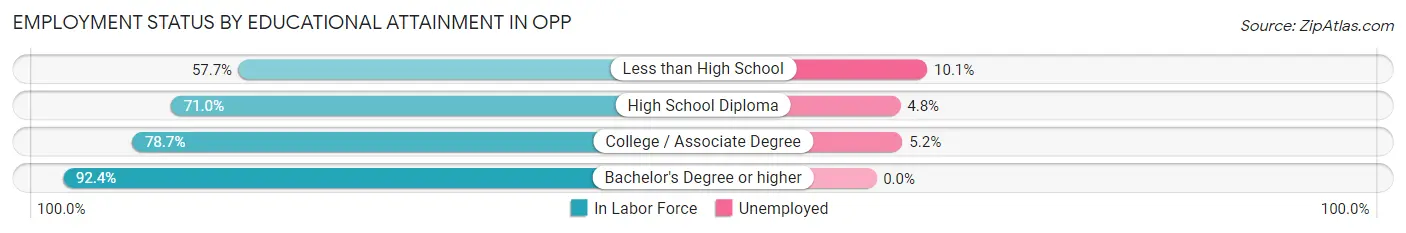
| Educational Attainment | In Labor Force | Unemployed |
| Less than High School | 217 (57.7%) | 38 (10.1%) |
| High School Diploma | 744 (71.0%) | 50 (4.8%) |
| College / Associate Degree | 902 (78.7%) | 60 (5.2%) |
| Bachelor's Degree or higher | 462 (92.4%) | 0 (0.0%) |
| Total | 2,324 (75.7%) | 138 (4.5%) |
Employment Occupations by Sex in Opp
Management, Business, Science and Arts Occupations
The most common Management, Business, Science and Arts occupations in Opp are Community & Social Service (319 | 11.0%), Management (216 | 7.5%), Education Instruction & Library (215 | 7.4%), Health Diagnosing & Treating (106 | 3.7%), and Education, Arts & Media (77 | 2.7%).
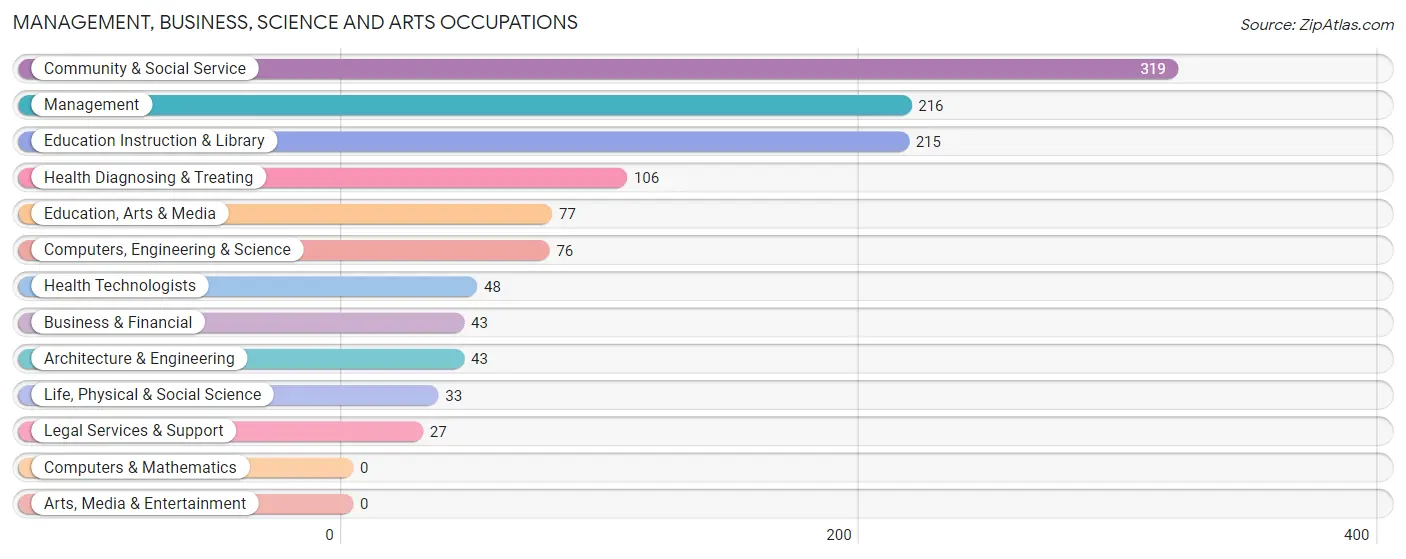
Management, Business, Science and Arts Occupations by Sex
Within the Management, Business, Science and Arts occupations in Opp, the most male-oriented occupations are Architecture & Engineering (100.0%), Education, Arts & Media (85.7%), and Computers, Engineering & Science (77.6%), while the most female-oriented occupations are Legal Services & Support (100.0%), Health Diagnosing & Treating (100.0%), and Health Technologists (100.0%).
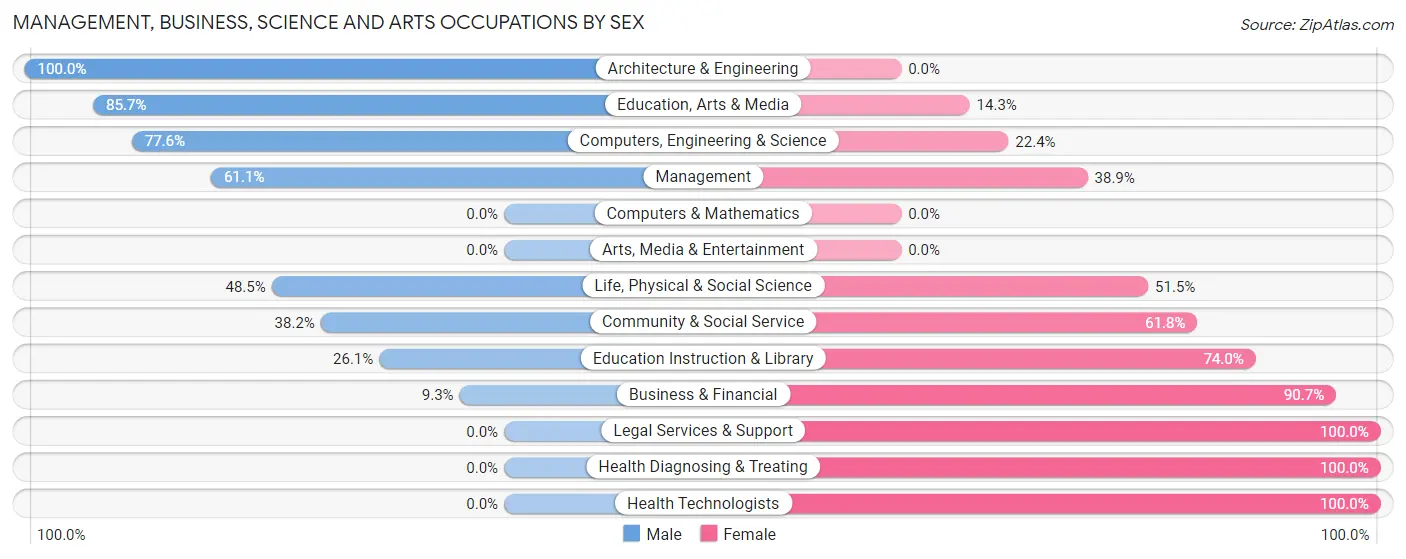
| Occupation | Male | Female |
| Management | 132 (61.1%) | 84 (38.9%) |
| Business & Financial | 4 (9.3%) | 39 (90.7%) |
| Computers, Engineering & Science | 59 (77.6%) | 17 (22.4%) |
| Computers & Mathematics | 0 (0.0%) | 0 (0.0%) |
| Architecture & Engineering | 43 (100.0%) | 0 (0.0%) |
| Life, Physical & Social Science | 16 (48.5%) | 17 (51.5%) |
| Community & Social Service | 122 (38.2%) | 197 (61.8%) |
| Education, Arts & Media | 66 (85.7%) | 11 (14.3%) |
| Legal Services & Support | 0 (0.0%) | 27 (100.0%) |
| Education Instruction & Library | 56 (26.1%) | 159 (74.0%) |
| Arts, Media & Entertainment | 0 (0.0%) | 0 (0.0%) |
| Health Diagnosing & Treating | 0 (0.0%) | 106 (100.0%) |
| Health Technologists | 0 (0.0%) | 48 (100.0%) |
| Total (Category) | 317 (41.7%) | 443 (58.3%) |
| Total (Overall) | 1,459 (50.4%) | 1,433 (49.5%) |
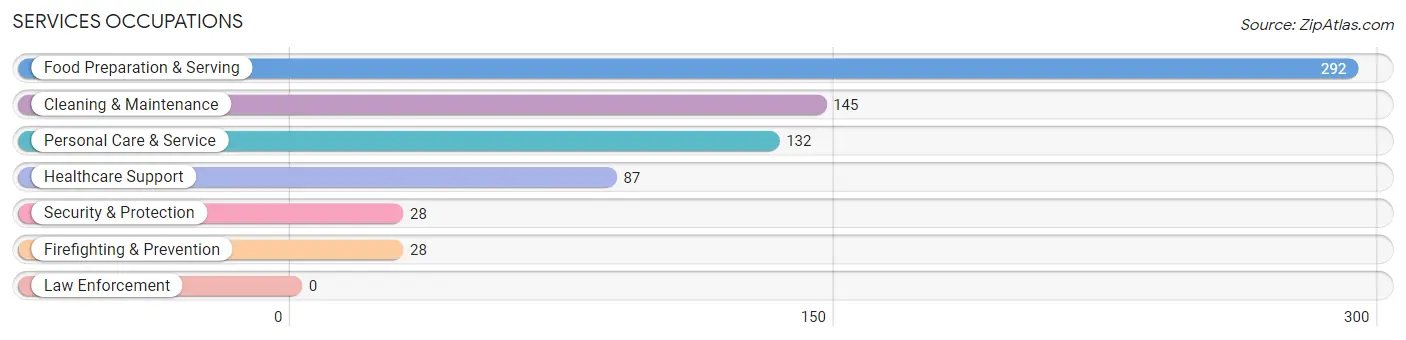
Services Occupations
The most common Services occupations in Opp are Food Preparation & Serving (292 | 10.1%), Cleaning & Maintenance (145 | 5.0%), Personal Care & Service (132 | 4.6%), Healthcare Support (87 | 3.0%), and Security & Protection (28 | 1.0%).
Services Occupations by Sex
Within the Services occupations in Opp, the most male-oriented occupations are Security & Protection (100.0%), Firefighting & Prevention (100.0%), and Cleaning & Maintenance (69.7%), while the most female-oriented occupations are Healthcare Support (100.0%), Personal Care & Service (100.0%), and Food Preparation & Serving (37.0%).
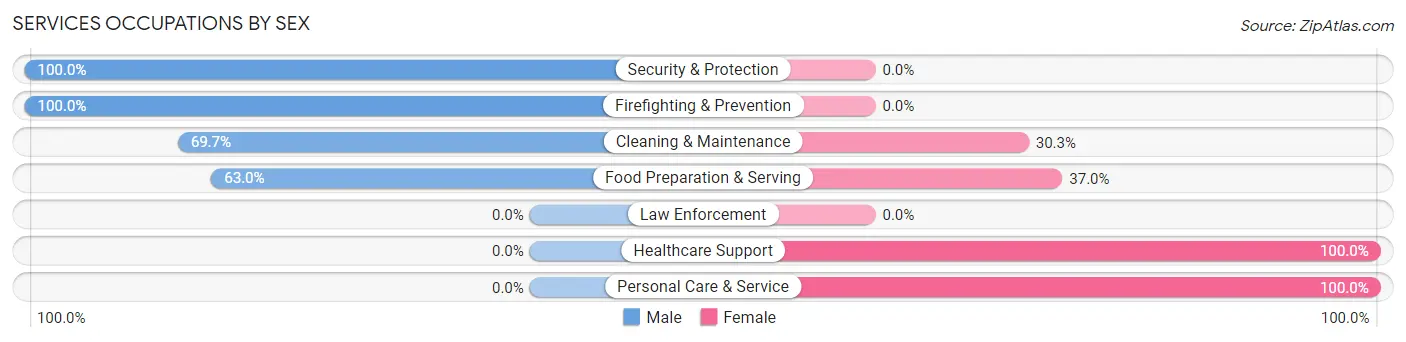
| Occupation | Male | Female |
| Healthcare Support | 0 (0.0%) | 87 (100.0%) |
| Security & Protection | 28 (100.0%) | 0 (0.0%) |
| Firefighting & Prevention | 28 (100.0%) | 0 (0.0%) |
| Law Enforcement | 0 (0.0%) | 0 (0.0%) |
| Food Preparation & Serving | 184 (63.0%) | 108 (37.0%) |
| Cleaning & Maintenance | 101 (69.7%) | 44 (30.3%) |
| Personal Care & Service | 0 (0.0%) | 132 (100.0%) |
| Total (Category) | 313 (45.8%) | 371 (54.2%) |
| Total (Overall) | 1,459 (50.4%) | 1,433 (49.5%) |
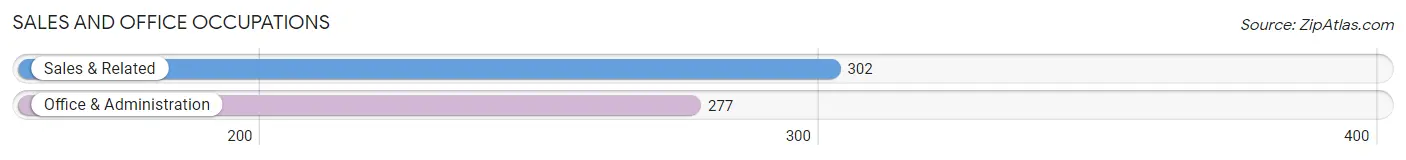
Sales and Office Occupations
The most common Sales and Office occupations in Opp are Sales & Related (302 | 10.4%), and Office & Administration (277 | 9.6%).
Sales and Office Occupations by Sex
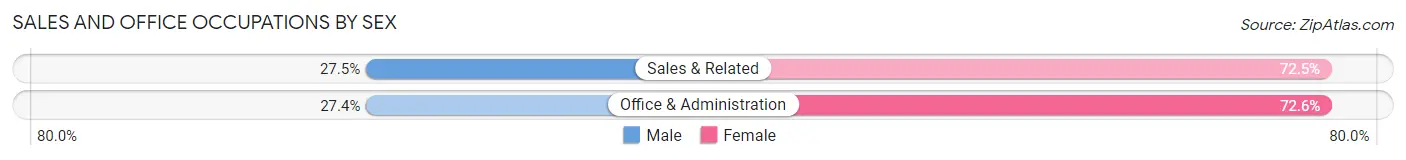
| Occupation | Male | Female |
| Sales & Related | 83 (27.5%) | 219 (72.5%) |
| Office & Administration | 76 (27.4%) | 201 (72.6%) |
| Total (Category) | 159 (27.5%) | 420 (72.5%) |
| Total (Overall) | 1,459 (50.4%) | 1,433 (49.5%) |
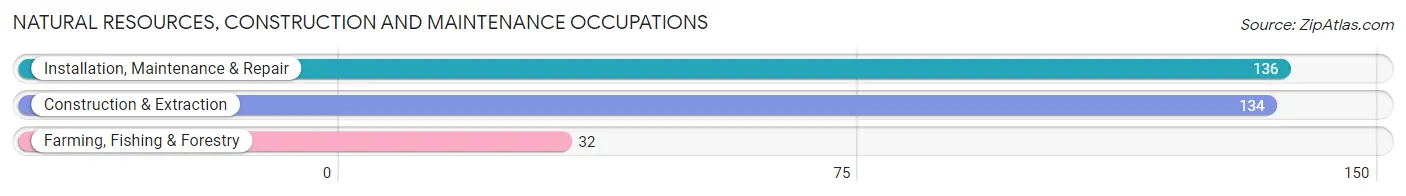
Natural Resources, Construction and Maintenance Occupations
The most common Natural Resources, Construction and Maintenance occupations in Opp are Installation, Maintenance & Repair (136 | 4.7%), Construction & Extraction (134 | 4.6%), and Farming, Fishing & Forestry (32 | 1.1%).
Natural Resources, Construction and Maintenance Occupations by Sex
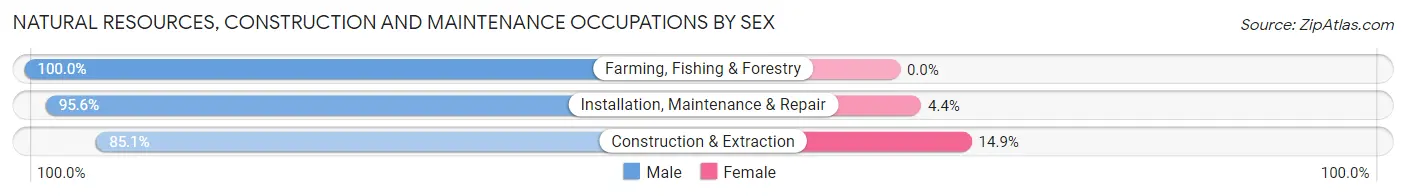
| Occupation | Male | Female |
| Farming, Fishing & Forestry | 32 (100.0%) | 0 (0.0%) |
| Construction & Extraction | 114 (85.1%) | 20 (14.9%) |
| Installation, Maintenance & Repair | 130 (95.6%) | 6 (4.4%) |
| Total (Category) | 276 (91.4%) | 26 (8.6%) |
| Total (Overall) | 1,459 (50.4%) | 1,433 (49.5%) |
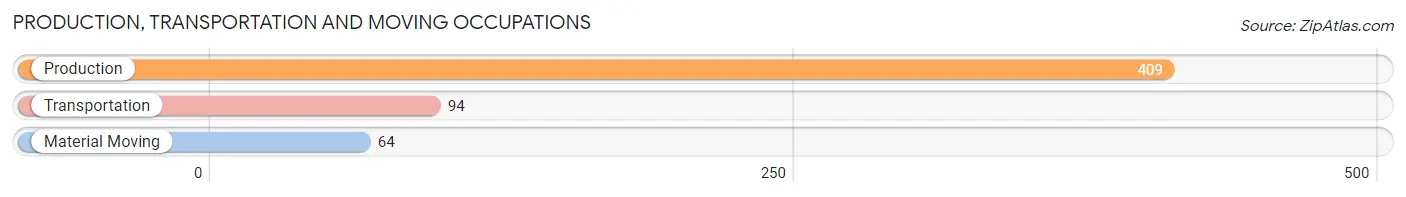
Production, Transportation and Moving Occupations
The most common Production, Transportation and Moving occupations in Opp are Production (409 | 14.1%), Transportation (94 | 3.3%), and Material Moving (64 | 2.2%).
Production, Transportation and Moving Occupations by Sex
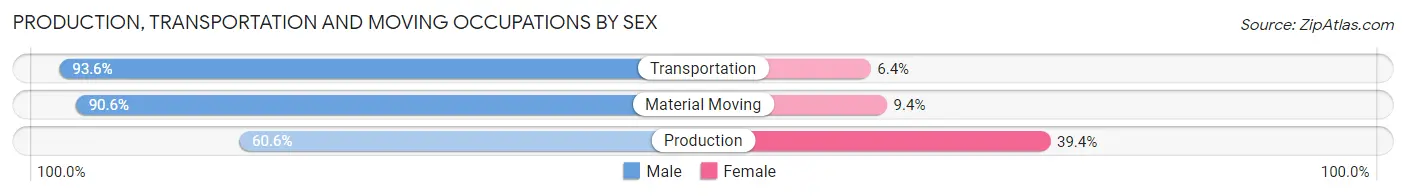
| Occupation | Male | Female |
| Production | 248 (60.6%) | 161 (39.4%) |
| Transportation | 88 (93.6%) | 6 (6.4%) |
| Material Moving | 58 (90.6%) | 6 (9.4%) |
| Total (Category) | 394 (69.5%) | 173 (30.5%) |
| Total (Overall) | 1,459 (50.4%) | 1,433 (49.5%) |
Employment Industries by Sex in Opp
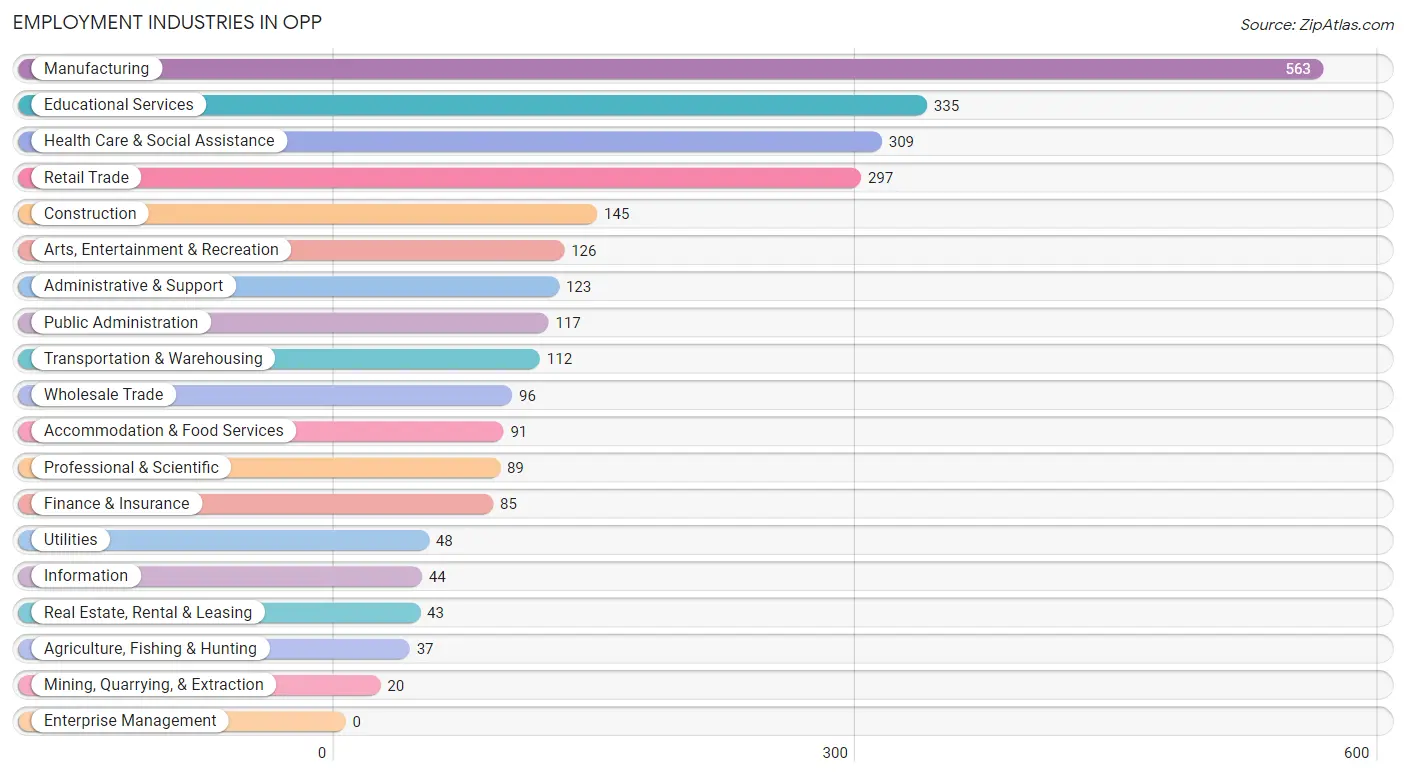
Employment Industries in Opp
The major employment industries in Opp include Manufacturing (563 | 19.5%), Educational Services (335 | 11.6%), Health Care & Social Assistance (309 | 10.7%), Retail Trade (297 | 10.3%), and Construction (145 | 5.0%).
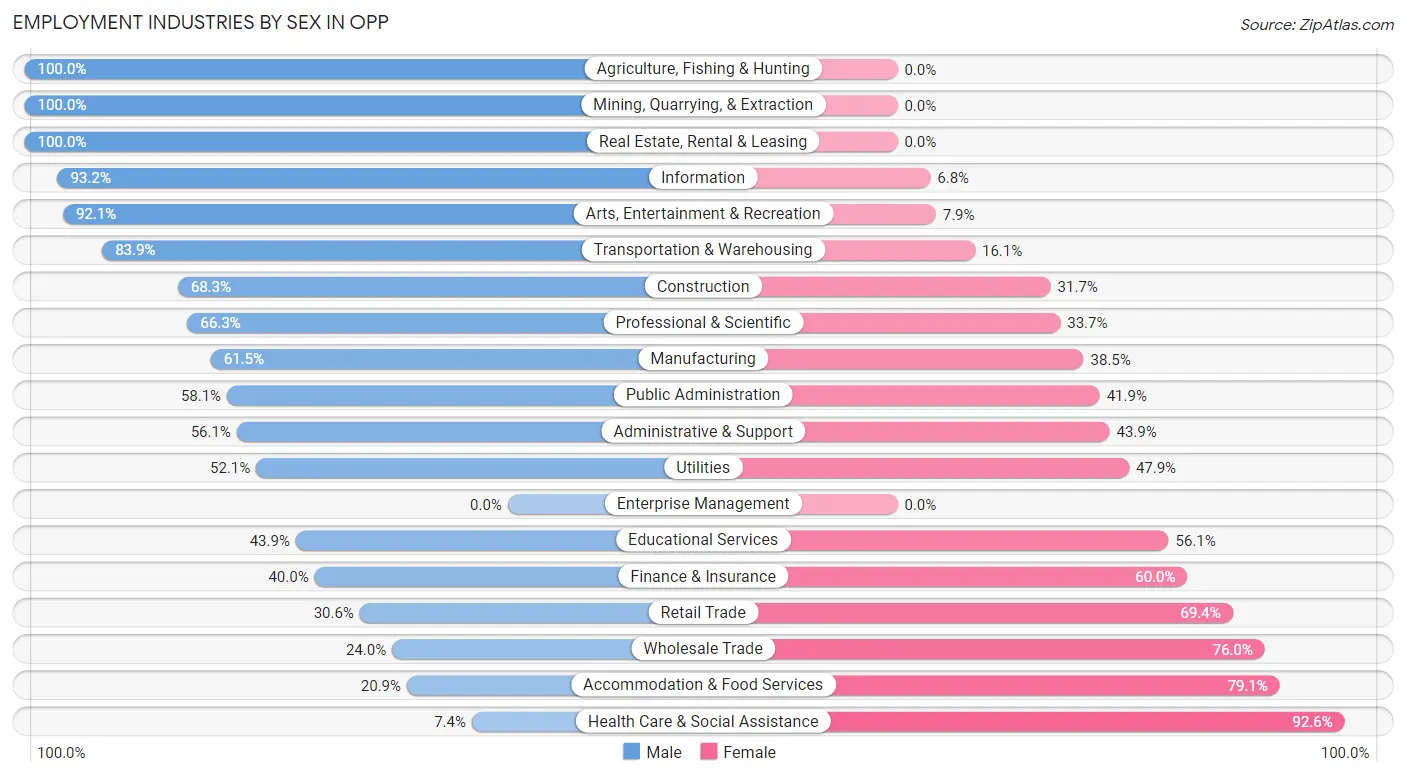
Employment Industries by Sex in Opp
The Opp industries that see more men than women are Agriculture, Fishing & Hunting (100.0%), Mining, Quarrying, & Extraction (100.0%), and Real Estate, Rental & Leasing (100.0%), whereas the industries that tend to have a higher number of women are Health Care & Social Assistance (92.6%), Accommodation & Food Services (79.1%), and Wholesale Trade (76.0%).
| Industry | Male | Female |
| Agriculture, Fishing & Hunting | 37 (100.0%) | 0 (0.0%) |
| Mining, Quarrying, & Extraction | 20 (100.0%) | 0 (0.0%) |
| Construction | 99 (68.3%) | 46 (31.7%) |
| Manufacturing | 346 (61.5%) | 217 (38.5%) |
| Wholesale Trade | 23 (24.0%) | 73 (76.0%) |
| Retail Trade | 91 (30.6%) | 206 (69.4%) |
| Transportation & Warehousing | 94 (83.9%) | 18 (16.1%) |
| Utilities | 25 (52.1%) | 23 (47.9%) |
| Information | 41 (93.2%) | 3 (6.8%) |
| Finance & Insurance | 34 (40.0%) | 51 (60.0%) |
| Real Estate, Rental & Leasing | 43 (100.0%) | 0 (0.0%) |
| Professional & Scientific | 59 (66.3%) | 30 (33.7%) |
| Enterprise Management | 0 (0.0%) | 0 (0.0%) |
| Administrative & Support | 69 (56.1%) | 54 (43.9%) |
| Educational Services | 147 (43.9%) | 188 (56.1%) |
| Health Care & Social Assistance | 23 (7.4%) | 286 (92.6%) |
| Arts, Entertainment & Recreation | 116 (92.1%) | 10 (7.9%) |
| Accommodation & Food Services | 19 (20.9%) | 72 (79.1%) |
| Public Administration | 68 (58.1%) | 49 (41.9%) |
| Total | 1,459 (50.4%) | 1,433 (49.5%) |
Education in Opp
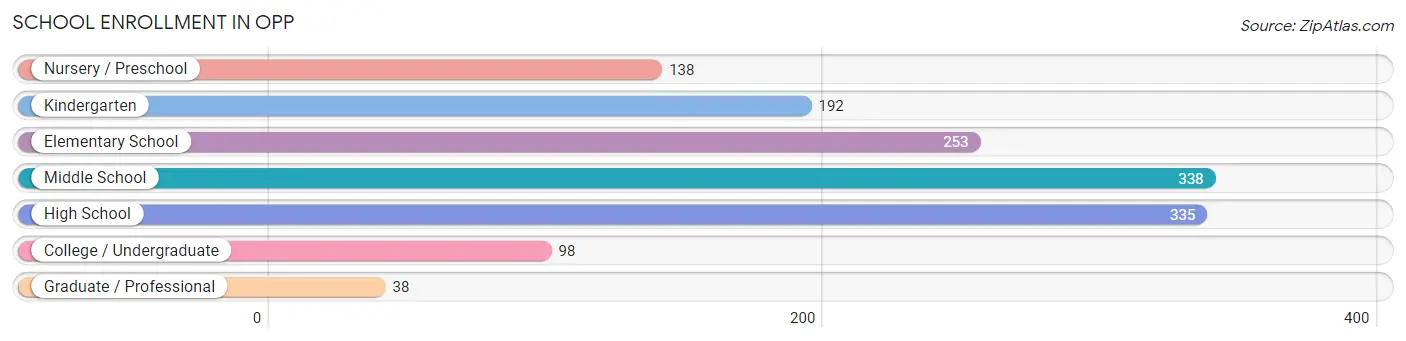
School Enrollment in Opp
The most common levels of schooling among the 1,392 students in Opp are middle school (338 | 24.3%), high school (335 | 24.1%), and elementary school (253 | 18.2%).
| School Level | # Students | % Students |
| Nursery / Preschool | 138 | 9.9% |
| Kindergarten | 192 | 13.8% |
| Elementary School | 253 | 18.2% |
| Middle School | 338 | 24.3% |
| High School | 335 | 24.1% |
| College / Undergraduate | 98 | 7.0% |
| Graduate / Professional | 38 | 2.7% |
| Total | 1,392 | 100.0% |
School Enrollment by Age by Funding Source in Opp
Out of a total of 1,392 students who are enrolled in schools in Opp, 95 (6.8%) attend a private institution, while the remaining 1,297 (93.2%) are enrolled in public schools. The age group of 35 years and over has the highest likelihood of being enrolled in private schools, with 5 (26.3% in the age bracket) enrolled. Conversely, the age group of 18 to 19 year olds has the lowest likelihood of being enrolled in a private school, with 128 (100.0% in the age bracket) attending a public institution.
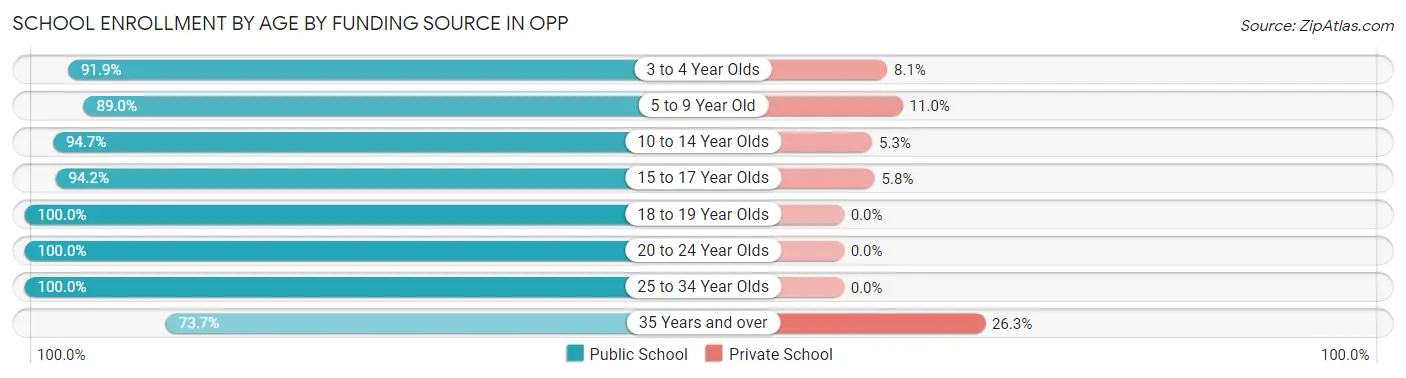
| Age Bracket | Public School | Private School |
| 3 to 4 Year Olds | 125 (91.9%) | 11 (8.1%) |
| 5 to 9 Year Old | 340 (89.0%) | 42 (11.0%) |
| 10 to 14 Year Olds | 394 (94.7%) | 22 (5.3%) |
| 15 to 17 Year Olds | 245 (94.2%) | 15 (5.8%) |
| 18 to 19 Year Olds | 128 (100.0%) | 0 (0.0%) |
| 20 to 24 Year Olds | 19 (100.0%) | 0 (0.0%) |
| 25 to 34 Year Olds | 32 (100.0%) | 0 (0.0%) |
| 35 Years and over | 14 (73.7%) | 5 (26.3%) |
| Total | 1,297 (93.2%) | 95 (6.8%) |
Educational Attainment by Field of Study in Opp
Education (192 | 28.1%), business (178 | 26.1%), liberal arts & history (63 | 9.2%), computers & mathematics (51 | 7.5%), and science & technology (38 | 5.6%) are the most common fields of study among 682 individuals in Opp who have obtained a bachelor's degree or higher.
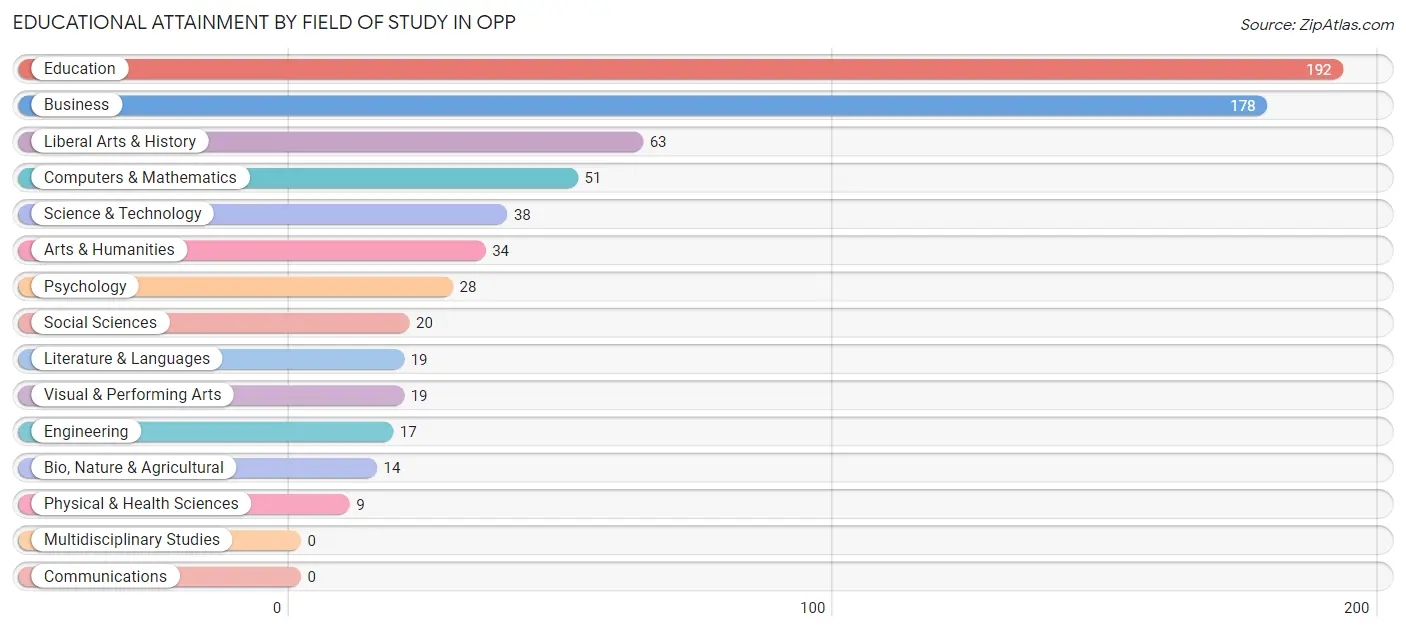
| Field of Study | # Graduates | % Graduates |
| Computers & Mathematics | 51 | 7.5% |
| Bio, Nature & Agricultural | 14 | 2.1% |
| Physical & Health Sciences | 9 | 1.3% |
| Psychology | 28 | 4.1% |
| Social Sciences | 20 | 2.9% |
| Engineering | 17 | 2.5% |
| Multidisciplinary Studies | 0 | 0.0% |
| Science & Technology | 38 | 5.6% |
| Business | 178 | 26.1% |
| Education | 192 | 28.1% |
| Literature & Languages | 19 | 2.8% |
| Liberal Arts & History | 63 | 9.2% |
| Visual & Performing Arts | 19 | 2.8% |
| Communications | 0 | 0.0% |
| Arts & Humanities | 34 | 5.0% |
| Total | 682 | 100.0% |
Transportation & Commute in Opp
Vehicle Availability by Sex in Opp
The most prevalent vehicle ownership categories in Opp are males with 2 vehicles (535, accounting for 36.8%) and females with 2 vehicles (518, making up 38.9%).
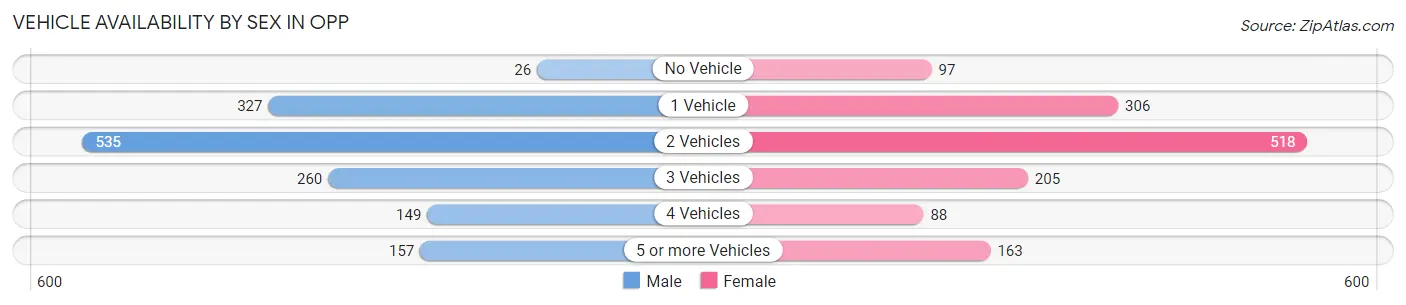
| Vehicles Available | Male | Female |
| No Vehicle | 26 (1.8%) | 97 (7.0%) |
| 1 Vehicle | 327 (22.5%) | 306 (22.2%) |
| 2 Vehicles | 535 (36.8%) | 518 (37.6%) |
| 3 Vehicles | 260 (17.9%) | 205 (14.9%) |
| 4 Vehicles | 149 (10.2%) | 88 (6.4%) |
| 5 or more Vehicles | 157 (10.8%) | 163 (11.8%) |
| Total | 1,454 (100.0%) | 1,377 (100.0%) |
Commute Time in Opp
The most frequently occuring commute durations in Opp are 5 to 9 minutes (611 commuters, 21.8%), 10 to 14 minutes (519 commuters, 18.5%), and 20 to 24 minutes (377 commuters, 13.5%).
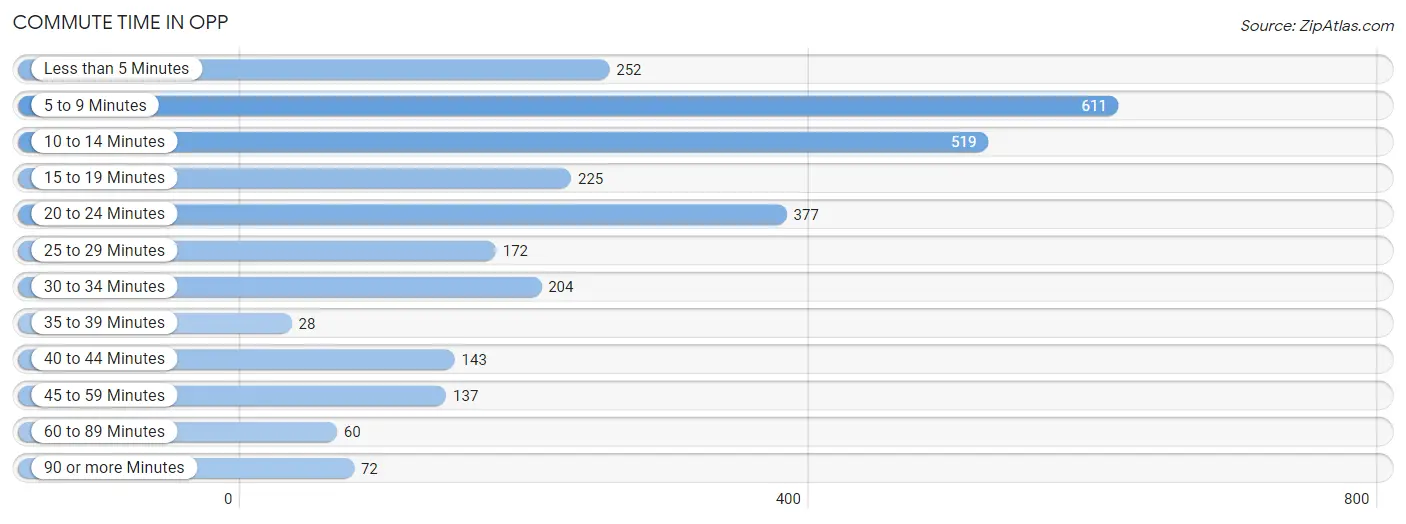
| Commute Time | # Commuters | % Commuters |
| Less than 5 Minutes | 252 | 9.0% |
| 5 to 9 Minutes | 611 | 21.8% |
| 10 to 14 Minutes | 519 | 18.5% |
| 15 to 19 Minutes | 225 | 8.0% |
| 20 to 24 Minutes | 377 | 13.5% |
| 25 to 29 Minutes | 172 | 6.1% |
| 30 to 34 Minutes | 204 | 7.3% |
| 35 to 39 Minutes | 28 | 1.0% |
| 40 to 44 Minutes | 143 | 5.1% |
| 45 to 59 Minutes | 137 | 4.9% |
| 60 to 89 Minutes | 60 | 2.1% |
| 90 or more Minutes | 72 | 2.6% |
Commute Time by Sex in Opp
The most common commute times in Opp are 10 to 14 minutes (309 commuters, 21.4%) for males and 5 to 9 minutes (314 commuters, 23.2%) for females.
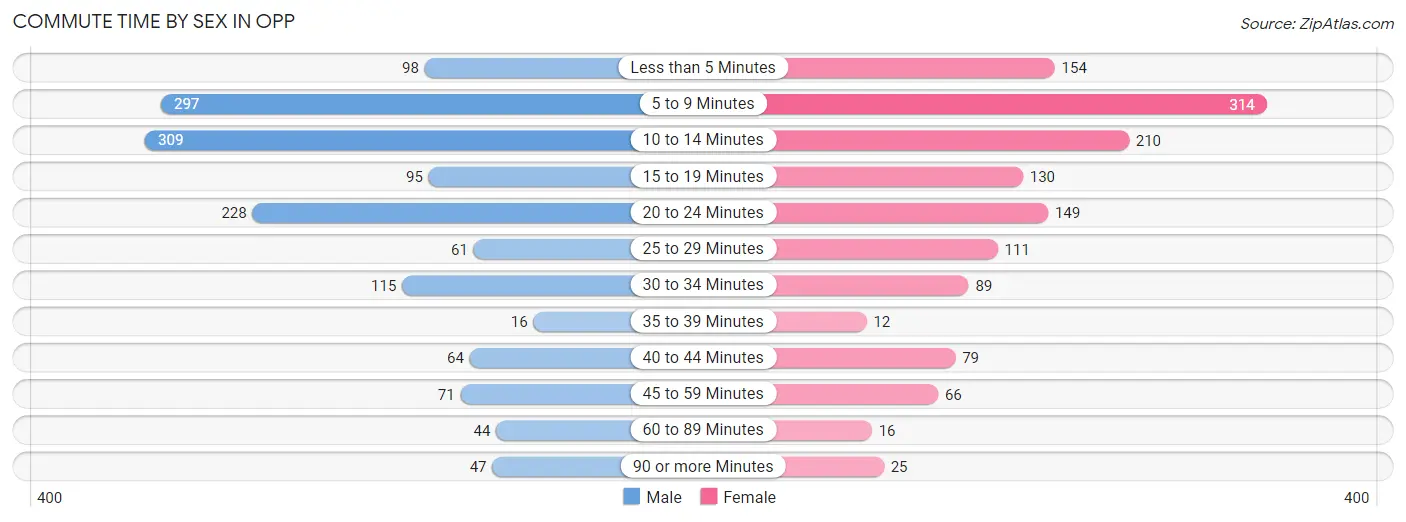
| Commute Time | Male | Female |
| Less than 5 Minutes | 98 (6.8%) | 154 (11.4%) |
| 5 to 9 Minutes | 297 (20.5%) | 314 (23.2%) |
| 10 to 14 Minutes | 309 (21.4%) | 210 (15.5%) |
| 15 to 19 Minutes | 95 (6.6%) | 130 (9.6%) |
| 20 to 24 Minutes | 228 (15.8%) | 149 (11.0%) |
| 25 to 29 Minutes | 61 (4.2%) | 111 (8.2%) |
| 30 to 34 Minutes | 115 (8.0%) | 89 (6.6%) |
| 35 to 39 Minutes | 16 (1.1%) | 12 (0.9%) |
| 40 to 44 Minutes | 64 (4.4%) | 79 (5.8%) |
| 45 to 59 Minutes | 71 (4.9%) | 66 (4.9%) |
| 60 to 89 Minutes | 44 (3.0%) | 16 (1.2%) |
| 90 or more Minutes | 47 (3.3%) | 25 (1.8%) |
Time of Departure to Work by Sex in Opp
The most frequent times of departure to work in Opp are 7:00 AM to 7:29 AM (257, 17.8%) for males and 7:00 AM to 7:29 AM (264, 19.5%) for females.
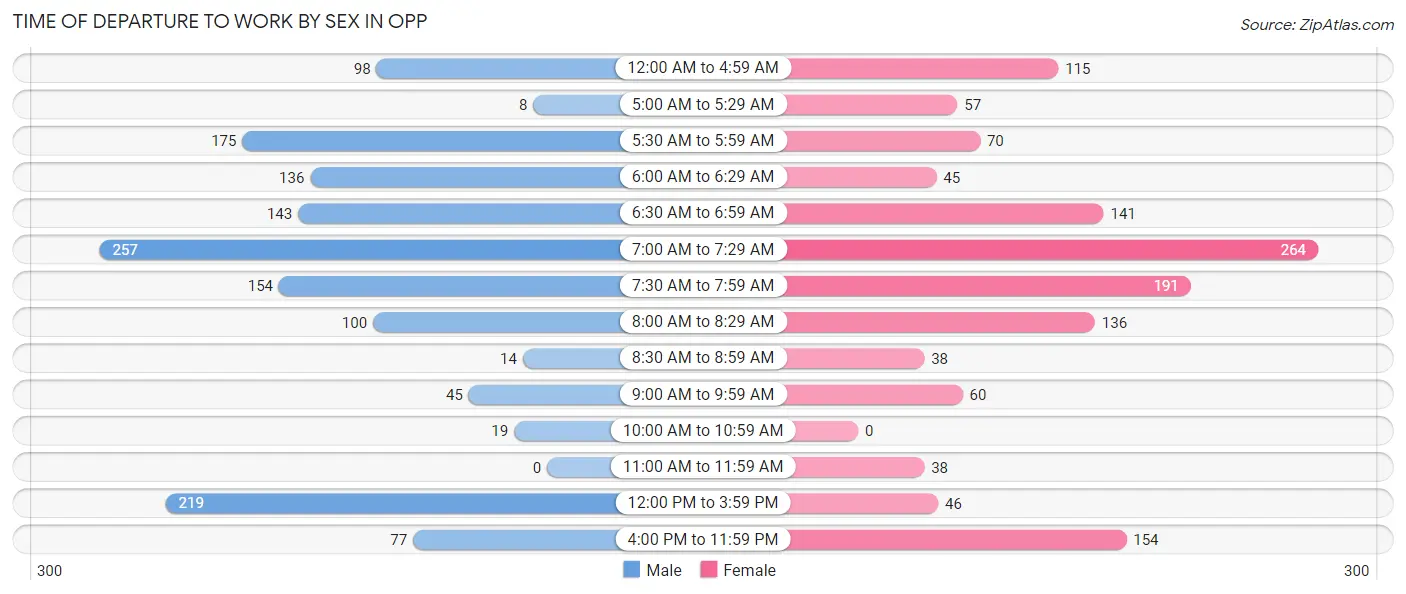
| Time of Departure | Male | Female |
| 12:00 AM to 4:59 AM | 98 (6.8%) | 115 (8.5%) |
| 5:00 AM to 5:29 AM | 8 (0.5%) | 57 (4.2%) |
| 5:30 AM to 5:59 AM | 175 (12.1%) | 70 (5.2%) |
| 6:00 AM to 6:29 AM | 136 (9.4%) | 45 (3.3%) |
| 6:30 AM to 6:59 AM | 143 (9.9%) | 141 (10.4%) |
| 7:00 AM to 7:29 AM | 257 (17.8%) | 264 (19.5%) |
| 7:30 AM to 7:59 AM | 154 (10.7%) | 191 (14.1%) |
| 8:00 AM to 8:29 AM | 100 (6.9%) | 136 (10.0%) |
| 8:30 AM to 8:59 AM | 14 (1.0%) | 38 (2.8%) |
| 9:00 AM to 9:59 AM | 45 (3.1%) | 60 (4.4%) |
| 10:00 AM to 10:59 AM | 19 (1.3%) | 0 (0.0%) |
| 11:00 AM to 11:59 AM | 0 (0.0%) | 38 (2.8%) |
| 12:00 PM to 3:59 PM | 219 (15.2%) | 46 (3.4%) |
| 4:00 PM to 11:59 PM | 77 (5.3%) | 154 (11.4%) |
| Total | 1,445 (100.0%) | 1,355 (100.0%) |
Housing Occupancy in Opp
Occupancy by Ownership in Opp
Of the total 2,793 dwellings in Opp, owner-occupied units account for 1,973 (70.6%), while renter-occupied units make up 820 (29.4%).
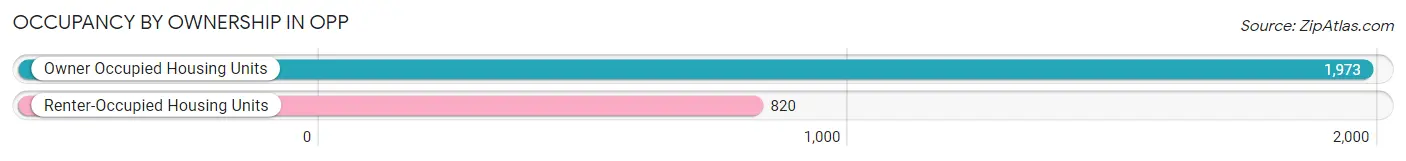
| Occupancy | # Housing Units | % Housing Units |
| Owner Occupied Housing Units | 1,973 | 70.6% |
| Renter-Occupied Housing Units | 820 | 29.4% |
| Total Occupied Housing Units | 2,793 | 100.0% |
Occupancy by Household Size in Opp
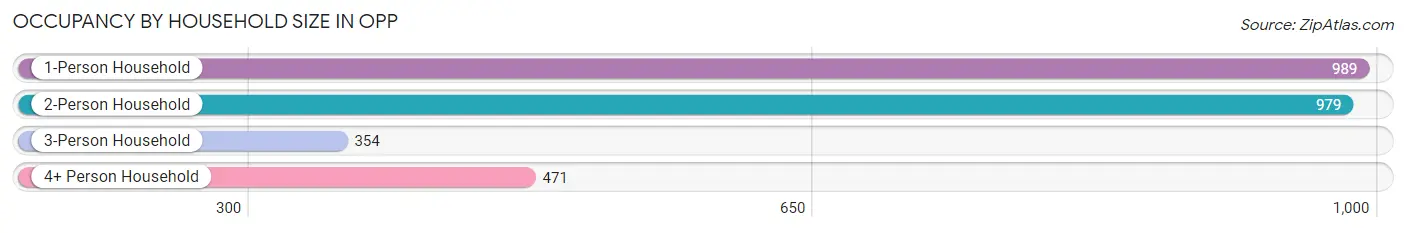
| Household Size | # Housing Units | % Housing Units |
| 1-Person Household | 989 | 35.4% |
| 2-Person Household | 979 | 35.0% |
| 3-Person Household | 354 | 12.7% |
| 4+ Person Household | 471 | 16.9% |
| Total Housing Units | 2,793 | 100.0% |
Occupancy by Ownership by Household Size in Opp
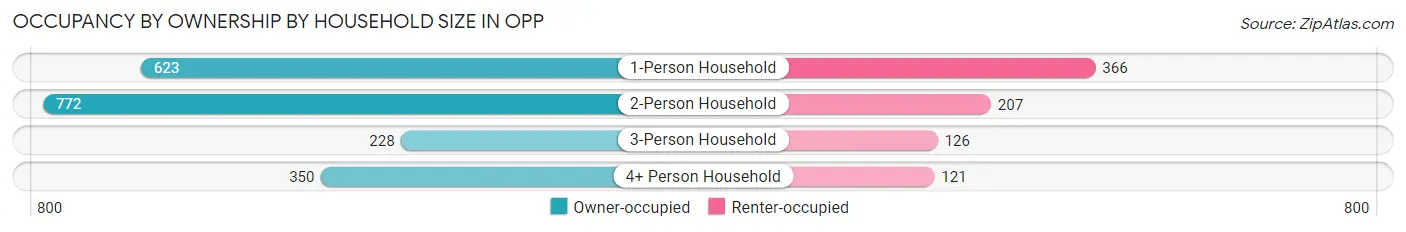
| Household Size | Owner-occupied | Renter-occupied |
| 1-Person Household | 623 (63.0%) | 366 (37.0%) |
| 2-Person Household | 772 (78.9%) | 207 (21.1%) |
| 3-Person Household | 228 (64.4%) | 126 (35.6%) |
| 4+ Person Household | 350 (74.3%) | 121 (25.7%) |
| Total Housing Units | 1,973 (70.6%) | 820 (29.4%) |
Occupancy by Educational Attainment in Opp
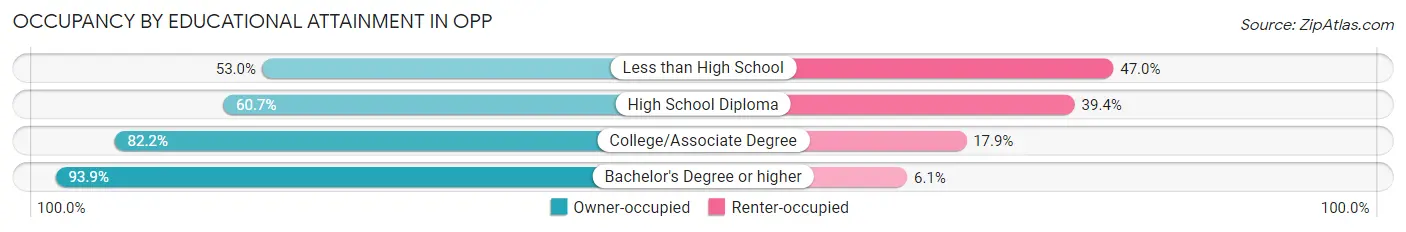
| Household Size | Owner-occupied | Renter-occupied |
| Less than High School | 169 (53.0%) | 150 (47.0%) |
| High School Diploma | 763 (60.7%) | 495 (39.4%) |
| College/Associate Degree | 704 (82.2%) | 153 (17.8%) |
| Bachelor's Degree or higher | 337 (93.9%) | 22 (6.1%) |
Occupancy by Age of Householder in Opp
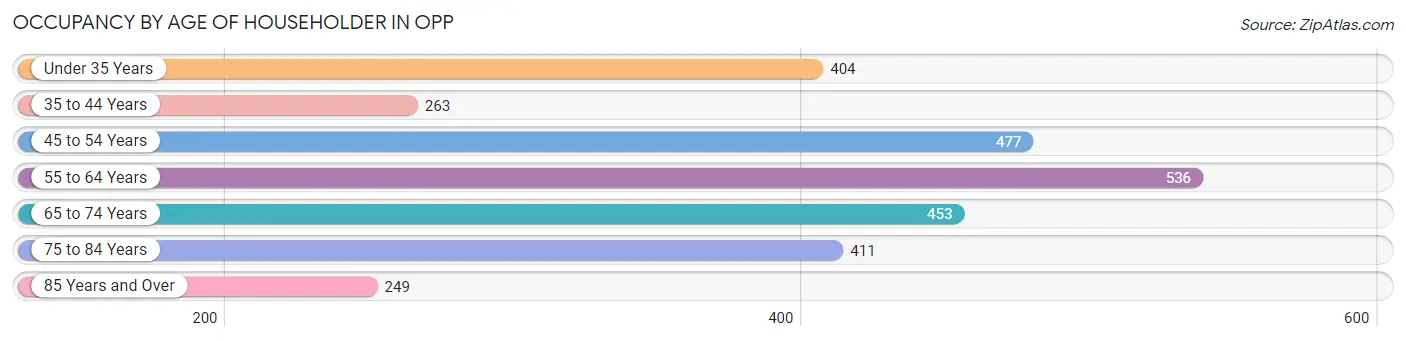
| Age Bracket | # Households | % Households |
| Under 35 Years | 404 | 14.5% |
| 35 to 44 Years | 263 | 9.4% |
| 45 to 54 Years | 477 | 17.1% |
| 55 to 64 Years | 536 | 19.2% |
| 65 to 74 Years | 453 | 16.2% |
| 75 to 84 Years | 411 | 14.7% |
| 85 Years and Over | 249 | 8.9% |
| Total | 2,793 | 100.0% |
Housing Finances in Opp
Median Income by Occupancy in Opp
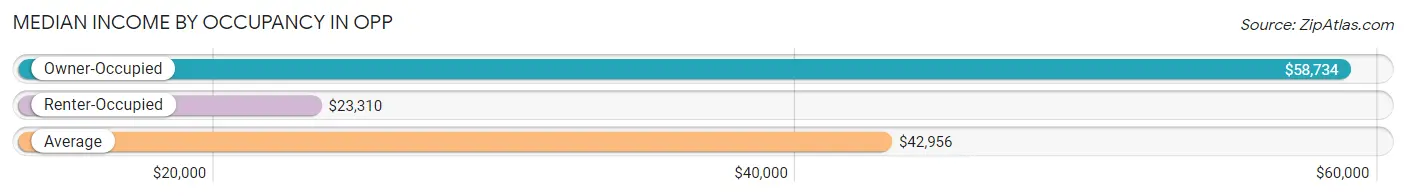
| Occupancy Type | # Households | Median Income |
| Owner-Occupied | 1,973 (70.6%) | $58,734 |
| Renter-Occupied | 820 (29.4%) | $23,310 |
| Average | 2,793 (100.0%) | $42,956 |
Occupancy by Householder Income Bracket in Opp
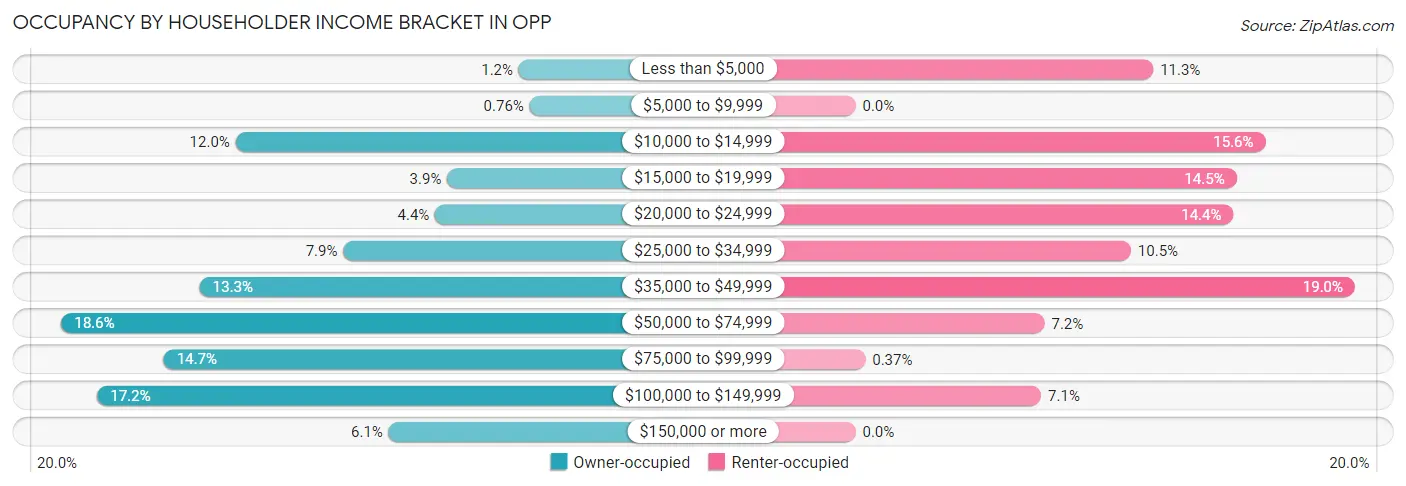
| Income Bracket | Owner-occupied | Renter-occupied |
| Less than $5,000 | 23 (1.2%) | 93 (11.3%) |
| $5,000 to $9,999 | 15 (0.8%) | 0 (0.0%) |
| $10,000 to $14,999 | 236 (12.0%) | 128 (15.6%) |
| $15,000 to $19,999 | 77 (3.9%) | 119 (14.5%) |
| $20,000 to $24,999 | 86 (4.4%) | 118 (14.4%) |
| $25,000 to $34,999 | 155 (7.9%) | 86 (10.5%) |
| $35,000 to $49,999 | 263 (13.3%) | 156 (19.0%) |
| $50,000 to $74,999 | 367 (18.6%) | 59 (7.2%) |
| $75,000 to $99,999 | 290 (14.7%) | 3 (0.4%) |
| $100,000 to $149,999 | 340 (17.2%) | 58 (7.1%) |
| $150,000 or more | 121 (6.1%) | 0 (0.0%) |
| Total | 1,973 (100.0%) | 820 (100.0%) |
Monthly Housing Cost Tiers in Opp
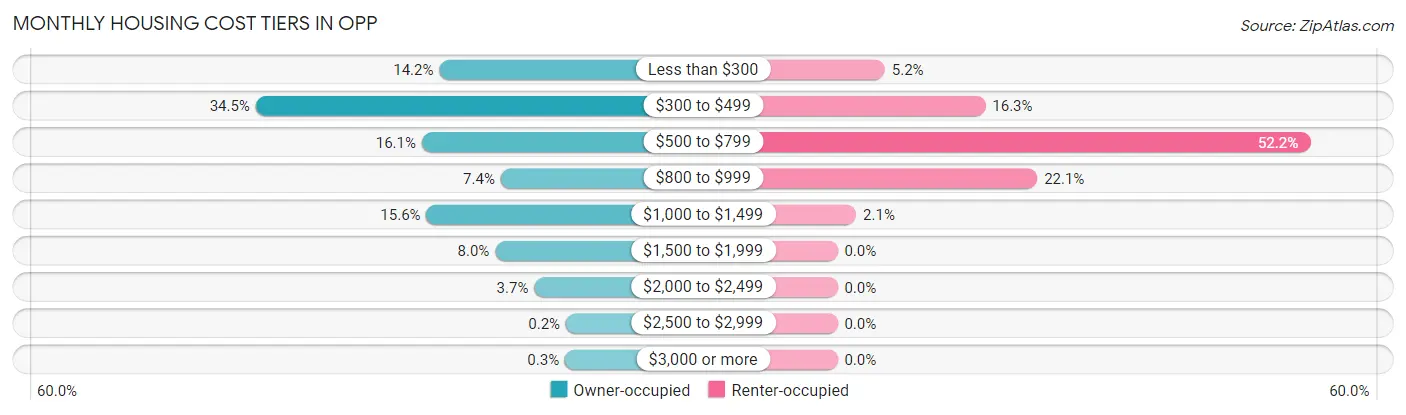
| Monthly Cost | Owner-occupied | Renter-occupied |
| Less than $300 | 280 (14.2%) | 43 (5.2%) |
| $300 to $499 | 680 (34.5%) | 134 (16.3%) |
| $500 to $799 | 318 (16.1%) | 428 (52.2%) |
| $800 to $999 | 146 (7.4%) | 181 (22.1%) |
| $1,000 to $1,499 | 308 (15.6%) | 17 (2.1%) |
| $1,500 to $1,999 | 158 (8.0%) | 0 (0.0%) |
| $2,000 to $2,499 | 73 (3.7%) | 0 (0.0%) |
| $2,500 to $2,999 | 4 (0.2%) | 0 (0.0%) |
| $3,000 or more | 6 (0.3%) | 0 (0.0%) |
| Total | 1,973 (100.0%) | 820 (100.0%) |
Physical Housing Characteristics in Opp
Housing Structures in Opp
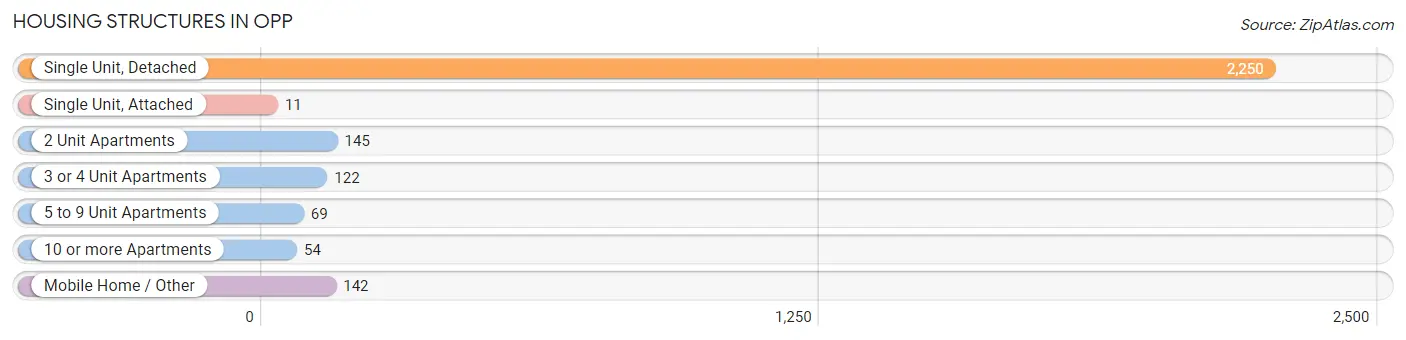
| Structure Type | # Housing Units | % Housing Units |
| Single Unit, Detached | 2,250 | 80.6% |
| Single Unit, Attached | 11 | 0.4% |
| 2 Unit Apartments | 145 | 5.2% |
| 3 or 4 Unit Apartments | 122 | 4.4% |
| 5 to 9 Unit Apartments | 69 | 2.5% |
| 10 or more Apartments | 54 | 1.9% |
| Mobile Home / Other | 142 | 5.1% |
| Total | 2,793 | 100.0% |
Housing Structures by Occupancy in Opp
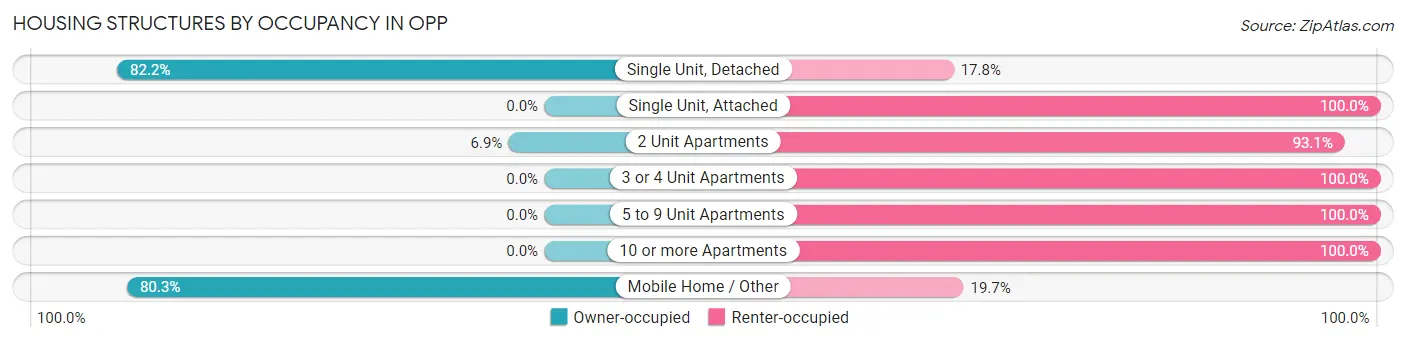
| Structure Type | Owner-occupied | Renter-occupied |
| Single Unit, Detached | 1,849 (82.2%) | 401 (17.8%) |
| Single Unit, Attached | 0 (0.0%) | 11 (100.0%) |
| 2 Unit Apartments | 10 (6.9%) | 135 (93.1%) |
| 3 or 4 Unit Apartments | 0 (0.0%) | 122 (100.0%) |
| 5 to 9 Unit Apartments | 0 (0.0%) | 69 (100.0%) |
| 10 or more Apartments | 0 (0.0%) | 54 (100.0%) |
| Mobile Home / Other | 114 (80.3%) | 28 (19.7%) |
| Total | 1,973 (70.6%) | 820 (29.4%) |
Housing Structures by Number of Rooms in Opp
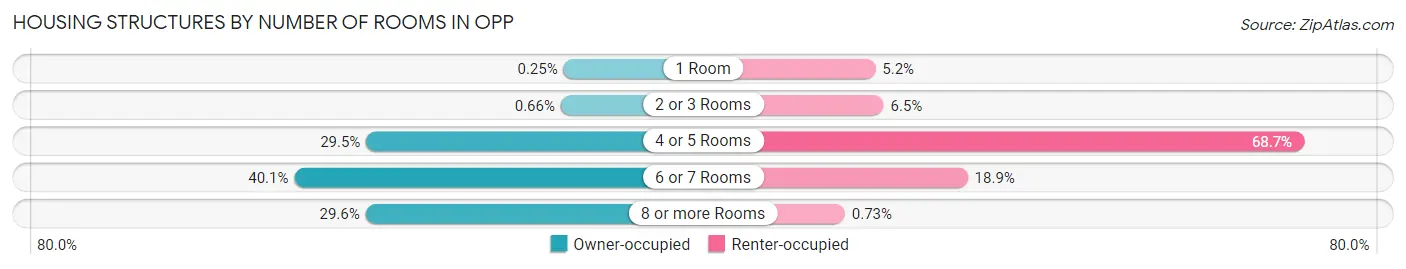
| Number of Rooms | Owner-occupied | Renter-occupied |
| 1 Room | 5 (0.3%) | 43 (5.2%) |
| 2 or 3 Rooms | 13 (0.7%) | 53 (6.5%) |
| 4 or 5 Rooms | 581 (29.4%) | 563 (68.7%) |
| 6 or 7 Rooms | 791 (40.1%) | 155 (18.9%) |
| 8 or more Rooms | 583 (29.5%) | 6 (0.7%) |
| Total | 1,973 (100.0%) | 820 (100.0%) |
Housing Structure by Heating Type in Opp
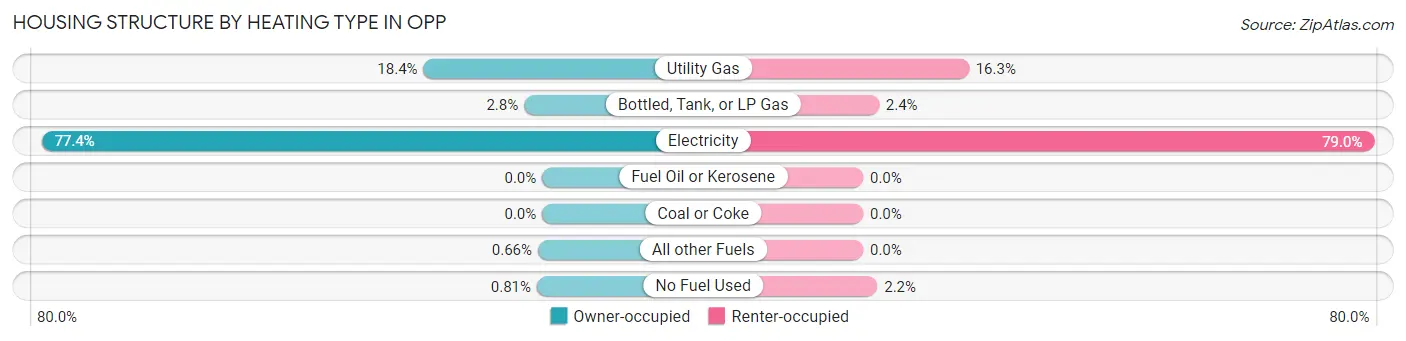
| Heating Type | Owner-occupied | Renter-occupied |
| Utility Gas | 362 (18.3%) | 134 (16.3%) |
| Bottled, Tank, or LP Gas | 55 (2.8%) | 20 (2.4%) |
| Electricity | 1,527 (77.4%) | 648 (79.0%) |
| Fuel Oil or Kerosene | 0 (0.0%) | 0 (0.0%) |
| Coal or Coke | 0 (0.0%) | 0 (0.0%) |
| All other Fuels | 13 (0.7%) | 0 (0.0%) |
| No Fuel Used | 16 (0.8%) | 18 (2.2%) |
| Total | 1,973 (100.0%) | 820 (100.0%) |
Household Vehicle Usage in Opp
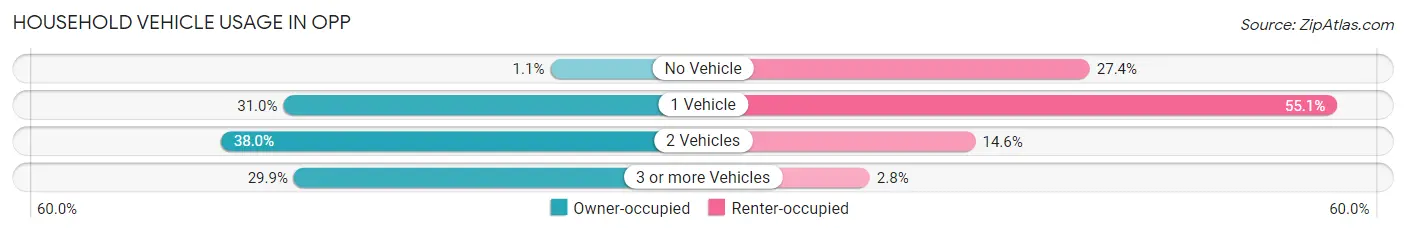
| Vehicles per Household | Owner-occupied | Renter-occupied |
| No Vehicle | 22 (1.1%) | 225 (27.4%) |
| 1 Vehicle | 612 (31.0%) | 452 (55.1%) |
| 2 Vehicles | 750 (38.0%) | 120 (14.6%) |
| 3 or more Vehicles | 589 (29.8%) | 23 (2.8%) |
| Total | 1,973 (100.0%) | 820 (100.0%) |
Real Estate & Mortgages in Opp
Real Estate and Mortgage Overview in Opp
| Characteristic | Without Mortgage | With Mortgage |
| Housing Units | 1,070 | 903 |
| Median Property Value | $107,500 | $127,300 |
| Median Household Income | $46,250 | $96 |
| Monthly Housing Costs | $375 | $6 |
| Real Estate Taxes | $356 | $116 |
Property Value by Mortgage Status in Opp
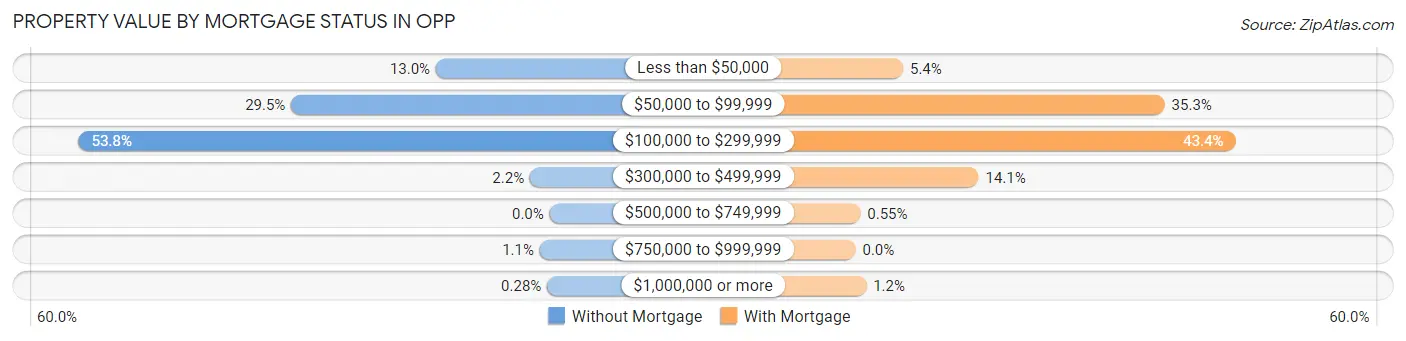
| Property Value | Without Mortgage | With Mortgage |
| Less than $50,000 | 139 (13.0%) | 49 (5.4%) |
| $50,000 to $99,999 | 316 (29.5%) | 319 (35.3%) |
| $100,000 to $299,999 | 576 (53.8%) | 392 (43.4%) |
| $300,000 to $499,999 | 24 (2.2%) | 127 (14.1%) |
| $500,000 to $749,999 | 0 (0.0%) | 5 (0.5%) |
| $750,000 to $999,999 | 12 (1.1%) | 0 (0.0%) |
| $1,000,000 or more | 3 (0.3%) | 11 (1.2%) |
| Total | 1,070 (100.0%) | 903 (100.0%) |
Household Income by Mortgage Status in Opp
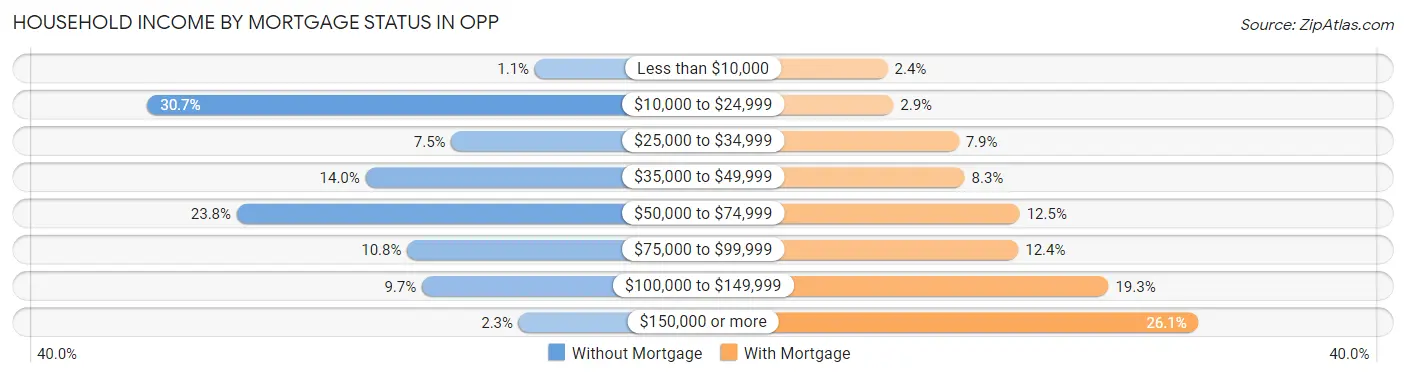
| Household Income | Without Mortgage | With Mortgage |
| Less than $10,000 | 12 (1.1%) | 22 (2.4%) |
| $10,000 to $24,999 | 328 (30.6%) | 26 (2.9%) |
| $25,000 to $34,999 | 80 (7.5%) | 71 (7.9%) |
| $35,000 to $49,999 | 150 (14.0%) | 75 (8.3%) |
| $50,000 to $74,999 | 255 (23.8%) | 113 (12.5%) |
| $75,000 to $99,999 | 116 (10.8%) | 112 (12.4%) |
| $100,000 to $149,999 | 104 (9.7%) | 174 (19.3%) |
| $150,000 or more | 25 (2.3%) | 236 (26.1%) |
| Total | 1,070 (100.0%) | 903 (100.0%) |
Property Value to Household Income Ratio in Opp
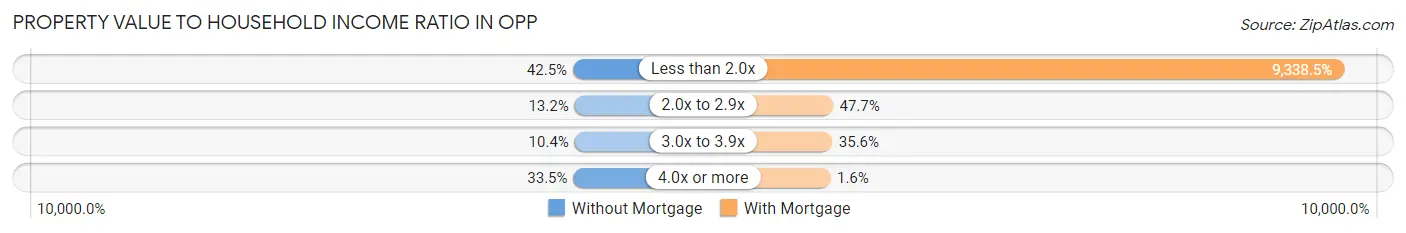
| Value-to-Income Ratio | Without Mortgage | With Mortgage |
| Less than 2.0x | 455 (42.5%) | 84,327 (9,338.5%) |
| 2.0x to 2.9x | 141 (13.2%) | 431 (47.7%) |
| 3.0x to 3.9x | 111 (10.4%) | 321 (35.5%) |
| 4.0x or more | 358 (33.5%) | 14 (1.5%) |
| Total | 1,070 (100.0%) | 903 (100.0%) |
Real Estate Taxes by Mortgage Status in Opp
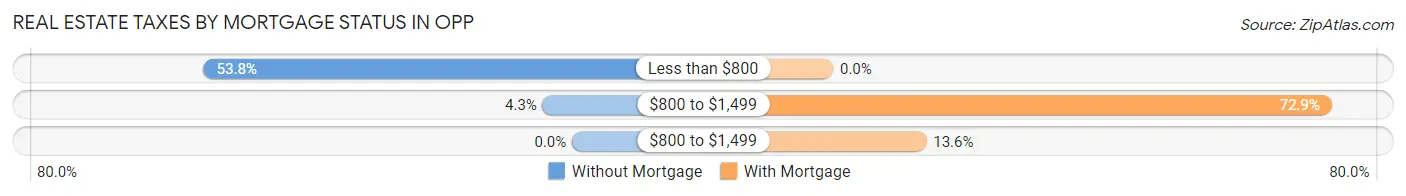
| Property Taxes | Without Mortgage | With Mortgage |
| Less than $800 | 576 (53.8%) | 0 (0.0%) |
| $800 to $1,499 | 46 (4.3%) | 658 (72.9%) |
| $800 to $1,499 | 0 (0.0%) | 123 (13.6%) |
| Total | 1,070 (100.0%) | 903 (100.0%) |
Health & Disability in Opp
Health Insurance Coverage by Age in Opp
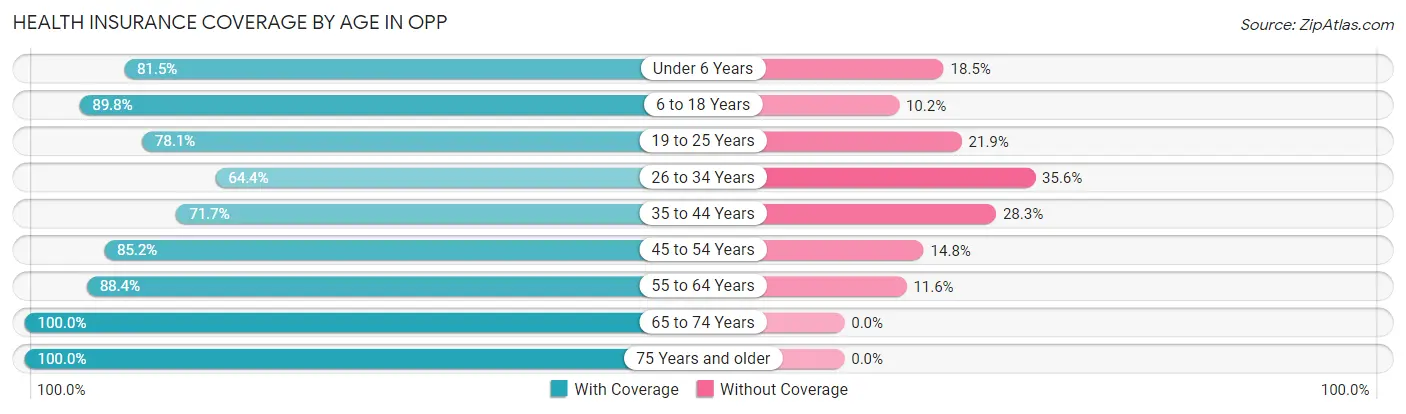
| Age Bracket | With Coverage | Without Coverage |
| Under 6 Years | 387 (81.5%) | 88 (18.5%) |
| 6 to 18 Years | 916 (89.8%) | 104 (10.2%) |
| 19 to 25 Years | 425 (78.1%) | 119 (21.9%) |
| 26 to 34 Years | 364 (64.4%) | 201 (35.6%) |
| 35 to 44 Years | 398 (71.7%) | 157 (28.3%) |
| 45 to 54 Years | 835 (85.2%) | 145 (14.8%) |
| 55 to 64 Years | 816 (88.4%) | 107 (11.6%) |
| 65 to 74 Years | 705 (100.0%) | 0 (0.0%) |
| 75 Years and older | 889 (100.0%) | 0 (0.0%) |
| Total | 5,735 (86.2%) | 921 (13.8%) |
Health Insurance Coverage by Citizenship Status in Opp
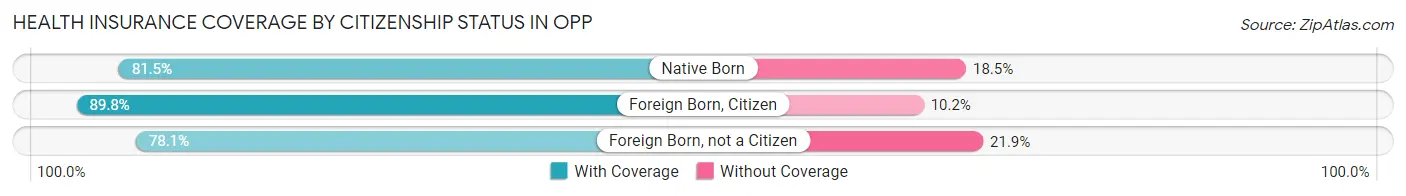
| Citizenship Status | With Coverage | Without Coverage |
| Native Born | 387 (81.5%) | 88 (18.5%) |
| Foreign Born, Citizen | 916 (89.8%) | 104 (10.2%) |
| Foreign Born, not a Citizen | 425 (78.1%) | 119 (21.9%) |
Health Insurance Coverage by Household Income in Opp
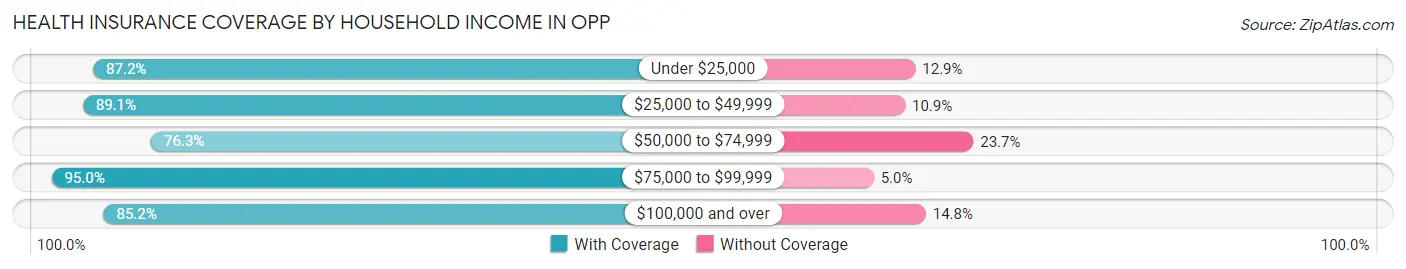
| Household Income | With Coverage | Without Coverage |
| Under $25,000 | 1,397 (87.2%) | 206 (12.9%) |
| $25,000 to $49,999 | 1,298 (89.1%) | 159 (10.9%) |
| $50,000 to $74,999 | 837 (76.3%) | 260 (23.7%) |
| $75,000 to $99,999 | 753 (95.0%) | 40 (5.0%) |
| $100,000 and over | 1,347 (85.2%) | 234 (14.8%) |
Public vs Private Health Insurance Coverage by Age in Opp
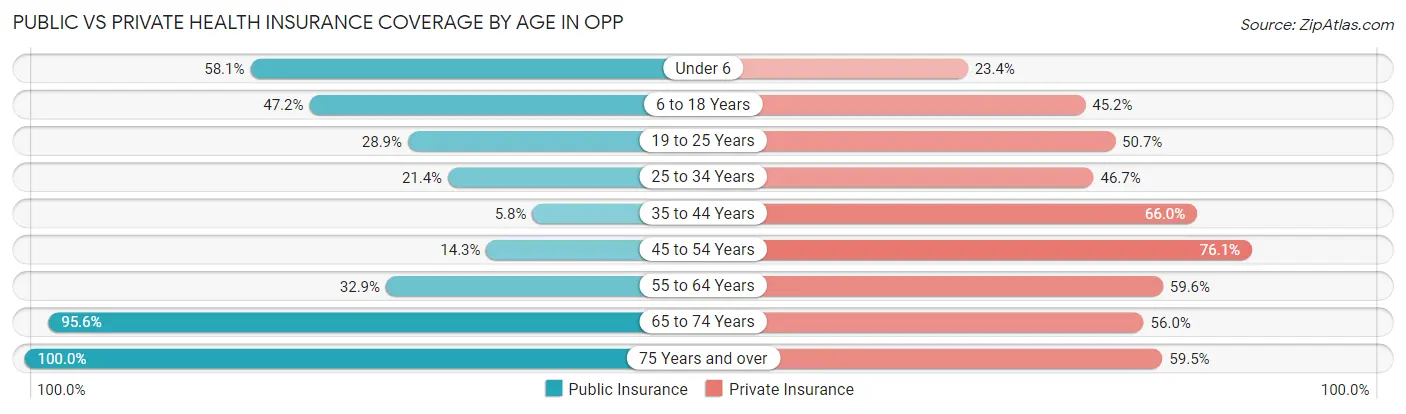
| Age Bracket | Public Insurance | Private Insurance |
| Under 6 | 276 (58.1%) | 111 (23.4%) |
| 6 to 18 Years | 481 (47.2%) | 461 (45.2%) |
| 19 to 25 Years | 157 (28.9%) | 276 (50.7%) |
| 25 to 34 Years | 121 (21.4%) | 264 (46.7%) |
| 35 to 44 Years | 32 (5.8%) | 366 (65.9%) |
| 45 to 54 Years | 140 (14.3%) | 746 (76.1%) |
| 55 to 64 Years | 304 (32.9%) | 550 (59.6%) |
| 65 to 74 Years | 674 (95.6%) | 395 (56.0%) |
| 75 Years and over | 889 (100.0%) | 529 (59.5%) |
| Total | 3,074 (46.2%) | 3,698 (55.6%) |
Disability Status by Sex by Age in Opp
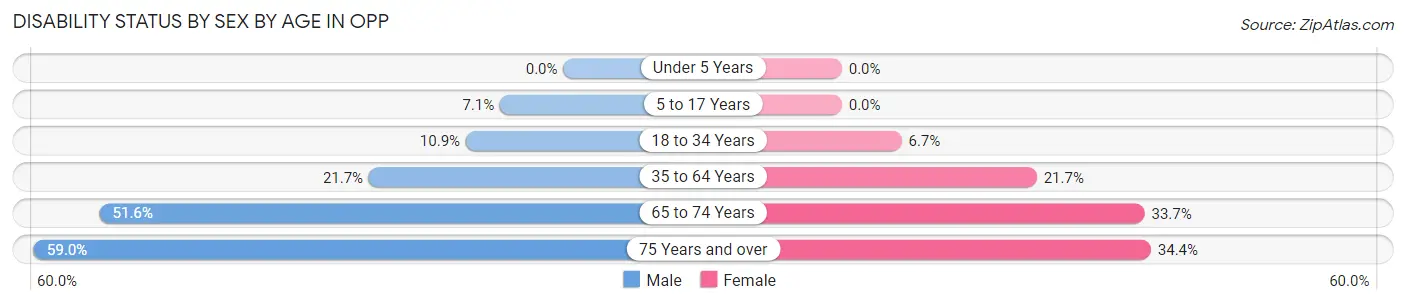
| Age Bracket | Male | Female |
| Under 5 Years | 0 (0.0%) | 0 (0.0%) |
| 5 to 17 Years | 40 (7.0%) | 0 (0.0%) |
| 18 to 34 Years | 69 (10.8%) | 36 (6.7%) |
| 35 to 64 Years | 267 (21.6%) | 266 (21.7%) |
| 65 to 74 Years | 142 (51.6%) | 145 (33.7%) |
| 75 Years and over | 125 (59.0%) | 233 (34.4%) |
Disability Class by Sex by Age in Opp
Disability Class: Hearing Difficulty
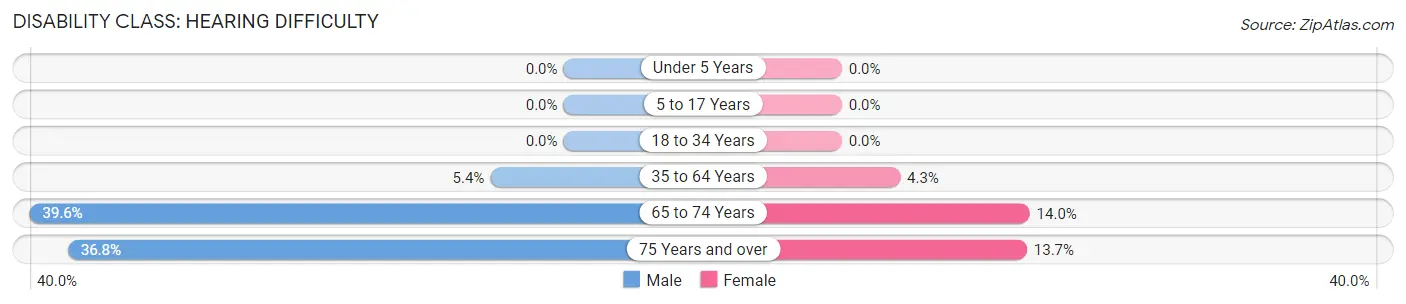
| Age Bracket | Male | Female |
| Under 5 Years | 0 (0.0%) | 0 (0.0%) |
| 5 to 17 Years | 0 (0.0%) | 0 (0.0%) |
| 18 to 34 Years | 0 (0.0%) | 0 (0.0%) |
| 35 to 64 Years | 67 (5.4%) | 53 (4.3%) |
| 65 to 74 Years | 109 (39.6%) | 60 (14.0%) |
| 75 Years and over | 78 (36.8%) | 93 (13.7%) |
Disability Class: Vision Difficulty
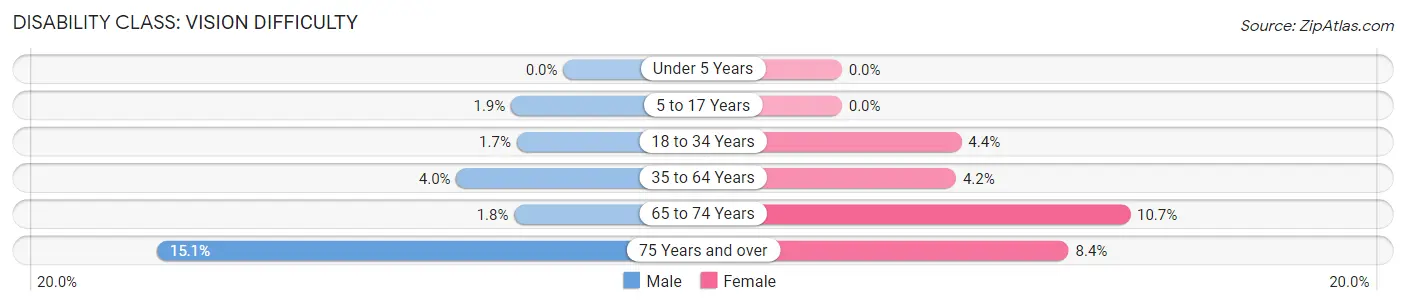
| Age Bracket | Male | Female |
| Under 5 Years | 0 (0.0%) | 0 (0.0%) |
| 5 to 17 Years | 11 (1.9%) | 0 (0.0%) |
| 18 to 34 Years | 11 (1.7%) | 24 (4.4%) |
| 35 to 64 Years | 49 (4.0%) | 52 (4.2%) |
| 65 to 74 Years | 5 (1.8%) | 46 (10.7%) |
| 75 Years and over | 32 (15.1%) | 57 (8.4%) |
Disability Class: Cognitive Difficulty
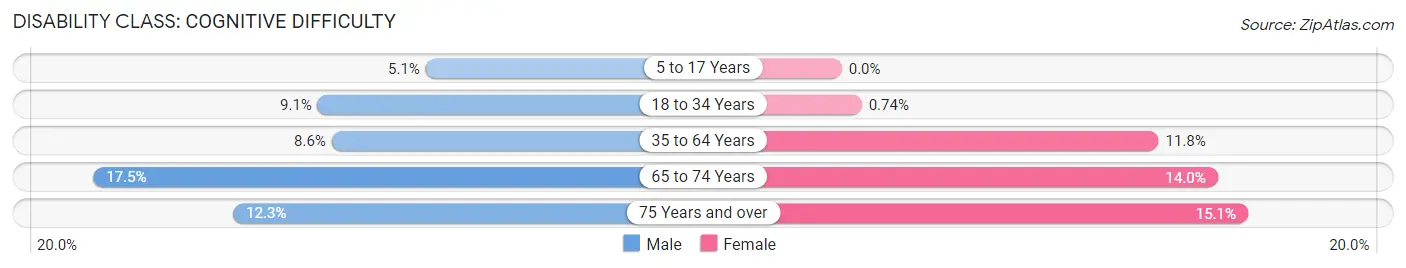
| Age Bracket | Male | Female |
| 5 to 17 Years | 29 (5.1%) | 0 (0.0%) |
| 18 to 34 Years | 58 (9.1%) | 4 (0.7%) |
| 35 to 64 Years | 106 (8.6%) | 144 (11.8%) |
| 65 to 74 Years | 48 (17.4%) | 60 (14.0%) |
| 75 Years and over | 26 (12.3%) | 102 (15.1%) |
Disability Class: Ambulatory Difficulty
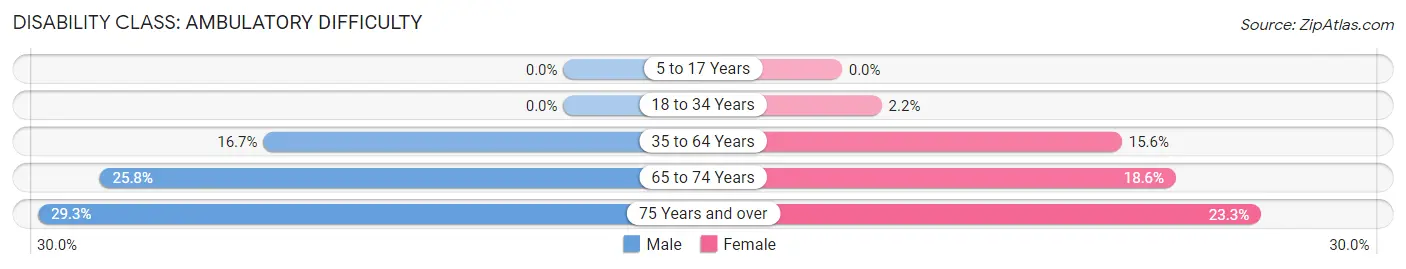
| Age Bracket | Male | Female |
| 5 to 17 Years | 0 (0.0%) | 0 (0.0%) |
| 18 to 34 Years | 0 (0.0%) | 12 (2.2%) |
| 35 to 64 Years | 206 (16.7%) | 191 (15.6%) |
| 65 to 74 Years | 71 (25.8%) | 80 (18.6%) |
| 75 Years and over | 62 (29.2%) | 158 (23.3%) |
Disability Class: Self-Care Difficulty
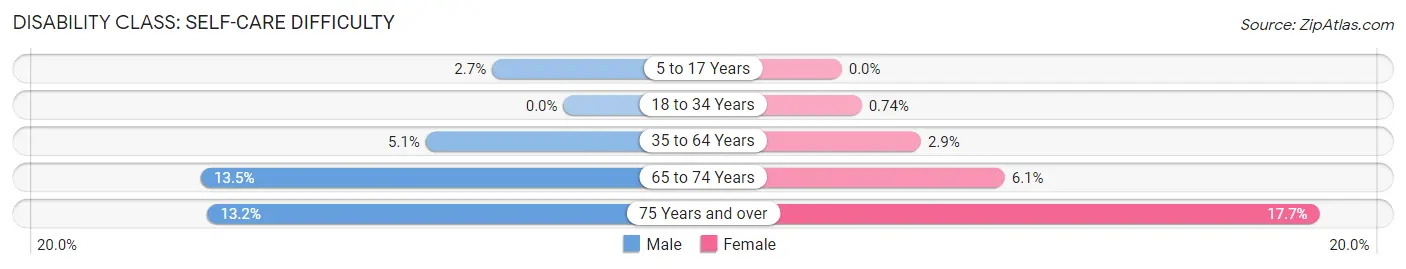
| Age Bracket | Male | Female |
| 5 to 17 Years | 15 (2.6%) | 0 (0.0%) |
| 18 to 34 Years | 0 (0.0%) | 4 (0.7%) |
| 35 to 64 Years | 63 (5.1%) | 36 (2.9%) |
| 65 to 74 Years | 37 (13.5%) | 26 (6.0%) |
| 75 Years and over | 28 (13.2%) | 120 (17.7%) |
Technology Access in Opp
Computing Device Access in Opp
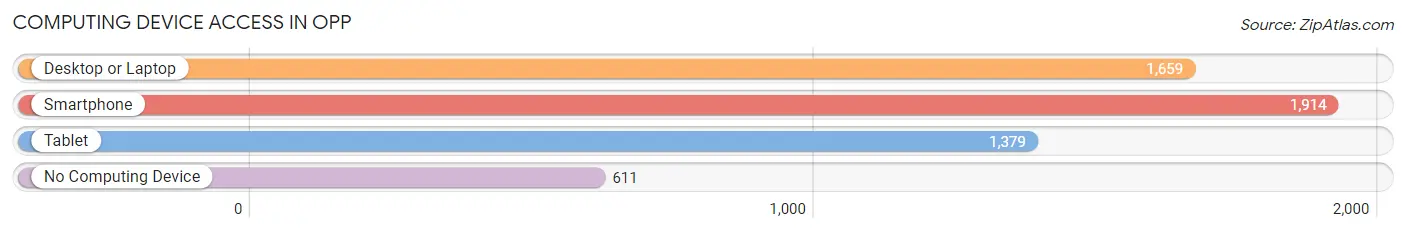
| Device Type | # Households | % Households |
| Desktop or Laptop | 1,659 | 59.4% |
| Smartphone | 1,914 | 68.5% |
| Tablet | 1,379 | 49.4% |
| No Computing Device | 611 | 21.9% |
| Total | 2,793 | 100.0% |
Internet Access in Opp
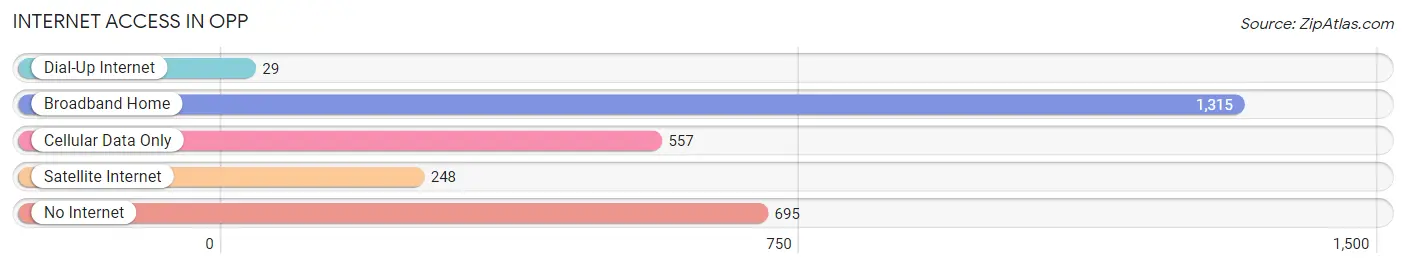
| Internet Type | # Households | % Households |
| Dial-Up Internet | 29 | 1.0% |
| Broadband Home | 1,315 | 47.1% |
| Cellular Data Only | 557 | 19.9% |
| Satellite Internet | 248 | 8.9% |
| No Internet | 695 | 24.9% |
| Total | 2,793 | 100.0% |
Opp Summary
Alabama is a state located in the southeastern region of the United States. It is bordered by Tennessee to the north, Georgia to the east, Florida and the Gulf of Mexico to the south, and Mississippi to the west. Alabama is the 30th largest state in the United States, with an area of 52,419 square miles (135,765 km2). It is the 24th most populous state, with a population of 4,858,979 as of 2019. The state capital is Montgomery, and the largest city is Birmingham.
Geography
Alabama is located in the southeastern region of the United States. It is bordered by Tennessee to the north, Georgia to the east, Florida and the Gulf of Mexico to the south, and Mississippi to the west. The state is divided into 67 counties, with the Tennessee River forming the northern border. The highest point in the state is Cheaha Mountain, which is 2,407 feet (734 m) above sea level. The state has a humid subtropical climate, with hot, humid summers and mild winters.
Economy
Alabama’s economy is largely based on agriculture, forestry, and manufacturing. The state’s agricultural products include poultry, eggs, cattle, hogs, dairy products, and peanuts. Forestry is also an important part of the state’s economy, with timber being the largest export. Manufacturing is also a major part of the state’s economy, with automotive, chemical, and steel production being the largest industries. The state also has a large tourism industry, with attractions such as the Gulf Coast beaches, the Appalachian Mountains, and the Robert Trent Jones Golf Trail.
Demographics
As of 2019, the population of Alabama was 4,858,979. The state is majority white (68.5%), with African Americans making up 26.2% of the population. Other racial groups include Hispanics (3.3%), Asians (1.3%), and Native Americans (0.4%). The median household income in the state is $48,123, and the median age is 38.7 years. The state’s largest cities are Birmingham (212,461), Montgomery (205,764), Mobile (195,111), Huntsville (193,079), and Tuscaloosa (99,543).
History
Alabama was first inhabited by Native American tribes, including the Cherokee, Choctaw, Creek, and Chickasaw. The first Europeans to explore the area were Spanish explorers in the 16th century. The area was later claimed by the French, and then by the British in 1763. The area became part of the United States in 1819, when it was admitted as the 22nd state. During the Civil War, Alabama seceded from the Union and joined the Confederate States of America. After the war, the state was readmitted to the Union in 1868. During the 20th century, the state experienced significant economic growth, particularly in the automotive and steel industries. In the 21st century, the state has continued to experience economic growth, with the automotive, aerospace, and biotechnology industries being the largest contributors.
Common Questions
What is Per Capita Income in Opp?
Per Capita income in Opp is $25,880.
What is the Median Family Income in Opp?
Median Family Income in Opp is $61,397.
What is the Median Household income in Opp?
Median Household Income in Opp is $42,956.
What is Income or Wage Gap in Opp?
Income or Wage Gap in Opp is 37.9%.
Women in Opp earn 62.1 cents for every dollar earned by a man.
What is Inequality or Gini Index in Opp?
Inequality or Gini Index in Opp is 0.45.
What is the Total Population of Opp?
Total Population of Opp is 6,741.
What is the Total Male Population of Opp?
Total Male Population of Opp is 3,155.
What is the Total Female Population of Opp?
Total Female Population of Opp is 3,586.
What is the Ratio of Males per 100 Females in Opp?
There are 87.98 Males per 100 Females in Opp.
What is the Ratio of Females per 100 Males in Opp?
There are 113.66 Females per 100 Males in Opp.
What is the Median Population Age in Opp?
Median Population Age in Opp is 46.8 Years.
What is the Average Family Size in Opp
Average Family Size in Opp is 3.0 People.
What is the Average Household Size in Opp
Average Household Size in Opp is 2.3 People.
How Large is the Labor Force in Opp?
There are 3,080 People in the Labor Forcein in Opp.
What is the Percentage of People in the Labor Force in Opp?
55.9% of People are in the Labor Force in Opp.
What is the Unemployment Rate in Opp?
Unemployment Rate in Opp is 6.0%.