Odenville, AL
Odenville Map
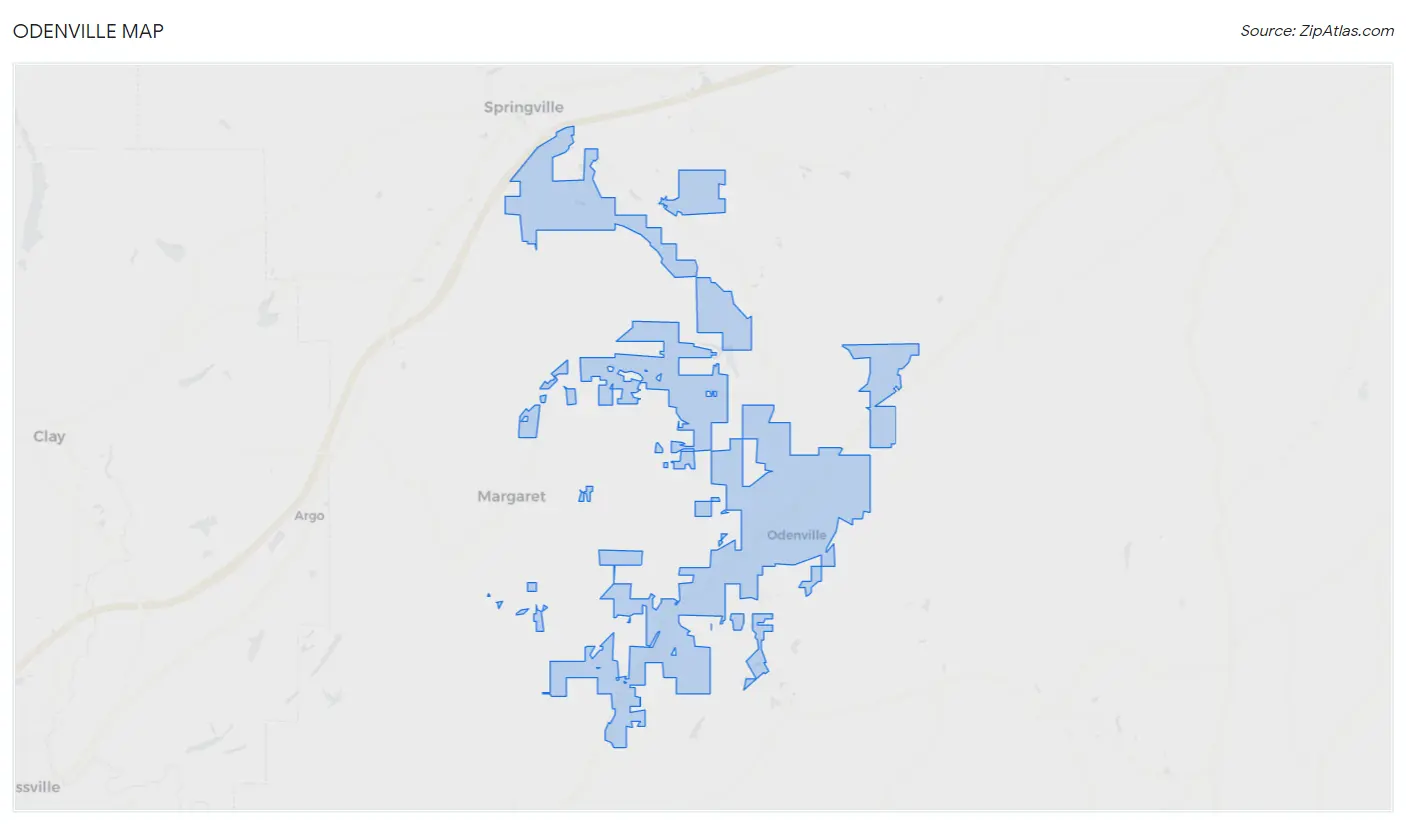
Odenville Overview
4,873
TOTAL POPULATION
2,294
MALE POPULATION
2,579
FEMALE POPULATION
88.95
MALES / 100 FEMALES
112.42
FEMALES / 100 MALES
36.3
MEDIAN AGE
2.9
AVG FAMILY SIZE
2.6
AVG HOUSEHOLD SIZE
$27,899
PER CAPITA INCOME
$77,230
AVG FAMILY INCOME
$72,521
AVG HOUSEHOLD INCOME
37.8%
WAGE / INCOME GAP [ % ]
62.2¢/ $1
WAGE / INCOME GAP [ $ ]
0.33
INEQUALITY / GINI INDEX
2,374
LABOR FORCE [ PEOPLE ]
62.8%
PERCENT IN LABOR FORCE
2.6%
UNEMPLOYMENT RATE
Odenville Zip Codes
Odenville Area Codes
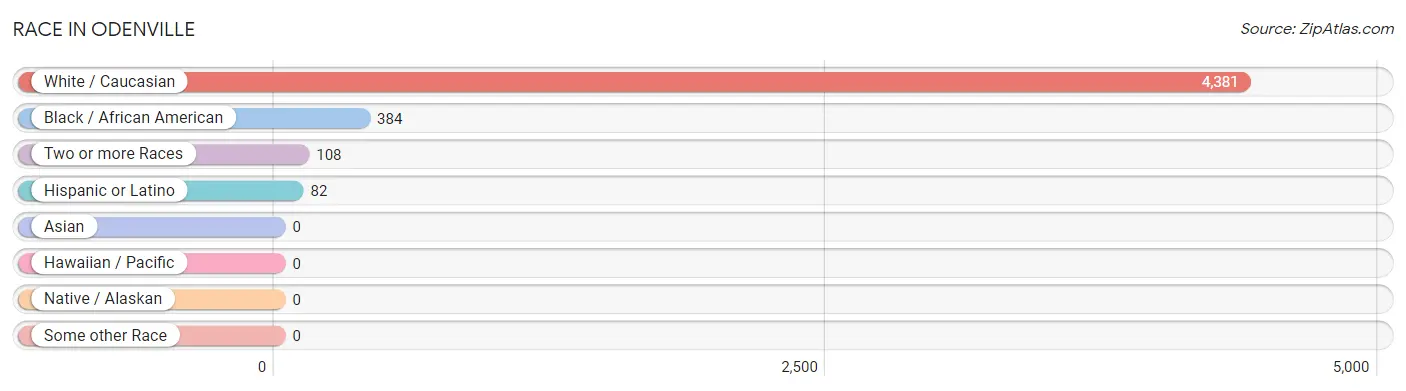
Race in Odenville
The most populous races in Odenville are White / Caucasian (4,381 | 89.9%), Black / African American (384 | 7.9%), and Two or more Races (108 | 2.2%).
| Race | # Population | % Population |
| Asian | 0 | 0.0% |
| Black / African American | 384 | 7.9% |
| Hawaiian / Pacific | 0 | 0.0% |
| Hispanic or Latino | 82 | 1.7% |
| Native / Alaskan | 0 | 0.0% |
| White / Caucasian | 4,381 | 89.9% |
| Two or more Races | 108 | 2.2% |
| Some other Race | 0 | 0.0% |
| Total | 4,873 | 100.0% |
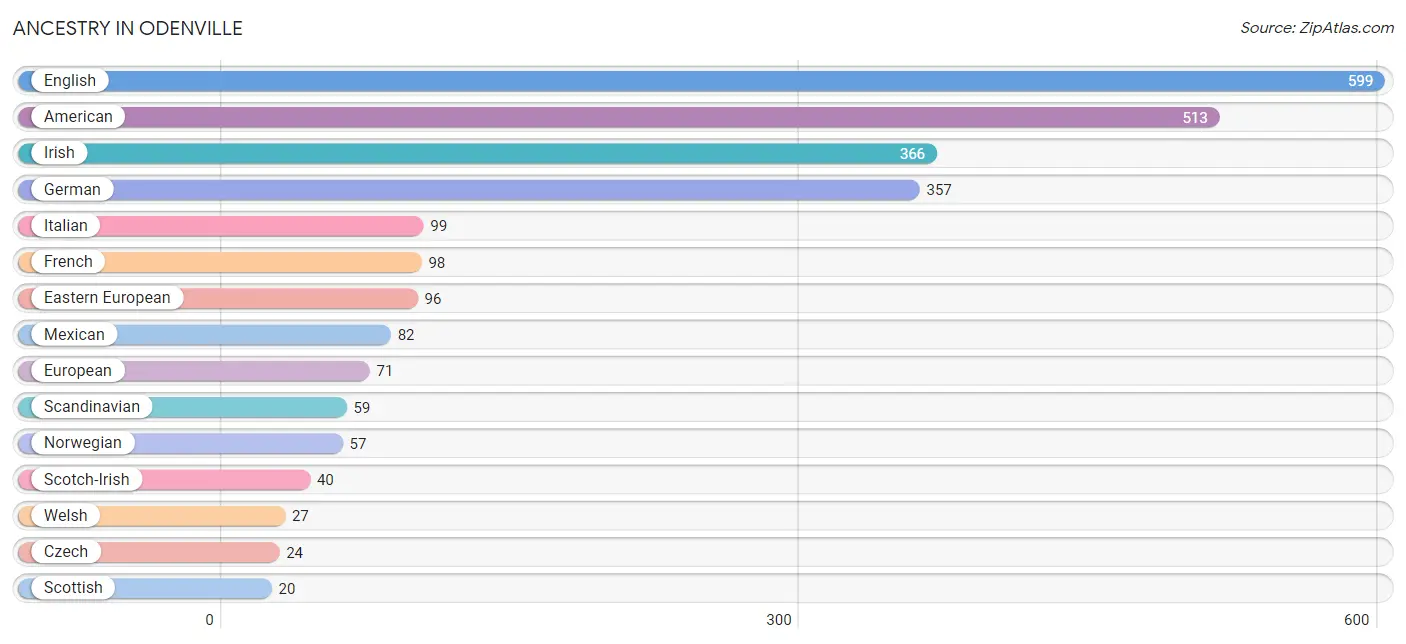
Ancestry in Odenville
The most populous ancestries reported in Odenville are English (599 | 12.3%), American (513 | 10.5%), Irish (366 | 7.5%), German (357 | 7.3%), and Italian (99 | 2.0%), together accounting for 39.7% of all Odenville residents.
| Ancestry | # Population | % Population |
| American | 513 | 10.5% |
| British | 1 | 0.0% |
| Cherokee | 3 | 0.1% |
| Czech | 24 | 0.5% |
| Dutch | 6 | 0.1% |
| Eastern European | 96 | 2.0% |
| English | 599 | 12.3% |
| European | 71 | 1.5% |
| French | 98 | 2.0% |
| German | 357 | 7.3% |
| Irish | 366 | 7.5% |
| Italian | 99 | 2.0% |
| Mexican | 82 | 1.7% |
| Native Hawaiian | 11 | 0.2% |
| Norwegian | 57 | 1.2% |
| Scandinavian | 59 | 1.2% |
| Scotch-Irish | 40 | 0.8% |
| Scottish | 20 | 0.4% |
| Welsh | 27 | 0.5% | View All 19 Rows |
Immigrants in Odenville

| Immigration Origin | # Population | % Population | View All 0 Rows |
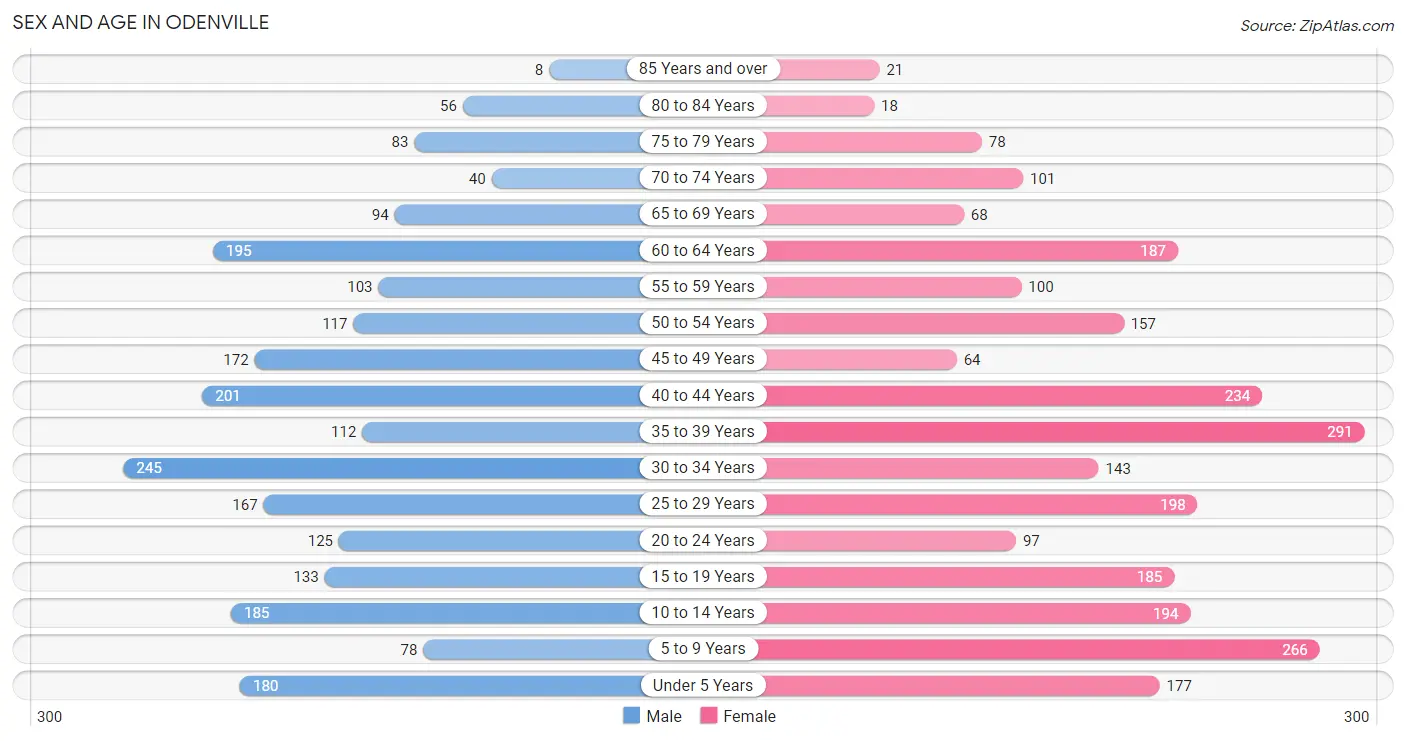
Sex and Age in Odenville
Sex and Age in Odenville
The most populous age groups in Odenville are 30 to 34 Years (245 | 10.7%) for men and 35 to 39 Years (291 | 11.3%) for women.
| Age Bracket | Male | Female |
| Under 5 Years | 180 (7.9%) | 177 (6.9%) |
| 5 to 9 Years | 78 (3.4%) | 266 (10.3%) |
| 10 to 14 Years | 185 (8.1%) | 194 (7.5%) |
| 15 to 19 Years | 133 (5.8%) | 185 (7.2%) |
| 20 to 24 Years | 125 (5.4%) | 97 (3.8%) |
| 25 to 29 Years | 167 (7.3%) | 198 (7.7%) |
| 30 to 34 Years | 245 (10.7%) | 143 (5.5%) |
| 35 to 39 Years | 112 (4.9%) | 291 (11.3%) |
| 40 to 44 Years | 201 (8.8%) | 234 (9.1%) |
| 45 to 49 Years | 172 (7.5%) | 64 (2.5%) |
| 50 to 54 Years | 117 (5.1%) | 157 (6.1%) |
| 55 to 59 Years | 103 (4.5%) | 100 (3.9%) |
| 60 to 64 Years | 195 (8.5%) | 187 (7.2%) |
| 65 to 69 Years | 94 (4.1%) | 68 (2.6%) |
| 70 to 74 Years | 40 (1.7%) | 101 (3.9%) |
| 75 to 79 Years | 83 (3.6%) | 78 (3.0%) |
| 80 to 84 Years | 56 (2.4%) | 18 (0.7%) |
| 85 Years and over | 8 (0.4%) | 21 (0.8%) |
| Total | 2,294 (100.0%) | 2,579 (100.0%) |
Families and Households in Odenville
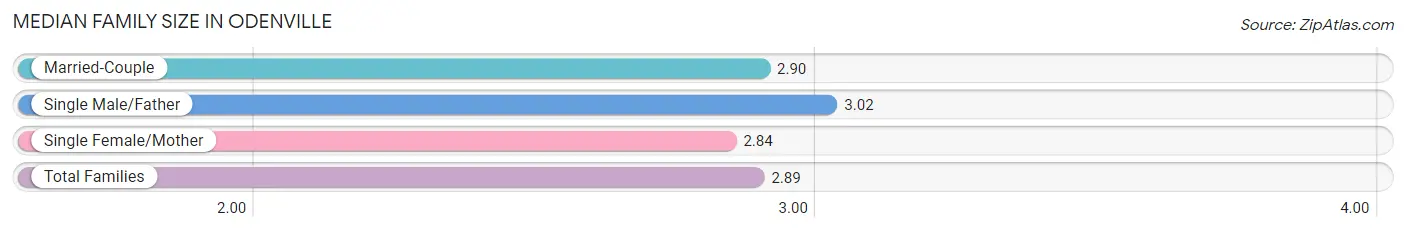
Median Family Size in Odenville
The median family size in Odenville is 2.89 persons per family, with single male/father families (65 | 4.3%) accounting for the largest median family size of 3.02 persons per family. On the other hand, single female/mother families (402 | 26.6%) represent the smallest median family size with 2.84 persons per family.
| Family Type | # Families | Family Size |
| Married-Couple | 1,042 (69.1%) | 2.90 |
| Single Male/Father | 65 (4.3%) | 3.02 |
| Single Female/Mother | 402 (26.6%) | 2.84 |
| Total Families | 1,509 (100.0%) | 2.89 |
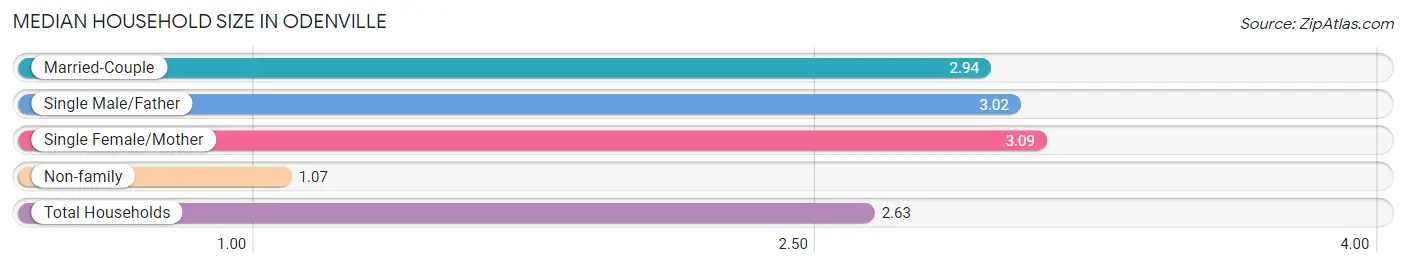
Median Household Size in Odenville
The median household size in Odenville is 2.63 persons per household, with single female/mother households (402 | 21.7%) accounting for the largest median household size of 3.09 persons per household. non-family households (344 | 18.6%) represent the smallest median household size with 1.07 persons per household.
| Household Type | # Households | Household Size |
| Married-Couple | 1,042 (56.2%) | 2.94 |
| Single Male/Father | 65 (3.5%) | 3.02 |
| Single Female/Mother | 402 (21.7%) | 3.09 |
| Non-family | 344 (18.6%) | 1.07 |
| Total Households | 1,853 (100.0%) | 2.63 |
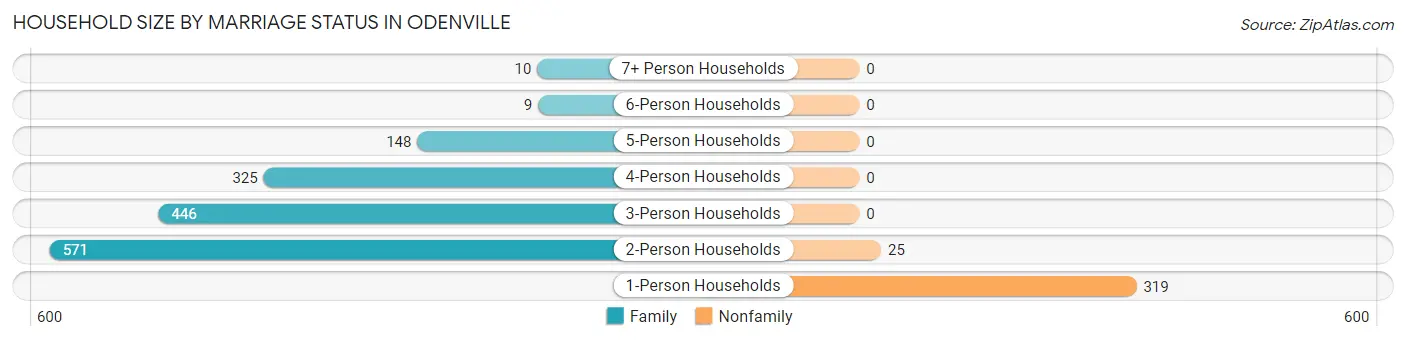
Household Size by Marriage Status in Odenville
Out of a total of 1,853 households in Odenville, 1,509 (81.4%) are family households, while 344 (18.6%) are nonfamily households. The most numerous type of family households are 2-person households, comprising 571, and the most common type of nonfamily households are 1-person households, comprising 319.
| Household Size | Family Households | Nonfamily Households |
| 1-Person Households | - | 319 (17.2%) |
| 2-Person Households | 571 (30.8%) | 25 (1.3%) |
| 3-Person Households | 446 (24.1%) | 0 (0.0%) |
| 4-Person Households | 325 (17.5%) | 0 (0.0%) |
| 5-Person Households | 148 (8.0%) | 0 (0.0%) |
| 6-Person Households | 9 (0.5%) | 0 (0.0%) |
| 7+ Person Households | 10 (0.5%) | 0 (0.0%) |
| Total | 1,509 (81.4%) | 344 (18.6%) |
Female Fertility in Odenville
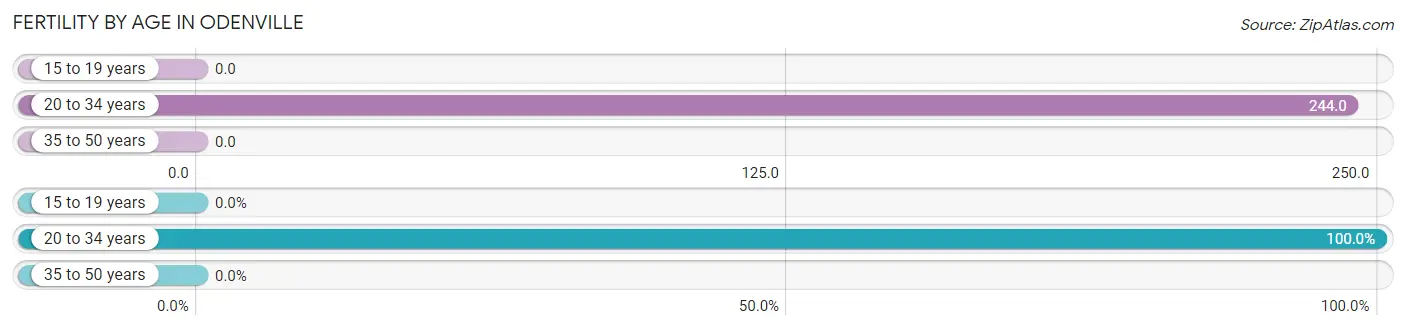
Fertility by Age in Odenville
Average fertility rate in Odenville is 88.0 births per 1,000 women. Women in the age bracket of 20 to 34 years have the highest fertility rate with 244.0 births per 1,000 women. Women in the age bracket of 20 to 34 years acount for 100.0% of all women with births.
| Age Bracket | Women with Births | Births / 1,000 Women |
| 15 to 19 years | 0 (0.0%) | 0.0 |
| 20 to 34 years | 107 (100.0%) | 244.0 |
| 35 to 50 years | 0 (0.0%) | 0.0 |
| Total | 107 (100.0%) | 88.0 |
Fertility by Age by Marriage Status in Odenville
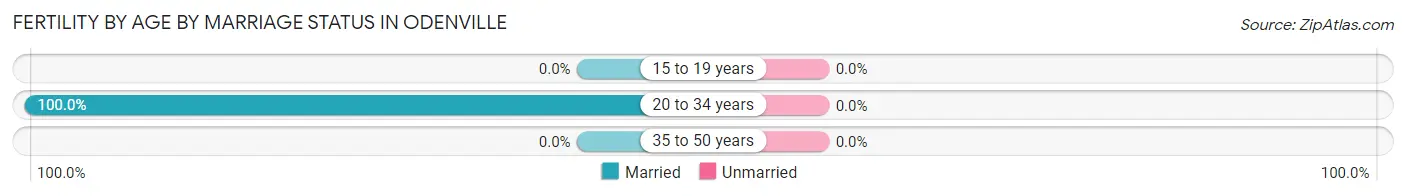
| Age Bracket | Married | Unmarried |
| 15 to 19 years | 0 (0.0%) | 0 (0.0%) |
| 20 to 34 years | 107 (100.0%) | 0 (0.0%) |
| 35 to 50 years | 0 (0.0%) | 0 (0.0%) |
| Total | 107 (100.0%) | 0 (0.0%) |
Fertility by Education in Odenville
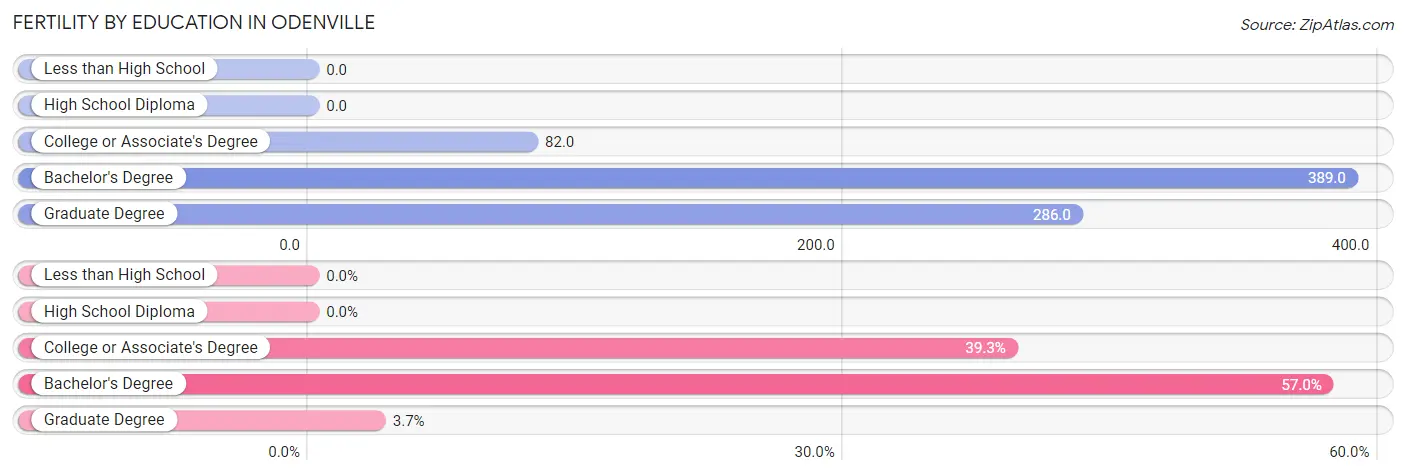
| Educational Attainment | Women with Births | Births / 1,000 Women |
| Less than High School | 0 (0.0%) | 0.0 |
| High School Diploma | 0 (0.0%) | 0.0 |
| College or Associate's Degree | 42 (39.3%) | 82.0 |
| Bachelor's Degree | 61 (57.0%) | 389.0 |
| Graduate Degree | 4 (3.7%) | 286.0 |
| Total | 107 (100.0%) | 88.0 |
Fertility by Education by Marriage Status in Odenville
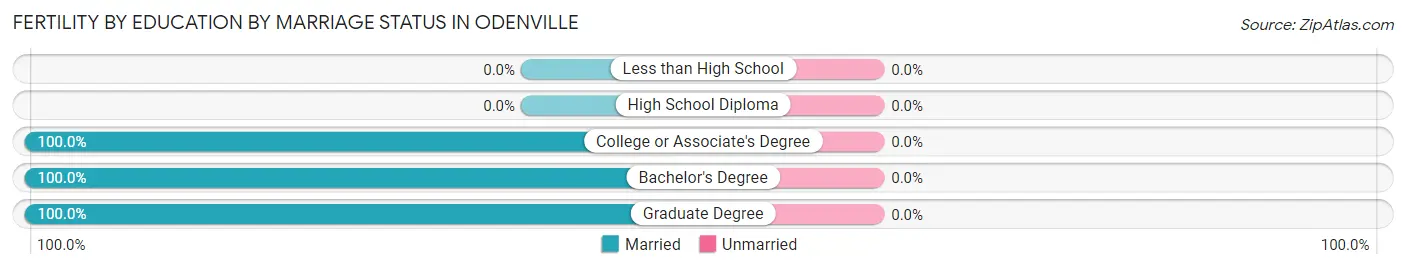
| Educational Attainment | Married | Unmarried |
| Less than High School | 0 (0.0%) | 0 (0.0%) |
| High School Diploma | 0 (0.0%) | 0 (0.0%) |
| College or Associate's Degree | 42 (100.0%) | 0 (0.0%) |
| Bachelor's Degree | 61 (100.0%) | 0 (0.0%) |
| Graduate Degree | 4 (100.0%) | 0 (0.0%) |
| Total | 107 (100.0%) | 0 (0.0%) |
Income in Odenville
Income Overview in Odenville
Per Capita Income in Odenville is $27,899, while median incomes of families and households are $77,230 and $72,521 respectively.
| Characteristic | Number | Measure |
| Per Capita Income | 4,873 | $27,899 |
| Median Family Income | 1,509 | $77,230 |
| Mean Family Income | 1,509 | $77,286 |
| Median Household Income | 1,853 | $72,521 |
| Mean Household Income | 1,853 | $72,373 |
| Income Deficit | 1,509 | $0 |
| Wage / Income Gap (%) | 4,873 | 37.79% |
| Wage / Income Gap ($) | 4,873 | 62.21¢ per $1 |
| Gini / Inequality Index | 4,873 | 0.33 |
Earnings by Sex in Odenville
Average Earnings in Odenville are $41,646, $48,309 for men and $30,051 for women, a difference of 37.8%.
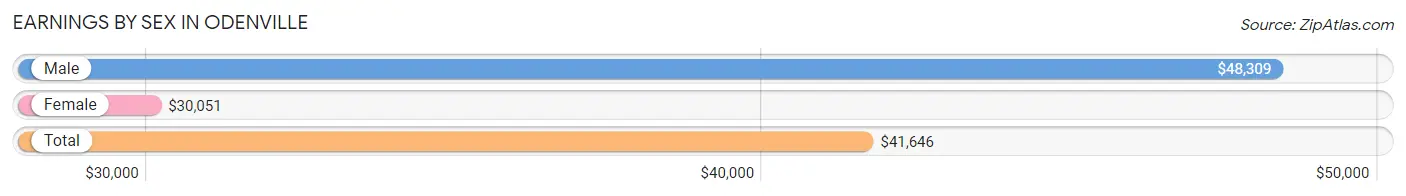
| Sex | Number | Average Earnings |
| Male | 1,246 (50.7%) | $48,309 |
| Female | 1,212 (49.3%) | $30,051 |
| Total | 2,458 (100.0%) | $41,646 |
Earnings by Sex by Income Bracket in Odenville
The most common earnings brackets in Odenville are $55,000 to $64,999 for men (174 | 14.0%) and $10,000 to $12,499 for women (161 | 13.3%).
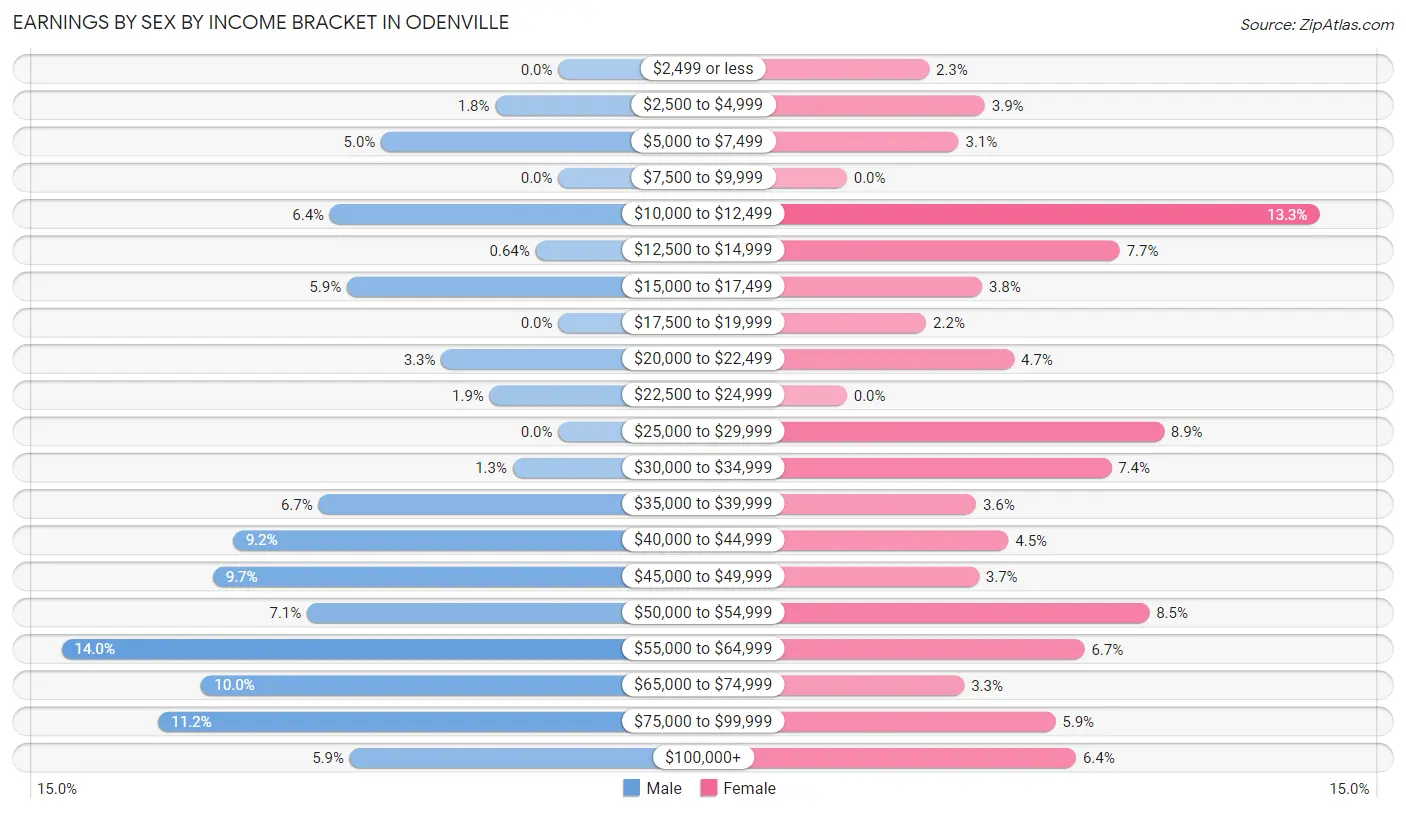
| Income | Male | Female |
| $2,499 or less | 0 (0.0%) | 28 (2.3%) |
| $2,500 to $4,999 | 22 (1.8%) | 47 (3.9%) |
| $5,000 to $7,499 | 62 (5.0%) | 38 (3.1%) |
| $7,500 to $9,999 | 0 (0.0%) | 0 (0.0%) |
| $10,000 to $12,499 | 80 (6.4%) | 161 (13.3%) |
| $12,500 to $14,999 | 8 (0.6%) | 93 (7.7%) |
| $15,000 to $17,499 | 74 (5.9%) | 46 (3.8%) |
| $17,500 to $19,999 | 0 (0.0%) | 27 (2.2%) |
| $20,000 to $22,499 | 41 (3.3%) | 57 (4.7%) |
| $22,500 to $24,999 | 24 (1.9%) | 0 (0.0%) |
| $25,000 to $29,999 | 0 (0.0%) | 108 (8.9%) |
| $30,000 to $34,999 | 16 (1.3%) | 90 (7.4%) |
| $35,000 to $39,999 | 84 (6.7%) | 44 (3.6%) |
| $40,000 to $44,999 | 114 (9.1%) | 55 (4.5%) |
| $45,000 to $49,999 | 121 (9.7%) | 45 (3.7%) |
| $50,000 to $54,999 | 88 (7.1%) | 103 (8.5%) |
| $55,000 to $64,999 | 174 (14.0%) | 81 (6.7%) |
| $65,000 to $74,999 | 125 (10.0%) | 40 (3.3%) |
| $75,000 to $99,999 | 140 (11.2%) | 71 (5.9%) |
| $100,000+ | 73 (5.9%) | 78 (6.4%) |
| Total | 1,246 (100.0%) | 1,212 (100.0%) |
Earnings by Sex by Educational Attainment in Odenville
Average earnings in Odenville are $52,074 for men and $40,091 for women, a difference of 23.0%. Men with an educational attainment of bachelor's degree enjoy the highest average annual earnings of $68,750, while those with high school diploma education earn the least with $50,107. Women with an educational attainment of graduate degree earn the most with the average annual earnings of $88,295, while those with high school diploma education have the smallest earnings of $29,063.
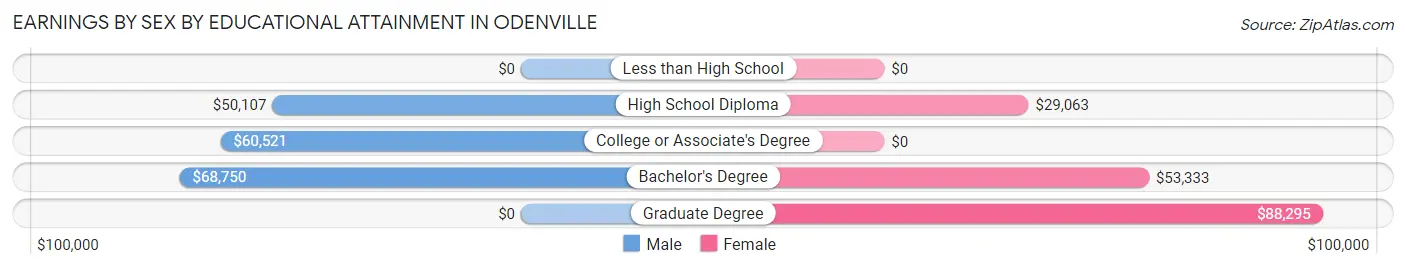
| Educational Attainment | Male Income | Female Income |
| Less than High School | - | - |
| High School Diploma | $50,107 | $29,063 |
| College or Associate's Degree | $60,521 | $0 |
| Bachelor's Degree | $68,750 | $53,333 |
| Graduate Degree | - | - |
| Total | $52,074 | $40,091 |
Family Income in Odenville
Family Income Brackets in Odenville
According to the Odenville family income data, there are 377 families falling into the $75,000 to $99,999 income range, which is the most common income bracket and makes up 25.0% of all families.
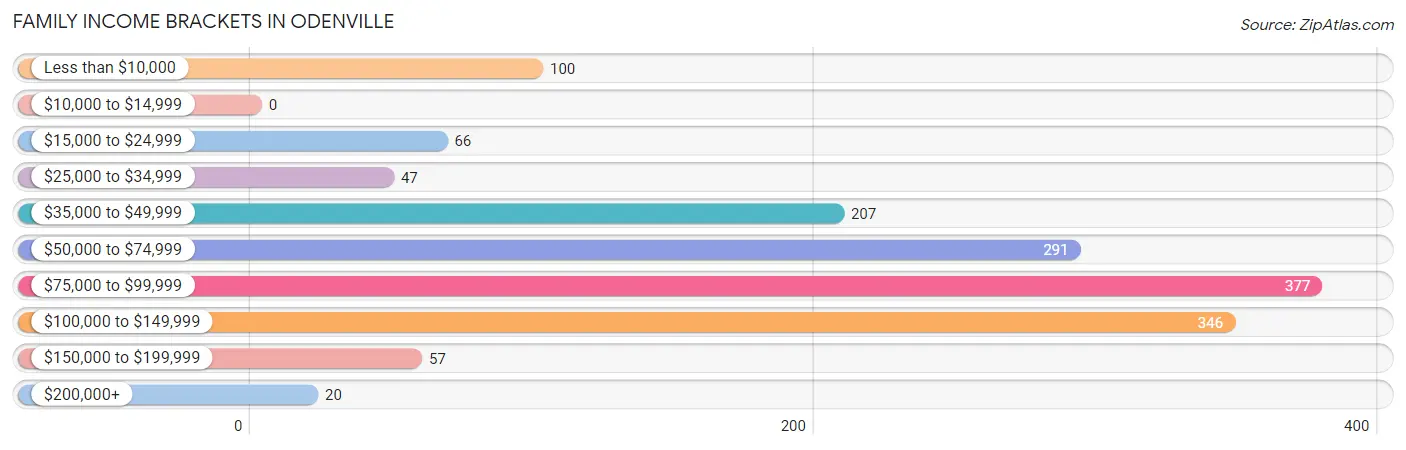
| Income Bracket | # Families | % Families |
| Less than $10,000 | 100 | 6.6% |
| $10,000 to $14,999 | 0 | 0.0% |
| $15,000 to $24,999 | 66 | 4.4% |
| $25,000 to $34,999 | 47 | 3.1% |
| $35,000 to $49,999 | 207 | 13.7% |
| $50,000 to $74,999 | 291 | 19.3% |
| $75,000 to $99,999 | 377 | 25.0% |
| $100,000 to $149,999 | 346 | 22.9% |
| $150,000 to $199,999 | 57 | 3.8% |
| $200,000+ | 20 | 1.3% |
Family Income by Famaliy Size in Odenville
5-person families (148 | 9.8%) account for the highest median family income in Odenville with $84,068 per family, while 2-person families (672 | 44.5%) have the highest median income of $33,370 per family member.
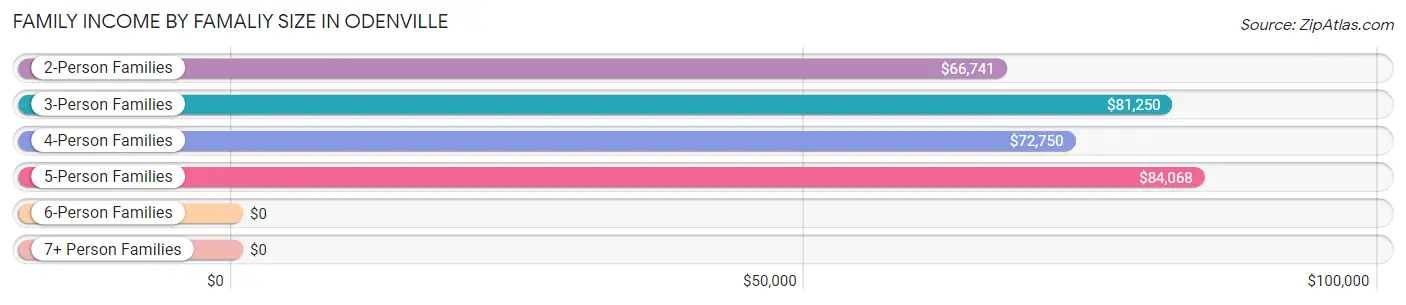
| Income Bracket | # Families | Median Income |
| 2-Person Families | 672 (44.5%) | $66,741 |
| 3-Person Families | 358 (23.7%) | $81,250 |
| 4-Person Families | 312 (20.7%) | $72,750 |
| 5-Person Families | 148 (9.8%) | $84,068 |
| 6-Person Families | 9 (0.6%) | $0 |
| 7+ Person Families | 10 (0.7%) | $0 |
| Total | 1,509 (100.0%) | $77,230 |
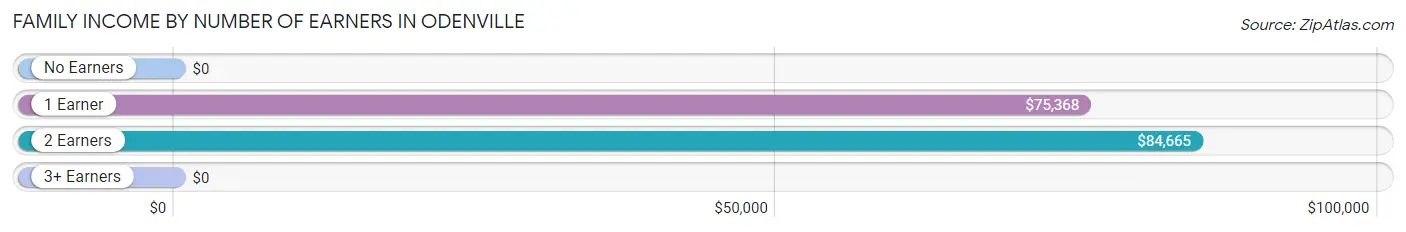
Family Income by Number of Earners in Odenville
| Number of Earners | # Families | Median Income |
| No Earners | 249 (16.5%) | $0 |
| 1 Earner | 415 (27.5%) | $75,368 |
| 2 Earners | 762 (50.5%) | $84,665 |
| 3+ Earners | 83 (5.5%) | $0 |
| Total | 1,509 (100.0%) | $77,230 |
Household Income in Odenville
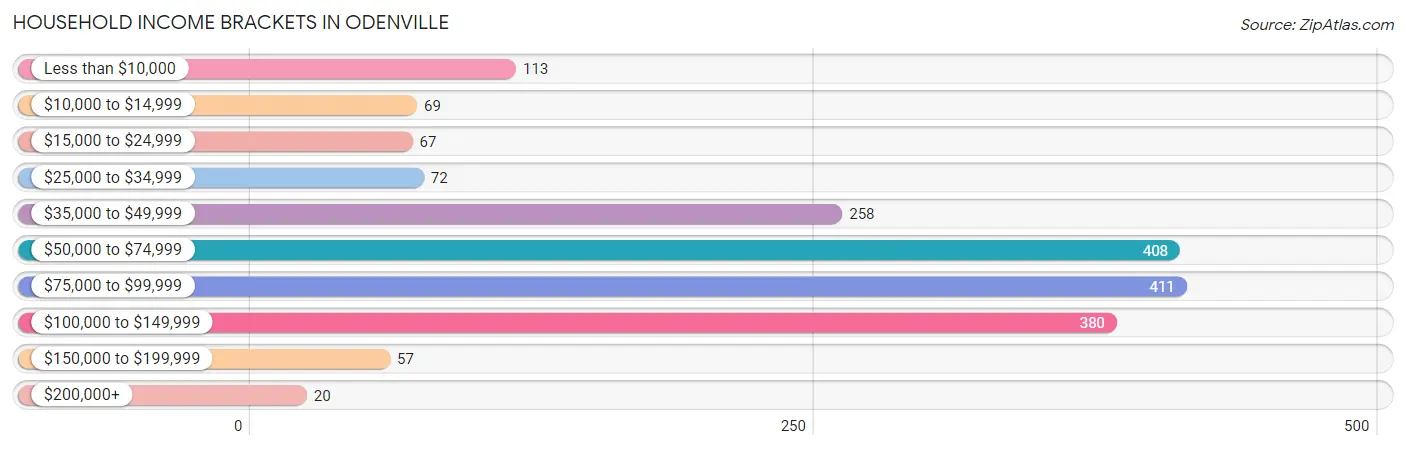
Household Income Brackets in Odenville
With 411 households falling in the category, the $75,000 to $99,999 income range is the most frequent in Odenville, accounting for 22.2% of all households. In contrast, only 20 households (1.1%) fall into the $200,000+ income bracket, making it the least populous group.
| Income Bracket | # Households | % Households |
| Less than $10,000 | 113 | 6.1% |
| $10,000 to $14,999 | 69 | 3.7% |
| $15,000 to $24,999 | 67 | 3.6% |
| $25,000 to $34,999 | 72 | 3.9% |
| $35,000 to $49,999 | 258 | 13.9% |
| $50,000 to $74,999 | 408 | 22.0% |
| $75,000 to $99,999 | 411 | 22.2% |
| $100,000 to $149,999 | 380 | 20.5% |
| $150,000 to $199,999 | 57 | 3.1% |
| $200,000+ | 20 | 1.1% |
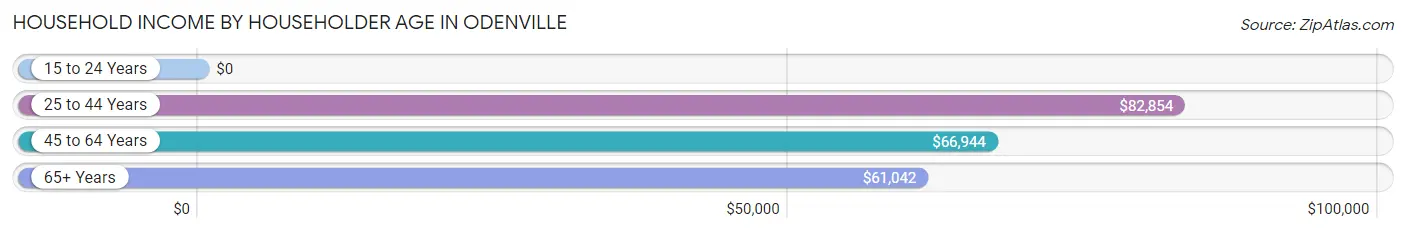
Household Income by Householder Age in Odenville
The median household income in Odenville is $72,521, with the highest median household income of $82,854 found in the 25 to 44 years age bracket for the primary householder. A total of 832 households (44.9%) fall into this category. Meanwhile, the 15 to 24 years age bracket for the primary householder has the lowest median household income of $0, with 56 households (3.0%) in this group.
| Income Bracket | # Households | Median Income |
| 15 to 24 Years | 56 (3.0%) | $0 |
| 25 to 44 Years | 832 (44.9%) | $82,854 |
| 45 to 64 Years | 638 (34.4%) | $66,944 |
| 65+ Years | 327 (17.6%) | $61,042 |
| Total | 1,853 (100.0%) | $72,521 |
Poverty in Odenville
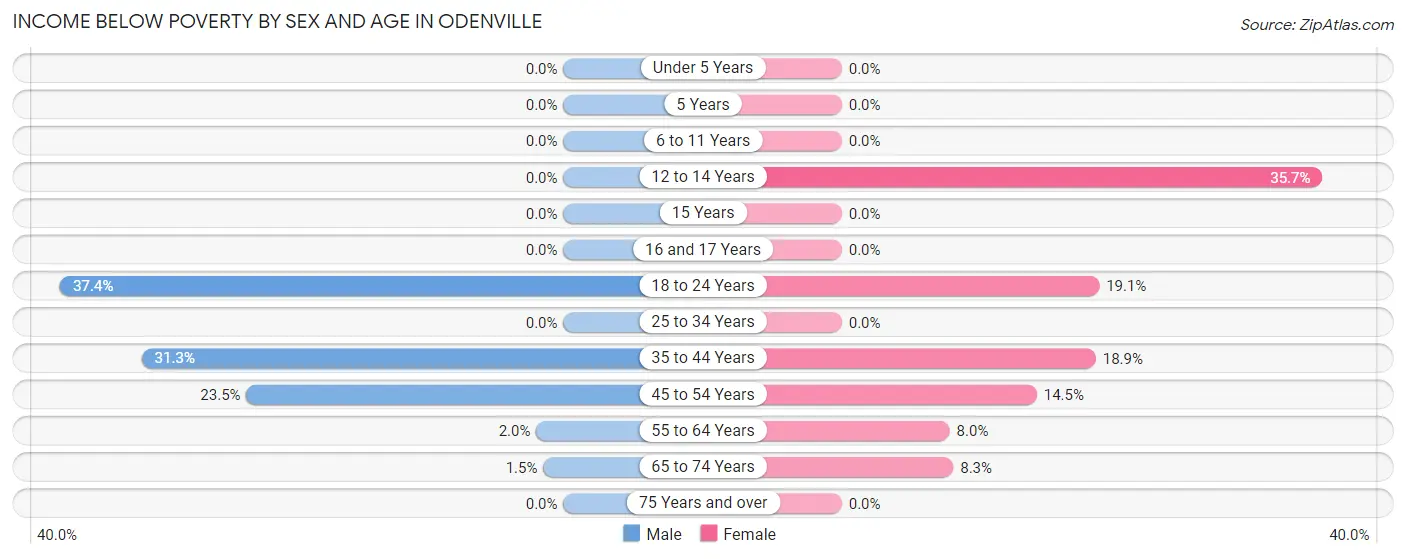
Income Below Poverty by Sex and Age in Odenville
With 10.8% poverty level for males and 9.9% for females among the residents of Odenville, 18 to 24 year old males and 12 to 14 year old females are the most vulnerable to poverty, with 71 males (37.4%) and 56 females (35.7%) in their respective age groups living below the poverty level.
| Age Bracket | Male | Female |
| Under 5 Years | 0 (0.0%) | 0 (0.0%) |
| 5 Years | 0 (0.0%) | 0 (0.0%) |
| 6 to 11 Years | 0 (0.0%) | 0 (0.0%) |
| 12 to 14 Years | 0 (0.0%) | 56 (35.7%) |
| 15 Years | 0 (0.0%) | 0 (0.0%) |
| 16 and 17 Years | 0 (0.0%) | 0 (0.0%) |
| 18 to 24 Years | 71 (37.4%) | 30 (19.1%) |
| 25 to 34 Years | 0 (0.0%) | 0 (0.0%) |
| 35 to 44 Years | 98 (31.3%) | 99 (18.9%) |
| 45 to 54 Years | 68 (23.5%) | 32 (14.5%) |
| 55 to 64 Years | 6 (2.0%) | 23 (8.0%) |
| 65 to 74 Years | 2 (1.5%) | 14 (8.3%) |
| 75 Years and over | 0 (0.0%) | 0 (0.0%) |
| Total | 245 (10.8%) | 254 (9.9%) |
Income Above Poverty by Sex and Age in Odenville
According to the poverty statistics in Odenville, males aged under 5 years and females aged under 5 years are the age groups that are most secure financially, with 100.0% of males and 100.0% of females in these age groups living above the poverty line.
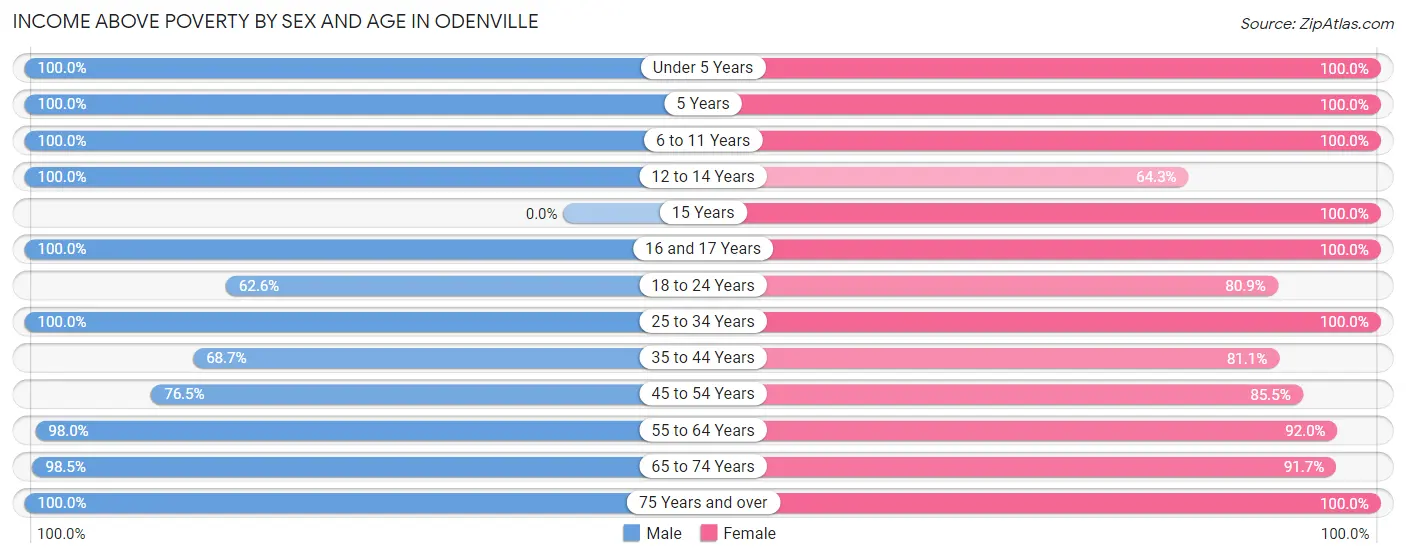
| Age Bracket | Male | Female |
| Under 5 Years | 180 (100.0%) | 177 (100.0%) |
| 5 Years | 54 (100.0%) | 11 (100.0%) |
| 6 to 11 Years | 68 (100.0%) | 292 (100.0%) |
| 12 to 14 Years | 114 (100.0%) | 101 (64.3%) |
| 15 Years | 0 (0.0%) | 12 (100.0%) |
| 16 and 17 Years | 68 (100.0%) | 113 (100.0%) |
| 18 to 24 Years | 119 (62.6%) | 127 (80.9%) |
| 25 to 34 Years | 412 (100.0%) | 341 (100.0%) |
| 35 to 44 Years | 215 (68.7%) | 426 (81.1%) |
| 45 to 54 Years | 221 (76.5%) | 189 (85.5%) |
| 55 to 64 Years | 292 (98.0%) | 264 (92.0%) |
| 65 to 74 Years | 132 (98.5%) | 155 (91.7%) |
| 75 Years and over | 147 (100.0%) | 117 (100.0%) |
| Total | 2,022 (89.2%) | 2,325 (90.1%) |
Income Below Poverty Among Married-Couple Families in Odenville
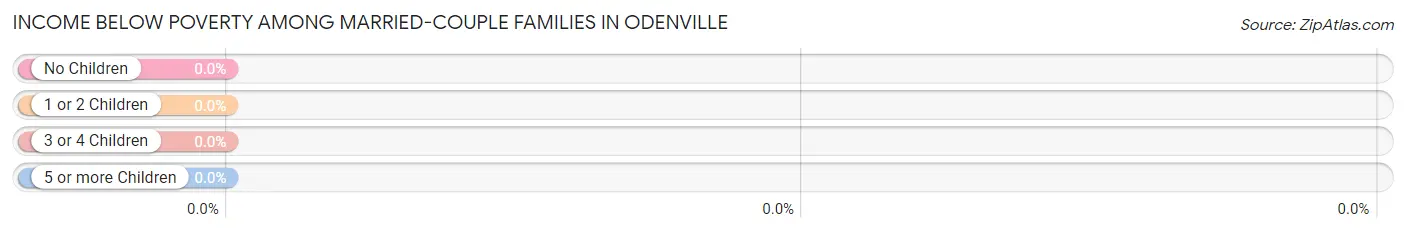
| Children | Above Poverty | Below Poverty |
| No Children | 453 (100.0%) | 0 (0.0%) |
| 1 or 2 Children | 452 (100.0%) | 0 (0.0%) |
| 3 or 4 Children | 137 (100.0%) | 0 (0.0%) |
| 5 or more Children | 0 (0.0%) | 0 (0.0%) |
| Total | 1,042 (100.0%) | 0 (0.0%) |
Income Below Poverty Among Single-Parent Households in Odenville
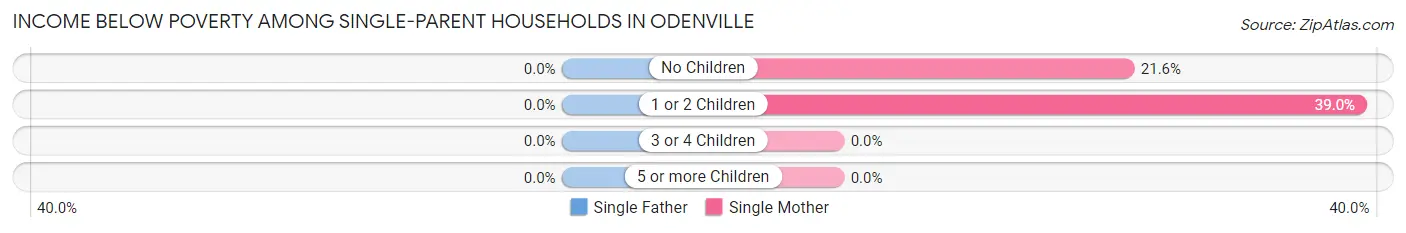
| Children | Single Father | Single Mother |
| No Children | 0 (0.0%) | 32 (21.6%) |
| 1 or 2 Children | 0 (0.0%) | 99 (39.0%) |
| 3 or 4 Children | 0 (0.0%) | 0 (0.0%) |
| 5 or more Children | 0 (0.0%) | 0 (0.0%) |
| Total | 0 (0.0%) | 131 (32.6%) |
Income Below Poverty Among Married-Couple vs Single-Parent Households in Odenville
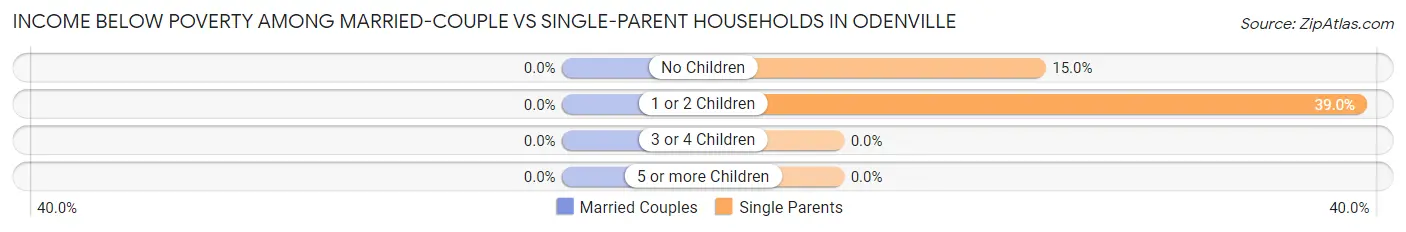
| Children | Married-Couple Families | Single-Parent Households |
| No Children | 0 (0.0%) | 32 (15.0%) |
| 1 or 2 Children | 0 (0.0%) | 99 (39.0%) |
| 3 or 4 Children | 0 (0.0%) | 0 (0.0%) |
| 5 or more Children | 0 (0.0%) | 0 (0.0%) |
| Total | 0 (0.0%) | 131 (28.1%) |
Employment Characteristics in Odenville
Employment by Class of Employer in Odenville
Among the 2,303 employed individuals in Odenville, private company employees (1,695 | 73.6%), self-employed (not incorporated) (162 | 7.0%), and local government employees (144 | 6.2%) make up the most common classes of employment.
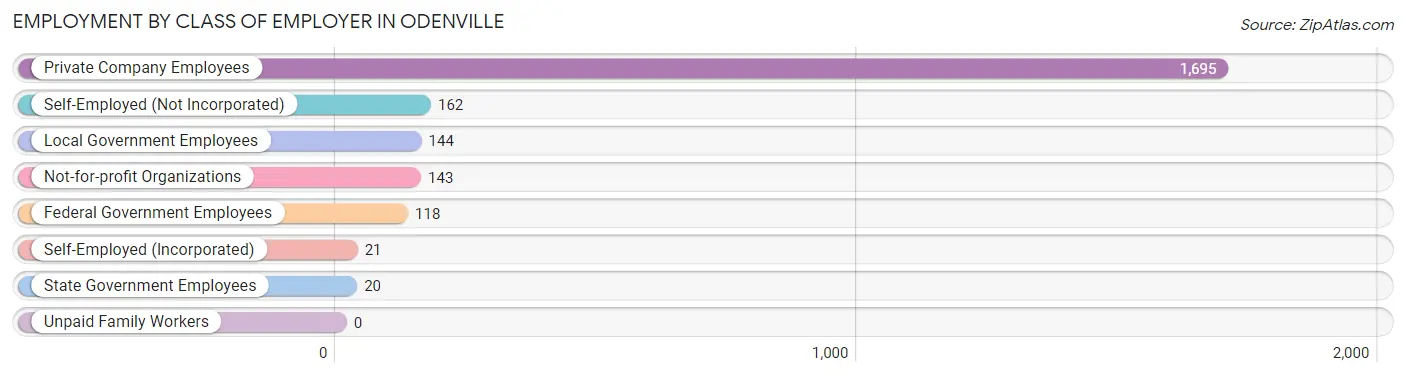
| Employer Class | # Employees | % Employees |
| Private Company Employees | 1,695 | 73.6% |
| Self-Employed (Incorporated) | 21 | 0.9% |
| Self-Employed (Not Incorporated) | 162 | 7.0% |
| Not-for-profit Organizations | 143 | 6.2% |
| Local Government Employees | 144 | 6.2% |
| State Government Employees | 20 | 0.9% |
| Federal Government Employees | 118 | 5.1% |
| Unpaid Family Workers | 0 | 0.0% |
| Total | 2,303 | 100.0% |
Employment Status by Age in Odenville
According to the labor force statistics for Odenville, out of the total population over 16 years of age (3,781), 62.8% or 2,374 individuals are in the labor force, with 2.6% or 62 of them unemployed. The age group with the highest labor force participation rate is 30 to 34 years, with 96.6% or 375 individuals in the labor force. Within the labor force, the 20 to 24 years age range has the highest percentage of unemployed individuals, with 17.2% or 29 of them being unemployed.
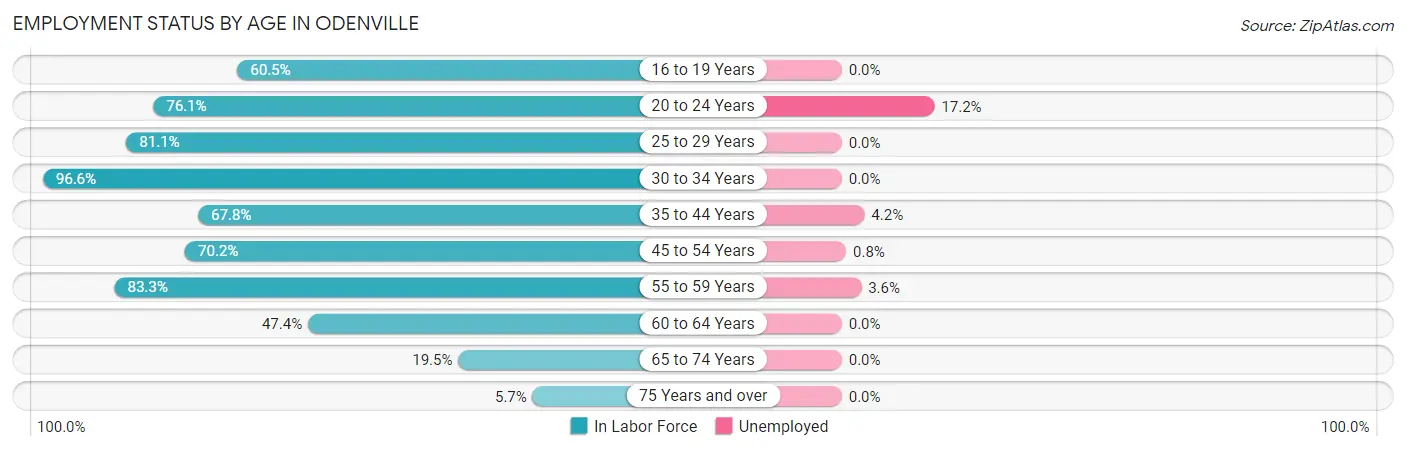
| Age Bracket | In Labor Force | Unemployed |
| 16 to 19 Years | 185 (60.5%) | 0 (0.0%) |
| 20 to 24 Years | 169 (76.1%) | 29 (17.2%) |
| 25 to 29 Years | 296 (81.1%) | 0 (0.0%) |
| 30 to 34 Years | 375 (96.6%) | 0 (0.0%) |
| 35 to 44 Years | 568 (67.8%) | 24 (4.2%) |
| 45 to 54 Years | 358 (70.2%) | 3 (0.8%) |
| 55 to 59 Years | 169 (83.3%) | 6 (3.6%) |
| 60 to 64 Years | 181 (47.4%) | 0 (0.0%) |
| 65 to 74 Years | 59 (19.5%) | 0 (0.0%) |
| 75 Years and over | 15 (5.7%) | 0 (0.0%) |
| Total | 2,374 (62.8%) | 62 (2.6%) |
Employment Status by Educational Attainment in Odenville
According to labor force statistics for Odenville, 72.5% of individuals (1,947) out of the total population between 25 and 64 years of age (2,686) are in the labor force, with 1.7% or 33 of them being unemployed. The group with the highest labor force participation rate are those with the educational attainment of bachelor's degree or higher, with 91.0% or 474 individuals in the labor force. Within the labor force, individuals with high school diploma education have the highest percentage of unemployment, with 4.8% or 31 of them being unemployed.
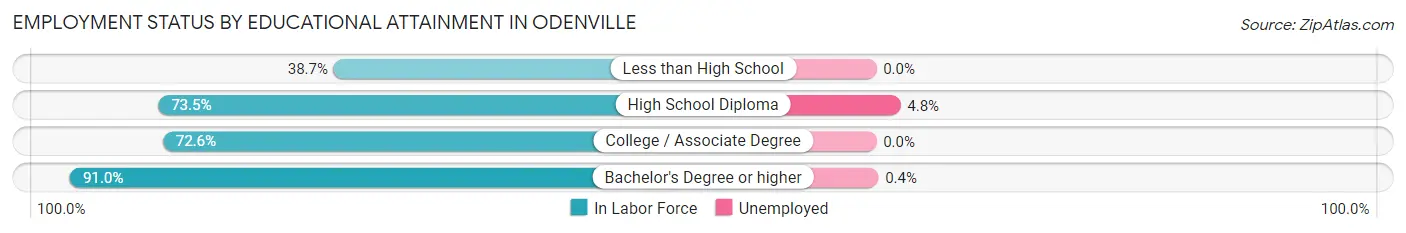
| Educational Attainment | In Labor Force | Unemployed |
| Less than High School | 122 (38.7%) | 0 (0.0%) |
| High School Diploma | 651 (73.5%) | 43 (4.8%) |
| College / Associate Degree | 700 (72.6%) | 0 (0.0%) |
| Bachelor's Degree or higher | 474 (91.0%) | 2 (0.4%) |
| Total | 1,947 (72.5%) | 46 (1.7%) |
Employment Occupations by Sex in Odenville
Management, Business, Science and Arts Occupations
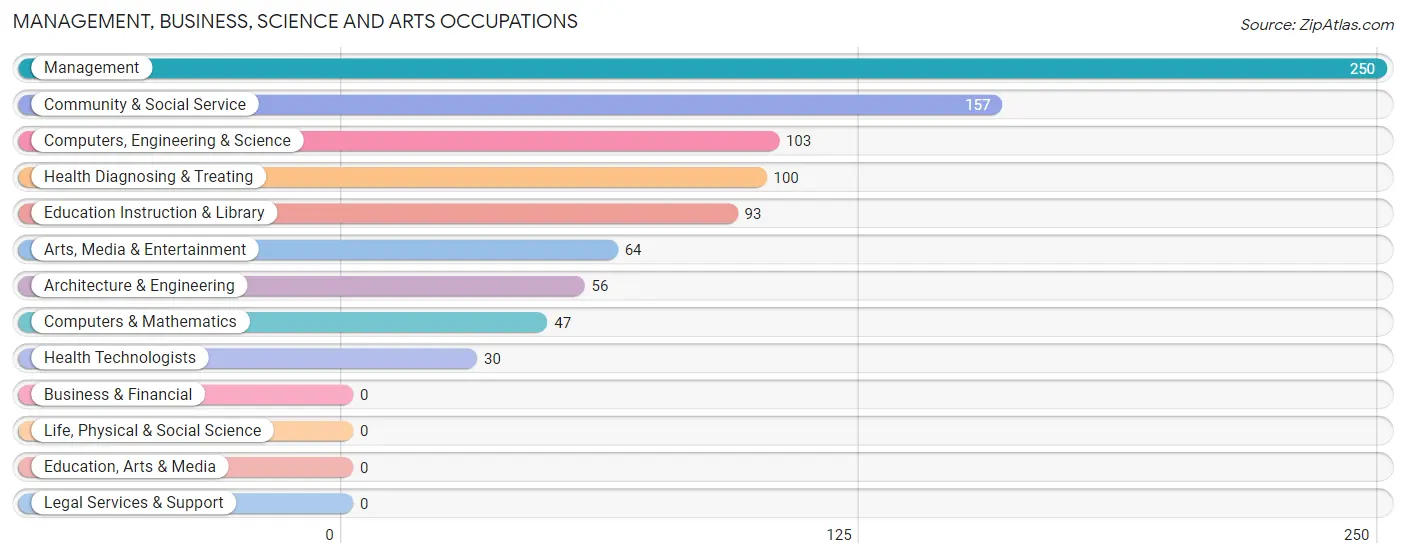
The most common Management, Business, Science and Arts occupations in Odenville are Management (250 | 10.8%), Community & Social Service (157 | 6.8%), Computers, Engineering & Science (103 | 4.4%), Health Diagnosing & Treating (100 | 4.3%), and Education Instruction & Library (93 | 4.0%).
Management, Business, Science and Arts Occupations by Sex
Within the Management, Business, Science and Arts occupations in Odenville, the most male-oriented occupations are Architecture & Engineering (100.0%), Computers, Engineering & Science (93.2%), and Computers & Mathematics (85.1%), while the most female-oriented occupations are Arts, Media & Entertainment (100.0%), Health Technologists (100.0%), and Community & Social Service (90.4%).
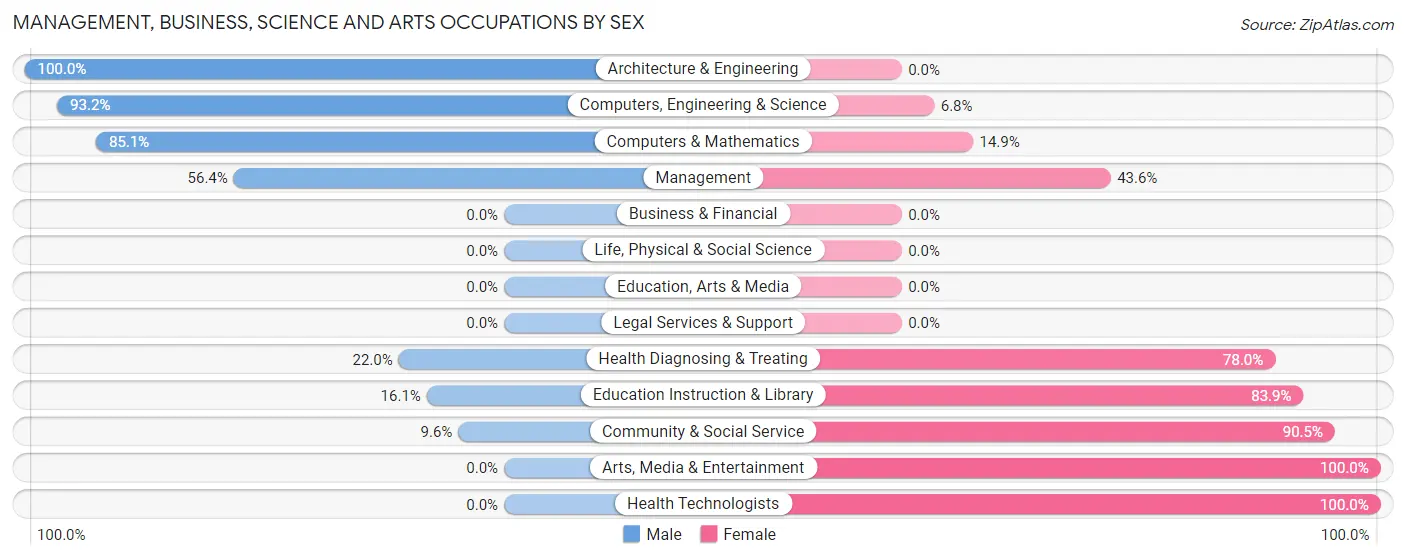
| Occupation | Male | Female |
| Management | 141 (56.4%) | 109 (43.6%) |
| Business & Financial | 0 (0.0%) | 0 (0.0%) |
| Computers, Engineering & Science | 96 (93.2%) | 7 (6.8%) |
| Computers & Mathematics | 40 (85.1%) | 7 (14.9%) |
| Architecture & Engineering | 56 (100.0%) | 0 (0.0%) |
| Life, Physical & Social Science | 0 (0.0%) | 0 (0.0%) |
| Community & Social Service | 15 (9.6%) | 142 (90.4%) |
| Education, Arts & Media | 0 (0.0%) | 0 (0.0%) |
| Legal Services & Support | 0 (0.0%) | 0 (0.0%) |
| Education Instruction & Library | 15 (16.1%) | 78 (83.9%) |
| Arts, Media & Entertainment | 0 (0.0%) | 64 (100.0%) |
| Health Diagnosing & Treating | 22 (22.0%) | 78 (78.0%) |
| Health Technologists | 0 (0.0%) | 30 (100.0%) |
| Total (Category) | 274 (44.9%) | 336 (55.1%) |
| Total (Overall) | 1,114 (48.2%) | 1,199 (51.8%) |
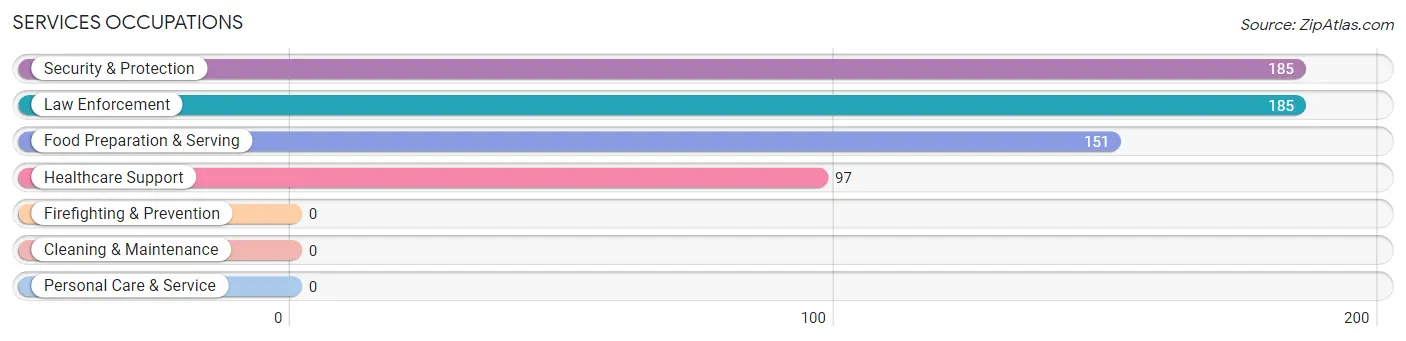
Services Occupations
The most common Services occupations in Odenville are Security & Protection (185 | 8.0%), Law Enforcement (185 | 8.0%), Food Preparation & Serving (151 | 6.5%), and Healthcare Support (97 | 4.2%).
Services Occupations by Sex
Within the Services occupations in Odenville, the most male-oriented occupations are Security & Protection (100.0%), Law Enforcement (100.0%), and Food Preparation & Serving (8.0%), while the most female-oriented occupations are Healthcare Support (100.0%), and Food Preparation & Serving (92.0%).
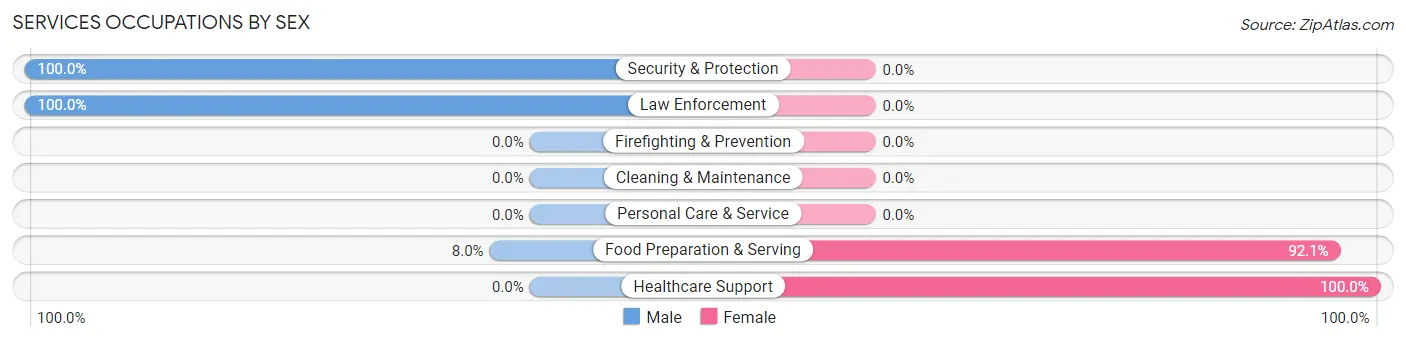
| Occupation | Male | Female |
| Healthcare Support | 0 (0.0%) | 97 (100.0%) |
| Security & Protection | 185 (100.0%) | 0 (0.0%) |
| Firefighting & Prevention | 0 (0.0%) | 0 (0.0%) |
| Law Enforcement | 185 (100.0%) | 0 (0.0%) |
| Food Preparation & Serving | 12 (8.0%) | 139 (92.0%) |
| Cleaning & Maintenance | 0 (0.0%) | 0 (0.0%) |
| Personal Care & Service | 0 (0.0%) | 0 (0.0%) |
| Total (Category) | 197 (45.5%) | 236 (54.5%) |
| Total (Overall) | 1,114 (48.2%) | 1,199 (51.8%) |
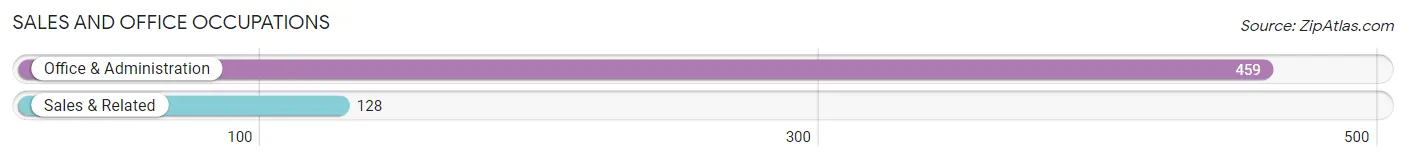
Sales and Office Occupations
The most common Sales and Office occupations in Odenville are Office & Administration (459 | 19.8%), and Sales & Related (128 | 5.5%).
Sales and Office Occupations by Sex
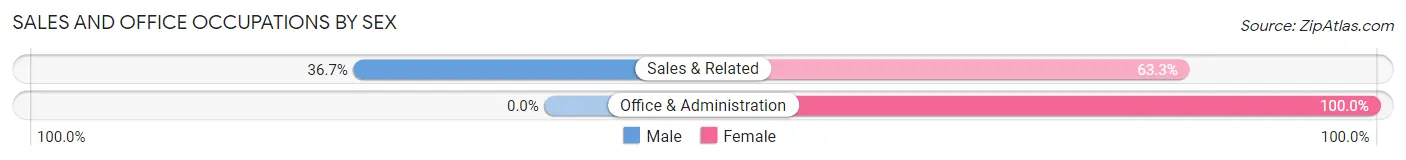
| Occupation | Male | Female |
| Sales & Related | 47 (36.7%) | 81 (63.3%) |
| Office & Administration | 0 (0.0%) | 459 (100.0%) |
| Total (Category) | 47 (8.0%) | 540 (92.0%) |
| Total (Overall) | 1,114 (48.2%) | 1,199 (51.8%) |
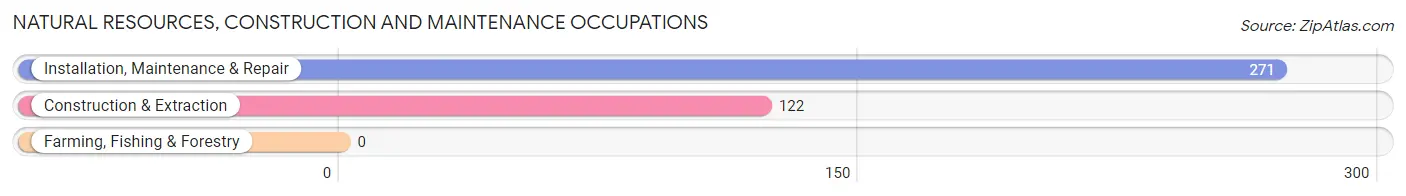
Natural Resources, Construction and Maintenance Occupations
The most common Natural Resources, Construction and Maintenance occupations in Odenville are Installation, Maintenance & Repair (271 | 11.7%), and Construction & Extraction (122 | 5.3%).
Natural Resources, Construction and Maintenance Occupations by Sex
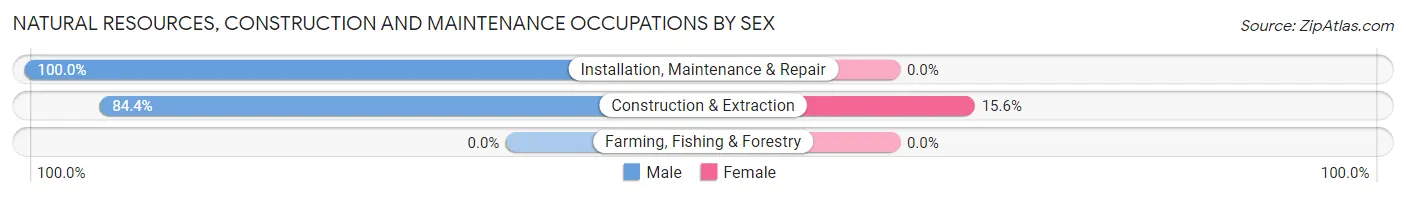
| Occupation | Male | Female |
| Farming, Fishing & Forestry | 0 (0.0%) | 0 (0.0%) |
| Construction & Extraction | 103 (84.4%) | 19 (15.6%) |
| Installation, Maintenance & Repair | 271 (100.0%) | 0 (0.0%) |
| Total (Category) | 374 (95.2%) | 19 (4.8%) |
| Total (Overall) | 1,114 (48.2%) | 1,199 (51.8%) |
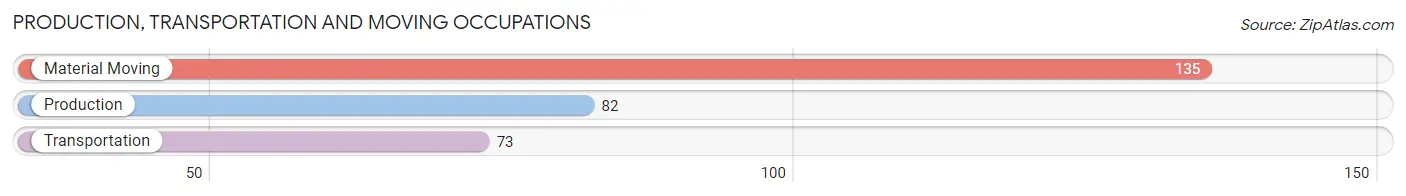
Production, Transportation and Moving Occupations
The most common Production, Transportation and Moving occupations in Odenville are Material Moving (135 | 5.8%), Production (82 | 3.5%), and Transportation (73 | 3.2%).
Production, Transportation and Moving Occupations by Sex
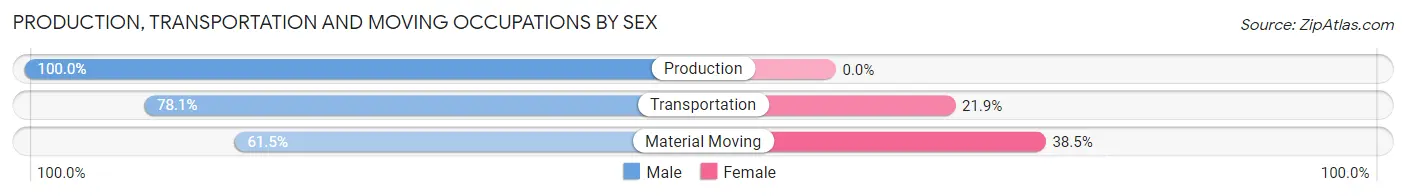
| Occupation | Male | Female |
| Production | 82 (100.0%) | 0 (0.0%) |
| Transportation | 57 (78.1%) | 16 (21.9%) |
| Material Moving | 83 (61.5%) | 52 (38.5%) |
| Total (Category) | 222 (76.5%) | 68 (23.4%) |
| Total (Overall) | 1,114 (48.2%) | 1,199 (51.8%) |
Employment Industries by Sex in Odenville
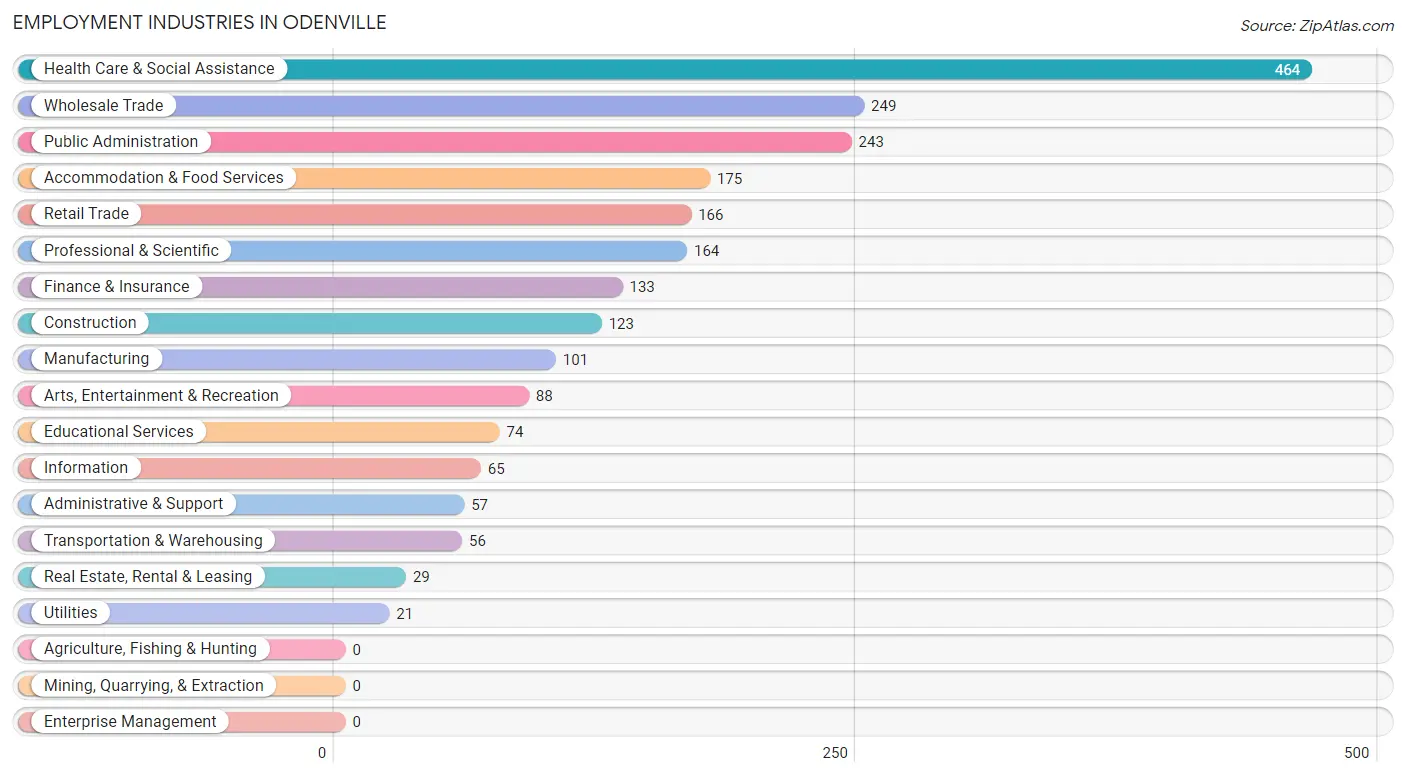
Employment Industries in Odenville
The major employment industries in Odenville include Health Care & Social Assistance (464 | 20.1%), Wholesale Trade (249 | 10.8%), Public Administration (243 | 10.5%), Accommodation & Food Services (175 | 7.6%), and Retail Trade (166 | 7.2%).
Employment Industries by Sex in Odenville
The Odenville industries that see more men than women are Manufacturing (100.0%), Utilities (100.0%), and Information (100.0%), whereas the industries that tend to have a higher number of women are Administrative & Support (100.0%), Educational Services (100.0%), and Health Care & Social Assistance (95.3%).
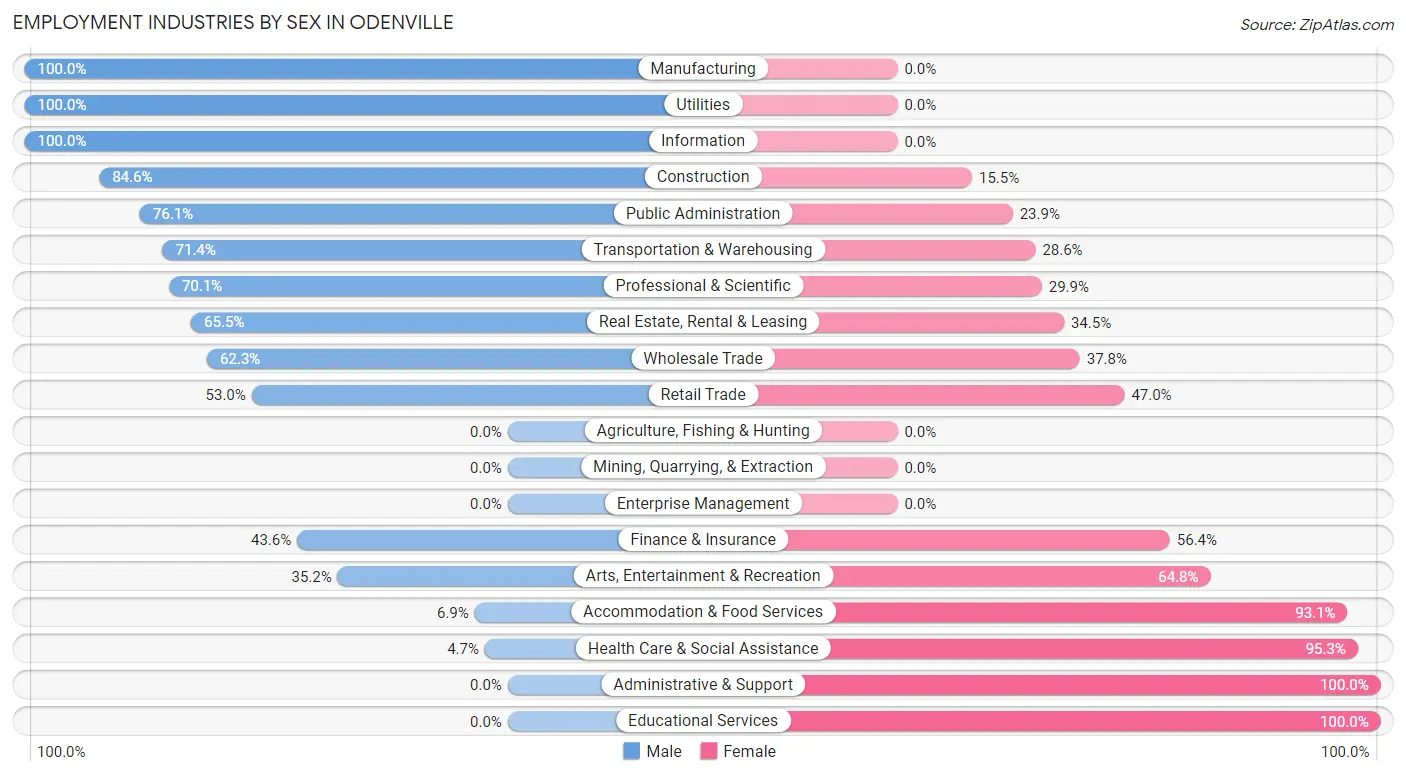
| Industry | Male | Female |
| Agriculture, Fishing & Hunting | 0 (0.0%) | 0 (0.0%) |
| Mining, Quarrying, & Extraction | 0 (0.0%) | 0 (0.0%) |
| Construction | 104 (84.6%) | 19 (15.4%) |
| Manufacturing | 101 (100.0%) | 0 (0.0%) |
| Wholesale Trade | 155 (62.3%) | 94 (37.8%) |
| Retail Trade | 88 (53.0%) | 78 (47.0%) |
| Transportation & Warehousing | 40 (71.4%) | 16 (28.6%) |
| Utilities | 21 (100.0%) | 0 (0.0%) |
| Information | 65 (100.0%) | 0 (0.0%) |
| Finance & Insurance | 58 (43.6%) | 75 (56.4%) |
| Real Estate, Rental & Leasing | 19 (65.5%) | 10 (34.5%) |
| Professional & Scientific | 115 (70.1%) | 49 (29.9%) |
| Enterprise Management | 0 (0.0%) | 0 (0.0%) |
| Administrative & Support | 0 (0.0%) | 57 (100.0%) |
| Educational Services | 0 (0.0%) | 74 (100.0%) |
| Health Care & Social Assistance | 22 (4.7%) | 442 (95.3%) |
| Arts, Entertainment & Recreation | 31 (35.2%) | 57 (64.8%) |
| Accommodation & Food Services | 12 (6.9%) | 163 (93.1%) |
| Public Administration | 185 (76.1%) | 58 (23.9%) |
| Total | 1,114 (48.2%) | 1,199 (51.8%) |
Education in Odenville
School Enrollment in Odenville
The most common levels of schooling among the 1,236 students in Odenville are high school (401 | 32.4%), elementary school (296 | 23.9%), and middle school (232 | 18.8%).
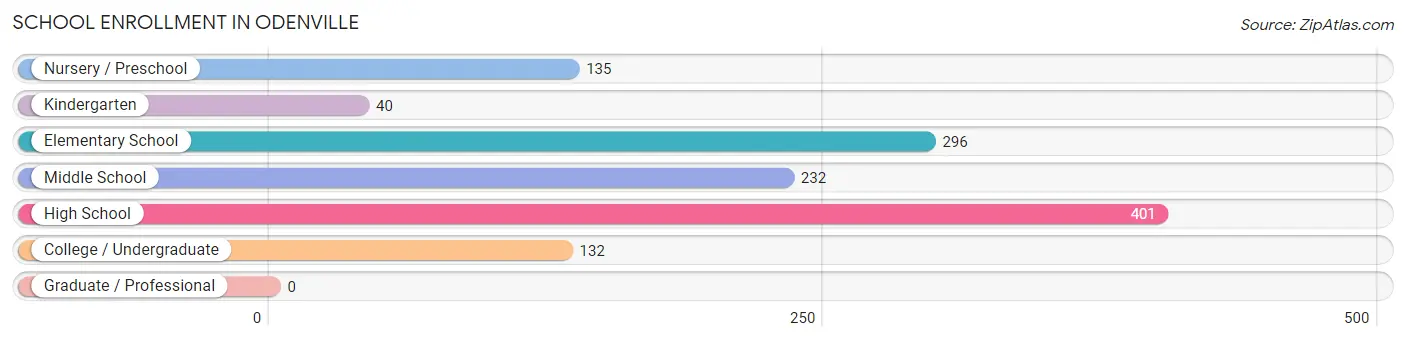
| School Level | # Students | % Students |
| Nursery / Preschool | 135 | 10.9% |
| Kindergarten | 40 | 3.2% |
| Elementary School | 296 | 23.9% |
| Middle School | 232 | 18.8% |
| High School | 401 | 32.4% |
| College / Undergraduate | 132 | 10.7% |
| Graduate / Professional | 0 | 0.0% |
| Total | 1,236 | 100.0% |
School Enrollment by Age by Funding Source in Odenville
Out of a total of 1,236 students who are enrolled in schools in Odenville, 355 (28.7%) attend a private institution, while the remaining 881 (71.3%) are enrolled in public schools. The age group of 15 to 17 year olds has the highest likelihood of being enrolled in private schools, with 136 (70.5% in the age bracket) enrolled. Conversely, the age group of 10 to 14 year olds has the lowest likelihood of being enrolled in a private school, with 379 (100.0% in the age bracket) attending a public institution.
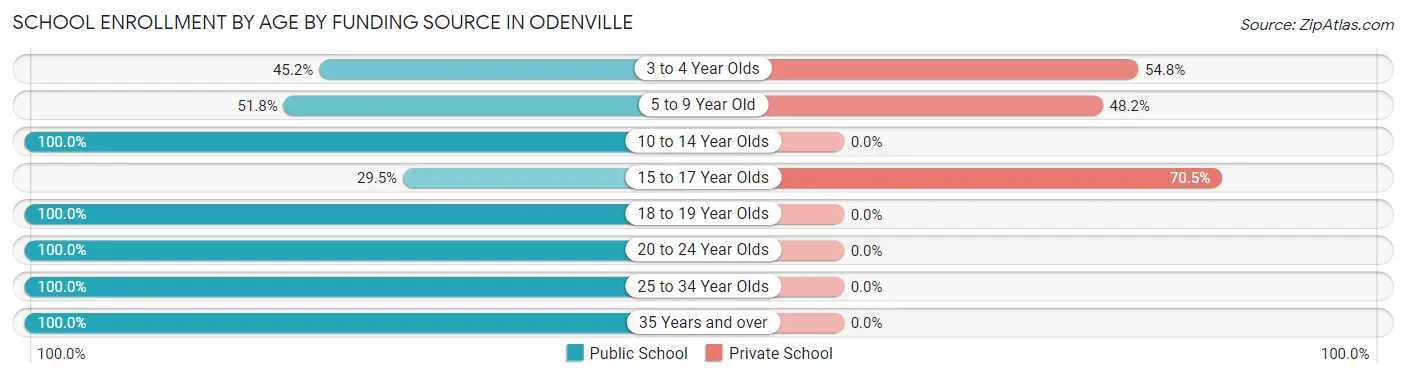
| Age Bracket | Public School | Private School |
| 3 to 4 Year Olds | 56 (45.2%) | 68 (54.8%) |
| 5 to 9 Year Old | 162 (51.8%) | 151 (48.2%) |
| 10 to 14 Year Olds | 379 (100.0%) | 0 (0.0%) |
| 15 to 17 Year Olds | 57 (29.5%) | 136 (70.5%) |
| 18 to 19 Year Olds | 95 (100.0%) | 0 (0.0%) |
| 20 to 24 Year Olds | 27 (100.0%) | 0 (0.0%) |
| 25 to 34 Year Olds | 65 (100.0%) | 0 (0.0%) |
| 35 Years and over | 40 (100.0%) | 0 (0.0%) |
| Total | 881 (71.3%) | 355 (28.7%) |
Educational Attainment by Field of Study in Odenville
Arts & humanities (156 | 23.4%), education (89 | 13.3%), visual & performing arts (79 | 11.8%), business (76 | 11.4%), and computers & mathematics (61 | 9.1%) are the most common fields of study among 667 individuals in Odenville who have obtained a bachelor's degree or higher.
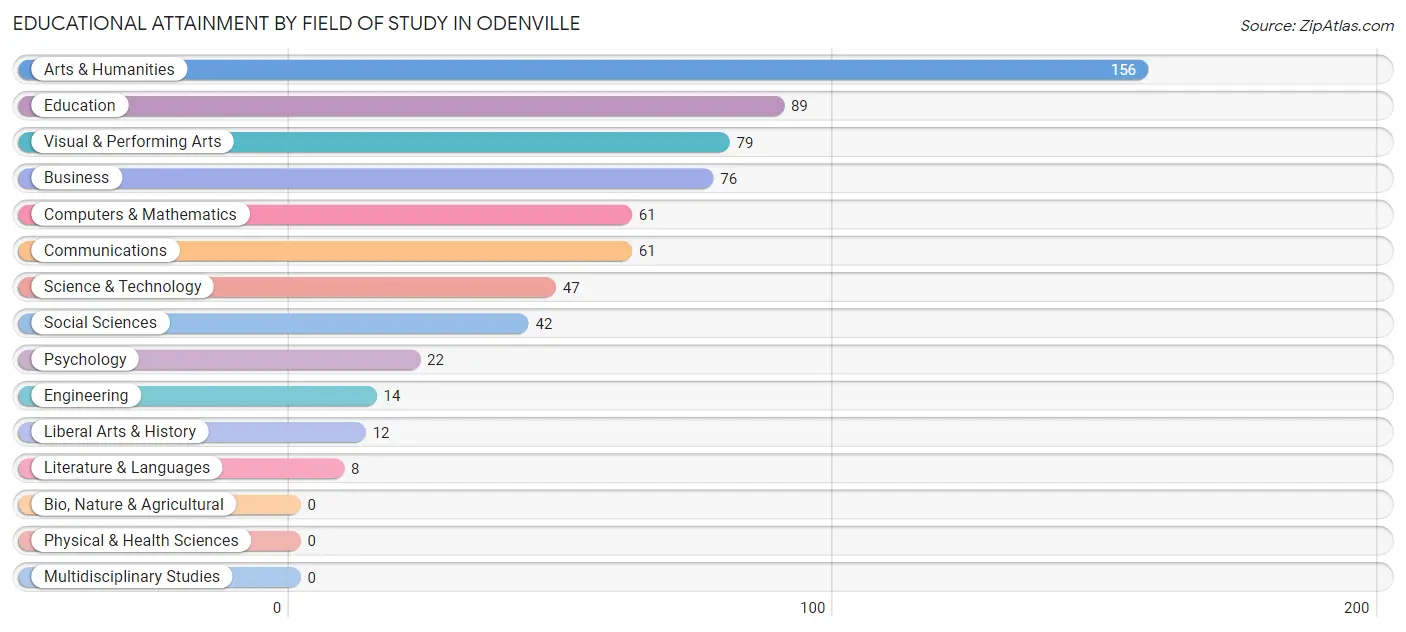
| Field of Study | # Graduates | % Graduates |
| Computers & Mathematics | 61 | 9.1% |
| Bio, Nature & Agricultural | 0 | 0.0% |
| Physical & Health Sciences | 0 | 0.0% |
| Psychology | 22 | 3.3% |
| Social Sciences | 42 | 6.3% |
| Engineering | 14 | 2.1% |
| Multidisciplinary Studies | 0 | 0.0% |
| Science & Technology | 47 | 7.0% |
| Business | 76 | 11.4% |
| Education | 89 | 13.3% |
| Literature & Languages | 8 | 1.2% |
| Liberal Arts & History | 12 | 1.8% |
| Visual & Performing Arts | 79 | 11.8% |
| Communications | 61 | 9.1% |
| Arts & Humanities | 156 | 23.4% |
| Total | 667 | 100.0% |
Transportation & Commute in Odenville
Vehicle Availability by Sex in Odenville
The most prevalent vehicle ownership categories in Odenville are males with 2 vehicles (491, accounting for 44.1%) and females with 2 vehicles (655, making up 41.3%).
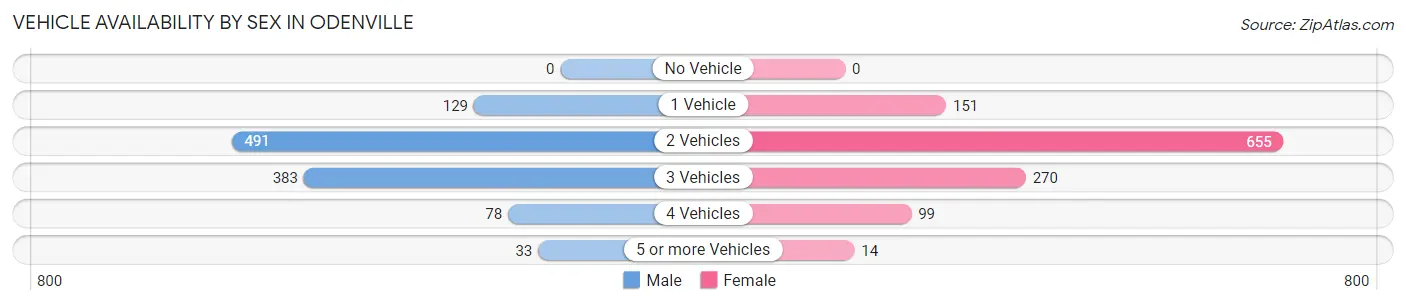
| Vehicles Available | Male | Female |
| No Vehicle | 0 (0.0%) | 0 (0.0%) |
| 1 Vehicle | 129 (11.6%) | 151 (12.7%) |
| 2 Vehicles | 491 (44.1%) | 655 (55.1%) |
| 3 Vehicles | 383 (34.4%) | 270 (22.7%) |
| 4 Vehicles | 78 (7.0%) | 99 (8.3%) |
| 5 or more Vehicles | 33 (3.0%) | 14 (1.2%) |
| Total | 1,114 (100.0%) | 1,189 (100.0%) |
Commute Time in Odenville
The most frequently occuring commute durations in Odenville are 45 to 59 minutes (525 commuters, 23.4%), 40 to 44 minutes (435 commuters, 19.4%), and 20 to 24 minutes (308 commuters, 13.7%).
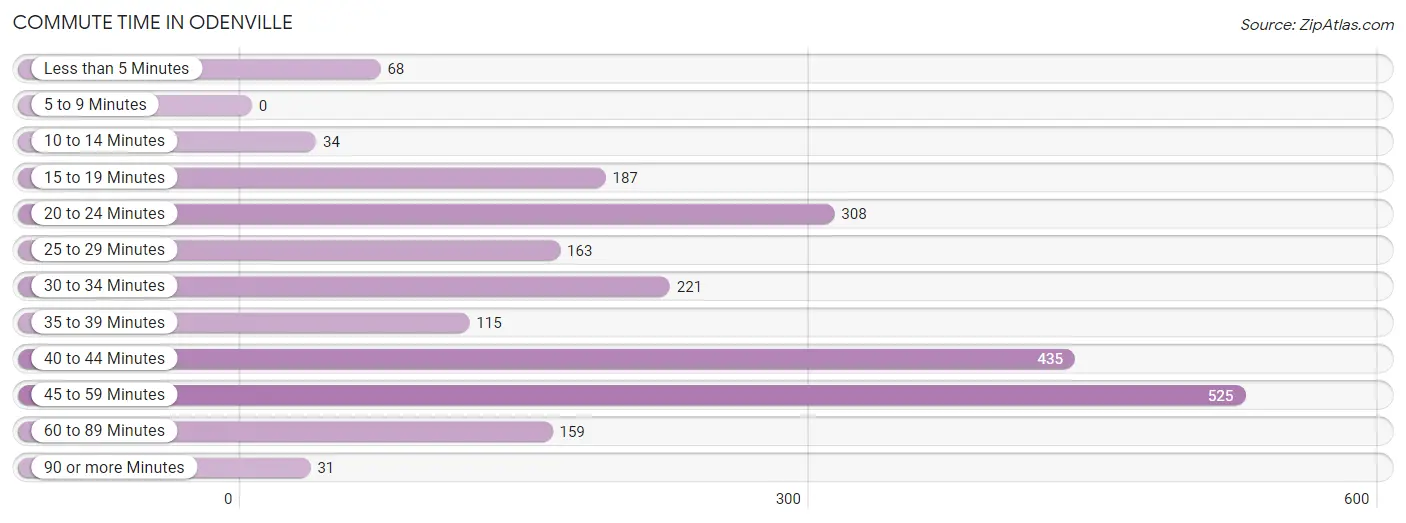
| Commute Time | # Commuters | % Commuters |
| Less than 5 Minutes | 68 | 3.0% |
| 5 to 9 Minutes | 0 | 0.0% |
| 10 to 14 Minutes | 34 | 1.5% |
| 15 to 19 Minutes | 187 | 8.3% |
| 20 to 24 Minutes | 308 | 13.7% |
| 25 to 29 Minutes | 163 | 7.3% |
| 30 to 34 Minutes | 221 | 9.8% |
| 35 to 39 Minutes | 115 | 5.1% |
| 40 to 44 Minutes | 435 | 19.4% |
| 45 to 59 Minutes | 525 | 23.4% |
| 60 to 89 Minutes | 159 | 7.1% |
| 90 or more Minutes | 31 | 1.4% |
Commute Time by Sex in Odenville
The most common commute times in Odenville are 40 to 44 minutes (300 commuters, 26.9%) for males and 45 to 59 minutes (250 commuters, 22.1%) for females.
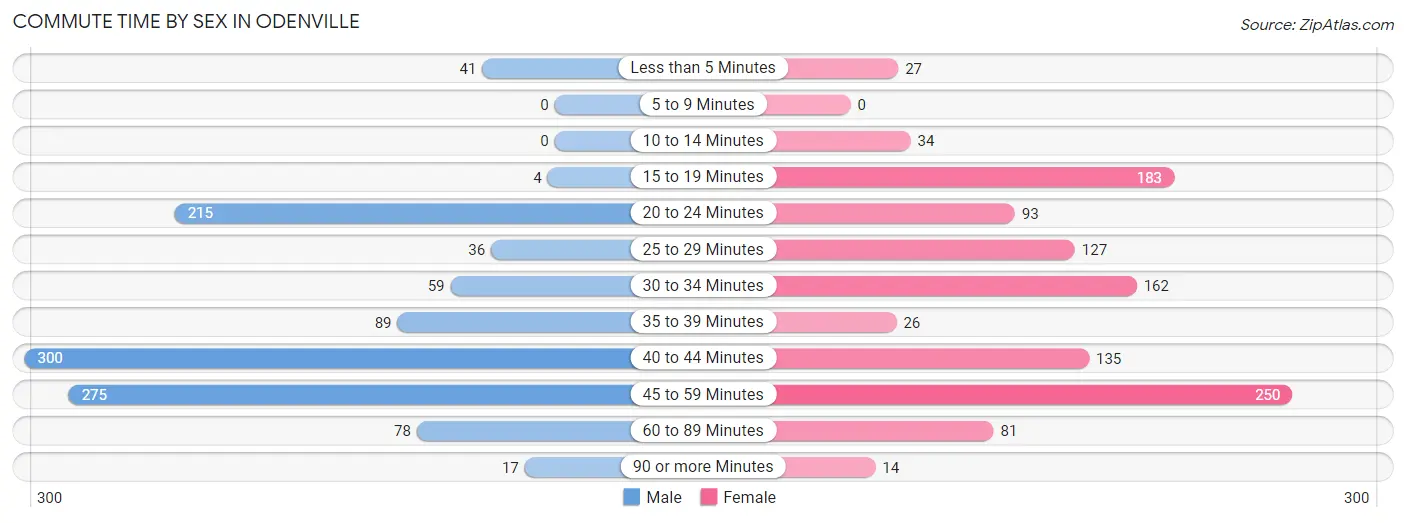
| Commute Time | Male | Female |
| Less than 5 Minutes | 41 (3.7%) | 27 (2.4%) |
| 5 to 9 Minutes | 0 (0.0%) | 0 (0.0%) |
| 10 to 14 Minutes | 0 (0.0%) | 34 (3.0%) |
| 15 to 19 Minutes | 4 (0.4%) | 183 (16.2%) |
| 20 to 24 Minutes | 215 (19.3%) | 93 (8.2%) |
| 25 to 29 Minutes | 36 (3.2%) | 127 (11.2%) |
| 30 to 34 Minutes | 59 (5.3%) | 162 (14.3%) |
| 35 to 39 Minutes | 89 (8.0%) | 26 (2.3%) |
| 40 to 44 Minutes | 300 (26.9%) | 135 (11.9%) |
| 45 to 59 Minutes | 275 (24.7%) | 250 (22.1%) |
| 60 to 89 Minutes | 78 (7.0%) | 81 (7.2%) |
| 90 or more Minutes | 17 (1.5%) | 14 (1.2%) |
Time of Departure to Work by Sex in Odenville
The most frequent times of departure to work in Odenville are 6:30 AM to 6:59 AM (286, 25.7%) for males and 7:00 AM to 7:29 AM (269, 23.8%) for females.
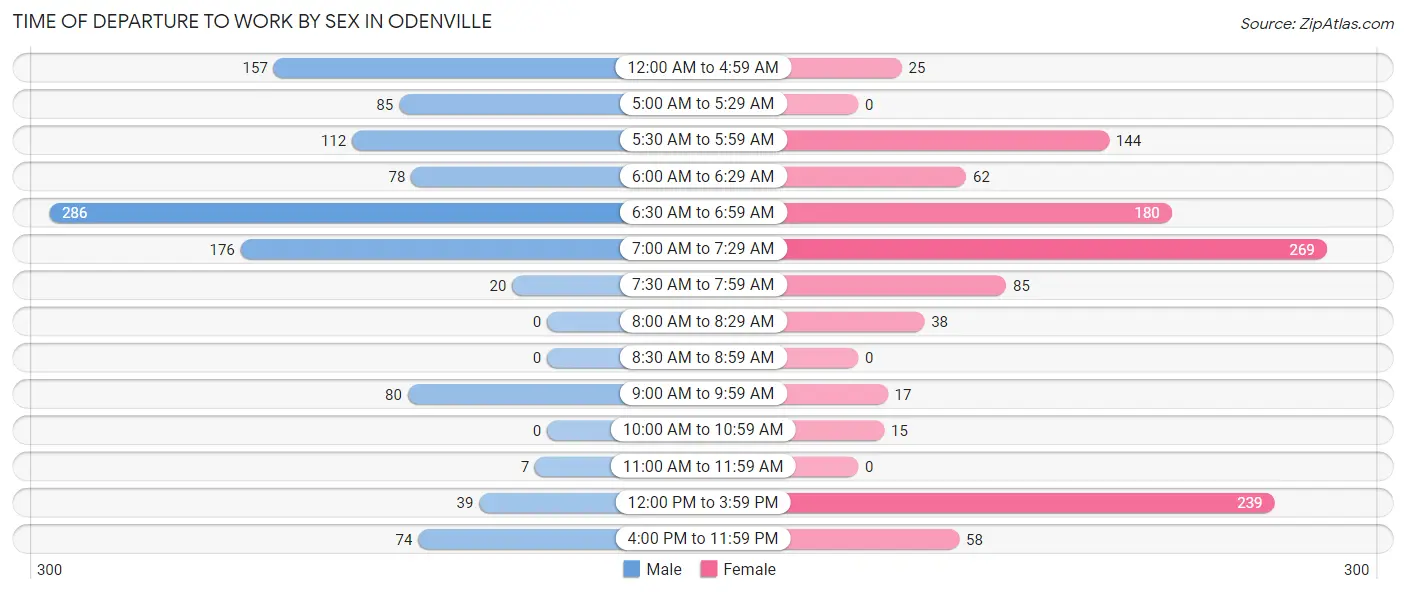
| Time of Departure | Male | Female |
| 12:00 AM to 4:59 AM | 157 (14.1%) | 25 (2.2%) |
| 5:00 AM to 5:29 AM | 85 (7.6%) | 0 (0.0%) |
| 5:30 AM to 5:59 AM | 112 (10.1%) | 144 (12.7%) |
| 6:00 AM to 6:29 AM | 78 (7.0%) | 62 (5.5%) |
| 6:30 AM to 6:59 AM | 286 (25.7%) | 180 (15.9%) |
| 7:00 AM to 7:29 AM | 176 (15.8%) | 269 (23.8%) |
| 7:30 AM to 7:59 AM | 20 (1.8%) | 85 (7.5%) |
| 8:00 AM to 8:29 AM | 0 (0.0%) | 38 (3.4%) |
| 8:30 AM to 8:59 AM | 0 (0.0%) | 0 (0.0%) |
| 9:00 AM to 9:59 AM | 80 (7.2%) | 17 (1.5%) |
| 10:00 AM to 10:59 AM | 0 (0.0%) | 15 (1.3%) |
| 11:00 AM to 11:59 AM | 7 (0.6%) | 0 (0.0%) |
| 12:00 PM to 3:59 PM | 39 (3.5%) | 239 (21.1%) |
| 4:00 PM to 11:59 PM | 74 (6.6%) | 58 (5.1%) |
| Total | 1,114 (100.0%) | 1,132 (100.0%) |
Housing Occupancy in Odenville
Occupancy by Ownership in Odenville
Of the total 1,853 dwellings in Odenville, owner-occupied units account for 1,787 (96.4%), while renter-occupied units make up 66 (3.6%).
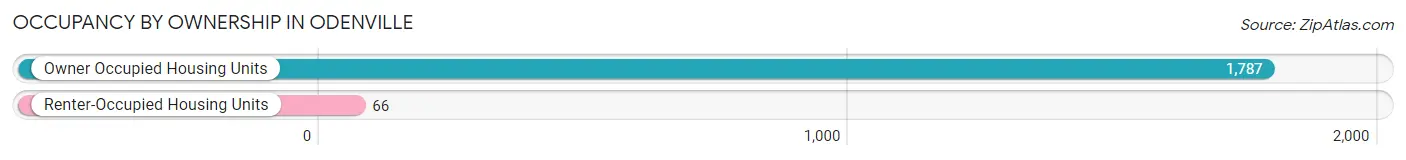
| Occupancy | # Housing Units | % Housing Units |
| Owner Occupied Housing Units | 1,787 | 96.4% |
| Renter-Occupied Housing Units | 66 | 3.6% |
| Total Occupied Housing Units | 1,853 | 100.0% |
Occupancy by Household Size in Odenville
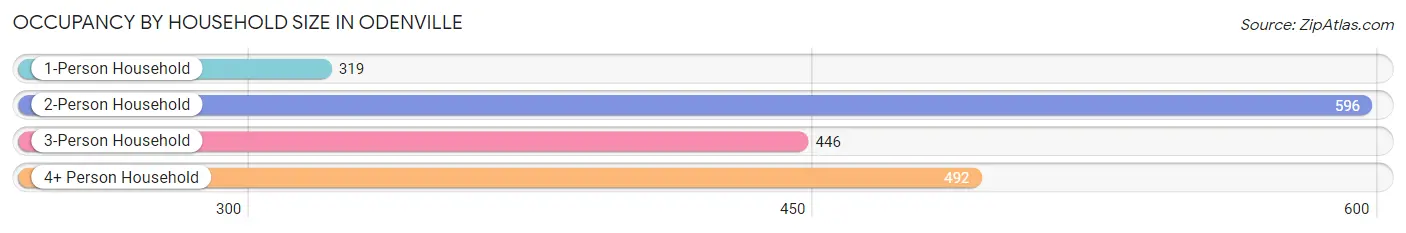
| Household Size | # Housing Units | % Housing Units |
| 1-Person Household | 319 | 17.2% |
| 2-Person Household | 596 | 32.2% |
| 3-Person Household | 446 | 24.1% |
| 4+ Person Household | 492 | 26.6% |
| Total Housing Units | 1,853 | 100.0% |
Occupancy by Ownership by Household Size in Odenville
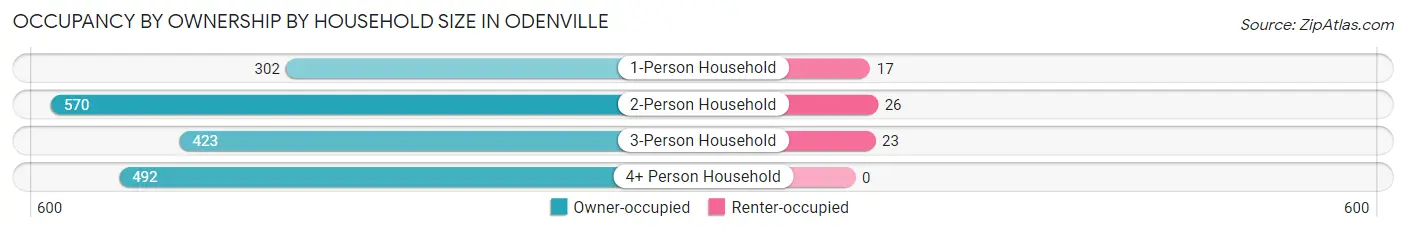
| Household Size | Owner-occupied | Renter-occupied |
| 1-Person Household | 302 (94.7%) | 17 (5.3%) |
| 2-Person Household | 570 (95.6%) | 26 (4.4%) |
| 3-Person Household | 423 (94.8%) | 23 (5.2%) |
| 4+ Person Household | 492 (100.0%) | 0 (0.0%) |
| Total Housing Units | 1,787 (96.4%) | 66 (3.6%) |
Occupancy by Educational Attainment in Odenville
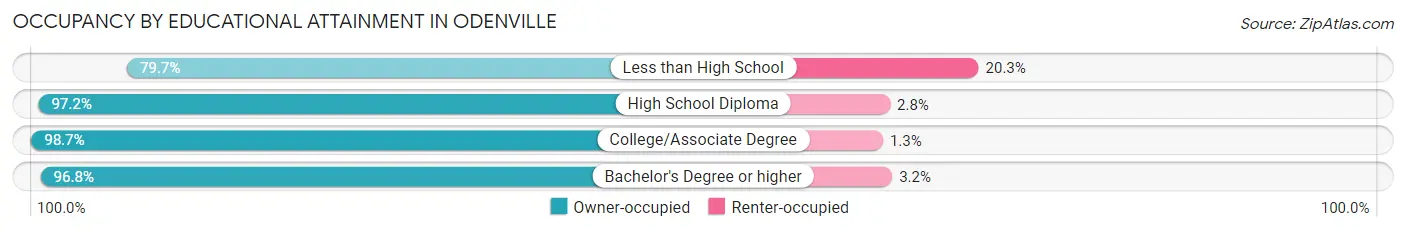
| Household Size | Owner-occupied | Renter-occupied |
| Less than High School | 102 (79.7%) | 26 (20.3%) |
| High School Diploma | 598 (97.2%) | 17 (2.8%) |
| College/Associate Degree | 662 (98.7%) | 9 (1.3%) |
| Bachelor's Degree or higher | 425 (96.8%) | 14 (3.2%) |
Occupancy by Age of Householder in Odenville
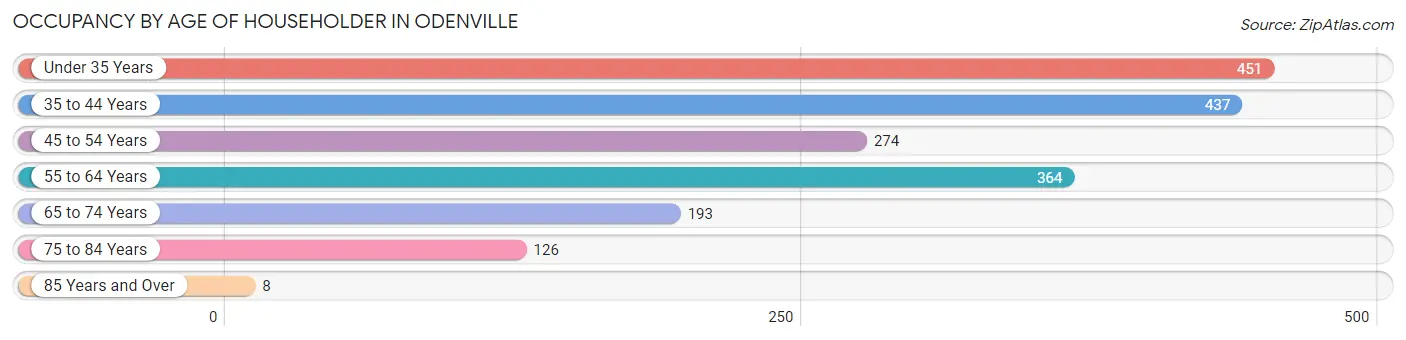
| Age Bracket | # Households | % Households |
| Under 35 Years | 451 | 24.3% |
| 35 to 44 Years | 437 | 23.6% |
| 45 to 54 Years | 274 | 14.8% |
| 55 to 64 Years | 364 | 19.6% |
| 65 to 74 Years | 193 | 10.4% |
| 75 to 84 Years | 126 | 6.8% |
| 85 Years and Over | 8 | 0.4% |
| Total | 1,853 | 100.0% |
Housing Finances in Odenville
Median Income by Occupancy in Odenville
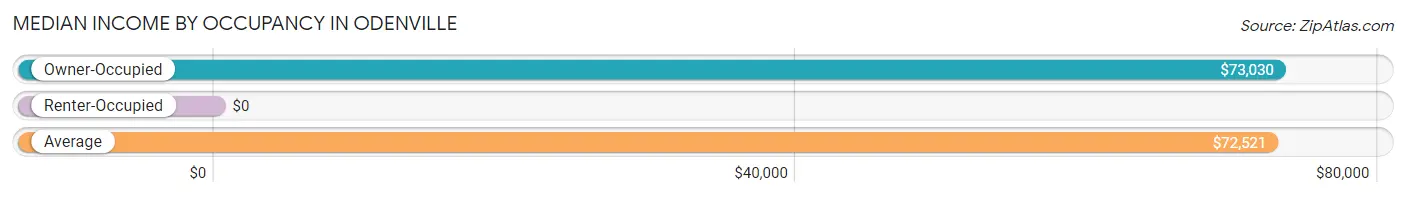
| Occupancy Type | # Households | Median Income |
| Owner-Occupied | 1,787 (96.4%) | $73,030 |
| Renter-Occupied | 66 (3.6%) | $0 |
| Average | 1,853 (100.0%) | $72,521 |
Occupancy by Householder Income Bracket in Odenville
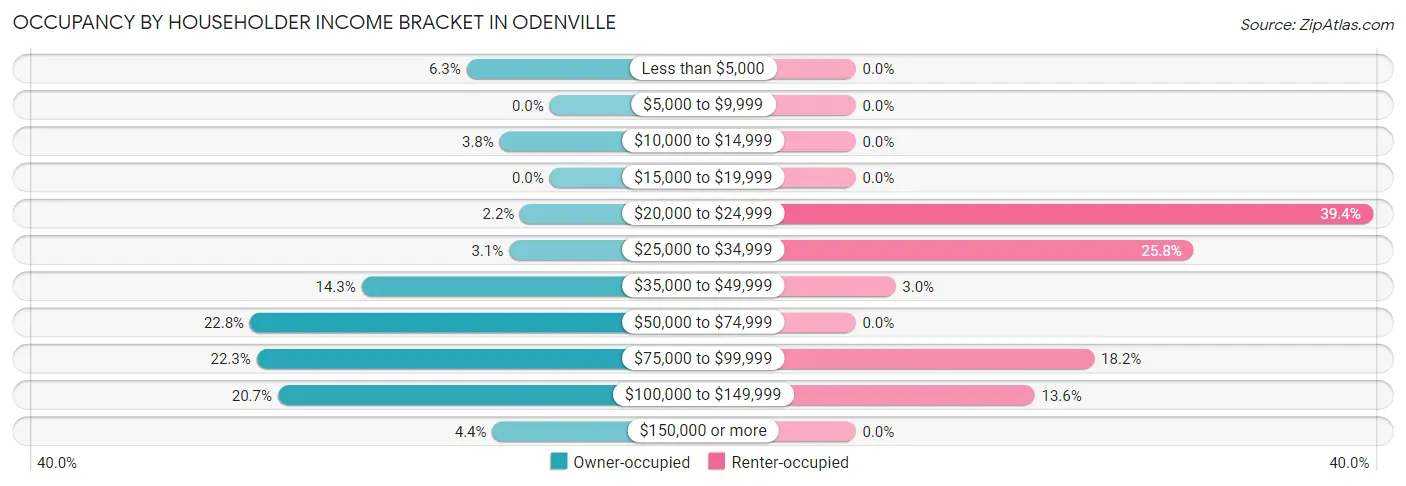
| Income Bracket | Owner-occupied | Renter-occupied |
| Less than $5,000 | 113 (6.3%) | 0 (0.0%) |
| $5,000 to $9,999 | 0 (0.0%) | 0 (0.0%) |
| $10,000 to $14,999 | 68 (3.8%) | 0 (0.0%) |
| $15,000 to $19,999 | 0 (0.0%) | 0 (0.0%) |
| $20,000 to $24,999 | 40 (2.2%) | 26 (39.4%) |
| $25,000 to $34,999 | 55 (3.1%) | 17 (25.8%) |
| $35,000 to $49,999 | 256 (14.3%) | 2 (3.0%) |
| $50,000 to $74,999 | 408 (22.8%) | 0 (0.0%) |
| $75,000 to $99,999 | 399 (22.3%) | 12 (18.2%) |
| $100,000 to $149,999 | 370 (20.7%) | 9 (13.6%) |
| $150,000 or more | 78 (4.4%) | 0 (0.0%) |
| Total | 1,787 (100.0%) | 66 (100.0%) |
Monthly Housing Cost Tiers in Odenville
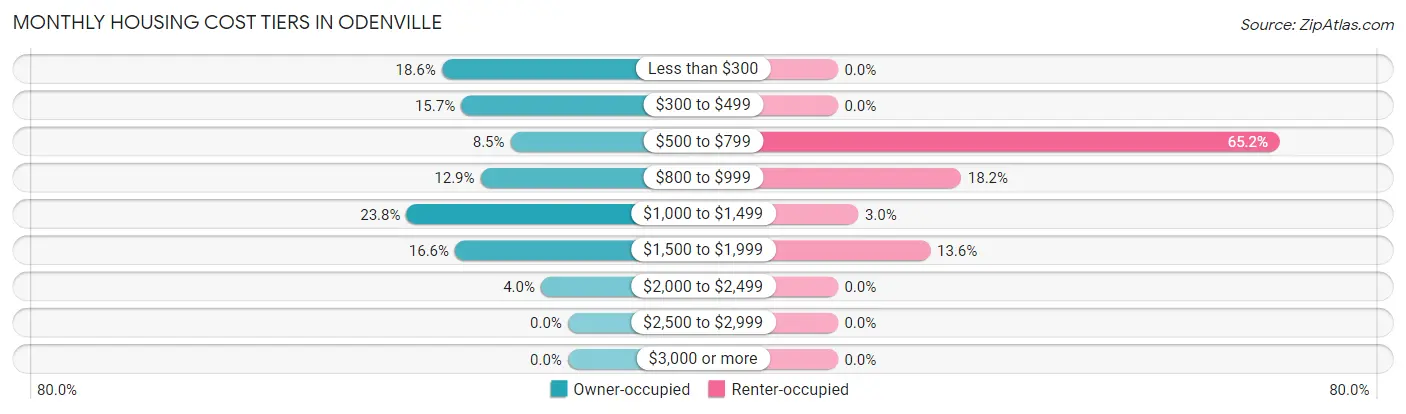
| Monthly Cost | Owner-occupied | Renter-occupied |
| Less than $300 | 332 (18.6%) | 0 (0.0%) |
| $300 to $499 | 281 (15.7%) | 0 (0.0%) |
| $500 to $799 | 151 (8.5%) | 43 (65.1%) |
| $800 to $999 | 230 (12.9%) | 12 (18.2%) |
| $1,000 to $1,499 | 425 (23.8%) | 2 (3.0%) |
| $1,500 to $1,999 | 297 (16.6%) | 9 (13.6%) |
| $2,000 to $2,499 | 71 (4.0%) | 0 (0.0%) |
| $2,500 to $2,999 | 0 (0.0%) | 0 (0.0%) |
| $3,000 or more | 0 (0.0%) | 0 (0.0%) |
| Total | 1,787 (100.0%) | 66 (100.0%) |
Physical Housing Characteristics in Odenville
Housing Structures in Odenville
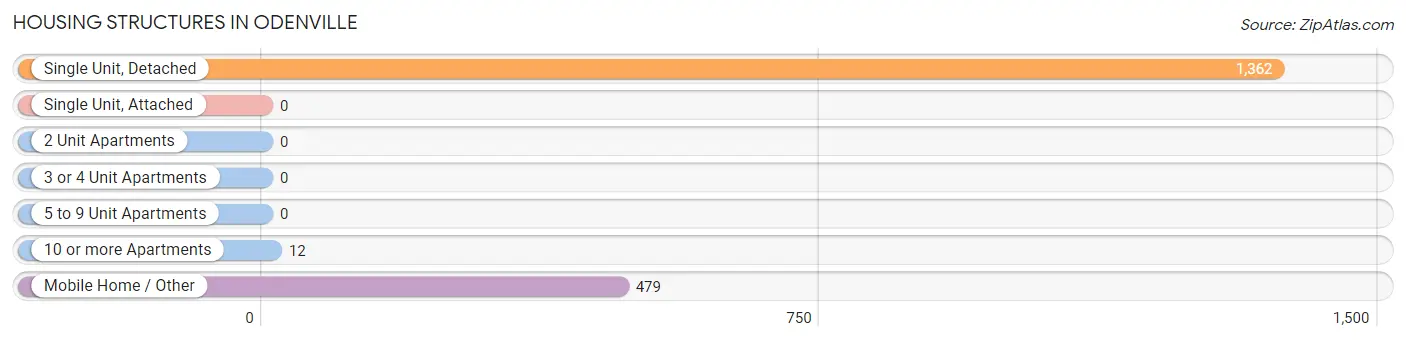
| Structure Type | # Housing Units | % Housing Units |
| Single Unit, Detached | 1,362 | 73.5% |
| Single Unit, Attached | 0 | 0.0% |
| 2 Unit Apartments | 0 | 0.0% |
| 3 or 4 Unit Apartments | 0 | 0.0% |
| 5 to 9 Unit Apartments | 0 | 0.0% |
| 10 or more Apartments | 12 | 0.6% |
| Mobile Home / Other | 479 | 25.9% |
| Total | 1,853 | 100.0% |
Housing Structures by Occupancy in Odenville
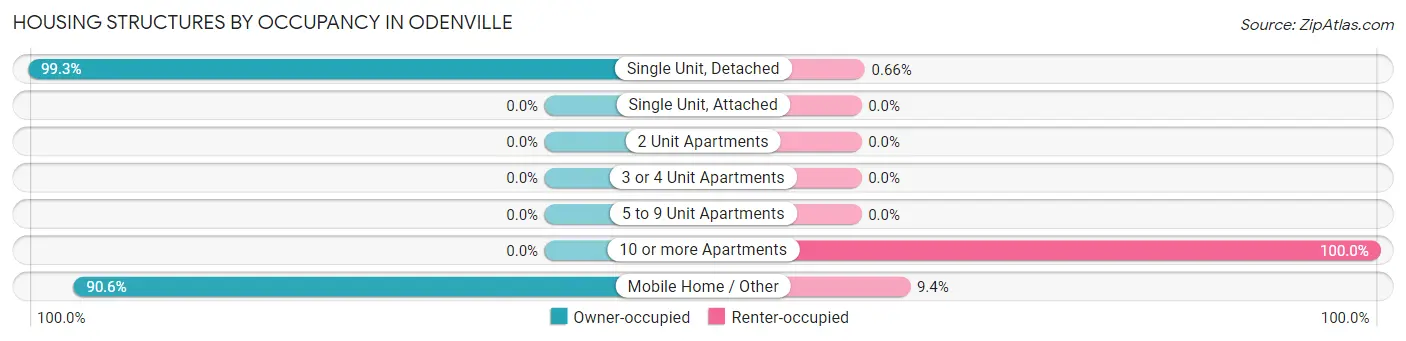
| Structure Type | Owner-occupied | Renter-occupied |
| Single Unit, Detached | 1,353 (99.3%) | 9 (0.7%) |
| Single Unit, Attached | 0 (0.0%) | 0 (0.0%) |
| 2 Unit Apartments | 0 (0.0%) | 0 (0.0%) |
| 3 or 4 Unit Apartments | 0 (0.0%) | 0 (0.0%) |
| 5 to 9 Unit Apartments | 0 (0.0%) | 0 (0.0%) |
| 10 or more Apartments | 0 (0.0%) | 12 (100.0%) |
| Mobile Home / Other | 434 (90.6%) | 45 (9.4%) |
| Total | 1,787 (96.4%) | 66 (3.6%) |
Housing Structures by Number of Rooms in Odenville
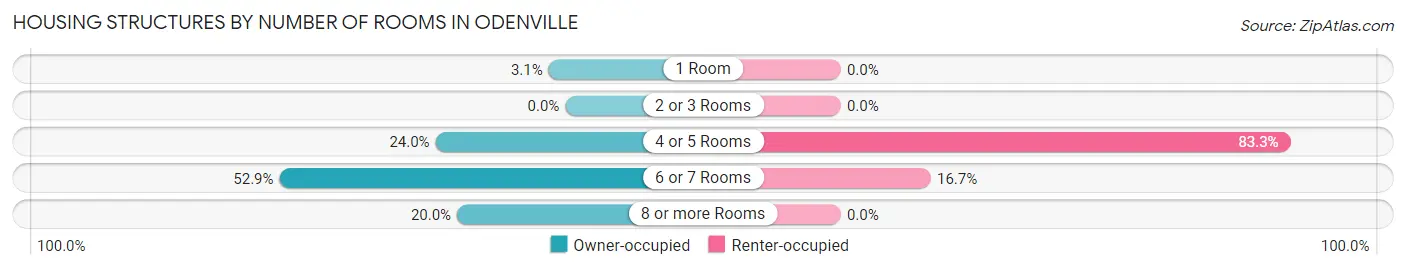
| Number of Rooms | Owner-occupied | Renter-occupied |
| 1 Room | 55 (3.1%) | 0 (0.0%) |
| 2 or 3 Rooms | 0 (0.0%) | 0 (0.0%) |
| 4 or 5 Rooms | 429 (24.0%) | 55 (83.3%) |
| 6 or 7 Rooms | 945 (52.9%) | 11 (16.7%) |
| 8 or more Rooms | 358 (20.0%) | 0 (0.0%) |
| Total | 1,787 (100.0%) | 66 (100.0%) |
Housing Structure by Heating Type in Odenville
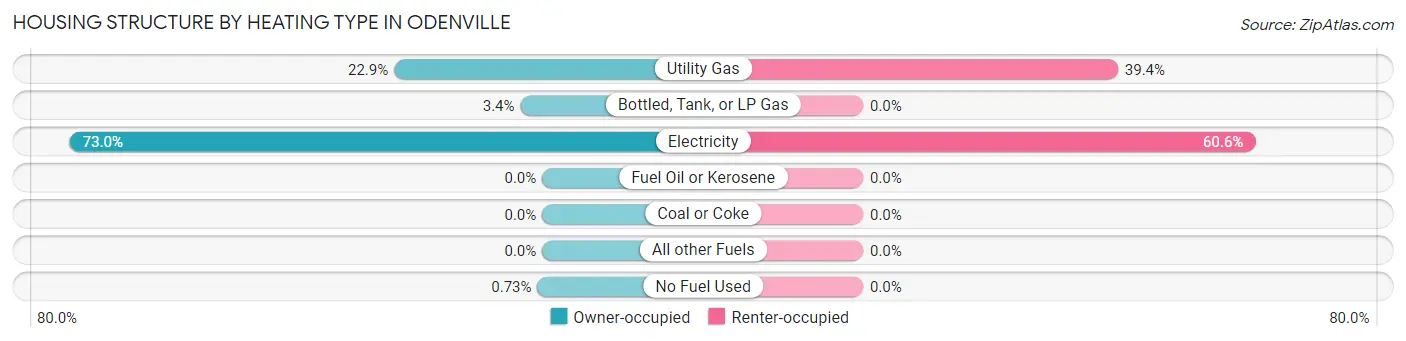
| Heating Type | Owner-occupied | Renter-occupied |
| Utility Gas | 409 (22.9%) | 26 (39.4%) |
| Bottled, Tank, or LP Gas | 60 (3.4%) | 0 (0.0%) |
| Electricity | 1,305 (73.0%) | 40 (60.6%) |
| Fuel Oil or Kerosene | 0 (0.0%) | 0 (0.0%) |
| Coal or Coke | 0 (0.0%) | 0 (0.0%) |
| All other Fuels | 0 (0.0%) | 0 (0.0%) |
| No Fuel Used | 13 (0.7%) | 0 (0.0%) |
| Total | 1,787 (100.0%) | 66 (100.0%) |
Household Vehicle Usage in Odenville
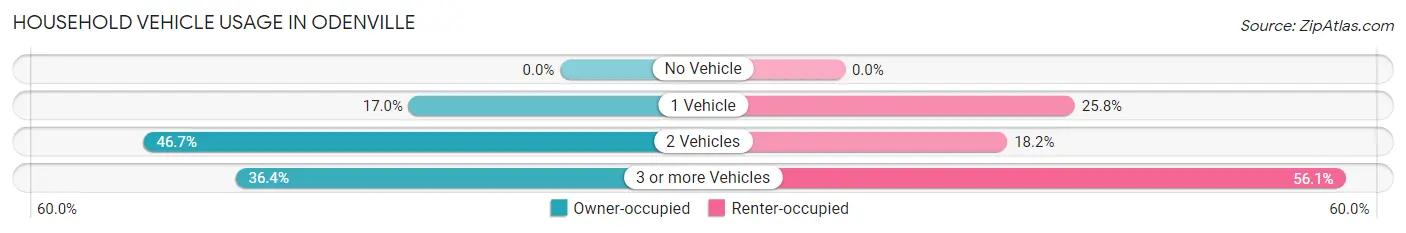
| Vehicles per Household | Owner-occupied | Renter-occupied |
| No Vehicle | 0 (0.0%) | 0 (0.0%) |
| 1 Vehicle | 303 (17.0%) | 17 (25.8%) |
| 2 Vehicles | 834 (46.7%) | 12 (18.2%) |
| 3 or more Vehicles | 650 (36.4%) | 37 (56.1%) |
| Total | 1,787 (100.0%) | 66 (100.0%) |
Real Estate & Mortgages in Odenville
Real Estate and Mortgage Overview in Odenville
| Characteristic | Without Mortgage | With Mortgage |
| Housing Units | 753 | 1,034 |
| Median Property Value | $157,400 | $201,600 |
| Median Household Income | $51,206 | $65 |
| Monthly Housing Costs | $360 | $0 |
| Real Estate Taxes | $513 | $13 |
Property Value by Mortgage Status in Odenville
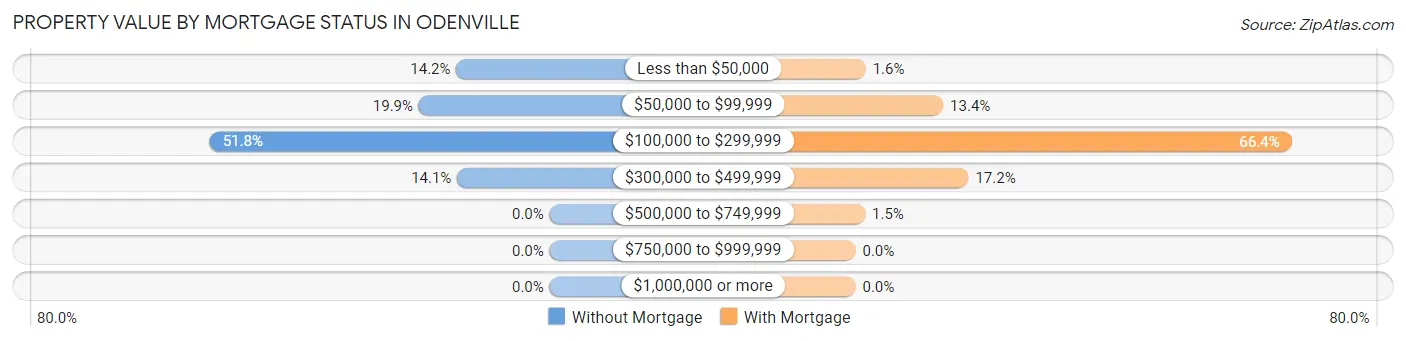
| Property Value | Without Mortgage | With Mortgage |
| Less than $50,000 | 107 (14.2%) | 16 (1.5%) |
| $50,000 to $99,999 | 150 (19.9%) | 138 (13.4%) |
| $100,000 to $299,999 | 390 (51.8%) | 687 (66.4%) |
| $300,000 to $499,999 | 106 (14.1%) | 178 (17.2%) |
| $500,000 to $749,999 | 0 (0.0%) | 15 (1.5%) |
| $750,000 to $999,999 | 0 (0.0%) | 0 (0.0%) |
| $1,000,000 or more | 0 (0.0%) | 0 (0.0%) |
| Total | 753 (100.0%) | 1,034 (100.0%) |
Household Income by Mortgage Status in Odenville
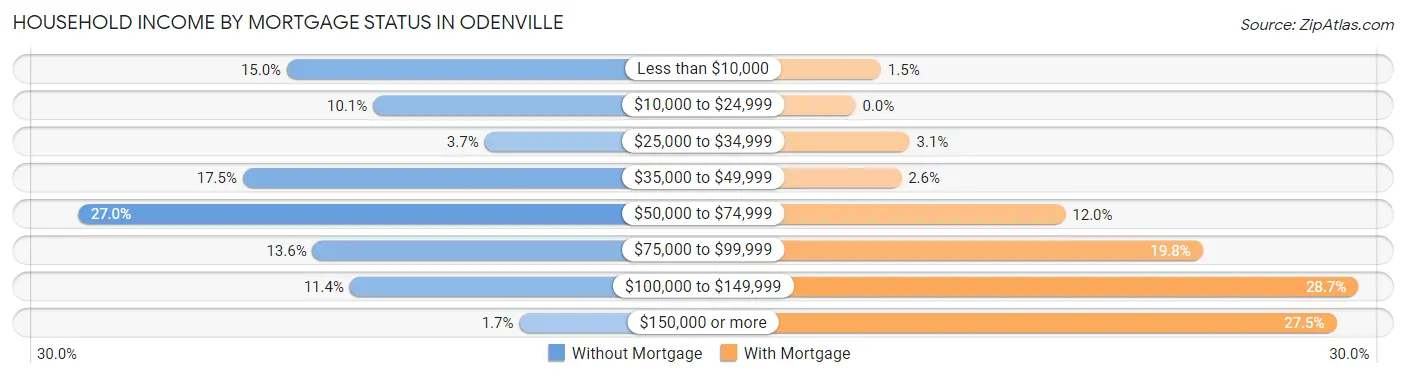
| Household Income | Without Mortgage | With Mortgage |
| Less than $10,000 | 113 (15.0%) | 15 (1.5%) |
| $10,000 to $24,999 | 76 (10.1%) | 0 (0.0%) |
| $25,000 to $34,999 | 28 (3.7%) | 32 (3.1%) |
| $35,000 to $49,999 | 132 (17.5%) | 27 (2.6%) |
| $50,000 to $74,999 | 203 (27.0%) | 124 (12.0%) |
| $75,000 to $99,999 | 102 (13.6%) | 205 (19.8%) |
| $100,000 to $149,999 | 86 (11.4%) | 297 (28.7%) |
| $150,000 or more | 13 (1.7%) | 284 (27.5%) |
| Total | 753 (100.0%) | 1,034 (100.0%) |
Property Value to Household Income Ratio in Odenville
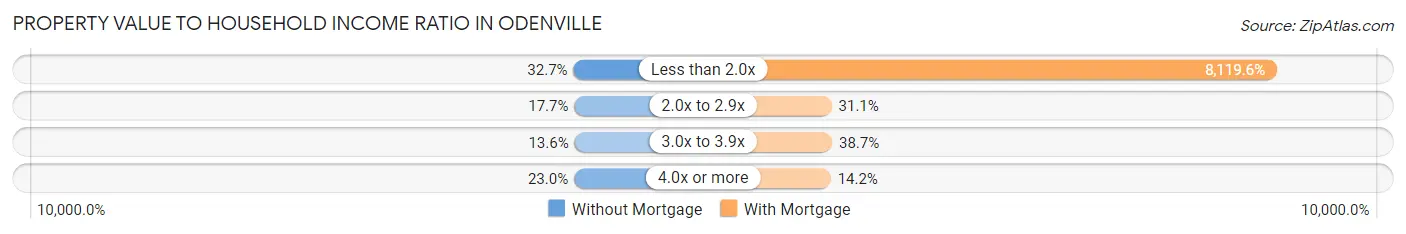
| Value-to-Income Ratio | Without Mortgage | With Mortgage |
| Less than 2.0x | 246 (32.7%) | 83,957 (8,119.6%) |
| 2.0x to 2.9x | 133 (17.7%) | 322 (31.1%) |
| 3.0x to 3.9x | 102 (13.6%) | 400 (38.7%) |
| 4.0x or more | 173 (23.0%) | 147 (14.2%) |
| Total | 753 (100.0%) | 1,034 (100.0%) |
Real Estate Taxes by Mortgage Status in Odenville
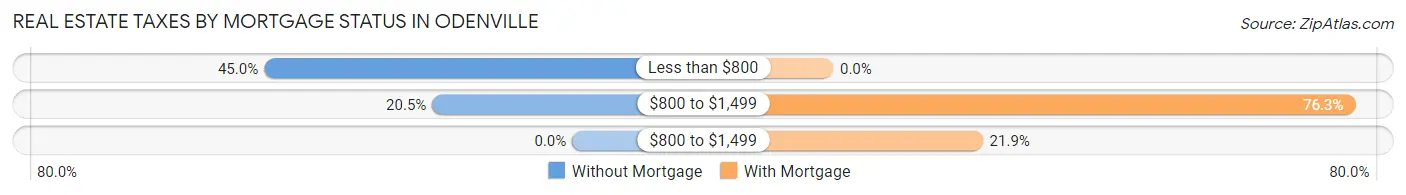
| Property Taxes | Without Mortgage | With Mortgage |
| Less than $800 | 339 (45.0%) | 0 (0.0%) |
| $800 to $1,499 | 154 (20.4%) | 789 (76.3%) |
| $800 to $1,499 | 0 (0.0%) | 226 (21.9%) |
| Total | 753 (100.0%) | 1,034 (100.0%) |
Health & Disability in Odenville
Health Insurance Coverage by Age in Odenville
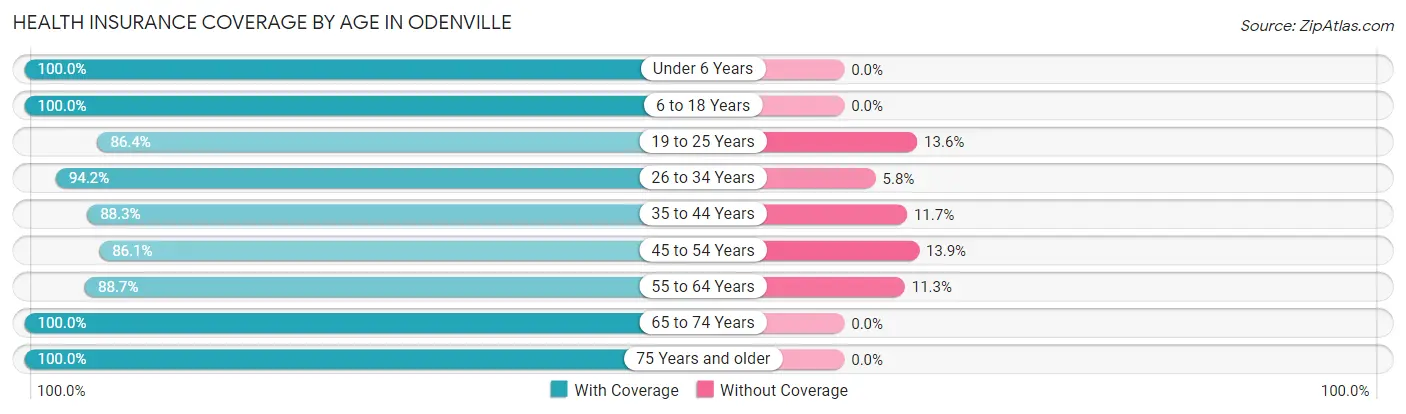
| Age Bracket | With Coverage | Without Coverage |
| Under 6 Years | 422 (100.0%) | 0 (0.0%) |
| 6 to 18 Years | 940 (100.0%) | 0 (0.0%) |
| 19 to 25 Years | 267 (86.4%) | 42 (13.6%) |
| 26 to 34 Years | 661 (94.2%) | 41 (5.8%) |
| 35 to 44 Years | 740 (88.3%) | 98 (11.7%) |
| 45 to 54 Years | 439 (86.1%) | 71 (13.9%) |
| 55 to 64 Years | 519 (88.7%) | 66 (11.3%) |
| 65 to 74 Years | 303 (100.0%) | 0 (0.0%) |
| 75 Years and older | 264 (100.0%) | 0 (0.0%) |
| Total | 4,555 (93.5%) | 318 (6.5%) |
Health Insurance Coverage by Citizenship Status in Odenville
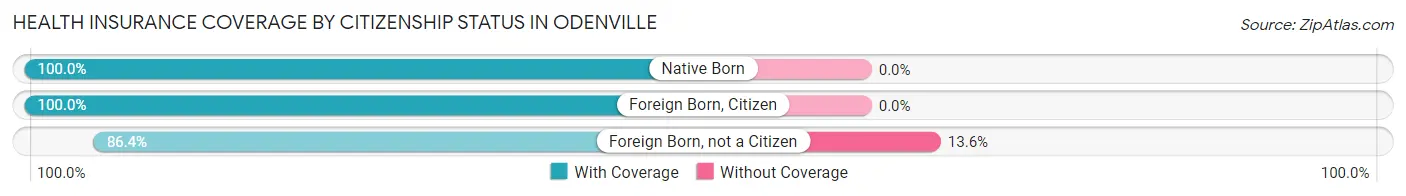
| Citizenship Status | With Coverage | Without Coverage |
| Native Born | 422 (100.0%) | 0 (0.0%) |
| Foreign Born, Citizen | 940 (100.0%) | 0 (0.0%) |
| Foreign Born, not a Citizen | 267 (86.4%) | 42 (13.6%) |
Health Insurance Coverage by Household Income in Odenville
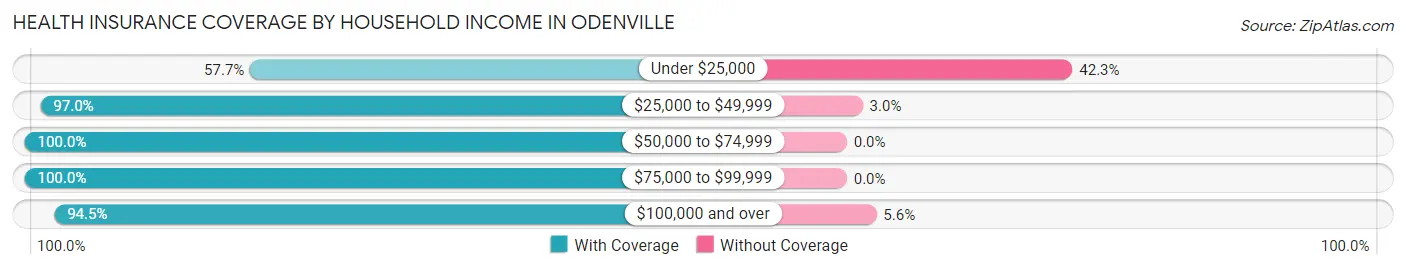
| Household Income | With Coverage | Without Coverage |
| Under $25,000 | 302 (57.7%) | 221 (42.3%) |
| $25,000 to $49,999 | 817 (97.0%) | 25 (3.0%) |
| $50,000 to $74,999 | 966 (100.0%) | 0 (0.0%) |
| $75,000 to $99,999 | 1,241 (100.0%) | 0 (0.0%) |
| $100,000 and over | 1,226 (94.5%) | 72 (5.6%) |
Public vs Private Health Insurance Coverage by Age in Odenville
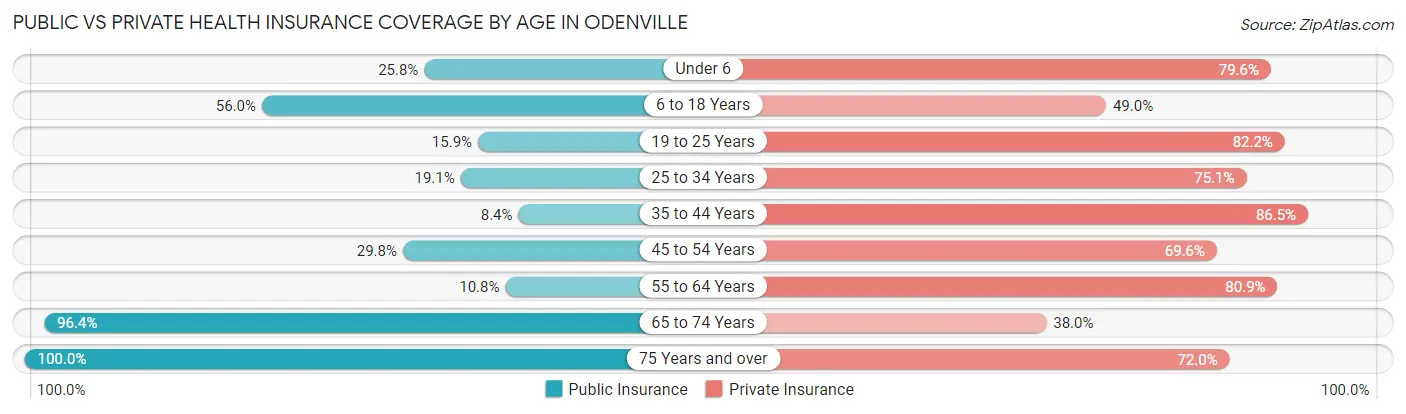
| Age Bracket | Public Insurance | Private Insurance |
| Under 6 | 109 (25.8%) | 336 (79.6%) |
| 6 to 18 Years | 526 (56.0%) | 461 (49.0%) |
| 19 to 25 Years | 49 (15.9%) | 254 (82.2%) |
| 25 to 34 Years | 134 (19.1%) | 527 (75.1%) |
| 35 to 44 Years | 70 (8.4%) | 725 (86.5%) |
| 45 to 54 Years | 152 (29.8%) | 355 (69.6%) |
| 55 to 64 Years | 63 (10.8%) | 473 (80.8%) |
| 65 to 74 Years | 292 (96.4%) | 115 (38.0%) |
| 75 Years and over | 264 (100.0%) | 190 (72.0%) |
| Total | 1,659 (34.0%) | 3,436 (70.5%) |
Disability Status by Sex by Age in Odenville
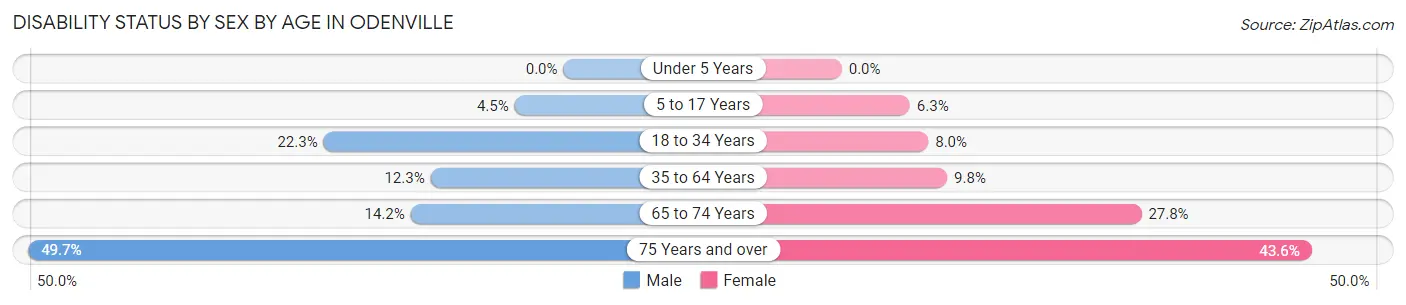
| Age Bracket | Male | Female |
| Under 5 Years | 0 (0.0%) | 0 (0.0%) |
| 5 to 17 Years | 15 (4.5%) | 37 (6.3%) |
| 18 to 34 Years | 134 (22.3%) | 40 (8.0%) |
| 35 to 64 Years | 111 (12.3%) | 101 (9.8%) |
| 65 to 74 Years | 19 (14.2%) | 47 (27.8%) |
| 75 Years and over | 73 (49.7%) | 51 (43.6%) |
Disability Class by Sex by Age in Odenville
Disability Class: Hearing Difficulty
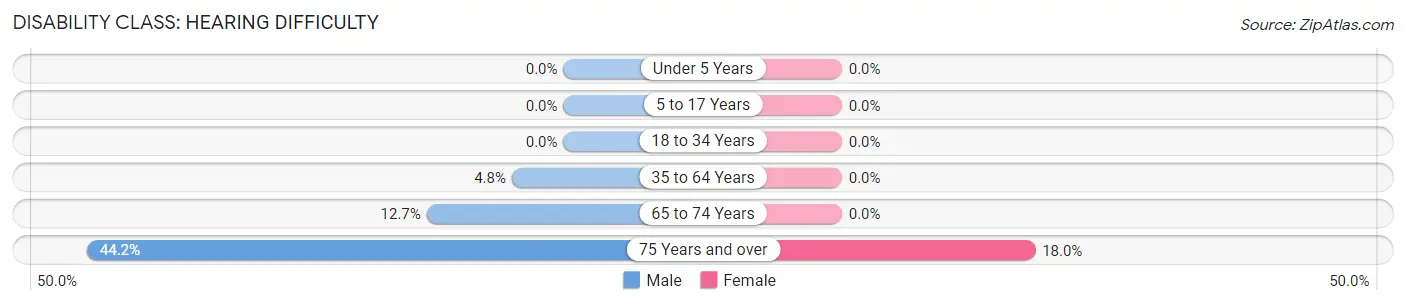
| Age Bracket | Male | Female |
| Under 5 Years | 0 (0.0%) | 0 (0.0%) |
| 5 to 17 Years | 0 (0.0%) | 0 (0.0%) |
| 18 to 34 Years | 0 (0.0%) | 0 (0.0%) |
| 35 to 64 Years | 43 (4.8%) | 0 (0.0%) |
| 65 to 74 Years | 17 (12.7%) | 0 (0.0%) |
| 75 Years and over | 65 (44.2%) | 21 (17.9%) |
Disability Class: Vision Difficulty
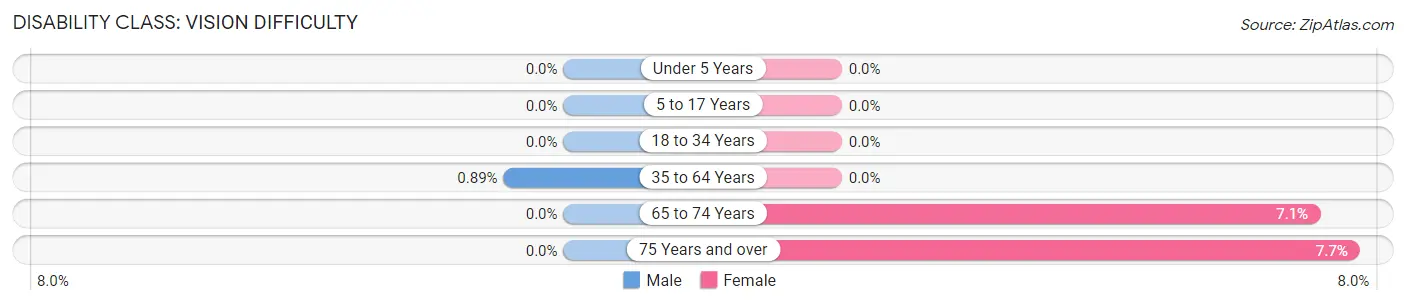
| Age Bracket | Male | Female |
| Under 5 Years | 0 (0.0%) | 0 (0.0%) |
| 5 to 17 Years | 0 (0.0%) | 0 (0.0%) |
| 18 to 34 Years | 0 (0.0%) | 0 (0.0%) |
| 35 to 64 Years | 8 (0.9%) | 0 (0.0%) |
| 65 to 74 Years | 0 (0.0%) | 12 (7.1%) |
| 75 Years and over | 0 (0.0%) | 9 (7.7%) |
Disability Class: Cognitive Difficulty
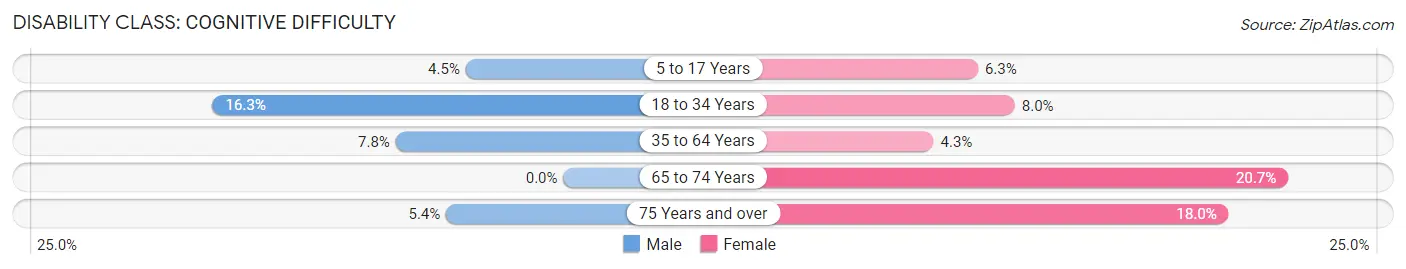
| Age Bracket | Male | Female |
| 5 to 17 Years | 15 (4.5%) | 37 (6.3%) |
| 18 to 34 Years | 98 (16.3%) | 40 (8.0%) |
| 35 to 64 Years | 70 (7.8%) | 44 (4.3%) |
| 65 to 74 Years | 0 (0.0%) | 35 (20.7%) |
| 75 Years and over | 8 (5.4%) | 21 (17.9%) |
Disability Class: Ambulatory Difficulty
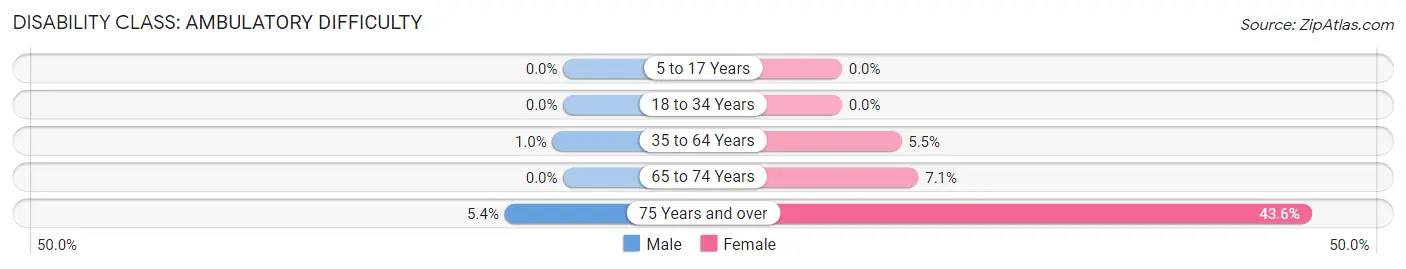
| Age Bracket | Male | Female |
| 5 to 17 Years | 0 (0.0%) | 0 (0.0%) |
| 18 to 34 Years | 0 (0.0%) | 0 (0.0%) |
| 35 to 64 Years | 9 (1.0%) | 57 (5.5%) |
| 65 to 74 Years | 0 (0.0%) | 12 (7.1%) |
| 75 Years and over | 8 (5.4%) | 51 (43.6%) |
Disability Class: Self-Care Difficulty
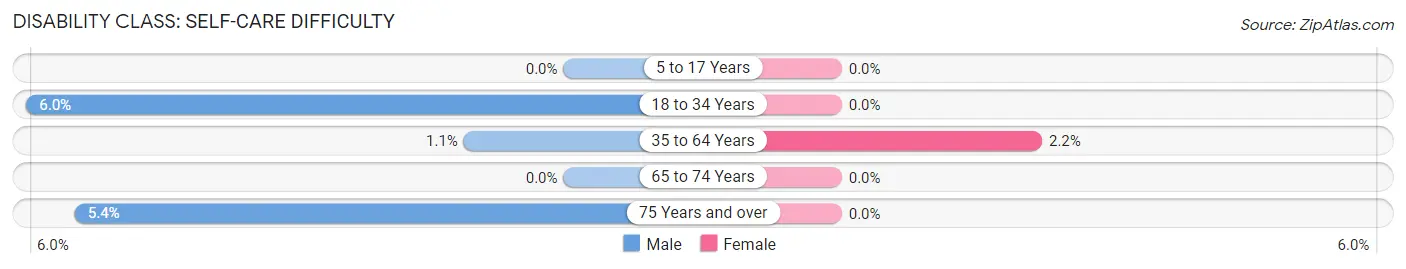
| Age Bracket | Male | Female |
| 5 to 17 Years | 0 (0.0%) | 0 (0.0%) |
| 18 to 34 Years | 36 (6.0%) | 0 (0.0%) |
| 35 to 64 Years | 10 (1.1%) | 23 (2.2%) |
| 65 to 74 Years | 0 (0.0%) | 0 (0.0%) |
| 75 Years and over | 8 (5.4%) | 0 (0.0%) |
Technology Access in Odenville
Computing Device Access in Odenville
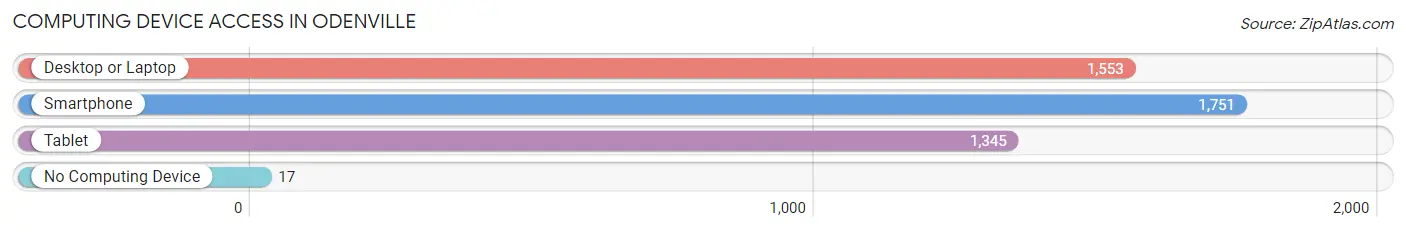
| Device Type | # Households | % Households |
| Desktop or Laptop | 1,553 | 83.8% |
| Smartphone | 1,751 | 94.5% |
| Tablet | 1,345 | 72.6% |
| No Computing Device | 17 | 0.9% |
| Total | 1,853 | 100.0% |
Internet Access in Odenville
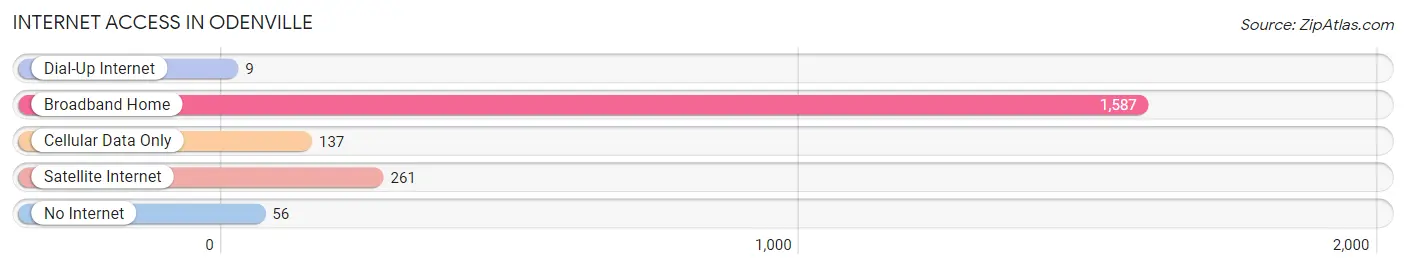
| Internet Type | # Households | % Households |
| Dial-Up Internet | 9 | 0.5% |
| Broadband Home | 1,587 | 85.6% |
| Cellular Data Only | 137 | 7.4% |
| Satellite Internet | 261 | 14.1% |
| No Internet | 56 | 3.0% |
| Total | 1,853 | 100.0% |
Odenville Summary
Odenville, Alabama is a small town located in St. Clair County, Alabama. It is situated about 25 miles northeast of Birmingham and is part of the Birmingham-Hoover Metropolitan Statistical Area. The town has a population of approximately 2,000 people and is known for its rural charm and friendly atmosphere.
Geography
Odenville is located in the foothills of the Appalachian Mountains in the northeastern corner of St. Clair County. The town is situated on the banks of the Little Cahaba River, which flows through the center of town. The terrain is mostly hilly and wooded, with some flat areas in the valleys. The climate is mild, with temperatures ranging from the mid-50s in the winter to the mid-80s in the summer.
Economy
Odenville’s economy is largely based on agriculture and manufacturing. The town is home to several small businesses, including a feed store, a hardware store, and a few restaurants. The town also has a few small industrial plants, including a paper mill and a plastics factory. The town is also home to a few small farms, which produce a variety of crops, including corn, soybeans, and cotton.
Demographics
As of the 2010 census, Odenville had a population of 2,000 people. The racial makeup of the town was 95.2% White, 1.7% African American, 0.7% Native American, 0.3% Asian, 0.1% Pacific Islander, and 1.9% from other races. The median household income was $37,500, and the median family income was $45,000. The per capita income was $18,000.
History
Odenville was founded in 1883 by a group of settlers from Georgia. The town was named after the Oden family, who were among the first settlers. The town grew slowly over the years, and by the early 1900s, it had become a thriving agricultural community. In the 1950s, the town began to experience a period of growth, as several new businesses opened in the area. Today, Odenville is a small but vibrant community, with a strong sense of community and a commitment to preserving its rural charm.
Odenville is a small town with a big heart. It is a place where people come together to celebrate the town’s history and to enjoy the beauty of the surrounding countryside. The town is a great place to live, work, and raise a family, and it is a great place to visit.
Common Questions
What is the Total Population of Odenville?
Total Population of Odenville is 4,873.
What is the Total Male Population of Odenville?
Total Male Population of Odenville is 2,294.
What is the Total Female Population of Odenville?
Total Female Population of Odenville is 2,579.
What is the Ratio of Males per 100 Females in Odenville?
There are 88.95 Males per 100 Females in Odenville.
What is the Ratio of Females per 100 Males in Odenville?
There are 112.42 Females per 100 Males in Odenville.
What is the Median Population Age in Odenville?
Median Population Age in Odenville is 36.3 Years.
What is the Average Family Size in Odenville
Average Family Size in Odenville is 2.9 People.
What is the Average Household Size in Odenville
Average Household Size in Odenville is 2.6 People.
What is Per Capita Income in Odenville?
Per Capita income in Odenville is $27,899.
What is the Median Family Income in Odenville?
Median Family Income in Odenville is $77,230.
What is the Median Household income in Odenville?
Median Household Income in Odenville is $72,521.
What is Income or Wage Gap in Odenville?
Income or Wage Gap in Odenville is 37.8%.
Women in Odenville earn 62.2 cents for every dollar earned by a man.
What is Inequality or Gini Index in Odenville?
Inequality or Gini Index in Odenville is 0.33.
How Large is the Labor Force in Odenville?
There are 2,374 People in the Labor Forcein in Odenville.
What is the Percentage of People in the Labor Force in Odenville?
62.8% of People are in the Labor Force in Odenville.
What is the Unemployment Rate in Odenville?
Unemployment Rate in Odenville is 2.6%.