Newton, AL Map & Demographics
Newton Map
Newton Overview
$26,393
PER CAPITA INCOME
$77,115
AVG FAMILY INCOME
$64,297
AVG HOUSEHOLD INCOME
25.2%
WAGE / INCOME GAP [ % ]
74.8¢/ $1
WAGE / INCOME GAP [ $ ]
$7,889
FAMILY INCOME DEFICIT
0.38
INEQUALITY / GINI INDEX
1,528
TOTAL POPULATION
761
MALE POPULATION
767
FEMALE POPULATION
99.22
MALES / 100 FEMALES
100.79
FEMALES / 100 MALES
43.9
MEDIAN AGE
3.3
AVG FAMILY SIZE
2.6
AVG HOUSEHOLD SIZE
571
LABOR FORCE [ PEOPLE ]
46.9%
PERCENT IN LABOR FORCE
4.0%
UNEMPLOYMENT RATE
Newton Zip Codes
Newton Area Codes
Income in Newton
Income Overview in Newton
Per Capita Income in Newton is $26,393, while median incomes of families and households are $77,115 and $64,297 respectively.
| Characteristic | Number | Measure |
| Per Capita Income | 1,528 | $26,393 |
| Median Family Income | 384 | $77,115 |
| Mean Family Income | 384 | $78,237 |
| Median Household Income | 597 | $64,297 |
| Mean Household Income | 597 | $65,886 |
| Income Deficit | 384 | $7,889 |
| Wage / Income Gap (%) | 1,528 | 25.21% |
| Wage / Income Gap ($) | 1,528 | 74.79¢ per $1 |
| Gini / Inequality Index | 1,528 | 0.38 |
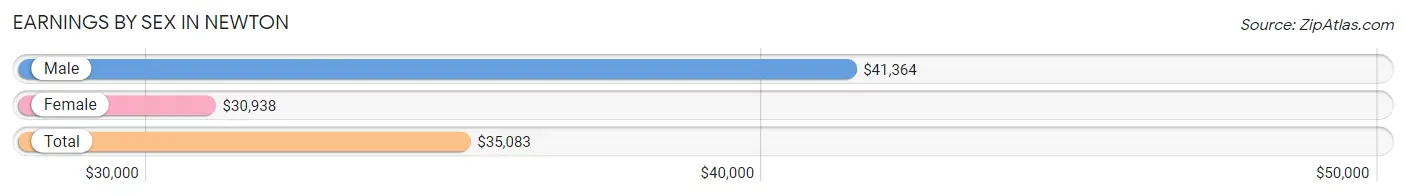
Earnings by Sex in Newton
Average Earnings in Newton are $35,083, $41,364 for men and $30,938 for women, a difference of 25.2%.
| Sex | Number | Average Earnings |
| Male | 350 (57.5%) | $41,364 |
| Female | 259 (42.5%) | $30,938 |
| Total | 609 (100.0%) | $35,083 |
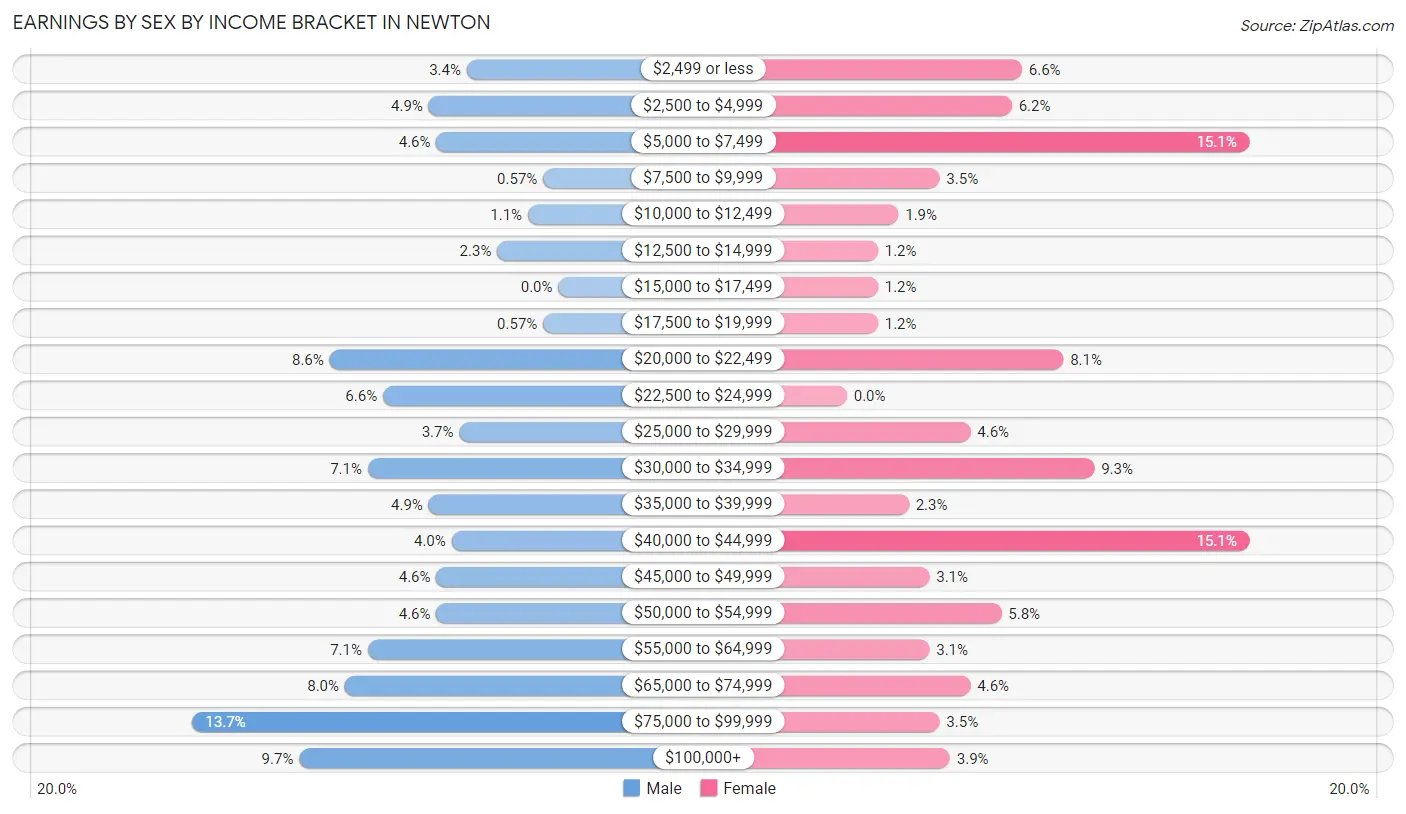
Earnings by Sex by Income Bracket in Newton
The most common earnings brackets in Newton are $75,000 to $99,999 for men (48 | 13.7%) and $5,000 to $7,499 for women (39 | 15.1%).
| Income | Male | Female |
| $2,499 or less | 12 (3.4%) | 17 (6.6%) |
| $2,500 to $4,999 | 17 (4.9%) | 16 (6.2%) |
| $5,000 to $7,499 | 16 (4.6%) | 39 (15.1%) |
| $7,500 to $9,999 | 2 (0.6%) | 9 (3.5%) |
| $10,000 to $12,499 | 4 (1.1%) | 5 (1.9%) |
| $12,500 to $14,999 | 8 (2.3%) | 3 (1.2%) |
| $15,000 to $17,499 | 0 (0.0%) | 3 (1.2%) |
| $17,500 to $19,999 | 2 (0.6%) | 3 (1.2%) |
| $20,000 to $22,499 | 30 (8.6%) | 21 (8.1%) |
| $22,500 to $24,999 | 23 (6.6%) | 0 (0.0%) |
| $25,000 to $29,999 | 13 (3.7%) | 12 (4.6%) |
| $30,000 to $34,999 | 25 (7.1%) | 24 (9.3%) |
| $35,000 to $39,999 | 17 (4.9%) | 6 (2.3%) |
| $40,000 to $44,999 | 14 (4.0%) | 39 (15.1%) |
| $45,000 to $49,999 | 16 (4.6%) | 8 (3.1%) |
| $50,000 to $54,999 | 16 (4.6%) | 15 (5.8%) |
| $55,000 to $64,999 | 25 (7.1%) | 8 (3.1%) |
| $65,000 to $74,999 | 28 (8.0%) | 12 (4.6%) |
| $75,000 to $99,999 | 48 (13.7%) | 9 (3.5%) |
| $100,000+ | 34 (9.7%) | 10 (3.9%) |
| Total | 350 (100.0%) | 259 (100.0%) |
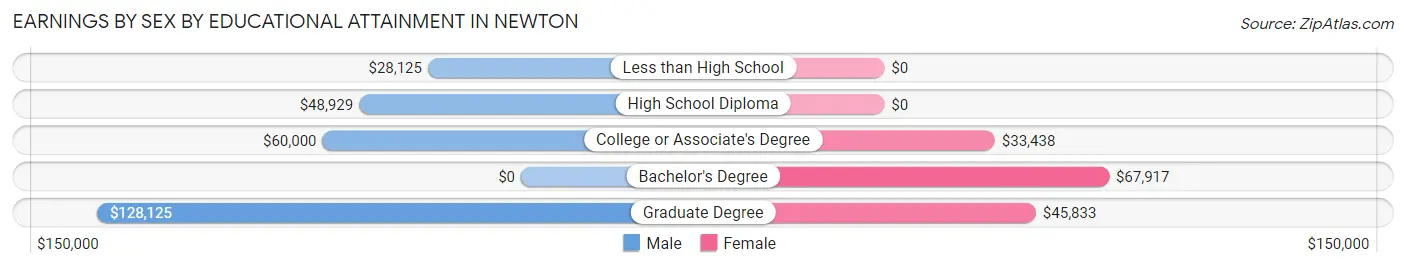
Earnings by Sex by Educational Attainment in Newton
Average earnings in Newton are $50,469 for men and $38,333 for women, a difference of 24.0%. Men with an educational attainment of graduate degree enjoy the highest average annual earnings of $128,125, while those with less than high school education earn the least with $28,125. Women with an educational attainment of bachelor's degree earn the most with the average annual earnings of $67,917, while those with college or associate's degree education have the smallest earnings of $33,438.
| Educational Attainment | Male Income | Female Income |
| Less than High School | $28,125 | $0 |
| High School Diploma | $48,929 | $0 |
| College or Associate's Degree | $60,000 | $33,438 |
| Bachelor's Degree | - | - |
| Graduate Degree | $128,125 | $45,833 |
| Total | $50,469 | $38,333 |
Family Income in Newton
Family Income Brackets in Newton
According to the Newton family income data, there are 120 families falling into the $75,000 to $99,999 income range, which is the most common income bracket and makes up 31.2% of all families. Conversely, the $150,000 to $199,999 income bracket is the least frequent group with only 5 families (1.3%) belonging to this category.
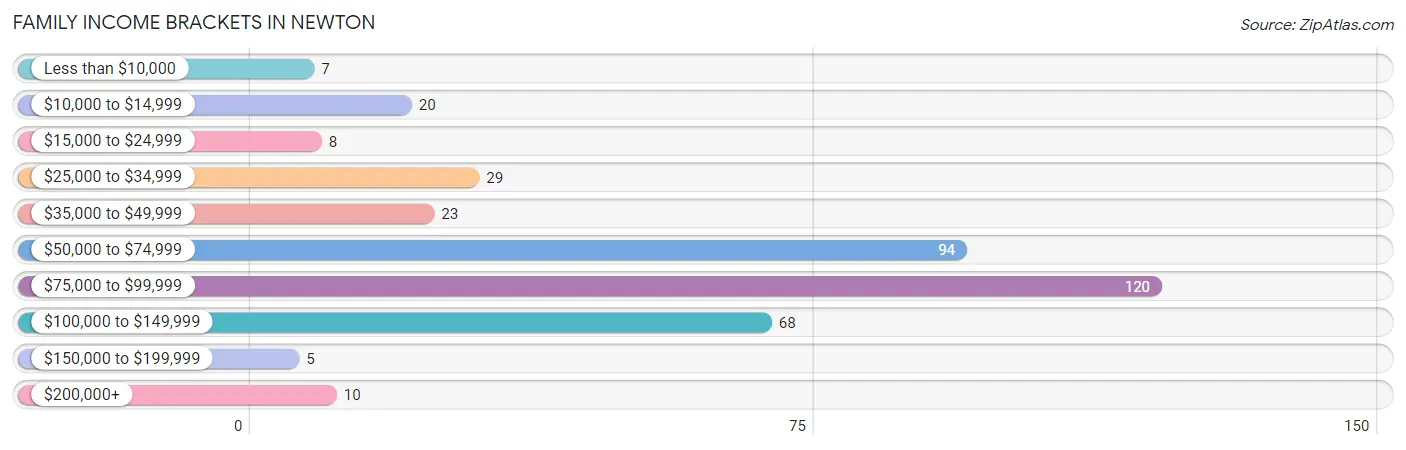
| Income Bracket | # Families | % Families |
| Less than $10,000 | 7 | 1.8% |
| $10,000 to $14,999 | 20 | 5.2% |
| $15,000 to $24,999 | 8 | 2.1% |
| $25,000 to $34,999 | 29 | 7.6% |
| $35,000 to $49,999 | 23 | 6.0% |
| $50,000 to $74,999 | 94 | 24.5% |
| $75,000 to $99,999 | 120 | 31.3% |
| $100,000 to $149,999 | 68 | 17.7% |
| $150,000 to $199,999 | 5 | 1.3% |
| $200,000+ | 10 | 2.6% |
Family Income by Famaliy Size in Newton
4-person families (83 | 21.6%) account for the highest median family income in Newton with $86,328 per family, while 2-person families (205 | 53.4%) have the highest median income of $36,125 per family member.
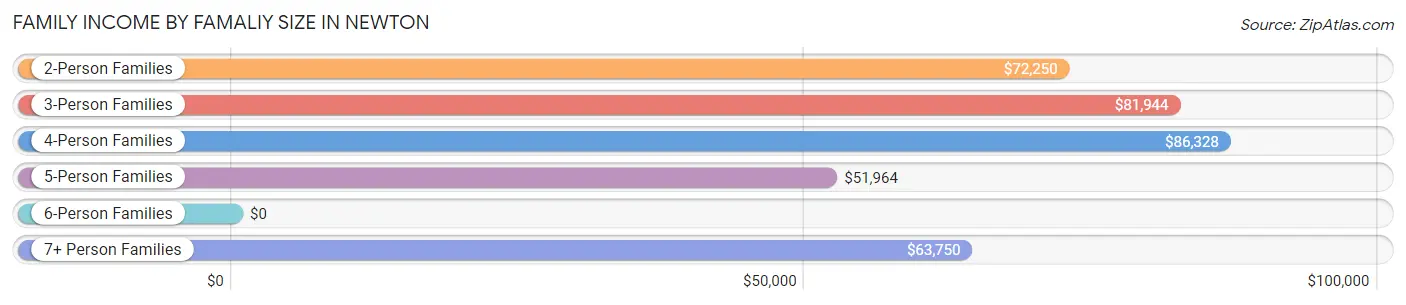
| Income Bracket | # Families | Median Income |
| 2-Person Families | 205 (53.4%) | $72,250 |
| 3-Person Families | 58 (15.1%) | $81,944 |
| 4-Person Families | 83 (21.6%) | $86,328 |
| 5-Person Families | 17 (4.4%) | $51,964 |
| 6-Person Families | 8 (2.1%) | $0 |
| 7+ Person Families | 13 (3.4%) | $63,750 |
| Total | 384 (100.0%) | $77,115 |
Family Income by Number of Earners in Newton
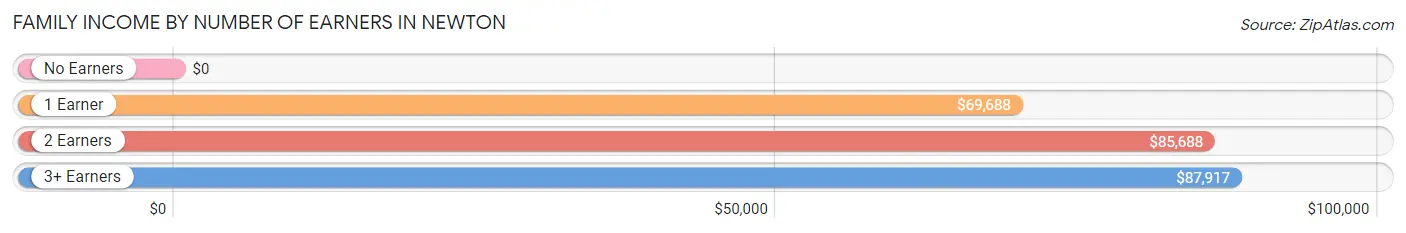
| Number of Earners | # Families | Median Income |
| No Earners | 107 (27.9%) | $0 |
| 1 Earner | 101 (26.3%) | $69,688 |
| 2 Earners | 133 (34.6%) | $85,688 |
| 3+ Earners | 43 (11.2%) | $87,917 |
| Total | 384 (100.0%) | $77,115 |
Household Income in Newton
Household Income Brackets in Newton
With 144 households falling in the category, the $75,000 to $99,999 income range is the most frequent in Newton, accounting for 24.1% of all households. In contrast, only 10 households (1.7%) fall into the $200,000+ income bracket, making it the least populous group.
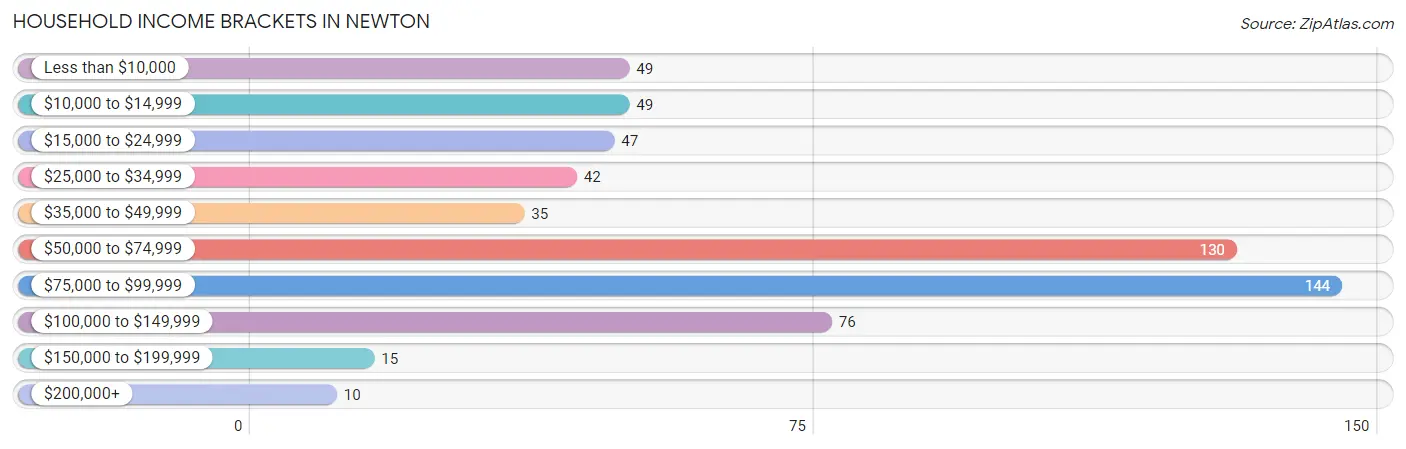
| Income Bracket | # Households | % Households |
| Less than $10,000 | 49 | 8.2% |
| $10,000 to $14,999 | 49 | 8.2% |
| $15,000 to $24,999 | 47 | 7.9% |
| $25,000 to $34,999 | 42 | 7.0% |
| $35,000 to $49,999 | 35 | 5.9% |
| $50,000 to $74,999 | 130 | 21.8% |
| $75,000 to $99,999 | 144 | 24.1% |
| $100,000 to $149,999 | 76 | 12.7% |
| $150,000 to $199,999 | 15 | 2.5% |
| $200,000+ | 10 | 1.7% |
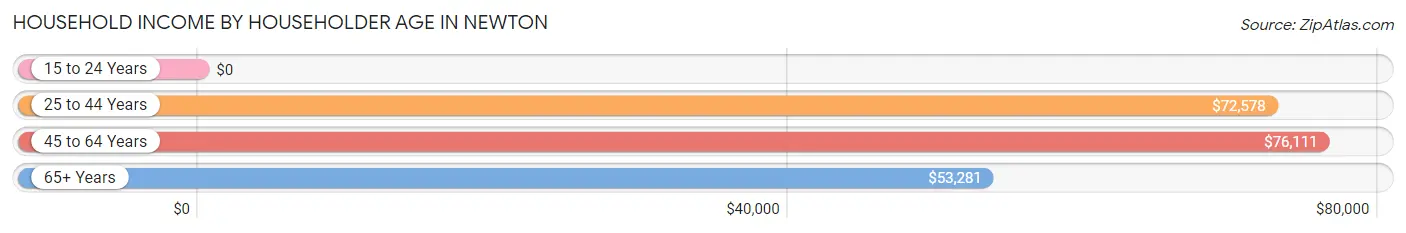
Household Income by Householder Age in Newton
The median household income in Newton is $64,297, with the highest median household income of $76,111 found in the 45 to 64 years age bracket for the primary householder. A total of 270 households (45.2%) fall into this category. Meanwhile, the 15 to 24 years age bracket for the primary householder has the lowest median household income of $0, with 5 households (0.8%) in this group.
| Income Bracket | # Households | Median Income |
| 15 to 24 Years | 5 (0.8%) | $0 |
| 25 to 44 Years | 131 (21.9%) | $72,578 |
| 45 to 64 Years | 270 (45.2%) | $76,111 |
| 65+ Years | 191 (32.0%) | $53,281 |
| Total | 597 (100.0%) | $64,297 |
Poverty in Newton
Income Below Poverty by Sex and Age in Newton
With 12.0% poverty level for males and 17.6% for females among the residents of Newton, 5 year old males and 25 to 34 year old females are the most vulnerable to poverty, with 7 males (63.6%) and 38 females (34.5%) in their respective age groups living below the poverty level.
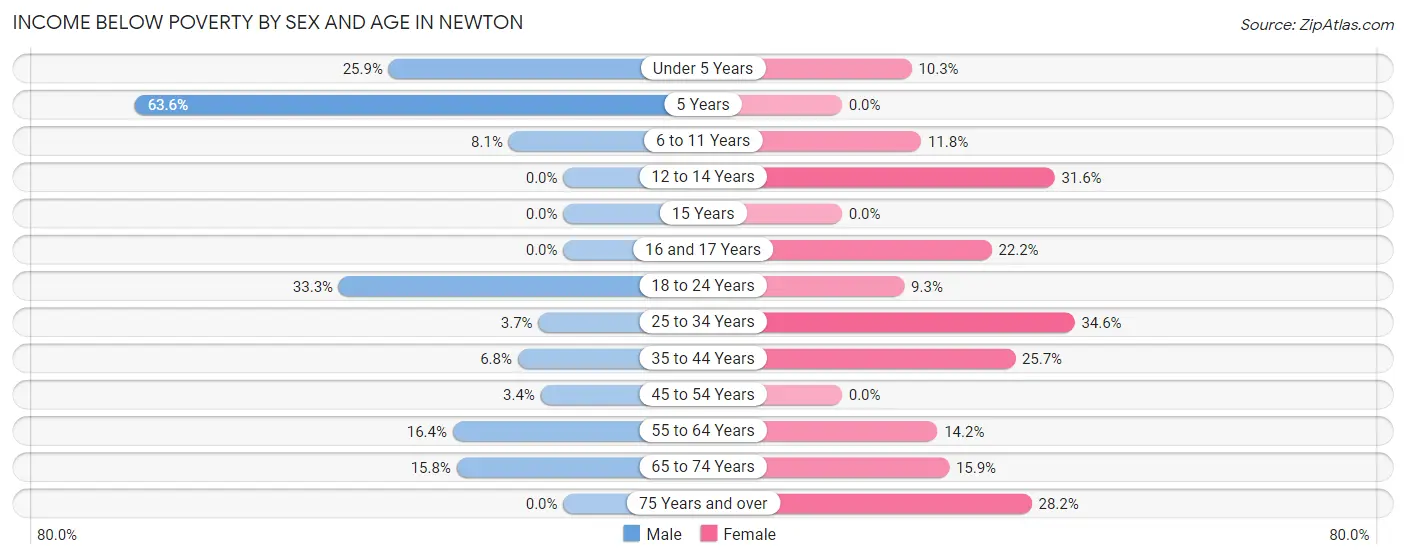
| Age Bracket | Male | Female |
| Under 5 Years | 7 (25.9%) | 3 (10.3%) |
| 5 Years | 7 (63.6%) | 0 (0.0%) |
| 6 to 11 Years | 6 (8.1%) | 6 (11.8%) |
| 12 to 14 Years | 0 (0.0%) | 18 (31.6%) |
| 15 Years | 0 (0.0%) | 0 (0.0%) |
| 16 and 17 Years | 0 (0.0%) | 2 (22.2%) |
| 18 to 24 Years | 22 (33.3%) | 5 (9.3%) |
| 25 to 34 Years | 3 (3.7%) | 38 (34.5%) |
| 35 to 44 Years | 5 (6.8%) | 9 (25.7%) |
| 45 to 54 Years | 3 (3.4%) | 0 (0.0%) |
| 55 to 64 Years | 22 (16.4%) | 18 (14.2%) |
| 65 to 74 Years | 16 (15.8%) | 14 (15.9%) |
| 75 Years and over | 0 (0.0%) | 20 (28.2%) |
| Total | 91 (12.0%) | 133 (17.6%) |
Income Above Poverty by Sex and Age in Newton
According to the poverty statistics in Newton, males aged 12 to 14 years and females aged 5 years are the age groups that are most secure financially, with 100.0% of males and 100.0% of females in these age groups living above the poverty line.
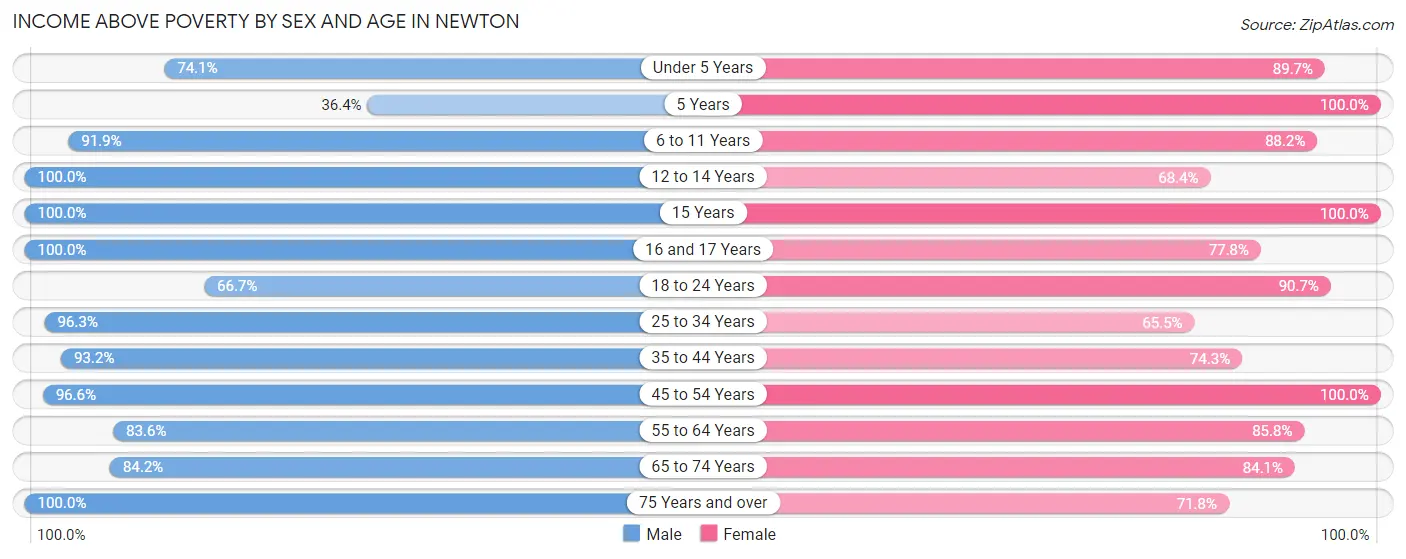
| Age Bracket | Male | Female |
| Under 5 Years | 20 (74.1%) | 26 (89.7%) |
| 5 Years | 4 (36.4%) | 17 (100.0%) |
| 6 to 11 Years | 68 (91.9%) | 45 (88.2%) |
| 12 to 14 Years | 23 (100.0%) | 39 (68.4%) |
| 15 Years | 9 (100.0%) | 3 (100.0%) |
| 16 and 17 Years | 27 (100.0%) | 7 (77.8%) |
| 18 to 24 Years | 44 (66.7%) | 49 (90.7%) |
| 25 to 34 Years | 78 (96.3%) | 72 (65.4%) |
| 35 to 44 Years | 69 (93.2%) | 26 (74.3%) |
| 45 to 54 Years | 86 (96.6%) | 106 (100.0%) |
| 55 to 64 Years | 112 (83.6%) | 109 (85.8%) |
| 65 to 74 Years | 85 (84.2%) | 74 (84.1%) |
| 75 Years and over | 45 (100.0%) | 51 (71.8%) |
| Total | 670 (88.0%) | 624 (82.4%) |
Income Below Poverty Among Married-Couple Families in Newton
The poverty statistics for married-couple families in Newton show that 6.1% or 18 of the total 295 families live below the poverty line. Families with 5 or more children have the highest poverty rate of 100.0%, comprising of 3 families. On the other hand, families with 3 or 4 children have the lowest poverty rate of 0.0%, which includes 0 families.
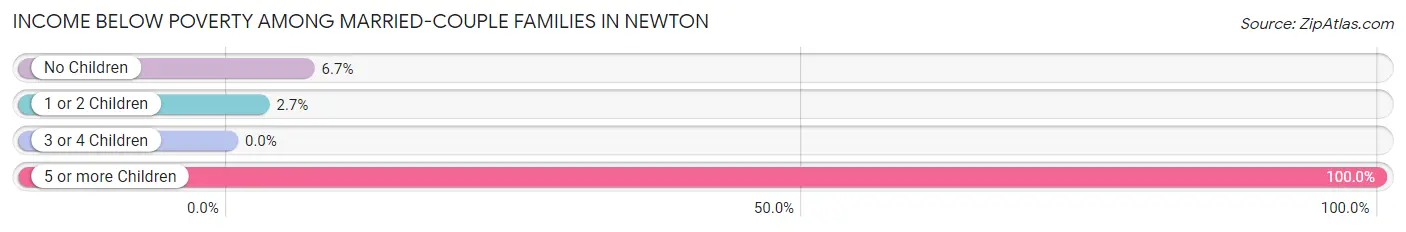
| Children | Above Poverty | Below Poverty |
| No Children | 182 (93.3%) | 13 (6.7%) |
| 1 or 2 Children | 71 (97.3%) | 2 (2.7%) |
| 3 or 4 Children | 24 (100.0%) | 0 (0.0%) |
| 5 or more Children | 0 (0.0%) | 3 (100.0%) |
| Total | 277 (93.9%) | 18 (6.1%) |
Income Below Poverty Among Single-Parent Households in Newton
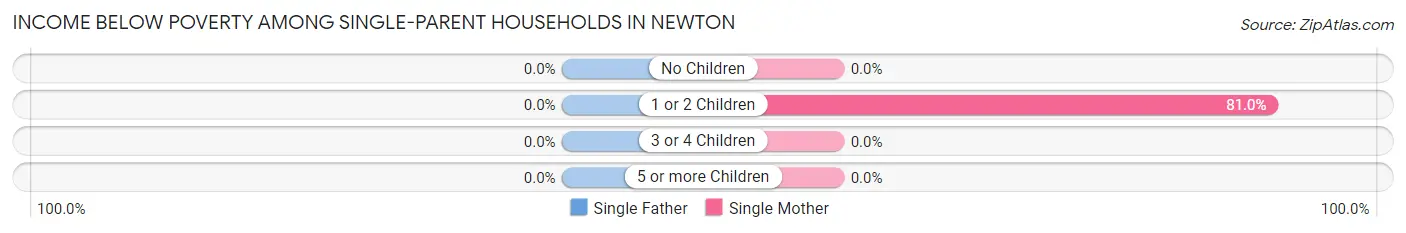
| Children | Single Father | Single Mother |
| No Children | 0 (0.0%) | 0 (0.0%) |
| 1 or 2 Children | 0 (0.0%) | 17 (80.9%) |
| 3 or 4 Children | 0 (0.0%) | 0 (0.0%) |
| 5 or more Children | 0 (0.0%) | 0 (0.0%) |
| Total | 0 (0.0%) | 17 (36.2%) |
Income Below Poverty Among Married-Couple vs Single-Parent Households in Newton
The poverty data for Newton shows that 18 of the married-couple family households (6.1%) and 17 of the single-parent households (19.1%) are living below the poverty level. Within the married-couple family households, those with 5 or more children have the highest poverty rate, with 3 households (100.0%) falling below the poverty line. Among the single-parent households, those with 1 or 2 children have the highest poverty rate, with 17 household (37.8%) living below poverty.
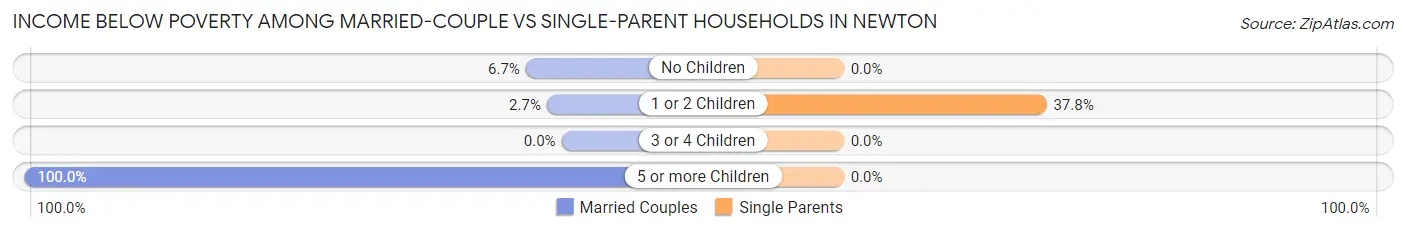
| Children | Married-Couple Families | Single-Parent Households |
| No Children | 13 (6.7%) | 0 (0.0%) |
| 1 or 2 Children | 2 (2.7%) | 17 (37.8%) |
| 3 or 4 Children | 0 (0.0%) | 0 (0.0%) |
| 5 or more Children | 3 (100.0%) | 0 (0.0%) |
| Total | 18 (6.1%) | 17 (19.1%) |
Race in Newton
The most populous races in Newton are White / Caucasian (1,314 | 86.0%), Black / African American (185 | 12.1%), and Two or more Races (25 | 1.6%).
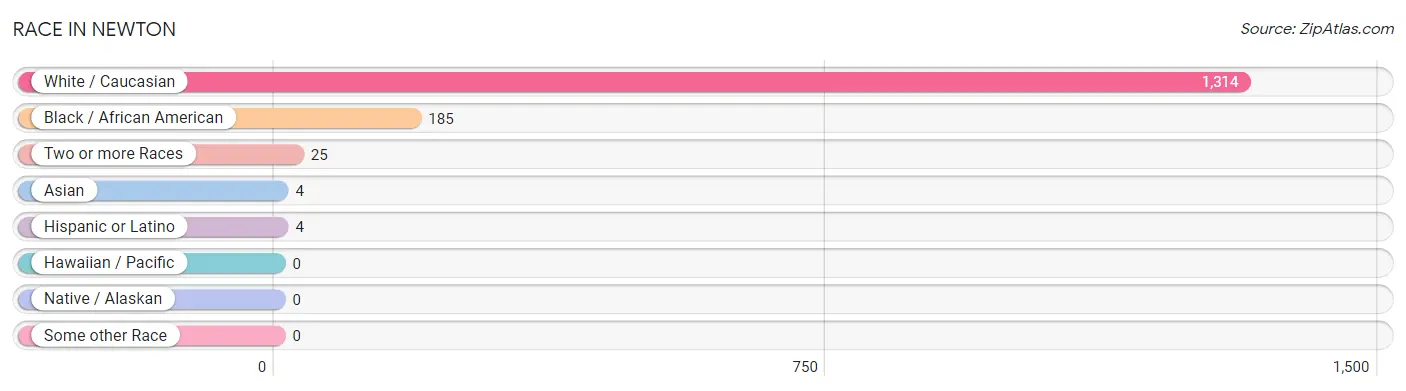
| Race | # Population | % Population |
| Asian | 4 | 0.3% |
| Black / African American | 185 | 12.1% |
| Hawaiian / Pacific | 0 | 0.0% |
| Hispanic or Latino | 4 | 0.3% |
| Native / Alaskan | 0 | 0.0% |
| White / Caucasian | 1,314 | 86.0% |
| Two or more Races | 25 | 1.6% |
| Some other Race | 0 | 0.0% |
| Total | 1,528 | 100.0% |
Ancestry in Newton
The most populous ancestries reported in Newton are American (342 | 22.4%), English (184 | 12.0%), Irish (118 | 7.7%), German (65 | 4.3%), and Scottish (27 | 1.8%), together accounting for 48.2% of all Newton residents.
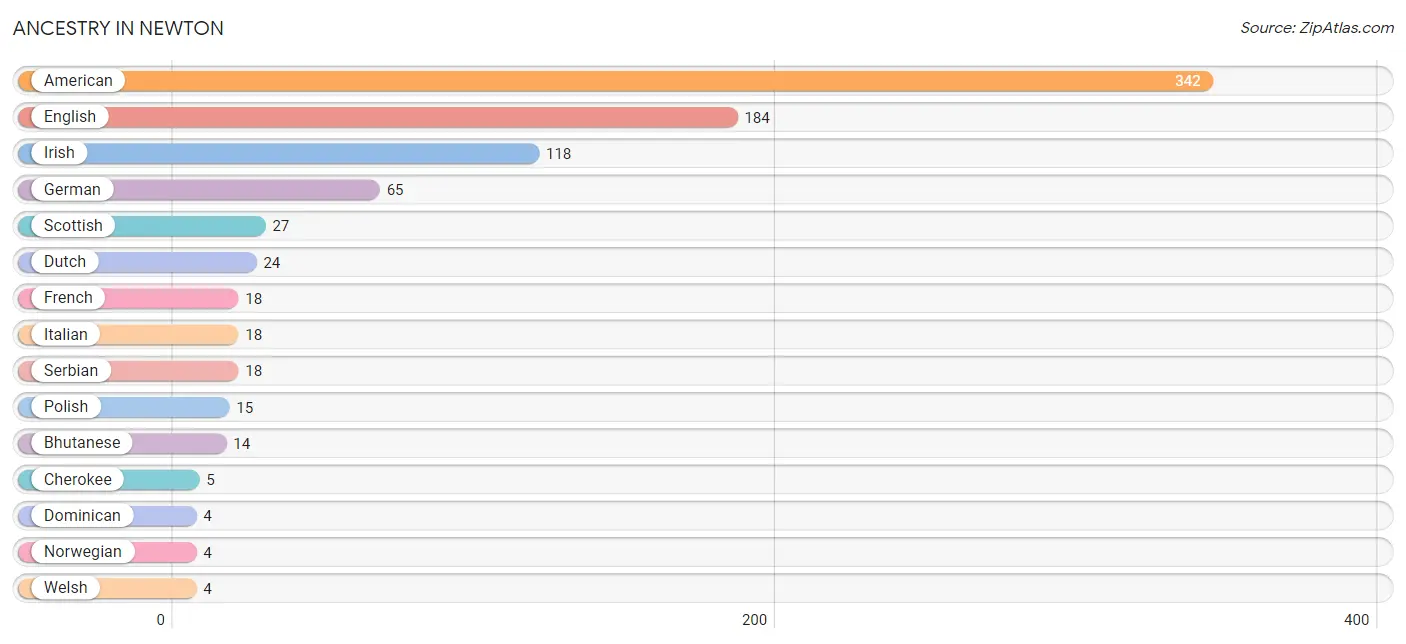
| Ancestry | # Population | % Population |
| American | 342 | 22.4% |
| Bhutanese | 14 | 0.9% |
| British | 3 | 0.2% |
| Cajun | 3 | 0.2% |
| Cherokee | 5 | 0.3% |
| Dominican | 4 | 0.3% |
| Dutch | 24 | 1.6% |
| Eastern European | 2 | 0.1% |
| English | 184 | 12.0% |
| French | 18 | 1.2% |
| German | 65 | 4.3% |
| Irish | 118 | 7.7% |
| Italian | 18 | 1.2% |
| Norwegian | 4 | 0.3% |
| Polish | 15 | 1.0% |
| Portuguese | 3 | 0.2% |
| Scotch-Irish | 2 | 0.1% |
| Scottish | 27 | 1.8% |
| Serbian | 18 | 1.2% |
| Slovak | 2 | 0.1% |
| Welsh | 4 | 0.3% | View All 21 Rows |
Immigrants in Newton
The most numerous immigrant groups reported in Newton came from Asia (4 | 0.3%), Eastern Asia (4 | 0.3%), Europe (4 | 0.3%), France (4 | 0.3%), and Japan (4 | 0.3%), together accounting for 1.3% of all Newton residents.
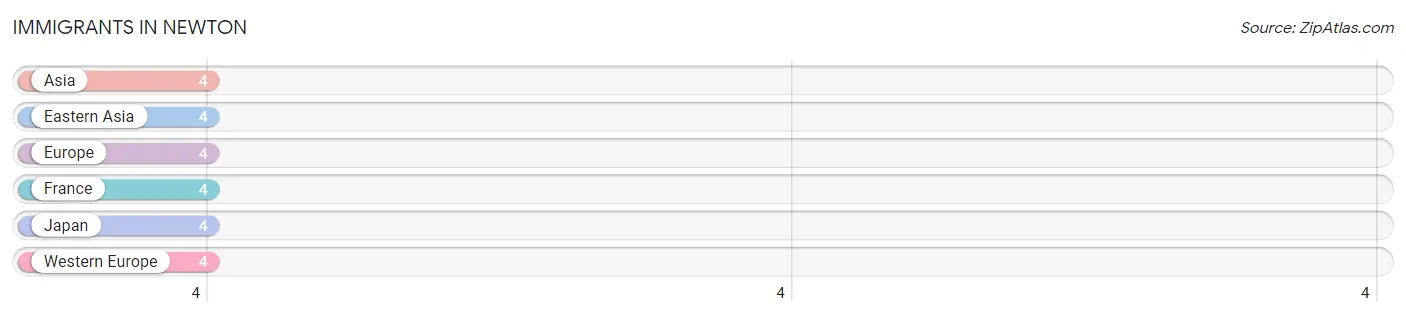
| Immigration Origin | # Population | % Population |
| Asia | 4 | 0.3% |
| Eastern Asia | 4 | 0.3% |
| Europe | 4 | 0.3% |
| France | 4 | 0.3% |
| Japan | 4 | 0.3% |
| Western Europe | 4 | 0.3% | View All 6 Rows |
Sex and Age in Newton
Sex and Age in Newton
The most populous age groups in Newton are 55 to 59 Years (76 | 10.0%) for men and 30 to 34 Years (95 | 12.4%) for women.
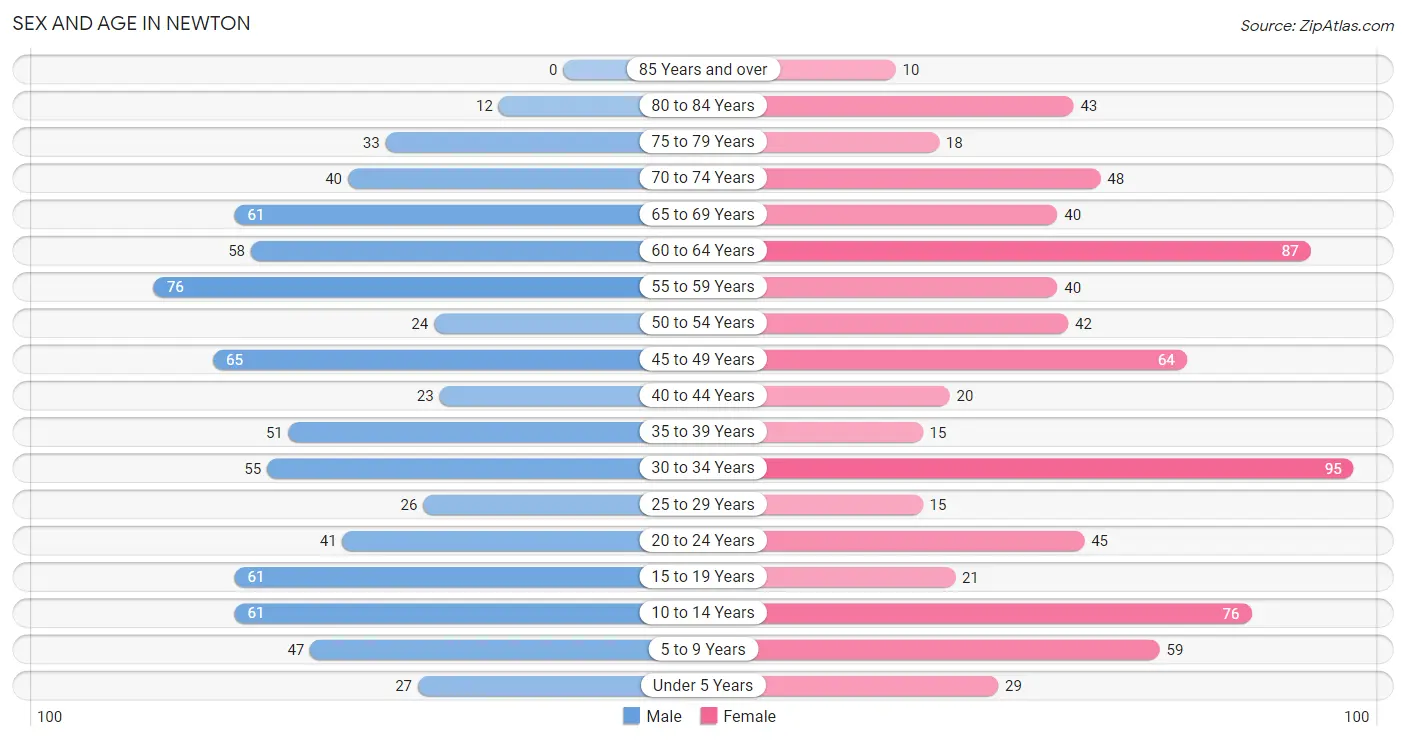
| Age Bracket | Male | Female |
| Under 5 Years | 27 (3.5%) | 29 (3.8%) |
| 5 to 9 Years | 47 (6.2%) | 59 (7.7%) |
| 10 to 14 Years | 61 (8.0%) | 76 (9.9%) |
| 15 to 19 Years | 61 (8.0%) | 21 (2.7%) |
| 20 to 24 Years | 41 (5.4%) | 45 (5.9%) |
| 25 to 29 Years | 26 (3.4%) | 15 (2.0%) |
| 30 to 34 Years | 55 (7.2%) | 95 (12.4%) |
| 35 to 39 Years | 51 (6.7%) | 15 (2.0%) |
| 40 to 44 Years | 23 (3.0%) | 20 (2.6%) |
| 45 to 49 Years | 65 (8.5%) | 64 (8.3%) |
| 50 to 54 Years | 24 (3.2%) | 42 (5.5%) |
| 55 to 59 Years | 76 (10.0%) | 40 (5.2%) |
| 60 to 64 Years | 58 (7.6%) | 87 (11.3%) |
| 65 to 69 Years | 61 (8.0%) | 40 (5.2%) |
| 70 to 74 Years | 40 (5.3%) | 48 (6.3%) |
| 75 to 79 Years | 33 (4.3%) | 18 (2.4%) |
| 80 to 84 Years | 12 (1.6%) | 43 (5.6%) |
| 85 Years and over | 0 (0.0%) | 10 (1.3%) |
| Total | 761 (100.0%) | 767 (100.0%) |
Families and Households in Newton
Median Family Size in Newton
The median family size in Newton is 3.32 persons per family, with single male/father families (42 | 10.9%) accounting for the largest median family size of 3.81 persons per family. On the other hand, single female/mother families (47 | 12.2%) represent the smallest median family size with 2.57 persons per family.
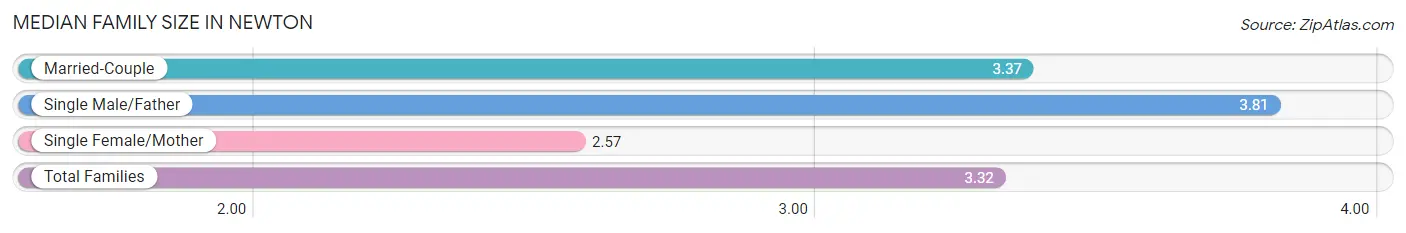
| Family Type | # Families | Family Size |
| Married-Couple | 295 (76.8%) | 3.37 |
| Single Male/Father | 42 (10.9%) | 3.81 |
| Single Female/Mother | 47 (12.2%) | 2.57 |
| Total Families | 384 (100.0%) | 3.32 |
Median Household Size in Newton
The median household size in Newton is 2.56 persons per household, with single male/father households (42 | 7.0%) accounting for the largest median household size of 3.98 persons per household. non-family households (213 | 35.7%) represent the smallest median household size with 1.15 persons per household.
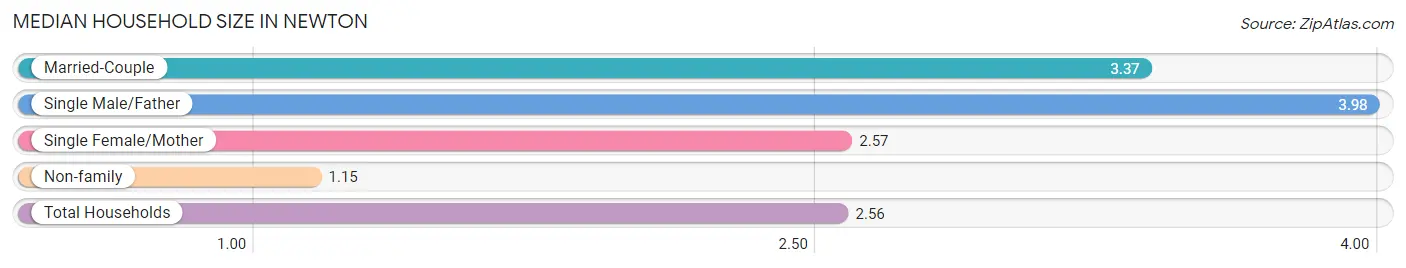
| Household Type | # Households | Household Size |
| Married-Couple | 295 (49.4%) | 3.37 |
| Single Male/Father | 42 (7.0%) | 3.98 |
| Single Female/Mother | 47 (7.9%) | 2.57 |
| Non-family | 213 (35.7%) | 1.15 |
| Total Households | 597 (100.0%) | 2.56 |
Household Size by Marriage Status in Newton
Out of a total of 597 households in Newton, 384 (64.3%) are family households, while 213 (35.7%) are nonfamily households. The most numerous type of family households are 2-person households, comprising 205, and the most common type of nonfamily households are 1-person households, comprising 190.
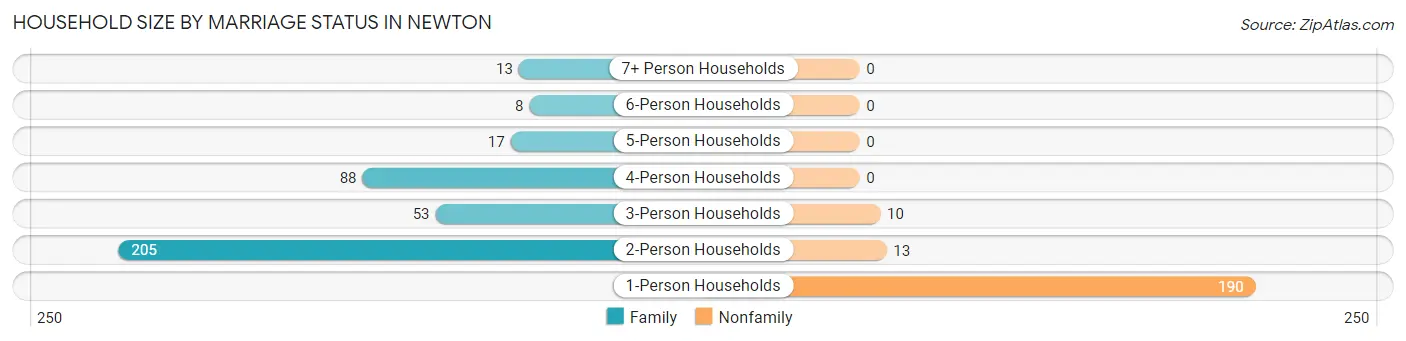
| Household Size | Family Households | Nonfamily Households |
| 1-Person Households | - | 190 (31.8%) |
| 2-Person Households | 205 (34.3%) | 13 (2.2%) |
| 3-Person Households | 53 (8.9%) | 10 (1.7%) |
| 4-Person Households | 88 (14.7%) | 0 (0.0%) |
| 5-Person Households | 17 (2.9%) | 0 (0.0%) |
| 6-Person Households | 8 (1.3%) | 0 (0.0%) |
| 7+ Person Households | 13 (2.2%) | 0 (0.0%) |
| Total | 384 (64.3%) | 213 (35.7%) |
Female Fertility in Newton
Fertility by Age in Newton
Average fertility rate in Newton is 10.0 births per 1,000 women. Women in the age bracket of 20 to 34 years have the highest fertility rate with 19.0 births per 1,000 women. Women in the age bracket of 20 to 34 years acount for 100.0% of all women with births.
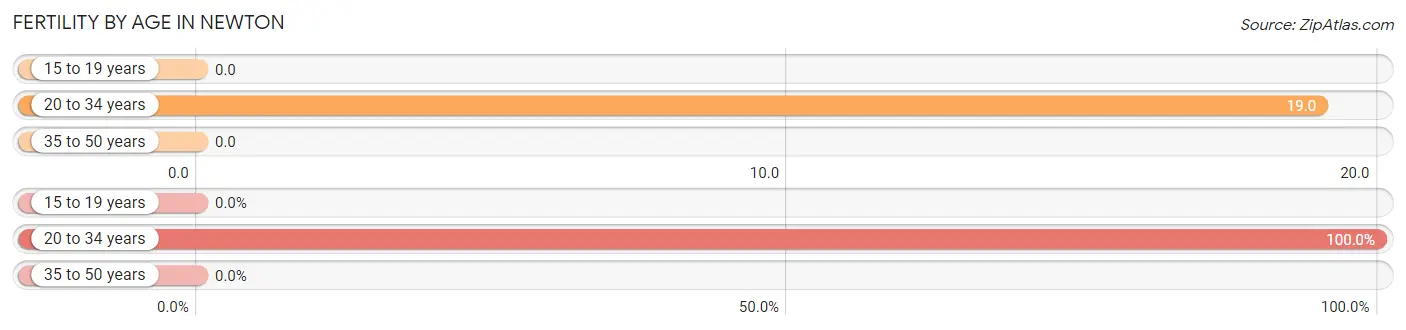
| Age Bracket | Women with Births | Births / 1,000 Women |
| 15 to 19 years | 0 (0.0%) | 0.0 |
| 20 to 34 years | 3 (100.0%) | 19.0 |
| 35 to 50 years | 0 (0.0%) | 0.0 |
| Total | 3 (100.0%) | 10.0 |
Fertility by Age by Marriage Status in Newton
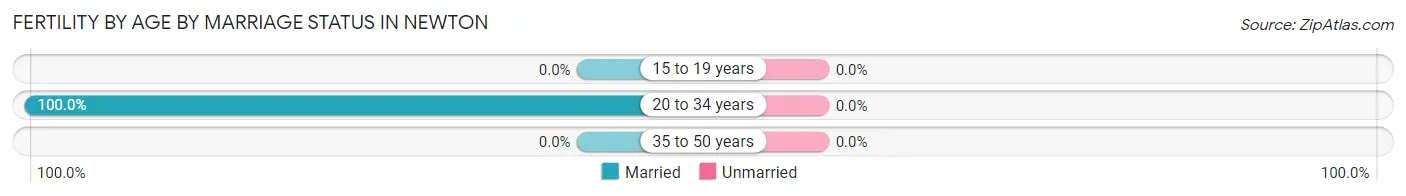
| Age Bracket | Married | Unmarried |
| 15 to 19 years | 0 (0.0%) | 0 (0.0%) |
| 20 to 34 years | 3 (100.0%) | 0 (0.0%) |
| 35 to 50 years | 0 (0.0%) | 0 (0.0%) |
| Total | 3 (100.0%) | 0 (0.0%) |
Fertility by Education in Newton
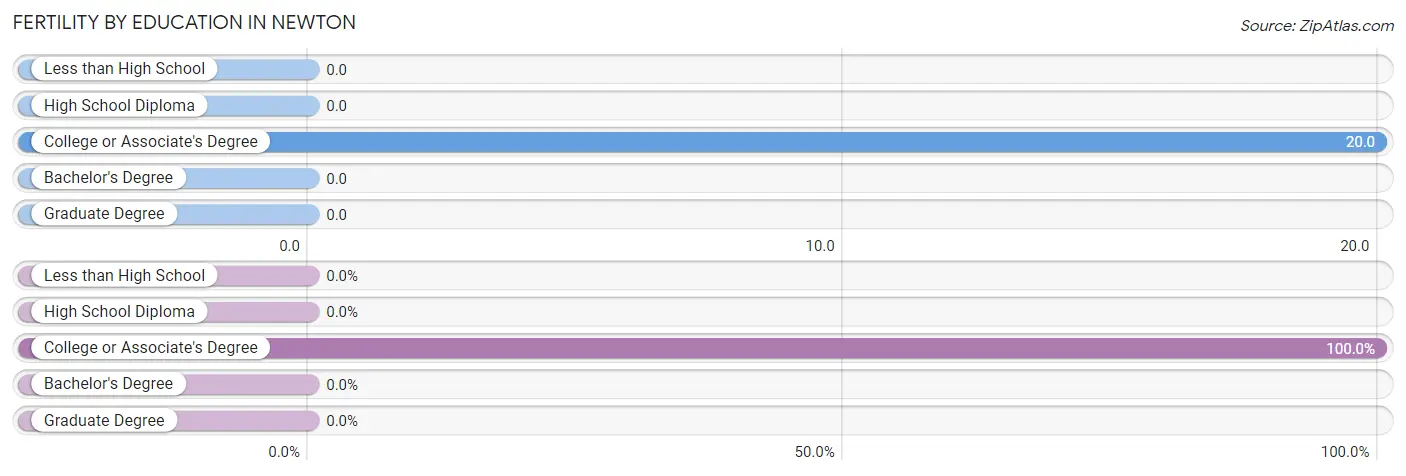
| Educational Attainment | Women with Births | Births / 1,000 Women |
| Less than High School | 0 (0.0%) | 0.0 |
| High School Diploma | 0 (0.0%) | 0.0 |
| College or Associate's Degree | 3 (100.0%) | 20.0 |
| Bachelor's Degree | 0 (0.0%) | 0.0 |
| Graduate Degree | 0 (0.0%) | 0.0 |
| Total | 3 (100.0%) | 10.0 |
Fertility by Education by Marriage Status in Newton
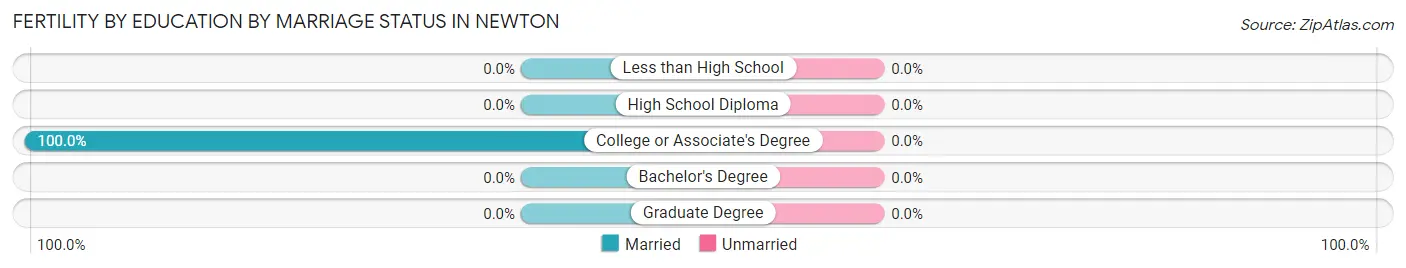
| Educational Attainment | Married | Unmarried |
| Less than High School | 0 (0.0%) | 0 (0.0%) |
| High School Diploma | 0 (0.0%) | 0 (0.0%) |
| College or Associate's Degree | 3 (100.0%) | 0 (0.0%) |
| Bachelor's Degree | 0 (0.0%) | 0 (0.0%) |
| Graduate Degree | 0 (0.0%) | 0 (0.0%) |
| Total | 3 (100.0%) | 0 (0.0%) |
Employment Characteristics in Newton
Employment by Class of Employer in Newton
Among the 528 employed individuals in Newton, private company employees (374 | 70.8%), local government employees (40 | 7.6%), and not-for-profit organizations (34 | 6.4%) make up the most common classes of employment.
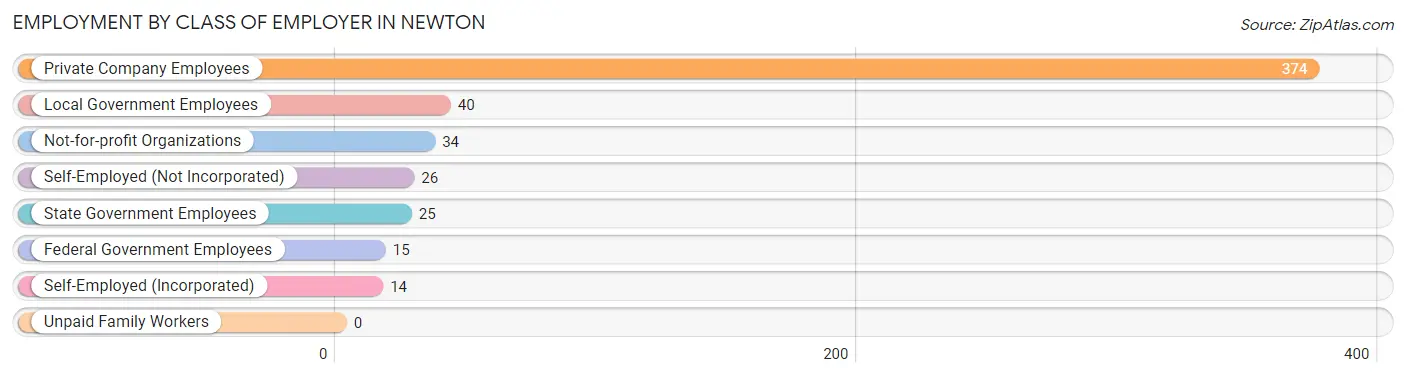
| Employer Class | # Employees | % Employees |
| Private Company Employees | 374 | 70.8% |
| Self-Employed (Incorporated) | 14 | 2.6% |
| Self-Employed (Not Incorporated) | 26 | 4.9% |
| Not-for-profit Organizations | 34 | 6.4% |
| Local Government Employees | 40 | 7.6% |
| State Government Employees | 25 | 4.7% |
| Federal Government Employees | 15 | 2.8% |
| Unpaid Family Workers | 0 | 0.0% |
| Total | 528 | 100.0% |
Employment Status by Age in Newton
According to the labor force statistics for Newton, out of the total population over 16 years of age (1,217), 46.9% or 571 individuals are in the labor force, with 4.0% or 23 of them unemployed. The age group with the highest labor force participation rate is 25 to 29 years, with 90.2% or 37 individuals in the labor force. Within the labor force, the 25 to 29 years age range has the highest percentage of unemployed individuals, with 40.5% or 15 of them being unemployed.
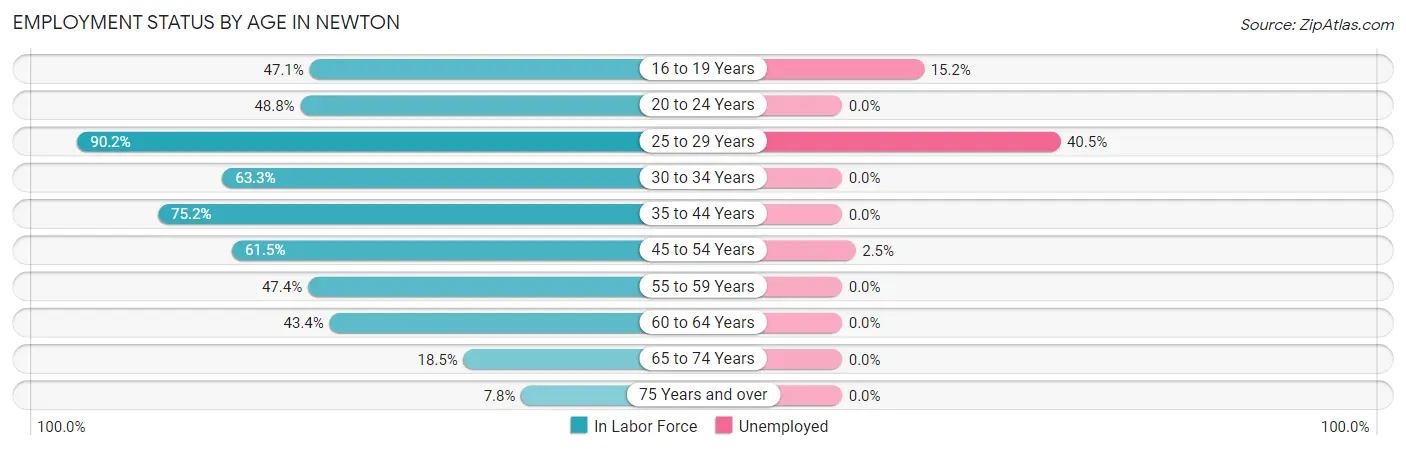
| Age Bracket | In Labor Force | Unemployed |
| 16 to 19 Years | 33 (47.1%) | 5 (15.2%) |
| 20 to 24 Years | 42 (48.8%) | 0 (0.0%) |
| 25 to 29 Years | 37 (90.2%) | 15 (40.5%) |
| 30 to 34 Years | 95 (63.3%) | 0 (0.0%) |
| 35 to 44 Years | 82 (75.2%) | 0 (0.0%) |
| 45 to 54 Years | 120 (61.5%) | 3 (2.5%) |
| 55 to 59 Years | 55 (47.4%) | 0 (0.0%) |
| 60 to 64 Years | 63 (43.4%) | 0 (0.0%) |
| 65 to 74 Years | 35 (18.5%) | 0 (0.0%) |
| 75 Years and over | 9 (7.8%) | 0 (0.0%) |
| Total | 571 (46.9%) | 23 (4.0%) |
Employment Status by Educational Attainment in Newton
According to labor force statistics for Newton, 59.8% of individuals (452) out of the total population between 25 and 64 years of age (756) are in the labor force, with 4.0% or 18 of them being unemployed. The group with the highest labor force participation rate are those with the educational attainment of bachelor's degree or higher, with 81.7% or 85 individuals in the labor force. Within the labor force, individuals with bachelor's degree or higher education have the highest percentage of unemployment, with 10.6% or 9 of them being unemployed.
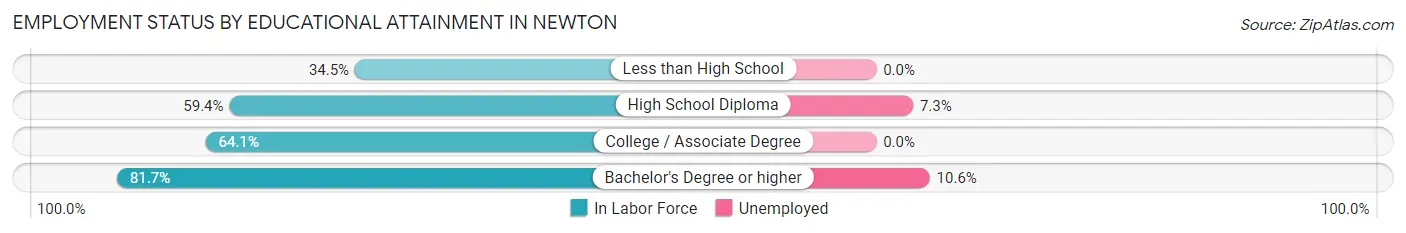
| Educational Attainment | In Labor Force | Unemployed |
| Less than High School | 48 (34.5%) | 0 (0.0%) |
| High School Diploma | 123 (59.4%) | 15 (7.3%) |
| College / Associate Degree | 196 (64.1%) | 0 (0.0%) |
| Bachelor's Degree or higher | 85 (81.7%) | 11 (10.6%) |
| Total | 452 (59.8%) | 30 (4.0%) |
Employment Occupations by Sex in Newton
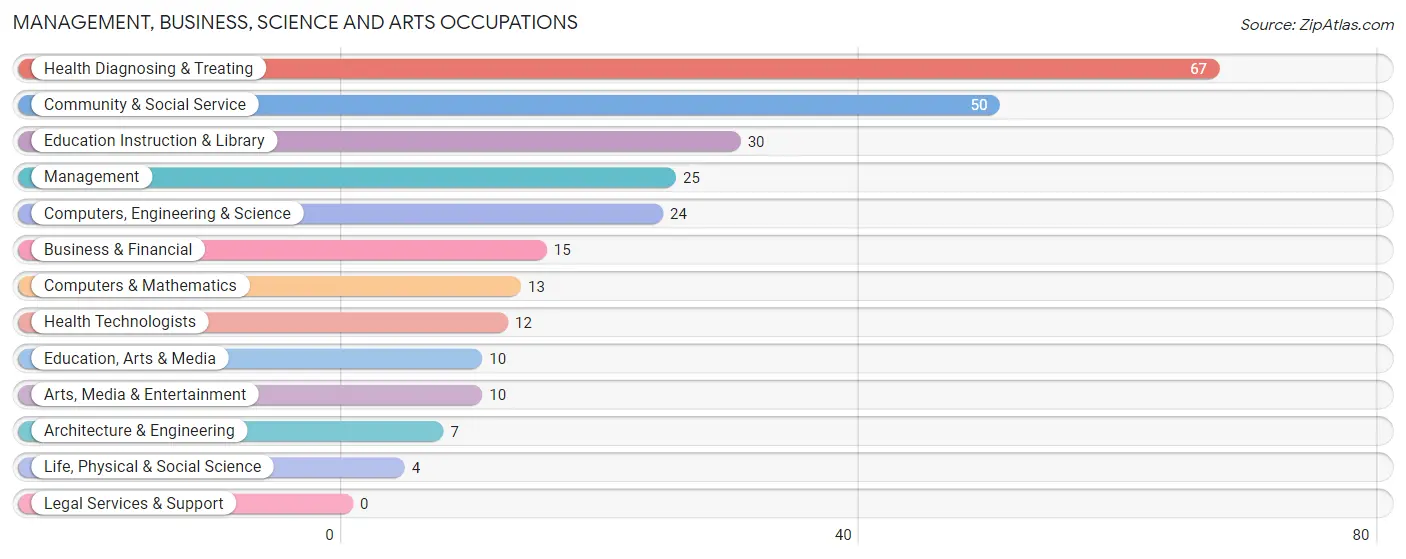
Management, Business, Science and Arts Occupations
The most common Management, Business, Science and Arts occupations in Newton are Health Diagnosing & Treating (67 | 12.2%), Community & Social Service (50 | 9.1%), Education Instruction & Library (30 | 5.5%), Management (25 | 4.6%), and Computers, Engineering & Science (24 | 4.4%).
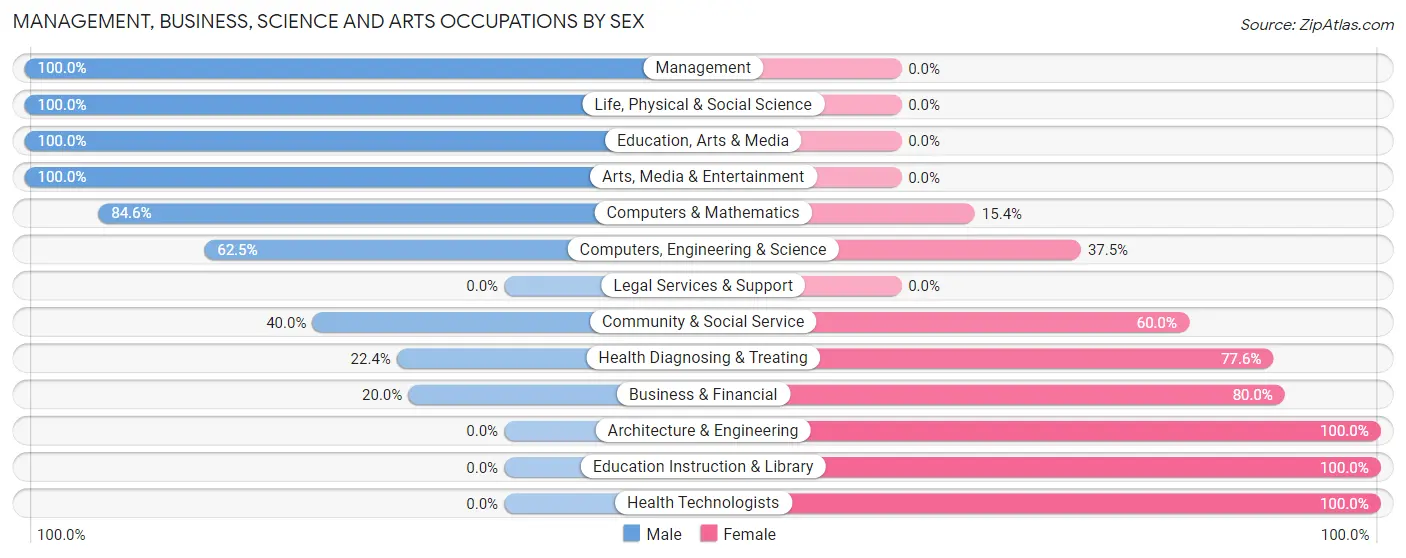
Management, Business, Science and Arts Occupations by Sex
Within the Management, Business, Science and Arts occupations in Newton, the most male-oriented occupations are Management (100.0%), Life, Physical & Social Science (100.0%), and Education, Arts & Media (100.0%), while the most female-oriented occupations are Architecture & Engineering (100.0%), Education Instruction & Library (100.0%), and Health Technologists (100.0%).
| Occupation | Male | Female |
| Management | 25 (100.0%) | 0 (0.0%) |
| Business & Financial | 3 (20.0%) | 12 (80.0%) |
| Computers, Engineering & Science | 15 (62.5%) | 9 (37.5%) |
| Computers & Mathematics | 11 (84.6%) | 2 (15.4%) |
| Architecture & Engineering | 0 (0.0%) | 7 (100.0%) |
| Life, Physical & Social Science | 4 (100.0%) | 0 (0.0%) |
| Community & Social Service | 20 (40.0%) | 30 (60.0%) |
| Education, Arts & Media | 10 (100.0%) | 0 (0.0%) |
| Legal Services & Support | 0 (0.0%) | 0 (0.0%) |
| Education Instruction & Library | 0 (0.0%) | 30 (100.0%) |
| Arts, Media & Entertainment | 10 (100.0%) | 0 (0.0%) |
| Health Diagnosing & Treating | 15 (22.4%) | 52 (77.6%) |
| Health Technologists | 0 (0.0%) | 12 (100.0%) |
| Total (Category) | 78 (43.1%) | 103 (56.9%) |
| Total (Overall) | 307 (56.0%) | 241 (44.0%) |
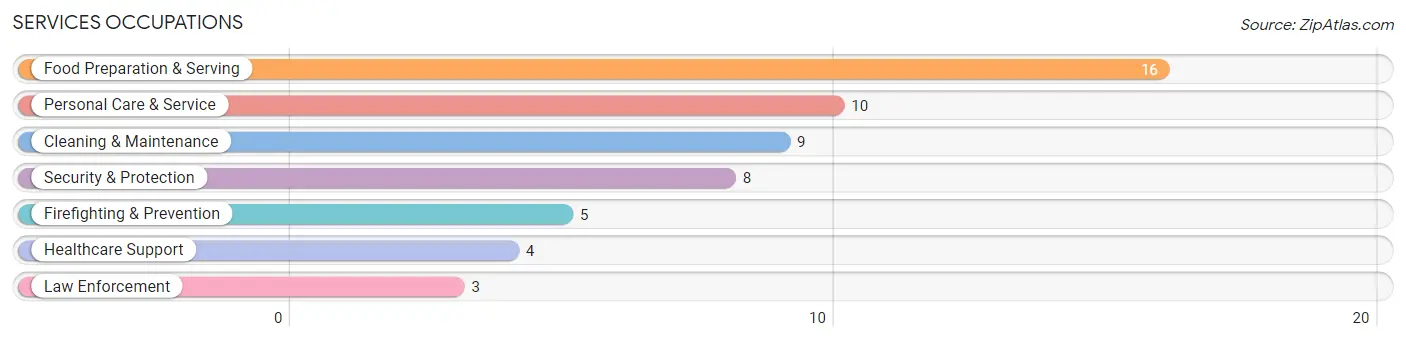
Services Occupations
The most common Services occupations in Newton are Food Preparation & Serving (16 | 2.9%), Personal Care & Service (10 | 1.8%), Cleaning & Maintenance (9 | 1.6%), Security & Protection (8 | 1.5%), and Firefighting & Prevention (5 | 0.9%).
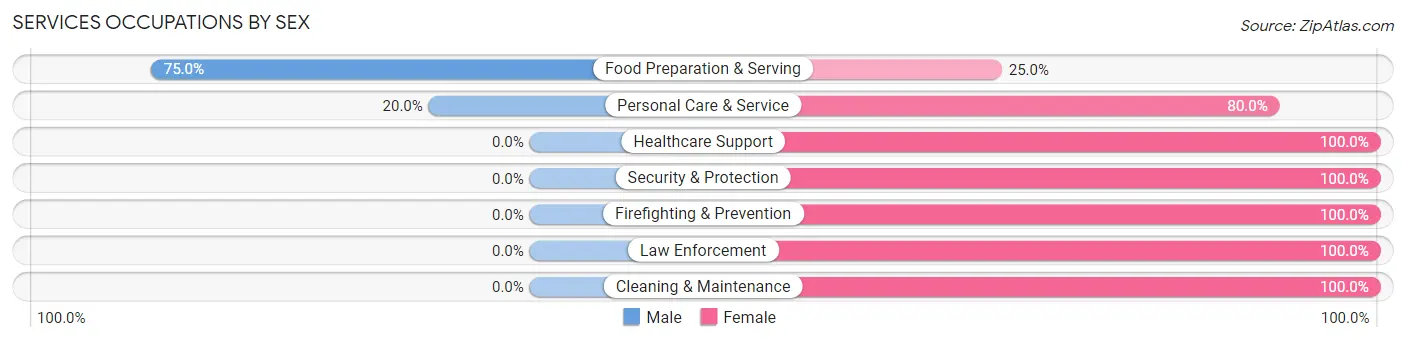
Services Occupations by Sex
Within the Services occupations in Newton, the most male-oriented occupations are Food Preparation & Serving (75.0%), and Personal Care & Service (20.0%), while the most female-oriented occupations are Healthcare Support (100.0%), Security & Protection (100.0%), and Firefighting & Prevention (100.0%).
| Occupation | Male | Female |
| Healthcare Support | 0 (0.0%) | 4 (100.0%) |
| Security & Protection | 0 (0.0%) | 8 (100.0%) |
| Firefighting & Prevention | 0 (0.0%) | 5 (100.0%) |
| Law Enforcement | 0 (0.0%) | 3 (100.0%) |
| Food Preparation & Serving | 12 (75.0%) | 4 (25.0%) |
| Cleaning & Maintenance | 0 (0.0%) | 9 (100.0%) |
| Personal Care & Service | 2 (20.0%) | 8 (80.0%) |
| Total (Category) | 14 (29.8%) | 33 (70.2%) |
| Total (Overall) | 307 (56.0%) | 241 (44.0%) |
Sales and Office Occupations
The most common Sales and Office occupations in Newton are Sales & Related (90 | 16.4%), and Office & Administration (49 | 8.9%).
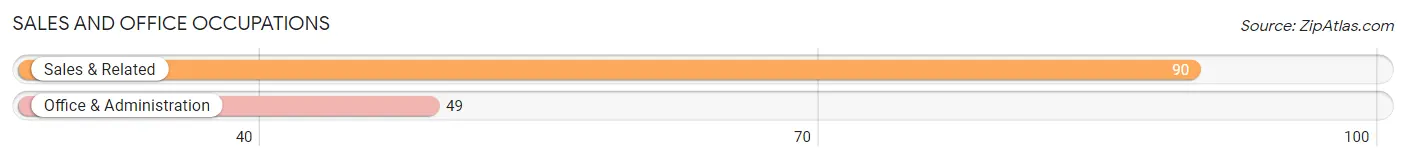
Sales and Office Occupations by Sex
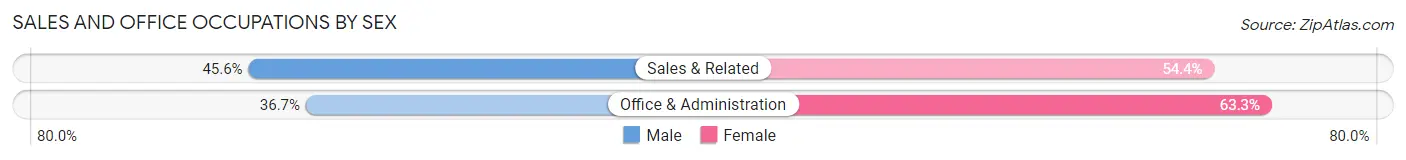
| Occupation | Male | Female |
| Sales & Related | 41 (45.6%) | 49 (54.4%) |
| Office & Administration | 18 (36.7%) | 31 (63.3%) |
| Total (Category) | 59 (42.4%) | 80 (57.6%) |
| Total (Overall) | 307 (56.0%) | 241 (44.0%) |
Natural Resources, Construction and Maintenance Occupations
The most common Natural Resources, Construction and Maintenance occupations in Newton are Installation, Maintenance & Repair (66 | 12.0%), Construction & Extraction (12 | 2.2%), and Farming, Fishing & Forestry (5 | 0.9%).
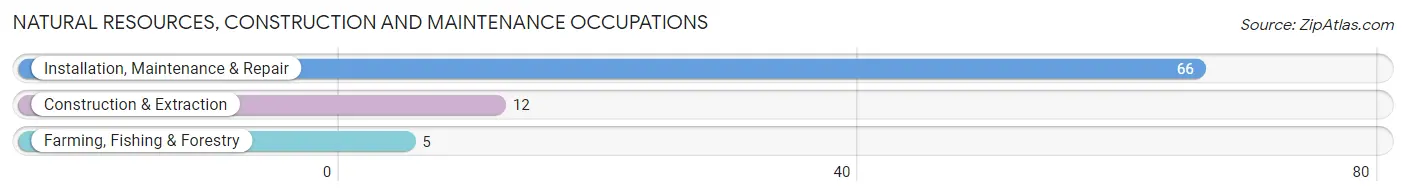
Natural Resources, Construction and Maintenance Occupations by Sex
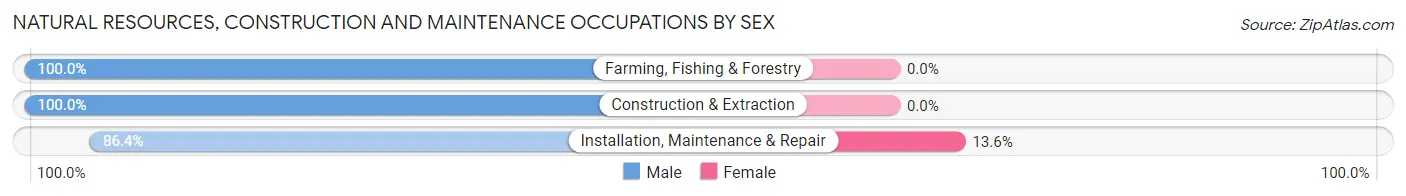
| Occupation | Male | Female |
| Farming, Fishing & Forestry | 5 (100.0%) | 0 (0.0%) |
| Construction & Extraction | 12 (100.0%) | 0 (0.0%) |
| Installation, Maintenance & Repair | 57 (86.4%) | 9 (13.6%) |
| Total (Category) | 74 (89.2%) | 9 (10.8%) |
| Total (Overall) | 307 (56.0%) | 241 (44.0%) |
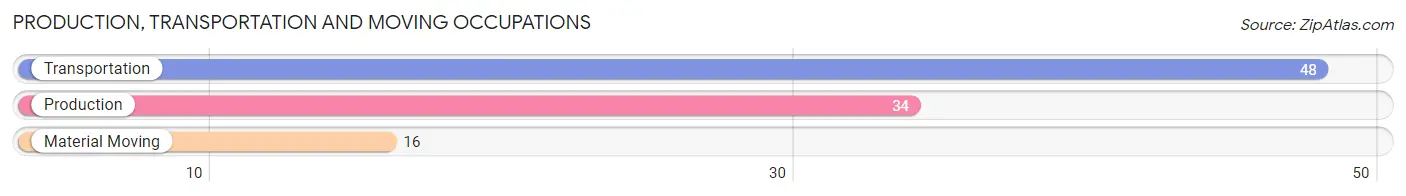
Production, Transportation and Moving Occupations
The most common Production, Transportation and Moving occupations in Newton are Transportation (48 | 8.8%), Production (34 | 6.2%), and Material Moving (16 | 2.9%).
Production, Transportation and Moving Occupations by Sex
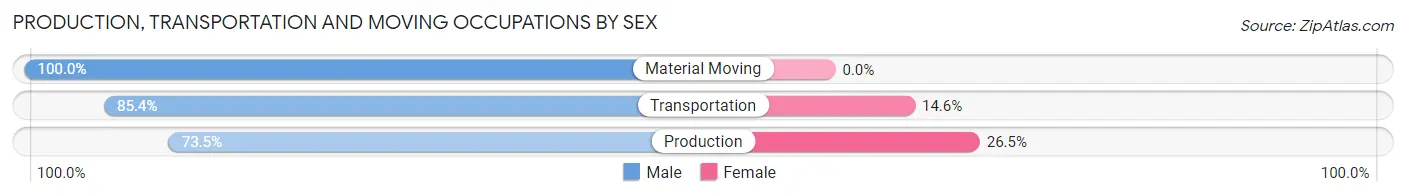
| Occupation | Male | Female |
| Production | 25 (73.5%) | 9 (26.5%) |
| Transportation | 41 (85.4%) | 7 (14.6%) |
| Material Moving | 16 (100.0%) | 0 (0.0%) |
| Total (Category) | 82 (83.7%) | 16 (16.3%) |
| Total (Overall) | 307 (56.0%) | 241 (44.0%) |
Employment Industries by Sex in Newton
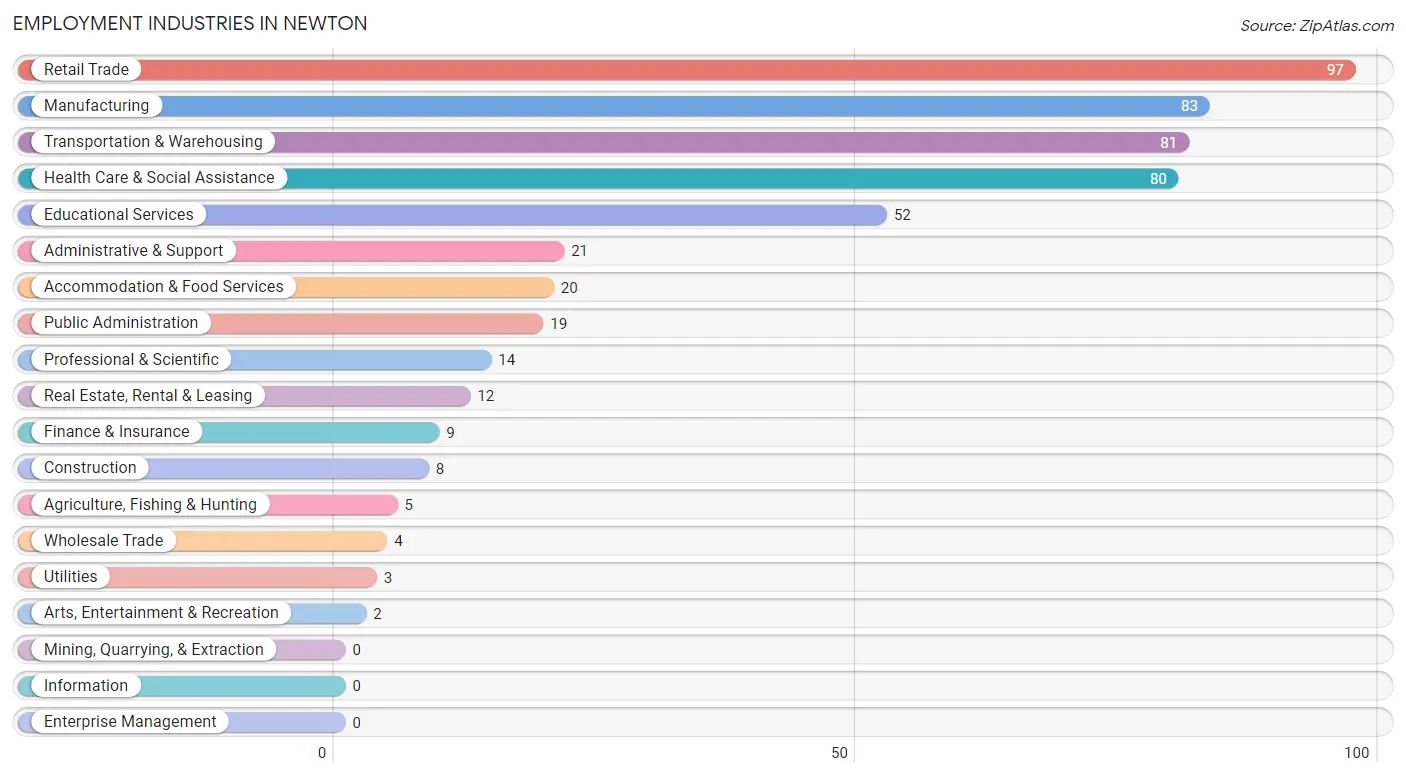
Employment Industries in Newton
The major employment industries in Newton include Retail Trade (97 | 17.7%), Manufacturing (83 | 15.1%), Transportation & Warehousing (81 | 14.8%), Health Care & Social Assistance (80 | 14.6%), and Educational Services (52 | 9.5%).
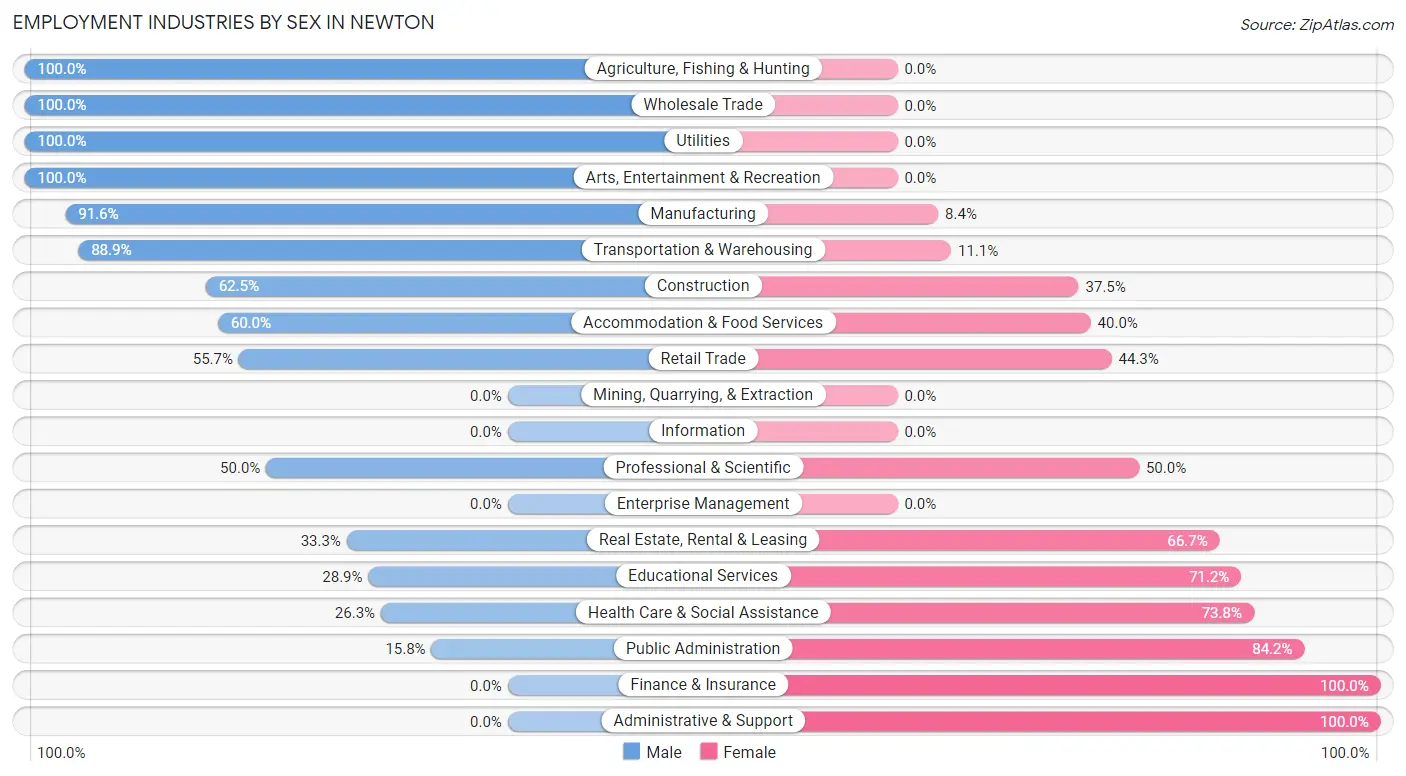
Employment Industries by Sex in Newton
The Newton industries that see more men than women are Agriculture, Fishing & Hunting (100.0%), Wholesale Trade (100.0%), and Utilities (100.0%), whereas the industries that tend to have a higher number of women are Finance & Insurance (100.0%), Administrative & Support (100.0%), and Public Administration (84.2%).
| Industry | Male | Female |
| Agriculture, Fishing & Hunting | 5 (100.0%) | 0 (0.0%) |
| Mining, Quarrying, & Extraction | 0 (0.0%) | 0 (0.0%) |
| Construction | 5 (62.5%) | 3 (37.5%) |
| Manufacturing | 76 (91.6%) | 7 (8.4%) |
| Wholesale Trade | 4 (100.0%) | 0 (0.0%) |
| Retail Trade | 54 (55.7%) | 43 (44.3%) |
| Transportation & Warehousing | 72 (88.9%) | 9 (11.1%) |
| Utilities | 3 (100.0%) | 0 (0.0%) |
| Information | 0 (0.0%) | 0 (0.0%) |
| Finance & Insurance | 0 (0.0%) | 9 (100.0%) |
| Real Estate, Rental & Leasing | 4 (33.3%) | 8 (66.7%) |
| Professional & Scientific | 7 (50.0%) | 7 (50.0%) |
| Enterprise Management | 0 (0.0%) | 0 (0.0%) |
| Administrative & Support | 0 (0.0%) | 21 (100.0%) |
| Educational Services | 15 (28.8%) | 37 (71.2%) |
| Health Care & Social Assistance | 21 (26.3%) | 59 (73.8%) |
| Arts, Entertainment & Recreation | 2 (100.0%) | 0 (0.0%) |
| Accommodation & Food Services | 12 (60.0%) | 8 (40.0%) |
| Public Administration | 3 (15.8%) | 16 (84.2%) |
| Total | 307 (56.0%) | 241 (44.0%) |
Education in Newton
School Enrollment in Newton
The most common levels of schooling among the 386 students in Newton are middle school (97 | 25.1%), college / undergraduate (92 | 23.8%), and elementary school (82 | 21.2%).
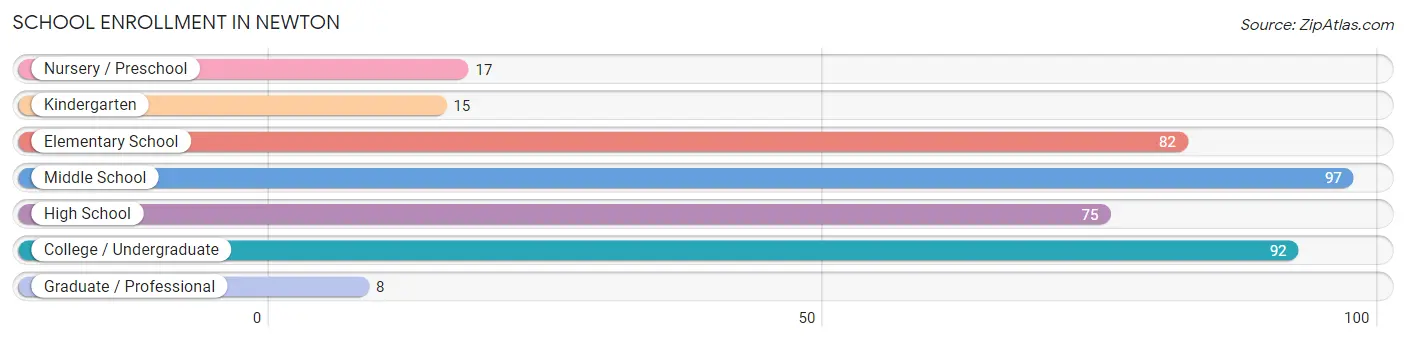
| School Level | # Students | % Students |
| Nursery / Preschool | 17 | 4.4% |
| Kindergarten | 15 | 3.9% |
| Elementary School | 82 | 21.2% |
| Middle School | 97 | 25.1% |
| High School | 75 | 19.4% |
| College / Undergraduate | 92 | 23.8% |
| Graduate / Professional | 8 | 2.1% |
| Total | 386 | 100.0% |
School Enrollment by Age by Funding Source in Newton
Out of a total of 386 students who are enrolled in schools in Newton, 22 (5.7%) attend a private institution, while the remaining 364 (94.3%) are enrolled in public schools. The age group of 15 to 17 year olds has the highest likelihood of being enrolled in private schools, with 13 (28.9% in the age bracket) enrolled. Conversely, the age group of 5 to 9 year old has the lowest likelihood of being enrolled in a private school, with 99 (100.0% in the age bracket) attending a public institution.
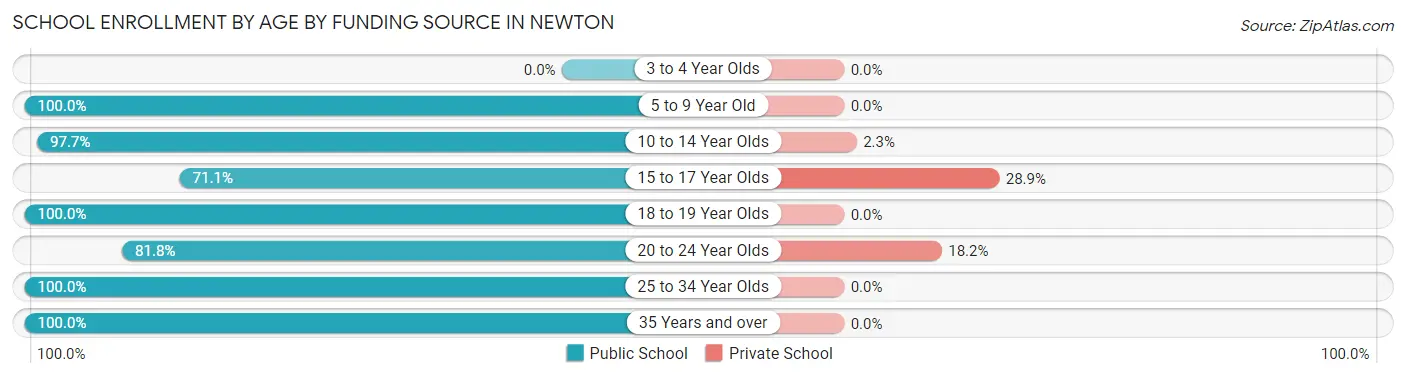
| Age Bracket | Public School | Private School |
| 3 to 4 Year Olds | 0 (0.0%) | 0 (0.0%) |
| 5 to 9 Year Old | 99 (100.0%) | 0 (0.0%) |
| 10 to 14 Year Olds | 126 (97.7%) | 3 (2.3%) |
| 15 to 17 Year Olds | 32 (71.1%) | 13 (28.9%) |
| 18 to 19 Year Olds | 16 (100.0%) | 0 (0.0%) |
| 20 to 24 Year Olds | 27 (81.8%) | 6 (18.2%) |
| 25 to 34 Year Olds | 37 (100.0%) | 0 (0.0%) |
| 35 Years and over | 27 (100.0%) | 0 (0.0%) |
| Total | 364 (94.3%) | 22 (5.7%) |
Educational Attainment by Field of Study in Newton
Business (32 | 20.1%), arts & humanities (30 | 18.9%), science & technology (20 | 12.6%), computers & mathematics (13 | 8.2%), and liberal arts & history (13 | 8.2%) are the most common fields of study among 159 individuals in Newton who have obtained a bachelor's degree or higher.
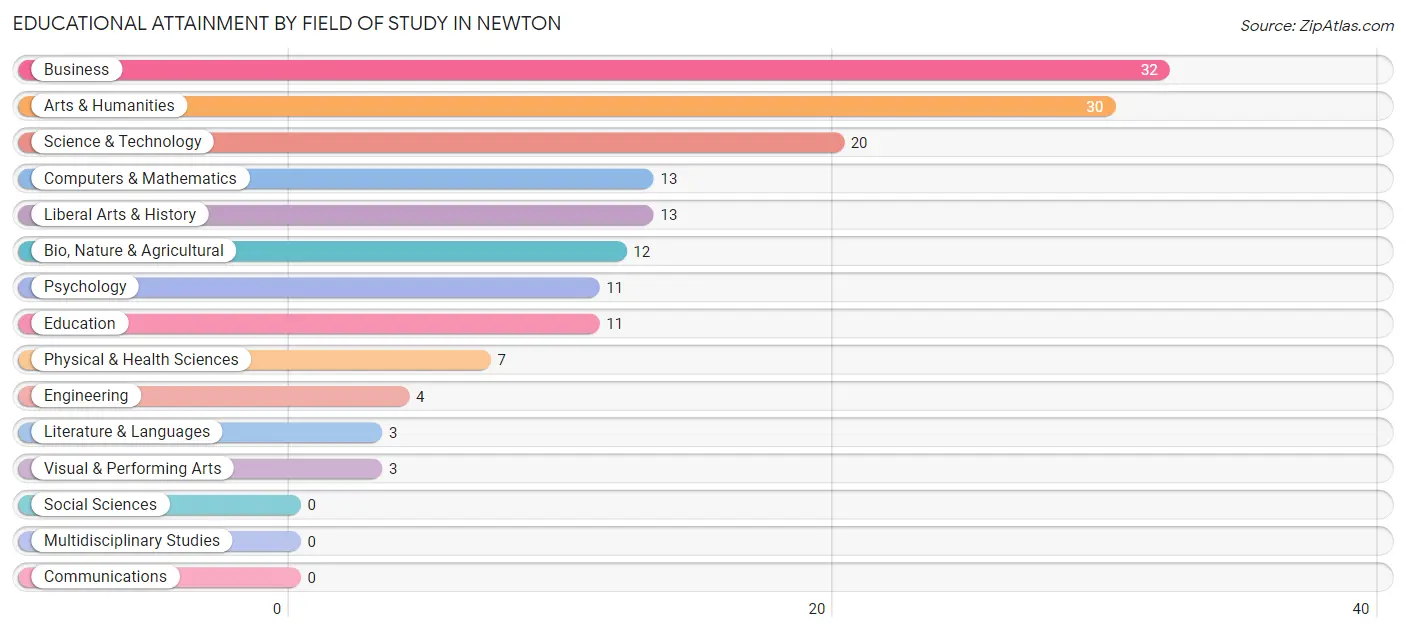
| Field of Study | # Graduates | % Graduates |
| Computers & Mathematics | 13 | 8.2% |
| Bio, Nature & Agricultural | 12 | 7.5% |
| Physical & Health Sciences | 7 | 4.4% |
| Psychology | 11 | 6.9% |
| Social Sciences | 0 | 0.0% |
| Engineering | 4 | 2.5% |
| Multidisciplinary Studies | 0 | 0.0% |
| Science & Technology | 20 | 12.6% |
| Business | 32 | 20.1% |
| Education | 11 | 6.9% |
| Literature & Languages | 3 | 1.9% |
| Liberal Arts & History | 13 | 8.2% |
| Visual & Performing Arts | 3 | 1.9% |
| Communications | 0 | 0.0% |
| Arts & Humanities | 30 | 18.9% |
| Total | 159 | 100.0% |
Transportation & Commute in Newton
Vehicle Availability by Sex in Newton
The most prevalent vehicle ownership categories in Newton are males with 3 vehicles (105, accounting for 35.5%) and females with 3 vehicles (67, making up 45.3%).
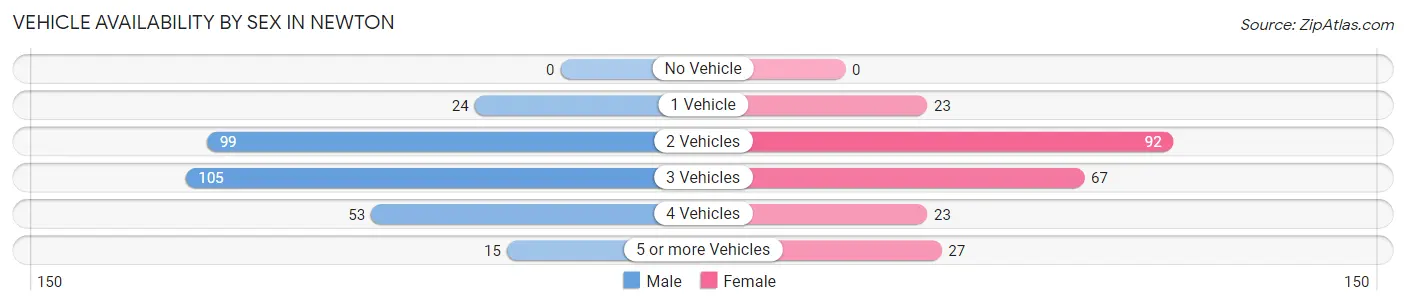
| Vehicles Available | Male | Female |
| No Vehicle | 0 (0.0%) | 0 (0.0%) |
| 1 Vehicle | 24 (8.1%) | 23 (9.9%) |
| 2 Vehicles | 99 (33.5%) | 92 (39.7%) |
| 3 Vehicles | 105 (35.5%) | 67 (28.9%) |
| 4 Vehicles | 53 (17.9%) | 23 (9.9%) |
| 5 or more Vehicles | 15 (5.1%) | 27 (11.6%) |
| Total | 296 (100.0%) | 232 (100.0%) |
Commute Time in Newton
The most frequently occuring commute durations in Newton are 15 to 19 minutes (153 commuters, 30.4%), 20 to 24 minutes (98 commuters, 19.5%), and 30 to 34 minutes (57 commuters, 11.3%).
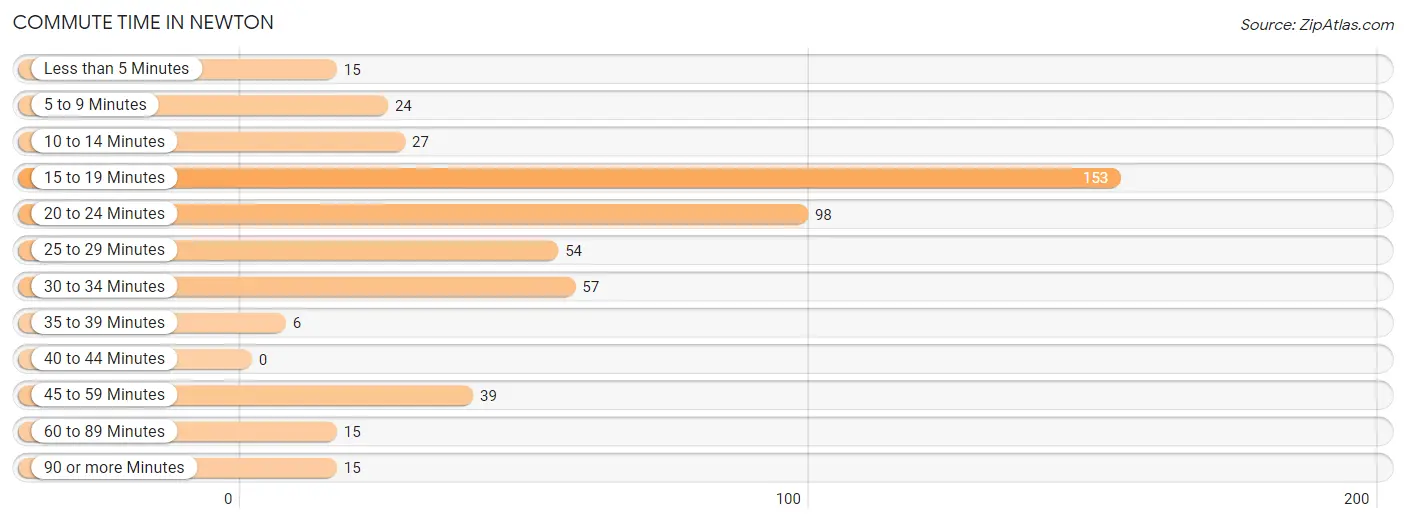
| Commute Time | # Commuters | % Commuters |
| Less than 5 Minutes | 15 | 3.0% |
| 5 to 9 Minutes | 24 | 4.8% |
| 10 to 14 Minutes | 27 | 5.4% |
| 15 to 19 Minutes | 153 | 30.4% |
| 20 to 24 Minutes | 98 | 19.5% |
| 25 to 29 Minutes | 54 | 10.7% |
| 30 to 34 Minutes | 57 | 11.3% |
| 35 to 39 Minutes | 6 | 1.2% |
| 40 to 44 Minutes | 0 | 0.0% |
| 45 to 59 Minutes | 39 | 7.7% |
| 60 to 89 Minutes | 15 | 3.0% |
| 90 or more Minutes | 15 | 3.0% |
Commute Time by Sex in Newton
The most common commute times in Newton are 15 to 19 minutes (96 commuters, 33.9%) for males and 15 to 19 minutes (57 commuters, 25.9%) for females.
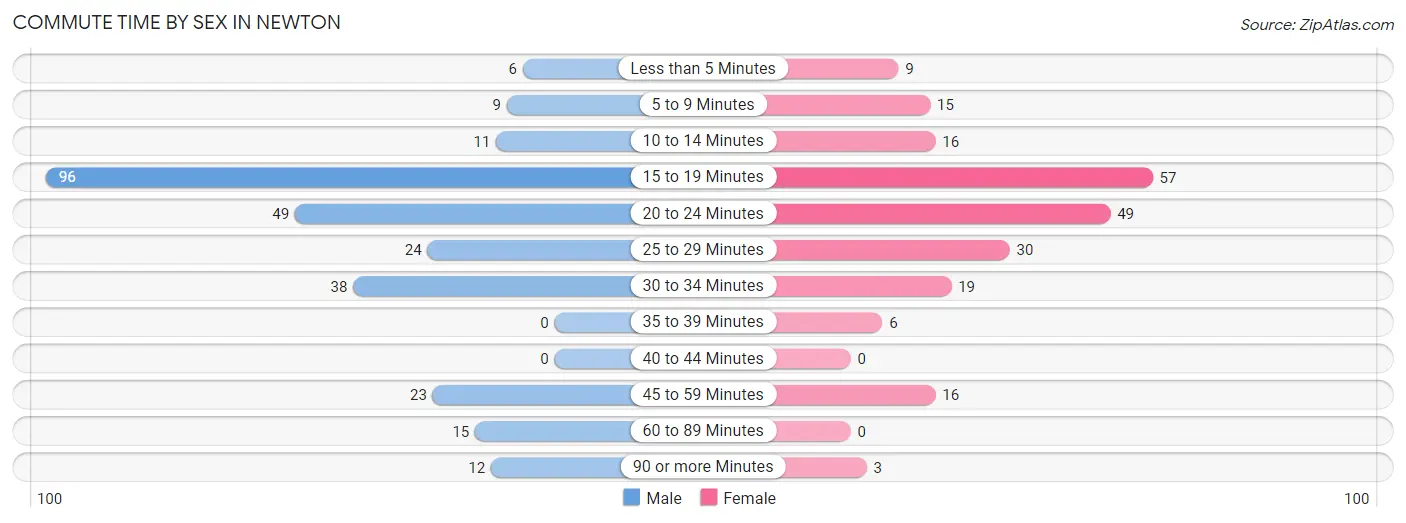
| Commute Time | Male | Female |
| Less than 5 Minutes | 6 (2.1%) | 9 (4.1%) |
| 5 to 9 Minutes | 9 (3.2%) | 15 (6.8%) |
| 10 to 14 Minutes | 11 (3.9%) | 16 (7.3%) |
| 15 to 19 Minutes | 96 (33.9%) | 57 (25.9%) |
| 20 to 24 Minutes | 49 (17.3%) | 49 (22.3%) |
| 25 to 29 Minutes | 24 (8.5%) | 30 (13.6%) |
| 30 to 34 Minutes | 38 (13.4%) | 19 (8.6%) |
| 35 to 39 Minutes | 0 (0.0%) | 6 (2.7%) |
| 40 to 44 Minutes | 0 (0.0%) | 0 (0.0%) |
| 45 to 59 Minutes | 23 (8.1%) | 16 (7.3%) |
| 60 to 89 Minutes | 15 (5.3%) | 0 (0.0%) |
| 90 or more Minutes | 12 (4.2%) | 3 (1.4%) |
Time of Departure to Work by Sex in Newton
The most frequent times of departure to work in Newton are 7:00 AM to 7:29 AM (49, 17.3%) for males and 7:00 AM to 7:29 AM (50, 22.7%) for females.
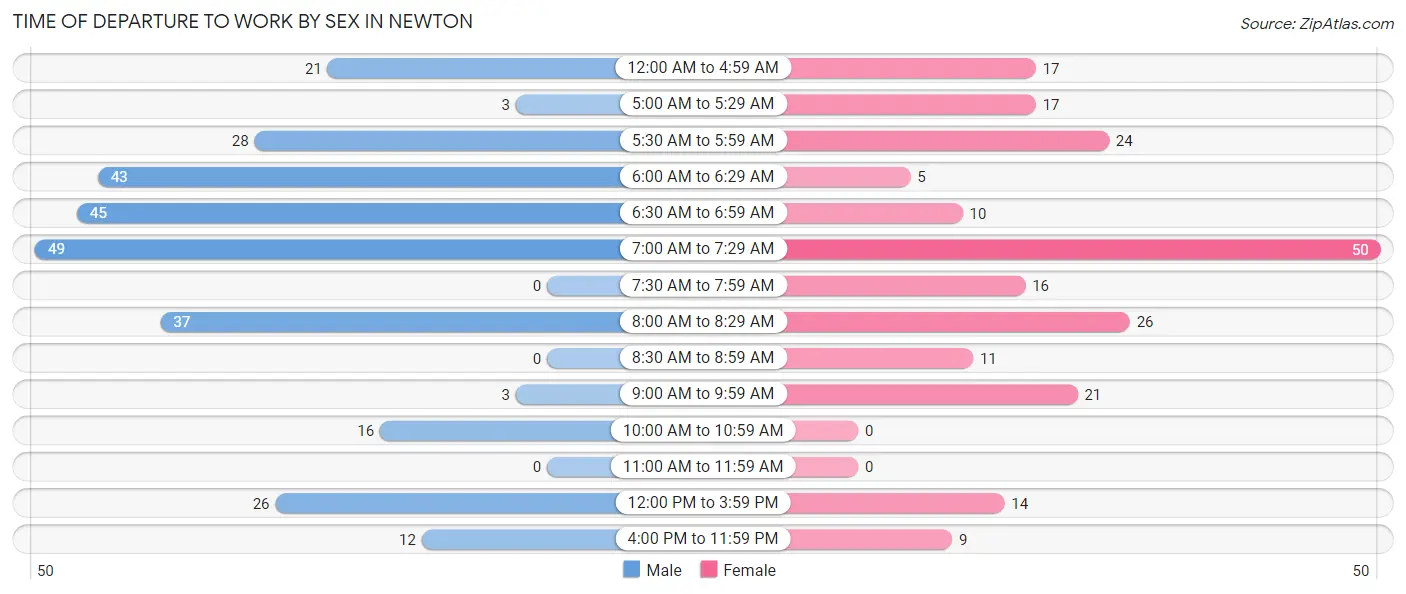
| Time of Departure | Male | Female |
| 12:00 AM to 4:59 AM | 21 (7.4%) | 17 (7.7%) |
| 5:00 AM to 5:29 AM | 3 (1.1%) | 17 (7.7%) |
| 5:30 AM to 5:59 AM | 28 (9.9%) | 24 (10.9%) |
| 6:00 AM to 6:29 AM | 43 (15.2%) | 5 (2.3%) |
| 6:30 AM to 6:59 AM | 45 (15.9%) | 10 (4.5%) |
| 7:00 AM to 7:29 AM | 49 (17.3%) | 50 (22.7%) |
| 7:30 AM to 7:59 AM | 0 (0.0%) | 16 (7.3%) |
| 8:00 AM to 8:29 AM | 37 (13.1%) | 26 (11.8%) |
| 8:30 AM to 8:59 AM | 0 (0.0%) | 11 (5.0%) |
| 9:00 AM to 9:59 AM | 3 (1.1%) | 21 (9.6%) |
| 10:00 AM to 10:59 AM | 16 (5.7%) | 0 (0.0%) |
| 11:00 AM to 11:59 AM | 0 (0.0%) | 0 (0.0%) |
| 12:00 PM to 3:59 PM | 26 (9.2%) | 14 (6.4%) |
| 4:00 PM to 11:59 PM | 12 (4.2%) | 9 (4.1%) |
| Total | 283 (100.0%) | 220 (100.0%) |
Housing Occupancy in Newton
Occupancy by Ownership in Newton
Of the total 597 dwellings in Newton, owner-occupied units account for 491 (82.2%), while renter-occupied units make up 106 (17.8%).
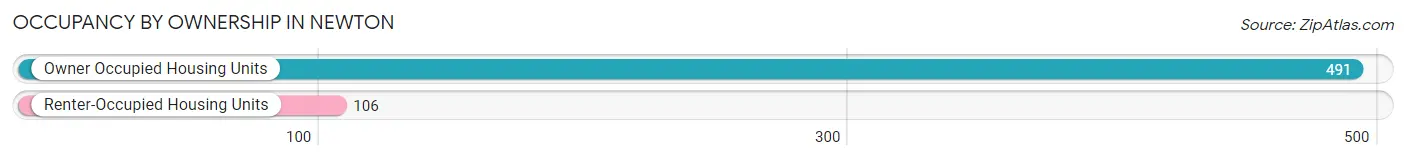
| Occupancy | # Housing Units | % Housing Units |
| Owner Occupied Housing Units | 491 | 82.2% |
| Renter-Occupied Housing Units | 106 | 17.8% |
| Total Occupied Housing Units | 597 | 100.0% |
Occupancy by Household Size in Newton
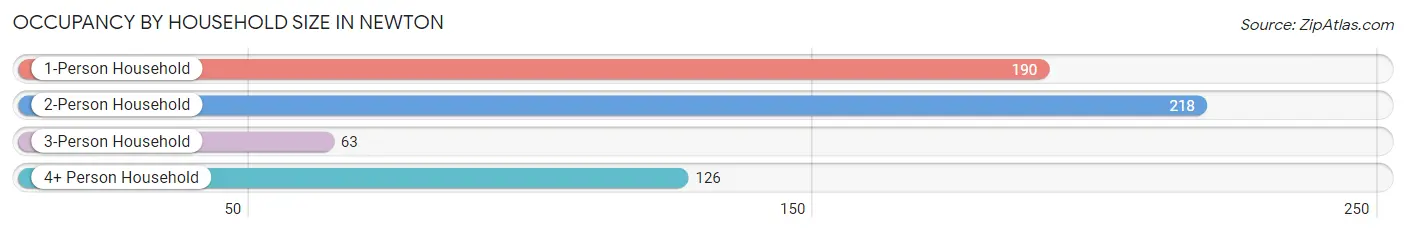
| Household Size | # Housing Units | % Housing Units |
| 1-Person Household | 190 | 31.8% |
| 2-Person Household | 218 | 36.5% |
| 3-Person Household | 63 | 10.5% |
| 4+ Person Household | 126 | 21.1% |
| Total Housing Units | 597 | 100.0% |
Occupancy by Ownership by Household Size in Newton
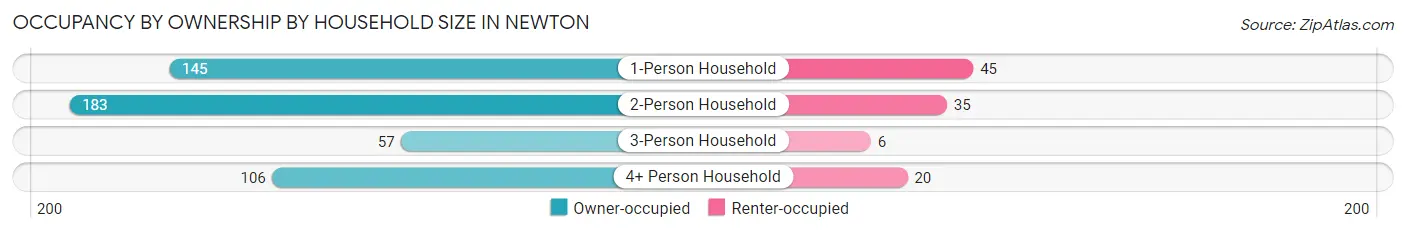
| Household Size | Owner-occupied | Renter-occupied |
| 1-Person Household | 145 (76.3%) | 45 (23.7%) |
| 2-Person Household | 183 (83.9%) | 35 (16.1%) |
| 3-Person Household | 57 (90.5%) | 6 (9.5%) |
| 4+ Person Household | 106 (84.1%) | 20 (15.9%) |
| Total Housing Units | 491 (82.2%) | 106 (17.8%) |
Occupancy by Educational Attainment in Newton
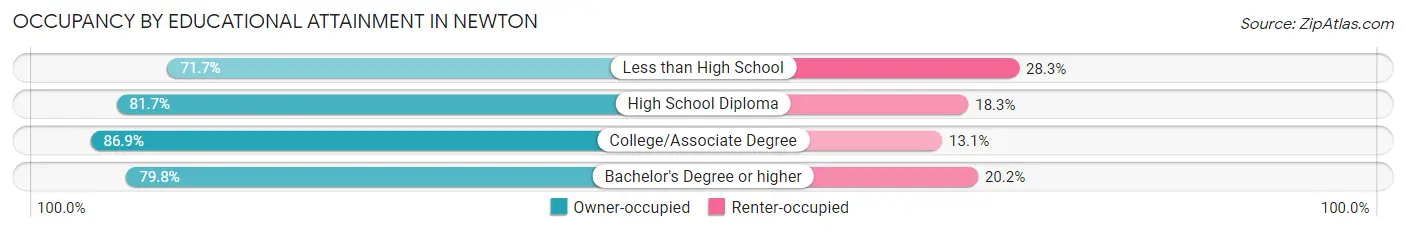
| Household Size | Owner-occupied | Renter-occupied |
| Less than High School | 43 (71.7%) | 17 (28.3%) |
| High School Diploma | 179 (81.7%) | 40 (18.3%) |
| College/Associate Degree | 186 (86.9%) | 28 (13.1%) |
| Bachelor's Degree or higher | 83 (79.8%) | 21 (20.2%) |
Occupancy by Age of Householder in Newton
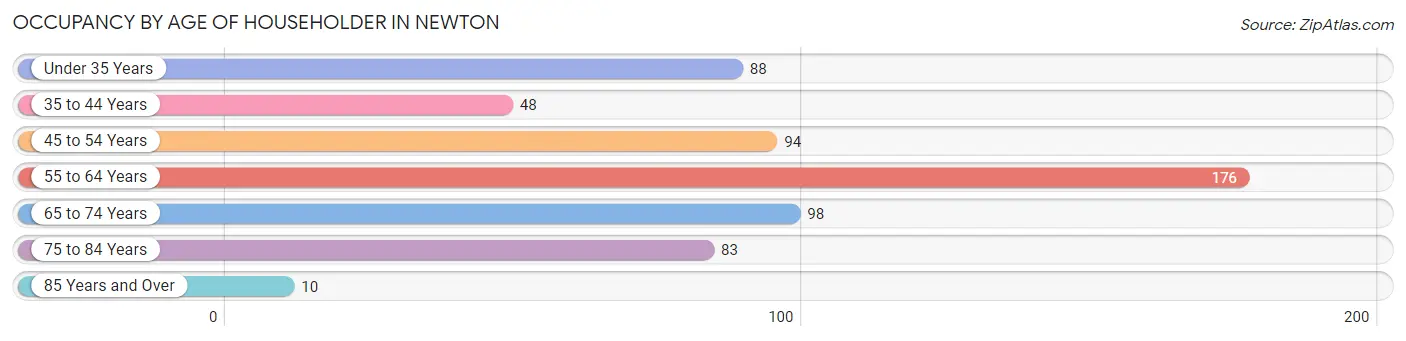
| Age Bracket | # Households | % Households |
| Under 35 Years | 88 | 14.7% |
| 35 to 44 Years | 48 | 8.0% |
| 45 to 54 Years | 94 | 15.8% |
| 55 to 64 Years | 176 | 29.5% |
| 65 to 74 Years | 98 | 16.4% |
| 75 to 84 Years | 83 | 13.9% |
| 85 Years and Over | 10 | 1.7% |
| Total | 597 | 100.0% |
Housing Finances in Newton
Median Income by Occupancy in Newton
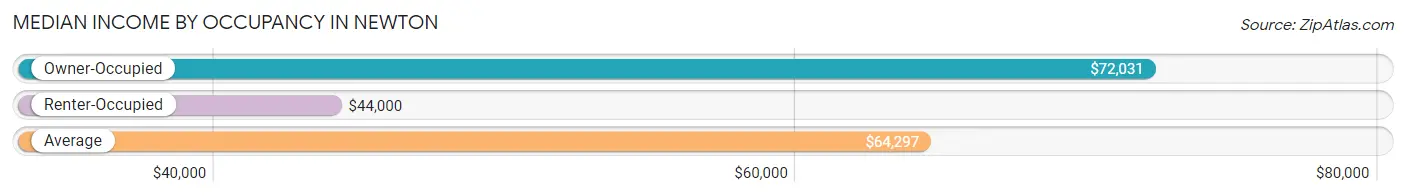
| Occupancy Type | # Households | Median Income |
| Owner-Occupied | 491 (82.2%) | $72,031 |
| Renter-Occupied | 106 (17.8%) | $44,000 |
| Average | 597 (100.0%) | $64,297 |
Occupancy by Householder Income Bracket in Newton
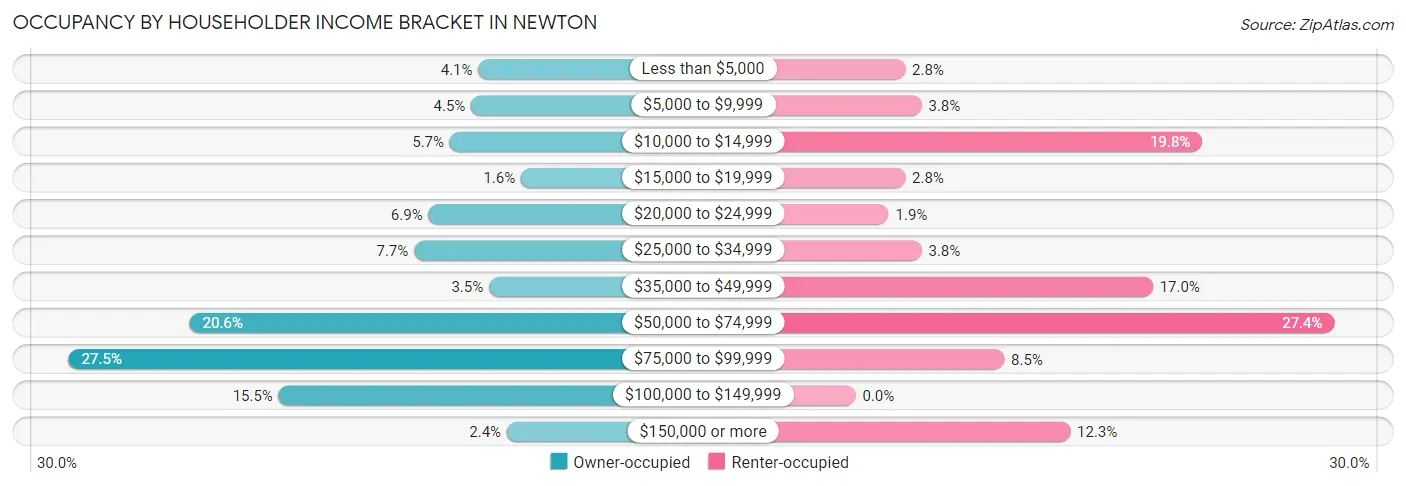
| Income Bracket | Owner-occupied | Renter-occupied |
| Less than $5,000 | 20 (4.1%) | 3 (2.8%) |
| $5,000 to $9,999 | 22 (4.5%) | 4 (3.8%) |
| $10,000 to $14,999 | 28 (5.7%) | 21 (19.8%) |
| $15,000 to $19,999 | 8 (1.6%) | 3 (2.8%) |
| $20,000 to $24,999 | 34 (6.9%) | 2 (1.9%) |
| $25,000 to $34,999 | 38 (7.7%) | 4 (3.8%) |
| $35,000 to $49,999 | 17 (3.5%) | 18 (17.0%) |
| $50,000 to $74,999 | 101 (20.6%) | 29 (27.4%) |
| $75,000 to $99,999 | 135 (27.5%) | 9 (8.5%) |
| $100,000 to $149,999 | 76 (15.5%) | 0 (0.0%) |
| $150,000 or more | 12 (2.4%) | 13 (12.3%) |
| Total | 491 (100.0%) | 106 (100.0%) |
Monthly Housing Cost Tiers in Newton
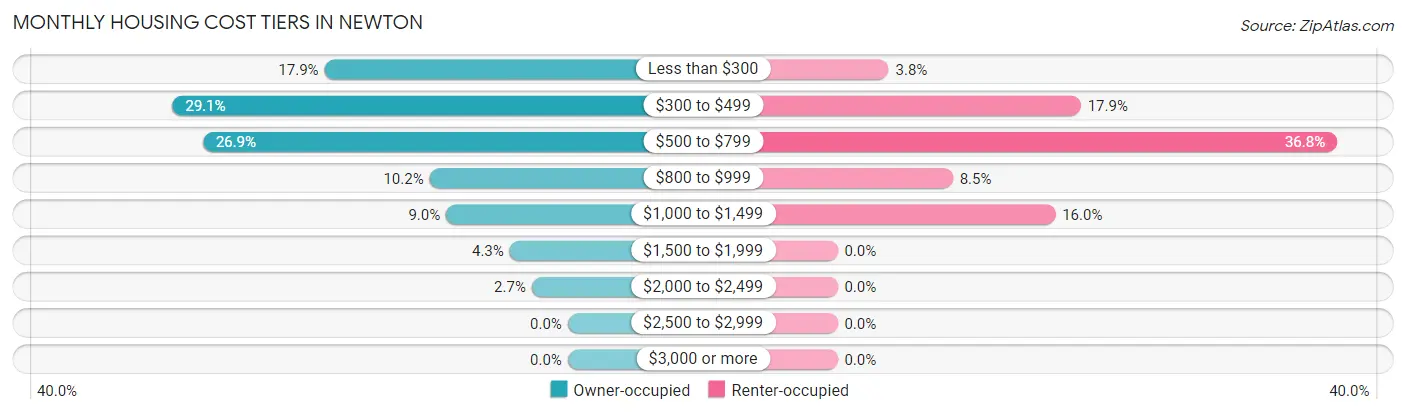
| Monthly Cost | Owner-occupied | Renter-occupied |
| Less than $300 | 88 (17.9%) | 4 (3.8%) |
| $300 to $499 | 143 (29.1%) | 19 (17.9%) |
| $500 to $799 | 132 (26.9%) | 39 (36.8%) |
| $800 to $999 | 50 (10.2%) | 9 (8.5%) |
| $1,000 to $1,499 | 44 (9.0%) | 17 (16.0%) |
| $1,500 to $1,999 | 21 (4.3%) | 0 (0.0%) |
| $2,000 to $2,499 | 13 (2.6%) | 0 (0.0%) |
| $2,500 to $2,999 | 0 (0.0%) | 0 (0.0%) |
| $3,000 or more | 0 (0.0%) | 0 (0.0%) |
| Total | 491 (100.0%) | 106 (100.0%) |
Physical Housing Characteristics in Newton
Housing Structures in Newton
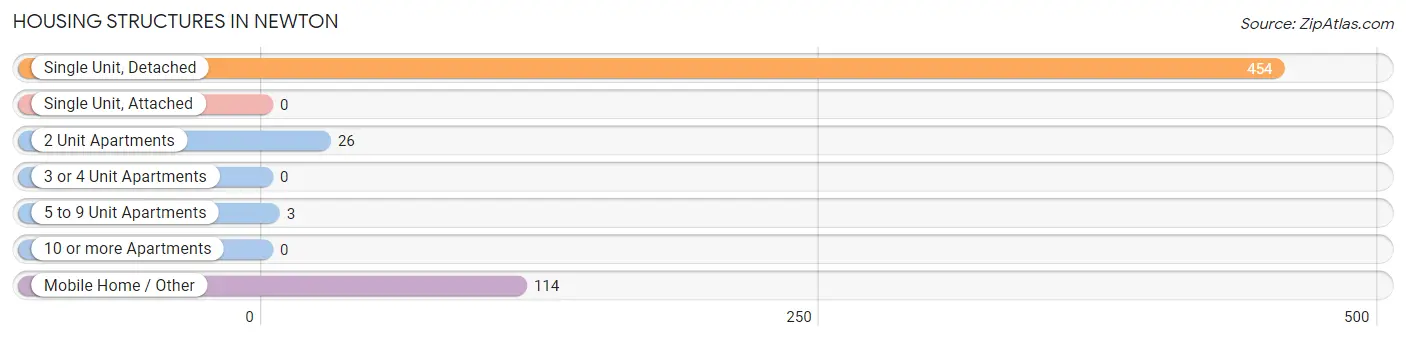
| Structure Type | # Housing Units | % Housing Units |
| Single Unit, Detached | 454 | 76.0% |
| Single Unit, Attached | 0 | 0.0% |
| 2 Unit Apartments | 26 | 4.4% |
| 3 or 4 Unit Apartments | 0 | 0.0% |
| 5 to 9 Unit Apartments | 3 | 0.5% |
| 10 or more Apartments | 0 | 0.0% |
| Mobile Home / Other | 114 | 19.1% |
| Total | 597 | 100.0% |
Housing Structures by Occupancy in Newton
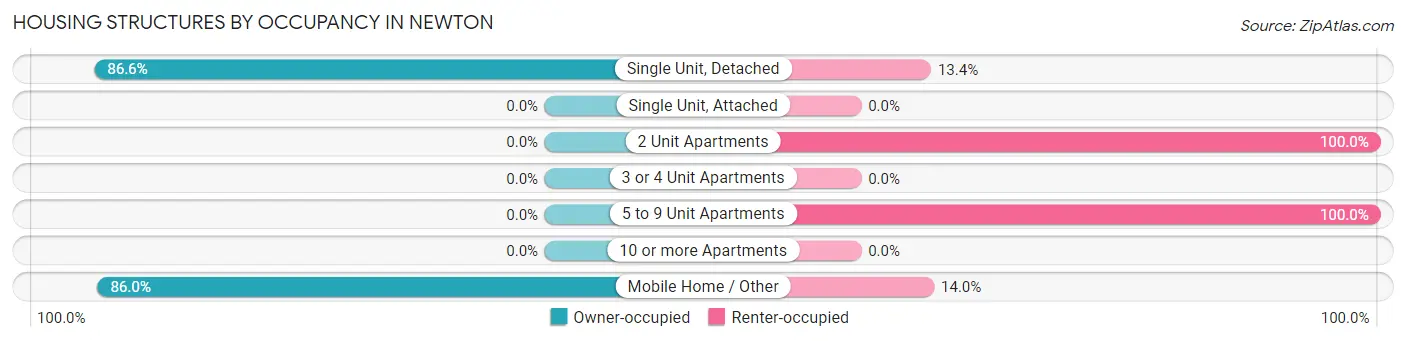
| Structure Type | Owner-occupied | Renter-occupied |
| Single Unit, Detached | 393 (86.6%) | 61 (13.4%) |
| Single Unit, Attached | 0 (0.0%) | 0 (0.0%) |
| 2 Unit Apartments | 0 (0.0%) | 26 (100.0%) |
| 3 or 4 Unit Apartments | 0 (0.0%) | 0 (0.0%) |
| 5 to 9 Unit Apartments | 0 (0.0%) | 3 (100.0%) |
| 10 or more Apartments | 0 (0.0%) | 0 (0.0%) |
| Mobile Home / Other | 98 (86.0%) | 16 (14.0%) |
| Total | 491 (82.2%) | 106 (17.8%) |
Housing Structures by Number of Rooms in Newton
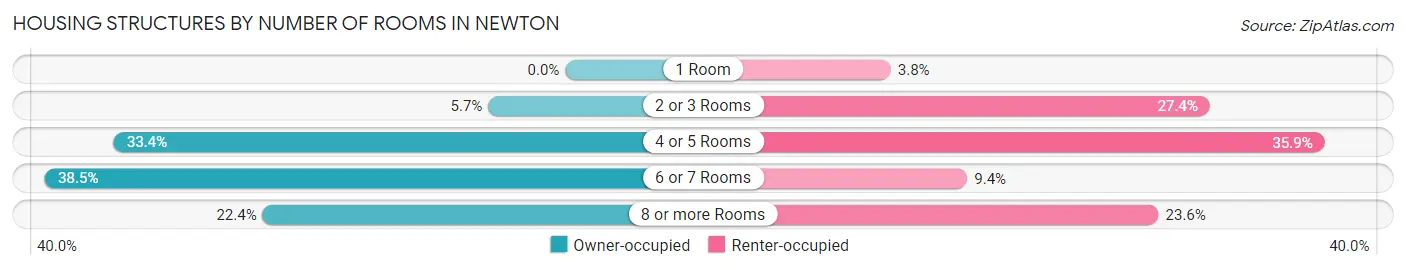
| Number of Rooms | Owner-occupied | Renter-occupied |
| 1 Room | 0 (0.0%) | 4 (3.8%) |
| 2 or 3 Rooms | 28 (5.7%) | 29 (27.4%) |
| 4 or 5 Rooms | 164 (33.4%) | 38 (35.8%) |
| 6 or 7 Rooms | 189 (38.5%) | 10 (9.4%) |
| 8 or more Rooms | 110 (22.4%) | 25 (23.6%) |
| Total | 491 (100.0%) | 106 (100.0%) |
Housing Structure by Heating Type in Newton
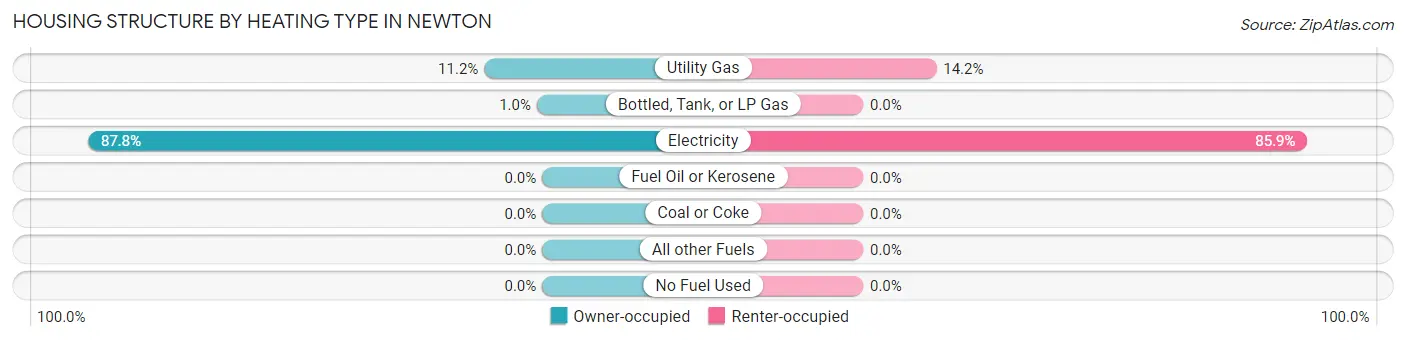
| Heating Type | Owner-occupied | Renter-occupied |
| Utility Gas | 55 (11.2%) | 15 (14.1%) |
| Bottled, Tank, or LP Gas | 5 (1.0%) | 0 (0.0%) |
| Electricity | 431 (87.8%) | 91 (85.9%) |
| Fuel Oil or Kerosene | 0 (0.0%) | 0 (0.0%) |
| Coal or Coke | 0 (0.0%) | 0 (0.0%) |
| All other Fuels | 0 (0.0%) | 0 (0.0%) |
| No Fuel Used | 0 (0.0%) | 0 (0.0%) |
| Total | 491 (100.0%) | 106 (100.0%) |
Household Vehicle Usage in Newton
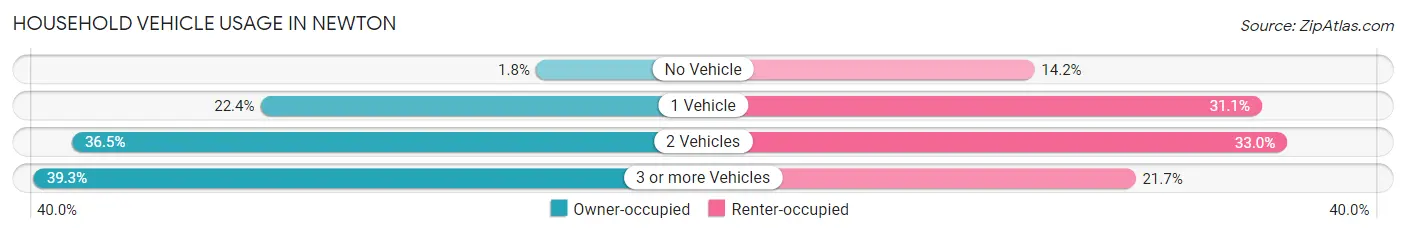
| Vehicles per Household | Owner-occupied | Renter-occupied |
| No Vehicle | 9 (1.8%) | 15 (14.1%) |
| 1 Vehicle | 110 (22.4%) | 33 (31.1%) |
| 2 Vehicles | 179 (36.5%) | 35 (33.0%) |
| 3 or more Vehicles | 193 (39.3%) | 23 (21.7%) |
| Total | 491 (100.0%) | 106 (100.0%) |
Real Estate & Mortgages in Newton
Real Estate and Mortgage Overview in Newton
| Characteristic | Without Mortgage | With Mortgage |
| Housing Units | 287 | 204 |
| Median Property Value | $83,600 | $95,500 |
| Median Household Income | $65,781 | $2 |
| Monthly Housing Costs | $393 | $0 |
| Real Estate Taxes | $323 | $42 |
Property Value by Mortgage Status in Newton
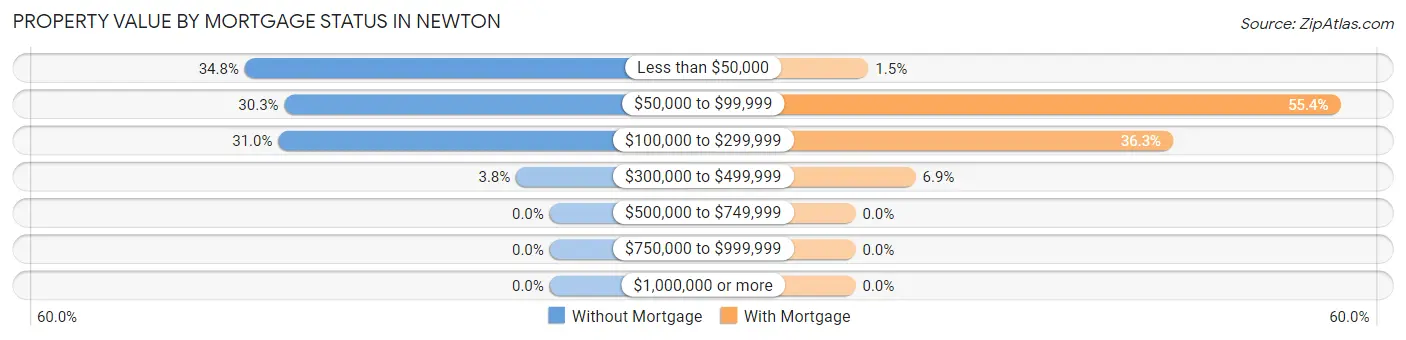
| Property Value | Without Mortgage | With Mortgage |
| Less than $50,000 | 100 (34.8%) | 3 (1.5%) |
| $50,000 to $99,999 | 87 (30.3%) | 113 (55.4%) |
| $100,000 to $299,999 | 89 (31.0%) | 74 (36.3%) |
| $300,000 to $499,999 | 11 (3.8%) | 14 (6.9%) |
| $500,000 to $749,999 | 0 (0.0%) | 0 (0.0%) |
| $750,000 to $999,999 | 0 (0.0%) | 0 (0.0%) |
| $1,000,000 or more | 0 (0.0%) | 0 (0.0%) |
| Total | 287 (100.0%) | 204 (100.0%) |
Household Income by Mortgage Status in Newton
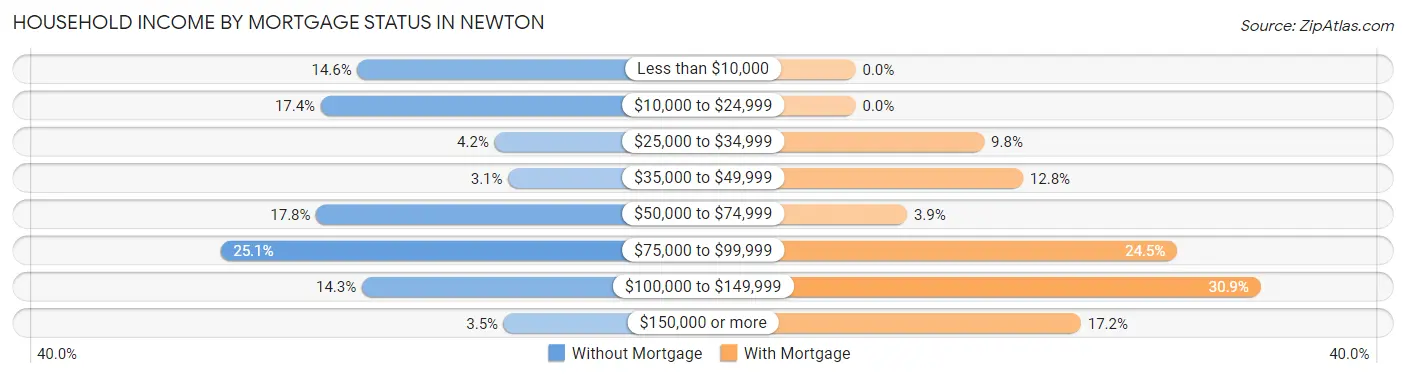
| Household Income | Without Mortgage | With Mortgage |
| Less than $10,000 | 42 (14.6%) | 0 (0.0%) |
| $10,000 to $24,999 | 50 (17.4%) | 0 (0.0%) |
| $25,000 to $34,999 | 12 (4.2%) | 20 (9.8%) |
| $35,000 to $49,999 | 9 (3.1%) | 26 (12.8%) |
| $50,000 to $74,999 | 51 (17.8%) | 8 (3.9%) |
| $75,000 to $99,999 | 72 (25.1%) | 50 (24.5%) |
| $100,000 to $149,999 | 41 (14.3%) | 63 (30.9%) |
| $150,000 or more | 10 (3.5%) | 35 (17.2%) |
| Total | 287 (100.0%) | 204 (100.0%) |
Property Value to Household Income Ratio in Newton
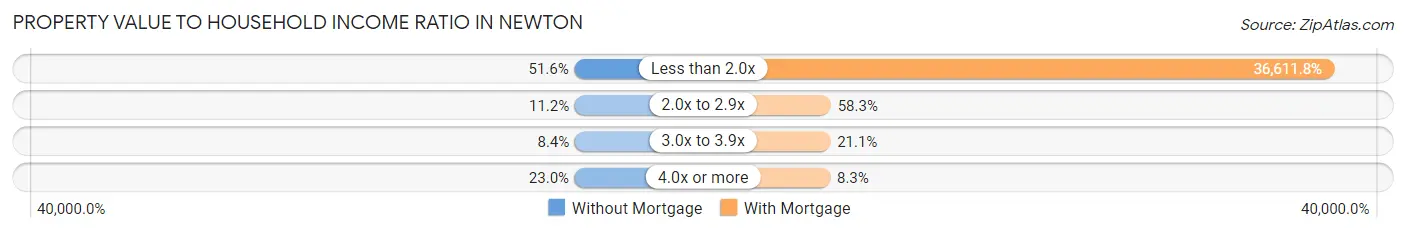
| Value-to-Income Ratio | Without Mortgage | With Mortgage |
| Less than 2.0x | 148 (51.6%) | 74,688 (36,611.8%) |
| 2.0x to 2.9x | 32 (11.2%) | 119 (58.3%) |
| 3.0x to 3.9x | 24 (8.4%) | 43 (21.1%) |
| 4.0x or more | 66 (23.0%) | 17 (8.3%) |
| Total | 287 (100.0%) | 204 (100.0%) |
Real Estate Taxes by Mortgage Status in Newton
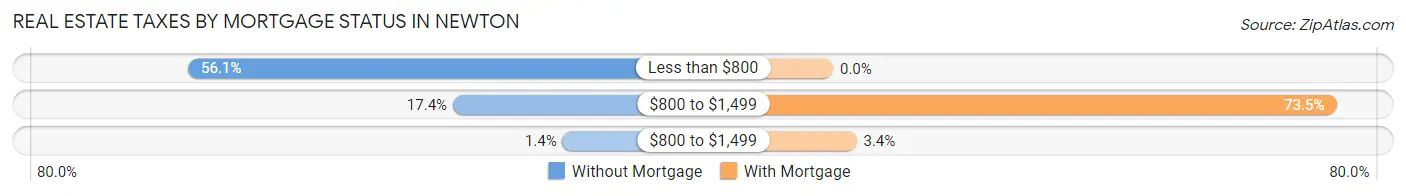
| Property Taxes | Without Mortgage | With Mortgage |
| Less than $800 | 161 (56.1%) | 0 (0.0%) |
| $800 to $1,499 | 50 (17.4%) | 150 (73.5%) |
| $800 to $1,499 | 4 (1.4%) | 7 (3.4%) |
| Total | 287 (100.0%) | 204 (100.0%) |
Health & Disability in Newton
Health Insurance Coverage by Age in Newton
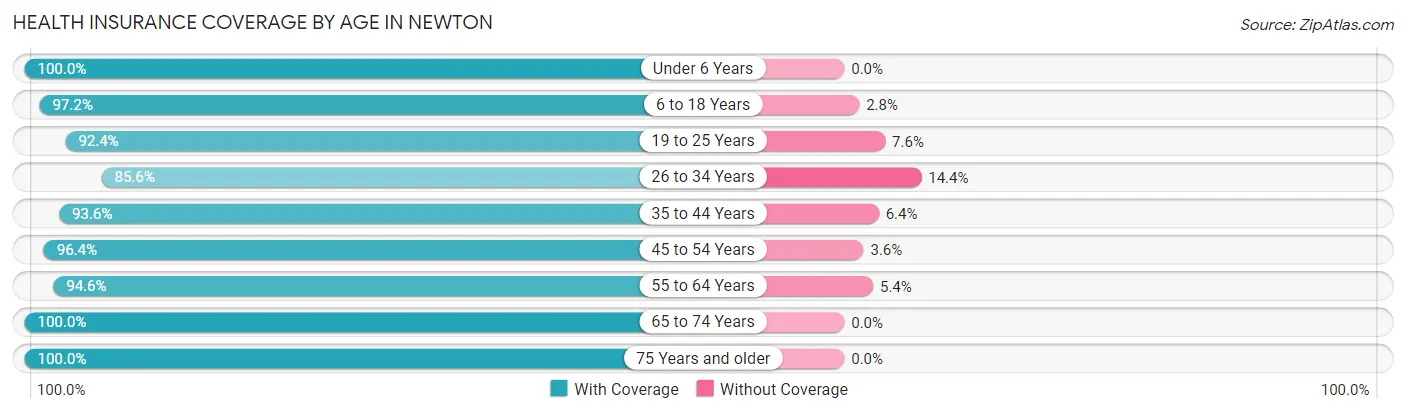
| Age Bracket | With Coverage | Without Coverage |
| Under 6 Years | 84 (100.0%) | 0 (0.0%) |
| 6 to 18 Years | 280 (97.2%) | 8 (2.8%) |
| 19 to 25 Years | 97 (92.4%) | 8 (7.6%) |
| 26 to 34 Years | 155 (85.6%) | 26 (14.4%) |
| 35 to 44 Years | 102 (93.6%) | 7 (6.4%) |
| 45 to 54 Years | 188 (96.4%) | 7 (3.6%) |
| 55 to 64 Years | 247 (94.6%) | 14 (5.4%) |
| 65 to 74 Years | 189 (100.0%) | 0 (0.0%) |
| 75 Years and older | 116 (100.0%) | 0 (0.0%) |
| Total | 1,458 (95.4%) | 70 (4.6%) |
Health Insurance Coverage by Citizenship Status in Newton
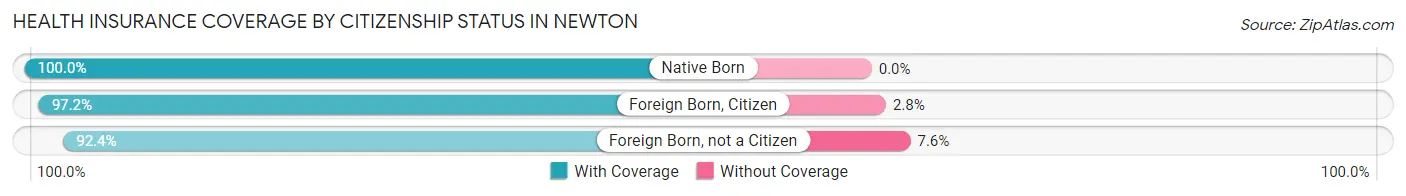
| Citizenship Status | With Coverage | Without Coverage |
| Native Born | 84 (100.0%) | 0 (0.0%) |
| Foreign Born, Citizen | 280 (97.2%) | 8 (2.8%) |
| Foreign Born, not a Citizen | 97 (92.4%) | 8 (7.6%) |
Health Insurance Coverage by Household Income in Newton
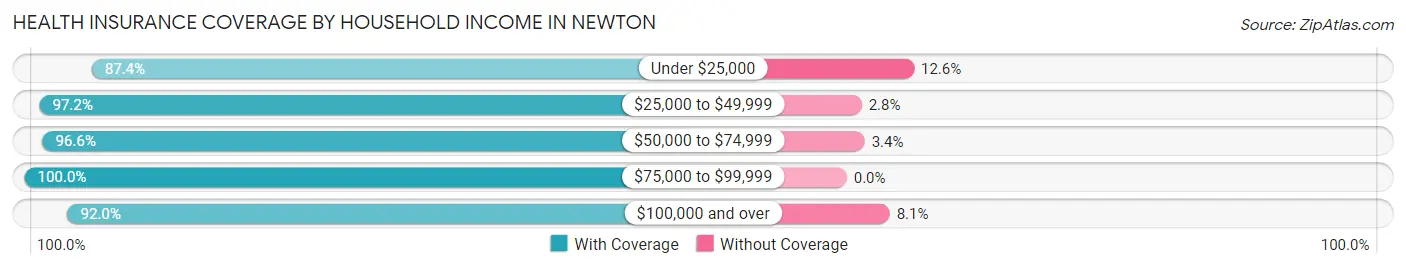
| Household Income | With Coverage | Without Coverage |
| Under $25,000 | 215 (87.4%) | 31 (12.6%) |
| $25,000 to $49,999 | 208 (97.2%) | 6 (2.8%) |
| $50,000 to $74,999 | 403 (96.6%) | 14 (3.4%) |
| $75,000 to $99,999 | 415 (100.0%) | 0 (0.0%) |
| $100,000 and over | 217 (91.9%) | 19 (8.1%) |
Public vs Private Health Insurance Coverage by Age in Newton
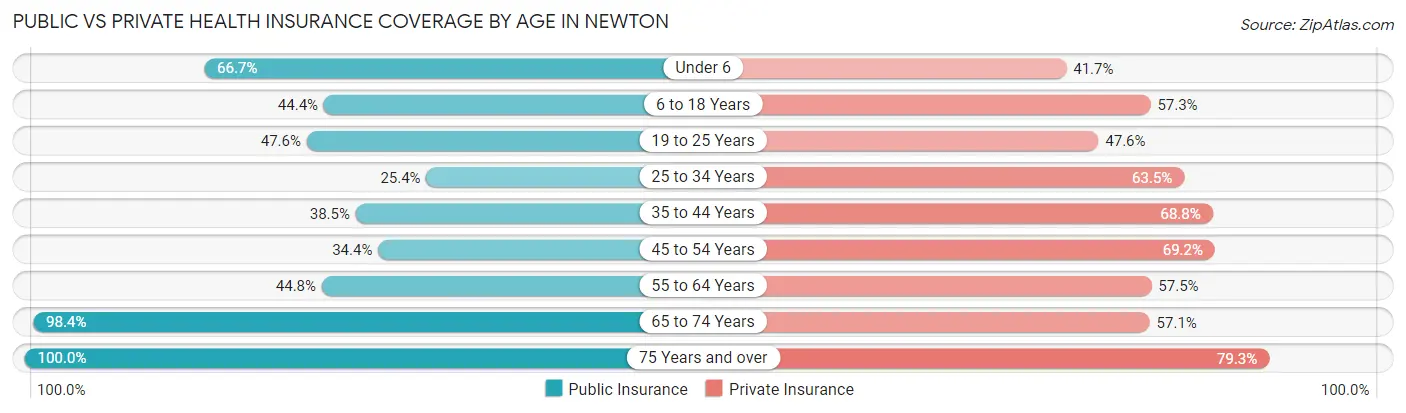
| Age Bracket | Public Insurance | Private Insurance |
| Under 6 | 56 (66.7%) | 35 (41.7%) |
| 6 to 18 Years | 128 (44.4%) | 165 (57.3%) |
| 19 to 25 Years | 50 (47.6%) | 50 (47.6%) |
| 25 to 34 Years | 46 (25.4%) | 115 (63.5%) |
| 35 to 44 Years | 42 (38.5%) | 75 (68.8%) |
| 45 to 54 Years | 67 (34.4%) | 135 (69.2%) |
| 55 to 64 Years | 117 (44.8%) | 150 (57.5%) |
| 65 to 74 Years | 186 (98.4%) | 108 (57.1%) |
| 75 Years and over | 116 (100.0%) | 92 (79.3%) |
| Total | 808 (52.9%) | 925 (60.5%) |
Disability Status by Sex by Age in Newton
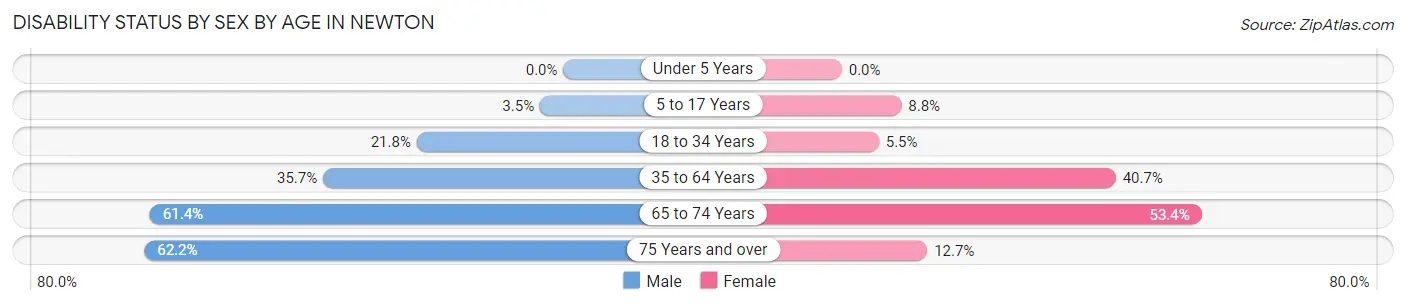
| Age Bracket | Male | Female |
| Under 5 Years | 0 (0.0%) | 0 (0.0%) |
| 5 to 17 Years | 5 (3.5%) | 13 (8.8%) |
| 18 to 34 Years | 32 (21.8%) | 9 (5.5%) |
| 35 to 64 Years | 106 (35.7%) | 109 (40.7%) |
| 65 to 74 Years | 62 (61.4%) | 47 (53.4%) |
| 75 Years and over | 28 (62.2%) | 9 (12.7%) |
Disability Class by Sex by Age in Newton
Disability Class: Hearing Difficulty
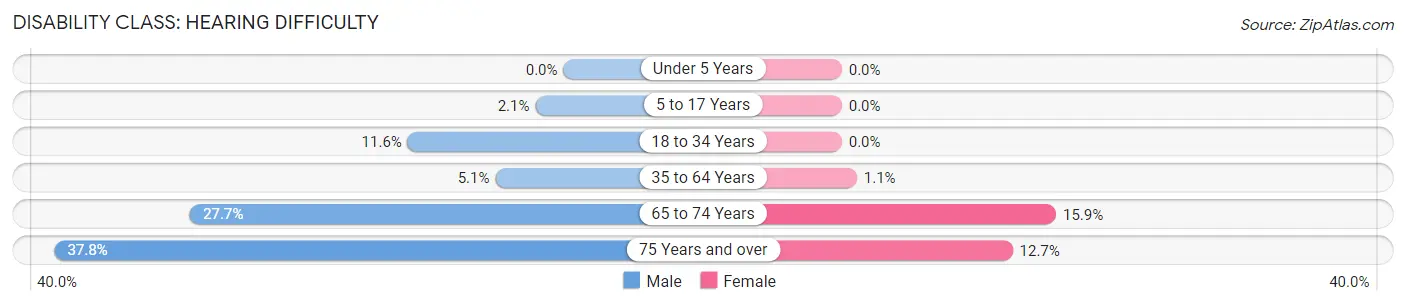
| Age Bracket | Male | Female |
| Under 5 Years | 0 (0.0%) | 0 (0.0%) |
| 5 to 17 Years | 3 (2.1%) | 0 (0.0%) |
| 18 to 34 Years | 17 (11.6%) | 0 (0.0%) |
| 35 to 64 Years | 15 (5.1%) | 3 (1.1%) |
| 65 to 74 Years | 28 (27.7%) | 14 (15.9%) |
| 75 Years and over | 17 (37.8%) | 9 (12.7%) |
Disability Class: Vision Difficulty
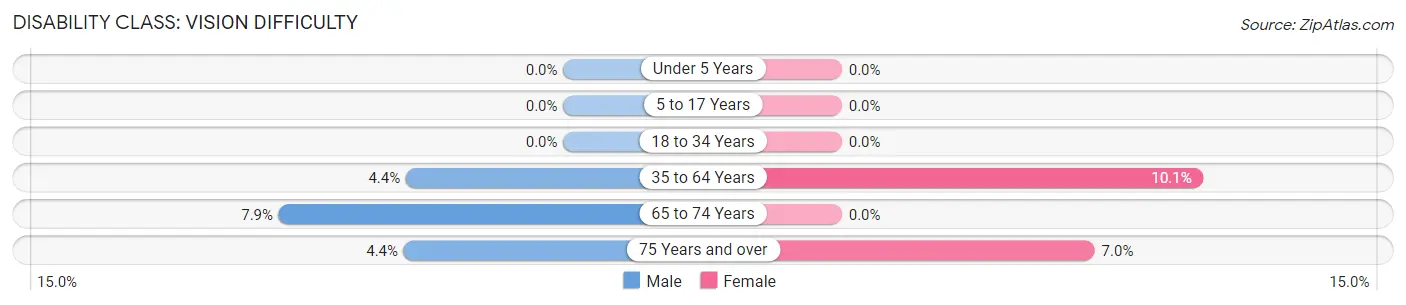
| Age Bracket | Male | Female |
| Under 5 Years | 0 (0.0%) | 0 (0.0%) |
| 5 to 17 Years | 0 (0.0%) | 0 (0.0%) |
| 18 to 34 Years | 0 (0.0%) | 0 (0.0%) |
| 35 to 64 Years | 13 (4.4%) | 27 (10.1%) |
| 65 to 74 Years | 8 (7.9%) | 0 (0.0%) |
| 75 Years and over | 2 (4.4%) | 5 (7.0%) |
Disability Class: Cognitive Difficulty
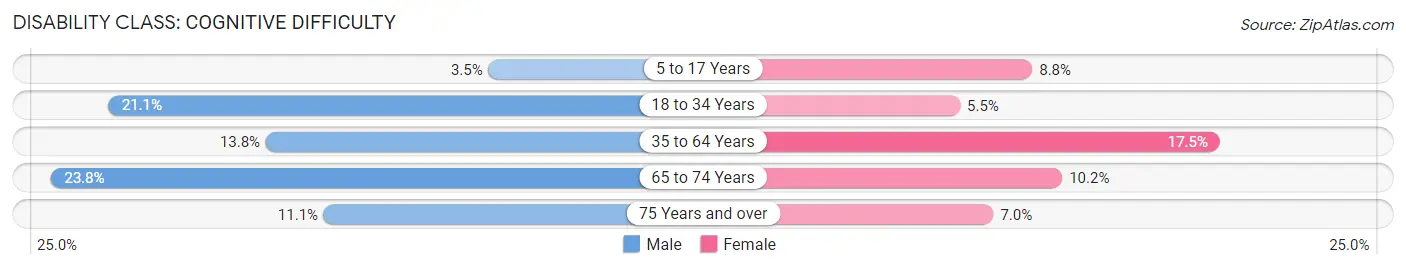
| Age Bracket | Male | Female |
| 5 to 17 Years | 5 (3.5%) | 13 (8.8%) |
| 18 to 34 Years | 31 (21.1%) | 9 (5.5%) |
| 35 to 64 Years | 41 (13.8%) | 47 (17.5%) |
| 65 to 74 Years | 24 (23.8%) | 9 (10.2%) |
| 75 Years and over | 5 (11.1%) | 5 (7.0%) |
Disability Class: Ambulatory Difficulty
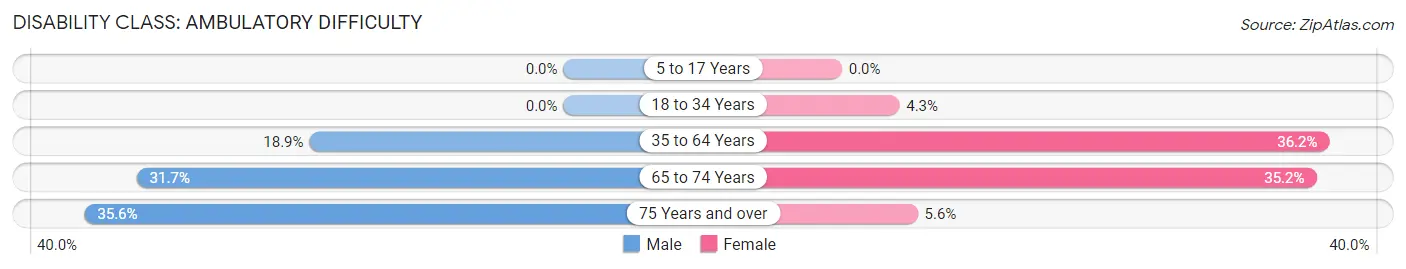
| Age Bracket | Male | Female |
| 5 to 17 Years | 0 (0.0%) | 0 (0.0%) |
| 18 to 34 Years | 0 (0.0%) | 7 (4.3%) |
| 35 to 64 Years | 56 (18.9%) | 97 (36.2%) |
| 65 to 74 Years | 32 (31.7%) | 31 (35.2%) |
| 75 Years and over | 16 (35.6%) | 4 (5.6%) |
Disability Class: Self-Care Difficulty
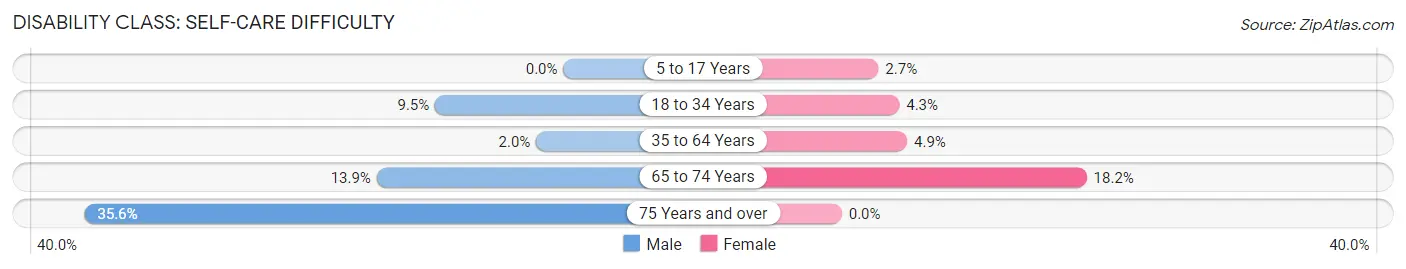
| Age Bracket | Male | Female |
| 5 to 17 Years | 0 (0.0%) | 4 (2.7%) |
| 18 to 34 Years | 14 (9.5%) | 7 (4.3%) |
| 35 to 64 Years | 6 (2.0%) | 13 (4.9%) |
| 65 to 74 Years | 14 (13.9%) | 16 (18.2%) |
| 75 Years and over | 16 (35.6%) | 0 (0.0%) |
Technology Access in Newton
Computing Device Access in Newton
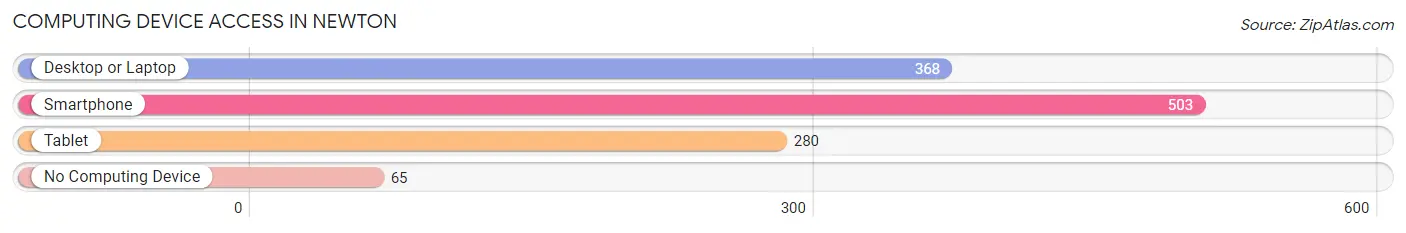
| Device Type | # Households | % Households |
| Desktop or Laptop | 368 | 61.6% |
| Smartphone | 503 | 84.3% |
| Tablet | 280 | 46.9% |
| No Computing Device | 65 | 10.9% |
| Total | 597 | 100.0% |
Internet Access in Newton
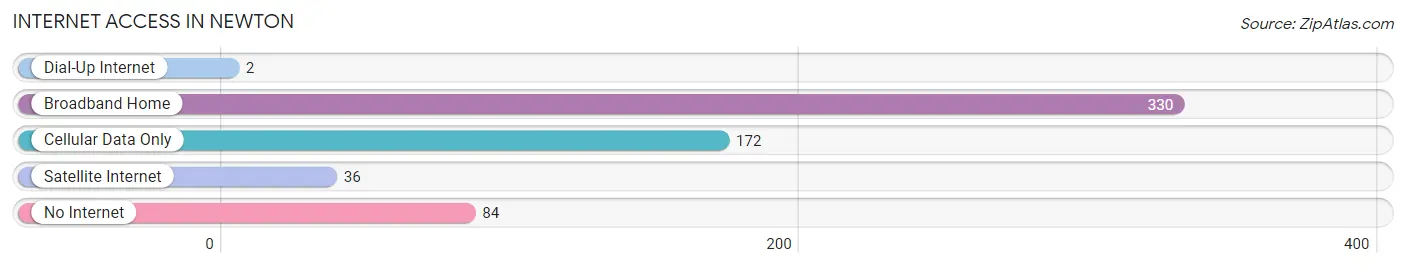
| Internet Type | # Households | % Households |
| Dial-Up Internet | 2 | 0.3% |
| Broadband Home | 330 | 55.3% |
| Cellular Data Only | 172 | 28.8% |
| Satellite Internet | 36 | 6.0% |
| No Internet | 84 | 14.1% |
| Total | 597 | 100.0% |
Newton Summary
Newton is a small town located in the state of Alabama, in the United States. It is situated in the southeastern part of the state, in the county of Dale. The town has a population of approximately 1,500 people, according to the 2010 census.
Geography
Newton is located in the southeastern part of Alabama, in the county of Dale. It is situated at an elevation of about 200 feet above sea level. The town is located on the banks of the Choctawhatchee River, which flows through the area. The town is surrounded by a number of small towns and villages, including Ozark, Enterprise, and Daleville. The nearest major city is Montgomery, which is located about 50 miles to the north.
The climate in Newton is humid subtropical, with hot summers and mild winters. The average annual temperature is around 70 degrees Fahrenheit, with an average high of around 90 degrees in the summer and an average low of around 50 degrees in the winter. The town receives an average of around 50 inches of precipitation per year, with most of it falling in the summer months.
Demographics
As of the 2010 census, the population of Newton was 1,500 people. The racial makeup of the town was 79.2% White, 17.3% African American, 0.7% Native American, 0.3% Asian, 0.1% Pacific Islander, and 2.4% from other races. The median household income was $30,000, and the median family income was $35,000. The per capita income was $14,000.
Economy
The economy of Newton is largely based on agriculture and forestry. The town is home to several farms, which produce a variety of crops, including cotton, corn, soybeans, and peanuts. The town is also home to several timber companies, which harvest and process timber for use in construction and other industries.
In addition to agriculture and forestry, the town is home to several small businesses, including restaurants, retail stores, and service providers. The town is also home to a number of manufacturing companies, which produce a variety of products, including furniture, clothing, and automotive parts.
The town is served by the Dale County School System, which provides educational services to the town's students. The town is also home to a number of churches, which provide spiritual guidance to the town's residents.
Conclusion
Newton is a small town located in the southeastern part of Alabama. It has a population of approximately 1,500 people, according to the 2010 census. The town's economy is largely based on agriculture and forestry, and it is home to several small businesses, manufacturing companies, and churches. The town is served by the Dale County School System, which provides educational services to the town's students.
Common Questions
What is Per Capita Income in Newton?
Per Capita income in Newton is $26,393.
What is the Median Family Income in Newton?
Median Family Income in Newton is $77,115.
What is the Median Household income in Newton?
Median Household Income in Newton is $64,297.
What is Income or Wage Gap in Newton?
Income or Wage Gap in Newton is 25.2%.
Women in Newton earn 74.8 cents for every dollar earned by a man.
What is Family Income Deficit in Newton?
Family Income Deficit in Newton is $7,889.
Families that are below poverty line in Newton earn $7,889 less on average than the poverty threshold level.
What is Inequality or Gini Index in Newton?
Inequality or Gini Index in Newton is 0.38.
What is the Total Population of Newton?
Total Population of Newton is 1,528.
What is the Total Male Population of Newton?
Total Male Population of Newton is 761.
What is the Total Female Population of Newton?
Total Female Population of Newton is 767.
What is the Ratio of Males per 100 Females in Newton?
There are 99.22 Males per 100 Females in Newton.
What is the Ratio of Females per 100 Males in Newton?
There are 100.79 Females per 100 Males in Newton.
What is the Median Population Age in Newton?
Median Population Age in Newton is 43.9 Years.
What is the Average Family Size in Newton
Average Family Size in Newton is 3.3 People.
What is the Average Household Size in Newton
Average Household Size in Newton is 2.6 People.
How Large is the Labor Force in Newton?
There are 571 People in the Labor Forcein in Newton.
What is the Percentage of People in the Labor Force in Newton?
46.9% of People are in the Labor Force in Newton.
What is the Unemployment Rate in Newton?
Unemployment Rate in Newton is 4.0%.