Newbern, AL Map & Demographics
Newbern Map
Newbern Overview
$18,490
PER CAPITA INCOME
$34,750
AVG FAMILY INCOME
$33,625
AVG HOUSEHOLD INCOME
69.8%
WAGE / INCOME GAP [ % ]
30.2¢/ $1
WAGE / INCOME GAP [ $ ]
0.41
INEQUALITY / GINI INDEX
310
TOTAL POPULATION
186
MALE POPULATION
124
FEMALE POPULATION
150.00
MALES / 100 FEMALES
66.67
FEMALES / 100 MALES
49.7
MEDIAN AGE
4.5
AVG FAMILY SIZE
3.1
AVG HOUSEHOLD SIZE
144
LABOR FORCE [ PEOPLE ]
49.1%
PERCENT IN LABOR FORCE
18.8%
UNEMPLOYMENT RATE
Newbern Zip Codes
Income in Newbern
Income Overview in Newbern
Per Capita Income in Newbern is $18,490, while median incomes of families and households are $34,750 and $33,625 respectively.
| Characteristic | Number | Measure |
| Per Capita Income | 310 | $18,490 |
| Median Family Income | 54 | $34,750 |
| Mean Family Income | 54 | $47,974 |
| Median Household Income | 99 | $33,625 |
| Mean Household Income | 99 | $39,226 |
| Income Deficit | 54 | $0 |
| Wage / Income Gap (%) | 310 | 69.83% |
| Wage / Income Gap ($) | 310 | 30.17¢ per $1 |
| Gini / Inequality Index | 310 | 0.41 |
Earnings by Sex in Newbern
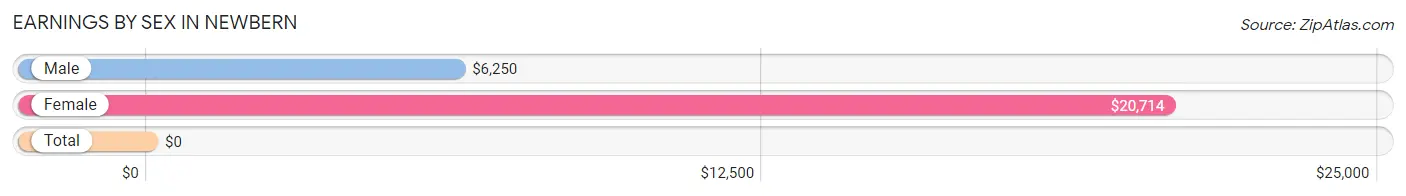
| Sex | Number | Average Earnings |
| Male | 70 (48.6%) | $6,250 |
| Female | 74 (51.4%) | $20,714 |
| Total | 144 (100.0%) | $0 |
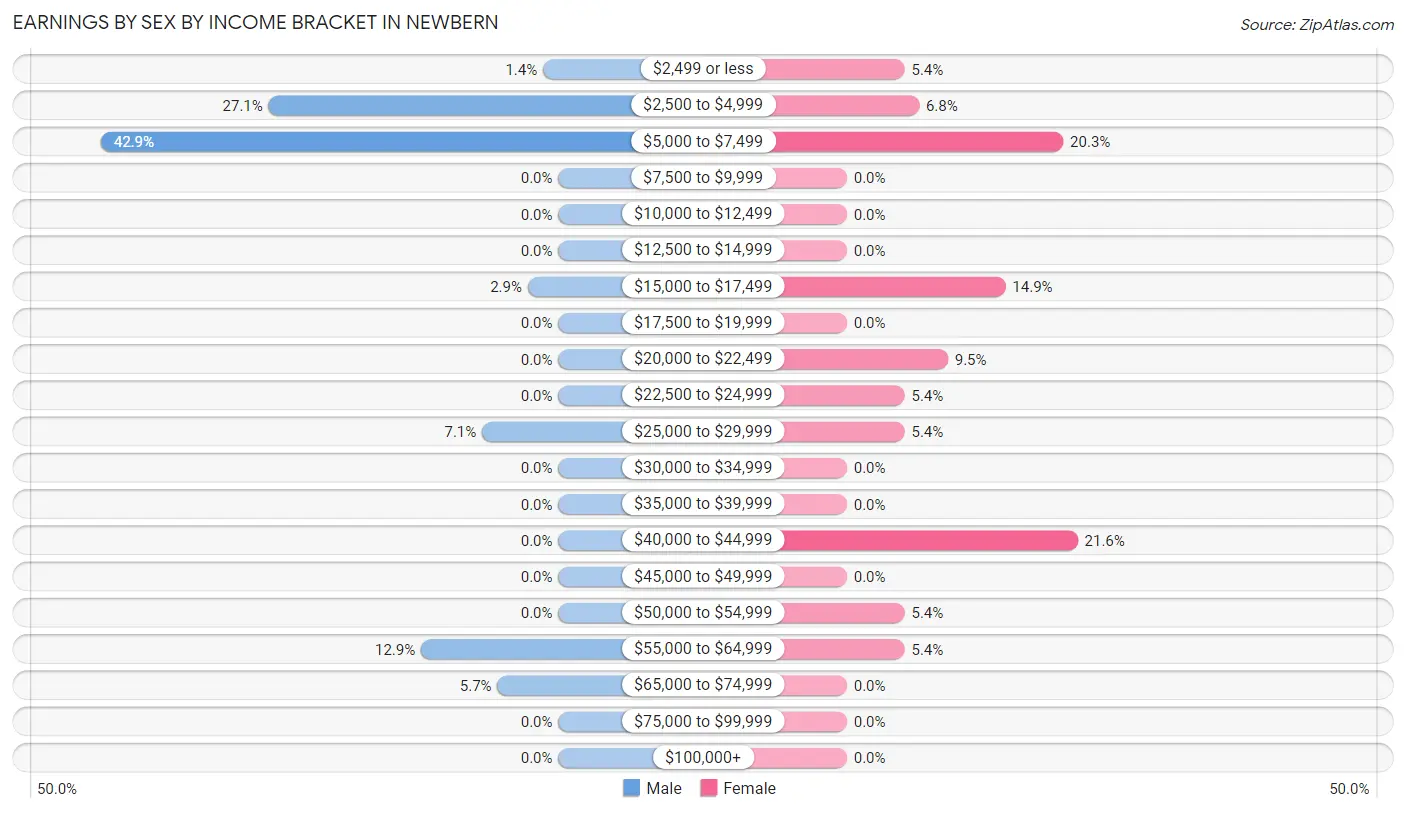
Earnings by Sex by Income Bracket in Newbern
The most common earnings brackets in Newbern are $5,000 to $7,499 for men (30 | 42.9%) and $40,000 to $44,999 for women (16 | 21.6%).
| Income | Male | Female |
| $2,499 or less | 1 (1.4%) | 4 (5.4%) |
| $2,500 to $4,999 | 19 (27.1%) | 5 (6.8%) |
| $5,000 to $7,499 | 30 (42.9%) | 15 (20.3%) |
| $7,500 to $9,999 | 0 (0.0%) | 0 (0.0%) |
| $10,000 to $12,499 | 0 (0.0%) | 0 (0.0%) |
| $12,500 to $14,999 | 0 (0.0%) | 0 (0.0%) |
| $15,000 to $17,499 | 2 (2.9%) | 11 (14.9%) |
| $17,500 to $19,999 | 0 (0.0%) | 0 (0.0%) |
| $20,000 to $22,499 | 0 (0.0%) | 7 (9.5%) |
| $22,500 to $24,999 | 0 (0.0%) | 4 (5.4%) |
| $25,000 to $29,999 | 5 (7.1%) | 4 (5.4%) |
| $30,000 to $34,999 | 0 (0.0%) | 0 (0.0%) |
| $35,000 to $39,999 | 0 (0.0%) | 0 (0.0%) |
| $40,000 to $44,999 | 0 (0.0%) | 16 (21.6%) |
| $45,000 to $49,999 | 0 (0.0%) | 0 (0.0%) |
| $50,000 to $54,999 | 0 (0.0%) | 4 (5.4%) |
| $55,000 to $64,999 | 9 (12.9%) | 4 (5.4%) |
| $65,000 to $74,999 | 4 (5.7%) | 0 (0.0%) |
| $75,000 to $99,999 | 0 (0.0%) | 0 (0.0%) |
| $100,000+ | 0 (0.0%) | 0 (0.0%) |
| Total | 70 (100.0%) | 74 (100.0%) |
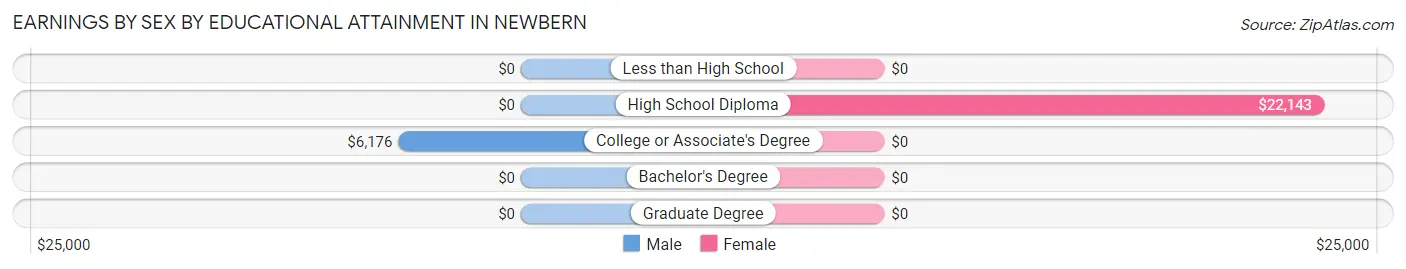
Earnings by Sex by Educational Attainment in Newbern
Average earnings in Newbern are $6,542 for men and $23,125 for women, a difference of 71.7%. Men with an educational attainment of college or associate's degree enjoy the highest average annual earnings of $6,176, while those with college or associate's degree education earn the least with $6,176. Women with an educational attainment of high school diploma earn the most with the average annual earnings of $22,143, while those with high school diploma education have the smallest earnings of $22,143.
| Educational Attainment | Male Income | Female Income |
| Less than High School | - | - |
| High School Diploma | - | - |
| College or Associate's Degree | $6,176 | $0 |
| Bachelor's Degree | - | - |
| Graduate Degree | - | - |
| Total | $6,542 | $23,125 |
Family Income in Newbern
Family Income Brackets in Newbern
According to the Newbern family income data, there are 14 families falling into the $10,000 to $14,999 income range, which is the most common income bracket and makes up 25.9% of all families.
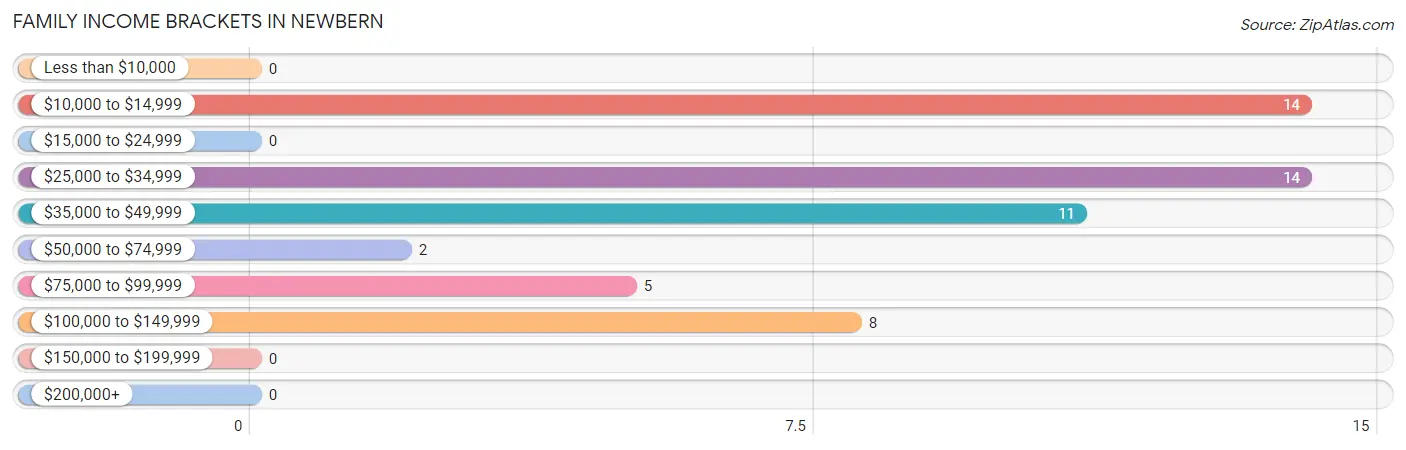
| Income Bracket | # Families | % Families |
| Less than $10,000 | 0 | 0.0% |
| $10,000 to $14,999 | 14 | 25.9% |
| $15,000 to $24,999 | 0 | 0.0% |
| $25,000 to $34,999 | 14 | 25.9% |
| $35,000 to $49,999 | 11 | 20.4% |
| $50,000 to $74,999 | 2 | 3.7% |
| $75,000 to $99,999 | 5 | 9.3% |
| $100,000 to $149,999 | 8 | 14.8% |
| $150,000 to $199,999 | 0 | 0.0% |
| $200,000+ | 0 | 0.0% |
Family Income by Famaliy Size in Newbern
2-person families (26 | 48.1%) account for the highest median family income in Newbern with $33,750 per family, while 2-person families (26 | 48.1%) have the highest median income of $16,875 per family member.
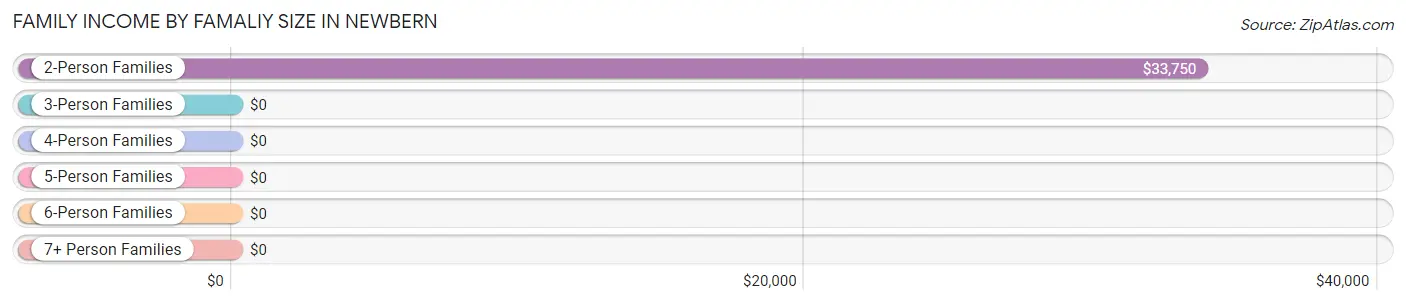
| Income Bracket | # Families | Median Income |
| 2-Person Families | 26 (48.1%) | $33,750 |
| 3-Person Families | 10 (18.5%) | $0 |
| 4-Person Families | 17 (31.5%) | $0 |
| 5-Person Families | 1 (1.8%) | $0 |
| 6-Person Families | 0 (0.0%) | $0 |
| 7+ Person Families | 0 (0.0%) | $0 |
| Total | 54 (100.0%) | $34,750 |
Family Income by Number of Earners in Newbern
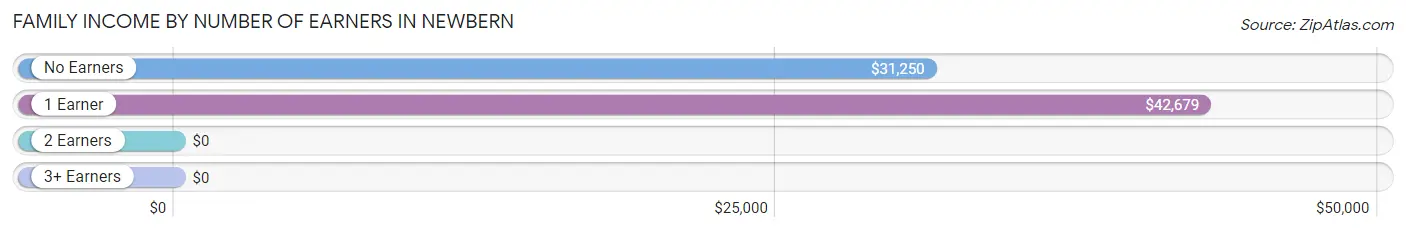
| Number of Earners | # Families | Median Income |
| No Earners | 5 (9.3%) | $31,250 |
| 1 Earner | 15 (27.8%) | $42,679 |
| 2 Earners | 32 (59.3%) | $0 |
| 3+ Earners | 2 (3.7%) | $0 |
| Total | 54 (100.0%) | $34,750 |
Household Income in Newbern
Household Income Brackets in Newbern
With 22 households falling in the category, the $25,000 to $34,999 income range is the most frequent in Newbern, accounting for 22.2% of all households.
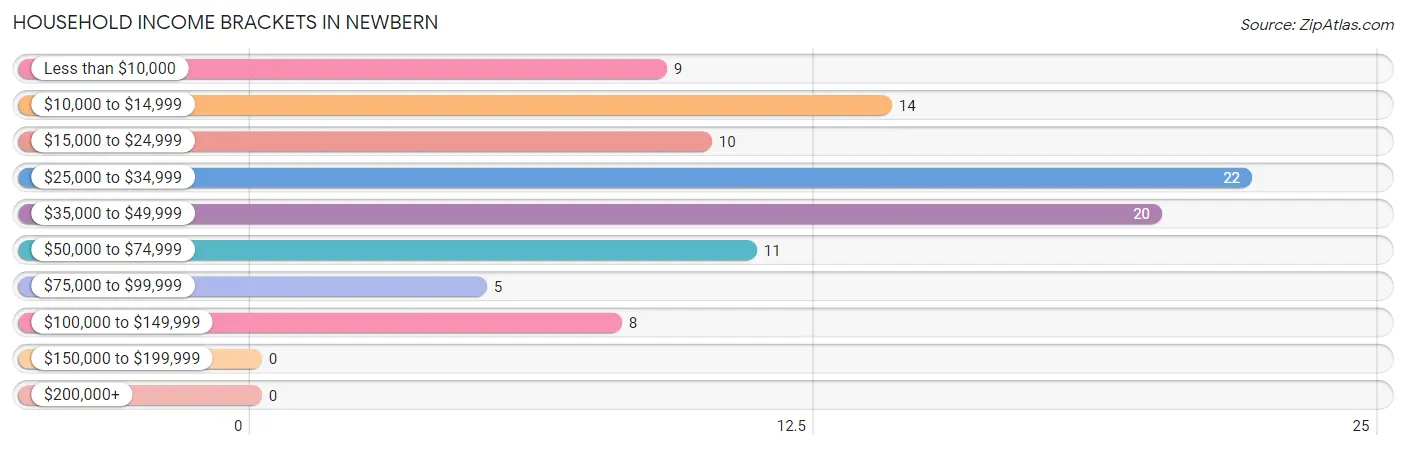
| Income Bracket | # Households | % Households |
| Less than $10,000 | 9 | 9.1% |
| $10,000 to $14,999 | 14 | 14.1% |
| $15,000 to $24,999 | 10 | 10.1% |
| $25,000 to $34,999 | 22 | 22.2% |
| $35,000 to $49,999 | 20 | 20.2% |
| $50,000 to $74,999 | 11 | 11.1% |
| $75,000 to $99,999 | 5 | 5.1% |
| $100,000 to $149,999 | 8 | 8.1% |
| $150,000 to $199,999 | 0 | 0.0% |
| $200,000+ | 0 | 0.0% |
Household Income by Householder Age in Newbern
The median household income in Newbern is $33,625, with the highest median household income of $34,250 found in the 65+ years age bracket for the primary householder. A total of 46 households (46.5%) fall into this category.
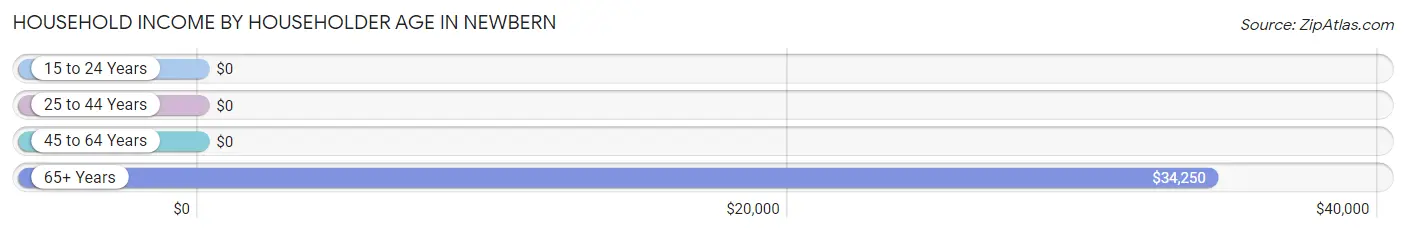
| Income Bracket | # Households | Median Income |
| 15 to 24 Years | 0 (0.0%) | $0 |
| 25 to 44 Years | 11 (11.1%) | $0 |
| 45 to 64 Years | 42 (42.4%) | $0 |
| 65+ Years | 46 (46.5%) | $34,250 |
| Total | 99 (100.0%) | $33,625 |
Poverty in Newbern
Income Below Poverty by Sex and Age in Newbern
With 30.6% poverty level for males and 18.5% for females among the residents of Newbern, 18 to 24 year old males and 12 to 14 year old females are the most vulnerable to poverty, with 12 males (70.6%) and 11 females (100.0%) in their respective age groups living below the poverty level.
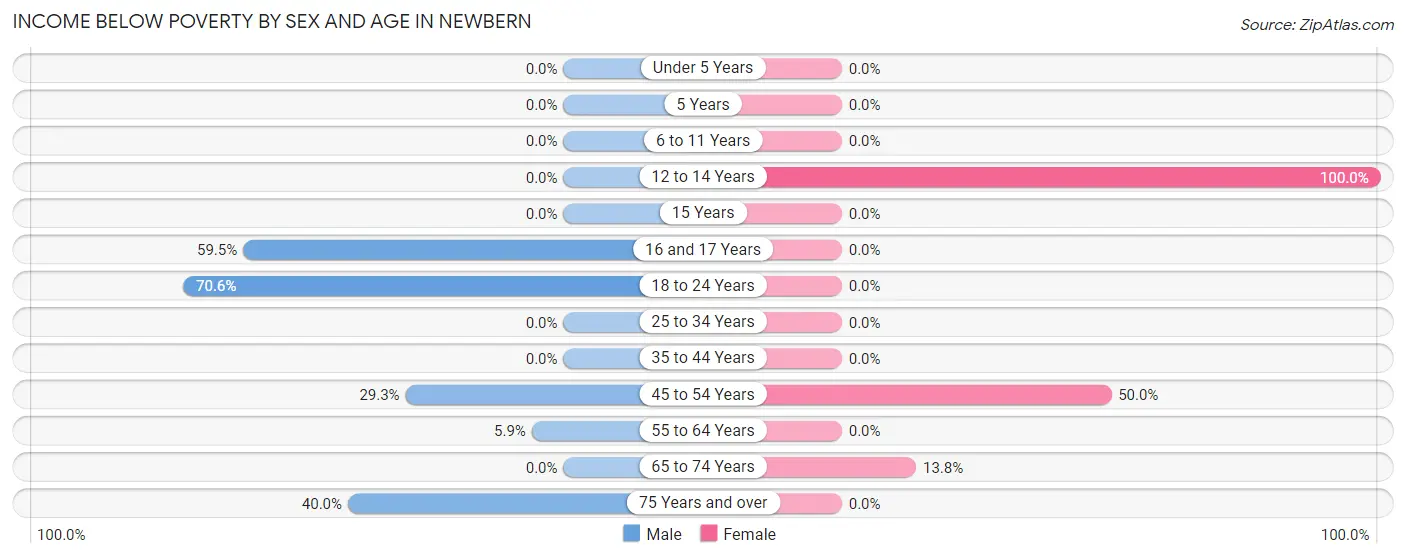
| Age Bracket | Male | Female |
| Under 5 Years | 0 (0.0%) | 0 (0.0%) |
| 5 Years | 0 (0.0%) | 0 (0.0%) |
| 6 to 11 Years | 0 (0.0%) | 0 (0.0%) |
| 12 to 14 Years | 0 (0.0%) | 11 (100.0%) |
| 15 Years | 0 (0.0%) | 0 (0.0%) |
| 16 and 17 Years | 22 (59.5%) | 0 (0.0%) |
| 18 to 24 Years | 12 (70.6%) | 0 (0.0%) |
| 25 to 34 Years | 0 (0.0%) | 0 (0.0%) |
| 35 to 44 Years | 0 (0.0%) | 0 (0.0%) |
| 45 to 54 Years | 17 (29.3%) | 8 (50.0%) |
| 55 to 64 Years | 2 (5.9%) | 0 (0.0%) |
| 65 to 74 Years | 0 (0.0%) | 4 (13.8%) |
| 75 Years and over | 4 (40.0%) | 0 (0.0%) |
| Total | 57 (30.6%) | 23 (18.5%) |
Income Above Poverty by Sex and Age in Newbern
According to the poverty statistics in Newbern, males aged under 5 years and females aged 16 and 17 years are the age groups that are most secure financially, with 100.0% of males and 100.0% of females in these age groups living above the poverty line.
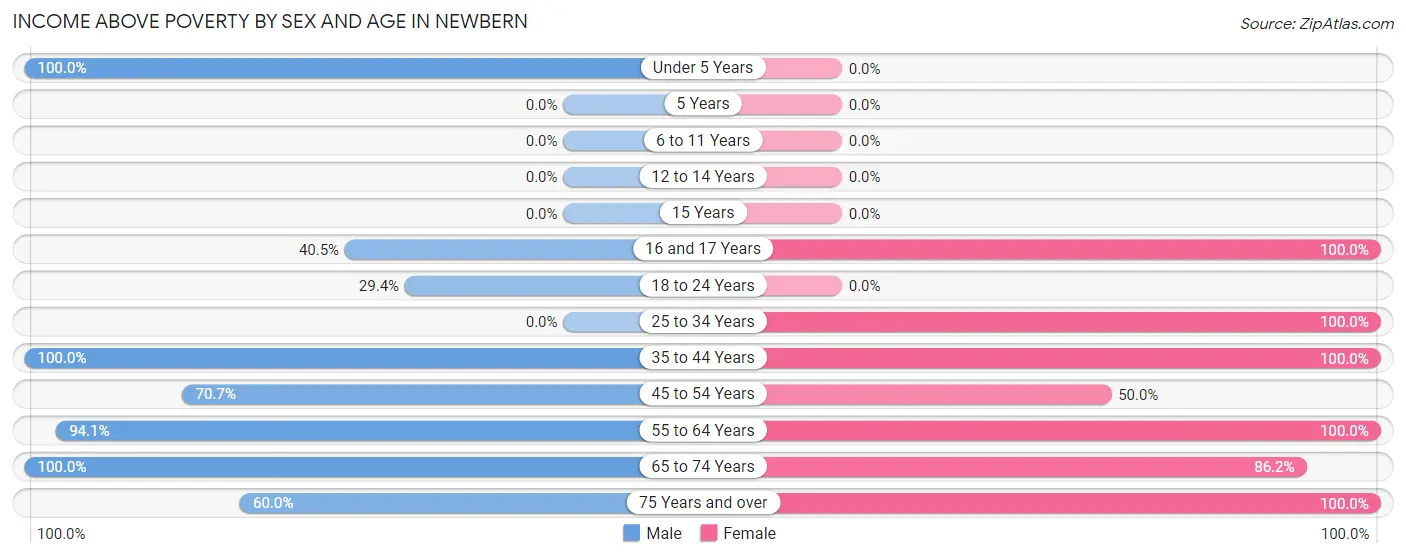
| Age Bracket | Male | Female |
| Under 5 Years | 6 (100.0%) | 0 (0.0%) |
| 5 Years | 0 (0.0%) | 0 (0.0%) |
| 6 to 11 Years | 0 (0.0%) | 0 (0.0%) |
| 12 to 14 Years | 0 (0.0%) | 0 (0.0%) |
| 15 Years | 0 (0.0%) | 0 (0.0%) |
| 16 and 17 Years | 15 (40.5%) | 12 (100.0%) |
| 18 to 24 Years | 5 (29.4%) | 0 (0.0%) |
| 25 to 34 Years | 0 (0.0%) | 4 (100.0%) |
| 35 to 44 Years | 5 (100.0%) | 21 (100.0%) |
| 45 to 54 Years | 41 (70.7%) | 8 (50.0%) |
| 55 to 64 Years | 32 (94.1%) | 27 (100.0%) |
| 65 to 74 Years | 19 (100.0%) | 25 (86.2%) |
| 75 Years and over | 6 (60.0%) | 4 (100.0%) |
| Total | 129 (69.4%) | 101 (81.5%) |
Income Below Poverty Among Married-Couple Families in Newbern
The poverty statistics for married-couple families in Newbern show that 42.4% or 14 of the total 33 families live below the poverty line. Families with 1 or 2 children have the highest poverty rate of 66.7%, comprising of 10 families. On the other hand, families with no children have the lowest poverty rate of 22.2%, which includes 4 families.
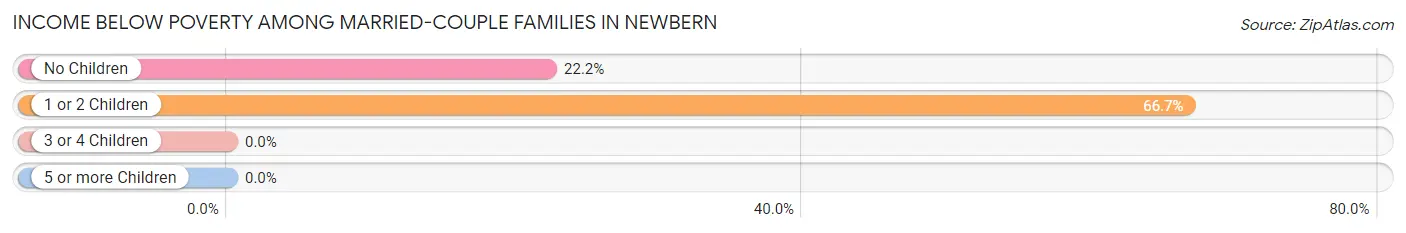
| Children | Above Poverty | Below Poverty |
| No Children | 14 (77.8%) | 4 (22.2%) |
| 1 or 2 Children | 5 (33.3%) | 10 (66.7%) |
| 3 or 4 Children | 0 (0.0%) | 0 (0.0%) |
| 5 or more Children | 0 (0.0%) | 0 (0.0%) |
| Total | 19 (57.6%) | 14 (42.4%) |
Income Below Poverty Among Single-Parent Households in Newbern
| Children | Single Father | Single Mother |
| No Children | 0 (0.0%) | 0 (0.0%) |
| 1 or 2 Children | 0 (0.0%) | 0 (0.0%) |
| 3 or 4 Children | 0 (0.0%) | 0 (0.0%) |
| 5 or more Children | 0 (0.0%) | 0 (0.0%) |
| Total | 0 (0.0%) | 0 (0.0%) |
Income Below Poverty Among Married-Couple vs Single-Parent Households in Newbern
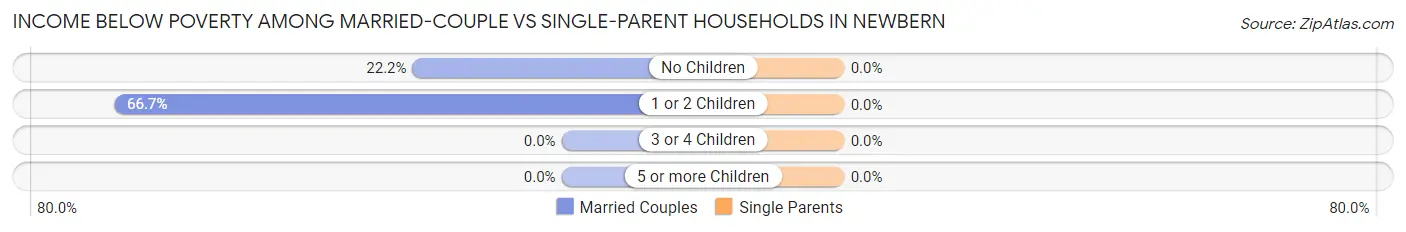
| Children | Married-Couple Families | Single-Parent Households |
| No Children | 4 (22.2%) | 0 (0.0%) |
| 1 or 2 Children | 10 (66.7%) | 0 (0.0%) |
| 3 or 4 Children | 0 (0.0%) | 0 (0.0%) |
| 5 or more Children | 0 (0.0%) | 0 (0.0%) |
| Total | 14 (42.4%) | 0 (0.0%) |
Race in Newbern
The most populous races in Newbern are Black / African American (288 | 92.9%), and White / Caucasian (22 | 7.1%).
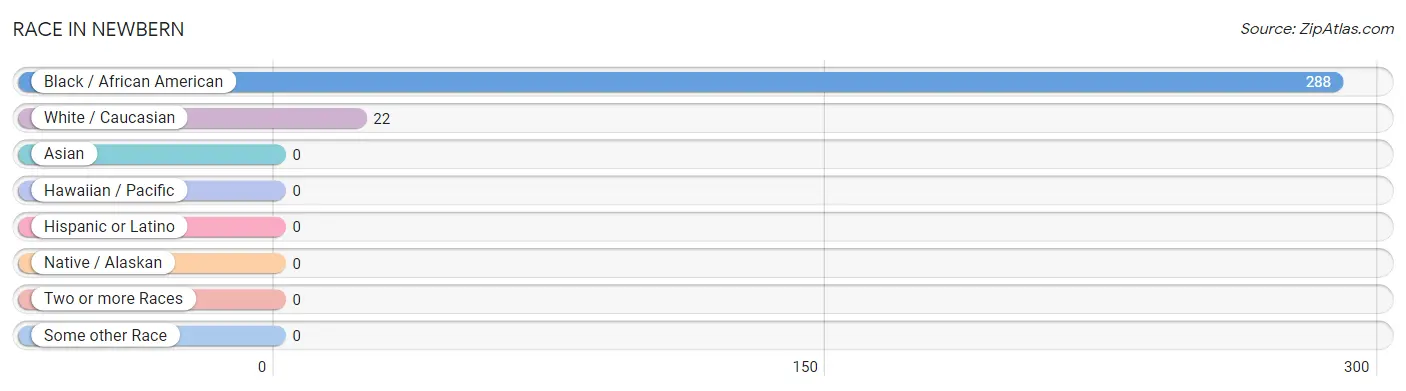
| Race | # Population | % Population |
| Asian | 0 | 0.0% |
| Black / African American | 288 | 92.9% |
| Hawaiian / Pacific | 0 | 0.0% |
| Hispanic or Latino | 0 | 0.0% |
| Native / Alaskan | 0 | 0.0% |
| White / Caucasian | 22 | 7.1% |
| Two or more Races | 0 | 0.0% |
| Some other Race | 0 | 0.0% |
| Total | 310 | 100.0% |
Ancestry in Newbern
The most populous ancestries reported in Newbern are American (21 | 6.8%), English (16 | 5.2%), African (6 | 1.9%), Subsaharan African (6 | 1.9%), and French (4 | 1.3%), together accounting for 17.1% of all Newbern residents.
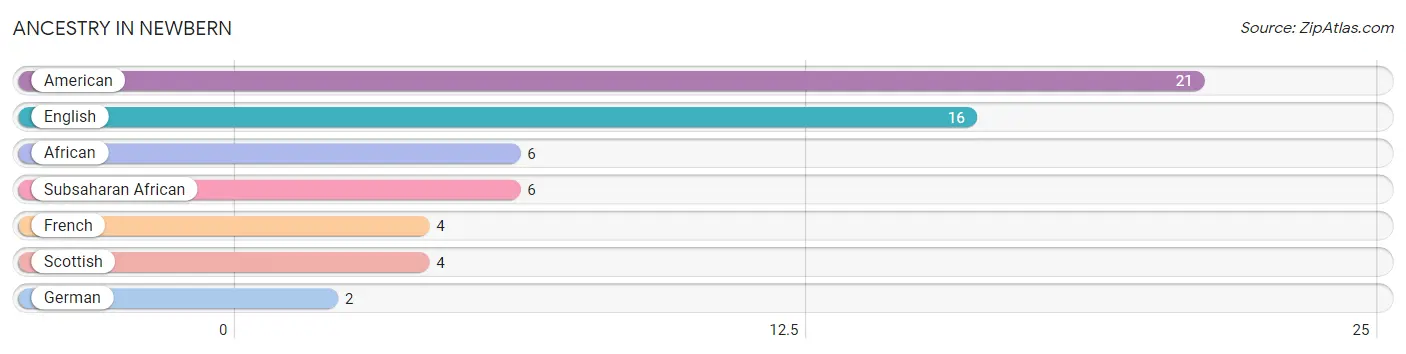
| Ancestry | # Population | % Population |
| African | 6 | 1.9% |
| American | 21 | 6.8% |
| English | 16 | 5.2% |
| French | 4 | 1.3% |
| German | 2 | 0.6% |
| Scottish | 4 | 1.3% |
| Subsaharan African | 6 | 1.9% | View All 7 Rows |
Immigrants in Newbern

| Immigration Origin | # Population | % Population | View All 0 Rows |
Sex and Age in Newbern
Sex and Age in Newbern
The most populous age groups in Newbern are 45 to 49 Years (49 | 26.3%) for men and 55 to 59 Years (21 | 16.9%) for women.
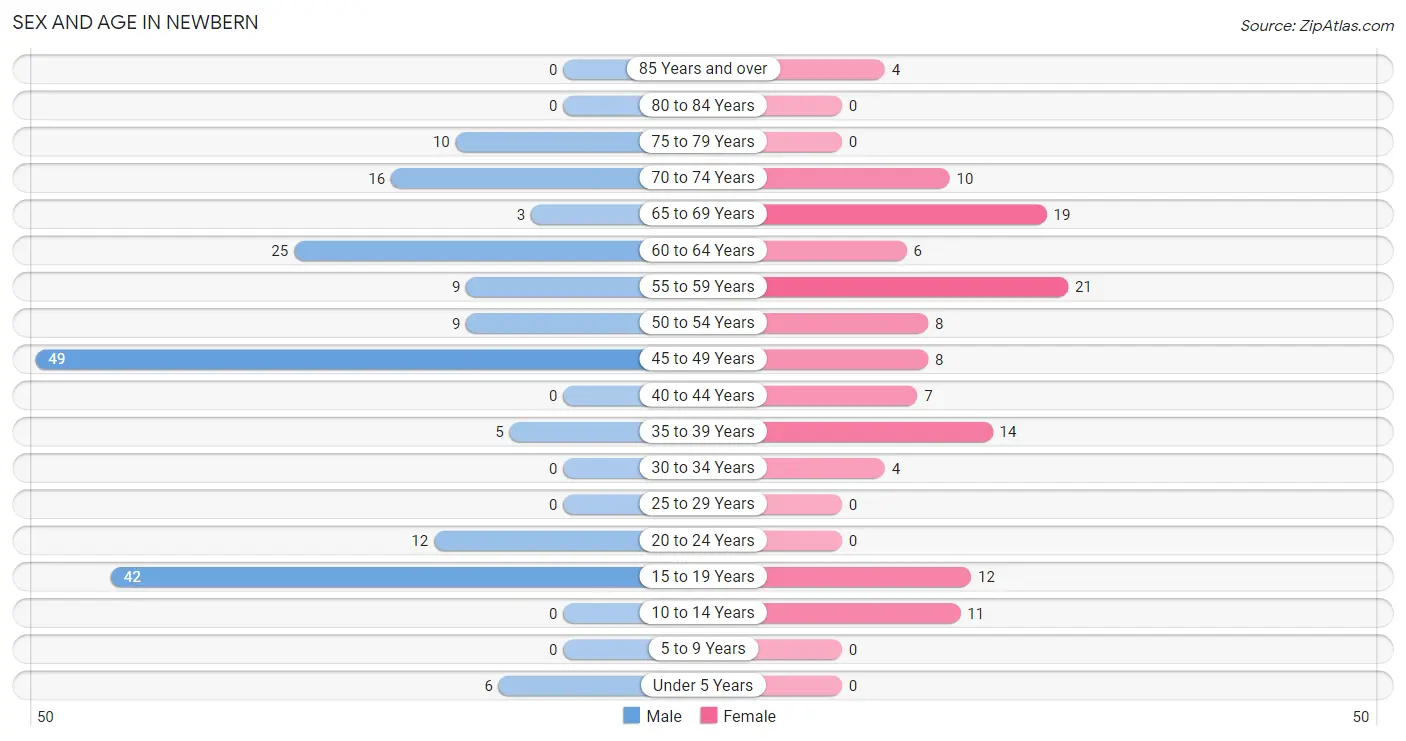
| Age Bracket | Male | Female |
| Under 5 Years | 6 (3.2%) | 0 (0.0%) |
| 5 to 9 Years | 0 (0.0%) | 0 (0.0%) |
| 10 to 14 Years | 0 (0.0%) | 11 (8.9%) |
| 15 to 19 Years | 42 (22.6%) | 12 (9.7%) |
| 20 to 24 Years | 12 (6.5%) | 0 (0.0%) |
| 25 to 29 Years | 0 (0.0%) | 0 (0.0%) |
| 30 to 34 Years | 0 (0.0%) | 4 (3.2%) |
| 35 to 39 Years | 5 (2.7%) | 14 (11.3%) |
| 40 to 44 Years | 0 (0.0%) | 7 (5.7%) |
| 45 to 49 Years | 49 (26.3%) | 8 (6.5%) |
| 50 to 54 Years | 9 (4.8%) | 8 (6.5%) |
| 55 to 59 Years | 9 (4.8%) | 21 (16.9%) |
| 60 to 64 Years | 25 (13.4%) | 6 (4.8%) |
| 65 to 69 Years | 3 (1.6%) | 19 (15.3%) |
| 70 to 74 Years | 16 (8.6%) | 10 (8.1%) |
| 75 to 79 Years | 10 (5.4%) | 0 (0.0%) |
| 80 to 84 Years | 0 (0.0%) | 0 (0.0%) |
| 85 Years and over | 0 (0.0%) | 4 (3.2%) |
| Total | 186 (100.0%) | 124 (100.0%) |
Families and Households in Newbern
Median Family Size in Newbern
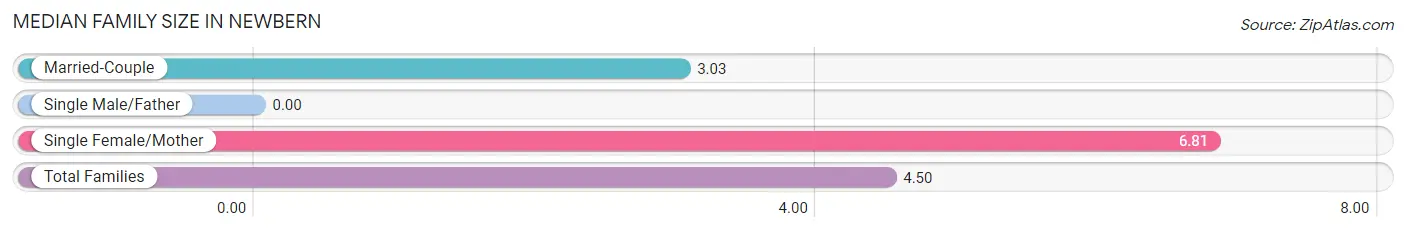
| Family Type | # Families | Family Size |
| Married-Couple | 33 (61.1%) | 3.03 |
| Single Male/Father | 0 (0.0%) | - |
| Single Female/Mother | 21 (38.9%) | 6.81 |
| Total Families | 54 (100.0%) | 4.50 |
Median Household Size in Newbern
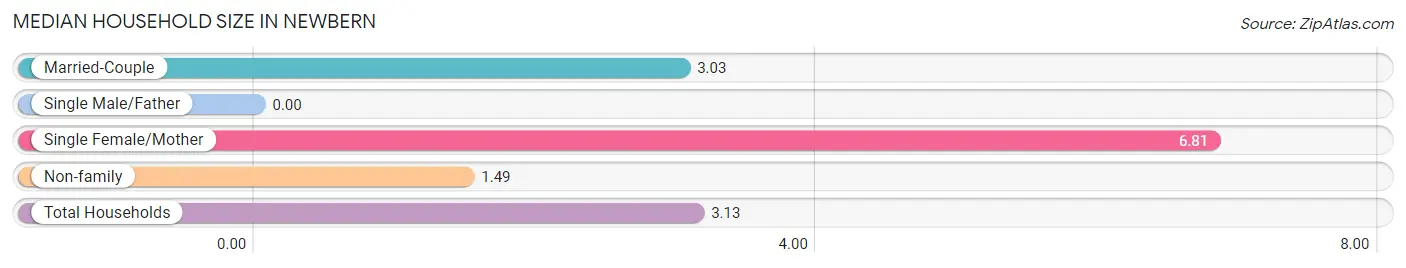
| Household Type | # Households | Household Size |
| Married-Couple | 33 (33.3%) | 3.03 |
| Single Male/Father | 0 (0.0%) | - |
| Single Female/Mother | 21 (21.2%) | 6.81 |
| Non-family | 45 (45.5%) | 1.49 |
| Total Households | 99 (100.0%) | 3.13 |
Household Size by Marriage Status in Newbern
Out of a total of 99 households in Newbern, 54 (54.5%) are family households, while 45 (45.5%) are nonfamily households. The most numerous type of family households are 2-person households, comprising 26, and the most common type of nonfamily households are 1-person households, comprising 38.
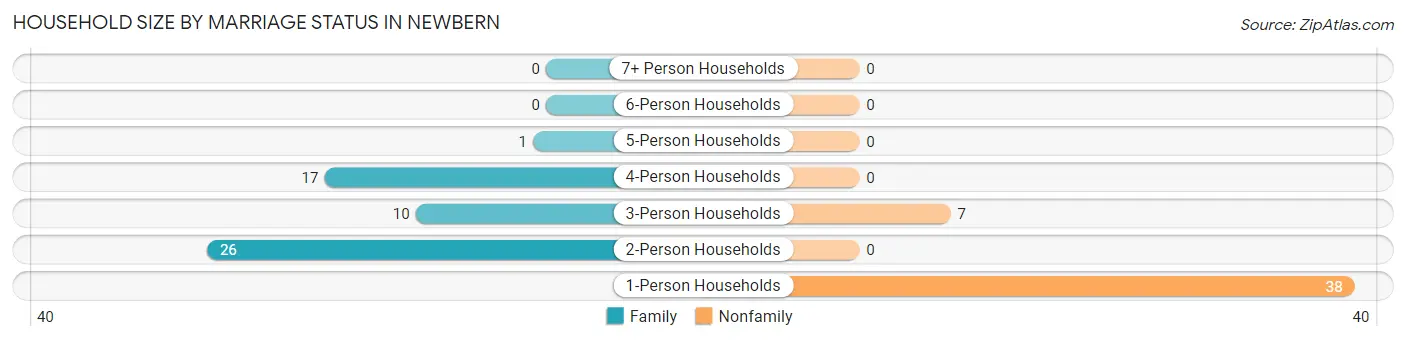
| Household Size | Family Households | Nonfamily Households |
| 1-Person Households | - | 38 (38.4%) |
| 2-Person Households | 26 (26.3%) | 0 (0.0%) |
| 3-Person Households | 10 (10.1%) | 7 (7.1%) |
| 4-Person Households | 17 (17.2%) | 0 (0.0%) |
| 5-Person Households | 1 (1.0%) | 0 (0.0%) |
| 6-Person Households | 0 (0.0%) | 0 (0.0%) |
| 7+ Person Households | 0 (0.0%) | 0 (0.0%) |
| Total | 54 (54.5%) | 45 (45.5%) |
Female Fertility in Newbern
Fertility by Age in Newbern
Average fertility rate in Newbern is 156.0 births per 1,000 women. Women in the age bracket of 35 to 50 years have the highest fertility rate with 241.0 births per 1,000 women. Women in the age bracket of 35 to 50 years acount for 100.0% of all women with births.
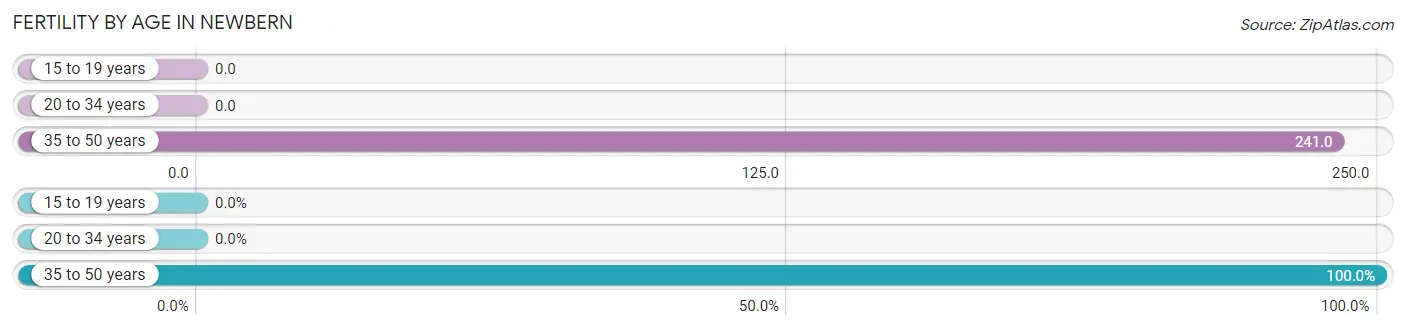
| Age Bracket | Women with Births | Births / 1,000 Women |
| 15 to 19 years | 0 (0.0%) | 0.0 |
| 20 to 34 years | 0 (0.0%) | 0.0 |
| 35 to 50 years | 7 (100.0%) | 241.0 |
| Total | 7 (100.0%) | 156.0 |
Fertility by Age by Marriage Status in Newbern
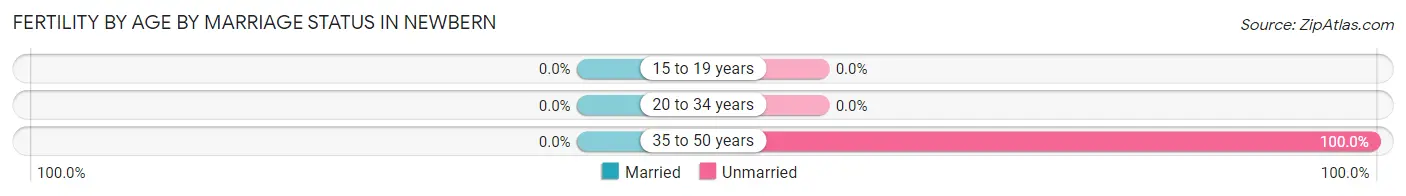
| Age Bracket | Married | Unmarried |
| 15 to 19 years | 0 (0.0%) | 0 (0.0%) |
| 20 to 34 years | 0 (0.0%) | 0 (0.0%) |
| 35 to 50 years | 0 (0.0%) | 7 (100.0%) |
| Total | 0 (0.0%) | 7 (100.0%) |
Fertility by Education in Newbern
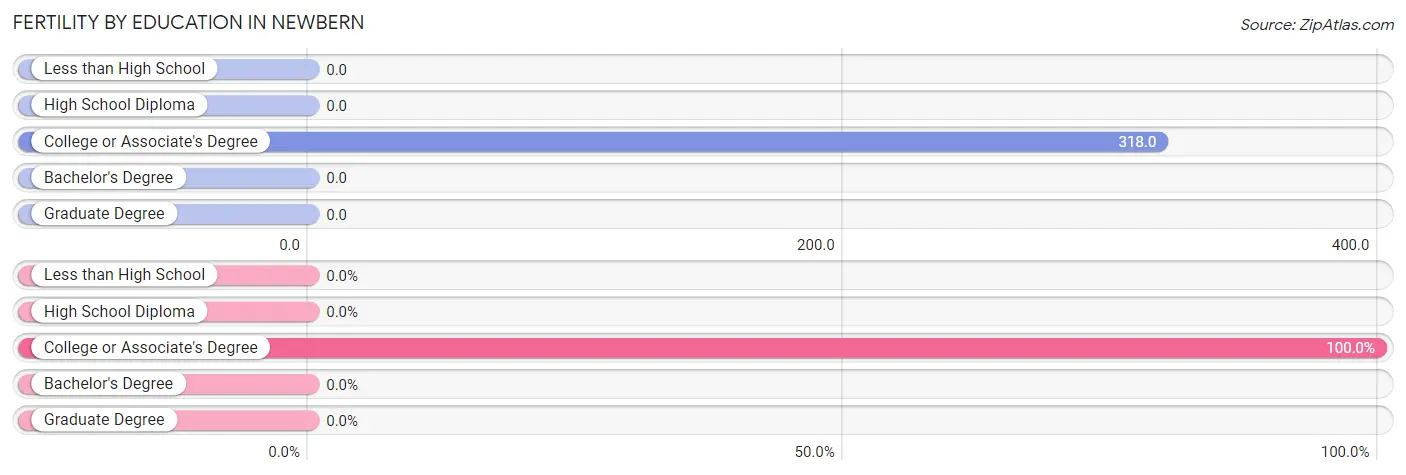
| Educational Attainment | Women with Births | Births / 1,000 Women |
| Less than High School | 0 (0.0%) | 0.0 |
| High School Diploma | 0 (0.0%) | 0.0 |
| College or Associate's Degree | 7 (100.0%) | 318.0 |
| Bachelor's Degree | 0 (0.0%) | 0.0 |
| Graduate Degree | 0 (0.0%) | 0.0 |
| Total | 7 (100.0%) | 156.0 |
Fertility by Education by Marriage Status in Newbern
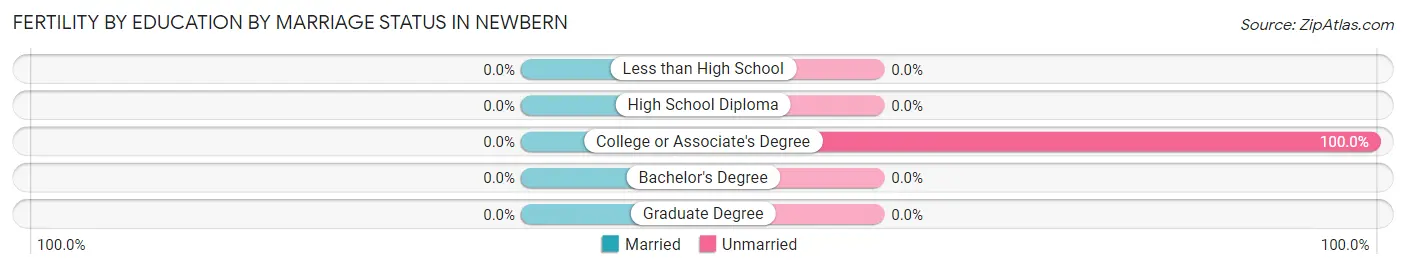
| Educational Attainment | Married | Unmarried |
| Less than High School | 0 (0.0%) | 0 (0.0%) |
| High School Diploma | 0 (0.0%) | 0 (0.0%) |
| College or Associate's Degree | 0 (0.0%) | 7 (100.0%) |
| Bachelor's Degree | 0 (0.0%) | 0 (0.0%) |
| Graduate Degree | 0 (0.0%) | 0 (0.0%) |
| Total | 0 (0.0%) | 7 (100.0%) |
Employment Characteristics in Newbern
Employment by Class of Employer in Newbern
Among the 104 employed individuals in Newbern, private company employees (81 | 77.9%), state government employees (13 | 12.5%), and not-for-profit organizations (10 | 9.6%) make up the most common classes of employment.
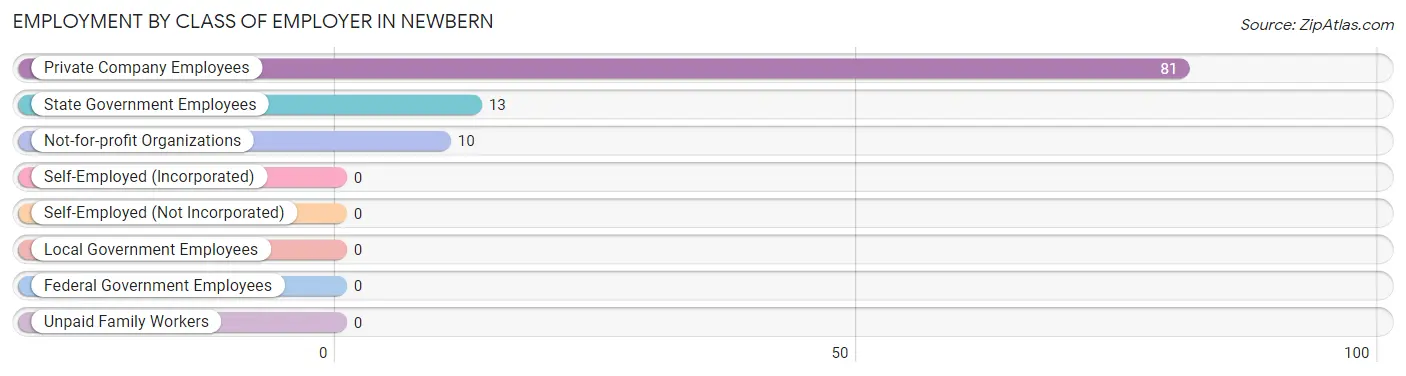
| Employer Class | # Employees | % Employees |
| Private Company Employees | 81 | 77.9% |
| Self-Employed (Incorporated) | 0 | 0.0% |
| Self-Employed (Not Incorporated) | 0 | 0.0% |
| Not-for-profit Organizations | 10 | 9.6% |
| Local Government Employees | 0 | 0.0% |
| State Government Employees | 13 | 12.5% |
| Federal Government Employees | 0 | 0.0% |
| Unpaid Family Workers | 0 | 0.0% |
| Total | 104 | 100.0% |
Employment Status by Age in Newbern
According to the labor force statistics for Newbern, out of the total population over 16 years of age (293), 49.1% or 144 individuals are in the labor force, with 18.8% or 27 of them unemployed. The age group with the highest labor force participation rate is 20 to 24 years, with 100.0% or 12 individuals in the labor force. Within the labor force, the 45 to 54 years age range has the highest percentage of unemployed individuals, with 52.9% or 27 of them being unemployed.
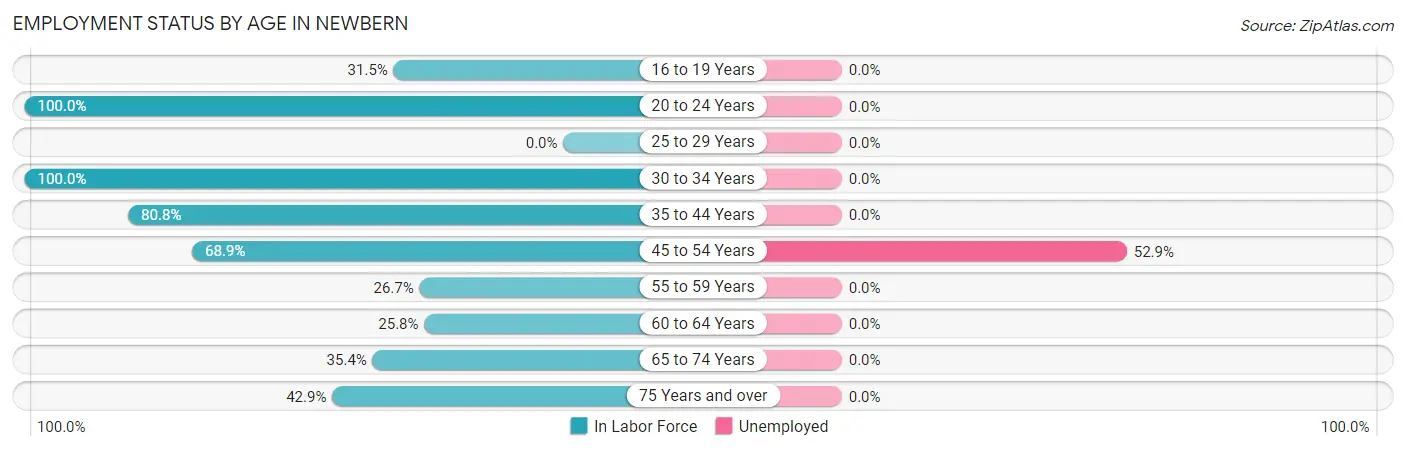
| Age Bracket | In Labor Force | Unemployed |
| 16 to 19 Years | 17 (31.5%) | 0 (0.0%) |
| 20 to 24 Years | 12 (100.0%) | 0 (0.0%) |
| 25 to 29 Years | 0 (0.0%) | 0 (0.0%) |
| 30 to 34 Years | 4 (100.0%) | 0 (0.0%) |
| 35 to 44 Years | 21 (80.8%) | 0 (0.0%) |
| 45 to 54 Years | 51 (68.9%) | 27 (52.9%) |
| 55 to 59 Years | 8 (26.7%) | 0 (0.0%) |
| 60 to 64 Years | 8 (25.8%) | 0 (0.0%) |
| 65 to 74 Years | 17 (35.4%) | 0 (0.0%) |
| 75 Years and over | 6 (42.9%) | 0 (0.0%) |
| Total | 144 (49.1%) | 27 (18.8%) |
Employment Status by Educational Attainment in Newbern
According to labor force statistics for Newbern, 55.8% of individuals (92) out of the total population between 25 and 64 years of age (165) are in the labor force, with 29.3% or 27 of them being unemployed. The group with the highest labor force participation rate are those with the educational attainment of college / associate degree, with 80.0% or 40 individuals in the labor force. Within the labor force, individuals with college / associate degree education have the highest percentage of unemployment, with 42.5% or 17 of them being unemployed.
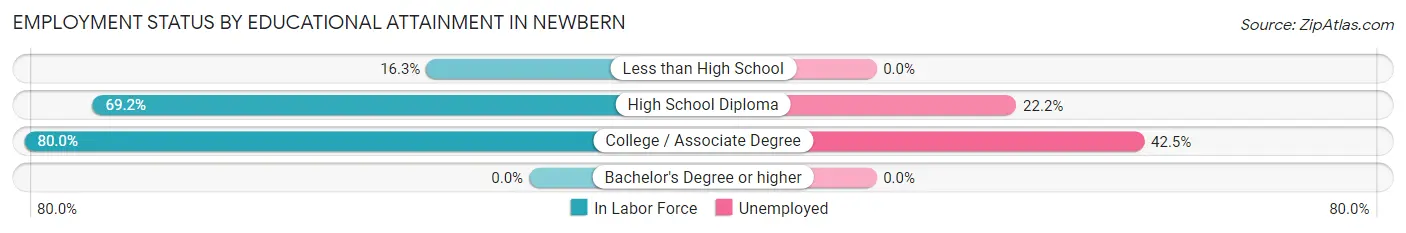
| Educational Attainment | In Labor Force | Unemployed |
| Less than High School | 7 (16.3%) | 0 (0.0%) |
| High School Diploma | 45 (69.2%) | 14 (22.2%) |
| College / Associate Degree | 40 (80.0%) | 21 (42.5%) |
| Bachelor's Degree or higher | 0 (0.0%) | 0 (0.0%) |
| Total | 92 (55.8%) | 48 (29.3%) |
Employment Occupations by Sex in Newbern
Management, Business, Science and Arts Occupations
The most common Management, Business, Science and Arts occupations in Newbern are Community & Social Service (21 | 17.9%), and Education Instruction & Library (21 | 17.9%).
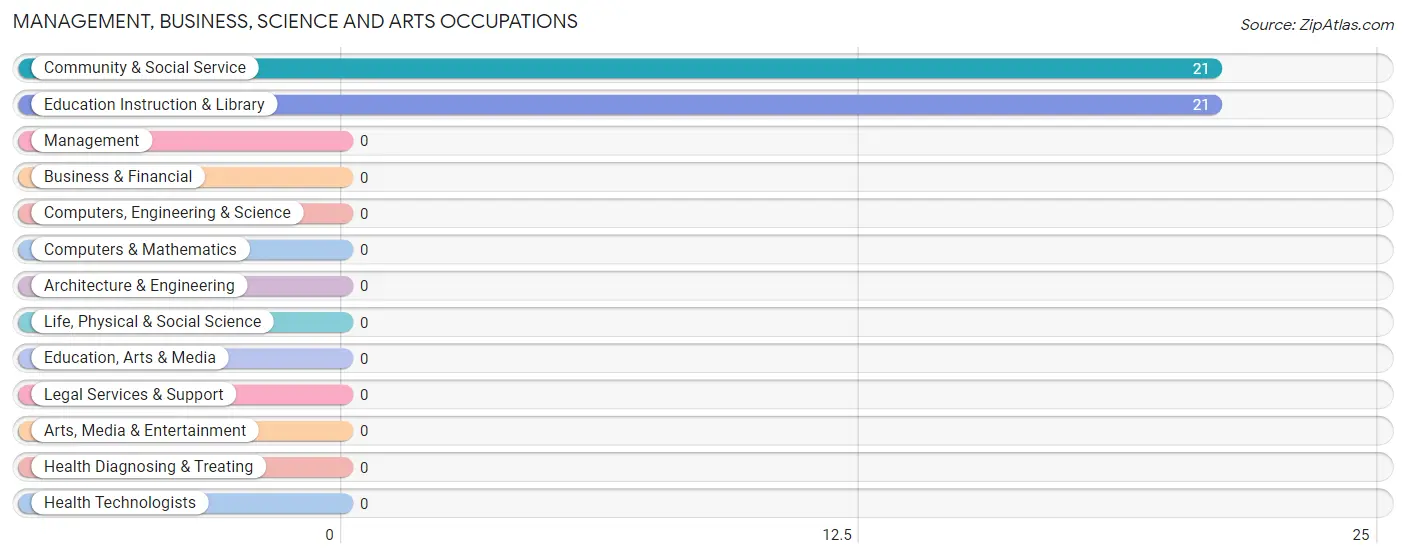
Management, Business, Science and Arts Occupations by Sex
Within the Management, Business, Science and Arts occupations in Newbern, the most male-oriented occupations are Community & Social Service (57.1%), and Education Instruction & Library (57.1%), while the most female-oriented occupations are Community & Social Service (42.9%), and Education Instruction & Library (42.9%).
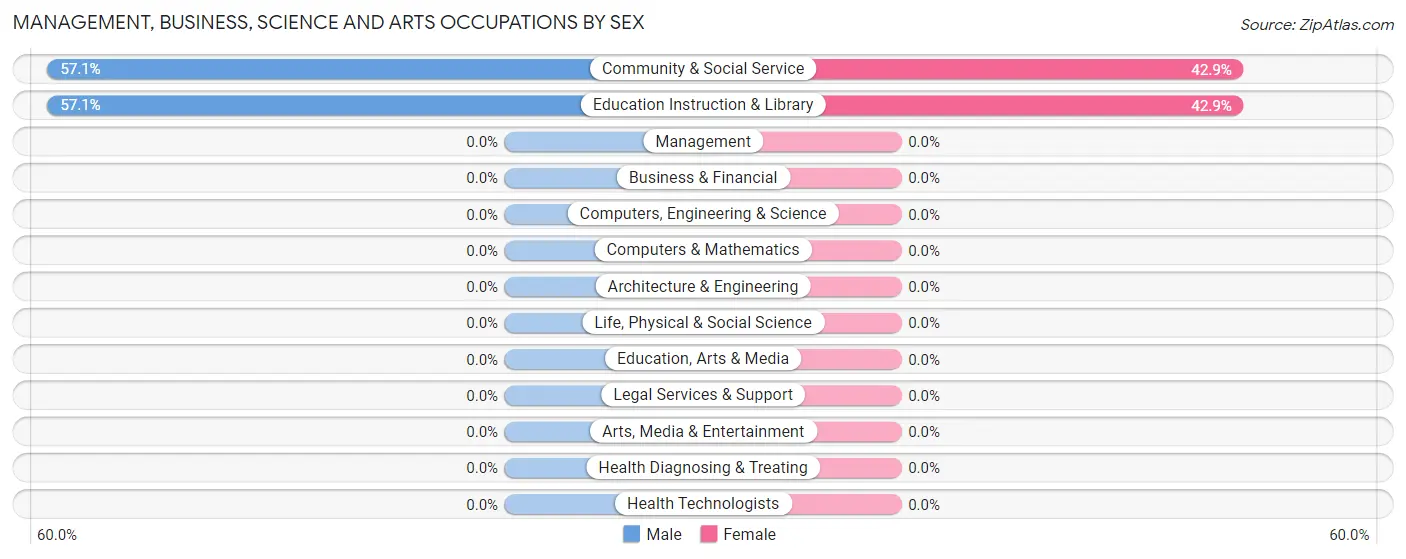
| Occupation | Male | Female |
| Management | 0 (0.0%) | 0 (0.0%) |
| Business & Financial | 0 (0.0%) | 0 (0.0%) |
| Computers, Engineering & Science | 0 (0.0%) | 0 (0.0%) |
| Computers & Mathematics | 0 (0.0%) | 0 (0.0%) |
| Architecture & Engineering | 0 (0.0%) | 0 (0.0%) |
| Life, Physical & Social Science | 0 (0.0%) | 0 (0.0%) |
| Community & Social Service | 12 (57.1%) | 9 (42.9%) |
| Education, Arts & Media | 0 (0.0%) | 0 (0.0%) |
| Legal Services & Support | 0 (0.0%) | 0 (0.0%) |
| Education Instruction & Library | 12 (57.1%) | 9 (42.9%) |
| Arts, Media & Entertainment | 0 (0.0%) | 0 (0.0%) |
| Health Diagnosing & Treating | 0 (0.0%) | 0 (0.0%) |
| Health Technologists | 0 (0.0%) | 0 (0.0%) |
| Total (Category) | 12 (57.1%) | 9 (42.9%) |
| Total (Overall) | 43 (36.7%) | 74 (63.2%) |
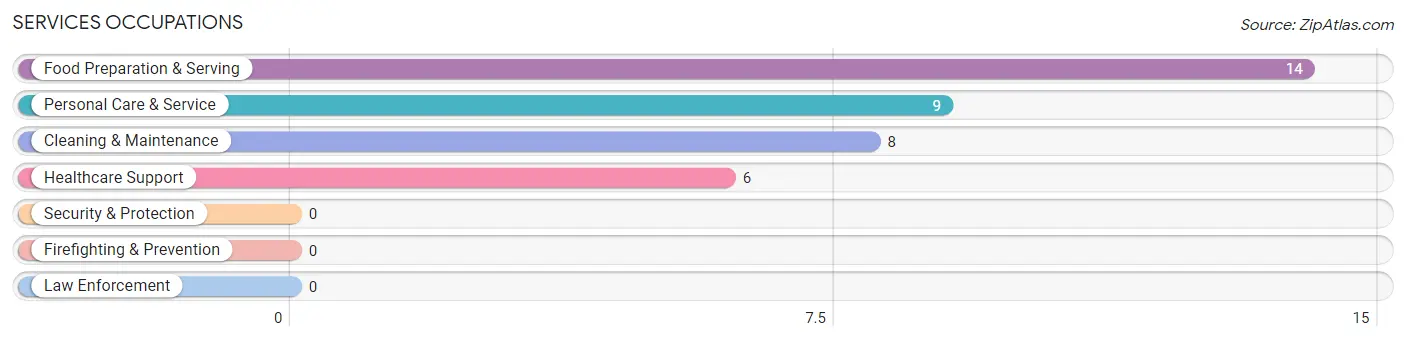
Services Occupations
The most common Services occupations in Newbern are Food Preparation & Serving (14 | 12.0%), Personal Care & Service (9 | 7.7%), Cleaning & Maintenance (8 | 6.8%), and Healthcare Support (6 | 5.1%).
Services Occupations by Sex
Within the Services occupations in Newbern, the most male-oriented occupations are Healthcare Support (100.0%), and Personal Care & Service (100.0%), while the most female-oriented occupations are Food Preparation & Serving (100.0%), and Cleaning & Maintenance (100.0%).
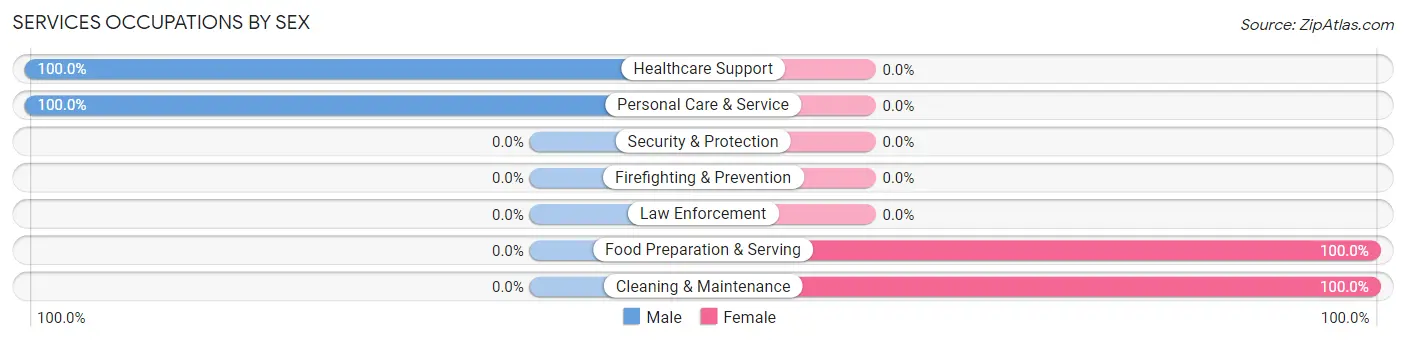
| Occupation | Male | Female |
| Healthcare Support | 6 (100.0%) | 0 (0.0%) |
| Security & Protection | 0 (0.0%) | 0 (0.0%) |
| Firefighting & Prevention | 0 (0.0%) | 0 (0.0%) |
| Law Enforcement | 0 (0.0%) | 0 (0.0%) |
| Food Preparation & Serving | 0 (0.0%) | 14 (100.0%) |
| Cleaning & Maintenance | 0 (0.0%) | 8 (100.0%) |
| Personal Care & Service | 9 (100.0%) | 0 (0.0%) |
| Total (Category) | 15 (40.5%) | 22 (59.5%) |
| Total (Overall) | 43 (36.7%) | 74 (63.2%) |
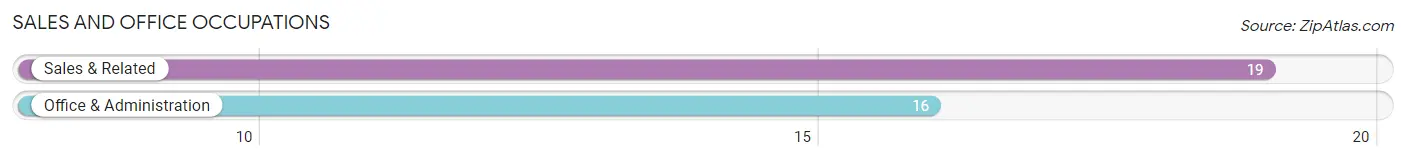
Sales and Office Occupations
The most common Sales and Office occupations in Newbern are Sales & Related (19 | 16.2%), and Office & Administration (16 | 13.7%).
Sales and Office Occupations by Sex
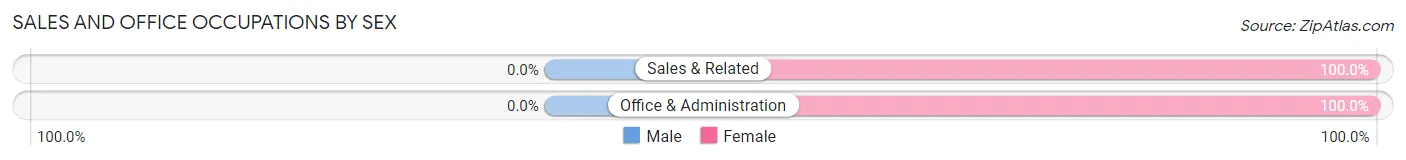
| Occupation | Male | Female |
| Sales & Related | 0 (0.0%) | 19 (100.0%) |
| Office & Administration | 0 (0.0%) | 16 (100.0%) |
| Total (Category) | 0 (0.0%) | 35 (100.0%) |
| Total (Overall) | 43 (36.7%) | 74 (63.2%) |
Natural Resources, Construction and Maintenance Occupations
The most common Natural Resources, Construction and Maintenance occupations in Newbern are Farming, Fishing & Forestry (11 | 9.4%), and Installation, Maintenance & Repair (9 | 7.7%).
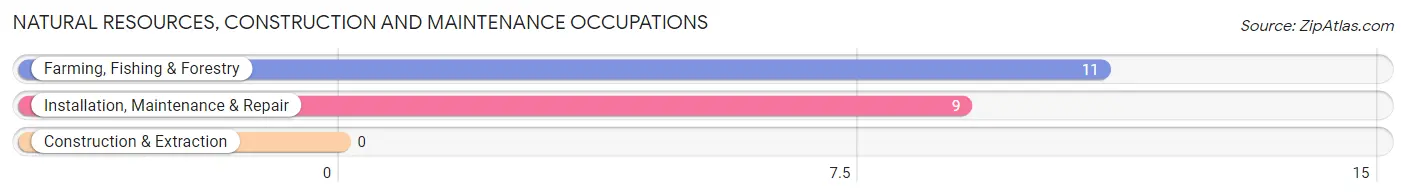
Natural Resources, Construction and Maintenance Occupations by Sex
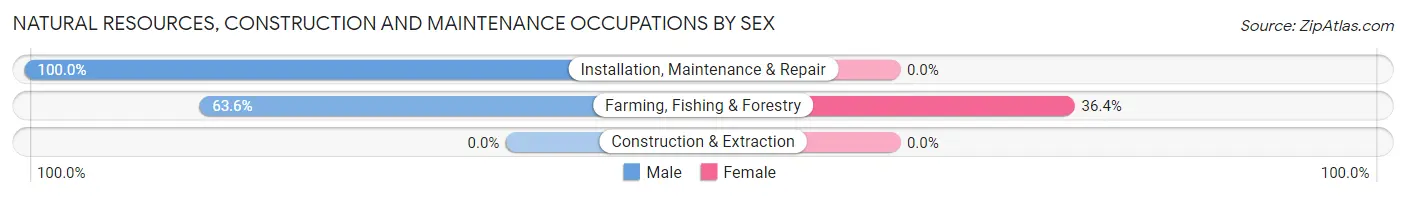
| Occupation | Male | Female |
| Farming, Fishing & Forestry | 7 (63.6%) | 4 (36.4%) |
| Construction & Extraction | 0 (0.0%) | 0 (0.0%) |
| Installation, Maintenance & Repair | 9 (100.0%) | 0 (0.0%) |
| Total (Category) | 16 (80.0%) | 4 (20.0%) |
| Total (Overall) | 43 (36.7%) | 74 (63.2%) |
Production, Transportation and Moving Occupations
The most common Production, Transportation and Moving occupations in Newbern are , and Transportation (4 | 3.4%).
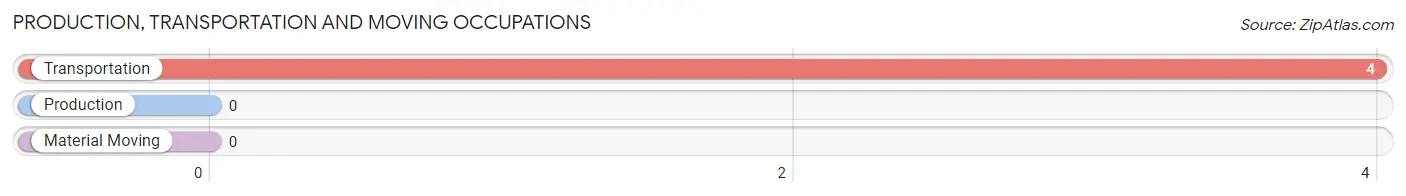
Production, Transportation and Moving Occupations by Sex
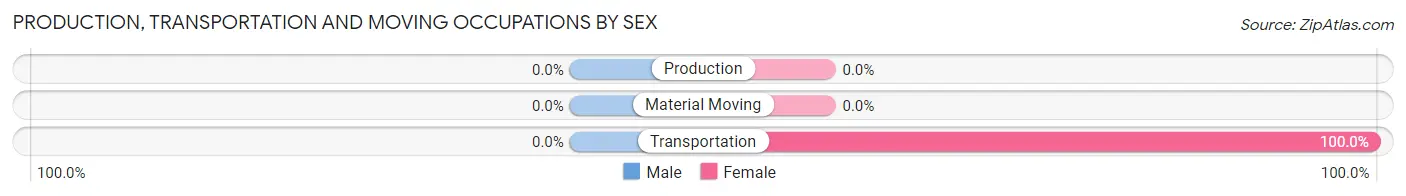
| Occupation | Male | Female |
| Production | 0 (0.0%) | 0 (0.0%) |
| Transportation | 0 (0.0%) | 4 (100.0%) |
| Material Moving | 0 (0.0%) | 0 (0.0%) |
| Total (Category) | 0 (0.0%) | 4 (100.0%) |
| Total (Overall) | 43 (36.7%) | 74 (63.2%) |
Employment Industries by Sex in Newbern
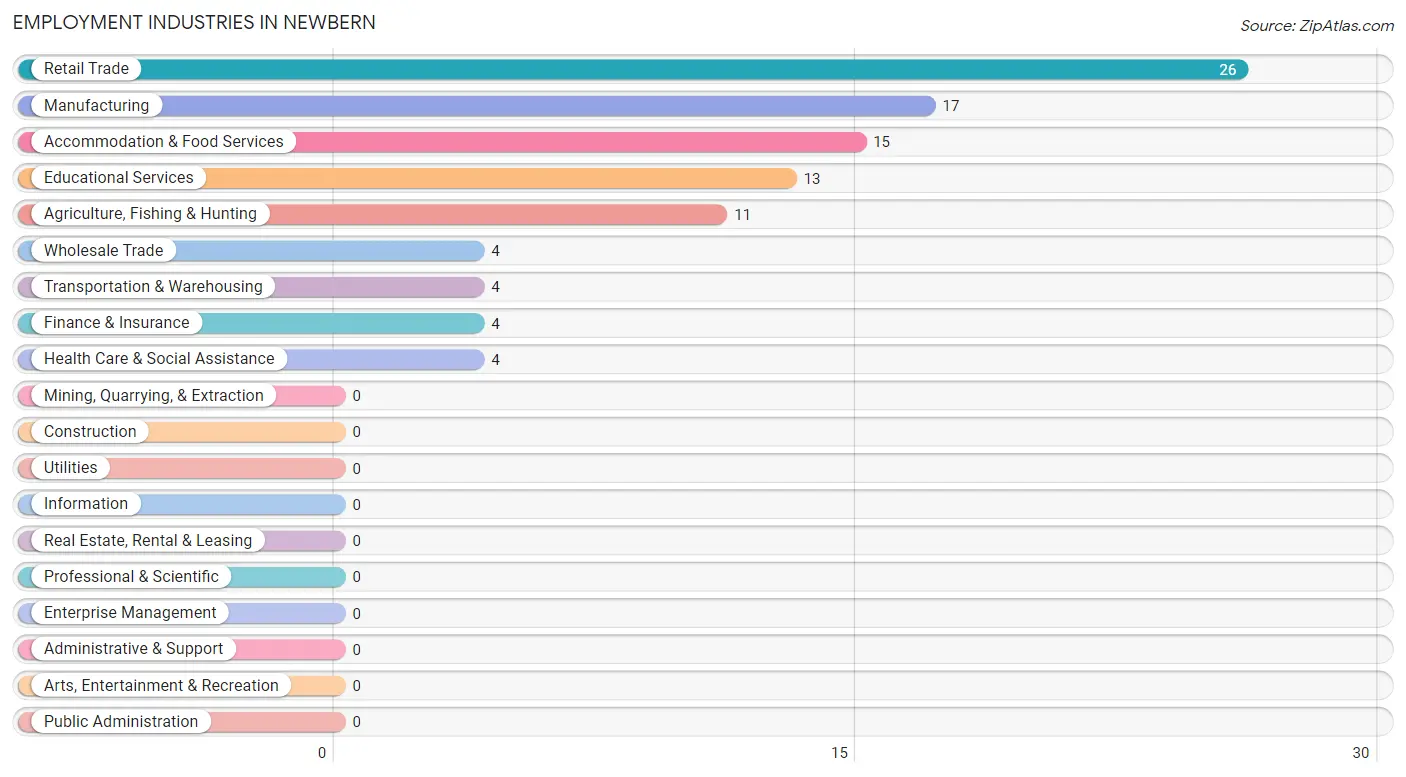
Employment Industries in Newbern
The major employment industries in Newbern include Retail Trade (26 | 22.2%), Manufacturing (17 | 14.5%), Accommodation & Food Services (15 | 12.8%), Educational Services (13 | 11.1%), and Agriculture, Fishing & Hunting (11 | 9.4%).
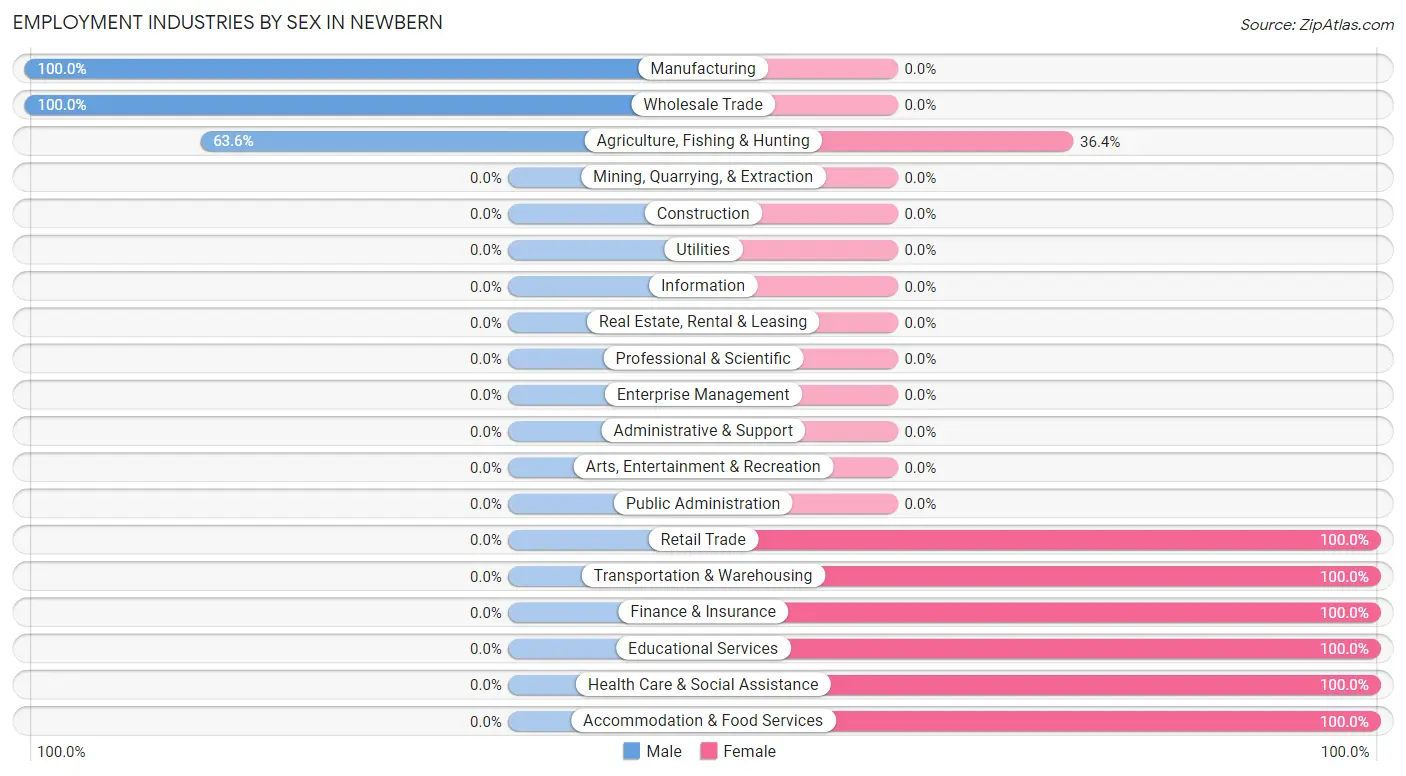
Employment Industries by Sex in Newbern
The Newbern industries that see more men than women are Manufacturing (100.0%), Wholesale Trade (100.0%), and Agriculture, Fishing & Hunting (63.6%), whereas the industries that tend to have a higher number of women are Retail Trade (100.0%), Transportation & Warehousing (100.0%), and Finance & Insurance (100.0%).
| Industry | Male | Female |
| Agriculture, Fishing & Hunting | 7 (63.6%) | 4 (36.4%) |
| Mining, Quarrying, & Extraction | 0 (0.0%) | 0 (0.0%) |
| Construction | 0 (0.0%) | 0 (0.0%) |
| Manufacturing | 17 (100.0%) | 0 (0.0%) |
| Wholesale Trade | 4 (100.0%) | 0 (0.0%) |
| Retail Trade | 0 (0.0%) | 26 (100.0%) |
| Transportation & Warehousing | 0 (0.0%) | 4 (100.0%) |
| Utilities | 0 (0.0%) | 0 (0.0%) |
| Information | 0 (0.0%) | 0 (0.0%) |
| Finance & Insurance | 0 (0.0%) | 4 (100.0%) |
| Real Estate, Rental & Leasing | 0 (0.0%) | 0 (0.0%) |
| Professional & Scientific | 0 (0.0%) | 0 (0.0%) |
| Enterprise Management | 0 (0.0%) | 0 (0.0%) |
| Administrative & Support | 0 (0.0%) | 0 (0.0%) |
| Educational Services | 0 (0.0%) | 13 (100.0%) |
| Health Care & Social Assistance | 0 (0.0%) | 4 (100.0%) |
| Arts, Entertainment & Recreation | 0 (0.0%) | 0 (0.0%) |
| Accommodation & Food Services | 0 (0.0%) | 15 (100.0%) |
| Public Administration | 0 (0.0%) | 0 (0.0%) |
| Total | 43 (36.7%) | 74 (63.2%) |
Education in Newbern
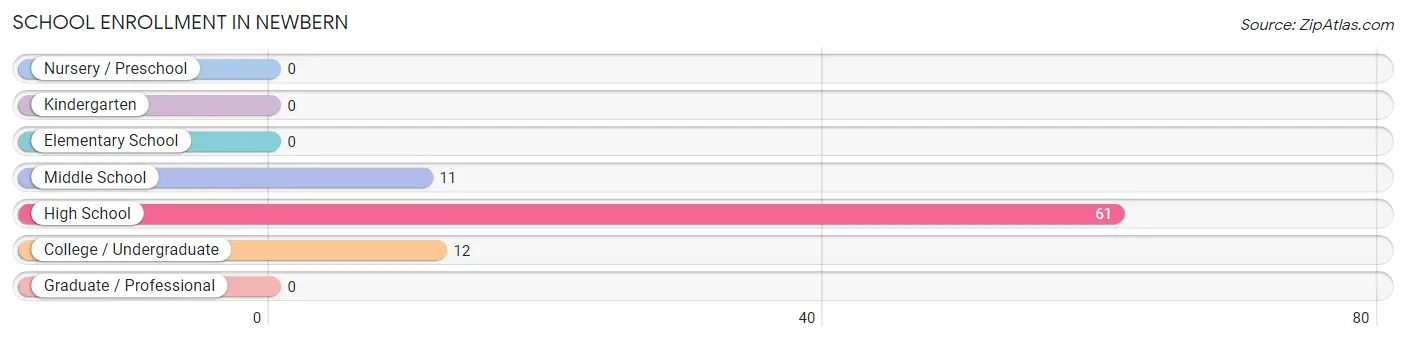
School Enrollment in Newbern
The most common levels of schooling among the 84 students in Newbern are high school (61 | 72.6%), college / undergraduate (12 | 14.3%), and middle school (11 | 13.1%).
| School Level | # Students | % Students |
| Nursery / Preschool | 0 | 0.0% |
| Kindergarten | 0 | 0.0% |
| Elementary School | 0 | 0.0% |
| Middle School | 11 | 13.1% |
| High School | 61 | 72.6% |
| College / Undergraduate | 12 | 14.3% |
| Graduate / Professional | 0 | 0.0% |
| Total | 84 | 100.0% |
School Enrollment by Age by Funding Source in Newbern
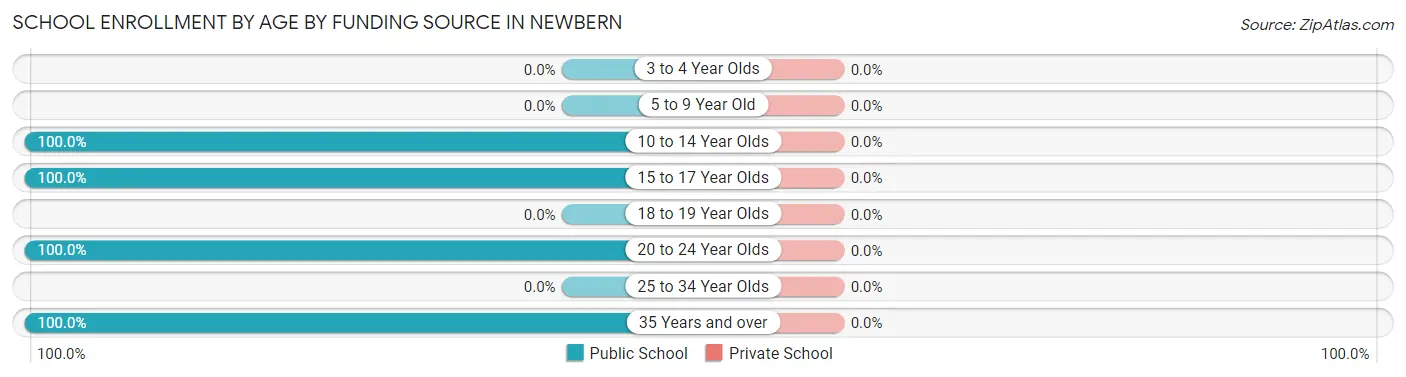
| Age Bracket | Public School | Private School |
| 3 to 4 Year Olds | 0 (0.0%) | 0 (0.0%) |
| 5 to 9 Year Old | 0 (0.0%) | 0 (0.0%) |
| 10 to 14 Year Olds | 11 (100.0%) | 0 (0.0%) |
| 15 to 17 Year Olds | 49 (100.0%) | 0 (0.0%) |
| 18 to 19 Year Olds | 0 (0.0%) | 0 (0.0%) |
| 20 to 24 Year Olds | 12 (100.0%) | 0 (0.0%) |
| 25 to 34 Year Olds | 0 (0.0%) | 0 (0.0%) |
| 35 Years and over | 12 (100.0%) | 0 (0.0%) |
| Total | 84 (100.0%) | 0 (0.0%) |
Educational Attainment by Field of Study in Newbern
Education (10 | 41.7%), science & technology (7 | 29.2%), bio, nature & agricultural (6 | 25.0%), and liberal arts & history (1 | 4.2%) are the most common fields of study among 24 individuals in Newbern who have obtained a bachelor's degree or higher.
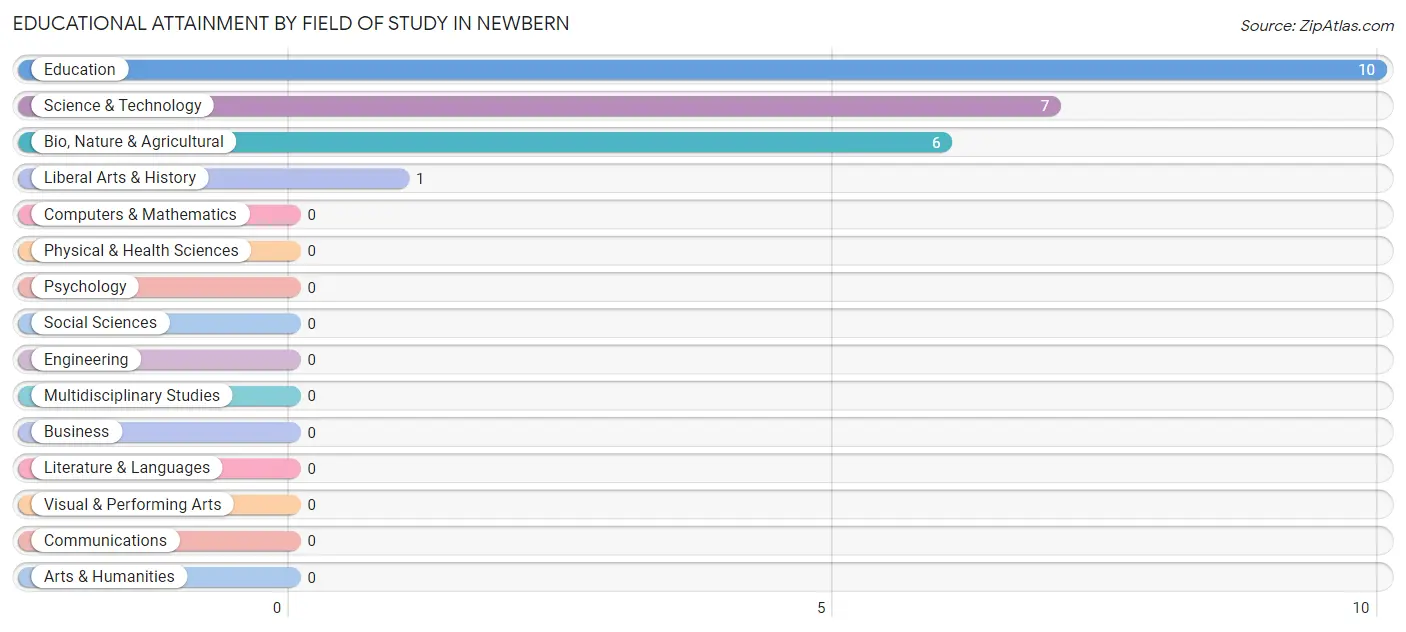
| Field of Study | # Graduates | % Graduates |
| Computers & Mathematics | 0 | 0.0% |
| Bio, Nature & Agricultural | 6 | 25.0% |
| Physical & Health Sciences | 0 | 0.0% |
| Psychology | 0 | 0.0% |
| Social Sciences | 0 | 0.0% |
| Engineering | 0 | 0.0% |
| Multidisciplinary Studies | 0 | 0.0% |
| Science & Technology | 7 | 29.2% |
| Business | 0 | 0.0% |
| Education | 10 | 41.7% |
| Literature & Languages | 0 | 0.0% |
| Liberal Arts & History | 1 | 4.2% |
| Visual & Performing Arts | 0 | 0.0% |
| Communications | 0 | 0.0% |
| Arts & Humanities | 0 | 0.0% |
| Total | 24 | 100.0% |
Transportation & Commute in Newbern
Vehicle Availability by Sex in Newbern
The most prevalent vehicle ownership categories in Newbern are males with 3 vehicles (16, accounting for 47.1%) and females with 3 vehicles (35, making up 22.9%).
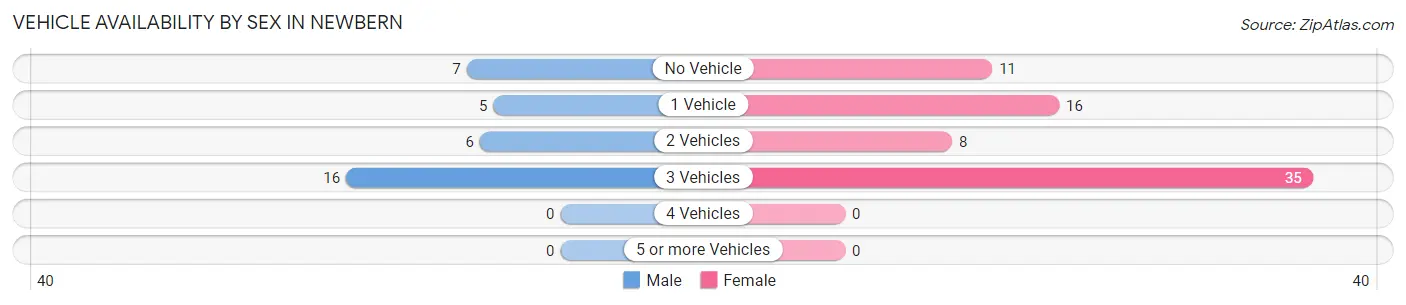
| Vehicles Available | Male | Female |
| No Vehicle | 7 (20.6%) | 11 (15.7%) |
| 1 Vehicle | 5 (14.7%) | 16 (22.9%) |
| 2 Vehicles | 6 (17.6%) | 8 (11.4%) |
| 3 Vehicles | 16 (47.1%) | 35 (50.0%) |
| 4 Vehicles | 0 (0.0%) | 0 (0.0%) |
| 5 or more Vehicles | 0 (0.0%) | 0 (0.0%) |
| Total | 34 (100.0%) | 70 (100.0%) |
Commute Time in Newbern
The most frequently occuring commute durations in Newbern are 25 to 29 minutes (16 commuters, 15.4%), 10 to 14 minutes (15 commuters, 14.4%), and 20 to 24 minutes (14 commuters, 13.5%).
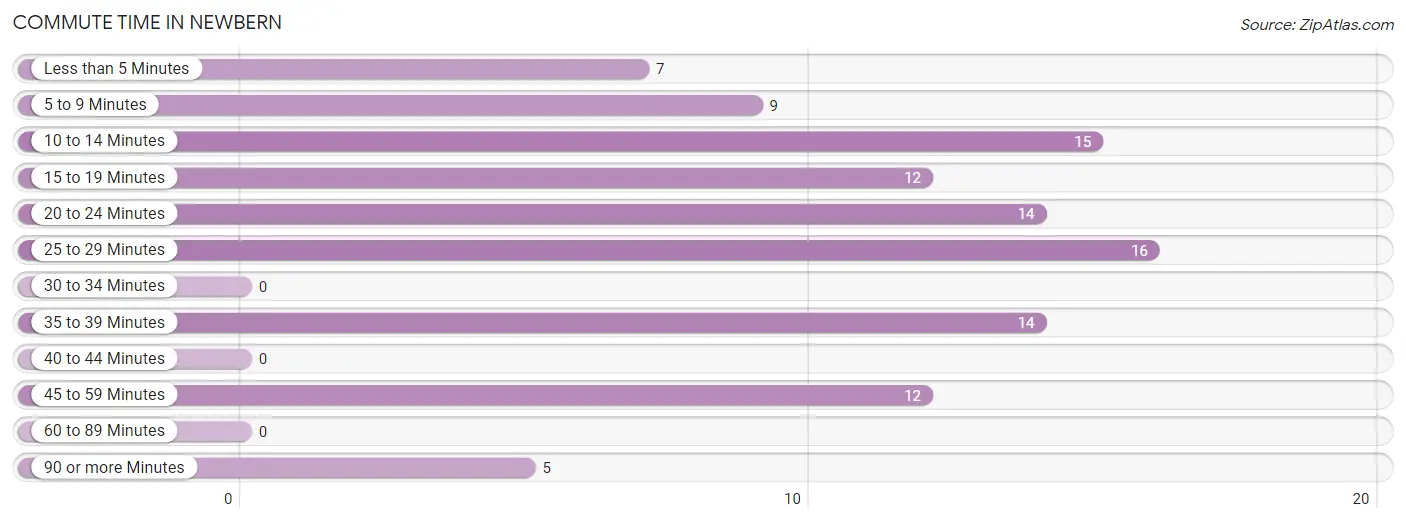
| Commute Time | # Commuters | % Commuters |
| Less than 5 Minutes | 7 | 6.7% |
| 5 to 9 Minutes | 9 | 8.6% |
| 10 to 14 Minutes | 15 | 14.4% |
| 15 to 19 Minutes | 12 | 11.5% |
| 20 to 24 Minutes | 14 | 13.5% |
| 25 to 29 Minutes | 16 | 15.4% |
| 30 to 34 Minutes | 0 | 0.0% |
| 35 to 39 Minutes | 14 | 13.5% |
| 40 to 44 Minutes | 0 | 0.0% |
| 45 to 59 Minutes | 12 | 11.5% |
| 60 to 89 Minutes | 0 | 0.0% |
| 90 or more Minutes | 5 | 4.8% |
Commute Time by Sex in Newbern
The most common commute times in Newbern are 45 to 59 minutes (12 commuters, 35.3%) for males and 25 to 29 minutes (16 commuters, 22.9%) for females.
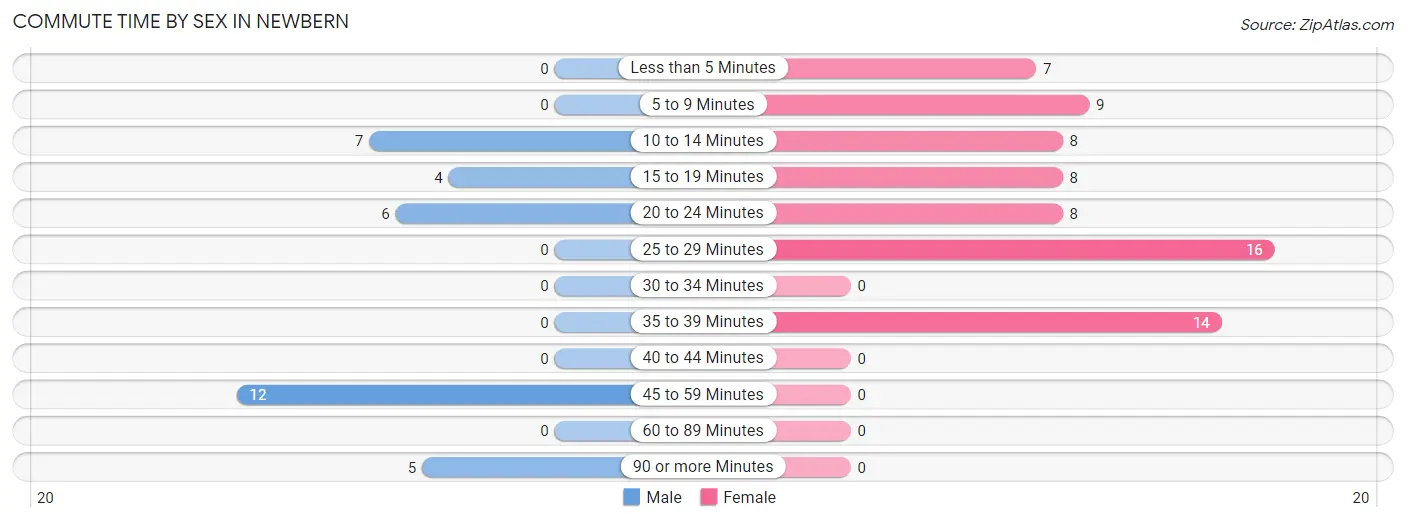
| Commute Time | Male | Female |
| Less than 5 Minutes | 0 (0.0%) | 7 (10.0%) |
| 5 to 9 Minutes | 0 (0.0%) | 9 (12.9%) |
| 10 to 14 Minutes | 7 (20.6%) | 8 (11.4%) |
| 15 to 19 Minutes | 4 (11.8%) | 8 (11.4%) |
| 20 to 24 Minutes | 6 (17.6%) | 8 (11.4%) |
| 25 to 29 Minutes | 0 (0.0%) | 16 (22.9%) |
| 30 to 34 Minutes | 0 (0.0%) | 0 (0.0%) |
| 35 to 39 Minutes | 0 (0.0%) | 14 (20.0%) |
| 40 to 44 Minutes | 0 (0.0%) | 0 (0.0%) |
| 45 to 59 Minutes | 12 (35.3%) | 0 (0.0%) |
| 60 to 89 Minutes | 0 (0.0%) | 0 (0.0%) |
| 90 or more Minutes | 5 (14.7%) | 0 (0.0%) |
Time of Departure to Work by Sex in Newbern
The most frequent times of departure to work in Newbern are 12:00 AM to 4:59 AM (16, 47.1%) for males and 12:00 PM to 3:59 PM (27, 38.6%) for females.
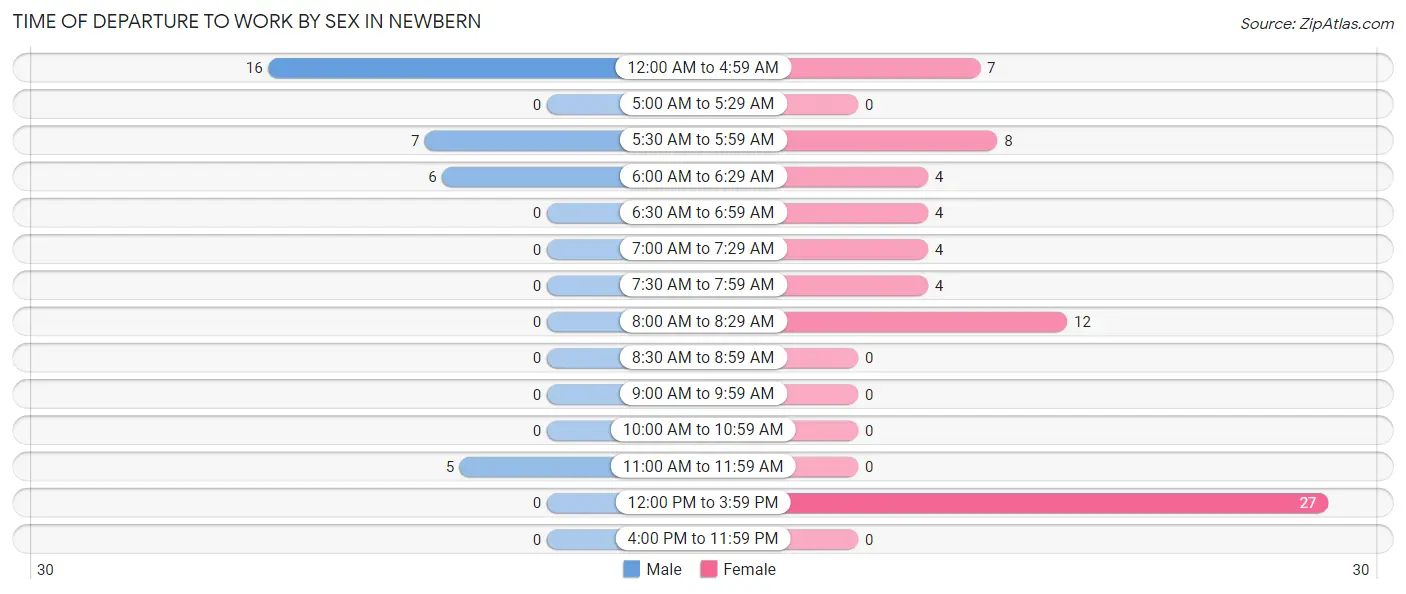
| Time of Departure | Male | Female |
| 12:00 AM to 4:59 AM | 16 (47.1%) | 7 (10.0%) |
| 5:00 AM to 5:29 AM | 0 (0.0%) | 0 (0.0%) |
| 5:30 AM to 5:59 AM | 7 (20.6%) | 8 (11.4%) |
| 6:00 AM to 6:29 AM | 6 (17.6%) | 4 (5.7%) |
| 6:30 AM to 6:59 AM | 0 (0.0%) | 4 (5.7%) |
| 7:00 AM to 7:29 AM | 0 (0.0%) | 4 (5.7%) |
| 7:30 AM to 7:59 AM | 0 (0.0%) | 4 (5.7%) |
| 8:00 AM to 8:29 AM | 0 (0.0%) | 12 (17.1%) |
| 8:30 AM to 8:59 AM | 0 (0.0%) | 0 (0.0%) |
| 9:00 AM to 9:59 AM | 0 (0.0%) | 0 (0.0%) |
| 10:00 AM to 10:59 AM | 0 (0.0%) | 0 (0.0%) |
| 11:00 AM to 11:59 AM | 5 (14.7%) | 0 (0.0%) |
| 12:00 PM to 3:59 PM | 0 (0.0%) | 27 (38.6%) |
| 4:00 PM to 11:59 PM | 0 (0.0%) | 0 (0.0%) |
| Total | 34 (100.0%) | 70 (100.0%) |
Housing Occupancy in Newbern
Occupancy by Ownership in Newbern
Of the total 99 dwellings in Newbern, owner-occupied units account for 77 (77.8%), while renter-occupied units make up 22 (22.2%).
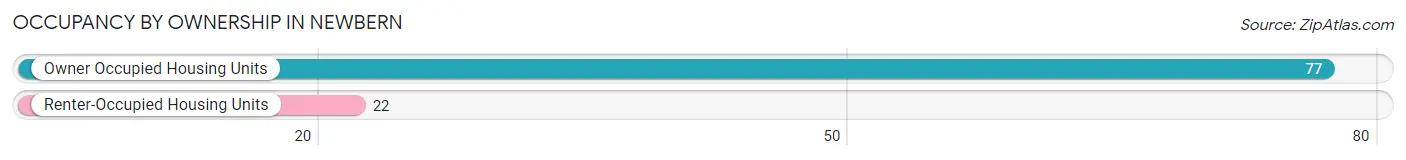
| Occupancy | # Housing Units | % Housing Units |
| Owner Occupied Housing Units | 77 | 77.8% |
| Renter-Occupied Housing Units | 22 | 22.2% |
| Total Occupied Housing Units | 99 | 100.0% |
Occupancy by Household Size in Newbern
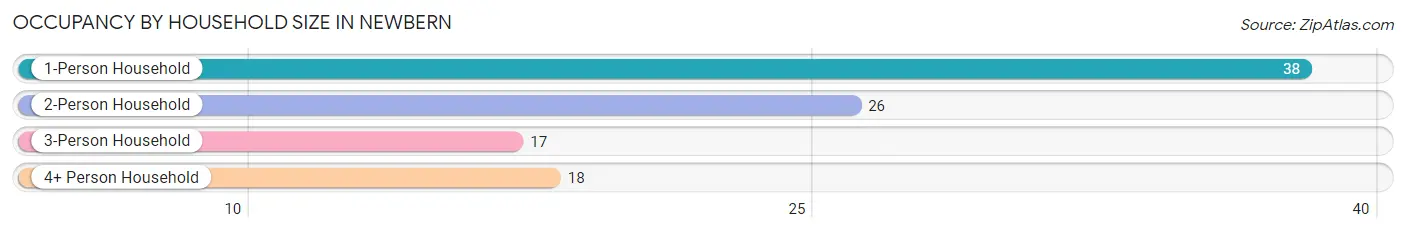
| Household Size | # Housing Units | % Housing Units |
| 1-Person Household | 38 | 38.4% |
| 2-Person Household | 26 | 26.3% |
| 3-Person Household | 17 | 17.2% |
| 4+ Person Household | 18 | 18.2% |
| Total Housing Units | 99 | 100.0% |
Occupancy by Ownership by Household Size in Newbern
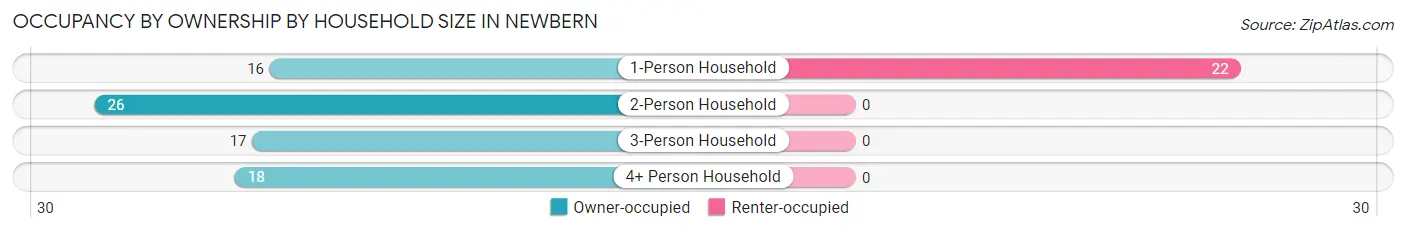
| Household Size | Owner-occupied | Renter-occupied |
| 1-Person Household | 16 (42.1%) | 22 (57.9%) |
| 2-Person Household | 26 (100.0%) | 0 (0.0%) |
| 3-Person Household | 17 (100.0%) | 0 (0.0%) |
| 4+ Person Household | 18 (100.0%) | 0 (0.0%) |
| Total Housing Units | 77 (77.8%) | 22 (22.2%) |
Occupancy by Educational Attainment in Newbern
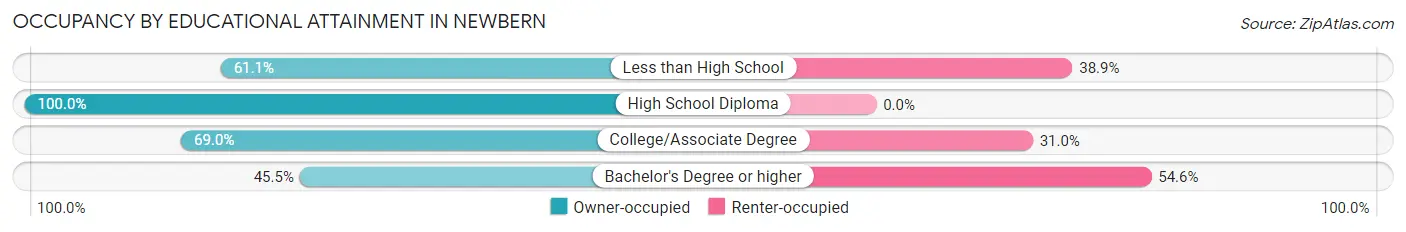
| Household Size | Owner-occupied | Renter-occupied |
| Less than High School | 11 (61.1%) | 7 (38.9%) |
| High School Diploma | 41 (100.0%) | 0 (0.0%) |
| College/Associate Degree | 20 (69.0%) | 9 (31.0%) |
| Bachelor's Degree or higher | 5 (45.5%) | 6 (54.5%) |
Occupancy by Age of Householder in Newbern
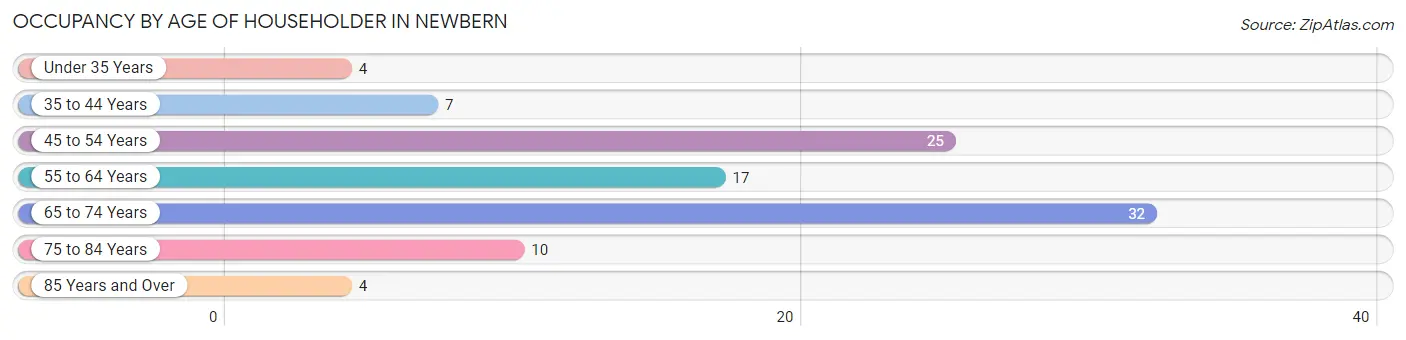
| Age Bracket | # Households | % Households |
| Under 35 Years | 4 | 4.0% |
| 35 to 44 Years | 7 | 7.1% |
| 45 to 54 Years | 25 | 25.3% |
| 55 to 64 Years | 17 | 17.2% |
| 65 to 74 Years | 32 | 32.3% |
| 75 to 84 Years | 10 | 10.1% |
| 85 Years and Over | 4 | 4.0% |
| Total | 99 | 100.0% |
Housing Finances in Newbern
Median Income by Occupancy in Newbern
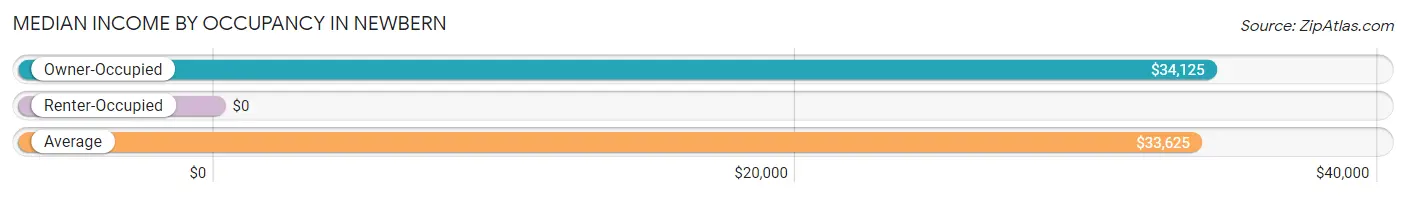
| Occupancy Type | # Households | Median Income |
| Owner-Occupied | 77 (77.8%) | $34,125 |
| Renter-Occupied | 22 (22.2%) | $0 |
| Average | 99 (100.0%) | $33,625 |
Occupancy by Householder Income Bracket in Newbern
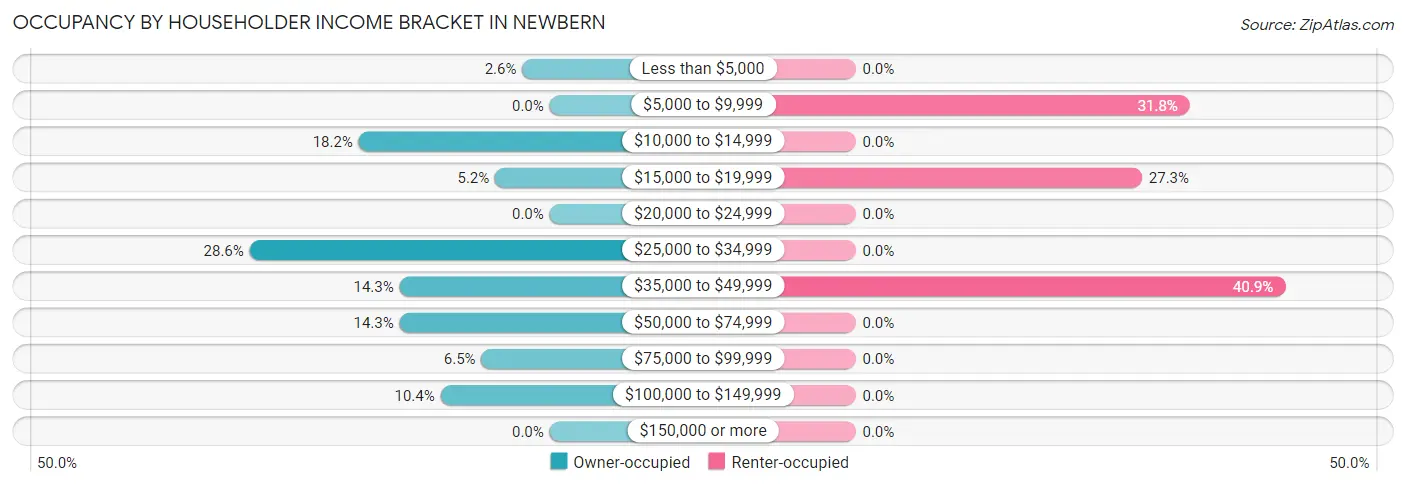
| Income Bracket | Owner-occupied | Renter-occupied |
| Less than $5,000 | 2 (2.6%) | 0 (0.0%) |
| $5,000 to $9,999 | 0 (0.0%) | 7 (31.8%) |
| $10,000 to $14,999 | 14 (18.2%) | 0 (0.0%) |
| $15,000 to $19,999 | 4 (5.2%) | 6 (27.3%) |
| $20,000 to $24,999 | 0 (0.0%) | 0 (0.0%) |
| $25,000 to $34,999 | 22 (28.6%) | 0 (0.0%) |
| $35,000 to $49,999 | 11 (14.3%) | 9 (40.9%) |
| $50,000 to $74,999 | 11 (14.3%) | 0 (0.0%) |
| $75,000 to $99,999 | 5 (6.5%) | 0 (0.0%) |
| $100,000 to $149,999 | 8 (10.4%) | 0 (0.0%) |
| $150,000 or more | 0 (0.0%) | 0 (0.0%) |
| Total | 77 (100.0%) | 22 (100.0%) |
Monthly Housing Cost Tiers in Newbern
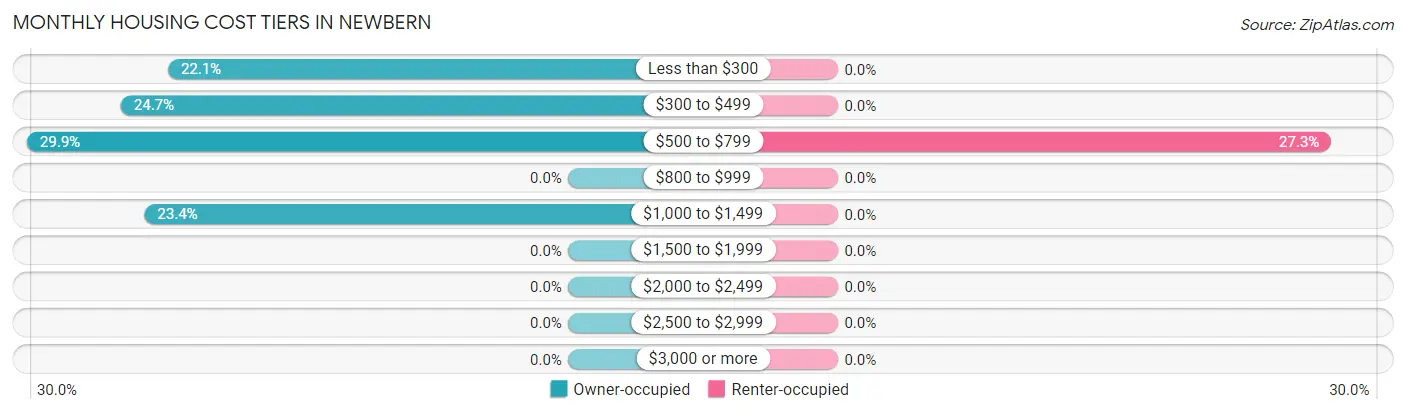
| Monthly Cost | Owner-occupied | Renter-occupied |
| Less than $300 | 17 (22.1%) | 0 (0.0%) |
| $300 to $499 | 19 (24.7%) | 0 (0.0%) |
| $500 to $799 | 23 (29.9%) | 6 (27.3%) |
| $800 to $999 | 0 (0.0%) | 0 (0.0%) |
| $1,000 to $1,499 | 18 (23.4%) | 0 (0.0%) |
| $1,500 to $1,999 | 0 (0.0%) | 0 (0.0%) |
| $2,000 to $2,499 | 0 (0.0%) | 0 (0.0%) |
| $2,500 to $2,999 | 0 (0.0%) | 0 (0.0%) |
| $3,000 or more | 0 (0.0%) | 0 (0.0%) |
| Total | 77 (100.0%) | 22 (100.0%) |
Physical Housing Characteristics in Newbern
Housing Structures in Newbern
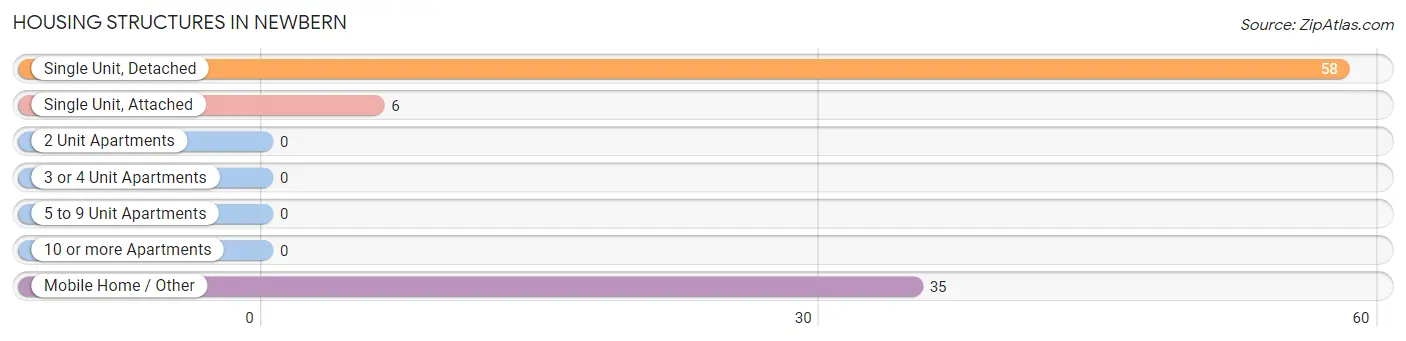
| Structure Type | # Housing Units | % Housing Units |
| Single Unit, Detached | 58 | 58.6% |
| Single Unit, Attached | 6 | 6.1% |
| 2 Unit Apartments | 0 | 0.0% |
| 3 or 4 Unit Apartments | 0 | 0.0% |
| 5 to 9 Unit Apartments | 0 | 0.0% |
| 10 or more Apartments | 0 | 0.0% |
| Mobile Home / Other | 35 | 35.3% |
| Total | 99 | 100.0% |
Housing Structures by Occupancy in Newbern
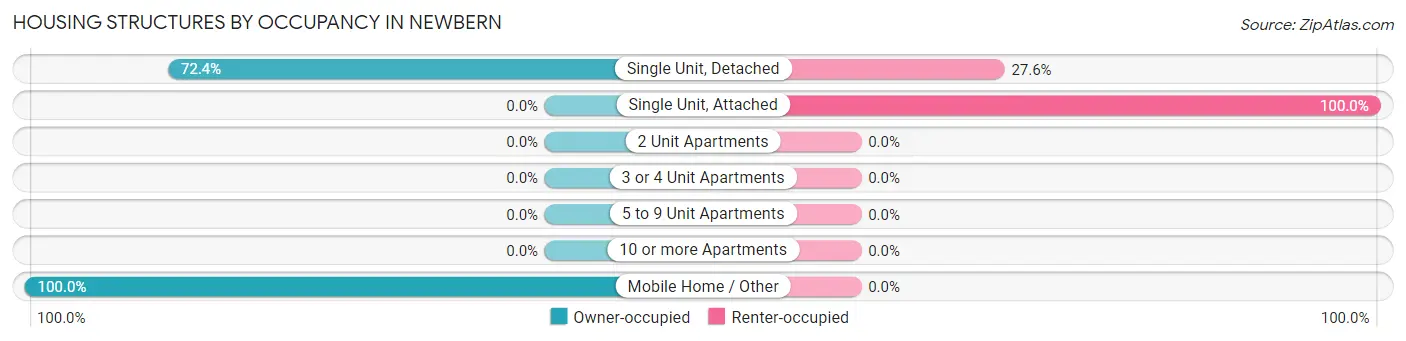
| Structure Type | Owner-occupied | Renter-occupied |
| Single Unit, Detached | 42 (72.4%) | 16 (27.6%) |
| Single Unit, Attached | 0 (0.0%) | 6 (100.0%) |
| 2 Unit Apartments | 0 (0.0%) | 0 (0.0%) |
| 3 or 4 Unit Apartments | 0 (0.0%) | 0 (0.0%) |
| 5 to 9 Unit Apartments | 0 (0.0%) | 0 (0.0%) |
| 10 or more Apartments | 0 (0.0%) | 0 (0.0%) |
| Mobile Home / Other | 35 (100.0%) | 0 (0.0%) |
| Total | 77 (77.8%) | 22 (22.2%) |
Housing Structures by Number of Rooms in Newbern
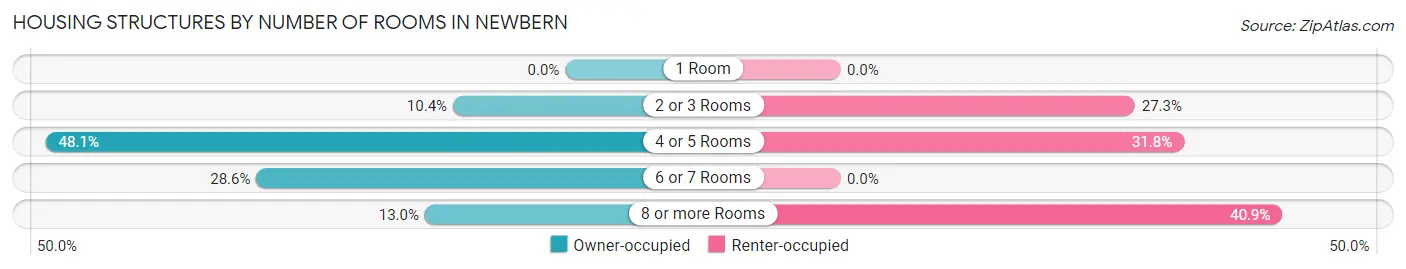
| Number of Rooms | Owner-occupied | Renter-occupied |
| 1 Room | 0 (0.0%) | 0 (0.0%) |
| 2 or 3 Rooms | 8 (10.4%) | 6 (27.3%) |
| 4 or 5 Rooms | 37 (48.0%) | 7 (31.8%) |
| 6 or 7 Rooms | 22 (28.6%) | 0 (0.0%) |
| 8 or more Rooms | 10 (13.0%) | 9 (40.9%) |
| Total | 77 (100.0%) | 22 (100.0%) |
Housing Structure by Heating Type in Newbern
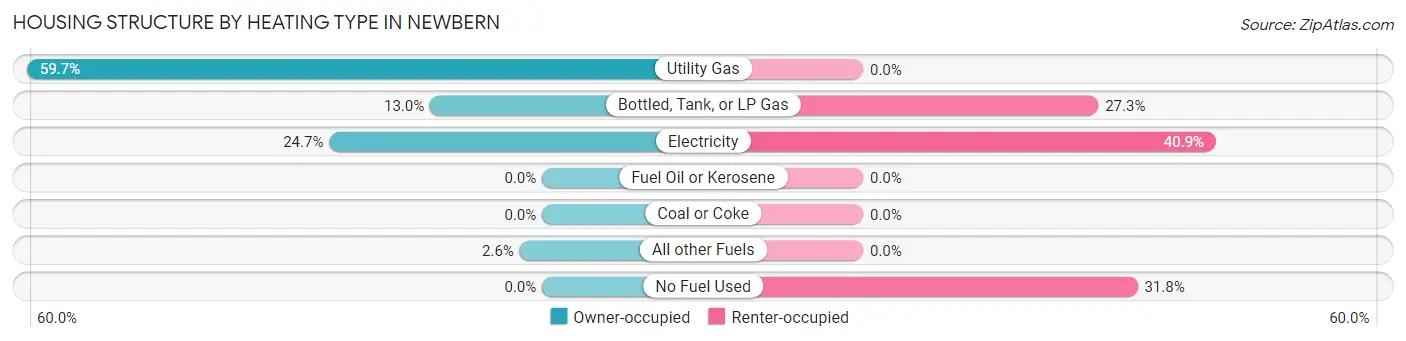
| Heating Type | Owner-occupied | Renter-occupied |
| Utility Gas | 46 (59.7%) | 0 (0.0%) |
| Bottled, Tank, or LP Gas | 10 (13.0%) | 6 (27.3%) |
| Electricity | 19 (24.7%) | 9 (40.9%) |
| Fuel Oil or Kerosene | 0 (0.0%) | 0 (0.0%) |
| Coal or Coke | 0 (0.0%) | 0 (0.0%) |
| All other Fuels | 2 (2.6%) | 0 (0.0%) |
| No Fuel Used | 0 (0.0%) | 7 (31.8%) |
| Total | 77 (100.0%) | 22 (100.0%) |
Household Vehicle Usage in Newbern
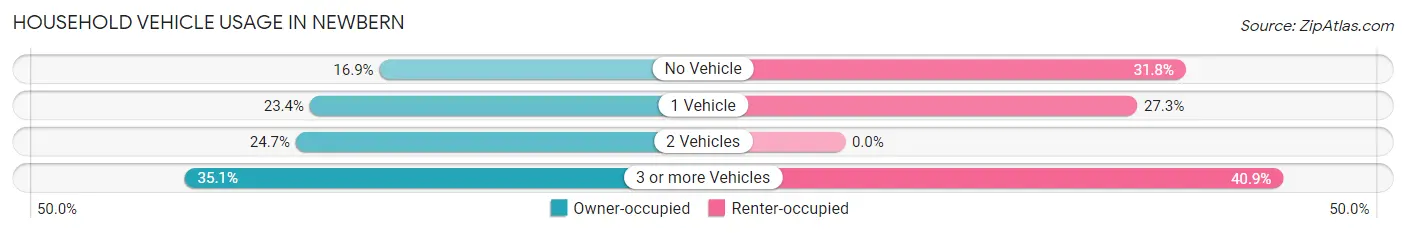
| Vehicles per Household | Owner-occupied | Renter-occupied |
| No Vehicle | 13 (16.9%) | 7 (31.8%) |
| 1 Vehicle | 18 (23.4%) | 6 (27.3%) |
| 2 Vehicles | 19 (24.7%) | 0 (0.0%) |
| 3 or more Vehicles | 27 (35.1%) | 9 (40.9%) |
| Total | 77 (100.0%) | 22 (100.0%) |
Real Estate & Mortgages in Newbern
Real Estate and Mortgage Overview in Newbern
| Characteristic | Without Mortgage | With Mortgage |
| Housing Units | 49 | 28 |
| Median Property Value | $72,500 | $0 |
| Median Household Income | $34,063 | $0 |
| Monthly Housing Costs | $381 | $0 |
| Real Estate Taxes | $213 | $0 |
Property Value by Mortgage Status in Newbern
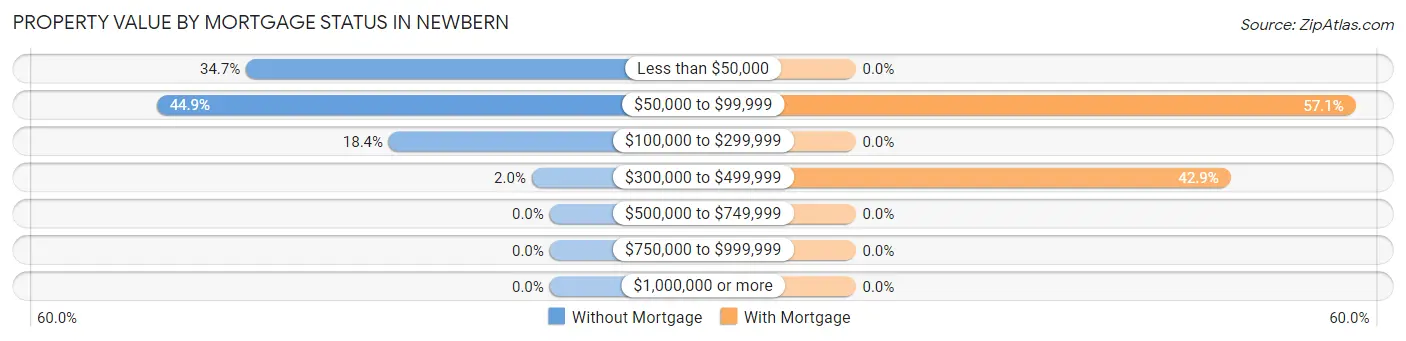
| Property Value | Without Mortgage | With Mortgage |
| Less than $50,000 | 17 (34.7%) | 0 (0.0%) |
| $50,000 to $99,999 | 22 (44.9%) | 16 (57.1%) |
| $100,000 to $299,999 | 9 (18.4%) | 0 (0.0%) |
| $300,000 to $499,999 | 1 (2.0%) | 12 (42.9%) |
| $500,000 to $749,999 | 0 (0.0%) | 0 (0.0%) |
| $750,000 to $999,999 | 0 (0.0%) | 0 (0.0%) |
| $1,000,000 or more | 0 (0.0%) | 0 (0.0%) |
| Total | 49 (100.0%) | 28 (100.0%) |
Household Income by Mortgage Status in Newbern
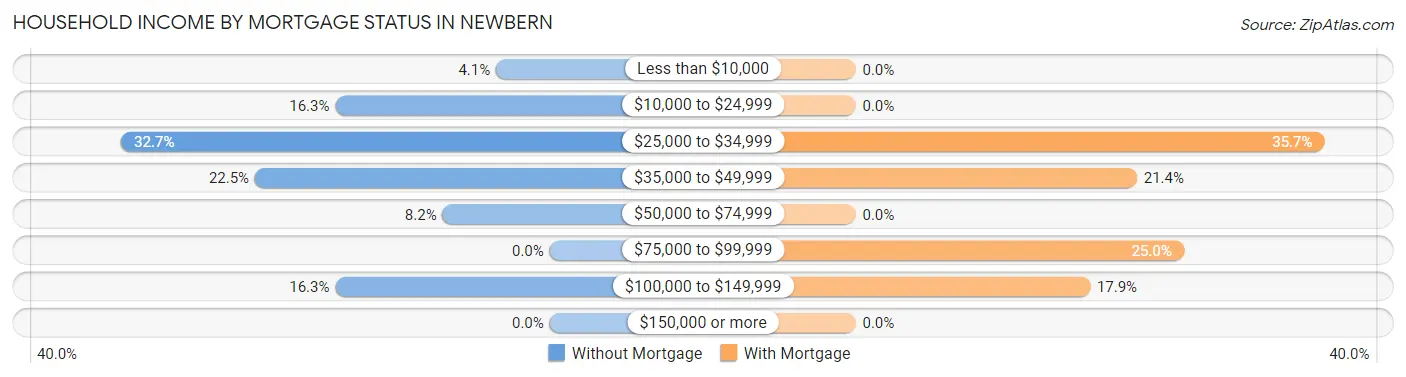
| Household Income | Without Mortgage | With Mortgage |
| Less than $10,000 | 2 (4.1%) | 0 (0.0%) |
| $10,000 to $24,999 | 8 (16.3%) | 0 (0.0%) |
| $25,000 to $34,999 | 16 (32.7%) | 10 (35.7%) |
| $35,000 to $49,999 | 11 (22.5%) | 6 (21.4%) |
| $50,000 to $74,999 | 4 (8.2%) | 0 (0.0%) |
| $75,000 to $99,999 | 0 (0.0%) | 7 (25.0%) |
| $100,000 to $149,999 | 8 (16.3%) | 5 (17.9%) |
| $150,000 or more | 0 (0.0%) | 0 (0.0%) |
| Total | 49 (100.0%) | 28 (100.0%) |
Property Value to Household Income Ratio in Newbern
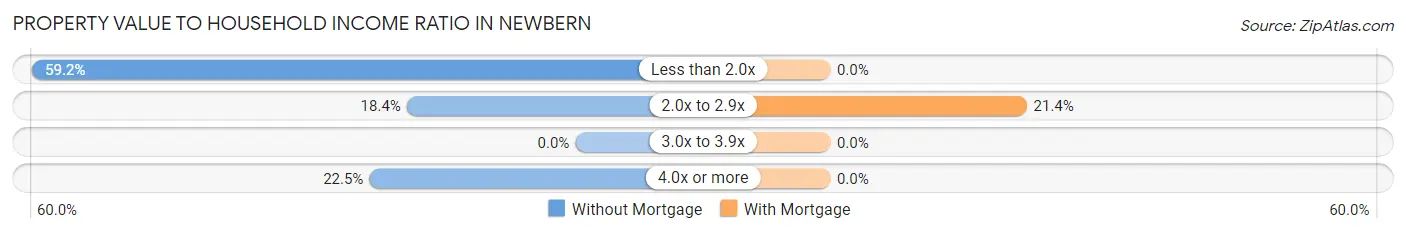
| Value-to-Income Ratio | Without Mortgage | With Mortgage |
| Less than 2.0x | 29 (59.2%) | 0 (0.0%) |
| 2.0x to 2.9x | 9 (18.4%) | 6 (21.4%) |
| 3.0x to 3.9x | 0 (0.0%) | 0 (0.0%) |
| 4.0x or more | 11 (22.5%) | 0 (0.0%) |
| Total | 49 (100.0%) | 28 (100.0%) |
Real Estate Taxes by Mortgage Status in Newbern
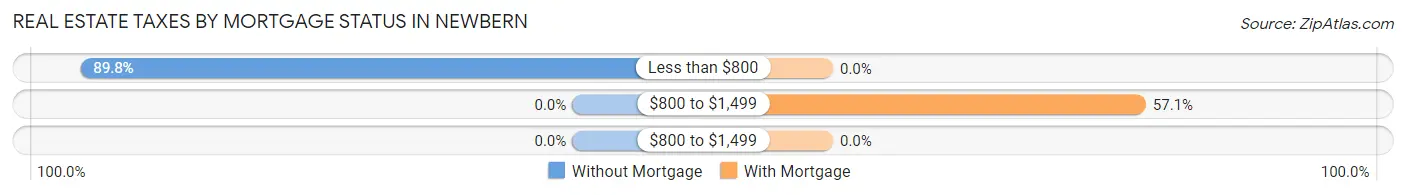
| Property Taxes | Without Mortgage | With Mortgage |
| Less than $800 | 44 (89.8%) | 0 (0.0%) |
| $800 to $1,499 | 0 (0.0%) | 16 (57.1%) |
| $800 to $1,499 | 0 (0.0%) | 0 (0.0%) |
| Total | 49 (100.0%) | 28 (100.0%) |
Health & Disability in Newbern
Health Insurance Coverage by Age in Newbern
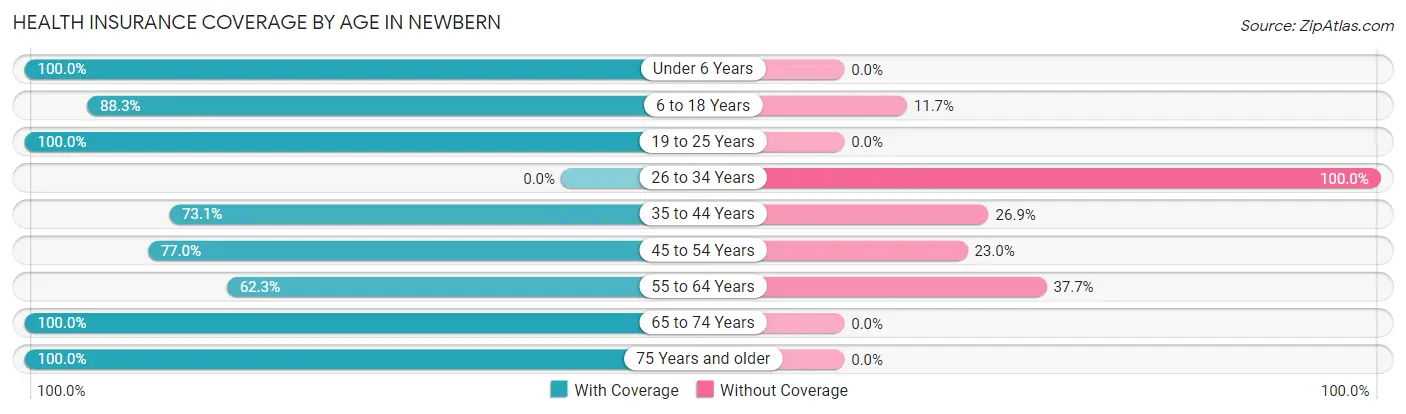
| Age Bracket | With Coverage | Without Coverage |
| Under 6 Years | 6 (100.0%) | 0 (0.0%) |
| 6 to 18 Years | 53 (88.3%) | 7 (11.7%) |
| 19 to 25 Years | 17 (100.0%) | 0 (0.0%) |
| 26 to 34 Years | 0 (0.0%) | 4 (100.0%) |
| 35 to 44 Years | 19 (73.1%) | 7 (26.9%) |
| 45 to 54 Years | 57 (77.0%) | 17 (23.0%) |
| 55 to 64 Years | 38 (62.3%) | 23 (37.7%) |
| 65 to 74 Years | 48 (100.0%) | 0 (0.0%) |
| 75 Years and older | 14 (100.0%) | 0 (0.0%) |
| Total | 252 (81.3%) | 58 (18.7%) |
Health Insurance Coverage by Citizenship Status in Newbern
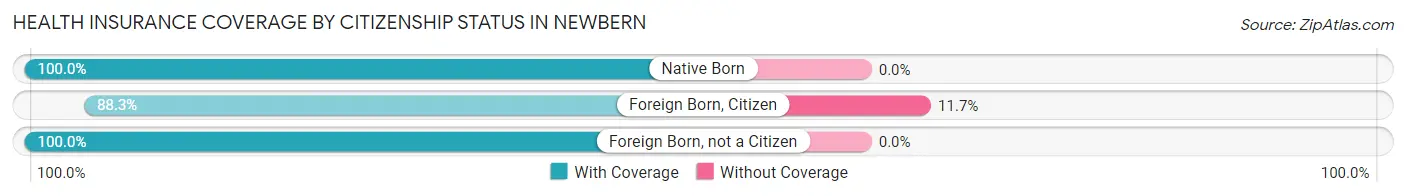
| Citizenship Status | With Coverage | Without Coverage |
| Native Born | 6 (100.0%) | 0 (0.0%) |
| Foreign Born, Citizen | 53 (88.3%) | 7 (11.7%) |
| Foreign Born, not a Citizen | 17 (100.0%) | 0 (0.0%) |
Health Insurance Coverage by Household Income in Newbern
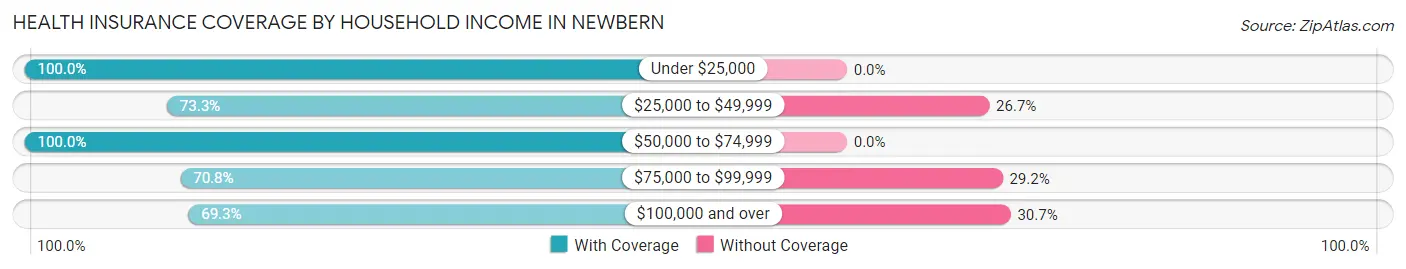
| Household Income | With Coverage | Without Coverage |
| Under $25,000 | 68 (100.0%) | 0 (0.0%) |
| $25,000 to $49,999 | 77 (73.3%) | 28 (26.7%) |
| $50,000 to $74,999 | 38 (100.0%) | 0 (0.0%) |
| $75,000 to $99,999 | 17 (70.8%) | 7 (29.2%) |
| $100,000 and over | 52 (69.3%) | 23 (30.7%) |
Public vs Private Health Insurance Coverage by Age in Newbern
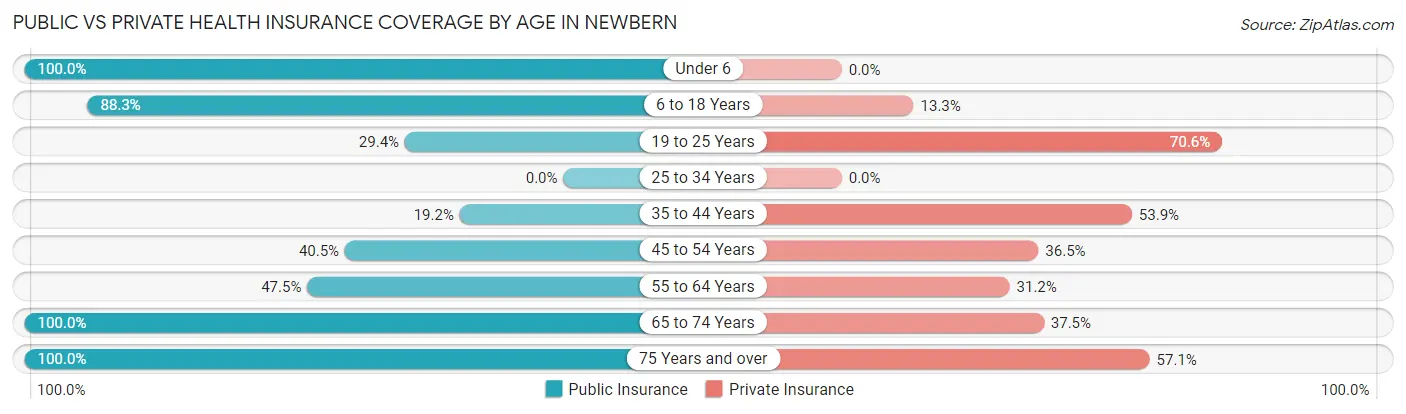
| Age Bracket | Public Insurance | Private Insurance |
| Under 6 | 6 (100.0%) | 0 (0.0%) |
| 6 to 18 Years | 53 (88.3%) | 8 (13.3%) |
| 19 to 25 Years | 5 (29.4%) | 12 (70.6%) |
| 25 to 34 Years | 0 (0.0%) | 0 (0.0%) |
| 35 to 44 Years | 5 (19.2%) | 14 (53.8%) |
| 45 to 54 Years | 30 (40.5%) | 27 (36.5%) |
| 55 to 64 Years | 29 (47.5%) | 19 (31.1%) |
| 65 to 74 Years | 48 (100.0%) | 18 (37.5%) |
| 75 Years and over | 14 (100.0%) | 8 (57.1%) |
| Total | 190 (61.3%) | 106 (34.2%) |
Disability Status by Sex by Age in Newbern
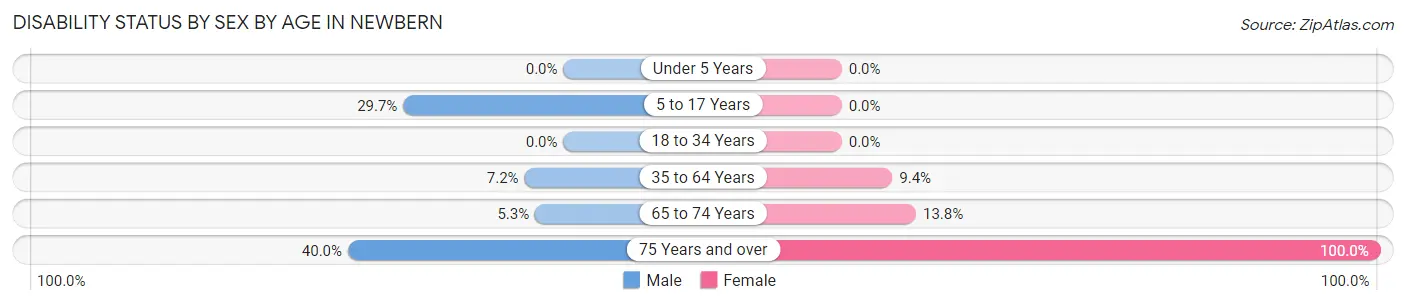
| Age Bracket | Male | Female |
| Under 5 Years | 0 (0.0%) | 0 (0.0%) |
| 5 to 17 Years | 11 (29.7%) | 0 (0.0%) |
| 18 to 34 Years | 0 (0.0%) | 0 (0.0%) |
| 35 to 64 Years | 7 (7.2%) | 6 (9.4%) |
| 65 to 74 Years | 1 (5.3%) | 4 (13.8%) |
| 75 Years and over | 4 (40.0%) | 4 (100.0%) |
Disability Class by Sex by Age in Newbern
Disability Class: Hearing Difficulty
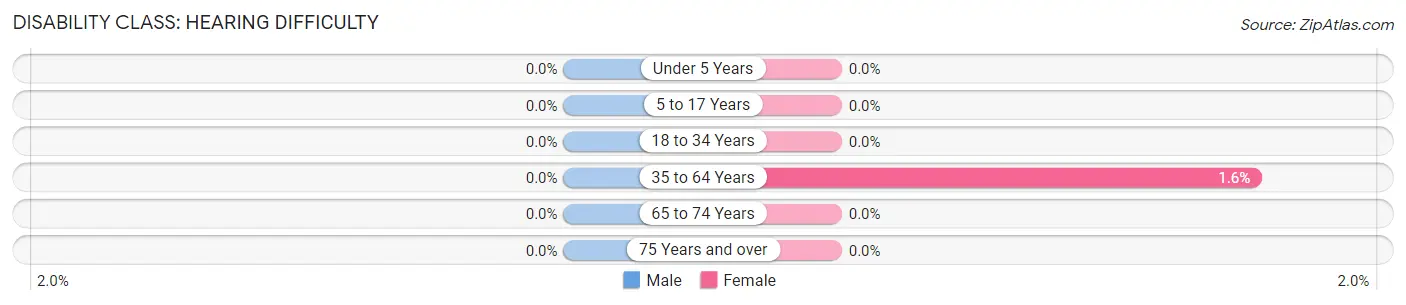
| Age Bracket | Male | Female |
| Under 5 Years | 0 (0.0%) | 0 (0.0%) |
| 5 to 17 Years | 0 (0.0%) | 0 (0.0%) |
| 18 to 34 Years | 0 (0.0%) | 0 (0.0%) |
| 35 to 64 Years | 0 (0.0%) | 1 (1.6%) |
| 65 to 74 Years | 0 (0.0%) | 0 (0.0%) |
| 75 Years and over | 0 (0.0%) | 0 (0.0%) |
Disability Class: Vision Difficulty
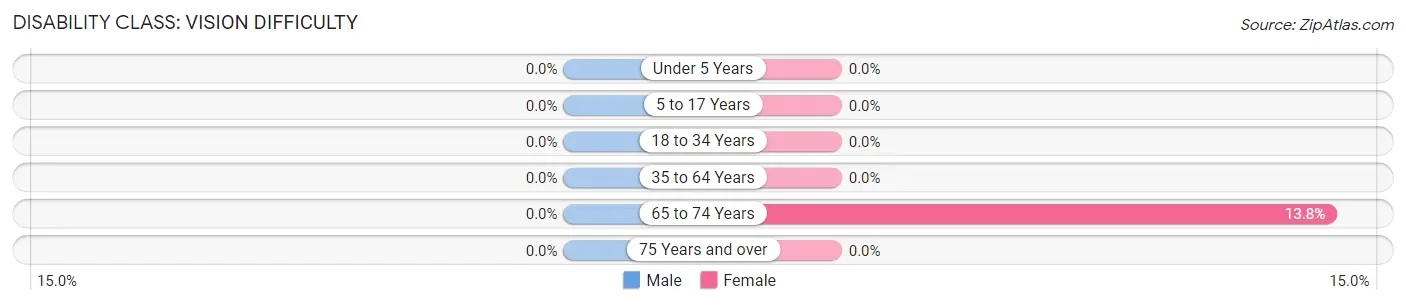
| Age Bracket | Male | Female |
| Under 5 Years | 0 (0.0%) | 0 (0.0%) |
| 5 to 17 Years | 0 (0.0%) | 0 (0.0%) |
| 18 to 34 Years | 0 (0.0%) | 0 (0.0%) |
| 35 to 64 Years | 0 (0.0%) | 0 (0.0%) |
| 65 to 74 Years | 0 (0.0%) | 4 (13.8%) |
| 75 Years and over | 0 (0.0%) | 0 (0.0%) |
Disability Class: Cognitive Difficulty
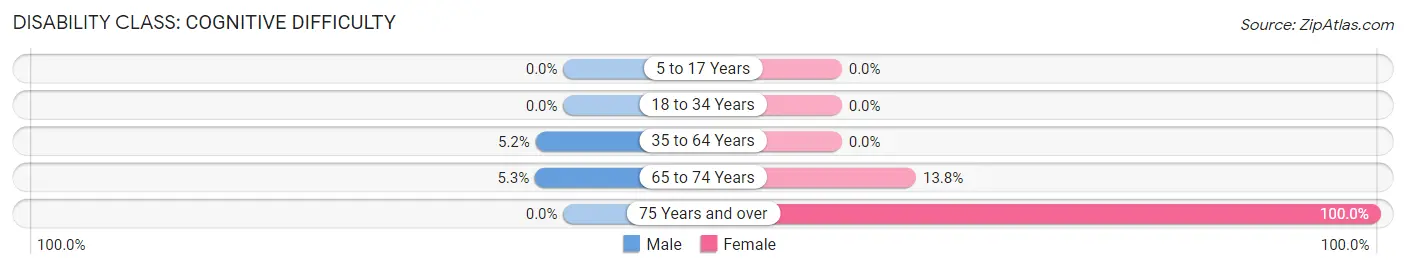
| Age Bracket | Male | Female |
| 5 to 17 Years | 0 (0.0%) | 0 (0.0%) |
| 18 to 34 Years | 0 (0.0%) | 0 (0.0%) |
| 35 to 64 Years | 5 (5.1%) | 0 (0.0%) |
| 65 to 74 Years | 1 (5.3%) | 4 (13.8%) |
| 75 Years and over | 0 (0.0%) | 4 (100.0%) |
Disability Class: Ambulatory Difficulty
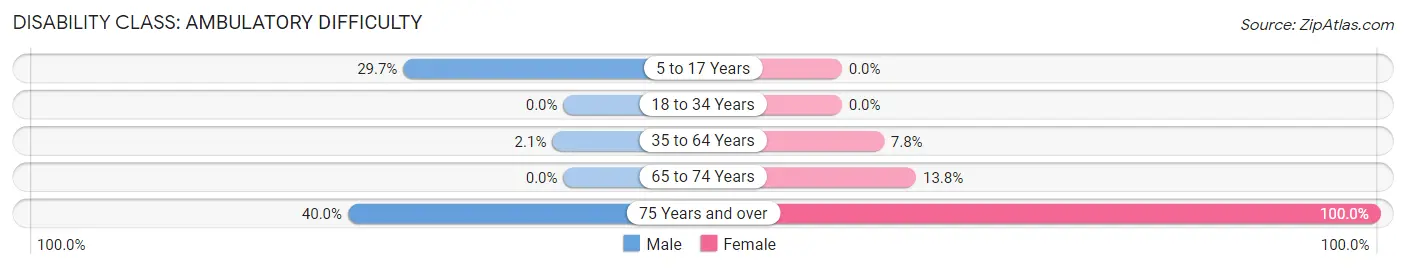
| Age Bracket | Male | Female |
| 5 to 17 Years | 11 (29.7%) | 0 (0.0%) |
| 18 to 34 Years | 0 (0.0%) | 0 (0.0%) |
| 35 to 64 Years | 2 (2.1%) | 5 (7.8%) |
| 65 to 74 Years | 0 (0.0%) | 4 (13.8%) |
| 75 Years and over | 4 (40.0%) | 4 (100.0%) |
Disability Class: Self-Care Difficulty
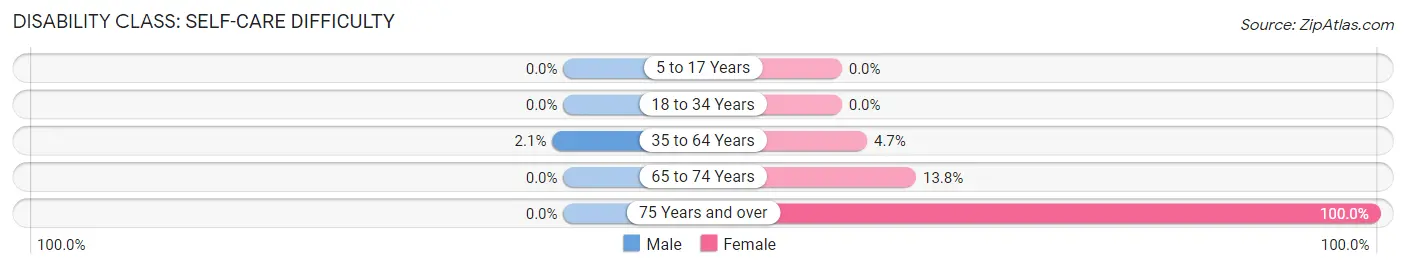
| Age Bracket | Male | Female |
| 5 to 17 Years | 0 (0.0%) | 0 (0.0%) |
| 18 to 34 Years | 0 (0.0%) | 0 (0.0%) |
| 35 to 64 Years | 2 (2.1%) | 3 (4.7%) |
| 65 to 74 Years | 0 (0.0%) | 4 (13.8%) |
| 75 Years and over | 0 (0.0%) | 4 (100.0%) |
Technology Access in Newbern
Computing Device Access in Newbern
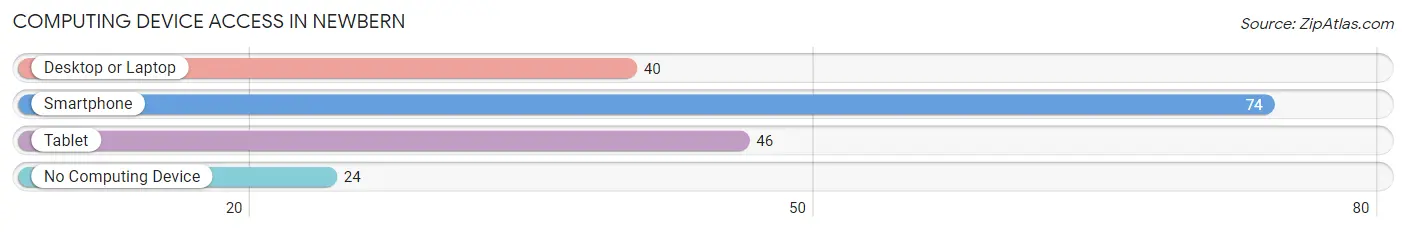
| Device Type | # Households | % Households |
| Desktop or Laptop | 40 | 40.4% |
| Smartphone | 74 | 74.8% |
| Tablet | 46 | 46.5% |
| No Computing Device | 24 | 24.2% |
| Total | 99 | 100.0% |
Internet Access in Newbern
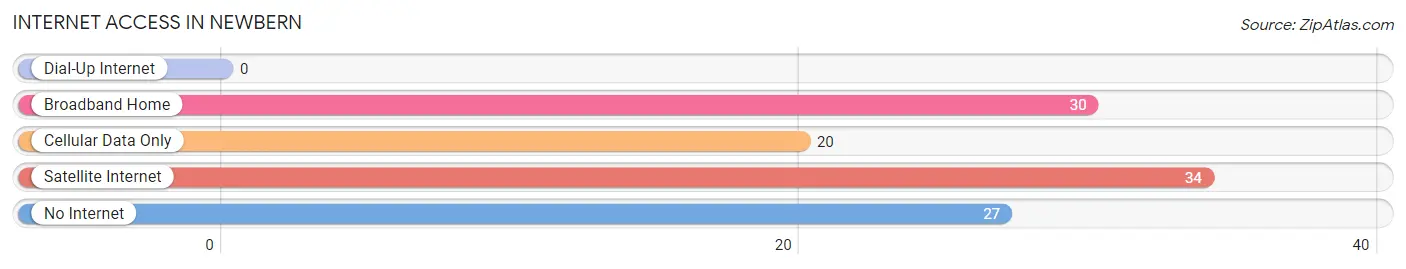
| Internet Type | # Households | % Households |
| Dial-Up Internet | 0 | 0.0% |
| Broadband Home | 30 | 30.3% |
| Cellular Data Only | 20 | 20.2% |
| Satellite Internet | 34 | 34.3% |
| No Internet | 27 | 27.3% |
| Total | 99 | 100.0% |
Newbern Summary
Newbern is a small town located in the northwest corner of Alabama, in the foothills of the Appalachian Mountains. It is situated in the Black Warrior River Valley, and is part of the larger Tuscaloosa Metropolitan Statistical Area. The town has a population of just over 1,000 people, and is the county seat of Walker County.
History
Newbern was founded in 1818 by settlers from North Carolina, and was originally known as “New Bern”. The town was named after the city of New Bern, North Carolina, which was the birthplace of the town’s founder, John Walker. The town was incorporated in 1820, and was the first county seat of Walker County.
In the early 19th century, Newbern was a thriving agricultural center, with cotton being the primary crop. The town was also home to several mills, including a grist mill, a saw mill, and a cotton gin. The town was also home to several churches, including the First Baptist Church, which was founded in 1820.
In the late 19th century, Newbern began to decline as the railroad bypassed the town. The town’s population began to decline, and by the early 20th century, the town was in decline. The town’s population continued to decline until the 1950s, when the town began to experience a resurgence.
Geography
Newbern is located in the northwest corner of Alabama, in the foothills of the Appalachian Mountains. The town is situated in the Black Warrior River Valley, and is part of the larger Tuscaloosa Metropolitan Statistical Area. The town is located approximately 25 miles northwest of Birmingham, and is approximately 50 miles south of Huntsville.
The town is situated at an elevation of 830 feet above sea level, and is located in a hilly region. The town is surrounded by forests, and is home to several creeks and streams. The town is located in a humid subtropical climate, and experiences hot, humid summers and mild winters.
Economy
The economy of Newbern is largely based on agriculture and manufacturing. The town is home to several farms, and is a major producer of cotton, soybeans, and corn. The town is also home to several manufacturing plants, including a paper mill, a furniture factory, and a plastics factory.
The town is also home to several small businesses, including restaurants, retail stores, and service providers. The town is also home to several tourist attractions, including the Walker County Historical Museum, the Newbern Depot Museum, and the Newbern Country Club.
Demographics
As of the 2010 census, the population of Newbern was 1,072. The town has a total area of 1.3 square miles, and a population density of 817.7 people per square mile. The racial makeup of the town is 87.3% White, 8.7% African American, 0.3% Native American, 0.3% Asian, 0.1% Pacific Islander, and 3.3% from other races.
The median household income in Newbern is $31,250, and the median family income is $37,500. The per capita income in the town is $17,845. The town has a poverty rate of 22.3%, and the unemployment rate is 8.2%. The town is served by the Walker County School District, and is home to several churches, including the First Baptist Church, which was founded in 1820.
Common Questions
What is Per Capita Income in Newbern?
Per Capita income in Newbern is $18,490.
What is the Median Family Income in Newbern?
Median Family Income in Newbern is $34,750.
What is the Median Household income in Newbern?
Median Household Income in Newbern is $33,625.
What is Income or Wage Gap in Newbern?
Income or Wage Gap in Newbern is 69.8%.
Women in Newbern earn 30.2 cents for every dollar earned by a man.
What is Inequality or Gini Index in Newbern?
Inequality or Gini Index in Newbern is 0.41.
What is the Total Population of Newbern?
Total Population of Newbern is 310.
What is the Total Male Population of Newbern?
Total Male Population of Newbern is 186.
What is the Total Female Population of Newbern?
Total Female Population of Newbern is 124.
What is the Ratio of Males per 100 Females in Newbern?
There are 150.00 Males per 100 Females in Newbern.
What is the Ratio of Females per 100 Males in Newbern?
There are 66.67 Females per 100 Males in Newbern.
What is the Median Population Age in Newbern?
Median Population Age in Newbern is 49.7 Years.
What is the Average Family Size in Newbern
Average Family Size in Newbern is 4.5 People.
What is the Average Household Size in Newbern
Average Household Size in Newbern is 3.1 People.
How Large is the Labor Force in Newbern?
There are 144 People in the Labor Forcein in Newbern.
What is the Percentage of People in the Labor Force in Newbern?
49.1% of People are in the Labor Force in Newbern.
What is the Unemployment Rate in Newbern?
Unemployment Rate in Newbern is 18.8%.