New Site, AL Map & Demographics
New Site Map
New Site Overview
$28,291
PER CAPITA INCOME
$61,705
AVG FAMILY INCOME
$63,571
AVG HOUSEHOLD INCOME
24.8%
WAGE / INCOME GAP [ % ]
75.2¢/ $1
WAGE / INCOME GAP [ $ ]
0.34
INEQUALITY / GINI INDEX
746
TOTAL POPULATION
350
MALE POPULATION
396
FEMALE POPULATION
88.38
MALES / 100 FEMALES
113.14
FEMALES / 100 MALES
46.0
MEDIAN AGE
3.0
AVG FAMILY SIZE
2.4
AVG HOUSEHOLD SIZE
303
LABOR FORCE [ PEOPLE ]
52.5%
PERCENT IN LABOR FORCE
3.3%
UNEMPLOYMENT RATE
Income in New Site
Income Overview in New Site
Per Capita Income in New Site is $28,291, while median incomes of families and households are $61,705 and $63,571 respectively.
| Characteristic | Number | Measure |
| Per Capita Income | 746 | $28,291 |
| Median Family Income | 209 | $61,705 |
| Mean Family Income | 209 | $66,321 |
| Median Household Income | 318 | $63,571 |
| Mean Household Income | 318 | $63,148 |
| Income Deficit | 209 | $0 |
| Wage / Income Gap (%) | 746 | 24.84% |
| Wage / Income Gap ($) | 746 | 75.16¢ per $1 |
| Gini / Inequality Index | 746 | 0.34 |
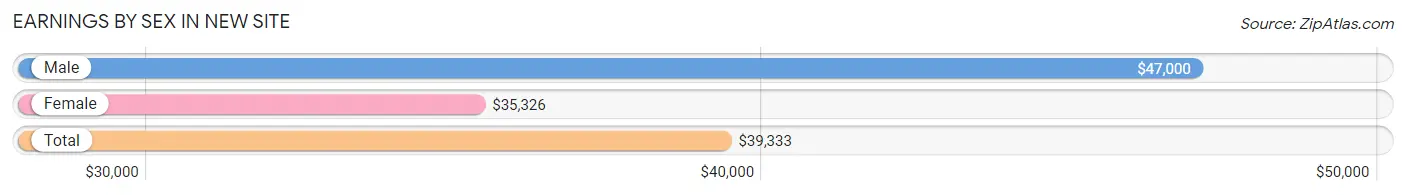
Earnings by Sex in New Site
Average Earnings in New Site are $39,333, $47,000 for men and $35,326 for women, a difference of 24.8%.
| Sex | Number | Average Earnings |
| Male | 164 (53.2%) | $47,000 |
| Female | 144 (46.8%) | $35,326 |
| Total | 308 (100.0%) | $39,333 |
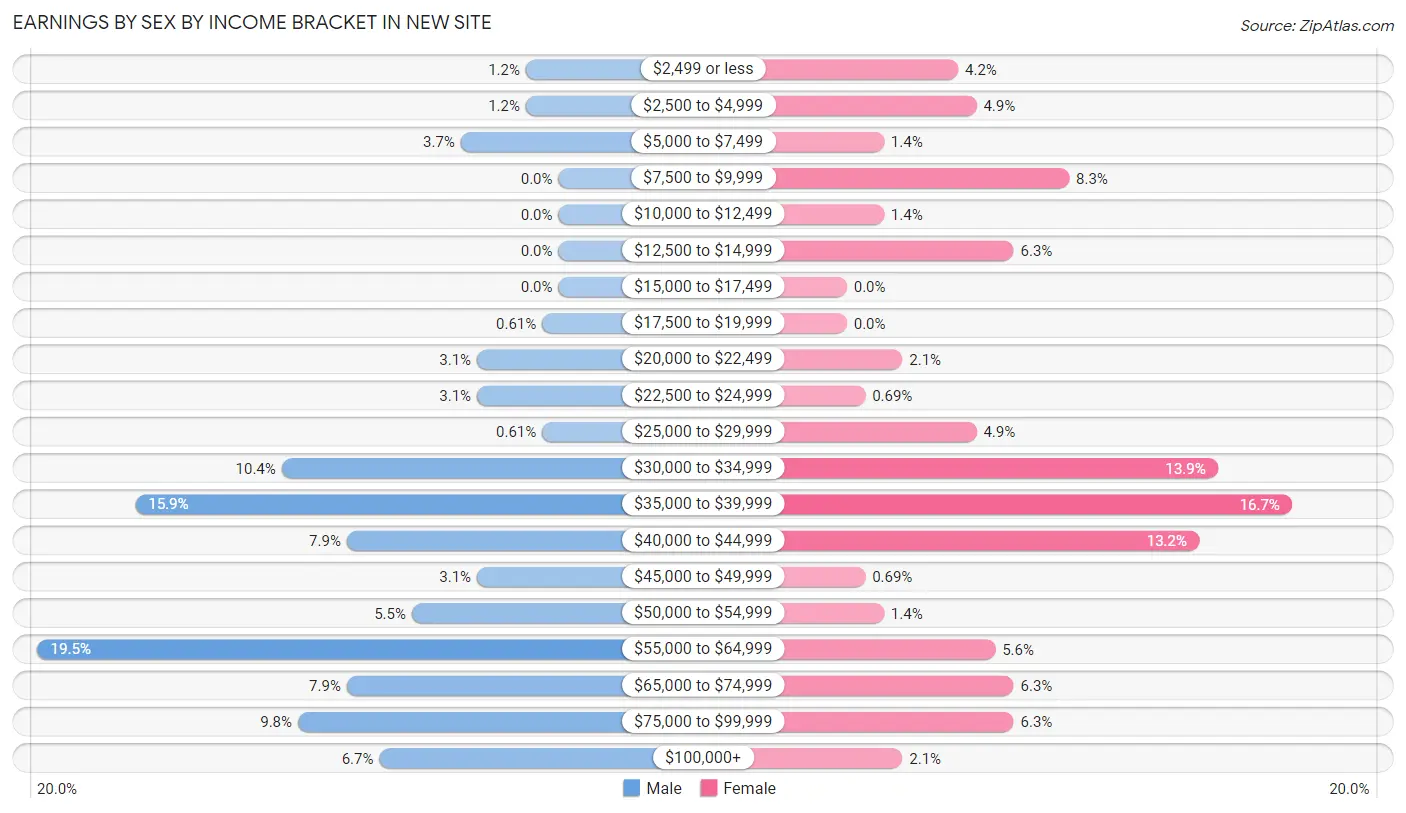
Earnings by Sex by Income Bracket in New Site
The most common earnings brackets in New Site are $55,000 to $64,999 for men (32 | 19.5%) and $35,000 to $39,999 for women (24 | 16.7%).
| Income | Male | Female |
| $2,499 or less | 2 (1.2%) | 6 (4.2%) |
| $2,500 to $4,999 | 2 (1.2%) | 7 (4.9%) |
| $5,000 to $7,499 | 6 (3.7%) | 2 (1.4%) |
| $7,500 to $9,999 | 0 (0.0%) | 12 (8.3%) |
| $10,000 to $12,499 | 0 (0.0%) | 2 (1.4%) |
| $12,500 to $14,999 | 0 (0.0%) | 9 (6.2%) |
| $15,000 to $17,499 | 0 (0.0%) | 0 (0.0%) |
| $17,500 to $19,999 | 1 (0.6%) | 0 (0.0%) |
| $20,000 to $22,499 | 5 (3.0%) | 3 (2.1%) |
| $22,500 to $24,999 | 5 (3.0%) | 1 (0.7%) |
| $25,000 to $29,999 | 1 (0.6%) | 7 (4.9%) |
| $30,000 to $34,999 | 17 (10.4%) | 20 (13.9%) |
| $35,000 to $39,999 | 26 (15.9%) | 24 (16.7%) |
| $40,000 to $44,999 | 13 (7.9%) | 19 (13.2%) |
| $45,000 to $49,999 | 5 (3.0%) | 1 (0.7%) |
| $50,000 to $54,999 | 9 (5.5%) | 2 (1.4%) |
| $55,000 to $64,999 | 32 (19.5%) | 8 (5.6%) |
| $65,000 to $74,999 | 13 (7.9%) | 9 (6.2%) |
| $75,000 to $99,999 | 16 (9.8%) | 9 (6.2%) |
| $100,000+ | 11 (6.7%) | 3 (2.1%) |
| Total | 164 (100.0%) | 144 (100.0%) |
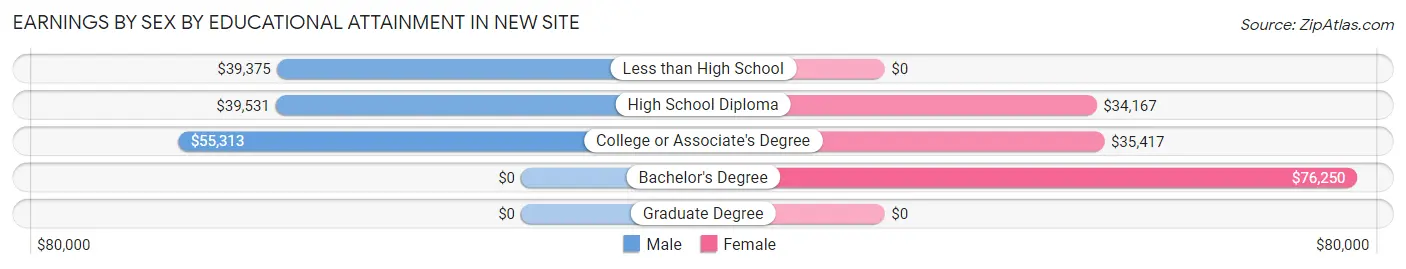
Earnings by Sex by Educational Attainment in New Site
Average earnings in New Site are $50,625 for men and $36,141 for women, a difference of 28.6%. Men with an educational attainment of college or associate's degree enjoy the highest average annual earnings of $55,313, while those with less than high school education earn the least with $39,375. Women with an educational attainment of bachelor's degree earn the most with the average annual earnings of $76,250, while those with high school diploma education have the smallest earnings of $34,167.
| Educational Attainment | Male Income | Female Income |
| Less than High School | $39,375 | $0 |
| High School Diploma | $39,531 | $34,167 |
| College or Associate's Degree | $55,313 | $35,417 |
| Bachelor's Degree | - | - |
| Graduate Degree | - | - |
| Total | $50,625 | $36,141 |
Family Income in New Site
Family Income Brackets in New Site
According to the New Site family income data, there are 59 families falling into the $50,000 to $74,999 income range, which is the most common income bracket and makes up 28.2% of all families.
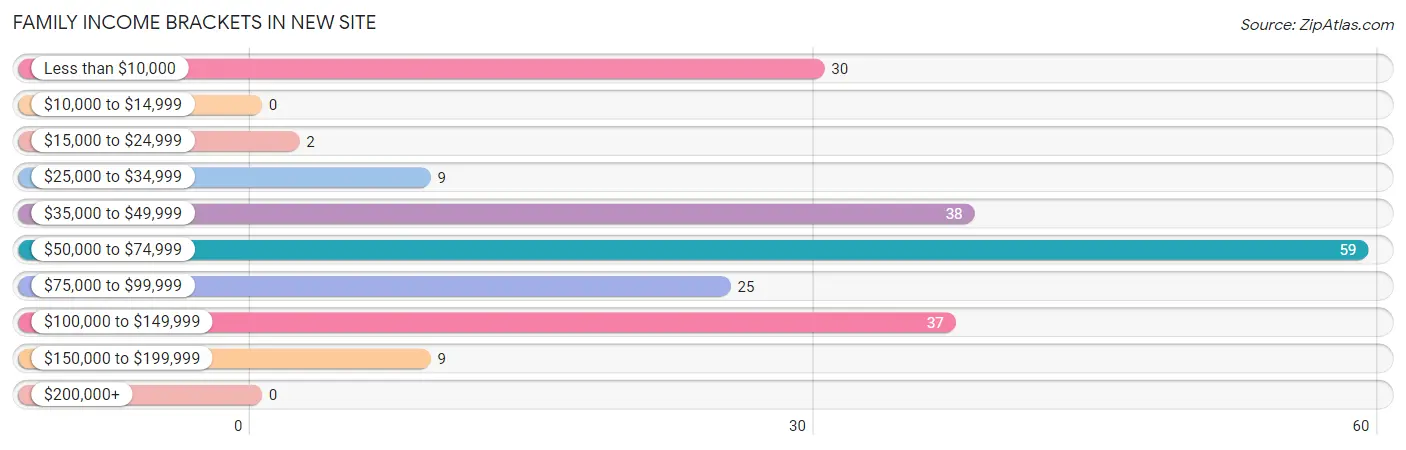
| Income Bracket | # Families | % Families |
| Less than $10,000 | 30 | 14.4% |
| $10,000 to $14,999 | 0 | 0.0% |
| $15,000 to $24,999 | 2 | 1.0% |
| $25,000 to $34,999 | 9 | 4.3% |
| $35,000 to $49,999 | 38 | 18.2% |
| $50,000 to $74,999 | 59 | 28.2% |
| $75,000 to $99,999 | 25 | 12.0% |
| $100,000 to $149,999 | 37 | 17.7% |
| $150,000 to $199,999 | 9 | 4.3% |
| $200,000+ | 0 | 0.0% |
Family Income by Famaliy Size in New Site
4-person families (24 | 11.5%) account for the highest median family income in New Site with $112,222 per family, while 4-person families (24 | 11.5%) have the highest median income of $28,056 per family member.
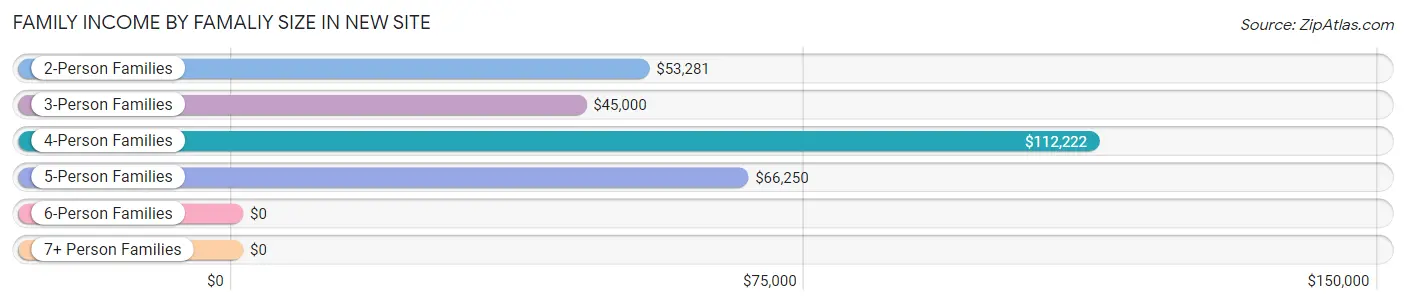
| Income Bracket | # Families | Median Income |
| 2-Person Families | 125 (59.8%) | $53,281 |
| 3-Person Families | 38 (18.2%) | $45,000 |
| 4-Person Families | 24 (11.5%) | $112,222 |
| 5-Person Families | 22 (10.5%) | $66,250 |
| 6-Person Families | 0 (0.0%) | $0 |
| 7+ Person Families | 0 (0.0%) | $0 |
| Total | 209 (100.0%) | $61,705 |
Family Income by Number of Earners in New Site
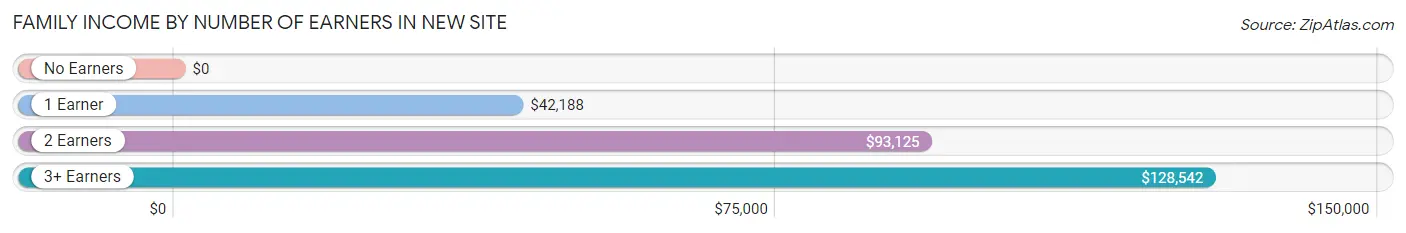
| Number of Earners | # Families | Median Income |
| No Earners | 67 (32.1%) | $0 |
| 1 Earner | 43 (20.6%) | $42,188 |
| 2 Earners | 88 (42.1%) | $93,125 |
| 3+ Earners | 11 (5.3%) | $128,542 |
| Total | 209 (100.0%) | $61,705 |
Household Income in New Site
Household Income Brackets in New Site
With 115 households falling in the category, the $50,000 to $74,999 income range is the most frequent in New Site, accounting for 36.2% of all households.
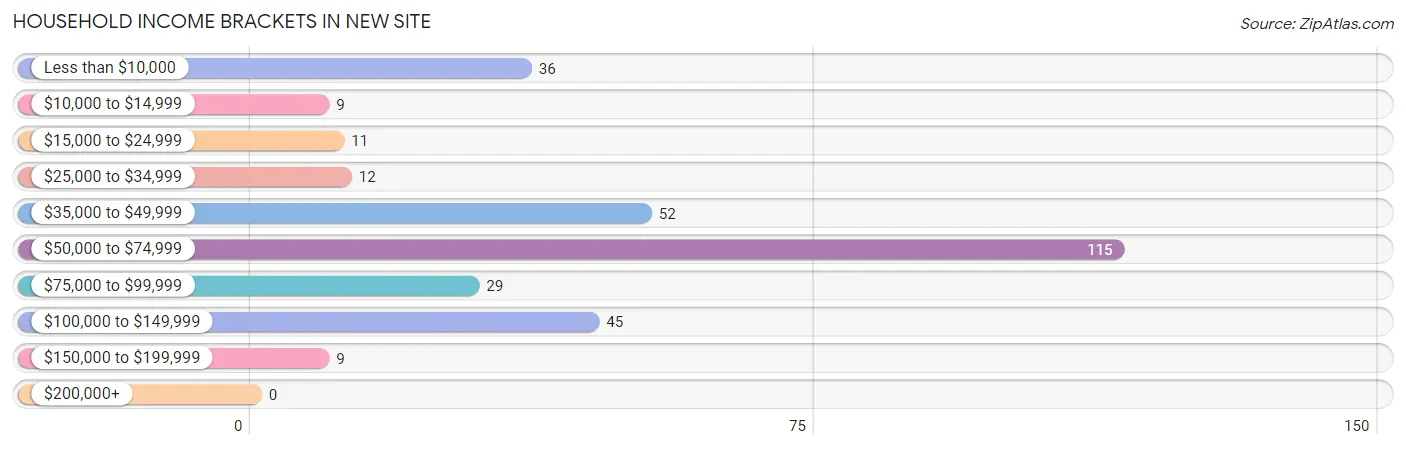
| Income Bracket | # Households | % Households |
| Less than $10,000 | 36 | 11.3% |
| $10,000 to $14,999 | 9 | 2.8% |
| $15,000 to $24,999 | 11 | 3.5% |
| $25,000 to $34,999 | 12 | 3.8% |
| $35,000 to $49,999 | 52 | 16.4% |
| $50,000 to $74,999 | 115 | 36.2% |
| $75,000 to $99,999 | 29 | 9.1% |
| $100,000 to $149,999 | 45 | 14.2% |
| $150,000 to $199,999 | 9 | 2.8% |
| $200,000+ | 0 | 0.0% |
Household Income by Householder Age in New Site
The median household income in New Site is $63,571, with the highest median household income of $70,026 found in the 65+ years age bracket for the primary householder. A total of 105 households (33.0%) fall into this category.
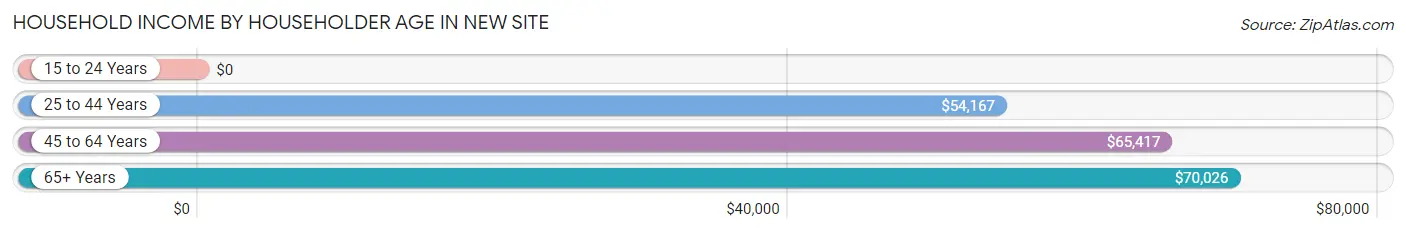
| Income Bracket | # Households | Median Income |
| 15 to 24 Years | 0 (0.0%) | $0 |
| 25 to 44 Years | 96 (30.2%) | $54,167 |
| 45 to 64 Years | 117 (36.8%) | $65,417 |
| 65+ Years | 105 (33.0%) | $70,026 |
| Total | 318 (100.0%) | $63,571 |
Poverty in New Site
Income Below Poverty by Sex and Age in New Site
With 10.9% poverty level for males and 13.9% for females among the residents of New Site, 5 year old males and 5 year old females are the most vulnerable to poverty, with 11 males (100.0%) and 6 females (100.0%) in their respective age groups living below the poverty level.
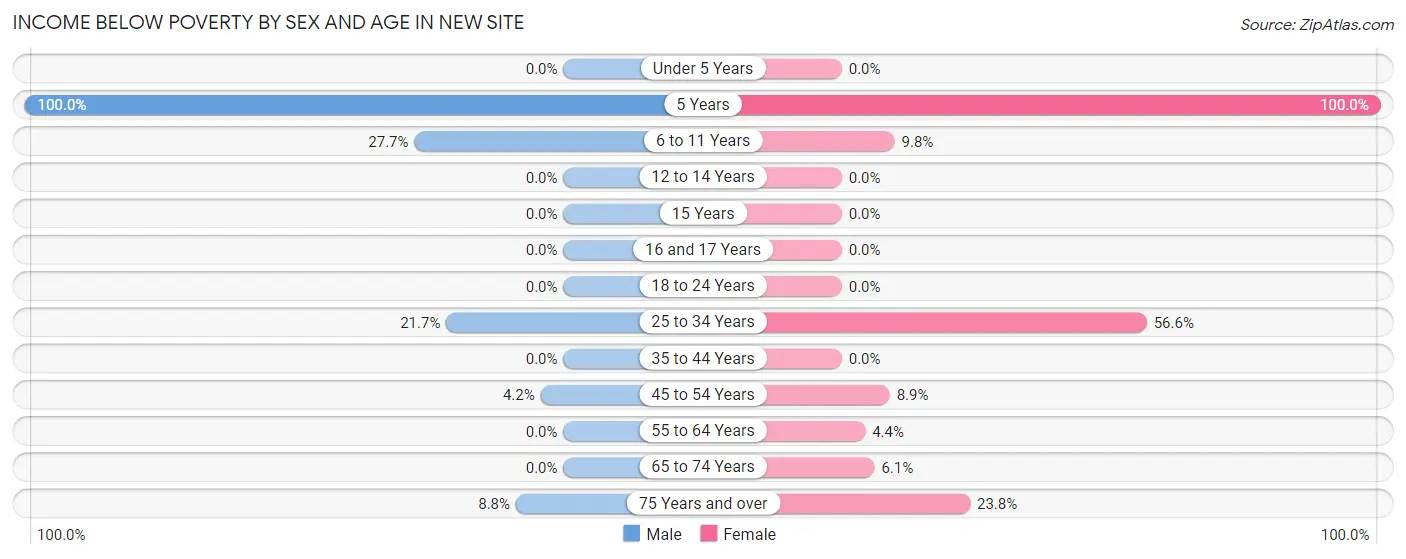
| Age Bracket | Male | Female |
| Under 5 Years | 0 (0.0%) | 0 (0.0%) |
| 5 Years | 11 (100.0%) | 6 (100.0%) |
| 6 to 11 Years | 13 (27.7%) | 5 (9.8%) |
| 12 to 14 Years | 0 (0.0%) | 0 (0.0%) |
| 15 Years | 0 (0.0%) | 0 (0.0%) |
| 16 and 17 Years | 0 (0.0%) | 0 (0.0%) |
| 18 to 24 Years | 0 (0.0%) | 0 (0.0%) |
| 25 to 34 Years | 5 (21.7%) | 30 (56.6%) |
| 35 to 44 Years | 0 (0.0%) | 0 (0.0%) |
| 45 to 54 Years | 3 (4.2%) | 4 (8.9%) |
| 55 to 64 Years | 0 (0.0%) | 3 (4.3%) |
| 65 to 74 Years | 0 (0.0%) | 2 (6.1%) |
| 75 Years and over | 6 (8.8%) | 5 (23.8%) |
| Total | 38 (10.9%) | 55 (13.9%) |
Income Above Poverty by Sex and Age in New Site
According to the poverty statistics in New Site, males aged 12 to 14 years and females aged under 5 years are the age groups that are most secure financially, with 100.0% of males and 100.0% of females in these age groups living above the poverty line.
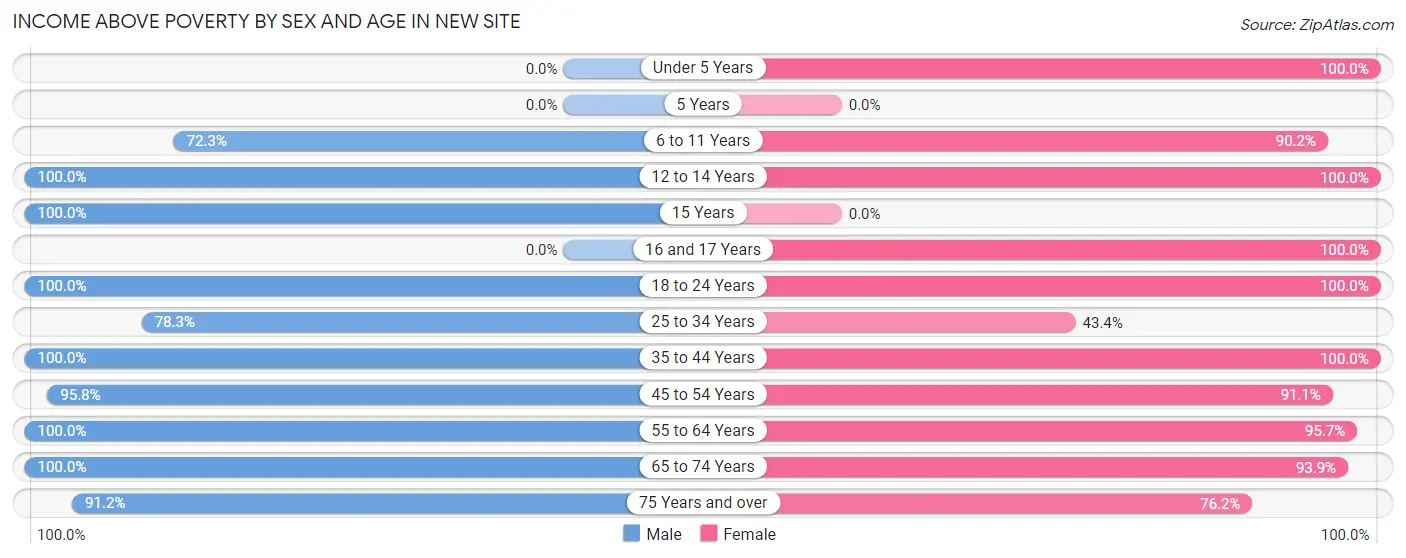
| Age Bracket | Male | Female |
| Under 5 Years | 0 (0.0%) | 3 (100.0%) |
| 5 Years | 0 (0.0%) | 0 (0.0%) |
| 6 to 11 Years | 34 (72.3%) | 46 (90.2%) |
| 12 to 14 Years | 7 (100.0%) | 37 (100.0%) |
| 15 Years | 7 (100.0%) | 0 (0.0%) |
| 16 and 17 Years | 0 (0.0%) | 9 (100.0%) |
| 18 to 24 Years | 16 (100.0%) | 18 (100.0%) |
| 25 to 34 Years | 18 (78.3%) | 23 (43.4%) |
| 35 to 44 Years | 31 (100.0%) | 51 (100.0%) |
| 45 to 54 Years | 68 (95.8%) | 41 (91.1%) |
| 55 to 64 Years | 49 (100.0%) | 66 (95.7%) |
| 65 to 74 Years | 20 (100.0%) | 31 (93.9%) |
| 75 Years and over | 62 (91.2%) | 16 (76.2%) |
| Total | 312 (89.1%) | 341 (86.1%) |
Income Below Poverty Among Married-Couple Families in New Site
The poverty statistics for married-couple families in New Site show that 5.4% or 8 of the total 149 families live below the poverty line. Families with 3 or 4 children have the highest poverty rate of 29.4%, comprising of 5 families. On the other hand, families with 1 or 2 children have the lowest poverty rate of 0.0%, which includes 0 families.
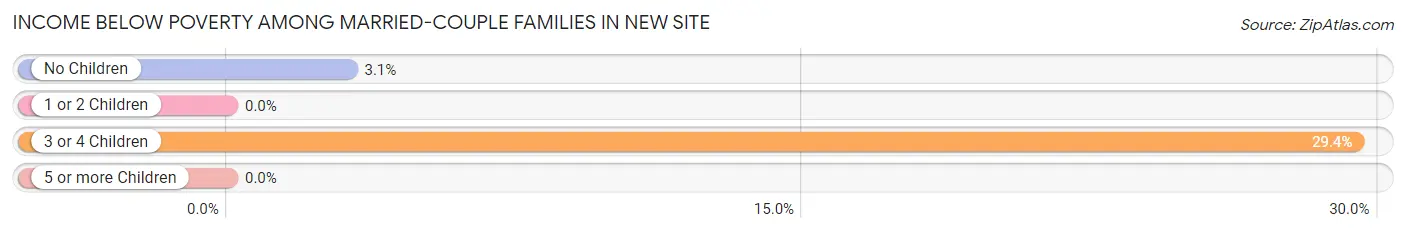
| Children | Above Poverty | Below Poverty |
| No Children | 93 (96.9%) | 3 (3.1%) |
| 1 or 2 Children | 36 (100.0%) | 0 (0.0%) |
| 3 or 4 Children | 12 (70.6%) | 5 (29.4%) |
| 5 or more Children | 0 (0.0%) | 0 (0.0%) |
| Total | 141 (94.6%) | 8 (5.4%) |
Income Below Poverty Among Single-Parent Households in New Site
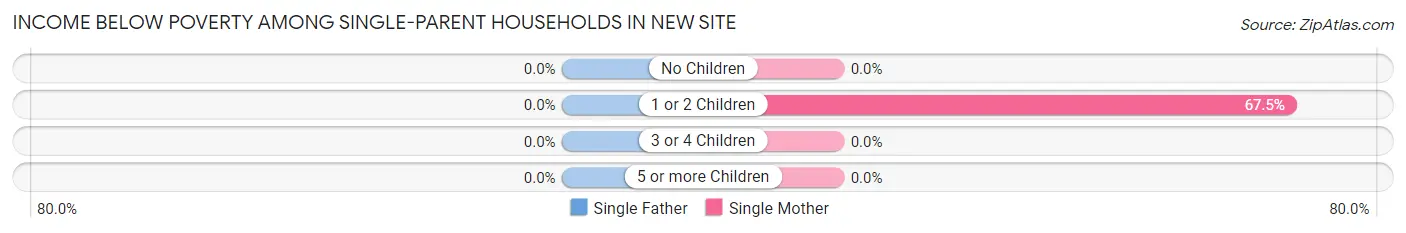
| Children | Single Father | Single Mother |
| No Children | 0 (0.0%) | 0 (0.0%) |
| 1 or 2 Children | 0 (0.0%) | 27 (67.5%) |
| 3 or 4 Children | 0 (0.0%) | 0 (0.0%) |
| 5 or more Children | 0 (0.0%) | 0 (0.0%) |
| Total | 0 (0.0%) | 27 (52.9%) |
Income Below Poverty Among Married-Couple vs Single-Parent Households in New Site
The poverty data for New Site shows that 8 of the married-couple family households (5.4%) and 27 of the single-parent households (45.0%) are living below the poverty level. Within the married-couple family households, those with 3 or 4 children have the highest poverty rate, with 5 households (29.4%) falling below the poverty line. Among the single-parent households, those with 1 or 2 children have the highest poverty rate, with 27 household (67.5%) living below poverty.
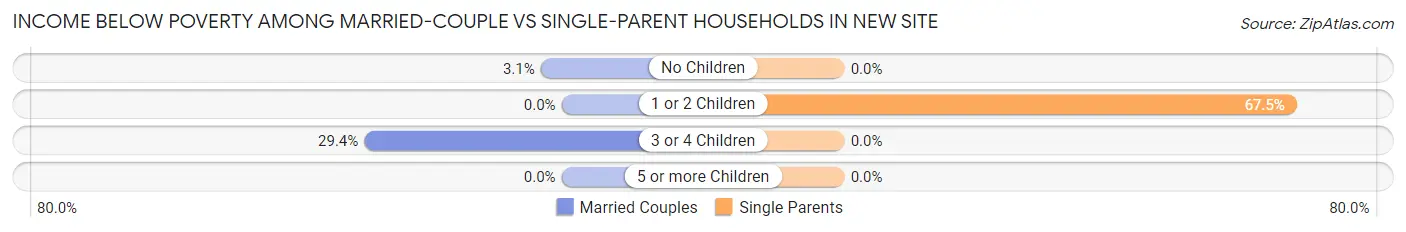
| Children | Married-Couple Families | Single-Parent Households |
| No Children | 3 (3.1%) | 0 (0.0%) |
| 1 or 2 Children | 0 (0.0%) | 27 (67.5%) |
| 3 or 4 Children | 5 (29.4%) | 0 (0.0%) |
| 5 or more Children | 0 (0.0%) | 0 (0.0%) |
| Total | 8 (5.4%) | 27 (45.0%) |
Race in New Site
The most populous races in New Site are White / Caucasian (691 | 92.6%), Black / African American (52 | 7.0%), and Two or more Races (2 | 0.3%).
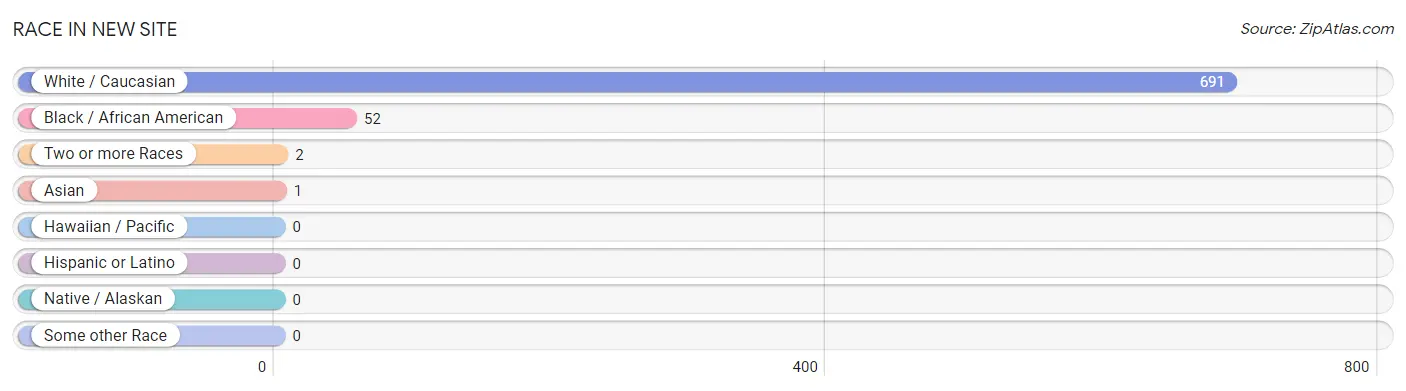
| Race | # Population | % Population |
| Asian | 1 | 0.1% |
| Black / African American | 52 | 7.0% |
| Hawaiian / Pacific | 0 | 0.0% |
| Hispanic or Latino | 0 | 0.0% |
| Native / Alaskan | 0 | 0.0% |
| White / Caucasian | 691 | 92.6% |
| Two or more Races | 2 | 0.3% |
| Some other Race | 0 | 0.0% |
| Total | 746 | 100.0% |
Ancestry in New Site
The most populous ancestries reported in New Site are American (130 | 17.4%), English (109 | 14.6%), Irish (26 | 3.5%), Eastern European (22 | 2.9%), and German (12 | 1.6%), together accounting for 40.1% of all New Site residents.
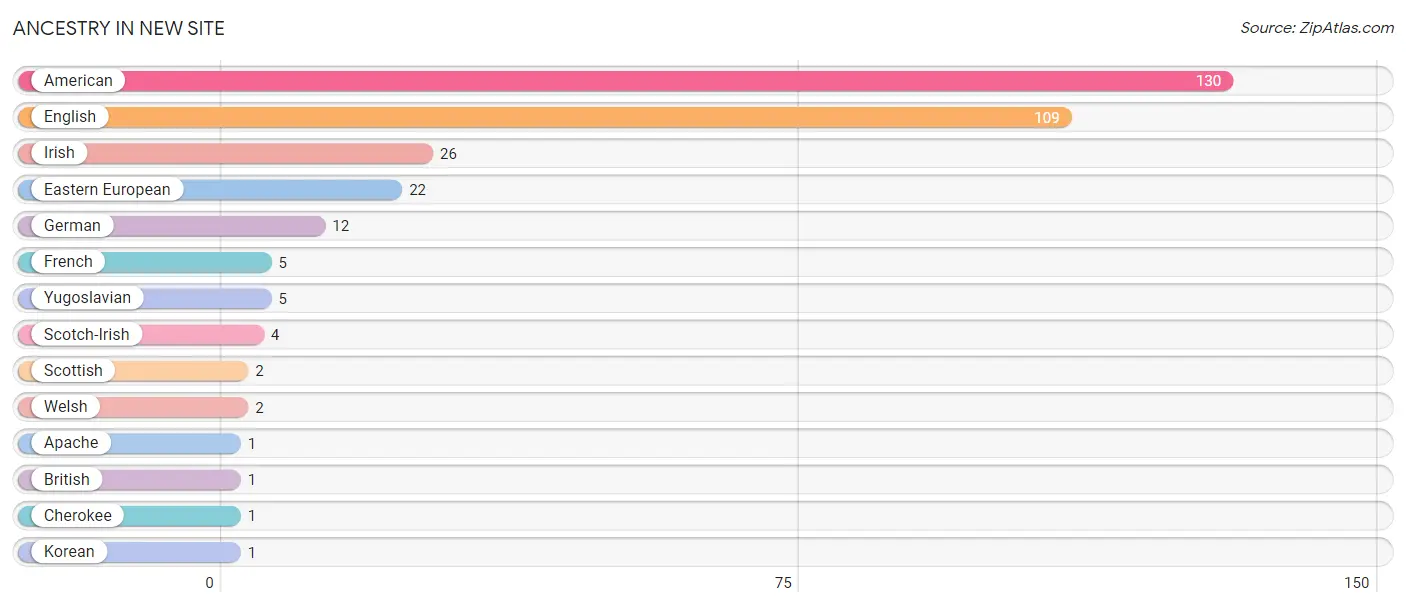
| Ancestry | # Population | % Population |
| American | 130 | 17.4% |
| Apache | 1 | 0.1% |
| British | 1 | 0.1% |
| Cherokee | 1 | 0.1% |
| Eastern European | 22 | 2.9% |
| English | 109 | 14.6% |
| French | 5 | 0.7% |
| German | 12 | 1.6% |
| Irish | 26 | 3.5% |
| Korean | 1 | 0.1% |
| Scotch-Irish | 4 | 0.5% |
| Scottish | 2 | 0.3% |
| Welsh | 2 | 0.3% |
| Yugoslavian | 5 | 0.7% | View All 14 Rows |
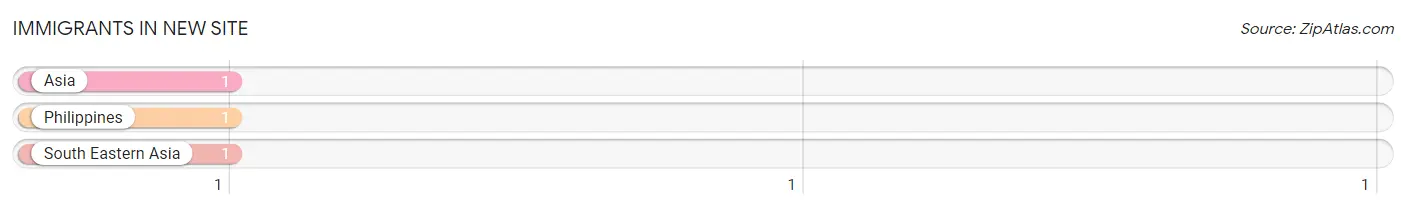
Immigrants in New Site
The most numerous immigrant groups reported in New Site came from Asia (1 | 0.1%), Philippines (1 | 0.1%), and South Eastern Asia (1 | 0.1%), together accounting for 0.4% of all New Site residents.
| Immigration Origin | # Population | % Population |
| Asia | 1 | 0.1% |
| Philippines | 1 | 0.1% |
| South Eastern Asia | 1 | 0.1% | View All 3 Rows |
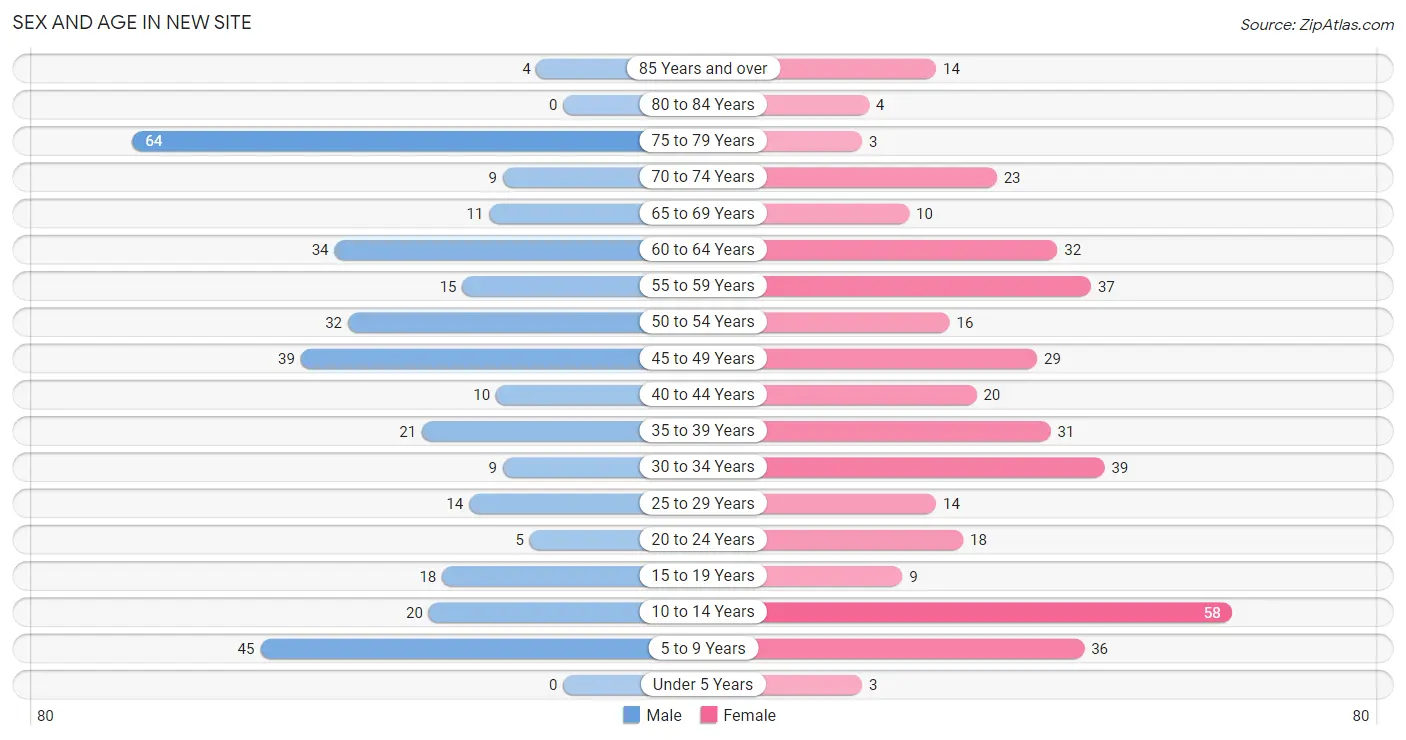
Sex and Age in New Site
Sex and Age in New Site
The most populous age groups in New Site are 75 to 79 Years (64 | 18.3%) for men and 10 to 14 Years (58 | 14.6%) for women.
| Age Bracket | Male | Female |
| Under 5 Years | 0 (0.0%) | 3 (0.8%) |
| 5 to 9 Years | 45 (12.9%) | 36 (9.1%) |
| 10 to 14 Years | 20 (5.7%) | 58 (14.6%) |
| 15 to 19 Years | 18 (5.1%) | 9 (2.3%) |
| 20 to 24 Years | 5 (1.4%) | 18 (4.5%) |
| 25 to 29 Years | 14 (4.0%) | 14 (3.5%) |
| 30 to 34 Years | 9 (2.6%) | 39 (9.9%) |
| 35 to 39 Years | 21 (6.0%) | 31 (7.8%) |
| 40 to 44 Years | 10 (2.9%) | 20 (5.1%) |
| 45 to 49 Years | 39 (11.1%) | 29 (7.3%) |
| 50 to 54 Years | 32 (9.1%) | 16 (4.0%) |
| 55 to 59 Years | 15 (4.3%) | 37 (9.3%) |
| 60 to 64 Years | 34 (9.7%) | 32 (8.1%) |
| 65 to 69 Years | 11 (3.1%) | 10 (2.5%) |
| 70 to 74 Years | 9 (2.6%) | 23 (5.8%) |
| 75 to 79 Years | 64 (18.3%) | 3 (0.8%) |
| 80 to 84 Years | 0 (0.0%) | 4 (1.0%) |
| 85 Years and over | 4 (1.1%) | 14 (3.5%) |
| Total | 350 (100.0%) | 396 (100.0%) |
Families and Households in New Site
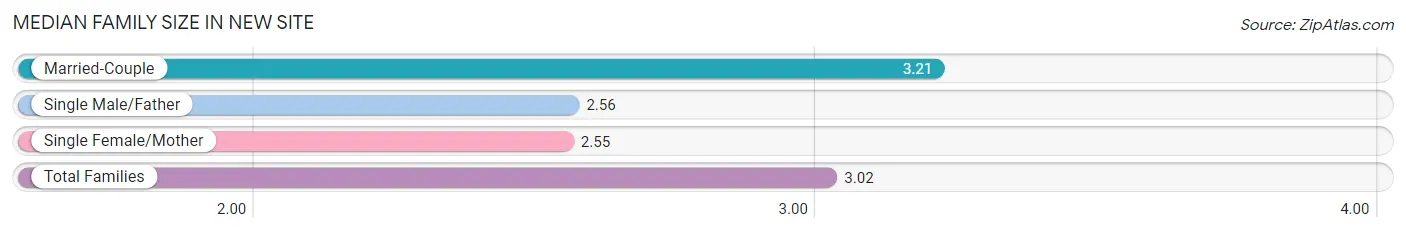
Median Family Size in New Site
The median family size in New Site is 3.02 persons per family, with married-couple families (149 | 71.3%) accounting for the largest median family size of 3.21 persons per family. On the other hand, single female/mother families (51 | 24.4%) represent the smallest median family size with 2.55 persons per family.
| Family Type | # Families | Family Size |
| Married-Couple | 149 (71.3%) | 3.21 |
| Single Male/Father | 9 (4.3%) | 2.56 |
| Single Female/Mother | 51 (24.4%) | 2.55 |
| Total Families | 209 (100.0%) | 3.02 |
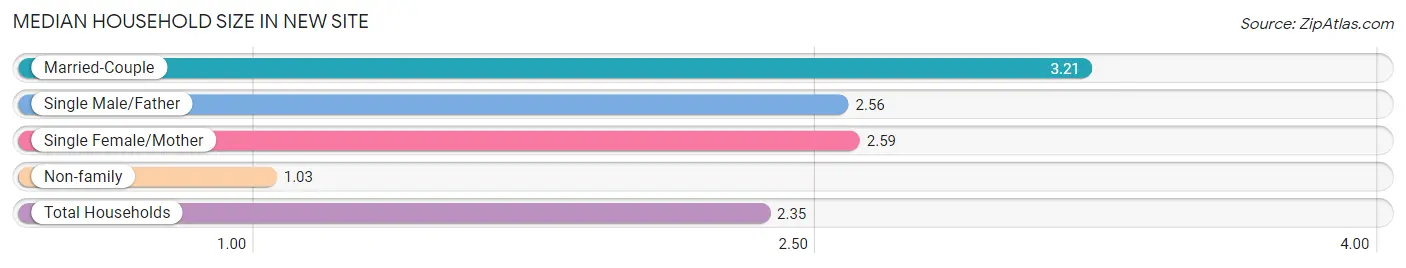
Median Household Size in New Site
The median household size in New Site is 2.35 persons per household, with married-couple households (149 | 46.9%) accounting for the largest median household size of 3.21 persons per household. non-family households (109 | 34.3%) represent the smallest median household size with 1.03 persons per household.
| Household Type | # Households | Household Size |
| Married-Couple | 149 (46.9%) | 3.21 |
| Single Male/Father | 9 (2.8%) | 2.56 |
| Single Female/Mother | 51 (16.0%) | 2.59 |
| Non-family | 109 (34.3%) | 1.03 |
| Total Households | 318 (100.0%) | 2.35 |
Household Size by Marriage Status in New Site
Out of a total of 318 households in New Site, 209 (65.7%) are family households, while 109 (34.3%) are nonfamily households. The most numerous type of family households are 2-person households, comprising 125, and the most common type of nonfamily households are 1-person households, comprising 105.
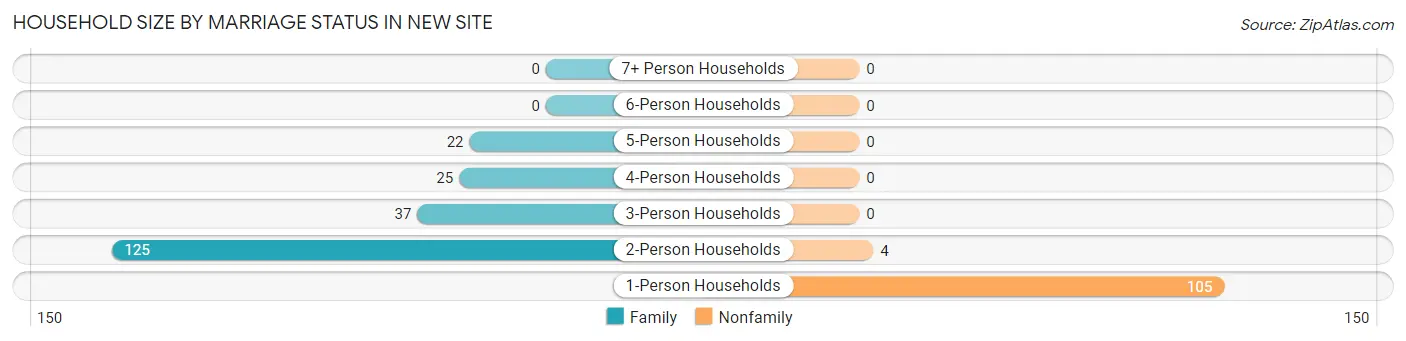
| Household Size | Family Households | Nonfamily Households |
| 1-Person Households | - | 105 (33.0%) |
| 2-Person Households | 125 (39.3%) | 4 (1.3%) |
| 3-Person Households | 37 (11.6%) | 0 (0.0%) |
| 4-Person Households | 25 (7.9%) | 0 (0.0%) |
| 5-Person Households | 22 (6.9%) | 0 (0.0%) |
| 6-Person Households | 0 (0.0%) | 0 (0.0%) |
| 7+ Person Households | 0 (0.0%) | 0 (0.0%) |
| Total | 209 (65.7%) | 109 (34.3%) |
Female Fertility in New Site
Fertility by Age in New Site
Average fertility rate in New Site is 12.0 births per 1,000 women. Women in the age bracket of 20 to 34 years have the highest fertility rate with 28.0 births per 1,000 women. Women in the age bracket of 20 to 34 years acount for 100.0% of all women with births.
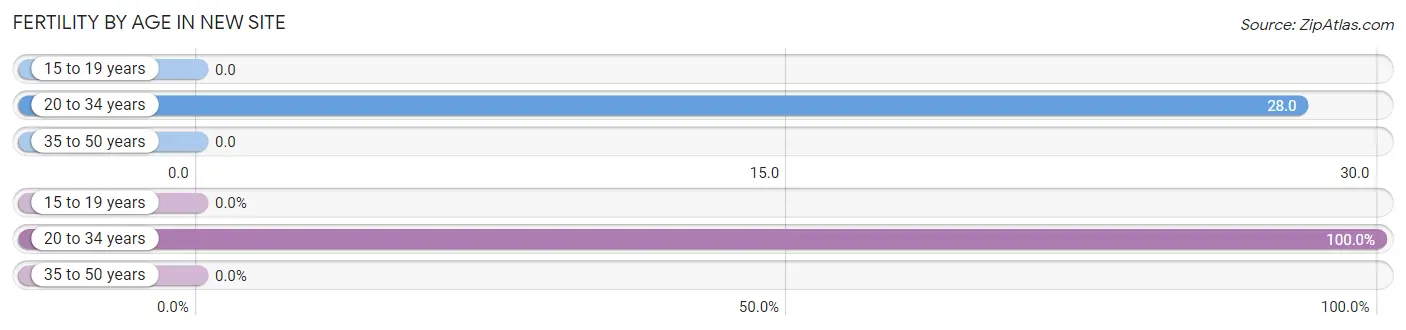
| Age Bracket | Women with Births | Births / 1,000 Women |
| 15 to 19 years | 0 (0.0%) | 0.0 |
| 20 to 34 years | 2 (100.0%) | 28.0 |
| 35 to 50 years | 0 (0.0%) | 0.0 |
| Total | 2 (100.0%) | 12.0 |
Fertility by Age by Marriage Status in New Site
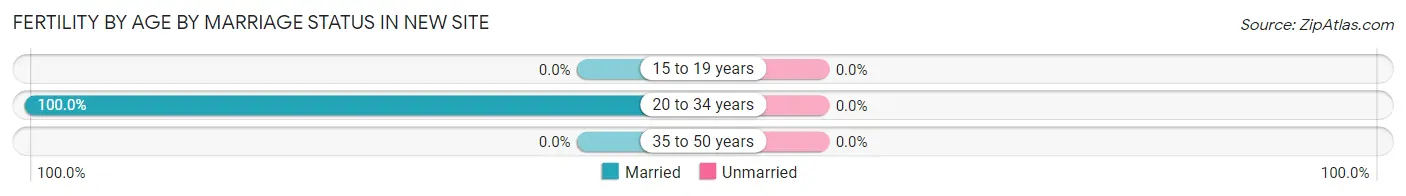
| Age Bracket | Married | Unmarried |
| 15 to 19 years | 0 (0.0%) | 0 (0.0%) |
| 20 to 34 years | 2 (100.0%) | 0 (0.0%) |
| 35 to 50 years | 0 (0.0%) | 0 (0.0%) |
| Total | 2 (100.0%) | 0 (0.0%) |
Fertility by Education in New Site
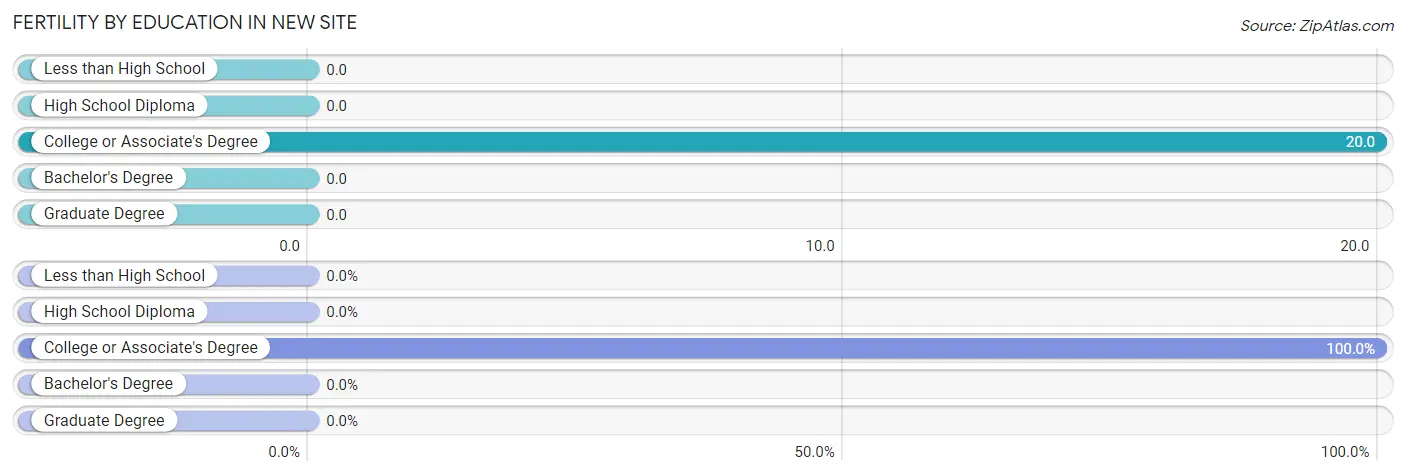
| Educational Attainment | Women with Births | Births / 1,000 Women |
| Less than High School | 0 (0.0%) | 0.0 |
| High School Diploma | 0 (0.0%) | 0.0 |
| College or Associate's Degree | 2 (100.0%) | 20.0 |
| Bachelor's Degree | 0 (0.0%) | 0.0 |
| Graduate Degree | 0 (0.0%) | 0.0 |
| Total | 2 (100.0%) | 12.0 |
Fertility by Education by Marriage Status in New Site
| Educational Attainment | Married | Unmarried |
| Less than High School | 0 (0.0%) | 0 (0.0%) |
| High School Diploma | 0 (0.0%) | 0 (0.0%) |
| College or Associate's Degree | 2 (100.0%) | 0 (0.0%) |
| Bachelor's Degree | 0 (0.0%) | 0 (0.0%) |
| Graduate Degree | 0 (0.0%) | 0 (0.0%) |
| Total | 2 (100.0%) | 0 (0.0%) |
Employment Characteristics in New Site
Employment by Class of Employer in New Site
Among the 284 employed individuals in New Site, private company employees (204 | 71.8%), local government employees (48 | 16.9%), and not-for-profit organizations (13 | 4.6%) make up the most common classes of employment.
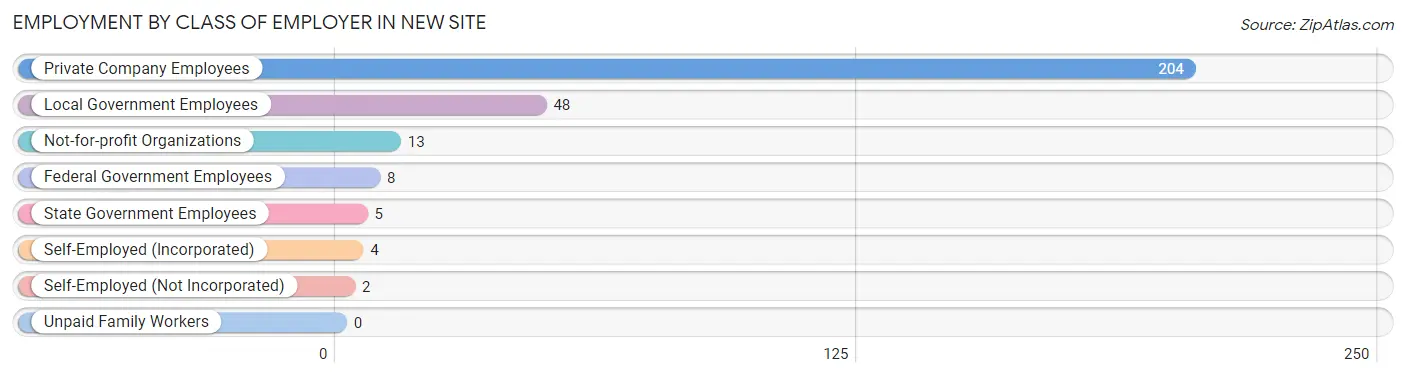
| Employer Class | # Employees | % Employees |
| Private Company Employees | 204 | 71.8% |
| Self-Employed (Incorporated) | 4 | 1.4% |
| Self-Employed (Not Incorporated) | 2 | 0.7% |
| Not-for-profit Organizations | 13 | 4.6% |
| Local Government Employees | 48 | 16.9% |
| State Government Employees | 5 | 1.8% |
| Federal Government Employees | 8 | 2.8% |
| Unpaid Family Workers | 0 | 0.0% |
| Total | 284 | 100.0% |
Employment Status by Age in New Site
According to the labor force statistics for New Site, out of the total population over 16 years of age (577), 52.5% or 303 individuals are in the labor force, with 3.3% or 10 of them unemployed. The age group with the highest labor force participation rate is 35 to 44 years, with 89.0% or 73 individuals in the labor force. Within the labor force, the 25 to 29 years age range has the highest percentage of unemployed individuals, with 23.8% or 5 of them being unemployed.
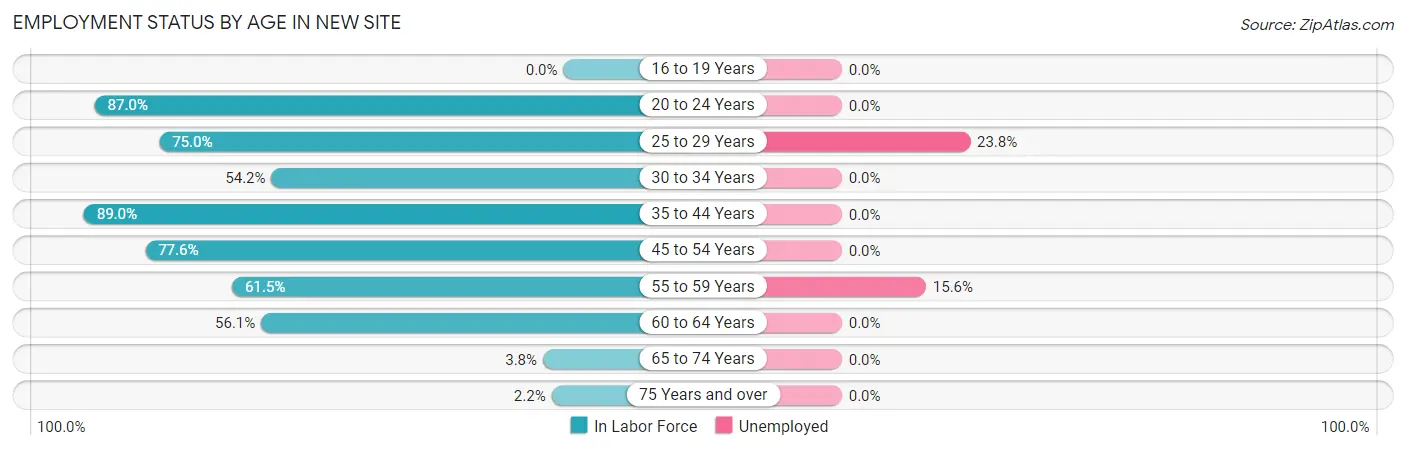
| Age Bracket | In Labor Force | Unemployed |
| 16 to 19 Years | 0 (0.0%) | 0 (0.0%) |
| 20 to 24 Years | 20 (87.0%) | 0 (0.0%) |
| 25 to 29 Years | 21 (75.0%) | 5 (23.8%) |
| 30 to 34 Years | 26 (54.2%) | 0 (0.0%) |
| 35 to 44 Years | 73 (89.0%) | 0 (0.0%) |
| 45 to 54 Years | 90 (77.6%) | 0 (0.0%) |
| 55 to 59 Years | 32 (61.5%) | 5 (15.6%) |
| 60 to 64 Years | 37 (56.1%) | 0 (0.0%) |
| 65 to 74 Years | 2 (3.8%) | 0 (0.0%) |
| 75 Years and over | 2 (2.2%) | 0 (0.0%) |
| Total | 303 (52.5%) | 10 (3.3%) |
Employment Status by Educational Attainment in New Site
According to labor force statistics for New Site, 71.2% of individuals (279) out of the total population between 25 and 64 years of age (392) are in the labor force, with 3.6% or 10 of them being unemployed. The group with the highest labor force participation rate are those with the educational attainment of bachelor's degree or higher, with 88.0% or 22 individuals in the labor force. Within the labor force, individuals with high school diploma education have the highest percentage of unemployment, with 5.6% or 5 of them being unemployed.
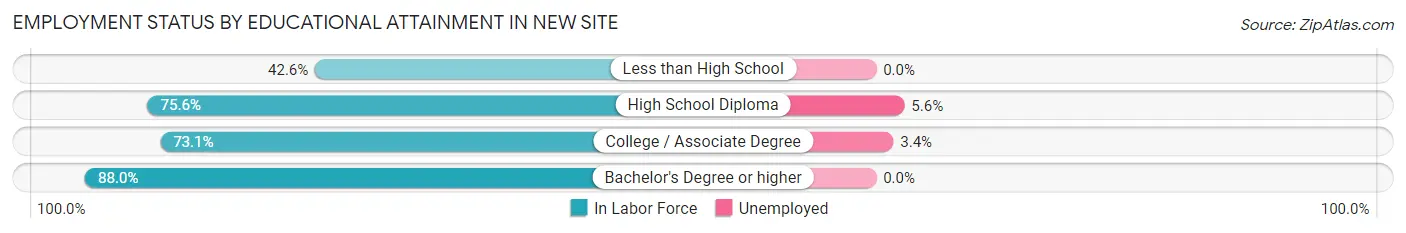
| Educational Attainment | In Labor Force | Unemployed |
| Less than High School | 20 (42.6%) | 0 (0.0%) |
| High School Diploma | 90 (75.6%) | 7 (5.6%) |
| College / Associate Degree | 147 (73.1%) | 7 (3.4%) |
| Bachelor's Degree or higher | 22 (88.0%) | 0 (0.0%) |
| Total | 279 (71.2%) | 14 (3.6%) |
Employment Occupations by Sex in New Site
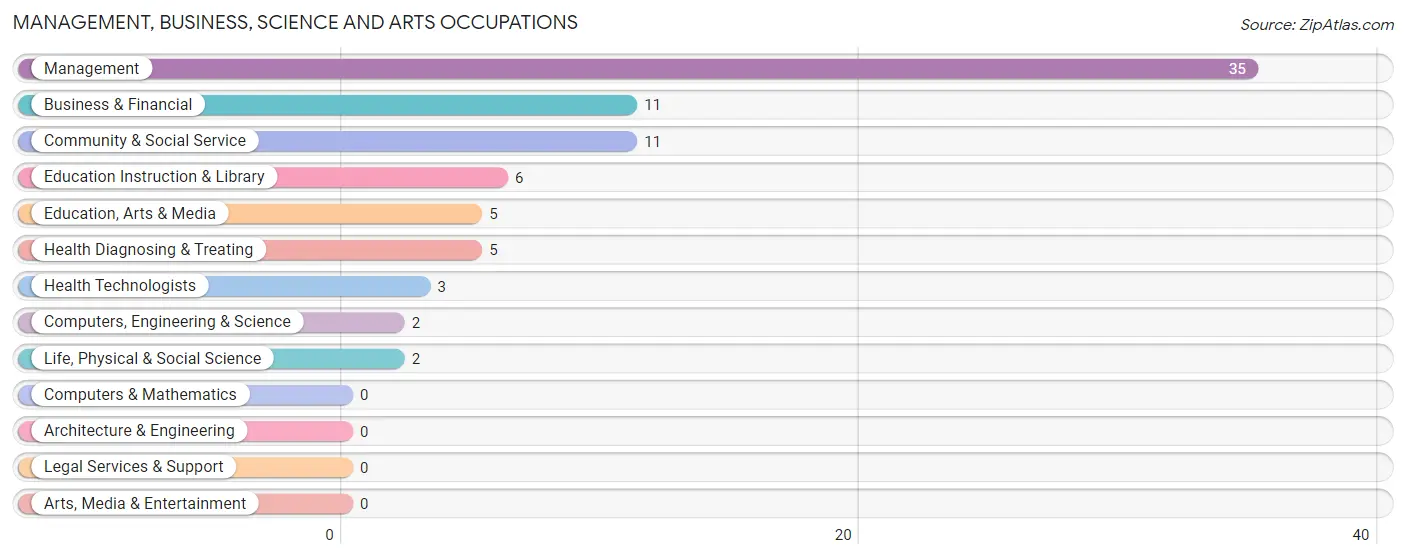
Management, Business, Science and Arts Occupations
The most common Management, Business, Science and Arts occupations in New Site are Management (35 | 11.9%), Business & Financial (11 | 3.7%), Community & Social Service (11 | 3.7%), Education Instruction & Library (6 | 2.1%), and Education, Arts & Media (5 | 1.7%).
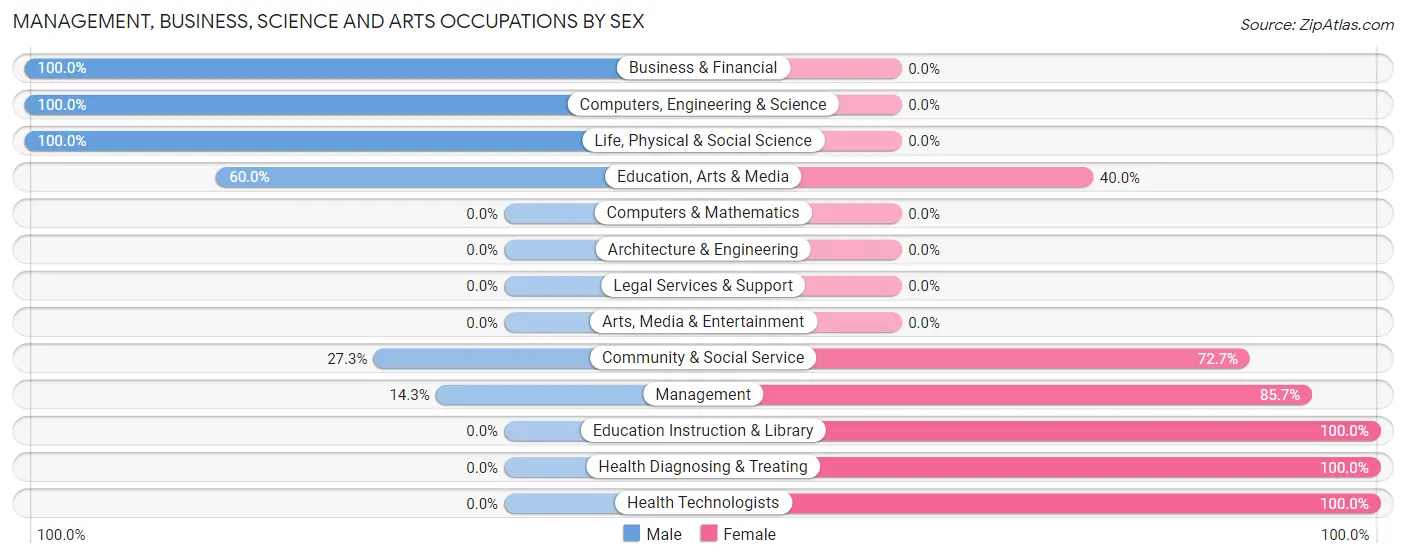
Management, Business, Science and Arts Occupations by Sex
Within the Management, Business, Science and Arts occupations in New Site, the most male-oriented occupations are Business & Financial (100.0%), Computers, Engineering & Science (100.0%), and Life, Physical & Social Science (100.0%), while the most female-oriented occupations are Education Instruction & Library (100.0%), Health Diagnosing & Treating (100.0%), and Health Technologists (100.0%).
| Occupation | Male | Female |
| Management | 5 (14.3%) | 30 (85.7%) |
| Business & Financial | 11 (100.0%) | 0 (0.0%) |
| Computers, Engineering & Science | 2 (100.0%) | 0 (0.0%) |
| Computers & Mathematics | 0 (0.0%) | 0 (0.0%) |
| Architecture & Engineering | 0 (0.0%) | 0 (0.0%) |
| Life, Physical & Social Science | 2 (100.0%) | 0 (0.0%) |
| Community & Social Service | 3 (27.3%) | 8 (72.7%) |
| Education, Arts & Media | 3 (60.0%) | 2 (40.0%) |
| Legal Services & Support | 0 (0.0%) | 0 (0.0%) |
| Education Instruction & Library | 0 (0.0%) | 6 (100.0%) |
| Arts, Media & Entertainment | 0 (0.0%) | 0 (0.0%) |
| Health Diagnosing & Treating | 0 (0.0%) | 5 (100.0%) |
| Health Technologists | 0 (0.0%) | 3 (100.0%) |
| Total (Category) | 21 (32.8%) | 43 (67.2%) |
| Total (Overall) | 156 (53.2%) | 137 (46.8%) |
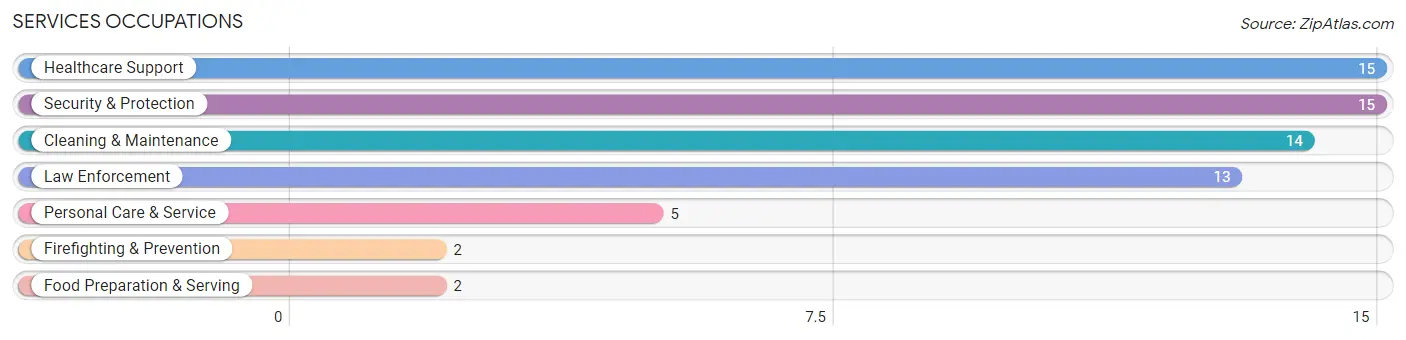
Services Occupations
The most common Services occupations in New Site are Healthcare Support (15 | 5.1%), Security & Protection (15 | 5.1%), Cleaning & Maintenance (14 | 4.8%), Law Enforcement (13 | 4.4%), and Personal Care & Service (5 | 1.7%).
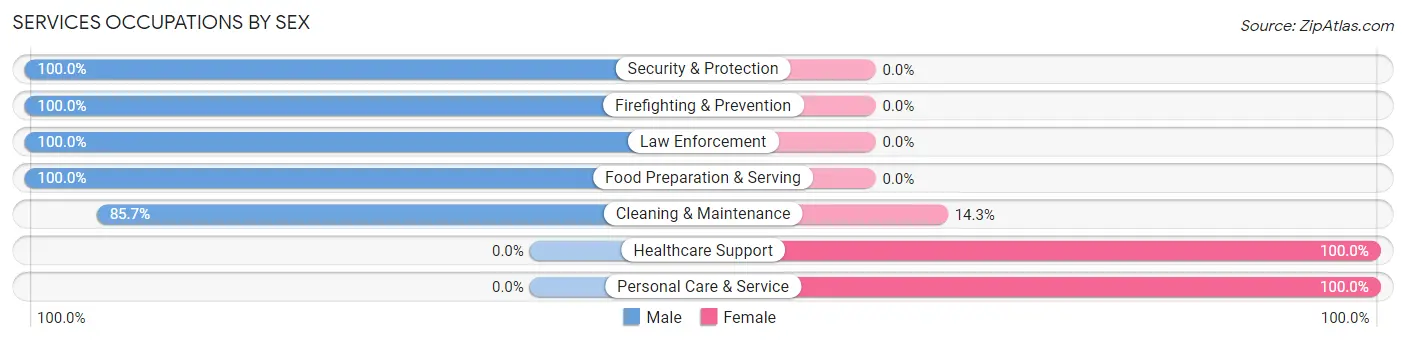
Services Occupations by Sex
Within the Services occupations in New Site, the most male-oriented occupations are Security & Protection (100.0%), Firefighting & Prevention (100.0%), and Law Enforcement (100.0%), while the most female-oriented occupations are Healthcare Support (100.0%), Personal Care & Service (100.0%), and Cleaning & Maintenance (14.3%).
| Occupation | Male | Female |
| Healthcare Support | 0 (0.0%) | 15 (100.0%) |
| Security & Protection | 15 (100.0%) | 0 (0.0%) |
| Firefighting & Prevention | 2 (100.0%) | 0 (0.0%) |
| Law Enforcement | 13 (100.0%) | 0 (0.0%) |
| Food Preparation & Serving | 2 (100.0%) | 0 (0.0%) |
| Cleaning & Maintenance | 12 (85.7%) | 2 (14.3%) |
| Personal Care & Service | 0 (0.0%) | 5 (100.0%) |
| Total (Category) | 29 (56.9%) | 22 (43.1%) |
| Total (Overall) | 156 (53.2%) | 137 (46.8%) |
Sales and Office Occupations
The most common Sales and Office occupations in New Site are Office & Administration (42 | 14.3%), and Sales & Related (21 | 7.2%).
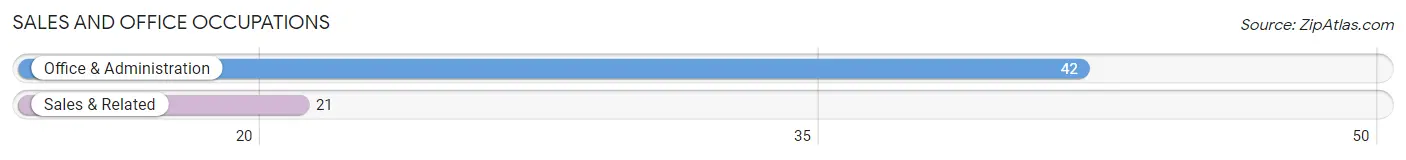
Sales and Office Occupations by Sex

| Occupation | Male | Female |
| Sales & Related | 9 (42.9%) | 12 (57.1%) |
| Office & Administration | 0 (0.0%) | 42 (100.0%) |
| Total (Category) | 9 (14.3%) | 54 (85.7%) |
| Total (Overall) | 156 (53.2%) | 137 (46.8%) |
Natural Resources, Construction and Maintenance Occupations
The most common Natural Resources, Construction and Maintenance occupations in New Site are Installation, Maintenance & Repair (25 | 8.5%), and Construction & Extraction (23 | 7.9%).
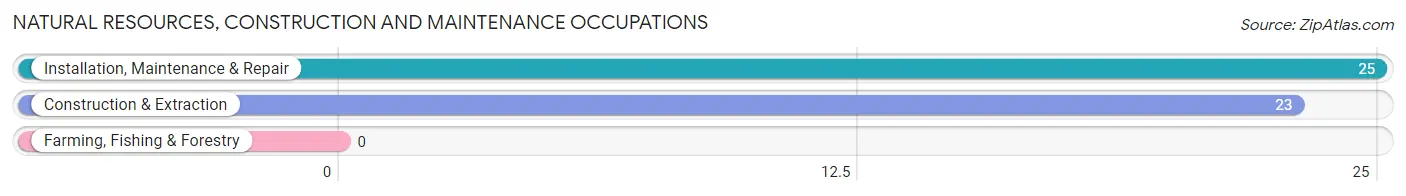
Natural Resources, Construction and Maintenance Occupations by Sex
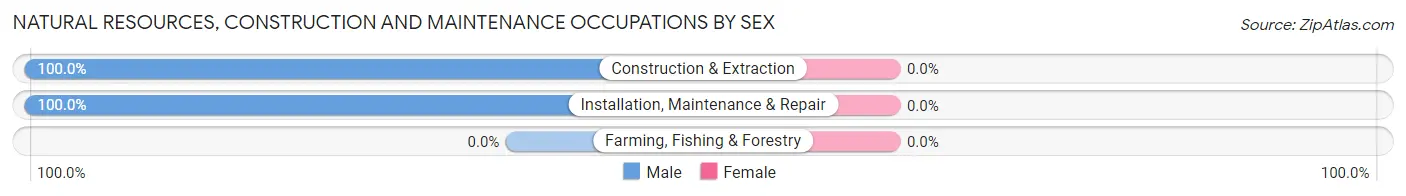
| Occupation | Male | Female |
| Farming, Fishing & Forestry | 0 (0.0%) | 0 (0.0%) |
| Construction & Extraction | 23 (100.0%) | 0 (0.0%) |
| Installation, Maintenance & Repair | 25 (100.0%) | 0 (0.0%) |
| Total (Category) | 48 (100.0%) | 0 (0.0%) |
| Total (Overall) | 156 (53.2%) | 137 (46.8%) |
Production, Transportation and Moving Occupations
The most common Production, Transportation and Moving occupations in New Site are Production (55 | 18.8%), Transportation (9 | 3.1%), and Material Moving (3 | 1.0%).
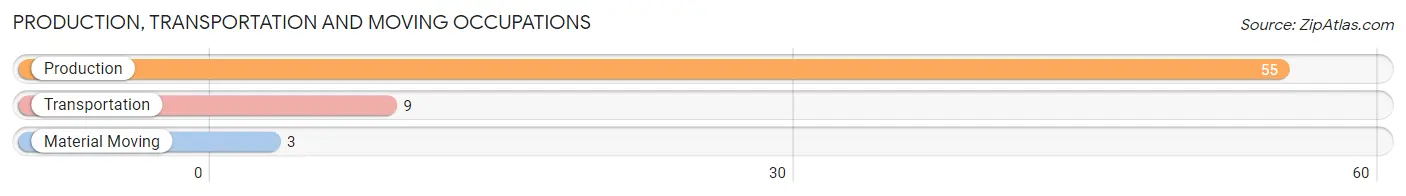
Production, Transportation and Moving Occupations by Sex
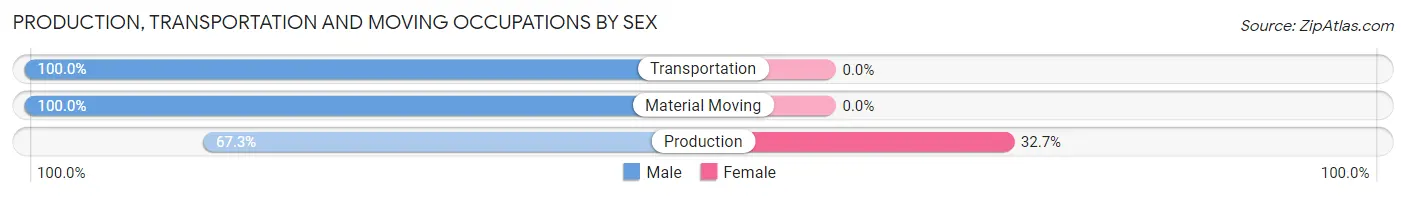
| Occupation | Male | Female |
| Production | 37 (67.3%) | 18 (32.7%) |
| Transportation | 9 (100.0%) | 0 (0.0%) |
| Material Moving | 3 (100.0%) | 0 (0.0%) |
| Total (Category) | 49 (73.1%) | 18 (26.9%) |
| Total (Overall) | 156 (53.2%) | 137 (46.8%) |
Employment Industries by Sex in New Site
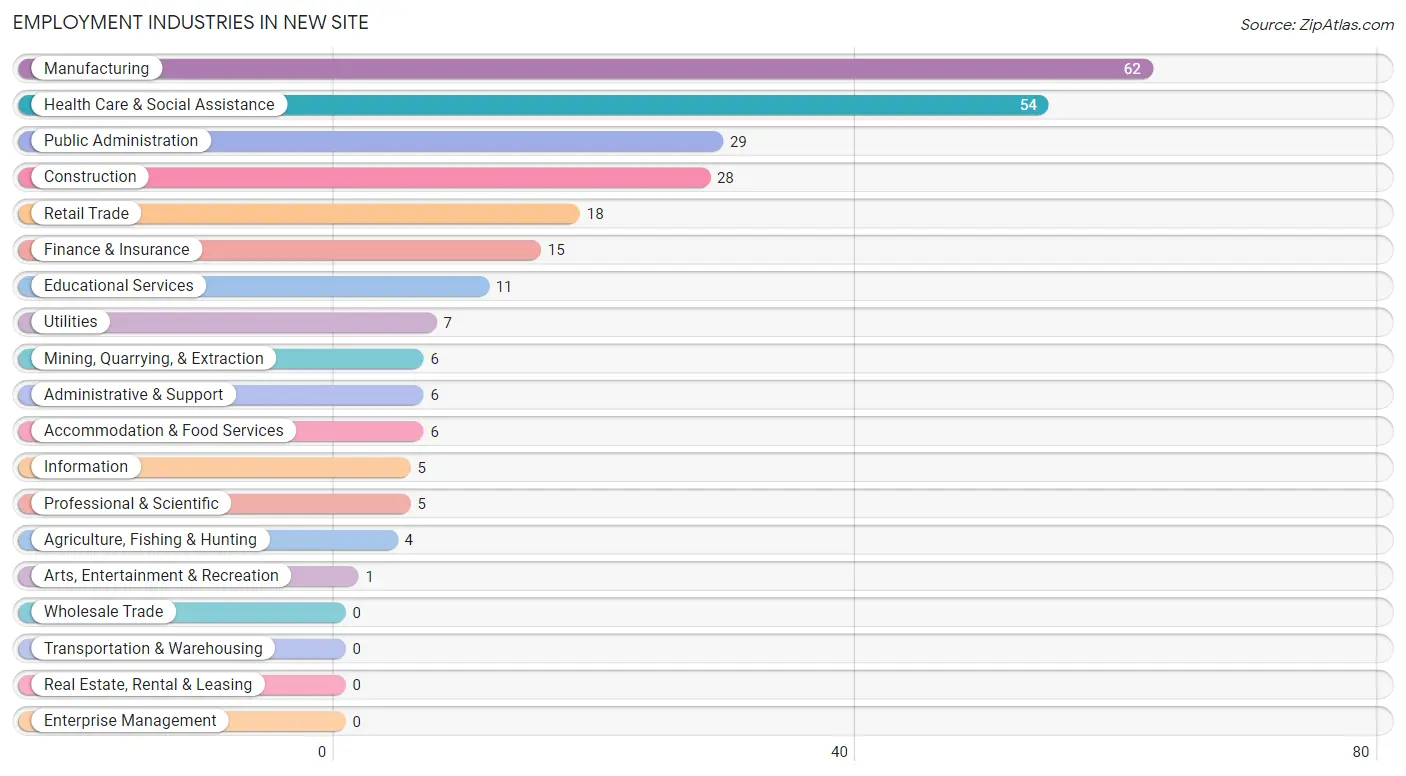
Employment Industries in New Site
The major employment industries in New Site include Manufacturing (62 | 21.2%), Health Care & Social Assistance (54 | 18.4%), Public Administration (29 | 9.9%), Construction (28 | 9.6%), and Retail Trade (18 | 6.1%).
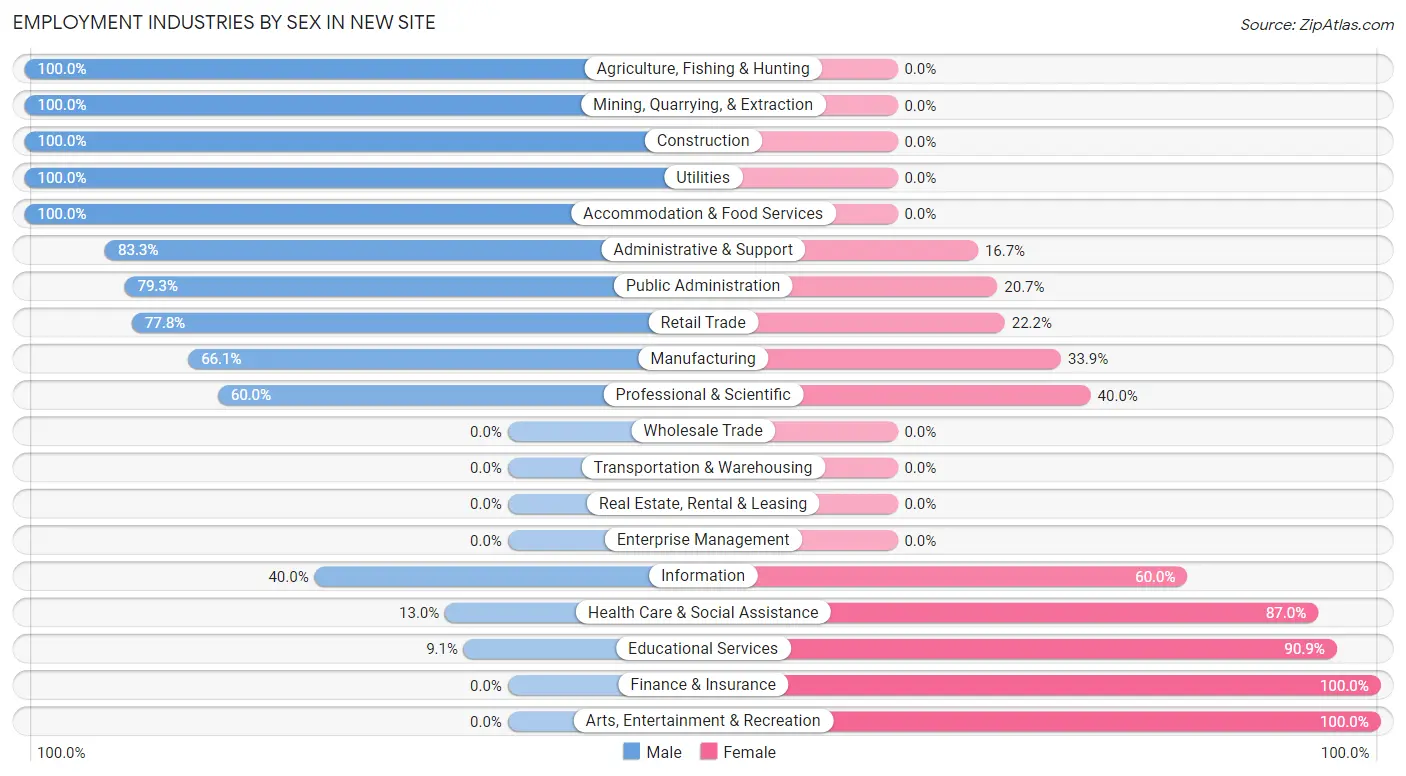
Employment Industries by Sex in New Site
The New Site industries that see more men than women are Agriculture, Fishing & Hunting (100.0%), Mining, Quarrying, & Extraction (100.0%), and Construction (100.0%), whereas the industries that tend to have a higher number of women are Finance & Insurance (100.0%), Arts, Entertainment & Recreation (100.0%), and Educational Services (90.9%).
| Industry | Male | Female |
| Agriculture, Fishing & Hunting | 4 (100.0%) | 0 (0.0%) |
| Mining, Quarrying, & Extraction | 6 (100.0%) | 0 (0.0%) |
| Construction | 28 (100.0%) | 0 (0.0%) |
| Manufacturing | 41 (66.1%) | 21 (33.9%) |
| Wholesale Trade | 0 (0.0%) | 0 (0.0%) |
| Retail Trade | 14 (77.8%) | 4 (22.2%) |
| Transportation & Warehousing | 0 (0.0%) | 0 (0.0%) |
| Utilities | 7 (100.0%) | 0 (0.0%) |
| Information | 2 (40.0%) | 3 (60.0%) |
| Finance & Insurance | 0 (0.0%) | 15 (100.0%) |
| Real Estate, Rental & Leasing | 0 (0.0%) | 0 (0.0%) |
| Professional & Scientific | 3 (60.0%) | 2 (40.0%) |
| Enterprise Management | 0 (0.0%) | 0 (0.0%) |
| Administrative & Support | 5 (83.3%) | 1 (16.7%) |
| Educational Services | 1 (9.1%) | 10 (90.9%) |
| Health Care & Social Assistance | 7 (13.0%) | 47 (87.0%) |
| Arts, Entertainment & Recreation | 0 (0.0%) | 1 (100.0%) |
| Accommodation & Food Services | 6 (100.0%) | 0 (0.0%) |
| Public Administration | 23 (79.3%) | 6 (20.7%) |
| Total | 156 (53.2%) | 137 (46.8%) |
Education in New Site
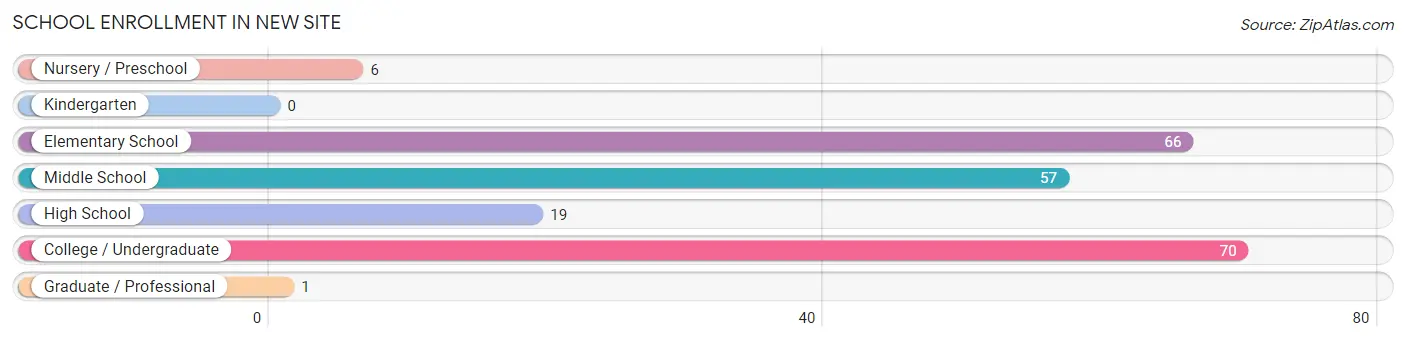
School Enrollment in New Site
The most common levels of schooling among the 219 students in New Site are college / undergraduate (70 | 32.0%), elementary school (66 | 30.1%), and middle school (57 | 26.0%).
| School Level | # Students | % Students |
| Nursery / Preschool | 6 | 2.7% |
| Kindergarten | 0 | 0.0% |
| Elementary School | 66 | 30.1% |
| Middle School | 57 | 26.0% |
| High School | 19 | 8.7% |
| College / Undergraduate | 70 | 32.0% |
| Graduate / Professional | 1 | 0.5% |
| Total | 219 | 100.0% |
School Enrollment by Age by Funding Source in New Site
Out of a total of 219 students who are enrolled in schools in New Site, 36 (16.4%) attend a private institution, while the remaining 183 (83.6%) are enrolled in public schools. The age group of 5 to 9 year old has the highest likelihood of being enrolled in private schools, with 16 (31.4% in the age bracket) enrolled. Conversely, the age group of 15 to 17 year olds has the lowest likelihood of being enrolled in a private school, with 16 (100.0% in the age bracket) attending a public institution.
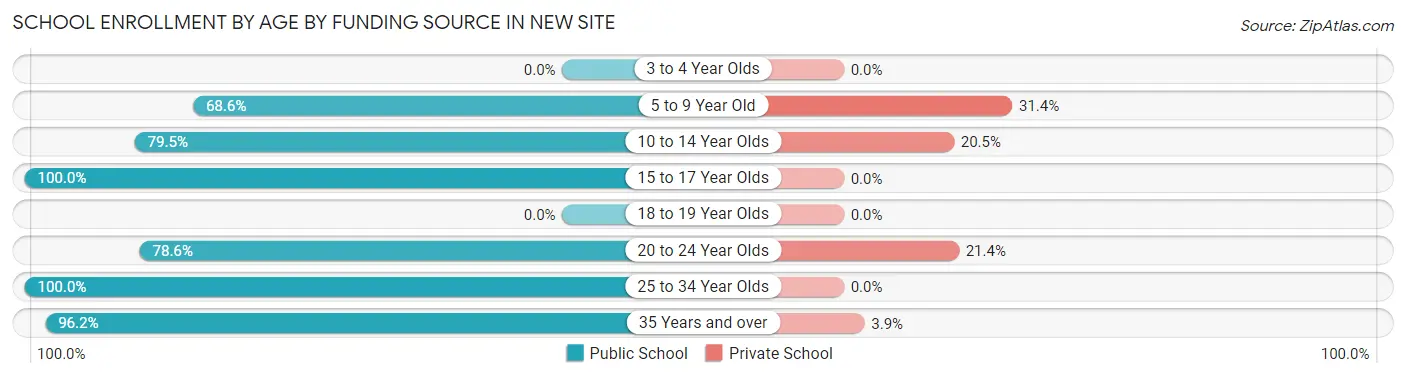
| Age Bracket | Public School | Private School |
| 3 to 4 Year Olds | 0 (0.0%) | 0 (0.0%) |
| 5 to 9 Year Old | 35 (68.6%) | 16 (31.4%) |
| 10 to 14 Year Olds | 62 (79.5%) | 16 (20.5%) |
| 15 to 17 Year Olds | 16 (100.0%) | 0 (0.0%) |
| 18 to 19 Year Olds | 0 (0.0%) | 0 (0.0%) |
| 20 to 24 Year Olds | 11 (78.6%) | 3 (21.4%) |
| 25 to 34 Year Olds | 34 (100.0%) | 0 (0.0%) |
| 35 Years and over | 25 (96.2%) | 1 (3.8%) |
| Total | 183 (83.6%) | 36 (16.4%) |
Educational Attainment by Field of Study in New Site
Education (58 | 69.9%), science & technology (10 | 12.0%), arts & humanities (9 | 10.8%), computers & mathematics (3 | 3.6%), and business (3 | 3.6%) are the most common fields of study among 83 individuals in New Site who have obtained a bachelor's degree or higher.
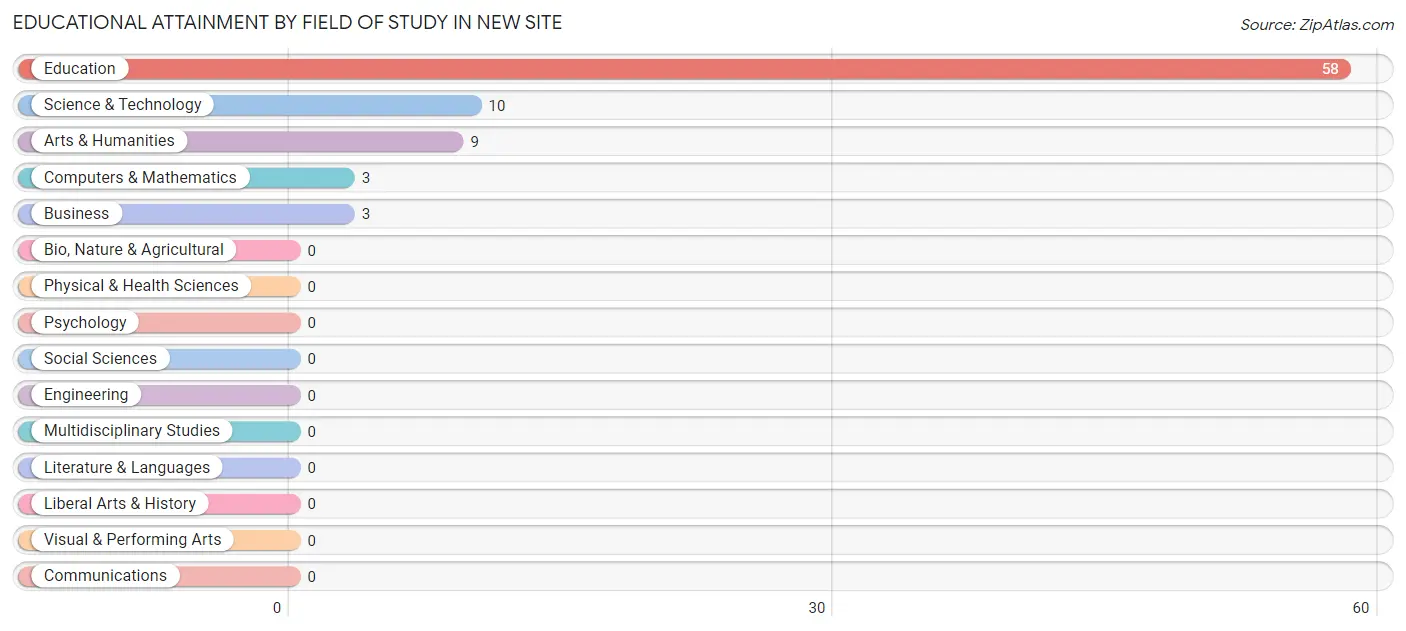
| Field of Study | # Graduates | % Graduates |
| Computers & Mathematics | 3 | 3.6% |
| Bio, Nature & Agricultural | 0 | 0.0% |
| Physical & Health Sciences | 0 | 0.0% |
| Psychology | 0 | 0.0% |
| Social Sciences | 0 | 0.0% |
| Engineering | 0 | 0.0% |
| Multidisciplinary Studies | 0 | 0.0% |
| Science & Technology | 10 | 12.0% |
| Business | 3 | 3.6% |
| Education | 58 | 69.9% |
| Literature & Languages | 0 | 0.0% |
| Liberal Arts & History | 0 | 0.0% |
| Visual & Performing Arts | 0 | 0.0% |
| Communications | 0 | 0.0% |
| Arts & Humanities | 9 | 10.8% |
| Total | 83 | 100.0% |
Transportation & Commute in New Site
Vehicle Availability by Sex in New Site
The most prevalent vehicle ownership categories in New Site are males with 2 vehicles (66, accounting for 42.3%) and females with 2 vehicles (37, making up 51.6%).
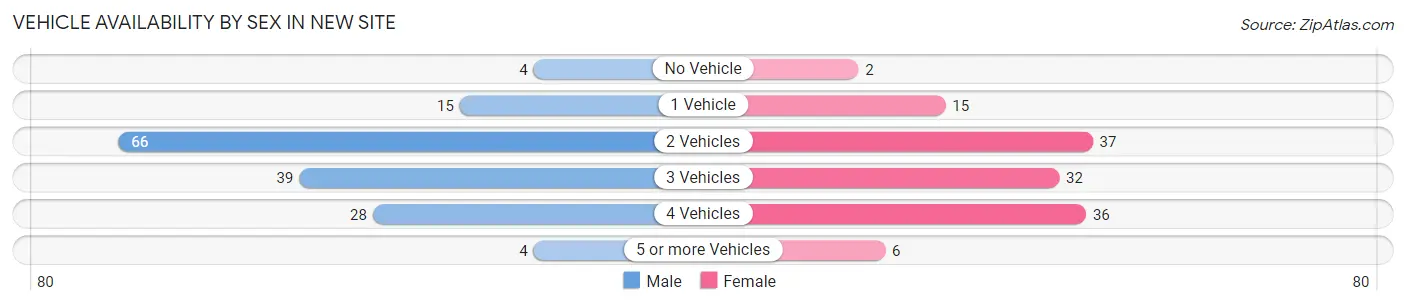
| Vehicles Available | Male | Female |
| No Vehicle | 4 (2.6%) | 2 (1.6%) |
| 1 Vehicle | 15 (9.6%) | 15 (11.7%) |
| 2 Vehicles | 66 (42.3%) | 37 (28.9%) |
| 3 Vehicles | 39 (25.0%) | 32 (25.0%) |
| 4 Vehicles | 28 (17.9%) | 36 (28.1%) |
| 5 or more Vehicles | 4 (2.6%) | 6 (4.7%) |
| Total | 156 (100.0%) | 128 (100.0%) |
Commute Time in New Site
The most frequently occuring commute durations in New Site are 20 to 24 minutes (74 commuters, 26.6%), 45 to 59 minutes (42 commuters, 15.1%), and 15 to 19 minutes (39 commuters, 14.0%).
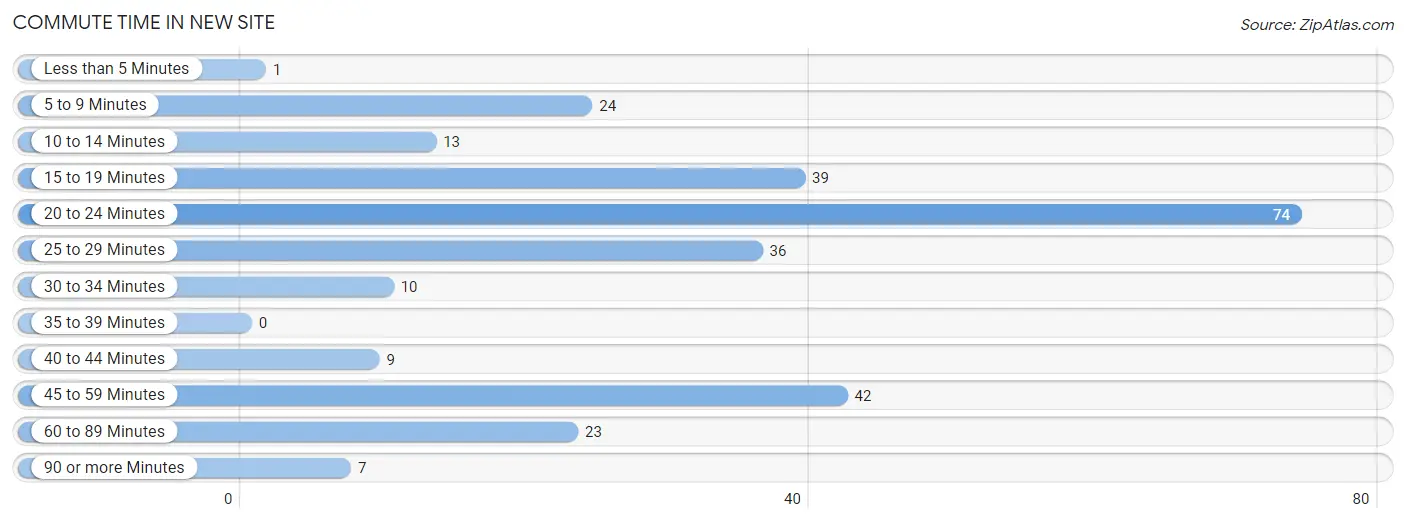
| Commute Time | # Commuters | % Commuters |
| Less than 5 Minutes | 1 | 0.4% |
| 5 to 9 Minutes | 24 | 8.6% |
| 10 to 14 Minutes | 13 | 4.7% |
| 15 to 19 Minutes | 39 | 14.0% |
| 20 to 24 Minutes | 74 | 26.6% |
| 25 to 29 Minutes | 36 | 13.0% |
| 30 to 34 Minutes | 10 | 3.6% |
| 35 to 39 Minutes | 0 | 0.0% |
| 40 to 44 Minutes | 9 | 3.2% |
| 45 to 59 Minutes | 42 | 15.1% |
| 60 to 89 Minutes | 23 | 8.3% |
| 90 or more Minutes | 7 | 2.5% |
Commute Time by Sex in New Site
The most common commute times in New Site are 20 to 24 minutes (36 commuters, 23.1%) for males and 20 to 24 minutes (38 commuters, 31.1%) for females.
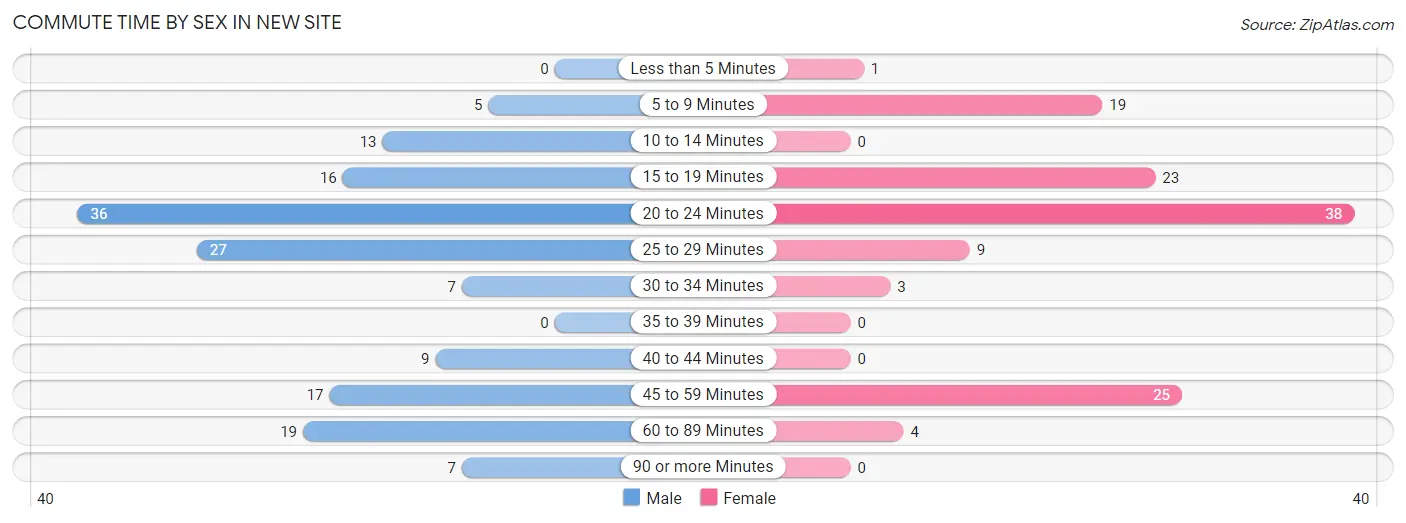
| Commute Time | Male | Female |
| Less than 5 Minutes | 0 (0.0%) | 1 (0.8%) |
| 5 to 9 Minutes | 5 (3.2%) | 19 (15.6%) |
| 10 to 14 Minutes | 13 (8.3%) | 0 (0.0%) |
| 15 to 19 Minutes | 16 (10.3%) | 23 (18.9%) |
| 20 to 24 Minutes | 36 (23.1%) | 38 (31.1%) |
| 25 to 29 Minutes | 27 (17.3%) | 9 (7.4%) |
| 30 to 34 Minutes | 7 (4.5%) | 3 (2.5%) |
| 35 to 39 Minutes | 0 (0.0%) | 0 (0.0%) |
| 40 to 44 Minutes | 9 (5.8%) | 0 (0.0%) |
| 45 to 59 Minutes | 17 (10.9%) | 25 (20.5%) |
| 60 to 89 Minutes | 19 (12.2%) | 4 (3.3%) |
| 90 or more Minutes | 7 (4.5%) | 0 (0.0%) |
Time of Departure to Work by Sex in New Site
The most frequent times of departure to work in New Site are 5:30 AM to 5:59 AM (37, 23.7%) for males and 7:00 AM to 7:29 AM (27, 22.1%) for females.
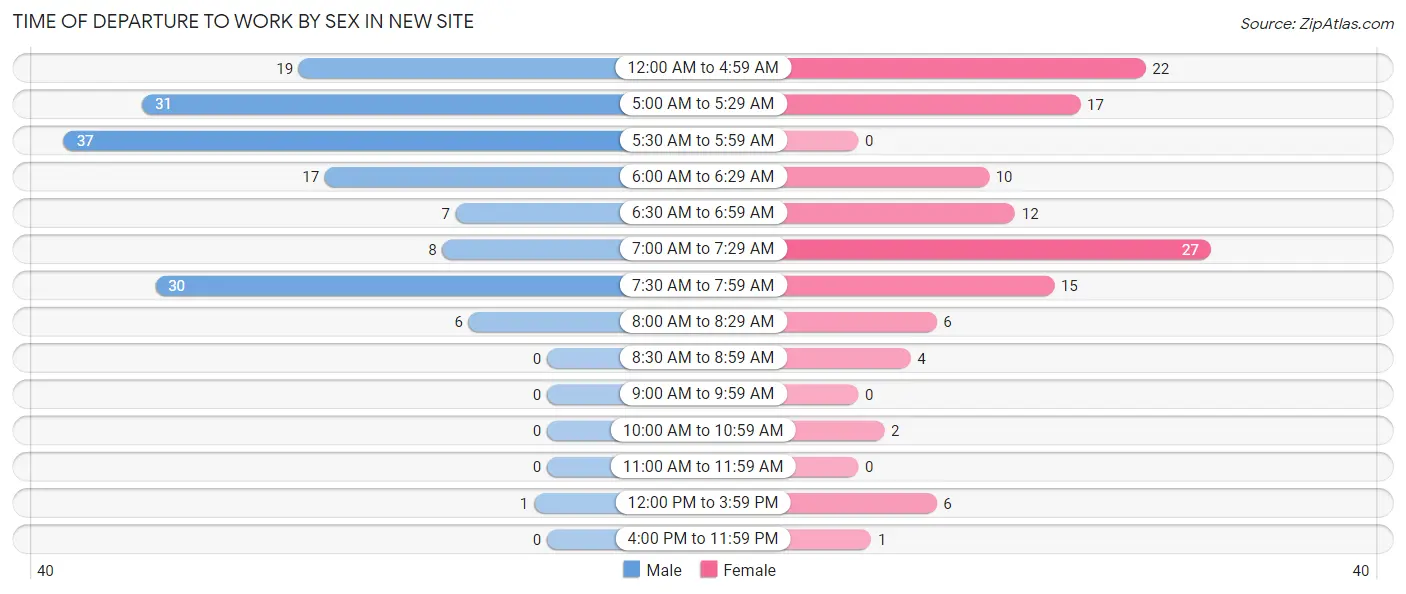
| Time of Departure | Male | Female |
| 12:00 AM to 4:59 AM | 19 (12.2%) | 22 (18.0%) |
| 5:00 AM to 5:29 AM | 31 (19.9%) | 17 (13.9%) |
| 5:30 AM to 5:59 AM | 37 (23.7%) | 0 (0.0%) |
| 6:00 AM to 6:29 AM | 17 (10.9%) | 10 (8.2%) |
| 6:30 AM to 6:59 AM | 7 (4.5%) | 12 (9.8%) |
| 7:00 AM to 7:29 AM | 8 (5.1%) | 27 (22.1%) |
| 7:30 AM to 7:59 AM | 30 (19.2%) | 15 (12.3%) |
| 8:00 AM to 8:29 AM | 6 (3.8%) | 6 (4.9%) |
| 8:30 AM to 8:59 AM | 0 (0.0%) | 4 (3.3%) |
| 9:00 AM to 9:59 AM | 0 (0.0%) | 0 (0.0%) |
| 10:00 AM to 10:59 AM | 0 (0.0%) | 2 (1.6%) |
| 11:00 AM to 11:59 AM | 0 (0.0%) | 0 (0.0%) |
| 12:00 PM to 3:59 PM | 1 (0.6%) | 6 (4.9%) |
| 4:00 PM to 11:59 PM | 0 (0.0%) | 1 (0.8%) |
| Total | 156 (100.0%) | 122 (100.0%) |
Housing Occupancy in New Site
Occupancy by Ownership in New Site
Of the total 318 dwellings in New Site, owner-occupied units account for 271 (85.2%), while renter-occupied units make up 47 (14.8%).
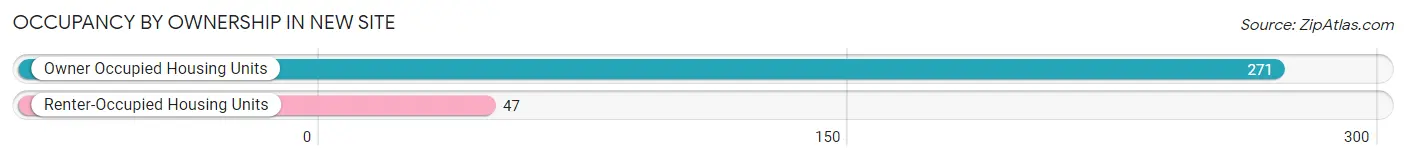
| Occupancy | # Housing Units | % Housing Units |
| Owner Occupied Housing Units | 271 | 85.2% |
| Renter-Occupied Housing Units | 47 | 14.8% |
| Total Occupied Housing Units | 318 | 100.0% |
Occupancy by Household Size in New Site
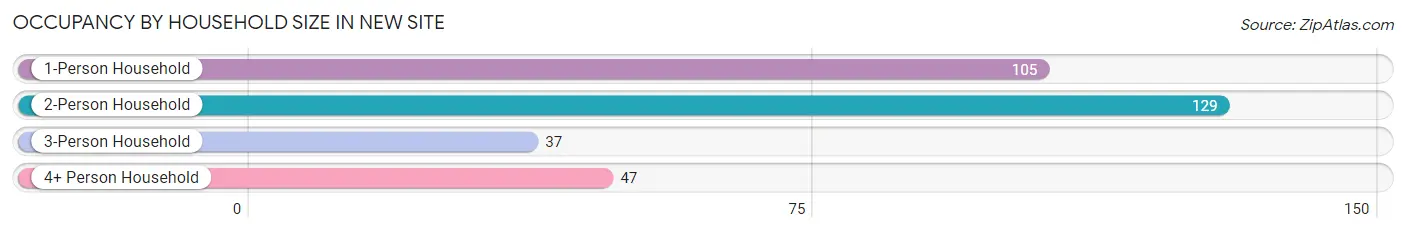
| Household Size | # Housing Units | % Housing Units |
| 1-Person Household | 105 | 33.0% |
| 2-Person Household | 129 | 40.6% |
| 3-Person Household | 37 | 11.6% |
| 4+ Person Household | 47 | 14.8% |
| Total Housing Units | 318 | 100.0% |
Occupancy by Ownership by Household Size in New Site
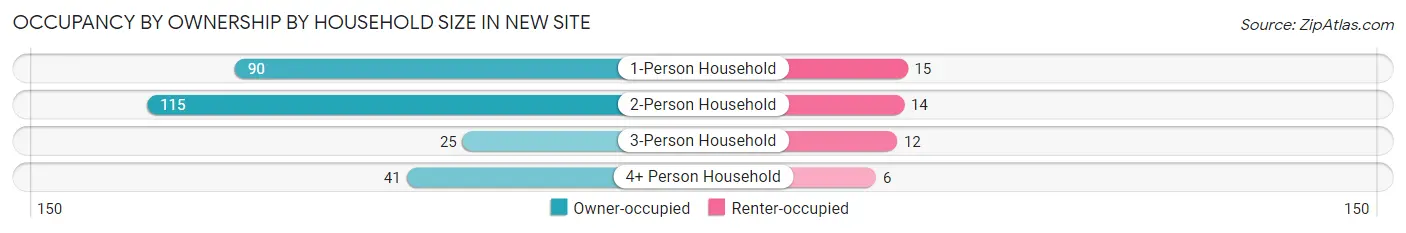
| Household Size | Owner-occupied | Renter-occupied |
| 1-Person Household | 90 (85.7%) | 15 (14.3%) |
| 2-Person Household | 115 (89.1%) | 14 (10.8%) |
| 3-Person Household | 25 (67.6%) | 12 (32.4%) |
| 4+ Person Household | 41 (87.2%) | 6 (12.8%) |
| Total Housing Units | 271 (85.2%) | 47 (14.8%) |
Occupancy by Educational Attainment in New Site
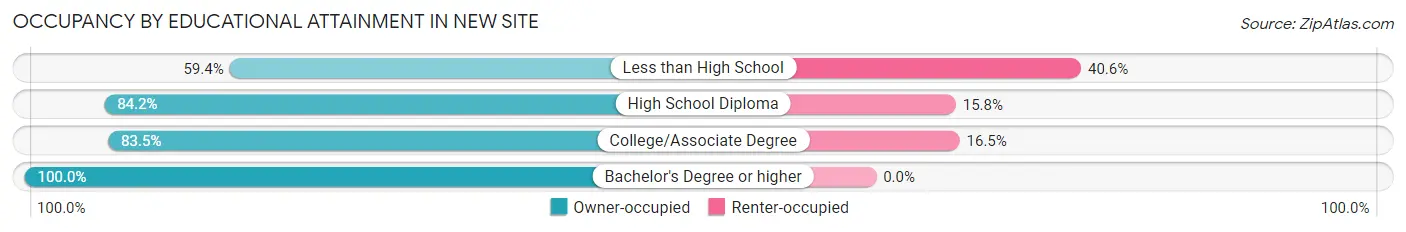
| Household Size | Owner-occupied | Renter-occupied |
| Less than High School | 19 (59.4%) | 13 (40.6%) |
| High School Diploma | 64 (84.2%) | 12 (15.8%) |
| College/Associate Degree | 111 (83.5%) | 22 (16.5%) |
| Bachelor's Degree or higher | 77 (100.0%) | 0 (0.0%) |
Occupancy by Age of Householder in New Site
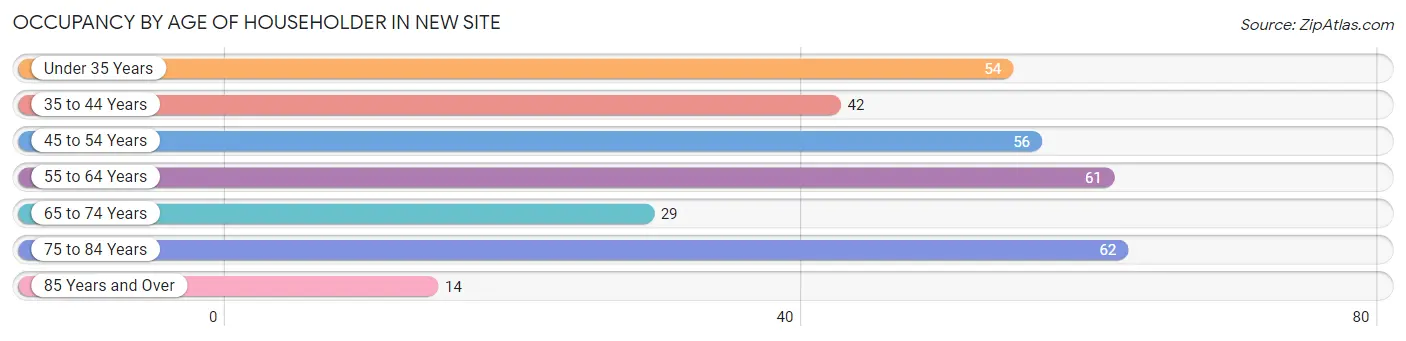
| Age Bracket | # Households | % Households |
| Under 35 Years | 54 | 17.0% |
| 35 to 44 Years | 42 | 13.2% |
| 45 to 54 Years | 56 | 17.6% |
| 55 to 64 Years | 61 | 19.2% |
| 65 to 74 Years | 29 | 9.1% |
| 75 to 84 Years | 62 | 19.5% |
| 85 Years and Over | 14 | 4.4% |
| Total | 318 | 100.0% |
Housing Finances in New Site
Median Income by Occupancy in New Site
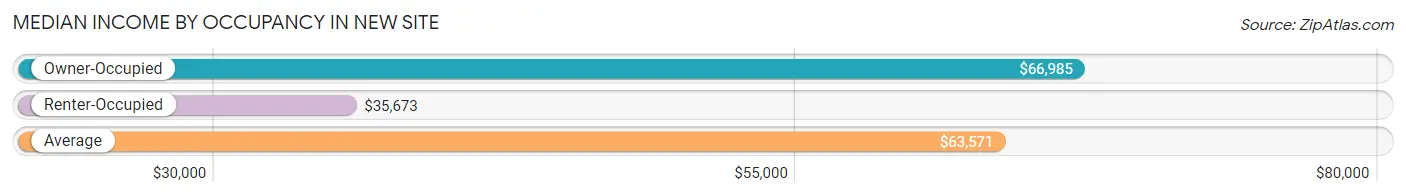
| Occupancy Type | # Households | Median Income |
| Owner-Occupied | 271 (85.2%) | $66,985 |
| Renter-Occupied | 47 (14.8%) | $35,673 |
| Average | 318 (100.0%) | $63,571 |
Occupancy by Householder Income Bracket in New Site
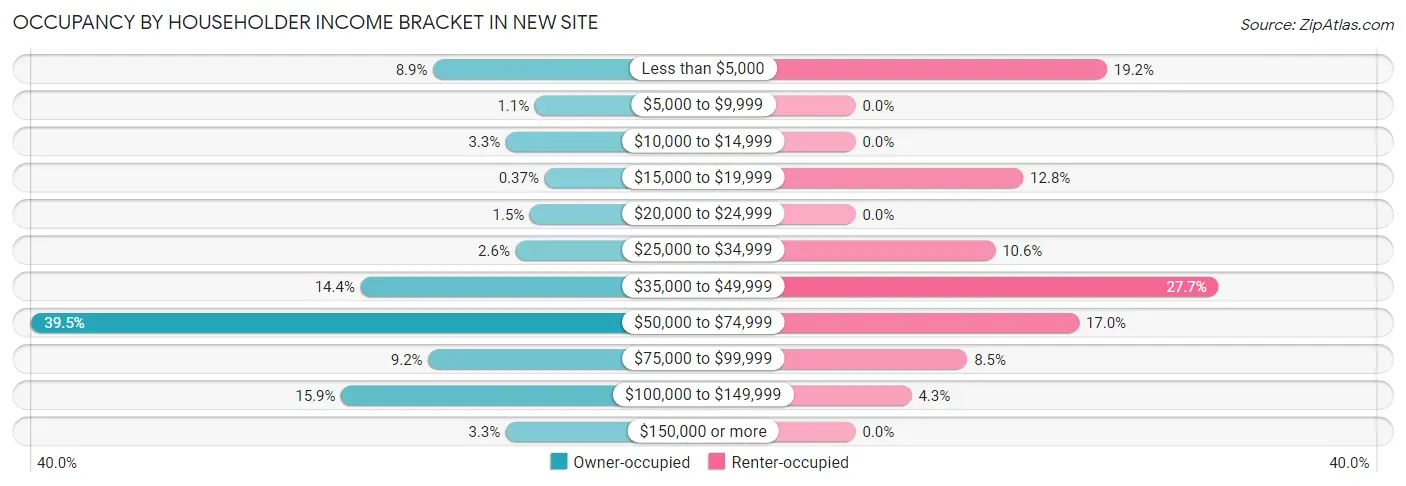
| Income Bracket | Owner-occupied | Renter-occupied |
| Less than $5,000 | 24 (8.9%) | 9 (19.2%) |
| $5,000 to $9,999 | 3 (1.1%) | 0 (0.0%) |
| $10,000 to $14,999 | 9 (3.3%) | 0 (0.0%) |
| $15,000 to $19,999 | 1 (0.4%) | 6 (12.8%) |
| $20,000 to $24,999 | 4 (1.5%) | 0 (0.0%) |
| $25,000 to $34,999 | 7 (2.6%) | 5 (10.6%) |
| $35,000 to $49,999 | 39 (14.4%) | 13 (27.7%) |
| $50,000 to $74,999 | 107 (39.5%) | 8 (17.0%) |
| $75,000 to $99,999 | 25 (9.2%) | 4 (8.5%) |
| $100,000 to $149,999 | 43 (15.9%) | 2 (4.3%) |
| $150,000 or more | 9 (3.3%) | 0 (0.0%) |
| Total | 271 (100.0%) | 47 (100.0%) |
Monthly Housing Cost Tiers in New Site
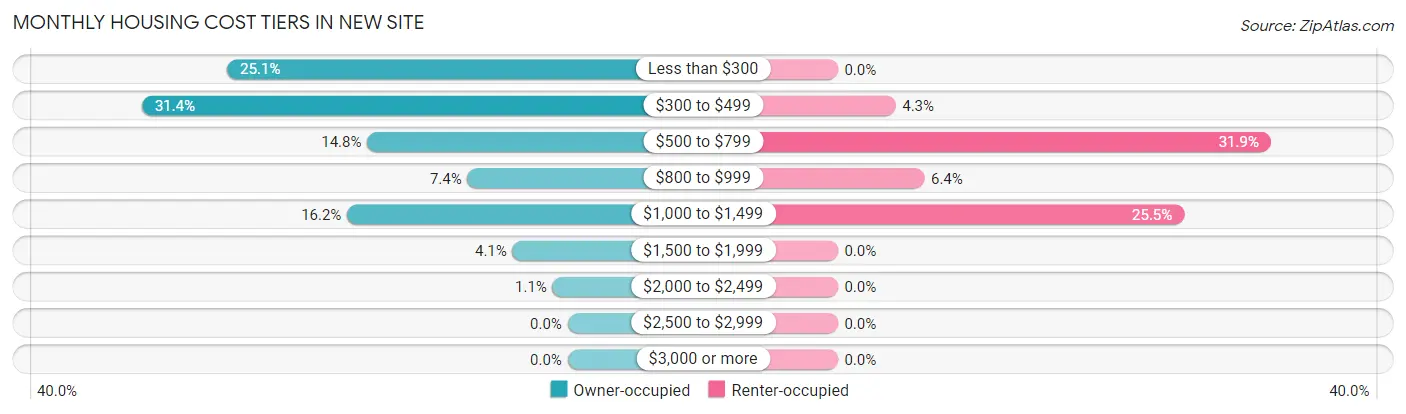
| Monthly Cost | Owner-occupied | Renter-occupied |
| Less than $300 | 68 (25.1%) | 0 (0.0%) |
| $300 to $499 | 85 (31.4%) | 2 (4.3%) |
| $500 to $799 | 40 (14.8%) | 15 (31.9%) |
| $800 to $999 | 20 (7.4%) | 3 (6.4%) |
| $1,000 to $1,499 | 44 (16.2%) | 12 (25.5%) |
| $1,500 to $1,999 | 11 (4.1%) | 0 (0.0%) |
| $2,000 to $2,499 | 3 (1.1%) | 0 (0.0%) |
| $2,500 to $2,999 | 0 (0.0%) | 0 (0.0%) |
| $3,000 or more | 0 (0.0%) | 0 (0.0%) |
| Total | 271 (100.0%) | 47 (100.0%) |
Physical Housing Characteristics in New Site
Housing Structures in New Site
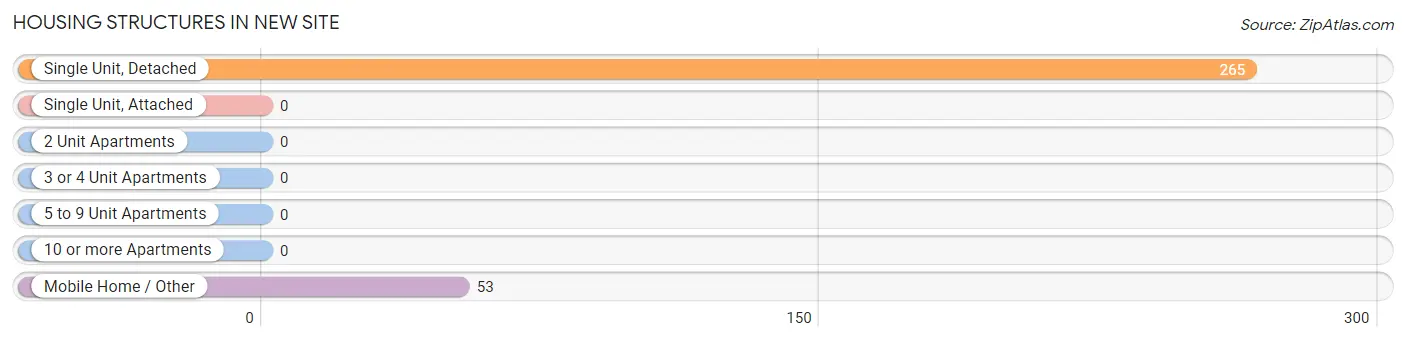
| Structure Type | # Housing Units | % Housing Units |
| Single Unit, Detached | 265 | 83.3% |
| Single Unit, Attached | 0 | 0.0% |
| 2 Unit Apartments | 0 | 0.0% |
| 3 or 4 Unit Apartments | 0 | 0.0% |
| 5 to 9 Unit Apartments | 0 | 0.0% |
| 10 or more Apartments | 0 | 0.0% |
| Mobile Home / Other | 53 | 16.7% |
| Total | 318 | 100.0% |
Housing Structures by Occupancy in New Site
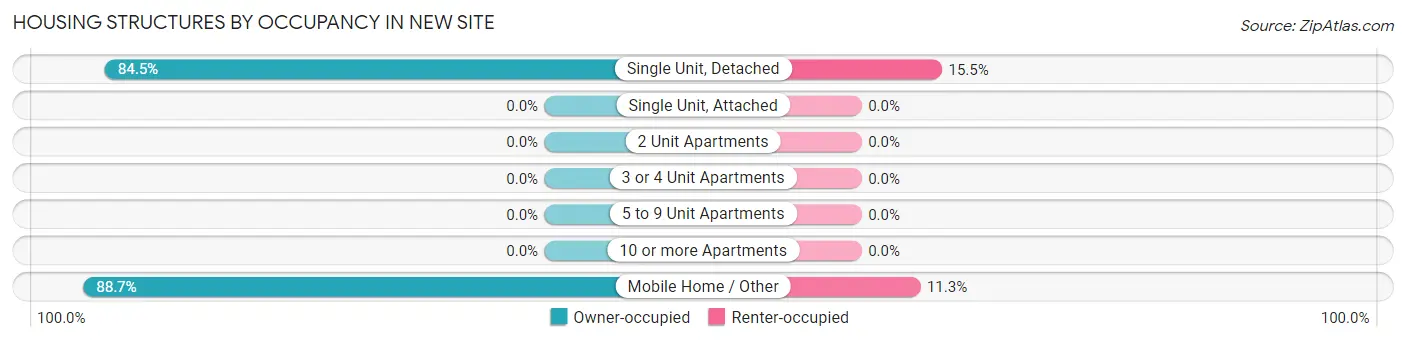
| Structure Type | Owner-occupied | Renter-occupied |
| Single Unit, Detached | 224 (84.5%) | 41 (15.5%) |
| Single Unit, Attached | 0 (0.0%) | 0 (0.0%) |
| 2 Unit Apartments | 0 (0.0%) | 0 (0.0%) |
| 3 or 4 Unit Apartments | 0 (0.0%) | 0 (0.0%) |
| 5 to 9 Unit Apartments | 0 (0.0%) | 0 (0.0%) |
| 10 or more Apartments | 0 (0.0%) | 0 (0.0%) |
| Mobile Home / Other | 47 (88.7%) | 6 (11.3%) |
| Total | 271 (85.2%) | 47 (14.8%) |
Housing Structures by Number of Rooms in New Site
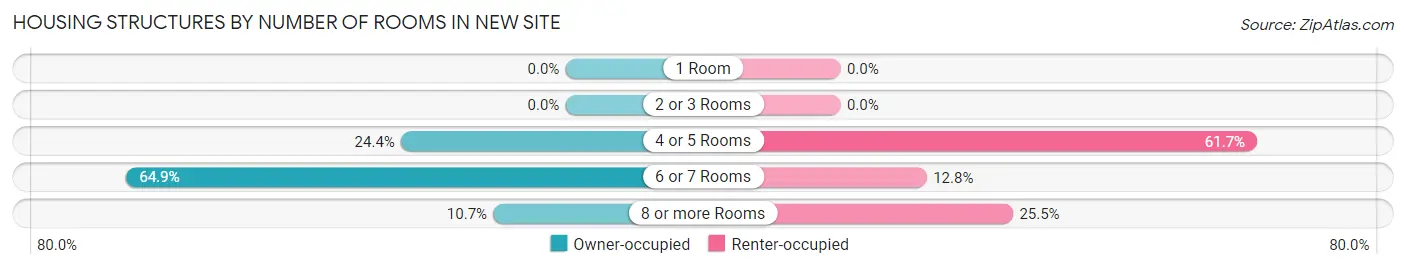
| Number of Rooms | Owner-occupied | Renter-occupied |
| 1 Room | 0 (0.0%) | 0 (0.0%) |
| 2 or 3 Rooms | 0 (0.0%) | 0 (0.0%) |
| 4 or 5 Rooms | 66 (24.3%) | 29 (61.7%) |
| 6 or 7 Rooms | 176 (64.9%) | 6 (12.8%) |
| 8 or more Rooms | 29 (10.7%) | 12 (25.5%) |
| Total | 271 (100.0%) | 47 (100.0%) |
Housing Structure by Heating Type in New Site
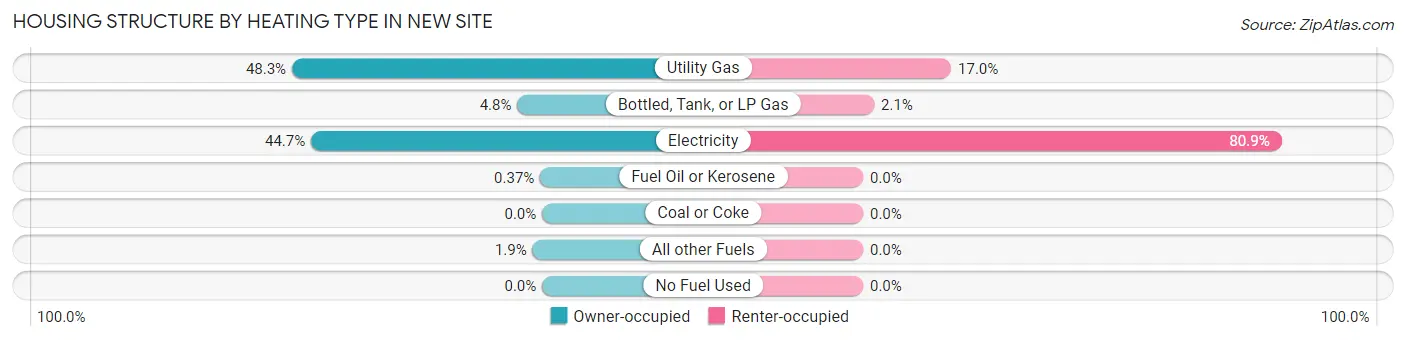
| Heating Type | Owner-occupied | Renter-occupied |
| Utility Gas | 131 (48.3%) | 8 (17.0%) |
| Bottled, Tank, or LP Gas | 13 (4.8%) | 1 (2.1%) |
| Electricity | 121 (44.7%) | 38 (80.8%) |
| Fuel Oil or Kerosene | 1 (0.4%) | 0 (0.0%) |
| Coal or Coke | 0 (0.0%) | 0 (0.0%) |
| All other Fuels | 5 (1.8%) | 0 (0.0%) |
| No Fuel Used | 0 (0.0%) | 0 (0.0%) |
| Total | 271 (100.0%) | 47 (100.0%) |
Household Vehicle Usage in New Site
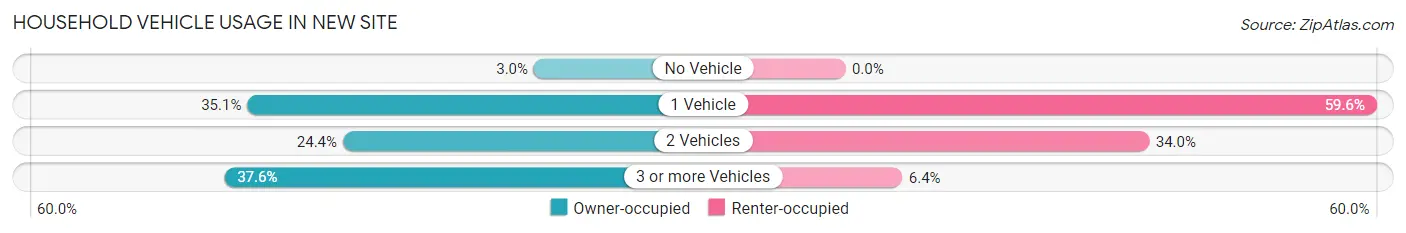
| Vehicles per Household | Owner-occupied | Renter-occupied |
| No Vehicle | 8 (2.9%) | 0 (0.0%) |
| 1 Vehicle | 95 (35.1%) | 28 (59.6%) |
| 2 Vehicles | 66 (24.3%) | 16 (34.0%) |
| 3 or more Vehicles | 102 (37.6%) | 3 (6.4%) |
| Total | 271 (100.0%) | 47 (100.0%) |
Real Estate & Mortgages in New Site
Real Estate and Mortgage Overview in New Site
| Characteristic | Without Mortgage | With Mortgage |
| Housing Units | 174 | 97 |
| Median Property Value | $163,200 | $144,900 |
| Median Household Income | $63,214 | $4 |
| Monthly Housing Costs | $315 | $0 |
| Real Estate Taxes | $618 | $4 |
Property Value by Mortgage Status in New Site
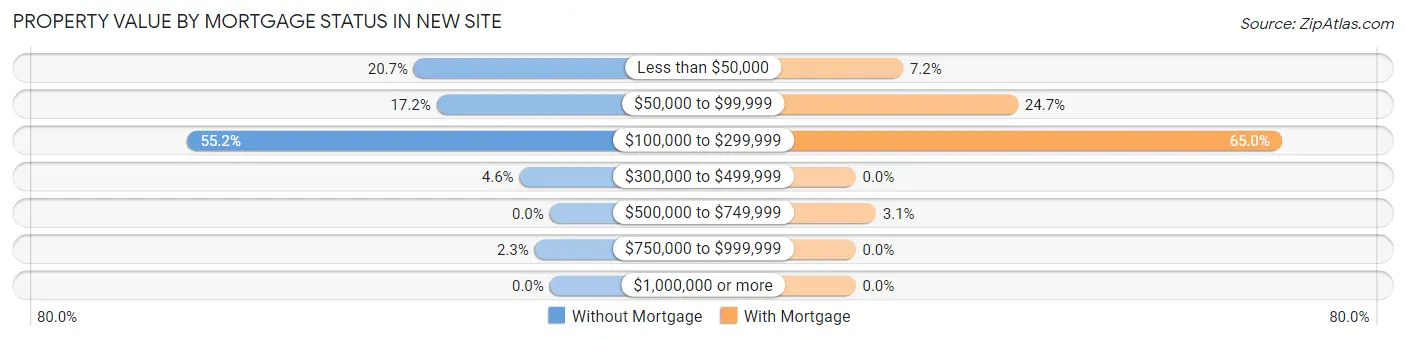
| Property Value | Without Mortgage | With Mortgage |
| Less than $50,000 | 36 (20.7%) | 7 (7.2%) |
| $50,000 to $99,999 | 30 (17.2%) | 24 (24.7%) |
| $100,000 to $299,999 | 96 (55.2%) | 63 (64.9%) |
| $300,000 to $499,999 | 8 (4.6%) | 0 (0.0%) |
| $500,000 to $749,999 | 0 (0.0%) | 3 (3.1%) |
| $750,000 to $999,999 | 4 (2.3%) | 0 (0.0%) |
| $1,000,000 or more | 0 (0.0%) | 0 (0.0%) |
| Total | 174 (100.0%) | 97 (100.0%) |
Household Income by Mortgage Status in New Site
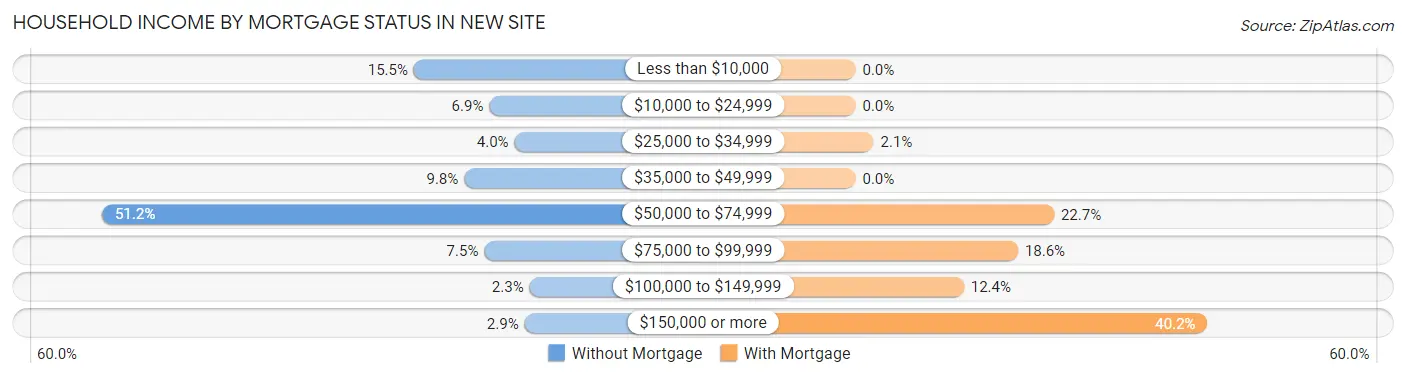
| Household Income | Without Mortgage | With Mortgage |
| Less than $10,000 | 27 (15.5%) | 0 (0.0%) |
| $10,000 to $24,999 | 12 (6.9%) | 0 (0.0%) |
| $25,000 to $34,999 | 7 (4.0%) | 2 (2.1%) |
| $35,000 to $49,999 | 17 (9.8%) | 0 (0.0%) |
| $50,000 to $74,999 | 89 (51.1%) | 22 (22.7%) |
| $75,000 to $99,999 | 13 (7.5%) | 18 (18.6%) |
| $100,000 to $149,999 | 4 (2.3%) | 12 (12.4%) |
| $150,000 or more | 5 (2.9%) | 39 (40.2%) |
| Total | 174 (100.0%) | 97 (100.0%) |
Property Value to Household Income Ratio in New Site
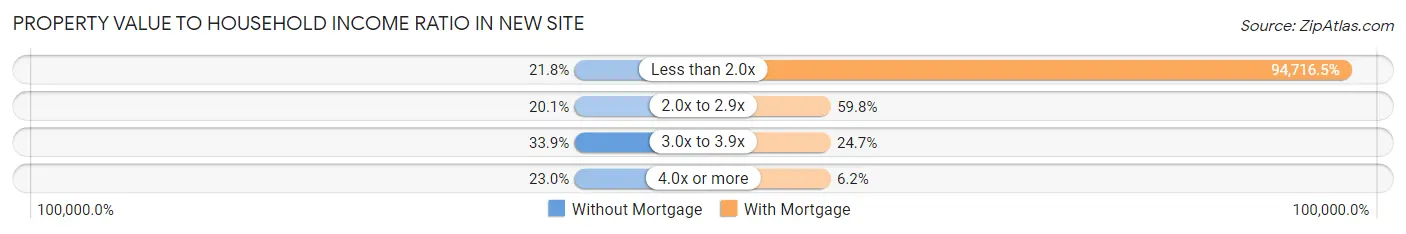
| Value-to-Income Ratio | Without Mortgage | With Mortgage |
| Less than 2.0x | 38 (21.8%) | 91,875 (94,716.5%) |
| 2.0x to 2.9x | 35 (20.1%) | 58 (59.8%) |
| 3.0x to 3.9x | 59 (33.9%) | 24 (24.7%) |
| 4.0x or more | 40 (23.0%) | 6 (6.2%) |
| Total | 174 (100.0%) | 97 (100.0%) |
Real Estate Taxes by Mortgage Status in New Site
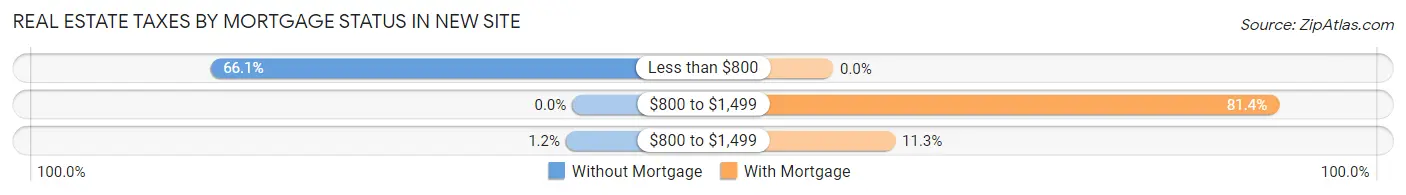
| Property Taxes | Without Mortgage | With Mortgage |
| Less than $800 | 115 (66.1%) | 0 (0.0%) |
| $800 to $1,499 | 0 (0.0%) | 79 (81.4%) |
| $800 to $1,499 | 2 (1.1%) | 11 (11.3%) |
| Total | 174 (100.0%) | 97 (100.0%) |
Health & Disability in New Site
Health Insurance Coverage by Age in New Site
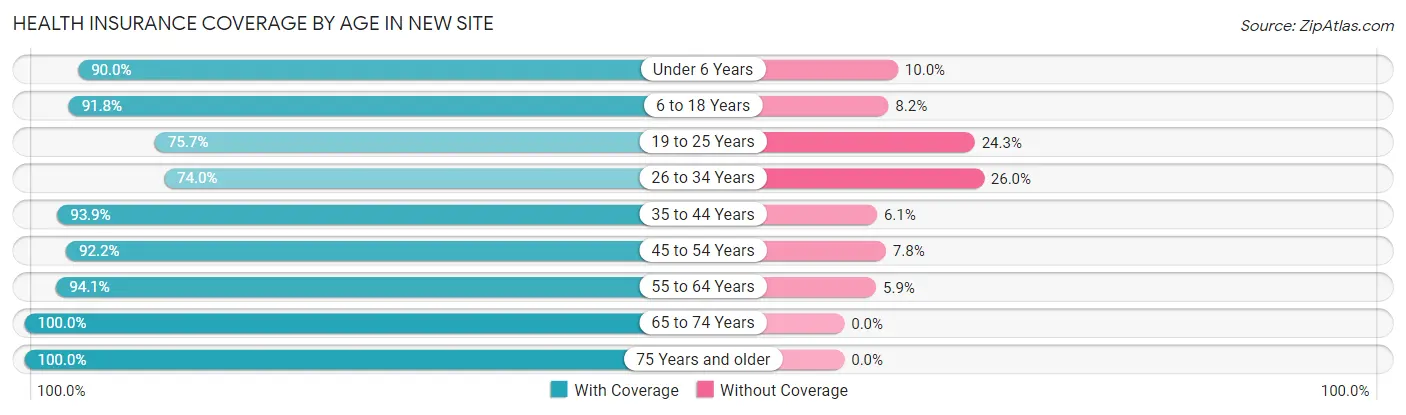
| Age Bracket | With Coverage | Without Coverage |
| Under 6 Years | 18 (90.0%) | 2 (10.0%) |
| 6 to 18 Years | 145 (91.8%) | 13 (8.2%) |
| 19 to 25 Years | 28 (75.7%) | 9 (24.3%) |
| 26 to 34 Years | 54 (74.0%) | 19 (26.0%) |
| 35 to 44 Years | 77 (93.9%) | 5 (6.1%) |
| 45 to 54 Years | 107 (92.2%) | 9 (7.8%) |
| 55 to 64 Years | 111 (94.1%) | 7 (5.9%) |
| 65 to 74 Years | 53 (100.0%) | 0 (0.0%) |
| 75 Years and older | 89 (100.0%) | 0 (0.0%) |
| Total | 682 (91.4%) | 64 (8.6%) |
Health Insurance Coverage by Citizenship Status in New Site
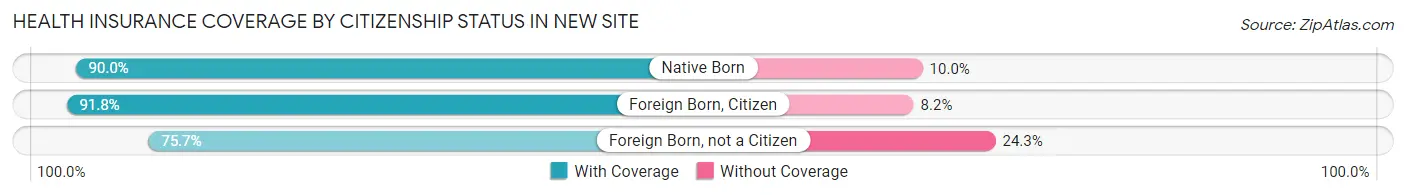
| Citizenship Status | With Coverage | Without Coverage |
| Native Born | 18 (90.0%) | 2 (10.0%) |
| Foreign Born, Citizen | 145 (91.8%) | 13 (8.2%) |
| Foreign Born, not a Citizen | 28 (75.7%) | 9 (24.3%) |
Health Insurance Coverage by Household Income in New Site
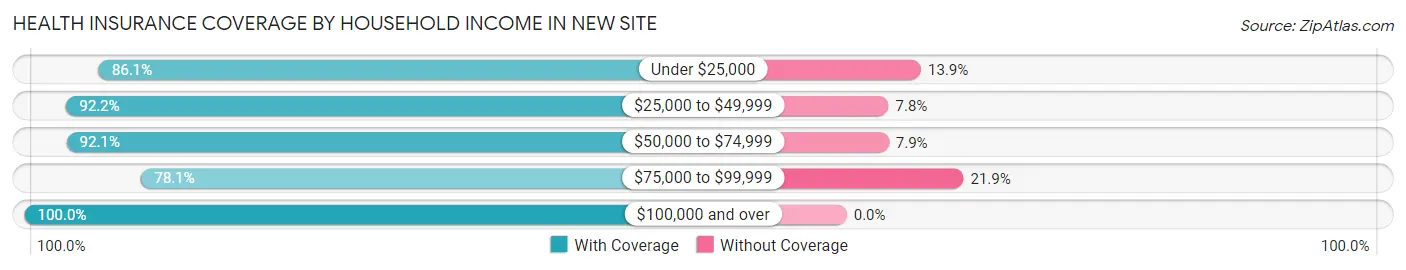
| Household Income | With Coverage | Without Coverage |
| Under $25,000 | 68 (86.1%) | 11 (13.9%) |
| $25,000 to $49,999 | 153 (92.2%) | 13 (7.8%) |
| $50,000 to $74,999 | 222 (92.1%) | 19 (7.9%) |
| $75,000 to $99,999 | 75 (78.1%) | 21 (21.9%) |
| $100,000 and over | 164 (100.0%) | 0 (0.0%) |
Public vs Private Health Insurance Coverage by Age in New Site
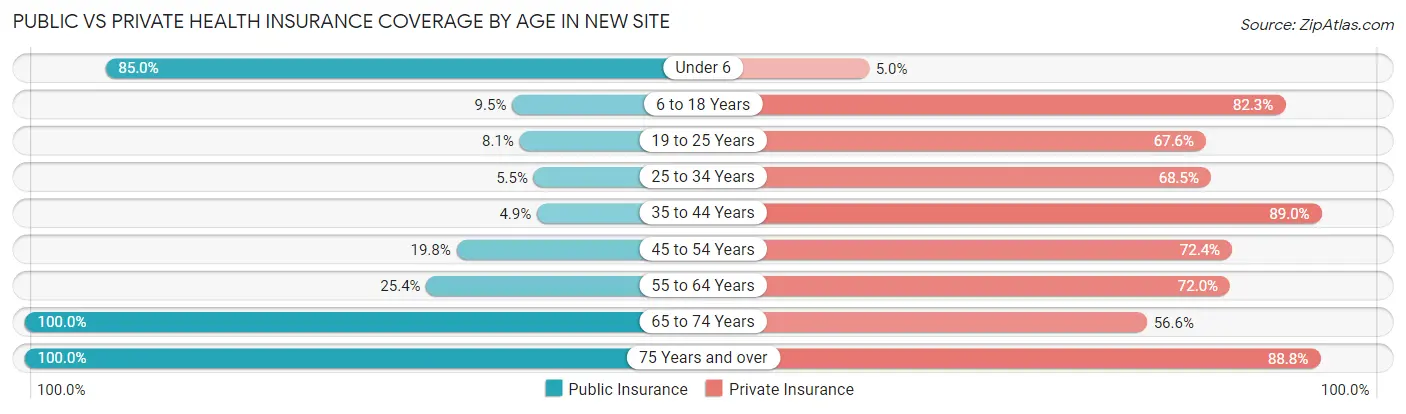
| Age Bracket | Public Insurance | Private Insurance |
| Under 6 | 17 (85.0%) | 1 (5.0%) |
| 6 to 18 Years | 15 (9.5%) | 130 (82.3%) |
| 19 to 25 Years | 3 (8.1%) | 25 (67.6%) |
| 25 to 34 Years | 4 (5.5%) | 50 (68.5%) |
| 35 to 44 Years | 4 (4.9%) | 73 (89.0%) |
| 45 to 54 Years | 23 (19.8%) | 84 (72.4%) |
| 55 to 64 Years | 30 (25.4%) | 85 (72.0%) |
| 65 to 74 Years | 53 (100.0%) | 30 (56.6%) |
| 75 Years and over | 89 (100.0%) | 79 (88.8%) |
| Total | 238 (31.9%) | 557 (74.7%) |
Disability Status by Sex by Age in New Site
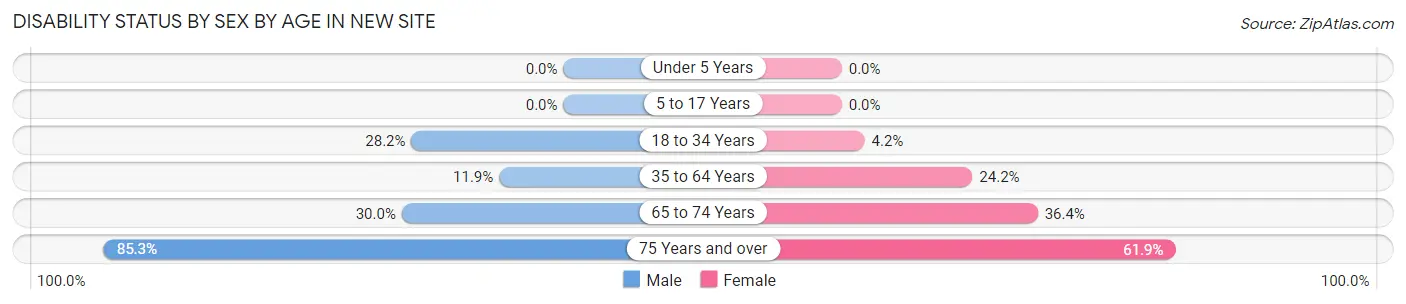
| Age Bracket | Male | Female |
| Under 5 Years | 0 (0.0%) | 0 (0.0%) |
| 5 to 17 Years | 0 (0.0%) | 0 (0.0%) |
| 18 to 34 Years | 11 (28.2%) | 3 (4.2%) |
| 35 to 64 Years | 18 (11.9%) | 40 (24.2%) |
| 65 to 74 Years | 6 (30.0%) | 12 (36.4%) |
| 75 Years and over | 58 (85.3%) | 13 (61.9%) |
Disability Class by Sex by Age in New Site
Disability Class: Hearing Difficulty
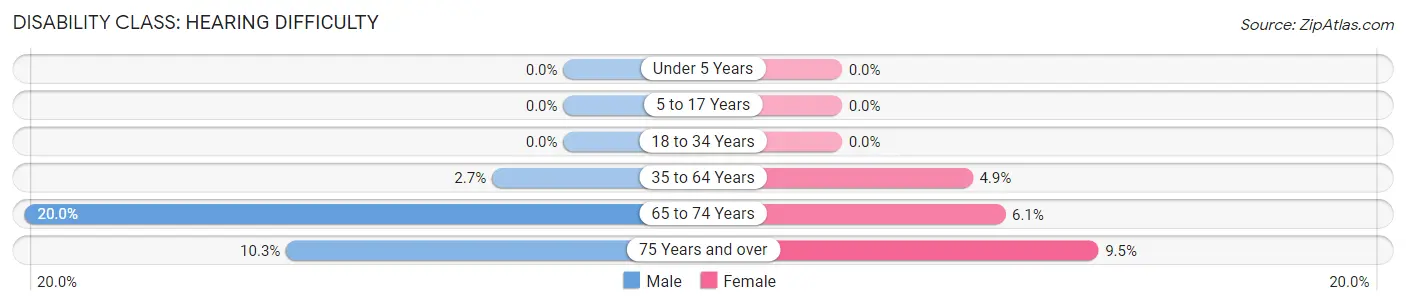
| Age Bracket | Male | Female |
| Under 5 Years | 0 (0.0%) | 0 (0.0%) |
| 5 to 17 Years | 0 (0.0%) | 0 (0.0%) |
| 18 to 34 Years | 0 (0.0%) | 0 (0.0%) |
| 35 to 64 Years | 4 (2.6%) | 8 (4.9%) |
| 65 to 74 Years | 4 (20.0%) | 2 (6.1%) |
| 75 Years and over | 7 (10.3%) | 2 (9.5%) |
Disability Class: Vision Difficulty
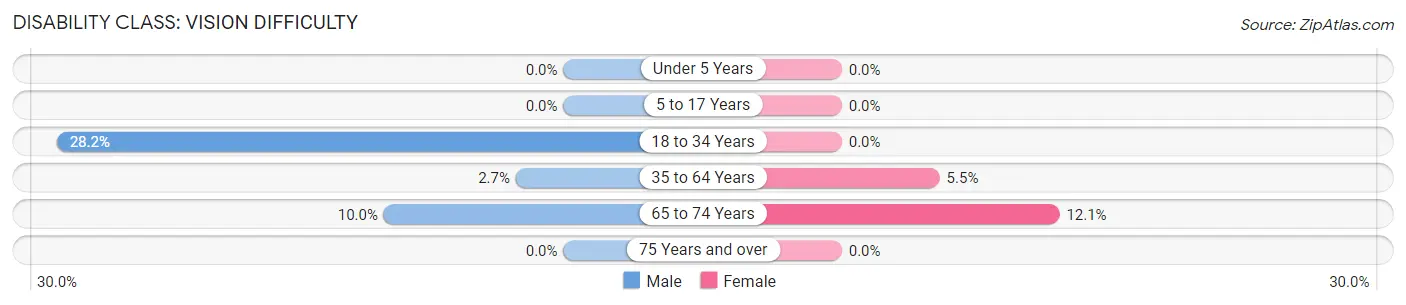
| Age Bracket | Male | Female |
| Under 5 Years | 0 (0.0%) | 0 (0.0%) |
| 5 to 17 Years | 0 (0.0%) | 0 (0.0%) |
| 18 to 34 Years | 11 (28.2%) | 0 (0.0%) |
| 35 to 64 Years | 4 (2.6%) | 9 (5.4%) |
| 65 to 74 Years | 2 (10.0%) | 4 (12.1%) |
| 75 Years and over | 0 (0.0%) | 0 (0.0%) |
Disability Class: Cognitive Difficulty
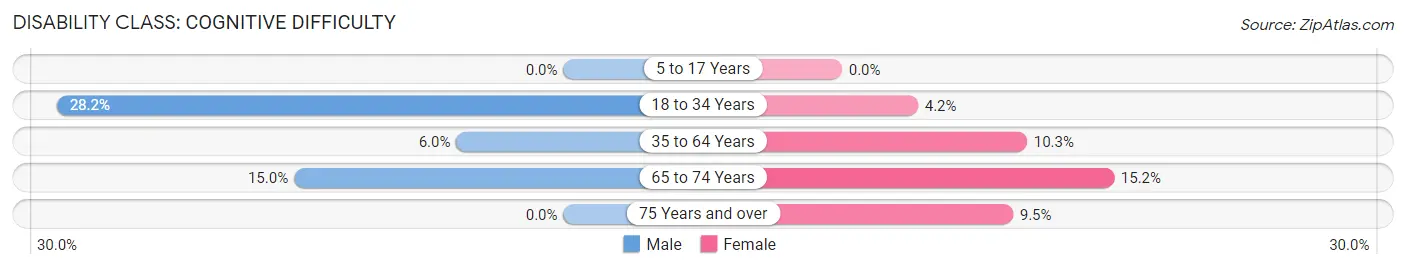
| Age Bracket | Male | Female |
| 5 to 17 Years | 0 (0.0%) | 0 (0.0%) |
| 18 to 34 Years | 11 (28.2%) | 3 (4.2%) |
| 35 to 64 Years | 9 (6.0%) | 17 (10.3%) |
| 65 to 74 Years | 3 (15.0%) | 5 (15.1%) |
| 75 Years and over | 0 (0.0%) | 2 (9.5%) |
Disability Class: Ambulatory Difficulty
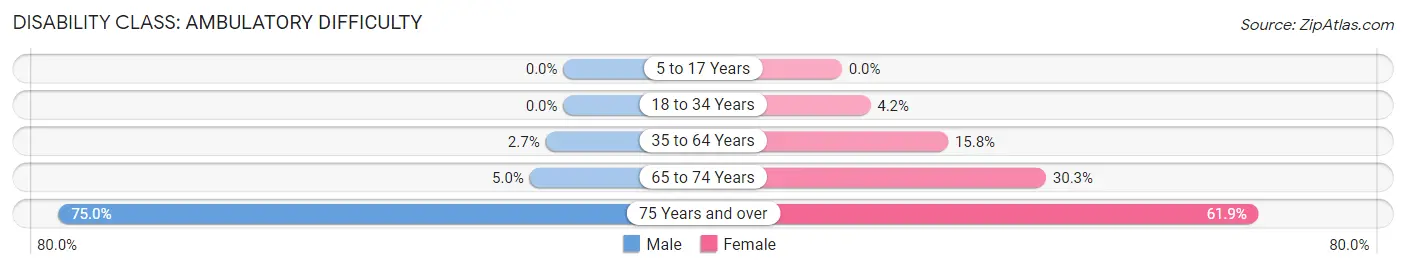
| Age Bracket | Male | Female |
| 5 to 17 Years | 0 (0.0%) | 0 (0.0%) |
| 18 to 34 Years | 0 (0.0%) | 3 (4.2%) |
| 35 to 64 Years | 4 (2.6%) | 26 (15.8%) |
| 65 to 74 Years | 1 (5.0%) | 10 (30.3%) |
| 75 Years and over | 51 (75.0%) | 13 (61.9%) |
Disability Class: Self-Care Difficulty
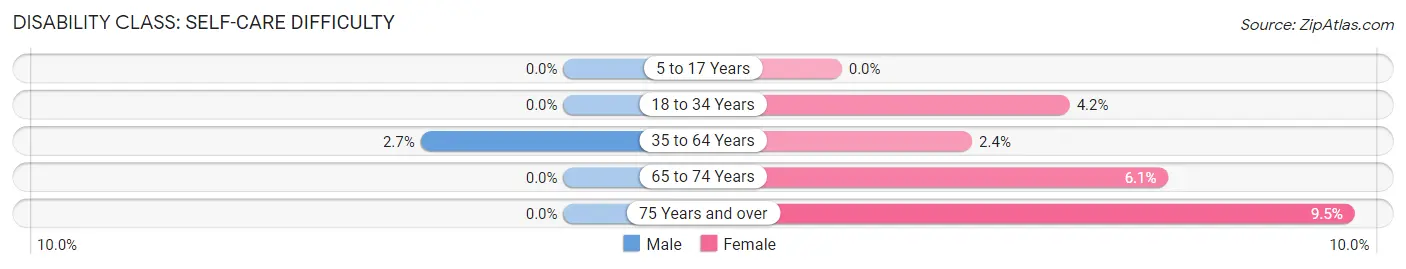
| Age Bracket | Male | Female |
| 5 to 17 Years | 0 (0.0%) | 0 (0.0%) |
| 18 to 34 Years | 0 (0.0%) | 3 (4.2%) |
| 35 to 64 Years | 4 (2.6%) | 4 (2.4%) |
| 65 to 74 Years | 0 (0.0%) | 2 (6.1%) |
| 75 Years and over | 0 (0.0%) | 2 (9.5%) |
Technology Access in New Site
Computing Device Access in New Site
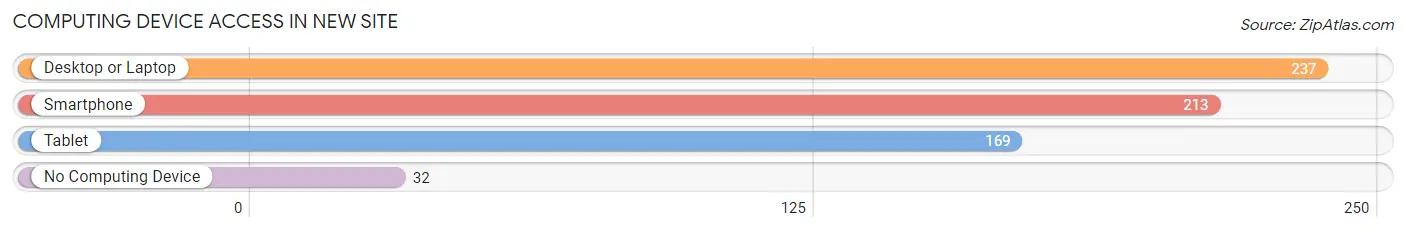
| Device Type | # Households | % Households |
| Desktop or Laptop | 237 | 74.5% |
| Smartphone | 213 | 67.0% |
| Tablet | 169 | 53.1% |
| No Computing Device | 32 | 10.1% |
| Total | 318 | 100.0% |
Internet Access in New Site
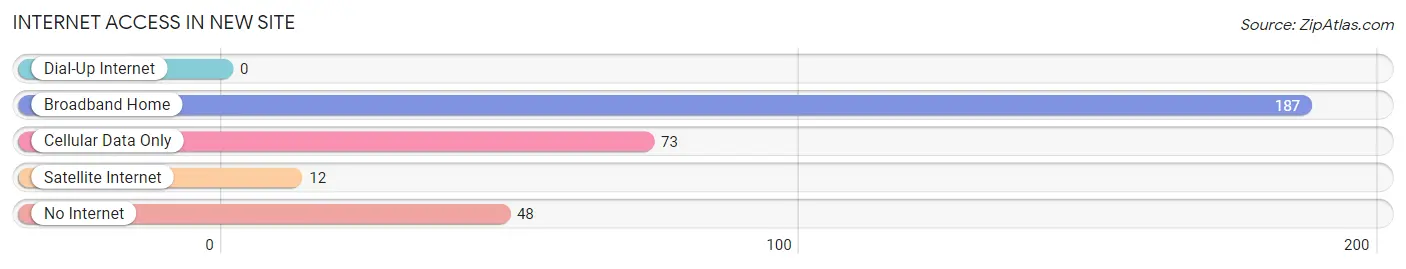
| Internet Type | # Households | % Households |
| Dial-Up Internet | 0 | 0.0% |
| Broadband Home | 187 | 58.8% |
| Cellular Data Only | 73 | 23.0% |
| Satellite Internet | 12 | 3.8% |
| No Internet | 48 | 15.1% |
| Total | 318 | 100.0% |
New Site Summary
Site, Alabama is a small town located in the northwest corner of the state, near the Tennessee border. It is part of Jackson County and is situated on the banks of the Tennessee River. The town was founded in 1818 and has a population of approximately 1,000 people.
History
Site, Alabama was founded in 1818 by a group of settlers from Tennessee. The town was named after the nearby site of a Revolutionary War battle. The town was originally a farming community, but in the late 19th century, the town began to grow as a result of the timber industry. The town was also home to a number of sawmills and other businesses related to the timber industry.
In the early 20th century, Site, Alabama began to experience a period of growth and prosperity. The town was home to a number of businesses, including a cotton gin, a grist mill, a blacksmith shop, and a general store. The town also had a number of churches, including the First Baptist Church, which was founded in 1820.
In the mid-20th century, Site, Alabama began to experience a period of decline. The timber industry began to decline, and the town began to lose population. In the late 20th century, the town began to experience a period of revitalization. The town was home to a number of new businesses, including a restaurant, a grocery store, and a hardware store.
Geography
Site, Alabama is located in the northwest corner of the state, near the Tennessee border. The town is situated on the banks of the Tennessee River. The town is surrounded by rolling hills and forests. The town is located approximately 30 miles from Chattanooga, Tennessee and approximately 60 miles from Huntsville, Alabama.
Economy
The economy of Site, Alabama is largely based on agriculture and timber. The town is home to a number of farms, which produce a variety of crops, including corn, soybeans, and cotton. The town is also home to a number of sawmills and other businesses related to the timber industry.
The town is also home to a number of small businesses, including a restaurant, a grocery store, and a hardware store. The town is also home to a number of churches, including the First Baptist Church, which was founded in 1820.
Demographics
As of the 2010 census, the population of Site, Alabama was 1,000. The town is predominantly white, with approximately 95% of the population being white. The town is also home to a small African American population, with approximately 5% of the population being African American. The town is also home to a small Hispanic population, with approximately 2% of the population being Hispanic. The median household income in Site, Alabama is approximately $35,000.
Common Questions
What is Per Capita Income in New Site?
Per Capita income in New Site is $28,291.
What is the Median Family Income in New Site?
Median Family Income in New Site is $61,705.
What is the Median Household income in New Site?
Median Household Income in New Site is $63,571.
What is Income or Wage Gap in New Site?
Income or Wage Gap in New Site is 24.8%.
Women in New Site earn 75.2 cents for every dollar earned by a man.
What is Inequality or Gini Index in New Site?
Inequality or Gini Index in New Site is 0.34.
What is the Total Population of New Site?
Total Population of New Site is 746.
What is the Total Male Population of New Site?
Total Male Population of New Site is 350.
What is the Total Female Population of New Site?
Total Female Population of New Site is 396.
What is the Ratio of Males per 100 Females in New Site?
There are 88.38 Males per 100 Females in New Site.
What is the Ratio of Females per 100 Males in New Site?
There are 113.14 Females per 100 Males in New Site.
What is the Median Population Age in New Site?
Median Population Age in New Site is 46.0 Years.
What is the Average Family Size in New Site
Average Family Size in New Site is 3.0 People.
What is the Average Household Size in New Site
Average Household Size in New Site is 2.4 People.
How Large is the Labor Force in New Site?
There are 303 People in the Labor Forcein in New Site.
What is the Percentage of People in the Labor Force in New Site?
52.5% of People are in the Labor Force in New Site.
What is the Unemployment Rate in New Site?
Unemployment Rate in New Site is 3.3%.