Nauvoo, AL Map & Demographics
Nauvoo Map
Nauvoo Overview
$25,919
PER CAPITA INCOME
$45,625
AVG FAMILY INCOME
$43,214
AVG HOUSEHOLD INCOME
0.50
INEQUALITY / GINI INDEX
168
TOTAL POPULATION
91
MALE POPULATION
77
FEMALE POPULATION
118.18
MALES / 100 FEMALES
84.62
FEMALES / 100 MALES
37.5
MEDIAN AGE
3.3
AVG FAMILY SIZE
2.6
AVG HOUSEHOLD SIZE
53
LABOR FORCE [ PEOPLE ]
43.4%
PERCENT IN LABOR FORCE
3.8%
UNEMPLOYMENT RATE
Nauvoo Zip Codes
Nauvoo Area Codes
Income in Nauvoo
Income Overview in Nauvoo
Per Capita Income in Nauvoo is $25,919, while median incomes of families and households are $45,625 and $43,214 respectively.
| Characteristic | Number | Measure |
| Per Capita Income | 168 | $25,919 |
| Median Family Income | 44 | $45,625 |
| Mean Family Income | 44 | $85,448 |
| Median Household Income | 64 | $43,214 |
| Mean Household Income | 64 | $69,827 |
| Income Deficit | 44 | $0 |
| Wage / Income Gap (%) | 168 | 0.00% |
| Wage / Income Gap ($) | 168 | 100.00¢ per $1 |
| Gini / Inequality Index | 168 | 0.50 |
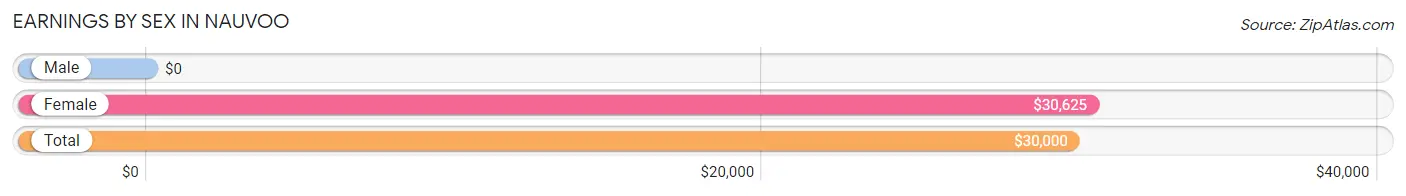
Earnings by Sex in Nauvoo
| Sex | Number | Average Earnings |
| Male | 27 (50.0%) | $0 |
| Female | 27 (50.0%) | $30,625 |
| Total | 54 (100.0%) | $30,000 |
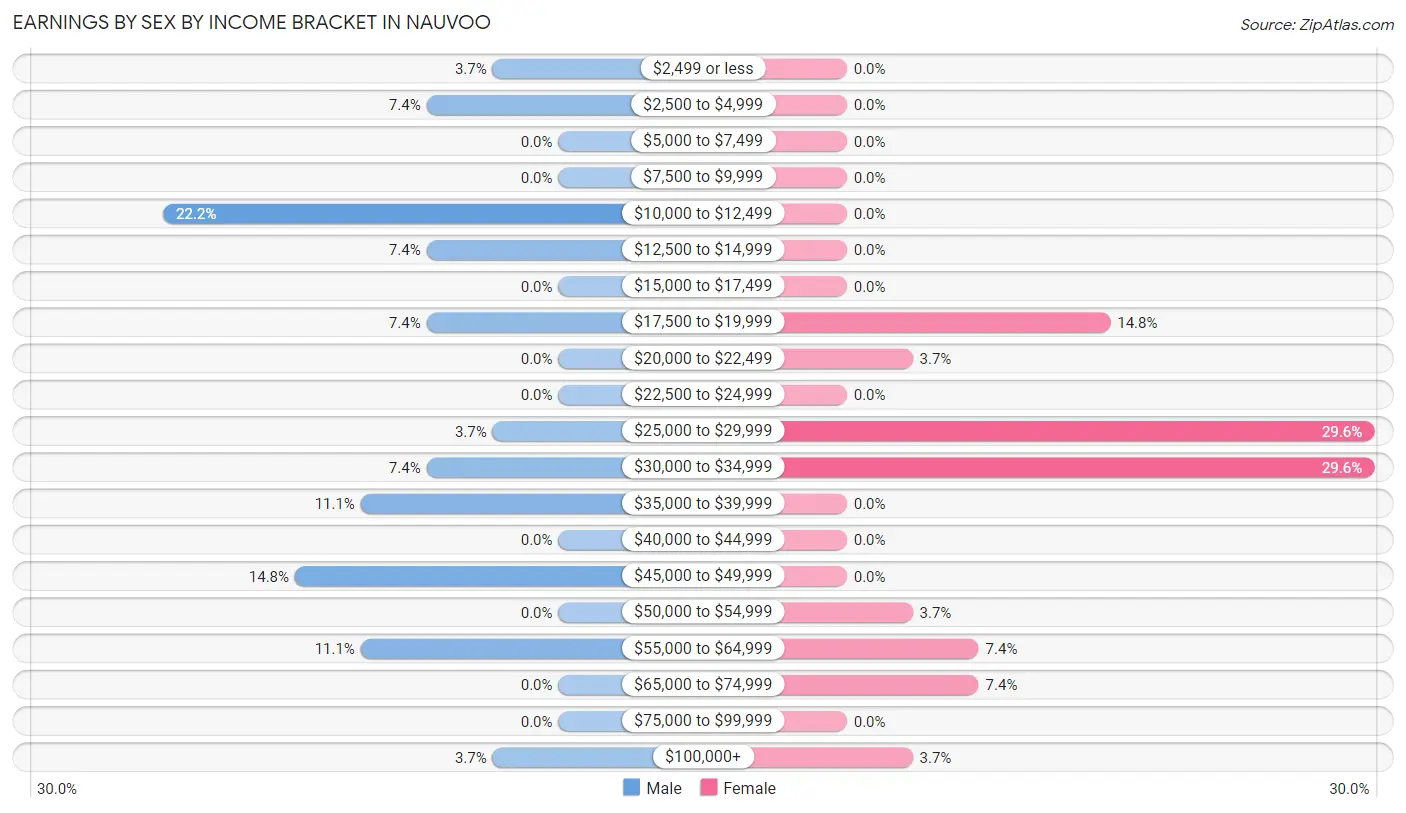
Earnings by Sex by Income Bracket in Nauvoo
The most common earnings brackets in Nauvoo are $10,000 to $12,499 for men (6 | 22.2%) and $25,000 to $29,999 for women (8 | 29.6%).
| Income | Male | Female |
| $2,499 or less | 1 (3.7%) | 0 (0.0%) |
| $2,500 to $4,999 | 2 (7.4%) | 0 (0.0%) |
| $5,000 to $7,499 | 0 (0.0%) | 0 (0.0%) |
| $7,500 to $9,999 | 0 (0.0%) | 0 (0.0%) |
| $10,000 to $12,499 | 6 (22.2%) | 0 (0.0%) |
| $12,500 to $14,999 | 2 (7.4%) | 0 (0.0%) |
| $15,000 to $17,499 | 0 (0.0%) | 0 (0.0%) |
| $17,500 to $19,999 | 2 (7.4%) | 4 (14.8%) |
| $20,000 to $22,499 | 0 (0.0%) | 1 (3.7%) |
| $22,500 to $24,999 | 0 (0.0%) | 0 (0.0%) |
| $25,000 to $29,999 | 1 (3.7%) | 8 (29.6%) |
| $30,000 to $34,999 | 2 (7.4%) | 8 (29.6%) |
| $35,000 to $39,999 | 3 (11.1%) | 0 (0.0%) |
| $40,000 to $44,999 | 0 (0.0%) | 0 (0.0%) |
| $45,000 to $49,999 | 4 (14.8%) | 0 (0.0%) |
| $50,000 to $54,999 | 0 (0.0%) | 1 (3.7%) |
| $55,000 to $64,999 | 3 (11.1%) | 2 (7.4%) |
| $65,000 to $74,999 | 0 (0.0%) | 2 (7.4%) |
| $75,000 to $99,999 | 0 (0.0%) | 0 (0.0%) |
| $100,000+ | 1 (3.7%) | 1 (3.7%) |
| Total | 27 (100.0%) | 27 (100.0%) |
Earnings by Sex by Educational Attainment in Nauvoo
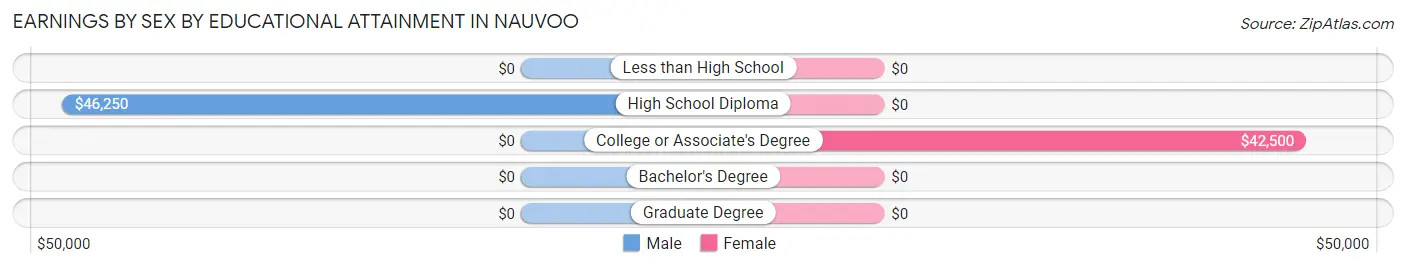
| Educational Attainment | Male Income | Female Income |
| Less than High School | - | - |
| High School Diploma | $46,250 | $0 |
| College or Associate's Degree | - | - |
| Bachelor's Degree | - | - |
| Graduate Degree | - | - |
| Total | - | - |
Family Income in Nauvoo
Family Income Brackets in Nauvoo
According to the Nauvoo family income data, there are 20 families falling into the $35,000 to $49,999 income range, which is the most common income bracket and makes up 45.5% of all families.
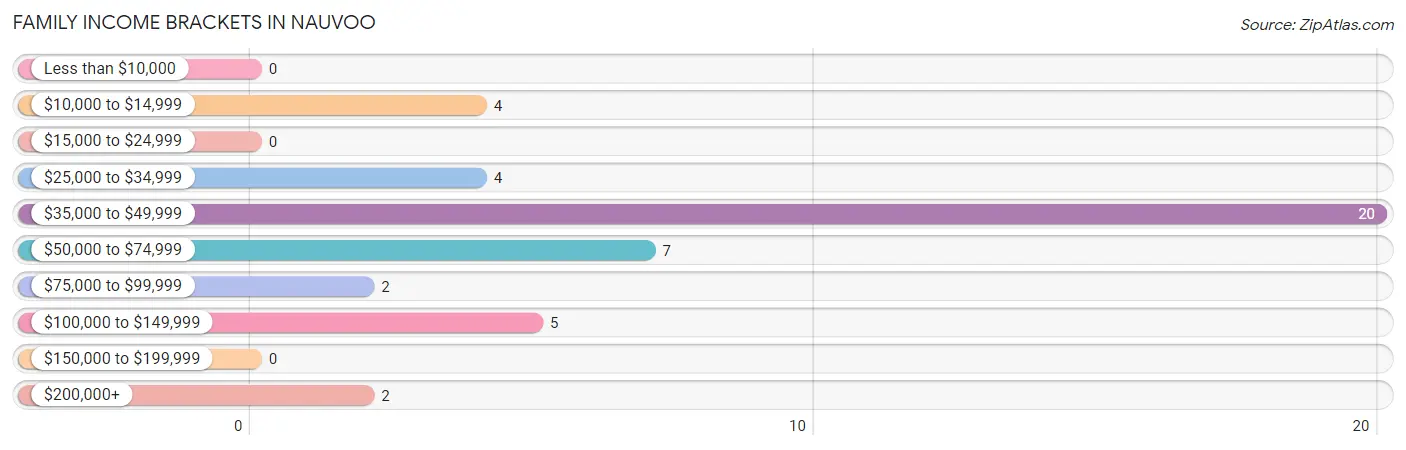
| Income Bracket | # Families | % Families |
| Less than $10,000 | 0 | 0.0% |
| $10,000 to $14,999 | 4 | 9.1% |
| $15,000 to $24,999 | 0 | 0.0% |
| $25,000 to $34,999 | 4 | 9.1% |
| $35,000 to $49,999 | 20 | 45.5% |
| $50,000 to $74,999 | 7 | 15.9% |
| $75,000 to $99,999 | 2 | 4.5% |
| $100,000 to $149,999 | 5 | 11.4% |
| $150,000 to $199,999 | 0 | 0.0% |
| $200,000+ | 2 | 4.5% |
Family Income by Famaliy Size in Nauvoo
2-person families (19 | 43.2%) account for the highest median family income in Nauvoo with $55,938 per family, while 2-person families (19 | 43.2%) have the highest median income of $27,969 per family member.
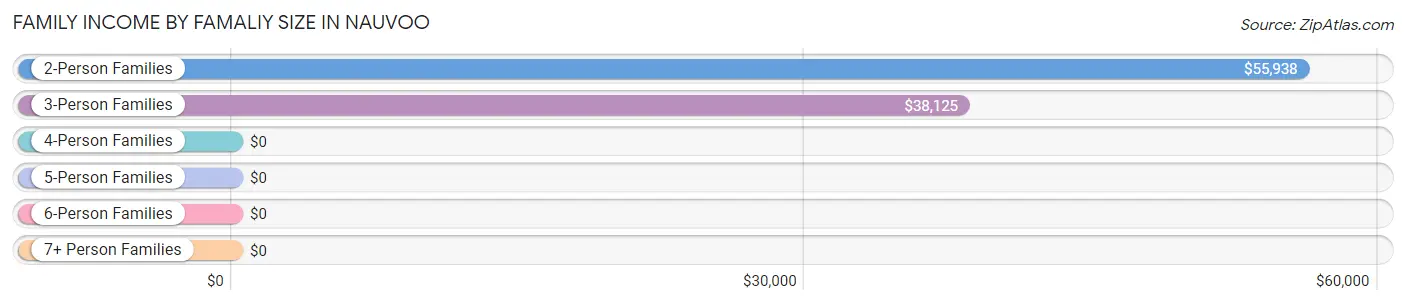
| Income Bracket | # Families | Median Income |
| 2-Person Families | 19 (43.2%) | $55,938 |
| 3-Person Families | 10 (22.7%) | $38,125 |
| 4-Person Families | 15 (34.1%) | $0 |
| 5-Person Families | 0 (0.0%) | $0 |
| 6-Person Families | 0 (0.0%) | $0 |
| 7+ Person Families | 0 (0.0%) | $0 |
| Total | 44 (100.0%) | $45,625 |
Family Income by Number of Earners in Nauvoo
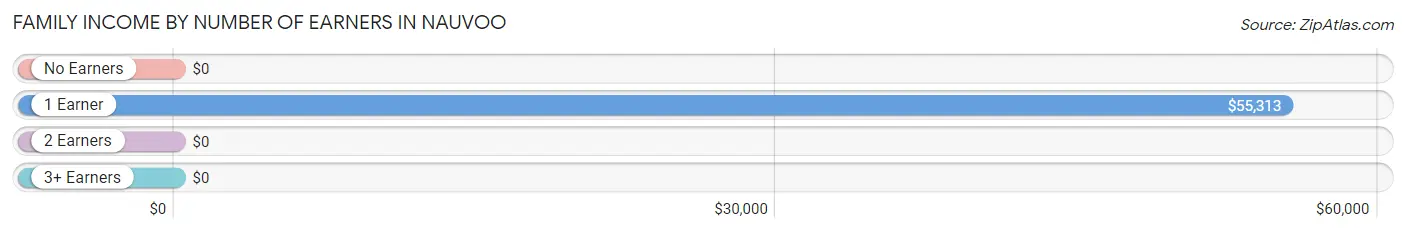
| Number of Earners | # Families | Median Income |
| No Earners | 9 (20.4%) | $0 |
| 1 Earner | 19 (43.2%) | $55,313 |
| 2 Earners | 16 (36.4%) | $0 |
| 3+ Earners | 0 (0.0%) | $0 |
| Total | 44 (100.0%) | $45,625 |
Household Income in Nauvoo
Household Income Brackets in Nauvoo
With 27 households falling in the category, the $35,000 to $49,999 income range is the most frequent in Nauvoo, accounting for 42.2% of all households.
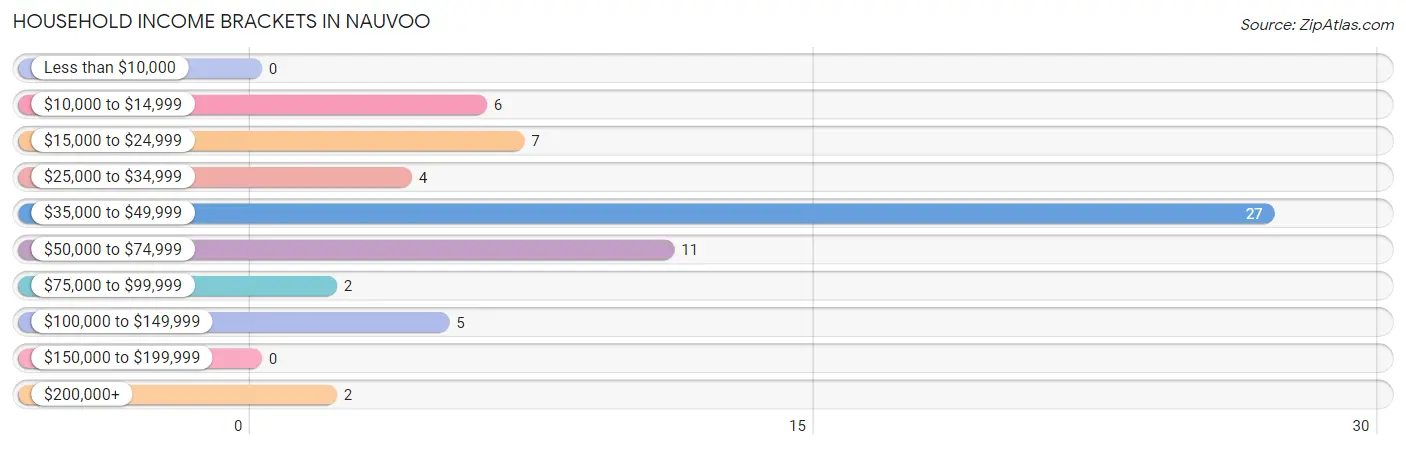
| Income Bracket | # Households | % Households |
| Less than $10,000 | 0 | 0.0% |
| $10,000 to $14,999 | 6 | 9.4% |
| $15,000 to $24,999 | 7 | 10.9% |
| $25,000 to $34,999 | 4 | 6.3% |
| $35,000 to $49,999 | 27 | 42.2% |
| $50,000 to $74,999 | 11 | 17.2% |
| $75,000 to $99,999 | 2 | 3.1% |
| $100,000 to $149,999 | 5 | 7.8% |
| $150,000 to $199,999 | 0 | 0.0% |
| $200,000+ | 2 | 3.1% |
Household Income by Householder Age in Nauvoo
The median household income in Nauvoo is $43,214, with the highest median household income of $45,625 found in the 45 to 64 years age bracket for the primary householder. A total of 23 households (35.9%) fall into this category. Meanwhile, the 15 to 24 years age bracket for the primary householder has the lowest median household income of $0, with 3 households (4.7%) in this group.
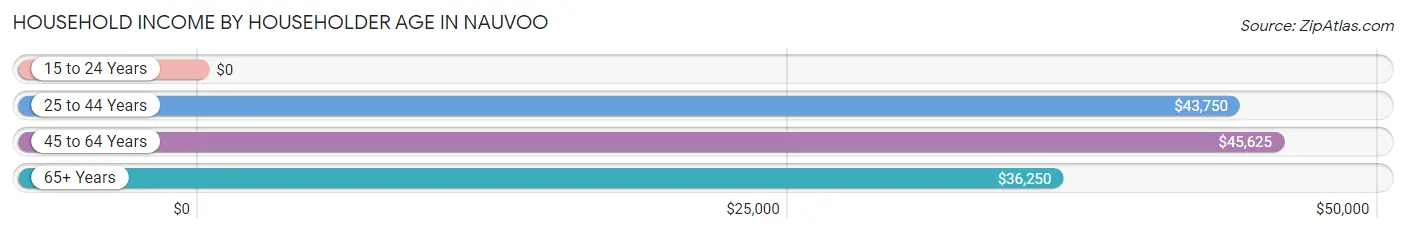
| Income Bracket | # Households | Median Income |
| 15 to 24 Years | 3 (4.7%) | $0 |
| 25 to 44 Years | 14 (21.9%) | $43,750 |
| 45 to 64 Years | 23 (35.9%) | $45,625 |
| 65+ Years | 24 (37.5%) | $36,250 |
| Total | 64 (100.0%) | $43,214 |
Poverty in Nauvoo
Income Below Poverty by Sex and Age in Nauvoo
With 15.4% poverty level for males and 16.9% for females among the residents of Nauvoo, 16 and 17 year old males and 75 year old and over females are the most vulnerable to poverty, with 4 males (100.0%) and 4 females (100.0%) in their respective age groups living below the poverty level.
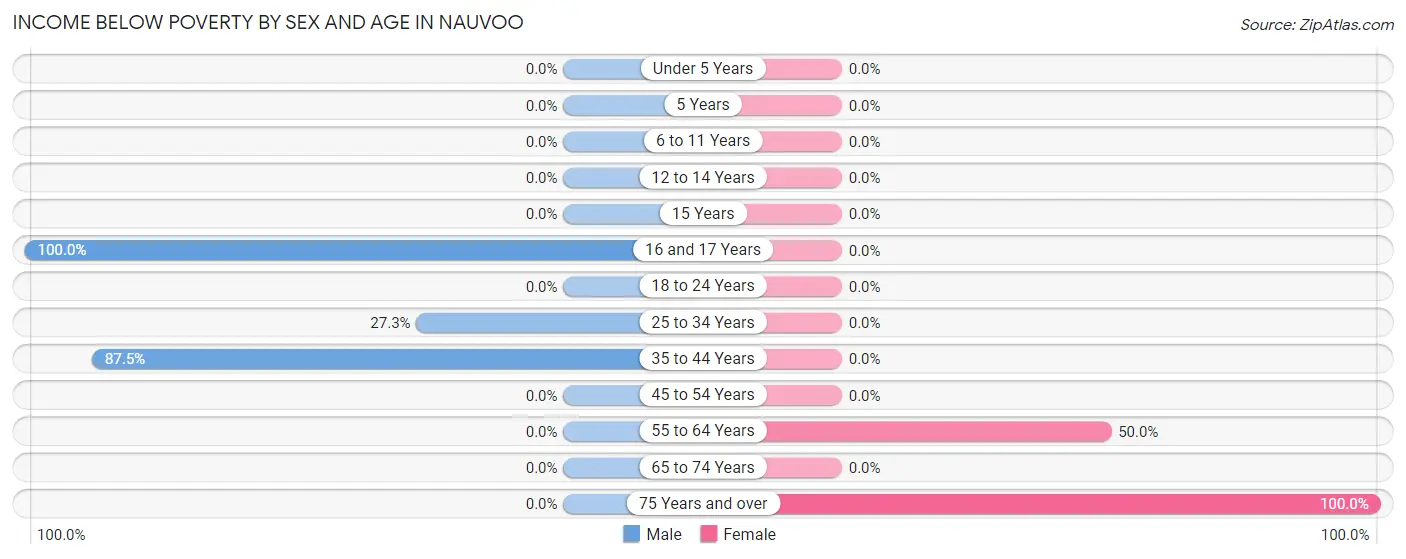
| Age Bracket | Male | Female |
| Under 5 Years | 0 (0.0%) | 0 (0.0%) |
| 5 Years | 0 (0.0%) | 0 (0.0%) |
| 6 to 11 Years | 0 (0.0%) | 0 (0.0%) |
| 12 to 14 Years | 0 (0.0%) | 0 (0.0%) |
| 15 Years | 0 (0.0%) | 0 (0.0%) |
| 16 and 17 Years | 4 (100.0%) | 0 (0.0%) |
| 18 to 24 Years | 0 (0.0%) | 0 (0.0%) |
| 25 to 34 Years | 3 (27.3%) | 0 (0.0%) |
| 35 to 44 Years | 7 (87.5%) | 0 (0.0%) |
| 45 to 54 Years | 0 (0.0%) | 0 (0.0%) |
| 55 to 64 Years | 0 (0.0%) | 9 (50.0%) |
| 65 to 74 Years | 0 (0.0%) | 0 (0.0%) |
| 75 Years and over | 0 (0.0%) | 4 (100.0%) |
| Total | 14 (15.4%) | 13 (16.9%) |
Income Above Poverty by Sex and Age in Nauvoo
According to the poverty statistics in Nauvoo, males aged under 5 years and females aged under 5 years are the age groups that are most secure financially, with 100.0% of males and 100.0% of females in these age groups living above the poverty line.
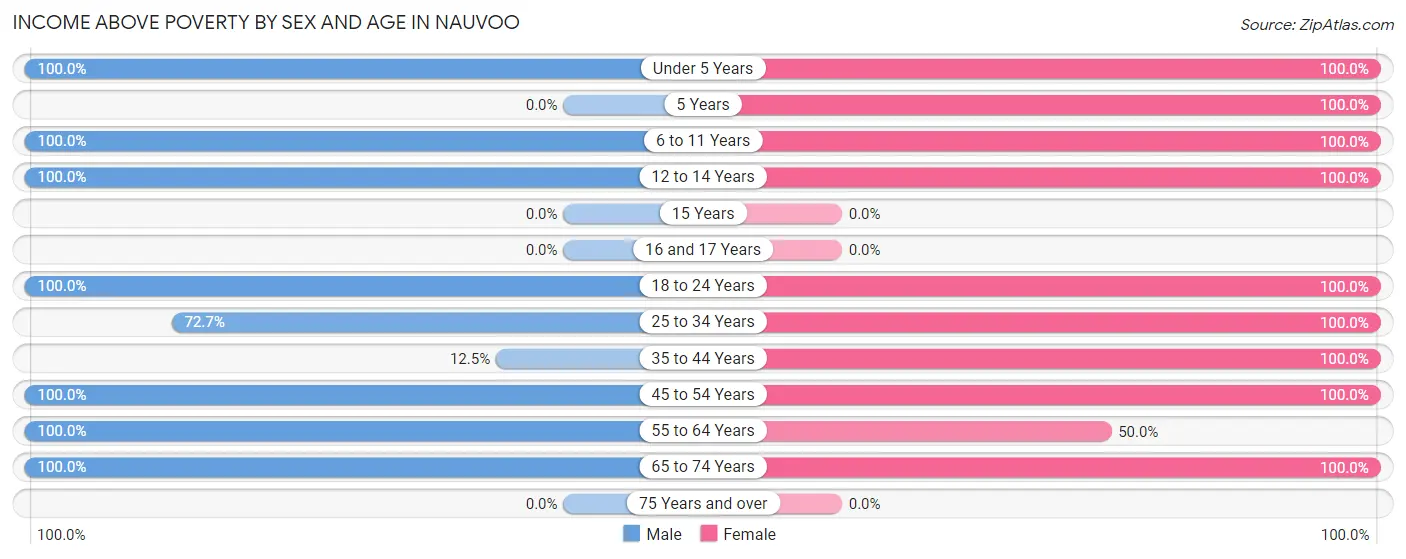
| Age Bracket | Male | Female |
| Under 5 Years | 2 (100.0%) | 3 (100.0%) |
| 5 Years | 0 (0.0%) | 10 (100.0%) |
| 6 to 11 Years | 21 (100.0%) | 2 (100.0%) |
| 12 to 14 Years | 4 (100.0%) | 4 (100.0%) |
| 15 Years | 0 (0.0%) | 0 (0.0%) |
| 16 and 17 Years | 0 (0.0%) | 0 (0.0%) |
| 18 to 24 Years | 4 (100.0%) | 2 (100.0%) |
| 25 to 34 Years | 8 (72.7%) | 8 (100.0%) |
| 35 to 44 Years | 1 (12.5%) | 8 (100.0%) |
| 45 to 54 Years | 6 (100.0%) | 12 (100.0%) |
| 55 to 64 Years | 13 (100.0%) | 9 (50.0%) |
| 65 to 74 Years | 18 (100.0%) | 6 (100.0%) |
| 75 Years and over | 0 (0.0%) | 0 (0.0%) |
| Total | 77 (84.6%) | 64 (83.1%) |
Income Below Poverty Among Married-Couple Families in Nauvoo
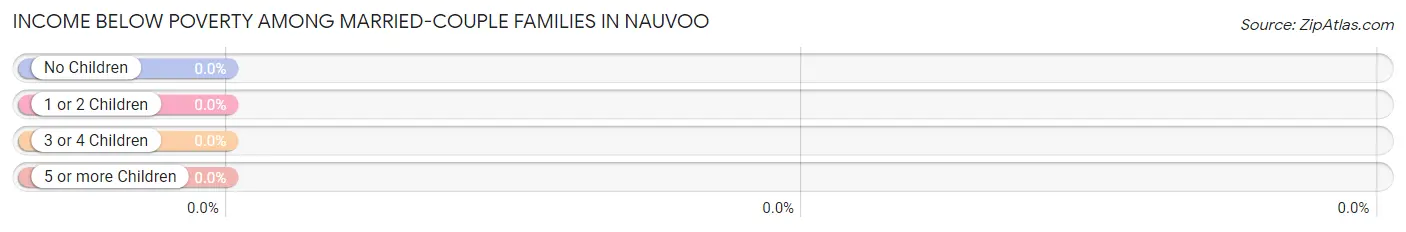
| Children | Above Poverty | Below Poverty |
| No Children | 20 (100.0%) | 0 (0.0%) |
| 1 or 2 Children | 11 (100.0%) | 0 (0.0%) |
| 3 or 4 Children | 0 (0.0%) | 0 (0.0%) |
| 5 or more Children | 0 (0.0%) | 0 (0.0%) |
| Total | 31 (100.0%) | 0 (0.0%) |
Income Below Poverty Among Single-Parent Households in Nauvoo
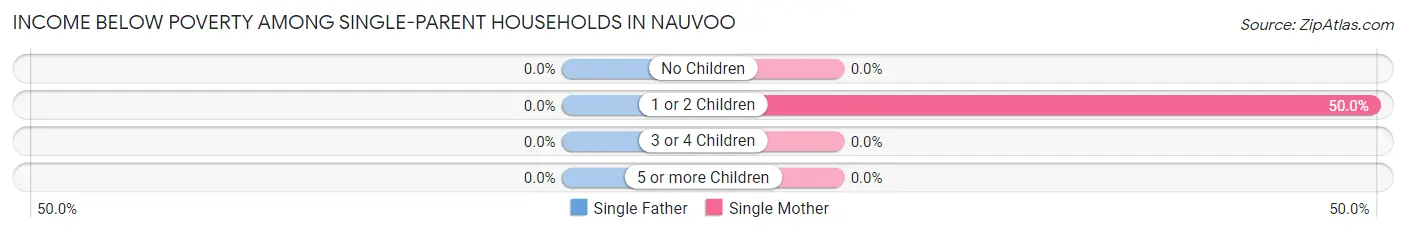
| Children | Single Father | Single Mother |
| No Children | 0 (0.0%) | 0 (0.0%) |
| 1 or 2 Children | 0 (0.0%) | 4 (50.0%) |
| 3 or 4 Children | 0 (0.0%) | 0 (0.0%) |
| 5 or more Children | 0 (0.0%) | 0 (0.0%) |
| Total | 0 (0.0%) | 4 (50.0%) |
Income Below Poverty Among Married-Couple vs Single-Parent Households in Nauvoo
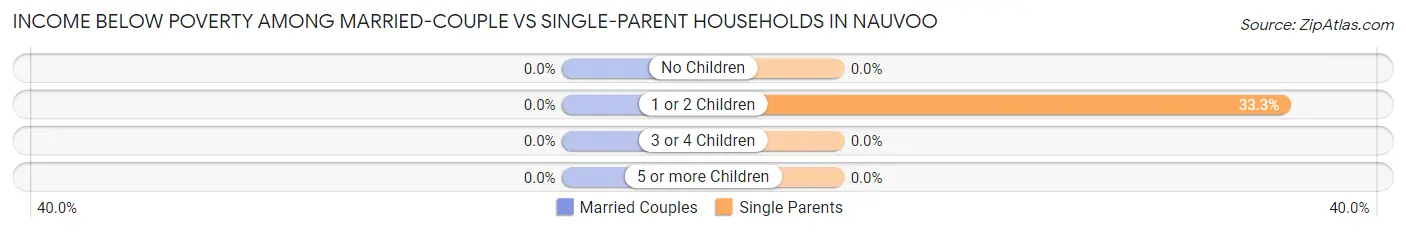
| Children | Married-Couple Families | Single-Parent Households |
| No Children | 0 (0.0%) | 0 (0.0%) |
| 1 or 2 Children | 0 (0.0%) | 4 (33.3%) |
| 3 or 4 Children | 0 (0.0%) | 0 (0.0%) |
| 5 or more Children | 0 (0.0%) | 0 (0.0%) |
| Total | 0 (0.0%) | 4 (30.8%) |
Race in Nauvoo
The most populous races in Nauvoo are White / Caucasian (134 | 79.8%), Hispanic or Latino (34 | 20.2%), and Some other Race (34 | 20.2%).
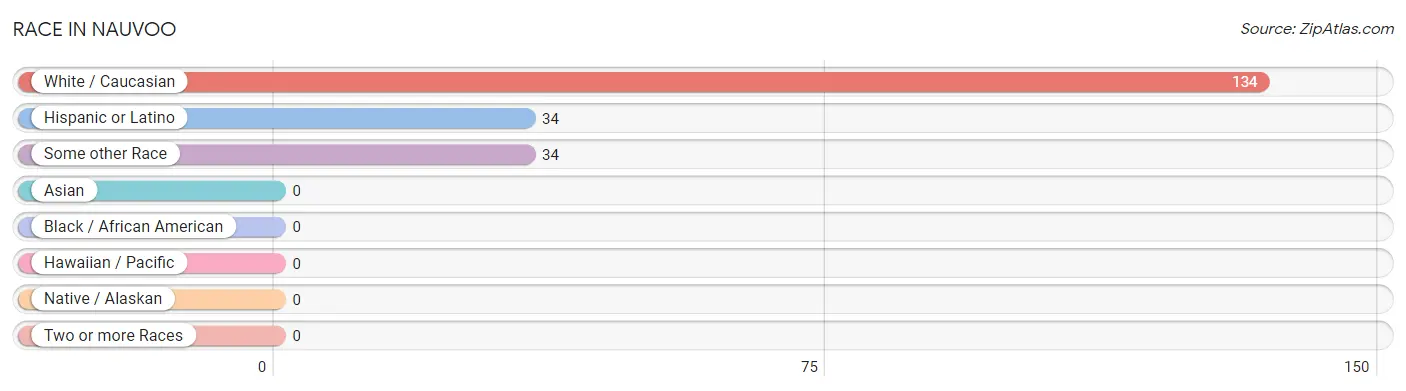
| Race | # Population | % Population |
| Asian | 0 | 0.0% |
| Black / African American | 0 | 0.0% |
| Hawaiian / Pacific | 0 | 0.0% |
| Hispanic or Latino | 34 | 20.2% |
| Native / Alaskan | 0 | 0.0% |
| White / Caucasian | 134 | 79.8% |
| Two or more Races | 0 | 0.0% |
| Some other Race | 34 | 20.2% |
| Total | 168 | 100.0% |
Ancestry in Nauvoo
The most populous ancestries reported in Nauvoo are Mexican (34 | 20.2%), Irish (32 | 19.1%), American (30 | 17.9%), English (16 | 9.5%), and German (10 | 5.9%), together accounting for 72.6% of all Nauvoo residents.
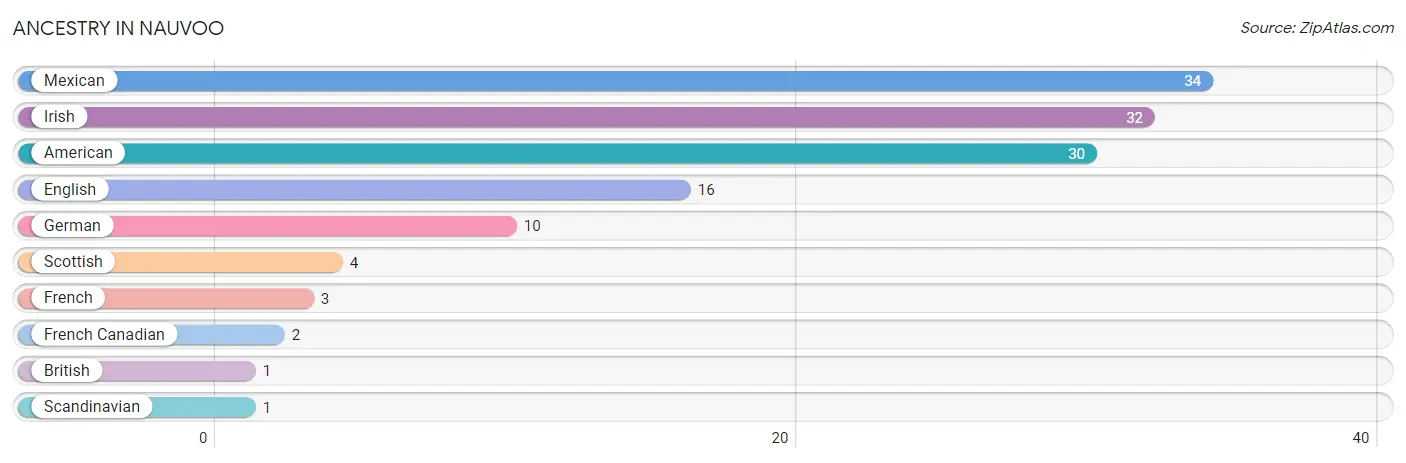
| Ancestry | # Population | % Population |
| American | 30 | 17.9% |
| British | 1 | 0.6% |
| English | 16 | 9.5% |
| French | 3 | 1.8% |
| French Canadian | 2 | 1.2% |
| German | 10 | 5.9% |
| Irish | 32 | 19.1% |
| Mexican | 34 | 20.2% |
| Scandinavian | 1 | 0.6% |
| Scottish | 4 | 2.4% | View All 10 Rows |
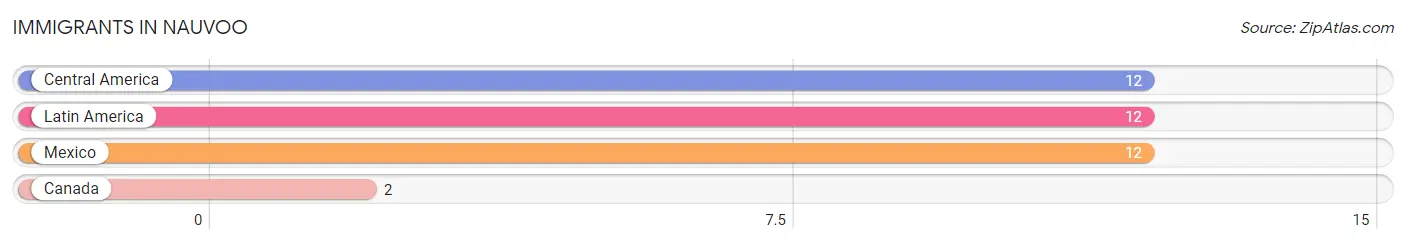
Immigrants in Nauvoo
The most numerous immigrant groups reported in Nauvoo came from Central America (12 | 7.1%), Latin America (12 | 7.1%), Mexico (12 | 7.1%), and Canada (2 | 1.2%), together accounting for 22.6% of all Nauvoo residents.
| Immigration Origin | # Population | % Population |
| Canada | 2 | 1.2% |
| Central America | 12 | 7.1% |
| Latin America | 12 | 7.1% |
| Mexico | 12 | 7.1% | View All 4 Rows |
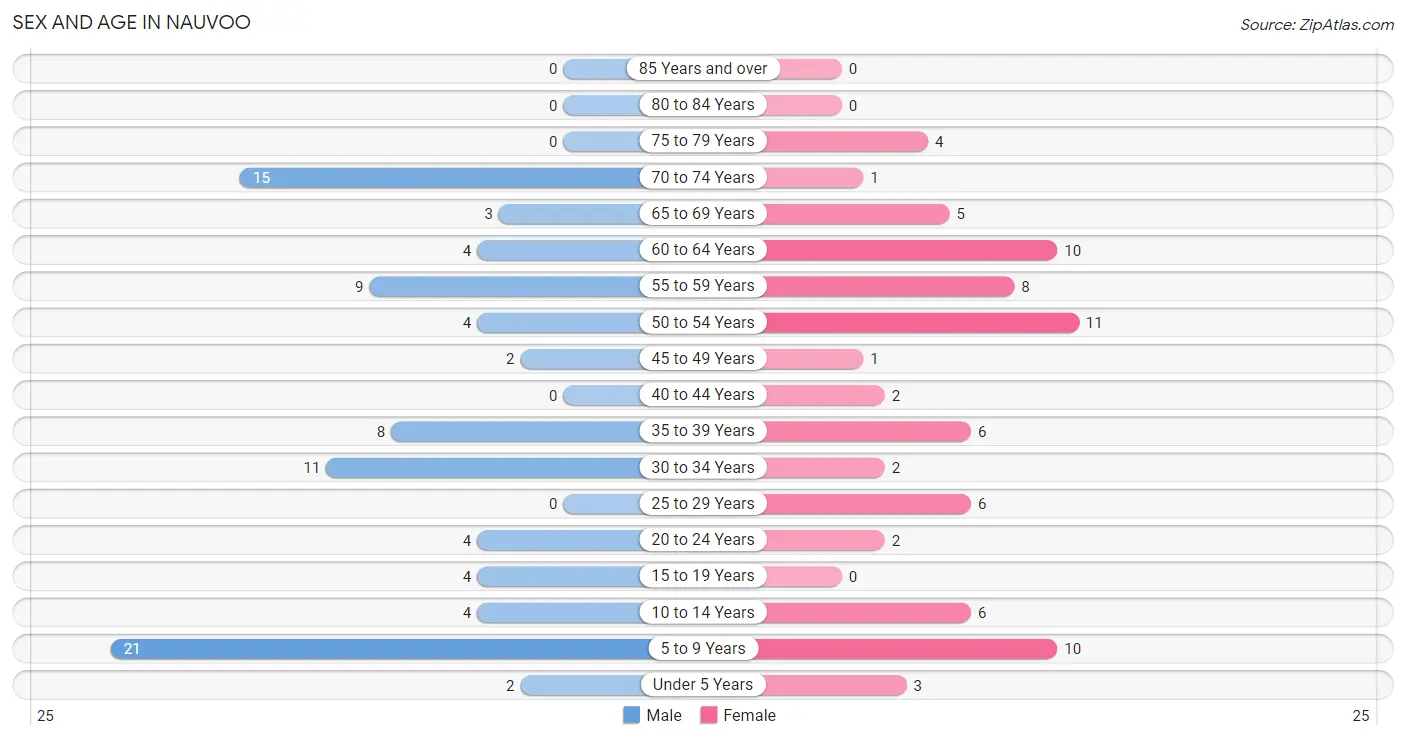
Sex and Age in Nauvoo
Sex and Age in Nauvoo
The most populous age groups in Nauvoo are 5 to 9 Years (21 | 23.1%) for men and 50 to 54 Years (11 | 14.3%) for women.
| Age Bracket | Male | Female |
| Under 5 Years | 2 (2.2%) | 3 (3.9%) |
| 5 to 9 Years | 21 (23.1%) | 10 (13.0%) |
| 10 to 14 Years | 4 (4.4%) | 6 (7.8%) |
| 15 to 19 Years | 4 (4.4%) | 0 (0.0%) |
| 20 to 24 Years | 4 (4.4%) | 2 (2.6%) |
| 25 to 29 Years | 0 (0.0%) | 6 (7.8%) |
| 30 to 34 Years | 11 (12.1%) | 2 (2.6%) |
| 35 to 39 Years | 8 (8.8%) | 6 (7.8%) |
| 40 to 44 Years | 0 (0.0%) | 2 (2.6%) |
| 45 to 49 Years | 2 (2.2%) | 1 (1.3%) |
| 50 to 54 Years | 4 (4.4%) | 11 (14.3%) |
| 55 to 59 Years | 9 (9.9%) | 8 (10.4%) |
| 60 to 64 Years | 4 (4.4%) | 10 (13.0%) |
| 65 to 69 Years | 3 (3.3%) | 5 (6.5%) |
| 70 to 74 Years | 15 (16.5%) | 1 (1.3%) |
| 75 to 79 Years | 0 (0.0%) | 4 (5.2%) |
| 80 to 84 Years | 0 (0.0%) | 0 (0.0%) |
| 85 Years and over | 0 (0.0%) | 0 (0.0%) |
| Total | 91 (100.0%) | 77 (100.0%) |
Families and Households in Nauvoo
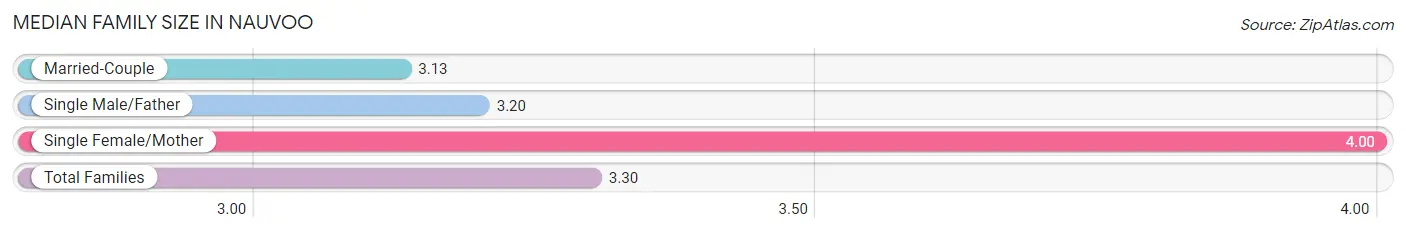
Median Family Size in Nauvoo
The median family size in Nauvoo is 3.30 persons per family, with single female/mother families (8 | 18.2%) accounting for the largest median family size of 4 persons per family. On the other hand, married-couple families (31 | 70.5%) represent the smallest median family size with 3.13 persons per family.
| Family Type | # Families | Family Size |
| Married-Couple | 31 (70.5%) | 3.13 |
| Single Male/Father | 5 (11.4%) | 3.20 |
| Single Female/Mother | 8 (18.2%) | 4.00 |
| Total Families | 44 (100.0%) | 3.30 |
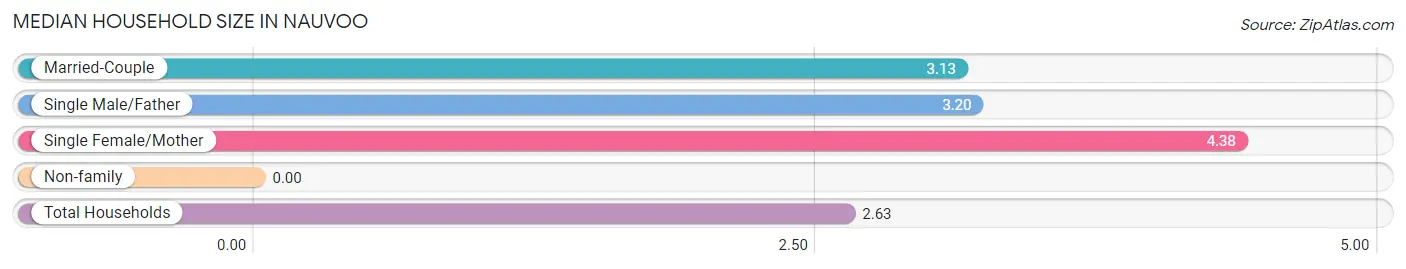
Median Household Size in Nauvoo
| Household Type | # Households | Household Size |
| Married-Couple | 31 (48.4%) | 3.13 |
| Single Male/Father | 5 (7.8%) | 3.20 |
| Single Female/Mother | 8 (12.5%) | 4.38 |
| Non-family | 20 (31.2%) | - |
| Total Households | 64 (100.0%) | 2.63 |
Household Size by Marriage Status in Nauvoo
Out of a total of 64 households in Nauvoo, 44 (68.8%) are family households, while 20 (31.2%) are nonfamily households. The most numerous type of family households are 2-person households, comprising 19, and the most common type of nonfamily households are 1-person households, comprising 20.
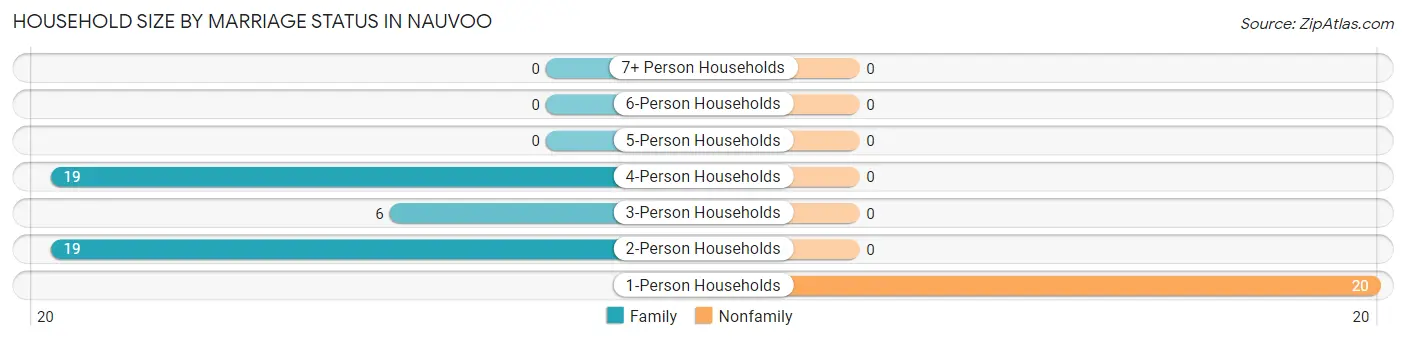
| Household Size | Family Households | Nonfamily Households |
| 1-Person Households | - | 20 (31.2%) |
| 2-Person Households | 19 (29.7%) | 0 (0.0%) |
| 3-Person Households | 6 (9.4%) | 0 (0.0%) |
| 4-Person Households | 19 (29.7%) | 0 (0.0%) |
| 5-Person Households | 0 (0.0%) | 0 (0.0%) |
| 6-Person Households | 0 (0.0%) | 0 (0.0%) |
| 7+ Person Households | 0 (0.0%) | 0 (0.0%) |
| Total | 44 (68.8%) | 20 (31.2%) |
Female Fertility in Nauvoo
Fertility by Age in Nauvoo
Average fertility rate in Nauvoo is 105.0 births per 1,000 women. Women in the age bracket of 20 to 34 years have the highest fertility rate with 200.0 births per 1,000 women. Women in the age bracket of 20 to 34 years acount for 100.0% of all women with births.
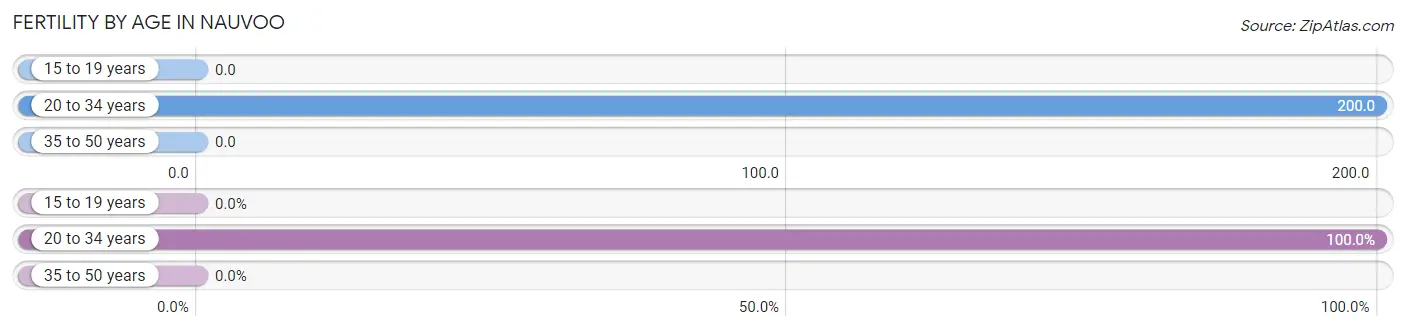
| Age Bracket | Women with Births | Births / 1,000 Women |
| 15 to 19 years | 0 (0.0%) | 0.0 |
| 20 to 34 years | 2 (100.0%) | 200.0 |
| 35 to 50 years | 0 (0.0%) | 0.0 |
| Total | 2 (100.0%) | 105.0 |
Fertility by Age by Marriage Status in Nauvoo
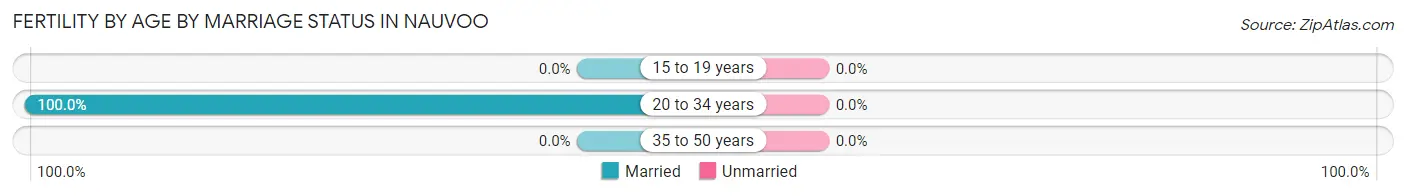
| Age Bracket | Married | Unmarried |
| 15 to 19 years | 0 (0.0%) | 0 (0.0%) |
| 20 to 34 years | 2 (100.0%) | 0 (0.0%) |
| 35 to 50 years | 0 (0.0%) | 0 (0.0%) |
| Total | 2 (100.0%) | 0 (0.0%) |
Fertility by Education in Nauvoo
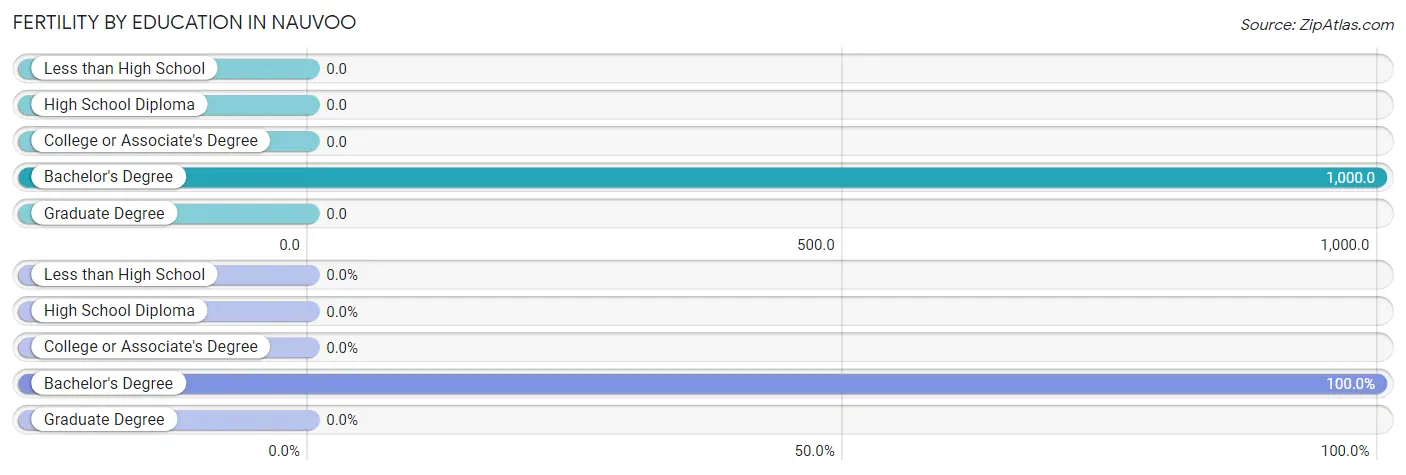
| Educational Attainment | Women with Births | Births / 1,000 Women |
| Less than High School | 0 (0.0%) | 0.0 |
| High School Diploma | 0 (0.0%) | 0.0 |
| College or Associate's Degree | 0 (0.0%) | 0.0 |
| Bachelor's Degree | 2 (100.0%) | 1,000.0 |
| Graduate Degree | 0 (0.0%) | 0.0 |
| Total | 2 (100.0%) | 105.0 |
Fertility by Education by Marriage Status in Nauvoo
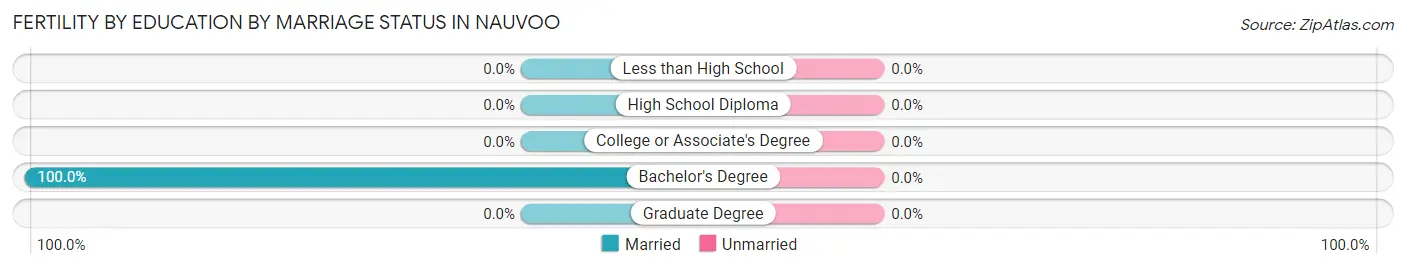
| Educational Attainment | Married | Unmarried |
| Less than High School | 0 (0.0%) | 0 (0.0%) |
| High School Diploma | 0 (0.0%) | 0 (0.0%) |
| College or Associate's Degree | 0 (0.0%) | 0 (0.0%) |
| Bachelor's Degree | 2 (100.0%) | 0 (0.0%) |
| Graduate Degree | 0 (0.0%) | 0 (0.0%) |
| Total | 2 (100.0%) | 0 (0.0%) |
Employment Characteristics in Nauvoo
Employment by Class of Employer in Nauvoo
Among the 47 employed individuals in Nauvoo, private company employees (34 | 72.3%), not-for-profit organizations (5 | 10.6%), and local government employees (5 | 10.6%) make up the most common classes of employment.
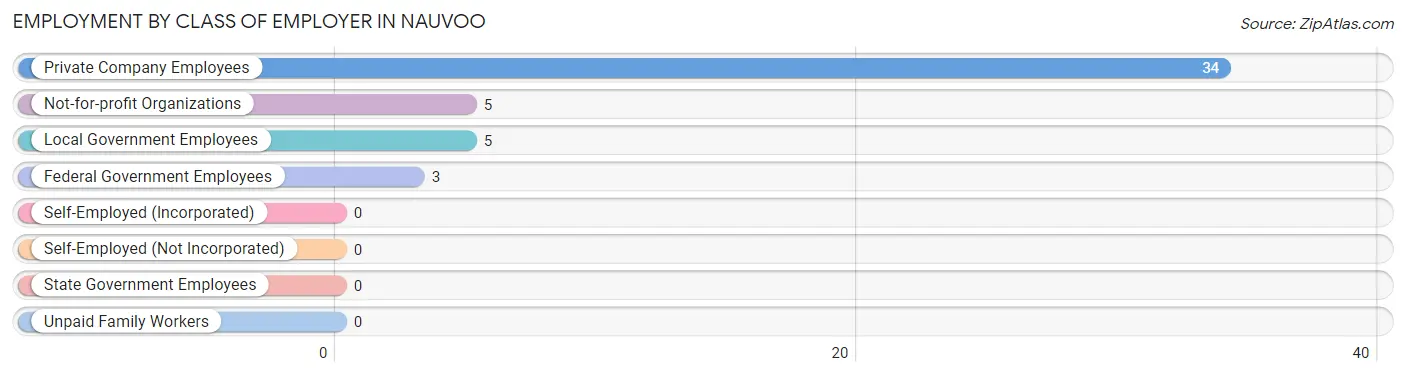
| Employer Class | # Employees | % Employees |
| Private Company Employees | 34 | 72.3% |
| Self-Employed (Incorporated) | 0 | 0.0% |
| Self-Employed (Not Incorporated) | 0 | 0.0% |
| Not-for-profit Organizations | 5 | 10.6% |
| Local Government Employees | 5 | 10.6% |
| State Government Employees | 0 | 0.0% |
| Federal Government Employees | 3 | 6.4% |
| Unpaid Family Workers | 0 | 0.0% |
| Total | 47 | 100.0% |
Employment Status by Age in Nauvoo
According to the labor force statistics for Nauvoo, out of the total population over 16 years of age (122), 43.4% or 53 individuals are in the labor force, with 3.8% or 2 of them unemployed. The age group with the highest labor force participation rate is 20 to 24 years, with 100.0% or 6 individuals in the labor force. Within the labor force, the 20 to 24 years age range has the highest percentage of unemployed individuals, with 16.7% or 1 of them being unemployed.
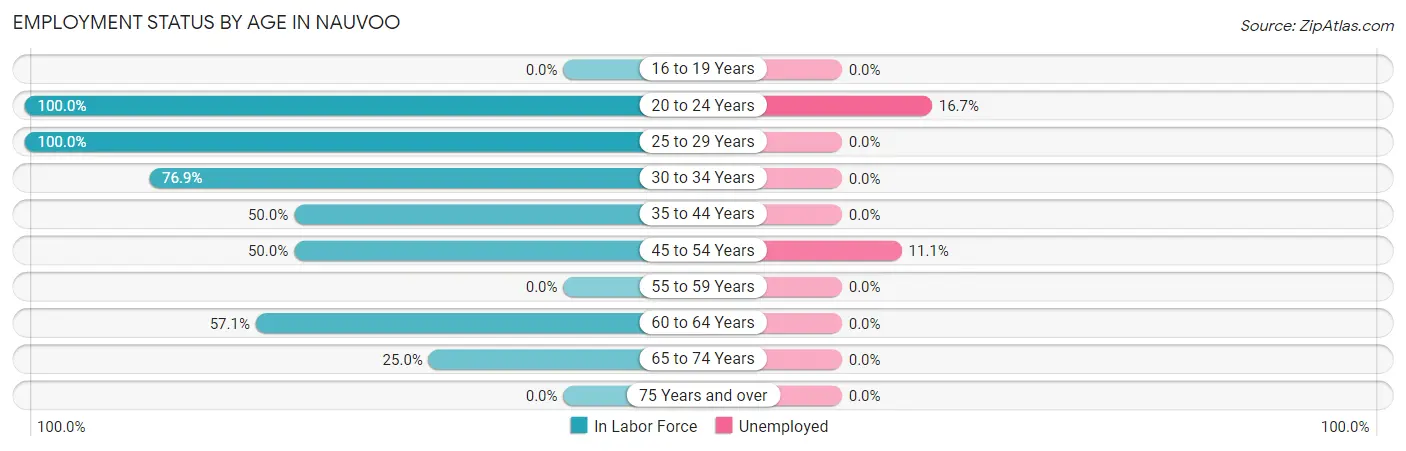
| Age Bracket | In Labor Force | Unemployed |
| 16 to 19 Years | 0 (0.0%) | 0 (0.0%) |
| 20 to 24 Years | 6 (100.0%) | 1 (16.7%) |
| 25 to 29 Years | 6 (100.0%) | 0 (0.0%) |
| 30 to 34 Years | 10 (76.9%) | 0 (0.0%) |
| 35 to 44 Years | 8 (50.0%) | 0 (0.0%) |
| 45 to 54 Years | 9 (50.0%) | 1 (11.1%) |
| 55 to 59 Years | 0 (0.0%) | 0 (0.0%) |
| 60 to 64 Years | 8 (57.1%) | 0 (0.0%) |
| 65 to 74 Years | 6 (25.0%) | 0 (0.0%) |
| 75 Years and over | 0 (0.0%) | 0 (0.0%) |
| Total | 53 (43.4%) | 2 (3.8%) |
Employment Status by Educational Attainment in Nauvoo
According to labor force statistics for Nauvoo, 48.8% of individuals (41) out of the total population between 25 and 64 years of age (84) are in the labor force, with 2.4% or 1 of them being unemployed. The group with the highest labor force participation rate are those with the educational attainment of college / associate degree, with 100.0% or 6 individuals in the labor force. Within the labor force, individuals with less than high school education have the highest percentage of unemployment, with 6.3% or 1 of them being unemployed.
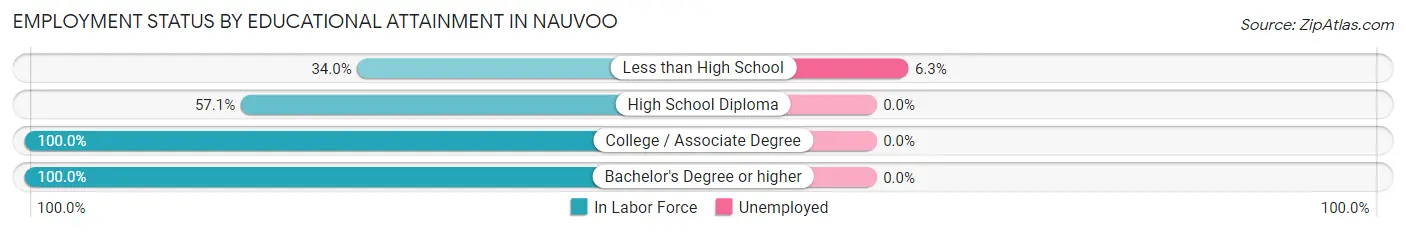
| Educational Attainment | In Labor Force | Unemployed |
| Less than High School | 16 (34.0%) | 3 (6.3%) |
| High School Diploma | 16 (57.1%) | 0 (0.0%) |
| College / Associate Degree | 6 (100.0%) | 0 (0.0%) |
| Bachelor's Degree or higher | 3 (100.0%) | 0 (0.0%) |
| Total | 41 (48.8%) | 2 (2.4%) |
Employment Occupations by Sex in Nauvoo
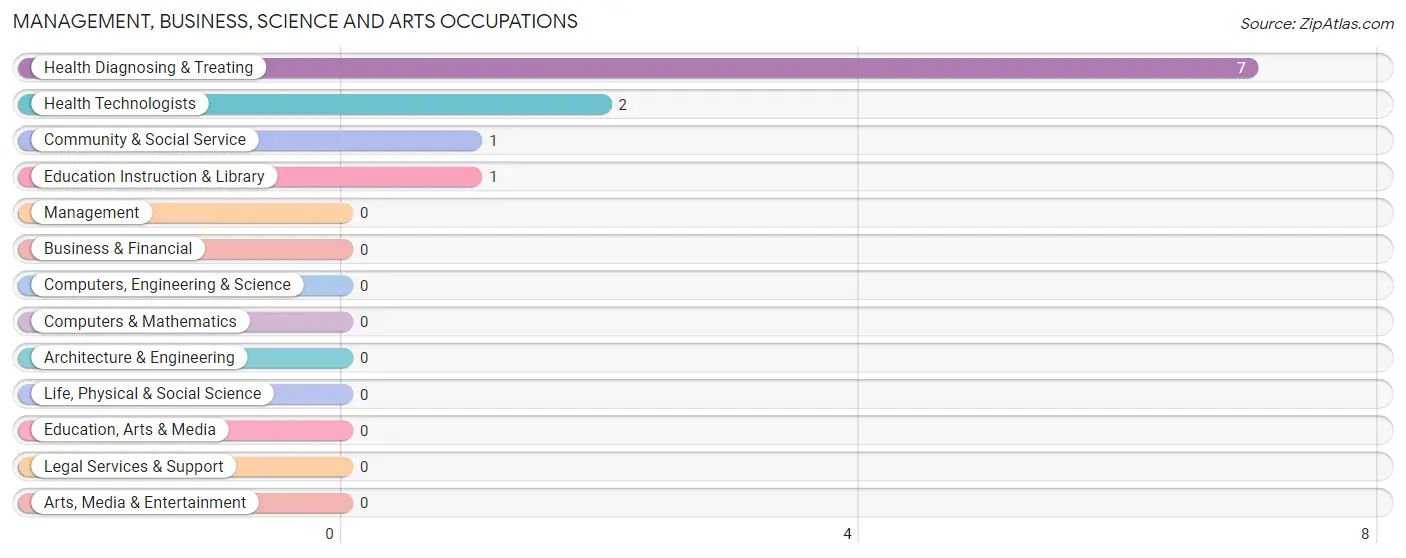
Management, Business, Science and Arts Occupations
The most common Management, Business, Science and Arts occupations in Nauvoo are Health Diagnosing & Treating (7 | 13.7%), Health Technologists (2 | 3.9%), Community & Social Service (1 | 2.0%), and Education Instruction & Library (1 | 2.0%).
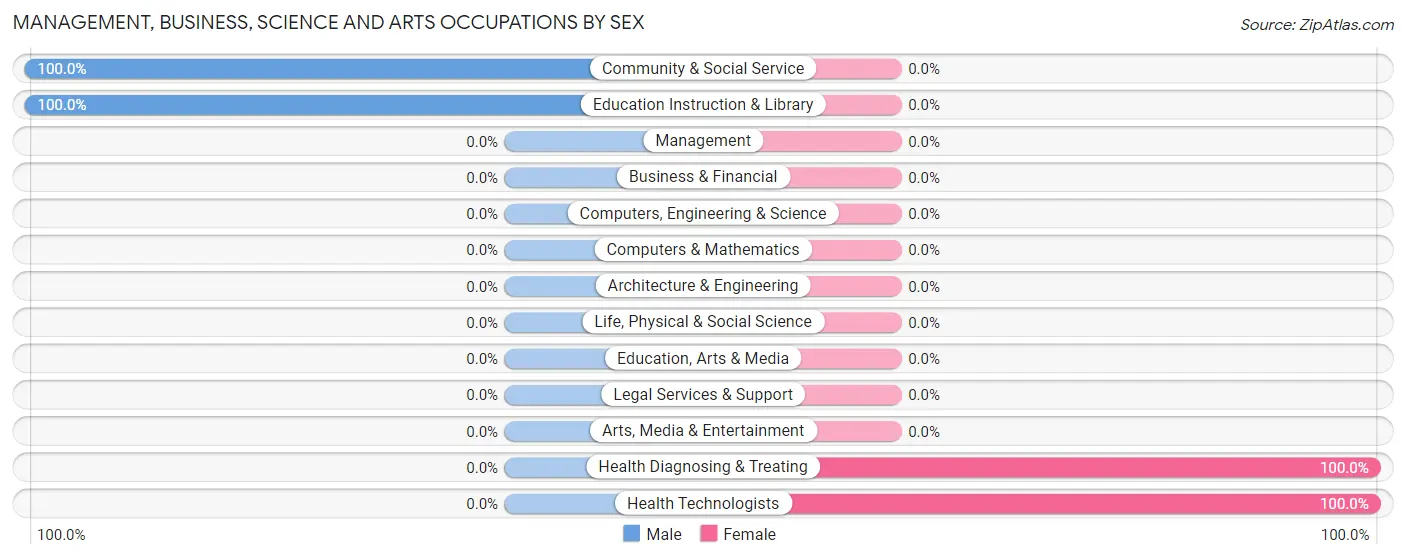
Management, Business, Science and Arts Occupations by Sex
Within the Management, Business, Science and Arts occupations in Nauvoo, the most male-oriented occupations are Community & Social Service (100.0%), and Education Instruction & Library (100.0%), while the most female-oriented occupations are Health Diagnosing & Treating (100.0%), and Health Technologists (100.0%).
| Occupation | Male | Female |
| Management | 0 (0.0%) | 0 (0.0%) |
| Business & Financial | 0 (0.0%) | 0 (0.0%) |
| Computers, Engineering & Science | 0 (0.0%) | 0 (0.0%) |
| Computers & Mathematics | 0 (0.0%) | 0 (0.0%) |
| Architecture & Engineering | 0 (0.0%) | 0 (0.0%) |
| Life, Physical & Social Science | 0 (0.0%) | 0 (0.0%) |
| Community & Social Service | 1 (100.0%) | 0 (0.0%) |
| Education, Arts & Media | 0 (0.0%) | 0 (0.0%) |
| Legal Services & Support | 0 (0.0%) | 0 (0.0%) |
| Education Instruction & Library | 1 (100.0%) | 0 (0.0%) |
| Arts, Media & Entertainment | 0 (0.0%) | 0 (0.0%) |
| Health Diagnosing & Treating | 0 (0.0%) | 7 (100.0%) |
| Health Technologists | 0 (0.0%) | 2 (100.0%) |
| Total (Category) | 1 (12.5%) | 7 (87.5%) |
| Total (Overall) | 24 (47.1%) | 27 (52.9%) |
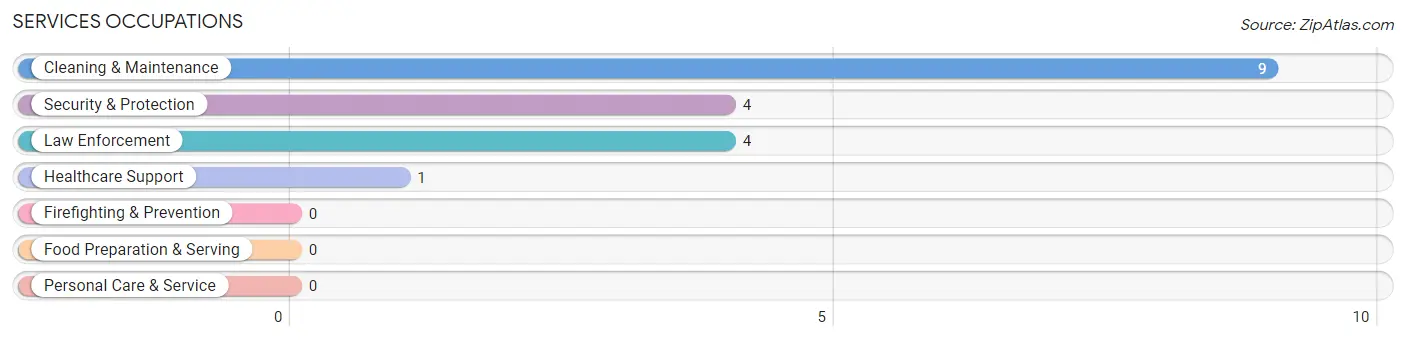
Services Occupations
The most common Services occupations in Nauvoo are Cleaning & Maintenance (9 | 17.6%), Security & Protection (4 | 7.8%), Law Enforcement (4 | 7.8%), and Healthcare Support (1 | 2.0%).
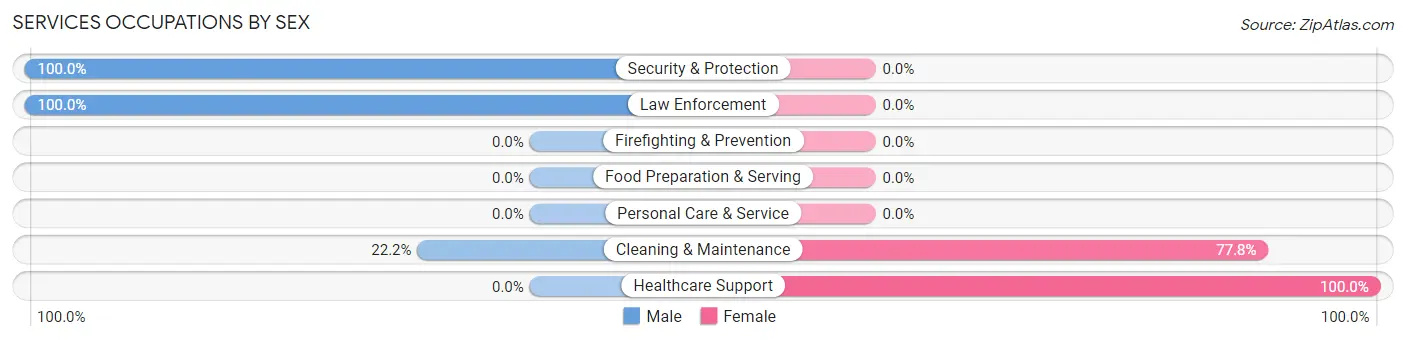
Services Occupations by Sex
Within the Services occupations in Nauvoo, the most male-oriented occupations are Security & Protection (100.0%), Law Enforcement (100.0%), and Cleaning & Maintenance (22.2%), while the most female-oriented occupations are Healthcare Support (100.0%), and Cleaning & Maintenance (77.8%).
| Occupation | Male | Female |
| Healthcare Support | 0 (0.0%) | 1 (100.0%) |
| Security & Protection | 4 (100.0%) | 0 (0.0%) |
| Firefighting & Prevention | 0 (0.0%) | 0 (0.0%) |
| Law Enforcement | 4 (100.0%) | 0 (0.0%) |
| Food Preparation & Serving | 0 (0.0%) | 0 (0.0%) |
| Cleaning & Maintenance | 2 (22.2%) | 7 (77.8%) |
| Personal Care & Service | 0 (0.0%) | 0 (0.0%) |
| Total (Category) | 6 (42.9%) | 8 (57.1%) |
| Total (Overall) | 24 (47.1%) | 27 (52.9%) |
Sales and Office Occupations
The most common Sales and Office occupations in Nauvoo are Office & Administration (3 | 5.9%), and Sales & Related (2 | 3.9%).

Sales and Office Occupations by Sex

| Occupation | Male | Female |
| Sales & Related | 2 (100.0%) | 0 (0.0%) |
| Office & Administration | 0 (0.0%) | 3 (100.0%) |
| Total (Category) | 2 (40.0%) | 3 (60.0%) |
| Total (Overall) | 24 (47.1%) | 27 (52.9%) |
Natural Resources, Construction and Maintenance Occupations
The most common Natural Resources, Construction and Maintenance occupations in Nauvoo are , and Construction & Extraction (6 | 11.8%).
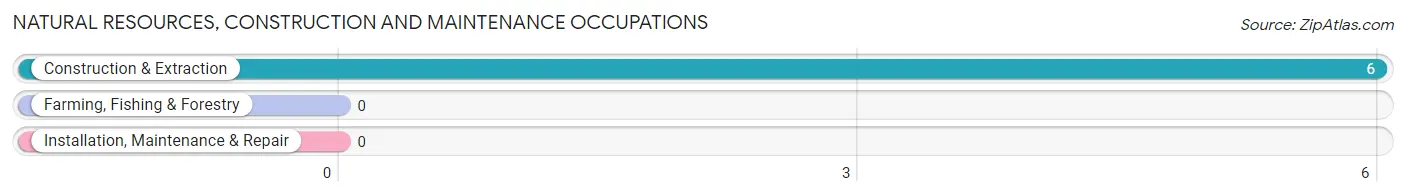
Natural Resources, Construction and Maintenance Occupations by Sex
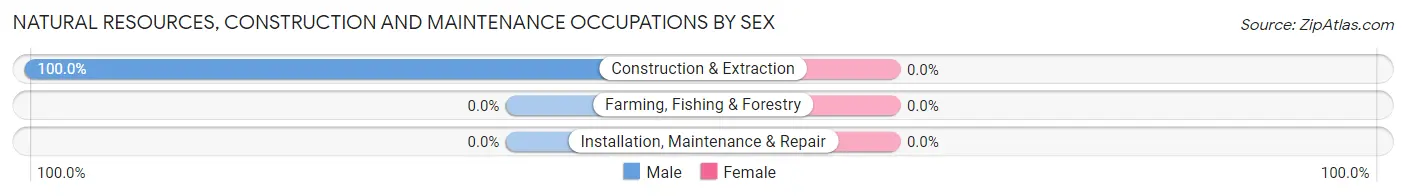
| Occupation | Male | Female |
| Farming, Fishing & Forestry | 0 (0.0%) | 0 (0.0%) |
| Construction & Extraction | 6 (100.0%) | 0 (0.0%) |
| Installation, Maintenance & Repair | 0 (0.0%) | 0 (0.0%) |
| Total (Category) | 6 (100.0%) | 0 (0.0%) |
| Total (Overall) | 24 (47.1%) | 27 (52.9%) |
Production, Transportation and Moving Occupations
The most common Production, Transportation and Moving occupations in Nauvoo are Production (11 | 21.6%), and Transportation (7 | 13.7%).
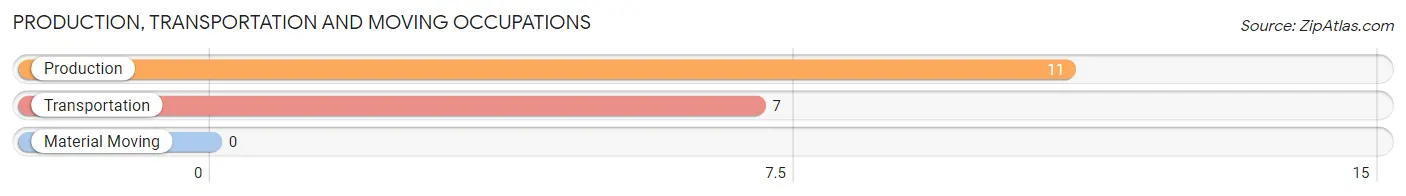
Production, Transportation and Moving Occupations by Sex
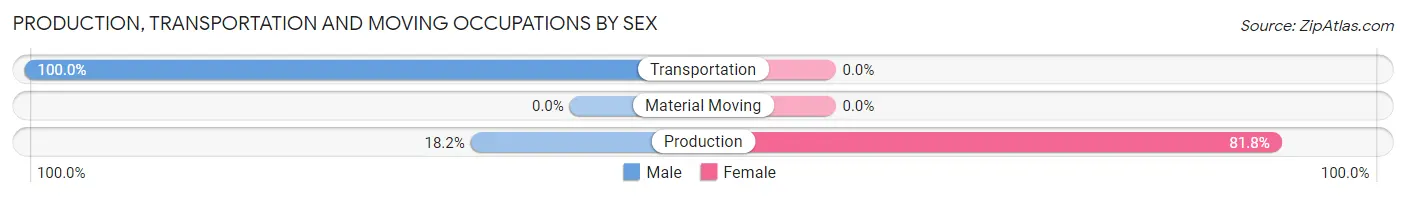
| Occupation | Male | Female |
| Production | 2 (18.2%) | 9 (81.8%) |
| Transportation | 7 (100.0%) | 0 (0.0%) |
| Material Moving | 0 (0.0%) | 0 (0.0%) |
| Total (Category) | 9 (50.0%) | 9 (50.0%) |
| Total (Overall) | 24 (47.1%) | 27 (52.9%) |
Employment Industries by Sex in Nauvoo
Employment Industries in Nauvoo
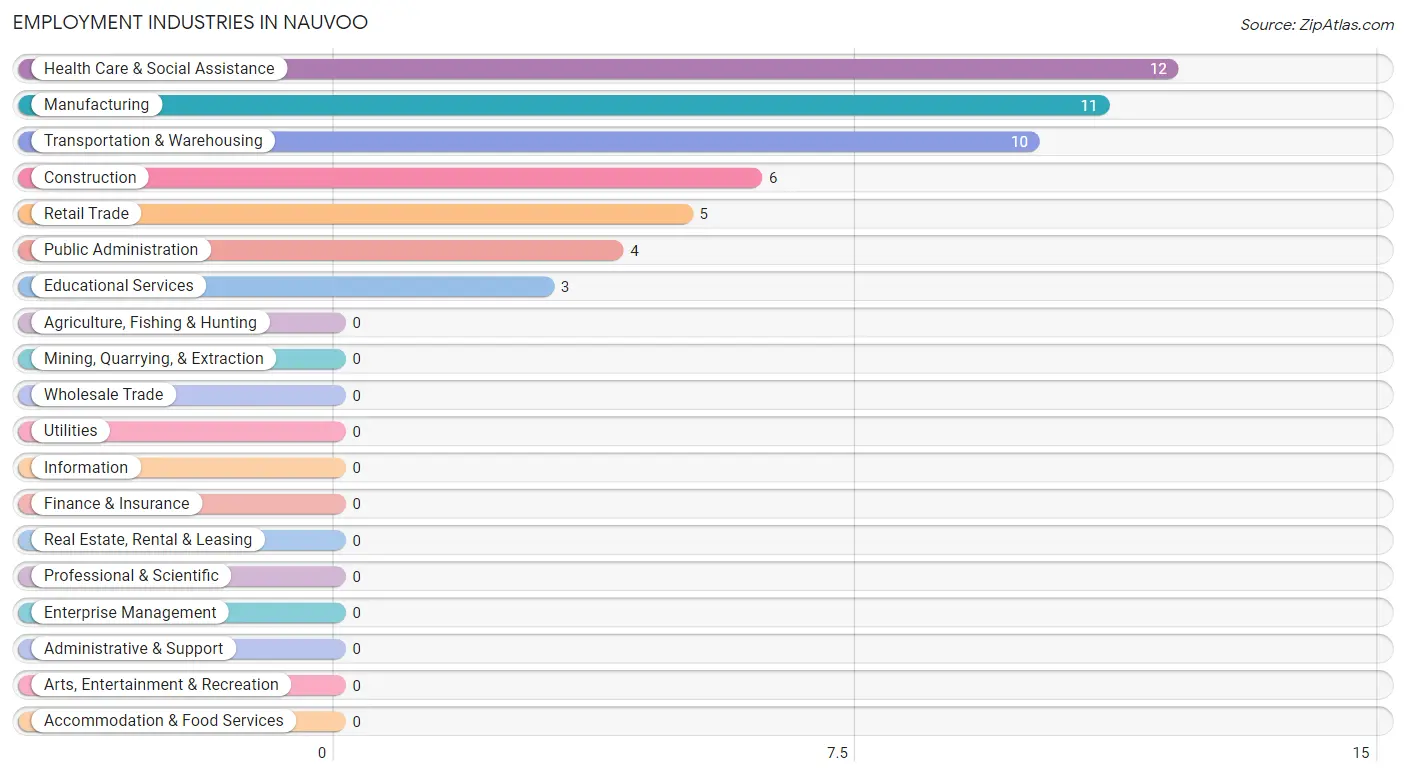
The major employment industries in Nauvoo include Health Care & Social Assistance (12 | 23.5%), Manufacturing (11 | 21.6%), Transportation & Warehousing (10 | 19.6%), Construction (6 | 11.8%), and Retail Trade (5 | 9.8%).
Employment Industries by Sex in Nauvoo
The Nauvoo industries that see more men than women are Construction (100.0%), Educational Services (100.0%), and Public Administration (100.0%), whereas the industries that tend to have a higher number of women are Health Care & Social Assistance (100.0%), Manufacturing (81.8%), and Retail Trade (60.0%).
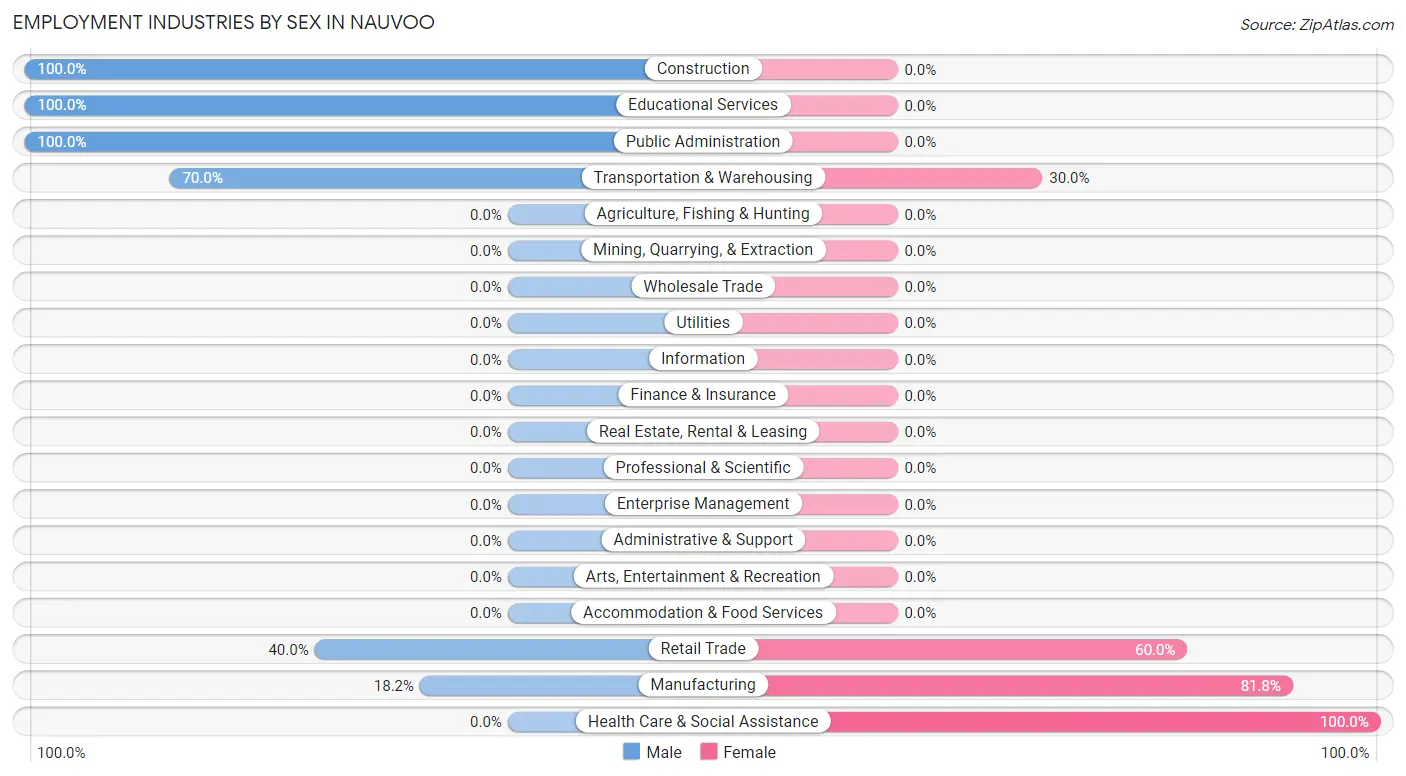
| Industry | Male | Female |
| Agriculture, Fishing & Hunting | 0 (0.0%) | 0 (0.0%) |
| Mining, Quarrying, & Extraction | 0 (0.0%) | 0 (0.0%) |
| Construction | 6 (100.0%) | 0 (0.0%) |
| Manufacturing | 2 (18.2%) | 9 (81.8%) |
| Wholesale Trade | 0 (0.0%) | 0 (0.0%) |
| Retail Trade | 2 (40.0%) | 3 (60.0%) |
| Transportation & Warehousing | 7 (70.0%) | 3 (30.0%) |
| Utilities | 0 (0.0%) | 0 (0.0%) |
| Information | 0 (0.0%) | 0 (0.0%) |
| Finance & Insurance | 0 (0.0%) | 0 (0.0%) |
| Real Estate, Rental & Leasing | 0 (0.0%) | 0 (0.0%) |
| Professional & Scientific | 0 (0.0%) | 0 (0.0%) |
| Enterprise Management | 0 (0.0%) | 0 (0.0%) |
| Administrative & Support | 0 (0.0%) | 0 (0.0%) |
| Educational Services | 3 (100.0%) | 0 (0.0%) |
| Health Care & Social Assistance | 0 (0.0%) | 12 (100.0%) |
| Arts, Entertainment & Recreation | 0 (0.0%) | 0 (0.0%) |
| Accommodation & Food Services | 0 (0.0%) | 0 (0.0%) |
| Public Administration | 4 (100.0%) | 0 (0.0%) |
| Total | 24 (47.1%) | 27 (52.9%) |
Education in Nauvoo
School Enrollment in Nauvoo
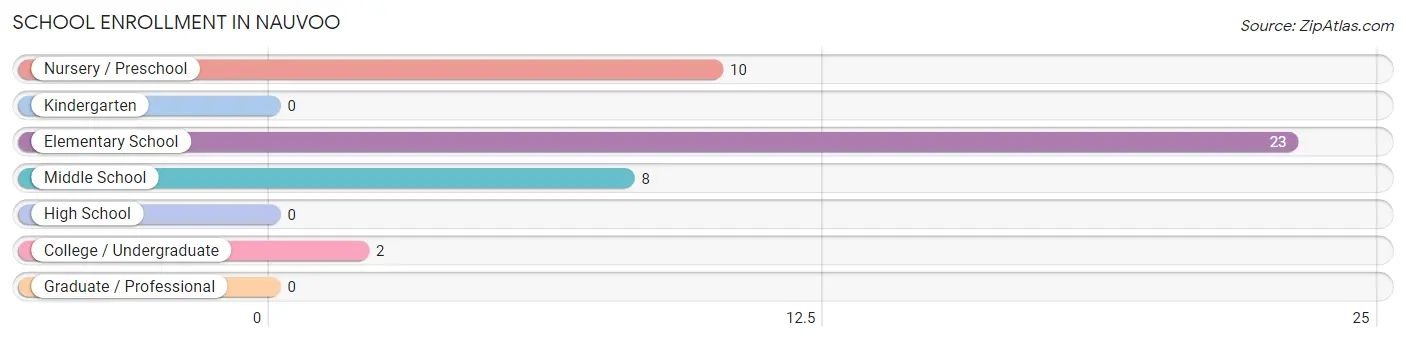
The most common levels of schooling among the 43 students in Nauvoo are elementary school (23 | 53.5%), nursery / preschool (10 | 23.3%), and middle school (8 | 18.6%).
| School Level | # Students | % Students |
| Nursery / Preschool | 10 | 23.3% |
| Kindergarten | 0 | 0.0% |
| Elementary School | 23 | 53.5% |
| Middle School | 8 | 18.6% |
| High School | 0 | 0.0% |
| College / Undergraduate | 2 | 4.6% |
| Graduate / Professional | 0 | 0.0% |
| Total | 43 | 100.0% |
School Enrollment by Age by Funding Source in Nauvoo
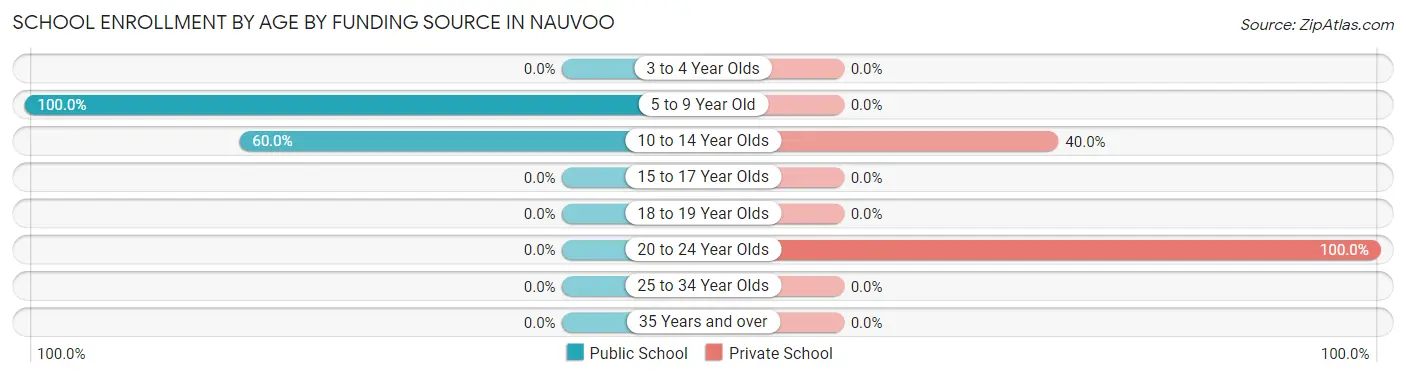
Out of a total of 43 students who are enrolled in schools in Nauvoo, 6 (14.0%) attend a private institution, while the remaining 37 (86.0%) are enrolled in public schools. The age group of 20 to 24 year olds has the highest likelihood of being enrolled in private schools, with 2 (100.0% in the age bracket) enrolled. Conversely, the age group of 5 to 9 year old has the lowest likelihood of being enrolled in a private school, with 31 (100.0% in the age bracket) attending a public institution.
| Age Bracket | Public School | Private School |
| 3 to 4 Year Olds | 0 (0.0%) | 0 (0.0%) |
| 5 to 9 Year Old | 31 (100.0%) | 0 (0.0%) |
| 10 to 14 Year Olds | 6 (60.0%) | 4 (40.0%) |
| 15 to 17 Year Olds | 0 (0.0%) | 0 (0.0%) |
| 18 to 19 Year Olds | 0 (0.0%) | 0 (0.0%) |
| 20 to 24 Year Olds | 0 (0.0%) | 2 (100.0%) |
| 25 to 34 Year Olds | 0 (0.0%) | 0 (0.0%) |
| 35 Years and over | 0 (0.0%) | 0 (0.0%) |
| Total | 37 (86.0%) | 6 (14.0%) |
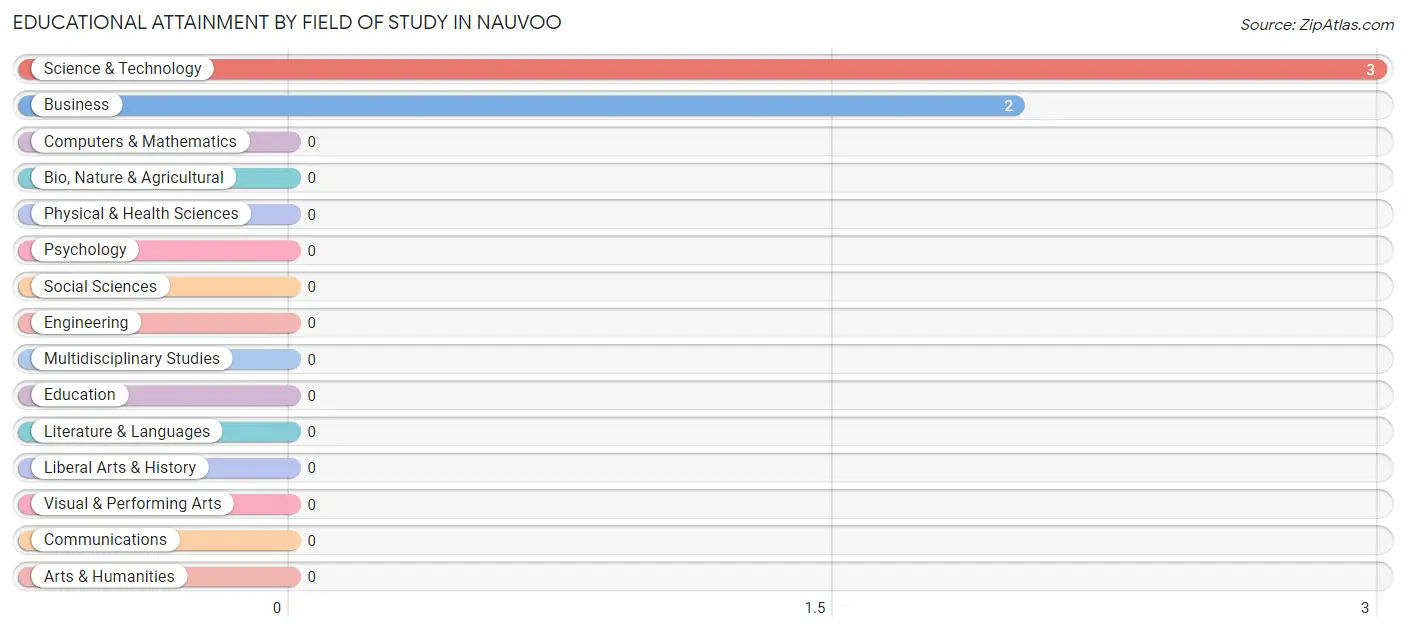
Educational Attainment by Field of Study in Nauvoo
Science & technology (3 | 60.0%), and business (2 | 40.0%) are the most common fields of study among 5 individuals in Nauvoo who have obtained a bachelor's degree or higher.
| Field of Study | # Graduates | % Graduates |
| Computers & Mathematics | 0 | 0.0% |
| Bio, Nature & Agricultural | 0 | 0.0% |
| Physical & Health Sciences | 0 | 0.0% |
| Psychology | 0 | 0.0% |
| Social Sciences | 0 | 0.0% |
| Engineering | 0 | 0.0% |
| Multidisciplinary Studies | 0 | 0.0% |
| Science & Technology | 3 | 60.0% |
| Business | 2 | 40.0% |
| Education | 0 | 0.0% |
| Literature & Languages | 0 | 0.0% |
| Liberal Arts & History | 0 | 0.0% |
| Visual & Performing Arts | 0 | 0.0% |
| Communications | 0 | 0.0% |
| Arts & Humanities | 0 | 0.0% |
| Total | 5 | 100.0% |
Transportation & Commute in Nauvoo
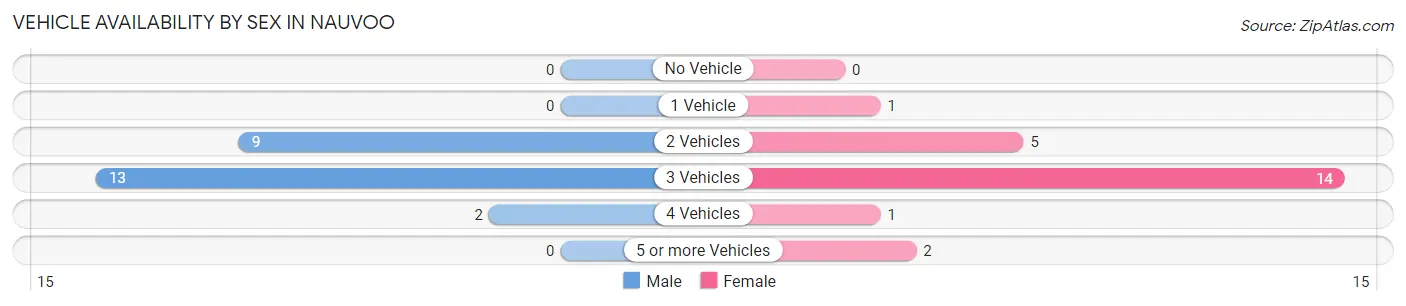
Vehicle Availability by Sex in Nauvoo
The most prevalent vehicle ownership categories in Nauvoo are males with 3 vehicles (13, accounting for 54.2%) and females with 3 vehicles (14, making up 56.5%).
| Vehicles Available | Male | Female |
| No Vehicle | 0 (0.0%) | 0 (0.0%) |
| 1 Vehicle | 0 (0.0%) | 1 (4.3%) |
| 2 Vehicles | 9 (37.5%) | 5 (21.7%) |
| 3 Vehicles | 13 (54.2%) | 14 (60.9%) |
| 4 Vehicles | 2 (8.3%) | 1 (4.3%) |
| 5 or more Vehicles | 0 (0.0%) | 2 (8.7%) |
| Total | 24 (100.0%) | 23 (100.0%) |
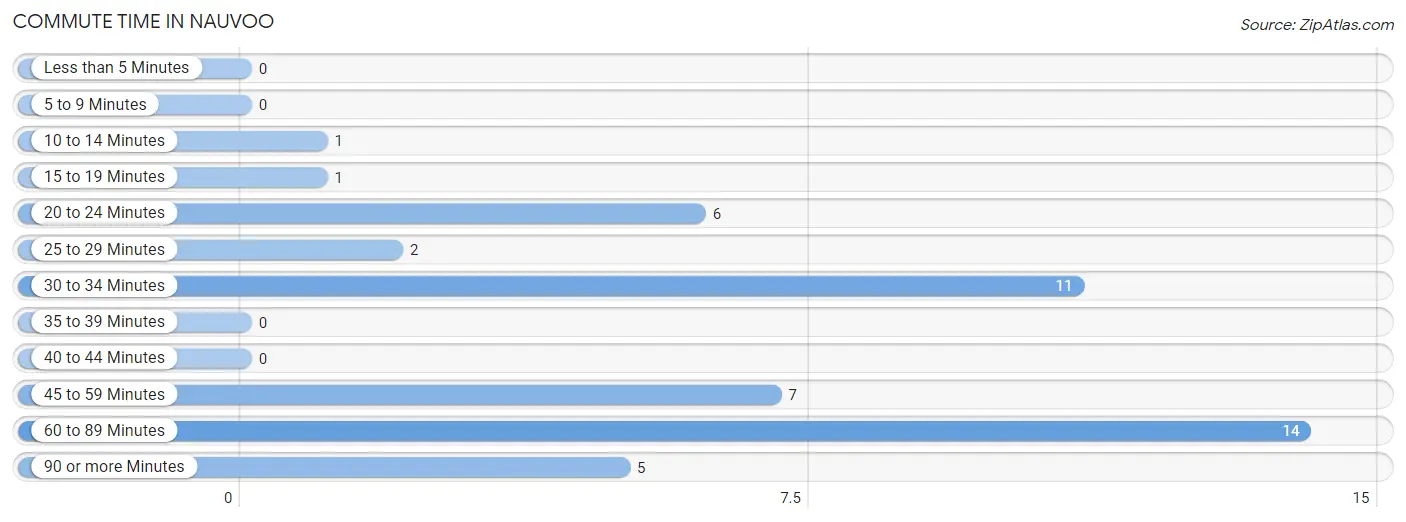
Commute Time in Nauvoo
The most frequently occuring commute durations in Nauvoo are 60 to 89 minutes (14 commuters, 29.8%), 30 to 34 minutes (11 commuters, 23.4%), and 45 to 59 minutes (7 commuters, 14.9%).
| Commute Time | # Commuters | % Commuters |
| Less than 5 Minutes | 0 | 0.0% |
| 5 to 9 Minutes | 0 | 0.0% |
| 10 to 14 Minutes | 1 | 2.1% |
| 15 to 19 Minutes | 1 | 2.1% |
| 20 to 24 Minutes | 6 | 12.8% |
| 25 to 29 Minutes | 2 | 4.3% |
| 30 to 34 Minutes | 11 | 23.4% |
| 35 to 39 Minutes | 0 | 0.0% |
| 40 to 44 Minutes | 0 | 0.0% |
| 45 to 59 Minutes | 7 | 14.9% |
| 60 to 89 Minutes | 14 | 29.8% |
| 90 or more Minutes | 5 | 10.6% |
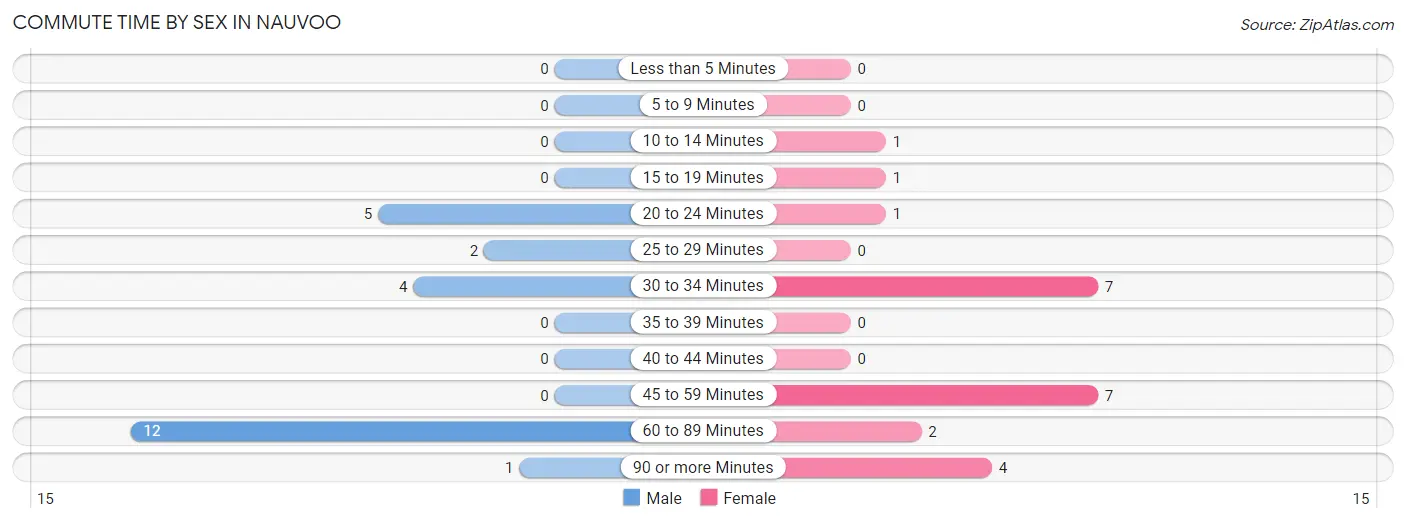
Commute Time by Sex in Nauvoo
The most common commute times in Nauvoo are 60 to 89 minutes (12 commuters, 50.0%) for males and 30 to 34 minutes (7 commuters, 30.4%) for females.
| Commute Time | Male | Female |
| Less than 5 Minutes | 0 (0.0%) | 0 (0.0%) |
| 5 to 9 Minutes | 0 (0.0%) | 0 (0.0%) |
| 10 to 14 Minutes | 0 (0.0%) | 1 (4.3%) |
| 15 to 19 Minutes | 0 (0.0%) | 1 (4.3%) |
| 20 to 24 Minutes | 5 (20.8%) | 1 (4.3%) |
| 25 to 29 Minutes | 2 (8.3%) | 0 (0.0%) |
| 30 to 34 Minutes | 4 (16.7%) | 7 (30.4%) |
| 35 to 39 Minutes | 0 (0.0%) | 0 (0.0%) |
| 40 to 44 Minutes | 0 (0.0%) | 0 (0.0%) |
| 45 to 59 Minutes | 0 (0.0%) | 7 (30.4%) |
| 60 to 89 Minutes | 12 (50.0%) | 2 (8.7%) |
| 90 or more Minutes | 1 (4.2%) | 4 (17.4%) |
Time of Departure to Work by Sex in Nauvoo
The most frequent times of departure to work in Nauvoo are 7:00 AM to 7:29 AM (14, 58.3%) for males and 7:00 AM to 7:29 AM (7, 30.4%) for females.
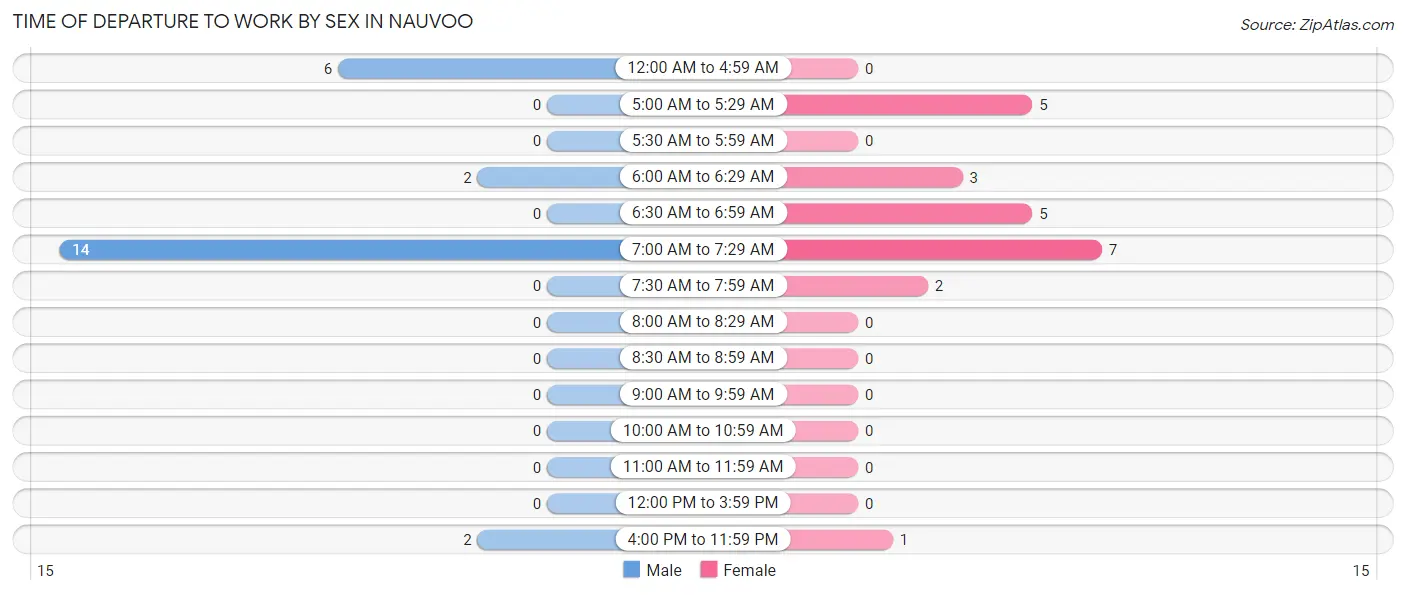
| Time of Departure | Male | Female |
| 12:00 AM to 4:59 AM | 6 (25.0%) | 0 (0.0%) |
| 5:00 AM to 5:29 AM | 0 (0.0%) | 5 (21.7%) |
| 5:30 AM to 5:59 AM | 0 (0.0%) | 0 (0.0%) |
| 6:00 AM to 6:29 AM | 2 (8.3%) | 3 (13.0%) |
| 6:30 AM to 6:59 AM | 0 (0.0%) | 5 (21.7%) |
| 7:00 AM to 7:29 AM | 14 (58.3%) | 7 (30.4%) |
| 7:30 AM to 7:59 AM | 0 (0.0%) | 2 (8.7%) |
| 8:00 AM to 8:29 AM | 0 (0.0%) | 0 (0.0%) |
| 8:30 AM to 8:59 AM | 0 (0.0%) | 0 (0.0%) |
| 9:00 AM to 9:59 AM | 0 (0.0%) | 0 (0.0%) |
| 10:00 AM to 10:59 AM | 0 (0.0%) | 0 (0.0%) |
| 11:00 AM to 11:59 AM | 0 (0.0%) | 0 (0.0%) |
| 12:00 PM to 3:59 PM | 0 (0.0%) | 0 (0.0%) |
| 4:00 PM to 11:59 PM | 2 (8.3%) | 1 (4.3%) |
| Total | 24 (100.0%) | 23 (100.0%) |
Housing Occupancy in Nauvoo
Occupancy by Ownership in Nauvoo
Of the total 64 dwellings in Nauvoo, owner-occupied units account for 49 (76.6%), while renter-occupied units make up 15 (23.4%).
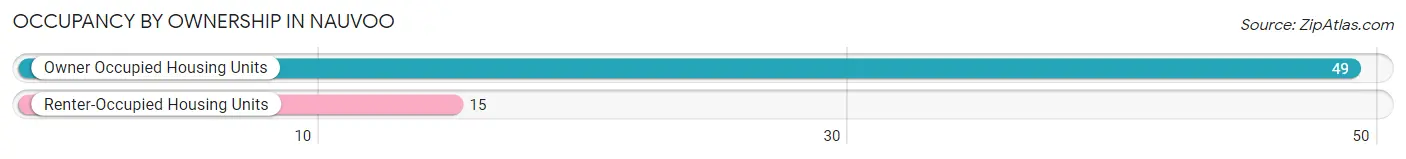
| Occupancy | # Housing Units | % Housing Units |
| Owner Occupied Housing Units | 49 | 76.6% |
| Renter-Occupied Housing Units | 15 | 23.4% |
| Total Occupied Housing Units | 64 | 100.0% |
Occupancy by Household Size in Nauvoo
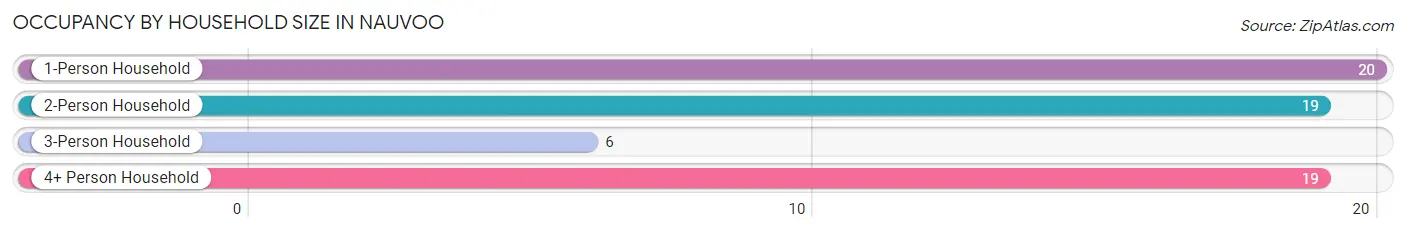
| Household Size | # Housing Units | % Housing Units |
| 1-Person Household | 20 | 31.2% |
| 2-Person Household | 19 | 29.7% |
| 3-Person Household | 6 | 9.4% |
| 4+ Person Household | 19 | 29.7% |
| Total Housing Units | 64 | 100.0% |
Occupancy by Ownership by Household Size in Nauvoo
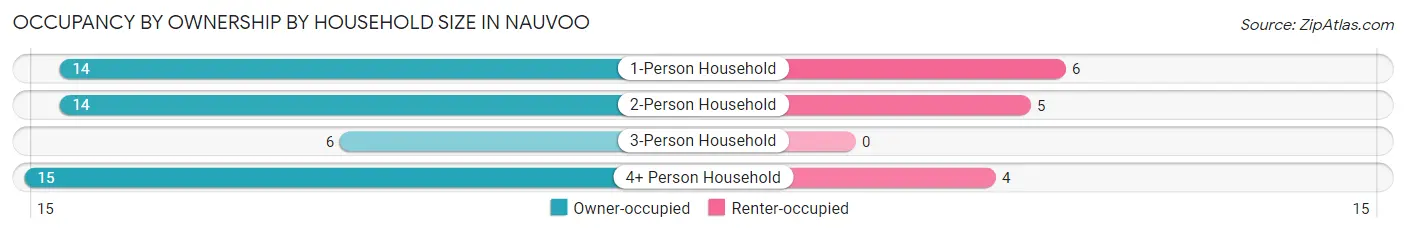
| Household Size | Owner-occupied | Renter-occupied |
| 1-Person Household | 14 (70.0%) | 6 (30.0%) |
| 2-Person Household | 14 (73.7%) | 5 (26.3%) |
| 3-Person Household | 6 (100.0%) | 0 (0.0%) |
| 4+ Person Household | 15 (78.9%) | 4 (21.0%) |
| Total Housing Units | 49 (76.6%) | 15 (23.4%) |
Occupancy by Educational Attainment in Nauvoo
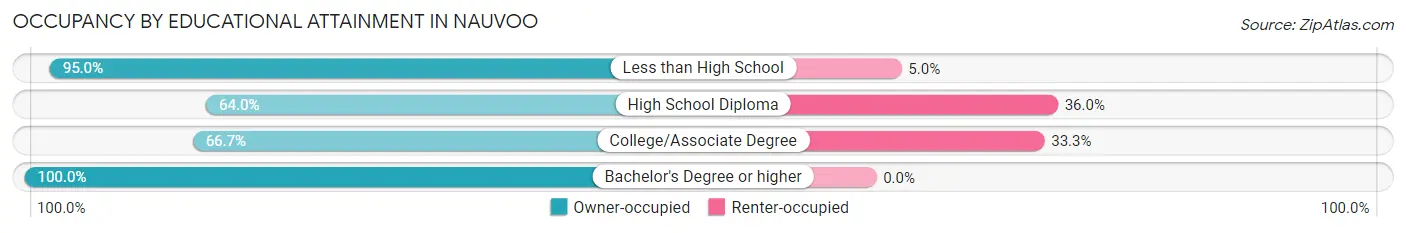
| Household Size | Owner-occupied | Renter-occupied |
| Less than High School | 19 (95.0%) | 1 (5.0%) |
| High School Diploma | 16 (64.0%) | 9 (36.0%) |
| College/Associate Degree | 10 (66.7%) | 5 (33.3%) |
| Bachelor's Degree or higher | 4 (100.0%) | 0 (0.0%) |
Occupancy by Age of Householder in Nauvoo
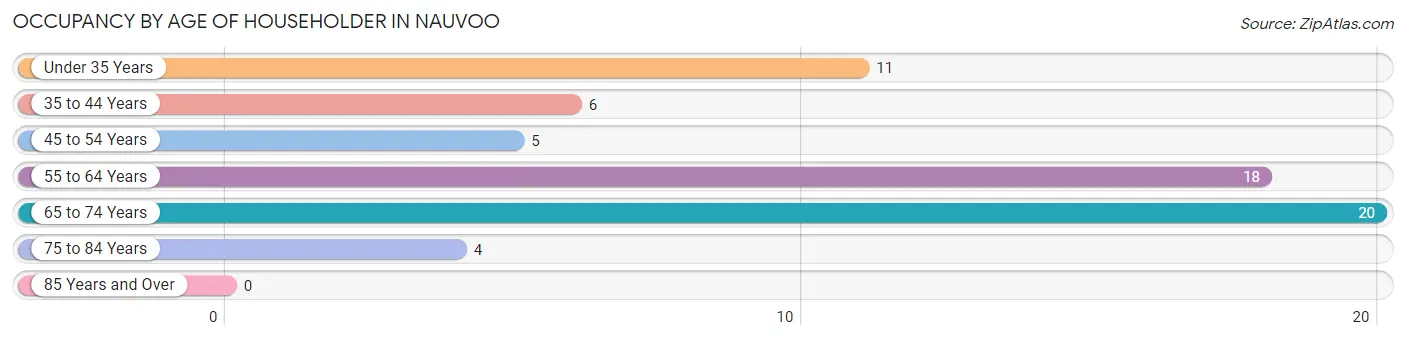
| Age Bracket | # Households | % Households |
| Under 35 Years | 11 | 17.2% |
| 35 to 44 Years | 6 | 9.4% |
| 45 to 54 Years | 5 | 7.8% |
| 55 to 64 Years | 18 | 28.1% |
| 65 to 74 Years | 20 | 31.2% |
| 75 to 84 Years | 4 | 6.2% |
| 85 Years and Over | 0 | 0.0% |
| Total | 64 | 100.0% |
Housing Finances in Nauvoo
Median Income by Occupancy in Nauvoo
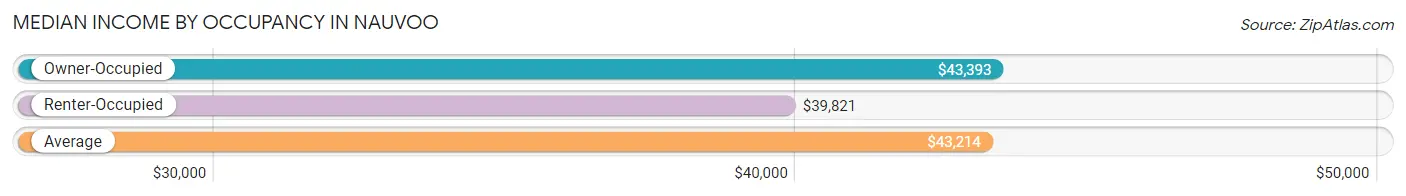
| Occupancy Type | # Households | Median Income |
| Owner-Occupied | 49 (76.6%) | $43,393 |
| Renter-Occupied | 15 (23.4%) | $39,821 |
| Average | 64 (100.0%) | $43,214 |
Occupancy by Householder Income Bracket in Nauvoo
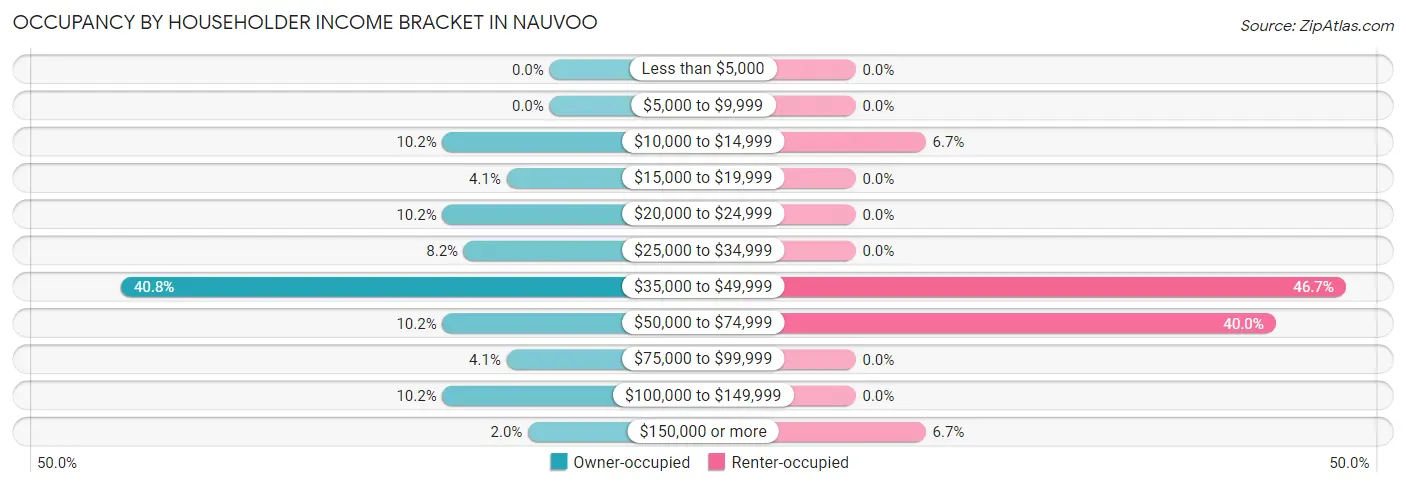
| Income Bracket | Owner-occupied | Renter-occupied |
| Less than $5,000 | 0 (0.0%) | 0 (0.0%) |
| $5,000 to $9,999 | 0 (0.0%) | 0 (0.0%) |
| $10,000 to $14,999 | 5 (10.2%) | 1 (6.7%) |
| $15,000 to $19,999 | 2 (4.1%) | 0 (0.0%) |
| $20,000 to $24,999 | 5 (10.2%) | 0 (0.0%) |
| $25,000 to $34,999 | 4 (8.2%) | 0 (0.0%) |
| $35,000 to $49,999 | 20 (40.8%) | 7 (46.7%) |
| $50,000 to $74,999 | 5 (10.2%) | 6 (40.0%) |
| $75,000 to $99,999 | 2 (4.1%) | 0 (0.0%) |
| $100,000 to $149,999 | 5 (10.2%) | 0 (0.0%) |
| $150,000 or more | 1 (2.0%) | 1 (6.7%) |
| Total | 49 (100.0%) | 15 (100.0%) |
Monthly Housing Cost Tiers in Nauvoo
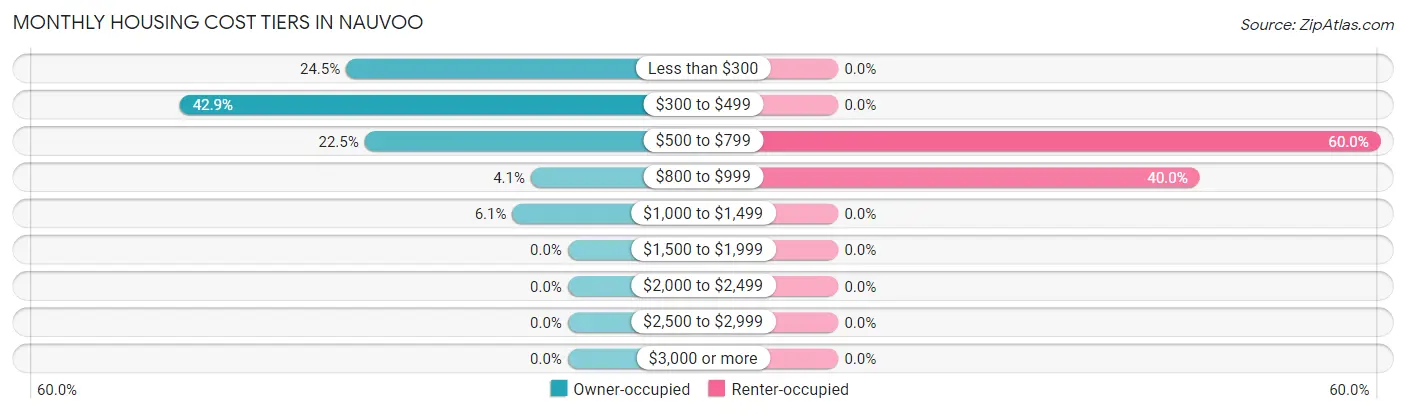
| Monthly Cost | Owner-occupied | Renter-occupied |
| Less than $300 | 12 (24.5%) | 0 (0.0%) |
| $300 to $499 | 21 (42.9%) | 0 (0.0%) |
| $500 to $799 | 11 (22.5%) | 9 (60.0%) |
| $800 to $999 | 2 (4.1%) | 6 (40.0%) |
| $1,000 to $1,499 | 3 (6.1%) | 0 (0.0%) |
| $1,500 to $1,999 | 0 (0.0%) | 0 (0.0%) |
| $2,000 to $2,499 | 0 (0.0%) | 0 (0.0%) |
| $2,500 to $2,999 | 0 (0.0%) | 0 (0.0%) |
| $3,000 or more | 0 (0.0%) | 0 (0.0%) |
| Total | 49 (100.0%) | 15 (100.0%) |
Physical Housing Characteristics in Nauvoo
Housing Structures in Nauvoo
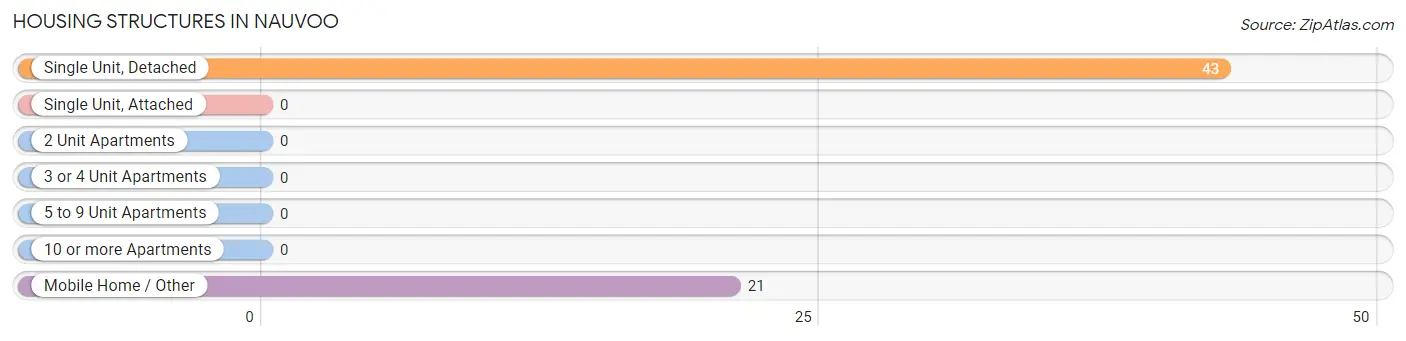
| Structure Type | # Housing Units | % Housing Units |
| Single Unit, Detached | 43 | 67.2% |
| Single Unit, Attached | 0 | 0.0% |
| 2 Unit Apartments | 0 | 0.0% |
| 3 or 4 Unit Apartments | 0 | 0.0% |
| 5 to 9 Unit Apartments | 0 | 0.0% |
| 10 or more Apartments | 0 | 0.0% |
| Mobile Home / Other | 21 | 32.8% |
| Total | 64 | 100.0% |
Housing Structures by Occupancy in Nauvoo
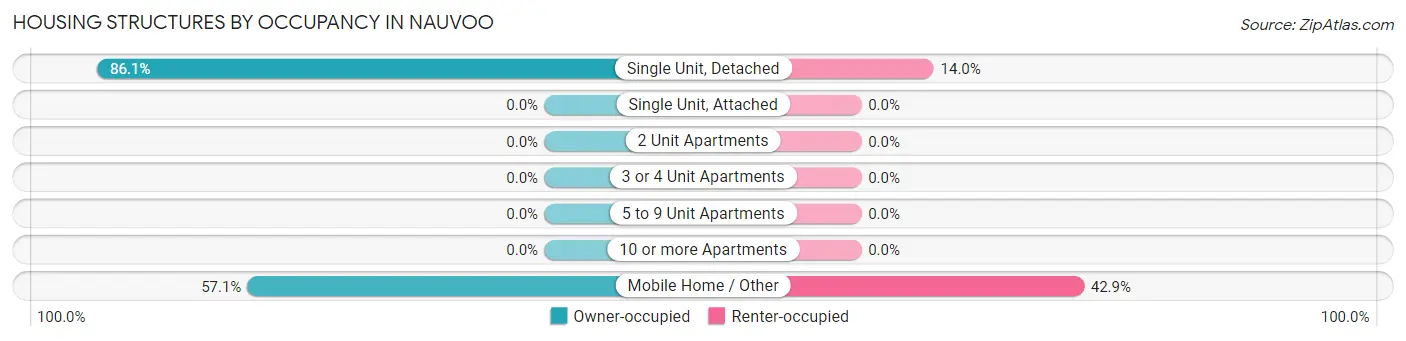
| Structure Type | Owner-occupied | Renter-occupied |
| Single Unit, Detached | 37 (86.1%) | 6 (14.0%) |
| Single Unit, Attached | 0 (0.0%) | 0 (0.0%) |
| 2 Unit Apartments | 0 (0.0%) | 0 (0.0%) |
| 3 or 4 Unit Apartments | 0 (0.0%) | 0 (0.0%) |
| 5 to 9 Unit Apartments | 0 (0.0%) | 0 (0.0%) |
| 10 or more Apartments | 0 (0.0%) | 0 (0.0%) |
| Mobile Home / Other | 12 (57.1%) | 9 (42.9%) |
| Total | 49 (76.6%) | 15 (23.4%) |
Housing Structures by Number of Rooms in Nauvoo
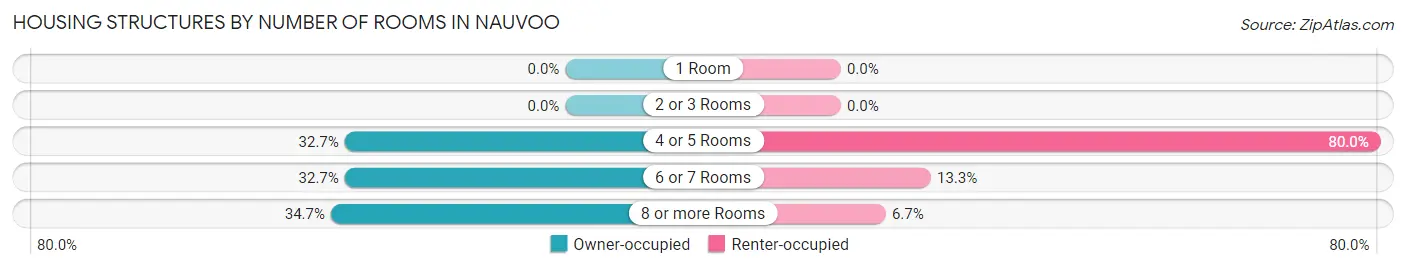
| Number of Rooms | Owner-occupied | Renter-occupied |
| 1 Room | 0 (0.0%) | 0 (0.0%) |
| 2 or 3 Rooms | 0 (0.0%) | 0 (0.0%) |
| 4 or 5 Rooms | 16 (32.7%) | 12 (80.0%) |
| 6 or 7 Rooms | 16 (32.7%) | 2 (13.3%) |
| 8 or more Rooms | 17 (34.7%) | 1 (6.7%) |
| Total | 49 (100.0%) | 15 (100.0%) |
Housing Structure by Heating Type in Nauvoo
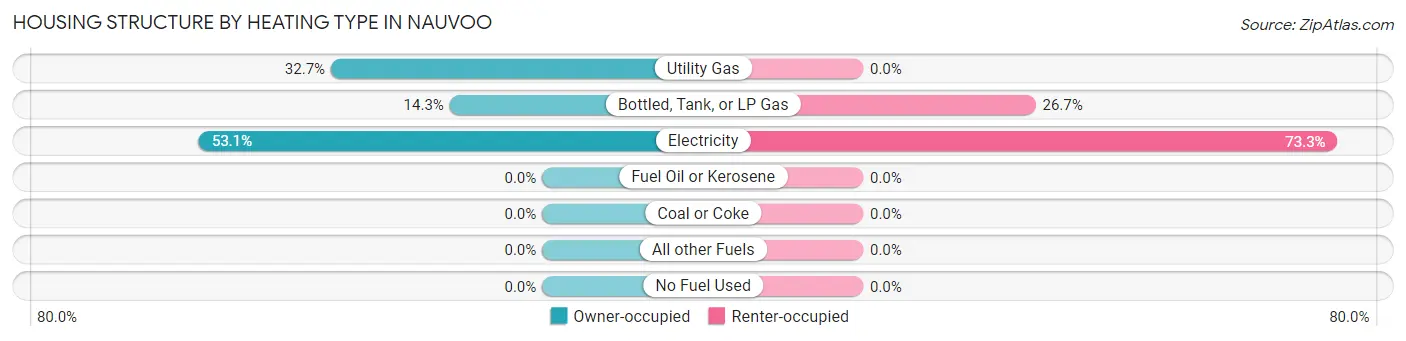
| Heating Type | Owner-occupied | Renter-occupied |
| Utility Gas | 16 (32.7%) | 0 (0.0%) |
| Bottled, Tank, or LP Gas | 7 (14.3%) | 4 (26.7%) |
| Electricity | 26 (53.1%) | 11 (73.3%) |
| Fuel Oil or Kerosene | 0 (0.0%) | 0 (0.0%) |
| Coal or Coke | 0 (0.0%) | 0 (0.0%) |
| All other Fuels | 0 (0.0%) | 0 (0.0%) |
| No Fuel Used | 0 (0.0%) | 0 (0.0%) |
| Total | 49 (100.0%) | 15 (100.0%) |
Household Vehicle Usage in Nauvoo
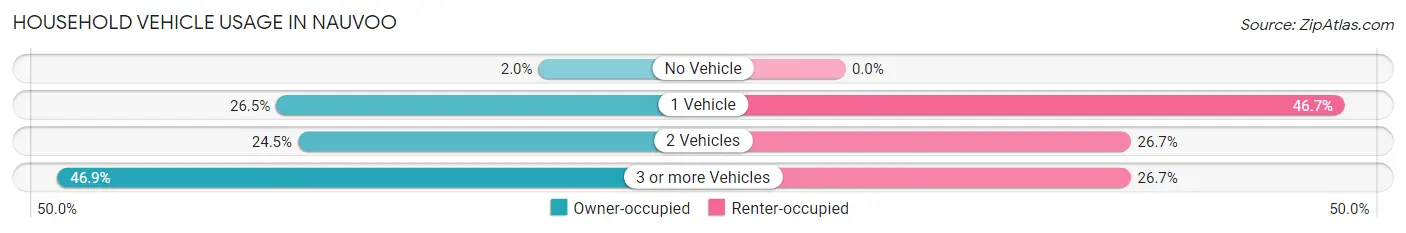
| Vehicles per Household | Owner-occupied | Renter-occupied |
| No Vehicle | 1 (2.0%) | 0 (0.0%) |
| 1 Vehicle | 13 (26.5%) | 7 (46.7%) |
| 2 Vehicles | 12 (24.5%) | 4 (26.7%) |
| 3 or more Vehicles | 23 (46.9%) | 4 (26.7%) |
| Total | 49 (100.0%) | 15 (100.0%) |
Real Estate & Mortgages in Nauvoo
Real Estate and Mortgage Overview in Nauvoo
| Characteristic | Without Mortgage | With Mortgage |
| Housing Units | 40 | 9 |
| Median Property Value | $70,000 | $152,500 |
| Median Household Income | $41,250 | $0 |
| Monthly Housing Costs | $325 | $0 |
| Real Estate Taxes | $300 | $0 |
Property Value by Mortgage Status in Nauvoo
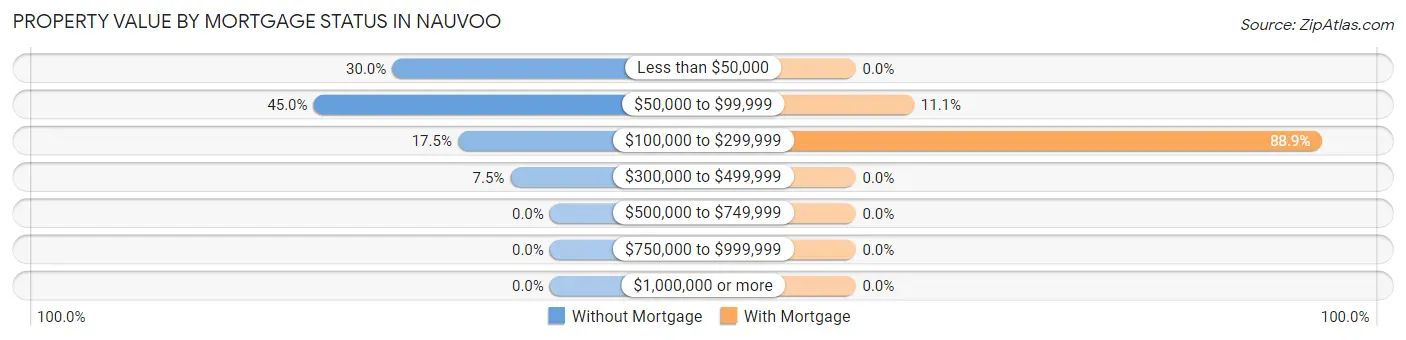
| Property Value | Without Mortgage | With Mortgage |
| Less than $50,000 | 12 (30.0%) | 0 (0.0%) |
| $50,000 to $99,999 | 18 (45.0%) | 1 (11.1%) |
| $100,000 to $299,999 | 7 (17.5%) | 8 (88.9%) |
| $300,000 to $499,999 | 3 (7.5%) | 0 (0.0%) |
| $500,000 to $749,999 | 0 (0.0%) | 0 (0.0%) |
| $750,000 to $999,999 | 0 (0.0%) | 0 (0.0%) |
| $1,000,000 or more | 0 (0.0%) | 0 (0.0%) |
| Total | 40 (100.0%) | 9 (100.0%) |
Household Income by Mortgage Status in Nauvoo
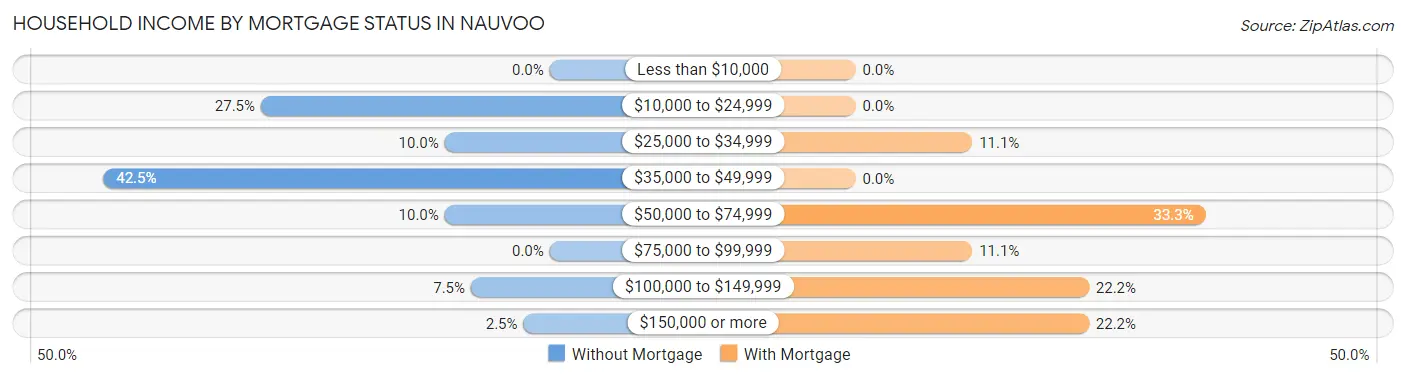
| Household Income | Without Mortgage | With Mortgage |
| Less than $10,000 | 0 (0.0%) | 0 (0.0%) |
| $10,000 to $24,999 | 11 (27.5%) | 0 (0.0%) |
| $25,000 to $34,999 | 4 (10.0%) | 1 (11.1%) |
| $35,000 to $49,999 | 17 (42.5%) | 0 (0.0%) |
| $50,000 to $74,999 | 4 (10.0%) | 3 (33.3%) |
| $75,000 to $99,999 | 0 (0.0%) | 1 (11.1%) |
| $100,000 to $149,999 | 3 (7.5%) | 2 (22.2%) |
| $150,000 or more | 1 (2.5%) | 2 (22.2%) |
| Total | 40 (100.0%) | 9 (100.0%) |
Property Value to Household Income Ratio in Nauvoo
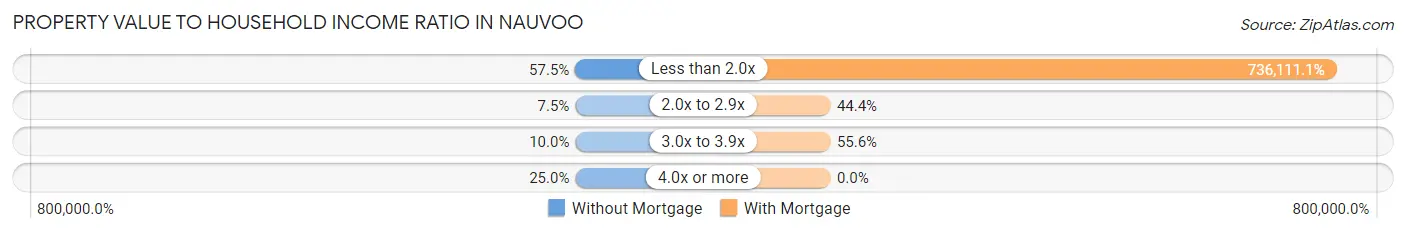
| Value-to-Income Ratio | Without Mortgage | With Mortgage |
| Less than 2.0x | 23 (57.5%) | 66,250 (736,111.1%) |
| 2.0x to 2.9x | 3 (7.5%) | 4 (44.4%) |
| 3.0x to 3.9x | 4 (10.0%) | 5 (55.6%) |
| 4.0x or more | 10 (25.0%) | 0 (0.0%) |
| Total | 40 (100.0%) | 9 (100.0%) |
Real Estate Taxes by Mortgage Status in Nauvoo
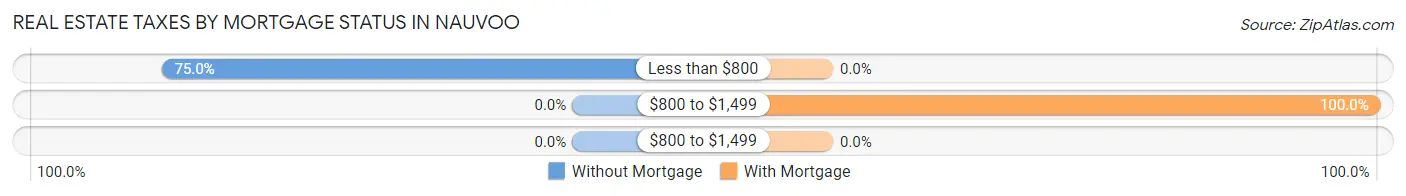
| Property Taxes | Without Mortgage | With Mortgage |
| Less than $800 | 30 (75.0%) | 0 (0.0%) |
| $800 to $1,499 | 0 (0.0%) | 9 (100.0%) |
| $800 to $1,499 | 0 (0.0%) | 0 (0.0%) |
| Total | 40 (100.0%) | 9 (100.0%) |
Health & Disability in Nauvoo
Health Insurance Coverage by Age in Nauvoo
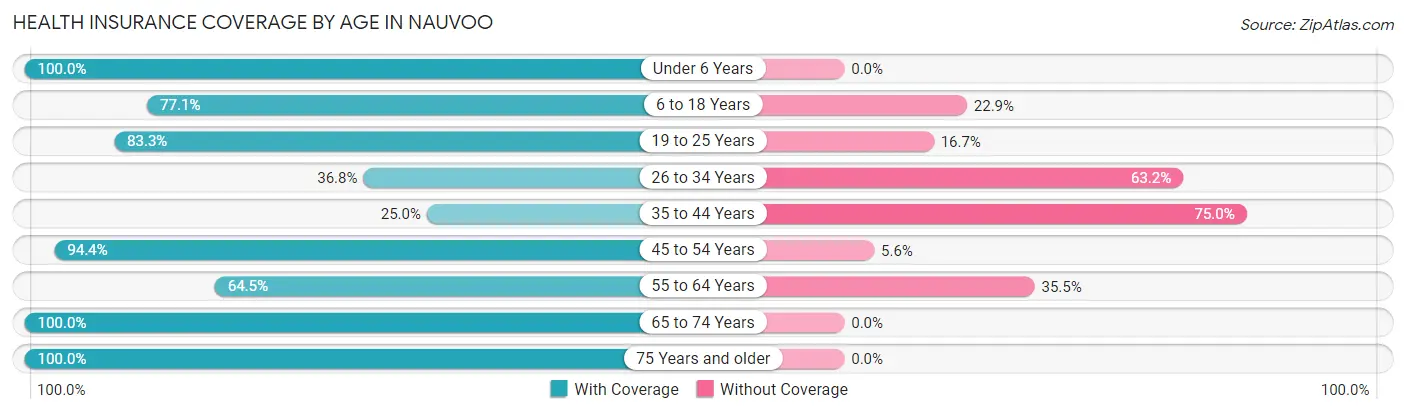
| Age Bracket | With Coverage | Without Coverage |
| Under 6 Years | 15 (100.0%) | 0 (0.0%) |
| 6 to 18 Years | 27 (77.1%) | 8 (22.9%) |
| 19 to 25 Years | 5 (83.3%) | 1 (16.7%) |
| 26 to 34 Years | 7 (36.8%) | 12 (63.2%) |
| 35 to 44 Years | 4 (25.0%) | 12 (75.0%) |
| 45 to 54 Years | 17 (94.4%) | 1 (5.6%) |
| 55 to 64 Years | 20 (64.5%) | 11 (35.5%) |
| 65 to 74 Years | 24 (100.0%) | 0 (0.0%) |
| 75 Years and older | 4 (100.0%) | 0 (0.0%) |
| Total | 123 (73.2%) | 45 (26.8%) |
Health Insurance Coverage by Citizenship Status in Nauvoo
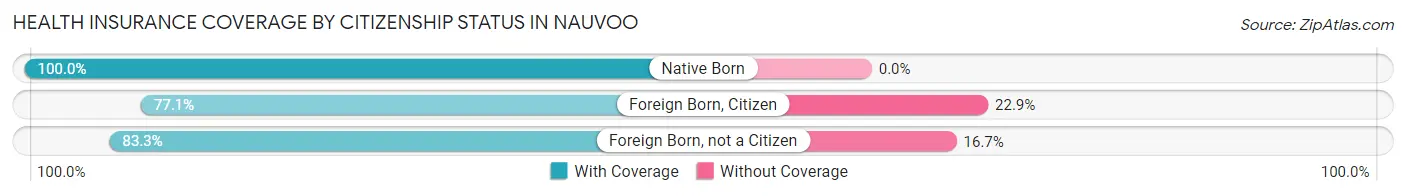
| Citizenship Status | With Coverage | Without Coverage |
| Native Born | 15 (100.0%) | 0 (0.0%) |
| Foreign Born, Citizen | 27 (77.1%) | 8 (22.9%) |
| Foreign Born, not a Citizen | 5 (83.3%) | 1 (16.7%) |
Health Insurance Coverage by Household Income in Nauvoo
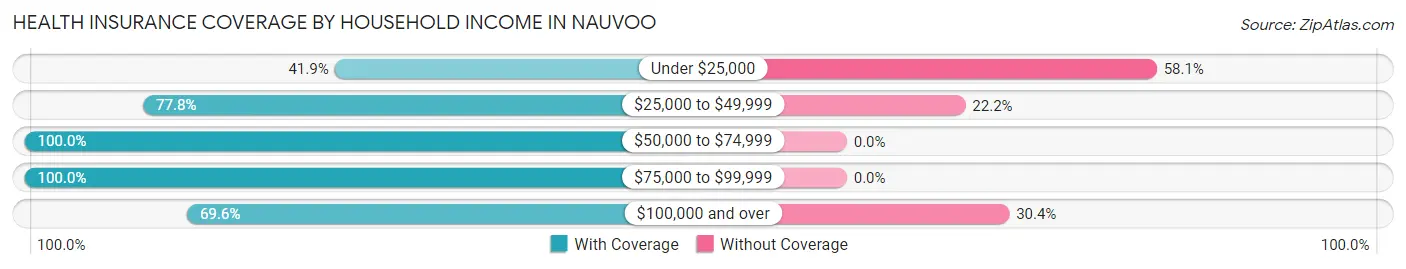
| Household Income | With Coverage | Without Coverage |
| Under $25,000 | 13 (41.9%) | 18 (58.1%) |
| $25,000 to $49,999 | 70 (77.8%) | 20 (22.2%) |
| $50,000 to $74,999 | 16 (100.0%) | 0 (0.0%) |
| $75,000 to $99,999 | 8 (100.0%) | 0 (0.0%) |
| $100,000 and over | 16 (69.6%) | 7 (30.4%) |
Public vs Private Health Insurance Coverage by Age in Nauvoo
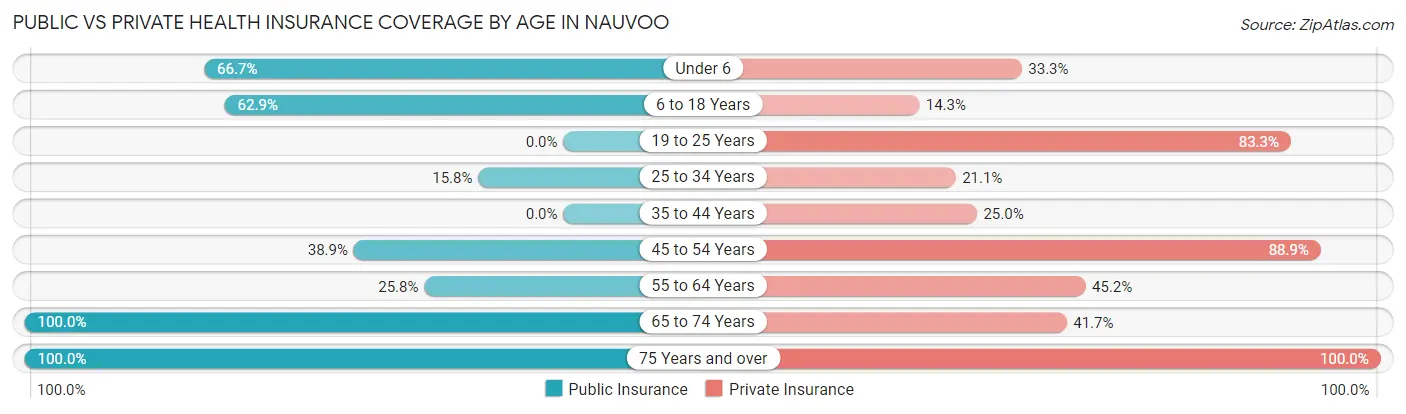
| Age Bracket | Public Insurance | Private Insurance |
| Under 6 | 10 (66.7%) | 5 (33.3%) |
| 6 to 18 Years | 22 (62.9%) | 5 (14.3%) |
| 19 to 25 Years | 0 (0.0%) | 5 (83.3%) |
| 25 to 34 Years | 3 (15.8%) | 4 (21.0%) |
| 35 to 44 Years | 0 (0.0%) | 4 (25.0%) |
| 45 to 54 Years | 7 (38.9%) | 16 (88.9%) |
| 55 to 64 Years | 8 (25.8%) | 14 (45.2%) |
| 65 to 74 Years | 24 (100.0%) | 10 (41.7%) |
| 75 Years and over | 4 (100.0%) | 4 (100.0%) |
| Total | 78 (46.4%) | 67 (39.9%) |
Disability Status by Sex by Age in Nauvoo
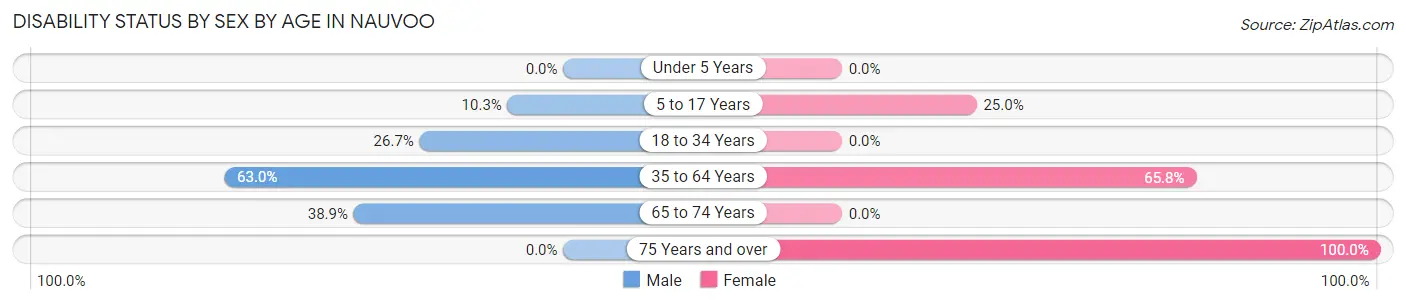
| Age Bracket | Male | Female |
| Under 5 Years | 0 (0.0%) | 0 (0.0%) |
| 5 to 17 Years | 3 (10.3%) | 4 (25.0%) |
| 18 to 34 Years | 4 (26.7%) | 0 (0.0%) |
| 35 to 64 Years | 17 (63.0%) | 25 (65.8%) |
| 65 to 74 Years | 7 (38.9%) | 0 (0.0%) |
| 75 Years and over | 0 (0.0%) | 4 (100.0%) |
Disability Class by Sex by Age in Nauvoo
Disability Class: Hearing Difficulty
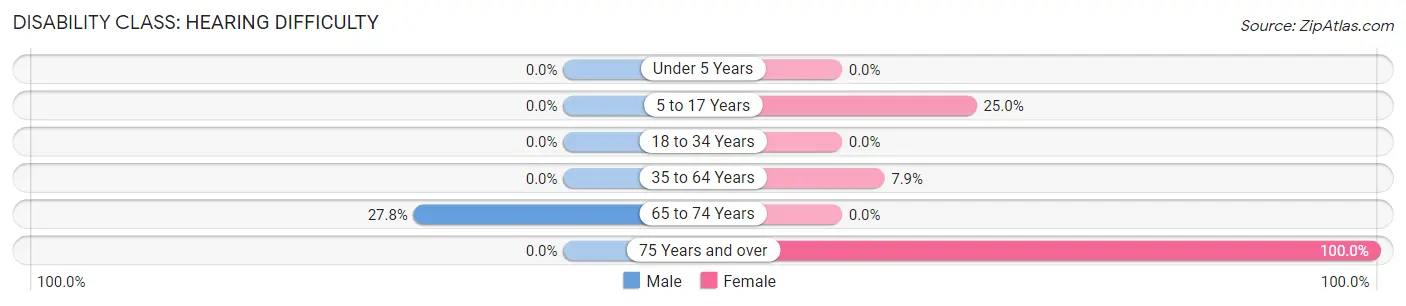
| Age Bracket | Male | Female |
| Under 5 Years | 0 (0.0%) | 0 (0.0%) |
| 5 to 17 Years | 0 (0.0%) | 4 (25.0%) |
| 18 to 34 Years | 0 (0.0%) | 0 (0.0%) |
| 35 to 64 Years | 0 (0.0%) | 3 (7.9%) |
| 65 to 74 Years | 5 (27.8%) | 0 (0.0%) |
| 75 Years and over | 0 (0.0%) | 4 (100.0%) |
Disability Class: Vision Difficulty
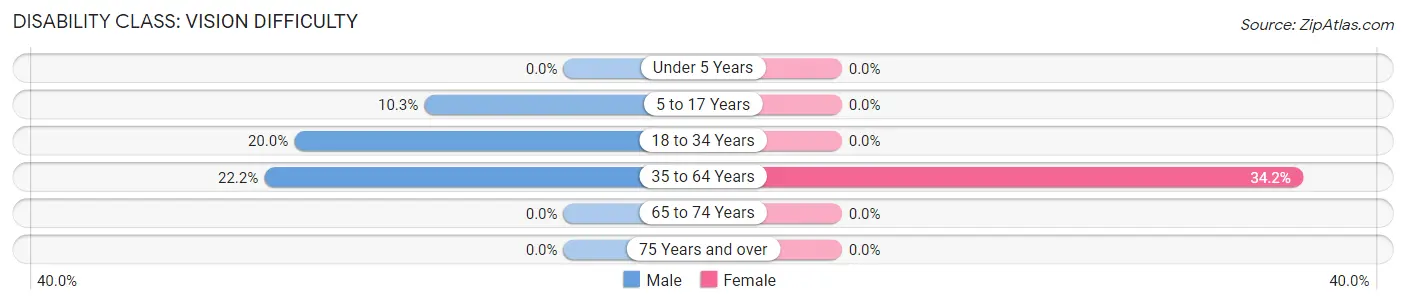
| Age Bracket | Male | Female |
| Under 5 Years | 0 (0.0%) | 0 (0.0%) |
| 5 to 17 Years | 3 (10.3%) | 0 (0.0%) |
| 18 to 34 Years | 3 (20.0%) | 0 (0.0%) |
| 35 to 64 Years | 6 (22.2%) | 13 (34.2%) |
| 65 to 74 Years | 0 (0.0%) | 0 (0.0%) |
| 75 Years and over | 0 (0.0%) | 0 (0.0%) |
Disability Class: Cognitive Difficulty
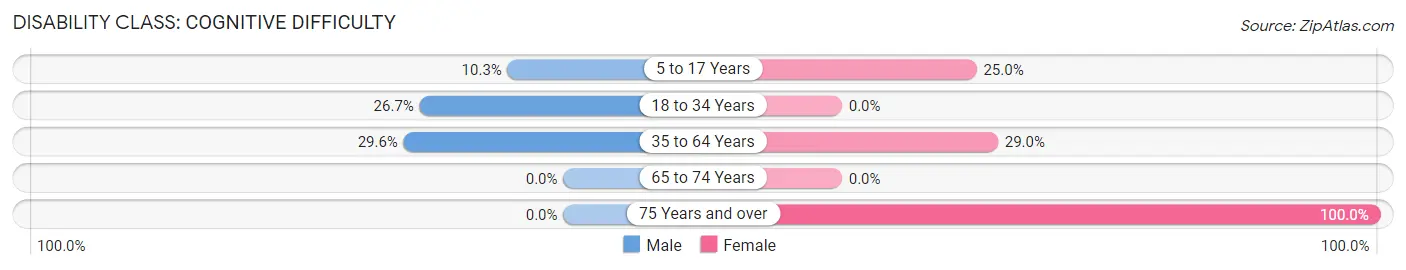
| Age Bracket | Male | Female |
| 5 to 17 Years | 3 (10.3%) | 4 (25.0%) |
| 18 to 34 Years | 4 (26.7%) | 0 (0.0%) |
| 35 to 64 Years | 8 (29.6%) | 11 (28.9%) |
| 65 to 74 Years | 0 (0.0%) | 0 (0.0%) |
| 75 Years and over | 0 (0.0%) | 4 (100.0%) |
Disability Class: Ambulatory Difficulty
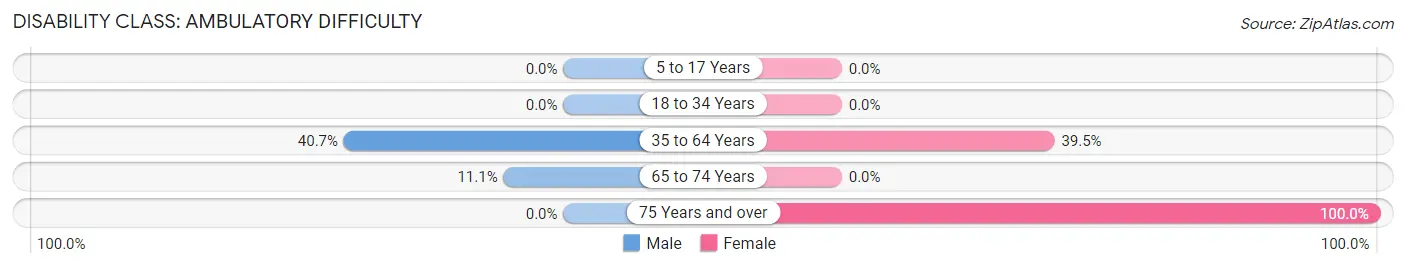
| Age Bracket | Male | Female |
| 5 to 17 Years | 0 (0.0%) | 0 (0.0%) |
| 18 to 34 Years | 0 (0.0%) | 0 (0.0%) |
| 35 to 64 Years | 11 (40.7%) | 15 (39.5%) |
| 65 to 74 Years | 2 (11.1%) | 0 (0.0%) |
| 75 Years and over | 0 (0.0%) | 4 (100.0%) |
Disability Class: Self-Care Difficulty
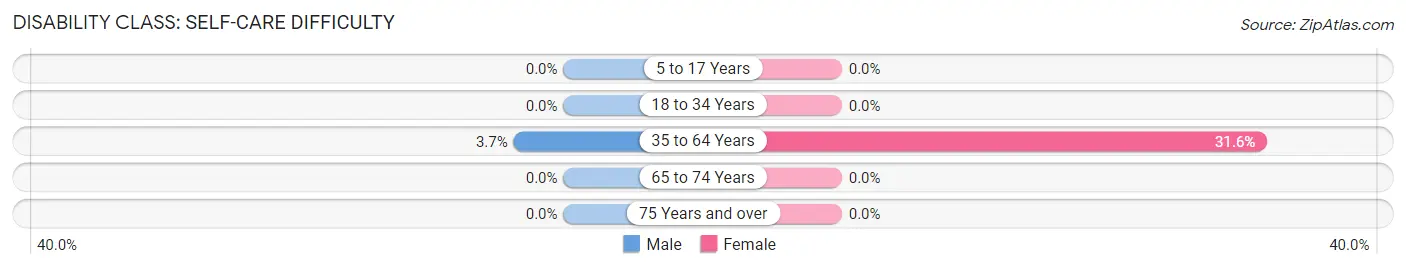
| Age Bracket | Male | Female |
| 5 to 17 Years | 0 (0.0%) | 0 (0.0%) |
| 18 to 34 Years | 0 (0.0%) | 0 (0.0%) |
| 35 to 64 Years | 1 (3.7%) | 12 (31.6%) |
| 65 to 74 Years | 0 (0.0%) | 0 (0.0%) |
| 75 Years and over | 0 (0.0%) | 0 (0.0%) |
Technology Access in Nauvoo
Computing Device Access in Nauvoo
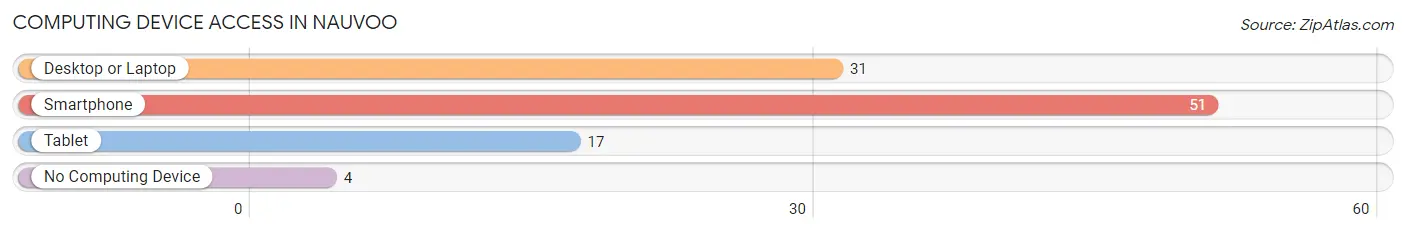
| Device Type | # Households | % Households |
| Desktop or Laptop | 31 | 48.4% |
| Smartphone | 51 | 79.7% |
| Tablet | 17 | 26.6% |
| No Computing Device | 4 | 6.2% |
| Total | 64 | 100.0% |
Internet Access in Nauvoo
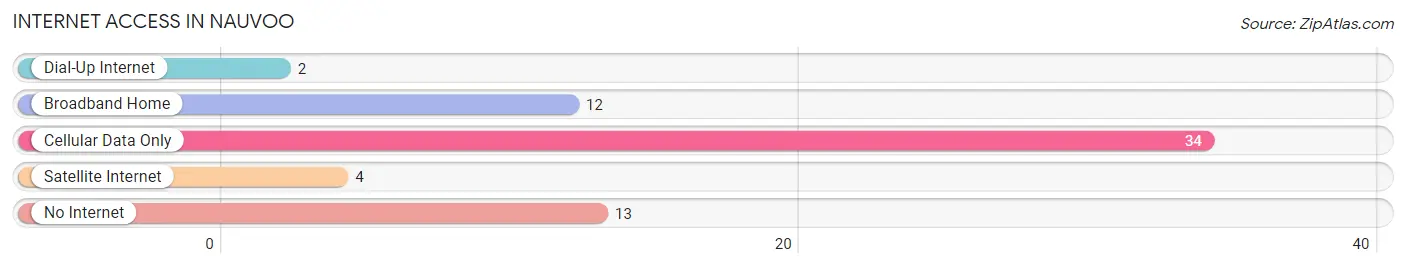
| Internet Type | # Households | % Households |
| Dial-Up Internet | 2 | 3.1% |
| Broadband Home | 12 | 18.8% |
| Cellular Data Only | 34 | 53.1% |
| Satellite Internet | 4 | 6.2% |
| No Internet | 13 | 20.3% |
| Total | 64 | 100.0% |
Nauvoo Summary
Nauvoo, Alabama is a small town located in the northwest corner of the state, in the foothills of the Appalachian Mountains. It is situated on the banks of the Tombigbee River, and is part of the larger Winston County. The town was founded in 1818, and has a population of just over 1,000 people.
History
Nauvoo was founded in 1818 by a group of settlers from Tennessee, led by William and Mary Ann Moore. The town was named after the city of Nauvoo, Illinois, which was founded by the Church of Jesus Christ of Latter-day Saints (LDS Church). The Moores were members of the LDS Church, and the town was intended to be a refuge for other members of the church who were facing persecution in other parts of the country.
The town grew quickly, and by 1820 it had a population of over 500 people. The town was incorporated in 1821, and by 1825 it had become the largest town in Winston County. The town was a center of commerce and industry, and was home to several mills, a tannery, and a distillery.
In 1844, the LDS Church moved its headquarters to Nauvoo, and the town became a major center of the church. The church built a large temple in the town, and the population grew to over 10,000 people. However, in 1846, the church moved its headquarters to Utah, and the population of Nauvoo declined.
Geography
Nauvoo is located in the northwest corner of Alabama, in the foothills of the Appalachian Mountains. The town is situated on the banks of the Tombigbee River, and is part of the larger Winston County. The town is surrounded by rolling hills and forests, and is located about 30 miles from the Mississippi border.
The climate in Nauvoo is humid subtropical, with hot, humid summers and mild winters. The average annual temperature is around 68 degrees Fahrenheit, and the average annual precipitation is around 50 inches.
Economy
Nauvoo’s economy is largely based on agriculture and tourism. The town is home to several farms, and the surrounding area is known for its production of cotton, soybeans, and corn. The town is also home to several small businesses, including restaurants, shops, and a few manufacturing plants.
Tourism is an important part of the local economy, as the town is home to several historic sites, including the Nauvoo Temple and the Joseph Smith Historic Site. The town also hosts several festivals and events throughout the year, including the Nauvoo Pageant, which is held every summer.
Demographics
As of the 2010 census, the population of Nauvoo was 1,068. The racial makeup of the town was 97.2% White, 0.9% African American, 0.3% Native American, 0.2% Asian, and 1.4% from other races. The median household income was $30,938, and the median family income was $37,500.
Nauvoo is a small, rural town with a strong sense of community. The town is home to several churches, and the local school system is highly rated. The town is also home to several parks and recreational areas, and is a popular destination for outdoor enthusiasts.
Common Questions
What is Per Capita Income in Nauvoo?
Per Capita income in Nauvoo is $25,919.
What is the Median Family Income in Nauvoo?
Median Family Income in Nauvoo is $45,625.
What is the Median Household income in Nauvoo?
Median Household Income in Nauvoo is $43,214.
What is Inequality or Gini Index in Nauvoo?
Inequality or Gini Index in Nauvoo is 0.50.
What is the Total Population of Nauvoo?
Total Population of Nauvoo is 168.
What is the Total Male Population of Nauvoo?
Total Male Population of Nauvoo is 91.
What is the Total Female Population of Nauvoo?
Total Female Population of Nauvoo is 77.
What is the Ratio of Males per 100 Females in Nauvoo?
There are 118.18 Males per 100 Females in Nauvoo.
What is the Ratio of Females per 100 Males in Nauvoo?
There are 84.62 Females per 100 Males in Nauvoo.
What is the Median Population Age in Nauvoo?
Median Population Age in Nauvoo is 37.5 Years.
What is the Average Family Size in Nauvoo
Average Family Size in Nauvoo is 3.3 People.
What is the Average Household Size in Nauvoo
Average Household Size in Nauvoo is 2.6 People.
How Large is the Labor Force in Nauvoo?
There are 53 People in the Labor Forcein in Nauvoo.
What is the Percentage of People in the Labor Force in Nauvoo?
43.4% of People are in the Labor Force in Nauvoo.
What is the Unemployment Rate in Nauvoo?
Unemployment Rate in Nauvoo is 3.8%.