Napier Field, AL Map & Demographics
Napier Field Map
Napier Field Overview
$19,909
PER CAPITA INCOME
$54,375
AVG FAMILY INCOME
$43,125
AVG HOUSEHOLD INCOME
19.1%
WAGE / INCOME GAP [ % ]
80.9¢/ $1
WAGE / INCOME GAP [ $ ]
0.36
INEQUALITY / GINI INDEX
430
TOTAL POPULATION
215
MALE POPULATION
215
FEMALE POPULATION
100.00
MALES / 100 FEMALES
100.00
FEMALES / 100 MALES
34.9
MEDIAN AGE
3.2
AVG FAMILY SIZE
2.7
AVG HOUSEHOLD SIZE
202
LABOR FORCE [ PEOPLE ]
64.5%
PERCENT IN LABOR FORCE
8.9%
UNEMPLOYMENT RATE
Income in Napier Field
Income Overview in Napier Field
Per Capita Income in Napier Field is $19,909, while median incomes of families and households are $54,375 and $43,125 respectively.
| Characteristic | Number | Measure |
| Per Capita Income | 430 | $19,909 |
| Median Family Income | 111 | $54,375 |
| Mean Family Income | 111 | $59,836 |
| Median Household Income | 159 | $43,125 |
| Mean Household Income | 159 | $51,904 |
| Income Deficit | 111 | $0 |
| Wage / Income Gap (%) | 430 | 19.11% |
| Wage / Income Gap ($) | 430 | 80.89¢ per $1 |
| Gini / Inequality Index | 430 | 0.36 |
Earnings by Sex in Napier Field
Average Earnings in Napier Field are $28,000, $30,313 for men and $24,519 for women, a difference of 19.1%.
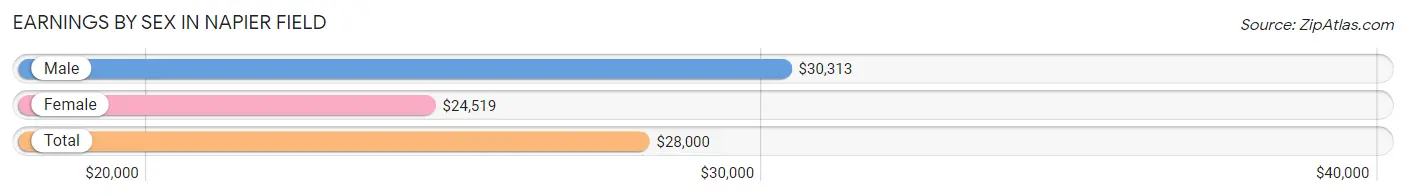
| Sex | Number | Average Earnings |
| Male | 117 (56.8%) | $30,313 |
| Female | 89 (43.2%) | $24,519 |
| Total | 206 (100.0%) | $28,000 |
Earnings by Sex by Income Bracket in Napier Field
The most common earnings brackets in Napier Field are $75,000 to $99,999 for men (17 | 14.5%) and $22,500 to $24,999 for women (13 | 14.6%).
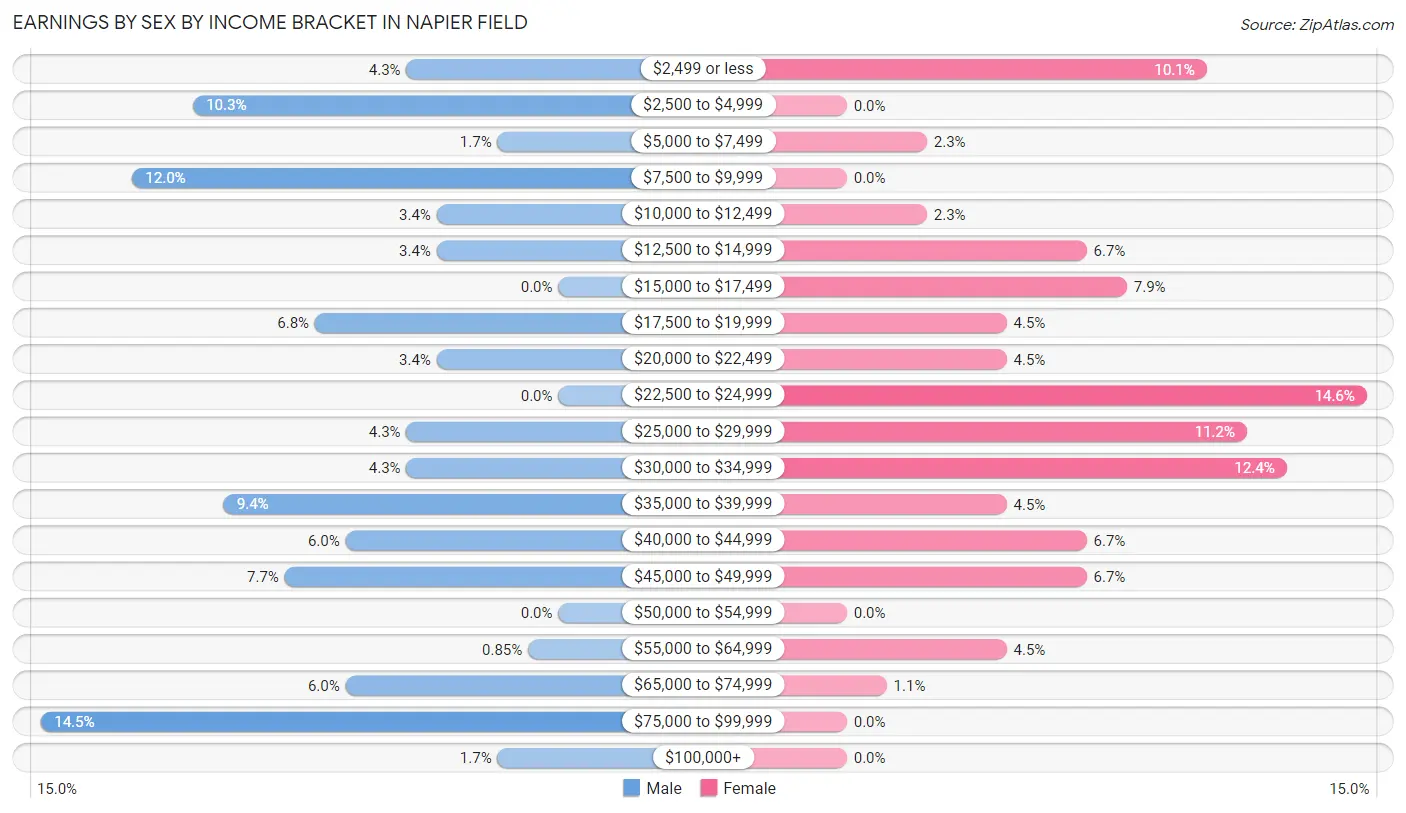
| Income | Male | Female |
| $2,499 or less | 5 (4.3%) | 9 (10.1%) |
| $2,500 to $4,999 | 12 (10.3%) | 0 (0.0%) |
| $5,000 to $7,499 | 2 (1.7%) | 2 (2.2%) |
| $7,500 to $9,999 | 14 (12.0%) | 0 (0.0%) |
| $10,000 to $12,499 | 4 (3.4%) | 2 (2.2%) |
| $12,500 to $14,999 | 4 (3.4%) | 6 (6.7%) |
| $15,000 to $17,499 | 0 (0.0%) | 7 (7.9%) |
| $17,500 to $19,999 | 8 (6.8%) | 4 (4.5%) |
| $20,000 to $22,499 | 4 (3.4%) | 4 (4.5%) |
| $22,500 to $24,999 | 0 (0.0%) | 13 (14.6%) |
| $25,000 to $29,999 | 5 (4.3%) | 10 (11.2%) |
| $30,000 to $34,999 | 5 (4.3%) | 11 (12.4%) |
| $35,000 to $39,999 | 11 (9.4%) | 4 (4.5%) |
| $40,000 to $44,999 | 7 (6.0%) | 6 (6.7%) |
| $45,000 to $49,999 | 9 (7.7%) | 6 (6.7%) |
| $50,000 to $54,999 | 0 (0.0%) | 0 (0.0%) |
| $55,000 to $64,999 | 1 (0.9%) | 4 (4.5%) |
| $65,000 to $74,999 | 7 (6.0%) | 1 (1.1%) |
| $75,000 to $99,999 | 17 (14.5%) | 0 (0.0%) |
| $100,000+ | 2 (1.7%) | 0 (0.0%) |
| Total | 117 (100.0%) | 89 (100.0%) |
Earnings by Sex by Educational Attainment in Napier Field
Average earnings in Napier Field are $33,750 for men and $24,904 for women, a difference of 26.2%. Men with an educational attainment of high school diploma enjoy the highest average annual earnings of $49,688, while those with college or associate's degree education earn the least with $36,136. Women with an educational attainment of college or associate's degree earn the most with the average annual earnings of $33,523, while those with high school diploma education have the smallest earnings of $17,292.
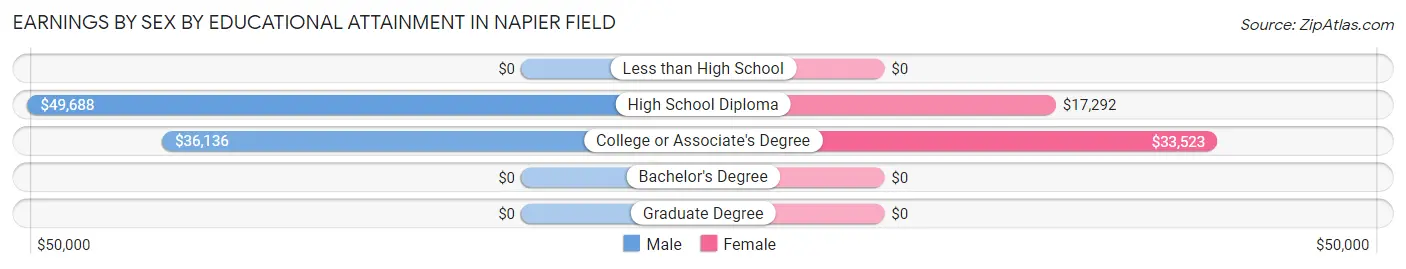
| Educational Attainment | Male Income | Female Income |
| Less than High School | - | - |
| High School Diploma | $49,688 | $17,292 |
| College or Associate's Degree | $36,136 | $33,523 |
| Bachelor's Degree | - | - |
| Graduate Degree | - | - |
| Total | $33,750 | $24,904 |
Family Income in Napier Field
Family Income Brackets in Napier Field
According to the Napier Field family income data, there are 40 families falling into the $50,000 to $74,999 income range, which is the most common income bracket and makes up 36.0% of all families.
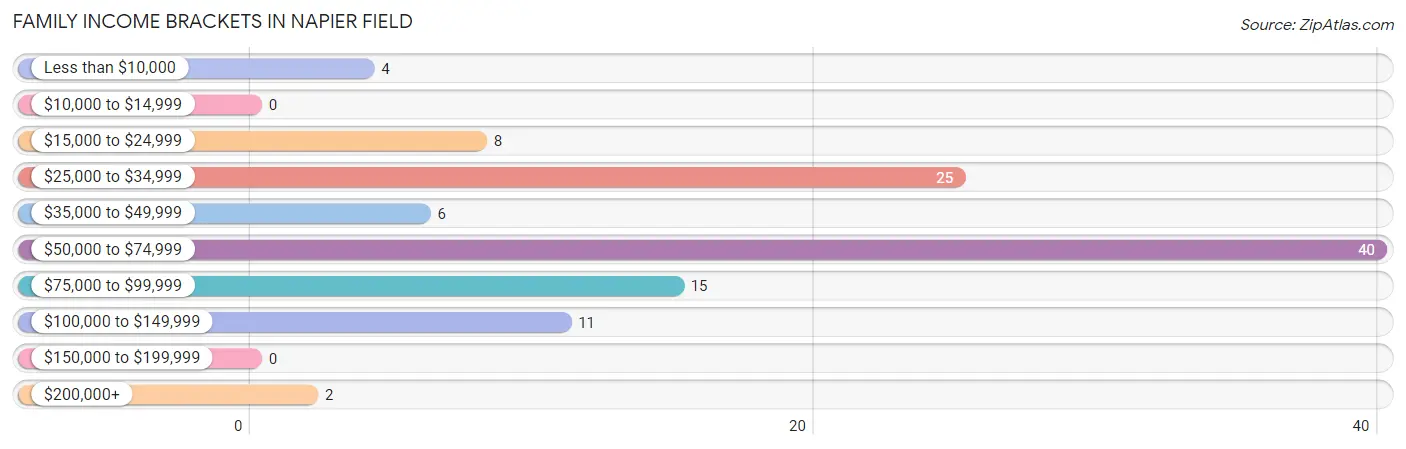
| Income Bracket | # Families | % Families |
| Less than $10,000 | 4 | 3.6% |
| $10,000 to $14,999 | 0 | 0.0% |
| $15,000 to $24,999 | 8 | 7.2% |
| $25,000 to $34,999 | 25 | 22.5% |
| $35,000 to $49,999 | 6 | 5.4% |
| $50,000 to $74,999 | 40 | 36.0% |
| $75,000 to $99,999 | 15 | 13.5% |
| $100,000 to $149,999 | 11 | 9.9% |
| $150,000 to $199,999 | 0 | 0.0% |
| $200,000+ | 2 | 1.8% |
Family Income by Famaliy Size in Napier Field
5-person families (12 | 10.8%) account for the highest median family income in Napier Field with $73,000 per family, while 2-person families (47 | 42.3%) have the highest median income of $27,969 per family member.
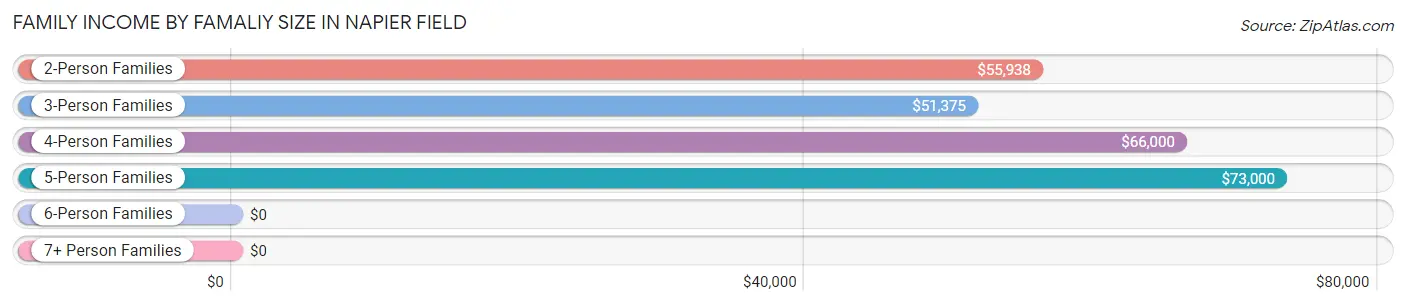
| Income Bracket | # Families | Median Income |
| 2-Person Families | 47 (42.3%) | $55,938 |
| 3-Person Families | 23 (20.7%) | $51,375 |
| 4-Person Families | 28 (25.2%) | $66,000 |
| 5-Person Families | 12 (10.8%) | $73,000 |
| 6-Person Families | 0 (0.0%) | $0 |
| 7+ Person Families | 1 (0.9%) | $0 |
| Total | 111 (100.0%) | $54,375 |
Family Income by Number of Earners in Napier Field
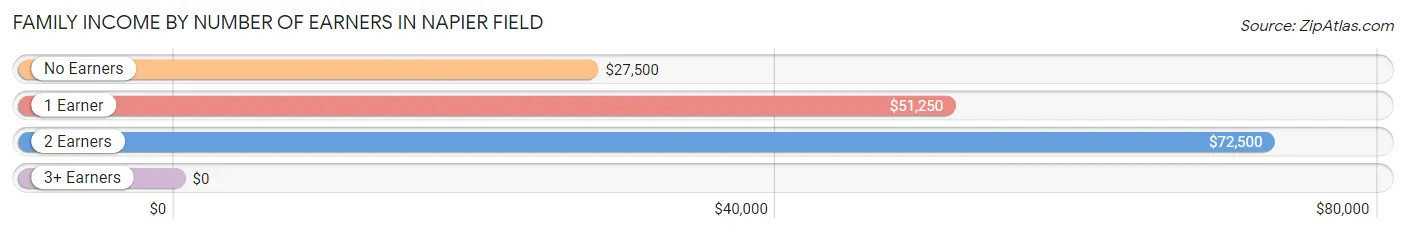
| Number of Earners | # Families | Median Income |
| No Earners | 18 (16.2%) | $27,500 |
| 1 Earner | 40 (36.0%) | $51,250 |
| 2 Earners | 44 (39.6%) | $72,500 |
| 3+ Earners | 9 (8.1%) | $0 |
| Total | 111 (100.0%) | $54,375 |
Household Income in Napier Field
Household Income Brackets in Napier Field
With 45 households falling in the category, the $50,000 to $74,999 income range is the most frequent in Napier Field, accounting for 28.3% of all households.
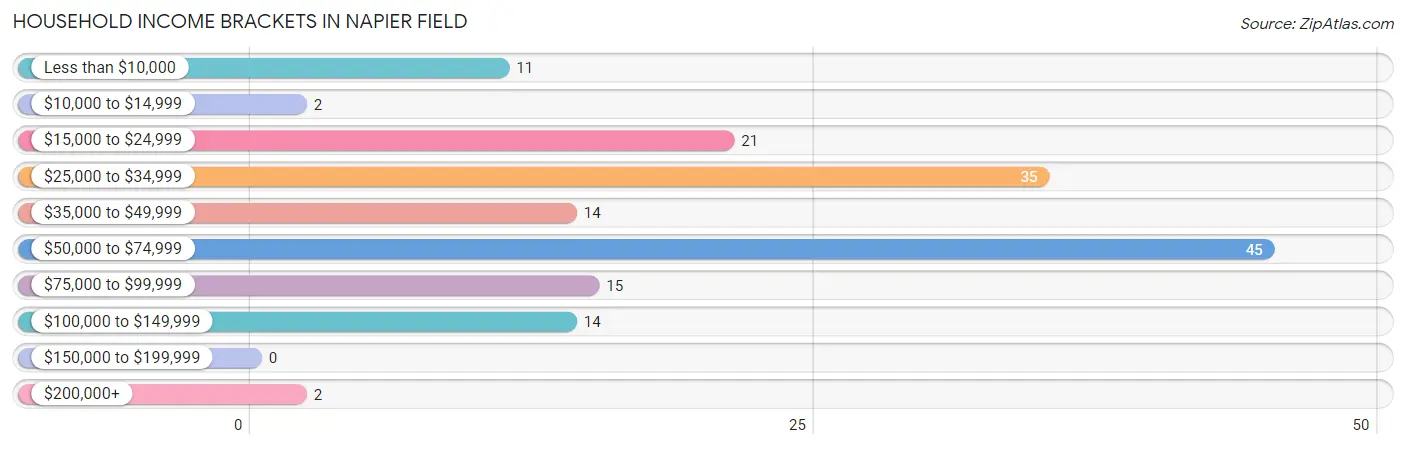
| Income Bracket | # Households | % Households |
| Less than $10,000 | 11 | 6.9% |
| $10,000 to $14,999 | 2 | 1.3% |
| $15,000 to $24,999 | 21 | 13.2% |
| $25,000 to $34,999 | 35 | 22.0% |
| $35,000 to $49,999 | 14 | 8.8% |
| $50,000 to $74,999 | 45 | 28.3% |
| $75,000 to $99,999 | 15 | 9.4% |
| $100,000 to $149,999 | 14 | 8.8% |
| $150,000 to $199,999 | 0 | 0.0% |
| $200,000+ | 2 | 1.3% |
Household Income by Householder Age in Napier Field
The median household income in Napier Field is $43,125, with the highest median household income of $105,938 found in the 15 to 24 years age bracket for the primary householder. A total of 13 households (8.2%) fall into this category. Meanwhile, the 65+ years age bracket for the primary householder has the lowest median household income of $34,375, with 30 households (18.9%) in this group.
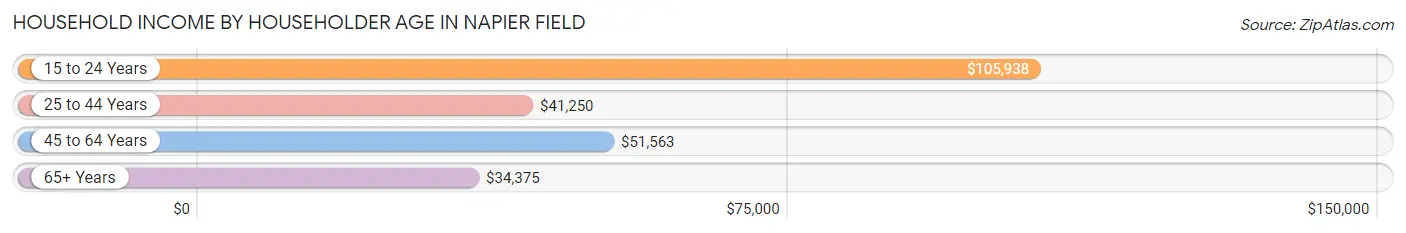
| Income Bracket | # Households | Median Income |
| 15 to 24 Years | 13 (8.2%) | $105,938 |
| 25 to 44 Years | 49 (30.8%) | $41,250 |
| 45 to 64 Years | 67 (42.1%) | $51,563 |
| 65+ Years | 30 (18.9%) | $34,375 |
| Total | 159 (100.0%) | $43,125 |
Poverty in Napier Field
Income Below Poverty by Sex and Age in Napier Field
With 20.0% poverty level for males and 20.9% for females among the residents of Napier Field, 15 year old males and 5 year old females are the most vulnerable to poverty, with 5 males (83.3%) and 2 females (100.0%) in their respective age groups living below the poverty level.
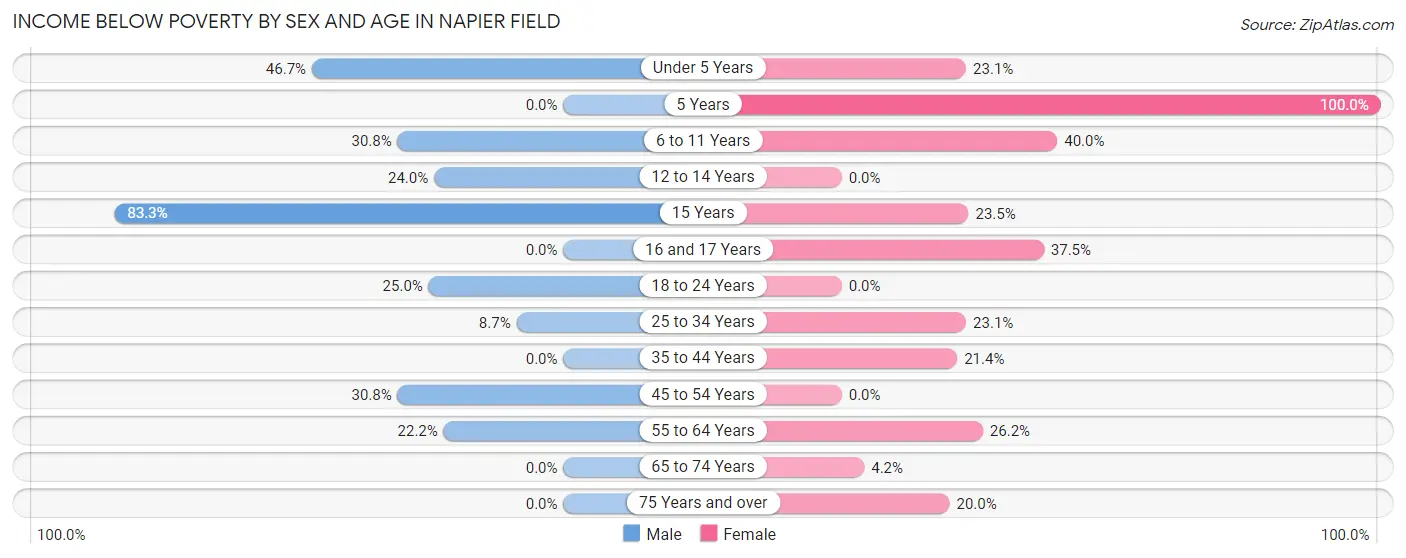
| Age Bracket | Male | Female |
| Under 5 Years | 7 (46.7%) | 3 (23.1%) |
| 5 Years | 0 (0.0%) | 2 (100.0%) |
| 6 to 11 Years | 4 (30.8%) | 8 (40.0%) |
| 12 to 14 Years | 6 (24.0%) | 0 (0.0%) |
| 15 Years | 5 (83.3%) | 4 (23.5%) |
| 16 and 17 Years | 0 (0.0%) | 3 (37.5%) |
| 18 to 24 Years | 5 (25.0%) | 0 (0.0%) |
| 25 to 34 Years | 2 (8.7%) | 6 (23.1%) |
| 35 to 44 Years | 0 (0.0%) | 6 (21.4%) |
| 45 to 54 Years | 4 (30.8%) | 0 (0.0%) |
| 55 to 64 Years | 10 (22.2%) | 11 (26.2%) |
| 65 to 74 Years | 0 (0.0%) | 1 (4.2%) |
| 75 Years and over | 0 (0.0%) | 1 (20.0%) |
| Total | 43 (20.0%) | 45 (20.9%) |
Income Above Poverty by Sex and Age in Napier Field
According to the poverty statistics in Napier Field, males aged 5 years and females aged 12 to 14 years are the age groups that are most secure financially, with 100.0% of males and 100.0% of females in these age groups living above the poverty line.
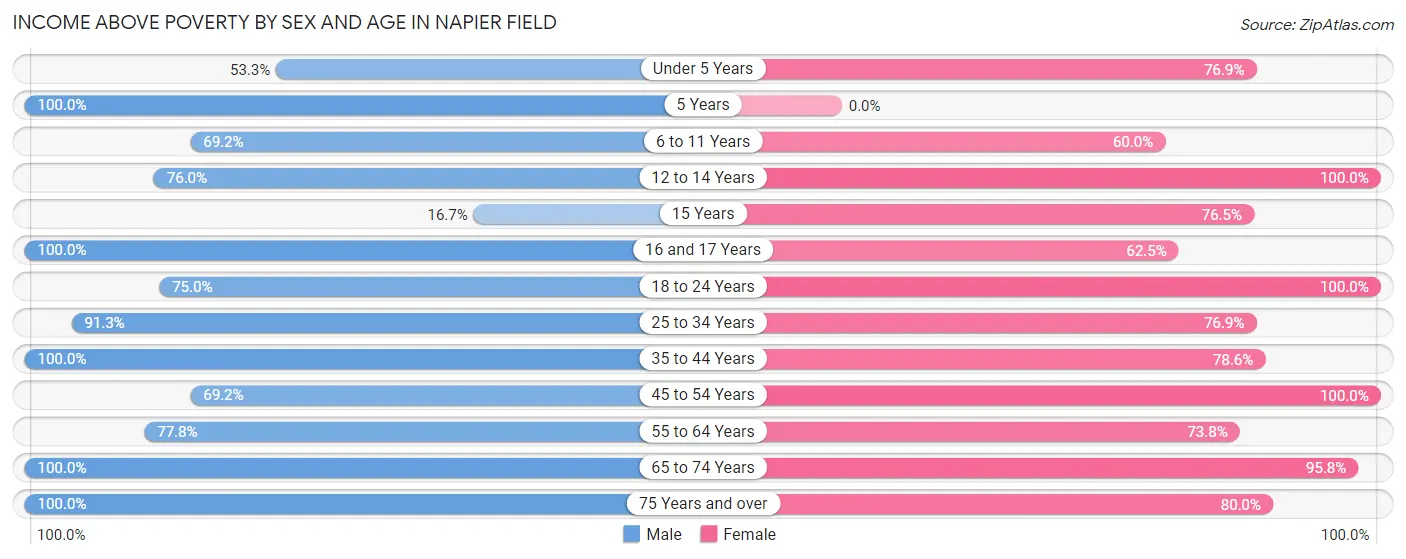
| Age Bracket | Male | Female |
| Under 5 Years | 8 (53.3%) | 10 (76.9%) |
| 5 Years | 2 (100.0%) | 0 (0.0%) |
| 6 to 11 Years | 9 (69.2%) | 12 (60.0%) |
| 12 to 14 Years | 19 (76.0%) | 4 (100.0%) |
| 15 Years | 1 (16.7%) | 13 (76.5%) |
| 16 and 17 Years | 8 (100.0%) | 5 (62.5%) |
| 18 to 24 Years | 15 (75.0%) | 14 (100.0%) |
| 25 to 34 Years | 21 (91.3%) | 20 (76.9%) |
| 35 to 44 Years | 20 (100.0%) | 22 (78.6%) |
| 45 to 54 Years | 9 (69.2%) | 12 (100.0%) |
| 55 to 64 Years | 35 (77.8%) | 31 (73.8%) |
| 65 to 74 Years | 19 (100.0%) | 23 (95.8%) |
| 75 Years and over | 6 (100.0%) | 4 (80.0%) |
| Total | 172 (80.0%) | 170 (79.1%) |
Income Below Poverty Among Married-Couple Families in Napier Field
The poverty statistics for married-couple families in Napier Field show that 3.4% or 3 of the total 88 families live below the poverty line. Families with 1 or 2 children have the highest poverty rate of 5.9%, comprising of 3 families. On the other hand, families with no children have the lowest poverty rate of 0.0%, which includes 0 families.
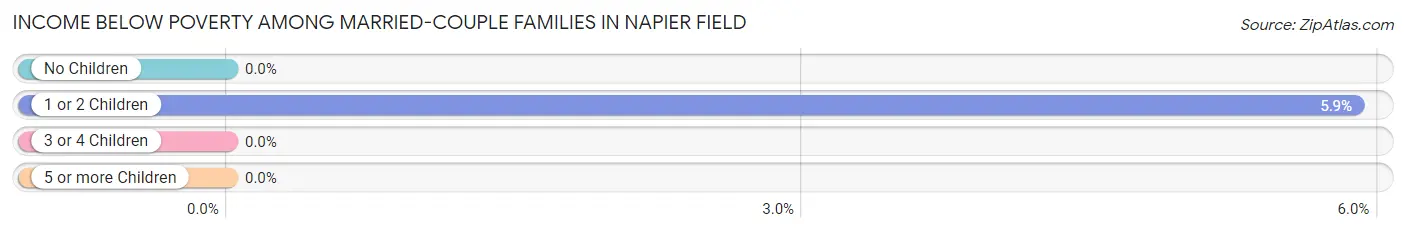
| Children | Above Poverty | Below Poverty |
| No Children | 36 (100.0%) | 0 (0.0%) |
| 1 or 2 Children | 48 (94.1%) | 3 (5.9%) |
| 3 or 4 Children | 0 (0.0%) | 0 (0.0%) |
| 5 or more Children | 1 (100.0%) | 0 (0.0%) |
| Total | 85 (96.6%) | 3 (3.4%) |
Income Below Poverty Among Single-Parent Households in Napier Field
| Children | Single Father | Single Mother |
| No Children | 0 (0.0%) | 0 (0.0%) |
| 1 or 2 Children | 0 (0.0%) | 1 (16.7%) |
| 3 or 4 Children | 0 (0.0%) | 9 (100.0%) |
| 5 or more Children | 0 (0.0%) | 0 (0.0%) |
| Total | 0 (0.0%) | 10 (52.6%) |
Income Below Poverty Among Married-Couple vs Single-Parent Households in Napier Field
The poverty data for Napier Field shows that 3 of the married-couple family households (3.4%) and 10 of the single-parent households (43.5%) are living below the poverty level. Within the married-couple family households, those with 1 or 2 children have the highest poverty rate, with 3 households (5.9%) falling below the poverty line. Among the single-parent households, those with 3 or 4 children have the highest poverty rate, with 9 household (100.0%) living below poverty.
| Children | Married-Couple Families | Single-Parent Households |
| No Children | 0 (0.0%) | 0 (0.0%) |
| 1 or 2 Children | 3 (5.9%) | 1 (14.3%) |
| 3 or 4 Children | 0 (0.0%) | 9 (100.0%) |
| 5 or more Children | 0 (0.0%) | 0 (0.0%) |
| Total | 3 (3.4%) | 10 (43.5%) |
Race in Napier Field
The most populous races in Napier Field are White / Caucasian (348 | 80.9%), Hispanic or Latino (65 | 15.1%), and Black / African American (35 | 8.1%).
| Race | # Population | % Population |
| Asian | 0 | 0.0% |
| Black / African American | 35 | 8.1% |
| Hawaiian / Pacific | 0 | 0.0% |
| Hispanic or Latino | 65 | 15.1% |
| Native / Alaskan | 1 | 0.2% |
| White / Caucasian | 348 | 80.9% |
| Two or more Races | 20 | 4.6% |
| Some other Race | 26 | 6.0% |
| Total | 430 | 100.0% |
Ancestry in Napier Field
The most populous ancestries reported in Napier Field are Irish (78 | 18.1%), American (48 | 11.2%), English (46 | 10.7%), Mexican (46 | 10.7%), and German (42 | 9.8%), together accounting for 60.5% of all Napier Field residents.
| Ancestry | # Population | % Population |
| American | 48 | 11.2% |
| British | 4 | 0.9% |
| Cherokee | 9 | 2.1% |
| Chippewa | 5 | 1.2% |
| Creek | 1 | 0.2% |
| Cuban | 11 | 2.6% |
| English | 46 | 10.7% |
| French | 7 | 1.6% |
| German | 42 | 9.8% |
| Hungarian | 9 | 2.1% |
| Irish | 78 | 18.1% |
| Italian | 2 | 0.5% |
| Mexican | 46 | 10.7% |
| Polish | 8 | 1.9% |
| Portuguese | 1 | 0.2% |
| Puerto Rican | 7 | 1.6% |
| Scotch-Irish | 29 | 6.7% |
| Scottish | 9 | 2.1% |
| Slavic | 1 | 0.2% |
| Spanish | 1 | 0.2% |
| Welsh | 2 | 0.5% | View All 21 Rows |
Immigrants in Napier Field
The most numerous immigrant groups reported in Napier Field came from Latin America (17 | 4.0%), Central America (13 | 3.0%), Mexico (13 | 3.0%), Caribbean (4 | 0.9%), and Cuba (4 | 0.9%), together accounting for 11.9% of all Napier Field residents.
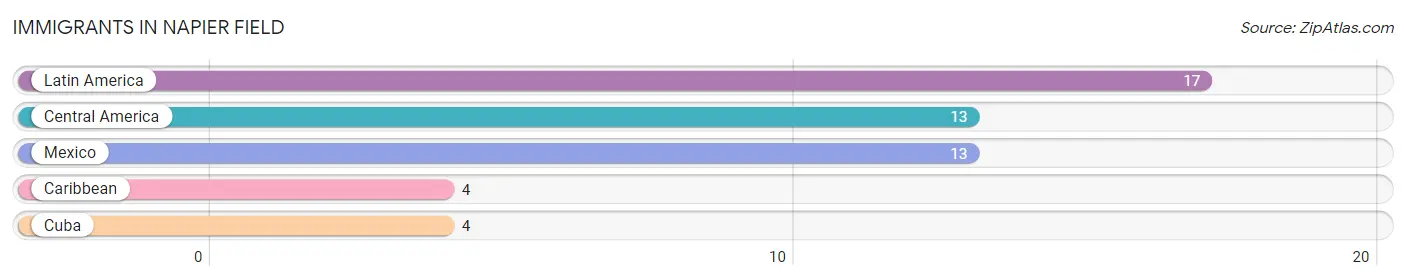
| Immigration Origin | # Population | % Population |
| Caribbean | 4 | 0.9% |
| Central America | 13 | 3.0% |
| Cuba | 4 | 0.9% |
| Latin America | 17 | 4.0% |
| Mexico | 13 | 3.0% | View All 5 Rows |
Sex and Age in Napier Field
Sex and Age in Napier Field
The most populous age groups in Napier Field are 10 to 14 Years (26 | 12.1%) for men and 15 to 19 Years (32 | 14.9%) for women.
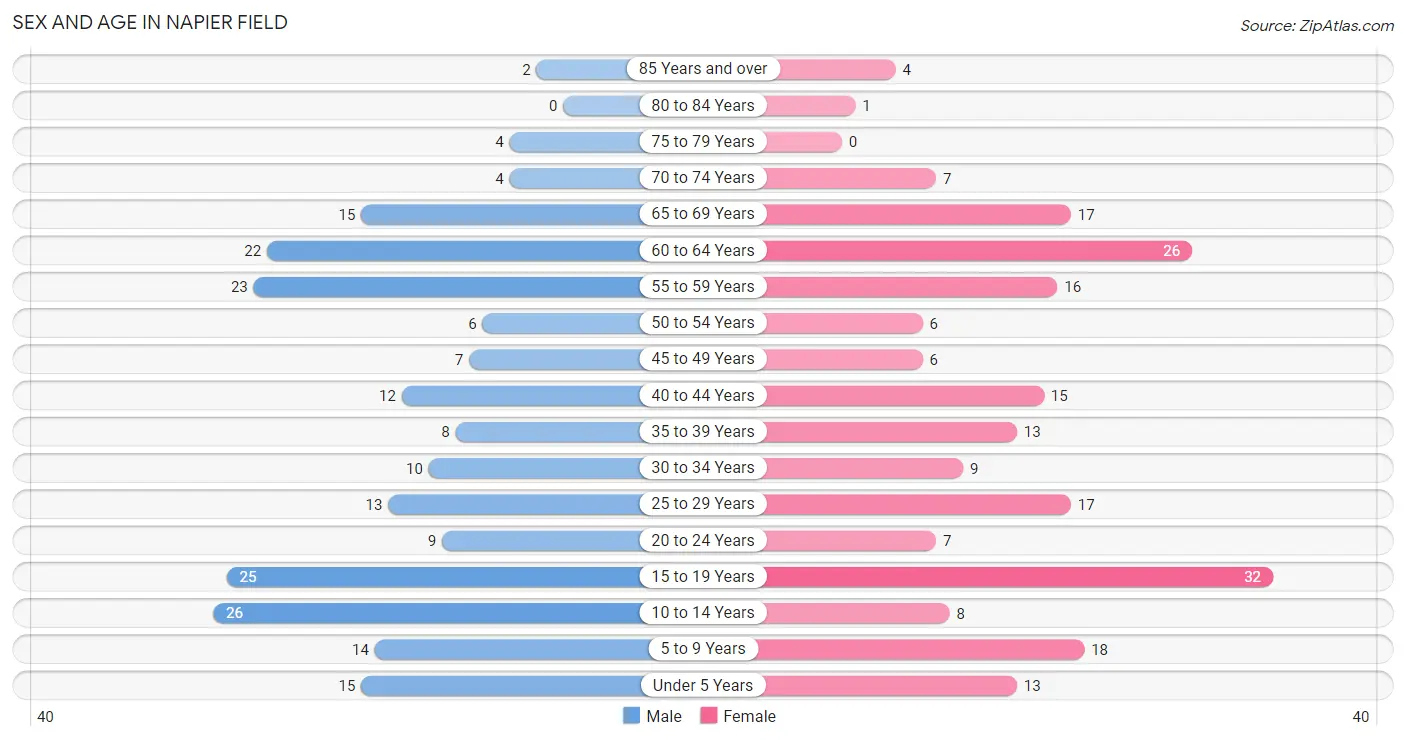
| Age Bracket | Male | Female |
| Under 5 Years | 15 (7.0%) | 13 (6.0%) |
| 5 to 9 Years | 14 (6.5%) | 18 (8.4%) |
| 10 to 14 Years | 26 (12.1%) | 8 (3.7%) |
| 15 to 19 Years | 25 (11.6%) | 32 (14.9%) |
| 20 to 24 Years | 9 (4.2%) | 7 (3.3%) |
| 25 to 29 Years | 13 (6.0%) | 17 (7.9%) |
| 30 to 34 Years | 10 (4.6%) | 9 (4.2%) |
| 35 to 39 Years | 8 (3.7%) | 13 (6.0%) |
| 40 to 44 Years | 12 (5.6%) | 15 (7.0%) |
| 45 to 49 Years | 7 (3.3%) | 6 (2.8%) |
| 50 to 54 Years | 6 (2.8%) | 6 (2.8%) |
| 55 to 59 Years | 23 (10.7%) | 16 (7.4%) |
| 60 to 64 Years | 22 (10.2%) | 26 (12.1%) |
| 65 to 69 Years | 15 (7.0%) | 17 (7.9%) |
| 70 to 74 Years | 4 (1.9%) | 7 (3.3%) |
| 75 to 79 Years | 4 (1.9%) | 0 (0.0%) |
| 80 to 84 Years | 0 (0.0%) | 1 (0.5%) |
| 85 Years and over | 2 (0.9%) | 4 (1.9%) |
| Total | 215 (100.0%) | 215 (100.0%) |
Families and Households in Napier Field
Median Family Size in Napier Field
The median family size in Napier Field is 3.23 persons per family, with single female/mother families (19 | 17.1%) accounting for the largest median family size of 3.79 persons per family. On the other hand, single male/father families (4 | 3.6%) represent the smallest median family size with 2.25 persons per family.
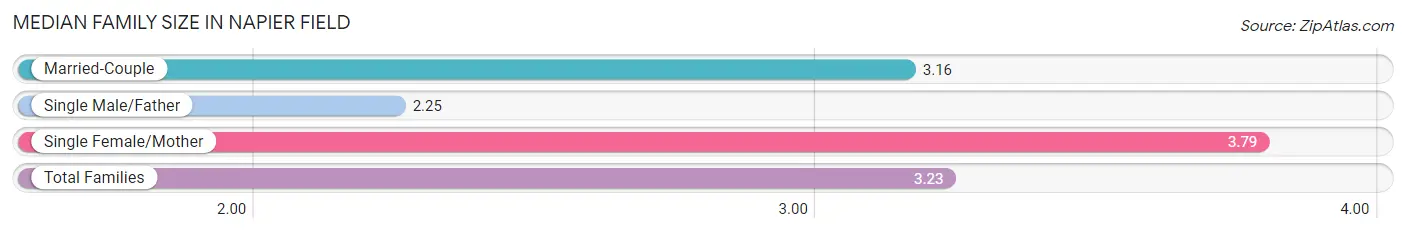
| Family Type | # Families | Family Size |
| Married-Couple | 88 (79.3%) | 3.16 |
| Single Male/Father | 4 (3.6%) | 2.25 |
| Single Female/Mother | 19 (17.1%) | 3.79 |
| Total Families | 111 (100.0%) | 3.23 |
Median Household Size in Napier Field
The median household size in Napier Field is 2.70 persons per household, with single female/mother households (19 | 11.9%) accounting for the largest median household size of 3.95 persons per household. non-family households (48 | 30.2%) represent the smallest median household size with 1.40 persons per household.
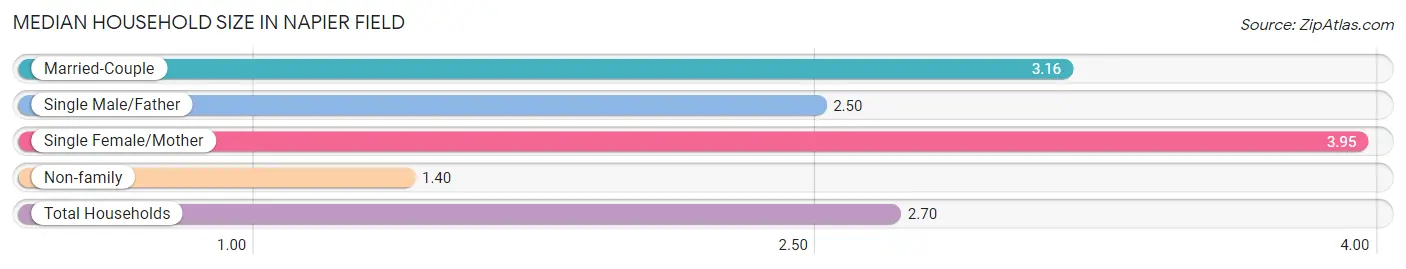
| Household Type | # Households | Household Size |
| Married-Couple | 88 (55.3%) | 3.16 |
| Single Male/Father | 4 (2.5%) | 2.50 |
| Single Female/Mother | 19 (11.9%) | 3.95 |
| Non-family | 48 (30.2%) | 1.40 |
| Total Households | 159 (100.0%) | 2.70 |
Household Size by Marriage Status in Napier Field
Out of a total of 159 households in Napier Field, 111 (69.8%) are family households, while 48 (30.2%) are nonfamily households. The most numerous type of family households are 2-person households, comprising 45, and the most common type of nonfamily households are 1-person households, comprising 32.
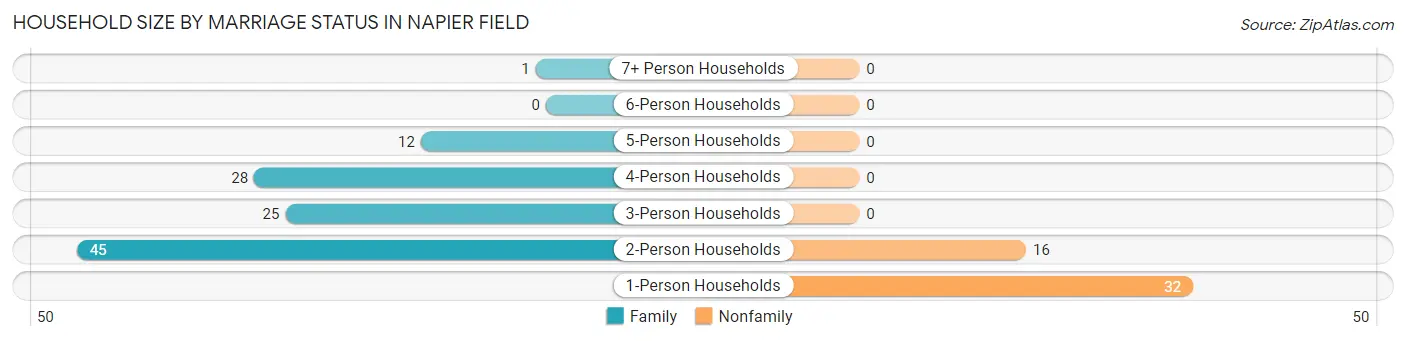
| Household Size | Family Households | Nonfamily Households |
| 1-Person Households | - | 32 (20.1%) |
| 2-Person Households | 45 (28.3%) | 16 (10.1%) |
| 3-Person Households | 25 (15.7%) | 0 (0.0%) |
| 4-Person Households | 28 (17.6%) | 0 (0.0%) |
| 5-Person Households | 12 (7.5%) | 0 (0.0%) |
| 6-Person Households | 0 (0.0%) | 0 (0.0%) |
| 7+ Person Households | 1 (0.6%) | 0 (0.0%) |
| Total | 111 (69.8%) | 48 (30.2%) |
Female Fertility in Napier Field
Fertility by Age in Napier Field
Average fertility rate in Napier Field is 101.0 births per 1,000 women. Women in the age bracket of 20 to 34 years have the highest fertility rate with 303.0 births per 1,000 women. Women in the age bracket of 20 to 34 years acount for 100.0% of all women with births.
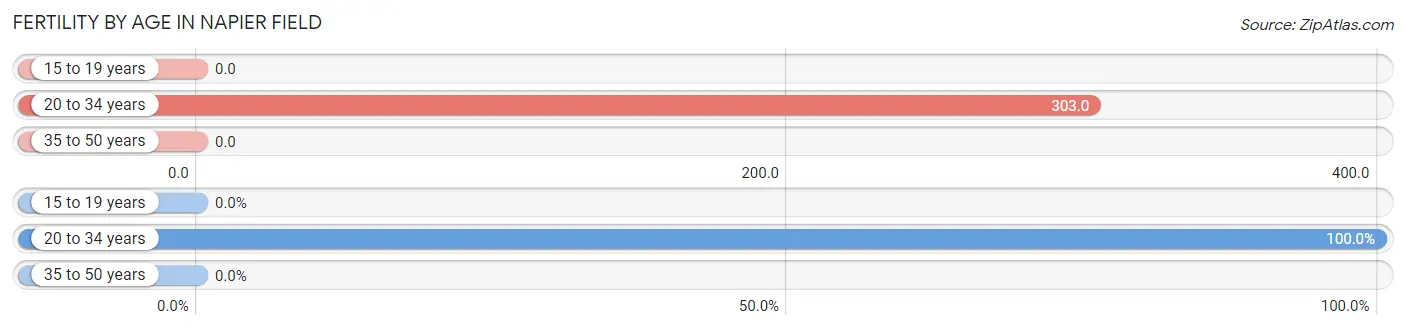
| Age Bracket | Women with Births | Births / 1,000 Women |
| 15 to 19 years | 0 (0.0%) | 0.0 |
| 20 to 34 years | 10 (100.0%) | 303.0 |
| 35 to 50 years | 0 (0.0%) | 0.0 |
| Total | 10 (100.0%) | 101.0 |
Fertility by Age by Marriage Status in Napier Field
90.0% of women with births (10) in Napier Field are married. The highest percentage of unmarried women with births falls into 20 to 34 years age bracket with 10.0% of them unmarried at the time of birth, while the lowest percentage of unmarried women with births belong to 20 to 34 years age bracket with 10.0% of them unmarried.
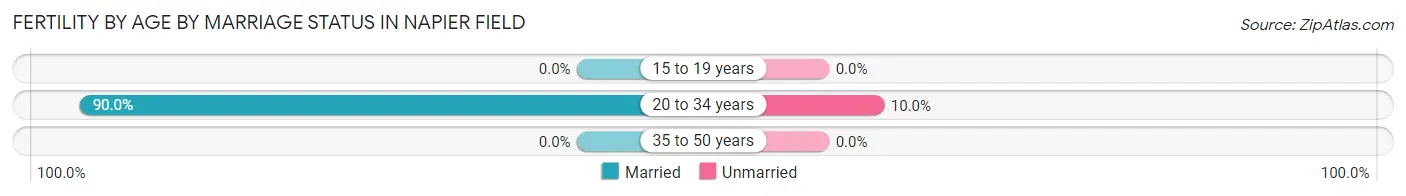
| Age Bracket | Married | Unmarried |
| 15 to 19 years | 0 (0.0%) | 0 (0.0%) |
| 20 to 34 years | 9 (90.0%) | 1 (10.0%) |
| 35 to 50 years | 0 (0.0%) | 0 (0.0%) |
| Total | 9 (90.0%) | 1 (10.0%) |
Fertility by Education in Napier Field
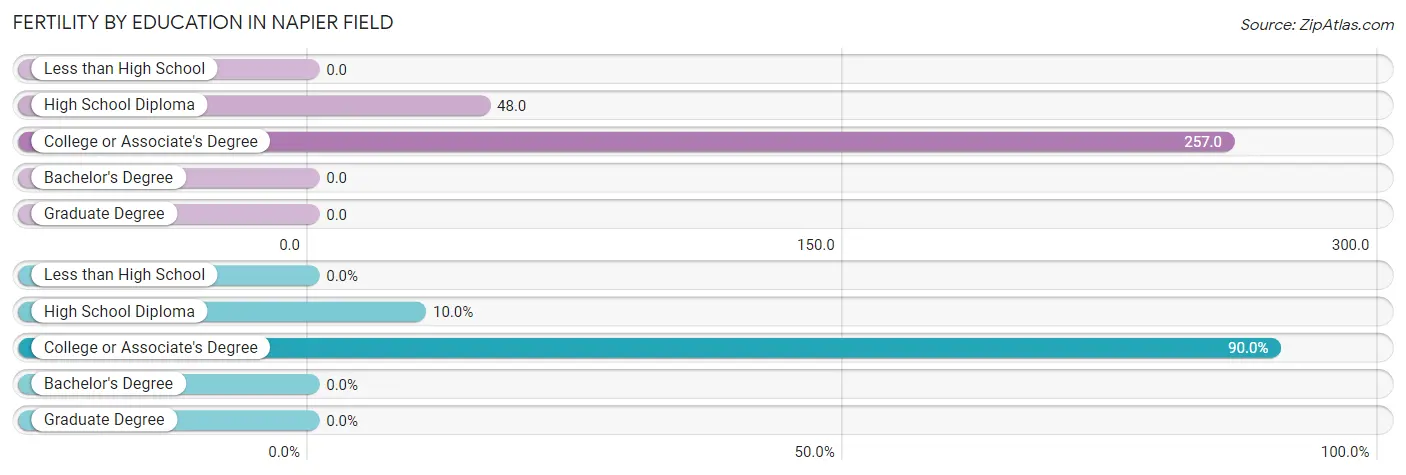
| Educational Attainment | Women with Births | Births / 1,000 Women |
| Less than High School | 0 (0.0%) | 0.0 |
| High School Diploma | 1 (10.0%) | 48.0 |
| College or Associate's Degree | 9 (90.0%) | 257.0 |
| Bachelor's Degree | 0 (0.0%) | 0.0 |
| Graduate Degree | 0 (0.0%) | 0.0 |
| Total | 10 (100.0%) | 101.0 |
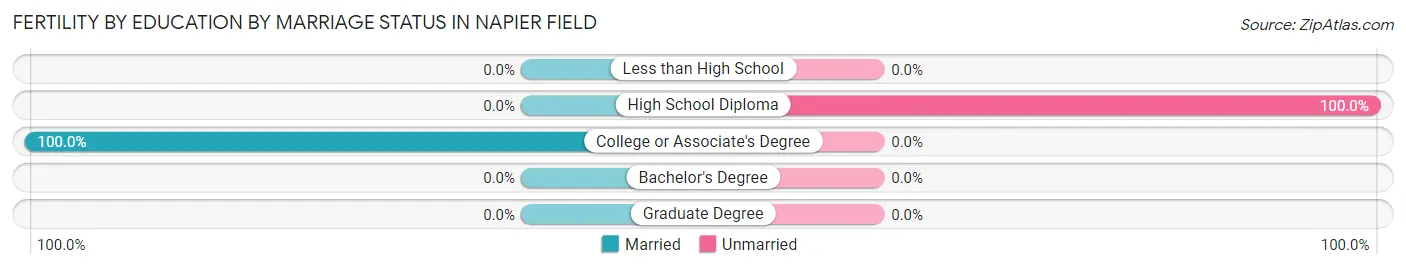
Fertility by Education by Marriage Status in Napier Field
10.0% of women with births in Napier Field are unmarried. Women with the educational attainment of college or associate's degree are most likely to be married with 100.0% of them married at childbirth, while women with the educational attainment of high school diploma are least likely to be married with 100.0% of them unmarried at childbirth.
| Educational Attainment | Married | Unmarried |
| Less than High School | 0 (0.0%) | 0 (0.0%) |
| High School Diploma | 0 (0.0%) | 1 (100.0%) |
| College or Associate's Degree | 9 (100.0%) | 0 (0.0%) |
| Bachelor's Degree | 0 (0.0%) | 0 (0.0%) |
| Graduate Degree | 0 (0.0%) | 0 (0.0%) |
| Total | 9 (90.0%) | 1 (10.0%) |
Employment Characteristics in Napier Field
Employment by Class of Employer in Napier Field
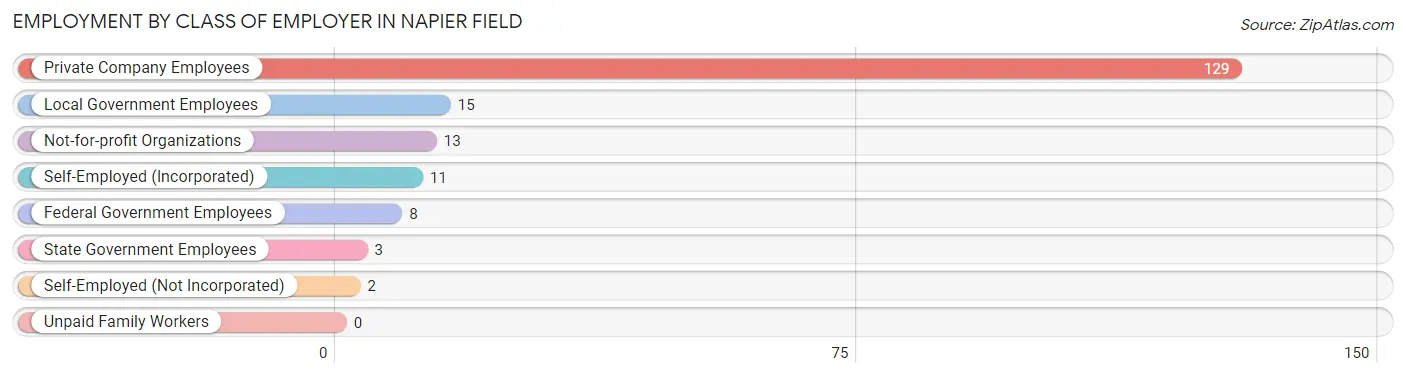
Among the 181 employed individuals in Napier Field, private company employees (129 | 71.3%), local government employees (15 | 8.3%), and not-for-profit organizations (13 | 7.2%) make up the most common classes of employment.
| Employer Class | # Employees | % Employees |
| Private Company Employees | 129 | 71.3% |
| Self-Employed (Incorporated) | 11 | 6.1% |
| Self-Employed (Not Incorporated) | 2 | 1.1% |
| Not-for-profit Organizations | 13 | 7.2% |
| Local Government Employees | 15 | 8.3% |
| State Government Employees | 3 | 1.7% |
| Federal Government Employees | 8 | 4.4% |
| Unpaid Family Workers | 0 | 0.0% |
| Total | 181 | 100.0% |
Employment Status by Age in Napier Field
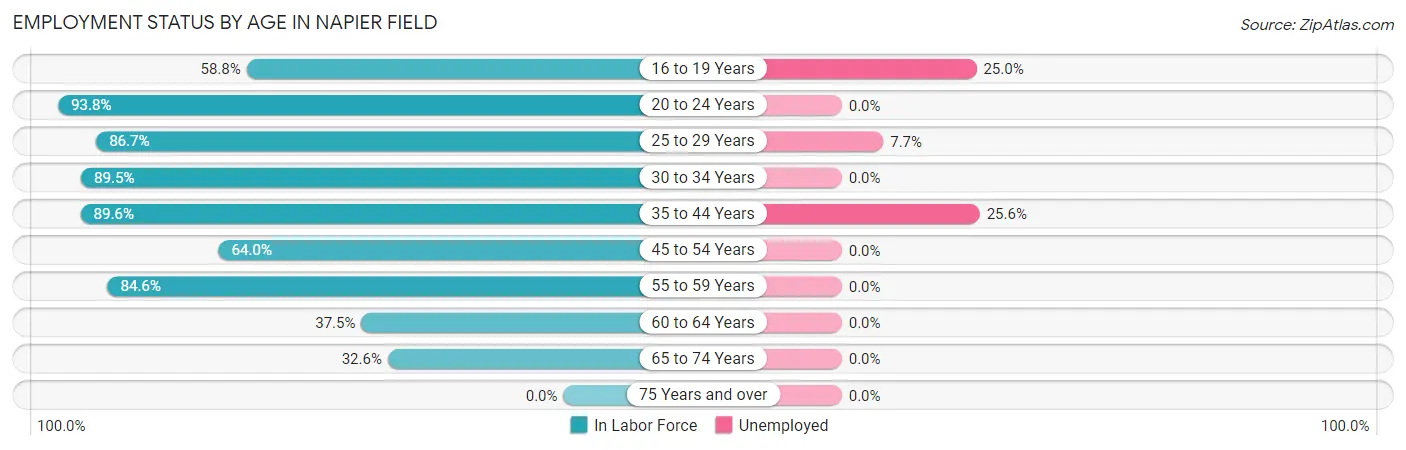
According to the labor force statistics for Napier Field, out of the total population over 16 years of age (313), 64.5% or 202 individuals are in the labor force, with 8.9% or 18 of them unemployed. The age group with the highest labor force participation rate is 20 to 24 years, with 93.8% or 15 individuals in the labor force. Within the labor force, the 35 to 44 years age range has the highest percentage of unemployed individuals, with 25.6% or 11 of them being unemployed.
| Age Bracket | In Labor Force | Unemployed |
| 16 to 19 Years | 20 (58.8%) | 5 (25.0%) |
| 20 to 24 Years | 15 (93.8%) | 0 (0.0%) |
| 25 to 29 Years | 26 (86.7%) | 2 (7.7%) |
| 30 to 34 Years | 17 (89.5%) | 0 (0.0%) |
| 35 to 44 Years | 43 (89.6%) | 11 (25.6%) |
| 45 to 54 Years | 16 (64.0%) | 0 (0.0%) |
| 55 to 59 Years | 33 (84.6%) | 0 (0.0%) |
| 60 to 64 Years | 18 (37.5%) | 0 (0.0%) |
| 65 to 74 Years | 14 (32.6%) | 0 (0.0%) |
| 75 Years and over | 0 (0.0%) | 0 (0.0%) |
| Total | 202 (64.5%) | 18 (8.9%) |
Employment Status by Educational Attainment in Napier Field
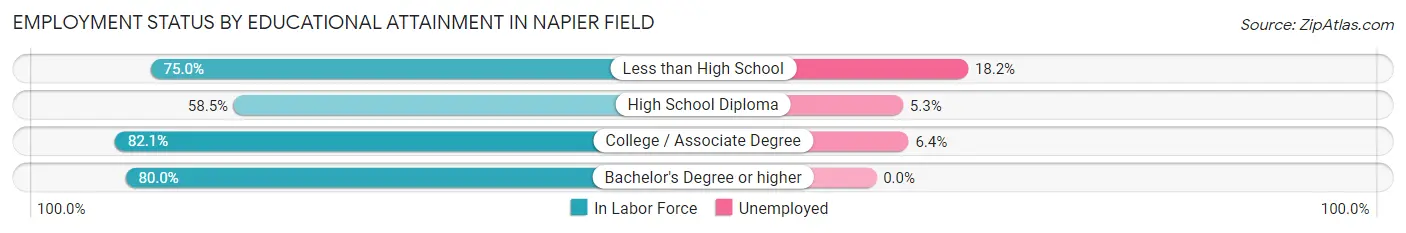
According to labor force statistics for Napier Field, 73.2% of individuals (153) out of the total population between 25 and 64 years of age (209) are in the labor force, with 8.5% or 13 of them being unemployed. The group with the highest labor force participation rate are those with the educational attainment of college / associate degree, with 82.1% or 78 individuals in the labor force. Within the labor force, individuals with less than high school education have the highest percentage of unemployment, with 18.2% or 6 of them being unemployed.
| Educational Attainment | In Labor Force | Unemployed |
| Less than High School | 33 (75.0%) | 8 (18.2%) |
| High School Diploma | 38 (58.5%) | 3 (5.3%) |
| College / Associate Degree | 78 (82.1%) | 6 (6.4%) |
| Bachelor's Degree or higher | 4 (80.0%) | 0 (0.0%) |
| Total | 153 (73.2%) | 18 (8.5%) |
Employment Occupations by Sex in Napier Field
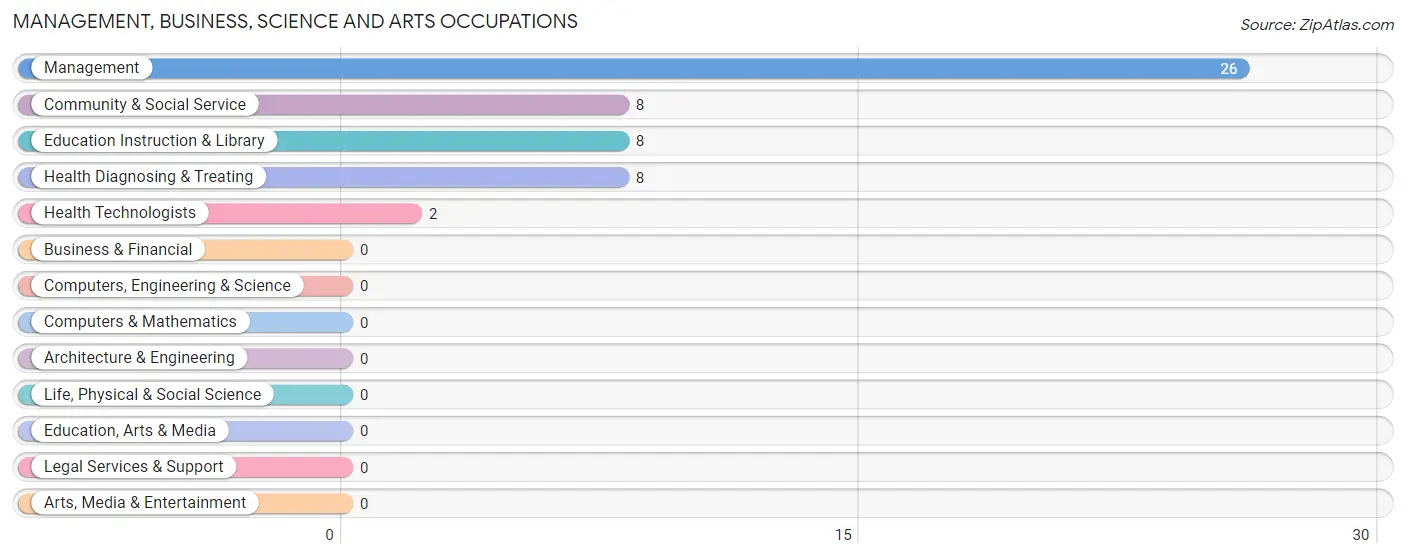
Management, Business, Science and Arts Occupations
The most common Management, Business, Science and Arts occupations in Napier Field are Management (26 | 14.1%), Community & Social Service (8 | 4.3%), Education Instruction & Library (8 | 4.3%), Health Diagnosing & Treating (8 | 4.3%), and Health Technologists (2 | 1.1%).
Management, Business, Science and Arts Occupations by Sex
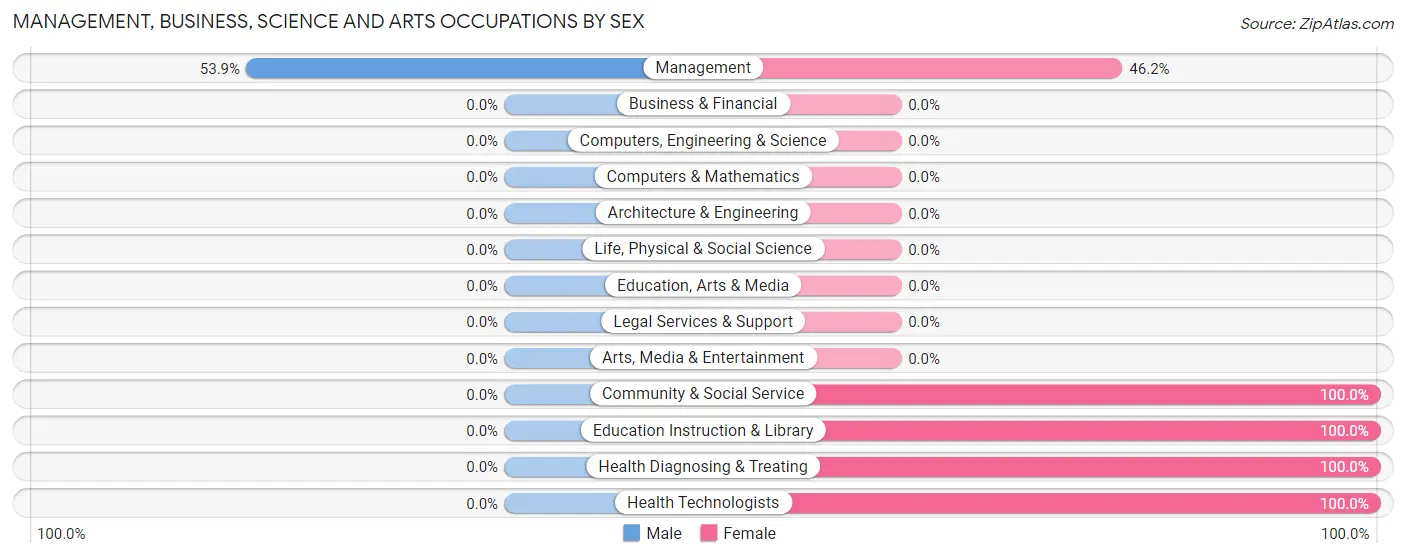
| Occupation | Male | Female |
| Management | 14 (53.8%) | 12 (46.2%) |
| Business & Financial | 0 (0.0%) | 0 (0.0%) |
| Computers, Engineering & Science | 0 (0.0%) | 0 (0.0%) |
| Computers & Mathematics | 0 (0.0%) | 0 (0.0%) |
| Architecture & Engineering | 0 (0.0%) | 0 (0.0%) |
| Life, Physical & Social Science | 0 (0.0%) | 0 (0.0%) |
| Community & Social Service | 0 (0.0%) | 8 (100.0%) |
| Education, Arts & Media | 0 (0.0%) | 0 (0.0%) |
| Legal Services & Support | 0 (0.0%) | 0 (0.0%) |
| Education Instruction & Library | 0 (0.0%) | 8 (100.0%) |
| Arts, Media & Entertainment | 0 (0.0%) | 0 (0.0%) |
| Health Diagnosing & Treating | 0 (0.0%) | 8 (100.0%) |
| Health Technologists | 0 (0.0%) | 2 (100.0%) |
| Total (Category) | 14 (33.3%) | 28 (66.7%) |
| Total (Overall) | 106 (57.6%) | 78 (42.4%) |
Services Occupations
The most common Services occupations in Napier Field are Cleaning & Maintenance (11 | 6.0%), Food Preparation & Serving (10 | 5.4%), Personal Care & Service (6 | 3.3%), Healthcare Support (5 | 2.7%), and Security & Protection (3 | 1.6%).
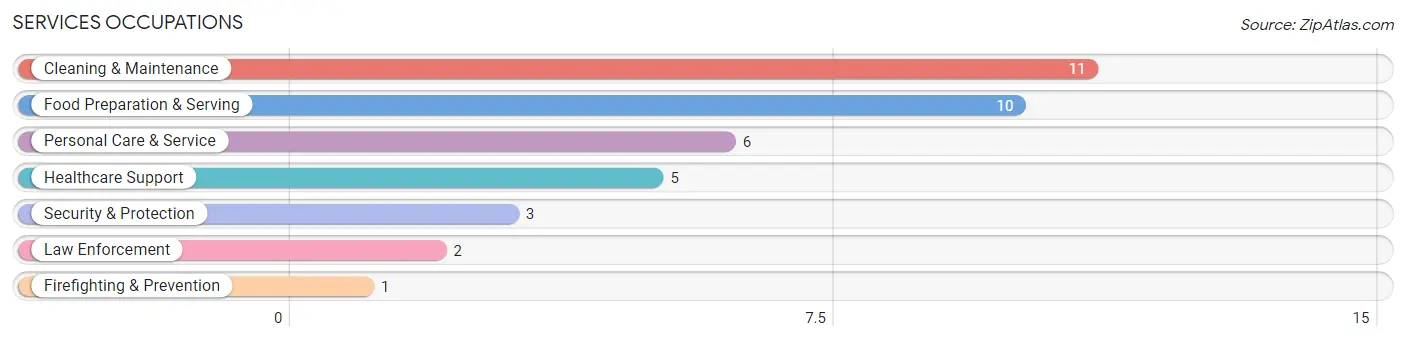
Services Occupations by Sex
Within the Services occupations in Napier Field, the most male-oriented occupations are Cleaning & Maintenance (100.0%), Personal Care & Service (100.0%), and Food Preparation & Serving (90.0%), while the most female-oriented occupations are Healthcare Support (100.0%), Security & Protection (100.0%), and Firefighting & Prevention (100.0%).
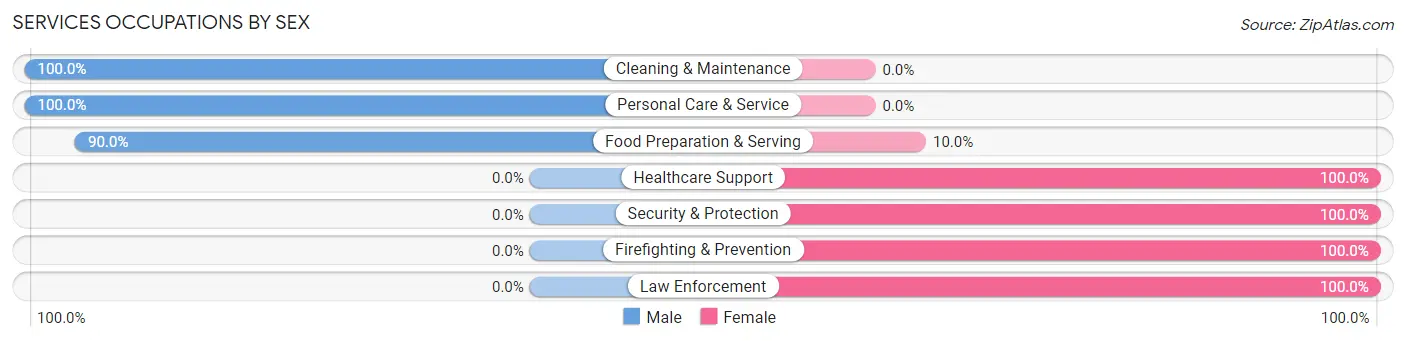
| Occupation | Male | Female |
| Healthcare Support | 0 (0.0%) | 5 (100.0%) |
| Security & Protection | 0 (0.0%) | 3 (100.0%) |
| Firefighting & Prevention | 0 (0.0%) | 1 (100.0%) |
| Law Enforcement | 0 (0.0%) | 2 (100.0%) |
| Food Preparation & Serving | 9 (90.0%) | 1 (10.0%) |
| Cleaning & Maintenance | 11 (100.0%) | 0 (0.0%) |
| Personal Care & Service | 6 (100.0%) | 0 (0.0%) |
| Total (Category) | 26 (74.3%) | 9 (25.7%) |
| Total (Overall) | 106 (57.6%) | 78 (42.4%) |
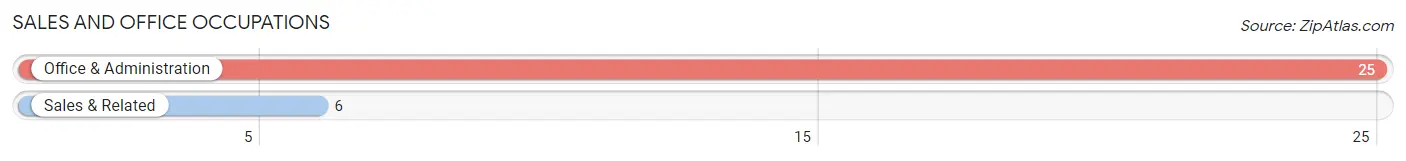
Sales and Office Occupations
The most common Sales and Office occupations in Napier Field are Office & Administration (25 | 13.6%), and Sales & Related (6 | 3.3%).
Sales and Office Occupations by Sex
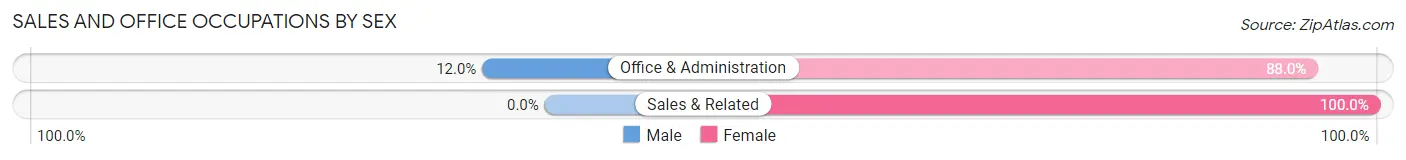
| Occupation | Male | Female |
| Sales & Related | 0 (0.0%) | 6 (100.0%) |
| Office & Administration | 3 (12.0%) | 22 (88.0%) |
| Total (Category) | 3 (9.7%) | 28 (90.3%) |
| Total (Overall) | 106 (57.6%) | 78 (42.4%) |
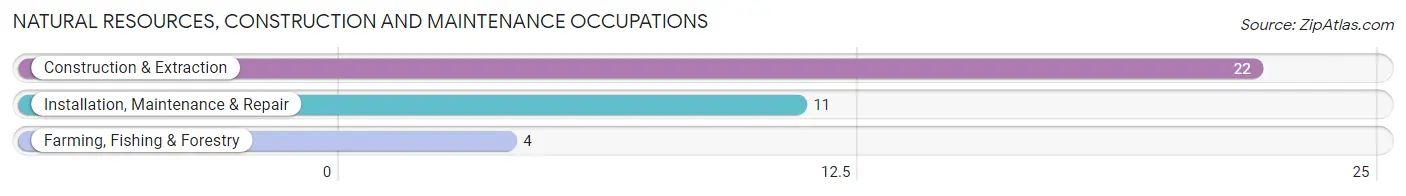
Natural Resources, Construction and Maintenance Occupations
The most common Natural Resources, Construction and Maintenance occupations in Napier Field are Construction & Extraction (22 | 12.0%), Installation, Maintenance & Repair (11 | 6.0%), and Farming, Fishing & Forestry (4 | 2.2%).
Natural Resources, Construction and Maintenance Occupations by Sex
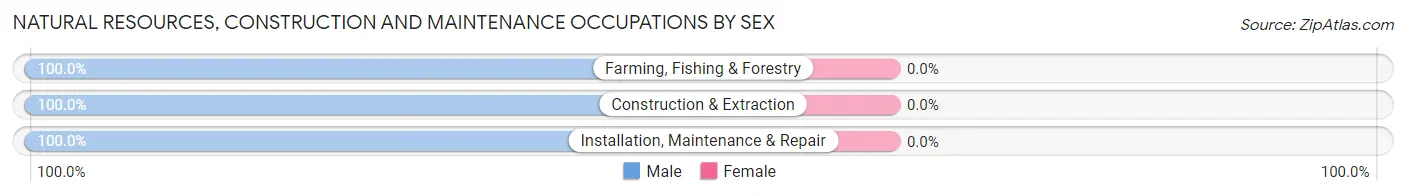
| Occupation | Male | Female |
| Farming, Fishing & Forestry | 4 (100.0%) | 0 (0.0%) |
| Construction & Extraction | 22 (100.0%) | 0 (0.0%) |
| Installation, Maintenance & Repair | 11 (100.0%) | 0 (0.0%) |
| Total (Category) | 37 (100.0%) | 0 (0.0%) |
| Total (Overall) | 106 (57.6%) | 78 (42.4%) |
Production, Transportation and Moving Occupations
The most common Production, Transportation and Moving occupations in Napier Field are Production (26 | 14.1%), Material Moving (7 | 3.8%), and Transportation (6 | 3.3%).
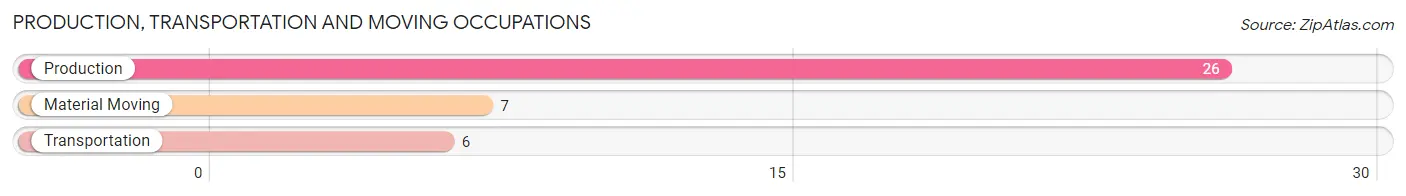
Production, Transportation and Moving Occupations by Sex
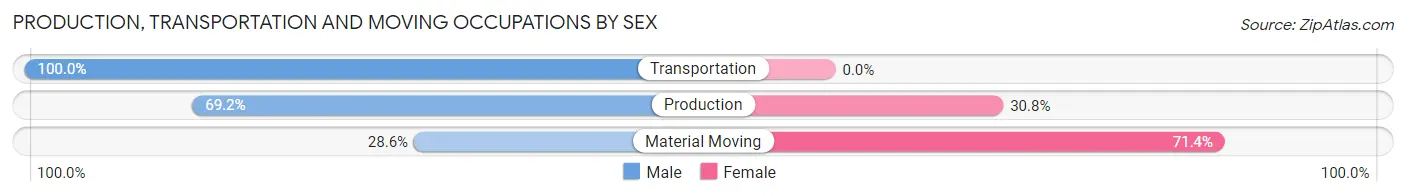
| Occupation | Male | Female |
| Production | 18 (69.2%) | 8 (30.8%) |
| Transportation | 6 (100.0%) | 0 (0.0%) |
| Material Moving | 2 (28.6%) | 5 (71.4%) |
| Total (Category) | 26 (66.7%) | 13 (33.3%) |
| Total (Overall) | 106 (57.6%) | 78 (42.4%) |
Employment Industries by Sex in Napier Field
Employment Industries in Napier Field
The major employment industries in Napier Field include Administrative & Support (25 | 13.6%), Manufacturing (23 | 12.5%), Health Care & Social Assistance (23 | 12.5%), Retail Trade (19 | 10.3%), and Construction (16 | 8.7%).
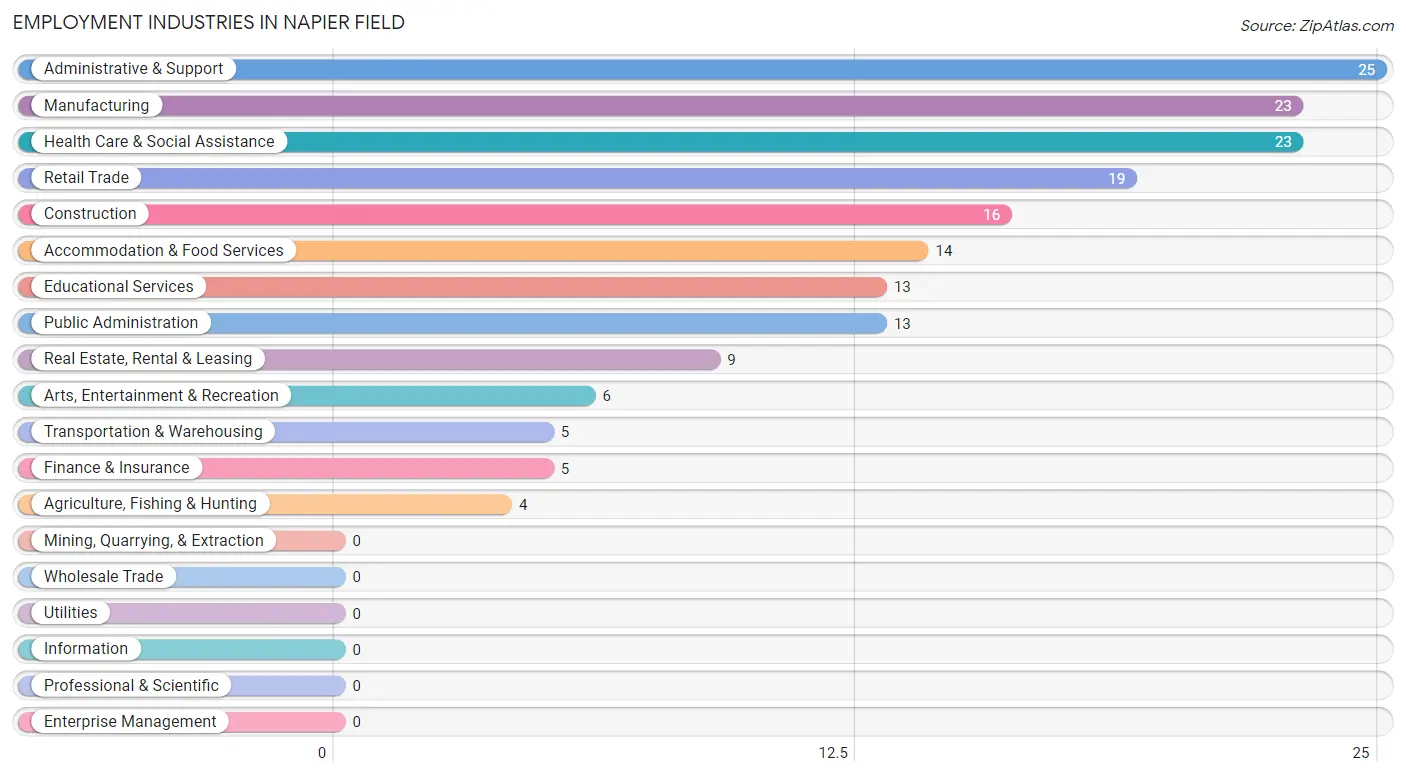
Employment Industries by Sex in Napier Field
The Napier Field industries that see more men than women are Agriculture, Fishing & Hunting (100.0%), Construction (100.0%), and Arts, Entertainment & Recreation (100.0%), whereas the industries that tend to have a higher number of women are Finance & Insurance (100.0%), Health Care & Social Assistance (87.0%), and Retail Trade (73.7%).
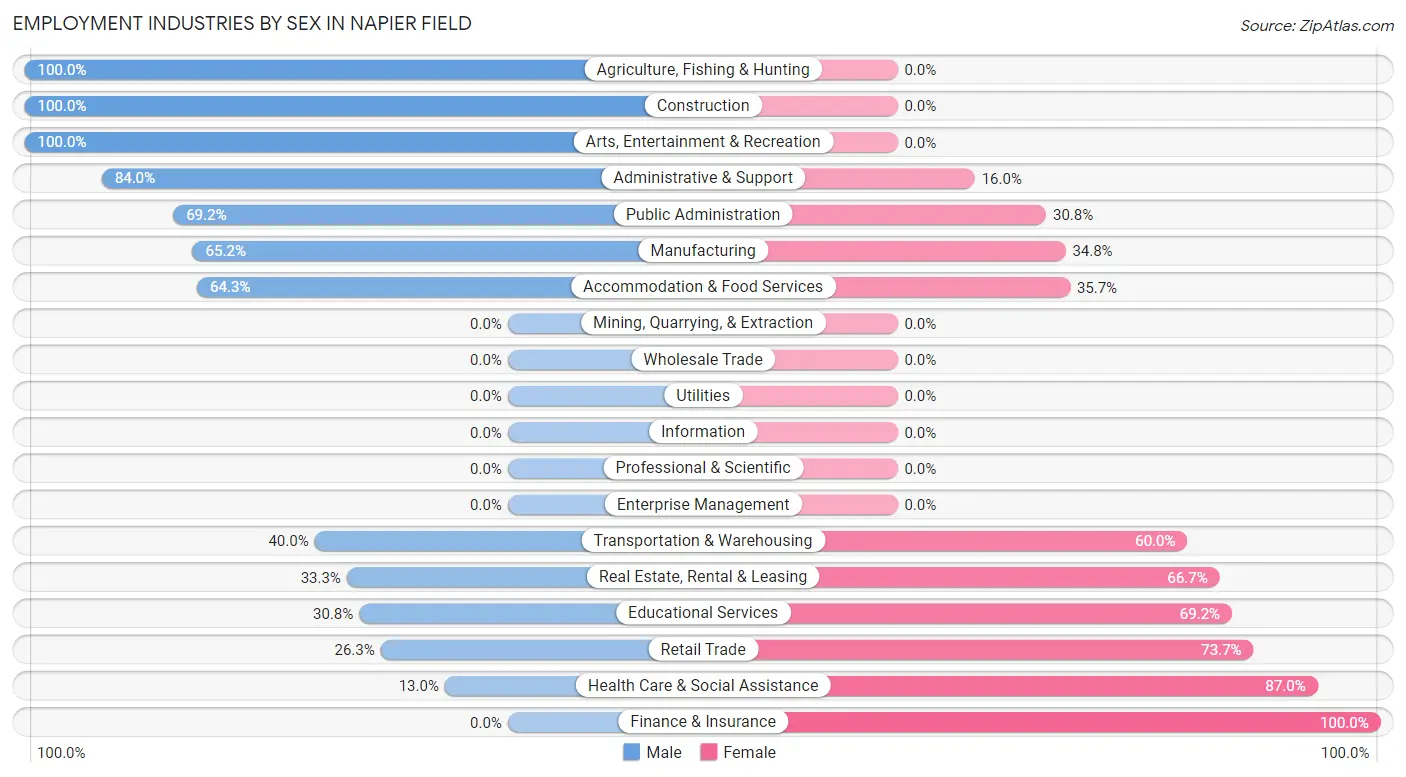
| Industry | Male | Female |
| Agriculture, Fishing & Hunting | 4 (100.0%) | 0 (0.0%) |
| Mining, Quarrying, & Extraction | 0 (0.0%) | 0 (0.0%) |
| Construction | 16 (100.0%) | 0 (0.0%) |
| Manufacturing | 15 (65.2%) | 8 (34.8%) |
| Wholesale Trade | 0 (0.0%) | 0 (0.0%) |
| Retail Trade | 5 (26.3%) | 14 (73.7%) |
| Transportation & Warehousing | 2 (40.0%) | 3 (60.0%) |
| Utilities | 0 (0.0%) | 0 (0.0%) |
| Information | 0 (0.0%) | 0 (0.0%) |
| Finance & Insurance | 0 (0.0%) | 5 (100.0%) |
| Real Estate, Rental & Leasing | 3 (33.3%) | 6 (66.7%) |
| Professional & Scientific | 0 (0.0%) | 0 (0.0%) |
| Enterprise Management | 0 (0.0%) | 0 (0.0%) |
| Administrative & Support | 21 (84.0%) | 4 (16.0%) |
| Educational Services | 4 (30.8%) | 9 (69.2%) |
| Health Care & Social Assistance | 3 (13.0%) | 20 (87.0%) |
| Arts, Entertainment & Recreation | 6 (100.0%) | 0 (0.0%) |
| Accommodation & Food Services | 9 (64.3%) | 5 (35.7%) |
| Public Administration | 9 (69.2%) | 4 (30.8%) |
| Total | 106 (57.6%) | 78 (42.4%) |
Education in Napier Field
School Enrollment in Napier Field
The most common levels of schooling among the 119 students in Napier Field are high school (47 | 39.5%), middle school (27 | 22.7%), and elementary school (25 | 21.0%).
| School Level | # Students | % Students |
| Nursery / Preschool | 4 | 3.4% |
| Kindergarten | 7 | 5.9% |
| Elementary School | 25 | 21.0% |
| Middle School | 27 | 22.7% |
| High School | 47 | 39.5% |
| College / Undergraduate | 9 | 7.6% |
| Graduate / Professional | 0 | 0.0% |
| Total | 119 | 100.0% |
School Enrollment by Age by Funding Source in Napier Field
Out of a total of 119 students who are enrolled in schools in Napier Field, 13 (10.9%) attend a private institution, while the remaining 106 (89.1%) are enrolled in public schools. The age group of 3 to 4 year olds has the highest likelihood of being enrolled in private schools, with 2 (100.0% in the age bracket) enrolled. Conversely, the age group of 18 to 19 year olds has the lowest likelihood of being enrolled in a private school, with 9 (100.0% in the age bracket) attending a public institution.
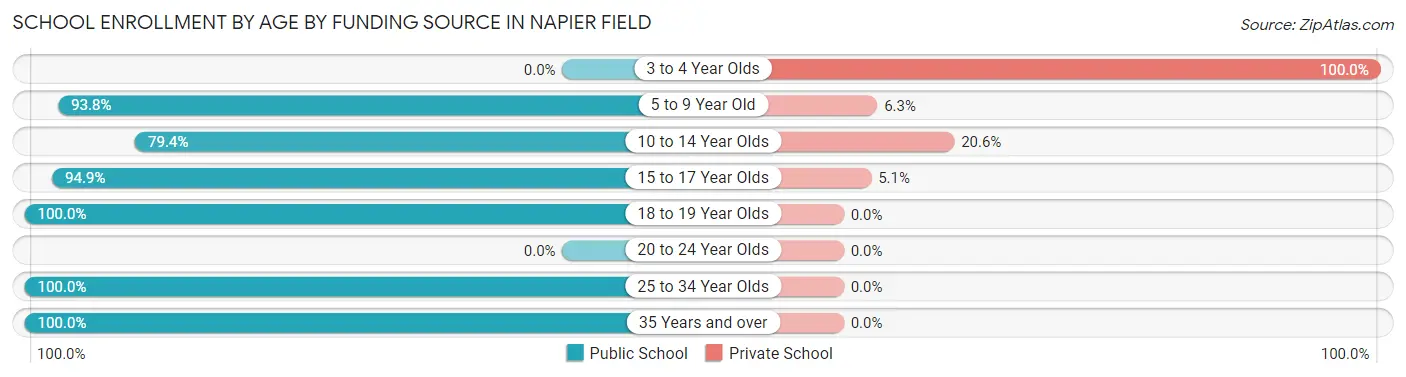
| Age Bracket | Public School | Private School |
| 3 to 4 Year Olds | 0 (0.0%) | 2 (100.0%) |
| 5 to 9 Year Old | 30 (93.8%) | 2 (6.2%) |
| 10 to 14 Year Olds | 27 (79.4%) | 7 (20.6%) |
| 15 to 17 Year Olds | 37 (94.9%) | 2 (5.1%) |
| 18 to 19 Year Olds | 9 (100.0%) | 0 (0.0%) |
| 20 to 24 Year Olds | 0 (0.0%) | 0 (0.0%) |
| 25 to 34 Year Olds | 1 (100.0%) | 0 (0.0%) |
| 35 Years and over | 2 (100.0%) | 0 (0.0%) |
| Total | 106 (89.1%) | 13 (10.9%) |
Educational Attainment by Field of Study in Napier Field
Education (8 | 80.0%), and business (2 | 20.0%) are the most common fields of study among 10 individuals in Napier Field who have obtained a bachelor's degree or higher.
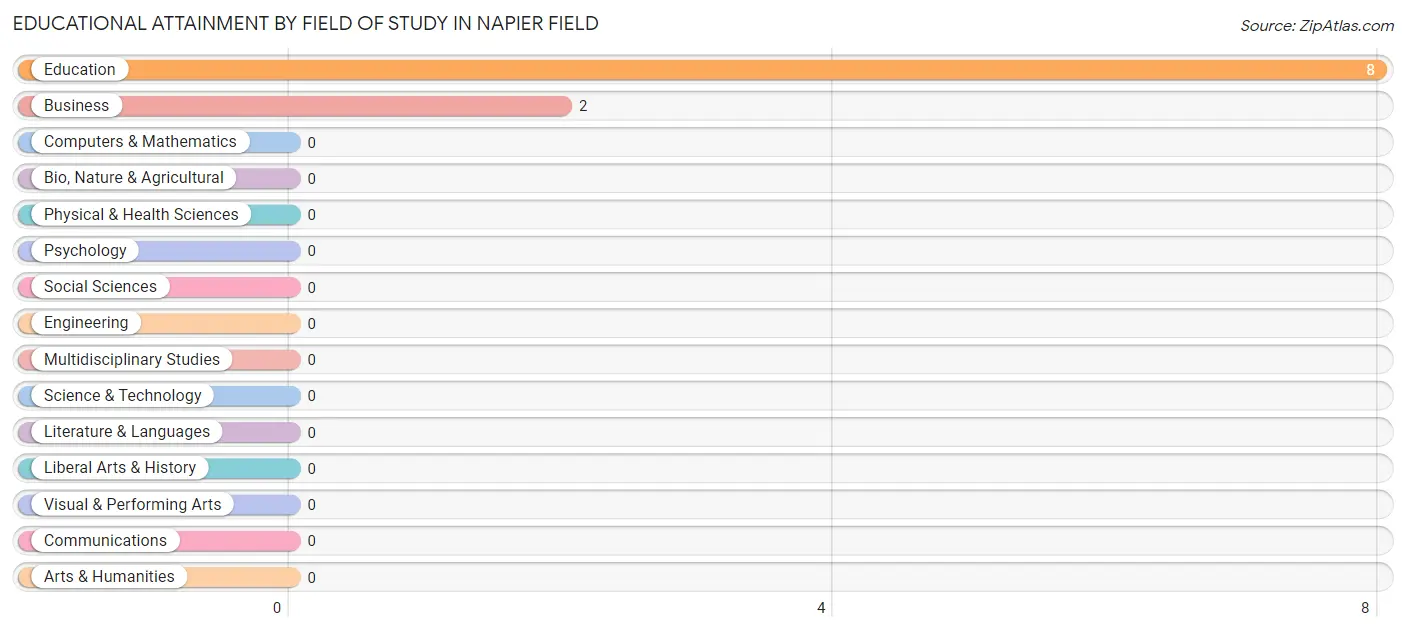
| Field of Study | # Graduates | % Graduates |
| Computers & Mathematics | 0 | 0.0% |
| Bio, Nature & Agricultural | 0 | 0.0% |
| Physical & Health Sciences | 0 | 0.0% |
| Psychology | 0 | 0.0% |
| Social Sciences | 0 | 0.0% |
| Engineering | 0 | 0.0% |
| Multidisciplinary Studies | 0 | 0.0% |
| Science & Technology | 0 | 0.0% |
| Business | 2 | 20.0% |
| Education | 8 | 80.0% |
| Literature & Languages | 0 | 0.0% |
| Liberal Arts & History | 0 | 0.0% |
| Visual & Performing Arts | 0 | 0.0% |
| Communications | 0 | 0.0% |
| Arts & Humanities | 0 | 0.0% |
| Total | 10 | 100.0% |
Transportation & Commute in Napier Field
Vehicle Availability by Sex in Napier Field
The most prevalent vehicle ownership categories in Napier Field are males with 2 vehicles (61, accounting for 57.6%) and females with 2 vehicles (44, making up 81.3%).
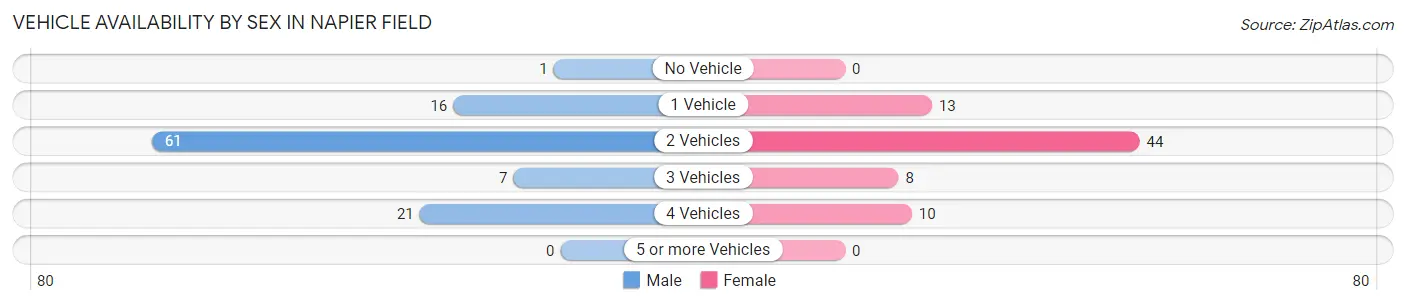
| Vehicles Available | Male | Female |
| No Vehicle | 1 (0.9%) | 0 (0.0%) |
| 1 Vehicle | 16 (15.1%) | 13 (17.3%) |
| 2 Vehicles | 61 (57.6%) | 44 (58.7%) |
| 3 Vehicles | 7 (6.6%) | 8 (10.7%) |
| 4 Vehicles | 21 (19.8%) | 10 (13.3%) |
| 5 or more Vehicles | 0 (0.0%) | 0 (0.0%) |
| Total | 106 (100.0%) | 75 (100.0%) |
Commute Time in Napier Field
The most frequently occuring commute durations in Napier Field are 15 to 19 minutes (44 commuters, 24.3%), 20 to 24 minutes (37 commuters, 20.4%), and 30 to 34 minutes (23 commuters, 12.7%).
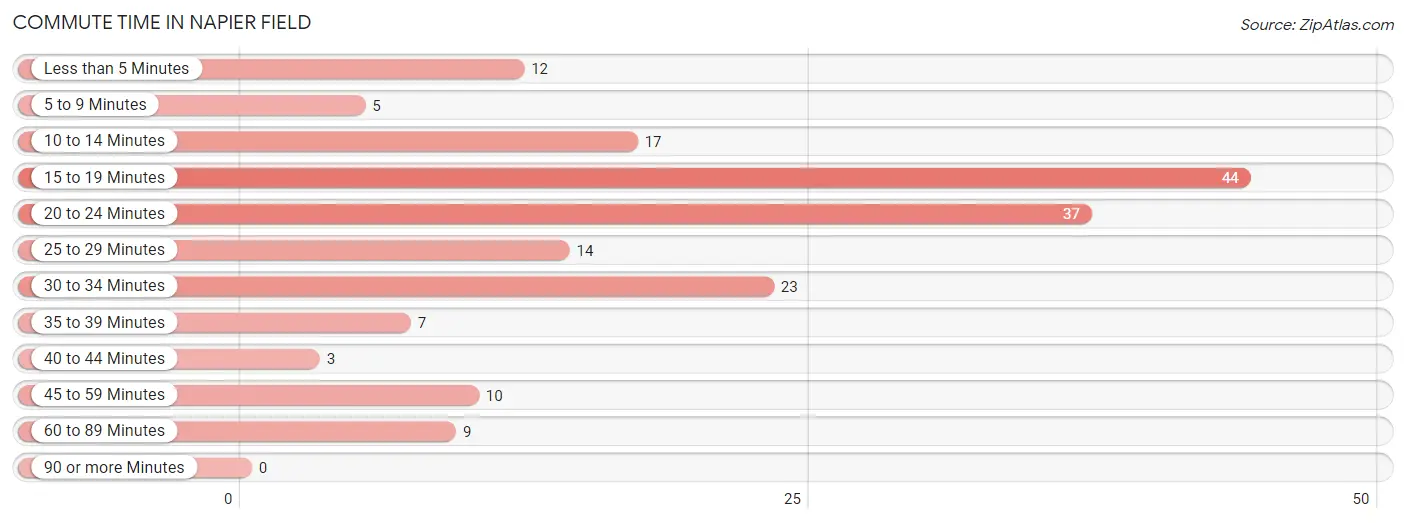
| Commute Time | # Commuters | % Commuters |
| Less than 5 Minutes | 12 | 6.6% |
| 5 to 9 Minutes | 5 | 2.8% |
| 10 to 14 Minutes | 17 | 9.4% |
| 15 to 19 Minutes | 44 | 24.3% |
| 20 to 24 Minutes | 37 | 20.4% |
| 25 to 29 Minutes | 14 | 7.7% |
| 30 to 34 Minutes | 23 | 12.7% |
| 35 to 39 Minutes | 7 | 3.9% |
| 40 to 44 Minutes | 3 | 1.7% |
| 45 to 59 Minutes | 10 | 5.5% |
| 60 to 89 Minutes | 9 | 5.0% |
| 90 or more Minutes | 0 | 0.0% |
Commute Time by Sex in Napier Field
The most common commute times in Napier Field are 15 to 19 minutes (28 commuters, 26.4%) for males and 20 to 24 minutes (22 commuters, 29.3%) for females.
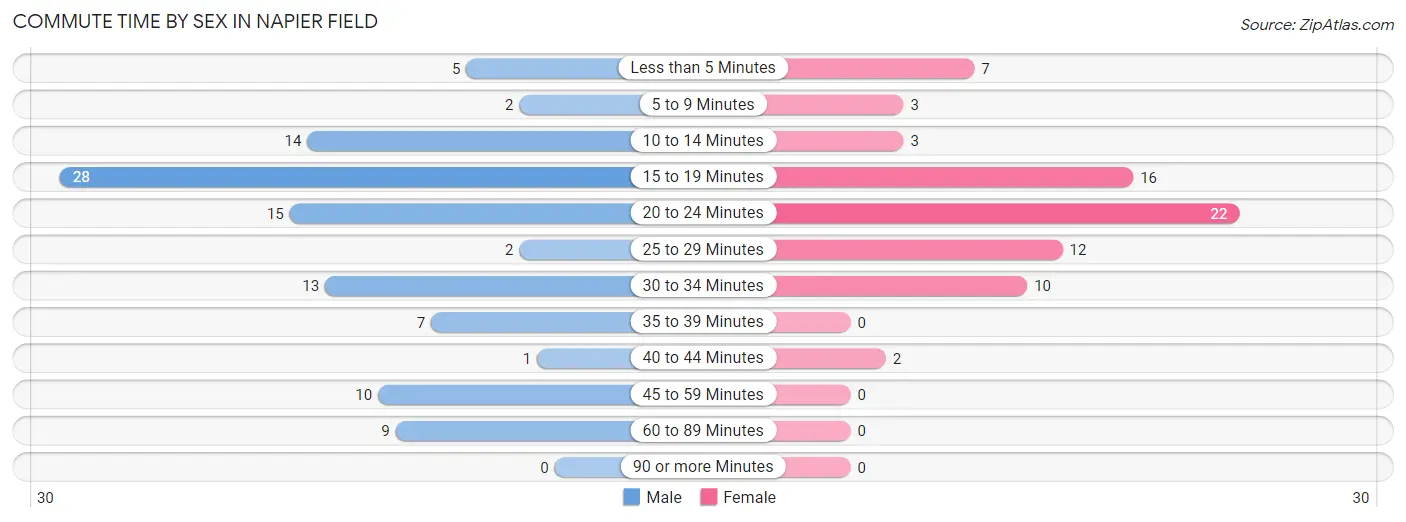
| Commute Time | Male | Female |
| Less than 5 Minutes | 5 (4.7%) | 7 (9.3%) |
| 5 to 9 Minutes | 2 (1.9%) | 3 (4.0%) |
| 10 to 14 Minutes | 14 (13.2%) | 3 (4.0%) |
| 15 to 19 Minutes | 28 (26.4%) | 16 (21.3%) |
| 20 to 24 Minutes | 15 (14.1%) | 22 (29.3%) |
| 25 to 29 Minutes | 2 (1.9%) | 12 (16.0%) |
| 30 to 34 Minutes | 13 (12.3%) | 10 (13.3%) |
| 35 to 39 Minutes | 7 (6.6%) | 0 (0.0%) |
| 40 to 44 Minutes | 1 (0.9%) | 2 (2.7%) |
| 45 to 59 Minutes | 10 (9.4%) | 0 (0.0%) |
| 60 to 89 Minutes | 9 (8.5%) | 0 (0.0%) |
| 90 or more Minutes | 0 (0.0%) | 0 (0.0%) |
Time of Departure to Work by Sex in Napier Field
The most frequent times of departure to work in Napier Field are 7:30 AM to 7:59 AM (16, 15.1%) for males and 6:30 AM to 6:59 AM (17, 22.7%) for females.
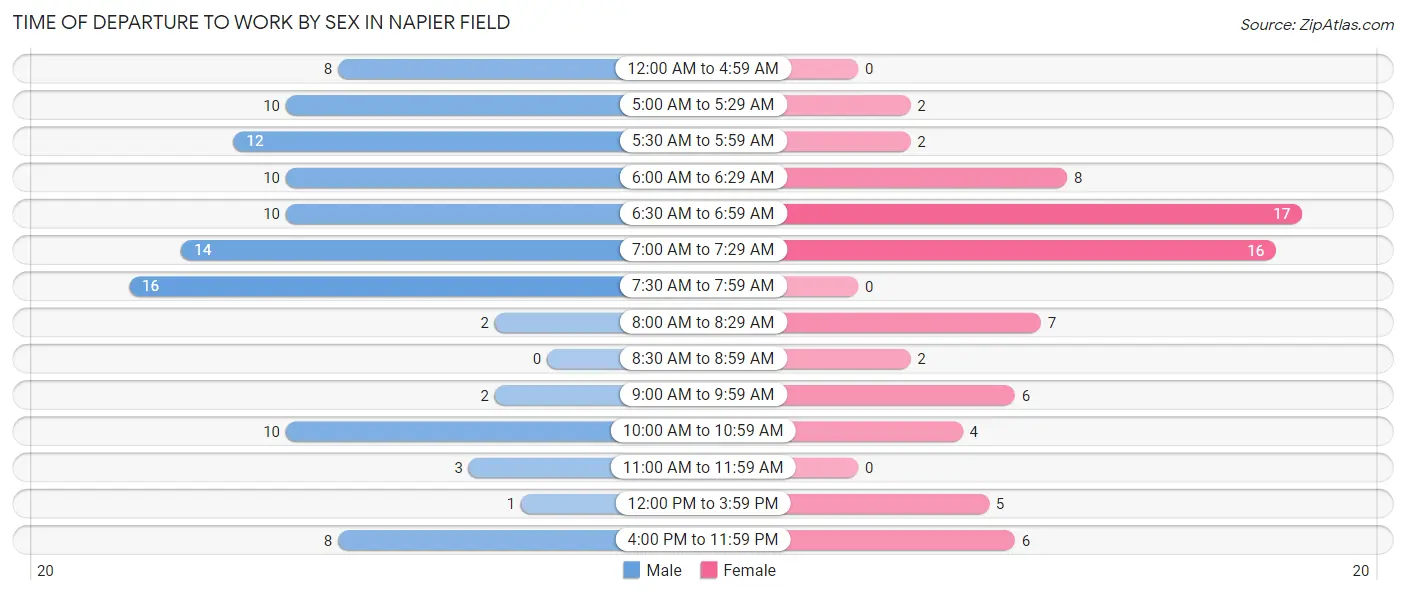
| Time of Departure | Male | Female |
| 12:00 AM to 4:59 AM | 8 (7.5%) | 0 (0.0%) |
| 5:00 AM to 5:29 AM | 10 (9.4%) | 2 (2.7%) |
| 5:30 AM to 5:59 AM | 12 (11.3%) | 2 (2.7%) |
| 6:00 AM to 6:29 AM | 10 (9.4%) | 8 (10.7%) |
| 6:30 AM to 6:59 AM | 10 (9.4%) | 17 (22.7%) |
| 7:00 AM to 7:29 AM | 14 (13.2%) | 16 (21.3%) |
| 7:30 AM to 7:59 AM | 16 (15.1%) | 0 (0.0%) |
| 8:00 AM to 8:29 AM | 2 (1.9%) | 7 (9.3%) |
| 8:30 AM to 8:59 AM | 0 (0.0%) | 2 (2.7%) |
| 9:00 AM to 9:59 AM | 2 (1.9%) | 6 (8.0%) |
| 10:00 AM to 10:59 AM | 10 (9.4%) | 4 (5.3%) |
| 11:00 AM to 11:59 AM | 3 (2.8%) | 0 (0.0%) |
| 12:00 PM to 3:59 PM | 1 (0.9%) | 5 (6.7%) |
| 4:00 PM to 11:59 PM | 8 (7.5%) | 6 (8.0%) |
| Total | 106 (100.0%) | 75 (100.0%) |
Housing Occupancy in Napier Field
Occupancy by Ownership in Napier Field
Of the total 159 dwellings in Napier Field, owner-occupied units account for 98 (61.6%), while renter-occupied units make up 61 (38.4%).
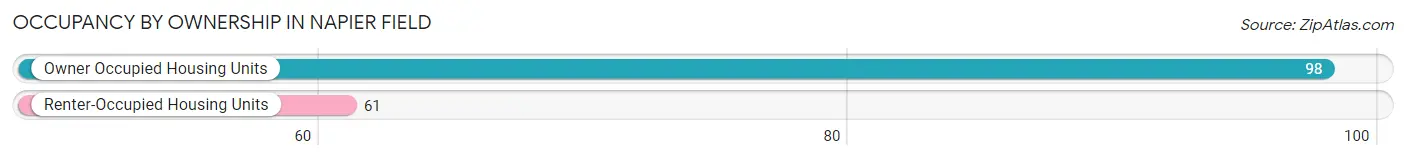
| Occupancy | # Housing Units | % Housing Units |
| Owner Occupied Housing Units | 98 | 61.6% |
| Renter-Occupied Housing Units | 61 | 38.4% |
| Total Occupied Housing Units | 159 | 100.0% |
Occupancy by Household Size in Napier Field
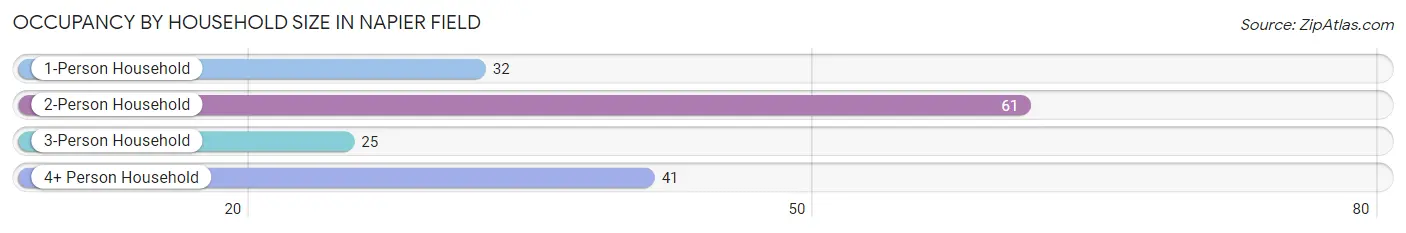
| Household Size | # Housing Units | % Housing Units |
| 1-Person Household | 32 | 20.1% |
| 2-Person Household | 61 | 38.4% |
| 3-Person Household | 25 | 15.7% |
| 4+ Person Household | 41 | 25.8% |
| Total Housing Units | 159 | 100.0% |
Occupancy by Ownership by Household Size in Napier Field
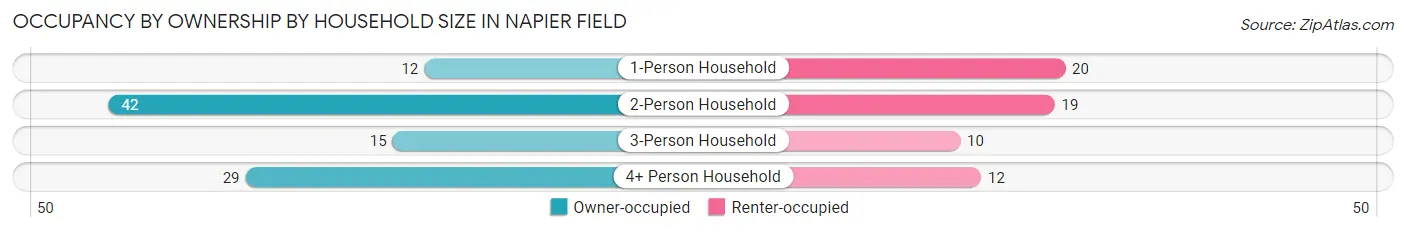
| Household Size | Owner-occupied | Renter-occupied |
| 1-Person Household | 12 (37.5%) | 20 (62.5%) |
| 2-Person Household | 42 (68.9%) | 19 (31.1%) |
| 3-Person Household | 15 (60.0%) | 10 (40.0%) |
| 4+ Person Household | 29 (70.7%) | 12 (29.3%) |
| Total Housing Units | 98 (61.6%) | 61 (38.4%) |
Occupancy by Educational Attainment in Napier Field
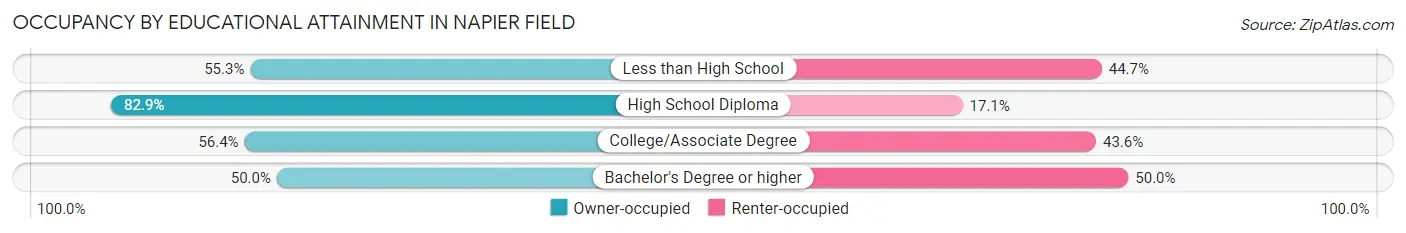
| Household Size | Owner-occupied | Renter-occupied |
| Less than High School | 21 (55.3%) | 17 (44.7%) |
| High School Diploma | 29 (82.9%) | 6 (17.1%) |
| College/Associate Degree | 44 (56.4%) | 34 (43.6%) |
| Bachelor's Degree or higher | 4 (50.0%) | 4 (50.0%) |
Occupancy by Age of Householder in Napier Field
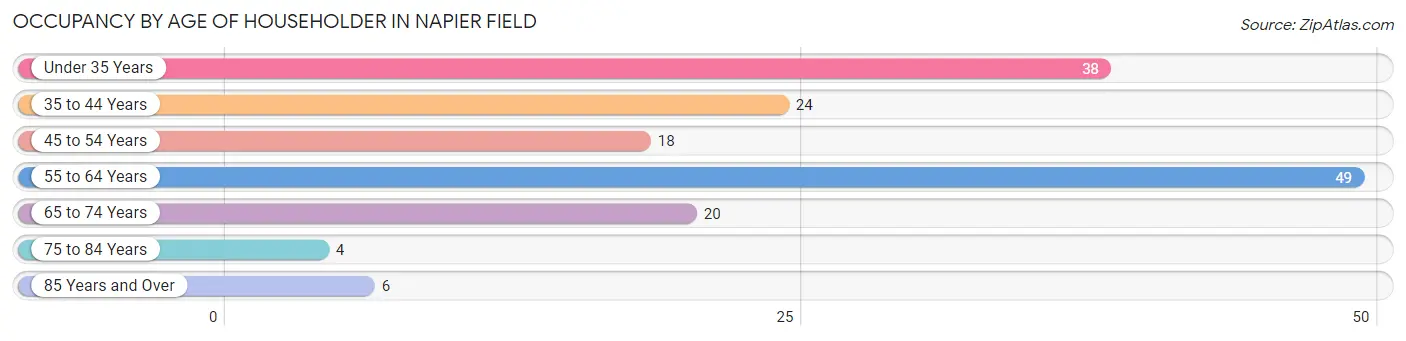
| Age Bracket | # Households | % Households |
| Under 35 Years | 38 | 23.9% |
| 35 to 44 Years | 24 | 15.1% |
| 45 to 54 Years | 18 | 11.3% |
| 55 to 64 Years | 49 | 30.8% |
| 65 to 74 Years | 20 | 12.6% |
| 75 to 84 Years | 4 | 2.5% |
| 85 Years and Over | 6 | 3.8% |
| Total | 159 | 100.0% |
Housing Finances in Napier Field
Median Income by Occupancy in Napier Field
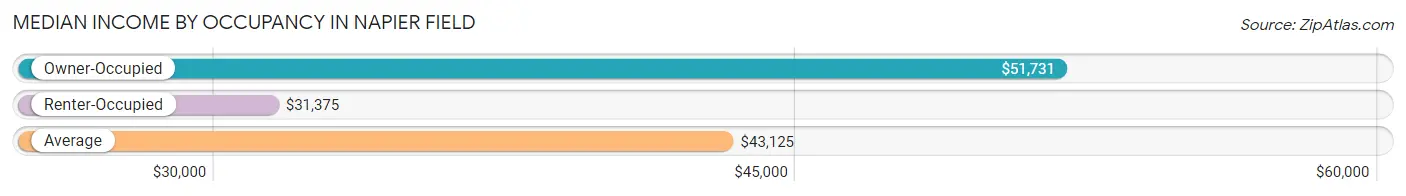
| Occupancy Type | # Households | Median Income |
| Owner-Occupied | 98 (61.6%) | $51,731 |
| Renter-Occupied | 61 (38.4%) | $31,375 |
| Average | 159 (100.0%) | $43,125 |
Occupancy by Householder Income Bracket in Napier Field
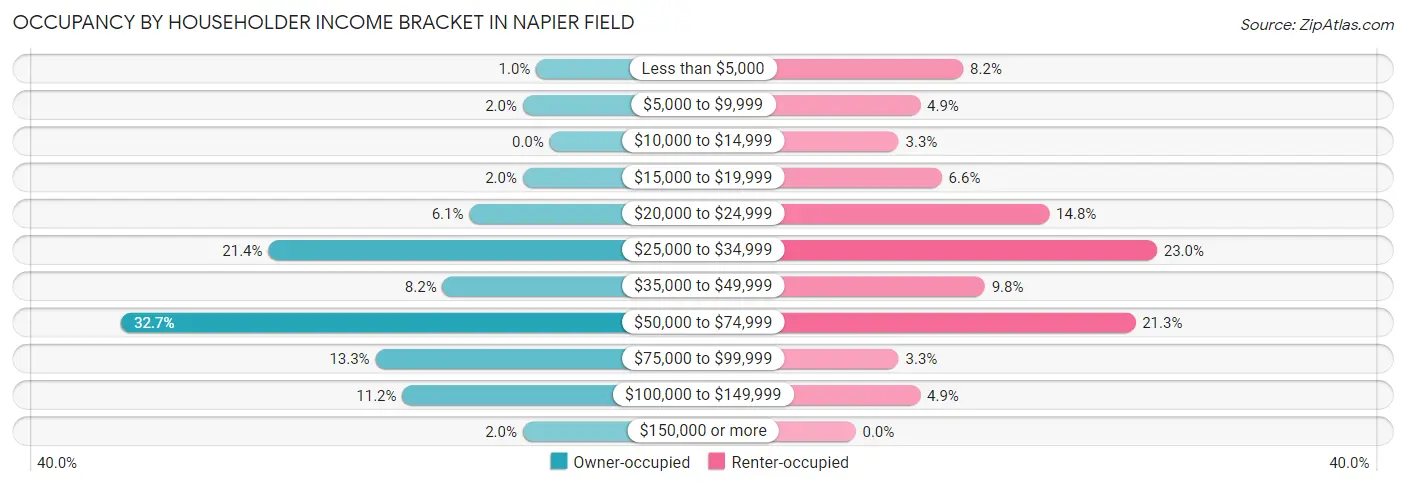
| Income Bracket | Owner-occupied | Renter-occupied |
| Less than $5,000 | 1 (1.0%) | 5 (8.2%) |
| $5,000 to $9,999 | 2 (2.0%) | 3 (4.9%) |
| $10,000 to $14,999 | 0 (0.0%) | 2 (3.3%) |
| $15,000 to $19,999 | 2 (2.0%) | 4 (6.6%) |
| $20,000 to $24,999 | 6 (6.1%) | 9 (14.7%) |
| $25,000 to $34,999 | 21 (21.4%) | 14 (23.0%) |
| $35,000 to $49,999 | 8 (8.2%) | 6 (9.8%) |
| $50,000 to $74,999 | 32 (32.7%) | 13 (21.3%) |
| $75,000 to $99,999 | 13 (13.3%) | 2 (3.3%) |
| $100,000 to $149,999 | 11 (11.2%) | 3 (4.9%) |
| $150,000 or more | 2 (2.0%) | 0 (0.0%) |
| Total | 98 (100.0%) | 61 (100.0%) |
Monthly Housing Cost Tiers in Napier Field
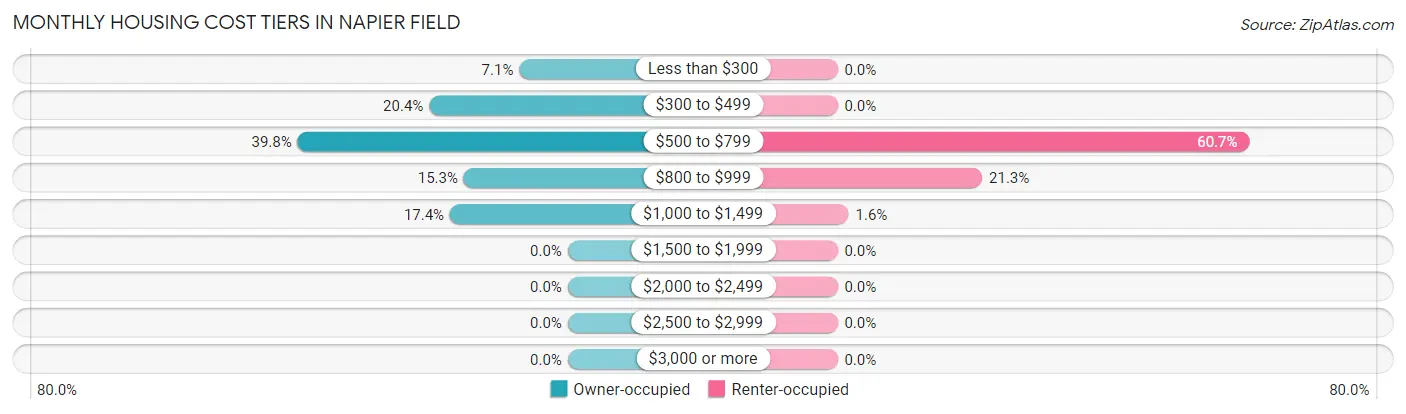
| Monthly Cost | Owner-occupied | Renter-occupied |
| Less than $300 | 7 (7.1%) | 0 (0.0%) |
| $300 to $499 | 20 (20.4%) | 0 (0.0%) |
| $500 to $799 | 39 (39.8%) | 37 (60.7%) |
| $800 to $999 | 15 (15.3%) | 13 (21.3%) |
| $1,000 to $1,499 | 17 (17.3%) | 1 (1.6%) |
| $1,500 to $1,999 | 0 (0.0%) | 0 (0.0%) |
| $2,000 to $2,499 | 0 (0.0%) | 0 (0.0%) |
| $2,500 to $2,999 | 0 (0.0%) | 0 (0.0%) |
| $3,000 or more | 0 (0.0%) | 0 (0.0%) |
| Total | 98 (100.0%) | 61 (100.0%) |
Physical Housing Characteristics in Napier Field
Housing Structures in Napier Field
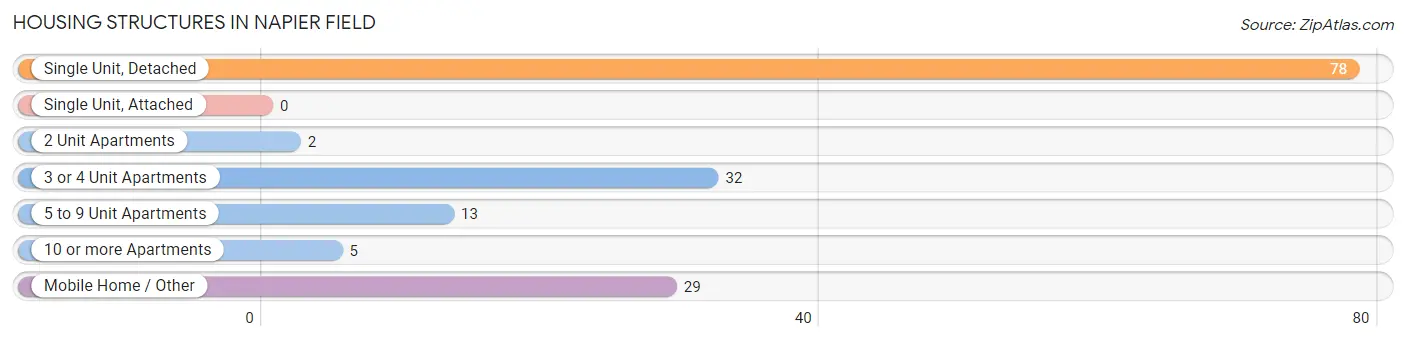
| Structure Type | # Housing Units | % Housing Units |
| Single Unit, Detached | 78 | 49.1% |
| Single Unit, Attached | 0 | 0.0% |
| 2 Unit Apartments | 2 | 1.3% |
| 3 or 4 Unit Apartments | 32 | 20.1% |
| 5 to 9 Unit Apartments | 13 | 8.2% |
| 10 or more Apartments | 5 | 3.1% |
| Mobile Home / Other | 29 | 18.2% |
| Total | 159 | 100.0% |
Housing Structures by Occupancy in Napier Field
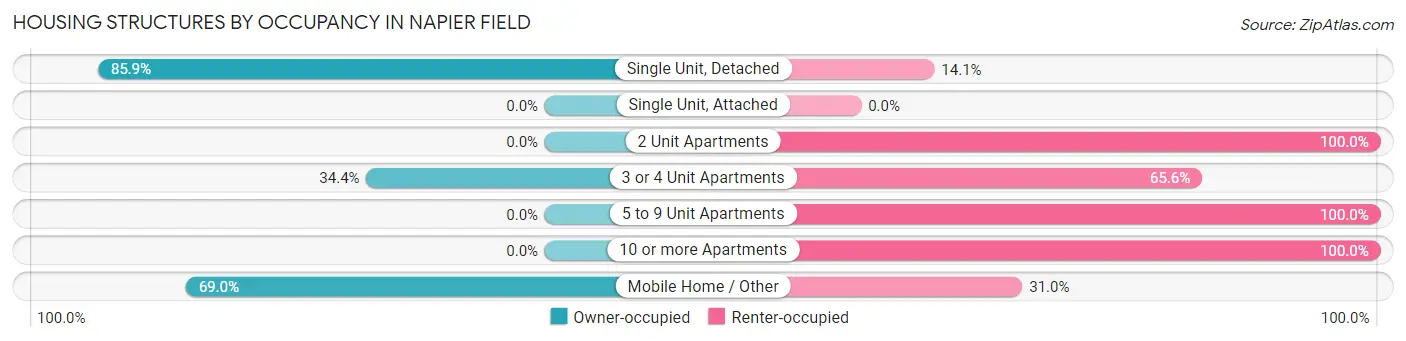
| Structure Type | Owner-occupied | Renter-occupied |
| Single Unit, Detached | 67 (85.9%) | 11 (14.1%) |
| Single Unit, Attached | 0 (0.0%) | 0 (0.0%) |
| 2 Unit Apartments | 0 (0.0%) | 2 (100.0%) |
| 3 or 4 Unit Apartments | 11 (34.4%) | 21 (65.6%) |
| 5 to 9 Unit Apartments | 0 (0.0%) | 13 (100.0%) |
| 10 or more Apartments | 0 (0.0%) | 5 (100.0%) |
| Mobile Home / Other | 20 (69.0%) | 9 (31.0%) |
| Total | 98 (61.6%) | 61 (38.4%) |
Housing Structures by Number of Rooms in Napier Field
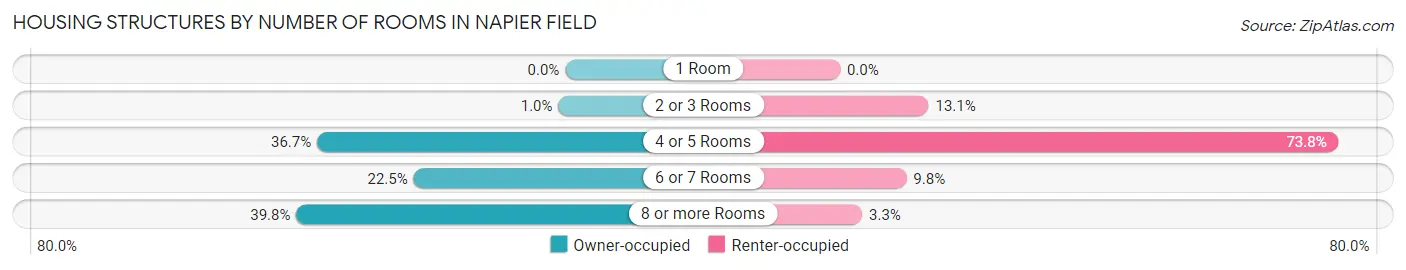
| Number of Rooms | Owner-occupied | Renter-occupied |
| 1 Room | 0 (0.0%) | 0 (0.0%) |
| 2 or 3 Rooms | 1 (1.0%) | 8 (13.1%) |
| 4 or 5 Rooms | 36 (36.7%) | 45 (73.8%) |
| 6 or 7 Rooms | 22 (22.5%) | 6 (9.8%) |
| 8 or more Rooms | 39 (39.8%) | 2 (3.3%) |
| Total | 98 (100.0%) | 61 (100.0%) |
Housing Structure by Heating Type in Napier Field
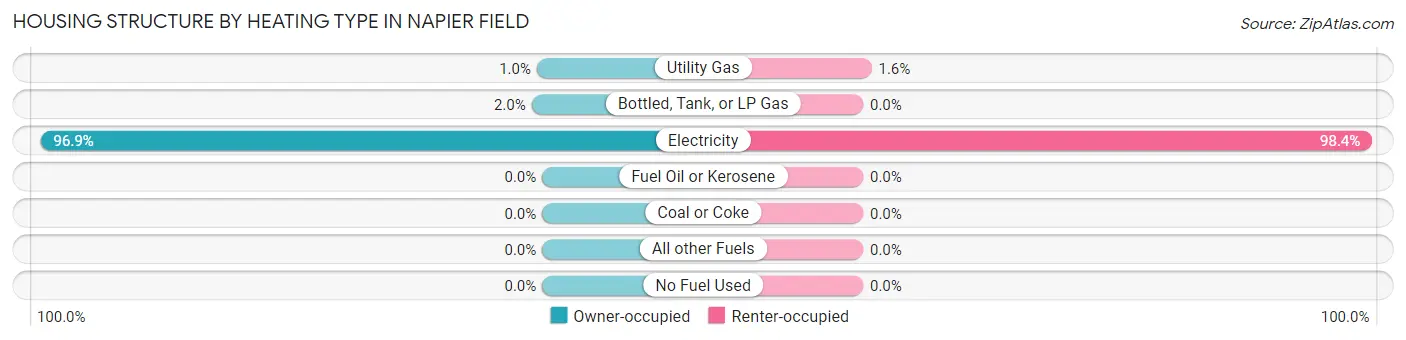
| Heating Type | Owner-occupied | Renter-occupied |
| Utility Gas | 1 (1.0%) | 1 (1.6%) |
| Bottled, Tank, or LP Gas | 2 (2.0%) | 0 (0.0%) |
| Electricity | 95 (96.9%) | 60 (98.4%) |
| Fuel Oil or Kerosene | 0 (0.0%) | 0 (0.0%) |
| Coal or Coke | 0 (0.0%) | 0 (0.0%) |
| All other Fuels | 0 (0.0%) | 0 (0.0%) |
| No Fuel Used | 0 (0.0%) | 0 (0.0%) |
| Total | 98 (100.0%) | 61 (100.0%) |
Household Vehicle Usage in Napier Field
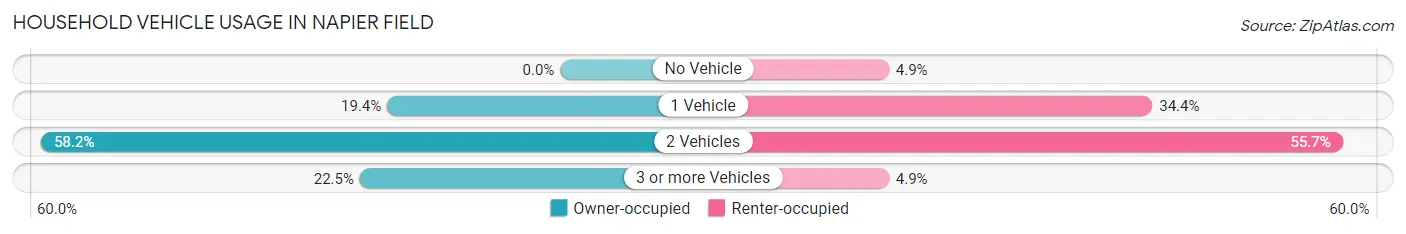
| Vehicles per Household | Owner-occupied | Renter-occupied |
| No Vehicle | 0 (0.0%) | 3 (4.9%) |
| 1 Vehicle | 19 (19.4%) | 21 (34.4%) |
| 2 Vehicles | 57 (58.2%) | 34 (55.7%) |
| 3 or more Vehicles | 22 (22.5%) | 3 (4.9%) |
| Total | 98 (100.0%) | 61 (100.0%) |
Real Estate & Mortgages in Napier Field
Real Estate and Mortgage Overview in Napier Field
| Characteristic | Without Mortgage | With Mortgage |
| Housing Units | 40 | 58 |
| Median Property Value | $50,000 | $84,400 |
| Median Household Income | $51,667 | $2 |
| Monthly Housing Costs | $425 | $0 |
| Real Estate Taxes | $200 | $10 |
Property Value by Mortgage Status in Napier Field
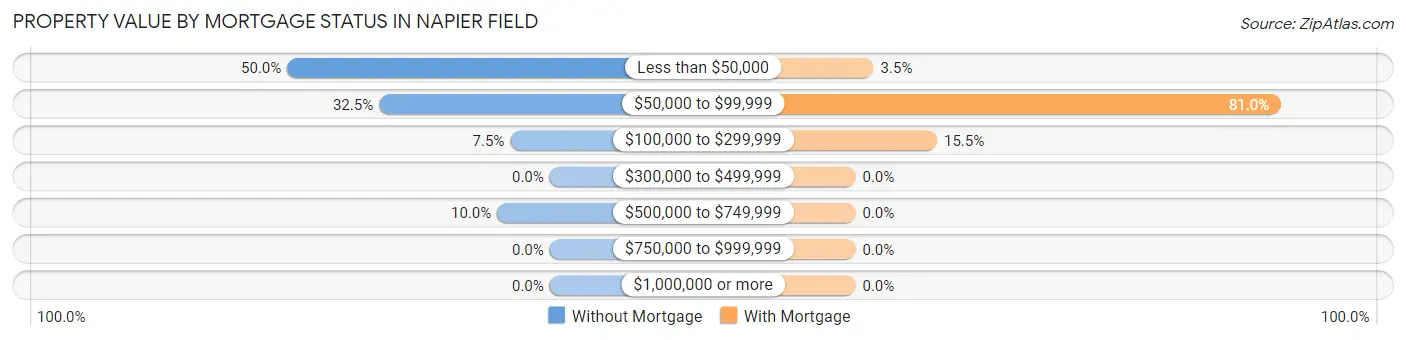
| Property Value | Without Mortgage | With Mortgage |
| Less than $50,000 | 20 (50.0%) | 2 (3.5%) |
| $50,000 to $99,999 | 13 (32.5%) | 47 (81.0%) |
| $100,000 to $299,999 | 3 (7.5%) | 9 (15.5%) |
| $300,000 to $499,999 | 0 (0.0%) | 0 (0.0%) |
| $500,000 to $749,999 | 4 (10.0%) | 0 (0.0%) |
| $750,000 to $999,999 | 0 (0.0%) | 0 (0.0%) |
| $1,000,000 or more | 0 (0.0%) | 0 (0.0%) |
| Total | 40 (100.0%) | 58 (100.0%) |
Household Income by Mortgage Status in Napier Field
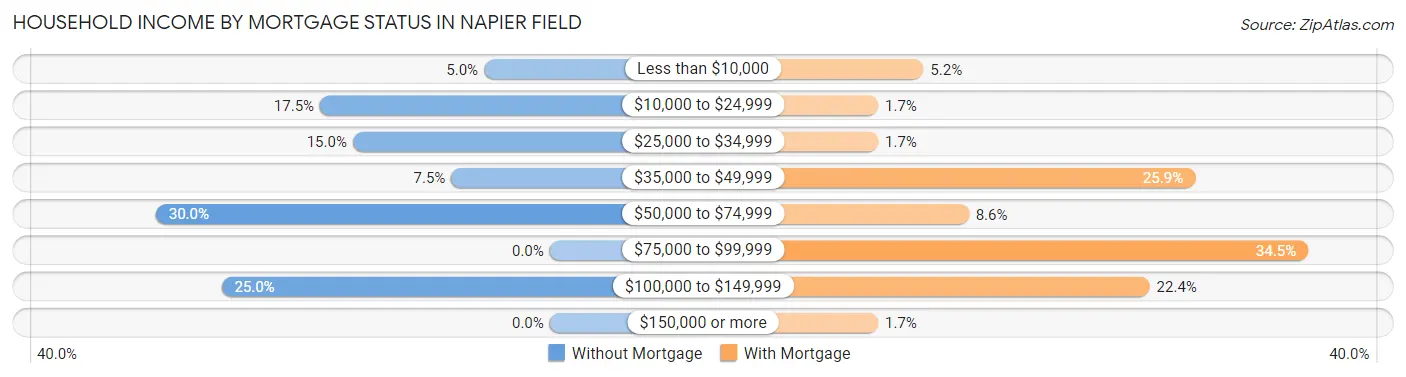
| Household Income | Without Mortgage | With Mortgage |
| Less than $10,000 | 2 (5.0%) | 3 (5.2%) |
| $10,000 to $24,999 | 7 (17.5%) | 1 (1.7%) |
| $25,000 to $34,999 | 6 (15.0%) | 1 (1.7%) |
| $35,000 to $49,999 | 3 (7.5%) | 15 (25.9%) |
| $50,000 to $74,999 | 12 (30.0%) | 5 (8.6%) |
| $75,000 to $99,999 | 0 (0.0%) | 20 (34.5%) |
| $100,000 to $149,999 | 10 (25.0%) | 13 (22.4%) |
| $150,000 or more | 0 (0.0%) | 1 (1.7%) |
| Total | 40 (100.0%) | 58 (100.0%) |
Property Value to Household Income Ratio in Napier Field
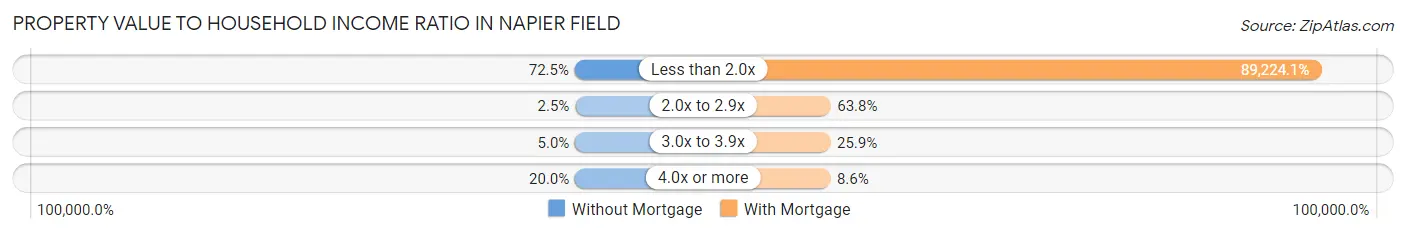
| Value-to-Income Ratio | Without Mortgage | With Mortgage |
| Less than 2.0x | 29 (72.5%) | 51,750 (89,224.1%) |
| 2.0x to 2.9x | 1 (2.5%) | 37 (63.8%) |
| 3.0x to 3.9x | 2 (5.0%) | 15 (25.9%) |
| 4.0x or more | 8 (20.0%) | 5 (8.6%) |
| Total | 40 (100.0%) | 58 (100.0%) |
Real Estate Taxes by Mortgage Status in Napier Field
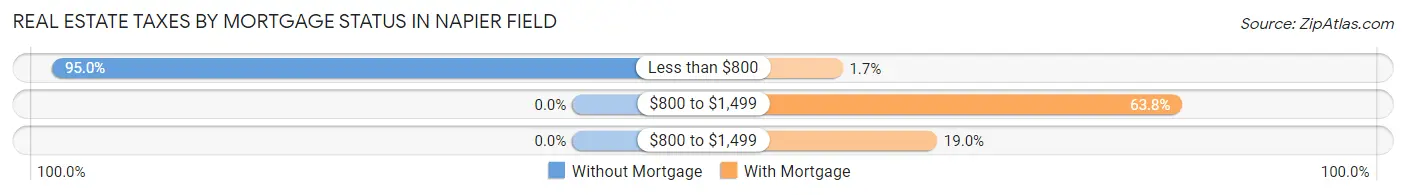
| Property Taxes | Without Mortgage | With Mortgage |
| Less than $800 | 38 (95.0%) | 1 (1.7%) |
| $800 to $1,499 | 0 (0.0%) | 37 (63.8%) |
| $800 to $1,499 | 0 (0.0%) | 11 (19.0%) |
| Total | 40 (100.0%) | 58 (100.0%) |
Health & Disability in Napier Field
Health Insurance Coverage by Age in Napier Field
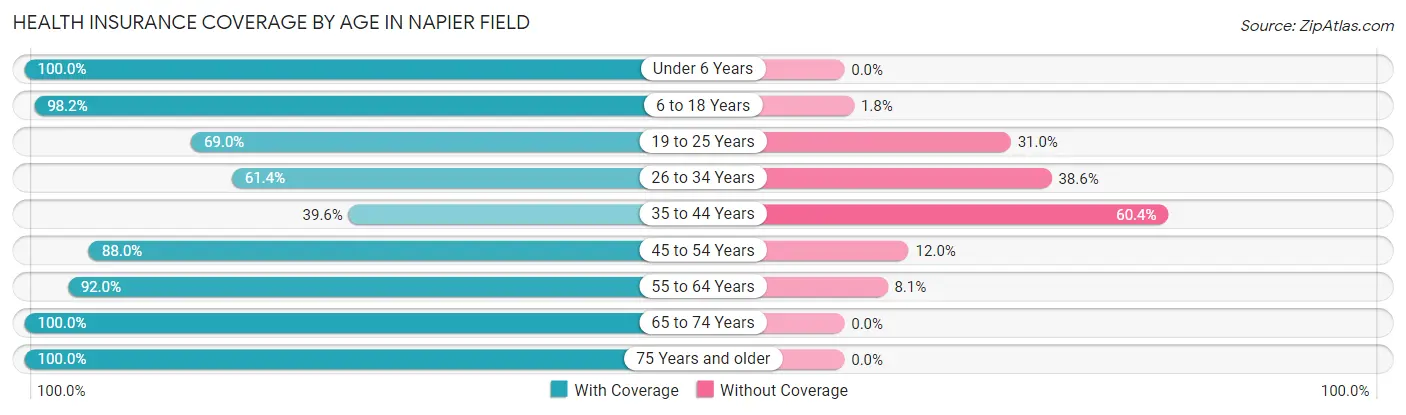
| Age Bracket | With Coverage | Without Coverage |
| Under 6 Years | 32 (100.0%) | 0 (0.0%) |
| 6 to 18 Years | 109 (98.2%) | 2 (1.8%) |
| 19 to 25 Years | 20 (69.0%) | 9 (31.0%) |
| 26 to 34 Years | 27 (61.4%) | 17 (38.6%) |
| 35 to 44 Years | 19 (39.6%) | 29 (60.4%) |
| 45 to 54 Years | 22 (88.0%) | 3 (12.0%) |
| 55 to 64 Years | 80 (91.9%) | 7 (8.1%) |
| 65 to 74 Years | 43 (100.0%) | 0 (0.0%) |
| 75 Years and older | 11 (100.0%) | 0 (0.0%) |
| Total | 363 (84.4%) | 67 (15.6%) |
Health Insurance Coverage by Citizenship Status in Napier Field
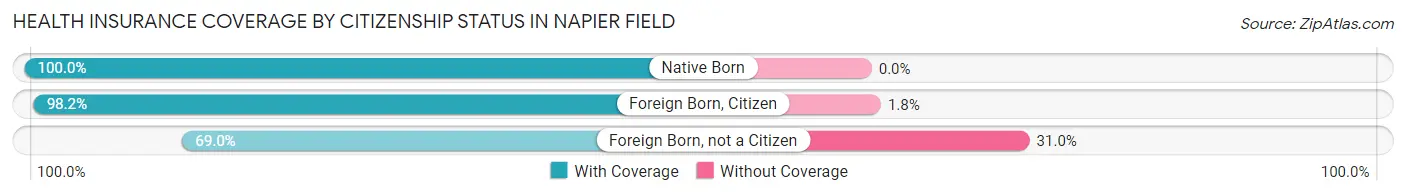
| Citizenship Status | With Coverage | Without Coverage |
| Native Born | 32 (100.0%) | 0 (0.0%) |
| Foreign Born, Citizen | 109 (98.2%) | 2 (1.8%) |
| Foreign Born, not a Citizen | 20 (69.0%) | 9 (31.0%) |
Health Insurance Coverage by Household Income in Napier Field
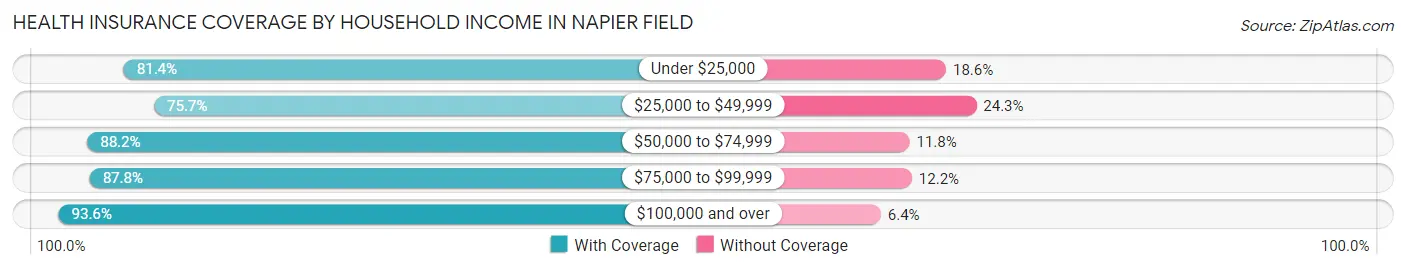
| Household Income | With Coverage | Without Coverage |
| Under $25,000 | 70 (81.4%) | 16 (18.6%) |
| $25,000 to $49,999 | 78 (75.7%) | 25 (24.3%) |
| $50,000 to $74,999 | 135 (88.2%) | 18 (11.8%) |
| $75,000 to $99,999 | 36 (87.8%) | 5 (12.2%) |
| $100,000 and over | 44 (93.6%) | 3 (6.4%) |
Public vs Private Health Insurance Coverage by Age in Napier Field
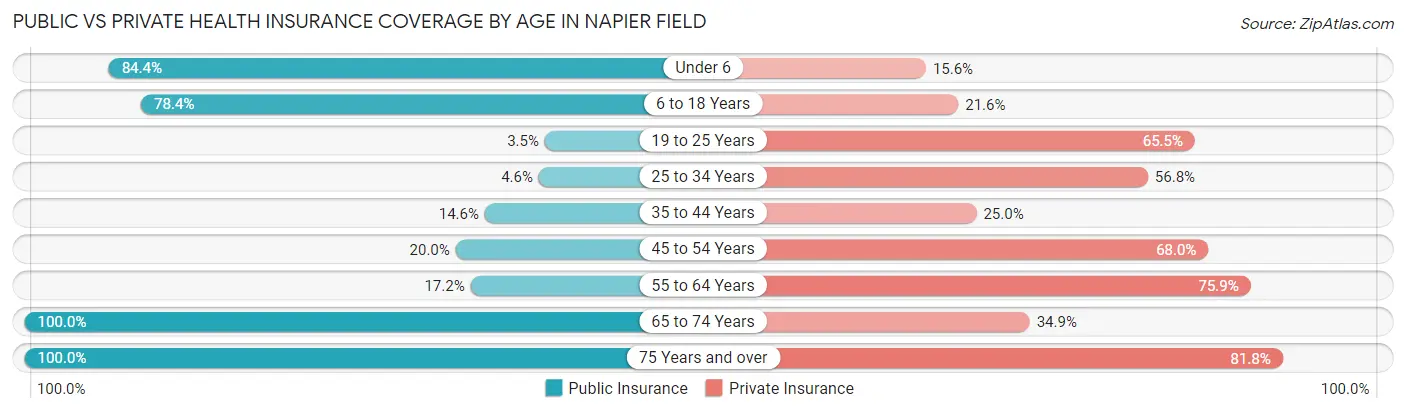
| Age Bracket | Public Insurance | Private Insurance |
| Under 6 | 27 (84.4%) | 5 (15.6%) |
| 6 to 18 Years | 87 (78.4%) | 24 (21.6%) |
| 19 to 25 Years | 1 (3.5%) | 19 (65.5%) |
| 25 to 34 Years | 2 (4.5%) | 25 (56.8%) |
| 35 to 44 Years | 7 (14.6%) | 12 (25.0%) |
| 45 to 54 Years | 5 (20.0%) | 17 (68.0%) |
| 55 to 64 Years | 15 (17.2%) | 66 (75.9%) |
| 65 to 74 Years | 43 (100.0%) | 15 (34.9%) |
| 75 Years and over | 11 (100.0%) | 9 (81.8%) |
| Total | 198 (46.1%) | 192 (44.7%) |
Disability Status by Sex by Age in Napier Field
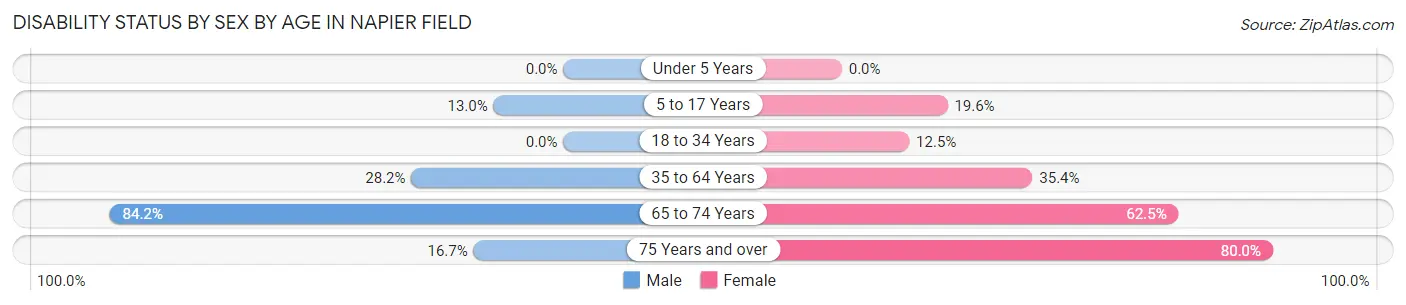
| Age Bracket | Male | Female |
| Under 5 Years | 0 (0.0%) | 0 (0.0%) |
| 5 to 17 Years | 7 (13.0%) | 10 (19.6%) |
| 18 to 34 Years | 0 (0.0%) | 5 (12.5%) |
| 35 to 64 Years | 22 (28.2%) | 29 (35.4%) |
| 65 to 74 Years | 16 (84.2%) | 15 (62.5%) |
| 75 Years and over | 1 (16.7%) | 4 (80.0%) |
Disability Class by Sex by Age in Napier Field
Disability Class: Hearing Difficulty
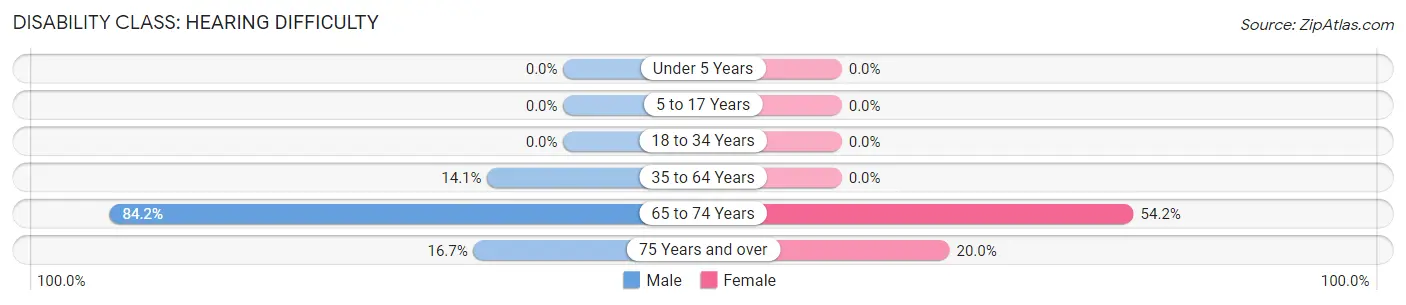
| Age Bracket | Male | Female |
| Under 5 Years | 0 (0.0%) | 0 (0.0%) |
| 5 to 17 Years | 0 (0.0%) | 0 (0.0%) |
| 18 to 34 Years | 0 (0.0%) | 0 (0.0%) |
| 35 to 64 Years | 11 (14.1%) | 0 (0.0%) |
| 65 to 74 Years | 16 (84.2%) | 13 (54.2%) |
| 75 Years and over | 1 (16.7%) | 1 (20.0%) |
Disability Class: Vision Difficulty
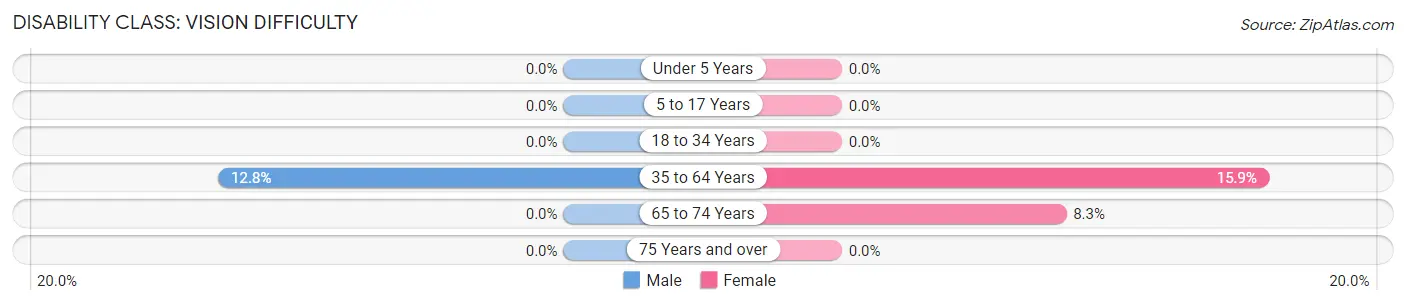
| Age Bracket | Male | Female |
| Under 5 Years | 0 (0.0%) | 0 (0.0%) |
| 5 to 17 Years | 0 (0.0%) | 0 (0.0%) |
| 18 to 34 Years | 0 (0.0%) | 0 (0.0%) |
| 35 to 64 Years | 10 (12.8%) | 13 (15.9%) |
| 65 to 74 Years | 0 (0.0%) | 2 (8.3%) |
| 75 Years and over | 0 (0.0%) | 0 (0.0%) |
Disability Class: Cognitive Difficulty
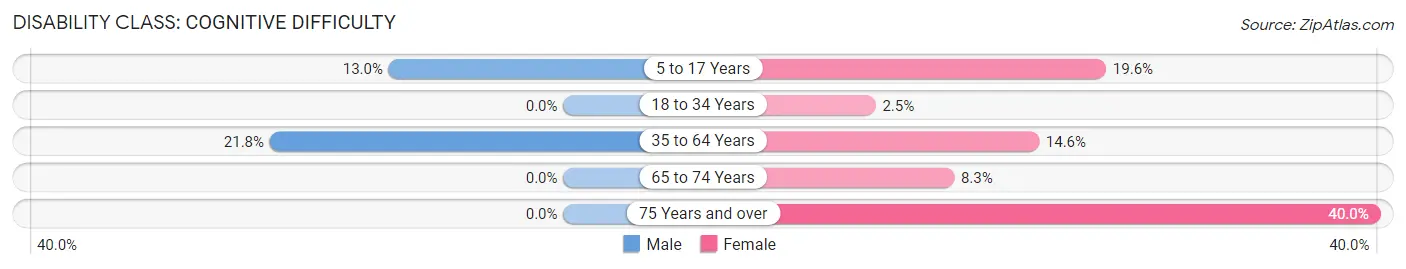
| Age Bracket | Male | Female |
| 5 to 17 Years | 7 (13.0%) | 10 (19.6%) |
| 18 to 34 Years | 0 (0.0%) | 1 (2.5%) |
| 35 to 64 Years | 17 (21.8%) | 12 (14.6%) |
| 65 to 74 Years | 0 (0.0%) | 2 (8.3%) |
| 75 Years and over | 0 (0.0%) | 2 (40.0%) |
Disability Class: Ambulatory Difficulty
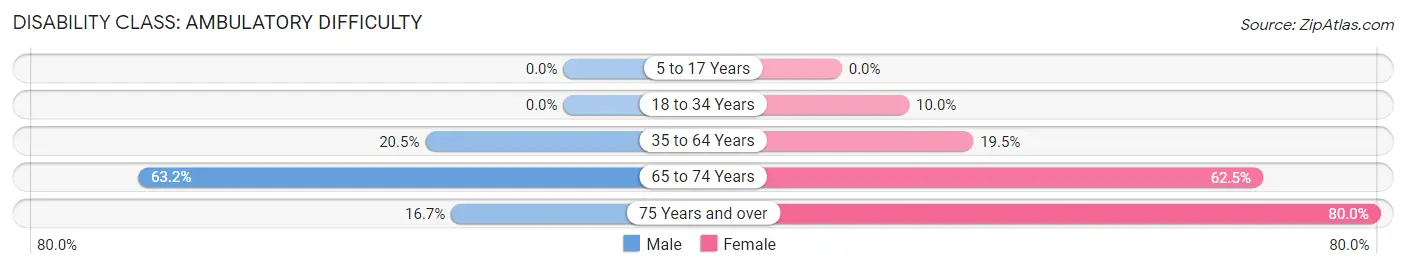
| Age Bracket | Male | Female |
| 5 to 17 Years | 0 (0.0%) | 0 (0.0%) |
| 18 to 34 Years | 0 (0.0%) | 4 (10.0%) |
| 35 to 64 Years | 16 (20.5%) | 16 (19.5%) |
| 65 to 74 Years | 12 (63.2%) | 15 (62.5%) |
| 75 Years and over | 1 (16.7%) | 4 (80.0%) |
Disability Class: Self-Care Difficulty
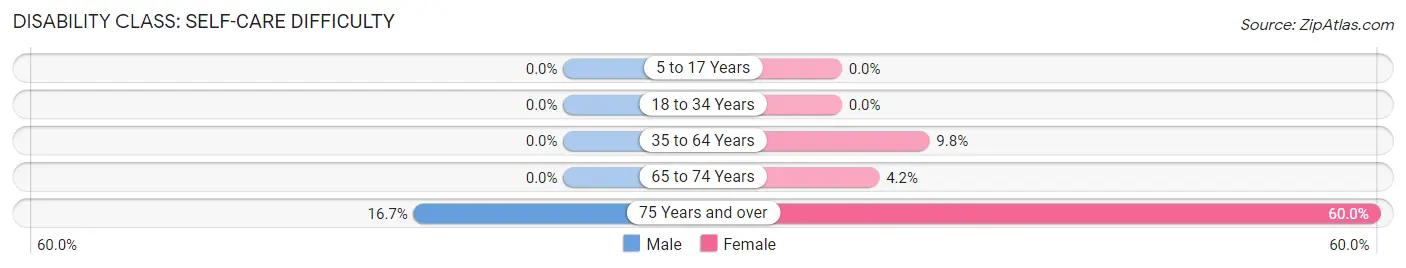
| Age Bracket | Male | Female |
| 5 to 17 Years | 0 (0.0%) | 0 (0.0%) |
| 18 to 34 Years | 0 (0.0%) | 0 (0.0%) |
| 35 to 64 Years | 0 (0.0%) | 8 (9.8%) |
| 65 to 74 Years | 0 (0.0%) | 1 (4.2%) |
| 75 Years and over | 1 (16.7%) | 3 (60.0%) |
Technology Access in Napier Field
Computing Device Access in Napier Field
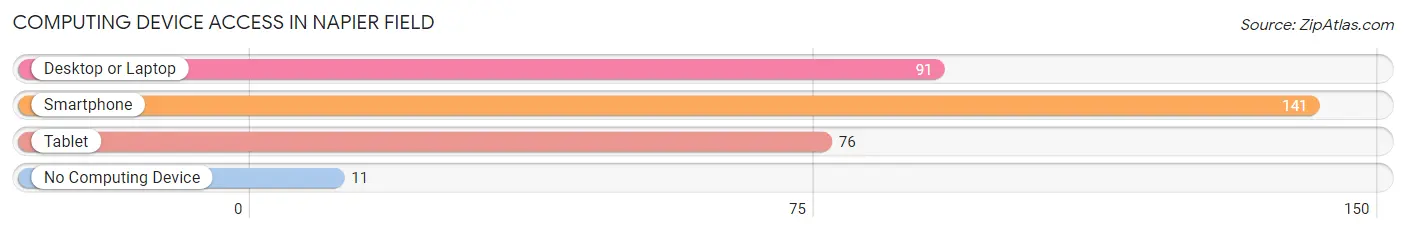
| Device Type | # Households | % Households |
| Desktop or Laptop | 91 | 57.2% |
| Smartphone | 141 | 88.7% |
| Tablet | 76 | 47.8% |
| No Computing Device | 11 | 6.9% |
| Total | 159 | 100.0% |
Internet Access in Napier Field
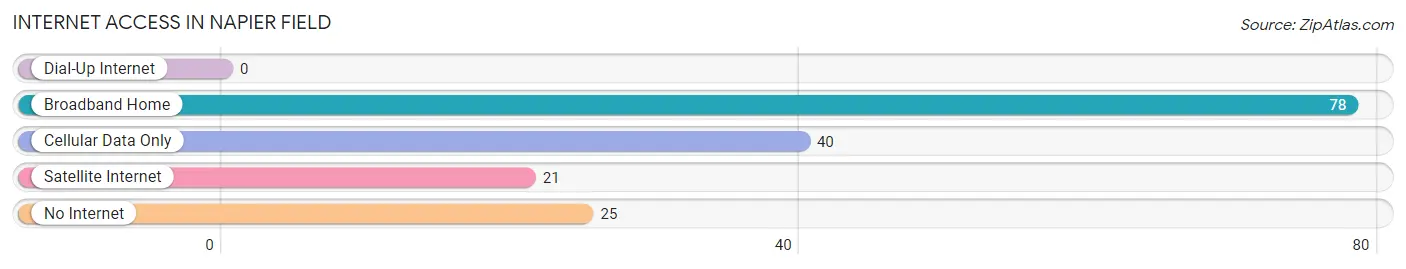
| Internet Type | # Households | % Households |
| Dial-Up Internet | 0 | 0.0% |
| Broadband Home | 78 | 49.1% |
| Cellular Data Only | 40 | 25.2% |
| Satellite Internet | 21 | 13.2% |
| No Internet | 25 | 15.7% |
| Total | 159 | 100.0% |
Napier Field Summary
Napier Field is a small town located in Dale County, Alabama. It is situated on the banks of the Choctawhatchee River, approximately 10 miles south of Ozark. The town was named after the Napier family, who were early settlers in the area. As of the 2010 census, the population of Napier Field was 1,845.
History
Napier Field was founded in 1883 by the Napier family, who were early settlers in the area. The town was originally known as Napier’s Field, but the name was later shortened to Napier Field. The town was incorporated in 1901.
In the early 1900s, the town was a thriving agricultural center, with cotton, corn, and peanuts being the main crops. The town also had a sawmill, a gristmill, and a cotton gin.
In the 1920s, the town began to experience a decline in population due to the Great Depression. The population dropped from 1,500 in 1920 to 1,000 in 1930.
In the 1940s, the town experienced a resurgence in population due to the establishment of the nearby Napier Field Air Force Base. The base was established in 1941 and was used as a training facility for pilots during World War II. The base was closed in 1945, but the population of Napier Field continued to grow due to the influx of military personnel and their families.
Geography
Napier Field is located in Dale County, Alabama. It is situated on the banks of the Choctawhatchee River, approximately 10 miles south of Ozark. The town is located in the southeastern part of the state, near the Florida border.
The town has a total area of 2.2 square miles, all of which is land. The terrain is mostly flat, with some rolling hills. The climate is humid subtropical, with hot, humid summers and mild winters.
Economy
The economy of Napier Field is largely based on agriculture. Cotton, corn, and peanuts are the main crops grown in the area. The town also has a sawmill, a gristmill, and a cotton gin.
In addition to agriculture, the town is home to several small businesses, including restaurants, retail stores, and service providers. The town also has a few manufacturing plants, including a furniture factory and a paper mill.
Demographics
As of the 2010 census, the population of Napier Field was 1,845. The racial makeup of the town was 79.3% White, 17.2% African American, 0.7% Native American, 0.3% Asian, 0.1% Pacific Islander, and 2.4% from other races. Hispanic or Latino of any race were 2.2% of the population.
The median household income in Napier Field was $31,250, and the median family income was $37,500. The per capita income was $15,945. About 17.2% of families and 20.2% of the population were below the poverty line, including 28.3% of those under age 18 and 11.2% of those age 65 or over.
Common Questions
What is Per Capita Income in Napier Field?
Per Capita income in Napier Field is $19,909.
What is the Median Family Income in Napier Field?
Median Family Income in Napier Field is $54,375.
What is the Median Household income in Napier Field?
Median Household Income in Napier Field is $43,125.
What is Income or Wage Gap in Napier Field?
Income or Wage Gap in Napier Field is 19.1%.
Women in Napier Field earn 80.9 cents for every dollar earned by a man.
What is Inequality or Gini Index in Napier Field?
Inequality or Gini Index in Napier Field is 0.36.
What is the Total Population of Napier Field?
Total Population of Napier Field is 430.
What is the Total Male Population of Napier Field?
Total Male Population of Napier Field is 215.
What is the Total Female Population of Napier Field?
Total Female Population of Napier Field is 215.
What is the Ratio of Males per 100 Females in Napier Field?
There are 100.00 Males per 100 Females in Napier Field.
What is the Ratio of Females per 100 Males in Napier Field?
There are 100.00 Females per 100 Males in Napier Field.
What is the Median Population Age in Napier Field?
Median Population Age in Napier Field is 34.9 Years.
What is the Average Family Size in Napier Field
Average Family Size in Napier Field is 3.2 People.
What is the Average Household Size in Napier Field
Average Household Size in Napier Field is 2.7 People.
How Large is the Labor Force in Napier Field?
There are 202 People in the Labor Forcein in Napier Field.
What is the Percentage of People in the Labor Force in Napier Field?
64.5% of People are in the Labor Force in Napier Field.
What is the Unemployment Rate in Napier Field?
Unemployment Rate in Napier Field is 8.9%.