Myrtlewood, AL Map & Demographics
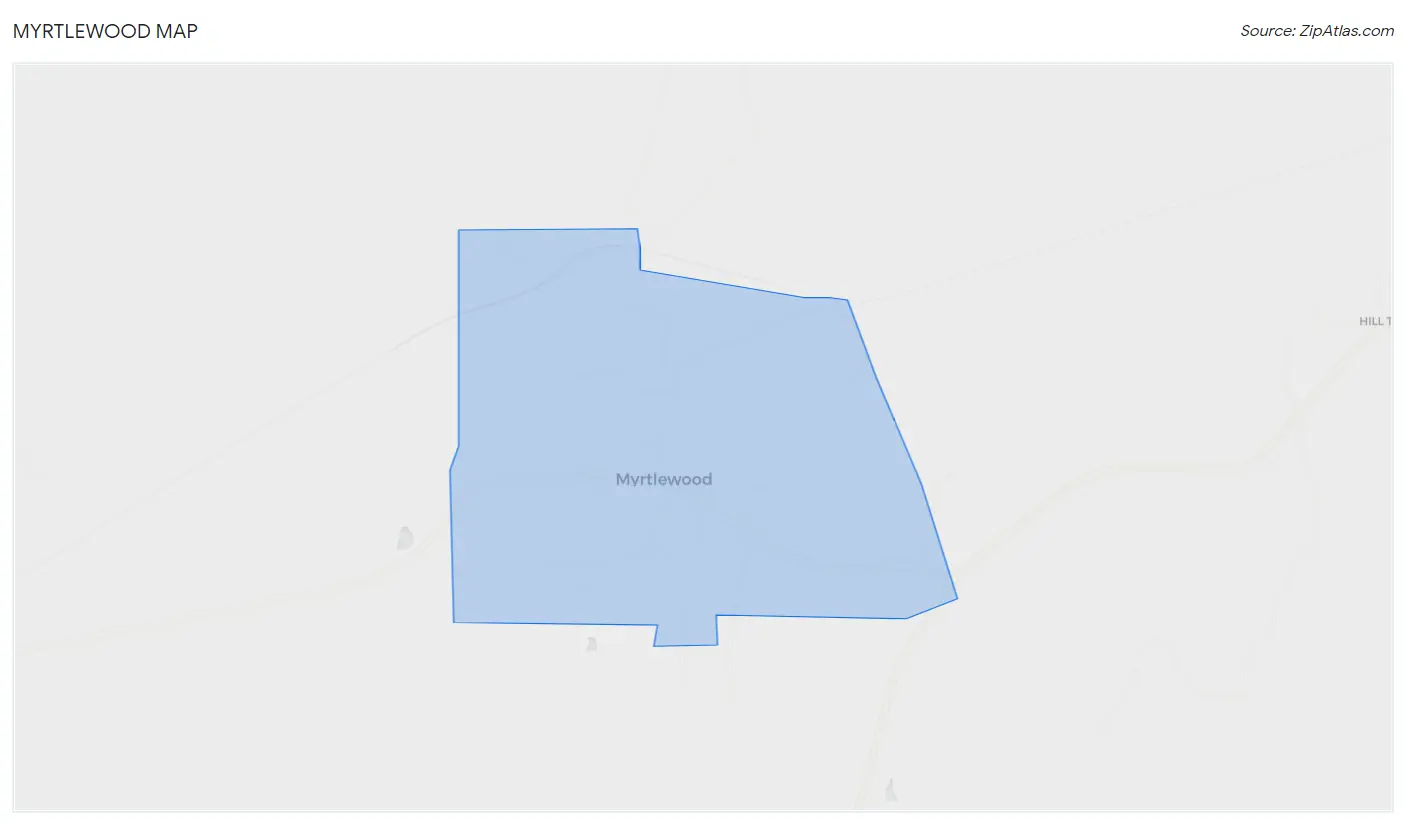
Myrtlewood Map
Myrtlewood Overview
$38,408
PER CAPITA INCOME
$88,182
AVG FAMILY INCOME
$57,500
AVG HOUSEHOLD INCOME
0.30
INEQUALITY / GINI INDEX
107
TOTAL POPULATION
64
MALE POPULATION
43
FEMALE POPULATION
148.84
MALES / 100 FEMALES
67.19
FEMALES / 100 MALES
55.6
MEDIAN AGE
3.2
AVG FAMILY SIZE
2.4
AVG HOUSEHOLD SIZE
65
LABOR FORCE [ PEOPLE ]
63.1%
PERCENT IN LABOR FORCE
4.6%
UNEMPLOYMENT RATE
Myrtlewood Zip Codes
Myrtlewood Area Codes
Income in Myrtlewood
Income Overview in Myrtlewood
Per Capita Income in Myrtlewood is $38,408, while median incomes of families and households are $88,182 and $57,500 respectively.
| Characteristic | Number | Measure |
| Per Capita Income | 107 | $38,408 |
| Median Family Income | 20 | $88,182 |
| Mean Family Income | 20 | $83,740 |
| Median Household Income | 44 | $57,500 |
| Mean Household Income | 44 | $62,945 |
| Income Deficit | 20 | $0 |
| Wage / Income Gap (%) | 107 | 0.00% |
| Wage / Income Gap ($) | 107 | 100.00¢ per $1 |
| Gini / Inequality Index | 107 | 0.30 |
Earnings by Sex in Myrtlewood
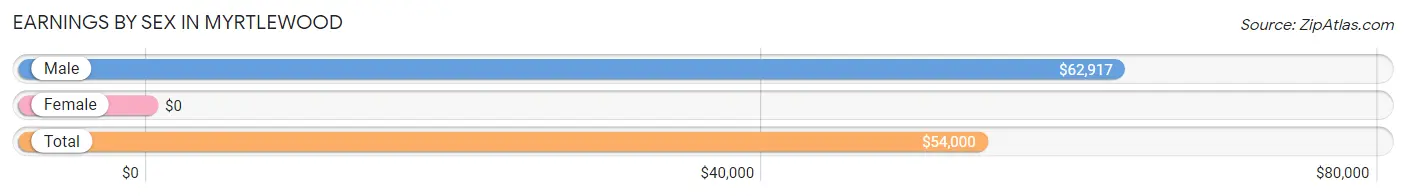
| Sex | Number | Average Earnings |
| Male | 30 (48.4%) | $62,917 |
| Female | 32 (51.6%) | $0 |
| Total | 62 (100.0%) | $54,000 |
Earnings by Sex by Income Bracket in Myrtlewood
The most common earnings brackets in Myrtlewood are $55,000 to $64,999 for men (18 | 60.0%) and $55,000 to $64,999 for women (11 | 34.4%).
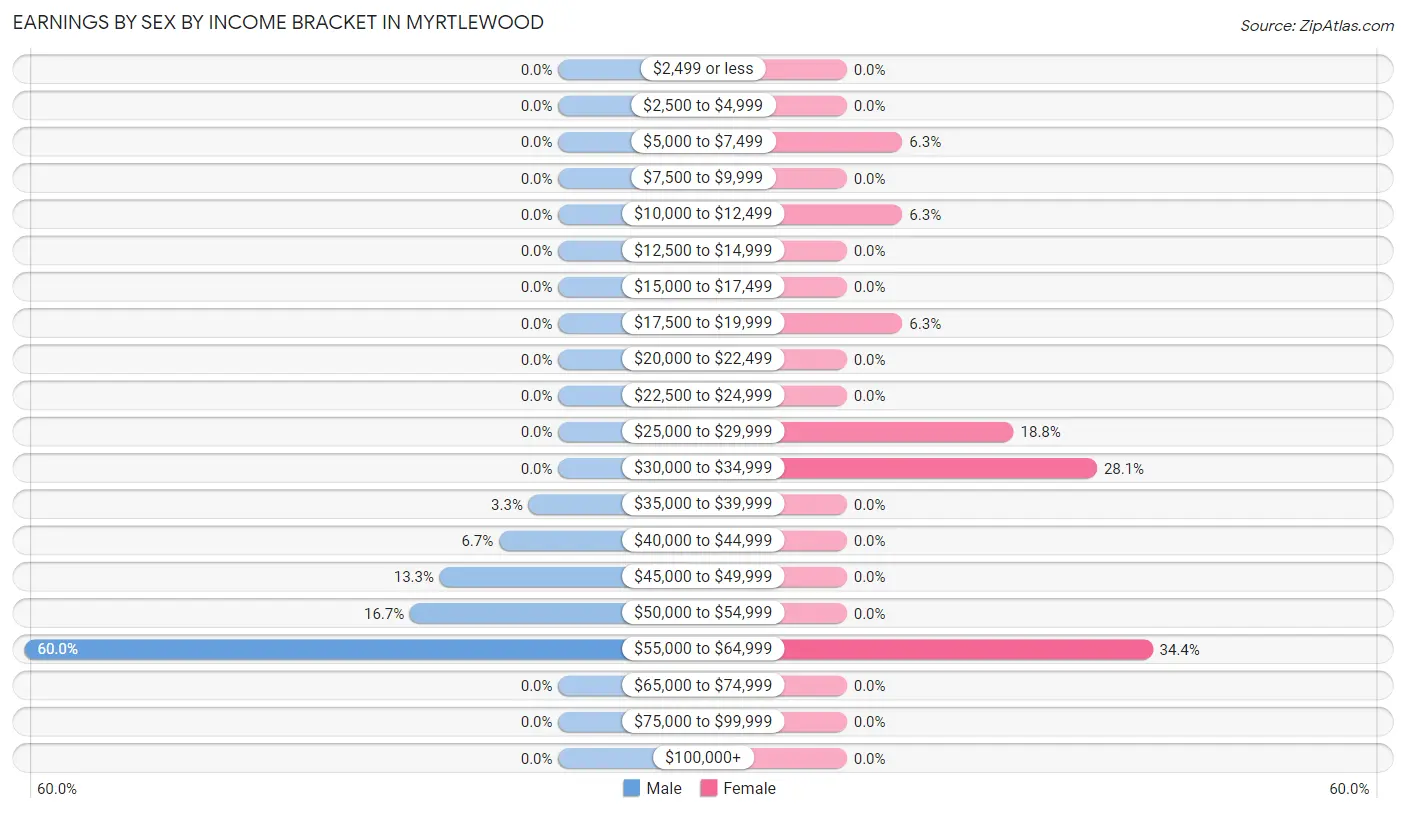
| Income | Male | Female |
| $2,499 or less | 0 (0.0%) | 0 (0.0%) |
| $2,500 to $4,999 | 0 (0.0%) | 0 (0.0%) |
| $5,000 to $7,499 | 0 (0.0%) | 2 (6.2%) |
| $7,500 to $9,999 | 0 (0.0%) | 0 (0.0%) |
| $10,000 to $12,499 | 0 (0.0%) | 2 (6.2%) |
| $12,500 to $14,999 | 0 (0.0%) | 0 (0.0%) |
| $15,000 to $17,499 | 0 (0.0%) | 0 (0.0%) |
| $17,500 to $19,999 | 0 (0.0%) | 2 (6.2%) |
| $20,000 to $22,499 | 0 (0.0%) | 0 (0.0%) |
| $22,500 to $24,999 | 0 (0.0%) | 0 (0.0%) |
| $25,000 to $29,999 | 0 (0.0%) | 6 (18.8%) |
| $30,000 to $34,999 | 0 (0.0%) | 9 (28.1%) |
| $35,000 to $39,999 | 1 (3.3%) | 0 (0.0%) |
| $40,000 to $44,999 | 2 (6.7%) | 0 (0.0%) |
| $45,000 to $49,999 | 4 (13.3%) | 0 (0.0%) |
| $50,000 to $54,999 | 5 (16.7%) | 0 (0.0%) |
| $55,000 to $64,999 | 18 (60.0%) | 11 (34.4%) |
| $65,000 to $74,999 | 0 (0.0%) | 0 (0.0%) |
| $75,000 to $99,999 | 0 (0.0%) | 0 (0.0%) |
| $100,000+ | 0 (0.0%) | 0 (0.0%) |
| Total | 30 (100.0%) | 32 (100.0%) |
Earnings by Sex by Educational Attainment in Myrtlewood
| Educational Attainment | Male Income | Female Income |
| Less than High School | - | - |
| High School Diploma | - | - |
| College or Associate's Degree | - | - |
| Bachelor's Degree | - | - |
| Graduate Degree | - | - |
| Total | $62,917 | $0 |
Family Income in Myrtlewood
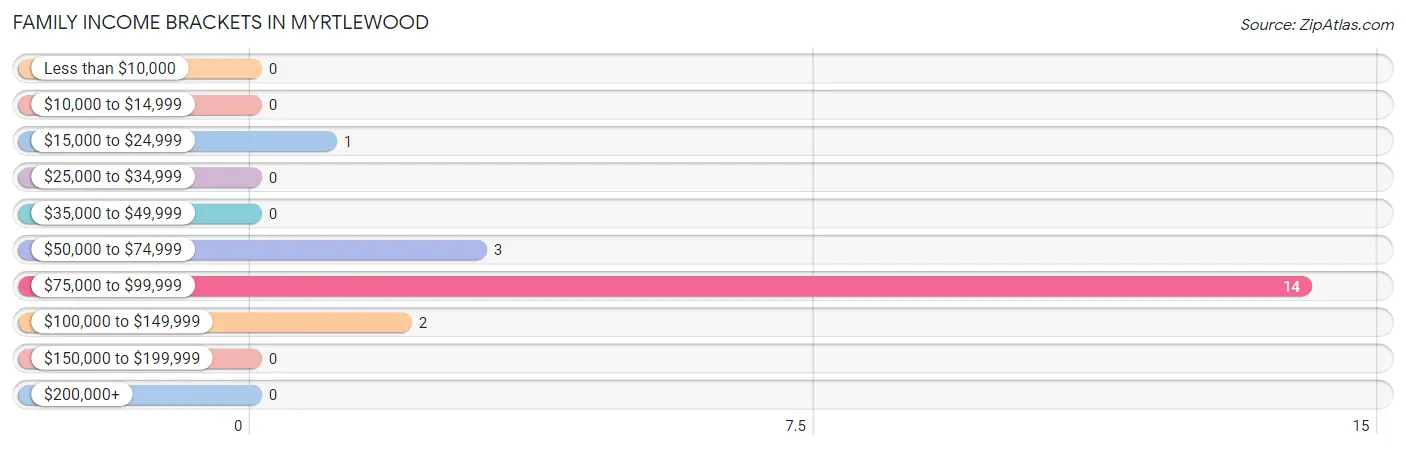
Family Income Brackets in Myrtlewood
According to the Myrtlewood family income data, there are 14 families falling into the $75,000 to $99,999 income range, which is the most common income bracket and makes up 70.0% of all families.
| Income Bracket | # Families | % Families |
| Less than $10,000 | 0 | 0.0% |
| $10,000 to $14,999 | 0 | 0.0% |
| $15,000 to $24,999 | 1 | 5.0% |
| $25,000 to $34,999 | 0 | 0.0% |
| $35,000 to $49,999 | 0 | 0.0% |
| $50,000 to $74,999 | 3 | 15.0% |
| $75,000 to $99,999 | 14 | 70.0% |
| $100,000 to $149,999 | 2 | 10.0% |
| $150,000 to $199,999 | 0 | 0.0% |
| $200,000+ | 0 | 0.0% |
Family Income by Famaliy Size in Myrtlewood
3-person families (13 | 65.0%) account for the highest median family income in Myrtlewood with $88,523 per family, while 2-person families (5 | 25.0%) have the highest median income of $37,812 per family member.
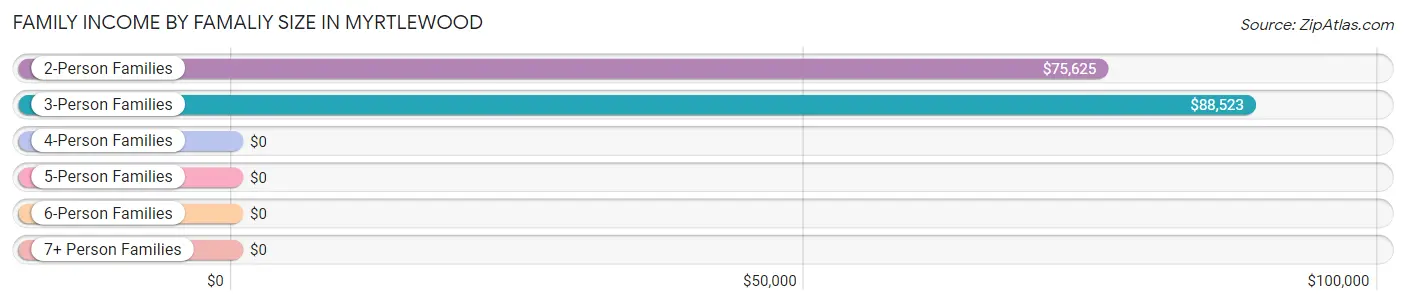
| Income Bracket | # Families | Median Income |
| 2-Person Families | 5 (25.0%) | $75,625 |
| 3-Person Families | 13 (65.0%) | $88,523 |
| 4-Person Families | 2 (10.0%) | $0 |
| 5-Person Families | 0 (0.0%) | $0 |
| 6-Person Families | 0 (0.0%) | $0 |
| 7+ Person Families | 0 (0.0%) | $0 |
| Total | 20 (100.0%) | $88,182 |
Family Income by Number of Earners in Myrtlewood
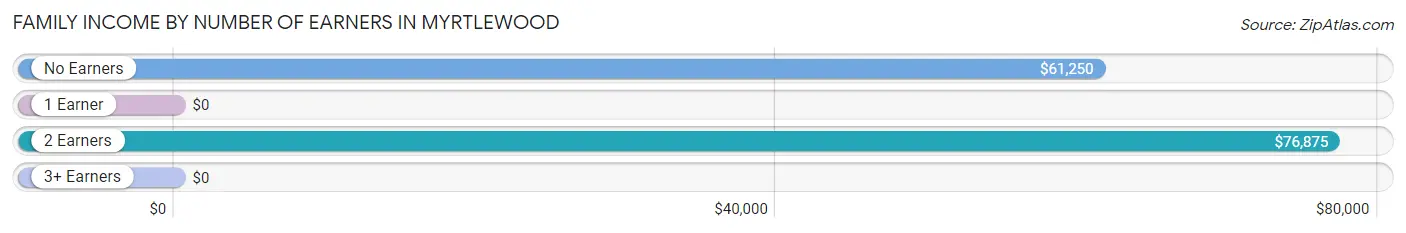
| Number of Earners | # Families | Median Income |
| No Earners | 4 (20.0%) | $61,250 |
| 1 Earner | 11 (55.0%) | $0 |
| 2 Earners | 5 (25.0%) | $76,875 |
| 3+ Earners | 0 (0.0%) | $0 |
| Total | 20 (100.0%) | $88,182 |
Household Income in Myrtlewood
Household Income Brackets in Myrtlewood
With 14 households falling in the category, the $75,000 to $99,999 income range is the most frequent in Myrtlewood, accounting for 31.8% of all households.
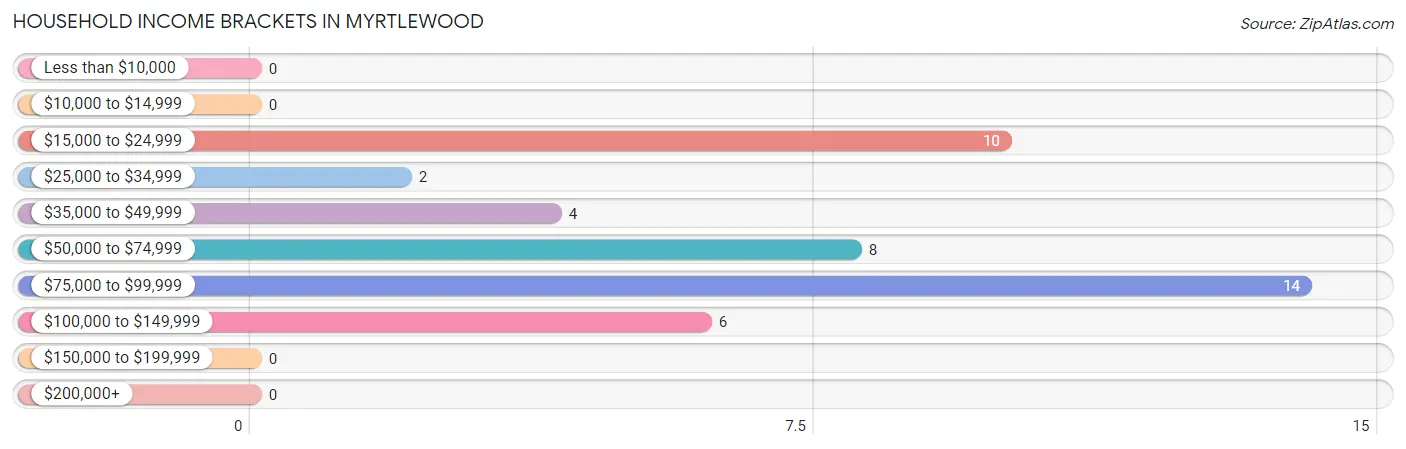
| Income Bracket | # Households | % Households |
| Less than $10,000 | 0 | 0.0% |
| $10,000 to $14,999 | 0 | 0.0% |
| $15,000 to $24,999 | 10 | 22.7% |
| $25,000 to $34,999 | 2 | 4.5% |
| $35,000 to $49,999 | 4 | 9.1% |
| $50,000 to $74,999 | 8 | 18.2% |
| $75,000 to $99,999 | 14 | 31.8% |
| $100,000 to $149,999 | 6 | 13.6% |
| $150,000 to $199,999 | 0 | 0.0% |
| $200,000+ | 0 | 0.0% |
Household Income by Householder Age in Myrtlewood
The median household income in Myrtlewood is $57,500, with the highest median household income of $61,250 found in the 65+ years age bracket for the primary householder. A total of 12 households (27.3%) fall into this category.
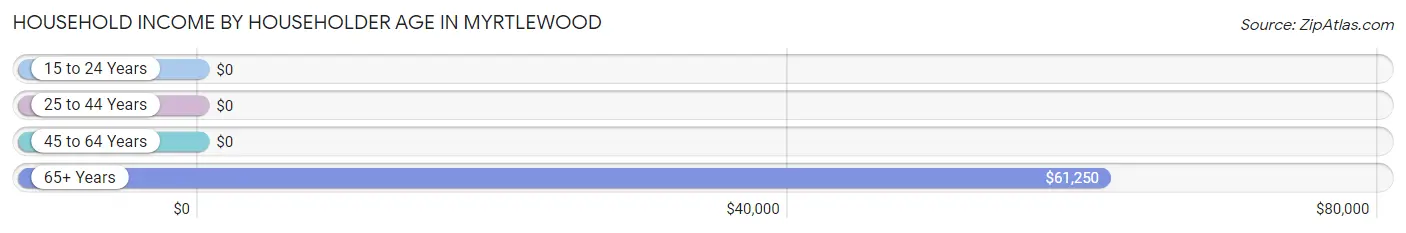
| Income Bracket | # Households | Median Income |
| 15 to 24 Years | 0 (0.0%) | $0 |
| 25 to 44 Years | 4 (9.1%) | $0 |
| 45 to 64 Years | 28 (63.6%) | $0 |
| 65+ Years | 12 (27.3%) | $61,250 |
| Total | 44 (100.0%) | $57,500 |
Poverty in Myrtlewood
Income Below Poverty by Sex and Age in Myrtlewood
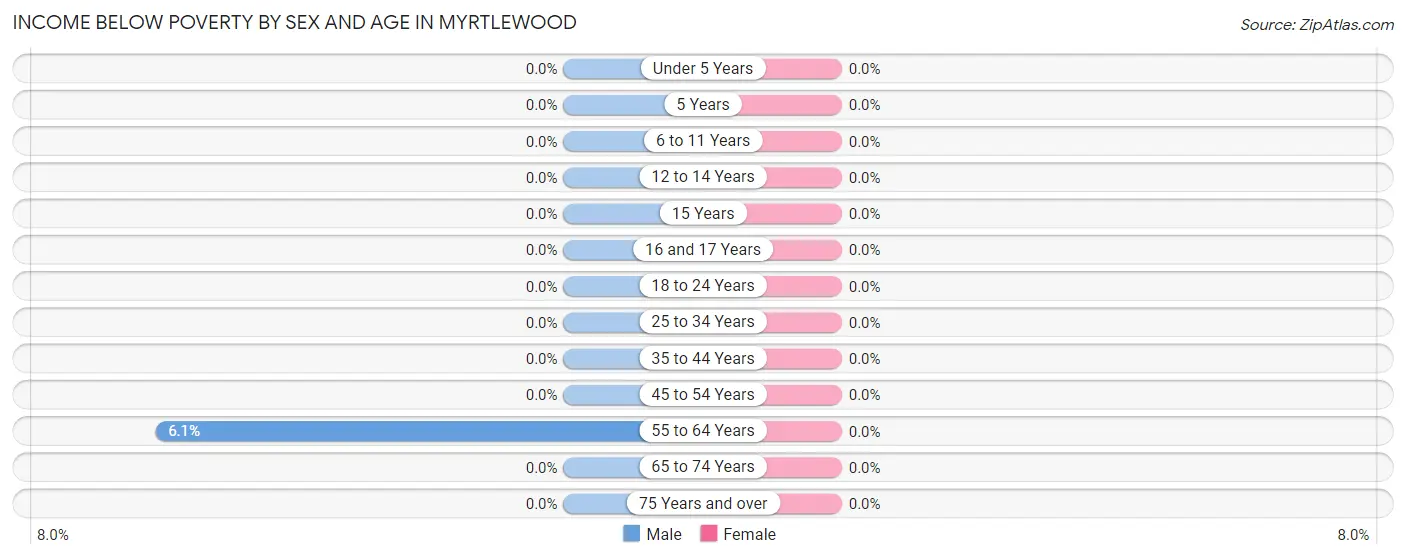
| Age Bracket | Male | Female |
| Under 5 Years | 0 (0.0%) | 0 (0.0%) |
| 5 Years | 0 (0.0%) | 0 (0.0%) |
| 6 to 11 Years | 0 (0.0%) | 0 (0.0%) |
| 12 to 14 Years | 0 (0.0%) | 0 (0.0%) |
| 15 Years | 0 (0.0%) | 0 (0.0%) |
| 16 and 17 Years | 0 (0.0%) | 0 (0.0%) |
| 18 to 24 Years | 0 (0.0%) | 0 (0.0%) |
| 25 to 34 Years | 0 (0.0%) | 0 (0.0%) |
| 35 to 44 Years | 0 (0.0%) | 0 (0.0%) |
| 45 to 54 Years | 0 (0.0%) | 0 (0.0%) |
| 55 to 64 Years | 2 (6.1%) | 0 (0.0%) |
| 65 to 74 Years | 0 (0.0%) | 0 (0.0%) |
| 75 Years and over | 0 (0.0%) | 0 (0.0%) |
| Total | 2 (3.1%) | 0 (0.0%) |
Income Above Poverty by Sex and Age in Myrtlewood
According to the poverty statistics in Myrtlewood, males aged 12 to 14 years and females aged 18 to 24 years are the age groups that are most secure financially, with 100.0% of males and 100.0% of females in these age groups living above the poverty line.
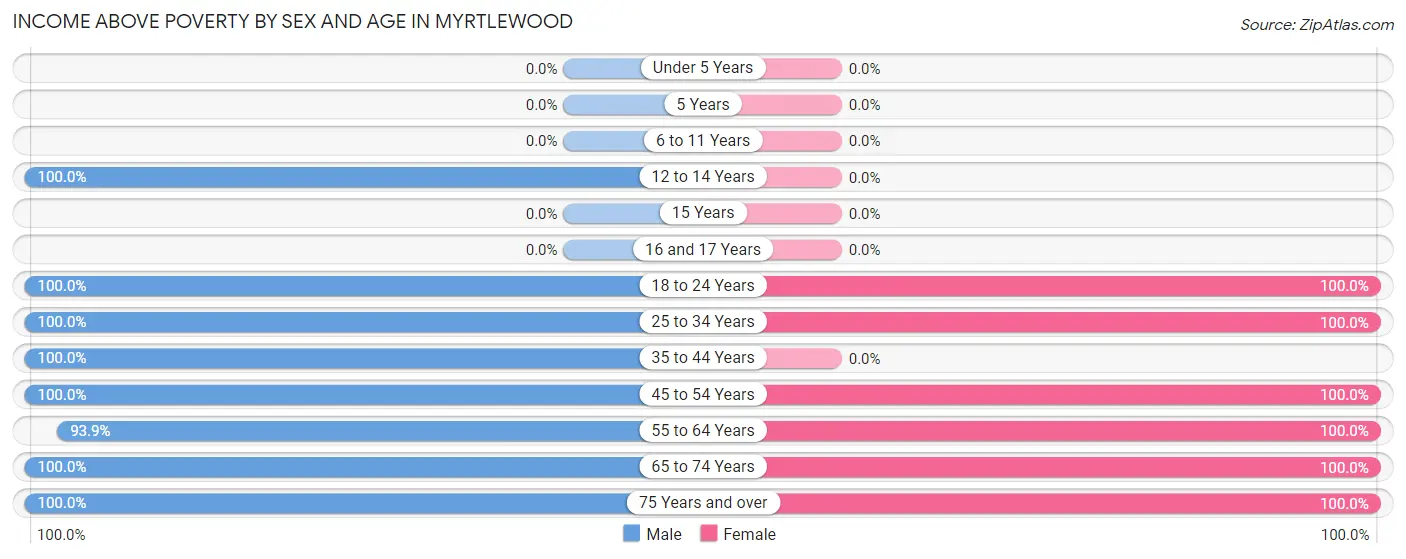
| Age Bracket | Male | Female |
| Under 5 Years | 0 (0.0%) | 0 (0.0%) |
| 5 Years | 0 (0.0%) | 0 (0.0%) |
| 6 to 11 Years | 0 (0.0%) | 0 (0.0%) |
| 12 to 14 Years | 4 (100.0%) | 0 (0.0%) |
| 15 Years | 0 (0.0%) | 0 (0.0%) |
| 16 and 17 Years | 0 (0.0%) | 0 (0.0%) |
| 18 to 24 Years | 6 (100.0%) | 3 (100.0%) |
| 25 to 34 Years | 3 (100.0%) | 9 (100.0%) |
| 35 to 44 Years | 4 (100.0%) | 0 (0.0%) |
| 45 to 54 Years | 6 (100.0%) | 15 (100.0%) |
| 55 to 64 Years | 31 (93.9%) | 8 (100.0%) |
| 65 to 74 Years | 2 (100.0%) | 3 (100.0%) |
| 75 Years and over | 6 (100.0%) | 5 (100.0%) |
| Total | 62 (96.9%) | 43 (100.0%) |
Income Below Poverty Among Married-Couple Families in Myrtlewood
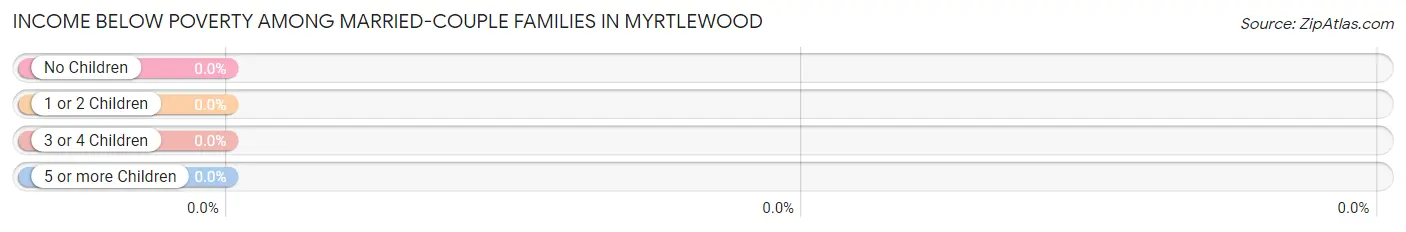
| Children | Above Poverty | Below Poverty |
| No Children | 7 (100.0%) | 0 (0.0%) |
| 1 or 2 Children | 0 (0.0%) | 0 (0.0%) |
| 3 or 4 Children | 0 (0.0%) | 0 (0.0%) |
| 5 or more Children | 0 (0.0%) | 0 (0.0%) |
| Total | 7 (100.0%) | 0 (0.0%) |
Income Below Poverty Among Single-Parent Households in Myrtlewood
| Children | Single Father | Single Mother |
| No Children | 0 (0.0%) | 0 (0.0%) |
| 1 or 2 Children | 0 (0.0%) | 0 (0.0%) |
| 3 or 4 Children | 0 (0.0%) | 0 (0.0%) |
| 5 or more Children | 0 (0.0%) | 0 (0.0%) |
| Total | 0 (0.0%) | 0 (0.0%) |
Income Below Poverty Among Married-Couple vs Single-Parent Households in Myrtlewood
| Children | Married-Couple Families | Single-Parent Households |
| No Children | 0 (0.0%) | 0 (0.0%) |
| 1 or 2 Children | 0 (0.0%) | 0 (0.0%) |
| 3 or 4 Children | 0 (0.0%) | 0 (0.0%) |
| 5 or more Children | 0 (0.0%) | 0 (0.0%) |
| Total | 0 (0.0%) | 0 (0.0%) |
Race in Myrtlewood
The most populous races in Myrtlewood are White / Caucasian (103 | 96.3%), Black / African American (2 | 1.9%), and Hispanic or Latino (2 | 1.9%).
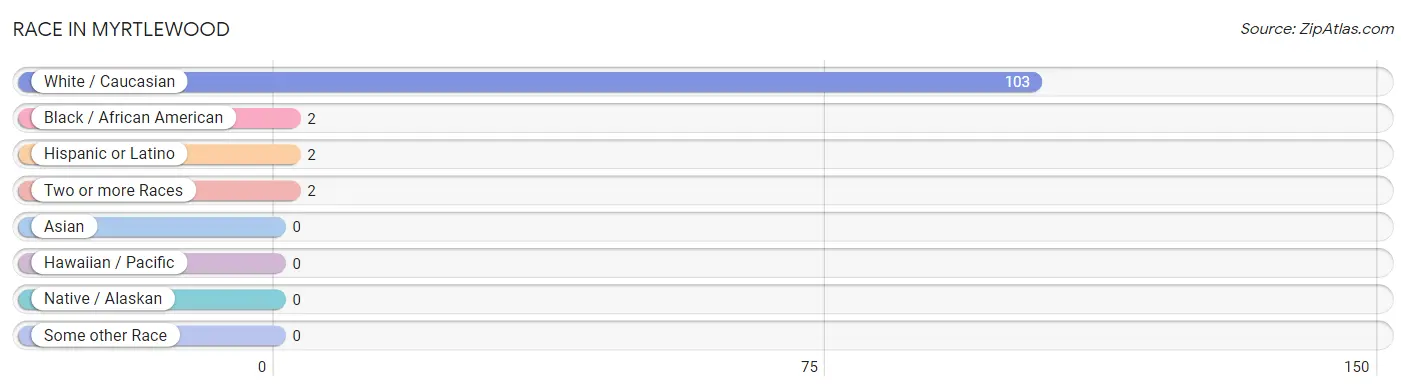
| Race | # Population | % Population |
| Asian | 0 | 0.0% |
| Black / African American | 2 | 1.9% |
| Hawaiian / Pacific | 0 | 0.0% |
| Hispanic or Latino | 2 | 1.9% |
| Native / Alaskan | 0 | 0.0% |
| White / Caucasian | 103 | 96.3% |
| Two or more Races | 2 | 1.9% |
| Some other Race | 0 | 0.0% |
| Total | 107 | 100.0% |
Ancestry in Myrtlewood
The most populous ancestries reported in Myrtlewood are American (66 | 61.7%), English (10 | 9.3%), German (8 | 7.5%), and British (2 | 1.9%), together accounting for 80.4% of all Myrtlewood residents.
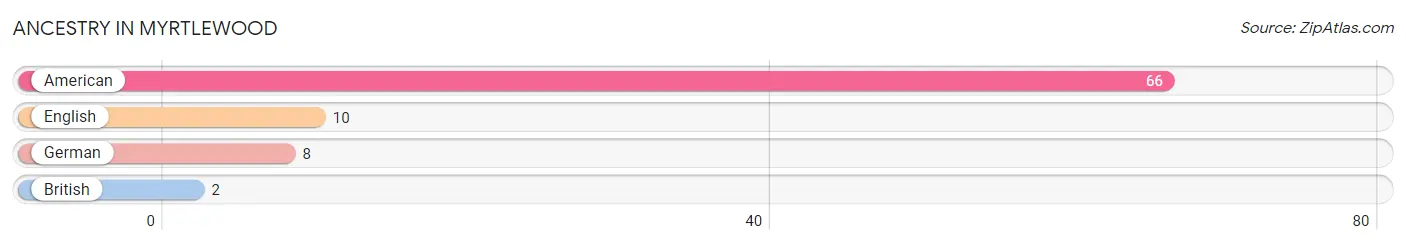
| Ancestry | # Population | % Population |
| American | 66 | 61.7% |
| British | 2 | 1.9% |
| English | 10 | 9.3% |
| German | 8 | 7.5% | View All 4 Rows |
Immigrants in Myrtlewood

| Immigration Origin | # Population | % Population | View All 0 Rows |
Sex and Age in Myrtlewood
Sex and Age in Myrtlewood
The most populous age groups in Myrtlewood are 55 to 59 Years (24 | 37.5%) for men and 50 to 54 Years (11 | 25.6%) for women.
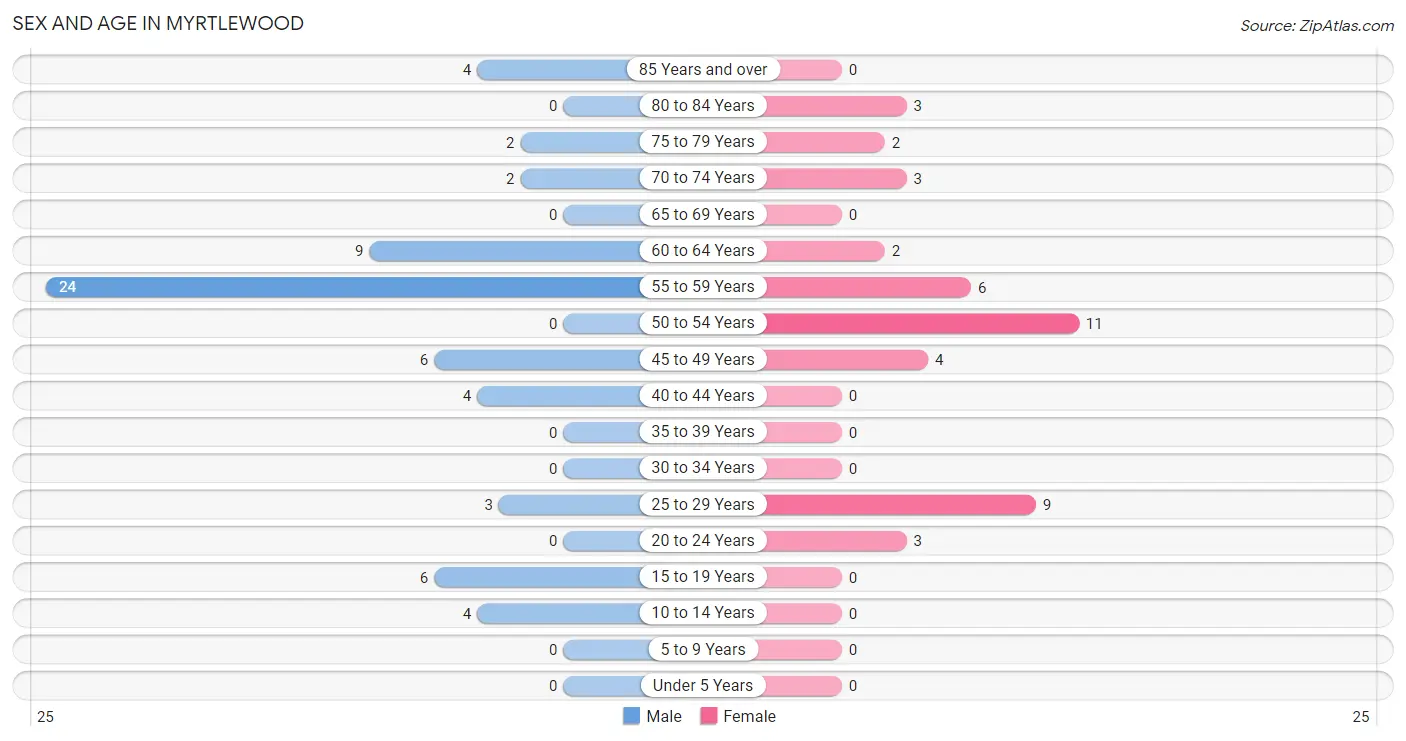
| Age Bracket | Male | Female |
| Under 5 Years | 0 (0.0%) | 0 (0.0%) |
| 5 to 9 Years | 0 (0.0%) | 0 (0.0%) |
| 10 to 14 Years | 4 (6.2%) | 0 (0.0%) |
| 15 to 19 Years | 6 (9.4%) | 0 (0.0%) |
| 20 to 24 Years | 0 (0.0%) | 3 (7.0%) |
| 25 to 29 Years | 3 (4.7%) | 9 (20.9%) |
| 30 to 34 Years | 0 (0.0%) | 0 (0.0%) |
| 35 to 39 Years | 0 (0.0%) | 0 (0.0%) |
| 40 to 44 Years | 4 (6.2%) | 0 (0.0%) |
| 45 to 49 Years | 6 (9.4%) | 4 (9.3%) |
| 50 to 54 Years | 0 (0.0%) | 11 (25.6%) |
| 55 to 59 Years | 24 (37.5%) | 6 (14.0%) |
| 60 to 64 Years | 9 (14.1%) | 2 (4.6%) |
| 65 to 69 Years | 0 (0.0%) | 0 (0.0%) |
| 70 to 74 Years | 2 (3.1%) | 3 (7.0%) |
| 75 to 79 Years | 2 (3.1%) | 2 (4.6%) |
| 80 to 84 Years | 0 (0.0%) | 3 (7.0%) |
| 85 Years and over | 4 (6.2%) | 0 (0.0%) |
| Total | 64 (100.0%) | 43 (100.0%) |
Families and Households in Myrtlewood
Median Family Size in Myrtlewood
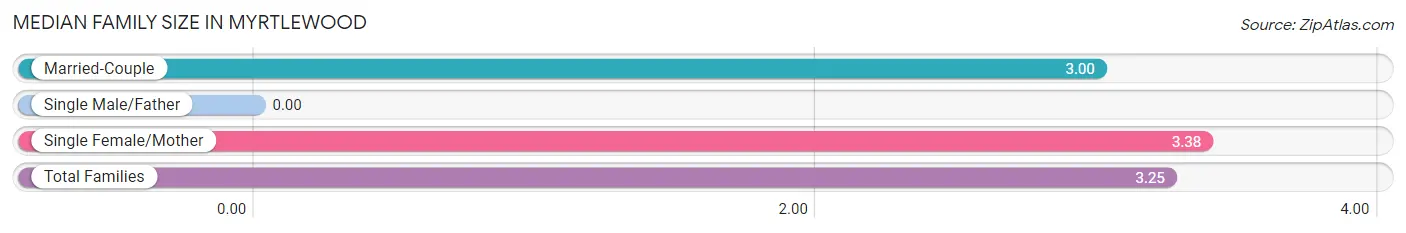
| Family Type | # Families | Family Size |
| Married-Couple | 7 (35.0%) | 3.00 |
| Single Male/Father | 0 (0.0%) | - |
| Single Female/Mother | 13 (65.0%) | 3.38 |
| Total Families | 20 (100.0%) | 3.25 |
Median Household Size in Myrtlewood
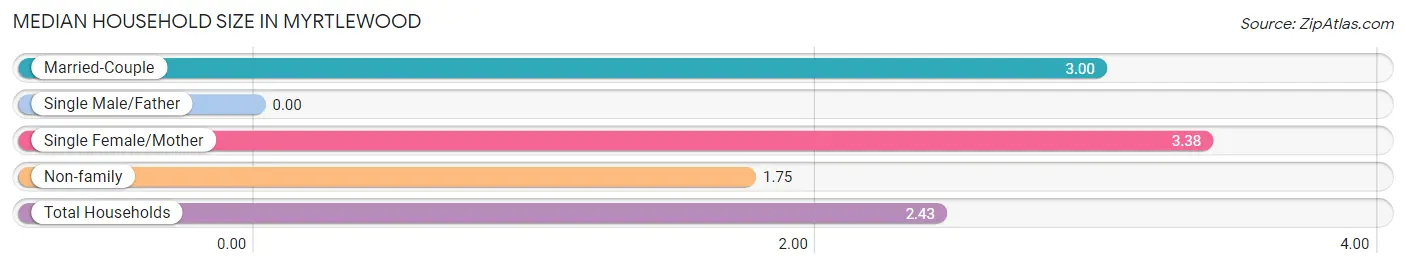
| Household Type | # Households | Household Size |
| Married-Couple | 7 (15.9%) | 3.00 |
| Single Male/Father | 0 (0.0%) | - |
| Single Female/Mother | 13 (29.5%) | 3.38 |
| Non-family | 24 (54.5%) | 1.75 |
| Total Households | 44 (100.0%) | 2.43 |
Household Size by Marriage Status in Myrtlewood
Out of a total of 44 households in Myrtlewood, 20 (45.5%) are family households, while 24 (54.5%) are nonfamily households. The most numerous type of family households are 3-person households, comprising 13, and the most common type of nonfamily households are 1-person households, comprising 20.
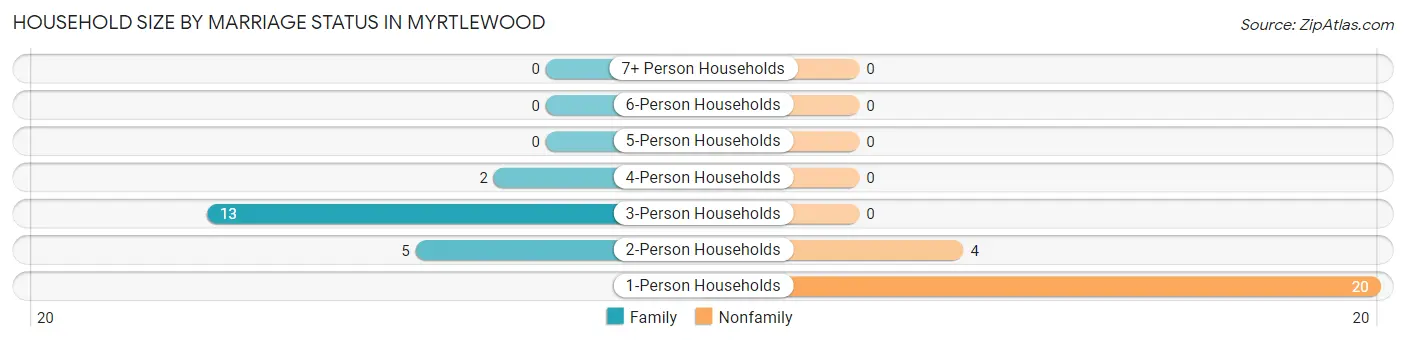
| Household Size | Family Households | Nonfamily Households |
| 1-Person Households | - | 20 (45.5%) |
| 2-Person Households | 5 (11.4%) | 4 (9.1%) |
| 3-Person Households | 13 (29.5%) | 0 (0.0%) |
| 4-Person Households | 2 (4.5%) | 0 (0.0%) |
| 5-Person Households | 0 (0.0%) | 0 (0.0%) |
| 6-Person Households | 0 (0.0%) | 0 (0.0%) |
| 7+ Person Households | 0 (0.0%) | 0 (0.0%) |
| Total | 20 (45.5%) | 24 (54.5%) |
Female Fertility in Myrtlewood
Fertility by Age in Myrtlewood
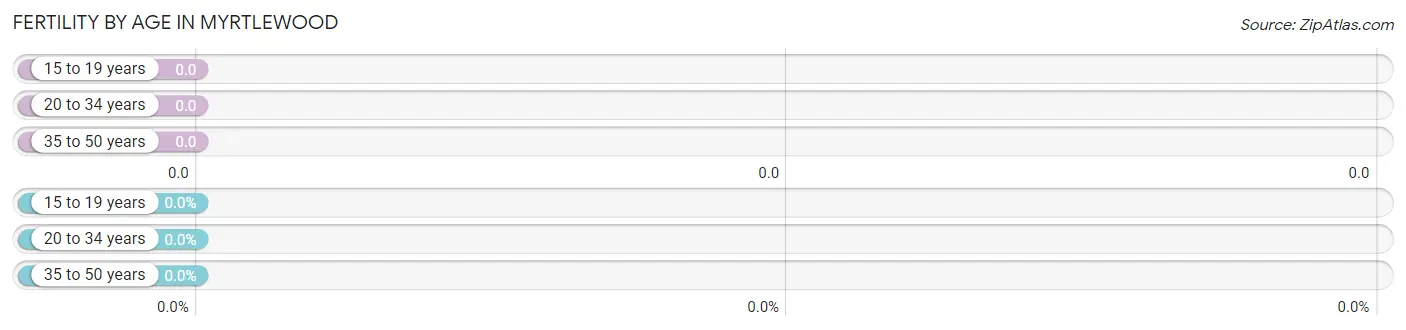
| Age Bracket | Women with Births | Births / 1,000 Women |
| 15 to 19 years | 0 (0.0%) | 0.0 |
| 20 to 34 years | 0 (0.0%) | 0.0 |
| 35 to 50 years | 0 (0.0%) | 0.0 |
| Total | 0 (0.0%) | 0.0 |
Fertility by Age by Marriage Status in Myrtlewood
| Age Bracket | Married | Unmarried |
| 15 to 19 years | 0 (0.0%) | 0 (0.0%) |
| 20 to 34 years | 0 (0.0%) | 0 (0.0%) |
| 35 to 50 years | 0 (0.0%) | 0 (0.0%) |
| Total | 0 (0.0%) | 0 (0.0%) |
Fertility by Education in Myrtlewood
| Educational Attainment | Women with Births | Births / 1,000 Women |
| Less than High School | 0 (0.0%) | 0.0 |
| High School Diploma | 0 (0.0%) | 0.0 |
| College or Associate's Degree | 0 (0.0%) | 0.0 |
| Bachelor's Degree | 0 (0.0%) | 0.0 |
| Graduate Degree | 0 (0.0%) | 0.0 |
| Total | 0 (0.0%) | 0.0 |
Fertility by Education by Marriage Status in Myrtlewood
| Educational Attainment | Married | Unmarried |
| Less than High School | 0 (0.0%) | 0 (0.0%) |
| High School Diploma | 0 (0.0%) | 0 (0.0%) |
| College or Associate's Degree | 0 (0.0%) | 0 (0.0%) |
| Bachelor's Degree | 0 (0.0%) | 0 (0.0%) |
| Graduate Degree | 0 (0.0%) | 0 (0.0%) |
| Total | 0 (0.0%) | 0 (0.0%) |
Employment Characteristics in Myrtlewood
Employment by Class of Employer in Myrtlewood
Among the 62 employed individuals in Myrtlewood, private company employees (40 | 64.5%), not-for-profit organizations (15 | 24.2%), and local government employees (5 | 8.1%) make up the most common classes of employment.
| Employer Class | # Employees | % Employees |
| Private Company Employees | 40 | 64.5% |
| Self-Employed (Incorporated) | 0 | 0.0% |
| Self-Employed (Not Incorporated) | 0 | 0.0% |
| Not-for-profit Organizations | 15 | 24.2% |
| Local Government Employees | 5 | 8.1% |
| State Government Employees | 0 | 0.0% |
| Federal Government Employees | 2 | 3.2% |
| Unpaid Family Workers | 0 | 0.0% |
| Total | 62 | 100.0% |
Employment Status by Age in Myrtlewood
According to the labor force statistics for Myrtlewood, out of the total population over 16 years of age (103), 63.1% or 65 individuals are in the labor force, with 4.6% or 3 of them unemployed. The age group with the highest labor force participation rate is 25 to 29 years, with 100.0% or 12 individuals in the labor force. Within the labor force, the 25 to 29 years age range has the highest percentage of unemployed individuals, with 25.0% or 3 of them being unemployed.
| Age Bracket | In Labor Force | Unemployed |
| 16 to 19 Years | 0 (0.0%) | 0 (0.0%) |
| 20 to 24 Years | 0 (0.0%) | 0 (0.0%) |
| 25 to 29 Years | 12 (100.0%) | 3 (25.0%) |
| 30 to 34 Years | 0 (0.0%) | 0 (0.0%) |
| 35 to 44 Years | 4 (100.0%) | 0 (0.0%) |
| 45 to 54 Years | 21 (100.0%) | 0 (0.0%) |
| 55 to 59 Years | 24 (80.0%) | 0 (0.0%) |
| 60 to 64 Years | 2 (18.2%) | 0 (0.0%) |
| 65 to 74 Years | 0 (0.0%) | 0 (0.0%) |
| 75 Years and over | 2 (18.2%) | 0 (0.0%) |
| Total | 65 (63.1%) | 3 (4.6%) |
Employment Status by Educational Attainment in Myrtlewood
According to labor force statistics for Myrtlewood, 80.8% of individuals (63) out of the total population between 25 and 64 years of age (78) are in the labor force, with 4.8% or 3 of them being unemployed. The group with the highest labor force participation rate are those with the educational attainment of college / associate degree, with 100.0% or 27 individuals in the labor force. Within the labor force, individuals with high school diploma education have the highest percentage of unemployment, with 9.1% or 3 of them being unemployed.
| Educational Attainment | In Labor Force | Unemployed |
| Less than High School | 1 (14.3%) | 0 (0.0%) |
| High School Diploma | 33 (82.5%) | 4 (9.1%) |
| College / Associate Degree | 27 (100.0%) | 0 (0.0%) |
| Bachelor's Degree or higher | 2 (50.0%) | 0 (0.0%) |
| Total | 63 (80.8%) | 4 (4.8%) |
Employment Occupations by Sex in Myrtlewood
Management, Business, Science and Arts Occupations
The most common Management, Business, Science and Arts occupations in Myrtlewood are Health Diagnosing & Treating (20 | 32.3%), Health Technologists (11 | 17.7%), Community & Social Service (4 | 6.5%), Education, Arts & Media (2 | 3.2%), and Education Instruction & Library (2 | 3.2%).
Management, Business, Science and Arts Occupations by Sex
Within the Management, Business, Science and Arts occupations in Myrtlewood, the most male-oriented occupations are Education, Arts & Media (100.0%), and Community & Social Service (50.0%), while the most female-oriented occupations are Education Instruction & Library (100.0%), Health Diagnosing & Treating (100.0%), and Health Technologists (100.0%).
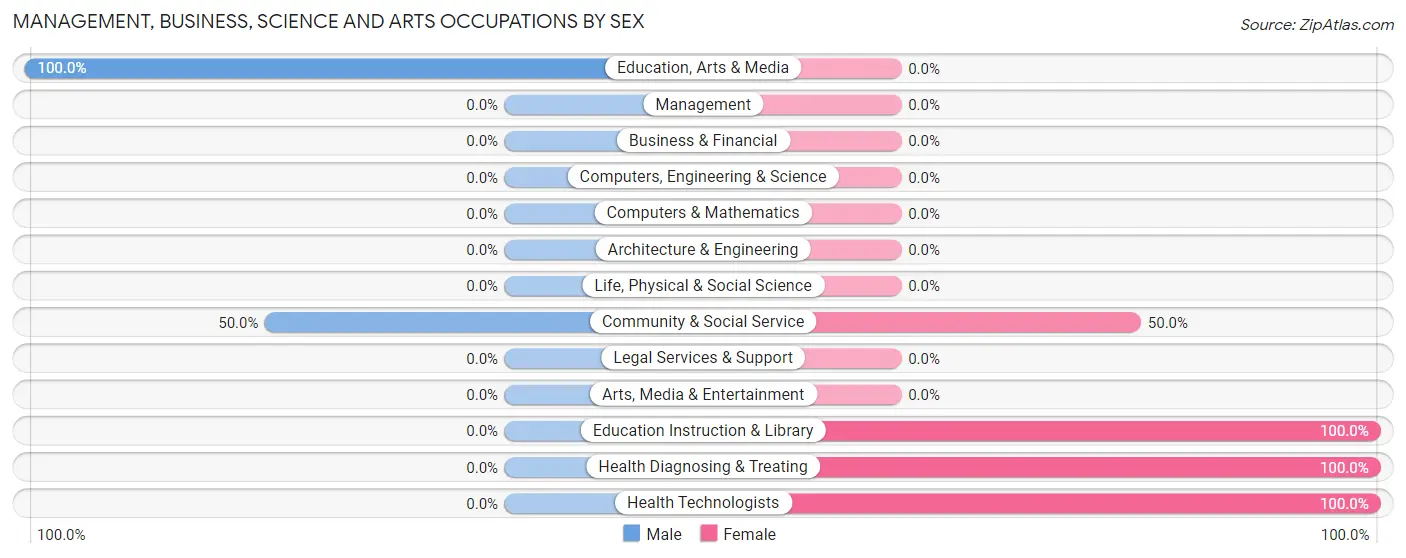
| Occupation | Male | Female |
| Management | 0 (0.0%) | 0 (0.0%) |
| Business & Financial | 0 (0.0%) | 0 (0.0%) |
| Computers, Engineering & Science | 0 (0.0%) | 0 (0.0%) |
| Computers & Mathematics | 0 (0.0%) | 0 (0.0%) |
| Architecture & Engineering | 0 (0.0%) | 0 (0.0%) |
| Life, Physical & Social Science | 0 (0.0%) | 0 (0.0%) |
| Community & Social Service | 2 (50.0%) | 2 (50.0%) |
| Education, Arts & Media | 2 (100.0%) | 0 (0.0%) |
| Legal Services & Support | 0 (0.0%) | 0 (0.0%) |
| Education Instruction & Library | 0 (0.0%) | 2 (100.0%) |
| Arts, Media & Entertainment | 0 (0.0%) | 0 (0.0%) |
| Health Diagnosing & Treating | 0 (0.0%) | 20 (100.0%) |
| Health Technologists | 0 (0.0%) | 11 (100.0%) |
| Total (Category) | 2 (8.3%) | 22 (91.7%) |
| Total (Overall) | 30 (48.4%) | 32 (51.6%) |
Services Occupations
The most common Services occupations in Myrtlewood are Security & Protection (23 | 37.1%), Firefighting & Prevention (23 | 37.1%), and Healthcare Support (2 | 3.2%).
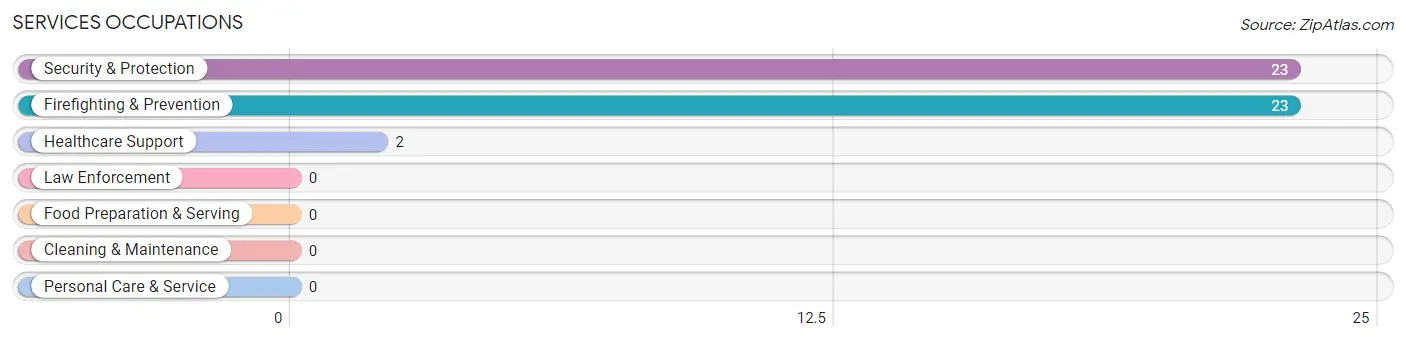
Services Occupations by Sex
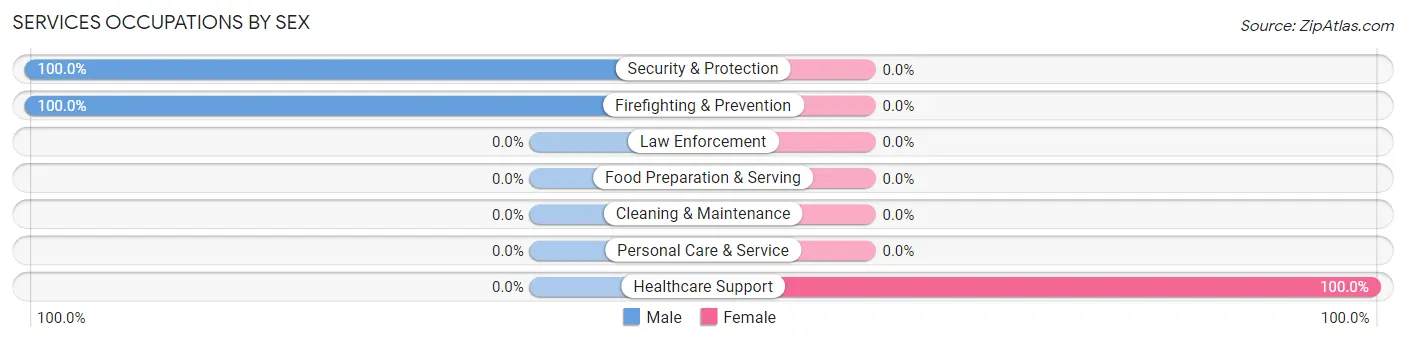
| Occupation | Male | Female |
| Healthcare Support | 0 (0.0%) | 2 (100.0%) |
| Security & Protection | 23 (100.0%) | 0 (0.0%) |
| Firefighting & Prevention | 23 (100.0%) | 0 (0.0%) |
| Law Enforcement | 0 (0.0%) | 0 (0.0%) |
| Food Preparation & Serving | 0 (0.0%) | 0 (0.0%) |
| Cleaning & Maintenance | 0 (0.0%) | 0 (0.0%) |
| Personal Care & Service | 0 (0.0%) | 0 (0.0%) |
| Total (Category) | 23 (92.0%) | 2 (8.0%) |
| Total (Overall) | 30 (48.4%) | 32 (51.6%) |
Sales and Office Occupations
The most common Sales and Office occupations in Myrtlewood are Office & Administration (6 | 9.7%), and Sales & Related (4 | 6.5%).
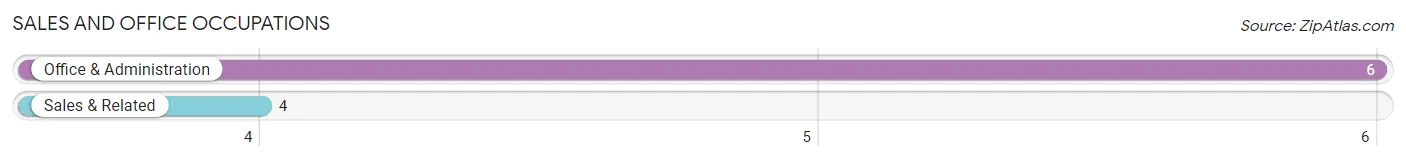
Sales and Office Occupations by Sex
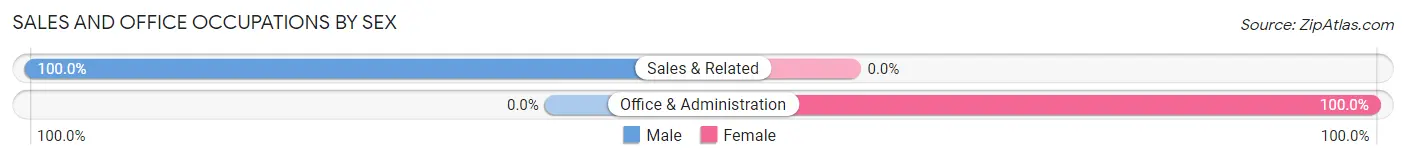
| Occupation | Male | Female |
| Sales & Related | 4 (100.0%) | 0 (0.0%) |
| Office & Administration | 0 (0.0%) | 6 (100.0%) |
| Total (Category) | 4 (40.0%) | 6 (60.0%) |
| Total (Overall) | 30 (48.4%) | 32 (51.6%) |
Natural Resources, Construction and Maintenance Occupations
Natural Resources, Construction and Maintenance Occupations by Sex
| Occupation | Male | Female |
| Farming, Fishing & Forestry | 0 (0.0%) | 0 (0.0%) |
| Construction & Extraction | 0 (0.0%) | 0 (0.0%) |
| Installation, Maintenance & Repair | 0 (0.0%) | 0 (0.0%) |
| Total (Category) | 0 (0.0%) | 0 (0.0%) |
| Total (Overall) | 30 (48.4%) | 32 (51.6%) |
Production, Transportation and Moving Occupations
The most common Production, Transportation and Moving occupations in Myrtlewood are Transportation (2 | 3.2%), and Production (1 | 1.6%).
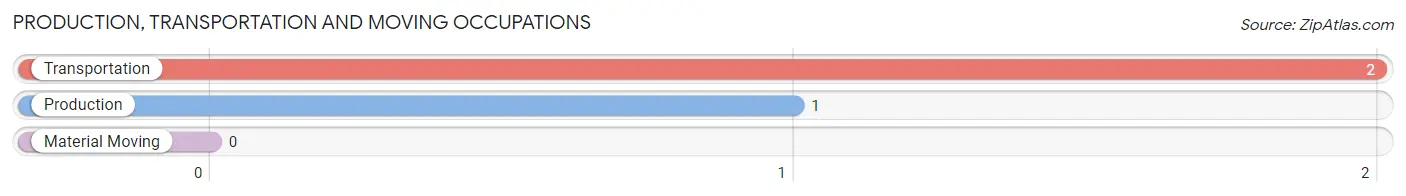
Production, Transportation and Moving Occupations by Sex
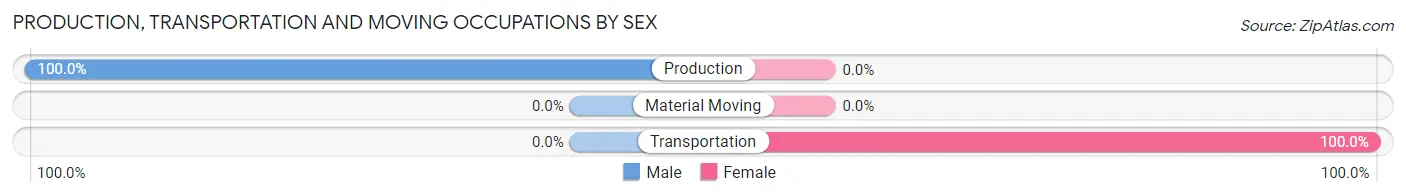
| Occupation | Male | Female |
| Production | 1 (100.0%) | 0 (0.0%) |
| Transportation | 0 (0.0%) | 2 (100.0%) |
| Material Moving | 0 (0.0%) | 0 (0.0%) |
| Total (Category) | 1 (33.3%) | 2 (66.7%) |
| Total (Overall) | 30 (48.4%) | 32 (51.6%) |
Employment Industries by Sex in Myrtlewood
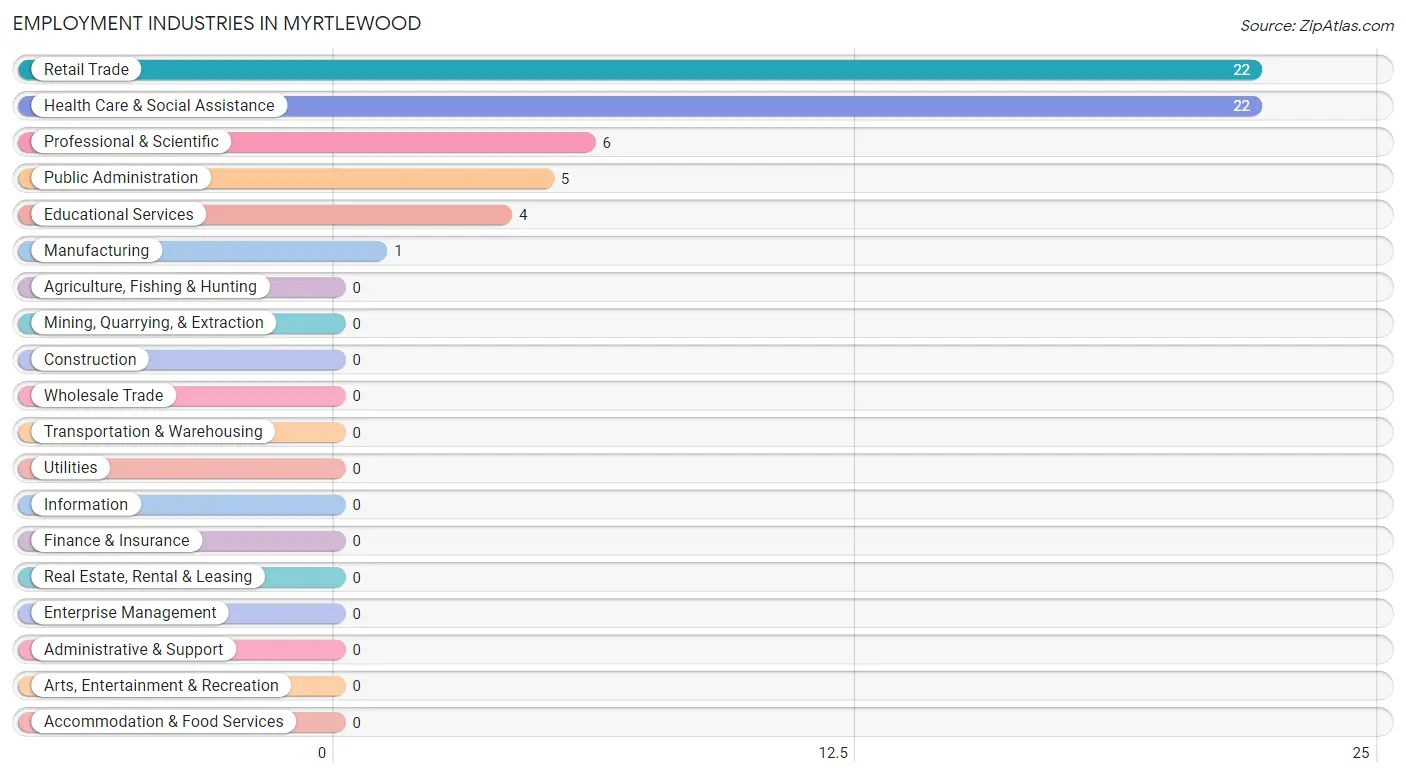
Employment Industries in Myrtlewood
The major employment industries in Myrtlewood include Retail Trade (22 | 35.5%), Health Care & Social Assistance (22 | 35.5%), Professional & Scientific (6 | 9.7%), Public Administration (5 | 8.1%), and Educational Services (4 | 6.5%).
Employment Industries by Sex in Myrtlewood
The Myrtlewood industries that see more men than women are Manufacturing (100.0%), Retail Trade (100.0%), and Public Administration (100.0%), whereas the industries that tend to have a higher number of women are Professional & Scientific (100.0%), Educational Services (100.0%), and Health Care & Social Assistance (100.0%).
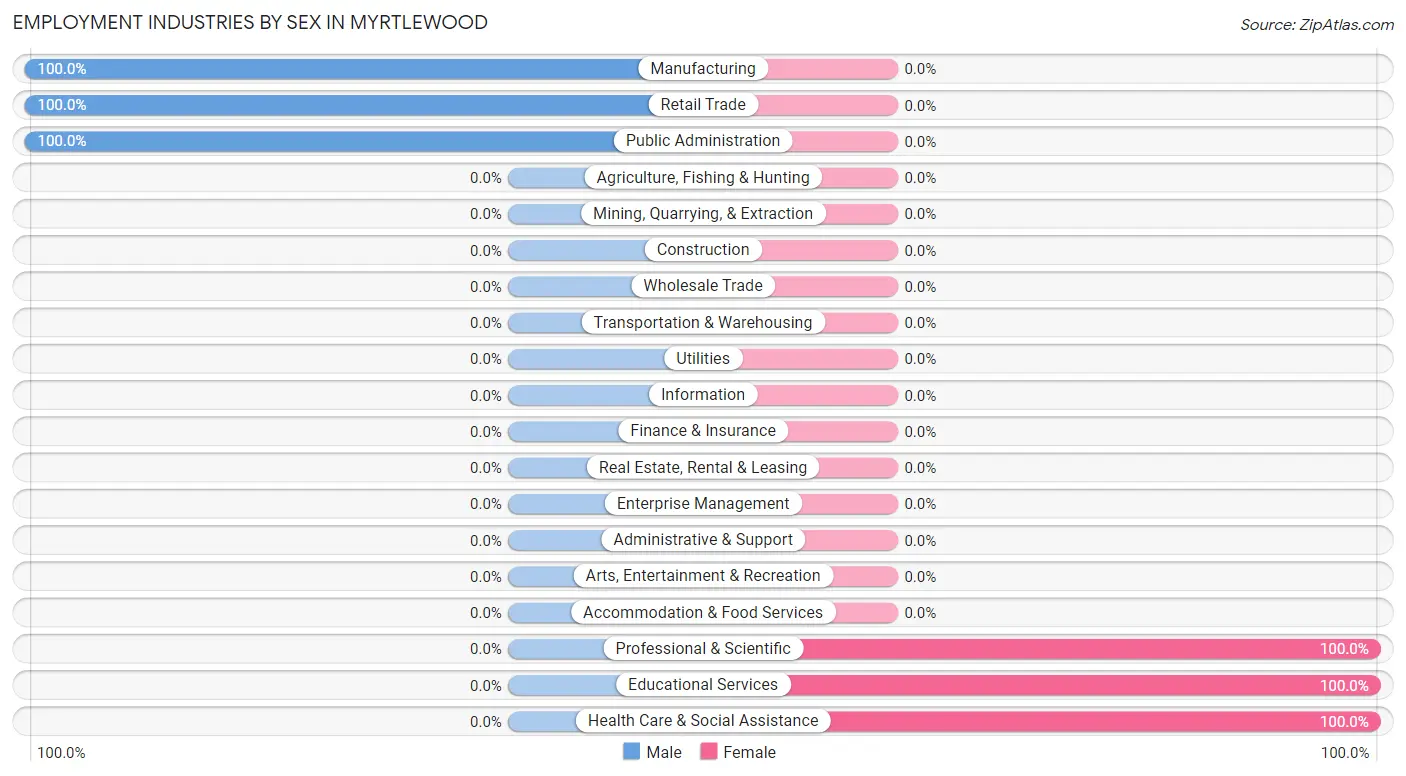
| Industry | Male | Female |
| Agriculture, Fishing & Hunting | 0 (0.0%) | 0 (0.0%) |
| Mining, Quarrying, & Extraction | 0 (0.0%) | 0 (0.0%) |
| Construction | 0 (0.0%) | 0 (0.0%) |
| Manufacturing | 1 (100.0%) | 0 (0.0%) |
| Wholesale Trade | 0 (0.0%) | 0 (0.0%) |
| Retail Trade | 22 (100.0%) | 0 (0.0%) |
| Transportation & Warehousing | 0 (0.0%) | 0 (0.0%) |
| Utilities | 0 (0.0%) | 0 (0.0%) |
| Information | 0 (0.0%) | 0 (0.0%) |
| Finance & Insurance | 0 (0.0%) | 0 (0.0%) |
| Real Estate, Rental & Leasing | 0 (0.0%) | 0 (0.0%) |
| Professional & Scientific | 0 (0.0%) | 6 (100.0%) |
| Enterprise Management | 0 (0.0%) | 0 (0.0%) |
| Administrative & Support | 0 (0.0%) | 0 (0.0%) |
| Educational Services | 0 (0.0%) | 4 (100.0%) |
| Health Care & Social Assistance | 0 (0.0%) | 22 (100.0%) |
| Arts, Entertainment & Recreation | 0 (0.0%) | 0 (0.0%) |
| Accommodation & Food Services | 0 (0.0%) | 0 (0.0%) |
| Public Administration | 5 (100.0%) | 0 (0.0%) |
| Total | 30 (48.4%) | 32 (51.6%) |
Education in Myrtlewood
School Enrollment in Myrtlewood
The most common levels of schooling among the 10 students in Myrtlewood are college / undergraduate (6 | 60.0%), and middle school (4 | 40.0%).
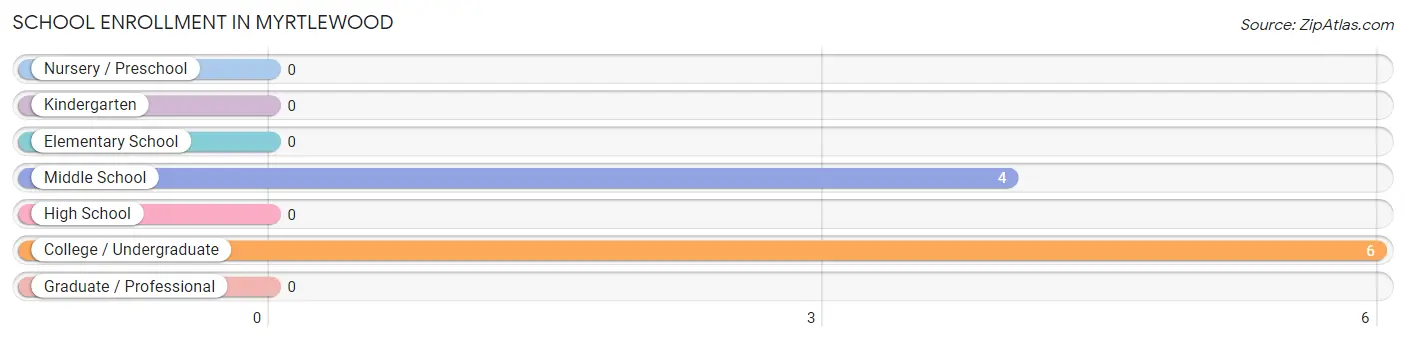
| School Level | # Students | % Students |
| Nursery / Preschool | 0 | 0.0% |
| Kindergarten | 0 | 0.0% |
| Elementary School | 0 | 0.0% |
| Middle School | 4 | 40.0% |
| High School | 0 | 0.0% |
| College / Undergraduate | 6 | 60.0% |
| Graduate / Professional | 0 | 0.0% |
| Total | 10 | 100.0% |
School Enrollment by Age by Funding Source in Myrtlewood
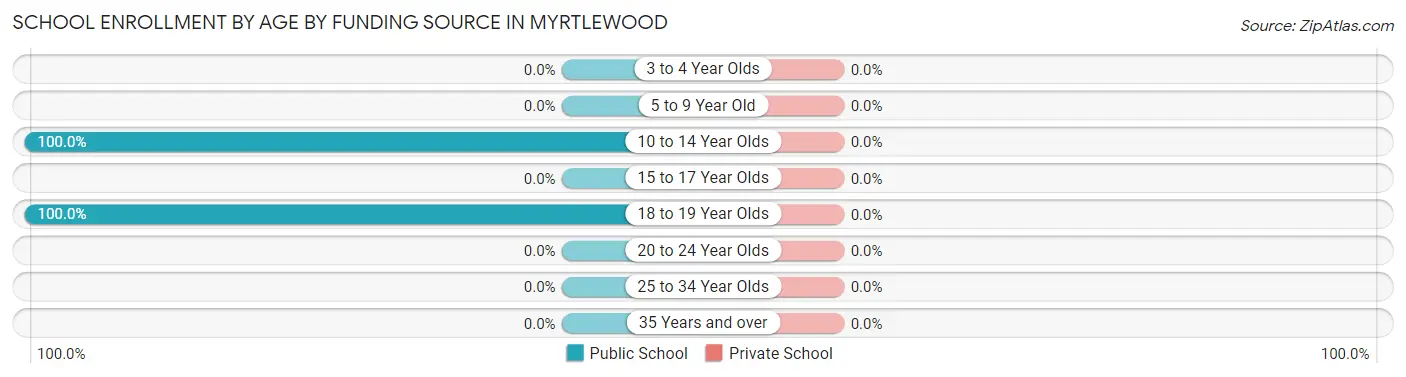
| Age Bracket | Public School | Private School |
| 3 to 4 Year Olds | 0 (0.0%) | 0 (0.0%) |
| 5 to 9 Year Old | 0 (0.0%) | 0 (0.0%) |
| 10 to 14 Year Olds | 4 (100.0%) | 0 (0.0%) |
| 15 to 17 Year Olds | 0 (0.0%) | 0 (0.0%) |
| 18 to 19 Year Olds | 6 (100.0%) | 0 (0.0%) |
| 20 to 24 Year Olds | 0 (0.0%) | 0 (0.0%) |
| 25 to 34 Year Olds | 0 (0.0%) | 0 (0.0%) |
| 35 Years and over | 0 (0.0%) | 0 (0.0%) |
| Total | 10 (100.0%) | 0 (0.0%) |
Educational Attainment by Field of Study in Myrtlewood
Liberal arts & history (4 | 50.0%), education (2 | 25.0%), and arts & humanities (2 | 25.0%) are the most common fields of study among 8 individuals in Myrtlewood who have obtained a bachelor's degree or higher.
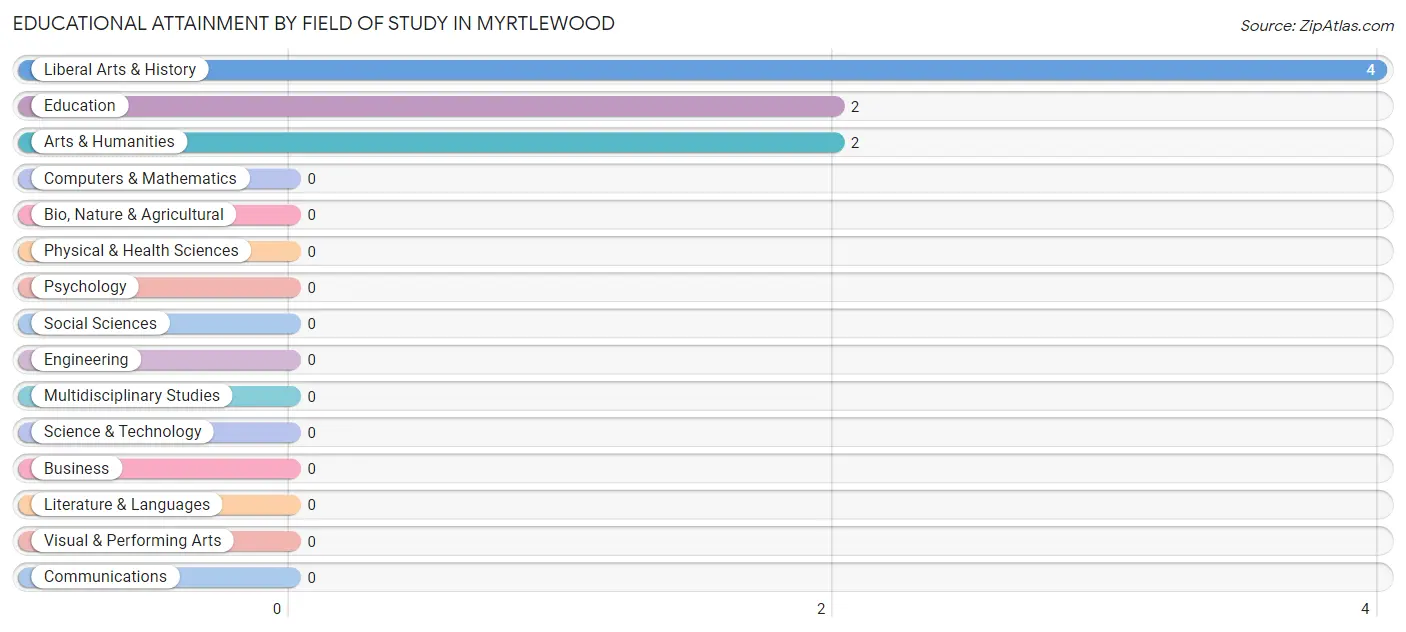
| Field of Study | # Graduates | % Graduates |
| Computers & Mathematics | 0 | 0.0% |
| Bio, Nature & Agricultural | 0 | 0.0% |
| Physical & Health Sciences | 0 | 0.0% |
| Psychology | 0 | 0.0% |
| Social Sciences | 0 | 0.0% |
| Engineering | 0 | 0.0% |
| Multidisciplinary Studies | 0 | 0.0% |
| Science & Technology | 0 | 0.0% |
| Business | 0 | 0.0% |
| Education | 2 | 25.0% |
| Literature & Languages | 0 | 0.0% |
| Liberal Arts & History | 4 | 50.0% |
| Visual & Performing Arts | 0 | 0.0% |
| Communications | 0 | 0.0% |
| Arts & Humanities | 2 | 25.0% |
| Total | 8 | 100.0% |
Transportation & Commute in Myrtlewood
Vehicle Availability by Sex in Myrtlewood
The most prevalent vehicle ownership categories in Myrtlewood are males with 2 vehicles (24, accounting for 80.0%) and females with 2 vehicles (2, making up 75.0%).
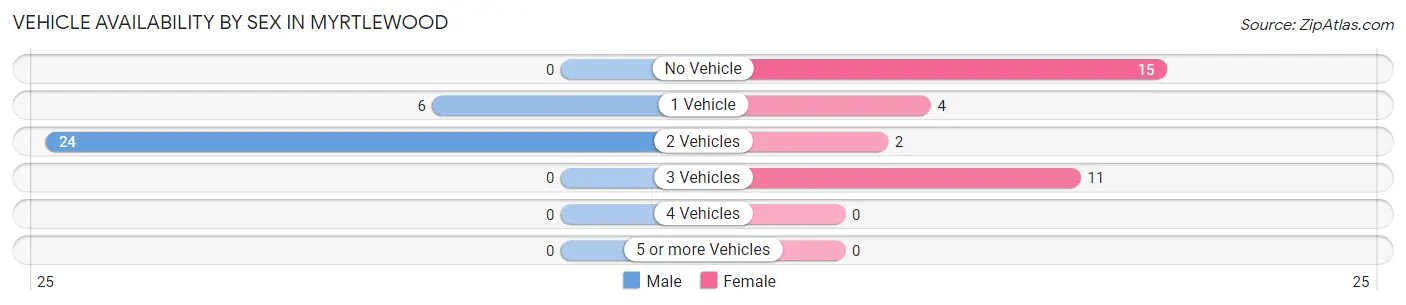
| Vehicles Available | Male | Female |
| No Vehicle | 0 (0.0%) | 15 (46.9%) |
| 1 Vehicle | 6 (20.0%) | 4 (12.5%) |
| 2 Vehicles | 24 (80.0%) | 2 (6.2%) |
| 3 Vehicles | 0 (0.0%) | 11 (34.4%) |
| 4 Vehicles | 0 (0.0%) | 0 (0.0%) |
| 5 or more Vehicles | 0 (0.0%) | 0 (0.0%) |
| Total | 30 (100.0%) | 32 (100.0%) |
Commute Time in Myrtlewood
The most frequently occuring commute durations in Myrtlewood are 20 to 24 minutes (37 commuters, 59.7%), 35 to 39 minutes (11 commuters, 17.7%), and 15 to 19 minutes (5 commuters, 8.1%).
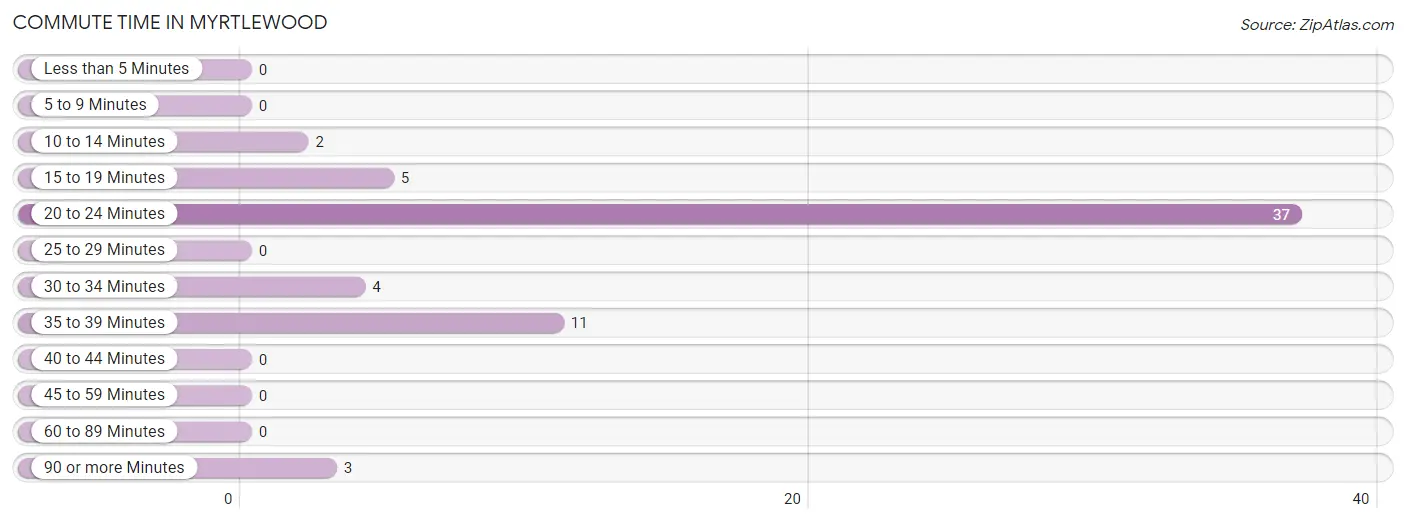
| Commute Time | # Commuters | % Commuters |
| Less than 5 Minutes | 0 | 0.0% |
| 5 to 9 Minutes | 0 | 0.0% |
| 10 to 14 Minutes | 2 | 3.2% |
| 15 to 19 Minutes | 5 | 8.1% |
| 20 to 24 Minutes | 37 | 59.7% |
| 25 to 29 Minutes | 0 | 0.0% |
| 30 to 34 Minutes | 4 | 6.5% |
| 35 to 39 Minutes | 11 | 17.7% |
| 40 to 44 Minutes | 0 | 0.0% |
| 45 to 59 Minutes | 0 | 0.0% |
| 60 to 89 Minutes | 0 | 0.0% |
| 90 or more Minutes | 3 | 4.8% |
Commute Time by Sex in Myrtlewood
The most common commute times in Myrtlewood are 20 to 24 minutes (22 commuters, 73.3%) for males and 20 to 24 minutes (15 commuters, 46.9%) for females.
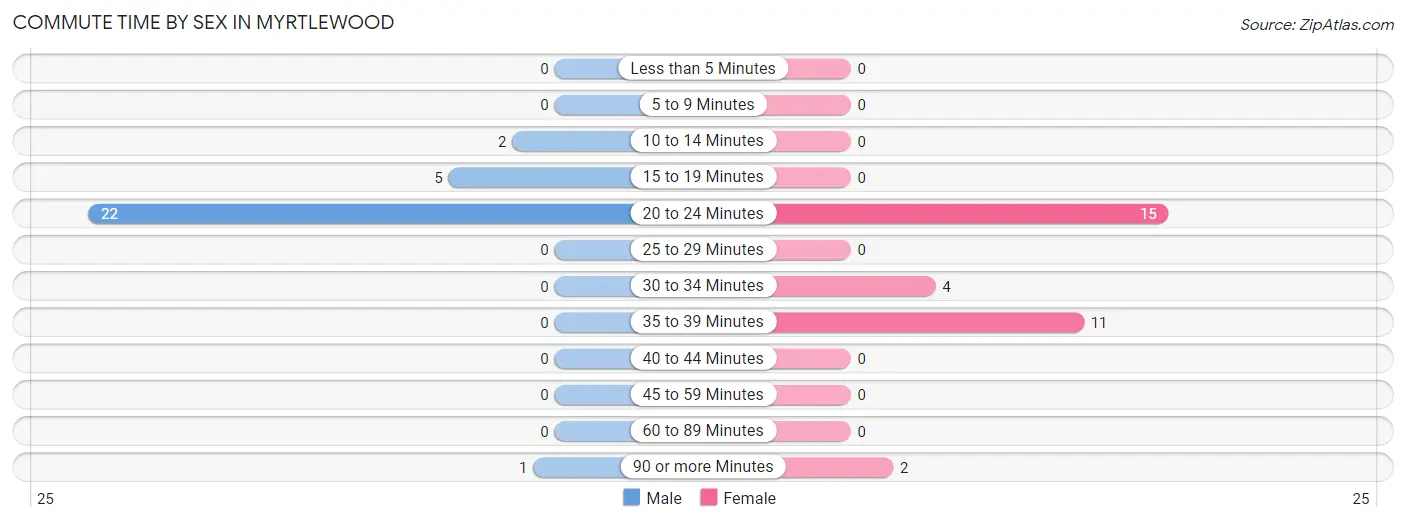
| Commute Time | Male | Female |
| Less than 5 Minutes | 0 (0.0%) | 0 (0.0%) |
| 5 to 9 Minutes | 0 (0.0%) | 0 (0.0%) |
| 10 to 14 Minutes | 2 (6.7%) | 0 (0.0%) |
| 15 to 19 Minutes | 5 (16.7%) | 0 (0.0%) |
| 20 to 24 Minutes | 22 (73.3%) | 15 (46.9%) |
| 25 to 29 Minutes | 0 (0.0%) | 0 (0.0%) |
| 30 to 34 Minutes | 0 (0.0%) | 4 (12.5%) |
| 35 to 39 Minutes | 0 (0.0%) | 11 (34.4%) |
| 40 to 44 Minutes | 0 (0.0%) | 0 (0.0%) |
| 45 to 59 Minutes | 0 (0.0%) | 0 (0.0%) |
| 60 to 89 Minutes | 0 (0.0%) | 0 (0.0%) |
| 90 or more Minutes | 1 (3.3%) | 2 (6.2%) |
Time of Departure to Work by Sex in Myrtlewood
The most frequent times of departure to work in Myrtlewood are 12:00 AM to 4:59 AM (18, 60.0%) for males and 6:30 AM to 6:59 AM (13, 40.6%) for females.
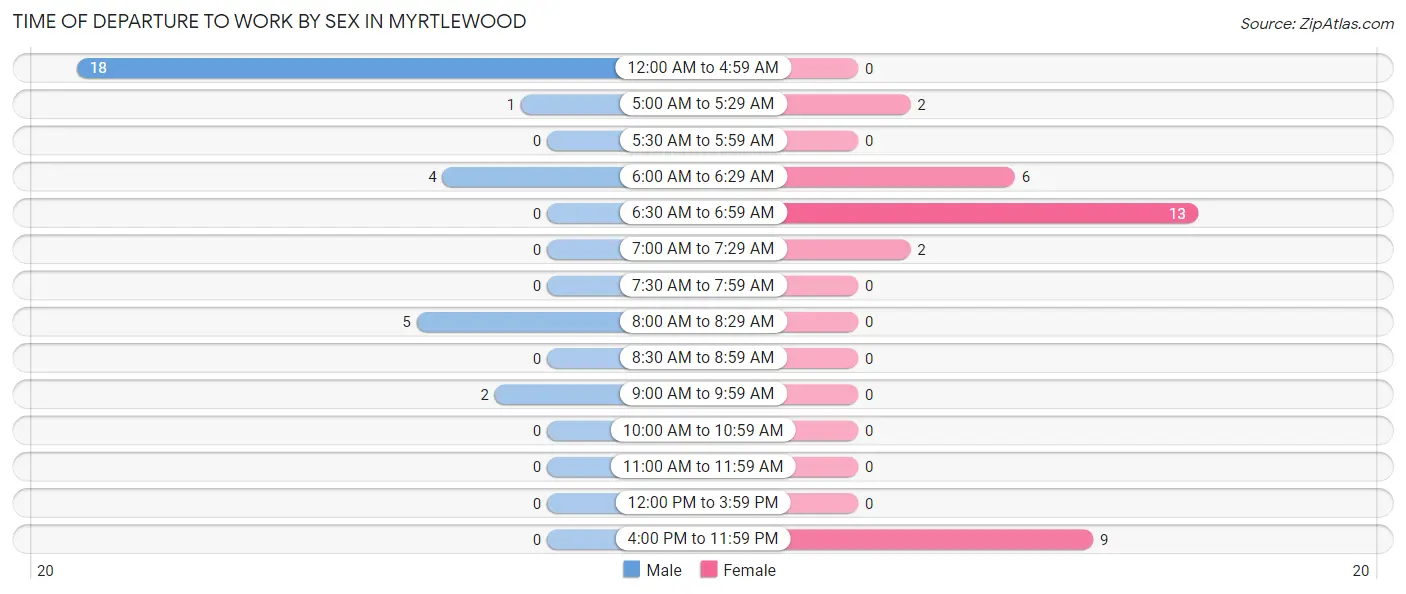
| Time of Departure | Male | Female |
| 12:00 AM to 4:59 AM | 18 (60.0%) | 0 (0.0%) |
| 5:00 AM to 5:29 AM | 1 (3.3%) | 2 (6.2%) |
| 5:30 AM to 5:59 AM | 0 (0.0%) | 0 (0.0%) |
| 6:00 AM to 6:29 AM | 4 (13.3%) | 6 (18.8%) |
| 6:30 AM to 6:59 AM | 0 (0.0%) | 13 (40.6%) |
| 7:00 AM to 7:29 AM | 0 (0.0%) | 2 (6.2%) |
| 7:30 AM to 7:59 AM | 0 (0.0%) | 0 (0.0%) |
| 8:00 AM to 8:29 AM | 5 (16.7%) | 0 (0.0%) |
| 8:30 AM to 8:59 AM | 0 (0.0%) | 0 (0.0%) |
| 9:00 AM to 9:59 AM | 2 (6.7%) | 0 (0.0%) |
| 10:00 AM to 10:59 AM | 0 (0.0%) | 0 (0.0%) |
| 11:00 AM to 11:59 AM | 0 (0.0%) | 0 (0.0%) |
| 12:00 PM to 3:59 PM | 0 (0.0%) | 0 (0.0%) |
| 4:00 PM to 11:59 PM | 0 (0.0%) | 9 (28.1%) |
| Total | 30 (100.0%) | 32 (100.0%) |
Housing Occupancy in Myrtlewood
Occupancy by Ownership in Myrtlewood
Of the total 44 dwellings in Myrtlewood, owner-occupied units account for 42 (95.5%), while renter-occupied units make up 2 (4.5%).
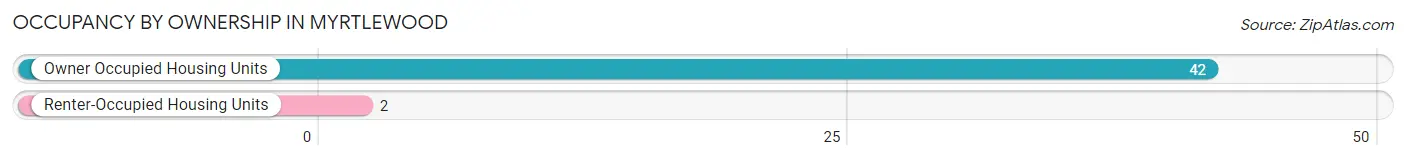
| Occupancy | # Housing Units | % Housing Units |
| Owner Occupied Housing Units | 42 | 95.5% |
| Renter-Occupied Housing Units | 2 | 4.5% |
| Total Occupied Housing Units | 44 | 100.0% |
Occupancy by Household Size in Myrtlewood
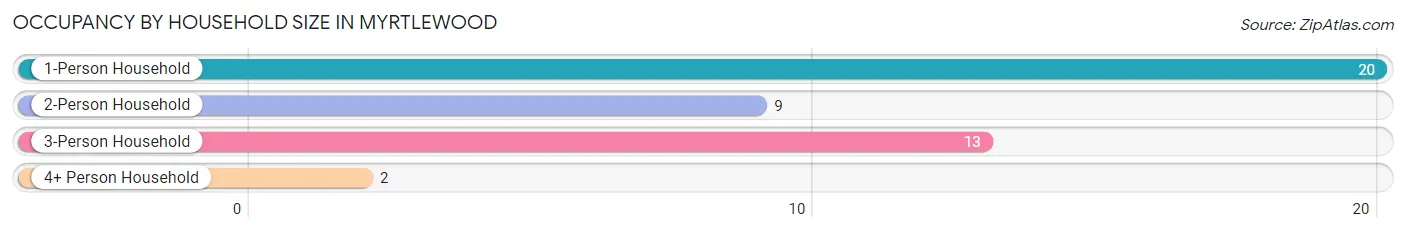
| Household Size | # Housing Units | % Housing Units |
| 1-Person Household | 20 | 45.5% |
| 2-Person Household | 9 | 20.4% |
| 3-Person Household | 13 | 29.5% |
| 4+ Person Household | 2 | 4.5% |
| Total Housing Units | 44 | 100.0% |
Occupancy by Ownership by Household Size in Myrtlewood
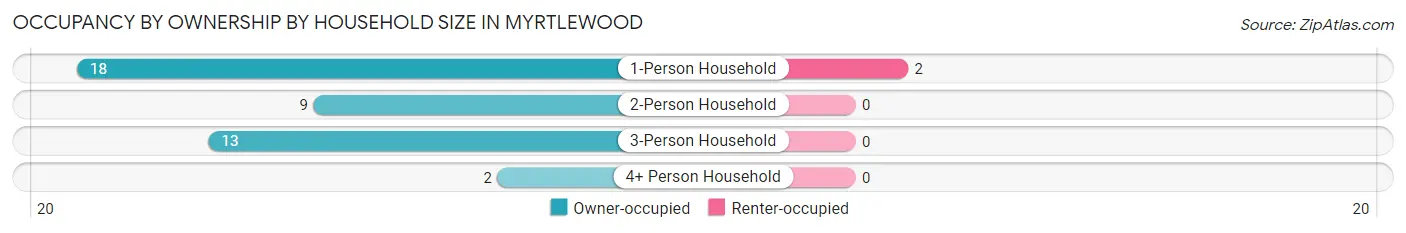
| Household Size | Owner-occupied | Renter-occupied |
| 1-Person Household | 18 (90.0%) | 2 (10.0%) |
| 2-Person Household | 9 (100.0%) | 0 (0.0%) |
| 3-Person Household | 13 (100.0%) | 0 (0.0%) |
| 4+ Person Household | 2 (100.0%) | 0 (0.0%) |
| Total Housing Units | 42 (95.5%) | 2 (4.5%) |
Occupancy by Educational Attainment in Myrtlewood
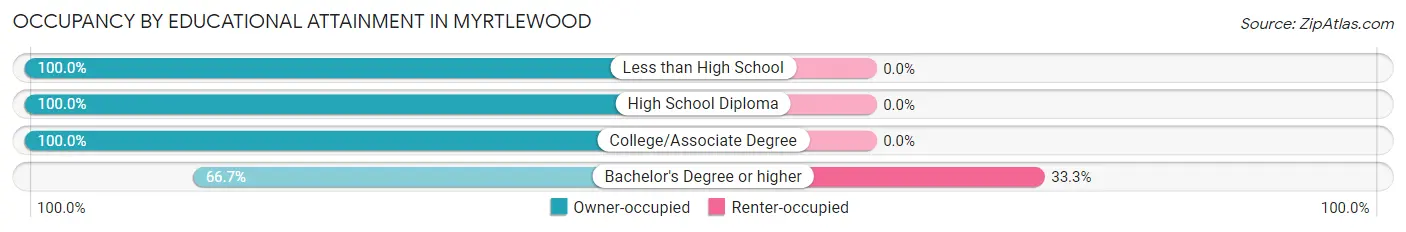
| Household Size | Owner-occupied | Renter-occupied |
| Less than High School | 3 (100.0%) | 0 (0.0%) |
| High School Diploma | 19 (100.0%) | 0 (0.0%) |
| College/Associate Degree | 16 (100.0%) | 0 (0.0%) |
| Bachelor's Degree or higher | 4 (66.7%) | 2 (33.3%) |
Occupancy by Age of Householder in Myrtlewood
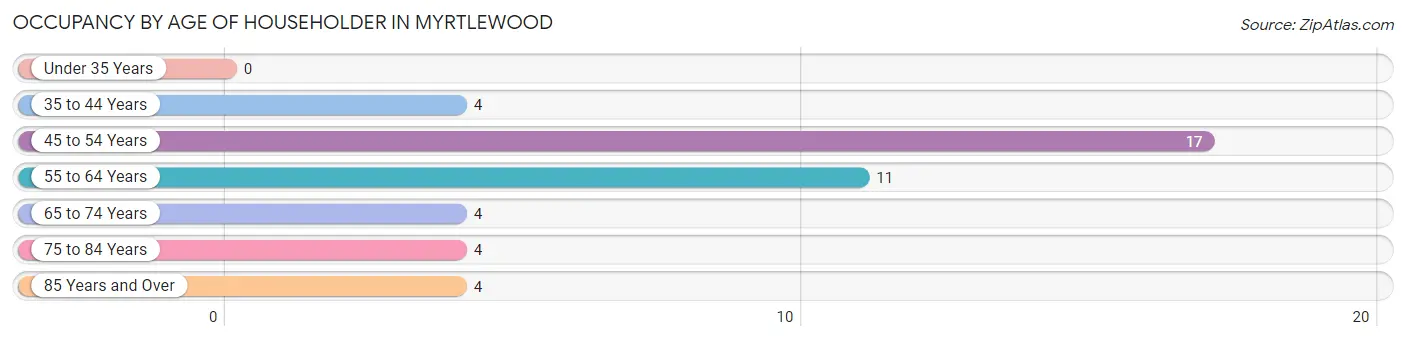
| Age Bracket | # Households | % Households |
| Under 35 Years | 0 | 0.0% |
| 35 to 44 Years | 4 | 9.1% |
| 45 to 54 Years | 17 | 38.6% |
| 55 to 64 Years | 11 | 25.0% |
| 65 to 74 Years | 4 | 9.1% |
| 75 to 84 Years | 4 | 9.1% |
| 85 Years and Over | 4 | 9.1% |
| Total | 44 | 100.0% |
Housing Finances in Myrtlewood
Median Income by Occupancy in Myrtlewood
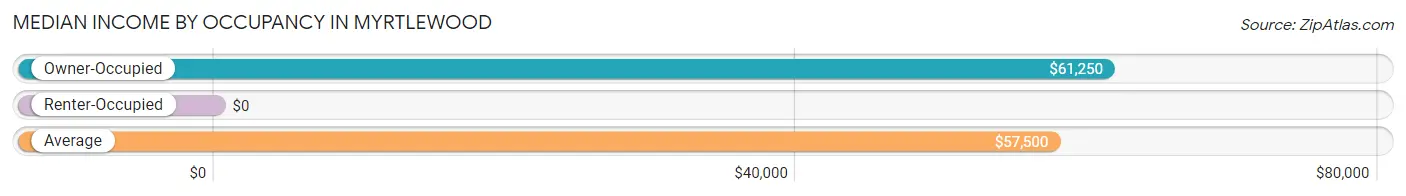
| Occupancy Type | # Households | Median Income |
| Owner-Occupied | 42 (95.5%) | $61,250 |
| Renter-Occupied | 2 (4.5%) | $0 |
| Average | 44 (100.0%) | $57,500 |
Occupancy by Householder Income Bracket in Myrtlewood
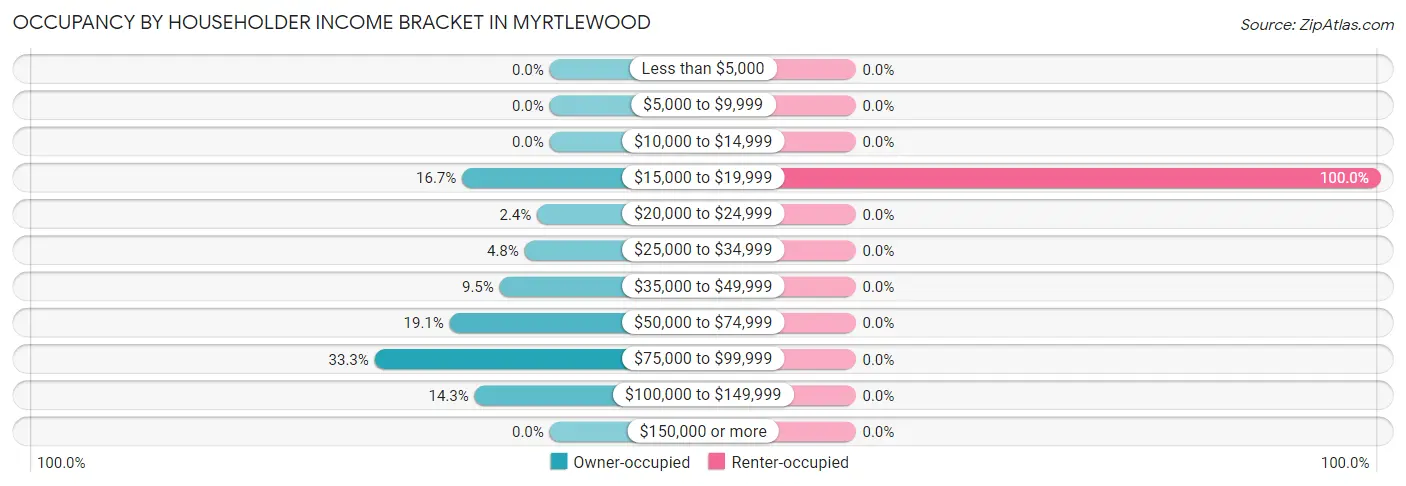
| Income Bracket | Owner-occupied | Renter-occupied |
| Less than $5,000 | 0 (0.0%) | 0 (0.0%) |
| $5,000 to $9,999 | 0 (0.0%) | 0 (0.0%) |
| $10,000 to $14,999 | 0 (0.0%) | 0 (0.0%) |
| $15,000 to $19,999 | 7 (16.7%) | 2 (100.0%) |
| $20,000 to $24,999 | 1 (2.4%) | 0 (0.0%) |
| $25,000 to $34,999 | 2 (4.8%) | 0 (0.0%) |
| $35,000 to $49,999 | 4 (9.5%) | 0 (0.0%) |
| $50,000 to $74,999 | 8 (19.1%) | 0 (0.0%) |
| $75,000 to $99,999 | 14 (33.3%) | 0 (0.0%) |
| $100,000 to $149,999 | 6 (14.3%) | 0 (0.0%) |
| $150,000 or more | 0 (0.0%) | 0 (0.0%) |
| Total | 42 (100.0%) | 2 (100.0%) |
Monthly Housing Cost Tiers in Myrtlewood
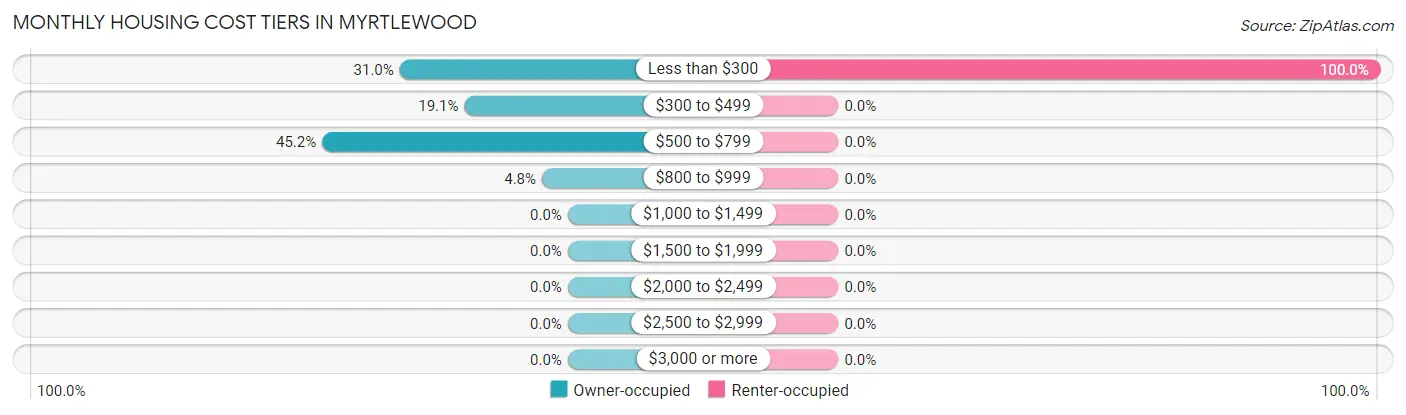
| Monthly Cost | Owner-occupied | Renter-occupied |
| Less than $300 | 13 (30.9%) | 2 (100.0%) |
| $300 to $499 | 8 (19.1%) | 0 (0.0%) |
| $500 to $799 | 19 (45.2%) | 0 (0.0%) |
| $800 to $999 | 2 (4.8%) | 0 (0.0%) |
| $1,000 to $1,499 | 0 (0.0%) | 0 (0.0%) |
| $1,500 to $1,999 | 0 (0.0%) | 0 (0.0%) |
| $2,000 to $2,499 | 0 (0.0%) | 0 (0.0%) |
| $2,500 to $2,999 | 0 (0.0%) | 0 (0.0%) |
| $3,000 or more | 0 (0.0%) | 0 (0.0%) |
| Total | 42 (100.0%) | 2 (100.0%) |
Physical Housing Characteristics in Myrtlewood
Housing Structures in Myrtlewood
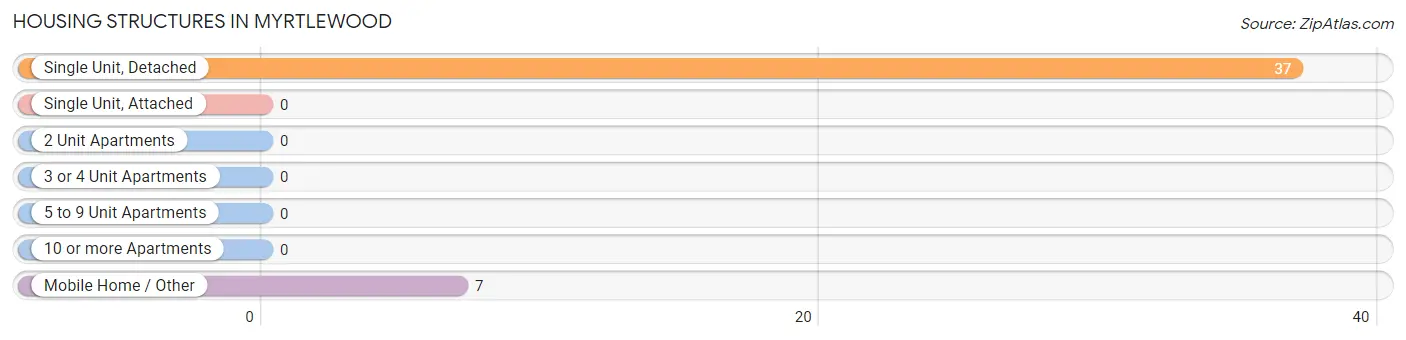
| Structure Type | # Housing Units | % Housing Units |
| Single Unit, Detached | 37 | 84.1% |
| Single Unit, Attached | 0 | 0.0% |
| 2 Unit Apartments | 0 | 0.0% |
| 3 or 4 Unit Apartments | 0 | 0.0% |
| 5 to 9 Unit Apartments | 0 | 0.0% |
| 10 or more Apartments | 0 | 0.0% |
| Mobile Home / Other | 7 | 15.9% |
| Total | 44 | 100.0% |
Housing Structures by Occupancy in Myrtlewood
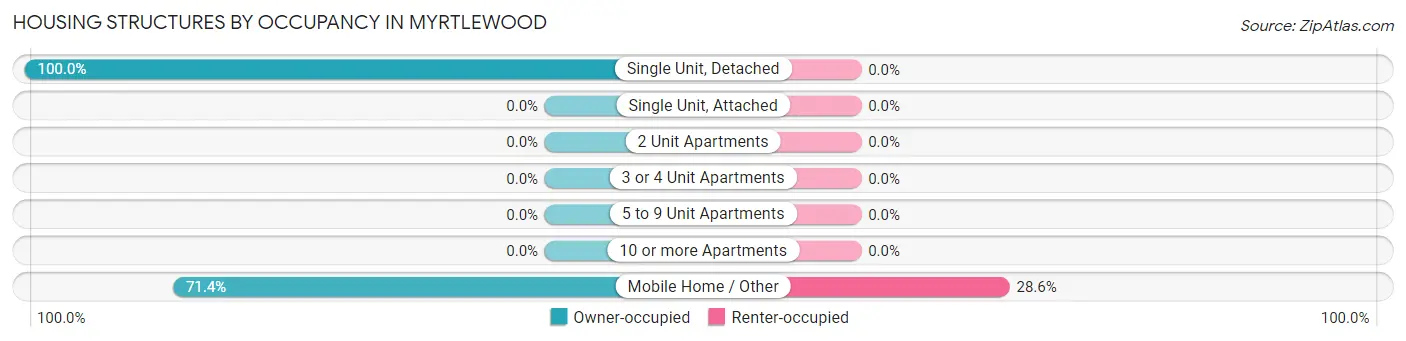
| Structure Type | Owner-occupied | Renter-occupied |
| Single Unit, Detached | 37 (100.0%) | 0 (0.0%) |
| Single Unit, Attached | 0 (0.0%) | 0 (0.0%) |
| 2 Unit Apartments | 0 (0.0%) | 0 (0.0%) |
| 3 or 4 Unit Apartments | 0 (0.0%) | 0 (0.0%) |
| 5 to 9 Unit Apartments | 0 (0.0%) | 0 (0.0%) |
| 10 or more Apartments | 0 (0.0%) | 0 (0.0%) |
| Mobile Home / Other | 5 (71.4%) | 2 (28.6%) |
| Total | 42 (95.5%) | 2 (4.5%) |
Housing Structures by Number of Rooms in Myrtlewood
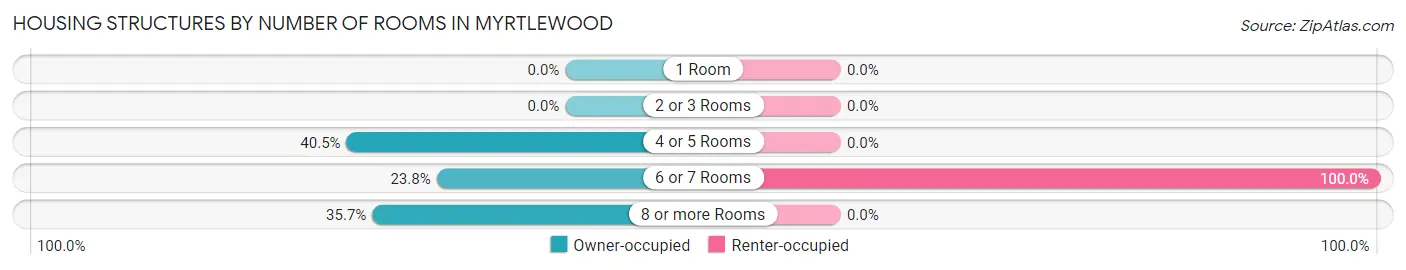
| Number of Rooms | Owner-occupied | Renter-occupied |
| 1 Room | 0 (0.0%) | 0 (0.0%) |
| 2 or 3 Rooms | 0 (0.0%) | 0 (0.0%) |
| 4 or 5 Rooms | 17 (40.5%) | 0 (0.0%) |
| 6 or 7 Rooms | 10 (23.8%) | 2 (100.0%) |
| 8 or more Rooms | 15 (35.7%) | 0 (0.0%) |
| Total | 42 (100.0%) | 2 (100.0%) |
Housing Structure by Heating Type in Myrtlewood
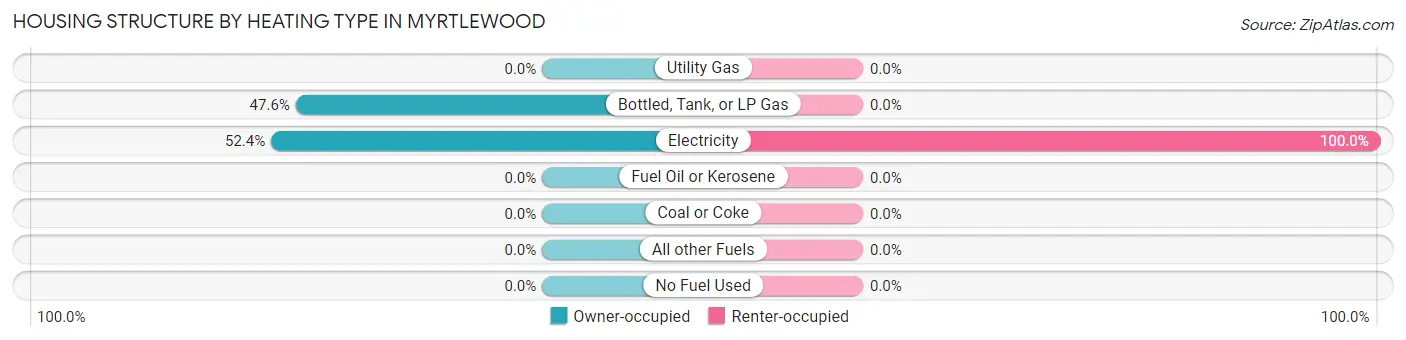
| Heating Type | Owner-occupied | Renter-occupied |
| Utility Gas | 0 (0.0%) | 0 (0.0%) |
| Bottled, Tank, or LP Gas | 20 (47.6%) | 0 (0.0%) |
| Electricity | 22 (52.4%) | 2 (100.0%) |
| Fuel Oil or Kerosene | 0 (0.0%) | 0 (0.0%) |
| Coal or Coke | 0 (0.0%) | 0 (0.0%) |
| All other Fuels | 0 (0.0%) | 0 (0.0%) |
| No Fuel Used | 0 (0.0%) | 0 (0.0%) |
| Total | 42 (100.0%) | 2 (100.0%) |
Household Vehicle Usage in Myrtlewood
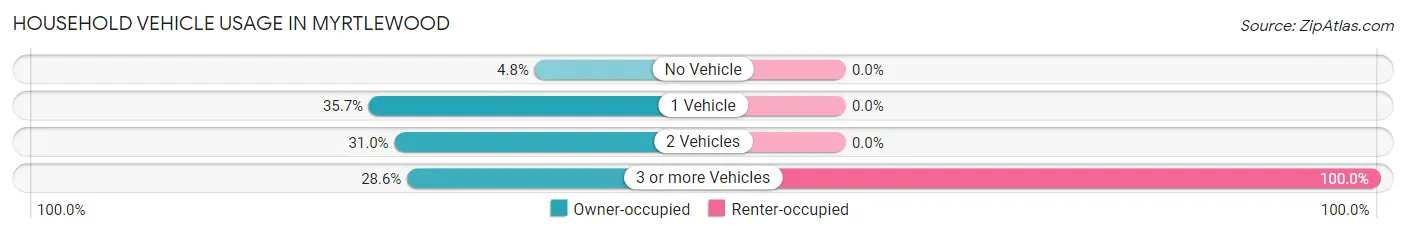
| Vehicles per Household | Owner-occupied | Renter-occupied |
| No Vehicle | 2 (4.8%) | 0 (0.0%) |
| 1 Vehicle | 15 (35.7%) | 0 (0.0%) |
| 2 Vehicles | 13 (30.9%) | 0 (0.0%) |
| 3 or more Vehicles | 12 (28.6%) | 2 (100.0%) |
| Total | 42 (100.0%) | 2 (100.0%) |
Real Estate & Mortgages in Myrtlewood
Real Estate and Mortgage Overview in Myrtlewood
| Characteristic | Without Mortgage | With Mortgage |
| Housing Units | 34 | 8 |
| Median Property Value | $54,600 | $56,000 |
| Median Household Income | $83,750 | $0 |
| Monthly Housing Costs | $333 | $0 |
| Real Estate Taxes | $199 | $0 |
Property Value by Mortgage Status in Myrtlewood
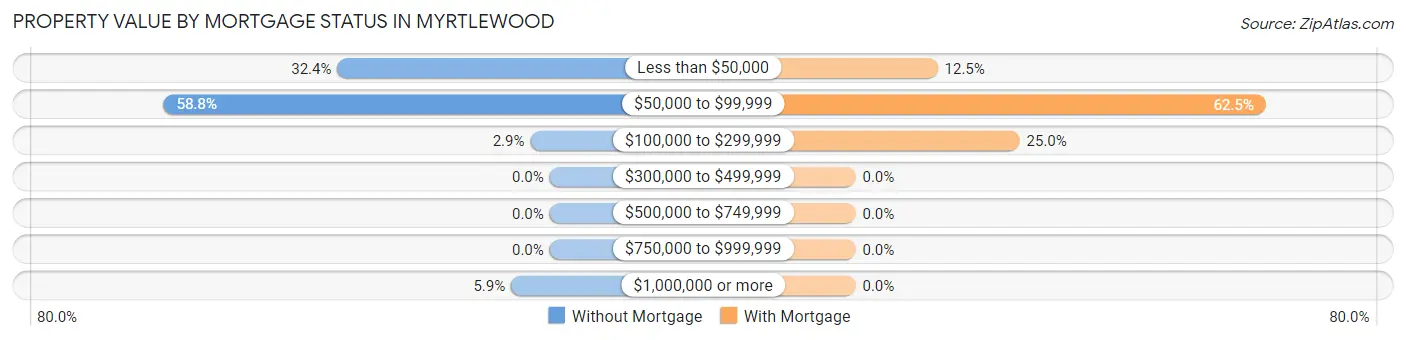
| Property Value | Without Mortgage | With Mortgage |
| Less than $50,000 | 11 (32.4%) | 1 (12.5%) |
| $50,000 to $99,999 | 20 (58.8%) | 5 (62.5%) |
| $100,000 to $299,999 | 1 (2.9%) | 2 (25.0%) |
| $300,000 to $499,999 | 0 (0.0%) | 0 (0.0%) |
| $500,000 to $749,999 | 0 (0.0%) | 0 (0.0%) |
| $750,000 to $999,999 | 0 (0.0%) | 0 (0.0%) |
| $1,000,000 or more | 2 (5.9%) | 0 (0.0%) |
| Total | 34 (100.0%) | 8 (100.0%) |
Household Income by Mortgage Status in Myrtlewood
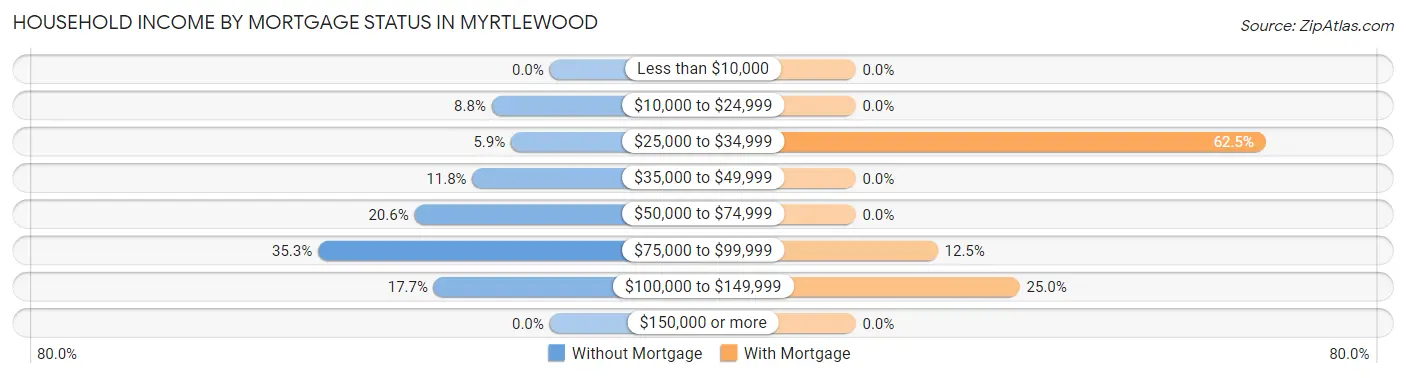
| Household Income | Without Mortgage | With Mortgage |
| Less than $10,000 | 0 (0.0%) | 0 (0.0%) |
| $10,000 to $24,999 | 3 (8.8%) | 0 (0.0%) |
| $25,000 to $34,999 | 2 (5.9%) | 5 (62.5%) |
| $35,000 to $49,999 | 4 (11.8%) | 0 (0.0%) |
| $50,000 to $74,999 | 7 (20.6%) | 0 (0.0%) |
| $75,000 to $99,999 | 12 (35.3%) | 1 (12.5%) |
| $100,000 to $149,999 | 6 (17.6%) | 2 (25.0%) |
| $150,000 or more | 0 (0.0%) | 0 (0.0%) |
| Total | 34 (100.0%) | 8 (100.0%) |
Property Value to Household Income Ratio in Myrtlewood
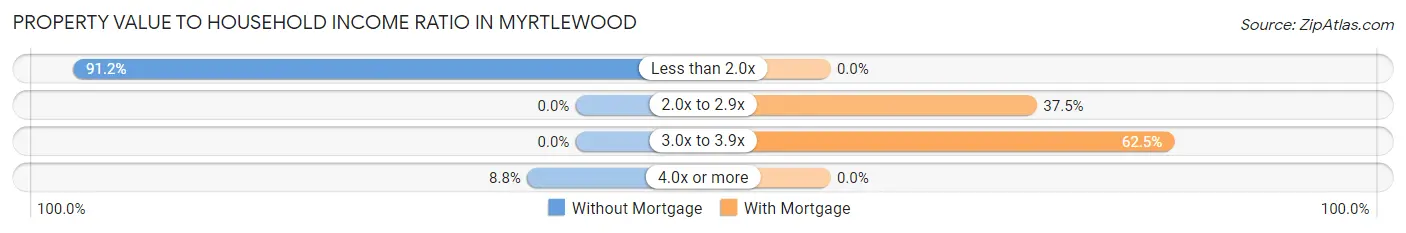
| Value-to-Income Ratio | Without Mortgage | With Mortgage |
| Less than 2.0x | 31 (91.2%) | 0 (0.0%) |
| 2.0x to 2.9x | 0 (0.0%) | 3 (37.5%) |
| 3.0x to 3.9x | 0 (0.0%) | 5 (62.5%) |
| 4.0x or more | 3 (8.8%) | 0 (0.0%) |
| Total | 34 (100.0%) | 8 (100.0%) |
Real Estate Taxes by Mortgage Status in Myrtlewood
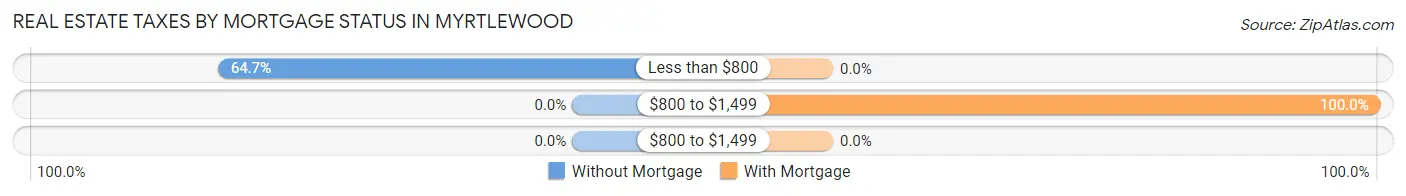
| Property Taxes | Without Mortgage | With Mortgage |
| Less than $800 | 22 (64.7%) | 0 (0.0%) |
| $800 to $1,499 | 0 (0.0%) | 8 (100.0%) |
| $800 to $1,499 | 0 (0.0%) | 0 (0.0%) |
| Total | 34 (100.0%) | 8 (100.0%) |
Health & Disability in Myrtlewood
Health Insurance Coverage by Age in Myrtlewood
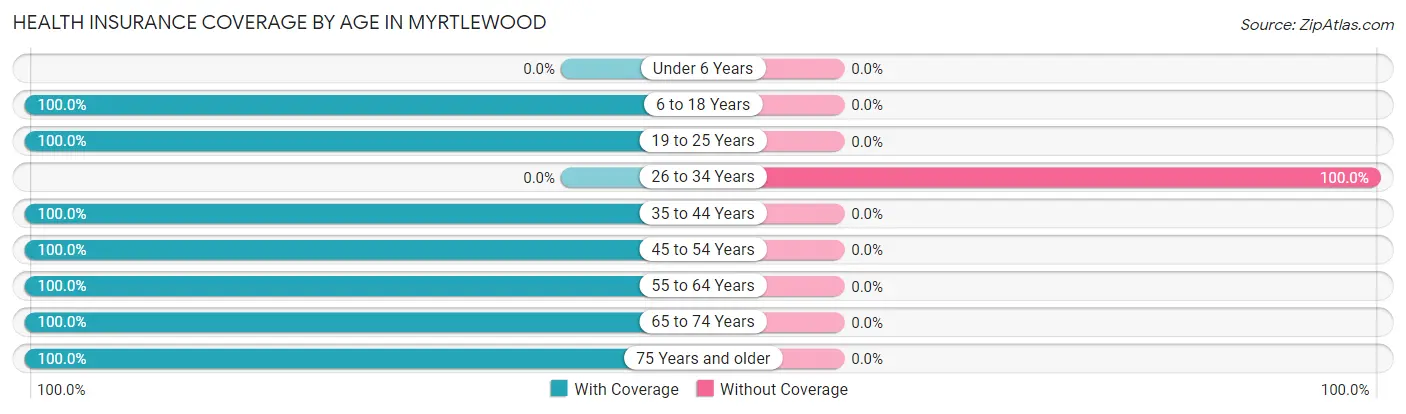
| Age Bracket | With Coverage | Without Coverage |
| Under 6 Years | 0 (0.0%) | 0 (0.0%) |
| 6 to 18 Years | 4 (100.0%) | 0 (0.0%) |
| 19 to 25 Years | 18 (100.0%) | 0 (0.0%) |
| 26 to 34 Years | 0 (0.0%) | 3 (100.0%) |
| 35 to 44 Years | 4 (100.0%) | 0 (0.0%) |
| 45 to 54 Years | 21 (100.0%) | 0 (0.0%) |
| 55 to 64 Years | 41 (100.0%) | 0 (0.0%) |
| 65 to 74 Years | 5 (100.0%) | 0 (0.0%) |
| 75 Years and older | 11 (100.0%) | 0 (0.0%) |
| Total | 104 (97.2%) | 3 (2.8%) |
Health Insurance Coverage by Citizenship Status in Myrtlewood
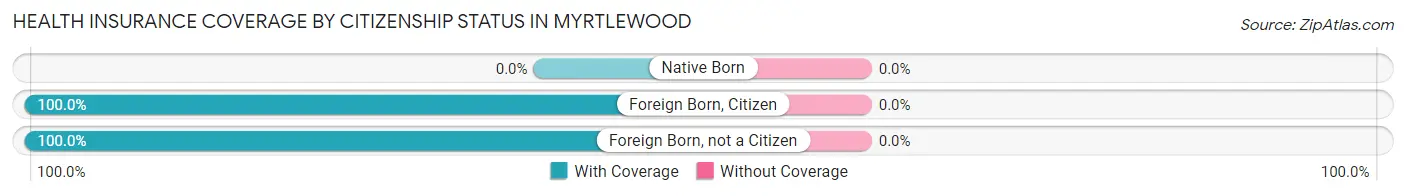
| Citizenship Status | With Coverage | Without Coverage |
| Native Born | 0 (0.0%) | 0 (0.0%) |
| Foreign Born, Citizen | 4 (100.0%) | 0 (0.0%) |
| Foreign Born, not a Citizen | 18 (100.0%) | 0 (0.0%) |
Health Insurance Coverage by Household Income in Myrtlewood
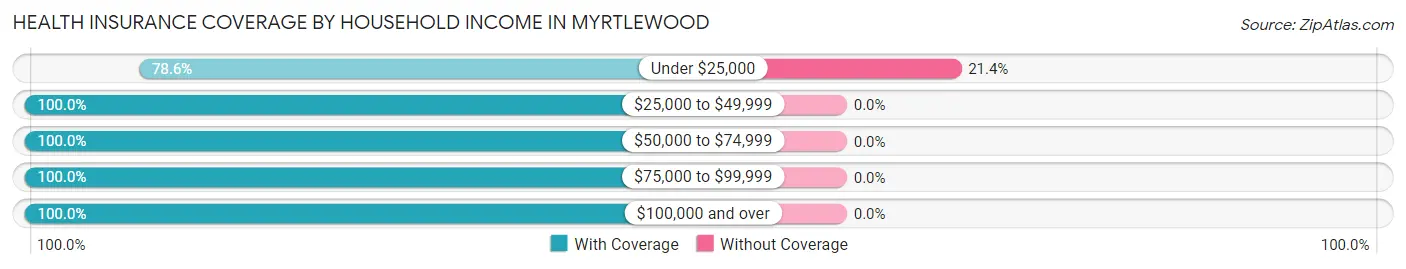
| Household Income | With Coverage | Without Coverage |
| Under $25,000 | 11 (78.6%) | 3 (21.4%) |
| $25,000 to $49,999 | 6 (100.0%) | 0 (0.0%) |
| $50,000 to $74,999 | 14 (100.0%) | 0 (0.0%) |
| $75,000 to $99,999 | 28 (100.0%) | 0 (0.0%) |
| $100,000 and over | 45 (100.0%) | 0 (0.0%) |
Public vs Private Health Insurance Coverage by Age in Myrtlewood
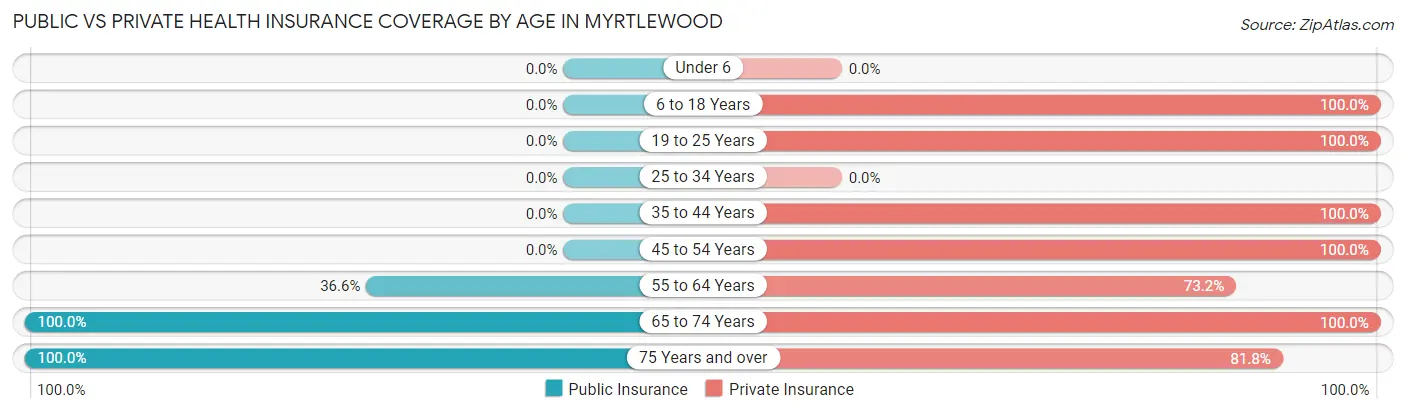
| Age Bracket | Public Insurance | Private Insurance |
| Under 6 | 0 (0.0%) | 0 (0.0%) |
| 6 to 18 Years | 0 (0.0%) | 4 (100.0%) |
| 19 to 25 Years | 0 (0.0%) | 18 (100.0%) |
| 25 to 34 Years | 0 (0.0%) | 0 (0.0%) |
| 35 to 44 Years | 0 (0.0%) | 4 (100.0%) |
| 45 to 54 Years | 0 (0.0%) | 21 (100.0%) |
| 55 to 64 Years | 15 (36.6%) | 30 (73.2%) |
| 65 to 74 Years | 5 (100.0%) | 5 (100.0%) |
| 75 Years and over | 11 (100.0%) | 9 (81.8%) |
| Total | 31 (29.0%) | 91 (85.1%) |
Disability Status by Sex by Age in Myrtlewood
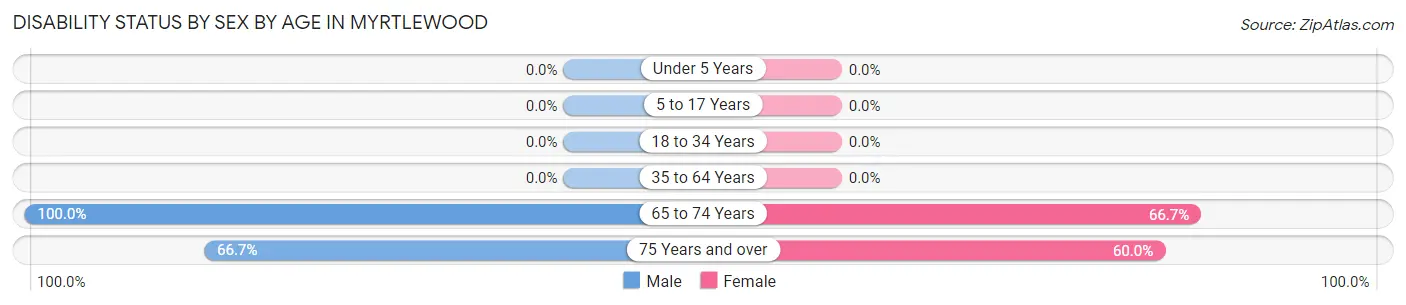
| Age Bracket | Male | Female |
| Under 5 Years | 0 (0.0%) | 0 (0.0%) |
| 5 to 17 Years | 0 (0.0%) | 0 (0.0%) |
| 18 to 34 Years | 0 (0.0%) | 0 (0.0%) |
| 35 to 64 Years | 0 (0.0%) | 0 (0.0%) |
| 65 to 74 Years | 2 (100.0%) | 2 (66.7%) |
| 75 Years and over | 4 (66.7%) | 3 (60.0%) |
Disability Class by Sex by Age in Myrtlewood
Disability Class: Hearing Difficulty
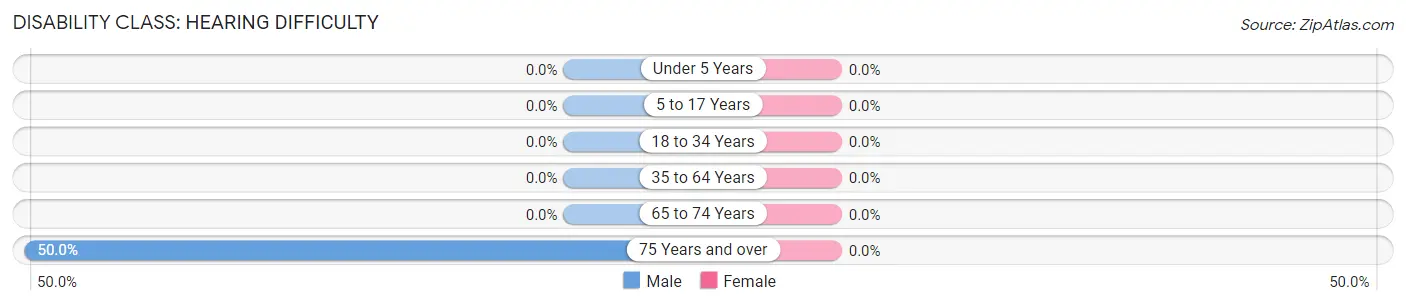
| Age Bracket | Male | Female |
| Under 5 Years | 0 (0.0%) | 0 (0.0%) |
| 5 to 17 Years | 0 (0.0%) | 0 (0.0%) |
| 18 to 34 Years | 0 (0.0%) | 0 (0.0%) |
| 35 to 64 Years | 0 (0.0%) | 0 (0.0%) |
| 65 to 74 Years | 0 (0.0%) | 0 (0.0%) |
| 75 Years and over | 3 (50.0%) | 0 (0.0%) |
Disability Class: Vision Difficulty
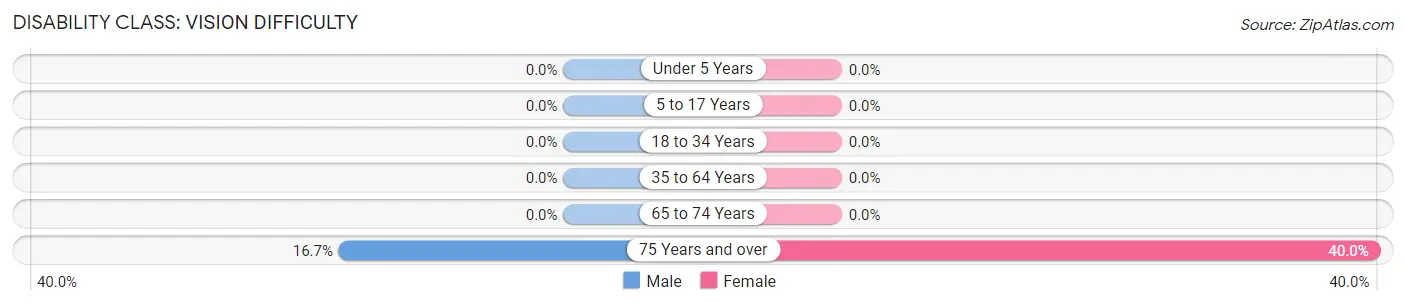
| Age Bracket | Male | Female |
| Under 5 Years | 0 (0.0%) | 0 (0.0%) |
| 5 to 17 Years | 0 (0.0%) | 0 (0.0%) |
| 18 to 34 Years | 0 (0.0%) | 0 (0.0%) |
| 35 to 64 Years | 0 (0.0%) | 0 (0.0%) |
| 65 to 74 Years | 0 (0.0%) | 0 (0.0%) |
| 75 Years and over | 1 (16.7%) | 2 (40.0%) |
Disability Class: Cognitive Difficulty
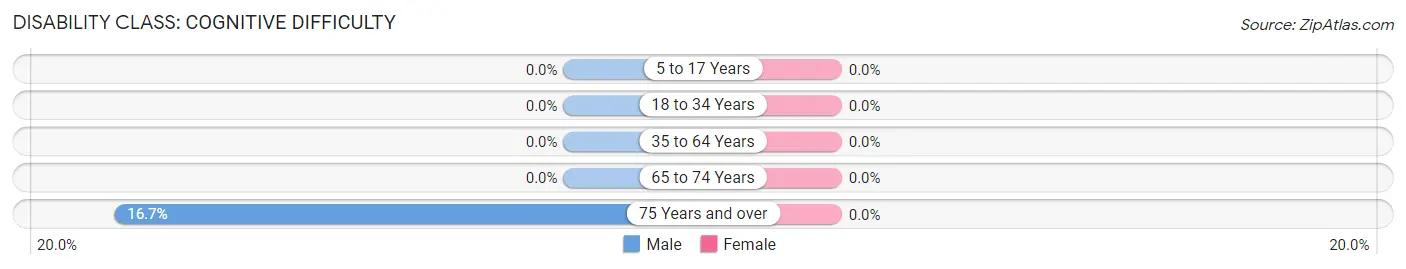
| Age Bracket | Male | Female |
| 5 to 17 Years | 0 (0.0%) | 0 (0.0%) |
| 18 to 34 Years | 0 (0.0%) | 0 (0.0%) |
| 35 to 64 Years | 0 (0.0%) | 0 (0.0%) |
| 65 to 74 Years | 0 (0.0%) | 0 (0.0%) |
| 75 Years and over | 1 (16.7%) | 0 (0.0%) |
Disability Class: Ambulatory Difficulty
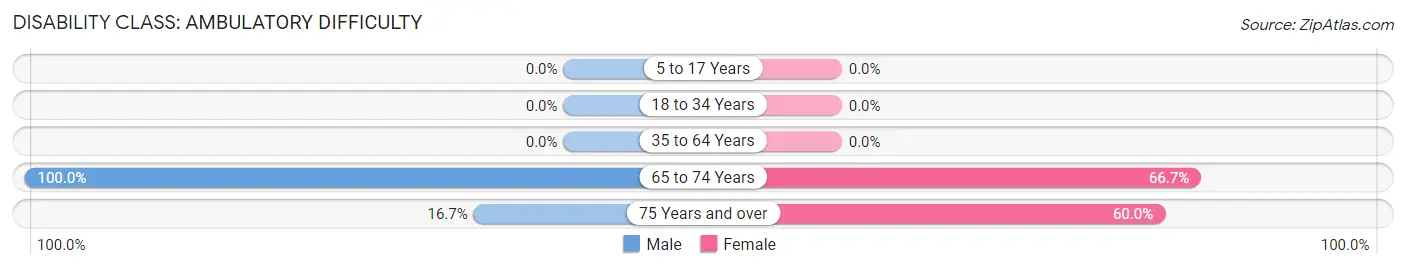
| Age Bracket | Male | Female |
| 5 to 17 Years | 0 (0.0%) | 0 (0.0%) |
| 18 to 34 Years | 0 (0.0%) | 0 (0.0%) |
| 35 to 64 Years | 0 (0.0%) | 0 (0.0%) |
| 65 to 74 Years | 2 (100.0%) | 2 (66.7%) |
| 75 Years and over | 1 (16.7%) | 3 (60.0%) |
Disability Class: Self-Care Difficulty
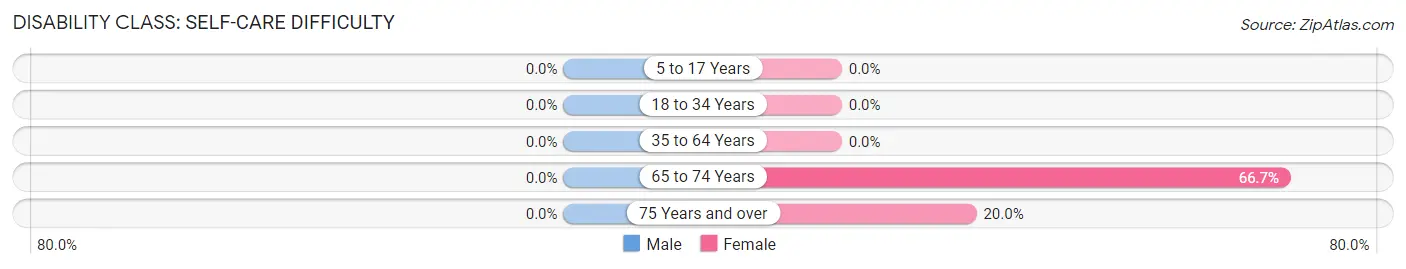
| Age Bracket | Male | Female |
| 5 to 17 Years | 0 (0.0%) | 0 (0.0%) |
| 18 to 34 Years | 0 (0.0%) | 0 (0.0%) |
| 35 to 64 Years | 0 (0.0%) | 0 (0.0%) |
| 65 to 74 Years | 0 (0.0%) | 2 (66.7%) |
| 75 Years and over | 0 (0.0%) | 1 (20.0%) |
Technology Access in Myrtlewood
Computing Device Access in Myrtlewood
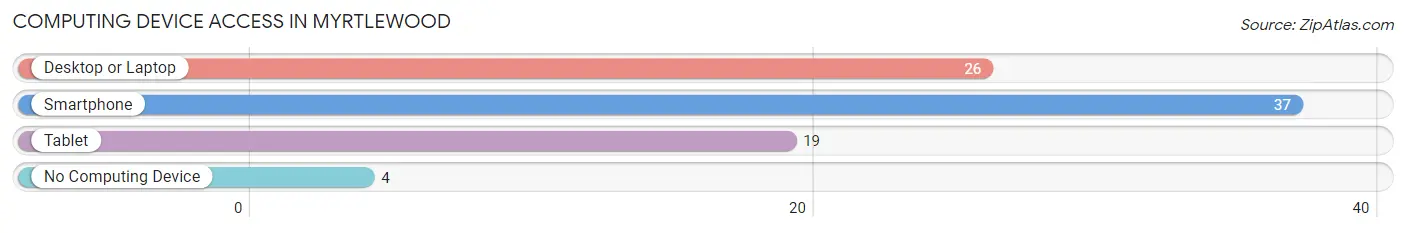
| Device Type | # Households | % Households |
| Desktop or Laptop | 26 | 59.1% |
| Smartphone | 37 | 84.1% |
| Tablet | 19 | 43.2% |
| No Computing Device | 4 | 9.1% |
| Total | 44 | 100.0% |
Internet Access in Myrtlewood
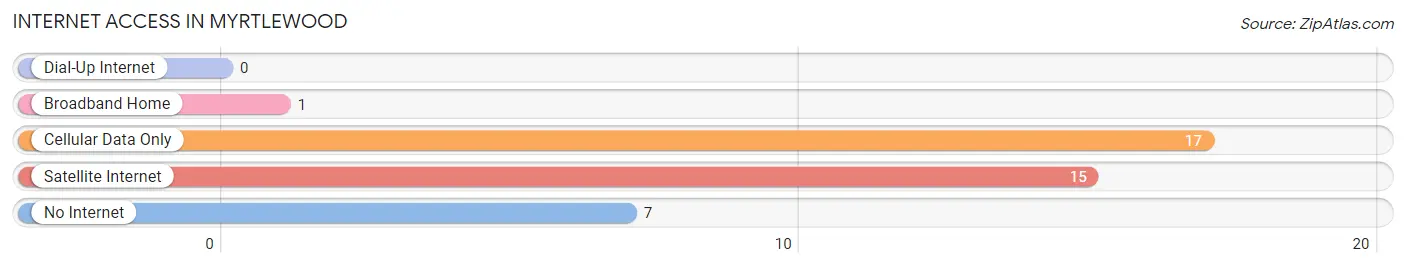
| Internet Type | # Households | % Households |
| Dial-Up Internet | 0 | 0.0% |
| Broadband Home | 1 | 2.3% |
| Cellular Data Only | 17 | 38.6% |
| Satellite Internet | 15 | 34.1% |
| No Internet | 7 | 15.9% |
| Total | 44 | 100.0% |
Myrtlewood Summary
Myrtlewood is a small town located in the northwest corner of Alabama, in the United States. It is situated in the foothills of the Appalachian Mountains, and is part of the Black Belt region of the state. The town has a population of just over 500 people, and is known for its rural charm and friendly atmosphere.
Geography
Myrtlewood is located in the northwest corner of Alabama, in the foothills of the Appalachian Mountains. The town is situated in the Black Belt region of the state, which is characterized by its rich, dark soil. The town is surrounded by rolling hills and lush forests, and is home to a variety of wildlife. The town is located near the Tombigbee River, which provides a source of recreation for the locals.
Economy
Myrtlewood is a small, rural town, and its economy is largely based on agriculture. The town is home to several farms, which produce a variety of crops, including corn, soybeans, cotton, and peanuts. The town also has a few small businesses, including a general store, a gas station, and a few restaurants.
Demographics
Myrtlewood is a small, rural town, and its population is largely composed of white Americans. The town has a population of just over 500 people, and the median age is 44. The town has a median household income of $35,000, and the poverty rate is 15%.
History
Myrtlewood was founded in 1820, and was originally known as “Myrtlewood Station”. The town was named after the myrtle trees that grew in the area. The town was a stop on the Mobile and Ohio Railroad, and was a popular destination for travelers. The town was also home to a number of sawmills, which provided lumber for the surrounding area.
In the late 19th century, the town began to decline, as the railroad was replaced by the automobile. The town was largely forgotten until the 1970s, when it was rediscovered by tourists and outdoor enthusiasts. Today, Myrtlewood is a popular destination for those looking to escape the hustle and bustle of city life.
Conclusion
Myrtlewood is a small, rural town located in the northwest corner of Alabama. The town is situated in the foothills of the Appalachian Mountains, and is part of the Black Belt region of the state. The town has a population of just over 500 people, and is known for its rural charm and friendly atmosphere. The town’s economy is largely based on agriculture, and it is home to several farms, as well as a few small businesses. Myrtlewood is a popular destination for those looking to escape the hustle and bustle of city life.
Common Questions
What is Per Capita Income in Myrtlewood?
Per Capita income in Myrtlewood is $38,408.
What is the Median Family Income in Myrtlewood?
Median Family Income in Myrtlewood is $88,182.
What is the Median Household income in Myrtlewood?
Median Household Income in Myrtlewood is $57,500.
What is Inequality or Gini Index in Myrtlewood?
Inequality or Gini Index in Myrtlewood is 0.30.
What is the Total Population of Myrtlewood?
Total Population of Myrtlewood is 107.
What is the Total Male Population of Myrtlewood?
Total Male Population of Myrtlewood is 64.
What is the Total Female Population of Myrtlewood?
Total Female Population of Myrtlewood is 43.
What is the Ratio of Males per 100 Females in Myrtlewood?
There are 148.84 Males per 100 Females in Myrtlewood.
What is the Ratio of Females per 100 Males in Myrtlewood?
There are 67.19 Females per 100 Males in Myrtlewood.
What is the Median Population Age in Myrtlewood?
Median Population Age in Myrtlewood is 55.6 Years.
What is the Average Family Size in Myrtlewood
Average Family Size in Myrtlewood is 3.2 People.
What is the Average Household Size in Myrtlewood
Average Household Size in Myrtlewood is 2.4 People.
How Large is the Labor Force in Myrtlewood?
There are 65 People in the Labor Forcein in Myrtlewood.
What is the Percentage of People in the Labor Force in Myrtlewood?
63.1% of People are in the Labor Force in Myrtlewood.
What is the Unemployment Rate in Myrtlewood?
Unemployment Rate in Myrtlewood is 4.6%.