Mulga, AL Map & Demographics
Mulga Map
Mulga Overview
$26,388
PER CAPITA INCOME
$47,500
AVG FAMILY INCOME
$37,692
AVG HOUSEHOLD INCOME
3.3%
WAGE / INCOME GAP [ % ]
96.7¢/ $1
WAGE / INCOME GAP [ $ ]
0.49
INEQUALITY / GINI INDEX
720
TOTAL POPULATION
400
MALE POPULATION
320
FEMALE POPULATION
125.00
MALES / 100 FEMALES
80.00
FEMALES / 100 MALES
47.6
MEDIAN AGE
2.6
AVG FAMILY SIZE
2.2
AVG HOUSEHOLD SIZE
336
LABOR FORCE [ PEOPLE ]
52.9%
PERCENT IN LABOR FORCE
2.7%
UNEMPLOYMENT RATE
Mulga Zip Codes
Mulga Area Codes
Income in Mulga
Income Overview in Mulga
Per Capita Income in Mulga is $26,388, while median incomes of families and households are $47,500 and $37,692 respectively.
| Characteristic | Number | Measure |
| Per Capita Income | 720 | $26,388 |
| Median Family Income | 210 | $47,500 |
| Mean Family Income | 210 | $69,556 |
| Median Household Income | 330 | $37,692 |
| Mean Household Income | 330 | $55,903 |
| Income Deficit | 210 | $0 |
| Wage / Income Gap (%) | 720 | 3.28% |
| Wage / Income Gap ($) | 720 | 96.72¢ per $1 |
| Gini / Inequality Index | 720 | 0.49 |
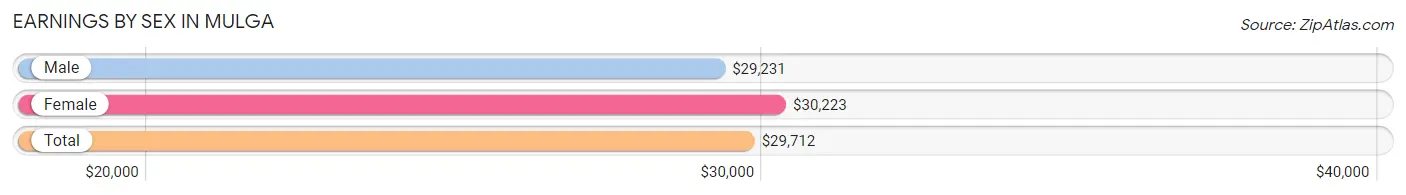
Earnings by Sex in Mulga
Average Earnings in Mulga are $29,712, $29,231 for men and $30,223 for women, a difference of 3.3%.
| Sex | Number | Average Earnings |
| Male | 206 (60.8%) | $29,231 |
| Female | 133 (39.2%) | $30,223 |
| Total | 339 (100.0%) | $29,712 |
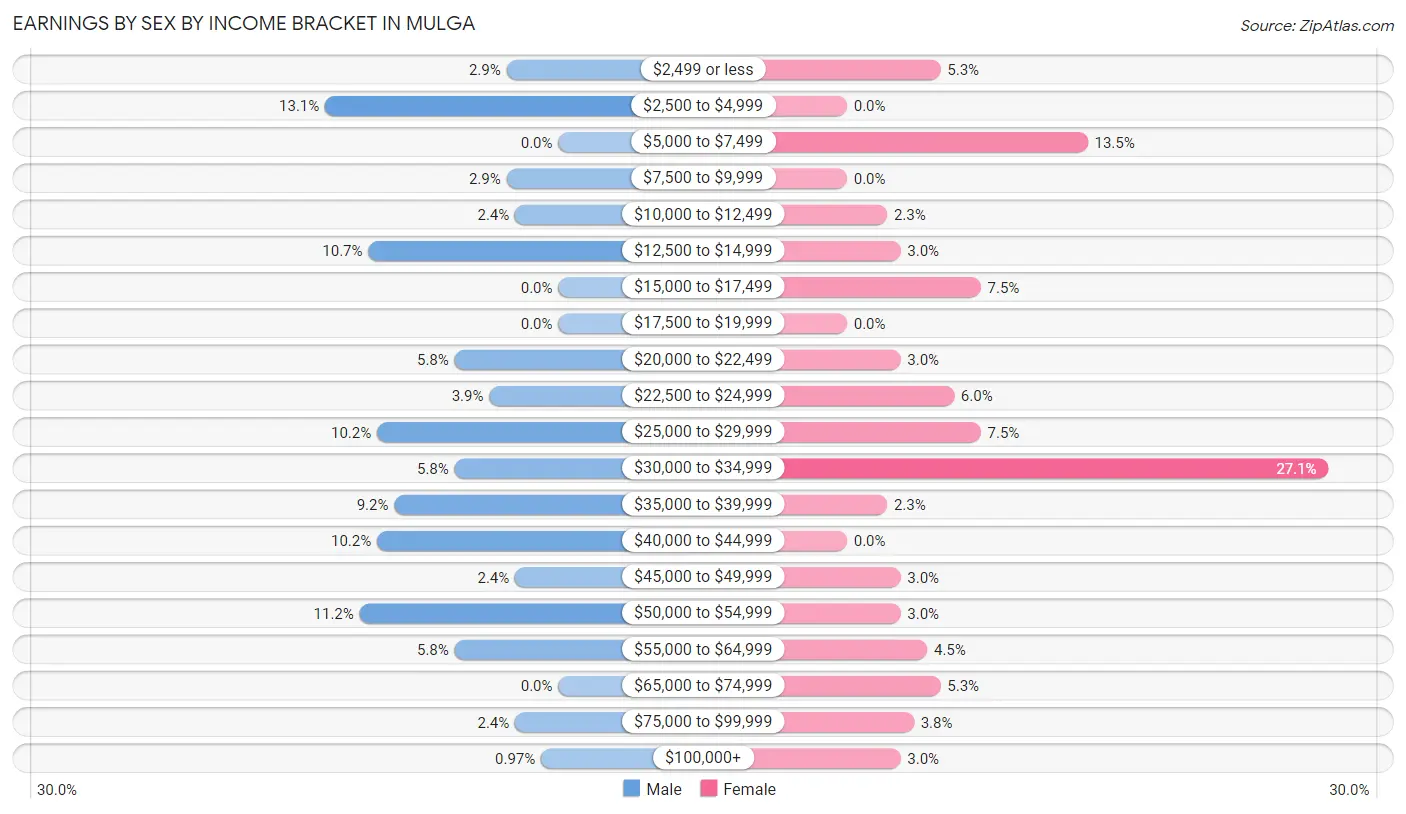
Earnings by Sex by Income Bracket in Mulga
The most common earnings brackets in Mulga are $2,500 to $4,999 for men (27 | 13.1%) and $30,000 to $34,999 for women (36 | 27.1%).
| Income | Male | Female |
| $2,499 or less | 6 (2.9%) | 7 (5.3%) |
| $2,500 to $4,999 | 27 (13.1%) | 0 (0.0%) |
| $5,000 to $7,499 | 0 (0.0%) | 18 (13.5%) |
| $7,500 to $9,999 | 6 (2.9%) | 0 (0.0%) |
| $10,000 to $12,499 | 5 (2.4%) | 3 (2.3%) |
| $12,500 to $14,999 | 22 (10.7%) | 4 (3.0%) |
| $15,000 to $17,499 | 0 (0.0%) | 10 (7.5%) |
| $17,500 to $19,999 | 0 (0.0%) | 0 (0.0%) |
| $20,000 to $22,499 | 12 (5.8%) | 4 (3.0%) |
| $22,500 to $24,999 | 8 (3.9%) | 8 (6.0%) |
| $25,000 to $29,999 | 21 (10.2%) | 10 (7.5%) |
| $30,000 to $34,999 | 12 (5.8%) | 36 (27.1%) |
| $35,000 to $39,999 | 19 (9.2%) | 3 (2.3%) |
| $40,000 to $44,999 | 21 (10.2%) | 0 (0.0%) |
| $45,000 to $49,999 | 5 (2.4%) | 4 (3.0%) |
| $50,000 to $54,999 | 23 (11.2%) | 4 (3.0%) |
| $55,000 to $64,999 | 12 (5.8%) | 6 (4.5%) |
| $65,000 to $74,999 | 0 (0.0%) | 7 (5.3%) |
| $75,000 to $99,999 | 5 (2.4%) | 5 (3.8%) |
| $100,000+ | 2 (1.0%) | 4 (3.0%) |
| Total | 206 (100.0%) | 133 (100.0%) |
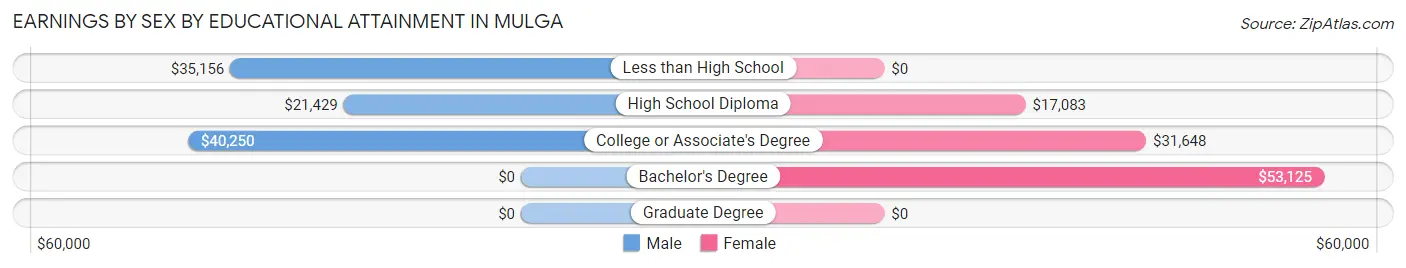
Earnings by Sex by Educational Attainment in Mulga
Average earnings in Mulga are $29,038 for men and $30,580 for women, a difference of 5.0%. Men with an educational attainment of college or associate's degree enjoy the highest average annual earnings of $40,250, while those with high school diploma education earn the least with $21,429. Women with an educational attainment of bachelor's degree earn the most with the average annual earnings of $53,125, while those with high school diploma education have the smallest earnings of $17,083.
| Educational Attainment | Male Income | Female Income |
| Less than High School | $35,156 | $0 |
| High School Diploma | $21,429 | $17,083 |
| College or Associate's Degree | $40,250 | $31,648 |
| Bachelor's Degree | - | - |
| Graduate Degree | - | - |
| Total | $29,038 | $30,580 |
Family Income in Mulga
Family Income Brackets in Mulga
According to the Mulga family income data, there are 63 families falling into the $50,000 to $74,999 income range, which is the most common income bracket and makes up 30.0% of all families.
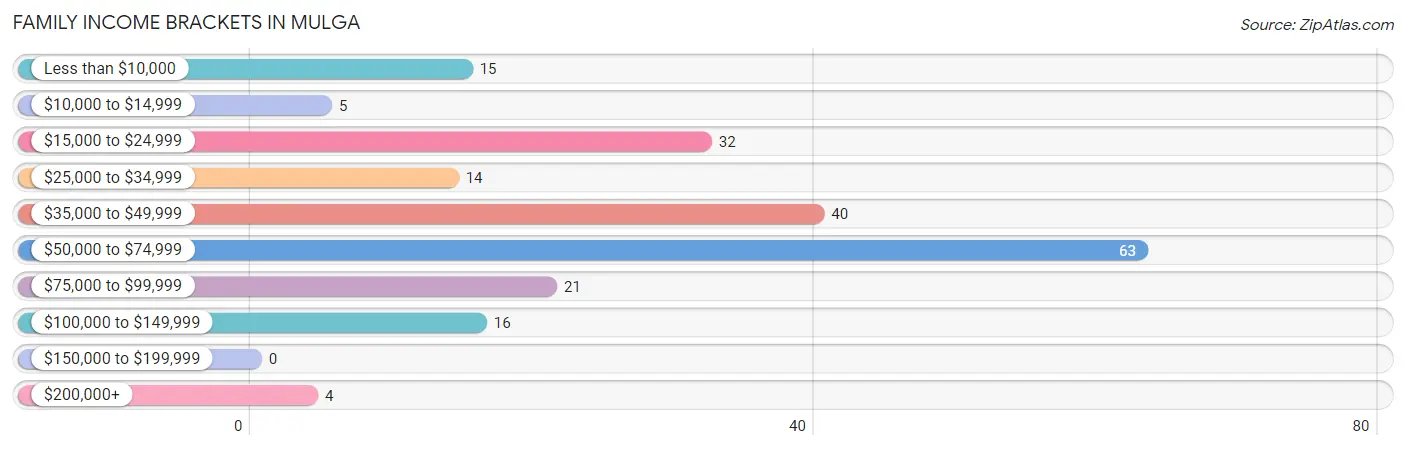
| Income Bracket | # Families | % Families |
| Less than $10,000 | 15 | 7.1% |
| $10,000 to $14,999 | 5 | 2.4% |
| $15,000 to $24,999 | 32 | 15.2% |
| $25,000 to $34,999 | 14 | 6.7% |
| $35,000 to $49,999 | 40 | 19.0% |
| $50,000 to $74,999 | 63 | 30.0% |
| $75,000 to $99,999 | 21 | 10.0% |
| $100,000 to $149,999 | 16 | 7.6% |
| $150,000 to $199,999 | 0 | 0.0% |
| $200,000+ | 4 | 1.9% |
Family Income by Famaliy Size in Mulga
3-person families (42 | 20.0%) account for the highest median family income in Mulga with $52,222 per family, while 2-person families (134 | 63.8%) have the highest median income of $21,250 per family member.
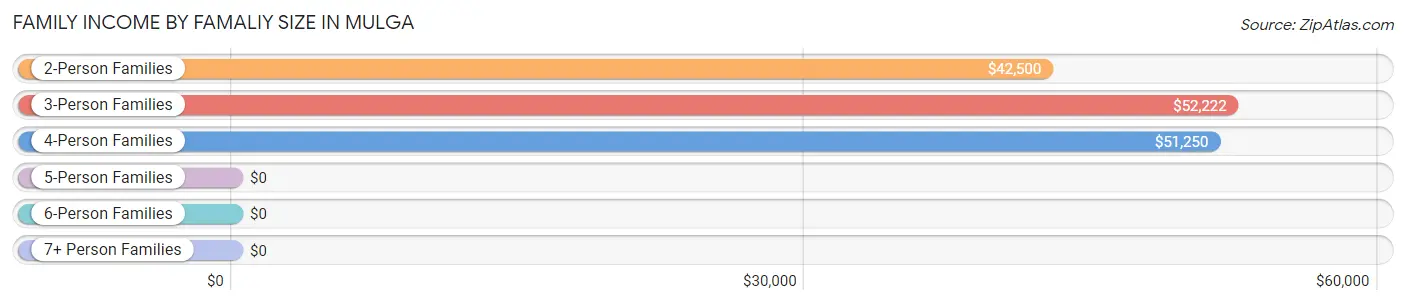
| Income Bracket | # Families | Median Income |
| 2-Person Families | 134 (63.8%) | $42,500 |
| 3-Person Families | 42 (20.0%) | $52,222 |
| 4-Person Families | 27 (12.9%) | $51,250 |
| 5-Person Families | 5 (2.4%) | $0 |
| 6-Person Families | 2 (0.9%) | $0 |
| 7+ Person Families | 0 (0.0%) | $0 |
| Total | 210 (100.0%) | $47,500 |
Family Income by Number of Earners in Mulga
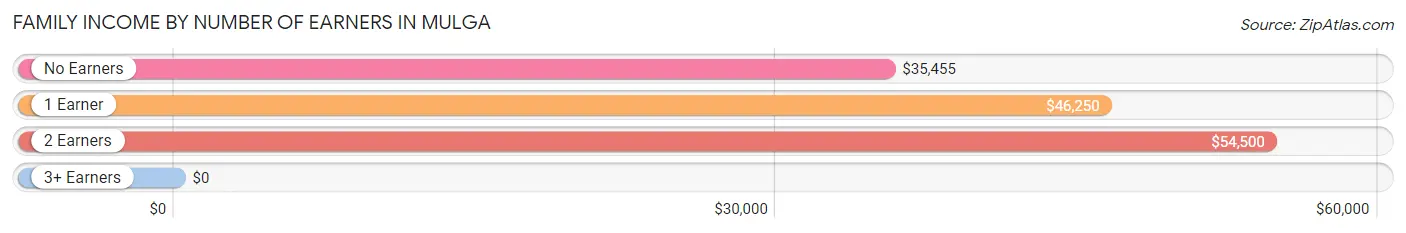
| Number of Earners | # Families | Median Income |
| No Earners | 54 (25.7%) | $35,455 |
| 1 Earner | 82 (39.1%) | $46,250 |
| 2 Earners | 70 (33.3%) | $54,500 |
| 3+ Earners | 4 (1.9%) | $0 |
| Total | 210 (100.0%) | $47,500 |
Household Income in Mulga
Household Income Brackets in Mulga
With 74 households falling in the category, the $50,000 to $74,999 income range is the most frequent in Mulga, accounting for 22.4% of all households.
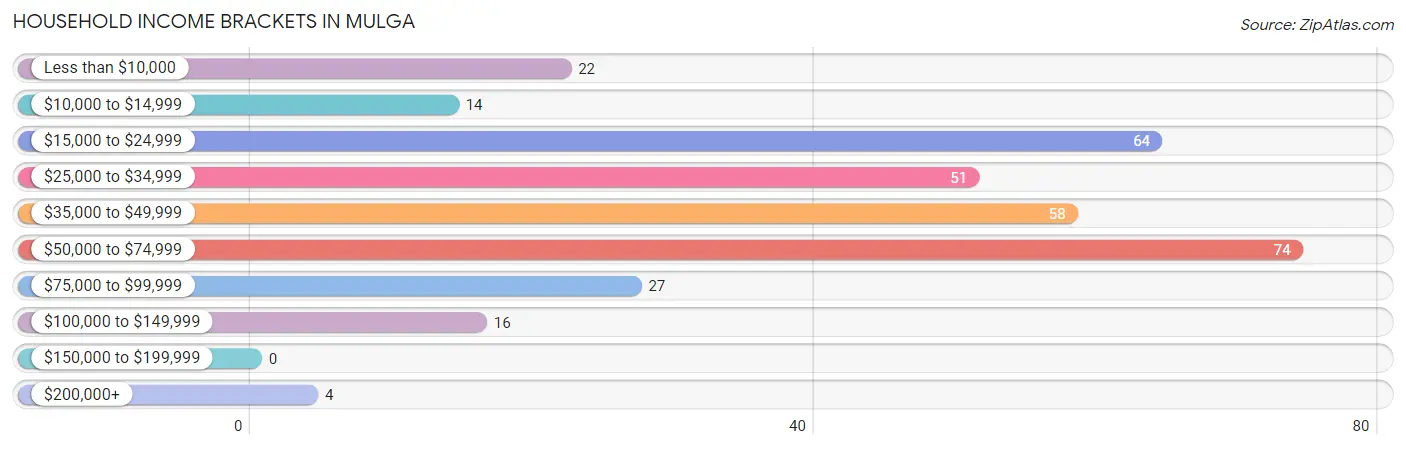
| Income Bracket | # Households | % Households |
| Less than $10,000 | 22 | 6.7% |
| $10,000 to $14,999 | 14 | 4.2% |
| $15,000 to $24,999 | 64 | 19.4% |
| $25,000 to $34,999 | 51 | 15.5% |
| $35,000 to $49,999 | 58 | 17.6% |
| $50,000 to $74,999 | 74 | 22.4% |
| $75,000 to $99,999 | 27 | 8.2% |
| $100,000 to $149,999 | 16 | 4.8% |
| $150,000 to $199,999 | 0 | 0.0% |
| $200,000+ | 4 | 1.2% |
Household Income by Householder Age in Mulga
The median household income in Mulga is $37,692, with the highest median household income of $43,125 found in the 15 to 24 years age bracket for the primary householder. A total of 21 households (6.4%) fall into this category. Meanwhile, the 25 to 44 years age bracket for the primary householder has the lowest median household income of $0, with 82 households (24.8%) in this group.
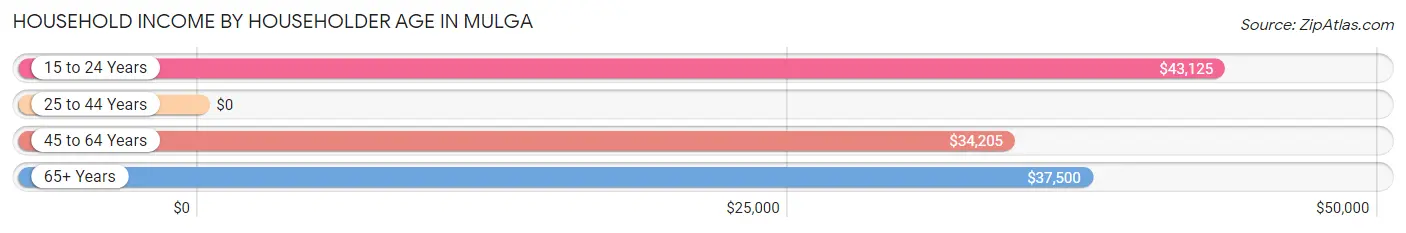
| Income Bracket | # Households | Median Income |
| 15 to 24 Years | 21 (6.4%) | $43,125 |
| 25 to 44 Years | 82 (24.8%) | $0 |
| 45 to 64 Years | 133 (40.3%) | $34,205 |
| 65+ Years | 94 (28.5%) | $37,500 |
| Total | 330 (100.0%) | $37,692 |
Poverty in Mulga
Income Below Poverty by Sex and Age in Mulga
With 23.4% poverty level for males and 25.6% for females among the residents of Mulga, 6 to 11 year old males and 5 year old females are the most vulnerable to poverty, with 4 males (50.0%) and 7 females (77.8%) in their respective age groups living below the poverty level.
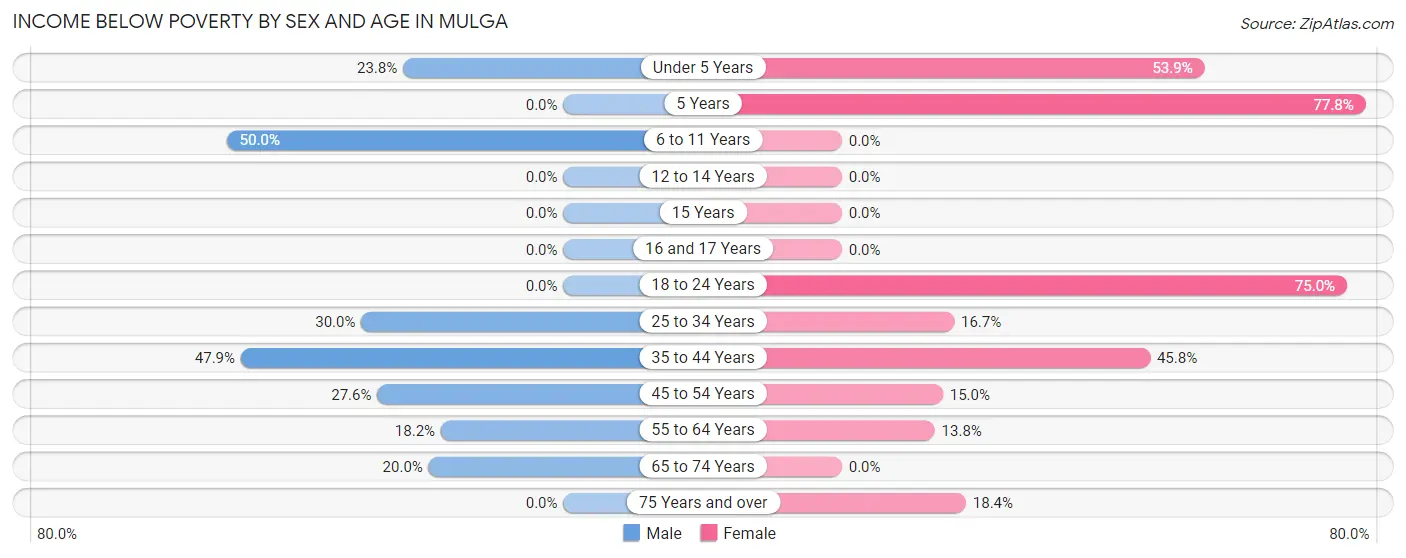
| Age Bracket | Male | Female |
| Under 5 Years | 5 (23.8%) | 7 (53.8%) |
| 5 Years | 0 (0.0%) | 7 (77.8%) |
| 6 to 11 Years | 4 (50.0%) | 0 (0.0%) |
| 12 to 14 Years | 0 (0.0%) | 0 (0.0%) |
| 15 Years | 0 (0.0%) | 0 (0.0%) |
| 16 and 17 Years | 0 (0.0%) | 0 (0.0%) |
| 18 to 24 Years | 0 (0.0%) | 15 (75.0%) |
| 25 to 34 Years | 9 (30.0%) | 4 (16.7%) |
| 35 to 44 Years | 34 (47.9%) | 27 (45.8%) |
| 45 to 54 Years | 21 (27.6%) | 3 (15.0%) |
| 55 to 64 Years | 10 (18.2%) | 12 (13.8%) |
| 65 to 74 Years | 10 (20.0%) | 0 (0.0%) |
| 75 Years and over | 0 (0.0%) | 7 (18.4%) |
| Total | 93 (23.4%) | 82 (25.6%) |
Income Above Poverty by Sex and Age in Mulga
According to the poverty statistics in Mulga, males aged 5 years and females aged 6 to 11 years are the age groups that are most secure financially, with 100.0% of males and 100.0% of females in these age groups living above the poverty line.
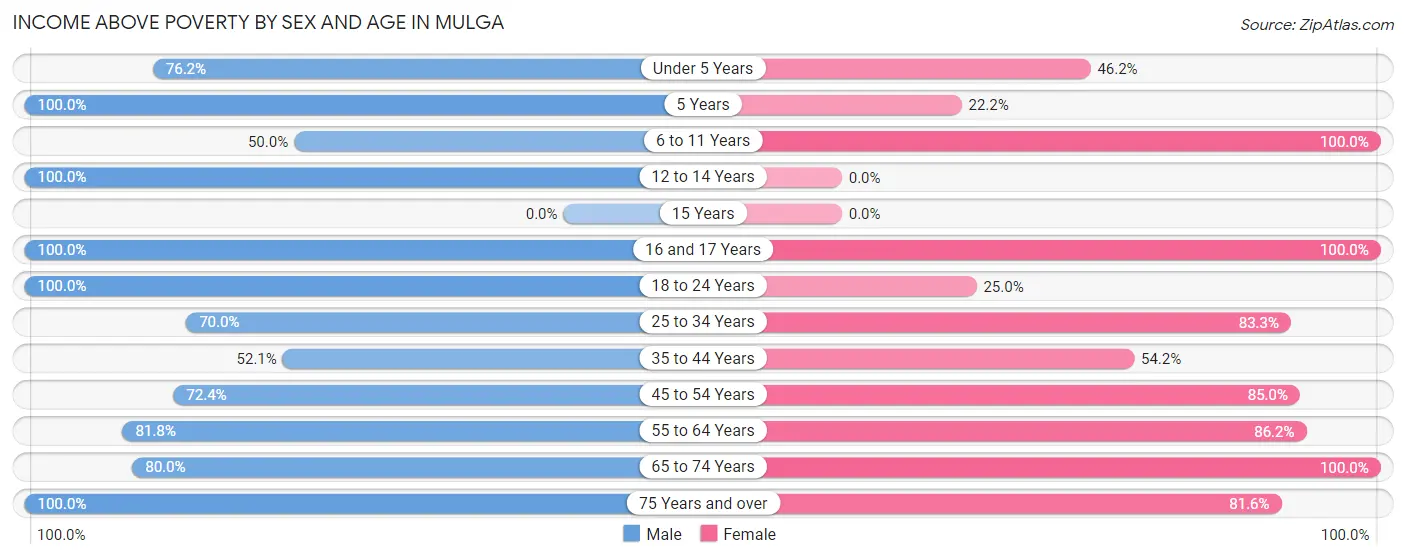
| Age Bracket | Male | Female |
| Under 5 Years | 16 (76.2%) | 6 (46.2%) |
| 5 Years | 3 (100.0%) | 2 (22.2%) |
| 6 to 11 Years | 4 (50.0%) | 6 (100.0%) |
| 12 to 14 Years | 23 (100.0%) | 0 (0.0%) |
| 15 Years | 0 (0.0%) | 0 (0.0%) |
| 16 and 17 Years | 5 (100.0%) | 3 (100.0%) |
| 18 to 24 Years | 41 (100.0%) | 5 (25.0%) |
| 25 to 34 Years | 21 (70.0%) | 20 (83.3%) |
| 35 to 44 Years | 37 (52.1%) | 32 (54.2%) |
| 45 to 54 Years | 55 (72.4%) | 17 (85.0%) |
| 55 to 64 Years | 45 (81.8%) | 75 (86.2%) |
| 65 to 74 Years | 40 (80.0%) | 41 (100.0%) |
| 75 Years and over | 15 (100.0%) | 31 (81.6%) |
| Total | 305 (76.6%) | 238 (74.4%) |
Income Below Poverty Among Married-Couple Families in Mulga
The poverty statistics for married-couple families in Mulga show that 19.6% or 26 of the total 133 families live below the poverty line. Families with 1 or 2 children have the highest poverty rate of 26.1%, comprising of 6 families. On the other hand, families with 3 or 4 children have the lowest poverty rate of 0.0%, which includes 0 families.
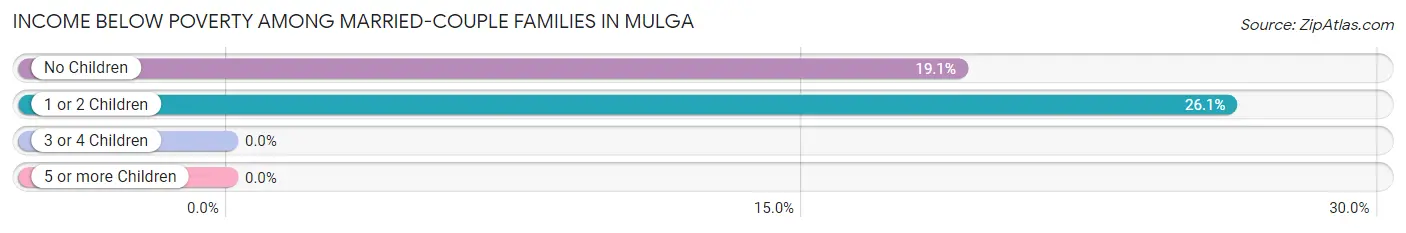
| Children | Above Poverty | Below Poverty |
| No Children | 85 (80.9%) | 20 (19.1%) |
| 1 or 2 Children | 17 (73.9%) | 6 (26.1%) |
| 3 or 4 Children | 5 (100.0%) | 0 (0.0%) |
| 5 or more Children | 0 (0.0%) | 0 (0.0%) |
| Total | 107 (80.4%) | 26 (19.6%) |
Income Below Poverty Among Single-Parent Households in Mulga
According to the poverty data in Mulga, 27.5% or 11 single-father households and 21.6% or 8 single-mother households are living below the poverty line. Among single-father households, those with no children have the highest poverty rate, with 11 households (52.4%) experiencing poverty. Likewise, among single-mother households, those with 1 or 2 children have the highest poverty rate, with 7 households (63.6%) falling below the poverty line.
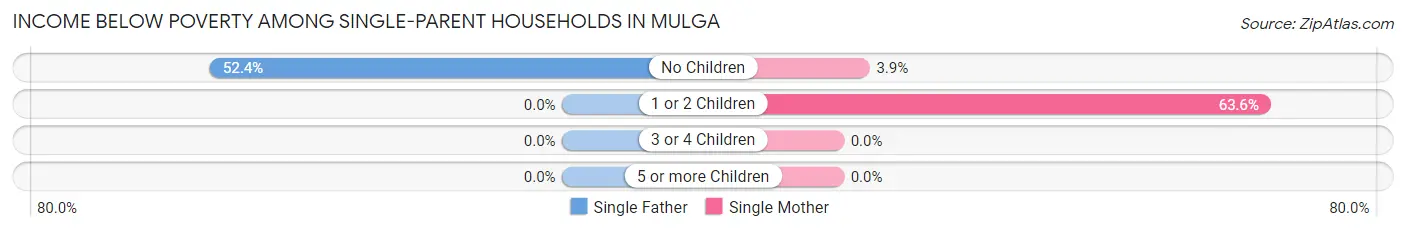
| Children | Single Father | Single Mother |
| No Children | 11 (52.4%) | 1 (3.8%) |
| 1 or 2 Children | 0 (0.0%) | 7 (63.6%) |
| 3 or 4 Children | 0 (0.0%) | 0 (0.0%) |
| 5 or more Children | 0 (0.0%) | 0 (0.0%) |
| Total | 11 (27.5%) | 8 (21.6%) |
Income Below Poverty Among Married-Couple vs Single-Parent Households in Mulga
The poverty data for Mulga shows that 26 of the married-couple family households (19.6%) and 19 of the single-parent households (24.7%) are living below the poverty level. Within the married-couple family households, those with 1 or 2 children have the highest poverty rate, with 6 households (26.1%) falling below the poverty line. Among the single-parent households, those with no children have the highest poverty rate, with 12 household (25.5%) living below poverty.
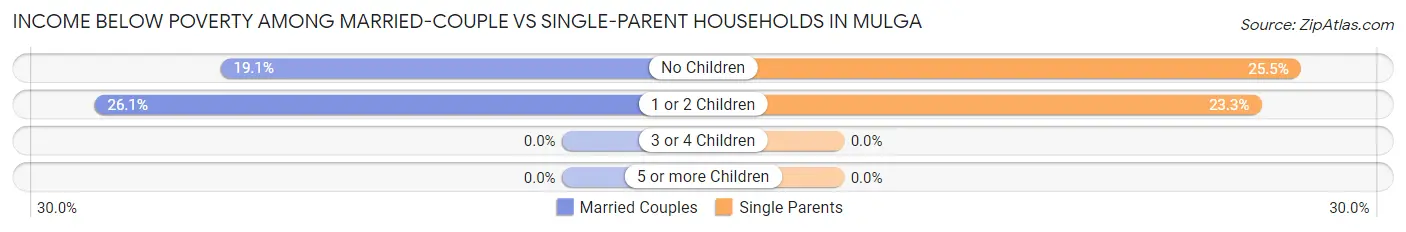
| Children | Married-Couple Families | Single-Parent Households |
| No Children | 20 (19.1%) | 12 (25.5%) |
| 1 or 2 Children | 6 (26.1%) | 7 (23.3%) |
| 3 or 4 Children | 0 (0.0%) | 0 (0.0%) |
| 5 or more Children | 0 (0.0%) | 0 (0.0%) |
| Total | 26 (19.6%) | 19 (24.7%) |
Race in Mulga
The most populous races in Mulga are White / Caucasian (538 | 74.7%), Black / African American (158 | 21.9%), and Two or more Races (24 | 3.3%).
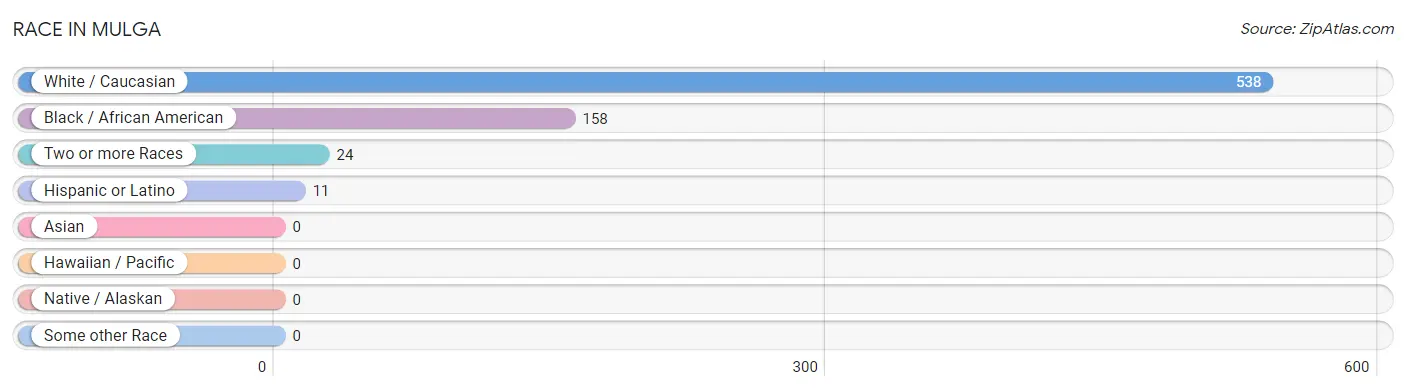
| Race | # Population | % Population |
| Asian | 0 | 0.0% |
| Black / African American | 158 | 21.9% |
| Hawaiian / Pacific | 0 | 0.0% |
| Hispanic or Latino | 11 | 1.5% |
| Native / Alaskan | 0 | 0.0% |
| White / Caucasian | 538 | 74.7% |
| Two or more Races | 24 | 3.3% |
| Some other Race | 0 | 0.0% |
| Total | 720 | 100.0% |
Ancestry in Mulga
The most populous ancestries reported in Mulga are American (76 | 10.6%), Irish (59 | 8.2%), English (55 | 7.6%), European (31 | 4.3%), and German (24 | 3.3%), together accounting for 34.0% of all Mulga residents.
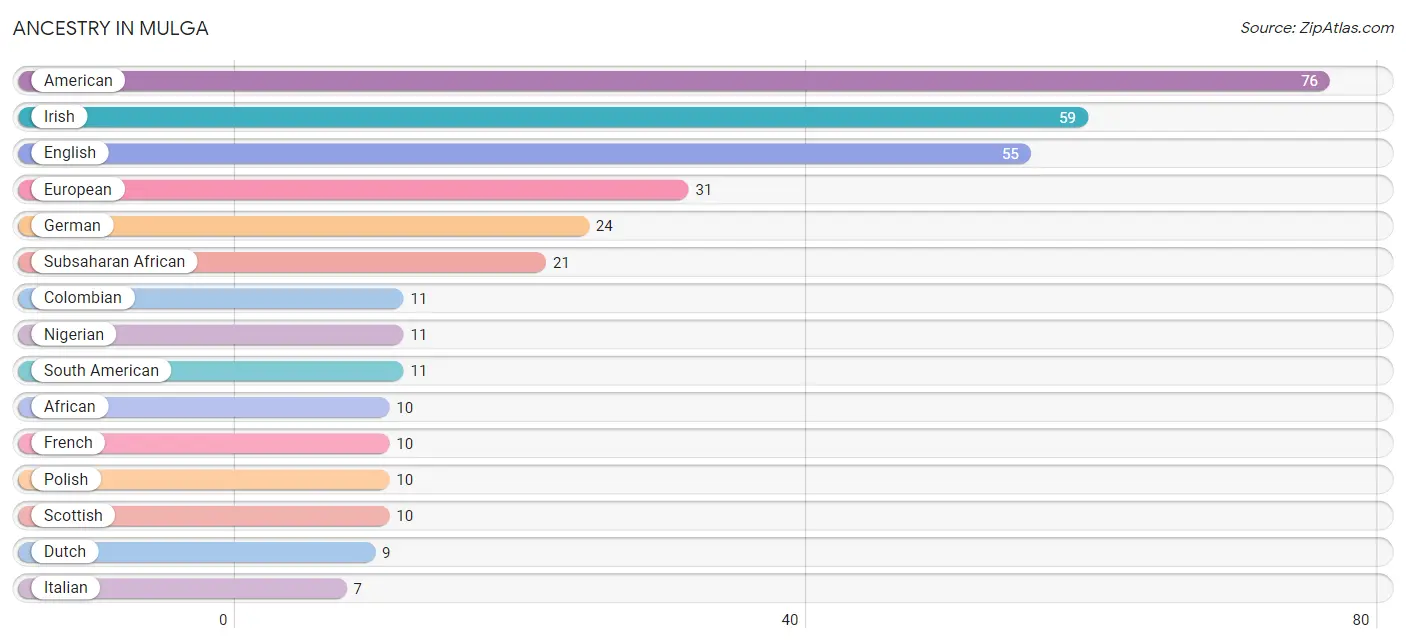
| Ancestry | # Population | % Population |
| African | 10 | 1.4% |
| American | 76 | 10.6% |
| Bhutanese | 4 | 0.6% |
| Cherokee | 1 | 0.1% |
| Colombian | 11 | 1.5% |
| Dutch | 9 | 1.3% |
| English | 55 | 7.6% |
| European | 31 | 4.3% |
| French | 10 | 1.4% |
| German | 24 | 3.3% |
| Irish | 59 | 8.2% |
| Italian | 7 | 1.0% |
| Nigerian | 11 | 1.5% |
| Polish | 10 | 1.4% |
| Scandinavian | 3 | 0.4% |
| Scottish | 10 | 1.4% |
| South American | 11 | 1.5% |
| Subsaharan African | 21 | 2.9% |
| Swedish | 2 | 0.3% | View All 19 Rows |
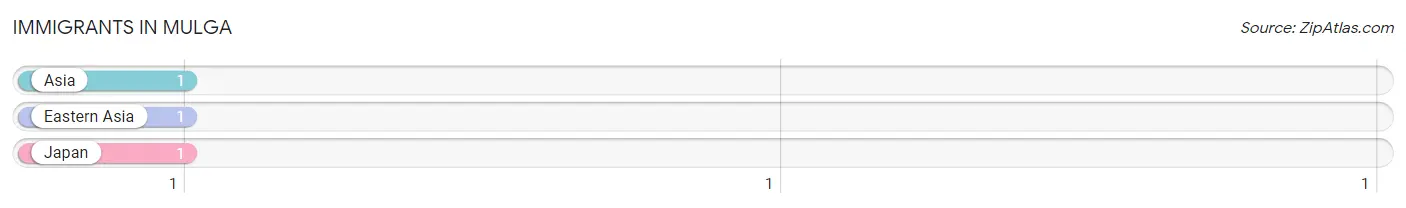
Immigrants in Mulga
The most numerous immigrant groups reported in Mulga came from Asia (1 | 0.1%), Eastern Asia (1 | 0.1%), and Japan (1 | 0.1%), together accounting for 0.4% of all Mulga residents.
| Immigration Origin | # Population | % Population |
| Asia | 1 | 0.1% |
| Eastern Asia | 1 | 0.1% |
| Japan | 1 | 0.1% | View All 3 Rows |
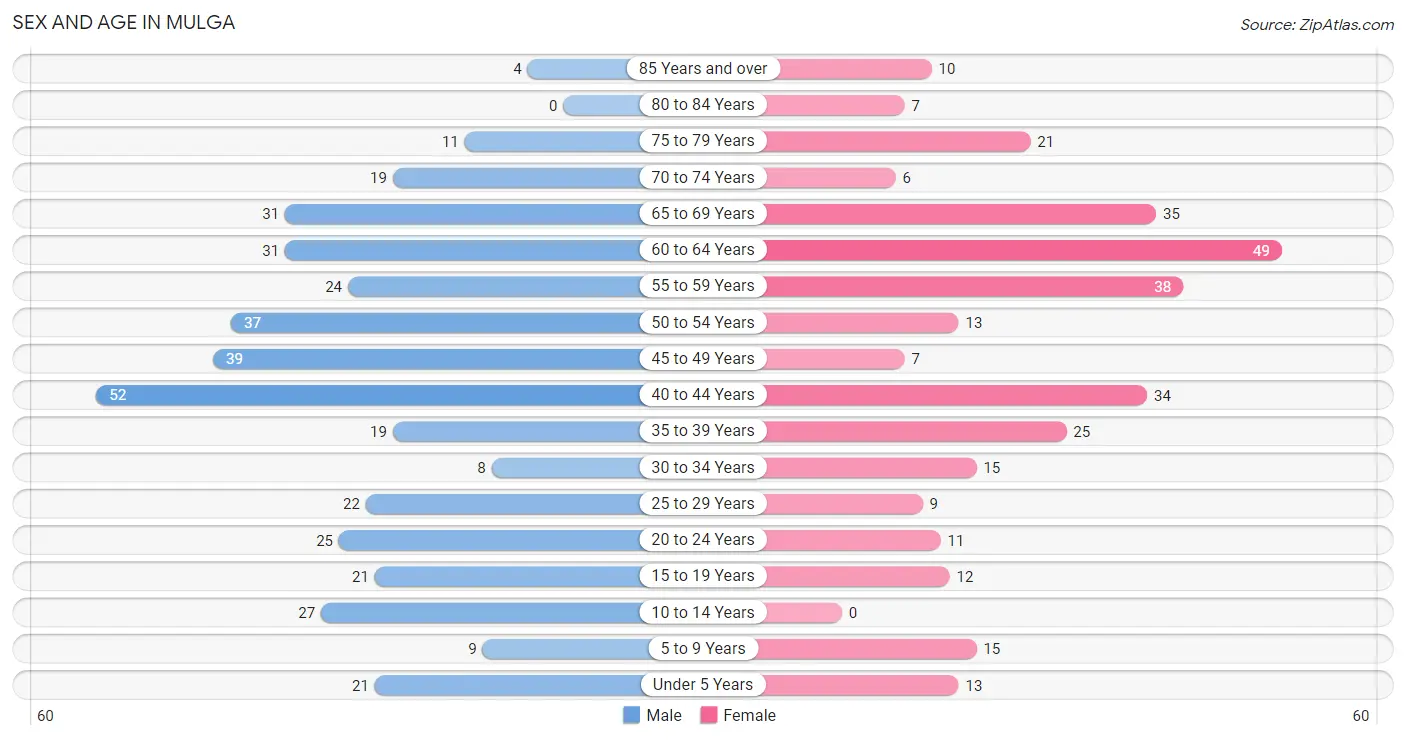
Sex and Age in Mulga
Sex and Age in Mulga
The most populous age groups in Mulga are 40 to 44 Years (52 | 13.0%) for men and 60 to 64 Years (49 | 15.3%) for women.
| Age Bracket | Male | Female |
| Under 5 Years | 21 (5.2%) | 13 (4.1%) |
| 5 to 9 Years | 9 (2.2%) | 15 (4.7%) |
| 10 to 14 Years | 27 (6.8%) | 0 (0.0%) |
| 15 to 19 Years | 21 (5.2%) | 12 (3.7%) |
| 20 to 24 Years | 25 (6.2%) | 11 (3.4%) |
| 25 to 29 Years | 22 (5.5%) | 9 (2.8%) |
| 30 to 34 Years | 8 (2.0%) | 15 (4.7%) |
| 35 to 39 Years | 19 (4.8%) | 25 (7.8%) |
| 40 to 44 Years | 52 (13.0%) | 34 (10.6%) |
| 45 to 49 Years | 39 (9.8%) | 7 (2.2%) |
| 50 to 54 Years | 37 (9.2%) | 13 (4.1%) |
| 55 to 59 Years | 24 (6.0%) | 38 (11.9%) |
| 60 to 64 Years | 31 (7.7%) | 49 (15.3%) |
| 65 to 69 Years | 31 (7.7%) | 35 (10.9%) |
| 70 to 74 Years | 19 (4.8%) | 6 (1.9%) |
| 75 to 79 Years | 11 (2.8%) | 21 (6.6%) |
| 80 to 84 Years | 0 (0.0%) | 7 (2.2%) |
| 85 Years and over | 4 (1.0%) | 10 (3.1%) |
| Total | 400 (100.0%) | 320 (100.0%) |
Families and Households in Mulga
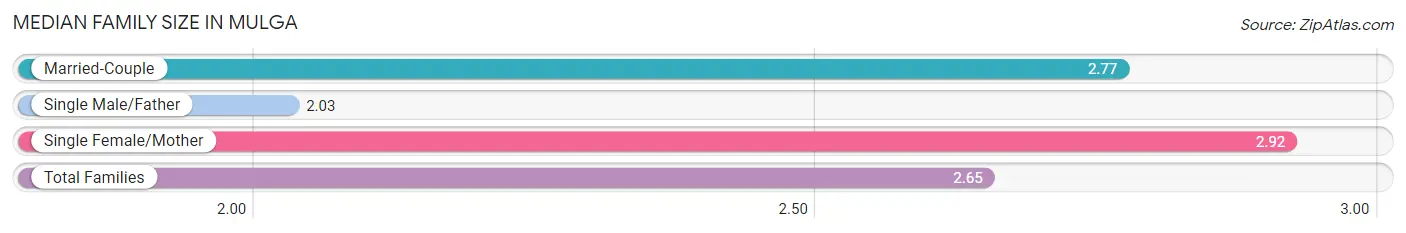
Median Family Size in Mulga
The median family size in Mulga is 2.65 persons per family, with single female/mother families (37 | 17.6%) accounting for the largest median family size of 2.92 persons per family. On the other hand, single male/father families (40 | 19.1%) represent the smallest median family size with 2.03 persons per family.
| Family Type | # Families | Family Size |
| Married-Couple | 133 (63.3%) | 2.77 |
| Single Male/Father | 40 (19.1%) | 2.03 |
| Single Female/Mother | 37 (17.6%) | 2.92 |
| Total Families | 210 (100.0%) | 2.65 |
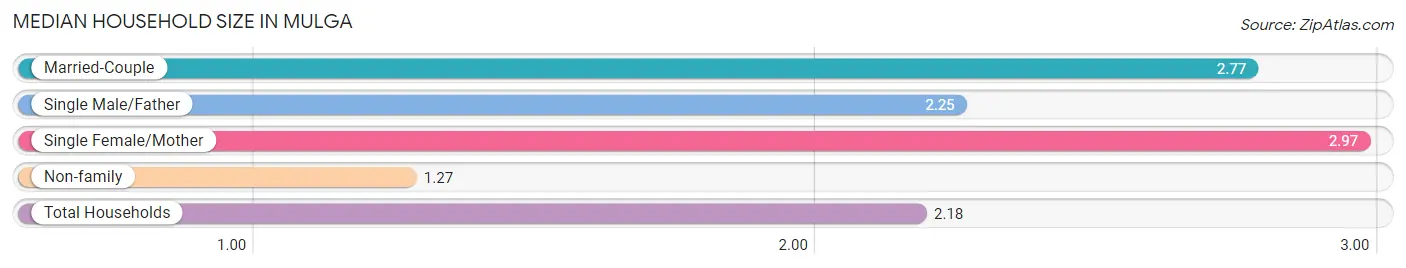
Median Household Size in Mulga
The median household size in Mulga is 2.18 persons per household, with single female/mother households (37 | 11.2%) accounting for the largest median household size of 2.97 persons per household. non-family households (120 | 36.4%) represent the smallest median household size with 1.27 persons per household.
| Household Type | # Households | Household Size |
| Married-Couple | 133 (40.3%) | 2.77 |
| Single Male/Father | 40 (12.1%) | 2.25 |
| Single Female/Mother | 37 (11.2%) | 2.97 |
| Non-family | 120 (36.4%) | 1.27 |
| Total Households | 330 (100.0%) | 2.18 |
Household Size by Marriage Status in Mulga
Out of a total of 330 households in Mulga, 210 (63.6%) are family households, while 120 (36.4%) are nonfamily households. The most numerous type of family households are 2-person households, comprising 124, and the most common type of nonfamily households are 1-person households, comprising 97.
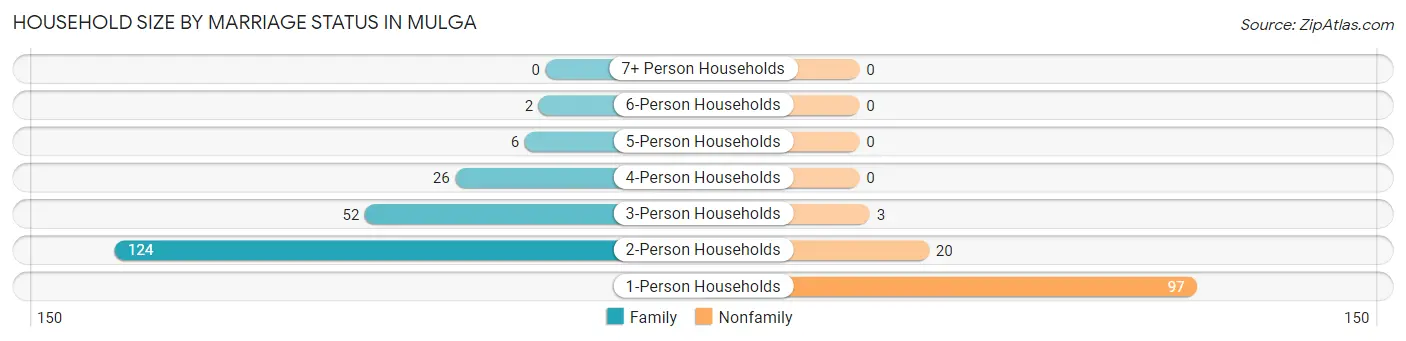
| Household Size | Family Households | Nonfamily Households |
| 1-Person Households | - | 97 (29.4%) |
| 2-Person Households | 124 (37.6%) | 20 (6.1%) |
| 3-Person Households | 52 (15.8%) | 3 (0.9%) |
| 4-Person Households | 26 (7.9%) | 0 (0.0%) |
| 5-Person Households | 6 (1.8%) | 0 (0.0%) |
| 6-Person Households | 2 (0.6%) | 0 (0.0%) |
| 7+ Person Households | 0 (0.0%) | 0 (0.0%) |
| Total | 210 (63.6%) | 120 (36.4%) |
Female Fertility in Mulga
Fertility by Age in Mulga
Average fertility rate in Mulga is 52.0 births per 1,000 women. Women in the age bracket of 20 to 34 years have the highest fertility rate with 171.0 births per 1,000 women. Women in the age bracket of 20 to 34 years acount for 100.0% of all women with births.
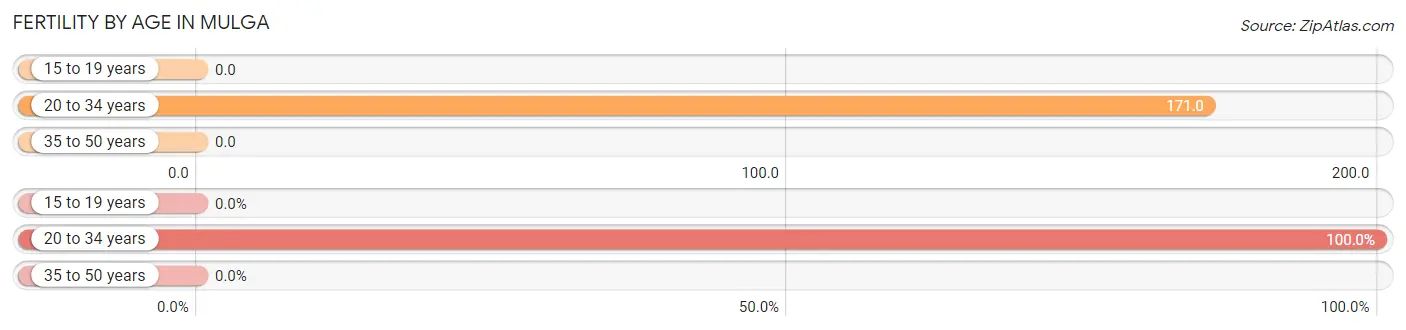
| Age Bracket | Women with Births | Births / 1,000 Women |
| 15 to 19 years | 0 (0.0%) | 0.0 |
| 20 to 34 years | 6 (100.0%) | 171.0 |
| 35 to 50 years | 0 (0.0%) | 0.0 |
| Total | 6 (100.0%) | 52.0 |
Fertility by Age by Marriage Status in Mulga
66.7% of women with births (6) in Mulga are married. The highest percentage of unmarried women with births falls into 20 to 34 years age bracket with 33.3% of them unmarried at the time of birth, while the lowest percentage of unmarried women with births belong to 20 to 34 years age bracket with 33.3% of them unmarried.
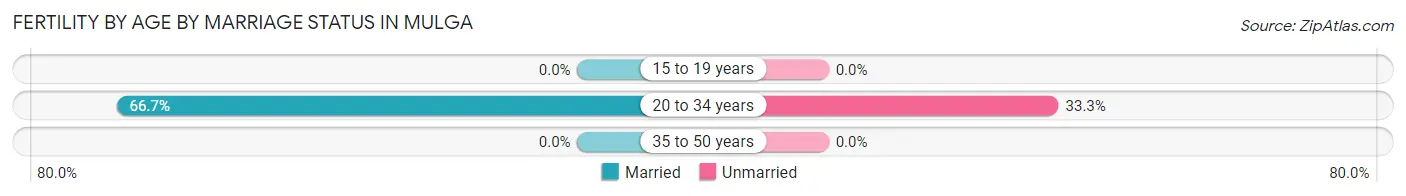
| Age Bracket | Married | Unmarried |
| 15 to 19 years | 0 (0.0%) | 0 (0.0%) |
| 20 to 34 years | 4 (66.7%) | 2 (33.3%) |
| 35 to 50 years | 0 (0.0%) | 0 (0.0%) |
| Total | 4 (66.7%) | 2 (33.3%) |
Fertility by Education in Mulga
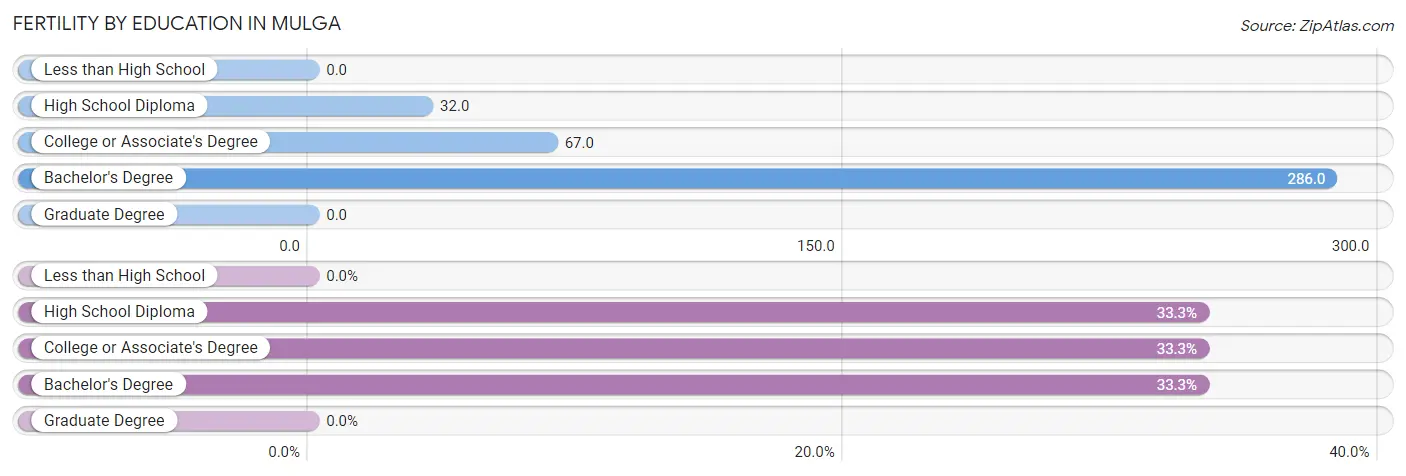
| Educational Attainment | Women with Births | Births / 1,000 Women |
| Less than High School | 0 (0.0%) | 0.0 |
| High School Diploma | 2 (33.3%) | 32.0 |
| College or Associate's Degree | 2 (33.3%) | 67.0 |
| Bachelor's Degree | 2 (33.3%) | 286.0 |
| Graduate Degree | 0 (0.0%) | 0.0 |
| Total | 6 (100.0%) | 52.0 |
Fertility by Education by Marriage Status in Mulga
33.3% of women with births in Mulga are unmarried. Women with the educational attainment of high school diploma are most likely to be married with 100.0% of them married at childbirth, while women with the educational attainment of college or associate's degree are least likely to be married with 100.0% of them unmarried at childbirth.
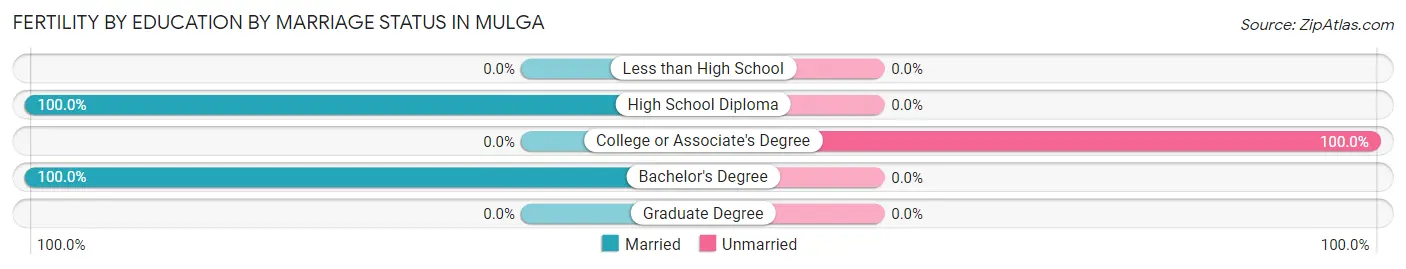
| Educational Attainment | Married | Unmarried |
| Less than High School | 0 (0.0%) | 0 (0.0%) |
| High School Diploma | 2 (100.0%) | 0 (0.0%) |
| College or Associate's Degree | 0 (0.0%) | 2 (100.0%) |
| Bachelor's Degree | 2 (100.0%) | 0 (0.0%) |
| Graduate Degree | 0 (0.0%) | 0 (0.0%) |
| Total | 4 (66.7%) | 2 (33.3%) |
Employment Characteristics in Mulga
Employment by Class of Employer in Mulga
Among the 317 employed individuals in Mulga, private company employees (214 | 67.5%), not-for-profit organizations (40 | 12.6%), and self-employed (not incorporated) (29 | 9.1%) make up the most common classes of employment.
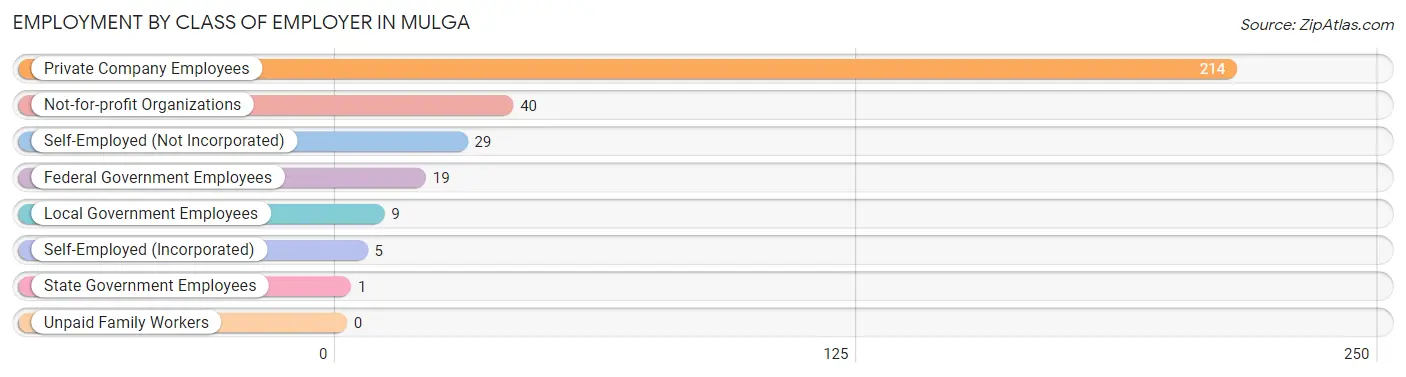
| Employer Class | # Employees | % Employees |
| Private Company Employees | 214 | 67.5% |
| Self-Employed (Incorporated) | 5 | 1.6% |
| Self-Employed (Not Incorporated) | 29 | 9.1% |
| Not-for-profit Organizations | 40 | 12.6% |
| Local Government Employees | 9 | 2.8% |
| State Government Employees | 1 | 0.3% |
| Federal Government Employees | 19 | 6.0% |
| Unpaid Family Workers | 0 | 0.0% |
| Total | 317 | 100.0% |
Employment Status by Age in Mulga
According to the labor force statistics for Mulga, out of the total population over 16 years of age (635), 52.9% or 336 individuals are in the labor force, with 2.7% or 9 of them unemployed. The age group with the highest labor force participation rate is 20 to 24 years, with 91.7% or 33 individuals in the labor force. Within the labor force, the 75 years and over age range has the highest percentage of unemployed individuals, with 40.0% or 2 of them being unemployed.
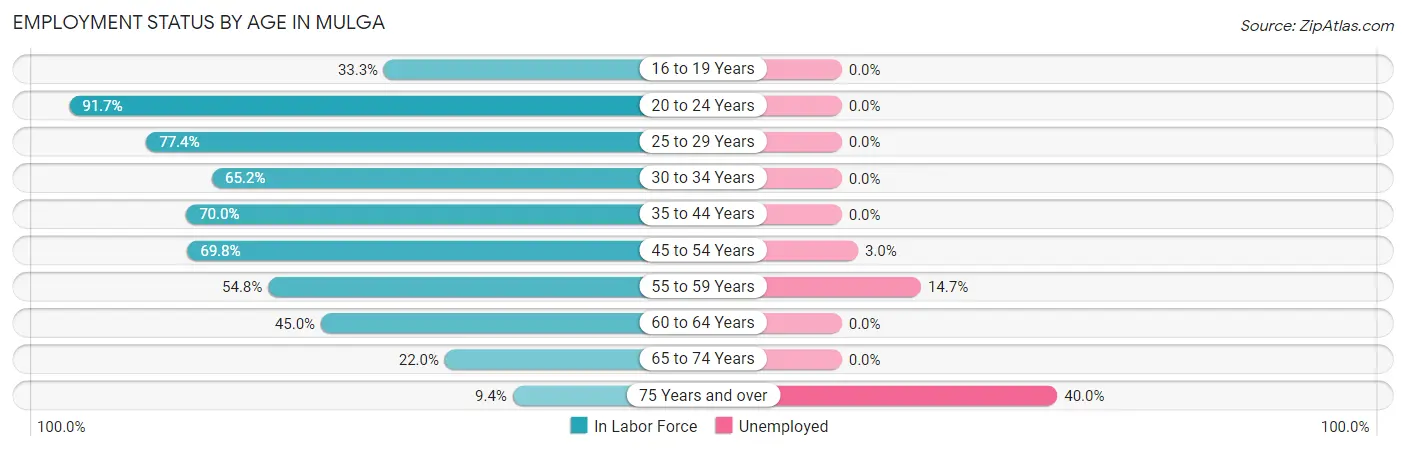
| Age Bracket | In Labor Force | Unemployed |
| 16 to 19 Years | 11 (33.3%) | 0 (0.0%) |
| 20 to 24 Years | 33 (91.7%) | 0 (0.0%) |
| 25 to 29 Years | 24 (77.4%) | 0 (0.0%) |
| 30 to 34 Years | 15 (65.2%) | 0 (0.0%) |
| 35 to 44 Years | 91 (70.0%) | 0 (0.0%) |
| 45 to 54 Years | 67 (69.8%) | 2 (3.0%) |
| 55 to 59 Years | 34 (54.8%) | 5 (14.7%) |
| 60 to 64 Years | 36 (45.0%) | 0 (0.0%) |
| 65 to 74 Years | 20 (22.0%) | 0 (0.0%) |
| 75 Years and over | 5 (9.4%) | 2 (40.0%) |
| Total | 336 (52.9%) | 9 (2.7%) |
Employment Status by Educational Attainment in Mulga
According to labor force statistics for Mulga, 63.3% of individuals (267) out of the total population between 25 and 64 years of age (422) are in the labor force, with 2.6% or 7 of them being unemployed. The group with the highest labor force participation rate are those with the educational attainment of bachelor's degree or higher, with 100.0% or 13 individuals in the labor force. Within the labor force, individuals with less than high school education have the highest percentage of unemployment, with 16.7% or 5 of them being unemployed.
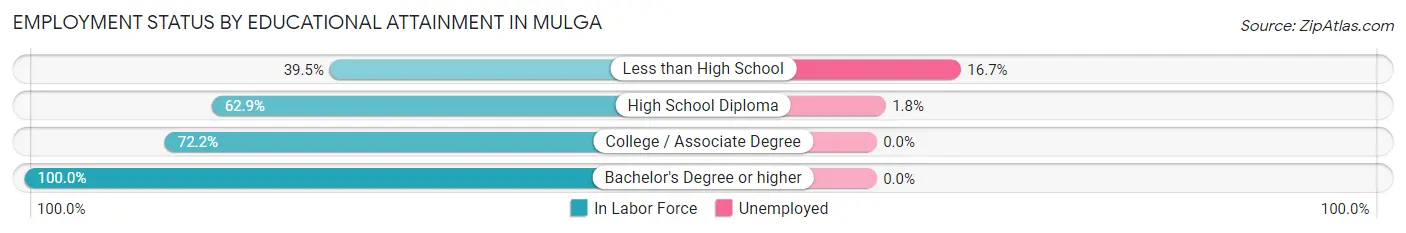
| Educational Attainment | In Labor Force | Unemployed |
| Less than High School | 30 (39.5%) | 13 (16.7%) |
| High School Diploma | 110 (62.9%) | 3 (1.8%) |
| College / Associate Degree | 114 (72.2%) | 0 (0.0%) |
| Bachelor's Degree or higher | 13 (100.0%) | 0 (0.0%) |
| Total | 267 (63.3%) | 11 (2.6%) |
Employment Occupations by Sex in Mulga
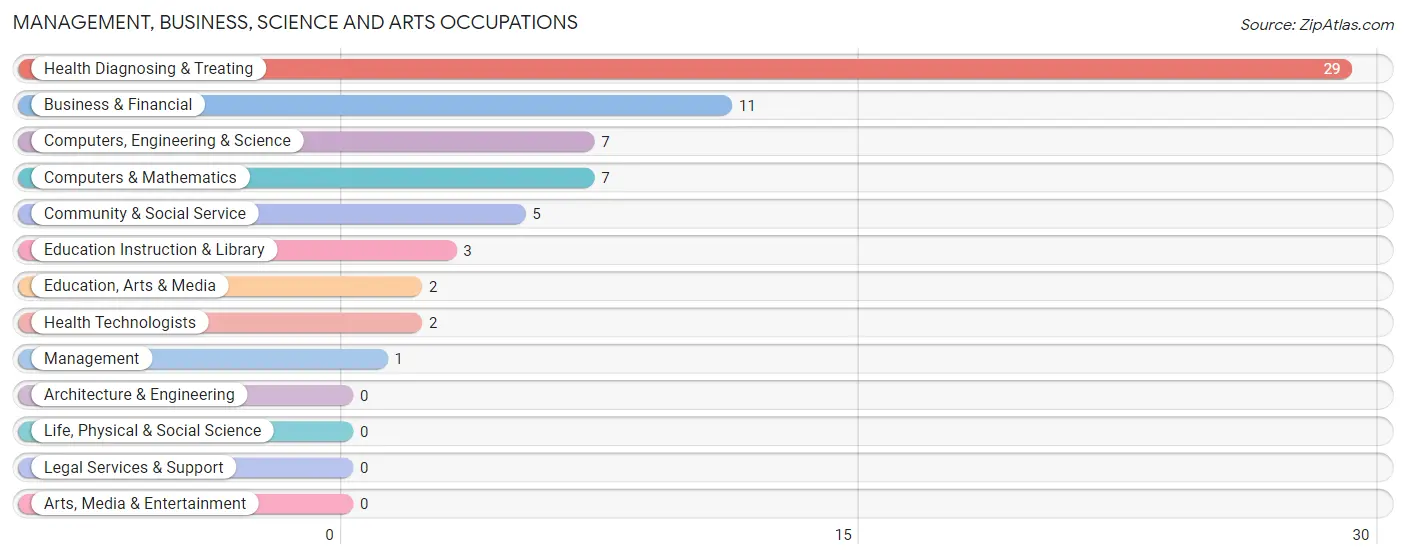
Management, Business, Science and Arts Occupations
The most common Management, Business, Science and Arts occupations in Mulga are Health Diagnosing & Treating (29 | 8.9%), Business & Financial (11 | 3.4%), Computers, Engineering & Science (7 | 2.2%), Computers & Mathematics (7 | 2.2%), and Community & Social Service (5 | 1.5%).
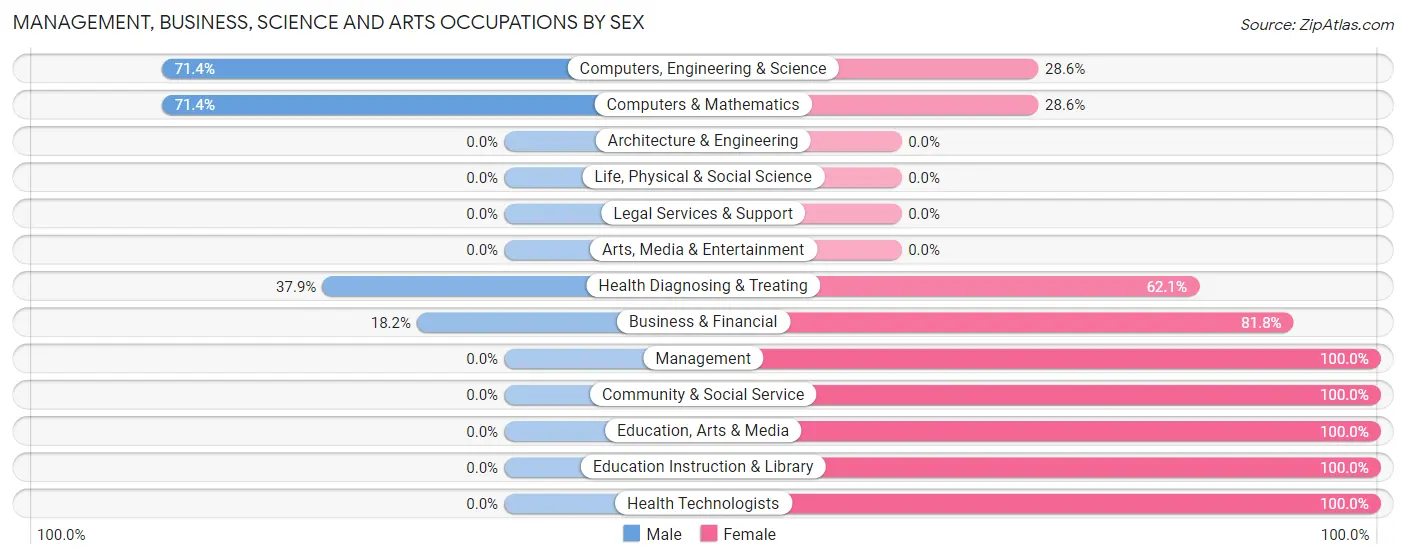
Management, Business, Science and Arts Occupations by Sex
Within the Management, Business, Science and Arts occupations in Mulga, the most male-oriented occupations are Computers, Engineering & Science (71.4%), Computers & Mathematics (71.4%), and Health Diagnosing & Treating (37.9%), while the most female-oriented occupations are Management (100.0%), Community & Social Service (100.0%), and Education, Arts & Media (100.0%).
| Occupation | Male | Female |
| Management | 0 (0.0%) | 1 (100.0%) |
| Business & Financial | 2 (18.2%) | 9 (81.8%) |
| Computers, Engineering & Science | 5 (71.4%) | 2 (28.6%) |
| Computers & Mathematics | 5 (71.4%) | 2 (28.6%) |
| Architecture & Engineering | 0 (0.0%) | 0 (0.0%) |
| Life, Physical & Social Science | 0 (0.0%) | 0 (0.0%) |
| Community & Social Service | 0 (0.0%) | 5 (100.0%) |
| Education, Arts & Media | 0 (0.0%) | 2 (100.0%) |
| Legal Services & Support | 0 (0.0%) | 0 (0.0%) |
| Education Instruction & Library | 0 (0.0%) | 3 (100.0%) |
| Arts, Media & Entertainment | 0 (0.0%) | 0 (0.0%) |
| Health Diagnosing & Treating | 11 (37.9%) | 18 (62.1%) |
| Health Technologists | 0 (0.0%) | 2 (100.0%) |
| Total (Category) | 18 (34.0%) | 35 (66.0%) |
| Total (Overall) | 198 (61.1%) | 126 (38.9%) |
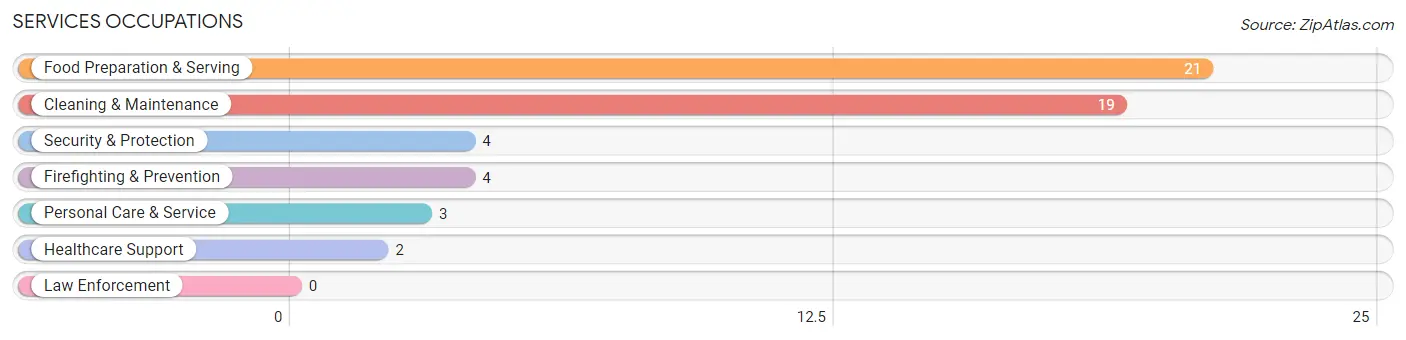
Services Occupations
The most common Services occupations in Mulga are Food Preparation & Serving (21 | 6.5%), Cleaning & Maintenance (19 | 5.9%), Security & Protection (4 | 1.2%), Firefighting & Prevention (4 | 1.2%), and Personal Care & Service (3 | 0.9%).
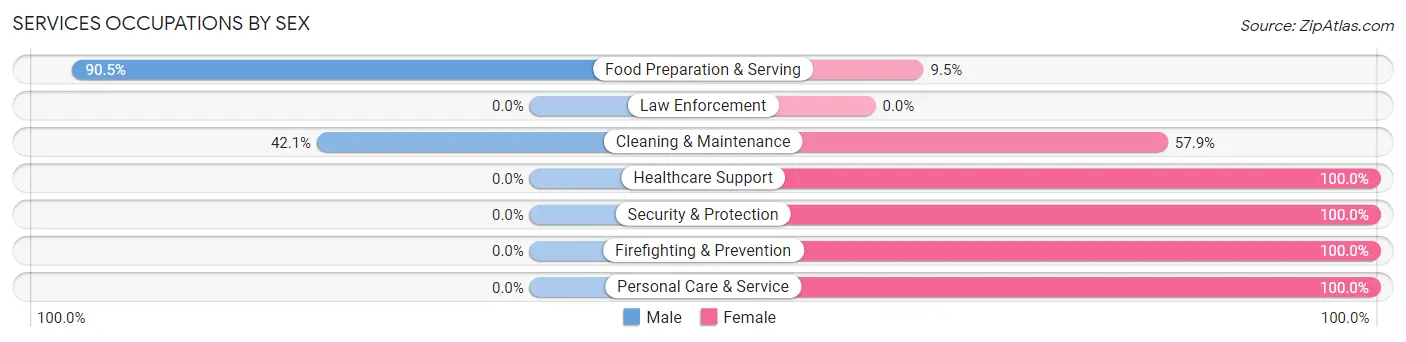
Services Occupations by Sex
Within the Services occupations in Mulga, the most male-oriented occupations are Food Preparation & Serving (90.5%), and Cleaning & Maintenance (42.1%), while the most female-oriented occupations are Healthcare Support (100.0%), Security & Protection (100.0%), and Firefighting & Prevention (100.0%).
| Occupation | Male | Female |
| Healthcare Support | 0 (0.0%) | 2 (100.0%) |
| Security & Protection | 0 (0.0%) | 4 (100.0%) |
| Firefighting & Prevention | 0 (0.0%) | 4 (100.0%) |
| Law Enforcement | 0 (0.0%) | 0 (0.0%) |
| Food Preparation & Serving | 19 (90.5%) | 2 (9.5%) |
| Cleaning & Maintenance | 8 (42.1%) | 11 (57.9%) |
| Personal Care & Service | 0 (0.0%) | 3 (100.0%) |
| Total (Category) | 27 (55.1%) | 22 (44.9%) |
| Total (Overall) | 198 (61.1%) | 126 (38.9%) |
Sales and Office Occupations
The most common Sales and Office occupations in Mulga are Office & Administration (34 | 10.5%), and Sales & Related (25 | 7.7%).
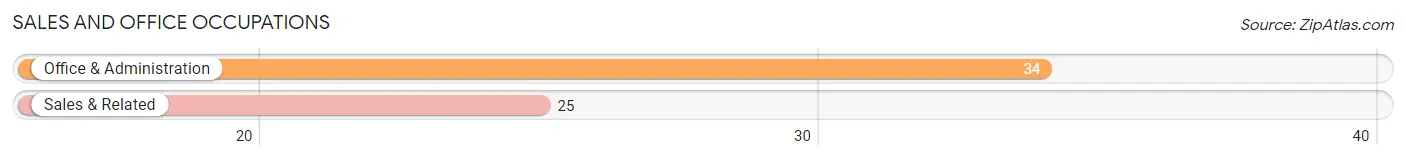
Sales and Office Occupations by Sex

| Occupation | Male | Female |
| Sales & Related | 10 (40.0%) | 15 (60.0%) |
| Office & Administration | 0 (0.0%) | 34 (100.0%) |
| Total (Category) | 10 (17.0%) | 49 (83.1%) |
| Total (Overall) | 198 (61.1%) | 126 (38.9%) |
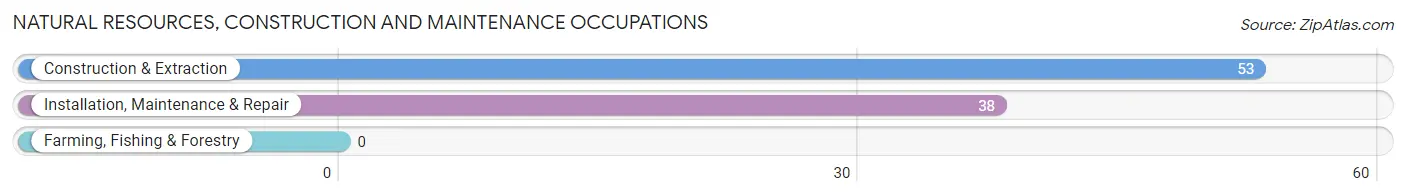
Natural Resources, Construction and Maintenance Occupations
The most common Natural Resources, Construction and Maintenance occupations in Mulga are Construction & Extraction (53 | 16.4%), and Installation, Maintenance & Repair (38 | 11.7%).
Natural Resources, Construction and Maintenance Occupations by Sex
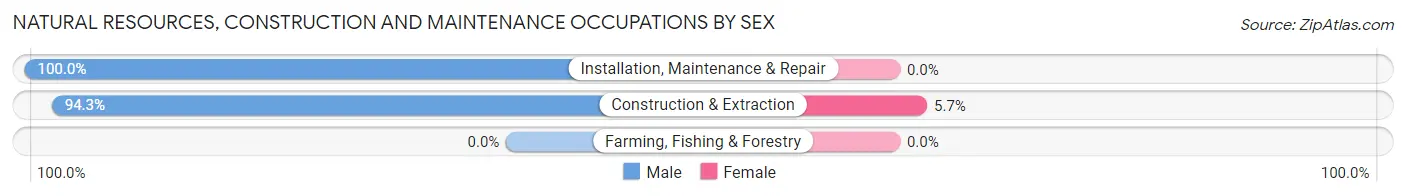
| Occupation | Male | Female |
| Farming, Fishing & Forestry | 0 (0.0%) | 0 (0.0%) |
| Construction & Extraction | 50 (94.3%) | 3 (5.7%) |
| Installation, Maintenance & Repair | 38 (100.0%) | 0 (0.0%) |
| Total (Category) | 88 (96.7%) | 3 (3.3%) |
| Total (Overall) | 198 (61.1%) | 126 (38.9%) |
Production, Transportation and Moving Occupations
The most common Production, Transportation and Moving occupations in Mulga are Production (34 | 10.5%), Material Moving (22 | 6.8%), and Transportation (16 | 4.9%).
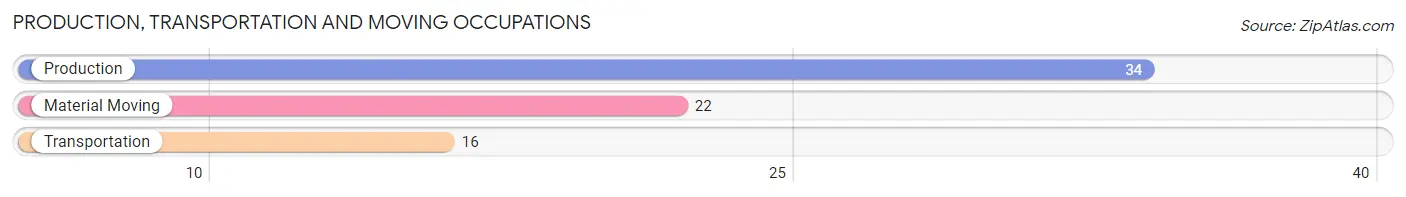
Production, Transportation and Moving Occupations by Sex
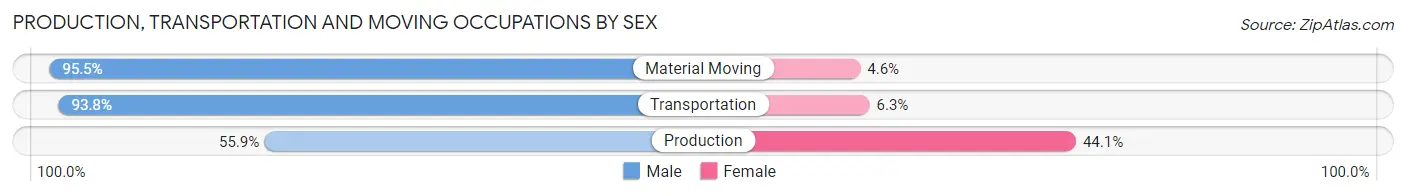
| Occupation | Male | Female |
| Production | 19 (55.9%) | 15 (44.1%) |
| Transportation | 15 (93.8%) | 1 (6.2%) |
| Material Moving | 21 (95.5%) | 1 (4.5%) |
| Total (Category) | 55 (76.4%) | 17 (23.6%) |
| Total (Overall) | 198 (61.1%) | 126 (38.9%) |
Employment Industries by Sex in Mulga
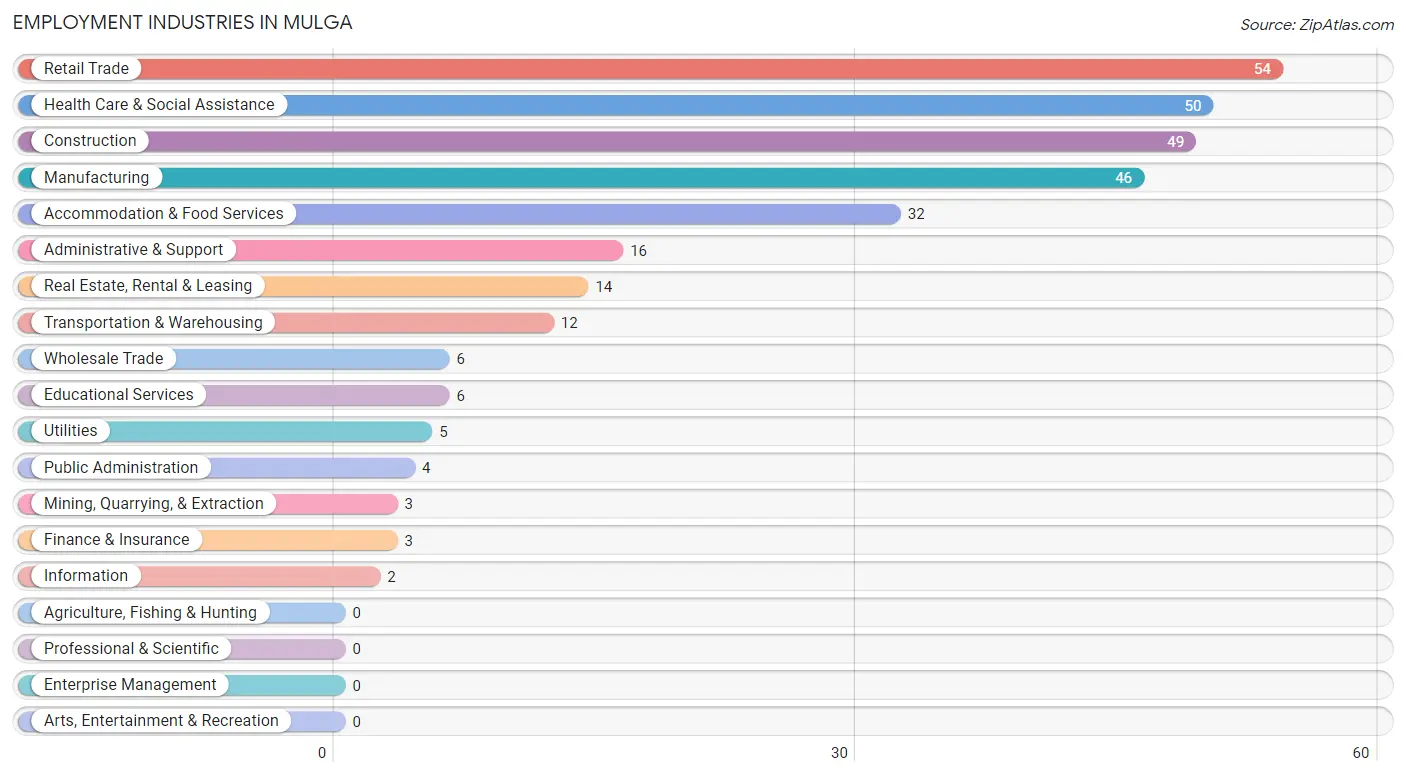
Employment Industries in Mulga
The major employment industries in Mulga include Retail Trade (54 | 16.7%), Health Care & Social Assistance (50 | 15.4%), Construction (49 | 15.1%), Manufacturing (46 | 14.2%), and Accommodation & Food Services (32 | 9.9%).
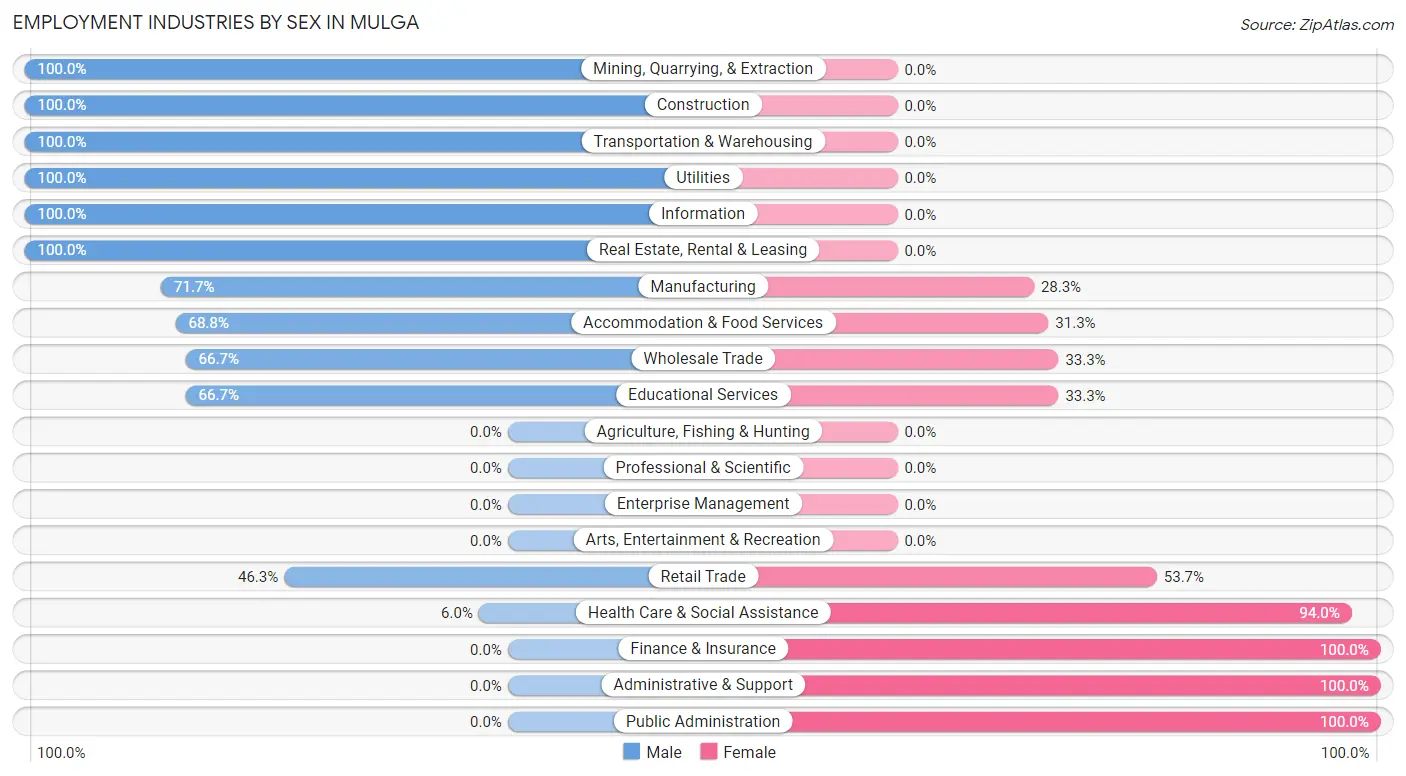
Employment Industries by Sex in Mulga
The Mulga industries that see more men than women are Mining, Quarrying, & Extraction (100.0%), Construction (100.0%), and Transportation & Warehousing (100.0%), whereas the industries that tend to have a higher number of women are Finance & Insurance (100.0%), Administrative & Support (100.0%), and Public Administration (100.0%).
| Industry | Male | Female |
| Agriculture, Fishing & Hunting | 0 (0.0%) | 0 (0.0%) |
| Mining, Quarrying, & Extraction | 3 (100.0%) | 0 (0.0%) |
| Construction | 49 (100.0%) | 0 (0.0%) |
| Manufacturing | 33 (71.7%) | 13 (28.3%) |
| Wholesale Trade | 4 (66.7%) | 2 (33.3%) |
| Retail Trade | 25 (46.3%) | 29 (53.7%) |
| Transportation & Warehousing | 12 (100.0%) | 0 (0.0%) |
| Utilities | 5 (100.0%) | 0 (0.0%) |
| Information | 2 (100.0%) | 0 (0.0%) |
| Finance & Insurance | 0 (0.0%) | 3 (100.0%) |
| Real Estate, Rental & Leasing | 14 (100.0%) | 0 (0.0%) |
| Professional & Scientific | 0 (0.0%) | 0 (0.0%) |
| Enterprise Management | 0 (0.0%) | 0 (0.0%) |
| Administrative & Support | 0 (0.0%) | 16 (100.0%) |
| Educational Services | 4 (66.7%) | 2 (33.3%) |
| Health Care & Social Assistance | 3 (6.0%) | 47 (94.0%) |
| Arts, Entertainment & Recreation | 0 (0.0%) | 0 (0.0%) |
| Accommodation & Food Services | 22 (68.8%) | 10 (31.2%) |
| Public Administration | 0 (0.0%) | 4 (100.0%) |
| Total | 198 (61.1%) | 126 (38.9%) |
Education in Mulga
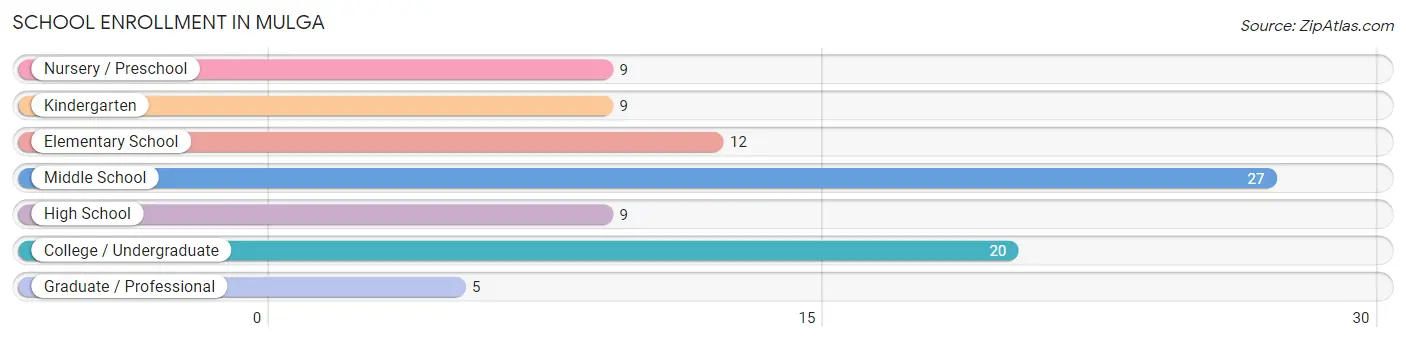
School Enrollment in Mulga
The most common levels of schooling among the 91 students in Mulga are middle school (27 | 29.7%), college / undergraduate (20 | 22.0%), and elementary school (12 | 13.2%).
| School Level | # Students | % Students |
| Nursery / Preschool | 9 | 9.9% |
| Kindergarten | 9 | 9.9% |
| Elementary School | 12 | 13.2% |
| Middle School | 27 | 29.7% |
| High School | 9 | 9.9% |
| College / Undergraduate | 20 | 22.0% |
| Graduate / Professional | 5 | 5.5% |
| Total | 91 | 100.0% |
School Enrollment by Age by Funding Source in Mulga
Out of a total of 91 students who are enrolled in schools in Mulga, 35 (38.5%) attend a private institution, while the remaining 56 (61.5%) are enrolled in public schools. The age group of 5 to 9 year old has the highest likelihood of being enrolled in private schools, with 17 (80.9% in the age bracket) enrolled. Conversely, the age group of 15 to 17 year olds has the lowest likelihood of being enrolled in a private school, with 8 (100.0% in the age bracket) attending a public institution.
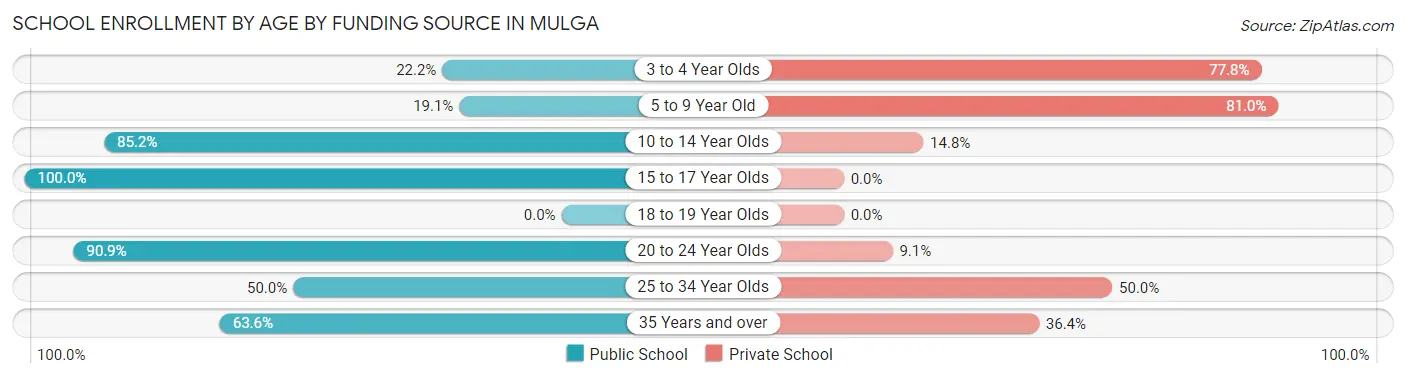
| Age Bracket | Public School | Private School |
| 3 to 4 Year Olds | 2 (22.2%) | 7 (77.8%) |
| 5 to 9 Year Old | 4 (19.1%) | 17 (80.9%) |
| 10 to 14 Year Olds | 23 (85.2%) | 4 (14.8%) |
| 15 to 17 Year Olds | 8 (100.0%) | 0 (0.0%) |
| 18 to 19 Year Olds | 0 (0.0%) | 0 (0.0%) |
| 20 to 24 Year Olds | 10 (90.9%) | 1 (9.1%) |
| 25 to 34 Year Olds | 2 (50.0%) | 2 (50.0%) |
| 35 Years and over | 7 (63.6%) | 4 (36.4%) |
| Total | 56 (61.5%) | 35 (38.5%) |
Educational Attainment by Field of Study in Mulga
Science & technology (6 | 30.0%), education (4 | 20.0%), physical & health sciences (3 | 15.0%), business (2 | 10.0%), and liberal arts & history (2 | 10.0%) are the most common fields of study among 20 individuals in Mulga who have obtained a bachelor's degree or higher.
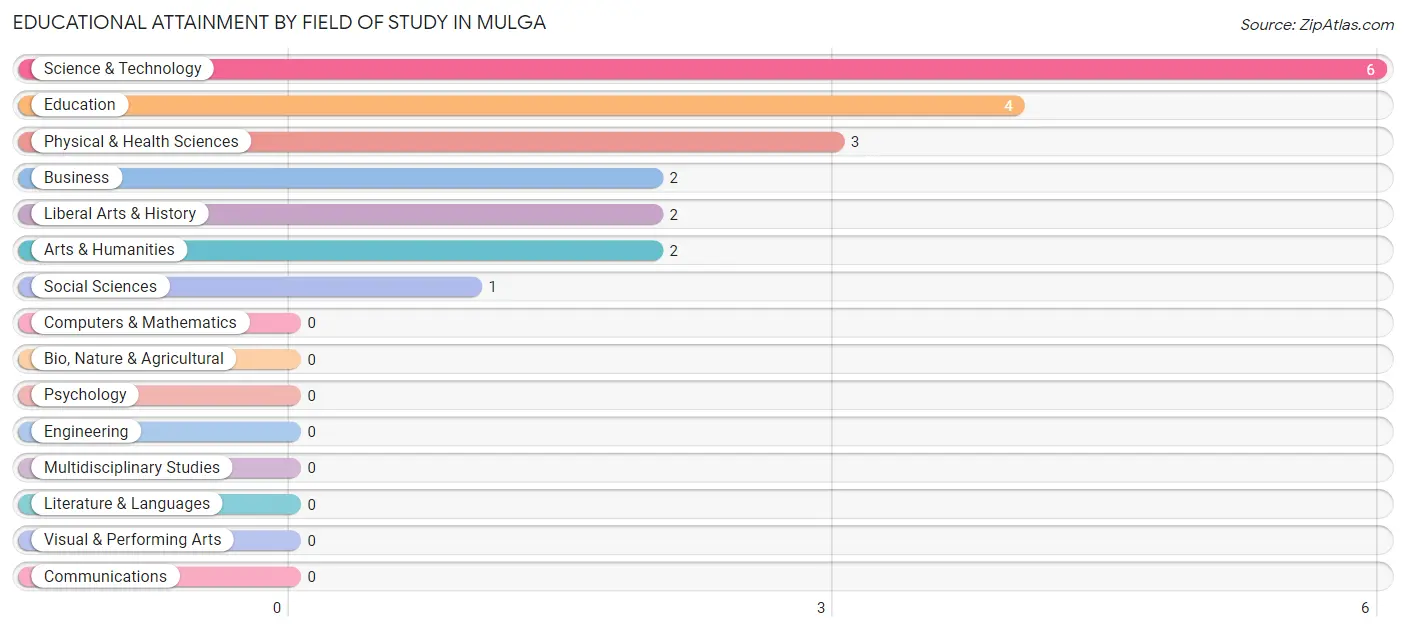
| Field of Study | # Graduates | % Graduates |
| Computers & Mathematics | 0 | 0.0% |
| Bio, Nature & Agricultural | 0 | 0.0% |
| Physical & Health Sciences | 3 | 15.0% |
| Psychology | 0 | 0.0% |
| Social Sciences | 1 | 5.0% |
| Engineering | 0 | 0.0% |
| Multidisciplinary Studies | 0 | 0.0% |
| Science & Technology | 6 | 30.0% |
| Business | 2 | 10.0% |
| Education | 4 | 20.0% |
| Literature & Languages | 0 | 0.0% |
| Liberal Arts & History | 2 | 10.0% |
| Visual & Performing Arts | 0 | 0.0% |
| Communications | 0 | 0.0% |
| Arts & Humanities | 2 | 10.0% |
| Total | 20 | 100.0% |
Transportation & Commute in Mulga
Vehicle Availability by Sex in Mulga
The most prevalent vehicle ownership categories in Mulga are males with 2 vehicles (65, accounting for 34.0%) and females with 2 vehicles (39, making up 51.6%).
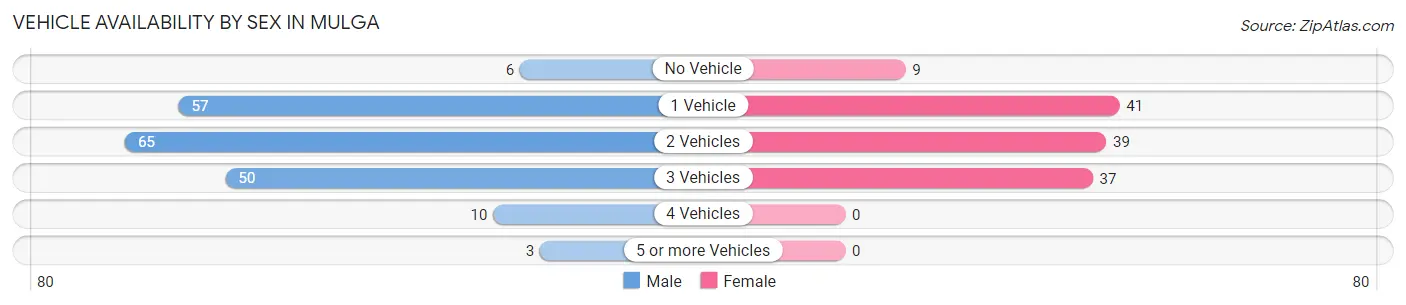
| Vehicles Available | Male | Female |
| No Vehicle | 6 (3.1%) | 9 (7.1%) |
| 1 Vehicle | 57 (29.8%) | 41 (32.5%) |
| 2 Vehicles | 65 (34.0%) | 39 (30.9%) |
| 3 Vehicles | 50 (26.2%) | 37 (29.4%) |
| 4 Vehicles | 10 (5.2%) | 0 (0.0%) |
| 5 or more Vehicles | 3 (1.6%) | 0 (0.0%) |
| Total | 191 (100.0%) | 126 (100.0%) |
Commute Time in Mulga
The most frequently occuring commute durations in Mulga are 30 to 34 minutes (68 commuters, 22.3%), 45 to 59 minutes (64 commuters, 21.0%), and 20 to 24 minutes (41 commuters, 13.4%).
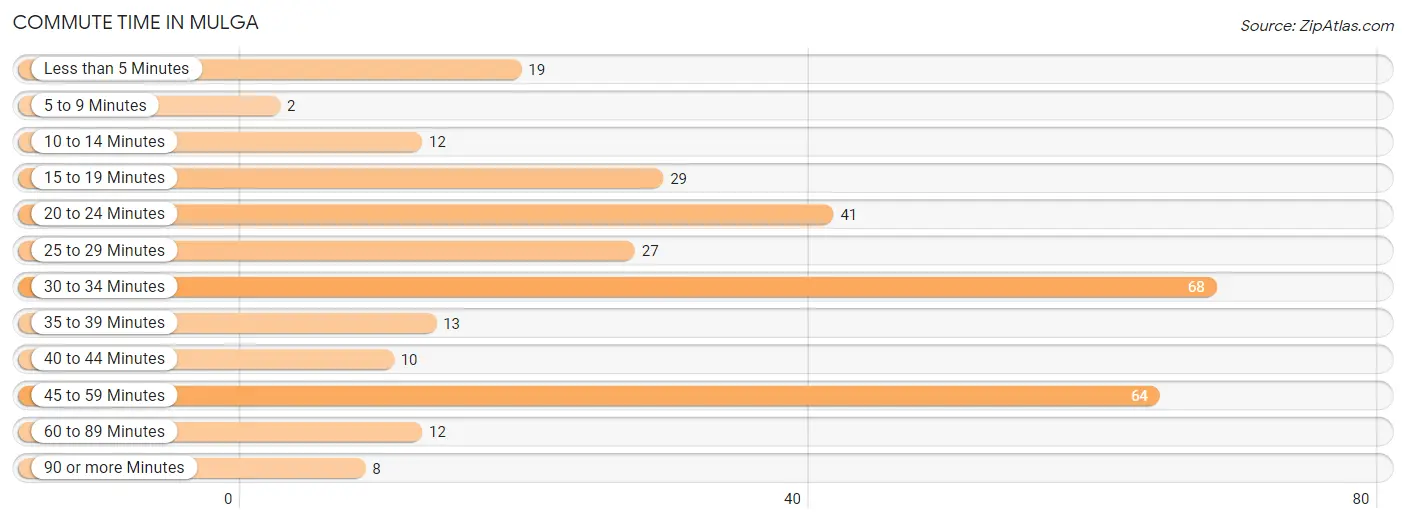
| Commute Time | # Commuters | % Commuters |
| Less than 5 Minutes | 19 | 6.2% |
| 5 to 9 Minutes | 2 | 0.7% |
| 10 to 14 Minutes | 12 | 3.9% |
| 15 to 19 Minutes | 29 | 9.5% |
| 20 to 24 Minutes | 41 | 13.4% |
| 25 to 29 Minutes | 27 | 8.8% |
| 30 to 34 Minutes | 68 | 22.3% |
| 35 to 39 Minutes | 13 | 4.3% |
| 40 to 44 Minutes | 10 | 3.3% |
| 45 to 59 Minutes | 64 | 21.0% |
| 60 to 89 Minutes | 12 | 3.9% |
| 90 or more Minutes | 8 | 2.6% |
Commute Time by Sex in Mulga
The most common commute times in Mulga are 45 to 59 minutes (54 commuters, 29.7%) for males and 20 to 24 minutes (29 commuters, 23.6%) for females.
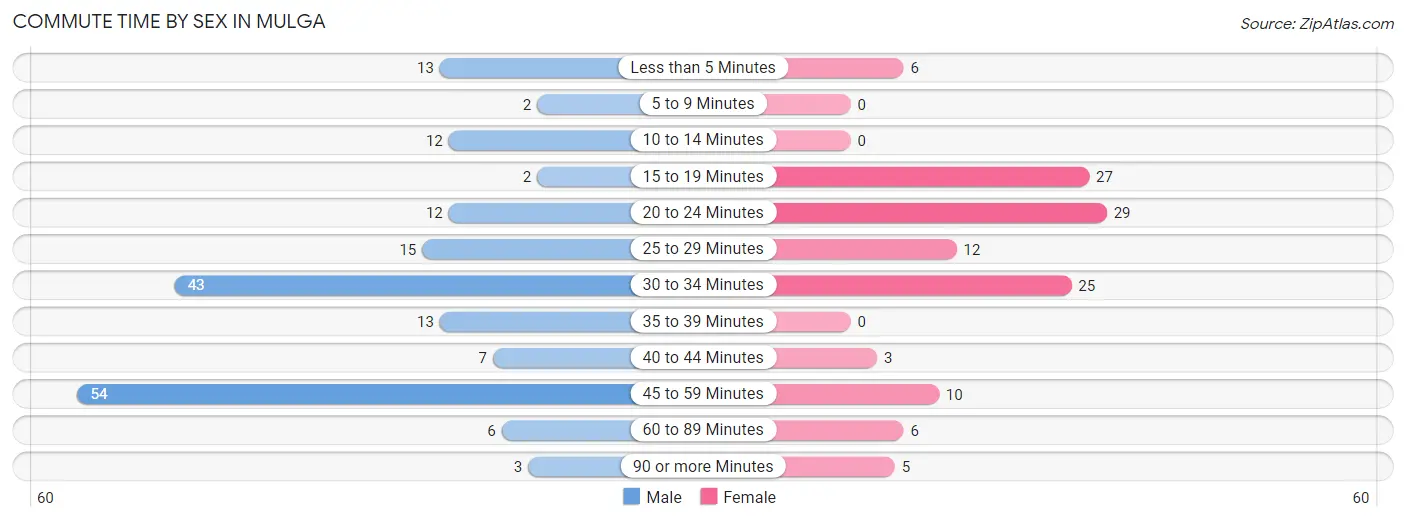
| Commute Time | Male | Female |
| Less than 5 Minutes | 13 (7.1%) | 6 (4.9%) |
| 5 to 9 Minutes | 2 (1.1%) | 0 (0.0%) |
| 10 to 14 Minutes | 12 (6.6%) | 0 (0.0%) |
| 15 to 19 Minutes | 2 (1.1%) | 27 (22.0%) |
| 20 to 24 Minutes | 12 (6.6%) | 29 (23.6%) |
| 25 to 29 Minutes | 15 (8.2%) | 12 (9.8%) |
| 30 to 34 Minutes | 43 (23.6%) | 25 (20.3%) |
| 35 to 39 Minutes | 13 (7.1%) | 0 (0.0%) |
| 40 to 44 Minutes | 7 (3.8%) | 3 (2.4%) |
| 45 to 59 Minutes | 54 (29.7%) | 10 (8.1%) |
| 60 to 89 Minutes | 6 (3.3%) | 6 (4.9%) |
| 90 or more Minutes | 3 (1.7%) | 5 (4.1%) |
Time of Departure to Work by Sex in Mulga
The most frequent times of departure to work in Mulga are 6:00 AM to 6:29 AM (37, 20.3%) for males and 6:00 AM to 6:29 AM (29, 23.6%) for females.
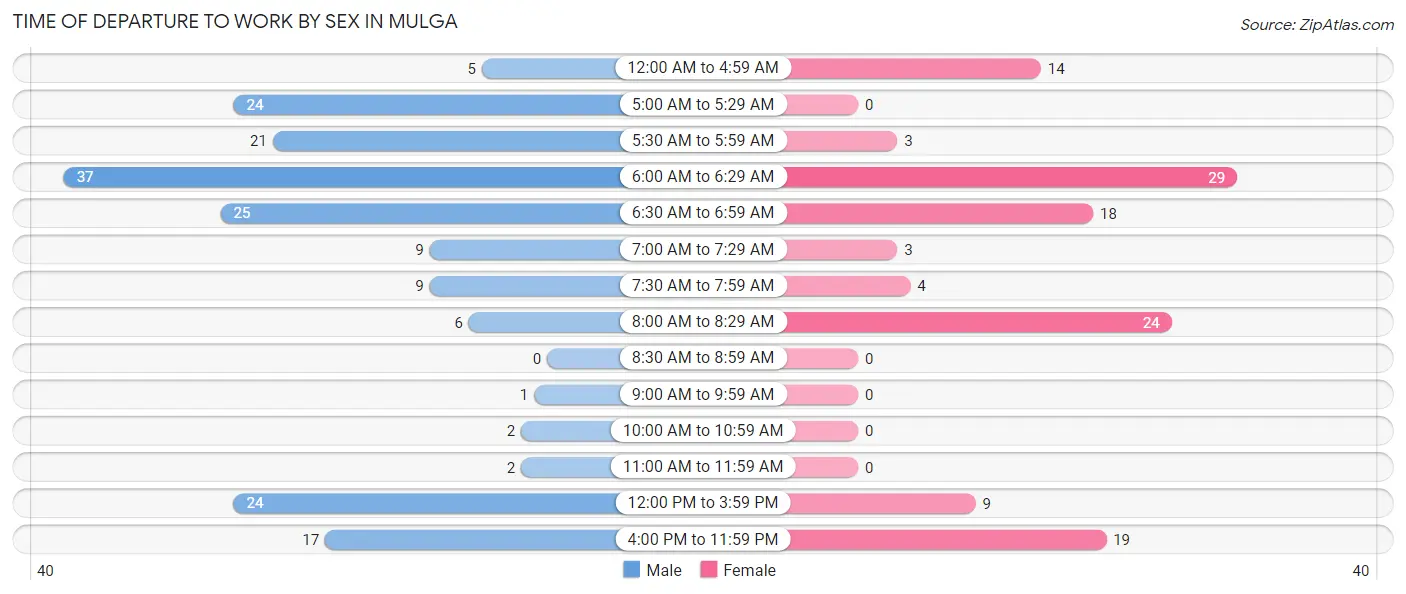
| Time of Departure | Male | Female |
| 12:00 AM to 4:59 AM | 5 (2.8%) | 14 (11.4%) |
| 5:00 AM to 5:29 AM | 24 (13.2%) | 0 (0.0%) |
| 5:30 AM to 5:59 AM | 21 (11.5%) | 3 (2.4%) |
| 6:00 AM to 6:29 AM | 37 (20.3%) | 29 (23.6%) |
| 6:30 AM to 6:59 AM | 25 (13.7%) | 18 (14.6%) |
| 7:00 AM to 7:29 AM | 9 (5.0%) | 3 (2.4%) |
| 7:30 AM to 7:59 AM | 9 (5.0%) | 4 (3.3%) |
| 8:00 AM to 8:29 AM | 6 (3.3%) | 24 (19.5%) |
| 8:30 AM to 8:59 AM | 0 (0.0%) | 0 (0.0%) |
| 9:00 AM to 9:59 AM | 1 (0.5%) | 0 (0.0%) |
| 10:00 AM to 10:59 AM | 2 (1.1%) | 0 (0.0%) |
| 11:00 AM to 11:59 AM | 2 (1.1%) | 0 (0.0%) |
| 12:00 PM to 3:59 PM | 24 (13.2%) | 9 (7.3%) |
| 4:00 PM to 11:59 PM | 17 (9.3%) | 19 (15.4%) |
| Total | 182 (100.0%) | 123 (100.0%) |
Housing Occupancy in Mulga
Occupancy by Ownership in Mulga
Of the total 330 dwellings in Mulga, owner-occupied units account for 219 (66.4%), while renter-occupied units make up 111 (33.6%).
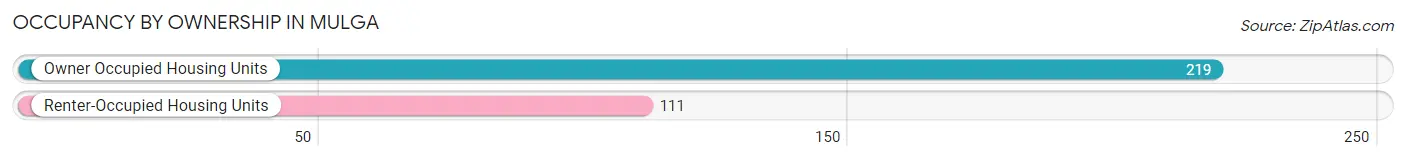
| Occupancy | # Housing Units | % Housing Units |
| Owner Occupied Housing Units | 219 | 66.4% |
| Renter-Occupied Housing Units | 111 | 33.6% |
| Total Occupied Housing Units | 330 | 100.0% |
Occupancy by Household Size in Mulga
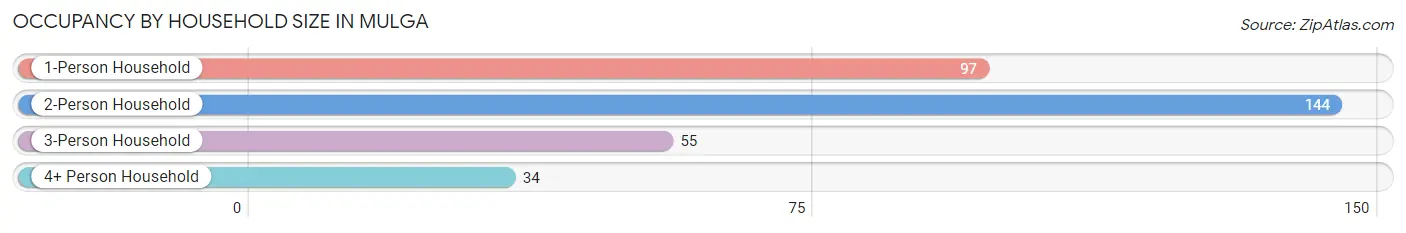
| Household Size | # Housing Units | % Housing Units |
| 1-Person Household | 97 | 29.4% |
| 2-Person Household | 144 | 43.6% |
| 3-Person Household | 55 | 16.7% |
| 4+ Person Household | 34 | 10.3% |
| Total Housing Units | 330 | 100.0% |
Occupancy by Ownership by Household Size in Mulga
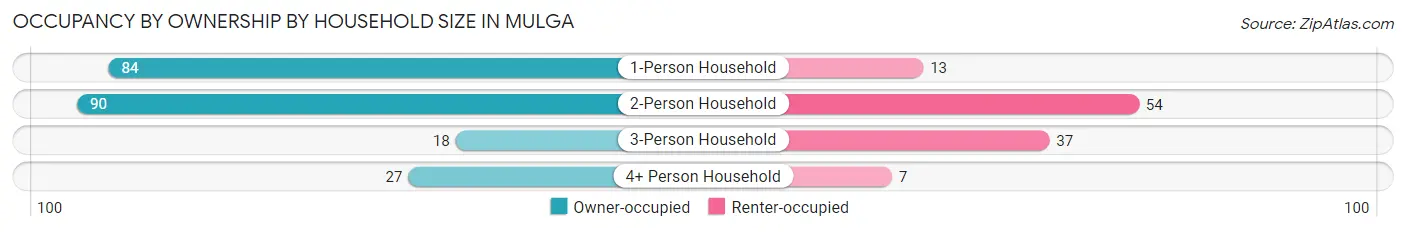
| Household Size | Owner-occupied | Renter-occupied |
| 1-Person Household | 84 (86.6%) | 13 (13.4%) |
| 2-Person Household | 90 (62.5%) | 54 (37.5%) |
| 3-Person Household | 18 (32.7%) | 37 (67.3%) |
| 4+ Person Household | 27 (79.4%) | 7 (20.6%) |
| Total Housing Units | 219 (66.4%) | 111 (33.6%) |
Occupancy by Educational Attainment in Mulga
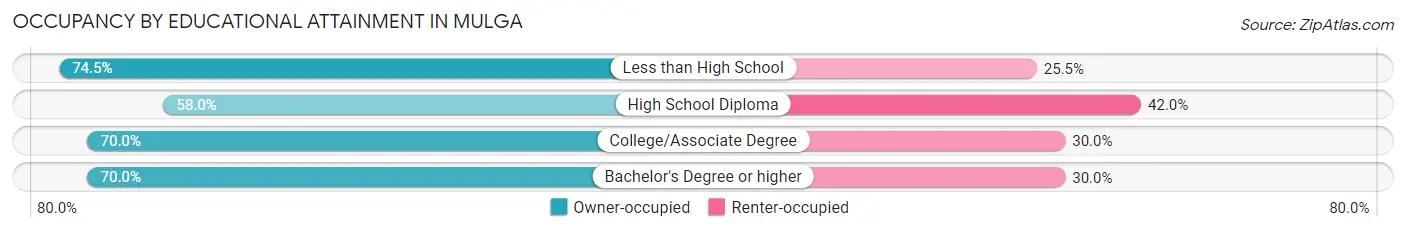
| Household Size | Owner-occupied | Renter-occupied |
| Less than High School | 38 (74.5%) | 13 (25.5%) |
| High School Diploma | 69 (58.0%) | 50 (42.0%) |
| College/Associate Degree | 105 (70.0%) | 45 (30.0%) |
| Bachelor's Degree or higher | 7 (70.0%) | 3 (30.0%) |
Occupancy by Age of Householder in Mulga
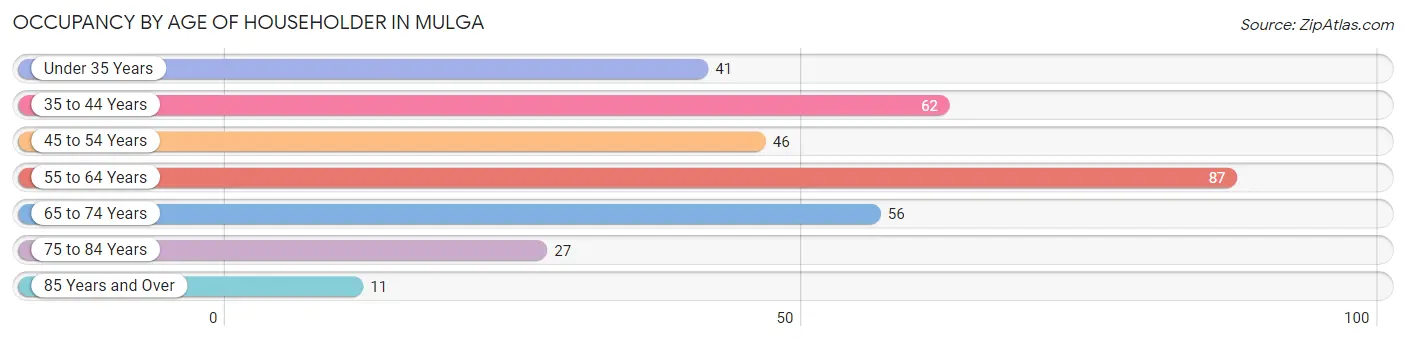
| Age Bracket | # Households | % Households |
| Under 35 Years | 41 | 12.4% |
| 35 to 44 Years | 62 | 18.8% |
| 45 to 54 Years | 46 | 13.9% |
| 55 to 64 Years | 87 | 26.4% |
| 65 to 74 Years | 56 | 17.0% |
| 75 to 84 Years | 27 | 8.2% |
| 85 Years and Over | 11 | 3.3% |
| Total | 330 | 100.0% |
Housing Finances in Mulga
Median Income by Occupancy in Mulga
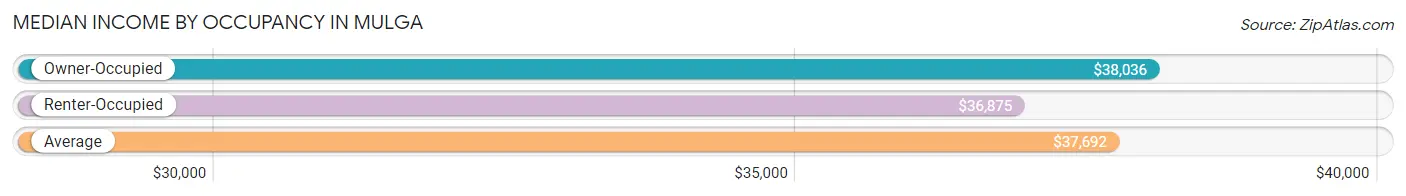
| Occupancy Type | # Households | Median Income |
| Owner-Occupied | 219 (66.4%) | $38,036 |
| Renter-Occupied | 111 (33.6%) | $36,875 |
| Average | 330 (100.0%) | $37,692 |
Occupancy by Householder Income Bracket in Mulga
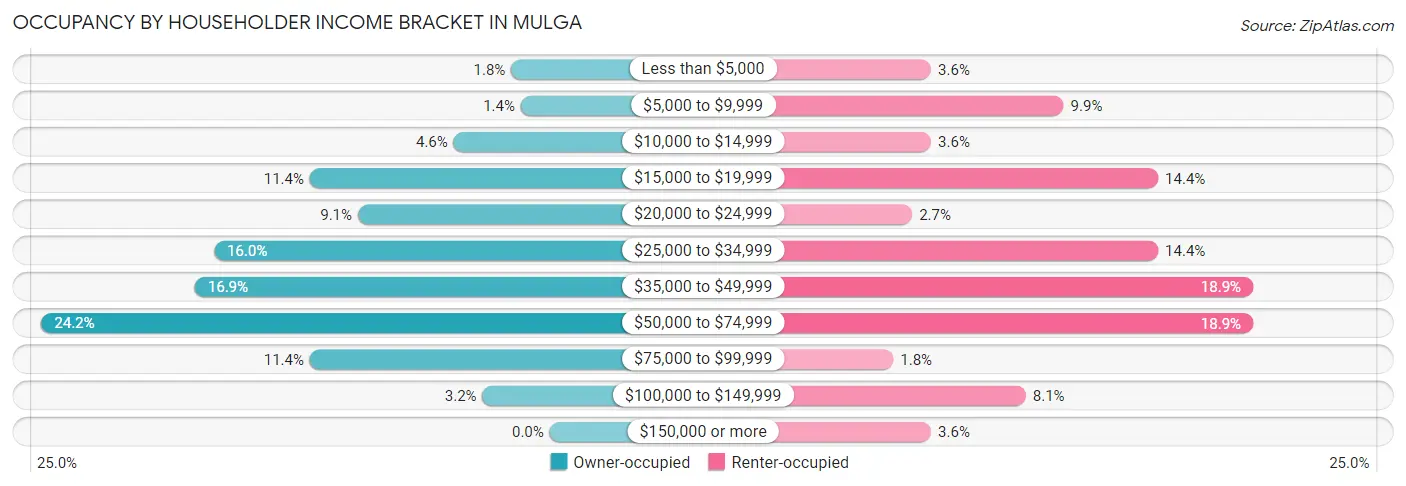
| Income Bracket | Owner-occupied | Renter-occupied |
| Less than $5,000 | 4 (1.8%) | 4 (3.6%) |
| $5,000 to $9,999 | 3 (1.4%) | 11 (9.9%) |
| $10,000 to $14,999 | 10 (4.6%) | 4 (3.6%) |
| $15,000 to $19,999 | 25 (11.4%) | 16 (14.4%) |
| $20,000 to $24,999 | 20 (9.1%) | 3 (2.7%) |
| $25,000 to $34,999 | 35 (16.0%) | 16 (14.4%) |
| $35,000 to $49,999 | 37 (16.9%) | 21 (18.9%) |
| $50,000 to $74,999 | 53 (24.2%) | 21 (18.9%) |
| $75,000 to $99,999 | 25 (11.4%) | 2 (1.8%) |
| $100,000 to $149,999 | 7 (3.2%) | 9 (8.1%) |
| $150,000 or more | 0 (0.0%) | 4 (3.6%) |
| Total | 219 (100.0%) | 111 (100.0%) |
Monthly Housing Cost Tiers in Mulga
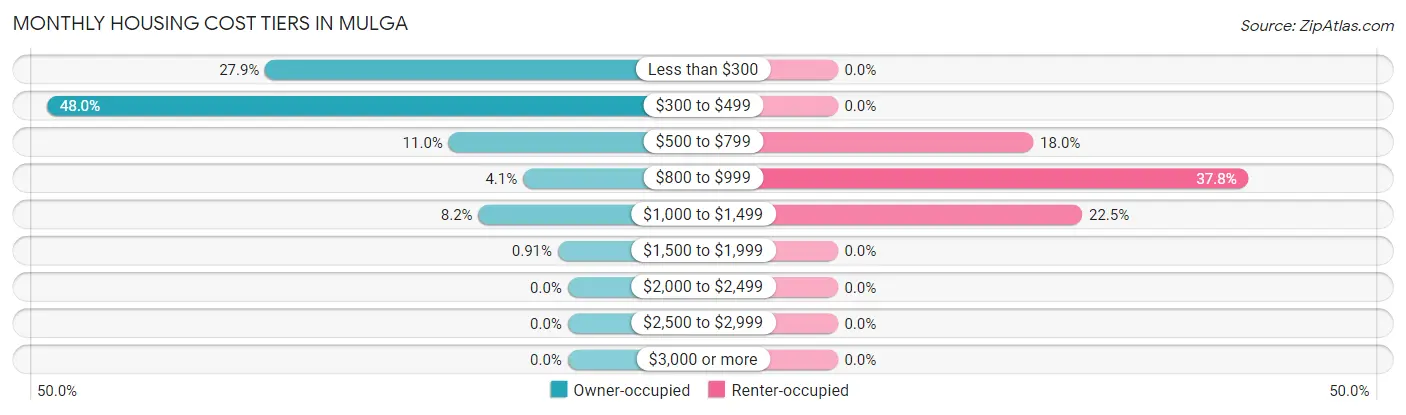
| Monthly Cost | Owner-occupied | Renter-occupied |
| Less than $300 | 61 (27.9%) | 0 (0.0%) |
| $300 to $499 | 105 (47.9%) | 0 (0.0%) |
| $500 to $799 | 24 (11.0%) | 20 (18.0%) |
| $800 to $999 | 9 (4.1%) | 42 (37.8%) |
| $1,000 to $1,499 | 18 (8.2%) | 25 (22.5%) |
| $1,500 to $1,999 | 2 (0.9%) | 0 (0.0%) |
| $2,000 to $2,499 | 0 (0.0%) | 0 (0.0%) |
| $2,500 to $2,999 | 0 (0.0%) | 0 (0.0%) |
| $3,000 or more | 0 (0.0%) | 0 (0.0%) |
| Total | 219 (100.0%) | 111 (100.0%) |
Physical Housing Characteristics in Mulga
Housing Structures in Mulga
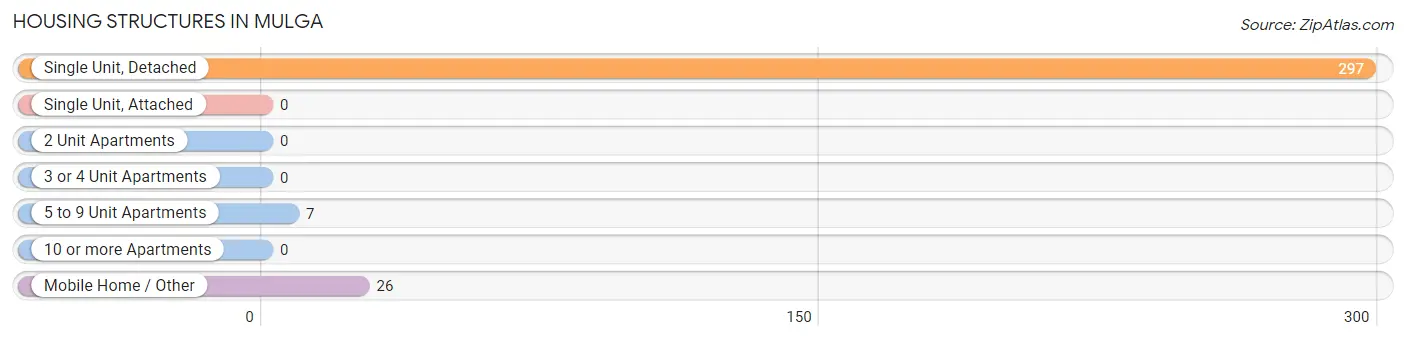
| Structure Type | # Housing Units | % Housing Units |
| Single Unit, Detached | 297 | 90.0% |
| Single Unit, Attached | 0 | 0.0% |
| 2 Unit Apartments | 0 | 0.0% |
| 3 or 4 Unit Apartments | 0 | 0.0% |
| 5 to 9 Unit Apartments | 7 | 2.1% |
| 10 or more Apartments | 0 | 0.0% |
| Mobile Home / Other | 26 | 7.9% |
| Total | 330 | 100.0% |
Housing Structures by Occupancy in Mulga
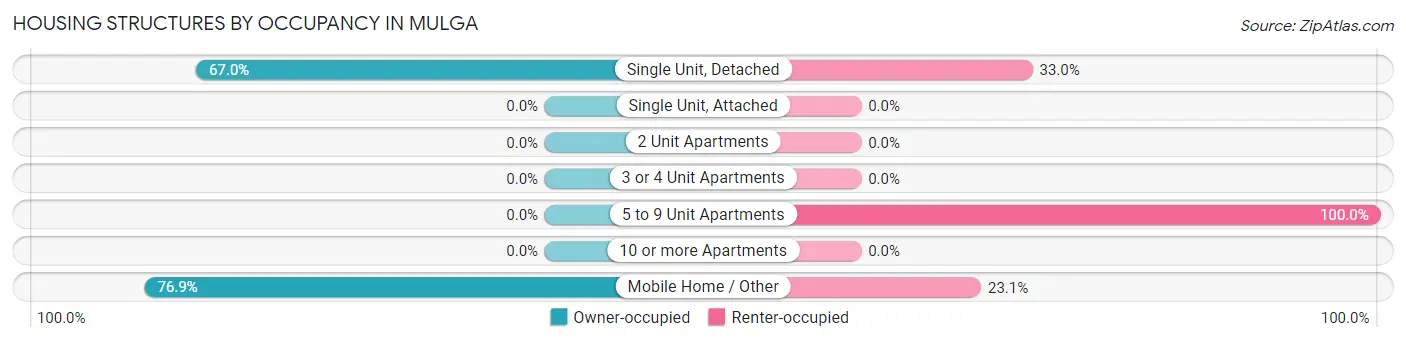
| Structure Type | Owner-occupied | Renter-occupied |
| Single Unit, Detached | 199 (67.0%) | 98 (33.0%) |
| Single Unit, Attached | 0 (0.0%) | 0 (0.0%) |
| 2 Unit Apartments | 0 (0.0%) | 0 (0.0%) |
| 3 or 4 Unit Apartments | 0 (0.0%) | 0 (0.0%) |
| 5 to 9 Unit Apartments | 0 (0.0%) | 7 (100.0%) |
| 10 or more Apartments | 0 (0.0%) | 0 (0.0%) |
| Mobile Home / Other | 20 (76.9%) | 6 (23.1%) |
| Total | 219 (66.4%) | 111 (33.6%) |
Housing Structures by Number of Rooms in Mulga
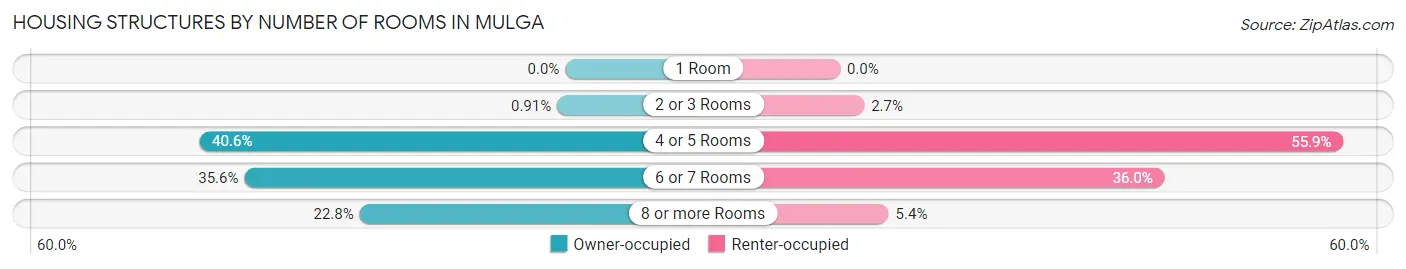
| Number of Rooms | Owner-occupied | Renter-occupied |
| 1 Room | 0 (0.0%) | 0 (0.0%) |
| 2 or 3 Rooms | 2 (0.9%) | 3 (2.7%) |
| 4 or 5 Rooms | 89 (40.6%) | 62 (55.9%) |
| 6 or 7 Rooms | 78 (35.6%) | 40 (36.0%) |
| 8 or more Rooms | 50 (22.8%) | 6 (5.4%) |
| Total | 219 (100.0%) | 111 (100.0%) |
Housing Structure by Heating Type in Mulga
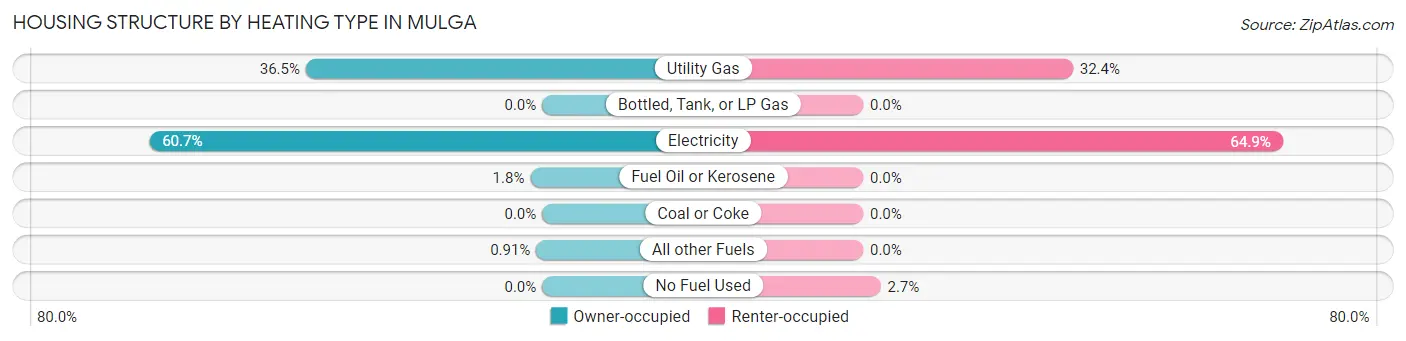
| Heating Type | Owner-occupied | Renter-occupied |
| Utility Gas | 80 (36.5%) | 36 (32.4%) |
| Bottled, Tank, or LP Gas | 0 (0.0%) | 0 (0.0%) |
| Electricity | 133 (60.7%) | 72 (64.9%) |
| Fuel Oil or Kerosene | 4 (1.8%) | 0 (0.0%) |
| Coal or Coke | 0 (0.0%) | 0 (0.0%) |
| All other Fuels | 2 (0.9%) | 0 (0.0%) |
| No Fuel Used | 0 (0.0%) | 3 (2.7%) |
| Total | 219 (100.0%) | 111 (100.0%) |
Household Vehicle Usage in Mulga
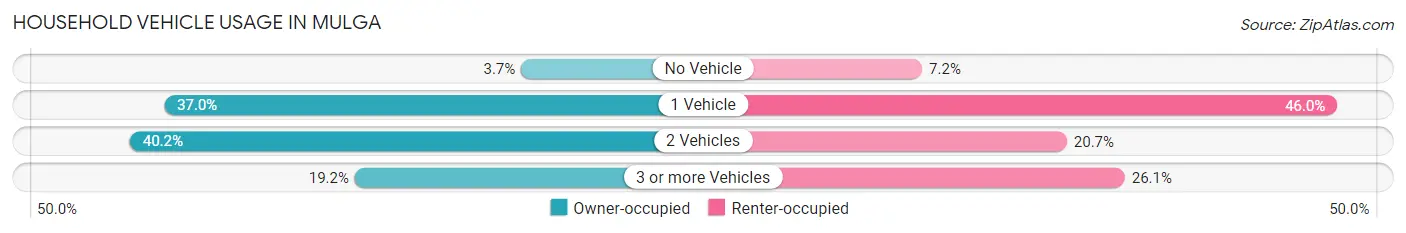
| Vehicles per Household | Owner-occupied | Renter-occupied |
| No Vehicle | 8 (3.6%) | 8 (7.2%) |
| 1 Vehicle | 81 (37.0%) | 51 (46.0%) |
| 2 Vehicles | 88 (40.2%) | 23 (20.7%) |
| 3 or more Vehicles | 42 (19.2%) | 29 (26.1%) |
| Total | 219 (100.0%) | 111 (100.0%) |
Real Estate & Mortgages in Mulga
Real Estate and Mortgage Overview in Mulga
| Characteristic | Without Mortgage | With Mortgage |
| Housing Units | 186 | 33 |
| Median Property Value | $53,800 | $81,900 |
| Median Household Income | $35,000 | $0 |
| Monthly Housing Costs | $343 | $0 |
| Real Estate Taxes | $251 | $4 |
Property Value by Mortgage Status in Mulga
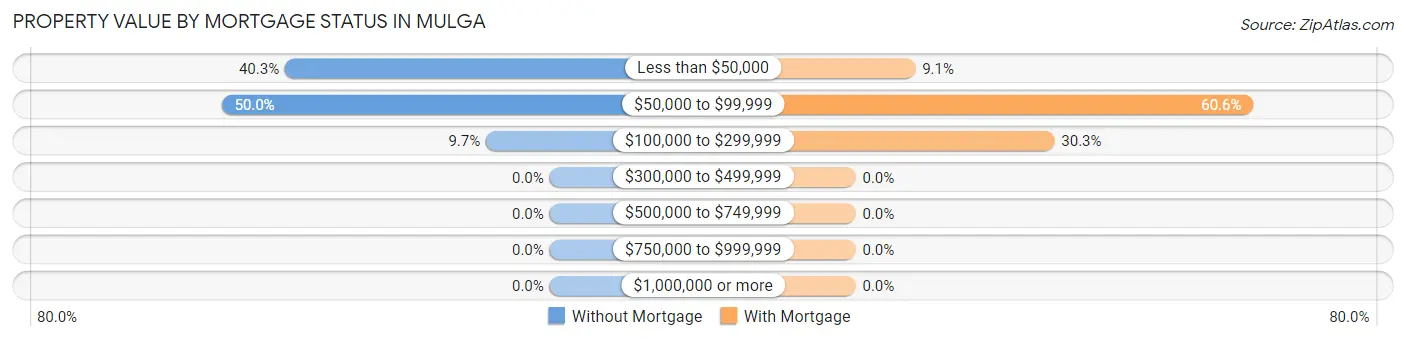
| Property Value | Without Mortgage | With Mortgage |
| Less than $50,000 | 75 (40.3%) | 3 (9.1%) |
| $50,000 to $99,999 | 93 (50.0%) | 20 (60.6%) |
| $100,000 to $299,999 | 18 (9.7%) | 10 (30.3%) |
| $300,000 to $499,999 | 0 (0.0%) | 0 (0.0%) |
| $500,000 to $749,999 | 0 (0.0%) | 0 (0.0%) |
| $750,000 to $999,999 | 0 (0.0%) | 0 (0.0%) |
| $1,000,000 or more | 0 (0.0%) | 0 (0.0%) |
| Total | 186 (100.0%) | 33 (100.0%) |
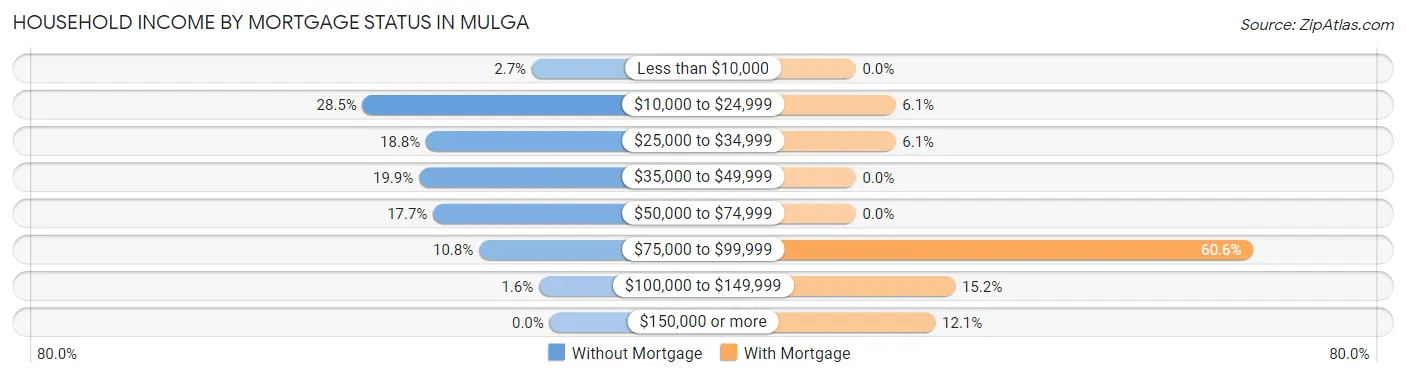
Household Income by Mortgage Status in Mulga
| Household Income | Without Mortgage | With Mortgage |
| Less than $10,000 | 5 (2.7%) | 0 (0.0%) |
| $10,000 to $24,999 | 53 (28.5%) | 2 (6.1%) |
| $25,000 to $34,999 | 35 (18.8%) | 2 (6.1%) |
| $35,000 to $49,999 | 37 (19.9%) | 0 (0.0%) |
| $50,000 to $74,999 | 33 (17.7%) | 0 (0.0%) |
| $75,000 to $99,999 | 20 (10.7%) | 20 (60.6%) |
| $100,000 to $149,999 | 3 (1.6%) | 5 (15.1%) |
| $150,000 or more | 0 (0.0%) | 4 (12.1%) |
| Total | 186 (100.0%) | 33 (100.0%) |
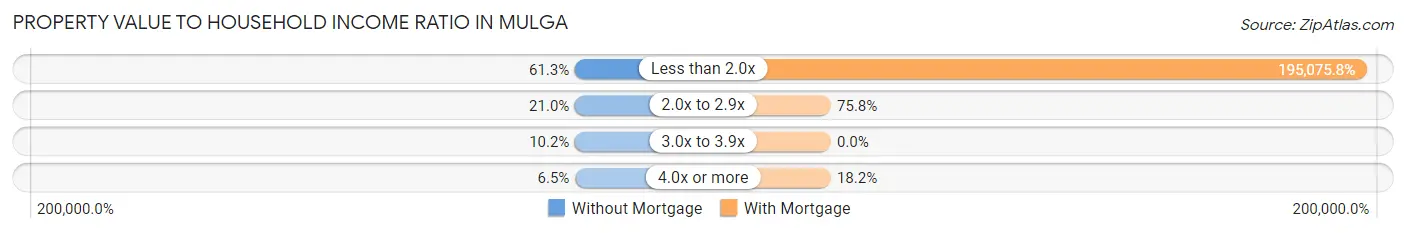
Property Value to Household Income Ratio in Mulga
| Value-to-Income Ratio | Without Mortgage | With Mortgage |
| Less than 2.0x | 114 (61.3%) | 64,375 (195,075.8%) |
| 2.0x to 2.9x | 39 (21.0%) | 25 (75.8%) |
| 3.0x to 3.9x | 19 (10.2%) | 0 (0.0%) |
| 4.0x or more | 12 (6.5%) | 6 (18.2%) |
| Total | 186 (100.0%) | 33 (100.0%) |
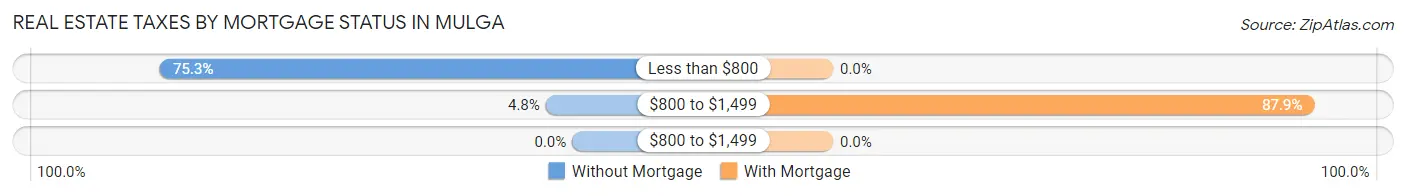
Real Estate Taxes by Mortgage Status in Mulga
| Property Taxes | Without Mortgage | With Mortgage |
| Less than $800 | 140 (75.3%) | 0 (0.0%) |
| $800 to $1,499 | 9 (4.8%) | 29 (87.9%) |
| $800 to $1,499 | 0 (0.0%) | 0 (0.0%) |
| Total | 186 (100.0%) | 33 (100.0%) |
Health & Disability in Mulga
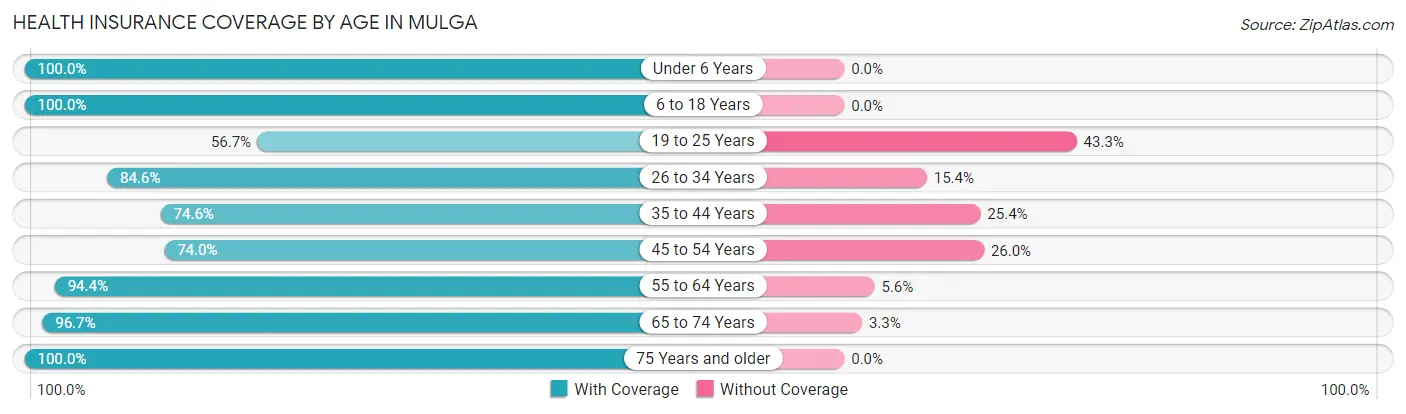
Health Insurance Coverage by Age in Mulga
| Age Bracket | With Coverage | Without Coverage |
| Under 6 Years | 46 (100.0%) | 0 (0.0%) |
| 6 to 18 Years | 47 (100.0%) | 0 (0.0%) |
| 19 to 25 Years | 34 (56.7%) | 26 (43.3%) |
| 26 to 34 Years | 44 (84.6%) | 8 (15.4%) |
| 35 to 44 Years | 97 (74.6%) | 33 (25.4%) |
| 45 to 54 Years | 71 (74.0%) | 25 (26.0%) |
| 55 to 64 Years | 134 (94.4%) | 8 (5.6%) |
| 65 to 74 Years | 88 (96.7%) | 3 (3.3%) |
| 75 Years and older | 53 (100.0%) | 0 (0.0%) |
| Total | 614 (85.6%) | 103 (14.4%) |
Health Insurance Coverage by Citizenship Status in Mulga

| Citizenship Status | With Coverage | Without Coverage |
| Native Born | 46 (100.0%) | 0 (0.0%) |
| Foreign Born, Citizen | 47 (100.0%) | 0 (0.0%) |
| Foreign Born, not a Citizen | 34 (56.7%) | 26 (43.3%) |
Health Insurance Coverage by Household Income in Mulga
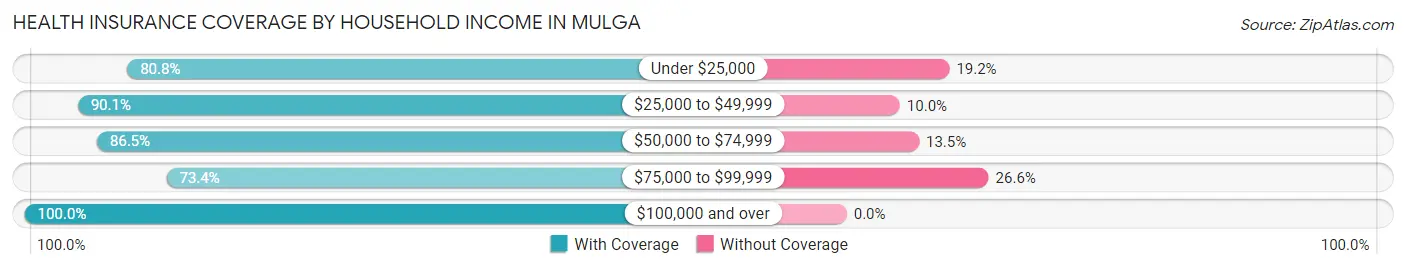
| Household Income | With Coverage | Without Coverage |
| Under $25,000 | 147 (80.8%) | 35 (19.2%) |
| $25,000 to $49,999 | 190 (90.0%) | 21 (10.0%) |
| $50,000 to $74,999 | 166 (86.5%) | 26 (13.5%) |
| $75,000 to $99,999 | 58 (73.4%) | 21 (26.6%) |
| $100,000 and over | 53 (100.0%) | 0 (0.0%) |
Public vs Private Health Insurance Coverage by Age in Mulga
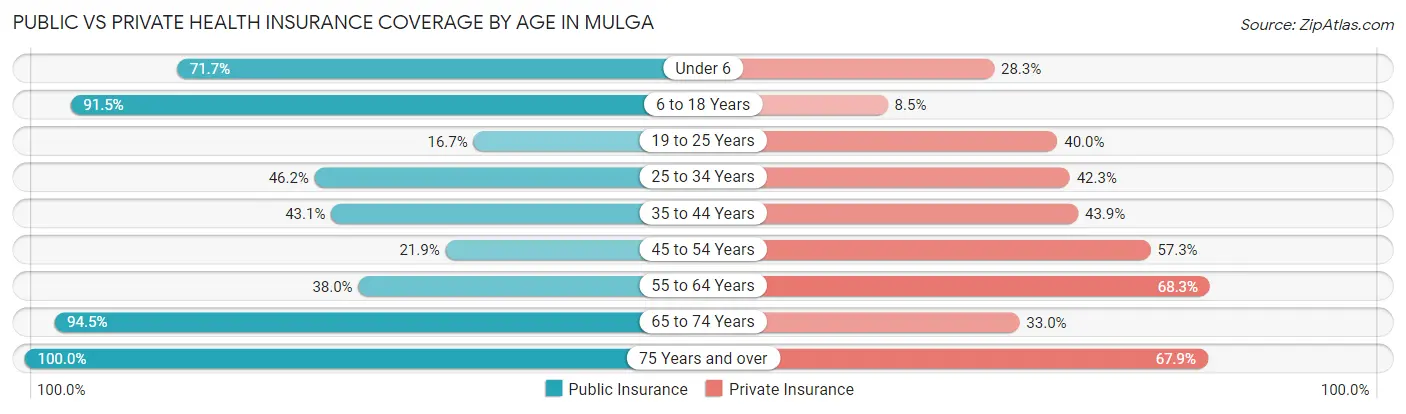
| Age Bracket | Public Insurance | Private Insurance |
| Under 6 | 33 (71.7%) | 13 (28.3%) |
| 6 to 18 Years | 43 (91.5%) | 4 (8.5%) |
| 19 to 25 Years | 10 (16.7%) | 24 (40.0%) |
| 25 to 34 Years | 24 (46.2%) | 22 (42.3%) |
| 35 to 44 Years | 56 (43.1%) | 57 (43.9%) |
| 45 to 54 Years | 21 (21.9%) | 55 (57.3%) |
| 55 to 64 Years | 54 (38.0%) | 97 (68.3%) |
| 65 to 74 Years | 86 (94.5%) | 30 (33.0%) |
| 75 Years and over | 53 (100.0%) | 36 (67.9%) |
| Total | 380 (53.0%) | 338 (47.1%) |
Disability Status by Sex by Age in Mulga
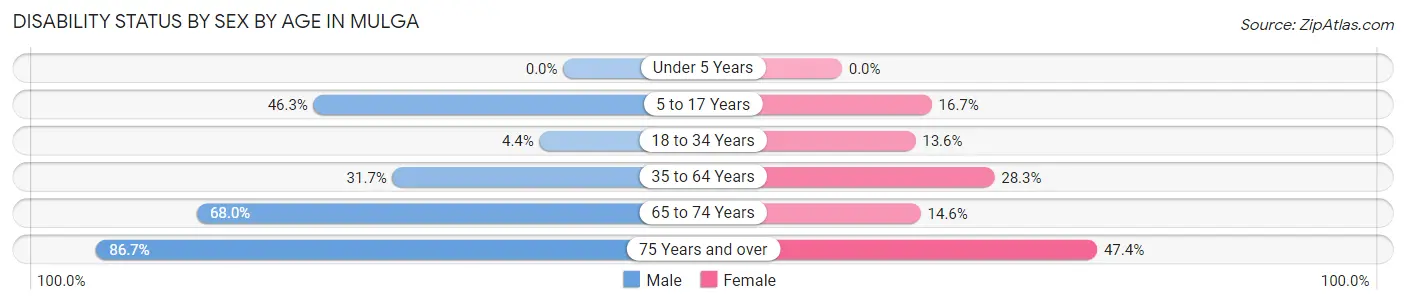
| Age Bracket | Male | Female |
| Under 5 Years | 0 (0.0%) | 0 (0.0%) |
| 5 to 17 Years | 19 (46.3%) | 3 (16.7%) |
| 18 to 34 Years | 3 (4.4%) | 6 (13.6%) |
| 35 to 64 Years | 64 (31.7%) | 47 (28.3%) |
| 65 to 74 Years | 34 (68.0%) | 6 (14.6%) |
| 75 Years and over | 13 (86.7%) | 18 (47.4%) |
Disability Class by Sex by Age in Mulga
Disability Class: Hearing Difficulty
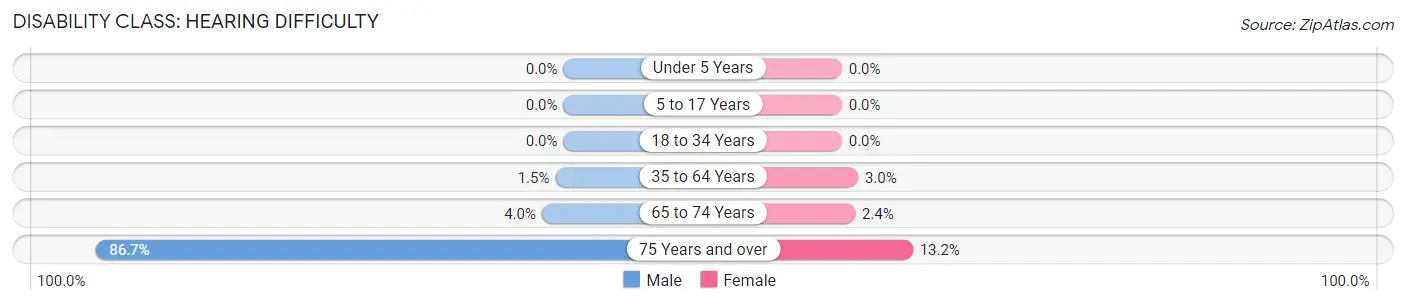
| Age Bracket | Male | Female |
| Under 5 Years | 0 (0.0%) | 0 (0.0%) |
| 5 to 17 Years | 0 (0.0%) | 0 (0.0%) |
| 18 to 34 Years | 0 (0.0%) | 0 (0.0%) |
| 35 to 64 Years | 3 (1.5%) | 5 (3.0%) |
| 65 to 74 Years | 2 (4.0%) | 1 (2.4%) |
| 75 Years and over | 13 (86.7%) | 5 (13.2%) |
Disability Class: Vision Difficulty
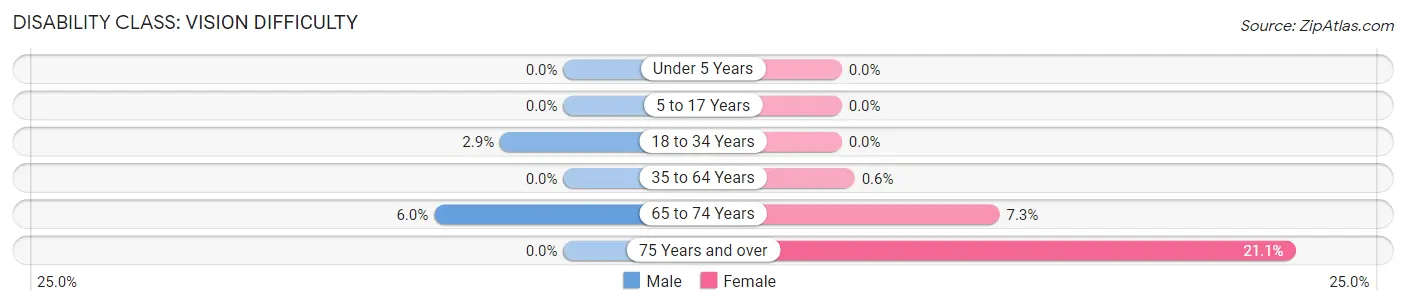
| Age Bracket | Male | Female |
| Under 5 Years | 0 (0.0%) | 0 (0.0%) |
| 5 to 17 Years | 0 (0.0%) | 0 (0.0%) |
| 18 to 34 Years | 2 (2.9%) | 0 (0.0%) |
| 35 to 64 Years | 0 (0.0%) | 1 (0.6%) |
| 65 to 74 Years | 3 (6.0%) | 3 (7.3%) |
| 75 Years and over | 0 (0.0%) | 8 (21.0%) |
Disability Class: Cognitive Difficulty
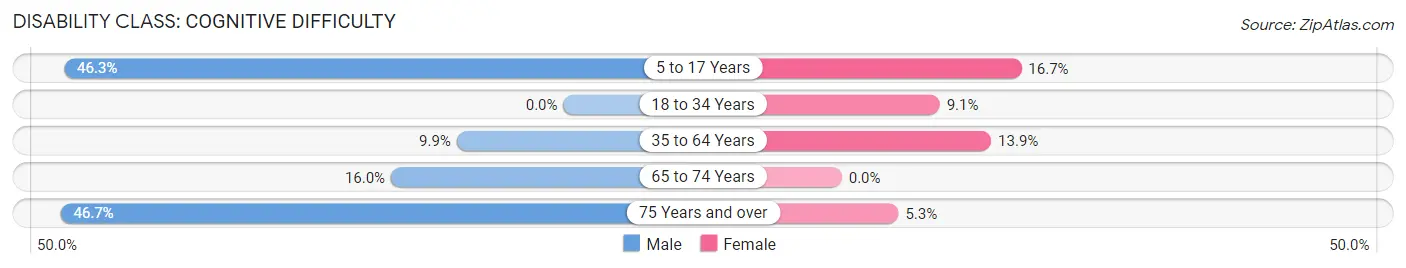
| Age Bracket | Male | Female |
| 5 to 17 Years | 19 (46.3%) | 3 (16.7%) |
| 18 to 34 Years | 0 (0.0%) | 4 (9.1%) |
| 35 to 64 Years | 20 (9.9%) | 23 (13.9%) |
| 65 to 74 Years | 8 (16.0%) | 0 (0.0%) |
| 75 Years and over | 7 (46.7%) | 2 (5.3%) |
Disability Class: Ambulatory Difficulty
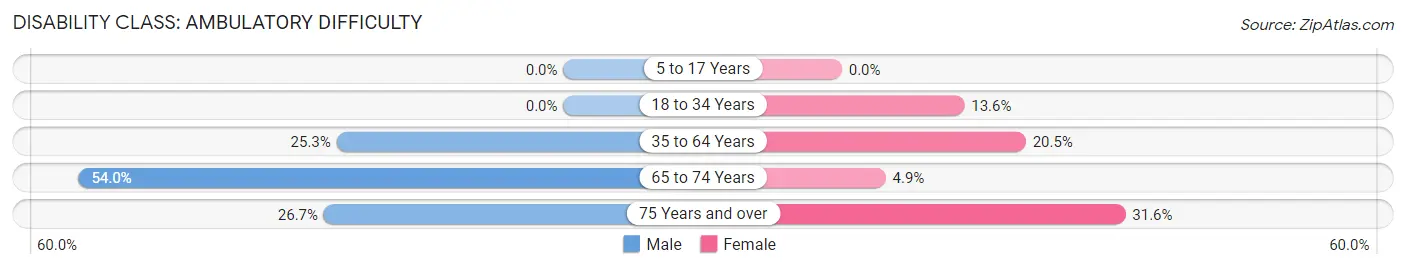
| Age Bracket | Male | Female |
| 5 to 17 Years | 0 (0.0%) | 0 (0.0%) |
| 18 to 34 Years | 0 (0.0%) | 6 (13.6%) |
| 35 to 64 Years | 51 (25.3%) | 34 (20.5%) |
| 65 to 74 Years | 27 (54.0%) | 2 (4.9%) |
| 75 Years and over | 4 (26.7%) | 12 (31.6%) |
Disability Class: Self-Care Difficulty
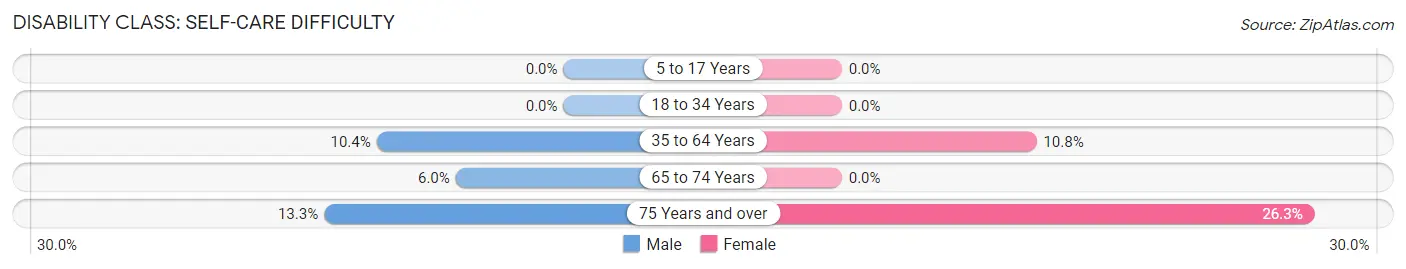
| Age Bracket | Male | Female |
| 5 to 17 Years | 0 (0.0%) | 0 (0.0%) |
| 18 to 34 Years | 0 (0.0%) | 0 (0.0%) |
| 35 to 64 Years | 21 (10.4%) | 18 (10.8%) |
| 65 to 74 Years | 3 (6.0%) | 0 (0.0%) |
| 75 Years and over | 2 (13.3%) | 10 (26.3%) |
Technology Access in Mulga
Computing Device Access in Mulga
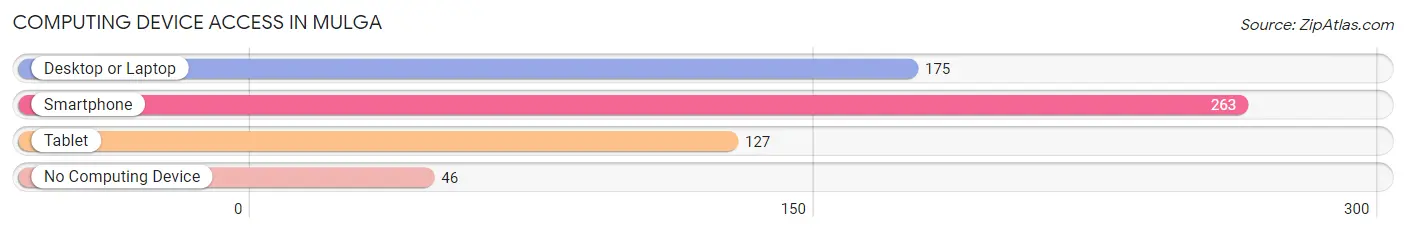
| Device Type | # Households | % Households |
| Desktop or Laptop | 175 | 53.0% |
| Smartphone | 263 | 79.7% |
| Tablet | 127 | 38.5% |
| No Computing Device | 46 | 13.9% |
| Total | 330 | 100.0% |
Internet Access in Mulga
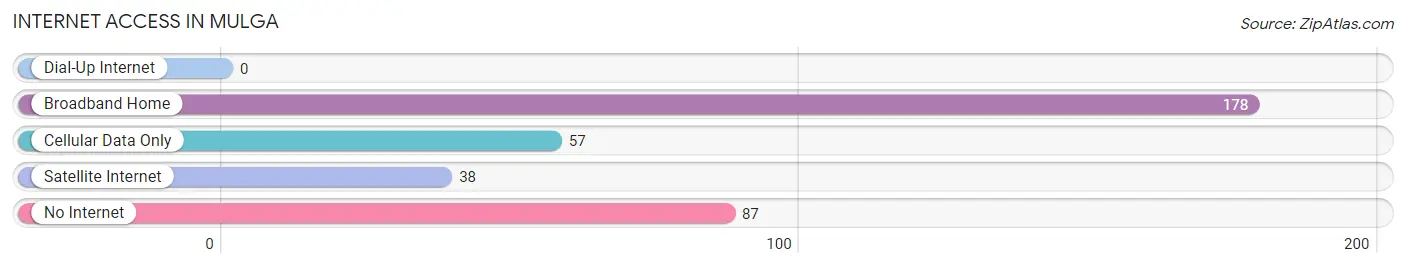
| Internet Type | # Households | % Households |
| Dial-Up Internet | 0 | 0.0% |
| Broadband Home | 178 | 53.9% |
| Cellular Data Only | 57 | 17.3% |
| Satellite Internet | 38 | 11.5% |
| No Internet | 87 | 26.4% |
| Total | 330 | 100.0% |
Mulga Summary
Mulga is a small unincorporated community located in Jefferson County, Alabama. It is situated approximately 15 miles west of Birmingham and is part of the Birmingham-Hoover Metropolitan Statistical Area. The population of Mulga was estimated to be 1,845 in 2019.
History
Mulga was founded in the late 19th century and was originally known as “Mulga Station”. The name was derived from the Choctaw word “mulgah”, which means “red clay”. The area was originally inhabited by Native Americans, and the first settlers were mostly farmers. The town was officially incorporated in 1901.
In the early 20th century, Mulga was a thriving community with a variety of businesses, including a general store, a blacksmith shop, a cotton gin, and a sawmill. The town also had a post office, a school, and a church.
In the 1950s, the town began to decline as many of its residents moved away in search of better economic opportunities. The decline continued into the 1970s, when the town’s population dropped to just over 500.
Geography
Mulga is located in the foothills of the Appalachian Mountains, and the terrain is mostly hilly. The town is situated at an elevation of 845 feet above sea level. The climate is humid subtropical, with hot summers and mild winters.
The town is located near the Mulga Wildlife Management Area, which is a popular destination for hunting and fishing. The area is also home to several state parks, including Oak Mountain State Park and Tannehill Ironworks Historical State Park.
Economy
Mulga’s economy is largely based on agriculture. The town is home to several farms, which produce a variety of crops, including corn, soybeans, and cotton. The town also has a few small businesses, including a gas station, a convenience store, and a restaurant.
Demographics
As of the 2010 census, the population of Mulga was 1,845. The racial makeup of the town was 79.3% White, 17.2% African American, 0.3% Native American, 0.2% Asian, 0.1% Pacific Islander, and 2.9% from other races. The median household income was $31,250, and the median family income was $37,500.
Conclusion
Mulga is a small unincorporated community located in Jefferson County, Alabama. It is situated approximately 15 miles west of Birmingham and is part of the Birmingham-Hoover Metropolitan Statistical Area. The town has a long history, and its economy is largely based on agriculture. The population of Mulga was estimated to be 1,845 in 2019, and the racial makeup of the town was 79.3% White, 17.2% African American, 0.3% Native American, 0.2% Asian, 0.1% Pacific Islander, and 2.9% from other races.
Common Questions
What is Per Capita Income in Mulga?
Per Capita income in Mulga is $26,388.
What is the Median Family Income in Mulga?
Median Family Income in Mulga is $47,500.
What is the Median Household income in Mulga?
Median Household Income in Mulga is $37,692.
What is Income or Wage Gap in Mulga?
Income or Wage Gap in Mulga is 3.3%.
Women in Mulga earn 96.7 cents for every dollar earned by a man.
What is Inequality or Gini Index in Mulga?
Inequality or Gini Index in Mulga is 0.49.
What is the Total Population of Mulga?
Total Population of Mulga is 720.
What is the Total Male Population of Mulga?
Total Male Population of Mulga is 400.
What is the Total Female Population of Mulga?
Total Female Population of Mulga is 320.
What is the Ratio of Males per 100 Females in Mulga?
There are 125.00 Males per 100 Females in Mulga.
What is the Ratio of Females per 100 Males in Mulga?
There are 80.00 Females per 100 Males in Mulga.
What is the Median Population Age in Mulga?
Median Population Age in Mulga is 47.6 Years.
What is the Average Family Size in Mulga
Average Family Size in Mulga is 2.6 People.
What is the Average Household Size in Mulga
Average Household Size in Mulga is 2.2 People.
How Large is the Labor Force in Mulga?
There are 336 People in the Labor Forcein in Mulga.
What is the Percentage of People in the Labor Force in Mulga?
52.9% of People are in the Labor Force in Mulga.
What is the Unemployment Rate in Mulga?
Unemployment Rate in Mulga is 2.7%.