Marion, AL Map & Demographics
Marion Map
Marion Overview
$13,413
PER CAPITA INCOME
$42,383
AVG FAMILY INCOME
$36,618
AVG HOUSEHOLD INCOME
58.2%
WAGE / INCOME GAP [ % ]
41.8¢/ $1
WAGE / INCOME GAP [ $ ]
$12,648
FAMILY INCOME DEFICIT
0.40
INEQUALITY / GINI INDEX
3,128
TOTAL POPULATION
1,345
MALE POPULATION
1,783
FEMALE POPULATION
75.43
MALES / 100 FEMALES
132.57
FEMALES / 100 MALES
23.6
MEDIAN AGE
3.6
AVG FAMILY SIZE
2.8
AVG HOUSEHOLD SIZE
903
LABOR FORCE [ PEOPLE ]
35.8%
PERCENT IN LABOR FORCE
18.7%
UNEMPLOYMENT RATE
Marion Zip Codes
Marion Area Codes
Income in Marion
Income Overview in Marion
Per Capita Income in Marion is $13,413, while median incomes of families and households are $42,383 and $36,618 respectively.
| Characteristic | Number | Measure |
| Per Capita Income | 3,128 | $13,413 |
| Median Family Income | 531 | $42,383 |
| Mean Family Income | 531 | $52,786 |
| Median Household Income | 784 | $36,618 |
| Mean Household Income | 784 | $45,589 |
| Income Deficit | 531 | $12,648 |
| Wage / Income Gap (%) | 3,128 | 58.17% |
| Wage / Income Gap ($) | 3,128 | 41.83¢ per $1 |
| Gini / Inequality Index | 3,128 | 0.40 |
Earnings by Sex in Marion
Average Earnings in Marion are $16,384, $9,019 for men and $21,560 for women, a difference of 58.2%.
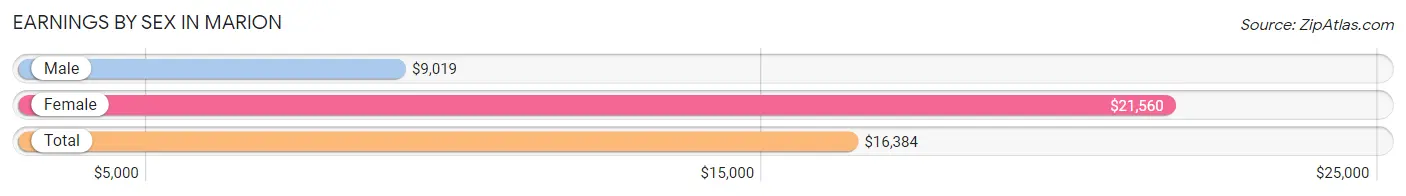
| Sex | Number | Average Earnings |
| Male | 367 (35.0%) | $9,019 |
| Female | 681 (65.0%) | $21,560 |
| Total | 1,048 (100.0%) | $16,384 |
Earnings by Sex by Income Bracket in Marion
The most common earnings brackets in Marion are $7,500 to $9,999 for men (167 | 45.5%) and $20,000 to $22,499 for women (137 | 20.1%).
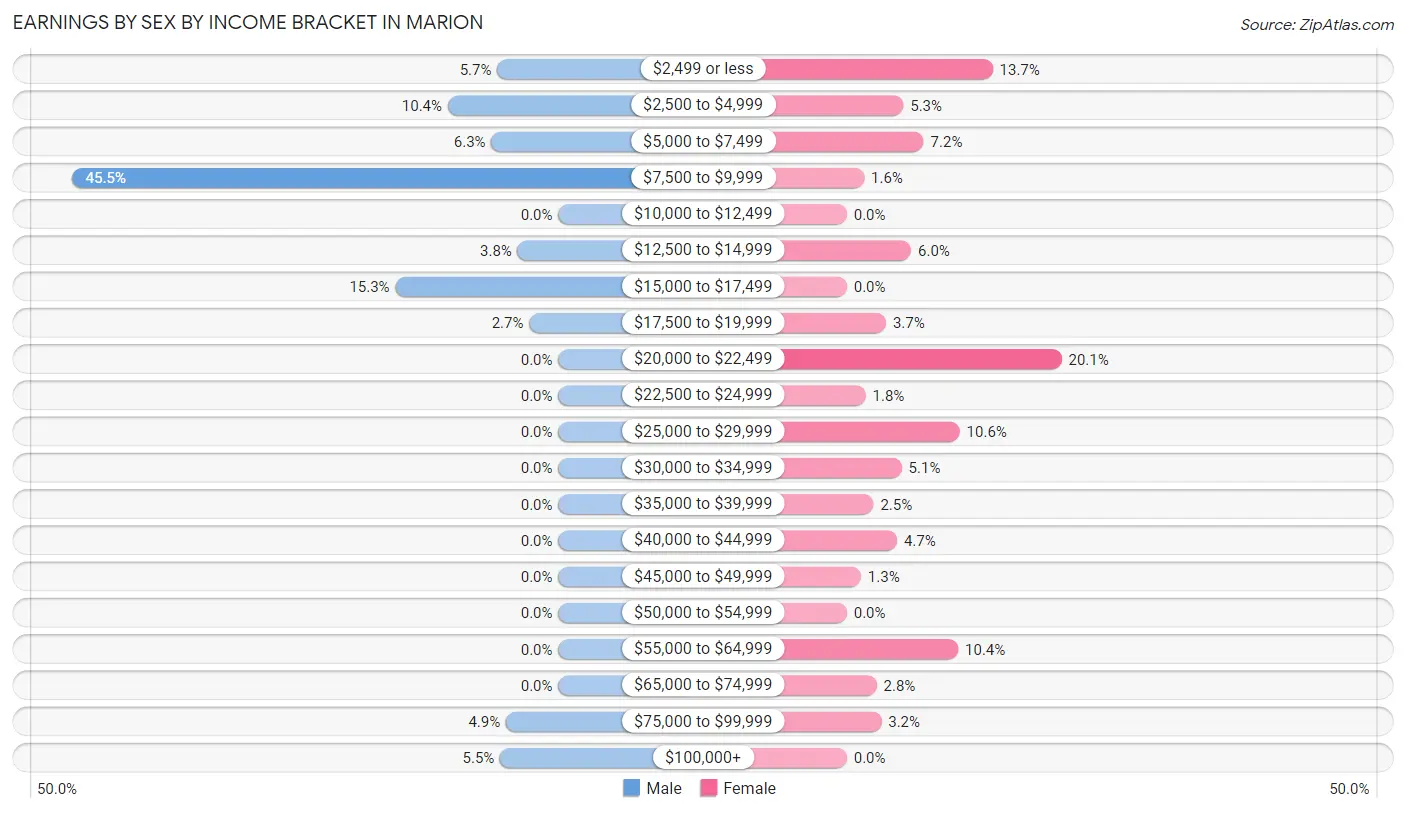
| Income | Male | Female |
| $2,499 or less | 21 (5.7%) | 93 (13.7%) |
| $2,500 to $4,999 | 38 (10.3%) | 36 (5.3%) |
| $5,000 to $7,499 | 23 (6.3%) | 49 (7.2%) |
| $7,500 to $9,999 | 167 (45.5%) | 11 (1.6%) |
| $10,000 to $12,499 | 0 (0.0%) | 0 (0.0%) |
| $12,500 to $14,999 | 14 (3.8%) | 41 (6.0%) |
| $15,000 to $17,499 | 56 (15.3%) | 0 (0.0%) |
| $17,500 to $19,999 | 10 (2.7%) | 25 (3.7%) |
| $20,000 to $22,499 | 0 (0.0%) | 137 (20.1%) |
| $22,500 to $24,999 | 0 (0.0%) | 12 (1.8%) |
| $25,000 to $29,999 | 0 (0.0%) | 72 (10.6%) |
| $30,000 to $34,999 | 0 (0.0%) | 35 (5.1%) |
| $35,000 to $39,999 | 0 (0.0%) | 17 (2.5%) |
| $40,000 to $44,999 | 0 (0.0%) | 32 (4.7%) |
| $45,000 to $49,999 | 0 (0.0%) | 9 (1.3%) |
| $50,000 to $54,999 | 0 (0.0%) | 0 (0.0%) |
| $55,000 to $64,999 | 0 (0.0%) | 71 (10.4%) |
| $65,000 to $74,999 | 0 (0.0%) | 19 (2.8%) |
| $75,000 to $99,999 | 18 (4.9%) | 22 (3.2%) |
| $100,000+ | 20 (5.4%) | 0 (0.0%) |
| Total | 367 (100.0%) | 681 (100.0%) |
Earnings by Sex by Educational Attainment in Marion
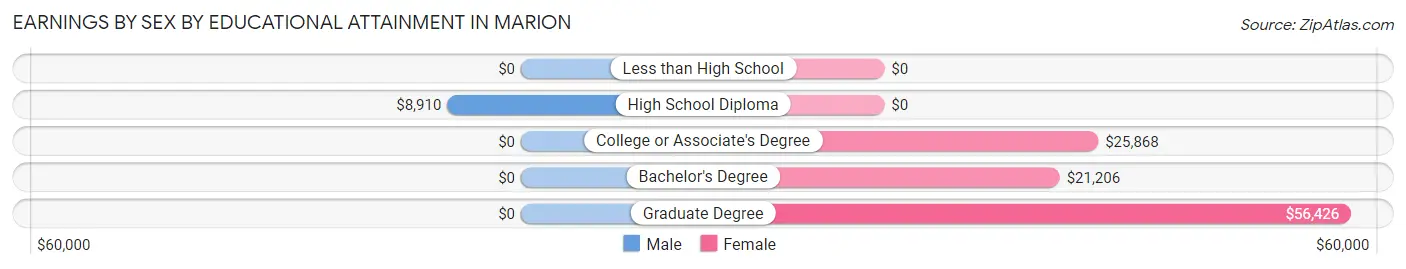
| Educational Attainment | Male Income | Female Income |
| Less than High School | - | - |
| High School Diploma | $8,910 | $0 |
| College or Associate's Degree | - | - |
| Bachelor's Degree | - | - |
| Graduate Degree | - | - |
| Total | - | - |
Family Income in Marion
Family Income Brackets in Marion
According to the Marion family income data, there are 133 families falling into the $35,000 to $49,999 income range, which is the most common income bracket and makes up 25.1% of all families.
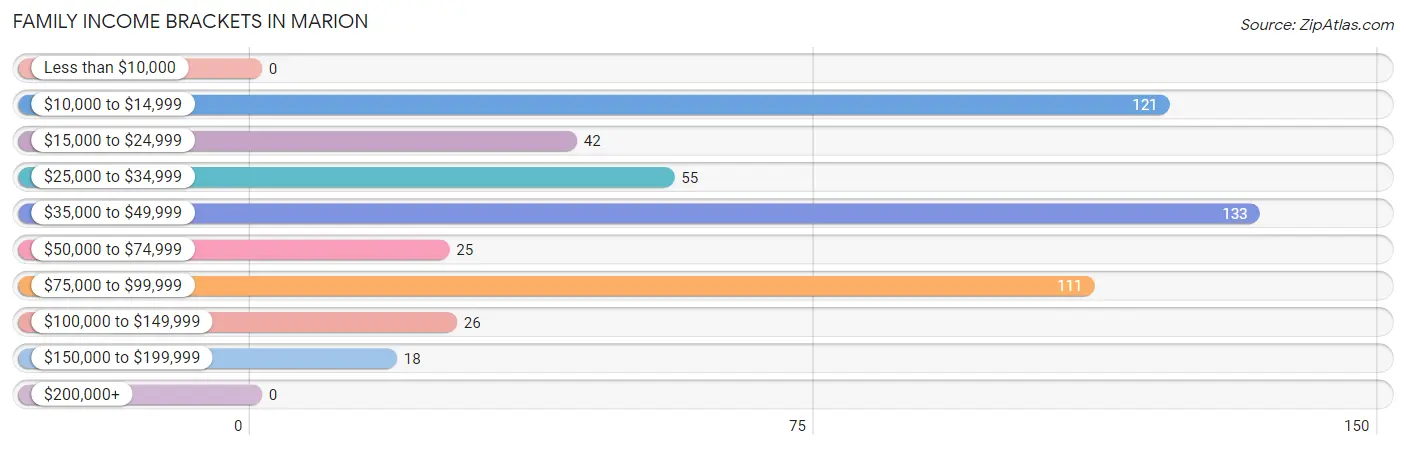
| Income Bracket | # Families | % Families |
| Less than $10,000 | 0 | 0.0% |
| $10,000 to $14,999 | 121 | 22.8% |
| $15,000 to $24,999 | 42 | 7.9% |
| $25,000 to $34,999 | 55 | 10.4% |
| $35,000 to $49,999 | 133 | 25.0% |
| $50,000 to $74,999 | 25 | 4.7% |
| $75,000 to $99,999 | 111 | 20.9% |
| $100,000 to $149,999 | 26 | 4.9% |
| $150,000 to $199,999 | 18 | 3.4% |
| $200,000+ | 0 | 0.0% |
Family Income by Famaliy Size in Marion
3-person families (198 | 37.3%) account for the highest median family income in Marion with $45,382 per family, while 3-person families (198 | 37.3%) have the highest median income of $15,127 per family member.
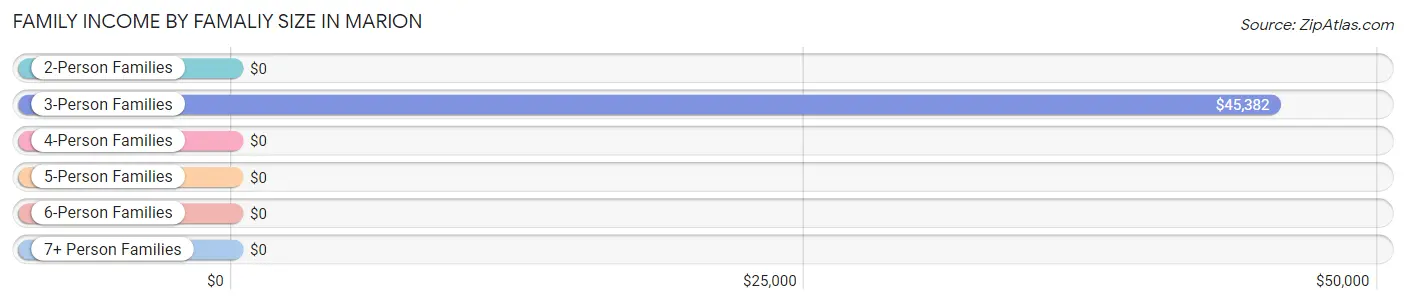
| Income Bracket | # Families | Median Income |
| 2-Person Families | 157 (29.6%) | $0 |
| 3-Person Families | 198 (37.3%) | $45,382 |
| 4-Person Families | 176 (33.2%) | $0 |
| 5-Person Families | 0 (0.0%) | $0 |
| 6-Person Families | 0 (0.0%) | $0 |
| 7+ Person Families | 0 (0.0%) | $0 |
| Total | 531 (100.0%) | $42,383 |
Family Income by Number of Earners in Marion
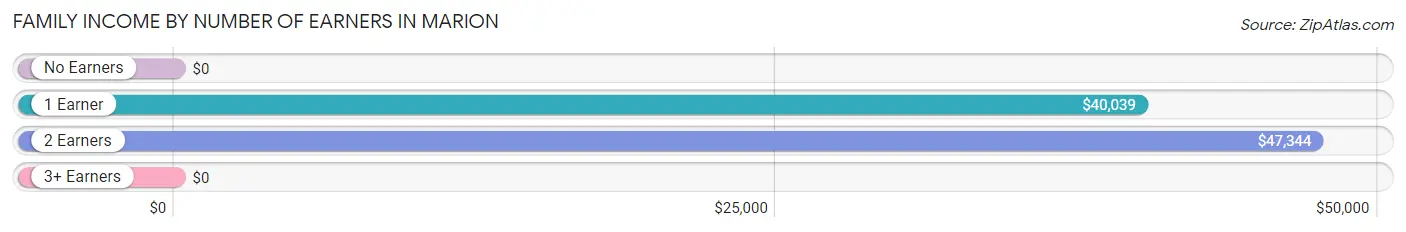
| Number of Earners | # Families | Median Income |
| No Earners | 192 (36.2%) | $0 |
| 1 Earner | 195 (36.7%) | $40,039 |
| 2 Earners | 135 (25.4%) | $47,344 |
| 3+ Earners | 9 (1.7%) | $0 |
| Total | 531 (100.0%) | $42,383 |
Household Income in Marion
Household Income Brackets in Marion
With 192 households falling in the category, the $35,000 to $49,999 income range is the most frequent in Marion, accounting for 24.5% of all households.
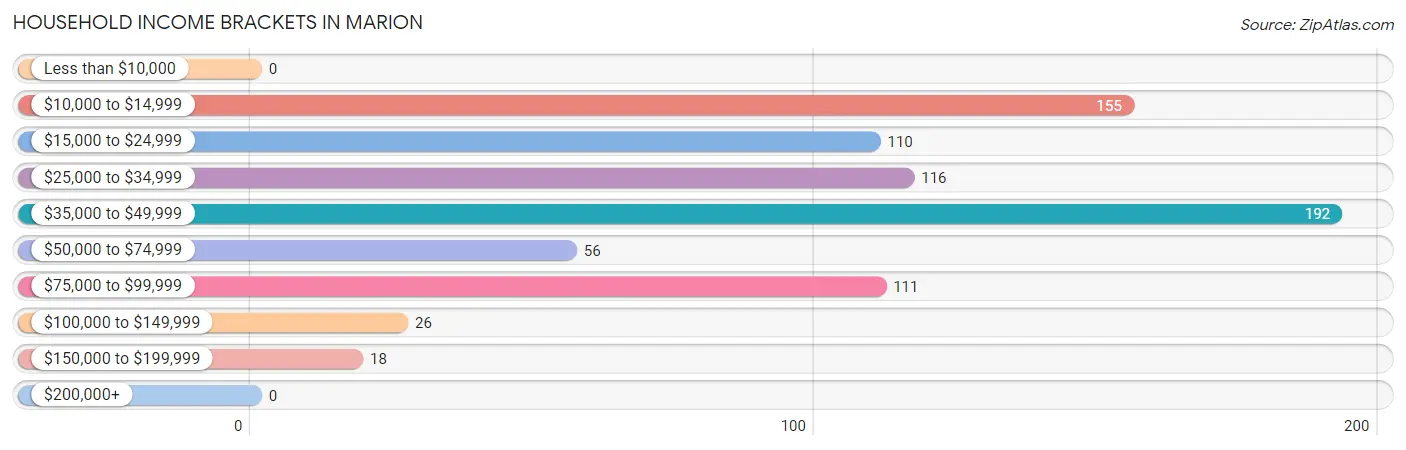
| Income Bracket | # Households | % Households |
| Less than $10,000 | 0 | 0.0% |
| $10,000 to $14,999 | 155 | 19.8% |
| $15,000 to $24,999 | 110 | 14.0% |
| $25,000 to $34,999 | 116 | 14.8% |
| $35,000 to $49,999 | 192 | 24.5% |
| $50,000 to $74,999 | 56 | 7.1% |
| $75,000 to $99,999 | 111 | 14.2% |
| $100,000 to $149,999 | 26 | 3.3% |
| $150,000 to $199,999 | 18 | 2.3% |
| $200,000+ | 0 | 0.0% |
Household Income by Householder Age in Marion
The median household income in Marion is $36,618, with the highest median household income of $46,404 found in the 45 to 64 years age bracket for the primary householder. A total of 269 households (34.3%) fall into this category. Meanwhile, the 15 to 24 years age bracket for the primary householder has the lowest median household income of $0, with 65 households (8.3%) in this group.
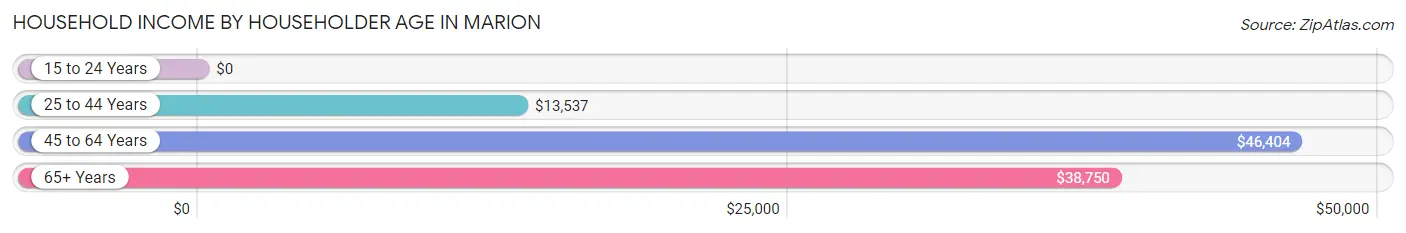
| Income Bracket | # Households | Median Income |
| 15 to 24 Years | 65 (8.3%) | $0 |
| 25 to 44 Years | 194 (24.7%) | $13,537 |
| 45 to 64 Years | 269 (34.3%) | $46,404 |
| 65+ Years | 256 (32.7%) | $38,750 |
| Total | 784 (100.0%) | $36,618 |
Poverty in Marion
Income Below Poverty by Sex and Age in Marion
With 13.5% poverty level for males and 33.3% for females among the residents of Marion, under 5 year old males and 12 to 14 year old females are the most vulnerable to poverty, with 38 males (49.3%) and 60 females (100.0%) in their respective age groups living below the poverty level.
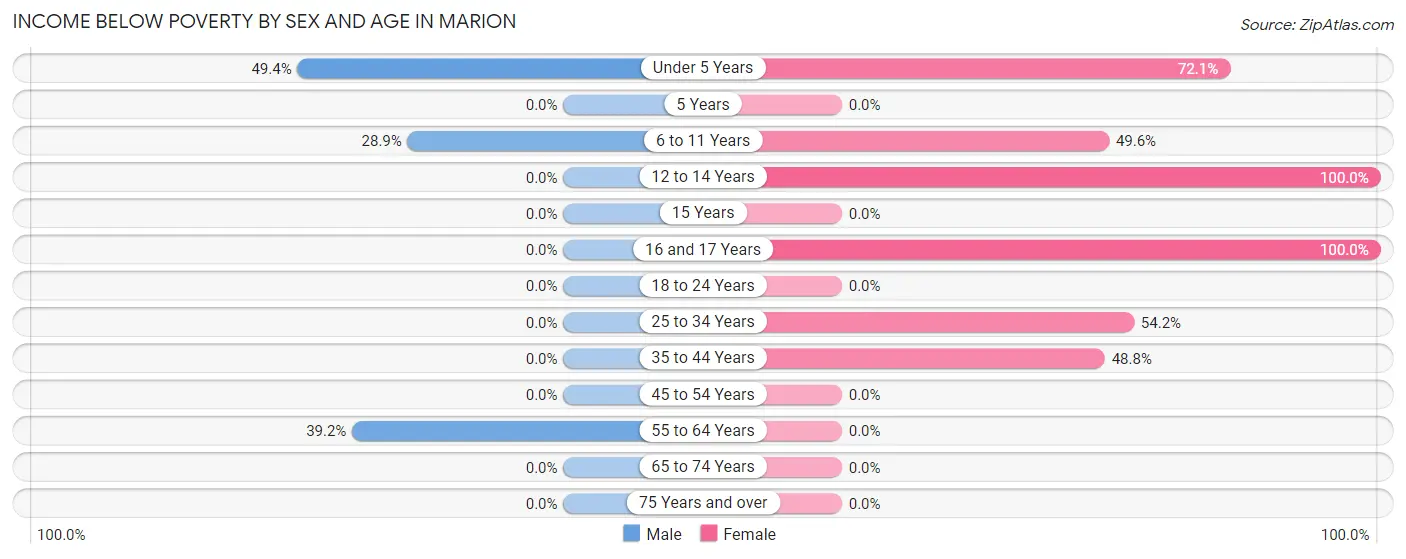
| Age Bracket | Male | Female |
| Under 5 Years | 38 (49.3%) | 98 (72.1%) |
| 5 Years | 0 (0.0%) | 0 (0.0%) |
| 6 to 11 Years | 61 (28.9%) | 60 (49.6%) |
| 12 to 14 Years | 0 (0.0%) | 60 (100.0%) |
| 15 Years | 0 (0.0%) | 0 (0.0%) |
| 16 and 17 Years | 0 (0.0%) | 35 (100.0%) |
| 18 to 24 Years | 0 (0.0%) | 0 (0.0%) |
| 25 to 34 Years | 0 (0.0%) | 122 (54.2%) |
| 35 to 44 Years | 0 (0.0%) | 41 (48.8%) |
| 45 to 54 Years | 0 (0.0%) | 0 (0.0%) |
| 55 to 64 Years | 29 (39.2%) | 0 (0.0%) |
| 65 to 74 Years | 0 (0.0%) | 0 (0.0%) |
| 75 Years and over | 0 (0.0%) | 0 (0.0%) |
| Total | 128 (13.5%) | 416 (33.3%) |
Income Above Poverty by Sex and Age in Marion
According to the poverty statistics in Marion, males aged 18 to 24 years and females aged 18 to 24 years are the age groups that are most secure financially, with 100.0% of males and 100.0% of females in these age groups living above the poverty line.
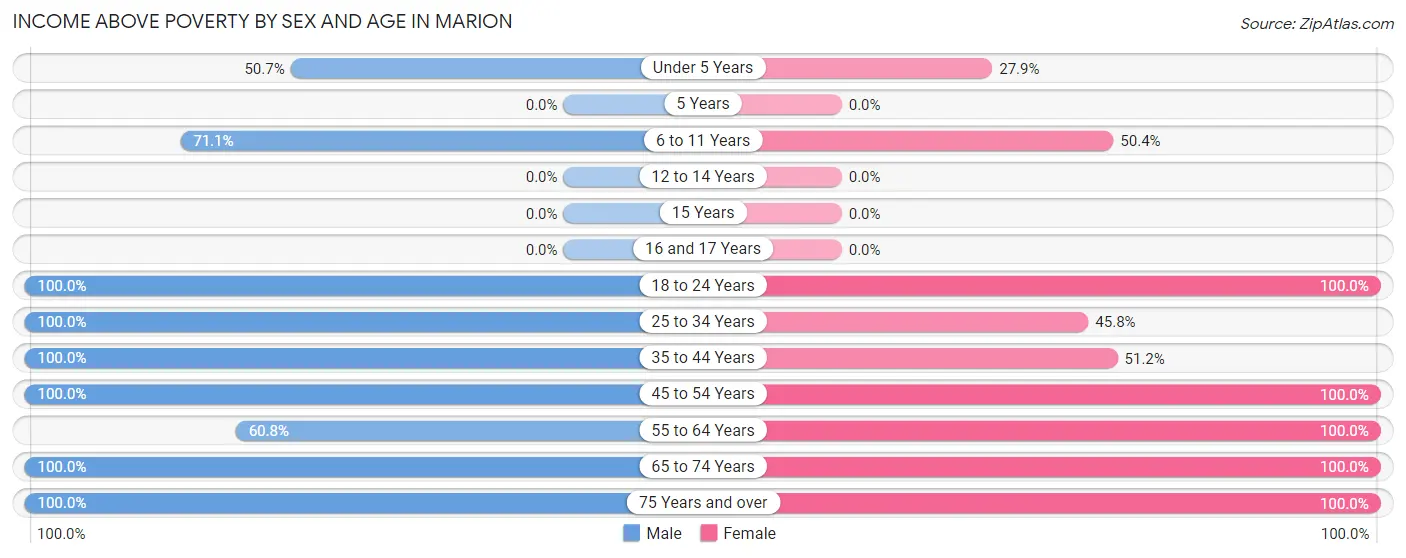
| Age Bracket | Male | Female |
| Under 5 Years | 39 (50.6%) | 38 (27.9%) |
| 5 Years | 0 (0.0%) | 0 (0.0%) |
| 6 to 11 Years | 150 (71.1%) | 61 (50.4%) |
| 12 to 14 Years | 0 (0.0%) | 0 (0.0%) |
| 15 Years | 0 (0.0%) | 0 (0.0%) |
| 16 and 17 Years | 0 (0.0%) | 0 (0.0%) |
| 18 to 24 Years | 191 (100.0%) | 26 (100.0%) |
| 25 to 34 Years | 129 (100.0%) | 103 (45.8%) |
| 35 to 44 Years | 18 (100.0%) | 43 (51.2%) |
| 45 to 54 Years | 113 (100.0%) | 93 (100.0%) |
| 55 to 64 Years | 45 (60.8%) | 180 (100.0%) |
| 65 to 74 Years | 23 (100.0%) | 250 (100.0%) |
| 75 Years and over | 116 (100.0%) | 40 (100.0%) |
| Total | 824 (86.6%) | 834 (66.7%) |
Income Below Poverty Among Married-Couple Families in Marion
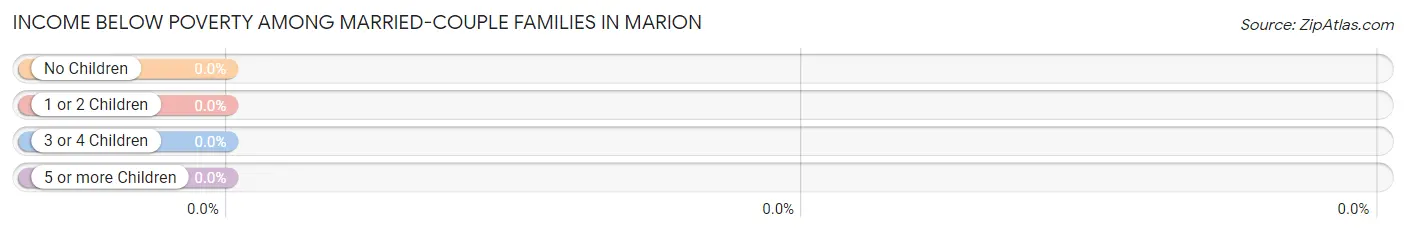
| Children | Above Poverty | Below Poverty |
| No Children | 95 (100.0%) | 0 (0.0%) |
| 1 or 2 Children | 38 (100.0%) | 0 (0.0%) |
| 3 or 4 Children | 0 (0.0%) | 0 (0.0%) |
| 5 or more Children | 0 (0.0%) | 0 (0.0%) |
| Total | 133 (100.0%) | 0 (0.0%) |
Income Below Poverty Among Single-Parent Households in Marion
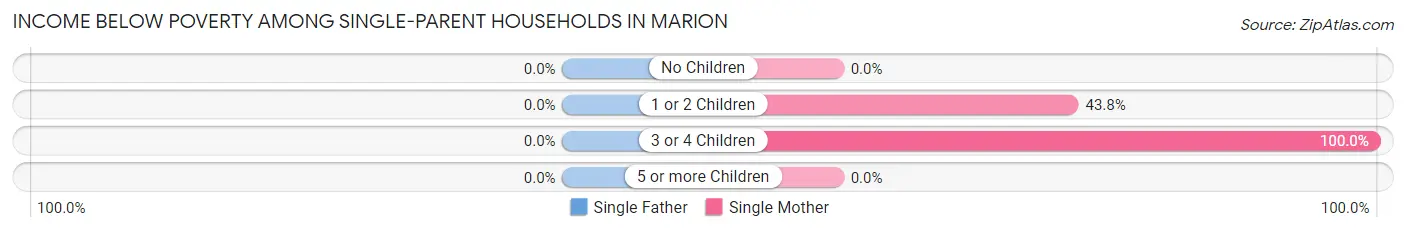
| Children | Single Father | Single Mother |
| No Children | 0 (0.0%) | 0 (0.0%) |
| 1 or 2 Children | 0 (0.0%) | 42 (43.8%) |
| 3 or 4 Children | 0 (0.0%) | 121 (100.0%) |
| 5 or more Children | 0 (0.0%) | 0 (0.0%) |
| Total | 0 (0.0%) | 163 (42.2%) |
Income Below Poverty Among Married-Couple vs Single-Parent Households in Marion
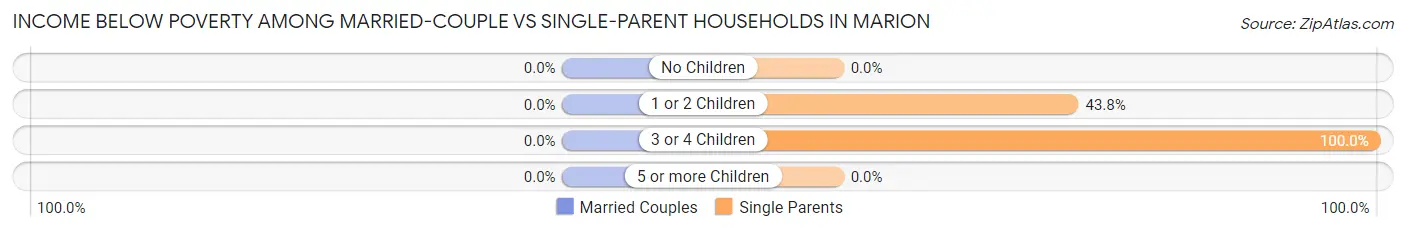
| Children | Married-Couple Families | Single-Parent Households |
| No Children | 0 (0.0%) | 0 (0.0%) |
| 1 or 2 Children | 0 (0.0%) | 42 (43.8%) |
| 3 or 4 Children | 0 (0.0%) | 121 (100.0%) |
| 5 or more Children | 0 (0.0%) | 0 (0.0%) |
| Total | 0 (0.0%) | 163 (40.9%) |
Race in Marion
The most populous races in Marion are Black / African American (2,093 | 66.9%), White / Caucasian (1,010 | 32.3%), and Hispanic or Latino (82 | 2.6%).
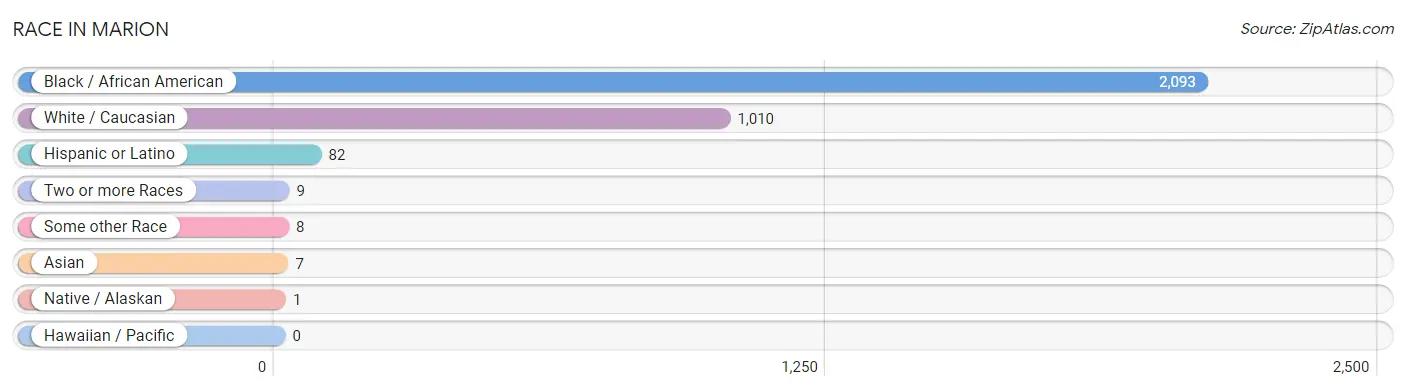
| Race | # Population | % Population |
| Asian | 7 | 0.2% |
| Black / African American | 2,093 | 66.9% |
| Hawaiian / Pacific | 0 | 0.0% |
| Hispanic or Latino | 82 | 2.6% |
| Native / Alaskan | 1 | 0.0% |
| White / Caucasian | 1,010 | 32.3% |
| Two or more Races | 9 | 0.3% |
| Some other Race | 8 | 0.3% |
| Total | 3,128 | 100.0% |
Ancestry in Marion
The most populous ancestries reported in Marion are American (227 | 7.3%), German (126 | 4.0%), Irish (123 | 3.9%), English (63 | 2.0%), and Puerto Rican (61 | 1.9%), together accounting for 19.2% of all Marion residents.
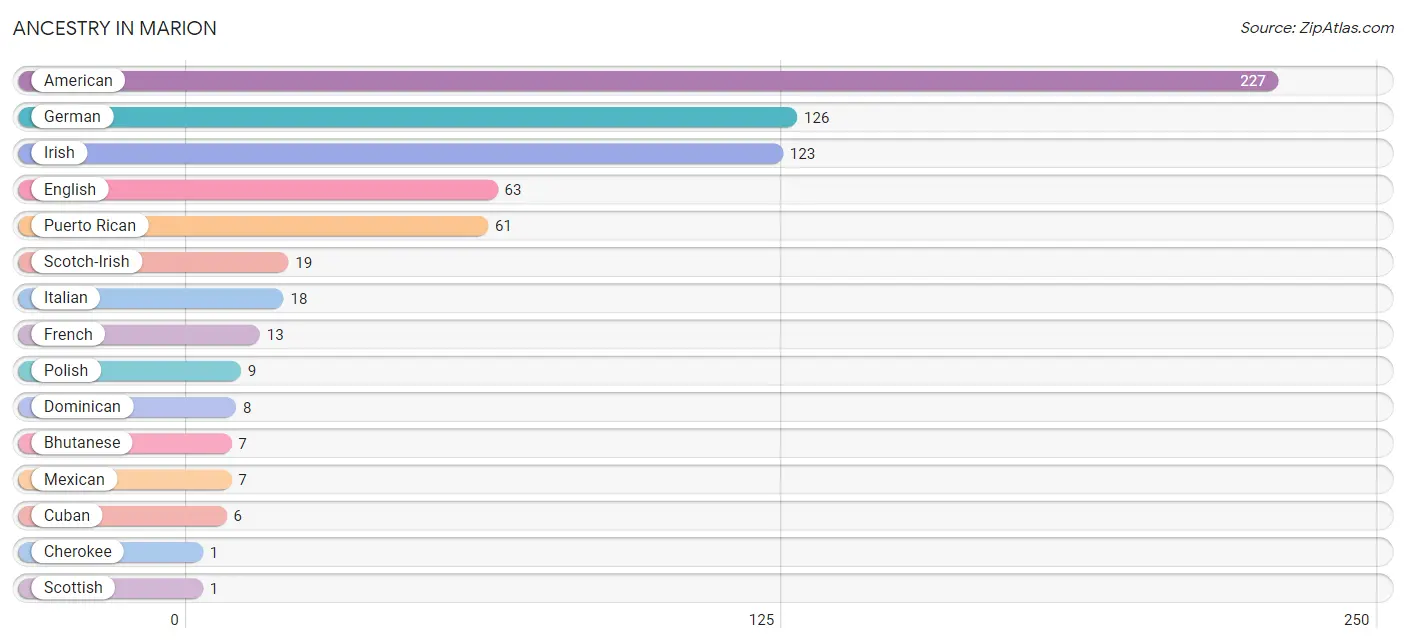
| Ancestry | # Population | % Population |
| American | 227 | 7.3% |
| Bhutanese | 7 | 0.2% |
| Cherokee | 1 | 0.0% |
| Cuban | 6 | 0.2% |
| Dominican | 8 | 0.3% |
| English | 63 | 2.0% |
| French | 13 | 0.4% |
| German | 126 | 4.0% |
| Irish | 123 | 3.9% |
| Italian | 18 | 0.6% |
| Mexican | 7 | 0.2% |
| Polish | 9 | 0.3% |
| Puerto Rican | 61 | 1.9% |
| Scotch-Irish | 19 | 0.6% |
| Scottish | 1 | 0.0% | View All 15 Rows |
Immigrants in Marion

| Immigration Origin | # Population | % Population | View All 0 Rows |
Sex and Age in Marion
Sex and Age in Marion
The most populous age groups in Marion are 15 to 19 Years (310 | 23.1%) for men and 15 to 19 Years (291 | 16.3%) for women.
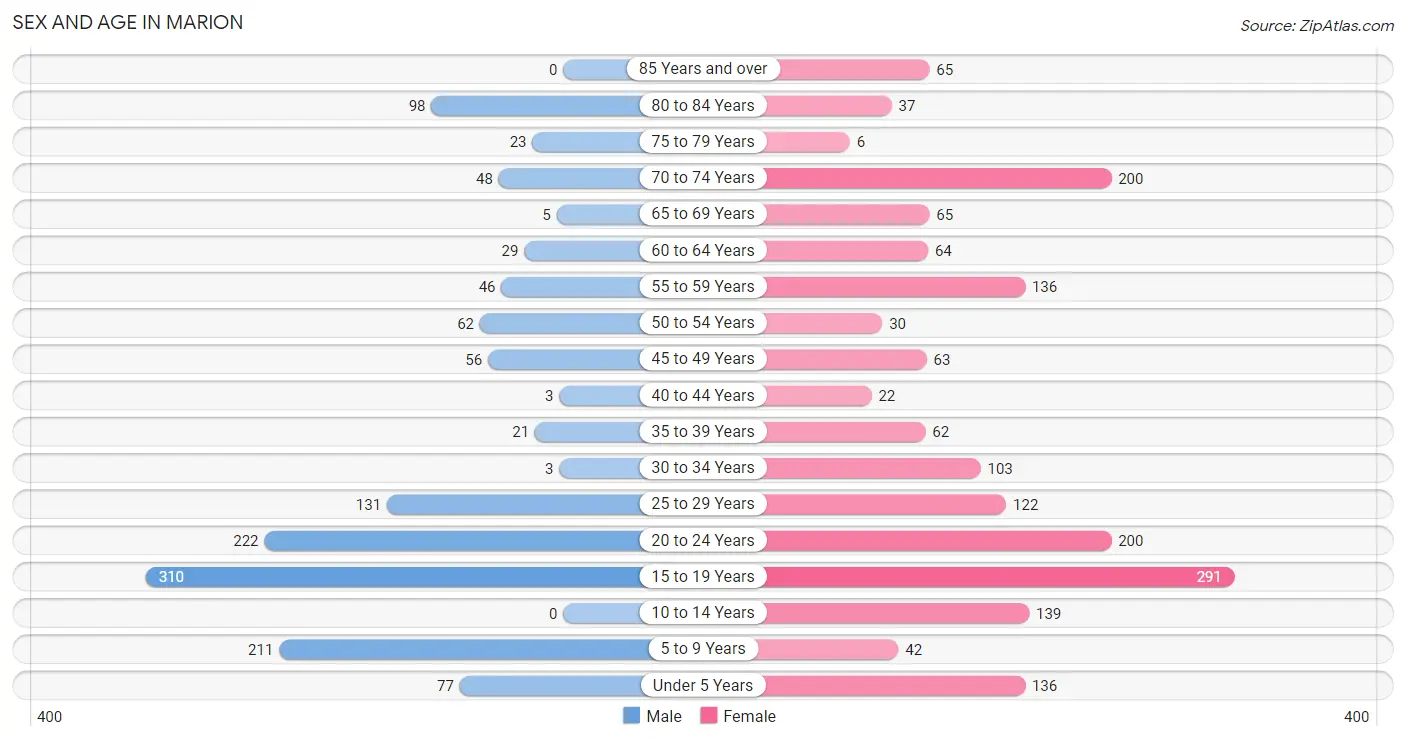
| Age Bracket | Male | Female |
| Under 5 Years | 77 (5.7%) | 136 (7.6%) |
| 5 to 9 Years | 211 (15.7%) | 42 (2.4%) |
| 10 to 14 Years | 0 (0.0%) | 139 (7.8%) |
| 15 to 19 Years | 310 (23.1%) | 291 (16.3%) |
| 20 to 24 Years | 222 (16.5%) | 200 (11.2%) |
| 25 to 29 Years | 131 (9.7%) | 122 (6.8%) |
| 30 to 34 Years | 3 (0.2%) | 103 (5.8%) |
| 35 to 39 Years | 21 (1.6%) | 62 (3.5%) |
| 40 to 44 Years | 3 (0.2%) | 22 (1.2%) |
| 45 to 49 Years | 56 (4.2%) | 63 (3.5%) |
| 50 to 54 Years | 62 (4.6%) | 30 (1.7%) |
| 55 to 59 Years | 46 (3.4%) | 136 (7.6%) |
| 60 to 64 Years | 29 (2.2%) | 64 (3.6%) |
| 65 to 69 Years | 5 (0.4%) | 65 (3.6%) |
| 70 to 74 Years | 48 (3.6%) | 200 (11.2%) |
| 75 to 79 Years | 23 (1.7%) | 6 (0.3%) |
| 80 to 84 Years | 98 (7.3%) | 37 (2.1%) |
| 85 Years and over | 0 (0.0%) | 65 (3.6%) |
| Total | 1,345 (100.0%) | 1,783 (100.0%) |
Families and Households in Marion
Median Family Size in Marion
The median family size in Marion is 3.62 persons per family, with single male/father families (12 | 2.3%) accounting for the largest median family size of 3.92 persons per family. On the other hand, married-couple families (133 | 25.1%) represent the smallest median family size with 3.21 persons per family.
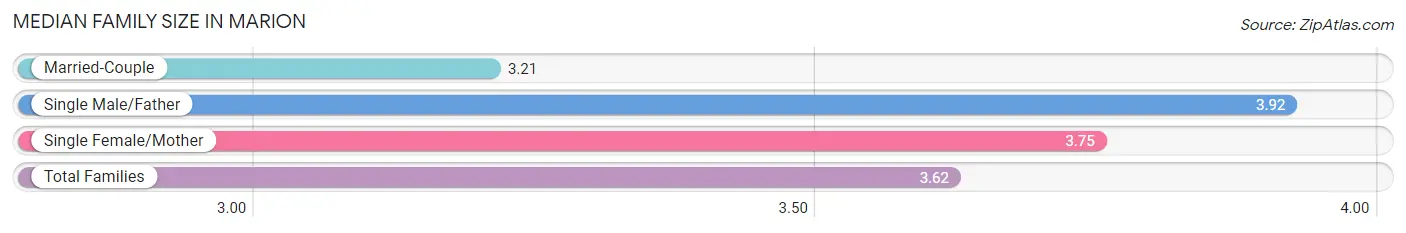
| Family Type | # Families | Family Size |
| Married-Couple | 133 (25.1%) | 3.21 |
| Single Male/Father | 12 (2.3%) | 3.92 |
| Single Female/Mother | 386 (72.7%) | 3.75 |
| Total Families | 531 (100.0%) | 3.62 |
Median Household Size in Marion
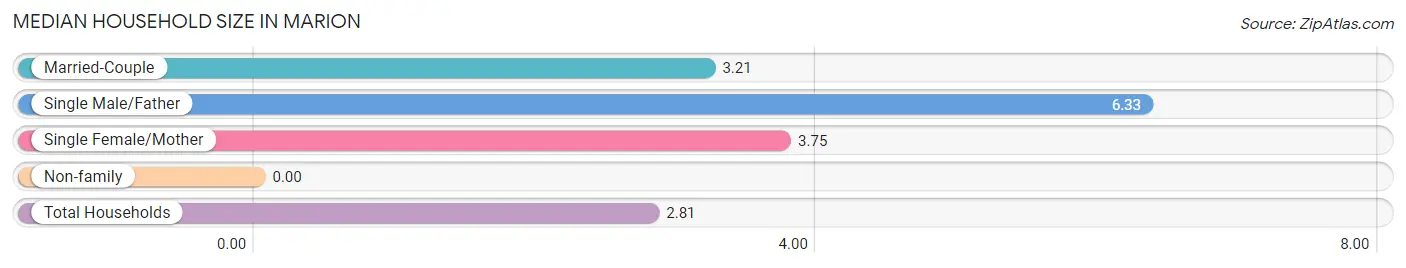
| Household Type | # Households | Household Size |
| Married-Couple | 133 (17.0%) | 3.21 |
| Single Male/Father | 12 (1.5%) | 6.33 |
| Single Female/Mother | 386 (49.2%) | 3.75 |
| Non-family | 253 (32.3%) | - |
| Total Households | 784 (100.0%) | 2.81 |
Household Size by Marriage Status in Marion
Out of a total of 784 households in Marion, 531 (67.7%) are family households, while 253 (32.3%) are nonfamily households. The most numerous type of family households are 3-person households, comprising 210, and the most common type of nonfamily households are 1-person households, comprising 253.
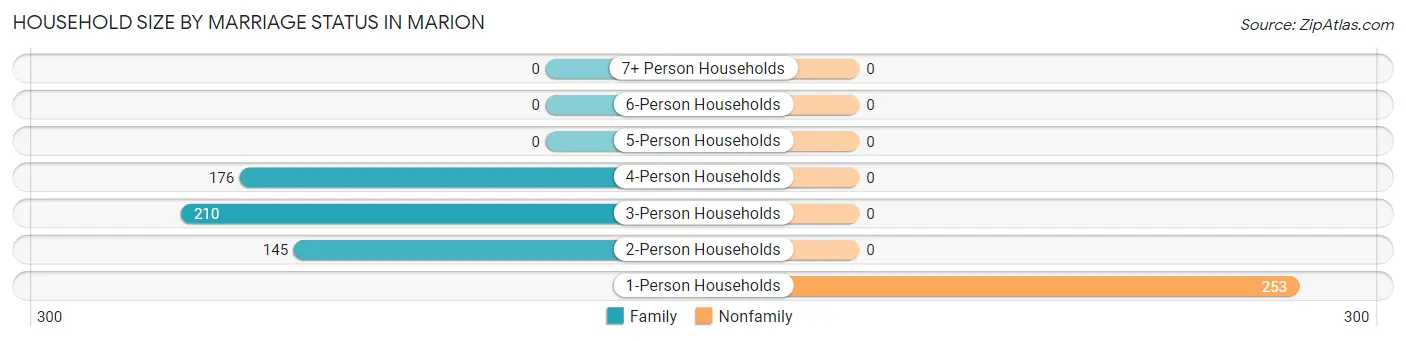
| Household Size | Family Households | Nonfamily Households |
| 1-Person Households | - | 253 (32.3%) |
| 2-Person Households | 145 (18.5%) | 0 (0.0%) |
| 3-Person Households | 210 (26.8%) | 0 (0.0%) |
| 4-Person Households | 176 (22.5%) | 0 (0.0%) |
| 5-Person Households | 0 (0.0%) | 0 (0.0%) |
| 6-Person Households | 0 (0.0%) | 0 (0.0%) |
| 7+ Person Households | 0 (0.0%) | 0 (0.0%) |
| Total | 531 (67.7%) | 253 (32.3%) |
Female Fertility in Marion
Fertility by Age in Marion
| Age Bracket | Women with Births | Births / 1,000 Women |
| 15 to 19 years | 0 (0.0%) | 0.0 |
| 20 to 34 years | 0 (0.0%) | 0.0 |
| 35 to 50 years | 0 (0.0%) | 0.0 |
| Total | 0 (0.0%) | 0.0 |
Fertility by Age by Marriage Status in Marion
| Age Bracket | Married | Unmarried |
| 15 to 19 years | 0 (0.0%) | 0 (0.0%) |
| 20 to 34 years | 0 (0.0%) | 0 (0.0%) |
| 35 to 50 years | 0 (0.0%) | 0 (0.0%) |
| Total | 0 (0.0%) | 0 (0.0%) |
Fertility by Education in Marion
| Educational Attainment | Women with Births | Births / 1,000 Women |
| Less than High School | 0 (0.0%) | 0.0 |
| High School Diploma | 0 (0.0%) | 0.0 |
| College or Associate's Degree | 0 (0.0%) | 0.0 |
| Bachelor's Degree | 0 (0.0%) | 0.0 |
| Graduate Degree | 0 (0.0%) | 0.0 |
| Total | 0 (0.0%) | 0.0 |
Fertility by Education by Marriage Status in Marion
| Educational Attainment | Married | Unmarried |
| Less than High School | 0 (0.0%) | 0 (0.0%) |
| High School Diploma | 0 (0.0%) | 0 (0.0%) |
| College or Associate's Degree | 0 (0.0%) | 0 (0.0%) |
| Bachelor's Degree | 0 (0.0%) | 0 (0.0%) |
| Graduate Degree | 0 (0.0%) | 0 (0.0%) |
| Total | 0 (0.0%) | 0 (0.0%) |
Employment Characteristics in Marion
Employment by Class of Employer in Marion
Among the 653 employed individuals in Marion, private company employees (415 | 63.5%), local government employees (88 | 13.5%), and state government employees (78 | 11.9%) make up the most common classes of employment.
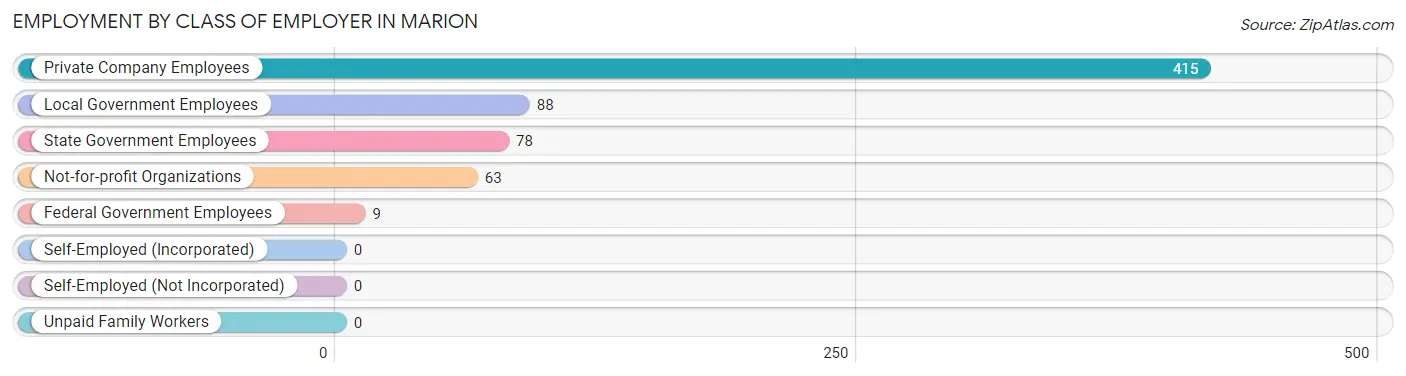
| Employer Class | # Employees | % Employees |
| Private Company Employees | 415 | 63.5% |
| Self-Employed (Incorporated) | 0 | 0.0% |
| Self-Employed (Not Incorporated) | 0 | 0.0% |
| Not-for-profit Organizations | 63 | 9.7% |
| Local Government Employees | 88 | 13.5% |
| State Government Employees | 78 | 11.9% |
| Federal Government Employees | 9 | 1.4% |
| Unpaid Family Workers | 0 | 0.0% |
| Total | 653 | 100.0% |
Employment Status by Age in Marion
According to the labor force statistics for Marion, out of the total population over 16 years of age (2,523), 35.8% or 903 individuals are in the labor force, with 18.7% or 169 of them unemployed. The age group with the highest labor force participation rate is 30 to 34 years, with 97.2% or 103 individuals in the labor force. Within the labor force, the 25 to 29 years age range has the highest percentage of unemployed individuals, with 75.4% or 129 of them being unemployed.
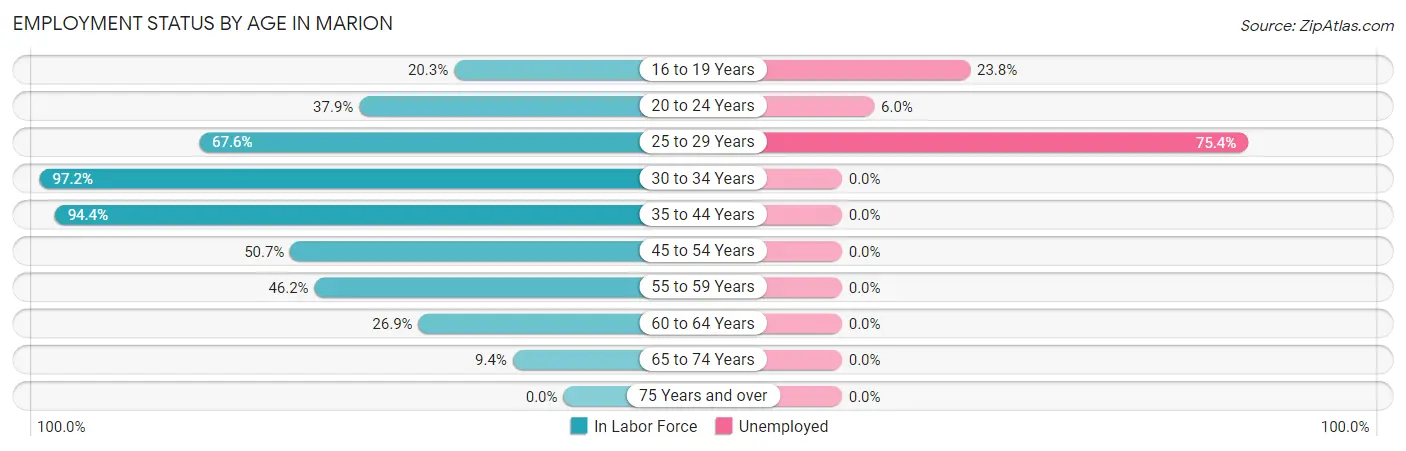
| Age Bracket | In Labor Force | Unemployed |
| 16 to 19 Years | 122 (20.3%) | 29 (23.8%) |
| 20 to 24 Years | 160 (37.9%) | 10 (6.0%) |
| 25 to 29 Years | 171 (67.6%) | 129 (75.4%) |
| 30 to 34 Years | 103 (97.2%) | 0 (0.0%) |
| 35 to 44 Years | 102 (94.4%) | 0 (0.0%) |
| 45 to 54 Years | 107 (50.7%) | 0 (0.0%) |
| 55 to 59 Years | 84 (46.2%) | 0 (0.0%) |
| 60 to 64 Years | 25 (26.9%) | 0 (0.0%) |
| 65 to 74 Years | 30 (9.4%) | 0 (0.0%) |
| 75 Years and over | 0 (0.0%) | 0 (0.0%) |
| Total | 903 (35.8%) | 169 (18.7%) |
Employment Status by Educational Attainment in Marion
According to labor force statistics for Marion, 62.1% of individuals (592) out of the total population between 25 and 64 years of age (953) are in the labor force, with 21.8% or 129 of them being unemployed. The group with the highest labor force participation rate are those with the educational attainment of bachelor's degree or higher, with 96.0% or 240 individuals in the labor force. Within the labor force, individuals with high school diploma education have the highest percentage of unemployment, with 76.3% or 129 of them being unemployed.
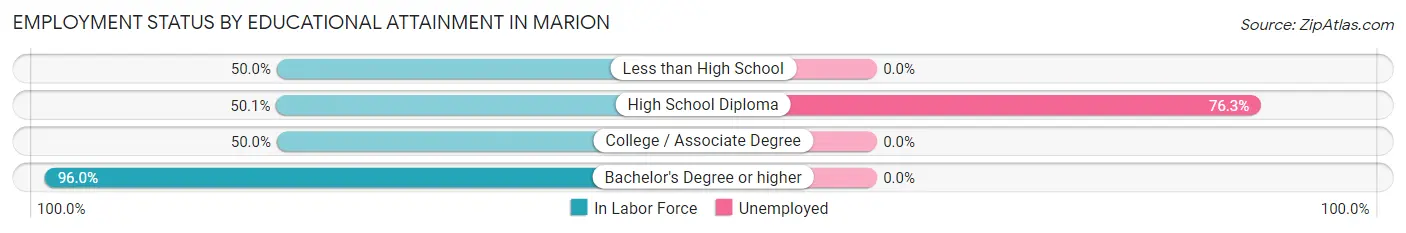
| Educational Attainment | In Labor Force | Unemployed |
| Less than High School | 41 (50.0%) | 0 (0.0%) |
| High School Diploma | 169 (50.1%) | 257 (76.3%) |
| College / Associate Degree | 142 (50.0%) | 0 (0.0%) |
| Bachelor's Degree or higher | 240 (96.0%) | 0 (0.0%) |
| Total | 592 (62.1%) | 208 (21.8%) |
Employment Occupations by Sex in Marion
Management, Business, Science and Arts Occupations
The most common Management, Business, Science and Arts occupations in Marion are Community & Social Service (206 | 28.3%), Education Instruction & Library (187 | 25.7%), Health Diagnosing & Treating (31 | 4.3%), and Education, Arts & Media (19 | 2.6%).
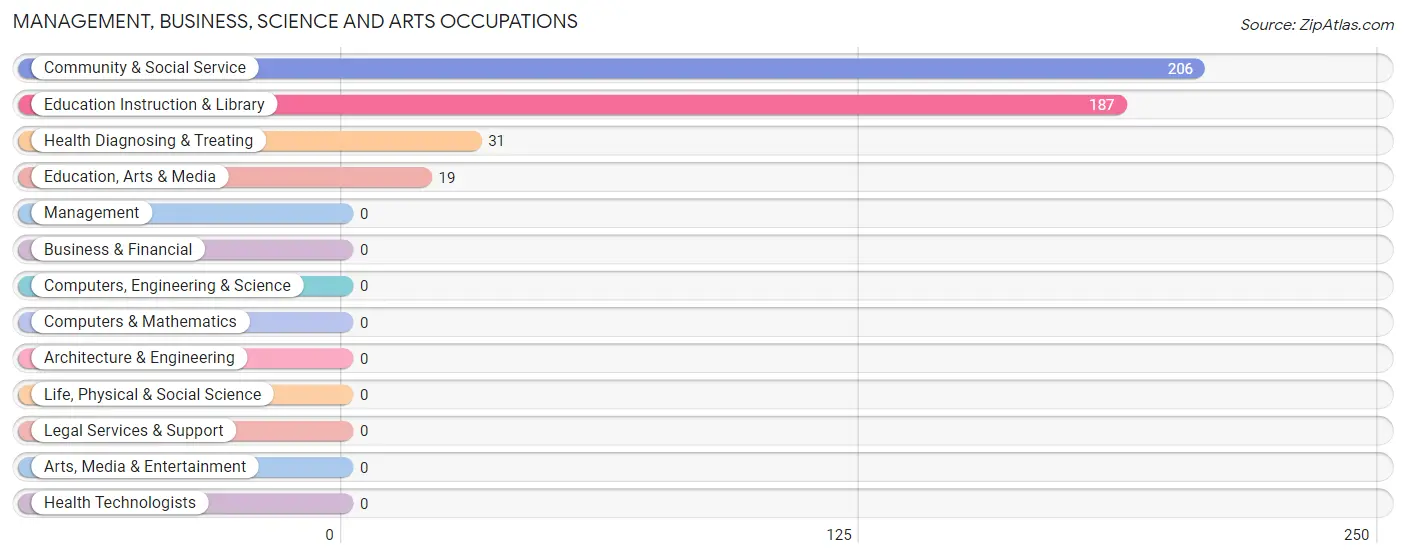
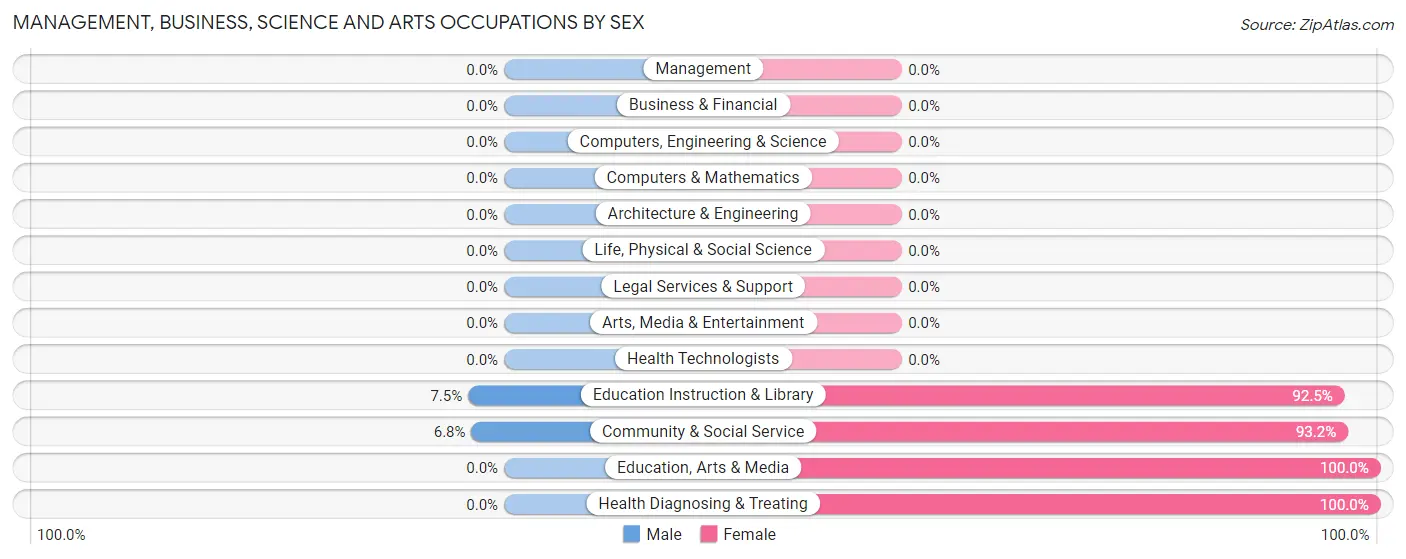
Management, Business, Science and Arts Occupations by Sex
Within the Management, Business, Science and Arts occupations in Marion, the most male-oriented occupations are Education Instruction & Library (7.5%), and Community & Social Service (6.8%), while the most female-oriented occupations are Education, Arts & Media (100.0%), Health Diagnosing & Treating (100.0%), and Community & Social Service (93.2%).
| Occupation | Male | Female |
| Management | 0 (0.0%) | 0 (0.0%) |
| Business & Financial | 0 (0.0%) | 0 (0.0%) |
| Computers, Engineering & Science | 0 (0.0%) | 0 (0.0%) |
| Computers & Mathematics | 0 (0.0%) | 0 (0.0%) |
| Architecture & Engineering | 0 (0.0%) | 0 (0.0%) |
| Life, Physical & Social Science | 0 (0.0%) | 0 (0.0%) |
| Community & Social Service | 14 (6.8%) | 192 (93.2%) |
| Education, Arts & Media | 0 (0.0%) | 19 (100.0%) |
| Legal Services & Support | 0 (0.0%) | 0 (0.0%) |
| Education Instruction & Library | 14 (7.5%) | 173 (92.5%) |
| Arts, Media & Entertainment | 0 (0.0%) | 0 (0.0%) |
| Health Diagnosing & Treating | 0 (0.0%) | 31 (100.0%) |
| Health Technologists | 0 (0.0%) | 0 (0.0%) |
| Total (Category) | 14 (5.9%) | 223 (94.1%) |
| Total (Overall) | 176 (24.2%) | 552 (75.8%) |
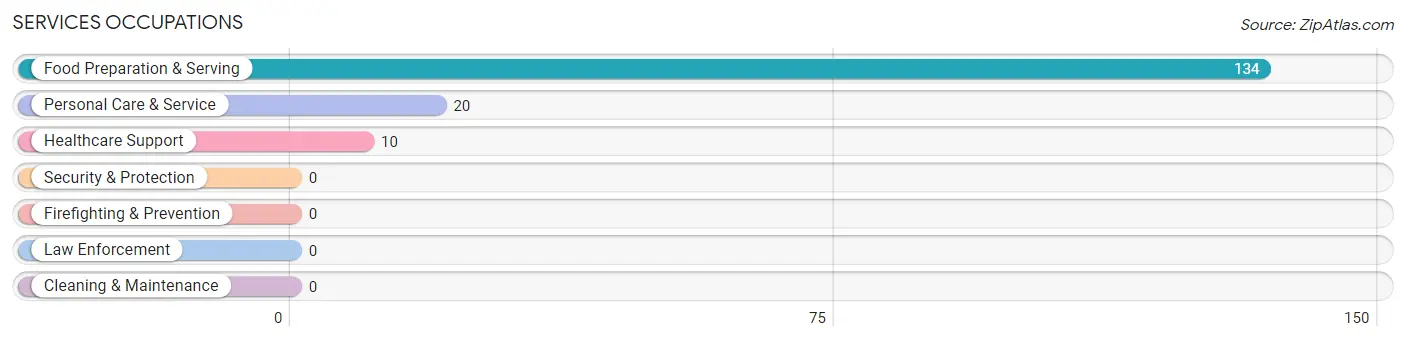
Services Occupations
The most common Services occupations in Marion are Food Preparation & Serving (134 | 18.4%), Personal Care & Service (20 | 2.8%), and Healthcare Support (10 | 1.4%).
Services Occupations by Sex

| Occupation | Male | Female |
| Healthcare Support | 10 (100.0%) | 0 (0.0%) |
| Security & Protection | 0 (0.0%) | 0 (0.0%) |
| Firefighting & Prevention | 0 (0.0%) | 0 (0.0%) |
| Law Enforcement | 0 (0.0%) | 0 (0.0%) |
| Food Preparation & Serving | 12 (9.0%) | 122 (91.0%) |
| Cleaning & Maintenance | 0 (0.0%) | 0 (0.0%) |
| Personal Care & Service | 20 (100.0%) | 0 (0.0%) |
| Total (Category) | 42 (25.6%) | 122 (74.4%) |
| Total (Overall) | 176 (24.2%) | 552 (75.8%) |
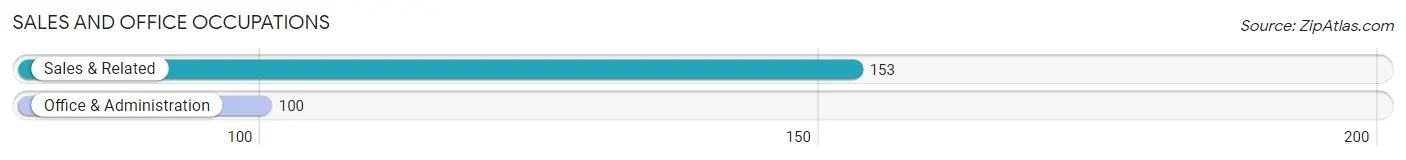
Sales and Office Occupations
The most common Sales and Office occupations in Marion are Sales & Related (153 | 21.0%), and Office & Administration (100 | 13.7%).
Sales and Office Occupations by Sex
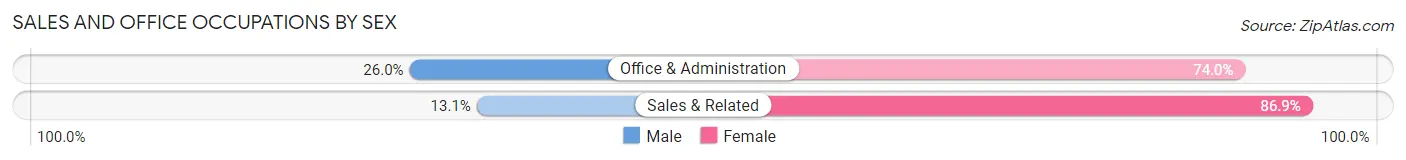
| Occupation | Male | Female |
| Sales & Related | 20 (13.1%) | 133 (86.9%) |
| Office & Administration | 26 (26.0%) | 74 (74.0%) |
| Total (Category) | 46 (18.2%) | 207 (81.8%) |
| Total (Overall) | 176 (24.2%) | 552 (75.8%) |
Natural Resources, Construction and Maintenance Occupations
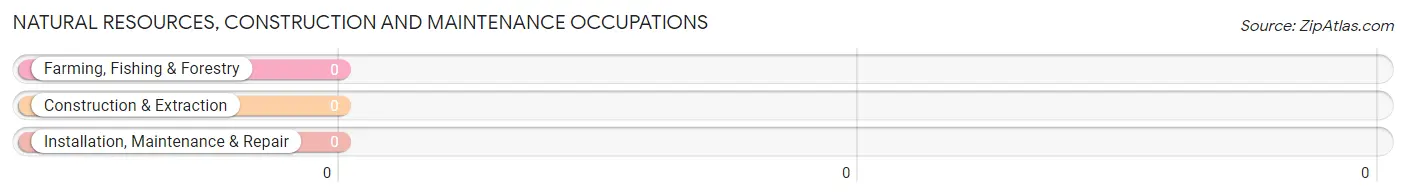
Natural Resources, Construction and Maintenance Occupations by Sex
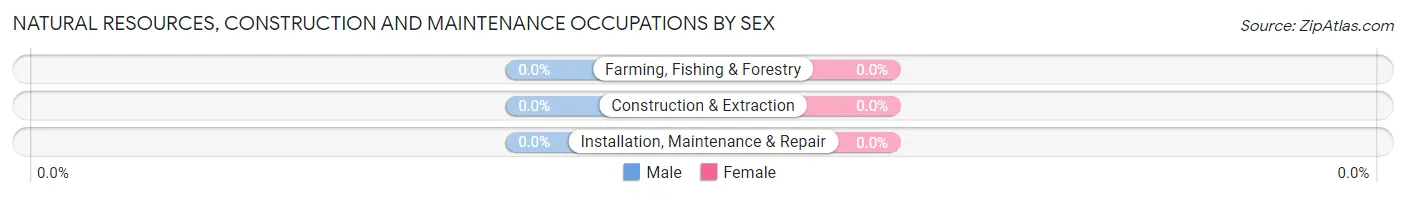
| Occupation | Male | Female |
| Farming, Fishing & Forestry | 0 (0.0%) | 0 (0.0%) |
| Construction & Extraction | 0 (0.0%) | 0 (0.0%) |
| Installation, Maintenance & Repair | 0 (0.0%) | 0 (0.0%) |
| Total (Category) | 0 (0.0%) | 0 (0.0%) |
| Total (Overall) | 176 (24.2%) | 552 (75.8%) |
Production, Transportation and Moving Occupations
The most common Production, Transportation and Moving occupations in Marion are Material Moving (56 | 7.7%), and Transportation (18 | 2.5%).
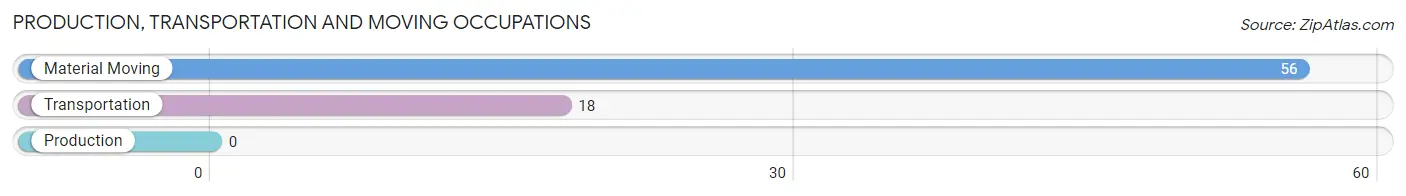
Production, Transportation and Moving Occupations by Sex
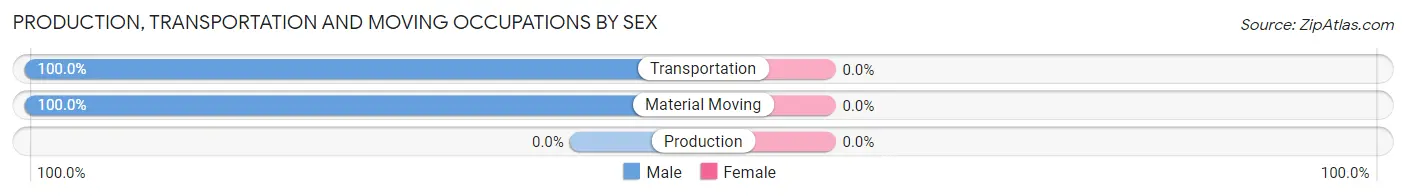
| Occupation | Male | Female |
| Production | 0 (0.0%) | 0 (0.0%) |
| Transportation | 18 (100.0%) | 0 (0.0%) |
| Material Moving | 56 (100.0%) | 0 (0.0%) |
| Total (Category) | 74 (100.0%) | 0 (0.0%) |
| Total (Overall) | 176 (24.2%) | 552 (75.8%) |
Employment Industries by Sex in Marion
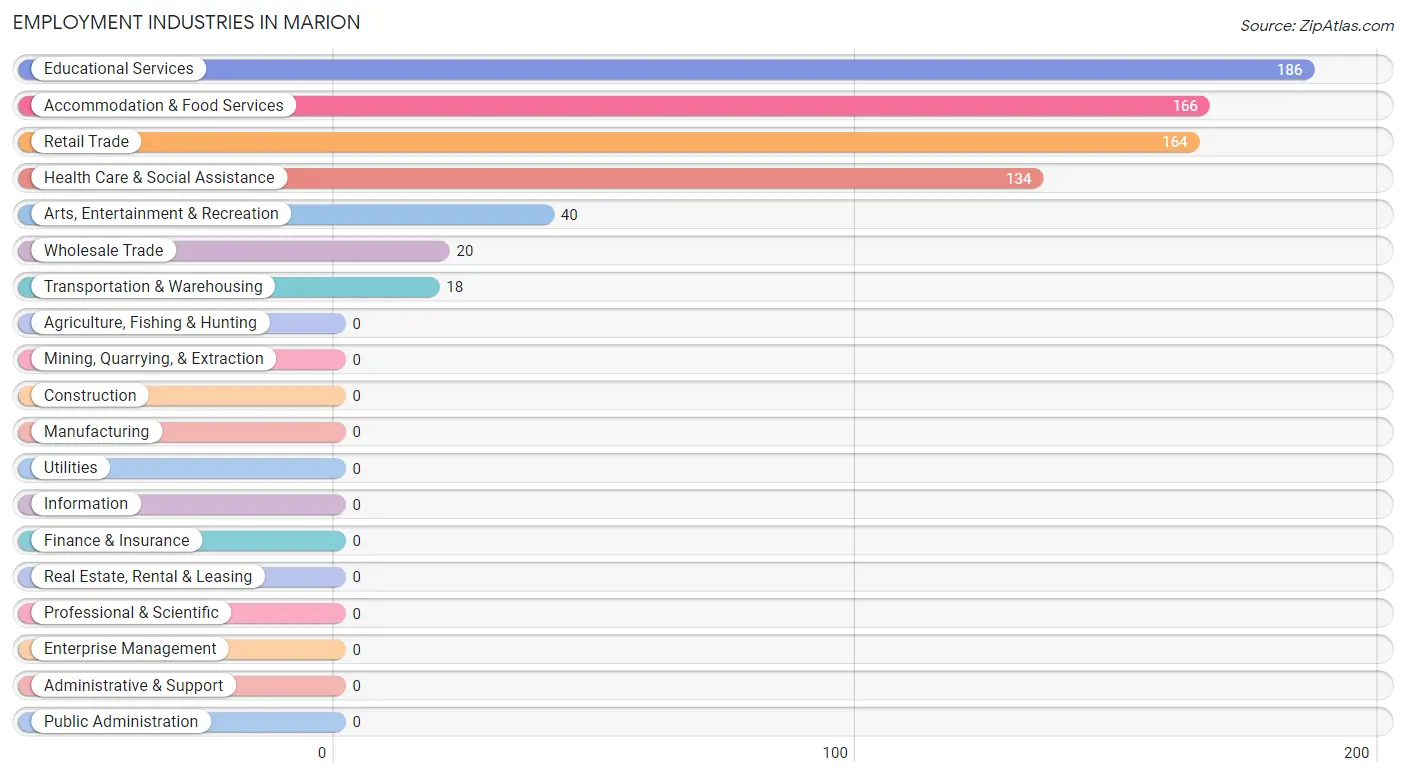
Employment Industries in Marion
The major employment industries in Marion include Educational Services (186 | 25.6%), Accommodation & Food Services (166 | 22.8%), Retail Trade (164 | 22.5%), Health Care & Social Assistance (134 | 18.4%), and Arts, Entertainment & Recreation (40 | 5.5%).
Employment Industries by Sex in Marion
The Marion industries that see more men than women are Wholesale Trade (100.0%), Transportation & Warehousing (100.0%), and Arts, Entertainment & Recreation (50.0%), whereas the industries that tend to have a higher number of women are Health Care & Social Assistance (92.5%), Educational Services (87.1%), and Accommodation & Food Services (83.1%).
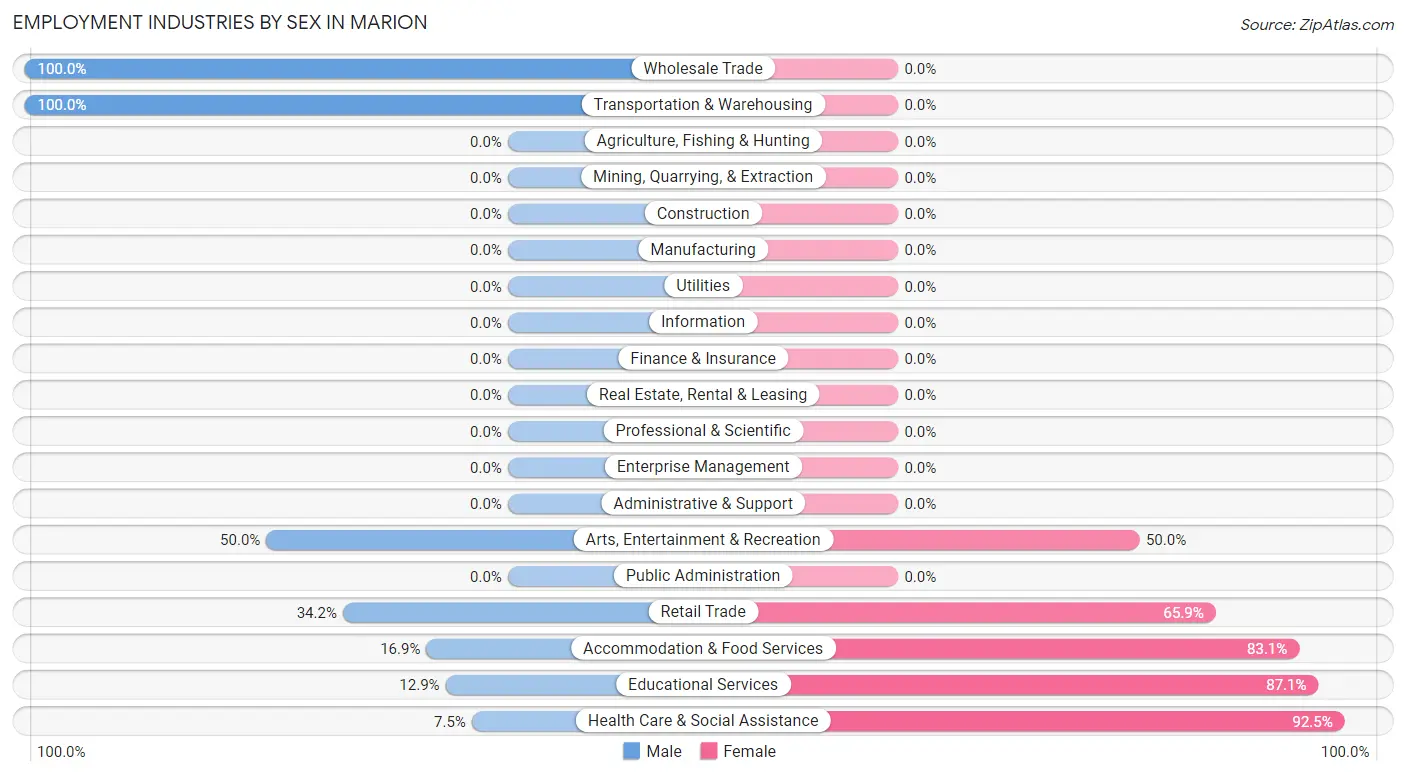
| Industry | Male | Female |
| Agriculture, Fishing & Hunting | 0 (0.0%) | 0 (0.0%) |
| Mining, Quarrying, & Extraction | 0 (0.0%) | 0 (0.0%) |
| Construction | 0 (0.0%) | 0 (0.0%) |
| Manufacturing | 0 (0.0%) | 0 (0.0%) |
| Wholesale Trade | 20 (100.0%) | 0 (0.0%) |
| Retail Trade | 56 (34.2%) | 108 (65.8%) |
| Transportation & Warehousing | 18 (100.0%) | 0 (0.0%) |
| Utilities | 0 (0.0%) | 0 (0.0%) |
| Information | 0 (0.0%) | 0 (0.0%) |
| Finance & Insurance | 0 (0.0%) | 0 (0.0%) |
| Real Estate, Rental & Leasing | 0 (0.0%) | 0 (0.0%) |
| Professional & Scientific | 0 (0.0%) | 0 (0.0%) |
| Enterprise Management | 0 (0.0%) | 0 (0.0%) |
| Administrative & Support | 0 (0.0%) | 0 (0.0%) |
| Educational Services | 24 (12.9%) | 162 (87.1%) |
| Health Care & Social Assistance | 10 (7.5%) | 124 (92.5%) |
| Arts, Entertainment & Recreation | 20 (50.0%) | 20 (50.0%) |
| Accommodation & Food Services | 28 (16.9%) | 138 (83.1%) |
| Public Administration | 0 (0.0%) | 0 (0.0%) |
| Total | 176 (24.2%) | 552 (75.8%) |
Education in Marion
School Enrollment in Marion
The most common levels of schooling among the 1,218 students in Marion are college / undergraduate (791 | 64.9%), middle school (139 | 11.4%), and elementary school (127 | 10.4%).
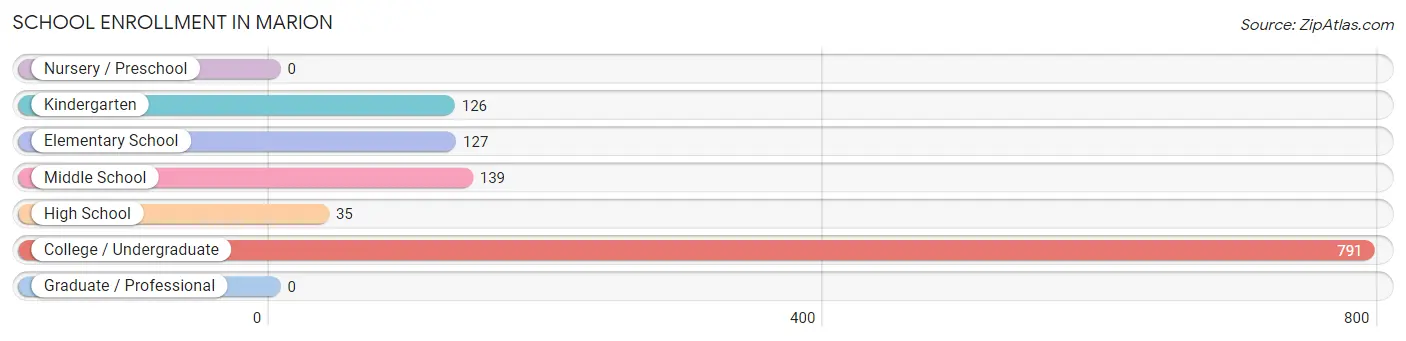
| School Level | # Students | % Students |
| Nursery / Preschool | 0 | 0.0% |
| Kindergarten | 126 | 10.3% |
| Elementary School | 127 | 10.4% |
| Middle School | 139 | 11.4% |
| High School | 35 | 2.9% |
| College / Undergraduate | 791 | 64.9% |
| Graduate / Professional | 0 | 0.0% |
| Total | 1,218 | 100.0% |
School Enrollment by Age by Funding Source in Marion
Out of a total of 1,218 students who are enrolled in schools in Marion, 303 (24.9%) attend a private institution, while the remaining 915 (75.1%) are enrolled in public schools. The age group of 20 to 24 year olds has the highest likelihood of being enrolled in private schools, with 184 (53.8% in the age bracket) enrolled. Conversely, the age group of 10 to 14 year olds has the lowest likelihood of being enrolled in a private school, with 139 (100.0% in the age bracket) attending a public institution.
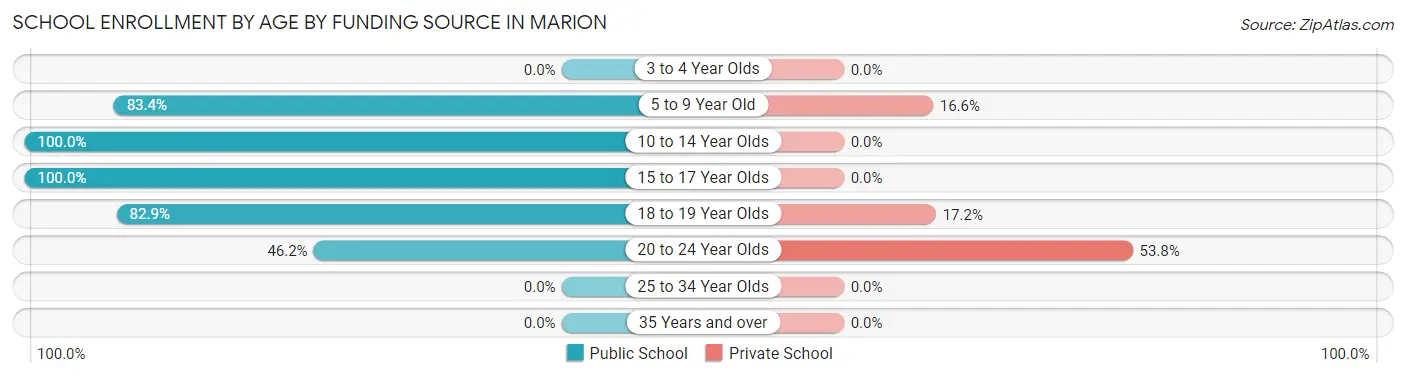
| Age Bracket | Public School | Private School |
| 3 to 4 Year Olds | 0 (0.0%) | 0 (0.0%) |
| 5 to 9 Year Old | 211 (83.4%) | 42 (16.6%) |
| 10 to 14 Year Olds | 139 (100.0%) | 0 (0.0%) |
| 15 to 17 Year Olds | 35 (100.0%) | 0 (0.0%) |
| 18 to 19 Year Olds | 372 (82.9%) | 77 (17.2%) |
| 20 to 24 Year Olds | 158 (46.2%) | 184 (53.8%) |
| 25 to 34 Year Olds | 0 (0.0%) | 0 (0.0%) |
| 35 Years and over | 0 (0.0%) | 0 (0.0%) |
| Total | 915 (75.1%) | 303 (24.9%) |
Educational Attainment by Field of Study in Marion
Psychology (145 | 43.1%), education (55 | 16.4%), bio, nature & agricultural (49 | 14.6%), arts & humanities (21 | 6.2%), and communications (19 | 5.7%) are the most common fields of study among 336 individuals in Marion who have obtained a bachelor's degree or higher.
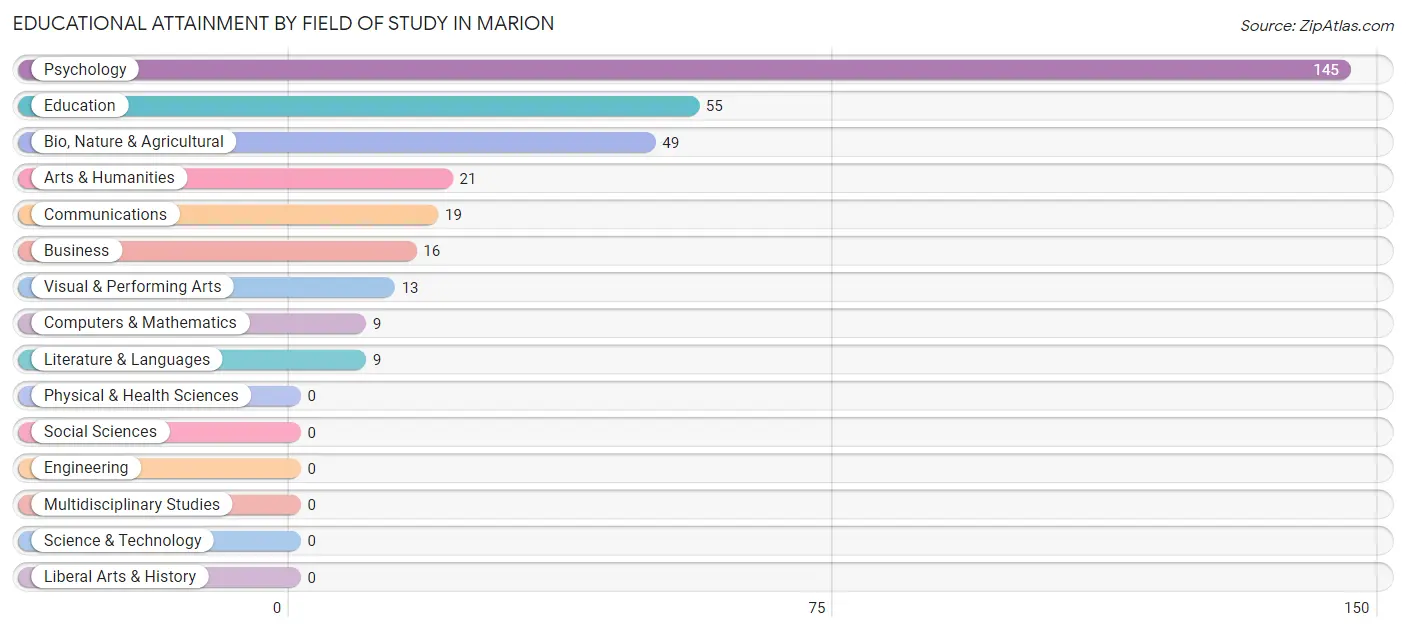
| Field of Study | # Graduates | % Graduates |
| Computers & Mathematics | 9 | 2.7% |
| Bio, Nature & Agricultural | 49 | 14.6% |
| Physical & Health Sciences | 0 | 0.0% |
| Psychology | 145 | 43.1% |
| Social Sciences | 0 | 0.0% |
| Engineering | 0 | 0.0% |
| Multidisciplinary Studies | 0 | 0.0% |
| Science & Technology | 0 | 0.0% |
| Business | 16 | 4.8% |
| Education | 55 | 16.4% |
| Literature & Languages | 9 | 2.7% |
| Liberal Arts & History | 0 | 0.0% |
| Visual & Performing Arts | 13 | 3.9% |
| Communications | 19 | 5.7% |
| Arts & Humanities | 21 | 6.2% |
| Total | 336 | 100.0% |
Transportation & Commute in Marion
Vehicle Availability by Sex in Marion
The most prevalent vehicle ownership categories in Marion are males with no vehicle (56, accounting for 52.8%) and females with no vehicle (0, making up 11.9%).
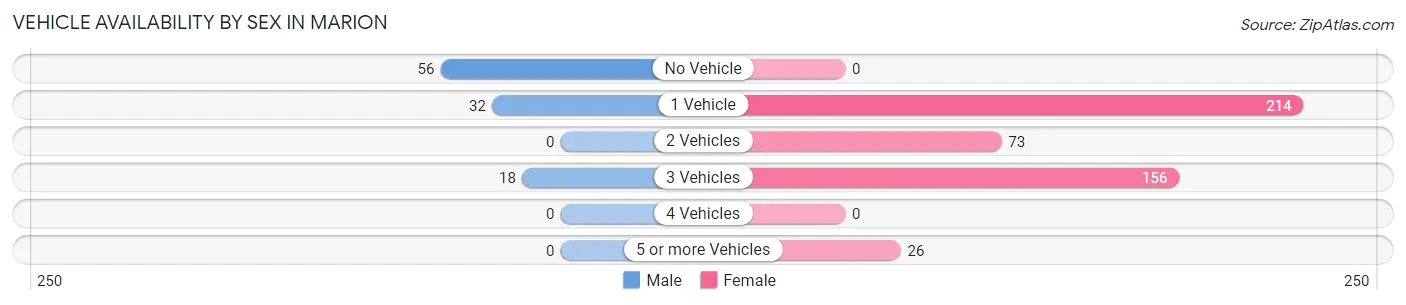
| Vehicles Available | Male | Female |
| No Vehicle | 56 (52.8%) | 0 (0.0%) |
| 1 Vehicle | 32 (30.2%) | 214 (45.6%) |
| 2 Vehicles | 0 (0.0%) | 73 (15.6%) |
| 3 Vehicles | 18 (17.0%) | 156 (33.3%) |
| 4 Vehicles | 0 (0.0%) | 0 (0.0%) |
| 5 or more Vehicles | 0 (0.0%) | 26 (5.5%) |
| Total | 106 (100.0%) | 469 (100.0%) |
Commute Time in Marion
The most frequently occuring commute durations in Marion are 10 to 14 minutes (204 commuters, 31.2%), less than 5 minutes (148 commuters, 22.7%), and 5 to 9 minutes (95 commuters, 14.5%).
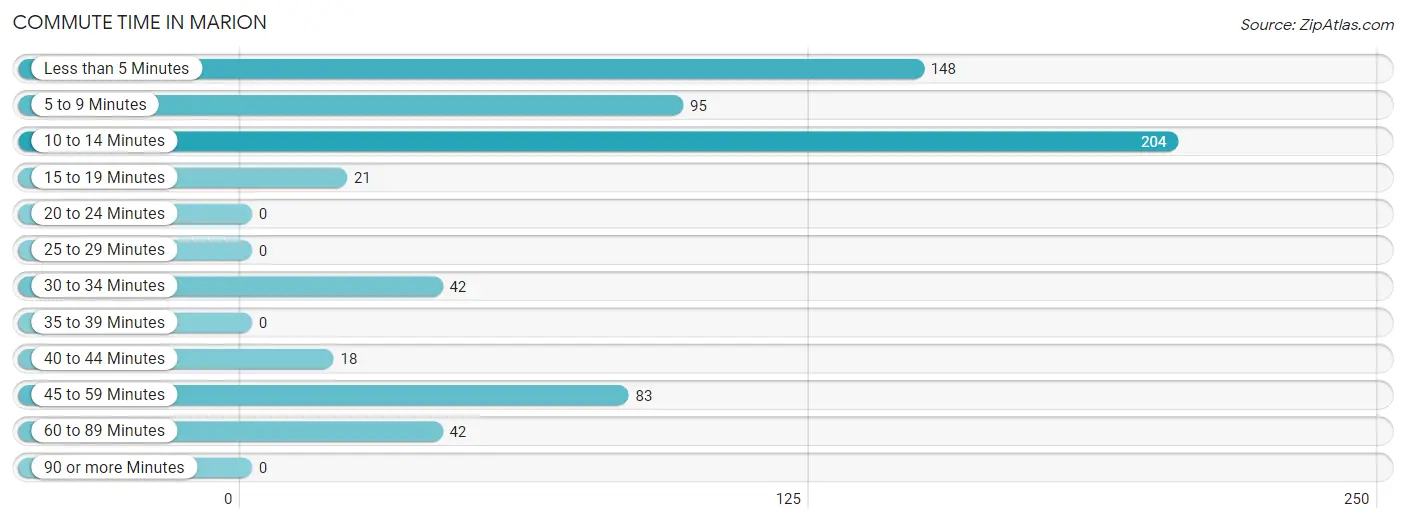
| Commute Time | # Commuters | % Commuters |
| Less than 5 Minutes | 148 | 22.7% |
| 5 to 9 Minutes | 95 | 14.5% |
| 10 to 14 Minutes | 204 | 31.2% |
| 15 to 19 Minutes | 21 | 3.2% |
| 20 to 24 Minutes | 0 | 0.0% |
| 25 to 29 Minutes | 0 | 0.0% |
| 30 to 34 Minutes | 42 | 6.4% |
| 35 to 39 Minutes | 0 | 0.0% |
| 40 to 44 Minutes | 18 | 2.8% |
| 45 to 59 Minutes | 83 | 12.7% |
| 60 to 89 Minutes | 42 | 6.4% |
| 90 or more Minutes | 0 | 0.0% |
Commute Time by Sex in Marion
The most common commute times in Marion are less than 5 minutes (109 commuters, 68.5%) for males and 10 to 14 minutes (184 commuters, 37.2%) for females.
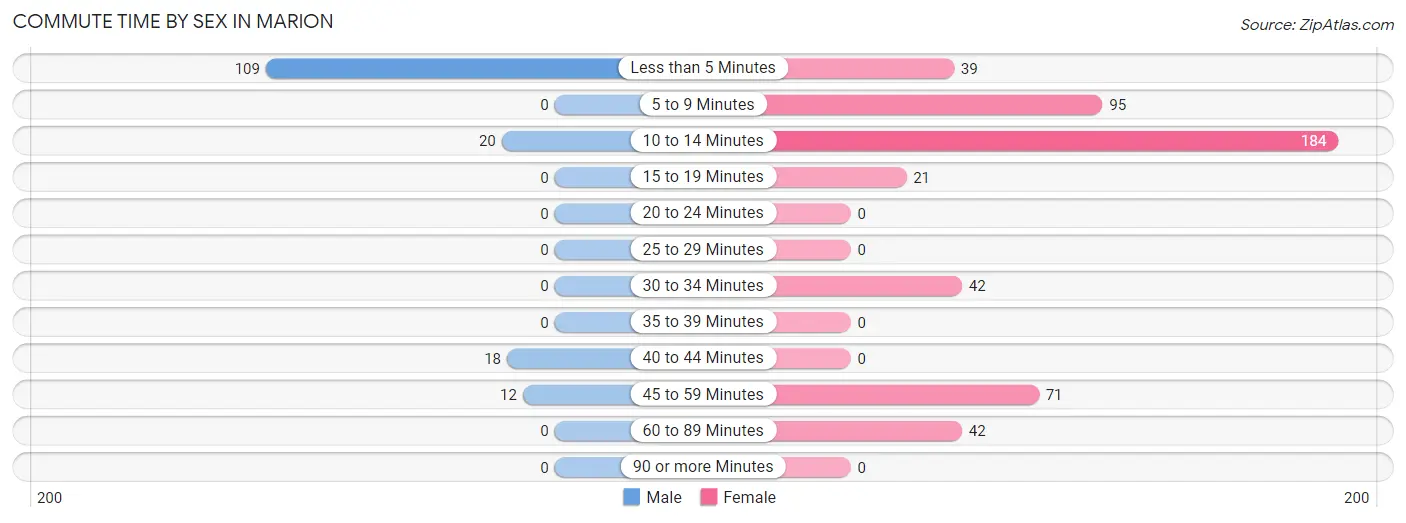
| Commute Time | Male | Female |
| Less than 5 Minutes | 109 (68.5%) | 39 (7.9%) |
| 5 to 9 Minutes | 0 (0.0%) | 95 (19.2%) |
| 10 to 14 Minutes | 20 (12.6%) | 184 (37.2%) |
| 15 to 19 Minutes | 0 (0.0%) | 21 (4.3%) |
| 20 to 24 Minutes | 0 (0.0%) | 0 (0.0%) |
| 25 to 29 Minutes | 0 (0.0%) | 0 (0.0%) |
| 30 to 34 Minutes | 0 (0.0%) | 42 (8.5%) |
| 35 to 39 Minutes | 0 (0.0%) | 0 (0.0%) |
| 40 to 44 Minutes | 18 (11.3%) | 0 (0.0%) |
| 45 to 59 Minutes | 12 (7.5%) | 71 (14.4%) |
| 60 to 89 Minutes | 0 (0.0%) | 42 (8.5%) |
| 90 or more Minutes | 0 (0.0%) | 0 (0.0%) |
Time of Departure to Work by Sex in Marion
The most frequent times of departure to work in Marion are 4:00 PM to 11:59 PM (80, 50.3%) for males and 7:00 AM to 7:29 AM (104, 21.0%) for females.
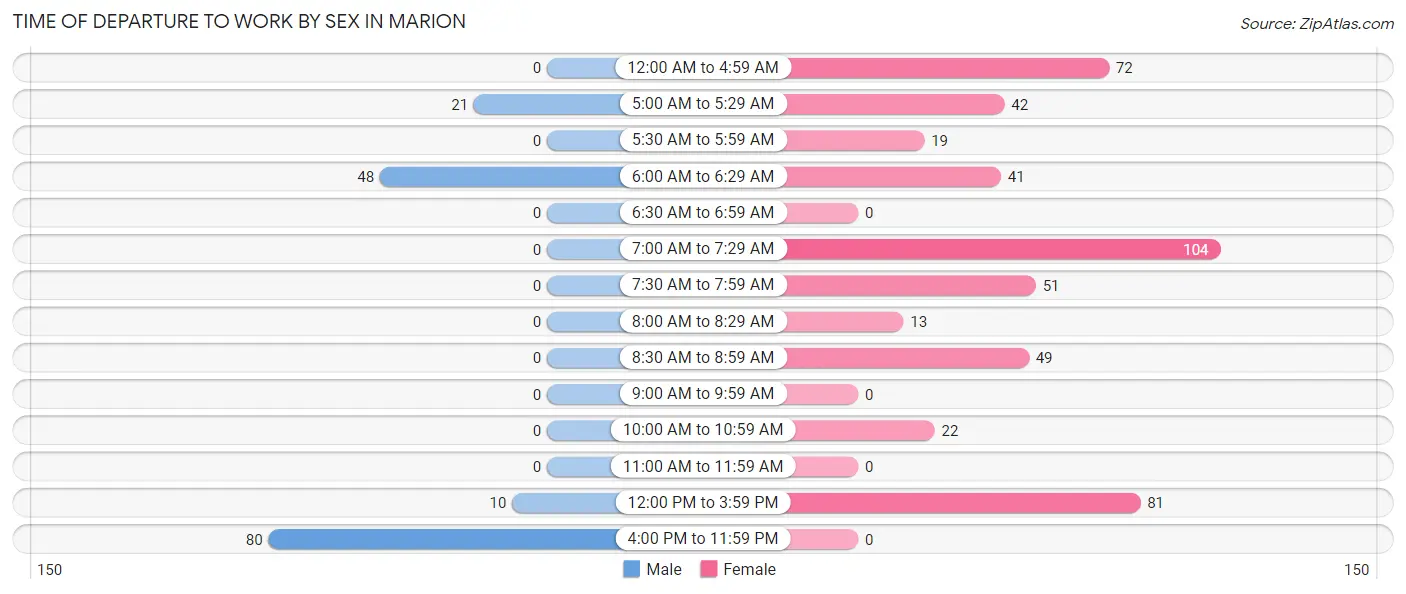
| Time of Departure | Male | Female |
| 12:00 AM to 4:59 AM | 0 (0.0%) | 72 (14.6%) |
| 5:00 AM to 5:29 AM | 21 (13.2%) | 42 (8.5%) |
| 5:30 AM to 5:59 AM | 0 (0.0%) | 19 (3.8%) |
| 6:00 AM to 6:29 AM | 48 (30.2%) | 41 (8.3%) |
| 6:30 AM to 6:59 AM | 0 (0.0%) | 0 (0.0%) |
| 7:00 AM to 7:29 AM | 0 (0.0%) | 104 (21.0%) |
| 7:30 AM to 7:59 AM | 0 (0.0%) | 51 (10.3%) |
| 8:00 AM to 8:29 AM | 0 (0.0%) | 13 (2.6%) |
| 8:30 AM to 8:59 AM | 0 (0.0%) | 49 (9.9%) |
| 9:00 AM to 9:59 AM | 0 (0.0%) | 0 (0.0%) |
| 10:00 AM to 10:59 AM | 0 (0.0%) | 22 (4.4%) |
| 11:00 AM to 11:59 AM | 0 (0.0%) | 0 (0.0%) |
| 12:00 PM to 3:59 PM | 10 (6.3%) | 81 (16.4%) |
| 4:00 PM to 11:59 PM | 80 (50.3%) | 0 (0.0%) |
| Total | 159 (100.0%) | 494 (100.0%) |
Housing Occupancy in Marion
Occupancy by Ownership in Marion
Of the total 784 dwellings in Marion, owner-occupied units account for 411 (52.4%), while renter-occupied units make up 373 (47.6%).
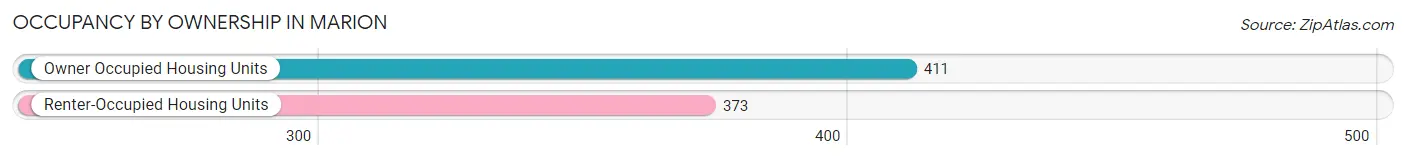
| Occupancy | # Housing Units | % Housing Units |
| Owner Occupied Housing Units | 411 | 52.4% |
| Renter-Occupied Housing Units | 373 | 47.6% |
| Total Occupied Housing Units | 784 | 100.0% |
Occupancy by Household Size in Marion
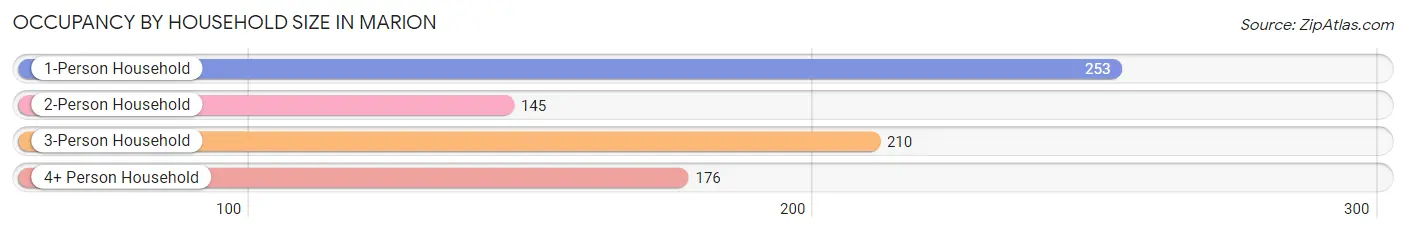
| Household Size | # Housing Units | % Housing Units |
| 1-Person Household | 253 | 32.3% |
| 2-Person Household | 145 | 18.5% |
| 3-Person Household | 210 | 26.8% |
| 4+ Person Household | 176 | 22.5% |
| Total Housing Units | 784 | 100.0% |
Occupancy by Ownership by Household Size in Marion
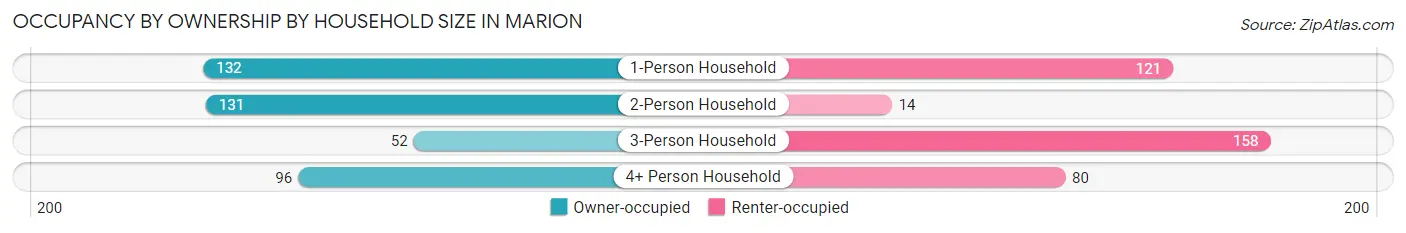
| Household Size | Owner-occupied | Renter-occupied |
| 1-Person Household | 132 (52.2%) | 121 (47.8%) |
| 2-Person Household | 131 (90.3%) | 14 (9.7%) |
| 3-Person Household | 52 (24.8%) | 158 (75.2%) |
| 4+ Person Household | 96 (54.5%) | 80 (45.5%) |
| Total Housing Units | 411 (52.4%) | 373 (47.6%) |
Occupancy by Educational Attainment in Marion
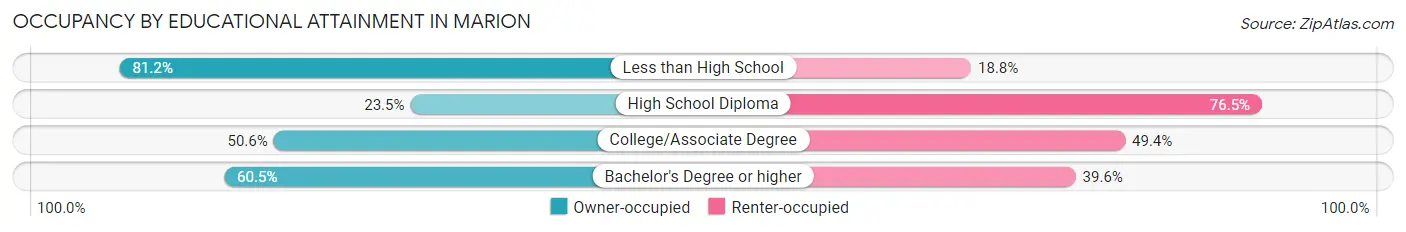
| Household Size | Owner-occupied | Renter-occupied |
| Less than High School | 138 (81.2%) | 32 (18.8%) |
| High School Diploma | 48 (23.5%) | 156 (76.5%) |
| College/Associate Degree | 118 (50.6%) | 115 (49.4%) |
| Bachelor's Degree or higher | 107 (60.5%) | 70 (39.6%) |
Occupancy by Age of Householder in Marion
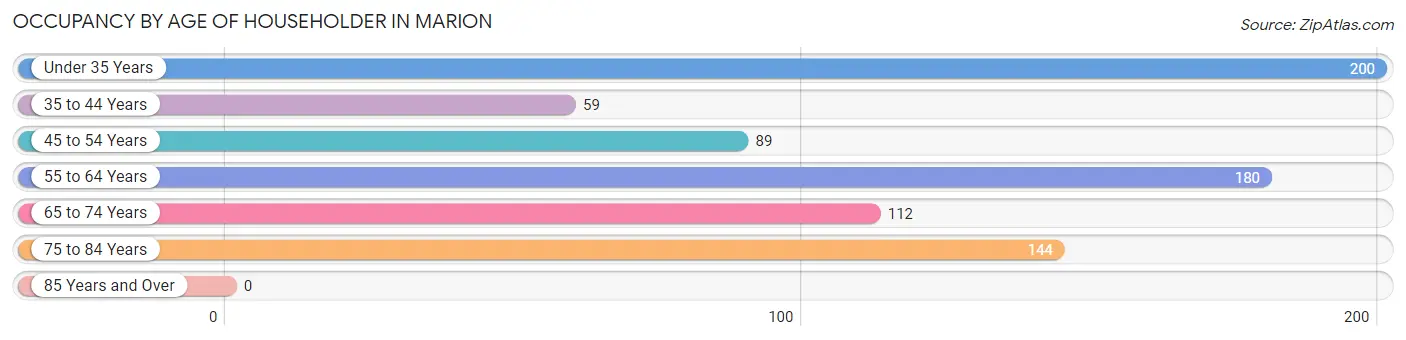
| Age Bracket | # Households | % Households |
| Under 35 Years | 200 | 25.5% |
| 35 to 44 Years | 59 | 7.5% |
| 45 to 54 Years | 89 | 11.4% |
| 55 to 64 Years | 180 | 23.0% |
| 65 to 74 Years | 112 | 14.3% |
| 75 to 84 Years | 144 | 18.4% |
| 85 Years and Over | 0 | 0.0% |
| Total | 784 | 100.0% |
Housing Finances in Marion
Median Income by Occupancy in Marion
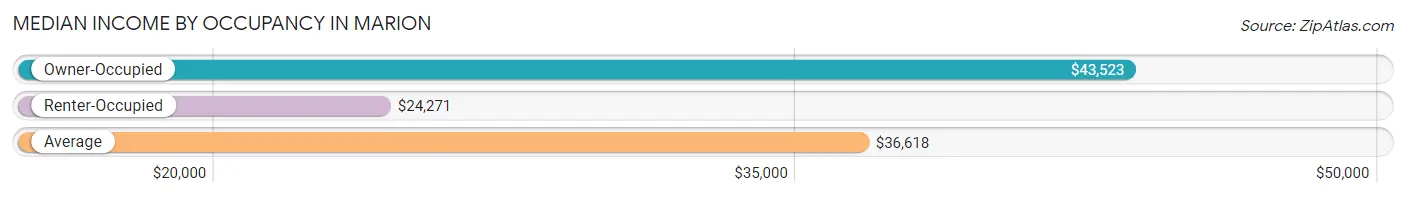
| Occupancy Type | # Households | Median Income |
| Owner-Occupied | 411 (52.4%) | $43,523 |
| Renter-Occupied | 373 (47.6%) | $24,271 |
| Average | 784 (100.0%) | $36,618 |
Occupancy by Householder Income Bracket in Marion
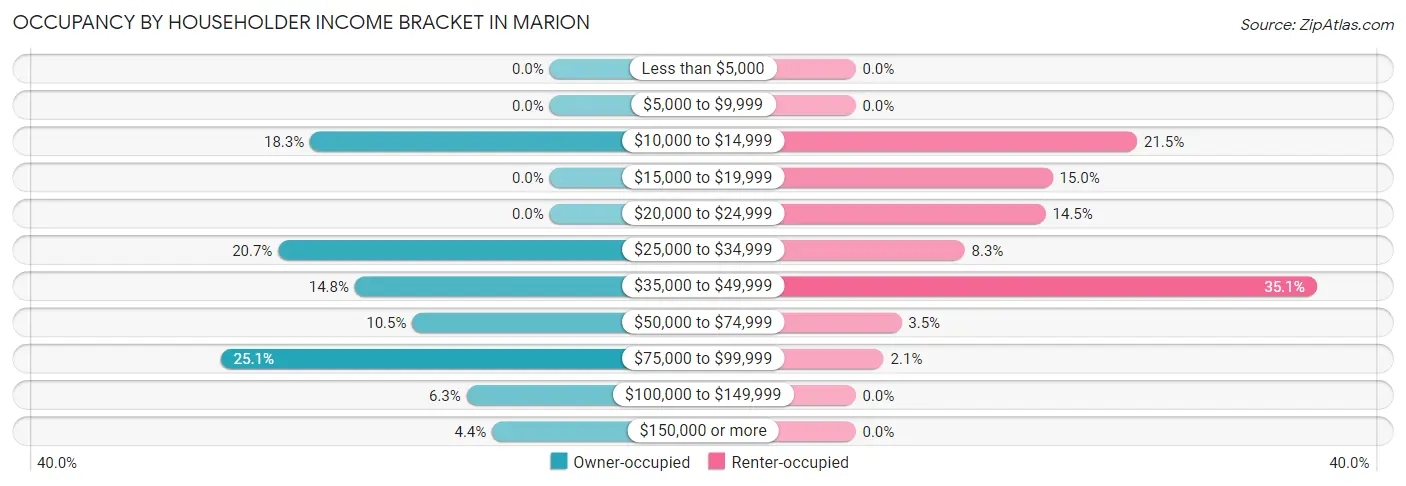
| Income Bracket | Owner-occupied | Renter-occupied |
| Less than $5,000 | 0 (0.0%) | 0 (0.0%) |
| $5,000 to $9,999 | 0 (0.0%) | 0 (0.0%) |
| $10,000 to $14,999 | 75 (18.2%) | 80 (21.4%) |
| $15,000 to $19,999 | 0 (0.0%) | 56 (15.0%) |
| $20,000 to $24,999 | 0 (0.0%) | 54 (14.5%) |
| $25,000 to $34,999 | 85 (20.7%) | 31 (8.3%) |
| $35,000 to $49,999 | 61 (14.8%) | 131 (35.1%) |
| $50,000 to $74,999 | 43 (10.5%) | 13 (3.5%) |
| $75,000 to $99,999 | 103 (25.1%) | 8 (2.1%) |
| $100,000 to $149,999 | 26 (6.3%) | 0 (0.0%) |
| $150,000 or more | 18 (4.4%) | 0 (0.0%) |
| Total | 411 (100.0%) | 373 (100.0%) |
Monthly Housing Cost Tiers in Marion
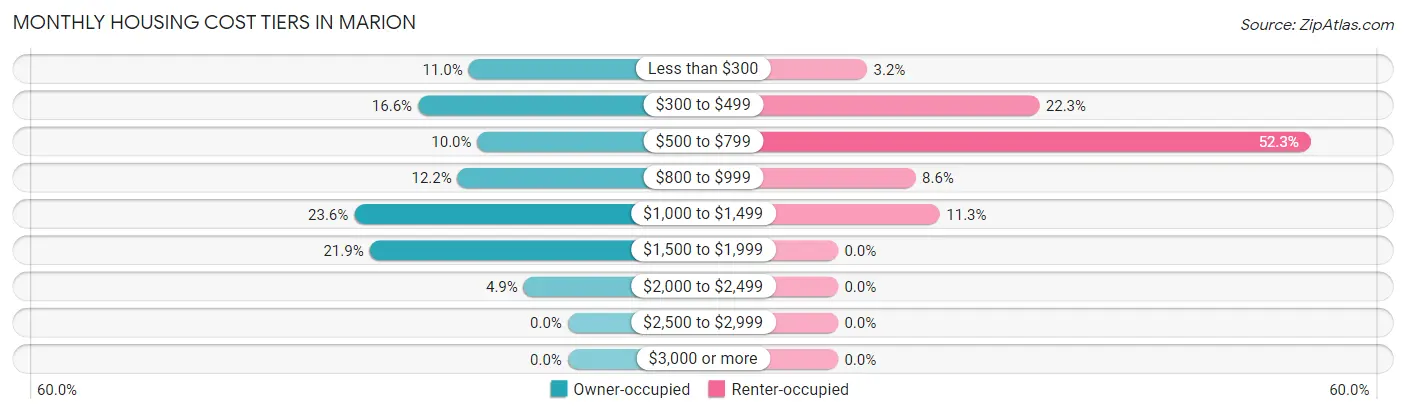
| Monthly Cost | Owner-occupied | Renter-occupied |
| Less than $300 | 45 (11.0%) | 12 (3.2%) |
| $300 to $499 | 68 (16.6%) | 83 (22.3%) |
| $500 to $799 | 41 (10.0%) | 195 (52.3%) |
| $800 to $999 | 50 (12.2%) | 32 (8.6%) |
| $1,000 to $1,499 | 97 (23.6%) | 42 (11.3%) |
| $1,500 to $1,999 | 90 (21.9%) | 0 (0.0%) |
| $2,000 to $2,499 | 20 (4.9%) | 0 (0.0%) |
| $2,500 to $2,999 | 0 (0.0%) | 0 (0.0%) |
| $3,000 or more | 0 (0.0%) | 0 (0.0%) |
| Total | 411 (100.0%) | 373 (100.0%) |
Physical Housing Characteristics in Marion
Housing Structures in Marion
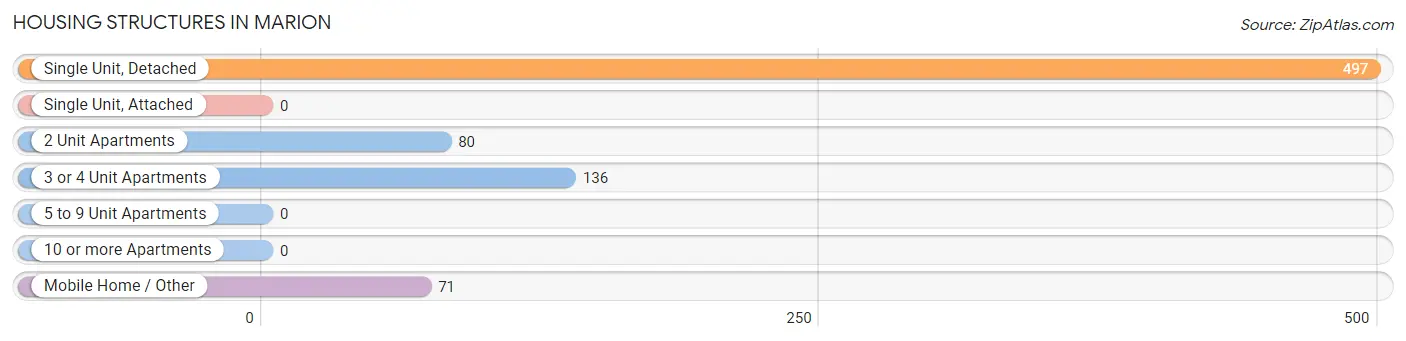
| Structure Type | # Housing Units | % Housing Units |
| Single Unit, Detached | 497 | 63.4% |
| Single Unit, Attached | 0 | 0.0% |
| 2 Unit Apartments | 80 | 10.2% |
| 3 or 4 Unit Apartments | 136 | 17.3% |
| 5 to 9 Unit Apartments | 0 | 0.0% |
| 10 or more Apartments | 0 | 0.0% |
| Mobile Home / Other | 71 | 9.1% |
| Total | 784 | 100.0% |
Housing Structures by Occupancy in Marion
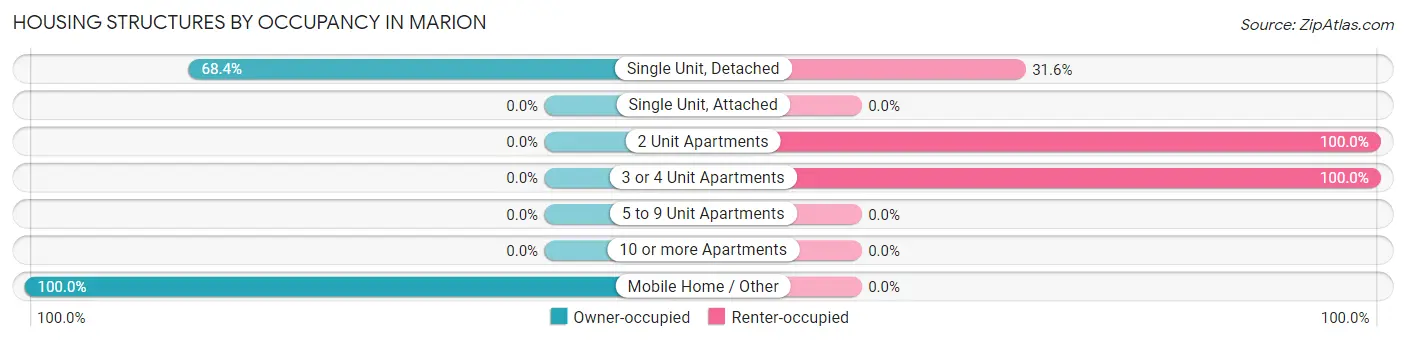
| Structure Type | Owner-occupied | Renter-occupied |
| Single Unit, Detached | 340 (68.4%) | 157 (31.6%) |
| Single Unit, Attached | 0 (0.0%) | 0 (0.0%) |
| 2 Unit Apartments | 0 (0.0%) | 80 (100.0%) |
| 3 or 4 Unit Apartments | 0 (0.0%) | 136 (100.0%) |
| 5 to 9 Unit Apartments | 0 (0.0%) | 0 (0.0%) |
| 10 or more Apartments | 0 (0.0%) | 0 (0.0%) |
| Mobile Home / Other | 71 (100.0%) | 0 (0.0%) |
| Total | 411 (52.4%) | 373 (47.6%) |
Housing Structures by Number of Rooms in Marion
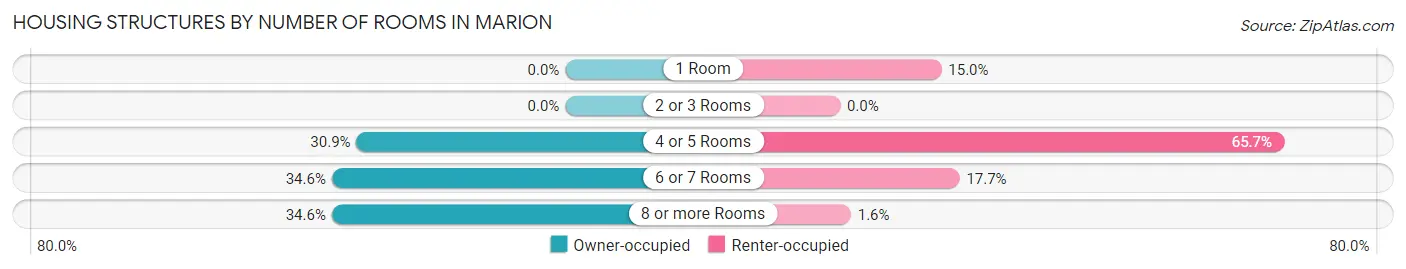
| Number of Rooms | Owner-occupied | Renter-occupied |
| 1 Room | 0 (0.0%) | 56 (15.0%) |
| 2 or 3 Rooms | 0 (0.0%) | 0 (0.0%) |
| 4 or 5 Rooms | 127 (30.9%) | 245 (65.7%) |
| 6 or 7 Rooms | 142 (34.5%) | 66 (17.7%) |
| 8 or more Rooms | 142 (34.5%) | 6 (1.6%) |
| Total | 411 (100.0%) | 373 (100.0%) |
Housing Structure by Heating Type in Marion
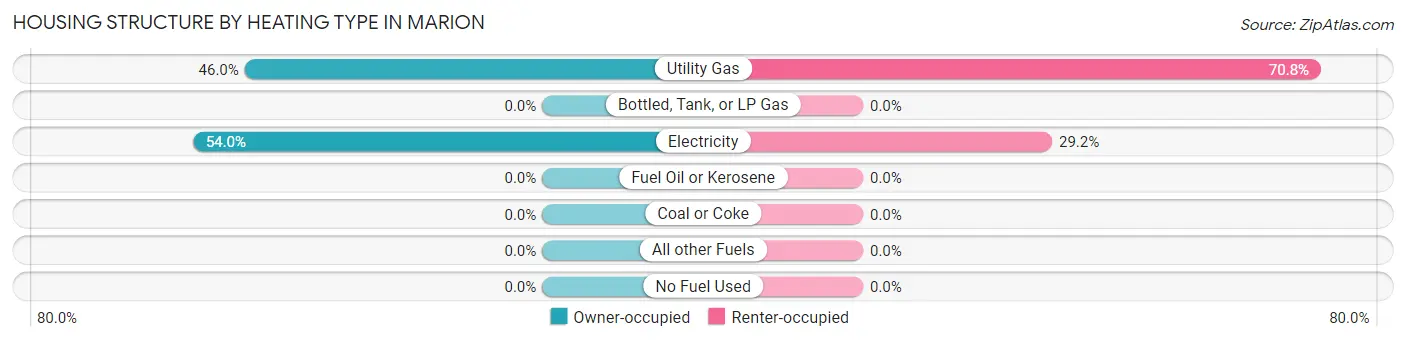
| Heating Type | Owner-occupied | Renter-occupied |
| Utility Gas | 189 (46.0%) | 264 (70.8%) |
| Bottled, Tank, or LP Gas | 0 (0.0%) | 0 (0.0%) |
| Electricity | 222 (54.0%) | 109 (29.2%) |
| Fuel Oil or Kerosene | 0 (0.0%) | 0 (0.0%) |
| Coal or Coke | 0 (0.0%) | 0 (0.0%) |
| All other Fuels | 0 (0.0%) | 0 (0.0%) |
| No Fuel Used | 0 (0.0%) | 0 (0.0%) |
| Total | 411 (100.0%) | 373 (100.0%) |
Household Vehicle Usage in Marion
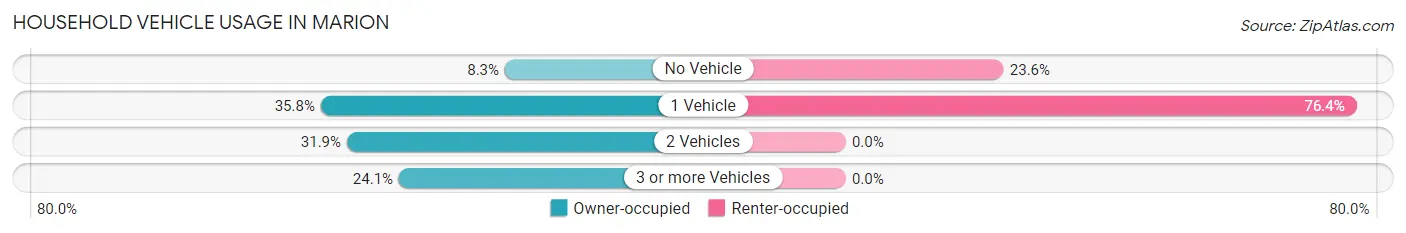
| Vehicles per Household | Owner-occupied | Renter-occupied |
| No Vehicle | 34 (8.3%) | 88 (23.6%) |
| 1 Vehicle | 147 (35.8%) | 285 (76.4%) |
| 2 Vehicles | 131 (31.9%) | 0 (0.0%) |
| 3 or more Vehicles | 99 (24.1%) | 0 (0.0%) |
| Total | 411 (100.0%) | 373 (100.0%) |
Real Estate & Mortgages in Marion
Real Estate and Mortgage Overview in Marion
| Characteristic | Without Mortgage | With Mortgage |
| Housing Units | 154 | 257 |
| Median Property Value | - | - |
| Median Household Income | - | - |
| Monthly Housing Costs | $437 | $0 |
| Real Estate Taxes | $199 | $0 |
Property Value by Mortgage Status in Marion
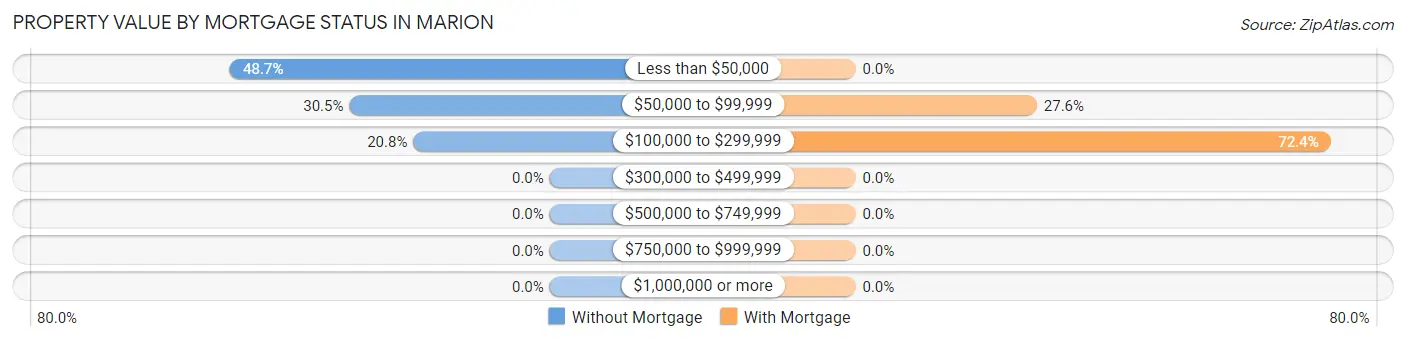
| Property Value | Without Mortgage | With Mortgage |
| Less than $50,000 | 75 (48.7%) | 0 (0.0%) |
| $50,000 to $99,999 | 47 (30.5%) | 71 (27.6%) |
| $100,000 to $299,999 | 32 (20.8%) | 186 (72.4%) |
| $300,000 to $499,999 | 0 (0.0%) | 0 (0.0%) |
| $500,000 to $749,999 | 0 (0.0%) | 0 (0.0%) |
| $750,000 to $999,999 | 0 (0.0%) | 0 (0.0%) |
| $1,000,000 or more | 0 (0.0%) | 0 (0.0%) |
| Total | 154 (100.0%) | 257 (100.0%) |
Household Income by Mortgage Status in Marion
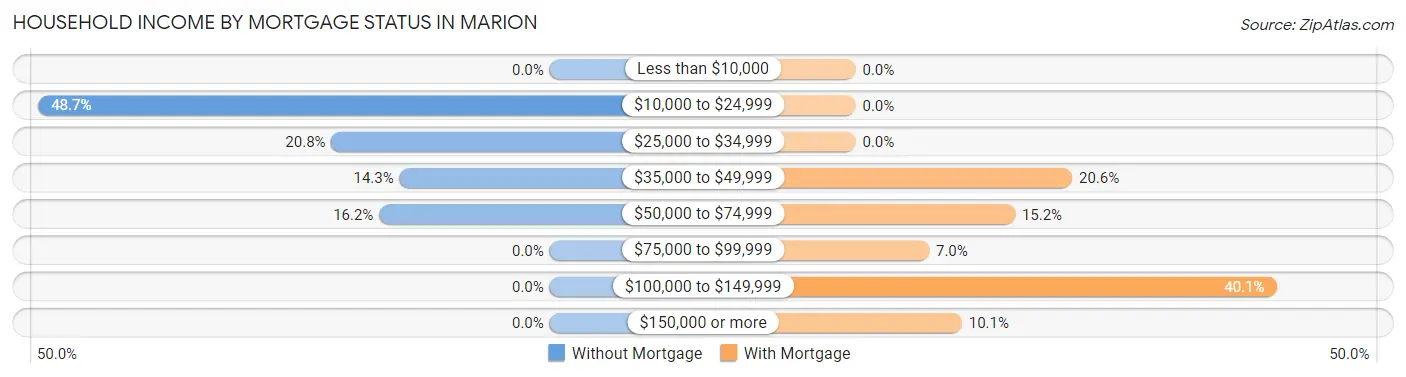
| Household Income | Without Mortgage | With Mortgage |
| Less than $10,000 | 0 (0.0%) | 0 (0.0%) |
| $10,000 to $24,999 | 75 (48.7%) | 0 (0.0%) |
| $25,000 to $34,999 | 32 (20.8%) | 0 (0.0%) |
| $35,000 to $49,999 | 22 (14.3%) | 53 (20.6%) |
| $50,000 to $74,999 | 25 (16.2%) | 39 (15.2%) |
| $75,000 to $99,999 | 0 (0.0%) | 18 (7.0%) |
| $100,000 to $149,999 | 0 (0.0%) | 103 (40.1%) |
| $150,000 or more | 0 (0.0%) | 26 (10.1%) |
| Total | 154 (100.0%) | 257 (100.0%) |
Property Value to Household Income Ratio in Marion
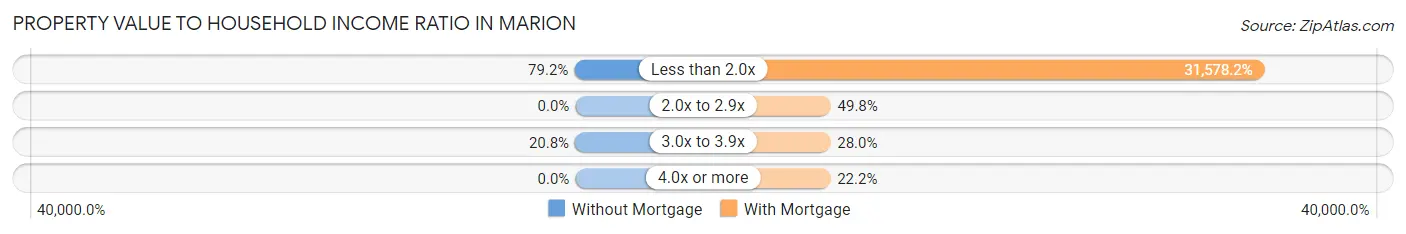
| Value-to-Income Ratio | Without Mortgage | With Mortgage |
| Less than 2.0x | 122 (79.2%) | 81,156 (31,578.2%) |
| 2.0x to 2.9x | 0 (0.0%) | 128 (49.8%) |
| 3.0x to 3.9x | 32 (20.8%) | 72 (28.0%) |
| 4.0x or more | 0 (0.0%) | 57 (22.2%) |
| Total | 154 (100.0%) | 257 (100.0%) |
Real Estate Taxes by Mortgage Status in Marion
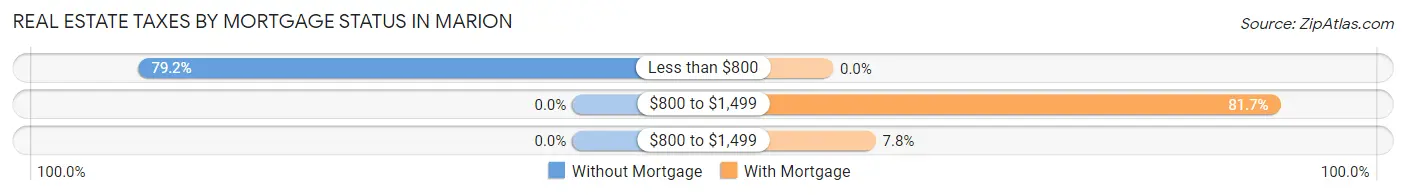
| Property Taxes | Without Mortgage | With Mortgage |
| Less than $800 | 122 (79.2%) | 0 (0.0%) |
| $800 to $1,499 | 0 (0.0%) | 210 (81.7%) |
| $800 to $1,499 | 0 (0.0%) | 20 (7.8%) |
| Total | 154 (100.0%) | 257 (100.0%) |
Health & Disability in Marion
Health Insurance Coverage by Age in Marion
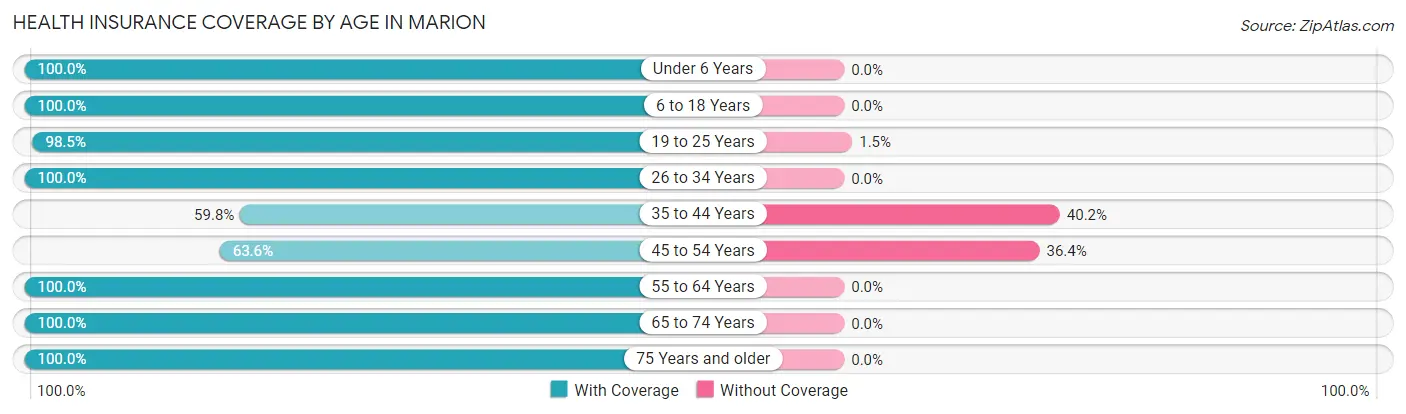
| Age Bracket | With Coverage | Without Coverage |
| Under 6 Years | 213 (100.0%) | 0 (0.0%) |
| 6 to 18 Years | 586 (100.0%) | 0 (0.0%) |
| 19 to 25 Years | 928 (98.5%) | 14 (1.5%) |
| 26 to 34 Years | 225 (100.0%) | 0 (0.0%) |
| 35 to 44 Years | 61 (59.8%) | 41 (40.2%) |
| 45 to 54 Years | 131 (63.6%) | 75 (36.4%) |
| 55 to 64 Years | 254 (100.0%) | 0 (0.0%) |
| 65 to 74 Years | 273 (100.0%) | 0 (0.0%) |
| 75 Years and older | 156 (100.0%) | 0 (0.0%) |
| Total | 2,827 (95.6%) | 130 (4.4%) |
Health Insurance Coverage by Citizenship Status in Marion
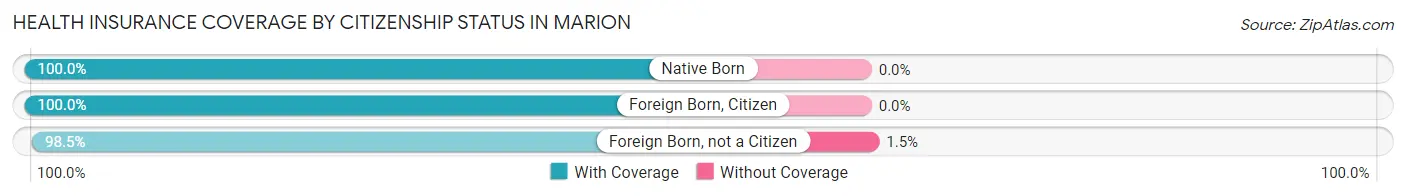
| Citizenship Status | With Coverage | Without Coverage |
| Native Born | 213 (100.0%) | 0 (0.0%) |
| Foreign Born, Citizen | 586 (100.0%) | 0 (0.0%) |
| Foreign Born, not a Citizen | 928 (98.5%) | 14 (1.5%) |
Health Insurance Coverage by Household Income in Marion
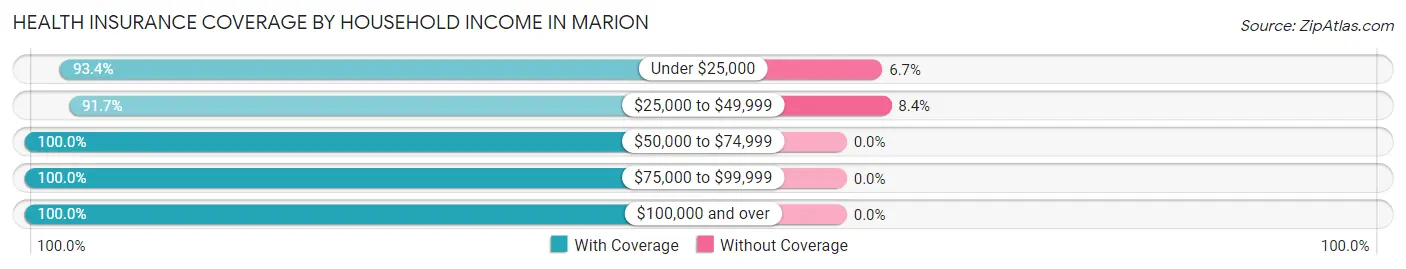
| Household Income | With Coverage | Without Coverage |
| Under $25,000 | 576 (93.3%) | 41 (6.7%) |
| $25,000 to $49,999 | 823 (91.6%) | 75 (8.4%) |
| $50,000 to $74,999 | 127 (100.0%) | 0 (0.0%) |
| $75,000 to $99,999 | 362 (100.0%) | 0 (0.0%) |
| $100,000 and over | 198 (100.0%) | 0 (0.0%) |
Public vs Private Health Insurance Coverage by Age in Marion
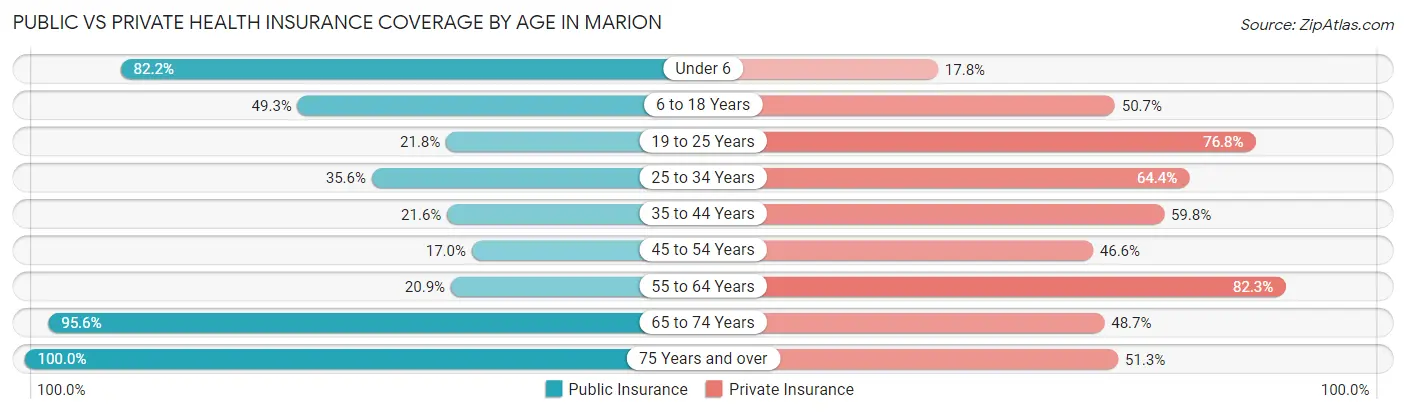
| Age Bracket | Public Insurance | Private Insurance |
| Under 6 | 175 (82.2%) | 38 (17.8%) |
| 6 to 18 Years | 289 (49.3%) | 297 (50.7%) |
| 19 to 25 Years | 205 (21.8%) | 723 (76.7%) |
| 25 to 34 Years | 80 (35.6%) | 145 (64.4%) |
| 35 to 44 Years | 22 (21.6%) | 61 (59.8%) |
| 45 to 54 Years | 35 (17.0%) | 96 (46.6%) |
| 55 to 64 Years | 53 (20.9%) | 209 (82.3%) |
| 65 to 74 Years | 261 (95.6%) | 133 (48.7%) |
| 75 Years and over | 156 (100.0%) | 80 (51.3%) |
| Total | 1,276 (43.1%) | 1,782 (60.3%) |
Disability Status by Sex by Age in Marion
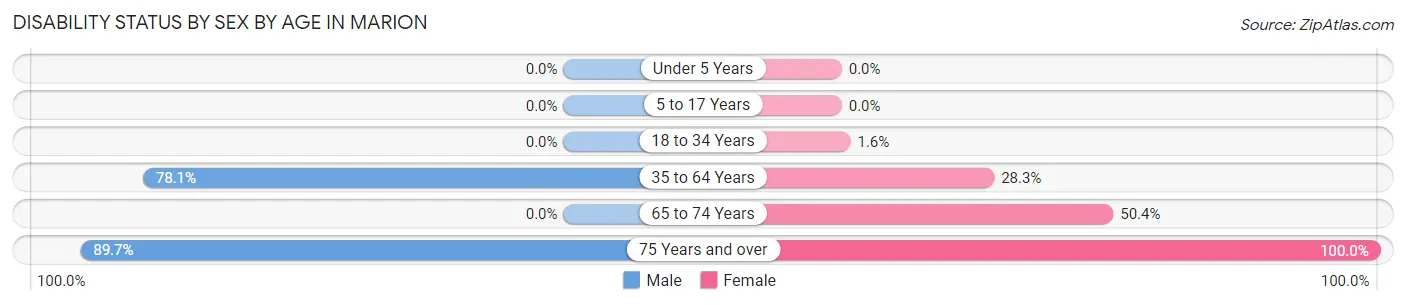
| Age Bracket | Male | Female |
| Under 5 Years | 0 (0.0%) | 0 (0.0%) |
| 5 to 17 Years | 0 (0.0%) | 0 (0.0%) |
| 18 to 34 Years | 0 (0.0%) | 11 (1.6%) |
| 35 to 64 Years | 160 (78.0%) | 101 (28.3%) |
| 65 to 74 Years | 0 (0.0%) | 126 (50.4%) |
| 75 Years and over | 104 (89.7%) | 40 (100.0%) |
Disability Class by Sex by Age in Marion
Disability Class: Hearing Difficulty
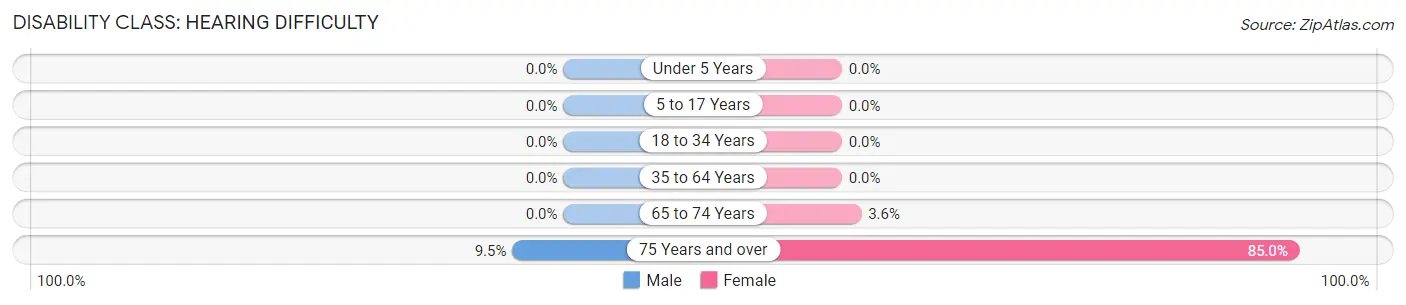
| Age Bracket | Male | Female |
| Under 5 Years | 0 (0.0%) | 0 (0.0%) |
| 5 to 17 Years | 0 (0.0%) | 0 (0.0%) |
| 18 to 34 Years | 0 (0.0%) | 0 (0.0%) |
| 35 to 64 Years | 0 (0.0%) | 0 (0.0%) |
| 65 to 74 Years | 0 (0.0%) | 9 (3.6%) |
| 75 Years and over | 11 (9.5%) | 34 (85.0%) |
Disability Class: Vision Difficulty
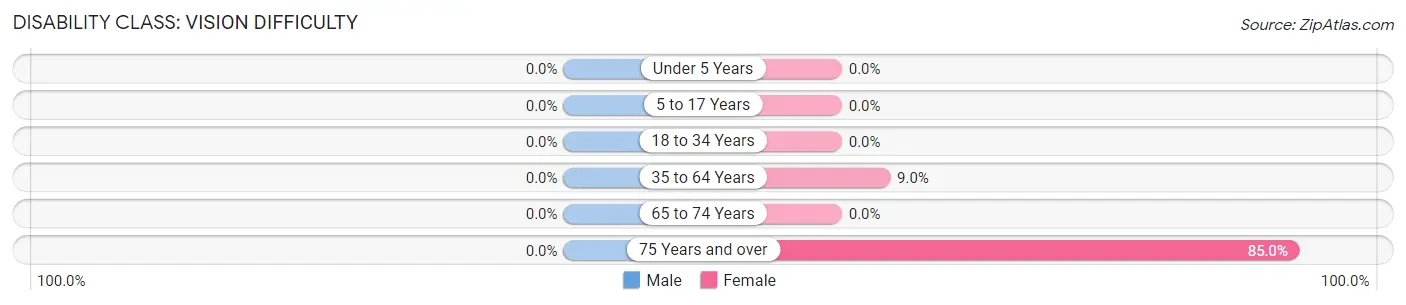
| Age Bracket | Male | Female |
| Under 5 Years | 0 (0.0%) | 0 (0.0%) |
| 5 to 17 Years | 0 (0.0%) | 0 (0.0%) |
| 18 to 34 Years | 0 (0.0%) | 0 (0.0%) |
| 35 to 64 Years | 0 (0.0%) | 32 (9.0%) |
| 65 to 74 Years | 0 (0.0%) | 0 (0.0%) |
| 75 Years and over | 0 (0.0%) | 34 (85.0%) |
Disability Class: Cognitive Difficulty
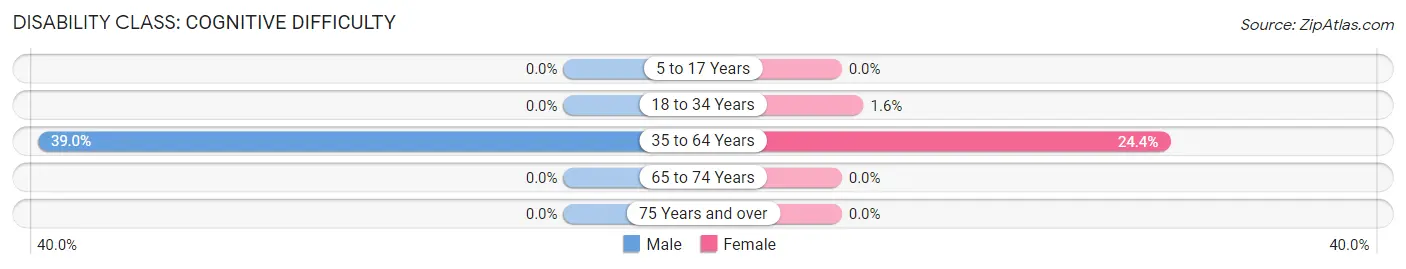
| Age Bracket | Male | Female |
| 5 to 17 Years | 0 (0.0%) | 0 (0.0%) |
| 18 to 34 Years | 0 (0.0%) | 11 (1.6%) |
| 35 to 64 Years | 80 (39.0%) | 87 (24.4%) |
| 65 to 74 Years | 0 (0.0%) | 0 (0.0%) |
| 75 Years and over | 0 (0.0%) | 0 (0.0%) |
Disability Class: Ambulatory Difficulty
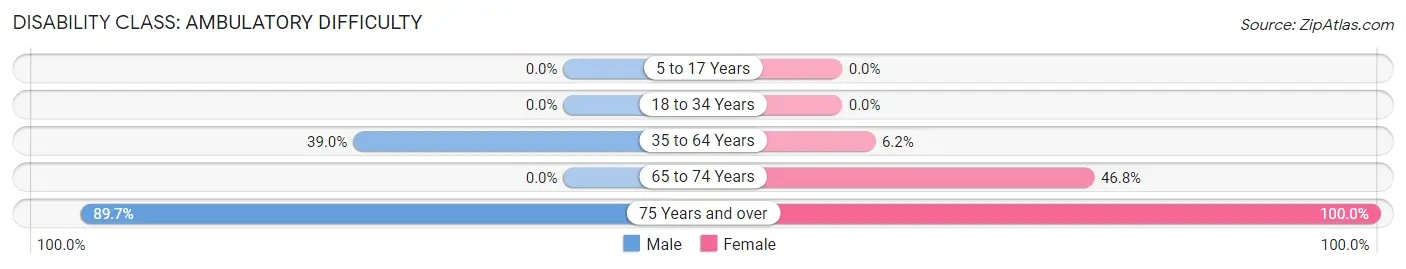
| Age Bracket | Male | Female |
| 5 to 17 Years | 0 (0.0%) | 0 (0.0%) |
| 18 to 34 Years | 0 (0.0%) | 0 (0.0%) |
| 35 to 64 Years | 80 (39.0%) | 22 (6.2%) |
| 65 to 74 Years | 0 (0.0%) | 117 (46.8%) |
| 75 Years and over | 104 (89.7%) | 40 (100.0%) |
Disability Class: Self-Care Difficulty
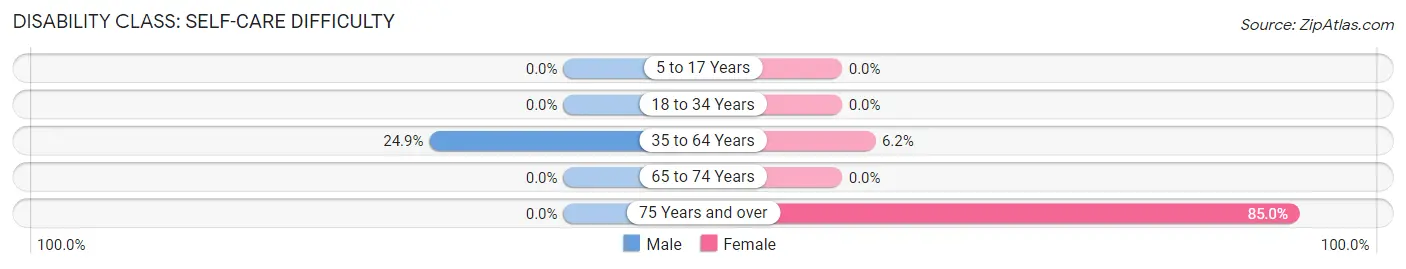
| Age Bracket | Male | Female |
| 5 to 17 Years | 0 (0.0%) | 0 (0.0%) |
| 18 to 34 Years | 0 (0.0%) | 0 (0.0%) |
| 35 to 64 Years | 51 (24.9%) | 22 (6.2%) |
| 65 to 74 Years | 0 (0.0%) | 0 (0.0%) |
| 75 Years and over | 0 (0.0%) | 34 (85.0%) |
Technology Access in Marion
Computing Device Access in Marion
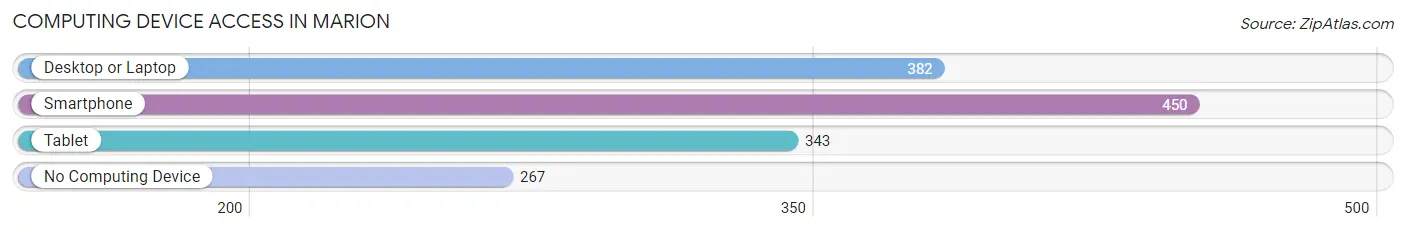
| Device Type | # Households | % Households |
| Desktop or Laptop | 382 | 48.7% |
| Smartphone | 450 | 57.4% |
| Tablet | 343 | 43.8% |
| No Computing Device | 267 | 34.1% |
| Total | 784 | 100.0% |
Internet Access in Marion
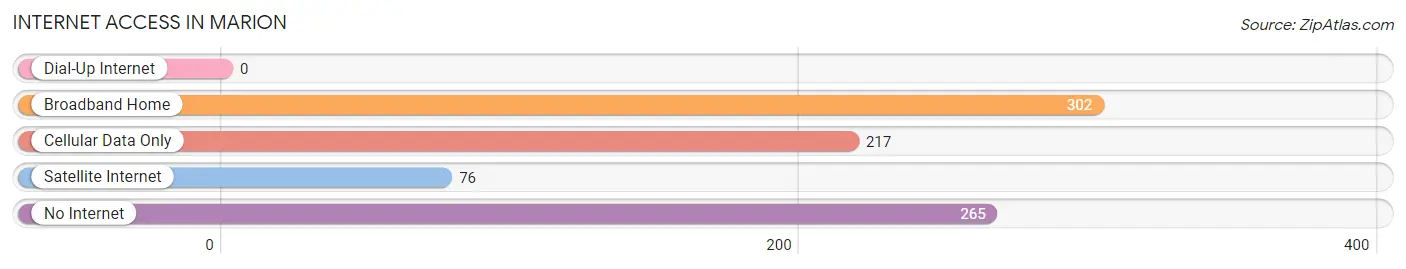
| Internet Type | # Households | % Households |
| Dial-Up Internet | 0 | 0.0% |
| Broadband Home | 302 | 38.5% |
| Cellular Data Only | 217 | 27.7% |
| Satellite Internet | 76 | 9.7% |
| No Internet | 265 | 33.8% |
| Total | 784 | 100.0% |
Marion Summary
Marion, Alabama is a small city located in the northwest corner of the state, in the foothills of the Appalachian Mountains. It is the county seat of Perry County and is part of the Birmingham-Hoover Metropolitan Statistical Area. The city has a population of approximately 3,500 people and is known for its rural charm and friendly atmosphere.
Geography
Marion is located in the northwest corner of Alabama, in the foothills of the Appalachian Mountains. It is situated on the banks of the Tombigbee River, which forms the border between Alabama and Mississippi. The city is surrounded by rolling hills and forests, and is located approximately 50 miles south of Birmingham and 90 miles north of Montgomery.
The climate in Marion is humid subtropical, with hot, humid summers and mild winters. The average annual temperature is around 64°F, with an average high of around 87°F in the summer and an average low of around 41°F in the winter. The average annual precipitation is around 50 inches, with most of the rain falling in the spring and summer months.
Economy
Marion’s economy is largely based on agriculture and manufacturing. The city is home to several large poultry processing plants, as well as a number of smaller businesses. The city is also home to a number of retail stores, restaurants, and other service-based businesses.
The city is also home to a number of educational institutions, including Marion Military Institute, Judson College, and the University of West Alabama. These institutions provide a number of jobs for the local economy, as well as educational opportunities for the residents of Marion.
Demographics
As of the 2010 census, the population of Marion was 3,521. The racial makeup of the city was 79.3% White, 18.2% African American, 0.3% Native American, 0.2% Asian, 0.1% Pacific Islander, 0.7% from other races, and 1.4% from two or more races. Hispanic or Latino of any race were 1.7% of the population.
The median income for a household in Marion was $30,938, and the median income for a family was $37,917. The per capita income for the city was $15,945. About 17.2% of families and 20.3% of the population were below the poverty line, including 28.2% of those under age 18 and 16.2% of those age 65 or over.
Conclusion
Marion, Alabama is a small city located in the northwest corner of the state, in the foothills of the Appalachian Mountains. It is the county seat of Perry County and is part of the Birmingham-Hoover Metropolitan Statistical Area. The city has a population of approximately 3,500 people and is known for its rural charm and friendly atmosphere. The economy of Marion is largely based on agriculture and manufacturing, and the city is home to several educational institutions. The population of Marion is predominantly white, with a small African American population. The median income for a household in Marion is lower than the national average, and a significant portion of the population is below the poverty line.
Common Questions
What is Per Capita Income in Marion?
Per Capita income in Marion is $13,413.
What is the Median Family Income in Marion?
Median Family Income in Marion is $42,383.
What is the Median Household income in Marion?
Median Household Income in Marion is $36,618.
What is Income or Wage Gap in Marion?
Income or Wage Gap in Marion is 58.2%.
Women in Marion earn 41.8 cents for every dollar earned by a man.
What is Family Income Deficit in Marion?
Family Income Deficit in Marion is $12,648.
Families that are below poverty line in Marion earn $12,648 less on average than the poverty threshold level.
What is Inequality or Gini Index in Marion?
Inequality or Gini Index in Marion is 0.40.
What is the Total Population of Marion?
Total Population of Marion is 3,128.
What is the Total Male Population of Marion?
Total Male Population of Marion is 1,345.
What is the Total Female Population of Marion?
Total Female Population of Marion is 1,783.
What is the Ratio of Males per 100 Females in Marion?
There are 75.43 Males per 100 Females in Marion.
What is the Ratio of Females per 100 Males in Marion?
There are 132.57 Females per 100 Males in Marion.
What is the Median Population Age in Marion?
Median Population Age in Marion is 23.6 Years.
What is the Average Family Size in Marion
Average Family Size in Marion is 3.6 People.
What is the Average Household Size in Marion
Average Household Size in Marion is 2.8 People.
How Large is the Labor Force in Marion?
There are 903 People in the Labor Forcein in Marion.
What is the Percentage of People in the Labor Force in Marion?
35.8% of People are in the Labor Force in Marion.
What is the Unemployment Rate in Marion?
Unemployment Rate in Marion is 18.7%.