Malvern, AL Map & Demographics
Malvern Map
Malvern Overview
$21,326
PER CAPITA INCOME
$60,000
AVG FAMILY INCOME
$50,662
AVG HOUSEHOLD INCOME
3.5%
WAGE / INCOME GAP [ % ]
96.5¢/ $1
WAGE / INCOME GAP [ $ ]
$6,849
FAMILY INCOME DEFICIT
0.41
INEQUALITY / GINI INDEX
1,926
TOTAL POPULATION
1,040
MALE POPULATION
886
FEMALE POPULATION
117.38
MALES / 100 FEMALES
85.19
FEMALES / 100 MALES
33.9
MEDIAN AGE
3.5
AVG FAMILY SIZE
2.9
AVG HOUSEHOLD SIZE
856
LABOR FORCE [ PEOPLE ]
60.1%
PERCENT IN LABOR FORCE
2.2%
UNEMPLOYMENT RATE
Malvern Area Codes
Income in Malvern
Income Overview in Malvern
Per Capita Income in Malvern is $21,326, while median incomes of families and households are $60,000 and $50,662 respectively.
| Characteristic | Number | Measure |
| Per Capita Income | 1,926 | $21,326 |
| Median Family Income | 486 | $60,000 |
| Mean Family Income | 486 | $66,931 |
| Median Household Income | 658 | $50,662 |
| Mean Household Income | 658 | $57,975 |
| Income Deficit | 486 | $6,849 |
| Wage / Income Gap (%) | 1,926 | 3.54% |
| Wage / Income Gap ($) | 1,926 | 96.46¢ per $1 |
| Gini / Inequality Index | 1,926 | 0.41 |
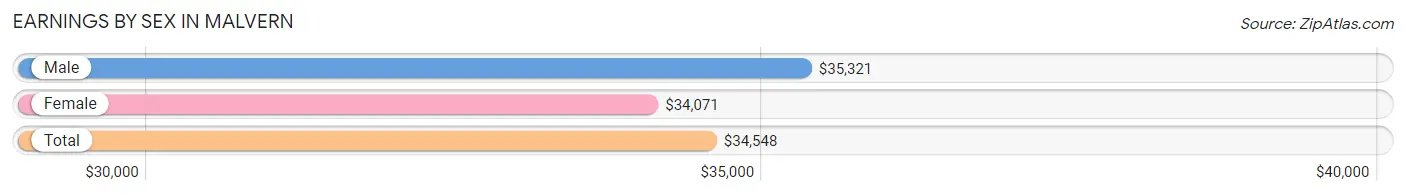
Earnings by Sex in Malvern
Average Earnings in Malvern are $34,548, $35,321 for men and $34,071 for women, a difference of 3.5%.
| Sex | Number | Average Earnings |
| Male | 577 (66.5%) | $35,321 |
| Female | 290 (33.5%) | $34,071 |
| Total | 867 (100.0%) | $34,548 |
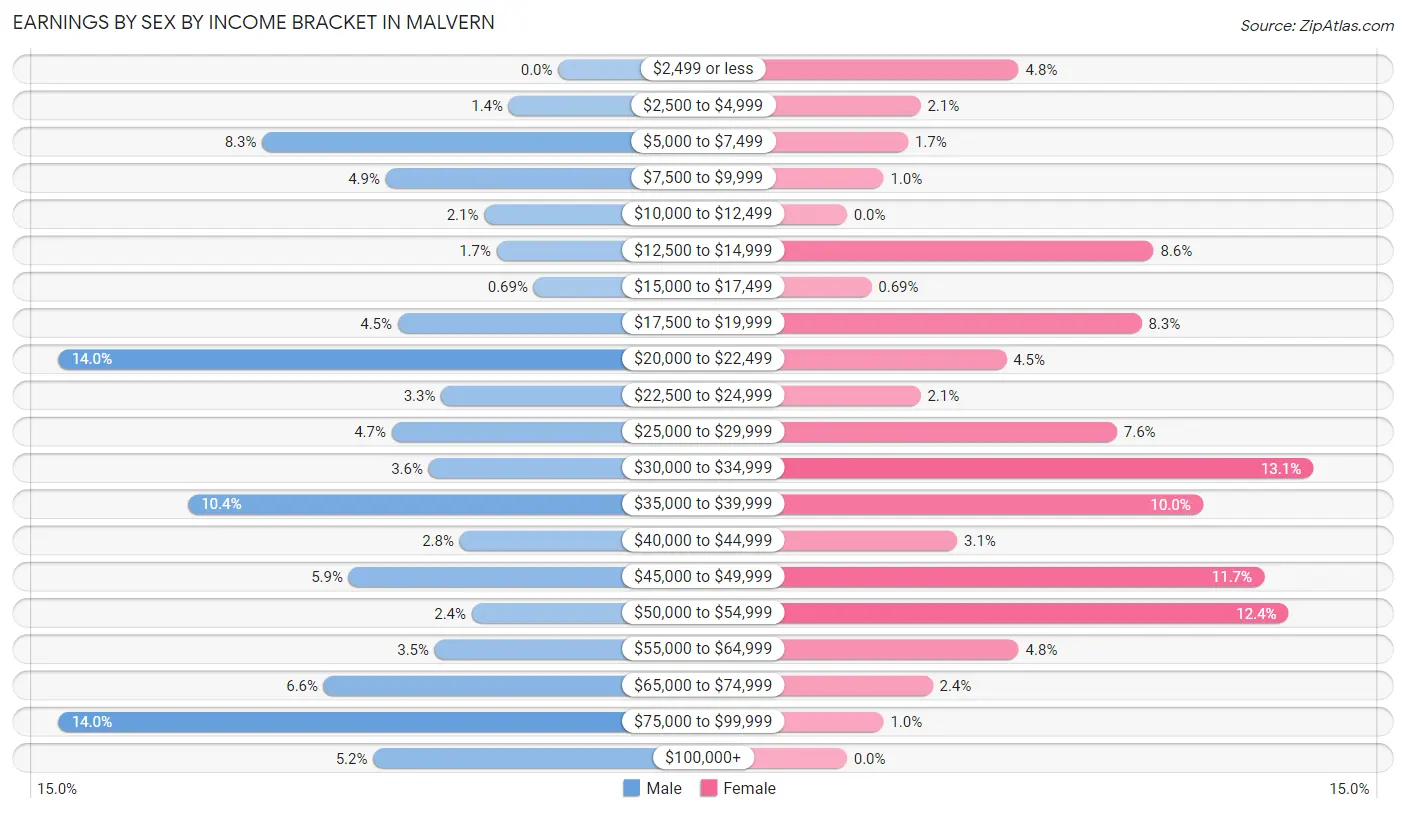
Earnings by Sex by Income Bracket in Malvern
The most common earnings brackets in Malvern are $20,000 to $22,499 for men (81 | 14.0%) and $30,000 to $34,999 for women (38 | 13.1%).
| Income | Male | Female |
| $2,499 or less | 0 (0.0%) | 14 (4.8%) |
| $2,500 to $4,999 | 8 (1.4%) | 6 (2.1%) |
| $5,000 to $7,499 | 48 (8.3%) | 5 (1.7%) |
| $7,500 to $9,999 | 28 (4.9%) | 3 (1.0%) |
| $10,000 to $12,499 | 12 (2.1%) | 0 (0.0%) |
| $12,500 to $14,999 | 10 (1.7%) | 25 (8.6%) |
| $15,000 to $17,499 | 4 (0.7%) | 2 (0.7%) |
| $17,500 to $19,999 | 26 (4.5%) | 24 (8.3%) |
| $20,000 to $22,499 | 81 (14.0%) | 13 (4.5%) |
| $22,500 to $24,999 | 19 (3.3%) | 6 (2.1%) |
| $25,000 to $29,999 | 27 (4.7%) | 22 (7.6%) |
| $30,000 to $34,999 | 21 (3.6%) | 38 (13.1%) |
| $35,000 to $39,999 | 60 (10.4%) | 29 (10.0%) |
| $40,000 to $44,999 | 16 (2.8%) | 9 (3.1%) |
| $45,000 to $49,999 | 34 (5.9%) | 34 (11.7%) |
| $50,000 to $54,999 | 14 (2.4%) | 36 (12.4%) |
| $55,000 to $64,999 | 20 (3.5%) | 14 (4.8%) |
| $65,000 to $74,999 | 38 (6.6%) | 7 (2.4%) |
| $75,000 to $99,999 | 81 (14.0%) | 3 (1.0%) |
| $100,000+ | 30 (5.2%) | 0 (0.0%) |
| Total | 577 (100.0%) | 290 (100.0%) |
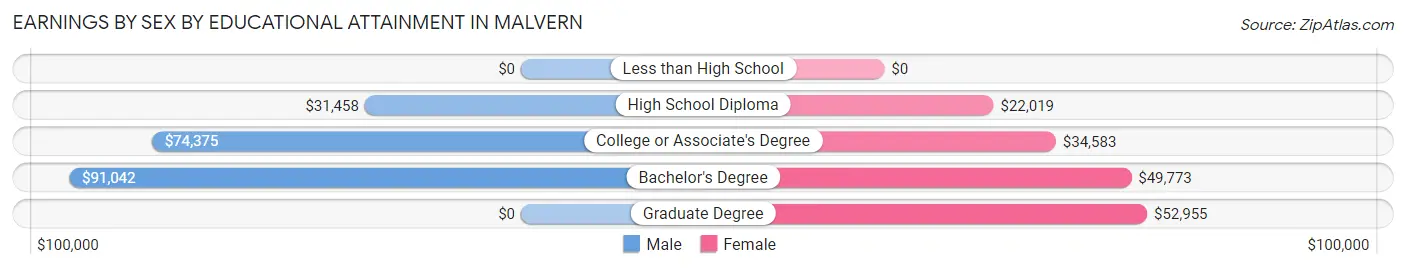
Earnings by Sex by Educational Attainment in Malvern
Average earnings in Malvern are $38,542 for men and $37,188 for women, a difference of 3.5%. Men with an educational attainment of bachelor's degree enjoy the highest average annual earnings of $91,042, while those with high school diploma education earn the least with $31,458. Women with an educational attainment of graduate degree earn the most with the average annual earnings of $52,955, while those with high school diploma education have the smallest earnings of $22,019.
| Educational Attainment | Male Income | Female Income |
| Less than High School | - | - |
| High School Diploma | $31,458 | $22,019 |
| College or Associate's Degree | $74,375 | $34,583 |
| Bachelor's Degree | $91,042 | $49,773 |
| Graduate Degree | - | - |
| Total | $38,542 | $37,188 |
Family Income in Malvern
Family Income Brackets in Malvern
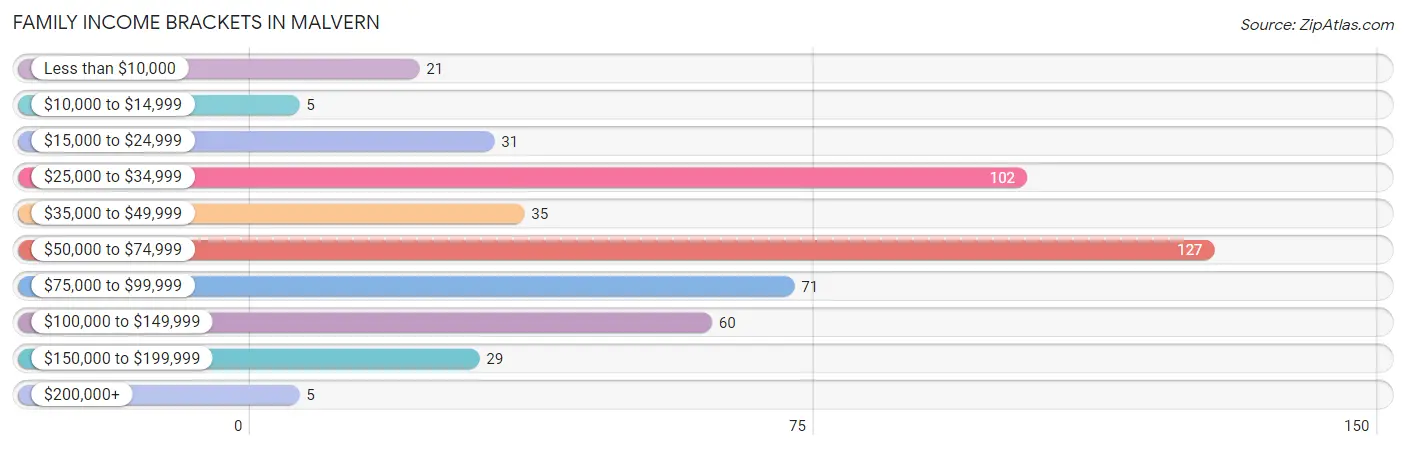
According to the Malvern family income data, there are 127 families falling into the $50,000 to $74,999 income range, which is the most common income bracket and makes up 26.1% of all families. Conversely, the $10,000 to $14,999 income bracket is the least frequent group with only 5 families (1.0%) belonging to this category.
| Income Bracket | # Families | % Families |
| Less than $10,000 | 21 | 4.3% |
| $10,000 to $14,999 | 5 | 1.0% |
| $15,000 to $24,999 | 31 | 6.4% |
| $25,000 to $34,999 | 102 | 21.0% |
| $35,000 to $49,999 | 35 | 7.2% |
| $50,000 to $74,999 | 127 | 26.1% |
| $75,000 to $99,999 | 71 | 14.6% |
| $100,000 to $149,999 | 60 | 12.3% |
| $150,000 to $199,999 | 29 | 6.0% |
| $200,000+ | 5 | 1.0% |
Family Income by Famaliy Size in Malvern
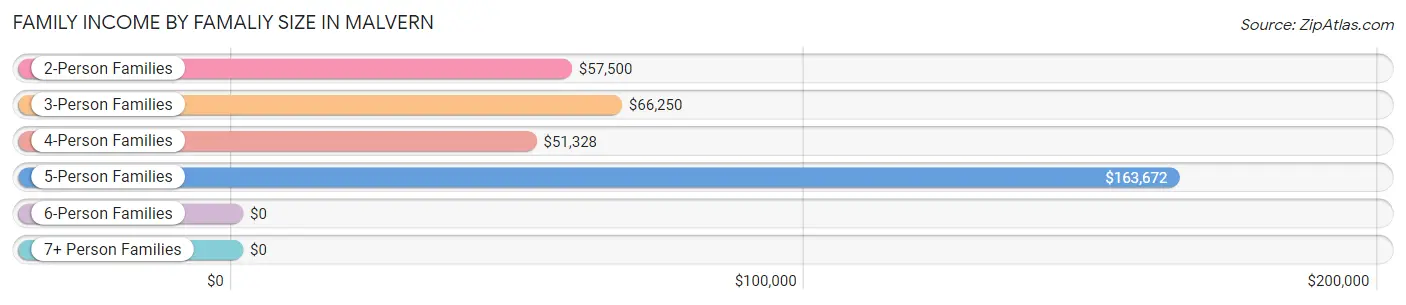
5-person families (27 | 5.6%) account for the highest median family income in Malvern with $163,672 per family, while 5-person families (27 | 5.6%) have the highest median income of $32,734 per family member.
| Income Bracket | # Families | Median Income |
| 2-Person Families | 152 (31.3%) | $57,500 |
| 3-Person Families | 122 (25.1%) | $66,250 |
| 4-Person Families | 181 (37.2%) | $51,328 |
| 5-Person Families | 27 (5.6%) | $163,672 |
| 6-Person Families | 4 (0.8%) | $0 |
| 7+ Person Families | 0 (0.0%) | $0 |
| Total | 486 (100.0%) | $60,000 |
Family Income by Number of Earners in Malvern
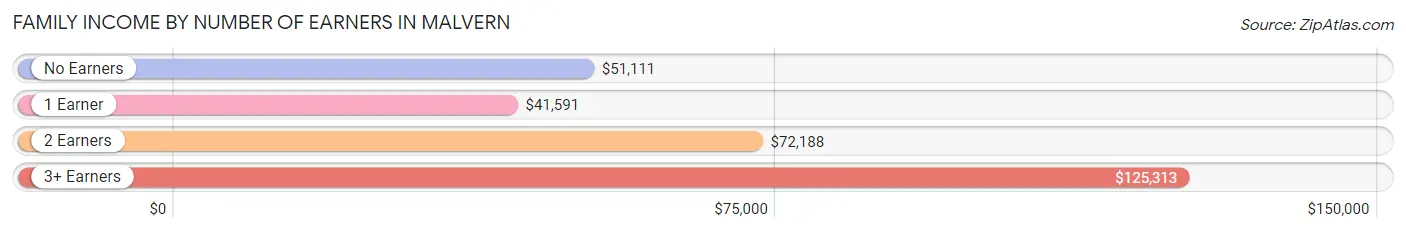
The median family income in Malvern is $60,000, with families comprising 3+ earners (23) having the highest median family income of $125,313, while families with 1 earner (204) have the lowest median family income of $41,591, accounting for 4.7% and 42.0% of families, respectively.
| Number of Earners | # Families | Median Income |
| No Earners | 50 (10.3%) | $51,111 |
| 1 Earner | 204 (42.0%) | $41,591 |
| 2 Earners | 209 (43.0%) | $72,188 |
| 3+ Earners | 23 (4.7%) | $125,313 |
| Total | 486 (100.0%) | $60,000 |
Household Income in Malvern
Household Income Brackets in Malvern
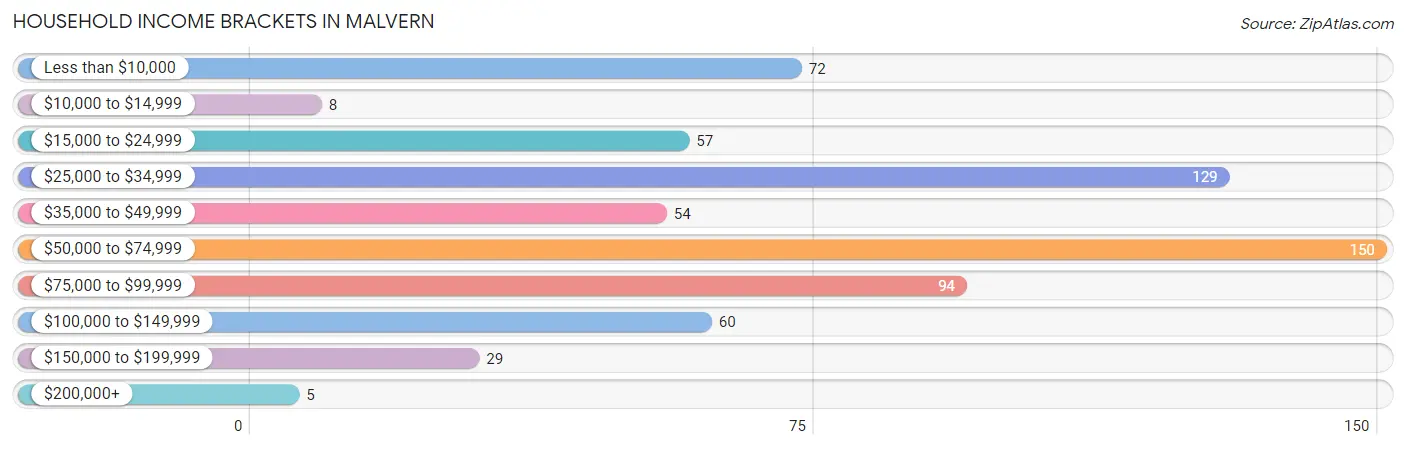
With 150 households falling in the category, the $50,000 to $74,999 income range is the most frequent in Malvern, accounting for 22.8% of all households. In contrast, only 5 households (0.8%) fall into the $200,000+ income bracket, making it the least populous group.
| Income Bracket | # Households | % Households |
| Less than $10,000 | 72 | 10.9% |
| $10,000 to $14,999 | 8 | 1.2% |
| $15,000 to $24,999 | 57 | 8.7% |
| $25,000 to $34,999 | 129 | 19.6% |
| $35,000 to $49,999 | 54 | 8.2% |
| $50,000 to $74,999 | 150 | 22.8% |
| $75,000 to $99,999 | 94 | 14.3% |
| $100,000 to $149,999 | 60 | 9.1% |
| $150,000 to $199,999 | 29 | 4.4% |
| $200,000+ | 5 | 0.8% |
Household Income by Householder Age in Malvern
The median household income in Malvern is $50,662, with the highest median household income of $73,313 found in the 45 to 64 years age bracket for the primary householder. A total of 173 households (26.3%) fall into this category. Meanwhile, the 15 to 24 years age bracket for the primary householder has the lowest median household income of $0, with 32 households (4.9%) in this group.
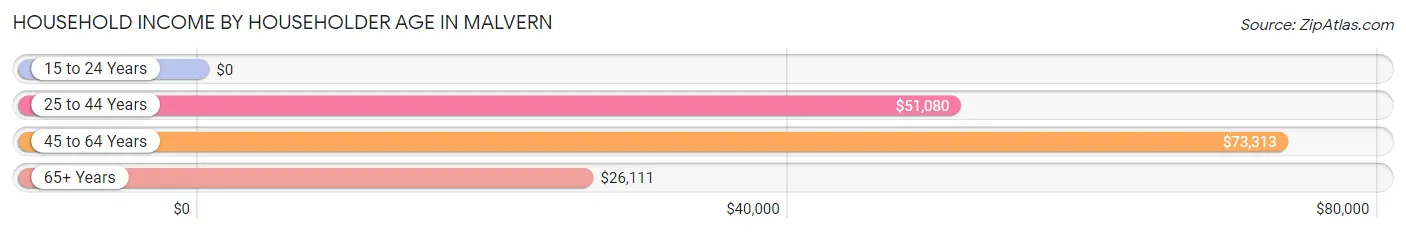
| Income Bracket | # Households | Median Income |
| 15 to 24 Years | 32 (4.9%) | $0 |
| 25 to 44 Years | 297 (45.1%) | $51,080 |
| 45 to 64 Years | 173 (26.3%) | $73,313 |
| 65+ Years | 156 (23.7%) | $26,111 |
| Total | 658 (100.0%) | $50,662 |
Poverty in Malvern
Income Below Poverty by Sex and Age in Malvern
With 27.4% poverty level for males and 18.0% for females among the residents of Malvern, 16 and 17 year old males and 18 to 24 year old females are the most vulnerable to poverty, with 48 males (85.7%) and 27 females (40.9%) in their respective age groups living below the poverty level.
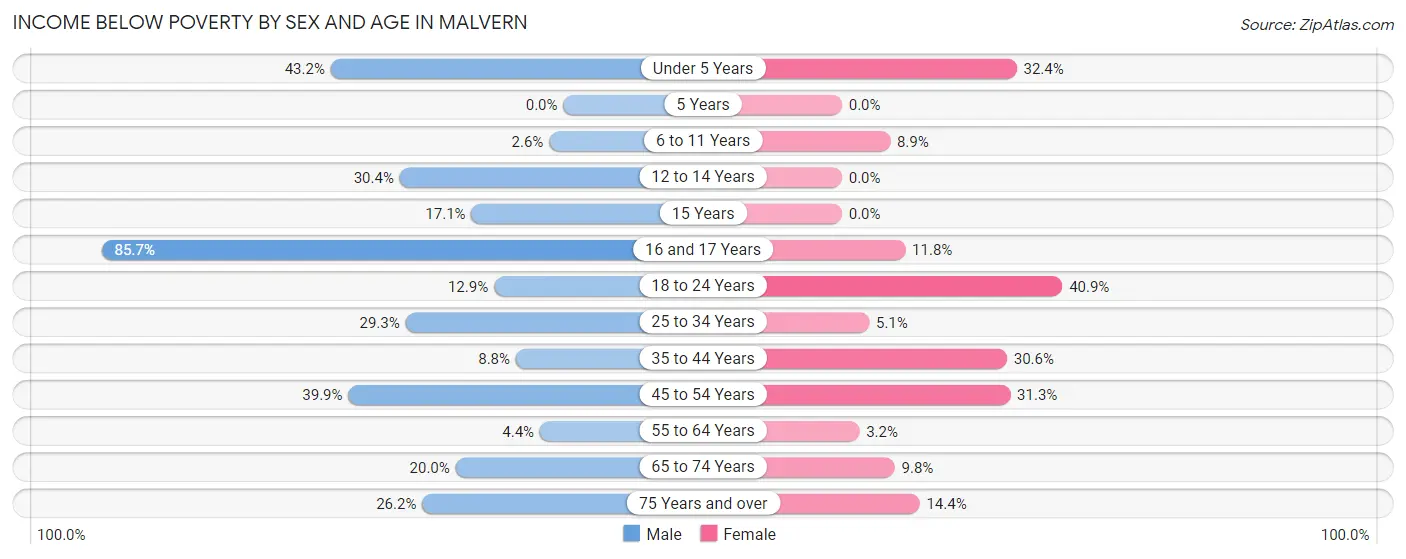
| Age Bracket | Male | Female |
| Under 5 Years | 19 (43.2%) | 12 (32.4%) |
| 5 Years | 0 (0.0%) | 0 (0.0%) |
| 6 to 11 Years | 2 (2.6%) | 11 (8.9%) |
| 12 to 14 Years | 41 (30.4%) | 0 (0.0%) |
| 15 Years | 7 (17.1%) | 0 (0.0%) |
| 16 and 17 Years | 48 (85.7%) | 4 (11.8%) |
| 18 to 24 Years | 13 (12.9%) | 27 (40.9%) |
| 25 to 34 Years | 41 (29.3%) | 4 (5.1%) |
| 35 to 44 Years | 6 (8.8%) | 68 (30.6%) |
| 45 to 54 Years | 81 (39.9%) | 10 (31.2%) |
| 55 to 64 Years | 3 (4.3%) | 3 (3.2%) |
| 65 to 74 Years | 13 (20.0%) | 5 (9.8%) |
| 75 Years and over | 11 (26.2%) | 15 (14.4%) |
| Total | 285 (27.4%) | 159 (18.0%) |
Income Above Poverty by Sex and Age in Malvern
According to the poverty statistics in Malvern, males aged 6 to 11 years and females aged 5 years are the age groups that are most secure financially, with 97.4% of males and 100.0% of females in these age groups living above the poverty line.
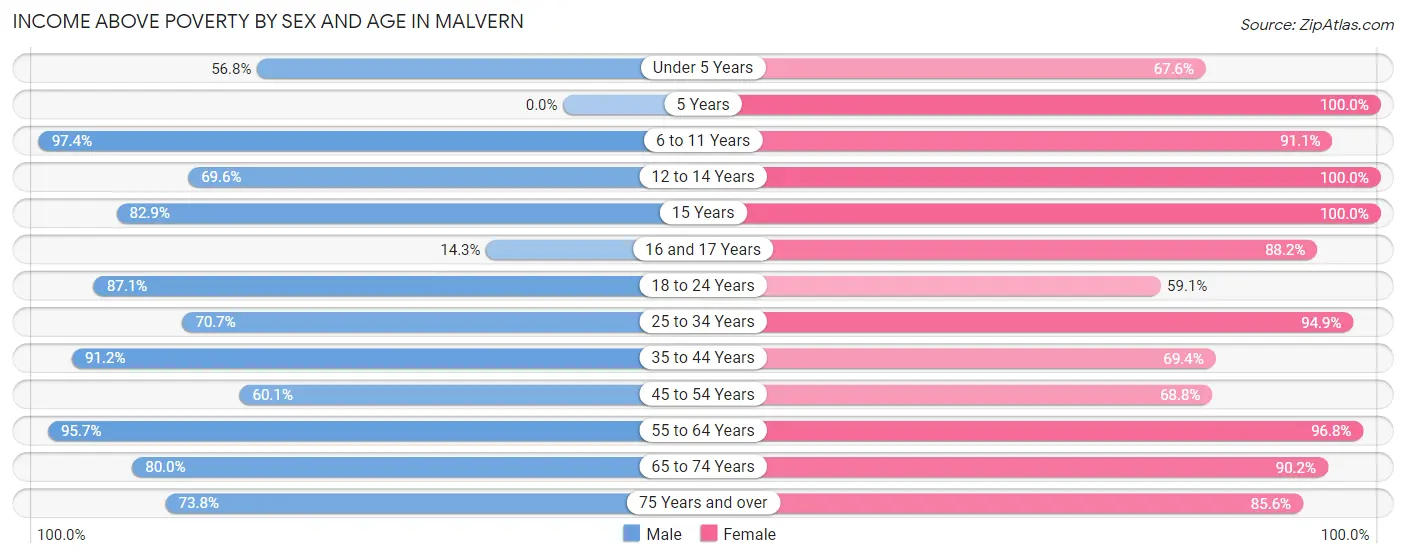
| Age Bracket | Male | Female |
| Under 5 Years | 25 (56.8%) | 25 (67.6%) |
| 5 Years | 0 (0.0%) | 5 (100.0%) |
| 6 to 11 Years | 74 (97.4%) | 112 (91.1%) |
| 12 to 14 Years | 94 (69.6%) | 30 (100.0%) |
| 15 Years | 34 (82.9%) | 5 (100.0%) |
| 16 and 17 Years | 8 (14.3%) | 30 (88.2%) |
| 18 to 24 Years | 88 (87.1%) | 39 (59.1%) |
| 25 to 34 Years | 99 (70.7%) | 75 (94.9%) |
| 35 to 44 Years | 62 (91.2%) | 154 (69.4%) |
| 45 to 54 Years | 122 (60.1%) | 22 (68.8%) |
| 55 to 64 Years | 66 (95.7%) | 90 (96.8%) |
| 65 to 74 Years | 52 (80.0%) | 46 (90.2%) |
| 75 Years and over | 31 (73.8%) | 89 (85.6%) |
| Total | 755 (72.6%) | 722 (82.0%) |
Income Below Poverty Among Married-Couple Families in Malvern
The poverty statistics for married-couple families in Malvern show that 20.7% or 79 of the total 382 families live below the poverty line. Families with 1 or 2 children have the highest poverty rate of 33.3%, comprising of 74 families. On the other hand, families with 3 or 4 children have the lowest poverty rate of 0.0%, which includes 0 families.
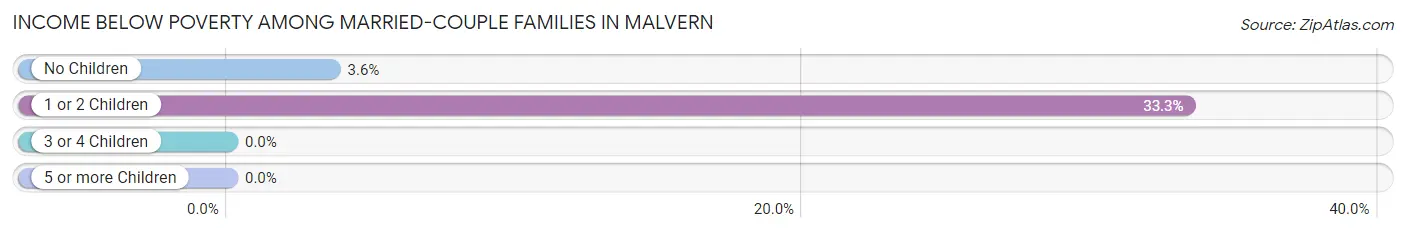
| Children | Above Poverty | Below Poverty |
| No Children | 135 (96.4%) | 5 (3.6%) |
| 1 or 2 Children | 148 (66.7%) | 74 (33.3%) |
| 3 or 4 Children | 20 (100.0%) | 0 (0.0%) |
| 5 or more Children | 0 (0.0%) | 0 (0.0%) |
| Total | 303 (79.3%) | 79 (20.7%) |
Income Below Poverty Among Single-Parent Households in Malvern
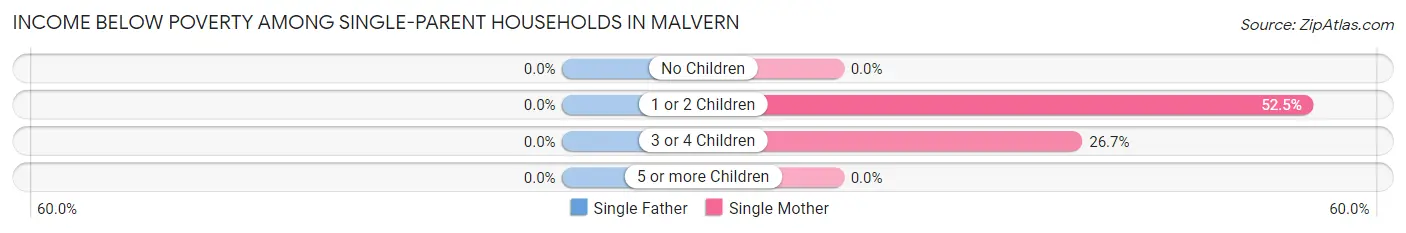
| Children | Single Father | Single Mother |
| No Children | 0 (0.0%) | 0 (0.0%) |
| 1 or 2 Children | 0 (0.0%) | 21 (52.5%) |
| 3 or 4 Children | 0 (0.0%) | 4 (26.7%) |
| 5 or more Children | 0 (0.0%) | 0 (0.0%) |
| Total | 0 (0.0%) | 25 (32.5%) |
Income Below Poverty Among Married-Couple vs Single-Parent Households in Malvern
The poverty data for Malvern shows that 79 of the married-couple family households (20.7%) and 25 of the single-parent households (24.0%) are living below the poverty level. Within the married-couple family households, those with 1 or 2 children have the highest poverty rate, with 74 households (33.3%) falling below the poverty line. Among the single-parent households, those with 1 or 2 children have the highest poverty rate, with 21 household (37.5%) living below poverty.
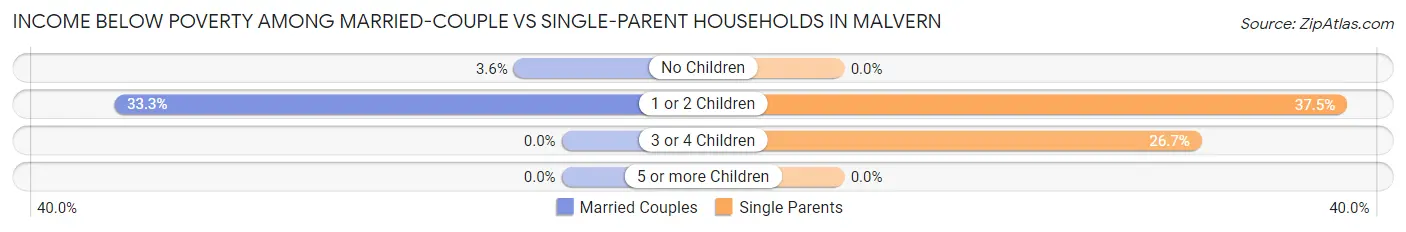
| Children | Married-Couple Families | Single-Parent Households |
| No Children | 5 (3.6%) | 0 (0.0%) |
| 1 or 2 Children | 74 (33.3%) | 21 (37.5%) |
| 3 or 4 Children | 0 (0.0%) | 4 (26.7%) |
| 5 or more Children | 0 (0.0%) | 0 (0.0%) |
| Total | 79 (20.7%) | 25 (24.0%) |
Race in Malvern
The most populous races in Malvern are White / Caucasian (1,863 | 96.7%), Hispanic or Latino (263 | 13.7%), and Black / African American (32 | 1.7%).
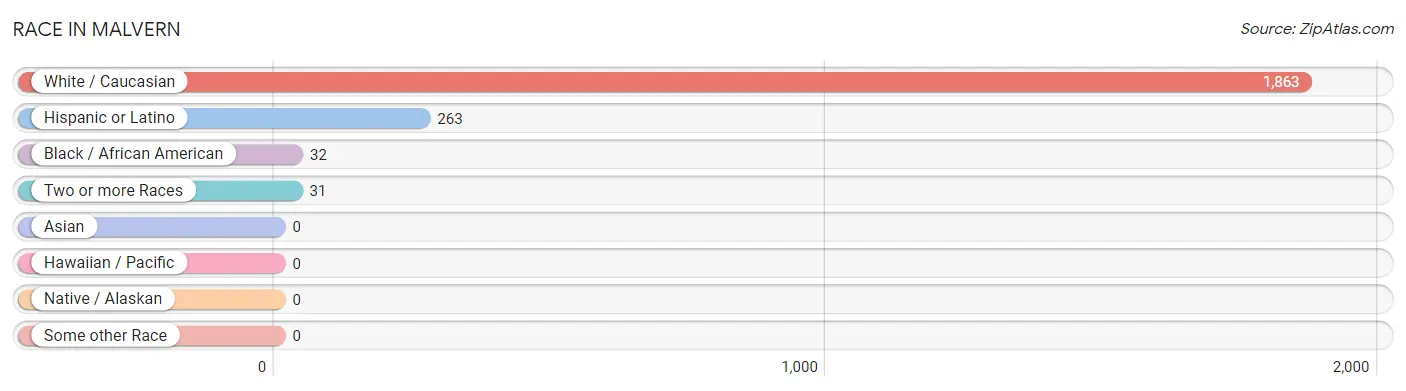
| Race | # Population | % Population |
| Asian | 0 | 0.0% |
| Black / African American | 32 | 1.7% |
| Hawaiian / Pacific | 0 | 0.0% |
| Hispanic or Latino | 263 | 13.7% |
| Native / Alaskan | 0 | 0.0% |
| White / Caucasian | 1,863 | 96.7% |
| Two or more Races | 31 | 1.6% |
| Some other Race | 0 | 0.0% |
| Total | 1,926 | 100.0% |
Ancestry in Malvern
The most populous ancestries reported in Malvern are Irish (277 | 14.4%), Mexican (241 | 12.5%), American (227 | 11.8%), English (190 | 9.9%), and German (97 | 5.0%), together accounting for 53.6% of all Malvern residents.
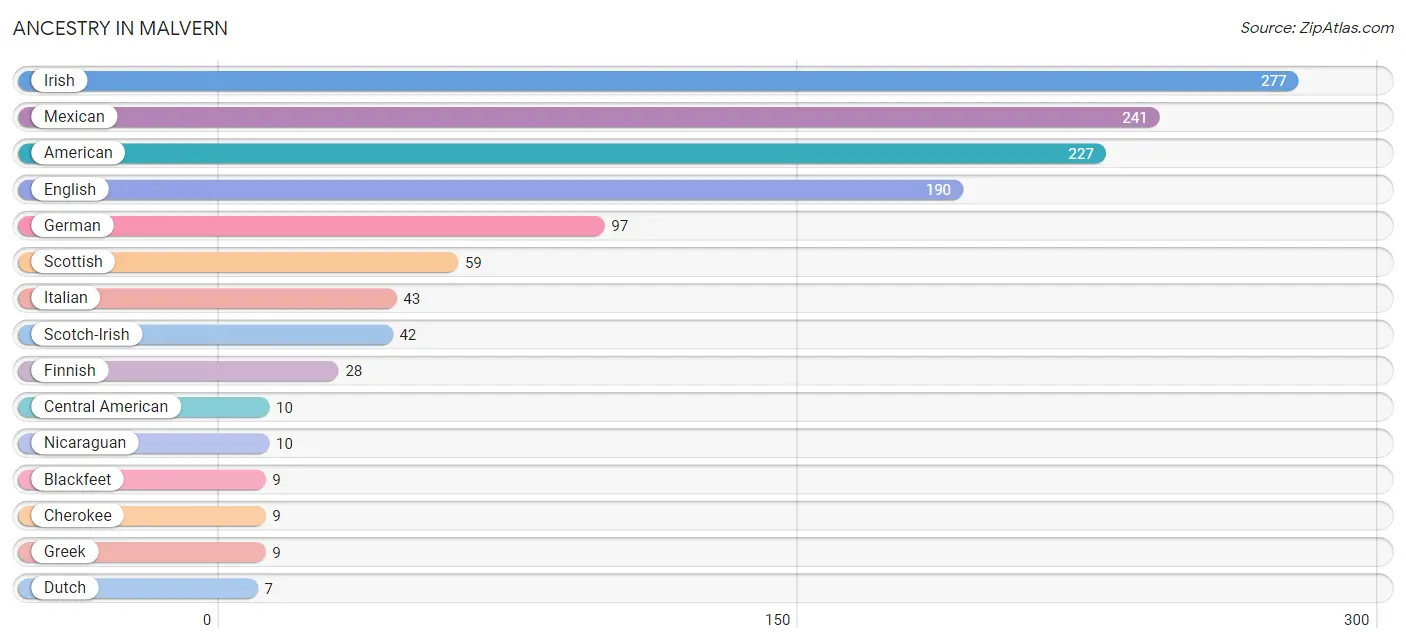
| Ancestry | # Population | % Population |
| American | 227 | 11.8% |
| Assyrian / Chaldean / Syriac | 4 | 0.2% |
| Blackfeet | 9 | 0.5% |
| Central American | 10 | 0.5% |
| Cherokee | 9 | 0.5% |
| Chickasaw | 3 | 0.2% |
| Dutch | 7 | 0.4% |
| English | 190 | 9.9% |
| Finnish | 28 | 1.5% |
| German | 97 | 5.0% |
| Greek | 9 | 0.5% |
| Irish | 277 | 14.4% |
| Italian | 43 | 2.2% |
| Mexican | 241 | 12.5% |
| Nicaraguan | 10 | 0.5% |
| Norwegian | 4 | 0.2% |
| Polish | 2 | 0.1% |
| Samoan | 2 | 0.1% |
| Scotch-Irish | 42 | 2.2% |
| Scottish | 59 | 3.1% |
| Spaniard | 2 | 0.1% | View All 21 Rows |
Immigrants in Malvern
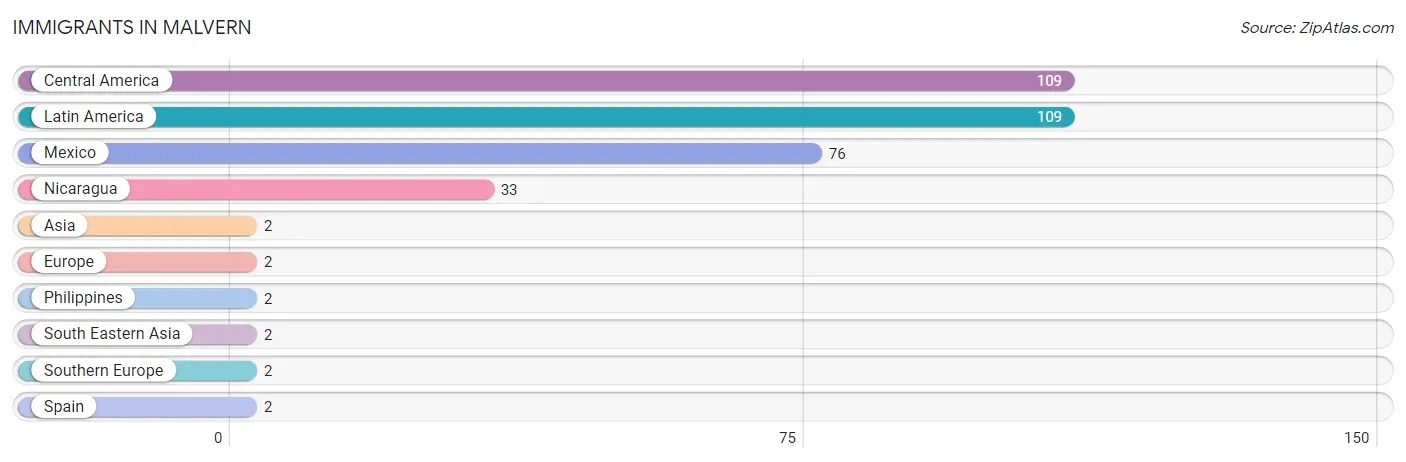
The most numerous immigrant groups reported in Malvern came from Central America (109 | 5.7%), Latin America (109 | 5.7%), Mexico (76 | 4.0%), Nicaragua (33 | 1.7%), and Asia (2 | 0.1%), together accounting for 17.1% of all Malvern residents.
| Immigration Origin | # Population | % Population |
| Asia | 2 | 0.1% |
| Central America | 109 | 5.7% |
| Europe | 2 | 0.1% |
| Latin America | 109 | 5.7% |
| Mexico | 76 | 4.0% |
| Nicaragua | 33 | 1.7% |
| Philippines | 2 | 0.1% |
| South Eastern Asia | 2 | 0.1% |
| Southern Europe | 2 | 0.1% |
| Spain | 2 | 0.1% | View All 10 Rows |
Sex and Age in Malvern
Sex and Age in Malvern
The most populous age groups in Malvern are 45 to 49 Years (179 | 17.2%) for men and 35 to 39 Years (151 | 17.0%) for women.
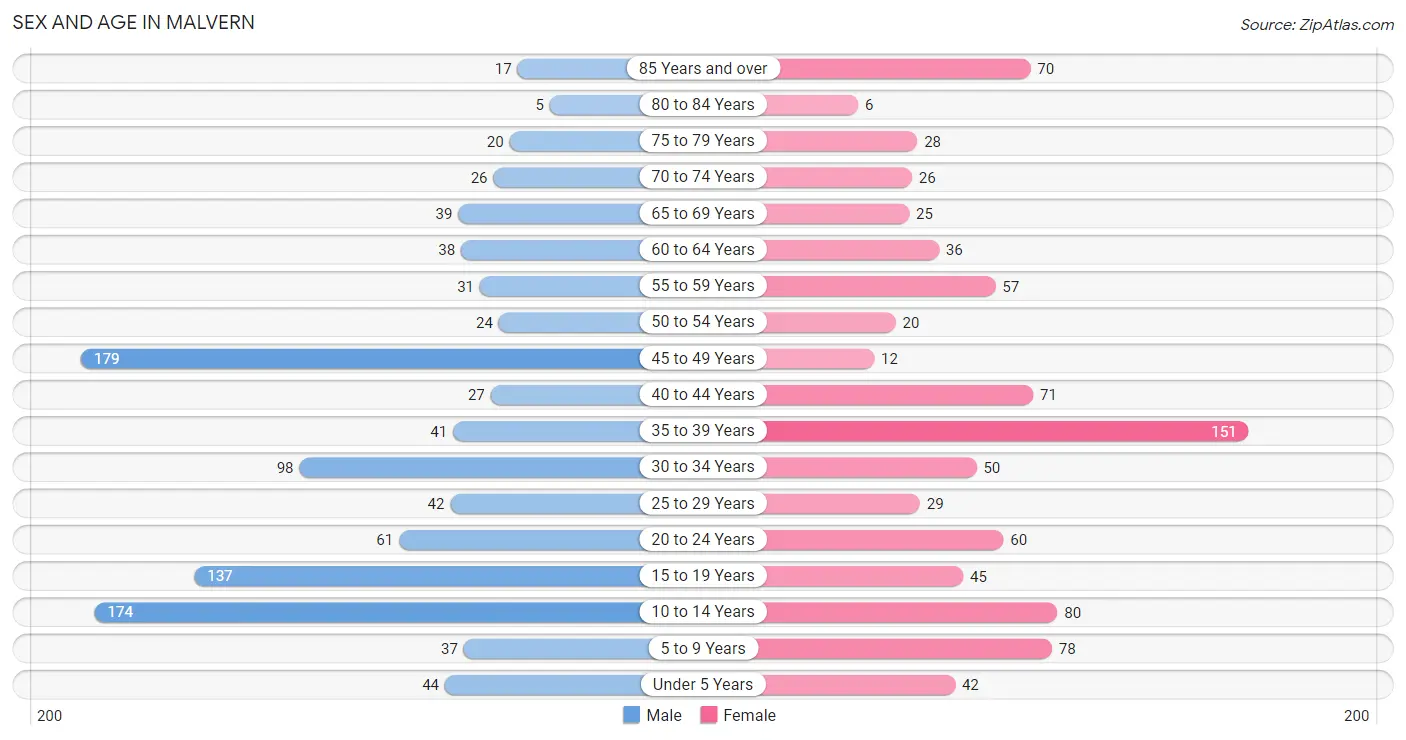
| Age Bracket | Male | Female |
| Under 5 Years | 44 (4.2%) | 42 (4.7%) |
| 5 to 9 Years | 37 (3.6%) | 78 (8.8%) |
| 10 to 14 Years | 174 (16.7%) | 80 (9.0%) |
| 15 to 19 Years | 137 (13.2%) | 45 (5.1%) |
| 20 to 24 Years | 61 (5.9%) | 60 (6.8%) |
| 25 to 29 Years | 42 (4.0%) | 29 (3.3%) |
| 30 to 34 Years | 98 (9.4%) | 50 (5.6%) |
| 35 to 39 Years | 41 (3.9%) | 151 (17.0%) |
| 40 to 44 Years | 27 (2.6%) | 71 (8.0%) |
| 45 to 49 Years | 179 (17.2%) | 12 (1.3%) |
| 50 to 54 Years | 24 (2.3%) | 20 (2.3%) |
| 55 to 59 Years | 31 (3.0%) | 57 (6.4%) |
| 60 to 64 Years | 38 (3.6%) | 36 (4.1%) |
| 65 to 69 Years | 39 (3.7%) | 25 (2.8%) |
| 70 to 74 Years | 26 (2.5%) | 26 (2.9%) |
| 75 to 79 Years | 20 (1.9%) | 28 (3.2%) |
| 80 to 84 Years | 5 (0.5%) | 6 (0.7%) |
| 85 Years and over | 17 (1.6%) | 70 (7.9%) |
| Total | 1,040 (100.0%) | 886 (100.0%) |
Families and Households in Malvern
Median Family Size in Malvern
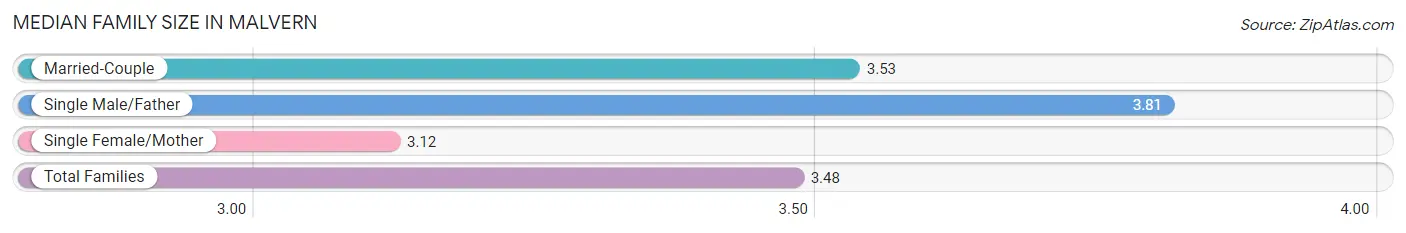
The median family size in Malvern is 3.48 persons per family, with single male/father families (27 | 5.6%) accounting for the largest median family size of 3.81 persons per family. On the other hand, single female/mother families (77 | 15.8%) represent the smallest median family size with 3.12 persons per family.
| Family Type | # Families | Family Size |
| Married-Couple | 382 (78.6%) | 3.53 |
| Single Male/Father | 27 (5.6%) | 3.81 |
| Single Female/Mother | 77 (15.8%) | 3.12 |
| Total Families | 486 (100.0%) | 3.48 |
Median Household Size in Malvern
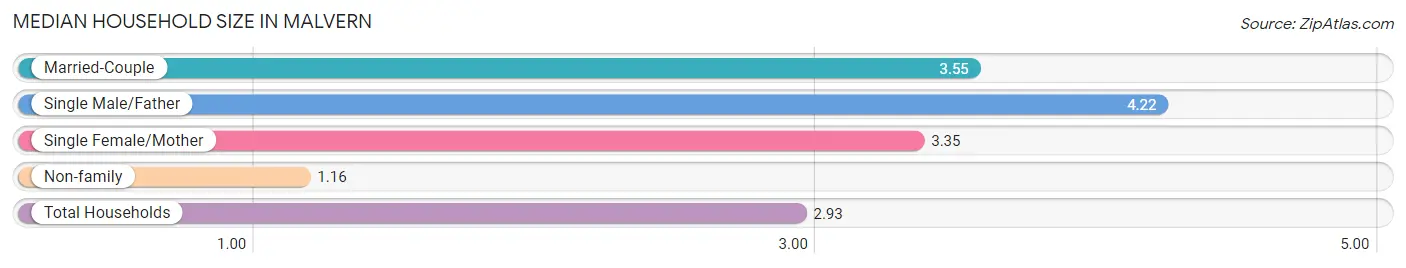
The median household size in Malvern is 2.93 persons per household, with single male/father households (27 | 4.1%) accounting for the largest median household size of 4.22 persons per household. non-family households (172 | 26.1%) represent the smallest median household size with 1.16 persons per household.
| Household Type | # Households | Household Size |
| Married-Couple | 382 (58.1%) | 3.55 |
| Single Male/Father | 27 (4.1%) | 4.22 |
| Single Female/Mother | 77 (11.7%) | 3.35 |
| Non-family | 172 (26.1%) | 1.16 |
| Total Households | 658 (100.0%) | 2.93 |
Household Size by Marriage Status in Malvern
Out of a total of 658 households in Malvern, 486 (73.9%) are family households, while 172 (26.1%) are nonfamily households. The most numerous type of family households are 4-person households, comprising 205, and the most common type of nonfamily households are 1-person households, comprising 156.
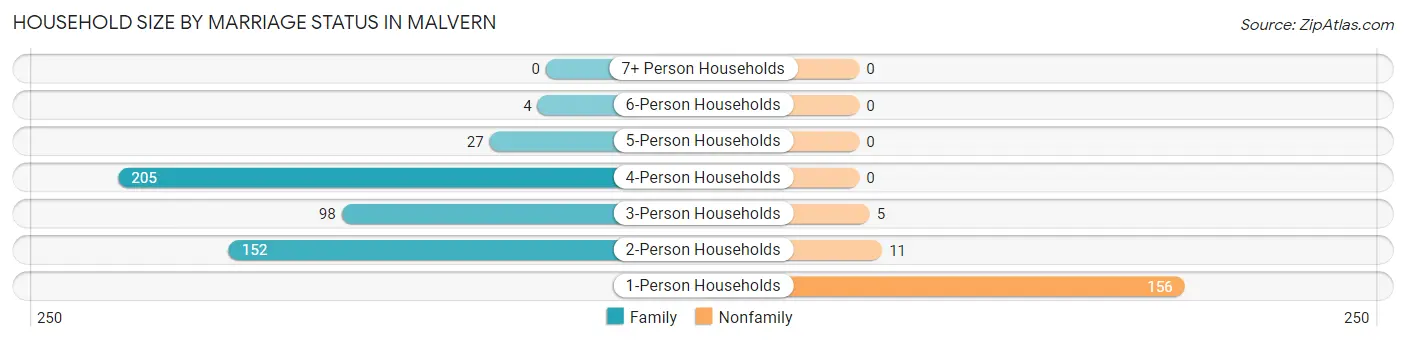
| Household Size | Family Households | Nonfamily Households |
| 1-Person Households | - | 156 (23.7%) |
| 2-Person Households | 152 (23.1%) | 11 (1.7%) |
| 3-Person Households | 98 (14.9%) | 5 (0.8%) |
| 4-Person Households | 205 (31.2%) | 0 (0.0%) |
| 5-Person Households | 27 (4.1%) | 0 (0.0%) |
| 6-Person Households | 4 (0.6%) | 0 (0.0%) |
| 7+ Person Households | 0 (0.0%) | 0 (0.0%) |
| Total | 486 (73.9%) | 172 (26.1%) |
Female Fertility in Malvern
Fertility by Age in Malvern
Average fertility rate in Malvern is 50.0 births per 1,000 women. Women in the age bracket of 20 to 34 years have the highest fertility rate with 151.0 births per 1,000 women. Women in the age bracket of 20 to 34 years acount for 100.0% of all women with births.
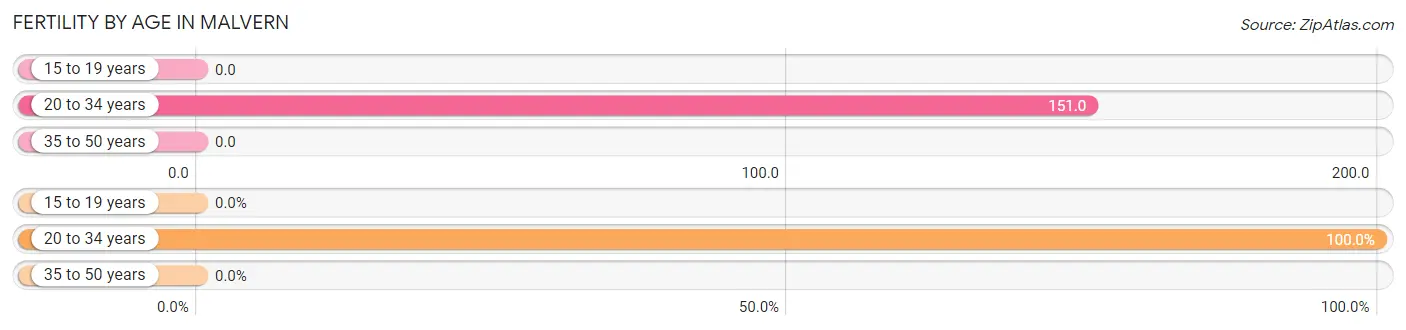
| Age Bracket | Women with Births | Births / 1,000 Women |
| 15 to 19 years | 0 (0.0%) | 0.0 |
| 20 to 34 years | 21 (100.0%) | 151.0 |
| 35 to 50 years | 0 (0.0%) | 0.0 |
| Total | 21 (100.0%) | 50.0 |
Fertility by Age by Marriage Status in Malvern
28.6% of women with births (21) in Malvern are married. The highest percentage of unmarried women with births falls into 20 to 34 years age bracket with 71.4% of them unmarried at the time of birth, while the lowest percentage of unmarried women with births belong to 20 to 34 years age bracket with 71.4% of them unmarried.
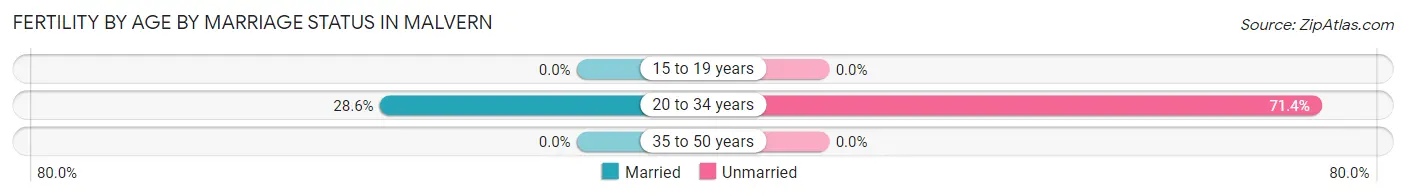
| Age Bracket | Married | Unmarried |
| 15 to 19 years | 0 (0.0%) | 0 (0.0%) |
| 20 to 34 years | 6 (28.6%) | 15 (71.4%) |
| 35 to 50 years | 0 (0.0%) | 0 (0.0%) |
| Total | 6 (28.6%) | 15 (71.4%) |
Fertility by Education in Malvern
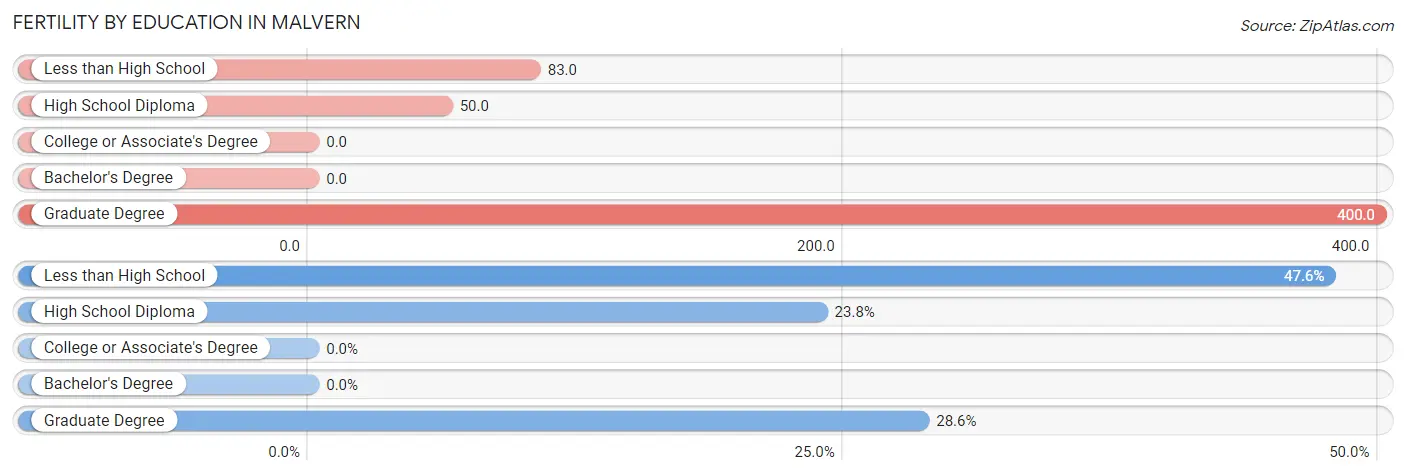
| Educational Attainment | Women with Births | Births / 1,000 Women |
| Less than High School | 10 (47.6%) | 83.0 |
| High School Diploma | 5 (23.8%) | 50.0 |
| College or Associate's Degree | 0 (0.0%) | 0.0 |
| Bachelor's Degree | 0 (0.0%) | 0.0 |
| Graduate Degree | 6 (28.6%) | 400.0 |
| Total | 21 (100.0%) | 50.0 |
Fertility by Education by Marriage Status in Malvern
71.4% of women with births in Malvern are unmarried. Women with the educational attainment of graduate degree are most likely to be married with 100.0% of them married at childbirth, while women with the educational attainment of less than high school are least likely to be married with 100.0% of them unmarried at childbirth.
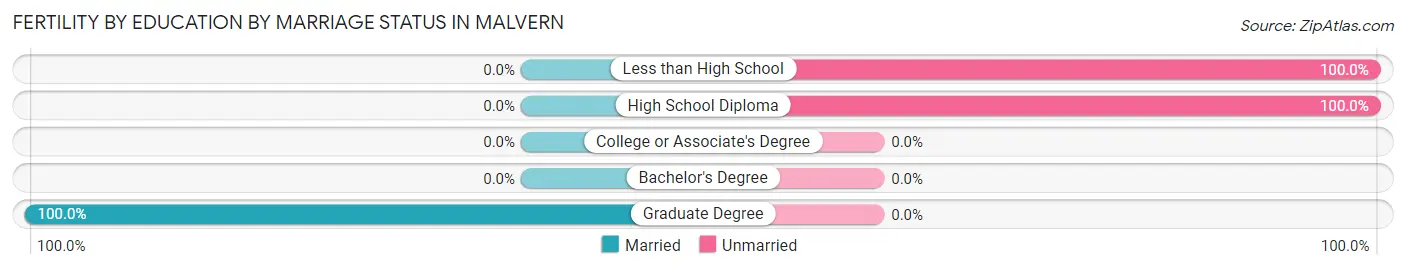
| Educational Attainment | Married | Unmarried |
| Less than High School | 0 (0.0%) | 10 (100.0%) |
| High School Diploma | 0 (0.0%) | 5 (100.0%) |
| College or Associate's Degree | 0 (0.0%) | 0 (0.0%) |
| Bachelor's Degree | 0 (0.0%) | 0 (0.0%) |
| Graduate Degree | 6 (100.0%) | 0 (0.0%) |
| Total | 6 (28.6%) | 15 (71.4%) |
Employment Characteristics in Malvern
Employment by Class of Employer in Malvern
Among the 814 employed individuals in Malvern, private company employees (604 | 74.2%), local government employees (88 | 10.8%), and self-employed (not incorporated) (52 | 6.4%) make up the most common classes of employment.
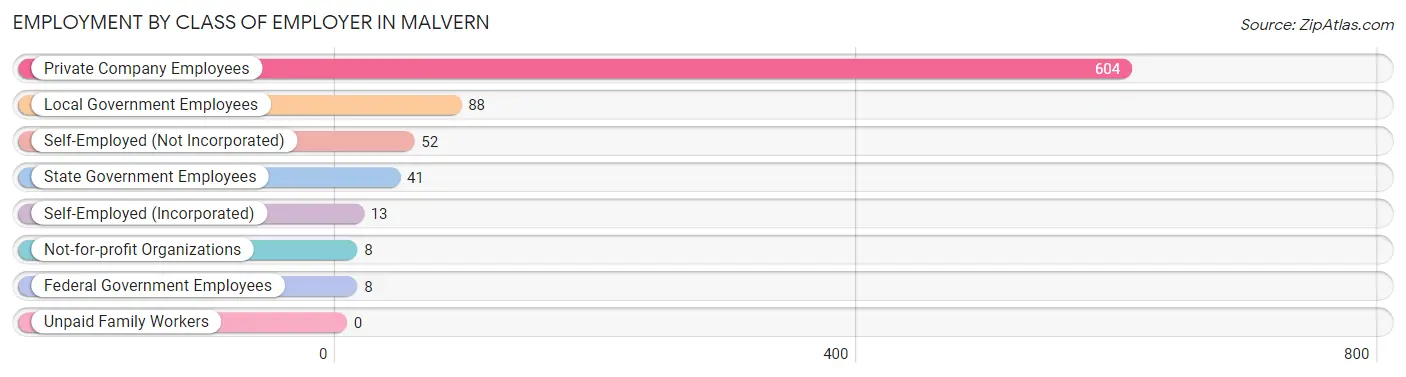
| Employer Class | # Employees | % Employees |
| Private Company Employees | 604 | 74.2% |
| Self-Employed (Incorporated) | 13 | 1.6% |
| Self-Employed (Not Incorporated) | 52 | 6.4% |
| Not-for-profit Organizations | 8 | 1.0% |
| Local Government Employees | 88 | 10.8% |
| State Government Employees | 41 | 5.0% |
| Federal Government Employees | 8 | 1.0% |
| Unpaid Family Workers | 0 | 0.0% |
| Total | 814 | 100.0% |
Employment Status by Age in Malvern
According to the labor force statistics for Malvern, out of the total population over 16 years of age (1,425), 60.1% or 856 individuals are in the labor force, with 2.2% or 19 of them unemployed. The age group with the highest labor force participation rate is 45 to 54 years, with 91.5% or 215 individuals in the labor force. Within the labor force, the 16 to 19 years age range has the highest percentage of unemployed individuals, with 14.8% or 13 of them being unemployed.
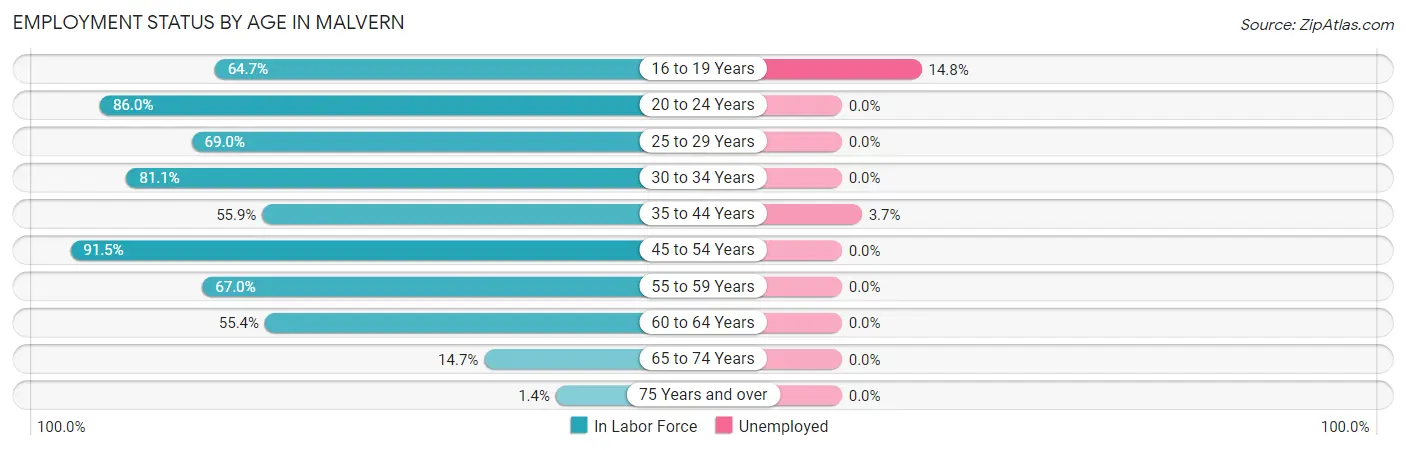
| Age Bracket | In Labor Force | Unemployed |
| 16 to 19 Years | 88 (64.7%) | 13 (14.8%) |
| 20 to 24 Years | 104 (86.0%) | 0 (0.0%) |
| 25 to 29 Years | 49 (69.0%) | 0 (0.0%) |
| 30 to 34 Years | 120 (81.1%) | 0 (0.0%) |
| 35 to 44 Years | 162 (55.9%) | 6 (3.7%) |
| 45 to 54 Years | 215 (91.5%) | 0 (0.0%) |
| 55 to 59 Years | 59 (67.0%) | 0 (0.0%) |
| 60 to 64 Years | 41 (55.4%) | 0 (0.0%) |
| 65 to 74 Years | 17 (14.7%) | 0 (0.0%) |
| 75 Years and over | 2 (1.4%) | 0 (0.0%) |
| Total | 856 (60.1%) | 19 (2.2%) |
Employment Status by Educational Attainment in Malvern
According to labor force statistics for Malvern, 71.3% of individuals (646) out of the total population between 25 and 64 years of age (906) are in the labor force, with 0.9% or 6 of them being unemployed. The group with the highest labor force participation rate are those with the educational attainment of bachelor's degree or higher, with 87.0% or 120 individuals in the labor force. Within the labor force, individuals with college / associate degree education have the highest percentage of unemployment, with 2.5% or 6 of them being unemployed.

| Educational Attainment | In Labor Force | Unemployed |
| Less than High School | 44 (27.5%) | 0 (0.0%) |
| High School Diploma | 239 (75.4%) | 0 (0.0%) |
| College / Associate Degree | 243 (83.5%) | 7 (2.5%) |
| Bachelor's Degree or higher | 120 (87.0%) | 0 (0.0%) |
| Total | 646 (71.3%) | 8 (0.9%) |
Employment Occupations by Sex in Malvern
Management, Business, Science and Arts Occupations
The most common Management, Business, Science and Arts occupations in Malvern are Management (125 | 14.9%), Health Diagnosing & Treating (61 | 7.3%), Community & Social Service (58 | 6.9%), Education Instruction & Library (58 | 6.9%), and Health Technologists (46 | 5.5%).
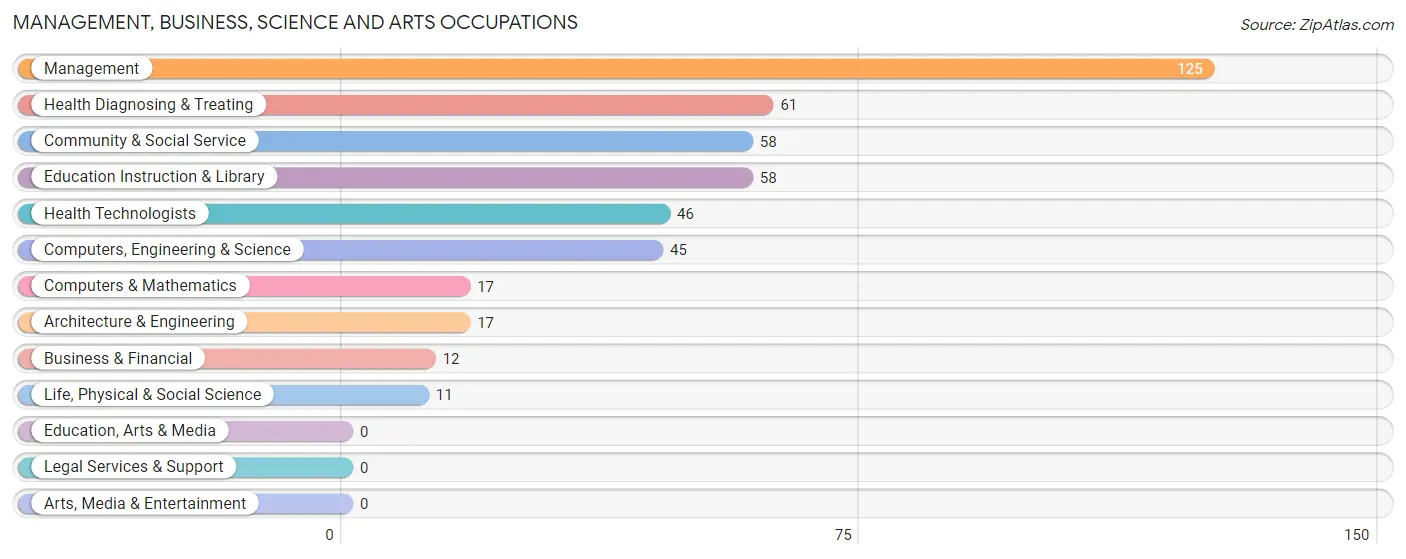
Management, Business, Science and Arts Occupations by Sex
Within the Management, Business, Science and Arts occupations in Malvern, the most male-oriented occupations are Computers, Engineering & Science (100.0%), Computers & Mathematics (100.0%), and Architecture & Engineering (100.0%), while the most female-oriented occupations are Community & Social Service (100.0%), Education Instruction & Library (100.0%), and Health Technologists (87.0%).
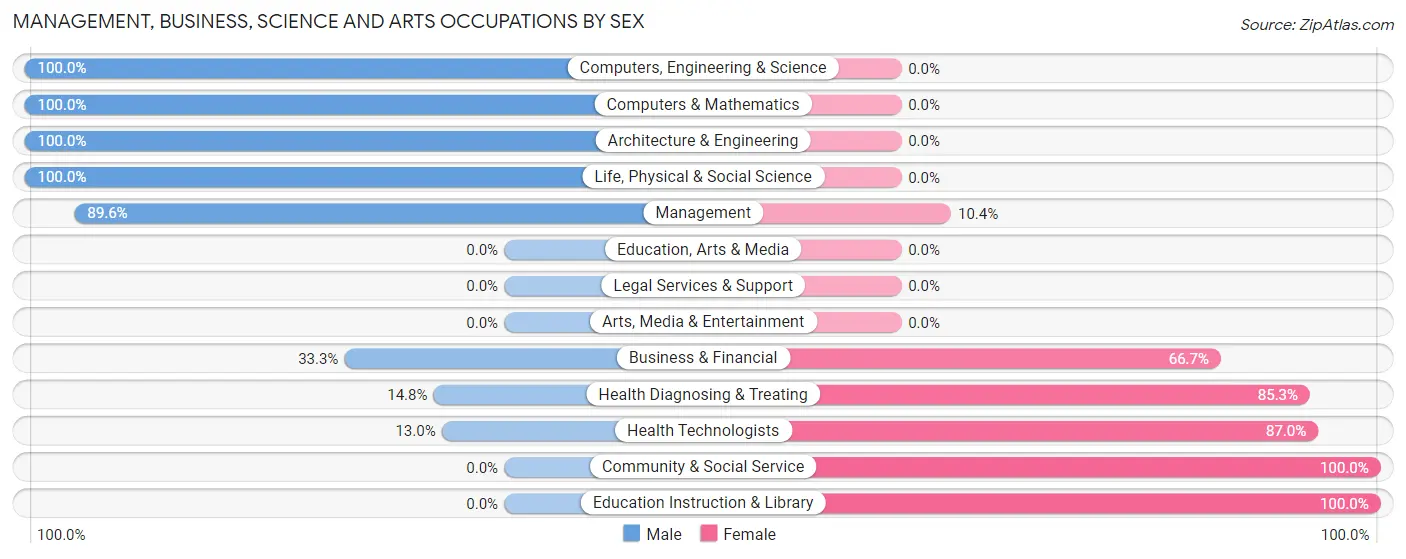
| Occupation | Male | Female |
| Management | 112 (89.6%) | 13 (10.4%) |
| Business & Financial | 4 (33.3%) | 8 (66.7%) |
| Computers, Engineering & Science | 45 (100.0%) | 0 (0.0%) |
| Computers & Mathematics | 17 (100.0%) | 0 (0.0%) |
| Architecture & Engineering | 17 (100.0%) | 0 (0.0%) |
| Life, Physical & Social Science | 11 (100.0%) | 0 (0.0%) |
| Community & Social Service | 0 (0.0%) | 58 (100.0%) |
| Education, Arts & Media | 0 (0.0%) | 0 (0.0%) |
| Legal Services & Support | 0 (0.0%) | 0 (0.0%) |
| Education Instruction & Library | 0 (0.0%) | 58 (100.0%) |
| Arts, Media & Entertainment | 0 (0.0%) | 0 (0.0%) |
| Health Diagnosing & Treating | 9 (14.7%) | 52 (85.3%) |
| Health Technologists | 6 (13.0%) | 40 (87.0%) |
| Total (Category) | 170 (56.5%) | 131 (43.5%) |
| Total (Overall) | 561 (66.9%) | 277 (33.1%) |
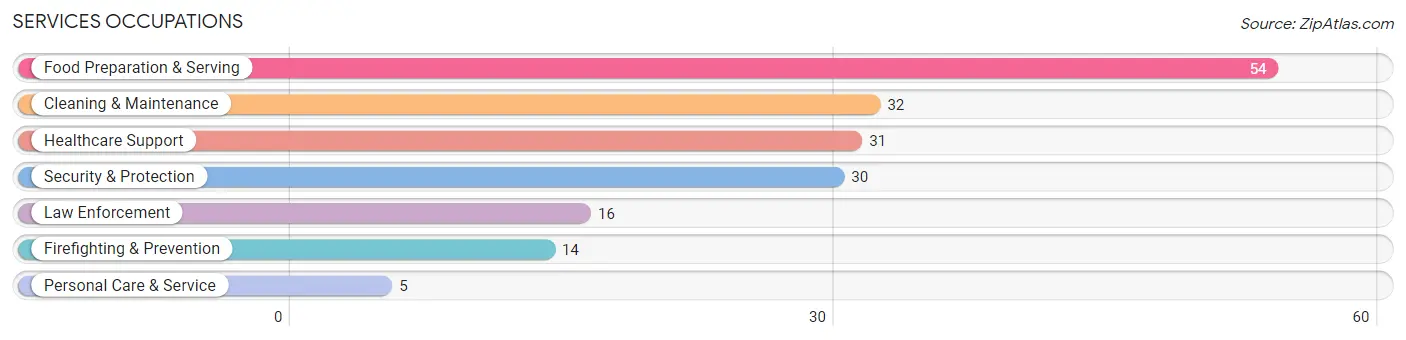
Services Occupations
The most common Services occupations in Malvern are Food Preparation & Serving (54 | 6.4%), Cleaning & Maintenance (32 | 3.8%), Healthcare Support (31 | 3.7%), Security & Protection (30 | 3.6%), and Law Enforcement (16 | 1.9%).
Services Occupations by Sex
Within the Services occupations in Malvern, the most male-oriented occupations are Security & Protection (100.0%), Firefighting & Prevention (100.0%), and Law Enforcement (100.0%), while the most female-oriented occupations are Healthcare Support (100.0%), Personal Care & Service (100.0%), and Cleaning & Maintenance (71.9%).
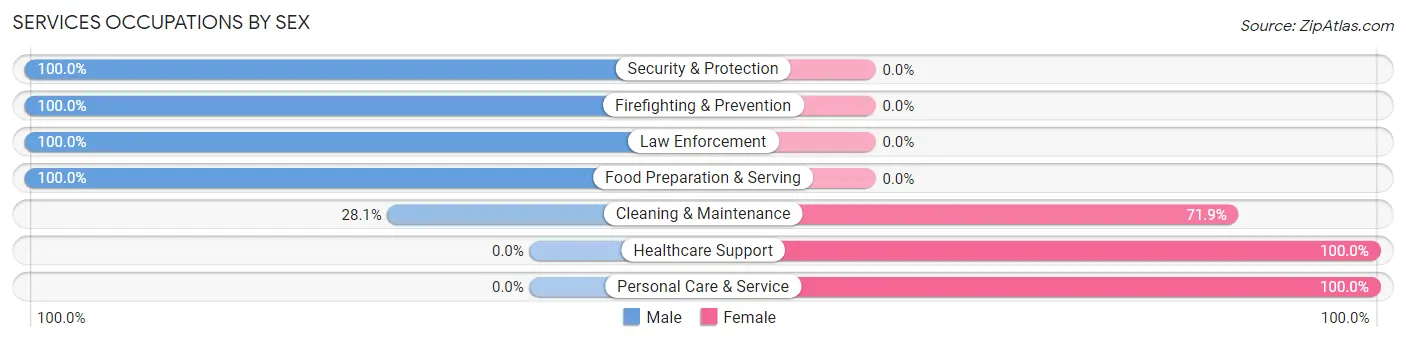
| Occupation | Male | Female |
| Healthcare Support | 0 (0.0%) | 31 (100.0%) |
| Security & Protection | 30 (100.0%) | 0 (0.0%) |
| Firefighting & Prevention | 14 (100.0%) | 0 (0.0%) |
| Law Enforcement | 16 (100.0%) | 0 (0.0%) |
| Food Preparation & Serving | 54 (100.0%) | 0 (0.0%) |
| Cleaning & Maintenance | 9 (28.1%) | 23 (71.9%) |
| Personal Care & Service | 0 (0.0%) | 5 (100.0%) |
| Total (Category) | 93 (61.2%) | 59 (38.8%) |
| Total (Overall) | 561 (66.9%) | 277 (33.1%) |
Sales and Office Occupations
The most common Sales and Office occupations in Malvern are Sales & Related (73 | 8.7%), and Office & Administration (56 | 6.7%).

Sales and Office Occupations by Sex

| Occupation | Male | Female |
| Sales & Related | 40 (54.8%) | 33 (45.2%) |
| Office & Administration | 10 (17.9%) | 46 (82.1%) |
| Total (Category) | 50 (38.8%) | 79 (61.2%) |
| Total (Overall) | 561 (66.9%) | 277 (33.1%) |
Natural Resources, Construction and Maintenance Occupations
The most common Natural Resources, Construction and Maintenance occupations in Malvern are Construction & Extraction (129 | 15.4%), and Installation, Maintenance & Repair (46 | 5.5%).
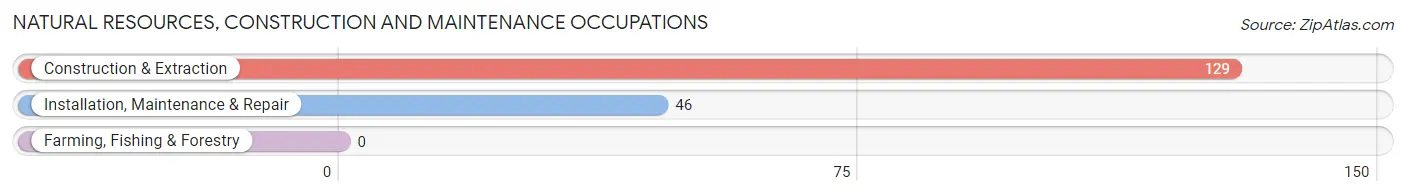
Natural Resources, Construction and Maintenance Occupations by Sex

| Occupation | Male | Female |
| Farming, Fishing & Forestry | 0 (0.0%) | 0 (0.0%) |
| Construction & Extraction | 129 (100.0%) | 0 (0.0%) |
| Installation, Maintenance & Repair | 46 (100.0%) | 0 (0.0%) |
| Total (Category) | 175 (100.0%) | 0 (0.0%) |
| Total (Overall) | 561 (66.9%) | 277 (33.1%) |
Production, Transportation and Moving Occupations
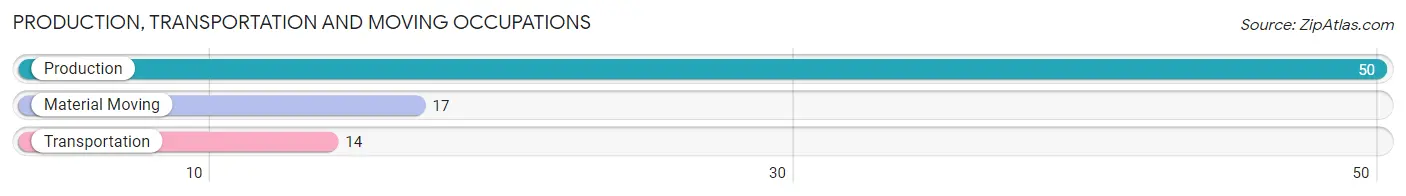
The most common Production, Transportation and Moving occupations in Malvern are Production (50 | 6.0%), Material Moving (17 | 2.0%), and Transportation (14 | 1.7%).
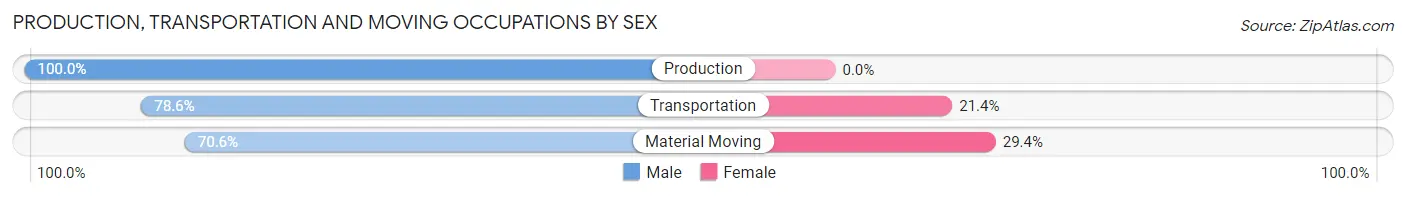
Production, Transportation and Moving Occupations by Sex
| Occupation | Male | Female |
| Production | 50 (100.0%) | 0 (0.0%) |
| Transportation | 11 (78.6%) | 3 (21.4%) |
| Material Moving | 12 (70.6%) | 5 (29.4%) |
| Total (Category) | 73 (90.1%) | 8 (9.9%) |
| Total (Overall) | 561 (66.9%) | 277 (33.1%) |
Employment Industries by Sex in Malvern
Employment Industries in Malvern
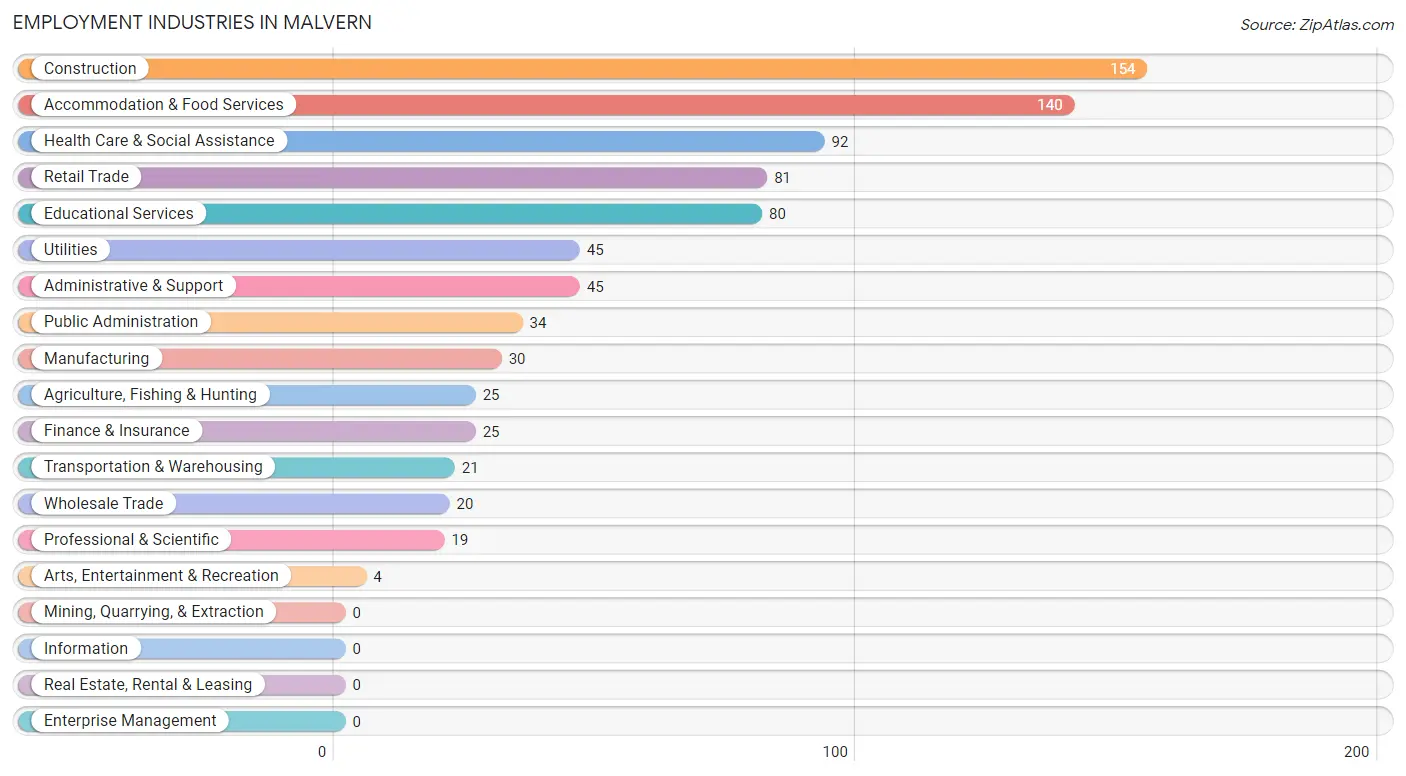
The major employment industries in Malvern include Construction (154 | 18.4%), Accommodation & Food Services (140 | 16.7%), Health Care & Social Assistance (92 | 11.0%), Retail Trade (81 | 9.7%), and Educational Services (80 | 9.6%).
Employment Industries by Sex in Malvern
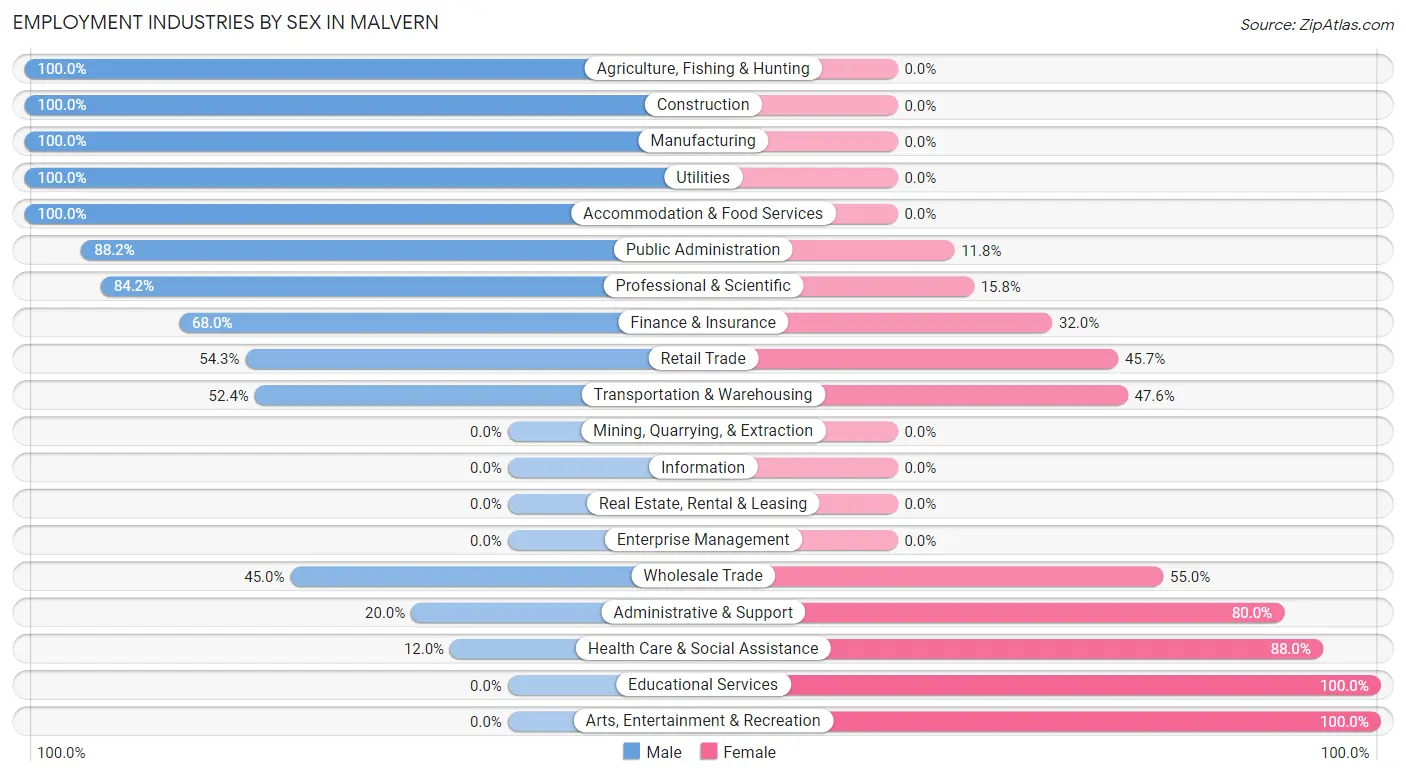
The Malvern industries that see more men than women are Agriculture, Fishing & Hunting (100.0%), Construction (100.0%), and Manufacturing (100.0%), whereas the industries that tend to have a higher number of women are Educational Services (100.0%), Arts, Entertainment & Recreation (100.0%), and Health Care & Social Assistance (88.0%).
| Industry | Male | Female |
| Agriculture, Fishing & Hunting | 25 (100.0%) | 0 (0.0%) |
| Mining, Quarrying, & Extraction | 0 (0.0%) | 0 (0.0%) |
| Construction | 154 (100.0%) | 0 (0.0%) |
| Manufacturing | 30 (100.0%) | 0 (0.0%) |
| Wholesale Trade | 9 (45.0%) | 11 (55.0%) |
| Retail Trade | 44 (54.3%) | 37 (45.7%) |
| Transportation & Warehousing | 11 (52.4%) | 10 (47.6%) |
| Utilities | 45 (100.0%) | 0 (0.0%) |
| Information | 0 (0.0%) | 0 (0.0%) |
| Finance & Insurance | 17 (68.0%) | 8 (32.0%) |
| Real Estate, Rental & Leasing | 0 (0.0%) | 0 (0.0%) |
| Professional & Scientific | 16 (84.2%) | 3 (15.8%) |
| Enterprise Management | 0 (0.0%) | 0 (0.0%) |
| Administrative & Support | 9 (20.0%) | 36 (80.0%) |
| Educational Services | 0 (0.0%) | 80 (100.0%) |
| Health Care & Social Assistance | 11 (12.0%) | 81 (88.0%) |
| Arts, Entertainment & Recreation | 0 (0.0%) | 4 (100.0%) |
| Accommodation & Food Services | 140 (100.0%) | 0 (0.0%) |
| Public Administration | 30 (88.2%) | 4 (11.8%) |
| Total | 561 (66.9%) | 277 (33.1%) |
Education in Malvern
School Enrollment in Malvern
The most common levels of schooling among the 565 students in Malvern are middle school (225 | 39.8%), high school (160 | 28.3%), and elementary school (113 | 20.0%).
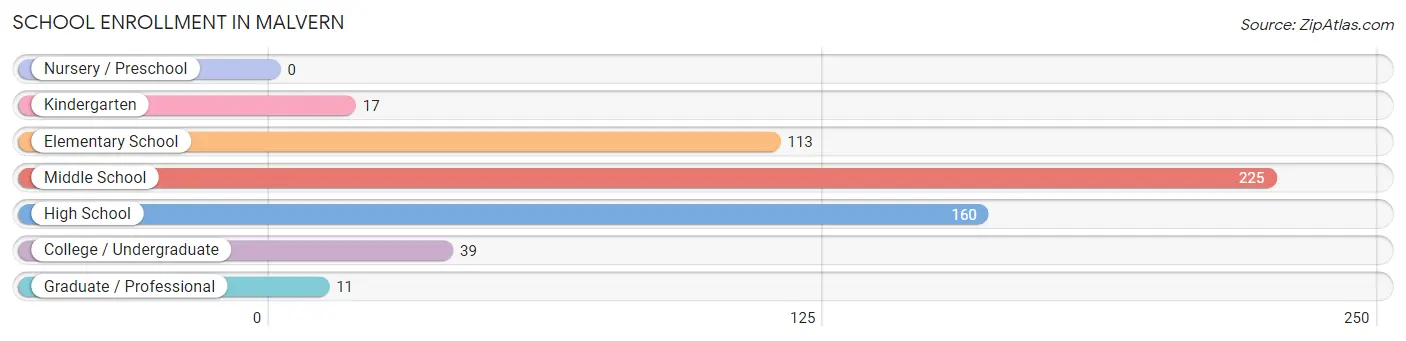
| School Level | # Students | % Students |
| Nursery / Preschool | 0 | 0.0% |
| Kindergarten | 17 | 3.0% |
| Elementary School | 113 | 20.0% |
| Middle School | 225 | 39.8% |
| High School | 160 | 28.3% |
| College / Undergraduate | 39 | 6.9% |
| Graduate / Professional | 11 | 1.9% |
| Total | 565 | 100.0% |
School Enrollment by Age by Funding Source in Malvern
Out of a total of 565 students who are enrolled in schools in Malvern, 15 (2.7%) attend a private institution, while the remaining 550 (97.3%) are enrolled in public schools. The age group of 20 to 24 year olds has the highest likelihood of being enrolled in private schools, with 5 (31.2% in the age bracket) enrolled. Conversely, the age group of 5 to 9 year old has the lowest likelihood of being enrolled in a private school, with 115 (100.0% in the age bracket) attending a public institution.
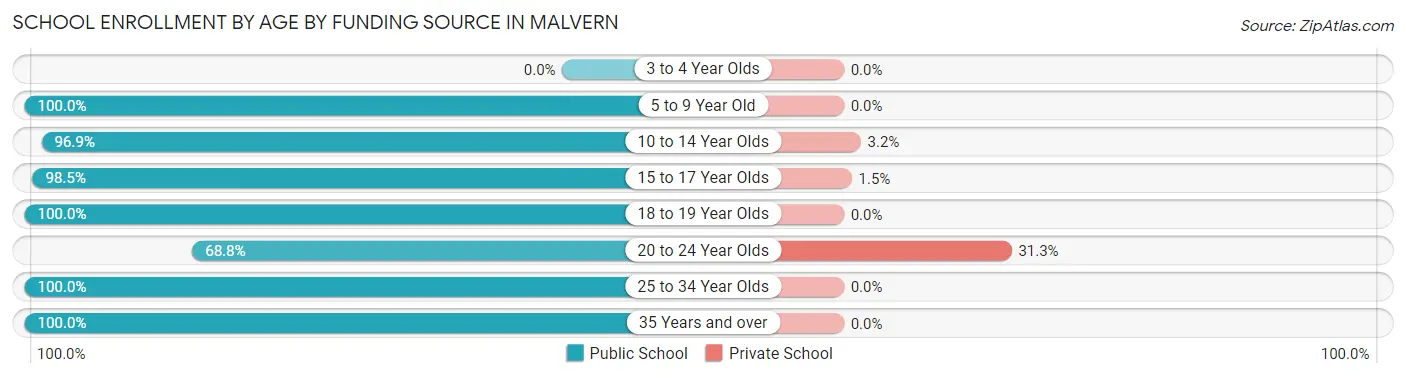
| Age Bracket | Public School | Private School |
| 3 to 4 Year Olds | 0 (0.0%) | 0 (0.0%) |
| 5 to 9 Year Old | 115 (100.0%) | 0 (0.0%) |
| 10 to 14 Year Olds | 246 (96.9%) | 8 (3.2%) |
| 15 to 17 Year Olds | 134 (98.5%) | 2 (1.5%) |
| 18 to 19 Year Olds | 4 (100.0%) | 0 (0.0%) |
| 20 to 24 Year Olds | 11 (68.8%) | 5 (31.2%) |
| 25 to 34 Year Olds | 24 (100.0%) | 0 (0.0%) |
| 35 Years and over | 16 (100.0%) | 0 (0.0%) |
| Total | 550 (97.3%) | 15 (2.7%) |
Educational Attainment by Field of Study in Malvern
Education (53 | 31.9%), business (27 | 16.3%), science & technology (19 | 11.5%), engineering (15 | 9.0%), and bio, nature & agricultural (10 | 6.0%) are the most common fields of study among 166 individuals in Malvern who have obtained a bachelor's degree or higher.
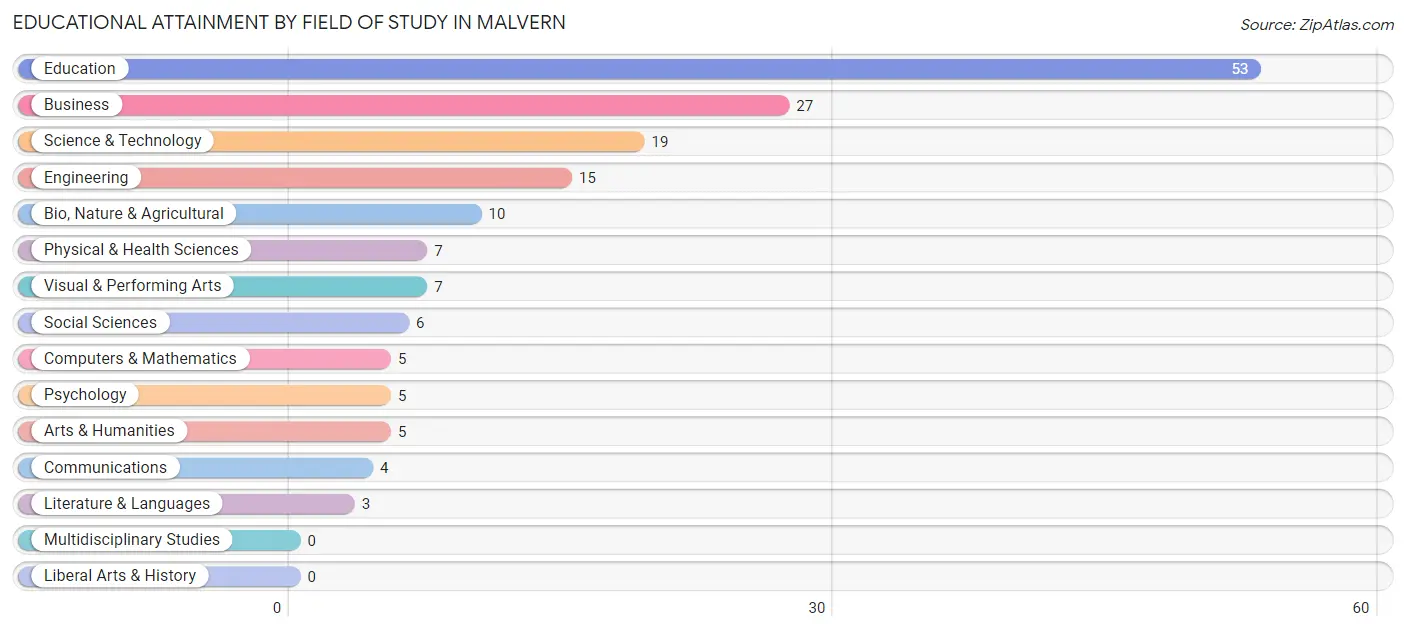
| Field of Study | # Graduates | % Graduates |
| Computers & Mathematics | 5 | 3.0% |
| Bio, Nature & Agricultural | 10 | 6.0% |
| Physical & Health Sciences | 7 | 4.2% |
| Psychology | 5 | 3.0% |
| Social Sciences | 6 | 3.6% |
| Engineering | 15 | 9.0% |
| Multidisciplinary Studies | 0 | 0.0% |
| Science & Technology | 19 | 11.5% |
| Business | 27 | 16.3% |
| Education | 53 | 31.9% |
| Literature & Languages | 3 | 1.8% |
| Liberal Arts & History | 0 | 0.0% |
| Visual & Performing Arts | 7 | 4.2% |
| Communications | 4 | 2.4% |
| Arts & Humanities | 5 | 3.0% |
| Total | 166 | 100.0% |
Transportation & Commute in Malvern
Vehicle Availability by Sex in Malvern
The most prevalent vehicle ownership categories in Malvern are males with 3 vehicles (232, accounting for 43.2%) and females with 3 vehicles (64, making up 83.8%).
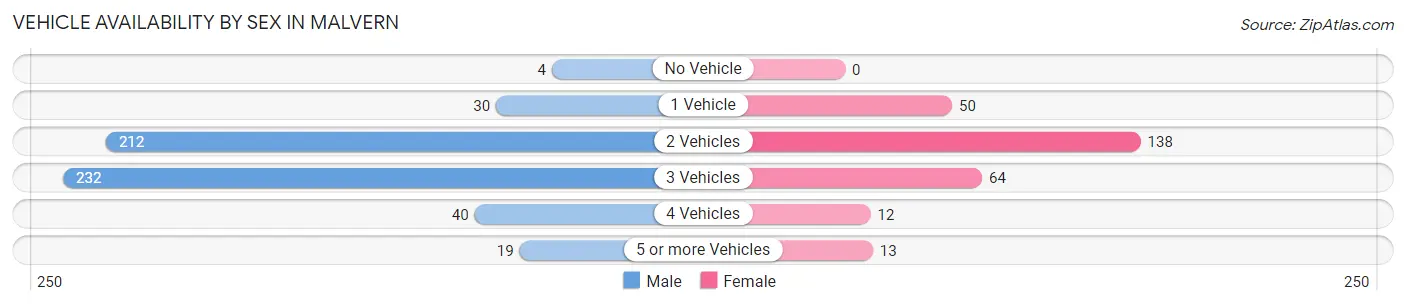
| Vehicles Available | Male | Female |
| No Vehicle | 4 (0.7%) | 0 (0.0%) |
| 1 Vehicle | 30 (5.6%) | 50 (18.0%) |
| 2 Vehicles | 212 (39.5%) | 138 (49.8%) |
| 3 Vehicles | 232 (43.2%) | 64 (23.1%) |
| 4 Vehicles | 40 (7.4%) | 12 (4.3%) |
| 5 or more Vehicles | 19 (3.5%) | 13 (4.7%) |
| Total | 537 (100.0%) | 277 (100.0%) |
Commute Time in Malvern
The most frequently occuring commute durations in Malvern are 15 to 19 minutes (189 commuters, 23.9%), 20 to 24 minutes (131 commuters, 16.5%), and 30 to 34 minutes (111 commuters, 14.0%).
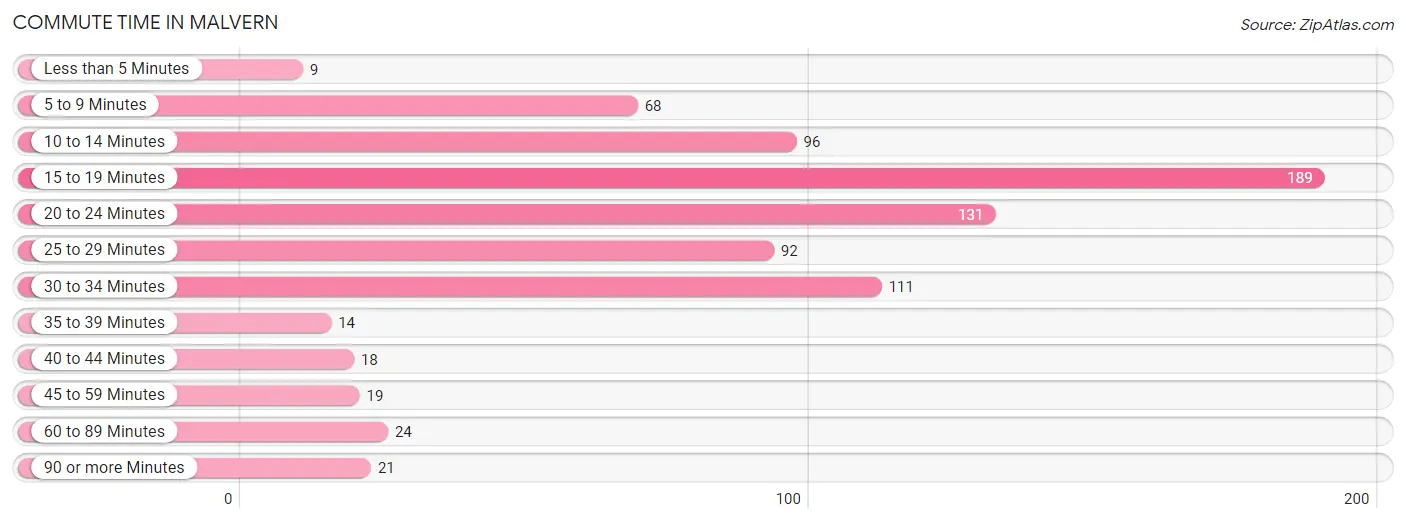
| Commute Time | # Commuters | % Commuters |
| Less than 5 Minutes | 9 | 1.1% |
| 5 to 9 Minutes | 68 | 8.6% |
| 10 to 14 Minutes | 96 | 12.1% |
| 15 to 19 Minutes | 189 | 23.9% |
| 20 to 24 Minutes | 131 | 16.5% |
| 25 to 29 Minutes | 92 | 11.6% |
| 30 to 34 Minutes | 111 | 14.0% |
| 35 to 39 Minutes | 14 | 1.8% |
| 40 to 44 Minutes | 18 | 2.3% |
| 45 to 59 Minutes | 19 | 2.4% |
| 60 to 89 Minutes | 24 | 3.0% |
| 90 or more Minutes | 21 | 2.6% |
Commute Time by Sex in Malvern
The most common commute times in Malvern are 15 to 19 minutes (141 commuters, 27.3%) for males and 25 to 29 minutes (75 commuters, 27.3%) for females.
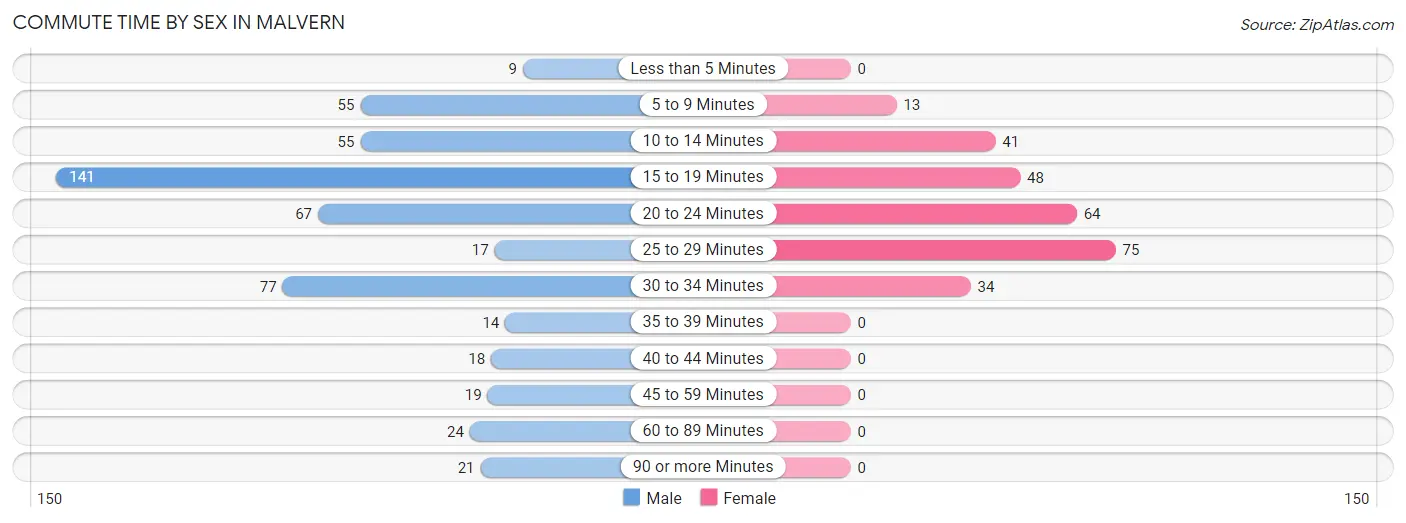
| Commute Time | Male | Female |
| Less than 5 Minutes | 9 (1.7%) | 0 (0.0%) |
| 5 to 9 Minutes | 55 (10.6%) | 13 (4.7%) |
| 10 to 14 Minutes | 55 (10.6%) | 41 (14.9%) |
| 15 to 19 Minutes | 141 (27.3%) | 48 (17.4%) |
| 20 to 24 Minutes | 67 (13.0%) | 64 (23.3%) |
| 25 to 29 Minutes | 17 (3.3%) | 75 (27.3%) |
| 30 to 34 Minutes | 77 (14.9%) | 34 (12.4%) |
| 35 to 39 Minutes | 14 (2.7%) | 0 (0.0%) |
| 40 to 44 Minutes | 18 (3.5%) | 0 (0.0%) |
| 45 to 59 Minutes | 19 (3.7%) | 0 (0.0%) |
| 60 to 89 Minutes | 24 (4.6%) | 0 (0.0%) |
| 90 or more Minutes | 21 (4.1%) | 0 (0.0%) |
Time of Departure to Work by Sex in Malvern
The most frequent times of departure to work in Malvern are 5:30 AM to 5:59 AM (121, 23.4%) for males and 7:00 AM to 7:29 AM (107, 38.9%) for females.
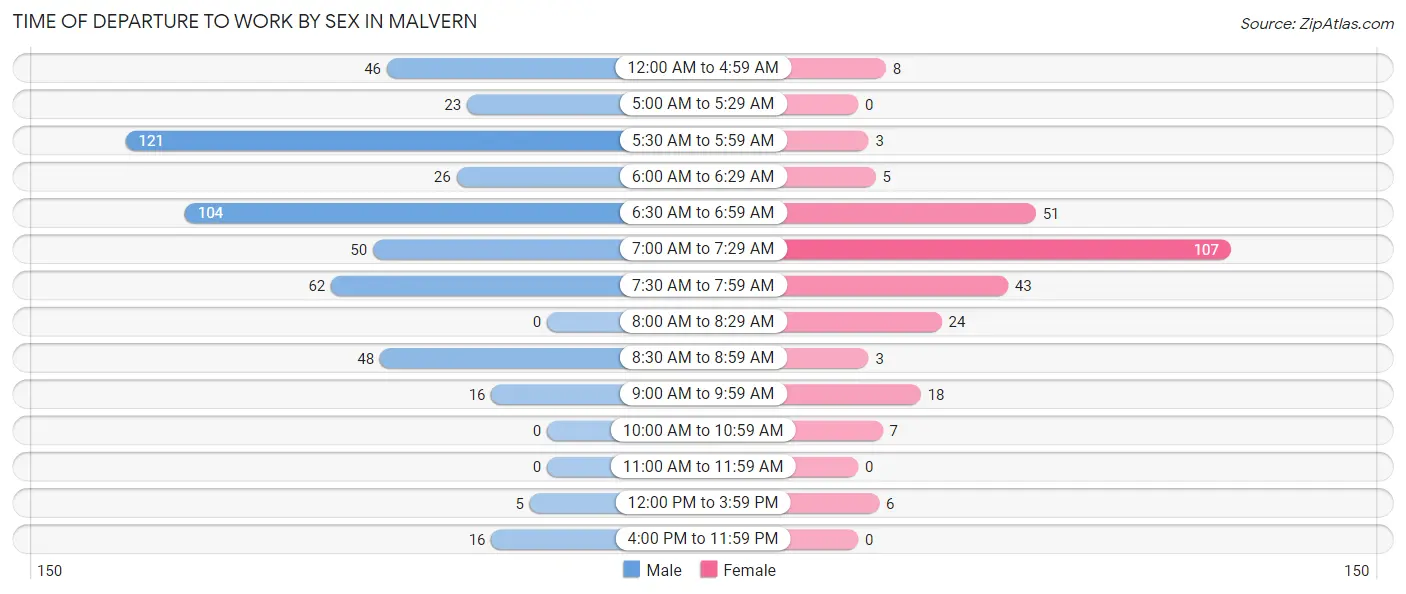
| Time of Departure | Male | Female |
| 12:00 AM to 4:59 AM | 46 (8.9%) | 8 (2.9%) |
| 5:00 AM to 5:29 AM | 23 (4.4%) | 0 (0.0%) |
| 5:30 AM to 5:59 AM | 121 (23.4%) | 3 (1.1%) |
| 6:00 AM to 6:29 AM | 26 (5.0%) | 5 (1.8%) |
| 6:30 AM to 6:59 AM | 104 (20.1%) | 51 (18.5%) |
| 7:00 AM to 7:29 AM | 50 (9.7%) | 107 (38.9%) |
| 7:30 AM to 7:59 AM | 62 (12.0%) | 43 (15.6%) |
| 8:00 AM to 8:29 AM | 0 (0.0%) | 24 (8.7%) |
| 8:30 AM to 8:59 AM | 48 (9.3%) | 3 (1.1%) |
| 9:00 AM to 9:59 AM | 16 (3.1%) | 18 (6.6%) |
| 10:00 AM to 10:59 AM | 0 (0.0%) | 7 (2.5%) |
| 11:00 AM to 11:59 AM | 0 (0.0%) | 0 (0.0%) |
| 12:00 PM to 3:59 PM | 5 (1.0%) | 6 (2.2%) |
| 4:00 PM to 11:59 PM | 16 (3.1%) | 0 (0.0%) |
| Total | 517 (100.0%) | 275 (100.0%) |
Housing Occupancy in Malvern
Occupancy by Ownership in Malvern
Of the total 658 dwellings in Malvern, owner-occupied units account for 510 (77.5%), while renter-occupied units make up 148 (22.5%).
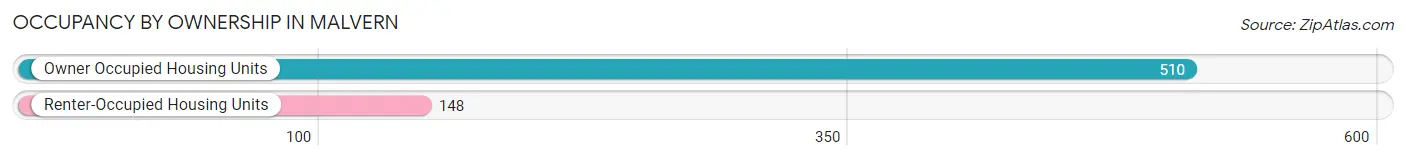
| Occupancy | # Housing Units | % Housing Units |
| Owner Occupied Housing Units | 510 | 77.5% |
| Renter-Occupied Housing Units | 148 | 22.5% |
| Total Occupied Housing Units | 658 | 100.0% |
Occupancy by Household Size in Malvern
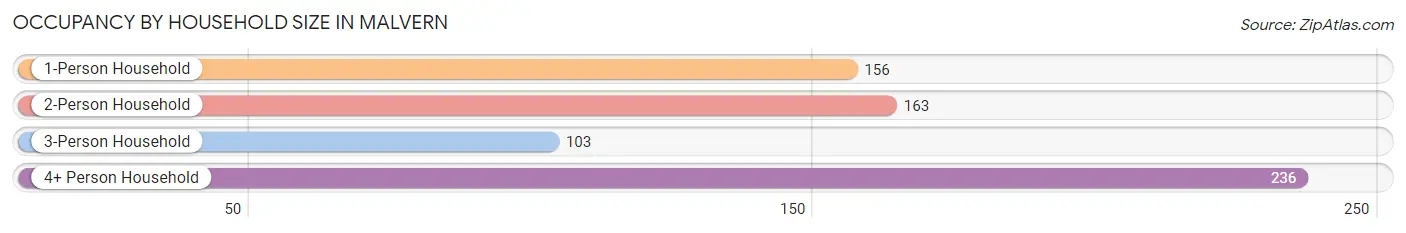
| Household Size | # Housing Units | % Housing Units |
| 1-Person Household | 156 | 23.7% |
| 2-Person Household | 163 | 24.8% |
| 3-Person Household | 103 | 15.7% |
| 4+ Person Household | 236 | 35.9% |
| Total Housing Units | 658 | 100.0% |
Occupancy by Ownership by Household Size in Malvern
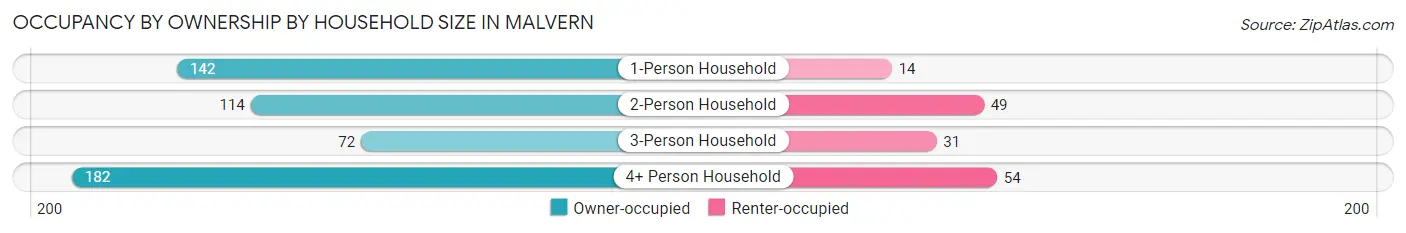
| Household Size | Owner-occupied | Renter-occupied |
| 1-Person Household | 142 (91.0%) | 14 (9.0%) |
| 2-Person Household | 114 (69.9%) | 49 (30.1%) |
| 3-Person Household | 72 (69.9%) | 31 (30.1%) |
| 4+ Person Household | 182 (77.1%) | 54 (22.9%) |
| Total Housing Units | 510 (77.5%) | 148 (22.5%) |
Occupancy by Educational Attainment in Malvern
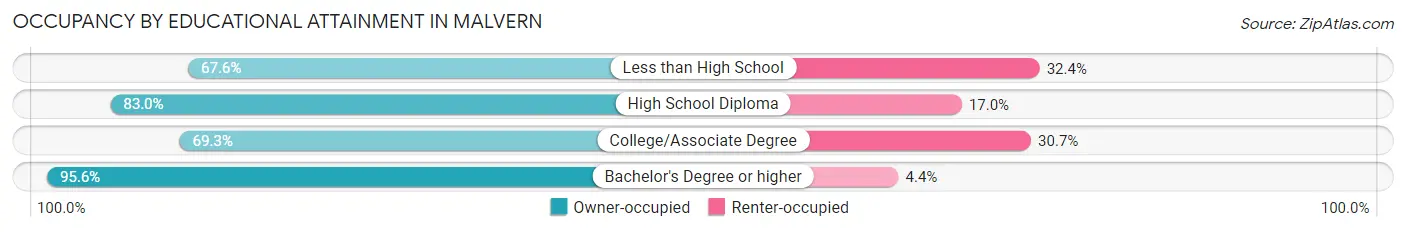
| Household Size | Owner-occupied | Renter-occupied |
| Less than High School | 100 (67.6%) | 48 (32.4%) |
| High School Diploma | 200 (83.0%) | 41 (17.0%) |
| College/Associate Degree | 124 (69.3%) | 55 (30.7%) |
| Bachelor's Degree or higher | 86 (95.6%) | 4 (4.4%) |
Occupancy by Age of Householder in Malvern
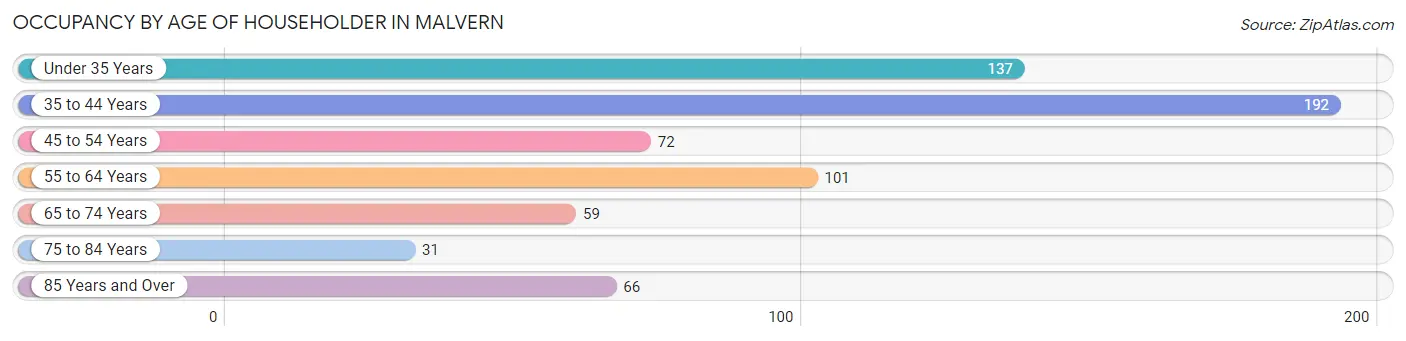
| Age Bracket | # Households | % Households |
| Under 35 Years | 137 | 20.8% |
| 35 to 44 Years | 192 | 29.2% |
| 45 to 54 Years | 72 | 10.9% |
| 55 to 64 Years | 101 | 15.3% |
| 65 to 74 Years | 59 | 9.0% |
| 75 to 84 Years | 31 | 4.7% |
| 85 Years and Over | 66 | 10.0% |
| Total | 658 | 100.0% |
Housing Finances in Malvern
Median Income by Occupancy in Malvern
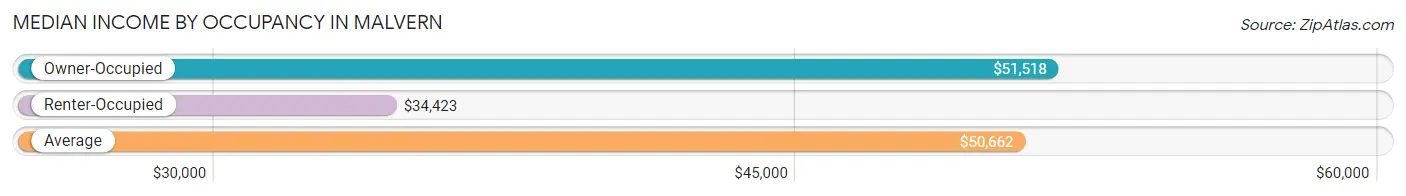
| Occupancy Type | # Households | Median Income |
| Owner-Occupied | 510 (77.5%) | $51,518 |
| Renter-Occupied | 148 (22.5%) | $34,423 |
| Average | 658 (100.0%) | $50,662 |
Occupancy by Householder Income Bracket in Malvern
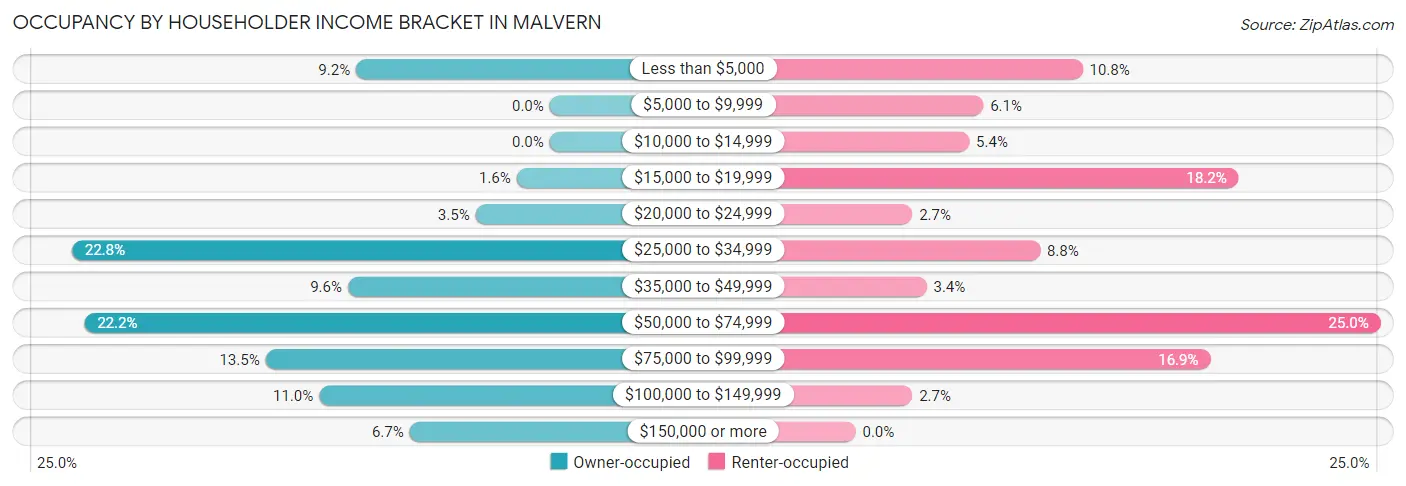
| Income Bracket | Owner-occupied | Renter-occupied |
| Less than $5,000 | 47 (9.2%) | 16 (10.8%) |
| $5,000 to $9,999 | 0 (0.0%) | 9 (6.1%) |
| $10,000 to $14,999 | 0 (0.0%) | 8 (5.4%) |
| $15,000 to $19,999 | 8 (1.6%) | 27 (18.2%) |
| $20,000 to $24,999 | 18 (3.5%) | 4 (2.7%) |
| $25,000 to $34,999 | 116 (22.8%) | 13 (8.8%) |
| $35,000 to $49,999 | 49 (9.6%) | 5 (3.4%) |
| $50,000 to $74,999 | 113 (22.2%) | 37 (25.0%) |
| $75,000 to $99,999 | 69 (13.5%) | 25 (16.9%) |
| $100,000 to $149,999 | 56 (11.0%) | 4 (2.7%) |
| $150,000 or more | 34 (6.7%) | 0 (0.0%) |
| Total | 510 (100.0%) | 148 (100.0%) |
Monthly Housing Cost Tiers in Malvern
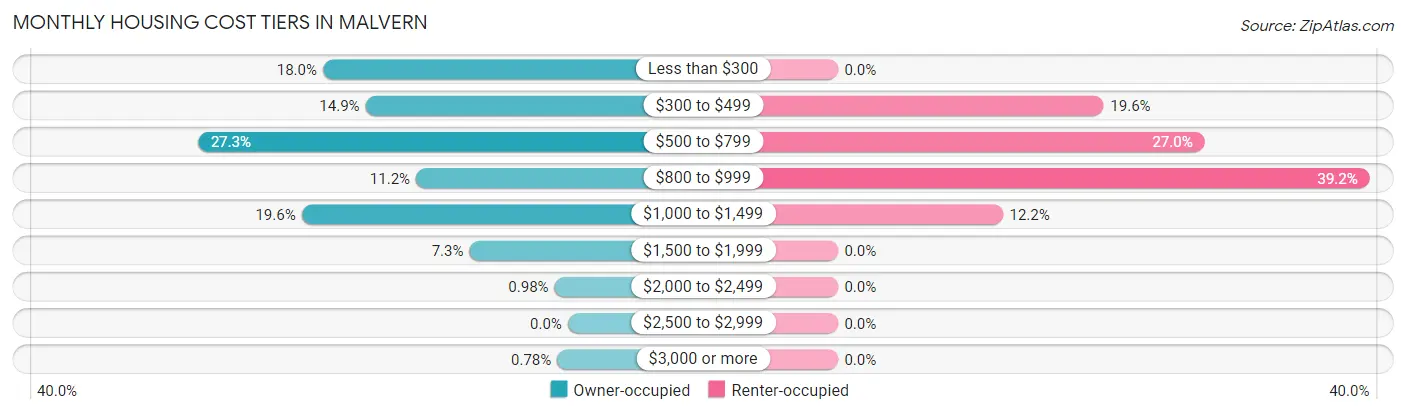
| Monthly Cost | Owner-occupied | Renter-occupied |
| Less than $300 | 92 (18.0%) | 0 (0.0%) |
| $300 to $499 | 76 (14.9%) | 29 (19.6%) |
| $500 to $799 | 139 (27.3%) | 40 (27.0%) |
| $800 to $999 | 57 (11.2%) | 58 (39.2%) |
| $1,000 to $1,499 | 100 (19.6%) | 18 (12.2%) |
| $1,500 to $1,999 | 37 (7.2%) | 0 (0.0%) |
| $2,000 to $2,499 | 5 (1.0%) | 0 (0.0%) |
| $2,500 to $2,999 | 0 (0.0%) | 0 (0.0%) |
| $3,000 or more | 4 (0.8%) | 0 (0.0%) |
| Total | 510 (100.0%) | 148 (100.0%) |
Physical Housing Characteristics in Malvern
Housing Structures in Malvern
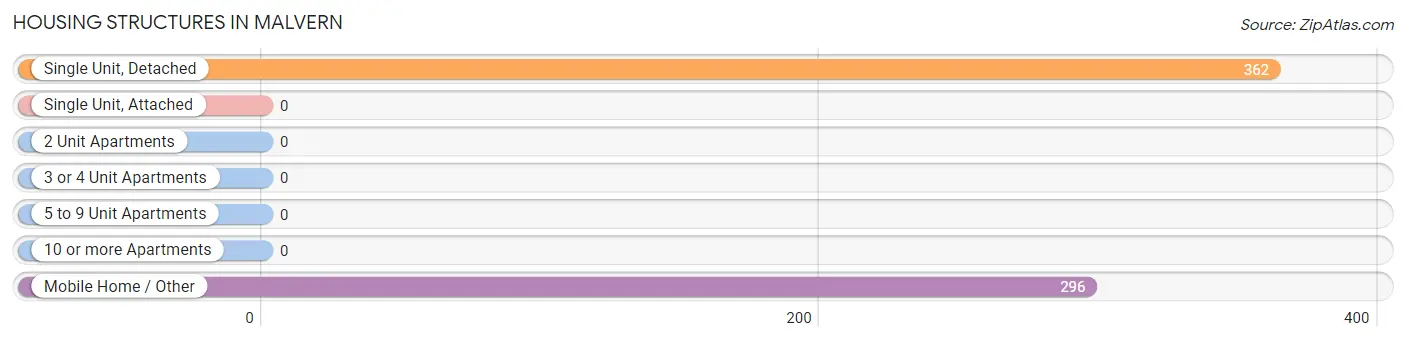
| Structure Type | # Housing Units | % Housing Units |
| Single Unit, Detached | 362 | 55.0% |
| Single Unit, Attached | 0 | 0.0% |
| 2 Unit Apartments | 0 | 0.0% |
| 3 or 4 Unit Apartments | 0 | 0.0% |
| 5 to 9 Unit Apartments | 0 | 0.0% |
| 10 or more Apartments | 0 | 0.0% |
| Mobile Home / Other | 296 | 45.0% |
| Total | 658 | 100.0% |
Housing Structures by Occupancy in Malvern
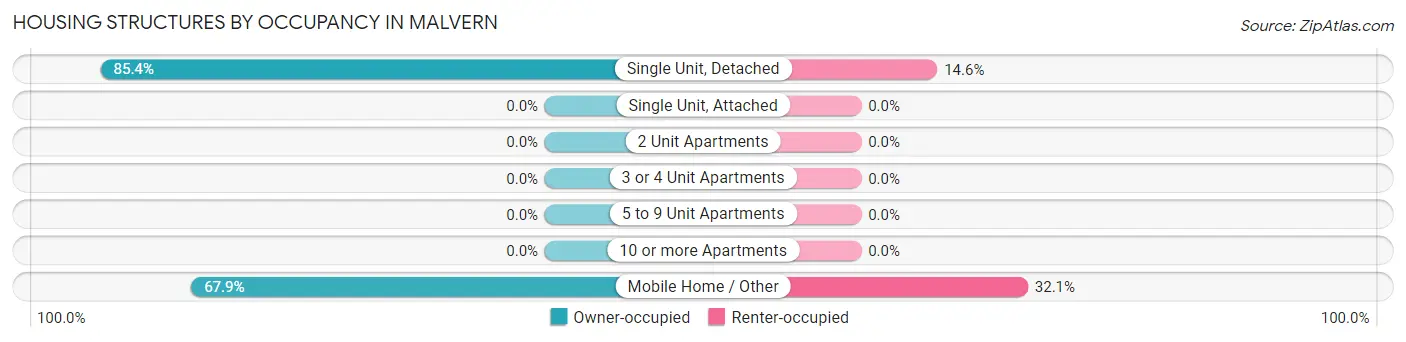
| Structure Type | Owner-occupied | Renter-occupied |
| Single Unit, Detached | 309 (85.4%) | 53 (14.6%) |
| Single Unit, Attached | 0 (0.0%) | 0 (0.0%) |
| 2 Unit Apartments | 0 (0.0%) | 0 (0.0%) |
| 3 or 4 Unit Apartments | 0 (0.0%) | 0 (0.0%) |
| 5 to 9 Unit Apartments | 0 (0.0%) | 0 (0.0%) |
| 10 or more Apartments | 0 (0.0%) | 0 (0.0%) |
| Mobile Home / Other | 201 (67.9%) | 95 (32.1%) |
| Total | 510 (77.5%) | 148 (22.5%) |
Housing Structures by Number of Rooms in Malvern
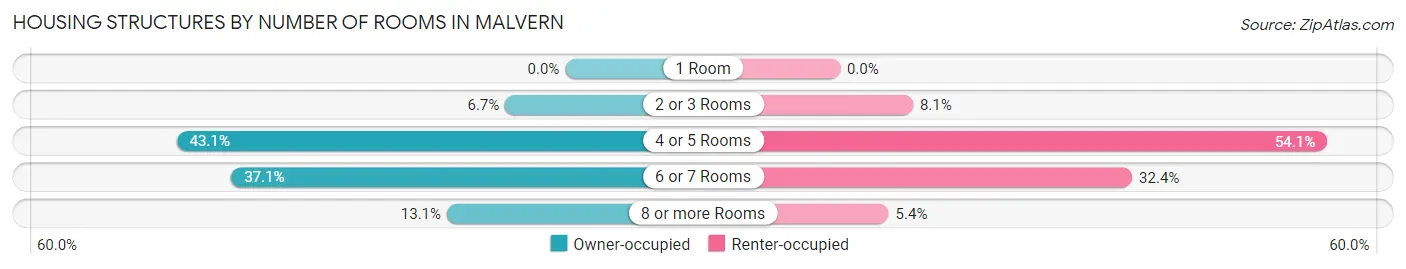
| Number of Rooms | Owner-occupied | Renter-occupied |
| 1 Room | 0 (0.0%) | 0 (0.0%) |
| 2 or 3 Rooms | 34 (6.7%) | 12 (8.1%) |
| 4 or 5 Rooms | 220 (43.1%) | 80 (54.0%) |
| 6 or 7 Rooms | 189 (37.1%) | 48 (32.4%) |
| 8 or more Rooms | 67 (13.1%) | 8 (5.4%) |
| Total | 510 (100.0%) | 148 (100.0%) |
Housing Structure by Heating Type in Malvern
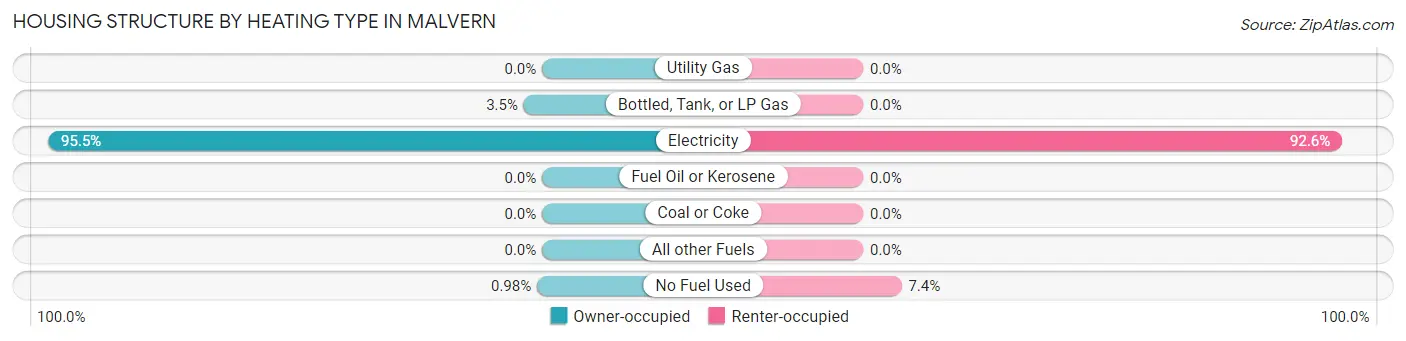
| Heating Type | Owner-occupied | Renter-occupied |
| Utility Gas | 0 (0.0%) | 0 (0.0%) |
| Bottled, Tank, or LP Gas | 18 (3.5%) | 0 (0.0%) |
| Electricity | 487 (95.5%) | 137 (92.6%) |
| Fuel Oil or Kerosene | 0 (0.0%) | 0 (0.0%) |
| Coal or Coke | 0 (0.0%) | 0 (0.0%) |
| All other Fuels | 0 (0.0%) | 0 (0.0%) |
| No Fuel Used | 5 (1.0%) | 11 (7.4%) |
| Total | 510 (100.0%) | 148 (100.0%) |
Household Vehicle Usage in Malvern
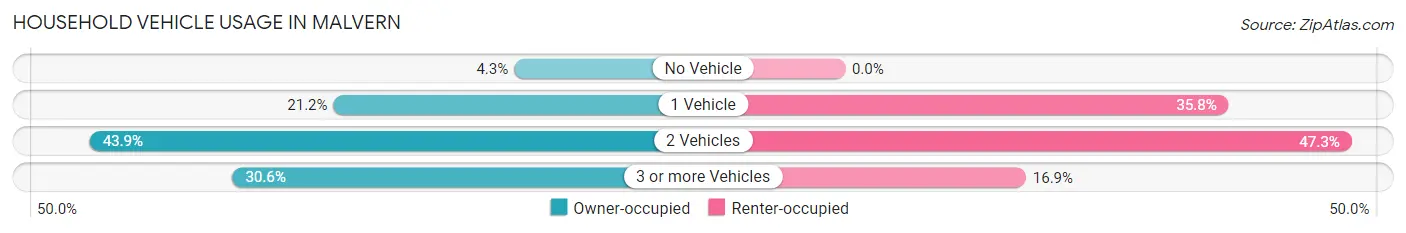
| Vehicles per Household | Owner-occupied | Renter-occupied |
| No Vehicle | 22 (4.3%) | 0 (0.0%) |
| 1 Vehicle | 108 (21.2%) | 53 (35.8%) |
| 2 Vehicles | 224 (43.9%) | 70 (47.3%) |
| 3 or more Vehicles | 156 (30.6%) | 25 (16.9%) |
| Total | 510 (100.0%) | 148 (100.0%) |
Real Estate & Mortgages in Malvern
Real Estate and Mortgage Overview in Malvern
| Characteristic | Without Mortgage | With Mortgage |
| Housing Units | 194 | 316 |
| Median Property Value | $79,100 | $157,000 |
| Median Household Income | $33,088 | $34 |
| Monthly Housing Costs | $309 | $4 |
| Real Estate Taxes | $308 | $19 |
Property Value by Mortgage Status in Malvern
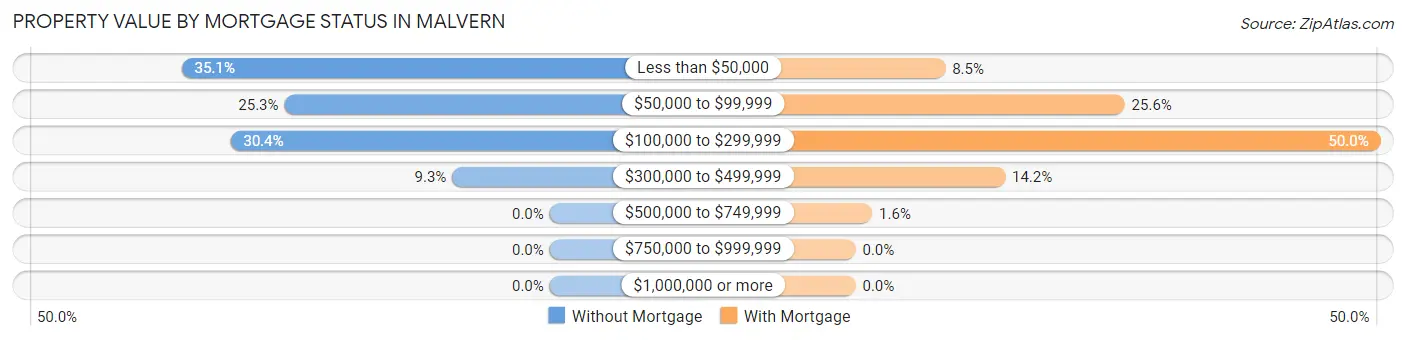
| Property Value | Without Mortgage | With Mortgage |
| Less than $50,000 | 68 (35.0%) | 27 (8.5%) |
| $50,000 to $99,999 | 49 (25.3%) | 81 (25.6%) |
| $100,000 to $299,999 | 59 (30.4%) | 158 (50.0%) |
| $300,000 to $499,999 | 18 (9.3%) | 45 (14.2%) |
| $500,000 to $749,999 | 0 (0.0%) | 5 (1.6%) |
| $750,000 to $999,999 | 0 (0.0%) | 0 (0.0%) |
| $1,000,000 or more | 0 (0.0%) | 0 (0.0%) |
| Total | 194 (100.0%) | 316 (100.0%) |
Household Income by Mortgage Status in Malvern
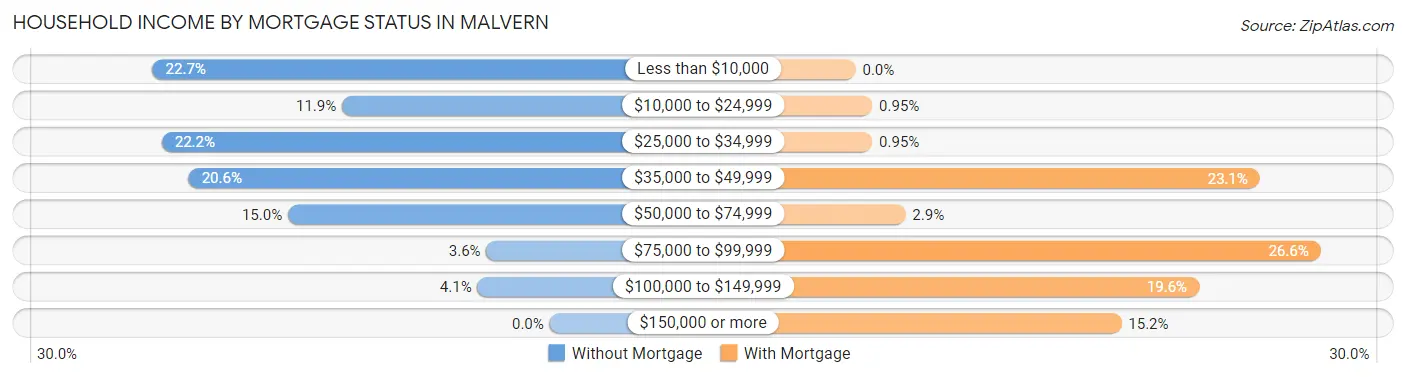
| Household Income | Without Mortgage | With Mortgage |
| Less than $10,000 | 44 (22.7%) | 0 (0.0%) |
| $10,000 to $24,999 | 23 (11.9%) | 3 (0.9%) |
| $25,000 to $34,999 | 43 (22.2%) | 3 (0.9%) |
| $35,000 to $49,999 | 40 (20.6%) | 73 (23.1%) |
| $50,000 to $74,999 | 29 (14.9%) | 9 (2.9%) |
| $75,000 to $99,999 | 7 (3.6%) | 84 (26.6%) |
| $100,000 to $149,999 | 8 (4.1%) | 62 (19.6%) |
| $150,000 or more | 0 (0.0%) | 48 (15.2%) |
| Total | 194 (100.0%) | 316 (100.0%) |
Property Value to Household Income Ratio in Malvern
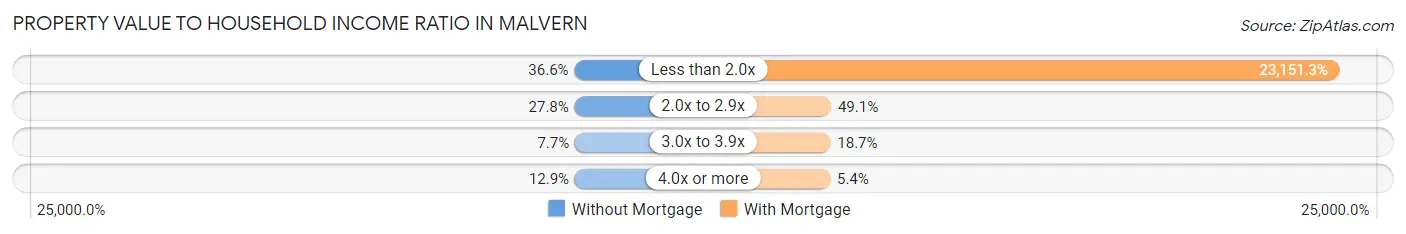
| Value-to-Income Ratio | Without Mortgage | With Mortgage |
| Less than 2.0x | 71 (36.6%) | 73,158 (23,151.3%) |
| 2.0x to 2.9x | 54 (27.8%) | 155 (49.0%) |
| 3.0x to 3.9x | 15 (7.7%) | 59 (18.7%) |
| 4.0x or more | 25 (12.9%) | 17 (5.4%) |
| Total | 194 (100.0%) | 316 (100.0%) |
Real Estate Taxes by Mortgage Status in Malvern
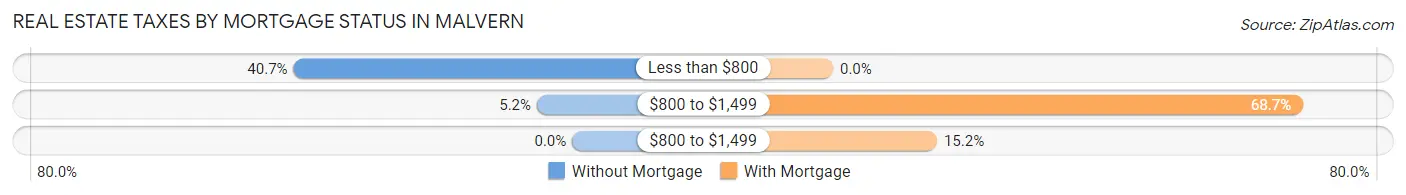
| Property Taxes | Without Mortgage | With Mortgage |
| Less than $800 | 79 (40.7%) | 0 (0.0%) |
| $800 to $1,499 | 10 (5.1%) | 217 (68.7%) |
| $800 to $1,499 | 0 (0.0%) | 48 (15.2%) |
| Total | 194 (100.0%) | 316 (100.0%) |
Health & Disability in Malvern
Health Insurance Coverage by Age in Malvern
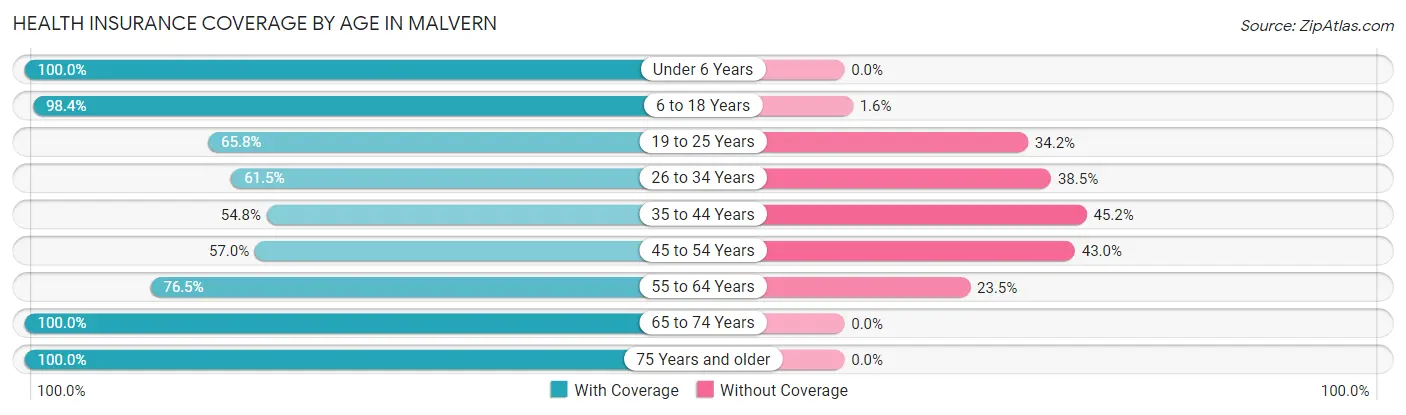
| Age Bracket | With Coverage | Without Coverage |
| Under 6 Years | 91 (100.0%) | 0 (0.0%) |
| 6 to 18 Years | 502 (98.4%) | 8 (1.6%) |
| 19 to 25 Years | 121 (65.8%) | 63 (34.2%) |
| 26 to 34 Years | 118 (61.5%) | 74 (38.5%) |
| 35 to 44 Years | 159 (54.8%) | 131 (45.2%) |
| 45 to 54 Years | 134 (57.0%) | 101 (43.0%) |
| 55 to 64 Years | 124 (76.5%) | 38 (23.5%) |
| 65 to 74 Years | 116 (100.0%) | 0 (0.0%) |
| 75 Years and older | 146 (100.0%) | 0 (0.0%) |
| Total | 1,511 (78.4%) | 415 (21.5%) |
Health Insurance Coverage by Citizenship Status in Malvern

| Citizenship Status | With Coverage | Without Coverage |
| Native Born | 91 (100.0%) | 0 (0.0%) |
| Foreign Born, Citizen | 502 (98.4%) | 8 (1.6%) |
| Foreign Born, not a Citizen | 121 (65.8%) | 63 (34.2%) |
Health Insurance Coverage by Household Income in Malvern

| Household Income | With Coverage | Without Coverage |
| Under $25,000 | 152 (60.1%) | 101 (39.9%) |
| $25,000 to $49,999 | 338 (64.7%) | 184 (35.2%) |
| $50,000 to $74,999 | 398 (80.1%) | 99 (19.9%) |
| $75,000 to $99,999 | 258 (91.2%) | 25 (8.8%) |
| $100,000 and over | 365 (98.4%) | 6 (1.6%) |
Public vs Private Health Insurance Coverage by Age in Malvern
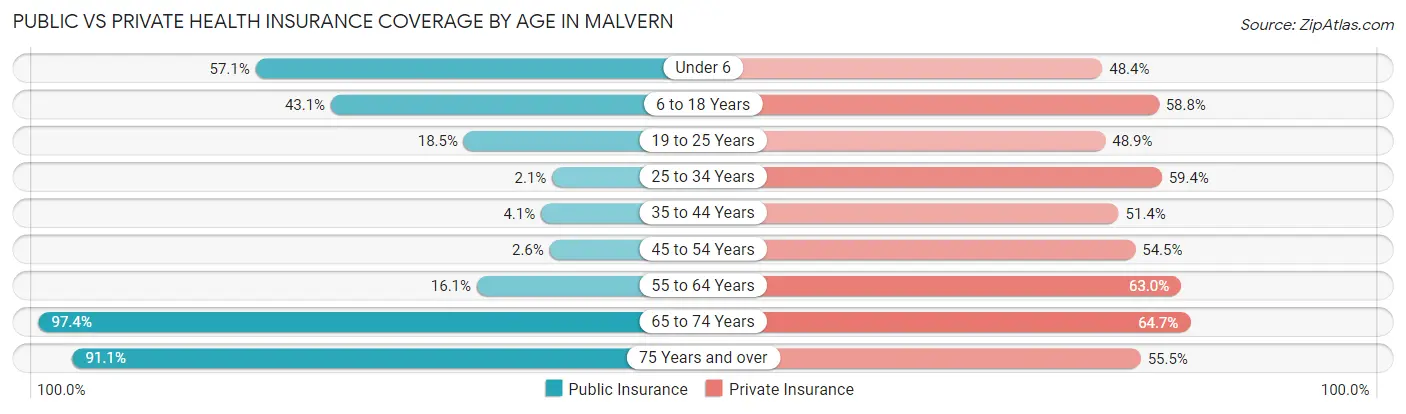
| Age Bracket | Public Insurance | Private Insurance |
| Under 6 | 52 (57.1%) | 44 (48.3%) |
| 6 to 18 Years | 220 (43.1%) | 300 (58.8%) |
| 19 to 25 Years | 34 (18.5%) | 90 (48.9%) |
| 25 to 34 Years | 4 (2.1%) | 114 (59.4%) |
| 35 to 44 Years | 12 (4.1%) | 149 (51.4%) |
| 45 to 54 Years | 6 (2.5%) | 128 (54.5%) |
| 55 to 64 Years | 26 (16.1%) | 102 (63.0%) |
| 65 to 74 Years | 113 (97.4%) | 75 (64.7%) |
| 75 Years and over | 133 (91.1%) | 81 (55.5%) |
| Total | 600 (31.1%) | 1,083 (56.2%) |
Disability Status by Sex by Age in Malvern
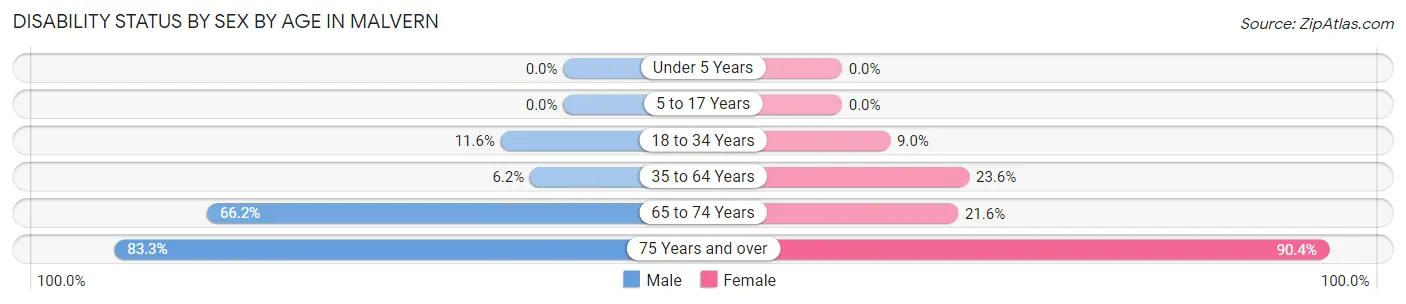
| Age Bracket | Male | Female |
| Under 5 Years | 0 (0.0%) | 0 (0.0%) |
| 5 to 17 Years | 0 (0.0%) | 0 (0.0%) |
| 18 to 34 Years | 28 (11.6%) | 13 (9.0%) |
| 35 to 64 Years | 21 (6.2%) | 82 (23.6%) |
| 65 to 74 Years | 43 (66.1%) | 11 (21.6%) |
| 75 Years and over | 35 (83.3%) | 94 (90.4%) |
Disability Class by Sex by Age in Malvern
Disability Class: Hearing Difficulty
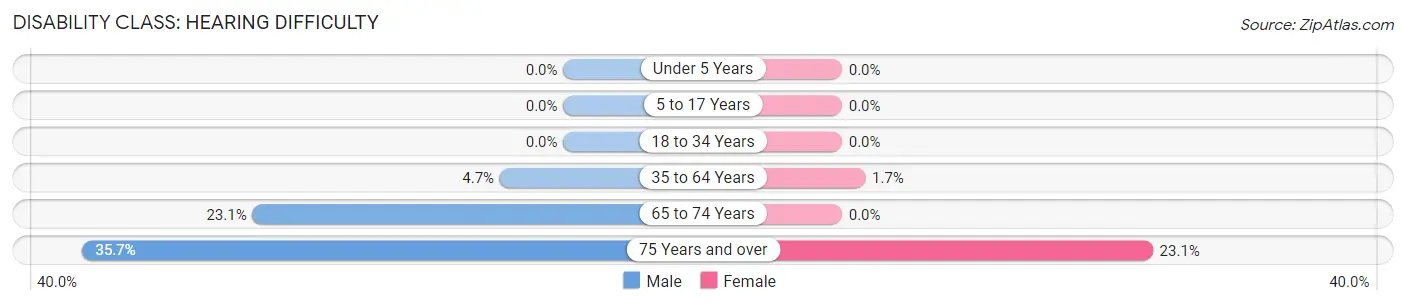
| Age Bracket | Male | Female |
| Under 5 Years | 0 (0.0%) | 0 (0.0%) |
| 5 to 17 Years | 0 (0.0%) | 0 (0.0%) |
| 18 to 34 Years | 0 (0.0%) | 0 (0.0%) |
| 35 to 64 Years | 16 (4.7%) | 6 (1.7%) |
| 65 to 74 Years | 15 (23.1%) | 0 (0.0%) |
| 75 Years and over | 15 (35.7%) | 24 (23.1%) |
Disability Class: Vision Difficulty
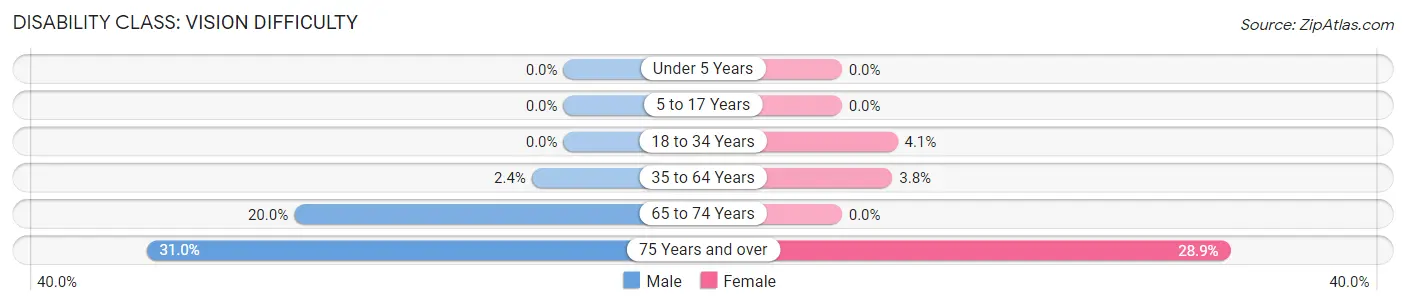
| Age Bracket | Male | Female |
| Under 5 Years | 0 (0.0%) | 0 (0.0%) |
| 5 to 17 Years | 0 (0.0%) | 0 (0.0%) |
| 18 to 34 Years | 0 (0.0%) | 6 (4.1%) |
| 35 to 64 Years | 8 (2.4%) | 13 (3.7%) |
| 65 to 74 Years | 13 (20.0%) | 0 (0.0%) |
| 75 Years and over | 13 (30.9%) | 30 (28.8%) |
Disability Class: Cognitive Difficulty
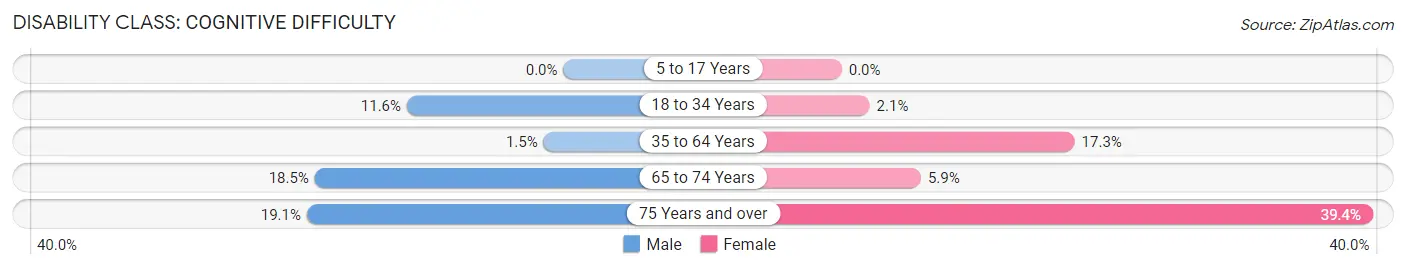
| Age Bracket | Male | Female |
| 5 to 17 Years | 0 (0.0%) | 0 (0.0%) |
| 18 to 34 Years | 28 (11.6%) | 3 (2.1%) |
| 35 to 64 Years | 5 (1.5%) | 60 (17.3%) |
| 65 to 74 Years | 12 (18.5%) | 3 (5.9%) |
| 75 Years and over | 8 (19.1%) | 41 (39.4%) |
Disability Class: Ambulatory Difficulty

| Age Bracket | Male | Female |
| 5 to 17 Years | 0 (0.0%) | 0 (0.0%) |
| 18 to 34 Years | 0 (0.0%) | 0 (0.0%) |
| 35 to 64 Years | 5 (1.5%) | 27 (7.8%) |
| 65 to 74 Years | 18 (27.7%) | 8 (15.7%) |
| 75 Years and over | 31 (73.8%) | 91 (87.5%) |
Disability Class: Self-Care Difficulty

| Age Bracket | Male | Female |
| 5 to 17 Years | 0 (0.0%) | 0 (0.0%) |
| 18 to 34 Years | 0 (0.0%) | 0 (0.0%) |
| 35 to 64 Years | 0 (0.0%) | 0 (0.0%) |
| 65 to 74 Years | 8 (12.3%) | 0 (0.0%) |
| 75 Years and over | 6 (14.3%) | 58 (55.8%) |
Technology Access in Malvern
Computing Device Access in Malvern
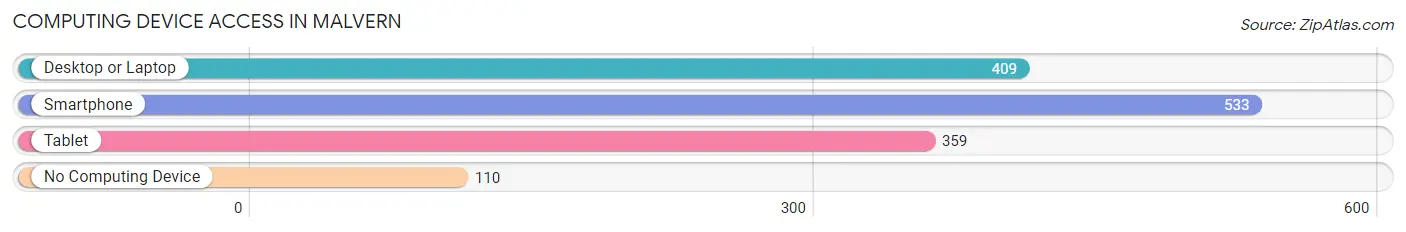
| Device Type | # Households | % Households |
| Desktop or Laptop | 409 | 62.2% |
| Smartphone | 533 | 81.0% |
| Tablet | 359 | 54.6% |
| No Computing Device | 110 | 16.7% |
| Total | 658 | 100.0% |
Internet Access in Malvern
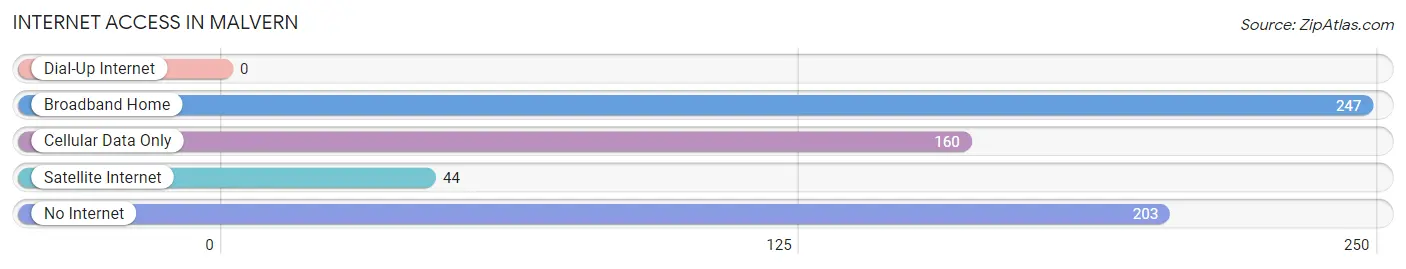
| Internet Type | # Households | % Households |
| Dial-Up Internet | 0 | 0.0% |
| Broadband Home | 247 | 37.5% |
| Cellular Data Only | 160 | 24.3% |
| Satellite Internet | 44 | 6.7% |
| No Internet | 203 | 30.8% |
| Total | 658 | 100.0% |
Malvern Summary
Malvern is a small town located in the state of Alabama, in the United States. It is situated in the northwest corner of the state, in the foothills of the Appalachian Mountains. The town is located in the county of Autauga, and is part of the Montgomery Metropolitan Statistical Area. The population of Malvern was estimated to be 1,845 in 2019.
History
Malvern was founded in 1818 by a group of settlers from Georgia. The town was named after the town of Malvern in England. The settlers were attracted to the area due to its fertile soil and abundant natural resources. The town was incorporated in 1819 and quickly became a thriving agricultural center. The town was also known for its iron ore deposits, which were mined and used to produce iron products.
In the late 19th century, Malvern began to experience a period of growth and prosperity. The town was home to several businesses, including a cotton gin, a sawmill, and a gristmill. The town also had a railroad station, which connected it to other towns in the region.
Geography
Malvern is located in the northwest corner of Alabama, in the foothills of the Appalachian Mountains. The town is situated in Autauga County, and is part of the Montgomery Metropolitan Statistical Area. The town is located at an elevation of 590 feet above sea level.
The town is located in a humid subtropical climate zone, with hot, humid summers and mild winters. The average annual temperature is around 68 degrees Fahrenheit, with an average high of around 90 degrees in the summer and an average low of around 40 degrees in the winter. The average annual precipitation is around 50 inches.
Economy
Malvern’s economy is largely based on agriculture. The town is home to several farms, which produce a variety of crops, including cotton, corn, soybeans, and wheat. The town is also home to several businesses, including a lumber mill, a sawmill, and a gristmill.
The town is also home to several manufacturing companies, which produce a variety of products, including furniture, clothing, and automotive parts. The town is also home to several retail stores, which sell a variety of goods, including clothing, electronics, and home goods.
Demographics
As of 2019, the population of Malvern was estimated to be 1,845. The town has a population density of around 545 people per square mile. The median age of the population is around 38 years old, and the median household income is around $41,000.
The town is predominantly white, with around 87% of the population identifying as white. The remaining population is made up of African Americans (7%), Hispanics (3%), and other races (3%). The town is also home to a small Native American population, which makes up around 1% of the population.
The town is served by the Autauga County School District, which operates several public schools in the area. The town is also home to several churches, including the First Baptist Church of Malvern and the Malvern United Methodist Church.
Common Questions
What is Per Capita Income in Malvern?
Per Capita income in Malvern is $21,326.
What is the Median Family Income in Malvern?
Median Family Income in Malvern is $60,000.
What is the Median Household income in Malvern?
Median Household Income in Malvern is $50,662.
What is Income or Wage Gap in Malvern?
Income or Wage Gap in Malvern is 3.5%.
Women in Malvern earn 96.5 cents for every dollar earned by a man.
What is Family Income Deficit in Malvern?
Family Income Deficit in Malvern is $6,849.
Families that are below poverty line in Malvern earn $6,849 less on average than the poverty threshold level.
What is Inequality or Gini Index in Malvern?
Inequality or Gini Index in Malvern is 0.41.
What is the Total Population of Malvern?
Total Population of Malvern is 1,926.
What is the Total Male Population of Malvern?
Total Male Population of Malvern is 1,040.
What is the Total Female Population of Malvern?
Total Female Population of Malvern is 886.
What is the Ratio of Males per 100 Females in Malvern?
There are 117.38 Males per 100 Females in Malvern.
What is the Ratio of Females per 100 Males in Malvern?
There are 85.19 Females per 100 Males in Malvern.
What is the Median Population Age in Malvern?
Median Population Age in Malvern is 33.9 Years.
What is the Average Family Size in Malvern
Average Family Size in Malvern is 3.5 People.
What is the Average Household Size in Malvern
Average Household Size in Malvern is 2.9 People.
How Large is the Labor Force in Malvern?
There are 856 People in the Labor Forcein in Malvern.
What is the Percentage of People in the Labor Force in Malvern?
60.1% of People are in the Labor Force in Malvern.
What is the Unemployment Rate in Malvern?
Unemployment Rate in Malvern is 2.2%.