Lynn, AL Map & Demographics
Lynn Map
Lynn Overview
$20,775
PER CAPITA INCOME
$39,303
AVG FAMILY INCOME
$38,934
AVG HOUSEHOLD INCOME
19.8%
WAGE / INCOME GAP [ % ]
80.2¢/ $1
WAGE / INCOME GAP [ $ ]
0.42
INEQUALITY / GINI INDEX
908
TOTAL POPULATION
440
MALE POPULATION
468
FEMALE POPULATION
94.02
MALES / 100 FEMALES
106.36
FEMALES / 100 MALES
50.5
MEDIAN AGE
2.6
AVG FAMILY SIZE
2.4
AVG HOUSEHOLD SIZE
299
LABOR FORCE [ PEOPLE ]
40.0%
PERCENT IN LABOR FORCE
3.3%
UNEMPLOYMENT RATE
Lynn Zip Codes
Lynn Area Codes
Income in Lynn
Income Overview in Lynn
Per Capita Income in Lynn is $20,775, while median incomes of families and households are $39,303 and $38,934 respectively.
| Characteristic | Number | Measure |
| Per Capita Income | 908 | $20,775 |
| Median Family Income | 300 | $39,303 |
| Mean Family Income | 300 | $53,973 |
| Median Household Income | 374 | $38,934 |
| Mean Household Income | 374 | $50,478 |
| Income Deficit | 300 | $0 |
| Wage / Income Gap (%) | 908 | 19.83% |
| Wage / Income Gap ($) | 908 | 80.17¢ per $1 |
| Gini / Inequality Index | 908 | 0.42 |
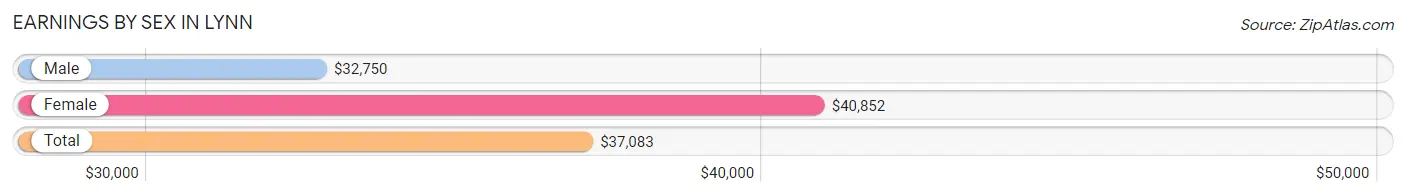
Earnings by Sex in Lynn
Average Earnings in Lynn are $37,083, $32,750 for men and $40,852 for women, a difference of 19.8%.
| Sex | Number | Average Earnings |
| Male | 203 (66.3%) | $32,750 |
| Female | 103 (33.7%) | $40,852 |
| Total | 306 (100.0%) | $37,083 |
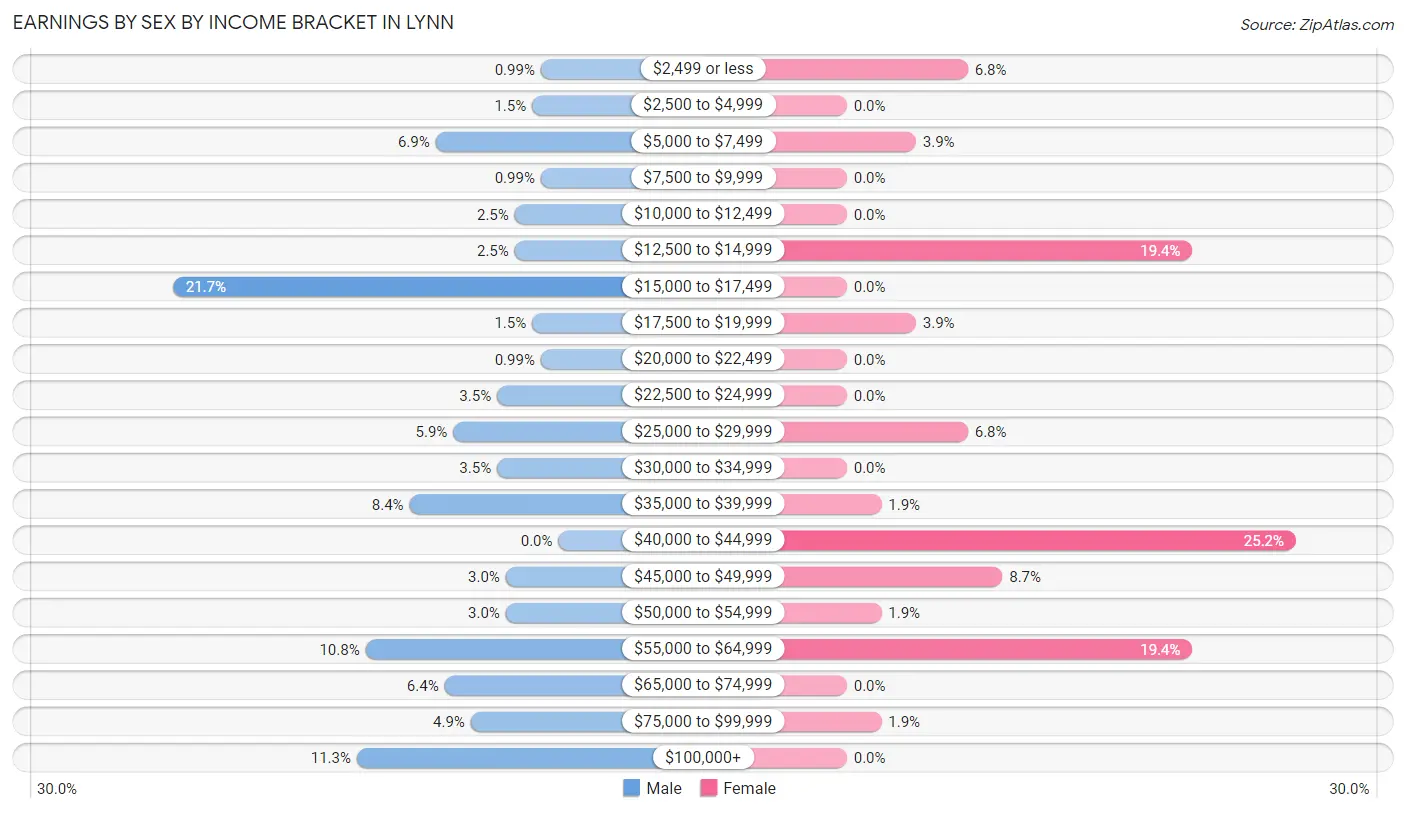
Earnings by Sex by Income Bracket in Lynn
The most common earnings brackets in Lynn are $15,000 to $17,499 for men (44 | 21.7%) and $40,000 to $44,999 for women (26 | 25.2%).
| Income | Male | Female |
| $2,499 or less | 2 (1.0%) | 7 (6.8%) |
| $2,500 to $4,999 | 3 (1.5%) | 0 (0.0%) |
| $5,000 to $7,499 | 14 (6.9%) | 4 (3.9%) |
| $7,500 to $9,999 | 2 (1.0%) | 0 (0.0%) |
| $10,000 to $12,499 | 5 (2.5%) | 0 (0.0%) |
| $12,500 to $14,999 | 5 (2.5%) | 20 (19.4%) |
| $15,000 to $17,499 | 44 (21.7%) | 0 (0.0%) |
| $17,500 to $19,999 | 3 (1.5%) | 4 (3.9%) |
| $20,000 to $22,499 | 2 (1.0%) | 0 (0.0%) |
| $22,500 to $24,999 | 7 (3.5%) | 0 (0.0%) |
| $25,000 to $29,999 | 12 (5.9%) | 7 (6.8%) |
| $30,000 to $34,999 | 7 (3.5%) | 0 (0.0%) |
| $35,000 to $39,999 | 17 (8.4%) | 2 (1.9%) |
| $40,000 to $44,999 | 0 (0.0%) | 26 (25.2%) |
| $45,000 to $49,999 | 6 (3.0%) | 9 (8.7%) |
| $50,000 to $54,999 | 6 (3.0%) | 2 (1.9%) |
| $55,000 to $64,999 | 22 (10.8%) | 20 (19.4%) |
| $65,000 to $74,999 | 13 (6.4%) | 0 (0.0%) |
| $75,000 to $99,999 | 10 (4.9%) | 2 (1.9%) |
| $100,000+ | 23 (11.3%) | 0 (0.0%) |
| Total | 203 (100.0%) | 103 (100.0%) |
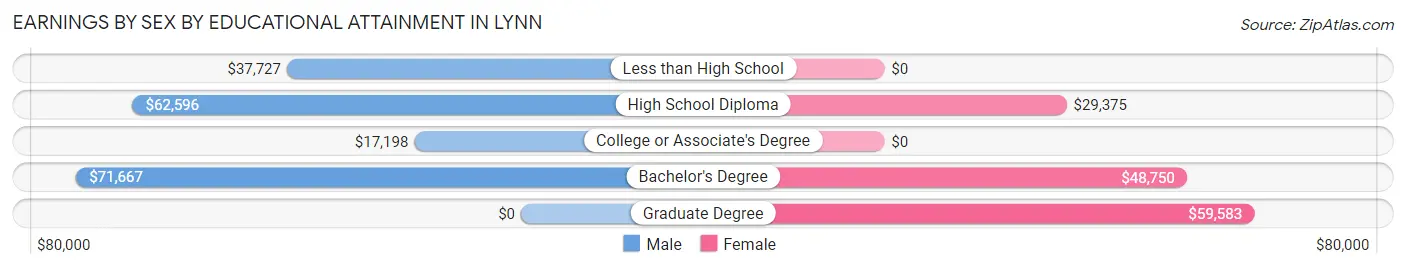
Earnings by Sex by Educational Attainment in Lynn
Average earnings in Lynn are $35,313 for men and $40,966 for women, a difference of 13.8%. Men with an educational attainment of bachelor's degree enjoy the highest average annual earnings of $71,667, while those with college or associate's degree education earn the least with $17,198. Women with an educational attainment of graduate degree earn the most with the average annual earnings of $59,583, while those with high school diploma education have the smallest earnings of $29,375.
| Educational Attainment | Male Income | Female Income |
| Less than High School | $37,727 | $0 |
| High School Diploma | $62,596 | $29,375 |
| College or Associate's Degree | $17,198 | $0 |
| Bachelor's Degree | $71,667 | $48,750 |
| Graduate Degree | - | - |
| Total | $35,313 | $40,966 |
Family Income in Lynn
Family Income Brackets in Lynn
According to the Lynn family income data, there are 75 families falling into the $35,000 to $49,999 income range, which is the most common income bracket and makes up 25.0% of all families.
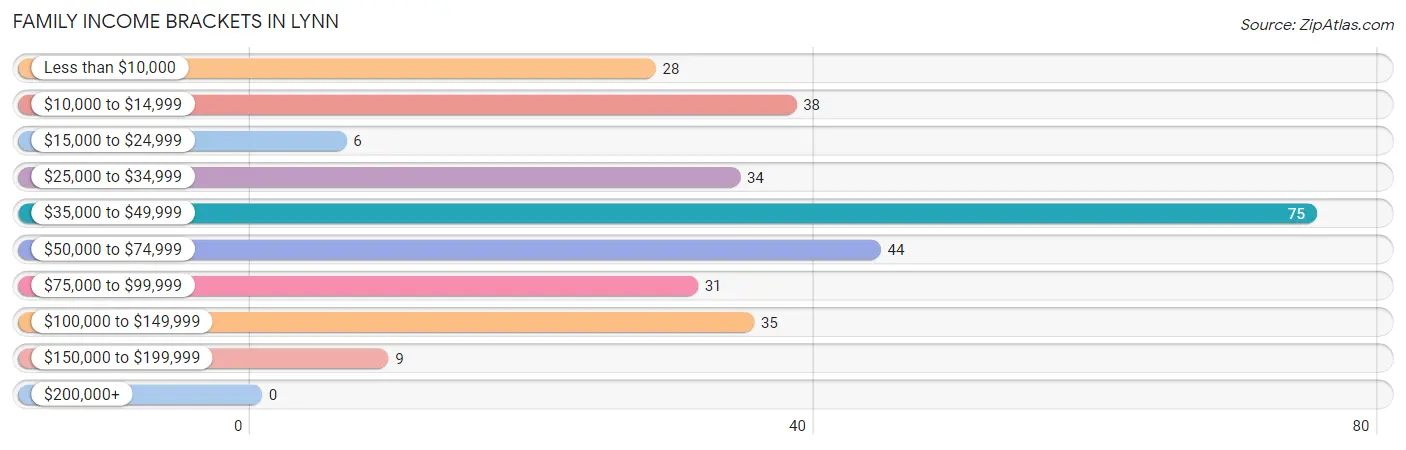
| Income Bracket | # Families | % Families |
| Less than $10,000 | 28 | 9.3% |
| $10,000 to $14,999 | 38 | 12.7% |
| $15,000 to $24,999 | 6 | 2.0% |
| $25,000 to $34,999 | 34 | 11.3% |
| $35,000 to $49,999 | 75 | 25.0% |
| $50,000 to $74,999 | 44 | 14.7% |
| $75,000 to $99,999 | 31 | 10.3% |
| $100,000 to $149,999 | 35 | 11.7% |
| $150,000 to $199,999 | 9 | 3.0% |
| $200,000+ | 0 | 0.0% |
Family Income by Famaliy Size in Lynn
3-person families (59 | 19.7%) account for the highest median family income in Lynn with $68,523 per family, while 3-person families (59 | 19.7%) have the highest median income of $22,841 per family member.
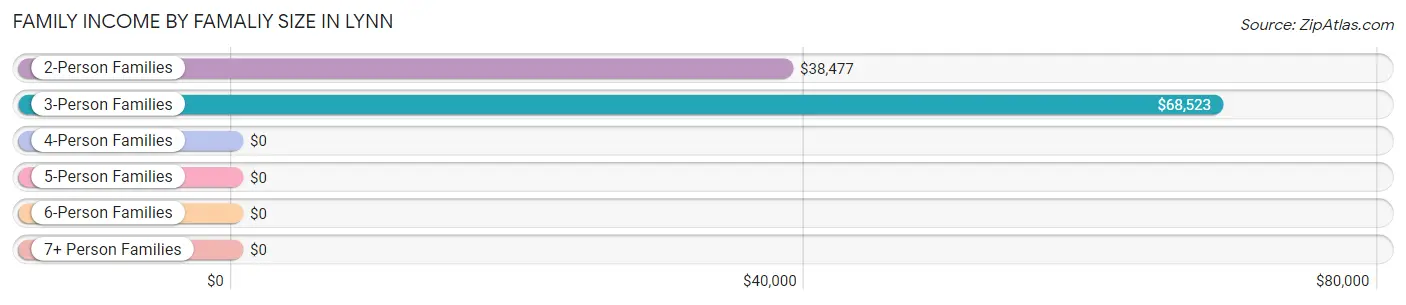
| Income Bracket | # Families | Median Income |
| 2-Person Families | 189 (63.0%) | $38,477 |
| 3-Person Families | 59 (19.7%) | $68,523 |
| 4-Person Families | 50 (16.7%) | $0 |
| 5-Person Families | 2 (0.7%) | $0 |
| 6-Person Families | 0 (0.0%) | $0 |
| 7+ Person Families | 0 (0.0%) | $0 |
| Total | 300 (100.0%) | $39,303 |
Family Income by Number of Earners in Lynn
The median family income in Lynn is $39,303, with families comprising 3+ earners (13) having the highest median family income of $89,688, while families with no earners (136) have the lowest median family income of $27,417, accounting for 4.3% and 45.3% of families, respectively.
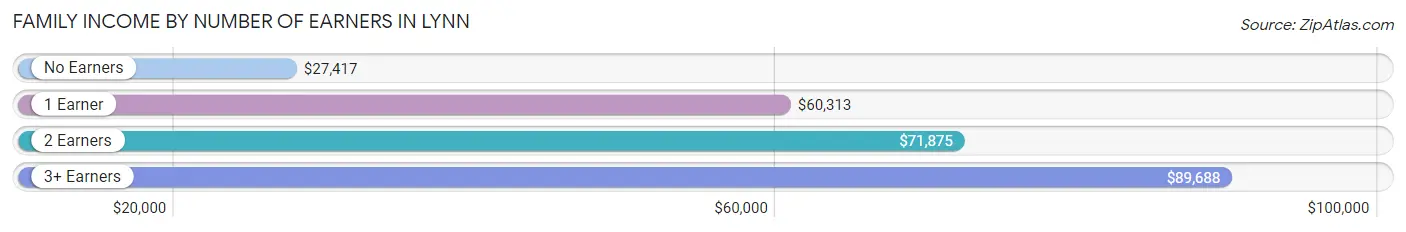
| Number of Earners | # Families | Median Income |
| No Earners | 136 (45.3%) | $27,417 |
| 1 Earner | 107 (35.7%) | $60,313 |
| 2 Earners | 44 (14.7%) | $71,875 |
| 3+ Earners | 13 (4.3%) | $89,688 |
| Total | 300 (100.0%) | $39,303 |
Household Income in Lynn
Household Income Brackets in Lynn
With 92 households falling in the category, the $35,000 to $49,999 income range is the most frequent in Lynn, accounting for 24.6% of all households.
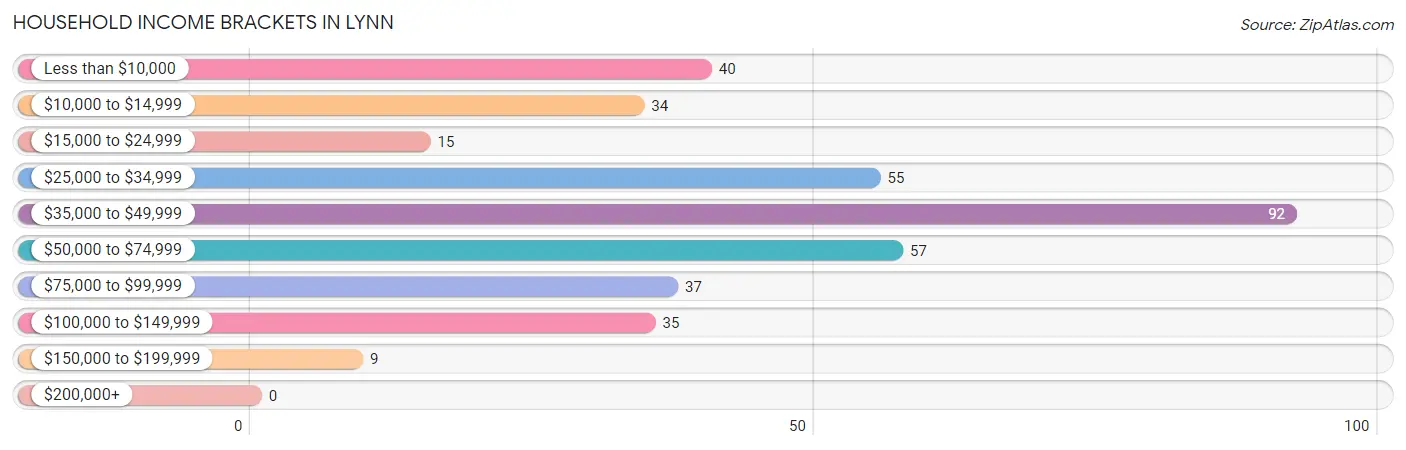
| Income Bracket | # Households | % Households |
| Less than $10,000 | 40 | 10.7% |
| $10,000 to $14,999 | 34 | 9.1% |
| $15,000 to $24,999 | 15 | 4.0% |
| $25,000 to $34,999 | 55 | 14.7% |
| $35,000 to $49,999 | 92 | 24.6% |
| $50,000 to $74,999 | 57 | 15.2% |
| $75,000 to $99,999 | 37 | 9.9% |
| $100,000 to $149,999 | 35 | 9.4% |
| $150,000 to $199,999 | 9 | 2.4% |
| $200,000+ | 0 | 0.0% |
Household Income by Householder Age in Lynn
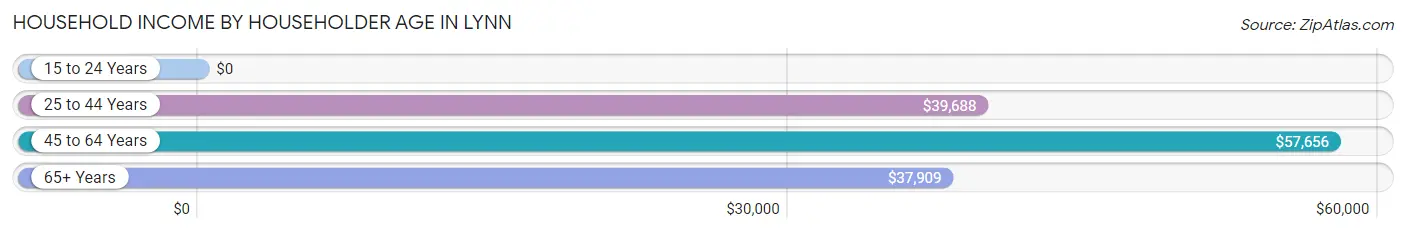
The median household income in Lynn is $38,934, with the highest median household income of $57,656 found in the 45 to 64 years age bracket for the primary householder. A total of 165 households (44.1%) fall into this category. Meanwhile, the 15 to 24 years age bracket for the primary householder has the lowest median household income of $0, with 2 households (0.5%) in this group.
| Income Bracket | # Households | Median Income |
| 15 to 24 Years | 2 (0.5%) | $0 |
| 25 to 44 Years | 73 (19.5%) | $39,688 |
| 45 to 64 Years | 165 (44.1%) | $57,656 |
| 65+ Years | 134 (35.8%) | $37,909 |
| Total | 374 (100.0%) | $38,934 |
Poverty in Lynn
Income Below Poverty by Sex and Age in Lynn
With 28.4% poverty level for males and 35.5% for females among the residents of Lynn, 16 and 17 year old males and 5 year old females are the most vulnerable to poverty, with 22 males (100.0%) and 11 females (100.0%) in their respective age groups living below the poverty level.
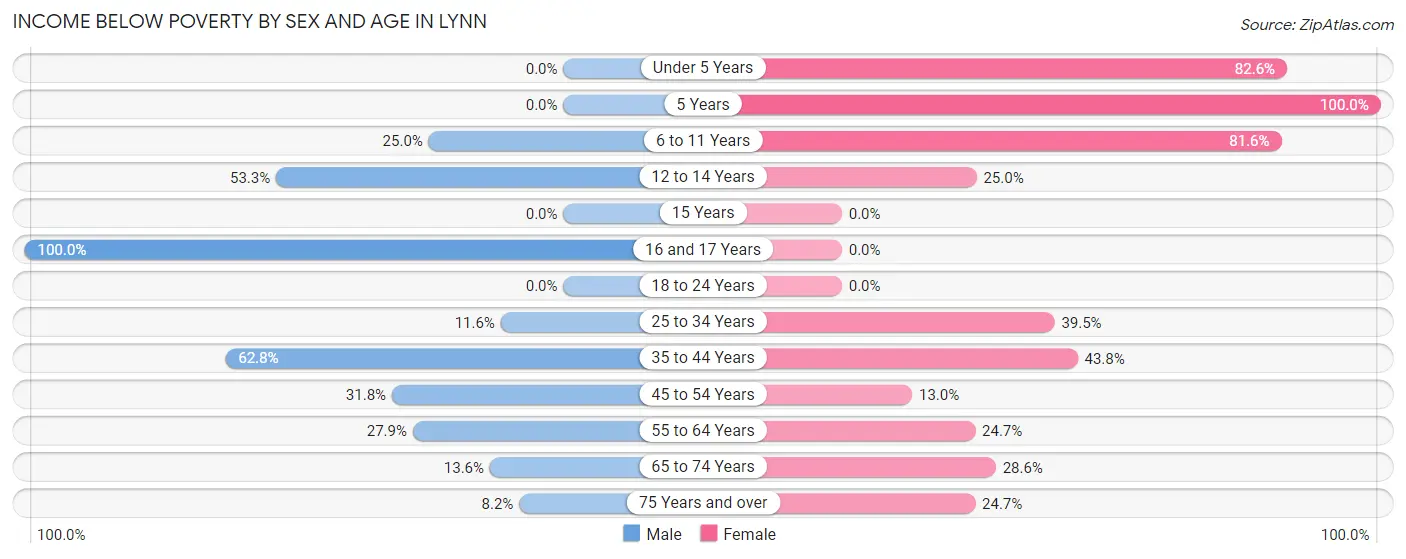
| Age Bracket | Male | Female |
| Under 5 Years | 0 (0.0%) | 19 (82.6%) |
| 5 Years | 0 (0.0%) | 11 (100.0%) |
| 6 to 11 Years | 4 (25.0%) | 31 (81.6%) |
| 12 to 14 Years | 8 (53.3%) | 9 (25.0%) |
| 15 Years | 0 (0.0%) | 0 (0.0%) |
| 16 and 17 Years | 22 (100.0%) | 0 (0.0%) |
| 18 to 24 Years | 0 (0.0%) | 0 (0.0%) |
| 25 to 34 Years | 5 (11.6%) | 15 (39.5%) |
| 35 to 44 Years | 32 (62.7%) | 21 (43.8%) |
| 45 to 54 Years | 21 (31.8%) | 6 (13.0%) |
| 55 to 64 Years | 19 (27.9%) | 24 (24.7%) |
| 65 to 74 Years | 9 (13.6%) | 6 (28.6%) |
| 75 Years and over | 5 (8.2%) | 24 (24.7%) |
| Total | 125 (28.4%) | 166 (35.5%) |
Income Above Poverty by Sex and Age in Lynn
According to the poverty statistics in Lynn, males aged under 5 years and females aged 15 years are the age groups that are most secure financially, with 100.0% of males and 100.0% of females in these age groups living above the poverty line.
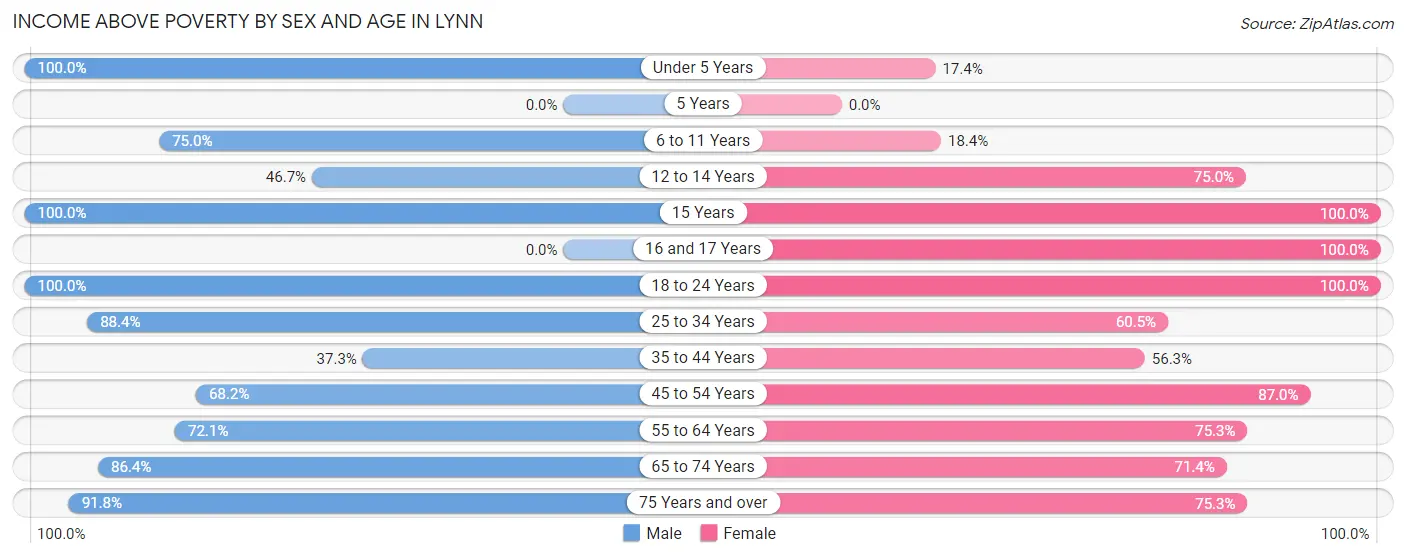
| Age Bracket | Male | Female |
| Under 5 Years | 14 (100.0%) | 4 (17.4%) |
| 5 Years | 0 (0.0%) | 0 (0.0%) |
| 6 to 11 Years | 12 (75.0%) | 7 (18.4%) |
| 12 to 14 Years | 7 (46.7%) | 27 (75.0%) |
| 15 Years | 4 (100.0%) | 4 (100.0%) |
| 16 and 17 Years | 0 (0.0%) | 7 (100.0%) |
| 18 to 24 Years | 14 (100.0%) | 2 (100.0%) |
| 25 to 34 Years | 38 (88.4%) | 23 (60.5%) |
| 35 to 44 Years | 19 (37.2%) | 27 (56.2%) |
| 45 to 54 Years | 45 (68.2%) | 40 (87.0%) |
| 55 to 64 Years | 49 (72.1%) | 73 (75.3%) |
| 65 to 74 Years | 57 (86.4%) | 15 (71.4%) |
| 75 Years and over | 56 (91.8%) | 73 (75.3%) |
| Total | 315 (71.6%) | 302 (64.5%) |
Income Below Poverty Among Married-Couple Families in Lynn
The poverty statistics for married-couple families in Lynn show that 12.1% or 25 of the total 207 families live below the poverty line. Families with no children have the highest poverty rate of 12.3%, comprising of 20 families. On the other hand, families with 1 or 2 children have the lowest poverty rate of 11.4%, which includes 5 families.
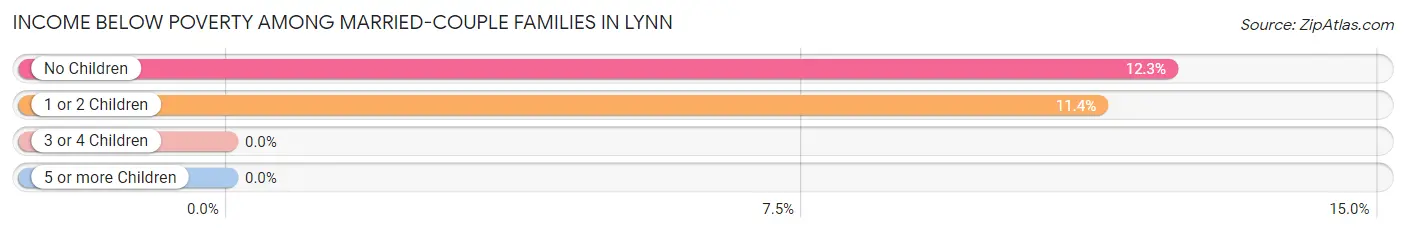
| Children | Above Poverty | Below Poverty |
| No Children | 143 (87.7%) | 20 (12.3%) |
| 1 or 2 Children | 39 (88.6%) | 5 (11.4%) |
| 3 or 4 Children | 0 (0.0%) | 0 (0.0%) |
| 5 or more Children | 0 (0.0%) | 0 (0.0%) |
| Total | 182 (87.9%) | 25 (12.1%) |
Income Below Poverty Among Single-Parent Households in Lynn
According to the poverty data in Lynn, 25.7% or 9 single-father households and 63.8% or 37 single-mother households are living below the poverty line. Among single-father households, those with 3 or 4 children have the highest poverty rate, with 9 households (100.0%) experiencing poverty. Likewise, among single-mother households, those with 3 or 4 children have the highest poverty rate, with 18 households (100.0%) falling below the poverty line.
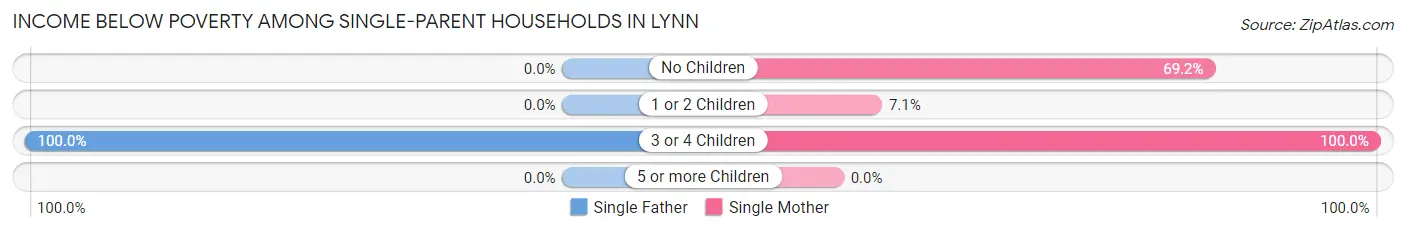
| Children | Single Father | Single Mother |
| No Children | 0 (0.0%) | 18 (69.2%) |
| 1 or 2 Children | 0 (0.0%) | 1 (7.1%) |
| 3 or 4 Children | 9 (100.0%) | 18 (100.0%) |
| 5 or more Children | 0 (0.0%) | 0 (0.0%) |
| Total | 9 (25.7%) | 37 (63.8%) |
Income Below Poverty Among Married-Couple vs Single-Parent Households in Lynn
The poverty data for Lynn shows that 25 of the married-couple family households (12.1%) and 46 of the single-parent households (49.5%) are living below the poverty level. Within the married-couple family households, those with no children have the highest poverty rate, with 20 households (12.3%) falling below the poverty line. Among the single-parent households, those with 3 or 4 children have the highest poverty rate, with 27 household (100.0%) living below poverty.
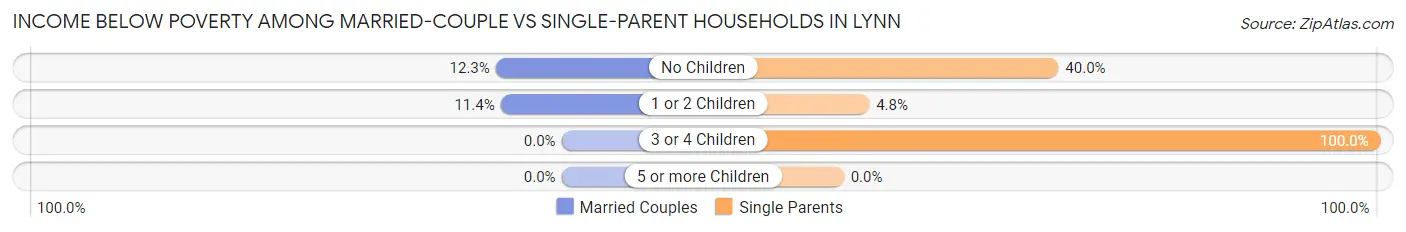
| Children | Married-Couple Families | Single-Parent Households |
| No Children | 20 (12.3%) | 18 (40.0%) |
| 1 or 2 Children | 5 (11.4%) | 1 (4.8%) |
| 3 or 4 Children | 0 (0.0%) | 27 (100.0%) |
| 5 or more Children | 0 (0.0%) | 0 (0.0%) |
| Total | 25 (12.1%) | 46 (49.5%) |
Race in Lynn
The most populous races in Lynn are White / Caucasian (898 | 98.9%), Two or more Races (10 | 1.1%), and Hispanic or Latino (4 | 0.4%).
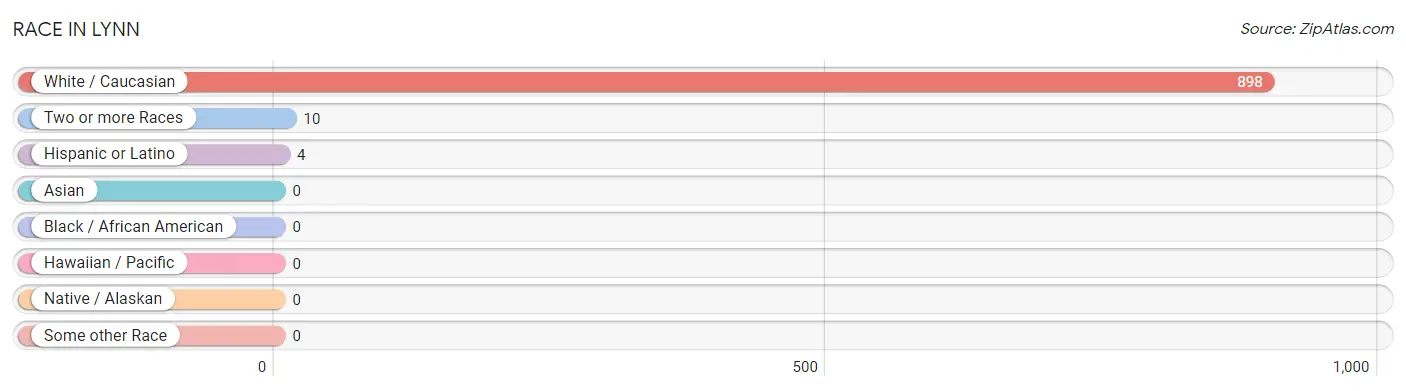
| Race | # Population | % Population |
| Asian | 0 | 0.0% |
| Black / African American | 0 | 0.0% |
| Hawaiian / Pacific | 0 | 0.0% |
| Hispanic or Latino | 4 | 0.4% |
| Native / Alaskan | 0 | 0.0% |
| White / Caucasian | 898 | 98.9% |
| Two or more Races | 10 | 1.1% |
| Some other Race | 0 | 0.0% |
| Total | 908 | 100.0% |
Ancestry in Lynn
The most populous ancestries reported in Lynn are American (141 | 15.5%), Irish (54 | 5.9%), English (45 | 5.0%), German (34 | 3.7%), and Scottish (16 | 1.8%), together accounting for 31.9% of all Lynn residents.
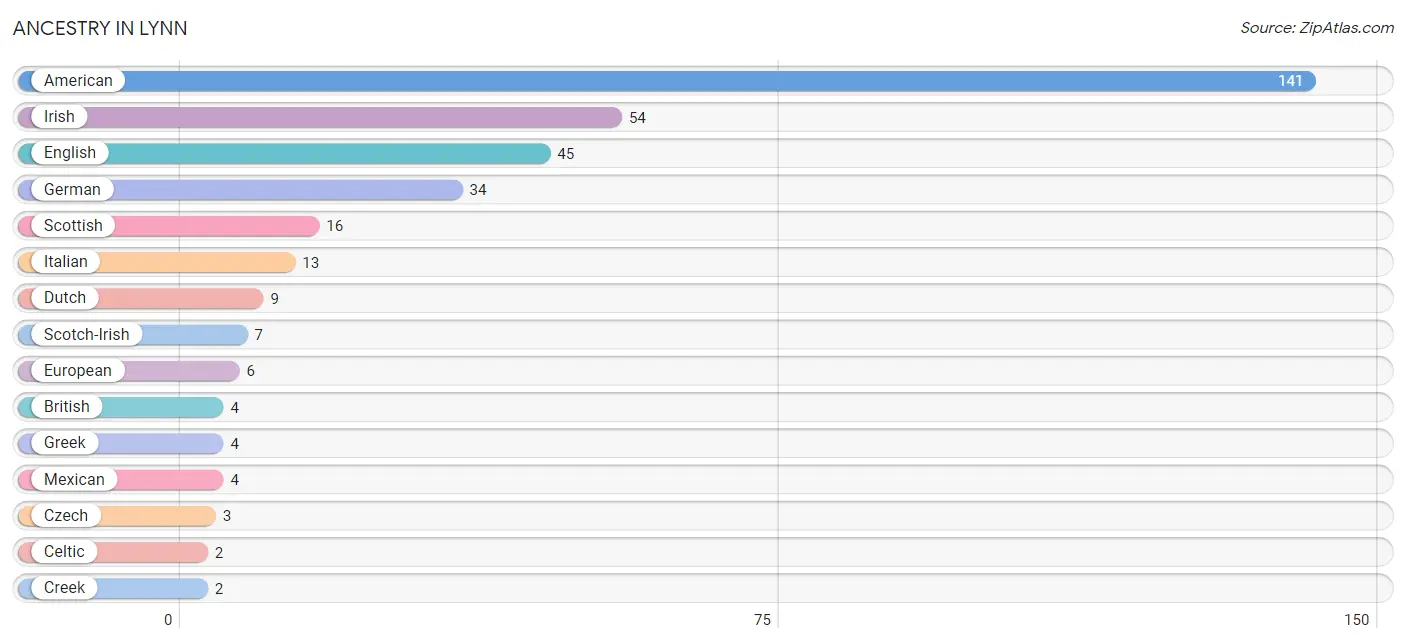
| Ancestry | # Population | % Population |
| American | 141 | 15.5% |
| British | 4 | 0.4% |
| Celtic | 2 | 0.2% |
| Creek | 2 | 0.2% |
| Czech | 3 | 0.3% |
| Dutch | 9 | 1.0% |
| English | 45 | 5.0% |
| European | 6 | 0.7% |
| German | 34 | 3.7% |
| Greek | 4 | 0.4% |
| Irish | 54 | 5.9% |
| Italian | 13 | 1.4% |
| Mexican | 4 | 0.4% |
| Scotch-Irish | 7 | 0.8% |
| Scottish | 16 | 1.8% |
| Swiss | 2 | 0.2% |
| Welsh | 2 | 0.2% | View All 17 Rows |
Immigrants in Lynn

| Immigration Origin | # Population | % Population | View All 0 Rows |
Sex and Age in Lynn
Sex and Age in Lynn
The most populous age groups in Lynn are 65 to 69 Years (55 | 12.5%) for men and 80 to 84 Years (66 | 14.1%) for women.
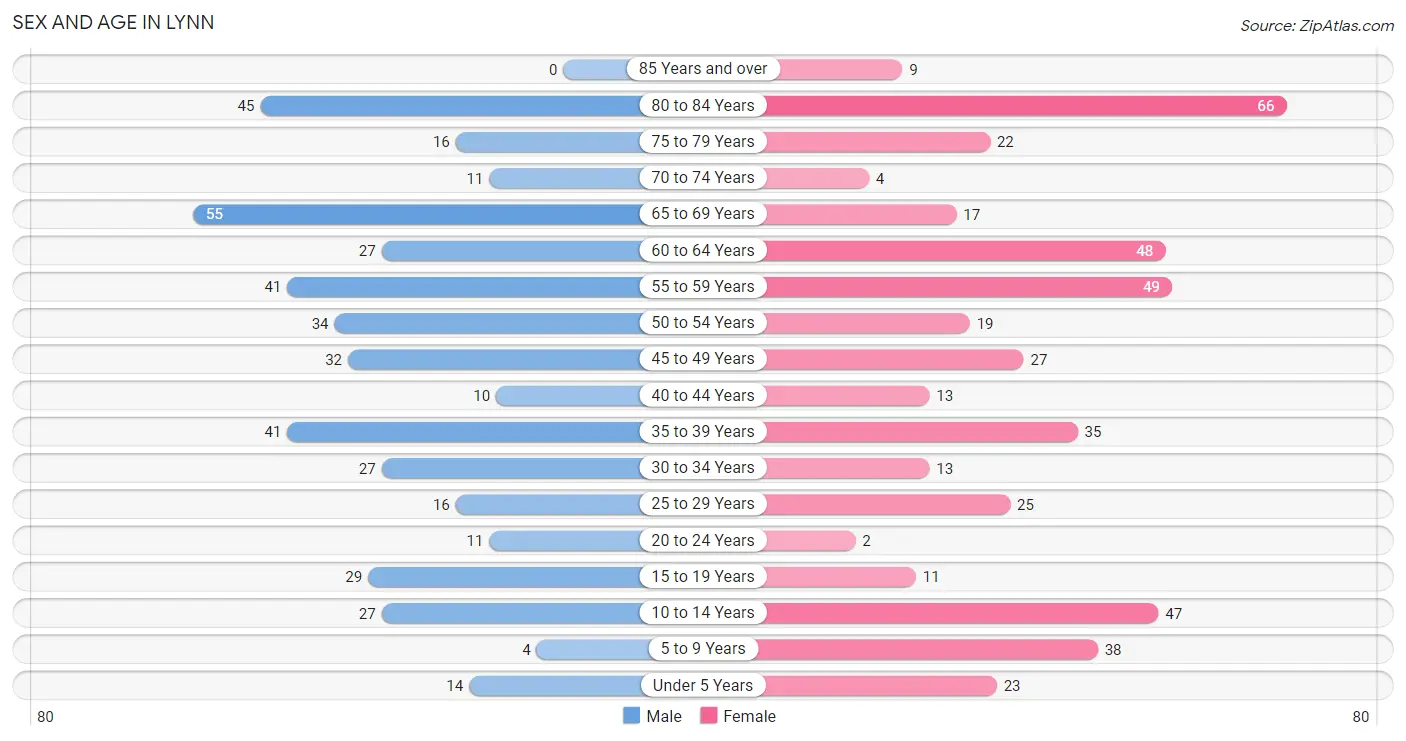
| Age Bracket | Male | Female |
| Under 5 Years | 14 (3.2%) | 23 (4.9%) |
| 5 to 9 Years | 4 (0.9%) | 38 (8.1%) |
| 10 to 14 Years | 27 (6.1%) | 47 (10.0%) |
| 15 to 19 Years | 29 (6.6%) | 11 (2.4%) |
| 20 to 24 Years | 11 (2.5%) | 2 (0.4%) |
| 25 to 29 Years | 16 (3.6%) | 25 (5.3%) |
| 30 to 34 Years | 27 (6.1%) | 13 (2.8%) |
| 35 to 39 Years | 41 (9.3%) | 35 (7.5%) |
| 40 to 44 Years | 10 (2.3%) | 13 (2.8%) |
| 45 to 49 Years | 32 (7.3%) | 27 (5.8%) |
| 50 to 54 Years | 34 (7.7%) | 19 (4.1%) |
| 55 to 59 Years | 41 (9.3%) | 49 (10.5%) |
| 60 to 64 Years | 27 (6.1%) | 48 (10.3%) |
| 65 to 69 Years | 55 (12.5%) | 17 (3.6%) |
| 70 to 74 Years | 11 (2.5%) | 4 (0.9%) |
| 75 to 79 Years | 16 (3.6%) | 22 (4.7%) |
| 80 to 84 Years | 45 (10.2%) | 66 (14.1%) |
| 85 Years and over | 0 (0.0%) | 9 (1.9%) |
| Total | 440 (100.0%) | 468 (100.0%) |
Families and Households in Lynn
Median Family Size in Lynn
The median family size in Lynn is 2.65 persons per family, with single female/mother families (58 | 19.3%) accounting for the largest median family size of 3.29 persons per family. On the other hand, married-couple families (207 | 69.0%) represent the smallest median family size with 2.45 persons per family.
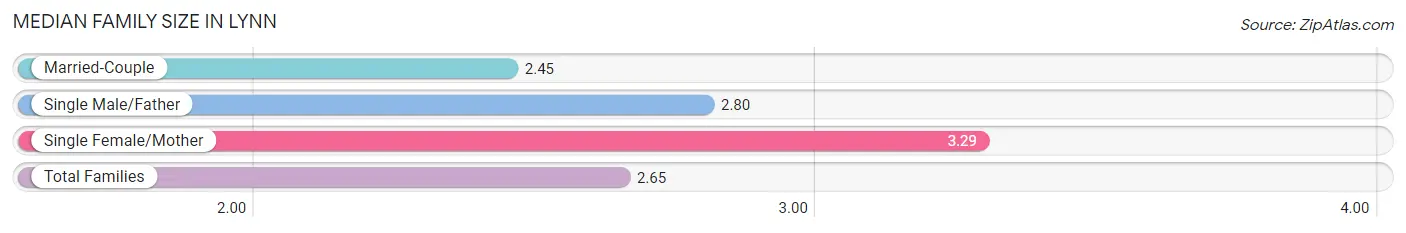
| Family Type | # Families | Family Size |
| Married-Couple | 207 (69.0%) | 2.45 |
| Single Male/Father | 35 (11.7%) | 2.80 |
| Single Female/Mother | 58 (19.3%) | 3.29 |
| Total Families | 300 (100.0%) | 2.65 |
Median Household Size in Lynn
The median household size in Lynn is 2.43 persons per household, with single female/mother households (58 | 15.5%) accounting for the largest median household size of 3.84 persons per household. non-family households (74 | 19.8%) represent the smallest median household size with 1.08 persons per household.
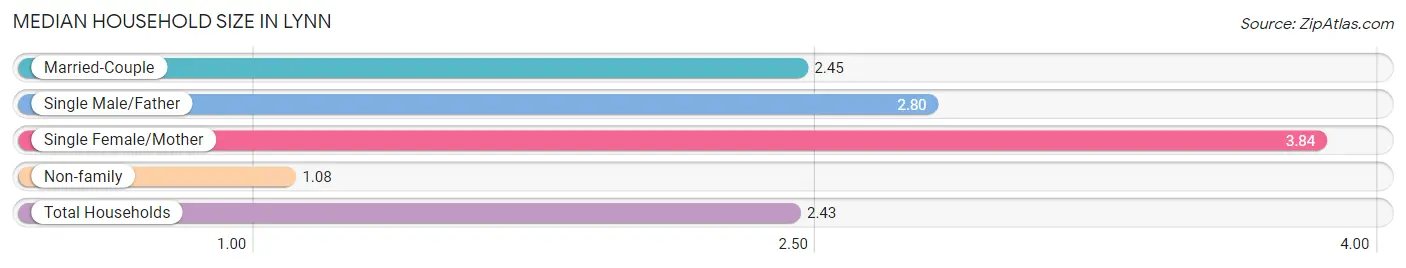
| Household Type | # Households | Household Size |
| Married-Couple | 207 (55.3%) | 2.45 |
| Single Male/Father | 35 (9.4%) | 2.80 |
| Single Female/Mother | 58 (15.5%) | 3.84 |
| Non-family | 74 (19.8%) | 1.08 |
| Total Households | 374 (100.0%) | 2.43 |
Household Size by Marriage Status in Lynn
Out of a total of 374 households in Lynn, 300 (80.2%) are family households, while 74 (19.8%) are nonfamily households. The most numerous type of family households are 2-person households, comprising 189, and the most common type of nonfamily households are 1-person households, comprising 70.
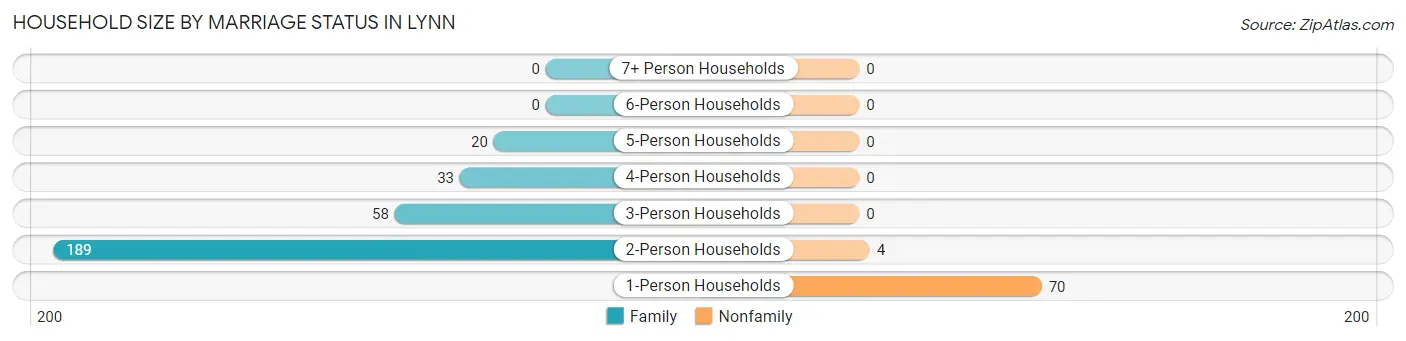
| Household Size | Family Households | Nonfamily Households |
| 1-Person Households | - | 70 (18.7%) |
| 2-Person Households | 189 (50.5%) | 4 (1.1%) |
| 3-Person Households | 58 (15.5%) | 0 (0.0%) |
| 4-Person Households | 33 (8.8%) | 0 (0.0%) |
| 5-Person Households | 20 (5.3%) | 0 (0.0%) |
| 6-Person Households | 0 (0.0%) | 0 (0.0%) |
| 7+ Person Households | 0 (0.0%) | 0 (0.0%) |
| Total | 300 (80.2%) | 74 (19.8%) |
Female Fertility in Lynn
Fertility by Age in Lynn
| Age Bracket | Women with Births | Births / 1,000 Women |
| 15 to 19 years | 0 (0.0%) | 0.0 |
| 20 to 34 years | 0 (0.0%) | 0.0 |
| 35 to 50 years | 0 (0.0%) | 0.0 |
| Total | 0 (0.0%) | 0.0 |
Fertility by Age by Marriage Status in Lynn
| Age Bracket | Married | Unmarried |
| 15 to 19 years | 0 (0.0%) | 0 (0.0%) |
| 20 to 34 years | 0 (0.0%) | 0 (0.0%) |
| 35 to 50 years | 0 (0.0%) | 0 (0.0%) |
| Total | 0 (0.0%) | 0 (0.0%) |
Fertility by Education in Lynn
| Educational Attainment | Women with Births | Births / 1,000 Women |
| Less than High School | 0 (0.0%) | 0.0 |
| High School Diploma | 0 (0.0%) | 0.0 |
| College or Associate's Degree | 0 (0.0%) | 0.0 |
| Bachelor's Degree | 0 (0.0%) | 0.0 |
| Graduate Degree | 0 (0.0%) | 0.0 |
| Total | 0 (0.0%) | 0.0 |
Fertility by Education by Marriage Status in Lynn
| Educational Attainment | Married | Unmarried |
| Less than High School | 0 (0.0%) | 0 (0.0%) |
| High School Diploma | 0 (0.0%) | 0 (0.0%) |
| College or Associate's Degree | 0 (0.0%) | 0 (0.0%) |
| Bachelor's Degree | 0 (0.0%) | 0 (0.0%) |
| Graduate Degree | 0 (0.0%) | 0 (0.0%) |
| Total | 0 (0.0%) | 0 (0.0%) |
Employment Characteristics in Lynn
Employment by Class of Employer in Lynn
Among the 283 employed individuals in Lynn, private company employees (206 | 72.8%), state government employees (24 | 8.5%), and unpaid family workers (15 | 5.3%) make up the most common classes of employment.
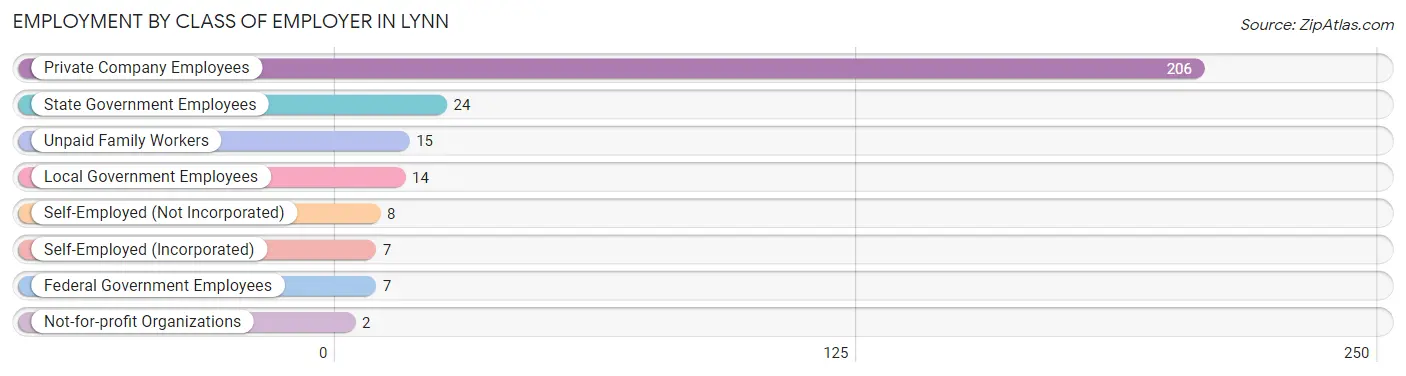
| Employer Class | # Employees | % Employees |
| Private Company Employees | 206 | 72.8% |
| Self-Employed (Incorporated) | 7 | 2.5% |
| Self-Employed (Not Incorporated) | 8 | 2.8% |
| Not-for-profit Organizations | 2 | 0.7% |
| Local Government Employees | 14 | 5.0% |
| State Government Employees | 24 | 8.5% |
| Federal Government Employees | 7 | 2.5% |
| Unpaid Family Workers | 15 | 5.3% |
| Total | 283 | 100.0% |
Employment Status by Age in Lynn
According to the labor force statistics for Lynn, out of the total population over 16 years of age (747), 40.0% or 299 individuals are in the labor force, with 3.3% or 10 of them unemployed. The age group with the highest labor force participation rate is 20 to 24 years, with 100.0% or 13 individuals in the labor force. Within the labor force, the 25 to 29 years age range has the highest percentage of unemployed individuals, with 16.0% or 4 of them being unemployed.
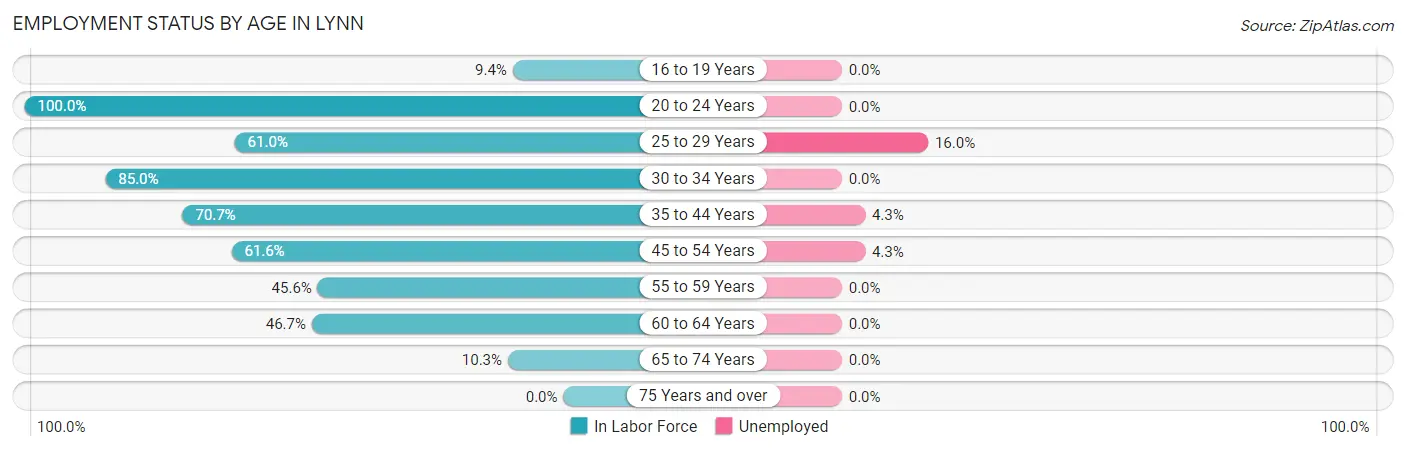
| Age Bracket | In Labor Force | Unemployed |
| 16 to 19 Years | 3 (9.4%) | 0 (0.0%) |
| 20 to 24 Years | 13 (100.0%) | 0 (0.0%) |
| 25 to 29 Years | 25 (61.0%) | 4 (16.0%) |
| 30 to 34 Years | 34 (85.0%) | 0 (0.0%) |
| 35 to 44 Years | 70 (70.7%) | 3 (4.3%) |
| 45 to 54 Years | 69 (61.6%) | 3 (4.3%) |
| 55 to 59 Years | 41 (45.6%) | 0 (0.0%) |
| 60 to 64 Years | 35 (46.7%) | 0 (0.0%) |
| 65 to 74 Years | 9 (10.3%) | 0 (0.0%) |
| 75 Years and over | 0 (0.0%) | 0 (0.0%) |
| Total | 299 (40.0%) | 10 (3.3%) |
Employment Status by Educational Attainment in Lynn
According to labor force statistics for Lynn, 60.0% of individuals (274) out of the total population between 25 and 64 years of age (457) are in the labor force, with 3.6% or 10 of them being unemployed. The group with the highest labor force participation rate are those with the educational attainment of bachelor's degree or higher, with 88.4% or 38 individuals in the labor force. Within the labor force, individuals with high school diploma education have the highest percentage of unemployment, with 7.2% or 7 of them being unemployed.
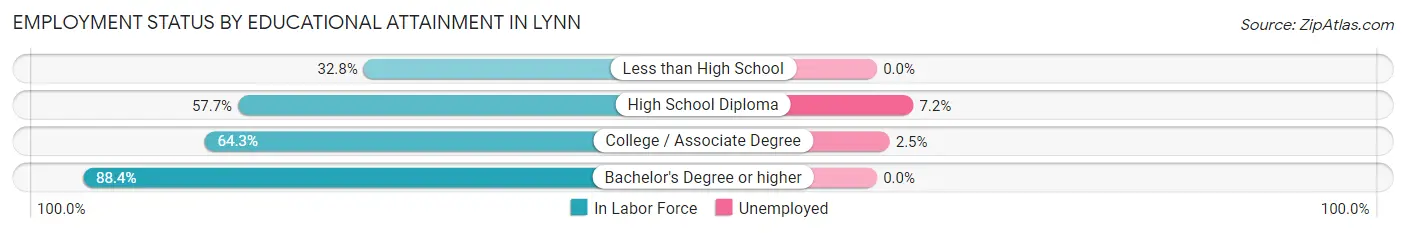
| Educational Attainment | In Labor Force | Unemployed |
| Less than High School | 20 (32.8%) | 0 (0.0%) |
| High School Diploma | 97 (57.7%) | 12 (7.2%) |
| College / Associate Degree | 119 (64.3%) | 5 (2.5%) |
| Bachelor's Degree or higher | 38 (88.4%) | 0 (0.0%) |
| Total | 274 (60.0%) | 16 (3.6%) |
Employment Occupations by Sex in Lynn
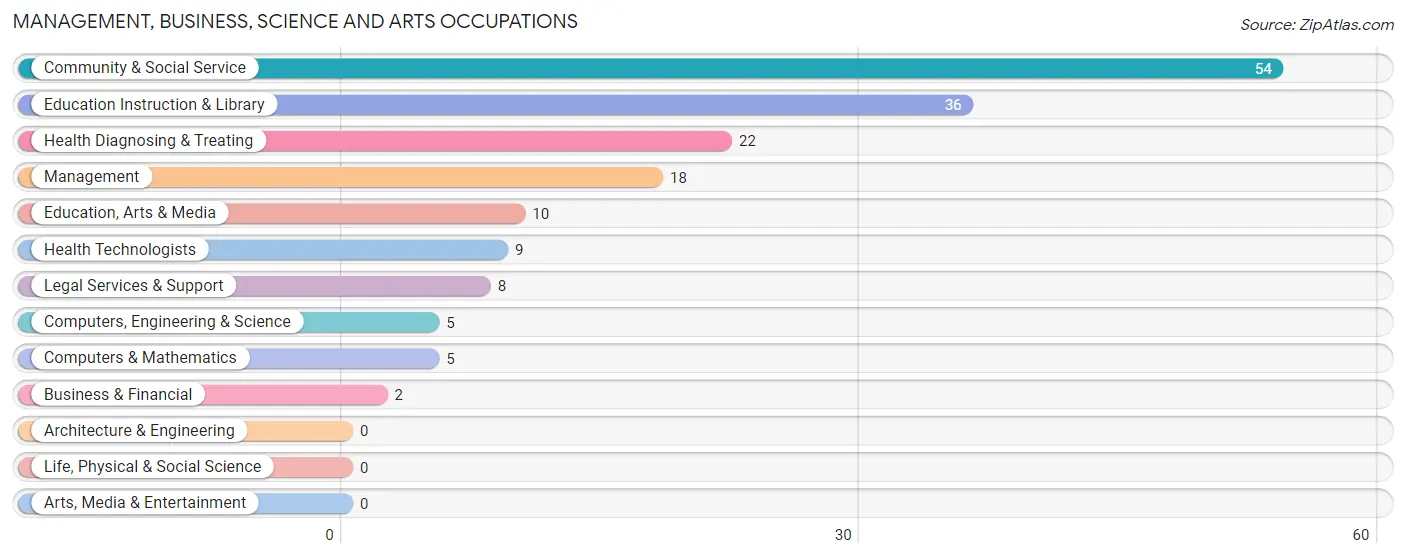
Management, Business, Science and Arts Occupations
The most common Management, Business, Science and Arts occupations in Lynn are Community & Social Service (54 | 18.7%), Education Instruction & Library (36 | 12.5%), Health Diagnosing & Treating (22 | 7.6%), Management (18 | 6.2%), and Education, Arts & Media (10 | 3.5%).
Management, Business, Science and Arts Occupations by Sex
Within the Management, Business, Science and Arts occupations in Lynn, the most male-oriented occupations are Computers, Engineering & Science (100.0%), Computers & Mathematics (100.0%), and Management (88.9%), while the most female-oriented occupations are Business & Financial (100.0%), Education, Arts & Media (100.0%), and Legal Services & Support (100.0%).
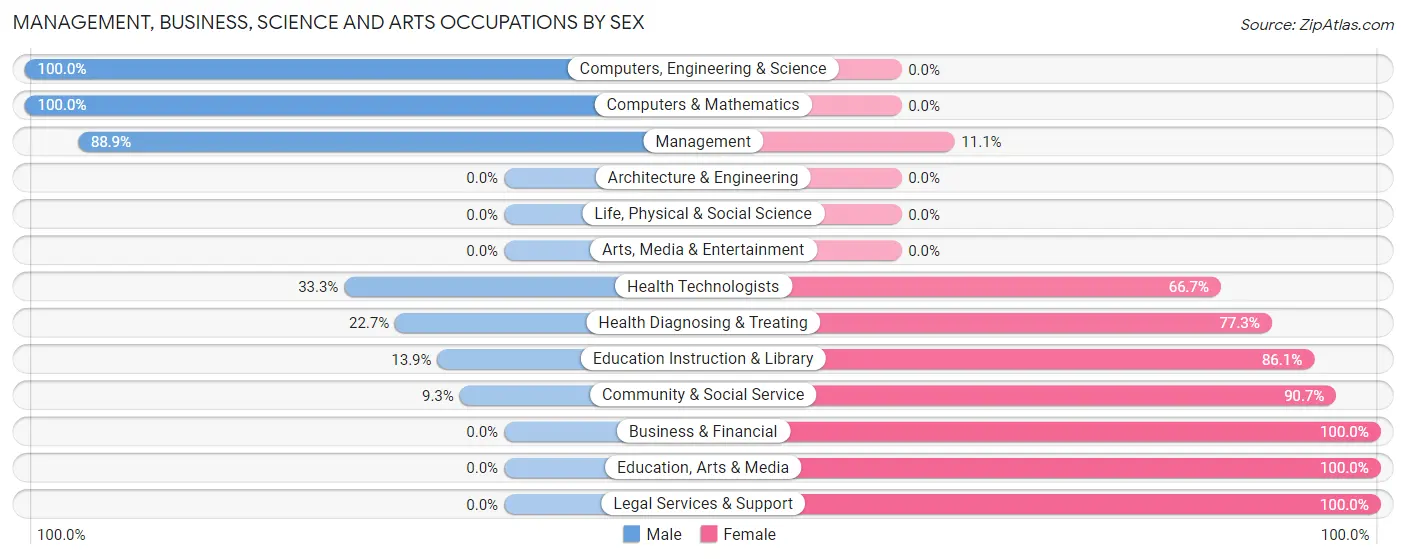
| Occupation | Male | Female |
| Management | 16 (88.9%) | 2 (11.1%) |
| Business & Financial | 0 (0.0%) | 2 (100.0%) |
| Computers, Engineering & Science | 5 (100.0%) | 0 (0.0%) |
| Computers & Mathematics | 5 (100.0%) | 0 (0.0%) |
| Architecture & Engineering | 0 (0.0%) | 0 (0.0%) |
| Life, Physical & Social Science | 0 (0.0%) | 0 (0.0%) |
| Community & Social Service | 5 (9.3%) | 49 (90.7%) |
| Education, Arts & Media | 0 (0.0%) | 10 (100.0%) |
| Legal Services & Support | 0 (0.0%) | 8 (100.0%) |
| Education Instruction & Library | 5 (13.9%) | 31 (86.1%) |
| Arts, Media & Entertainment | 0 (0.0%) | 0 (0.0%) |
| Health Diagnosing & Treating | 5 (22.7%) | 17 (77.3%) |
| Health Technologists | 3 (33.3%) | 6 (66.7%) |
| Total (Category) | 31 (30.7%) | 70 (69.3%) |
| Total (Overall) | 197 (68.2%) | 92 (31.8%) |
Services Occupations
The most common Services occupations in Lynn are Security & Protection (10 | 3.5%), Law Enforcement (10 | 3.5%), Cleaning & Maintenance (5 | 1.7%), and Food Preparation & Serving (1 | 0.4%).
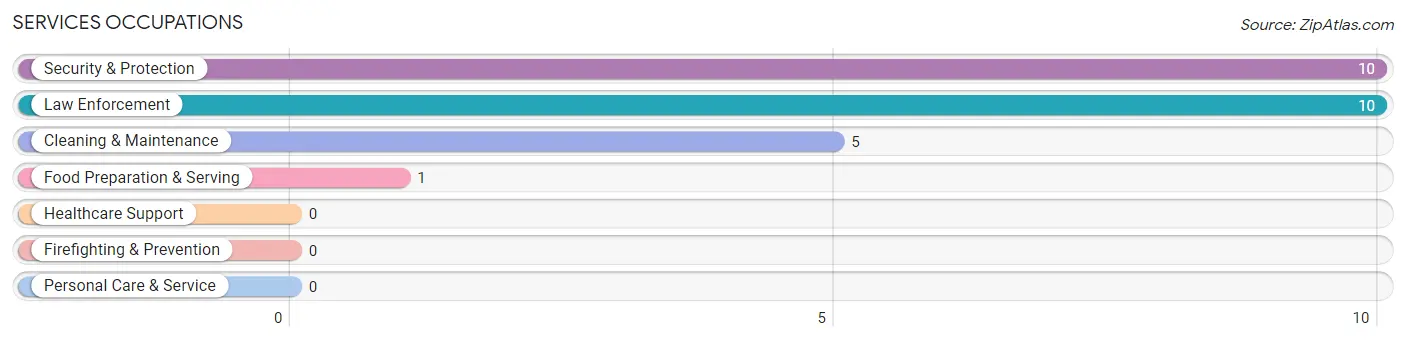
Services Occupations by Sex
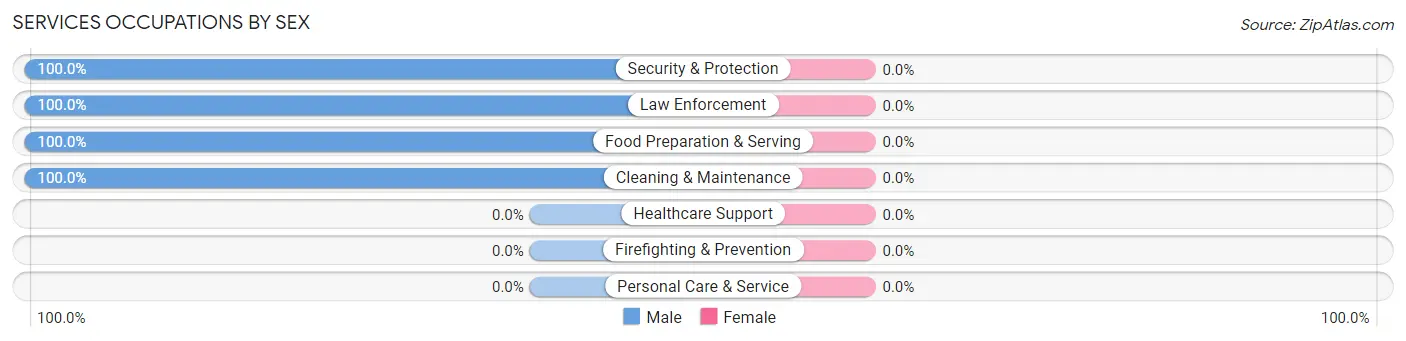
| Occupation | Male | Female |
| Healthcare Support | 0 (0.0%) | 0 (0.0%) |
| Security & Protection | 10 (100.0%) | 0 (0.0%) |
| Firefighting & Prevention | 0 (0.0%) | 0 (0.0%) |
| Law Enforcement | 10 (100.0%) | 0 (0.0%) |
| Food Preparation & Serving | 1 (100.0%) | 0 (0.0%) |
| Cleaning & Maintenance | 5 (100.0%) | 0 (0.0%) |
| Personal Care & Service | 0 (0.0%) | 0 (0.0%) |
| Total (Category) | 16 (100.0%) | 0 (0.0%) |
| Total (Overall) | 197 (68.2%) | 92 (31.8%) |
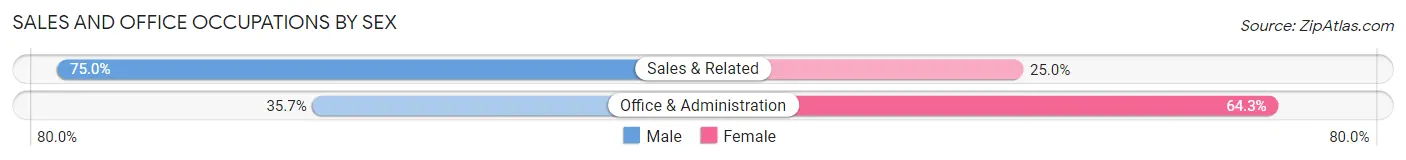
Sales and Office Occupations
The most common Sales and Office occupations in Lynn are Office & Administration (14 | 4.8%), and Sales & Related (8 | 2.8%).
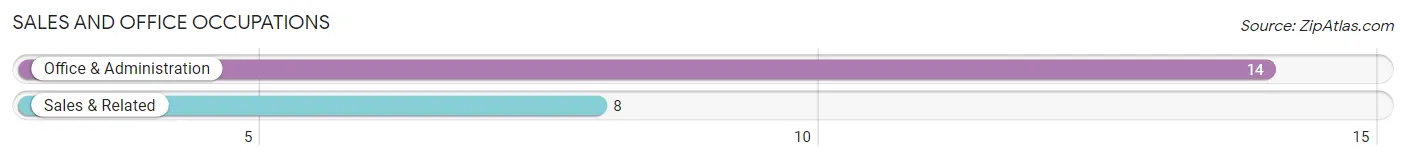
Sales and Office Occupations by Sex
| Occupation | Male | Female |
| Sales & Related | 6 (75.0%) | 2 (25.0%) |
| Office & Administration | 5 (35.7%) | 9 (64.3%) |
| Total (Category) | 11 (50.0%) | 11 (50.0%) |
| Total (Overall) | 197 (68.2%) | 92 (31.8%) |
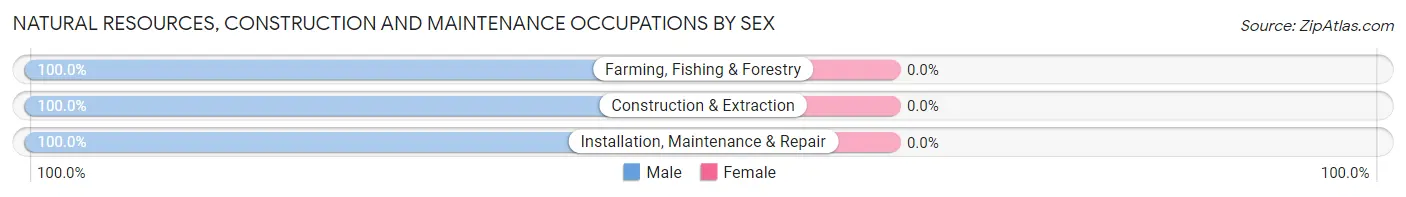
Natural Resources, Construction and Maintenance Occupations
The most common Natural Resources, Construction and Maintenance occupations in Lynn are Construction & Extraction (60 | 20.8%), Installation, Maintenance & Repair (15 | 5.2%), and Farming, Fishing & Forestry (2 | 0.7%).

Natural Resources, Construction and Maintenance Occupations by Sex
| Occupation | Male | Female |
| Farming, Fishing & Forestry | 2 (100.0%) | 0 (0.0%) |
| Construction & Extraction | 60 (100.0%) | 0 (0.0%) |
| Installation, Maintenance & Repair | 15 (100.0%) | 0 (0.0%) |
| Total (Category) | 77 (100.0%) | 0 (0.0%) |
| Total (Overall) | 197 (68.2%) | 92 (31.8%) |
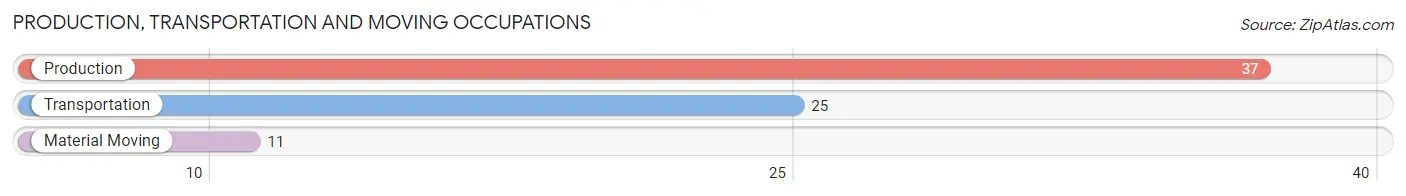
Production, Transportation and Moving Occupations
The most common Production, Transportation and Moving occupations in Lynn are Production (37 | 12.8%), Transportation (25 | 8.6%), and Material Moving (11 | 3.8%).
Production, Transportation and Moving Occupations by Sex
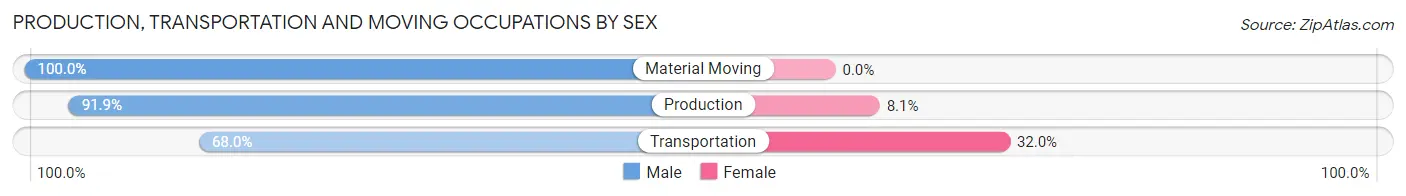
| Occupation | Male | Female |
| Production | 34 (91.9%) | 3 (8.1%) |
| Transportation | 17 (68.0%) | 8 (32.0%) |
| Material Moving | 11 (100.0%) | 0 (0.0%) |
| Total (Category) | 62 (84.9%) | 11 (15.1%) |
| Total (Overall) | 197 (68.2%) | 92 (31.8%) |
Employment Industries by Sex in Lynn
Employment Industries in Lynn
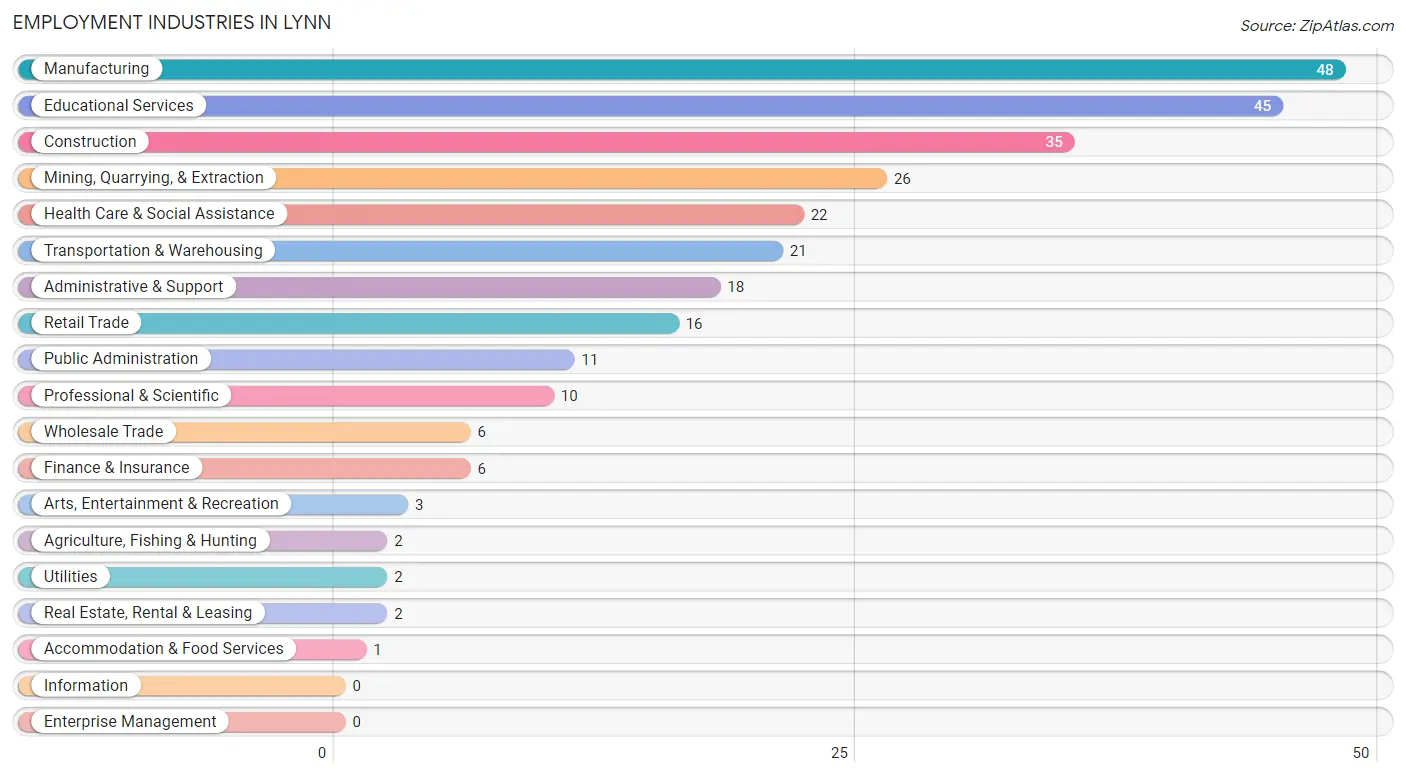
The major employment industries in Lynn include Manufacturing (48 | 16.6%), Educational Services (45 | 15.6%), Construction (35 | 12.1%), Mining, Quarrying, & Extraction (26 | 9.0%), and Health Care & Social Assistance (22 | 7.6%).
Employment Industries by Sex in Lynn
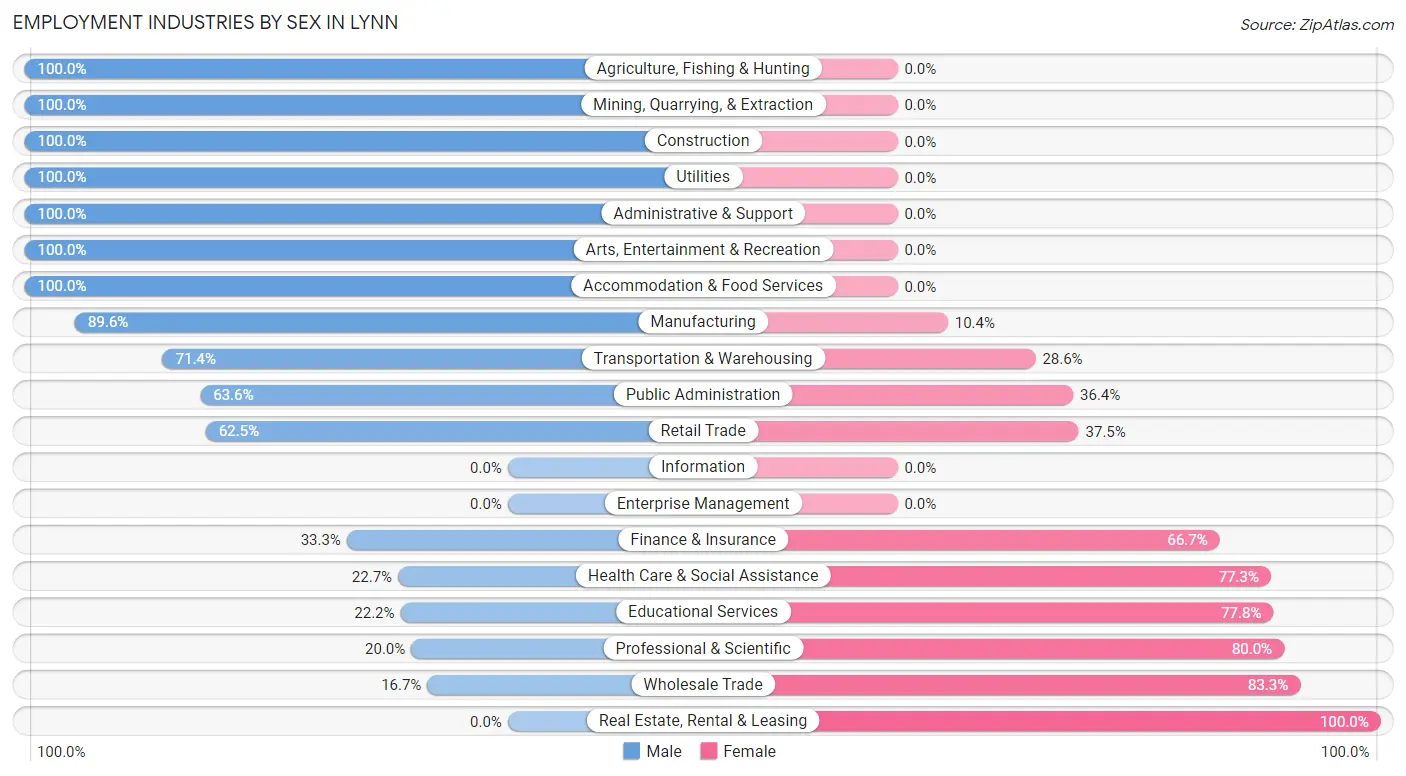
The Lynn industries that see more men than women are Agriculture, Fishing & Hunting (100.0%), Mining, Quarrying, & Extraction (100.0%), and Construction (100.0%), whereas the industries that tend to have a higher number of women are Real Estate, Rental & Leasing (100.0%), Wholesale Trade (83.3%), and Professional & Scientific (80.0%).
| Industry | Male | Female |
| Agriculture, Fishing & Hunting | 2 (100.0%) | 0 (0.0%) |
| Mining, Quarrying, & Extraction | 26 (100.0%) | 0 (0.0%) |
| Construction | 35 (100.0%) | 0 (0.0%) |
| Manufacturing | 43 (89.6%) | 5 (10.4%) |
| Wholesale Trade | 1 (16.7%) | 5 (83.3%) |
| Retail Trade | 10 (62.5%) | 6 (37.5%) |
| Transportation & Warehousing | 15 (71.4%) | 6 (28.6%) |
| Utilities | 2 (100.0%) | 0 (0.0%) |
| Information | 0 (0.0%) | 0 (0.0%) |
| Finance & Insurance | 2 (33.3%) | 4 (66.7%) |
| Real Estate, Rental & Leasing | 0 (0.0%) | 2 (100.0%) |
| Professional & Scientific | 2 (20.0%) | 8 (80.0%) |
| Enterprise Management | 0 (0.0%) | 0 (0.0%) |
| Administrative & Support | 18 (100.0%) | 0 (0.0%) |
| Educational Services | 10 (22.2%) | 35 (77.8%) |
| Health Care & Social Assistance | 5 (22.7%) | 17 (77.3%) |
| Arts, Entertainment & Recreation | 3 (100.0%) | 0 (0.0%) |
| Accommodation & Food Services | 1 (100.0%) | 0 (0.0%) |
| Public Administration | 7 (63.6%) | 4 (36.4%) |
| Total | 197 (68.2%) | 92 (31.8%) |
Education in Lynn
School Enrollment in Lynn
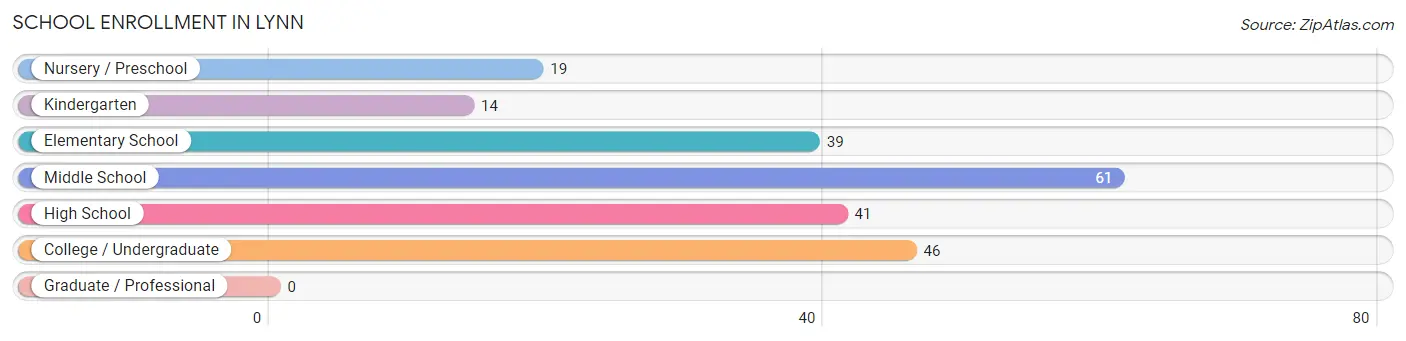
The most common levels of schooling among the 220 students in Lynn are middle school (61 | 27.7%), college / undergraduate (46 | 20.9%), and high school (41 | 18.6%).
| School Level | # Students | % Students |
| Nursery / Preschool | 19 | 8.6% |
| Kindergarten | 14 | 6.4% |
| Elementary School | 39 | 17.7% |
| Middle School | 61 | 27.7% |
| High School | 41 | 18.6% |
| College / Undergraduate | 46 | 20.9% |
| Graduate / Professional | 0 | 0.0% |
| Total | 220 | 100.0% |
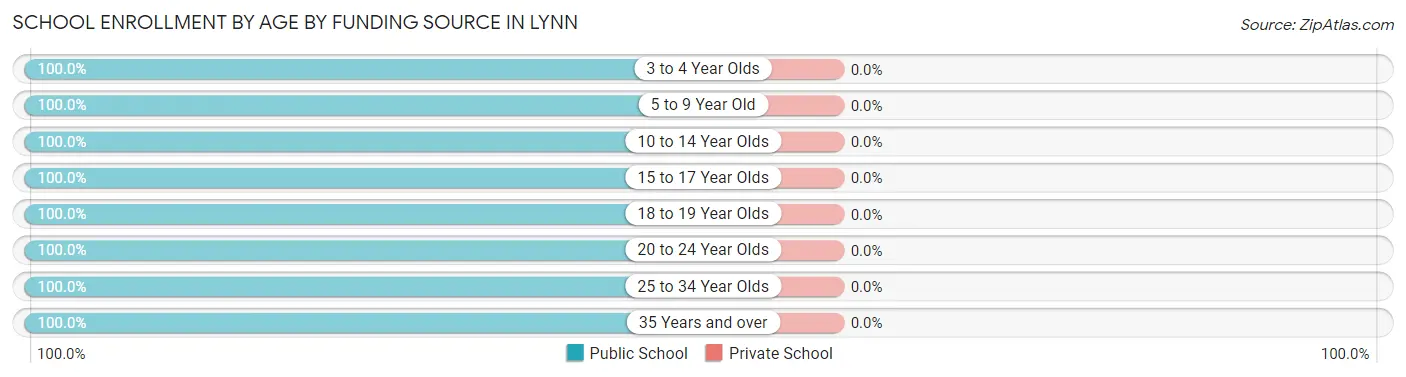
School Enrollment by Age by Funding Source in Lynn
| Age Bracket | Public School | Private School |
| 3 to 4 Year Olds | 19 (100.0%) | 0 (0.0%) |
| 5 to 9 Year Old | 42 (100.0%) | 0 (0.0%) |
| 10 to 14 Year Olds | 74 (100.0%) | 0 (0.0%) |
| 15 to 17 Year Olds | 37 (100.0%) | 0 (0.0%) |
| 18 to 19 Year Olds | 2 (100.0%) | 0 (0.0%) |
| 20 to 24 Year Olds | 7 (100.0%) | 0 (0.0%) |
| 25 to 34 Year Olds | 10 (100.0%) | 0 (0.0%) |
| 35 Years and over | 29 (100.0%) | 0 (0.0%) |
| Total | 220 (100.0%) | 0 (0.0%) |
Educational Attainment by Field of Study in Lynn
Business (18 | 28.1%), education (15 | 23.4%), science & technology (10 | 15.6%), psychology (5 | 7.8%), and communications (5 | 7.8%) are the most common fields of study among 64 individuals in Lynn who have obtained a bachelor's degree or higher.
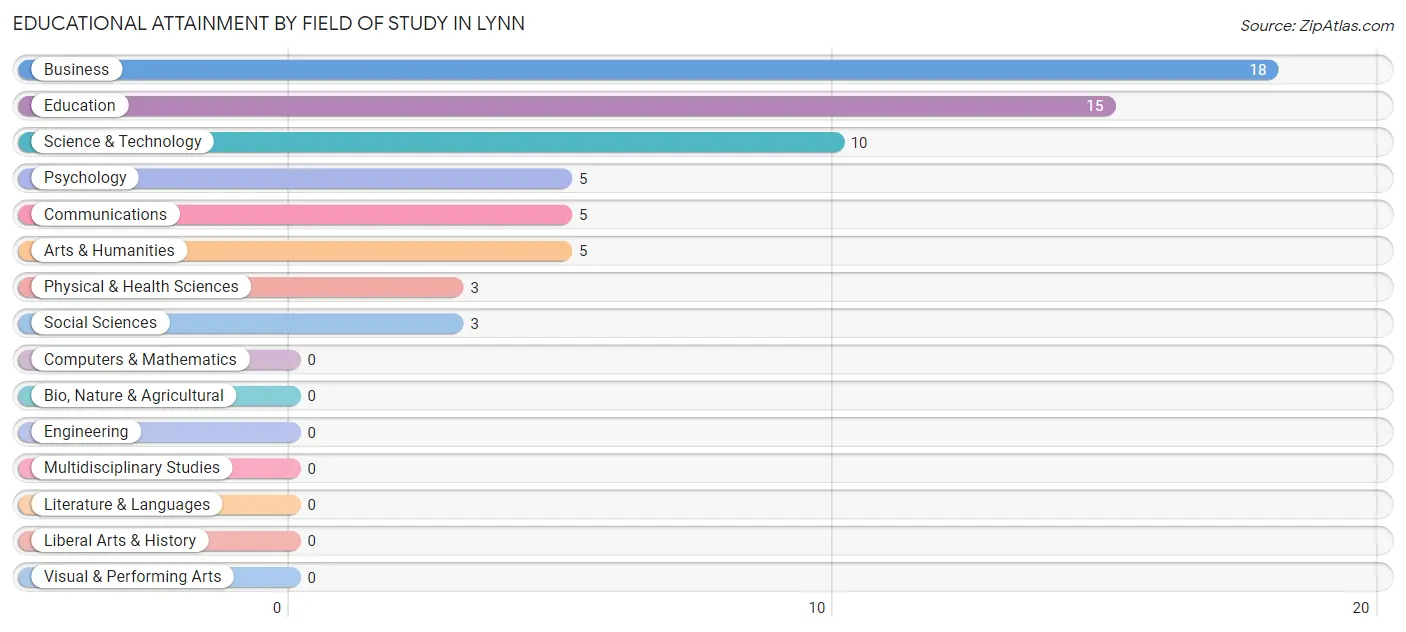
| Field of Study | # Graduates | % Graduates |
| Computers & Mathematics | 0 | 0.0% |
| Bio, Nature & Agricultural | 0 | 0.0% |
| Physical & Health Sciences | 3 | 4.7% |
| Psychology | 5 | 7.8% |
| Social Sciences | 3 | 4.7% |
| Engineering | 0 | 0.0% |
| Multidisciplinary Studies | 0 | 0.0% |
| Science & Technology | 10 | 15.6% |
| Business | 18 | 28.1% |
| Education | 15 | 23.4% |
| Literature & Languages | 0 | 0.0% |
| Liberal Arts & History | 0 | 0.0% |
| Visual & Performing Arts | 0 | 0.0% |
| Communications | 5 | 7.8% |
| Arts & Humanities | 5 | 7.8% |
| Total | 64 | 100.0% |
Transportation & Commute in Lynn
Vehicle Availability by Sex in Lynn
The most prevalent vehicle ownership categories in Lynn are males with 3 vehicles (100, accounting for 51.0%) and females with 3 vehicles (35, making up 114.9%).
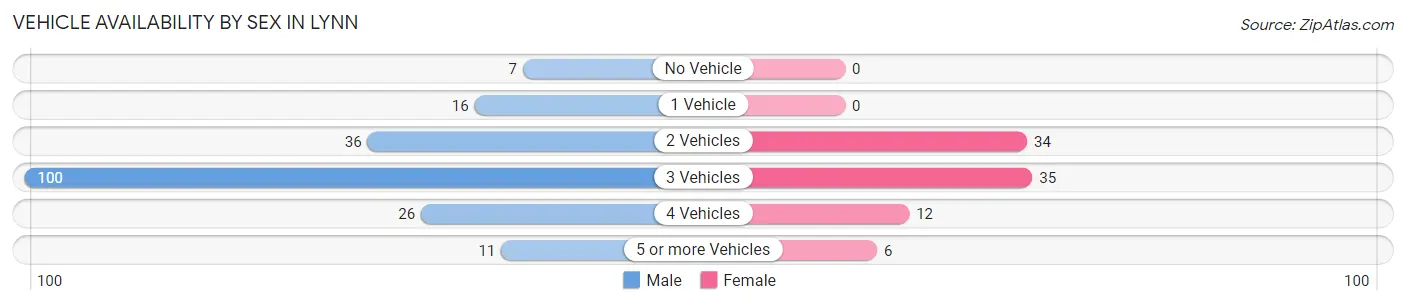
| Vehicles Available | Male | Female |
| No Vehicle | 7 (3.6%) | 0 (0.0%) |
| 1 Vehicle | 16 (8.2%) | 0 (0.0%) |
| 2 Vehicles | 36 (18.4%) | 34 (39.1%) |
| 3 Vehicles | 100 (51.0%) | 35 (40.2%) |
| 4 Vehicles | 26 (13.3%) | 12 (13.8%) |
| 5 or more Vehicles | 11 (5.6%) | 6 (6.9%) |
| Total | 196 (100.0%) | 87 (100.0%) |
Commute Time in Lynn
The most frequently occuring commute durations in Lynn are 5 to 9 minutes (57 commuters, 20.7%), 30 to 34 minutes (42 commuters, 15.3%), and 10 to 14 minutes (39 commuters, 14.2%).
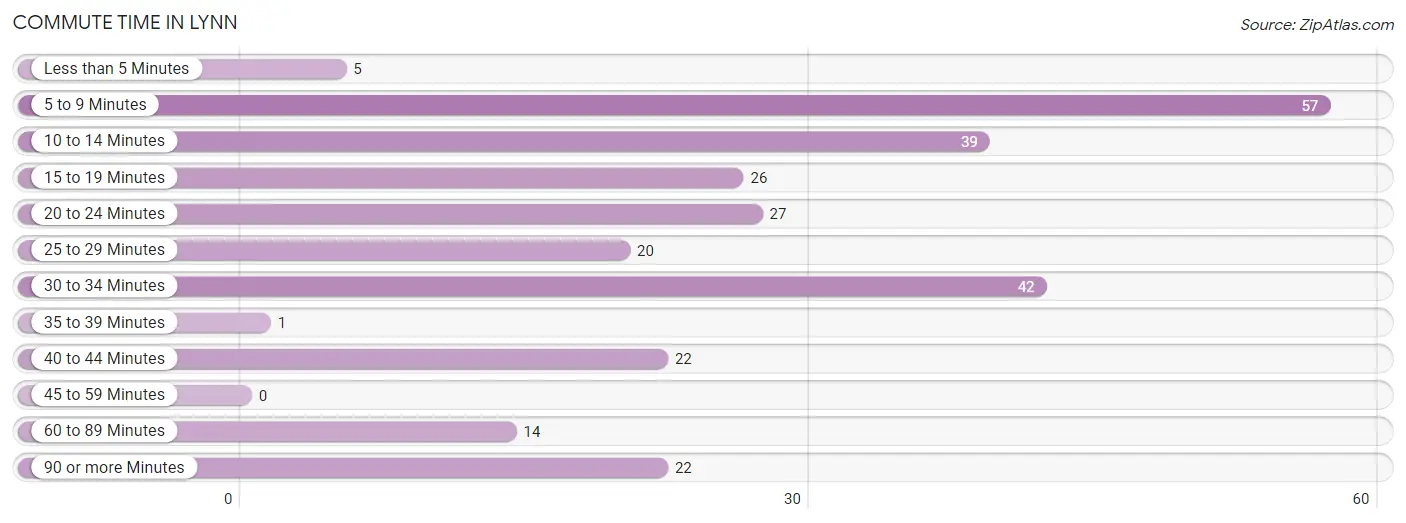
| Commute Time | # Commuters | % Commuters |
| Less than 5 Minutes | 5 | 1.8% |
| 5 to 9 Minutes | 57 | 20.7% |
| 10 to 14 Minutes | 39 | 14.2% |
| 15 to 19 Minutes | 26 | 9.5% |
| 20 to 24 Minutes | 27 | 9.8% |
| 25 to 29 Minutes | 20 | 7.3% |
| 30 to 34 Minutes | 42 | 15.3% |
| 35 to 39 Minutes | 1 | 0.4% |
| 40 to 44 Minutes | 22 | 8.0% |
| 45 to 59 Minutes | 0 | 0.0% |
| 60 to 89 Minutes | 14 | 5.1% |
| 90 or more Minutes | 22 | 8.0% |
Commute Time by Sex in Lynn
The most common commute times in Lynn are 10 to 14 minutes (35 commuters, 18.6%) for males and 5 to 9 minutes (26 commuters, 29.9%) for females.
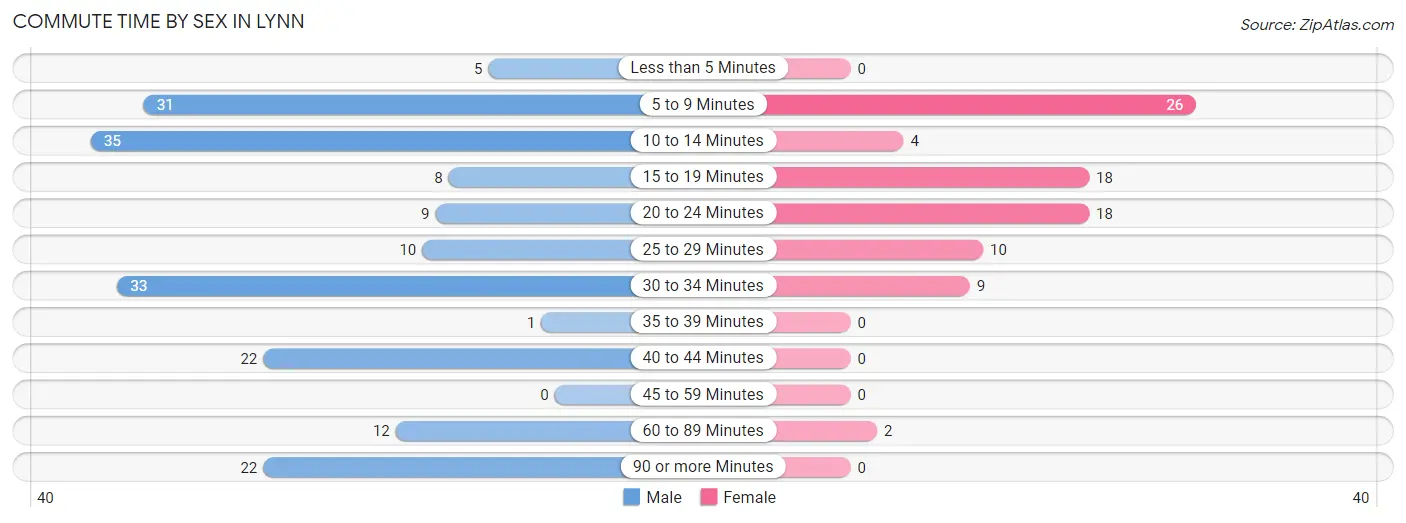
| Commute Time | Male | Female |
| Less than 5 Minutes | 5 (2.7%) | 0 (0.0%) |
| 5 to 9 Minutes | 31 (16.5%) | 26 (29.9%) |
| 10 to 14 Minutes | 35 (18.6%) | 4 (4.6%) |
| 15 to 19 Minutes | 8 (4.3%) | 18 (20.7%) |
| 20 to 24 Minutes | 9 (4.8%) | 18 (20.7%) |
| 25 to 29 Minutes | 10 (5.3%) | 10 (11.5%) |
| 30 to 34 Minutes | 33 (17.5%) | 9 (10.3%) |
| 35 to 39 Minutes | 1 (0.5%) | 0 (0.0%) |
| 40 to 44 Minutes | 22 (11.7%) | 0 (0.0%) |
| 45 to 59 Minutes | 0 (0.0%) | 0 (0.0%) |
| 60 to 89 Minutes | 12 (6.4%) | 2 (2.3%) |
| 90 or more Minutes | 22 (11.7%) | 0 (0.0%) |
Time of Departure to Work by Sex in Lynn
The most frequent times of departure to work in Lynn are 12:00 AM to 4:59 AM (46, 24.5%) for males and 6:30 AM to 6:59 AM (22, 25.3%) for females.
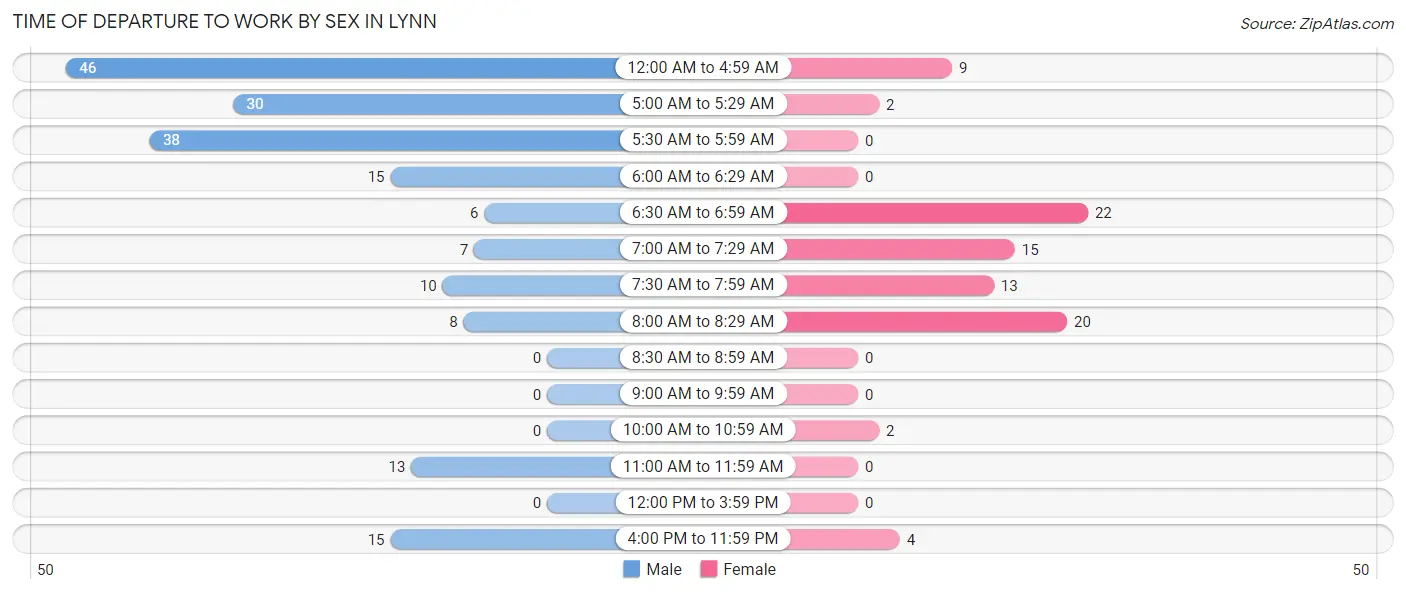
| Time of Departure | Male | Female |
| 12:00 AM to 4:59 AM | 46 (24.5%) | 9 (10.3%) |
| 5:00 AM to 5:29 AM | 30 (16.0%) | 2 (2.3%) |
| 5:30 AM to 5:59 AM | 38 (20.2%) | 0 (0.0%) |
| 6:00 AM to 6:29 AM | 15 (8.0%) | 0 (0.0%) |
| 6:30 AM to 6:59 AM | 6 (3.2%) | 22 (25.3%) |
| 7:00 AM to 7:29 AM | 7 (3.7%) | 15 (17.2%) |
| 7:30 AM to 7:59 AM | 10 (5.3%) | 13 (14.9%) |
| 8:00 AM to 8:29 AM | 8 (4.3%) | 20 (23.0%) |
| 8:30 AM to 8:59 AM | 0 (0.0%) | 0 (0.0%) |
| 9:00 AM to 9:59 AM | 0 (0.0%) | 0 (0.0%) |
| 10:00 AM to 10:59 AM | 0 (0.0%) | 2 (2.3%) |
| 11:00 AM to 11:59 AM | 13 (6.9%) | 0 (0.0%) |
| 12:00 PM to 3:59 PM | 0 (0.0%) | 0 (0.0%) |
| 4:00 PM to 11:59 PM | 15 (8.0%) | 4 (4.6%) |
| Total | 188 (100.0%) | 87 (100.0%) |
Housing Occupancy in Lynn
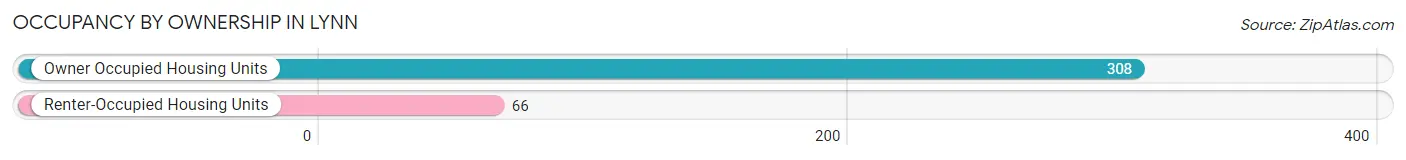
Occupancy by Ownership in Lynn
Of the total 374 dwellings in Lynn, owner-occupied units account for 308 (82.4%), while renter-occupied units make up 66 (17.6%).
| Occupancy | # Housing Units | % Housing Units |
| Owner Occupied Housing Units | 308 | 82.4% |
| Renter-Occupied Housing Units | 66 | 17.6% |
| Total Occupied Housing Units | 374 | 100.0% |
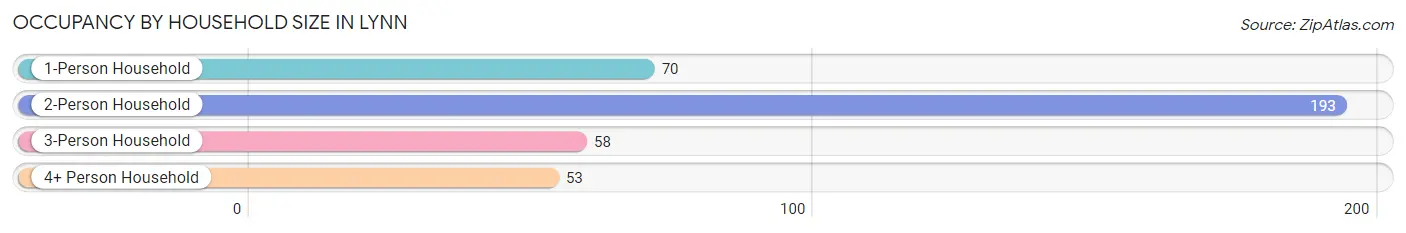
Occupancy by Household Size in Lynn
| Household Size | # Housing Units | % Housing Units |
| 1-Person Household | 70 | 18.7% |
| 2-Person Household | 193 | 51.6% |
| 3-Person Household | 58 | 15.5% |
| 4+ Person Household | 53 | 14.2% |
| Total Housing Units | 374 | 100.0% |
Occupancy by Ownership by Household Size in Lynn
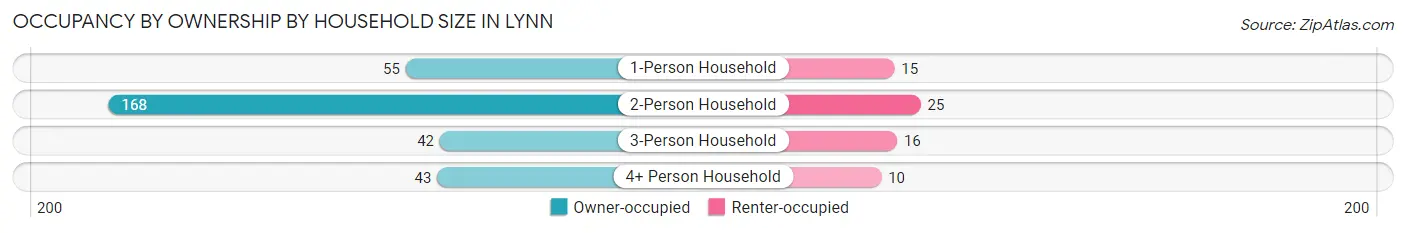
| Household Size | Owner-occupied | Renter-occupied |
| 1-Person Household | 55 (78.6%) | 15 (21.4%) |
| 2-Person Household | 168 (87.1%) | 25 (13.0%) |
| 3-Person Household | 42 (72.4%) | 16 (27.6%) |
| 4+ Person Household | 43 (81.1%) | 10 (18.9%) |
| Total Housing Units | 308 (82.4%) | 66 (17.6%) |
Occupancy by Educational Attainment in Lynn
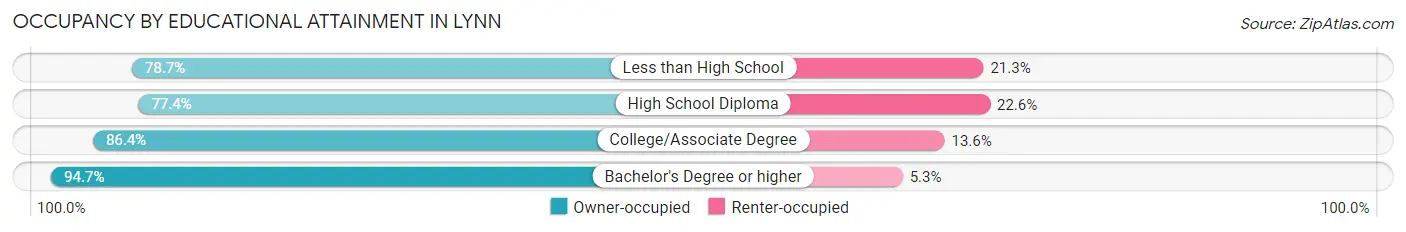
| Household Size | Owner-occupied | Renter-occupied |
| Less than High School | 74 (78.7%) | 20 (21.3%) |
| High School Diploma | 96 (77.4%) | 28 (22.6%) |
| College/Associate Degree | 102 (86.4%) | 16 (13.6%) |
| Bachelor's Degree or higher | 36 (94.7%) | 2 (5.3%) |
Occupancy by Age of Householder in Lynn
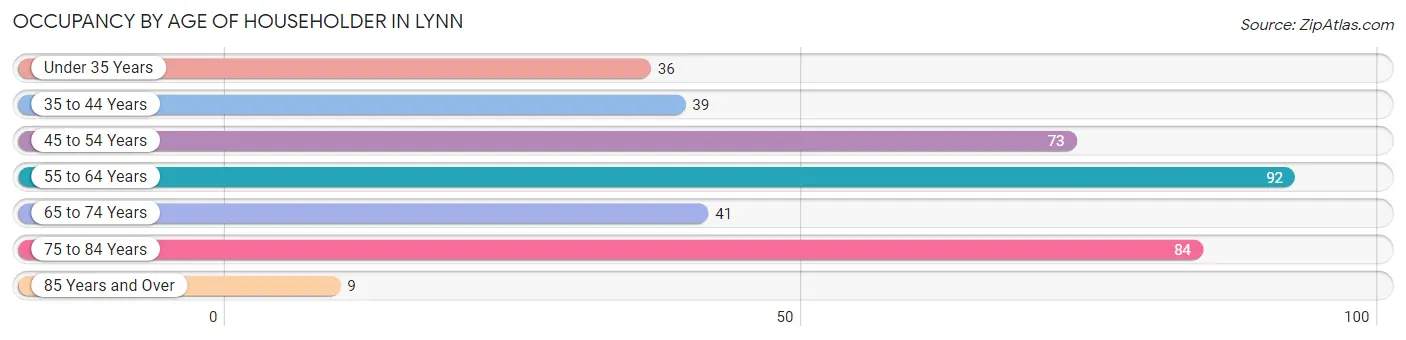
| Age Bracket | # Households | % Households |
| Under 35 Years | 36 | 9.6% |
| 35 to 44 Years | 39 | 10.4% |
| 45 to 54 Years | 73 | 19.5% |
| 55 to 64 Years | 92 | 24.6% |
| 65 to 74 Years | 41 | 11.0% |
| 75 to 84 Years | 84 | 22.5% |
| 85 Years and Over | 9 | 2.4% |
| Total | 374 | 100.0% |
Housing Finances in Lynn
Median Income by Occupancy in Lynn
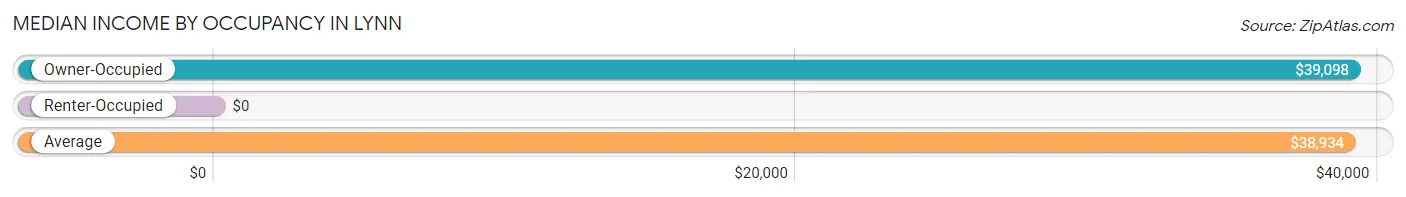
| Occupancy Type | # Households | Median Income |
| Owner-Occupied | 308 (82.4%) | $39,098 |
| Renter-Occupied | 66 (17.6%) | $0 |
| Average | 374 (100.0%) | $38,934 |
Occupancy by Householder Income Bracket in Lynn
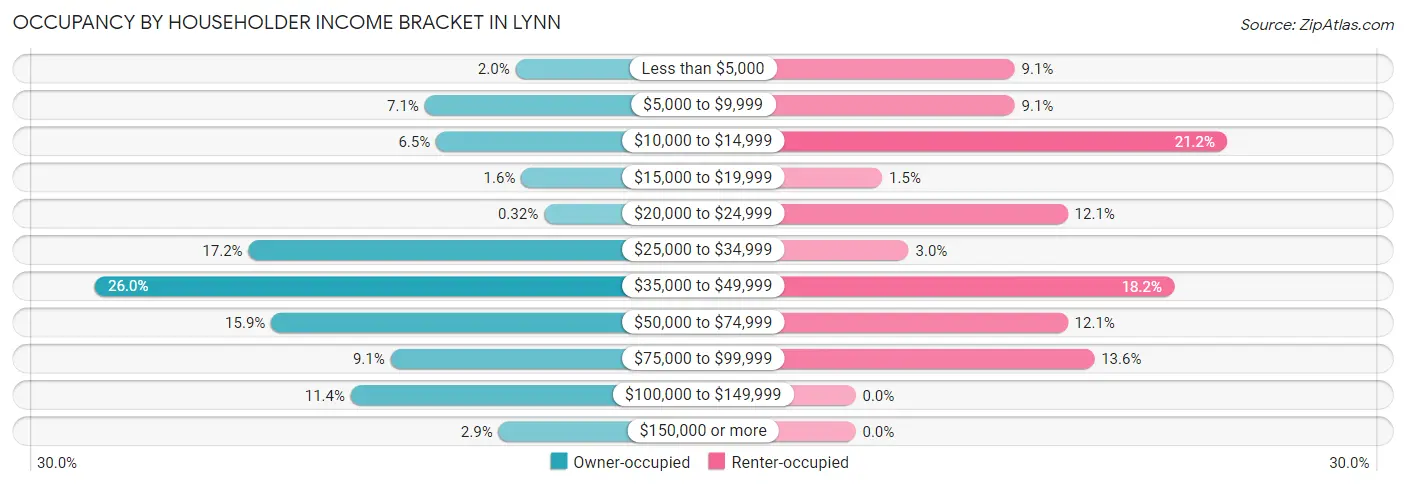
| Income Bracket | Owner-occupied | Renter-occupied |
| Less than $5,000 | 6 (1.9%) | 6 (9.1%) |
| $5,000 to $9,999 | 22 (7.1%) | 6 (9.1%) |
| $10,000 to $14,999 | 20 (6.5%) | 14 (21.2%) |
| $15,000 to $19,999 | 5 (1.6%) | 1 (1.5%) |
| $20,000 to $24,999 | 1 (0.3%) | 8 (12.1%) |
| $25,000 to $34,999 | 53 (17.2%) | 2 (3.0%) |
| $35,000 to $49,999 | 80 (26.0%) | 12 (18.2%) |
| $50,000 to $74,999 | 49 (15.9%) | 8 (12.1%) |
| $75,000 to $99,999 | 28 (9.1%) | 9 (13.6%) |
| $100,000 to $149,999 | 35 (11.4%) | 0 (0.0%) |
| $150,000 or more | 9 (2.9%) | 0 (0.0%) |
| Total | 308 (100.0%) | 66 (100.0%) |
Monthly Housing Cost Tiers in Lynn
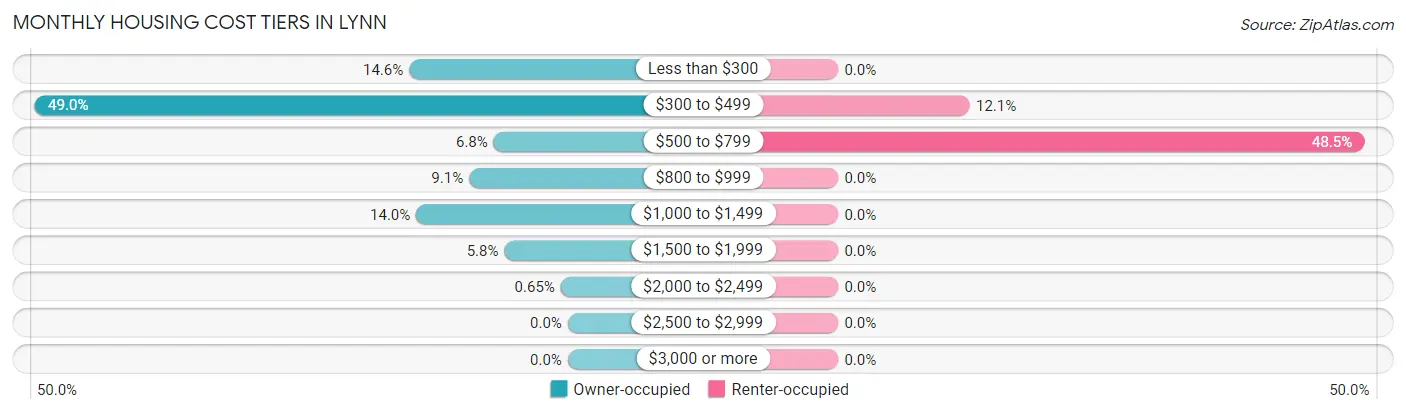
| Monthly Cost | Owner-occupied | Renter-occupied |
| Less than $300 | 45 (14.6%) | 0 (0.0%) |
| $300 to $499 | 151 (49.0%) | 8 (12.1%) |
| $500 to $799 | 21 (6.8%) | 32 (48.5%) |
| $800 to $999 | 28 (9.1%) | 0 (0.0%) |
| $1,000 to $1,499 | 43 (14.0%) | 0 (0.0%) |
| $1,500 to $1,999 | 18 (5.8%) | 0 (0.0%) |
| $2,000 to $2,499 | 2 (0.6%) | 0 (0.0%) |
| $2,500 to $2,999 | 0 (0.0%) | 0 (0.0%) |
| $3,000 or more | 0 (0.0%) | 0 (0.0%) |
| Total | 308 (100.0%) | 66 (100.0%) |
Physical Housing Characteristics in Lynn
Housing Structures in Lynn
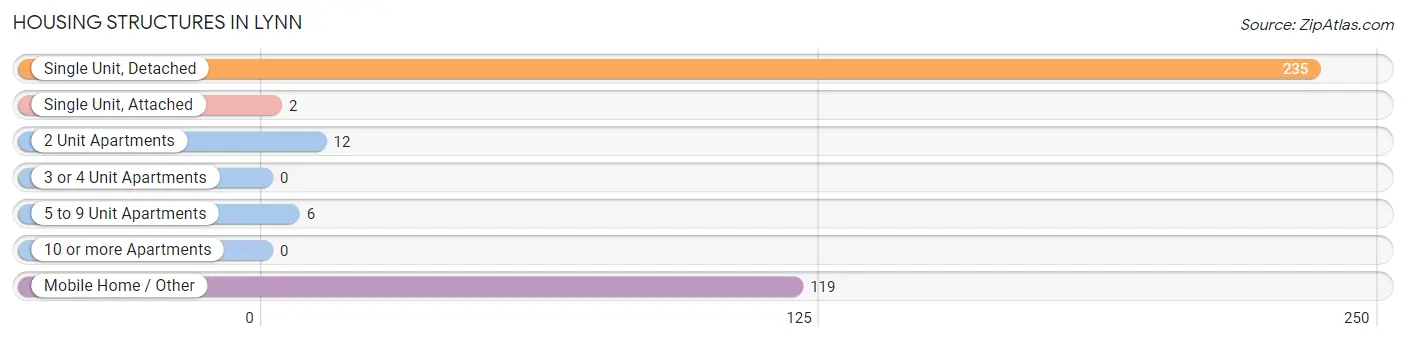
| Structure Type | # Housing Units | % Housing Units |
| Single Unit, Detached | 235 | 62.8% |
| Single Unit, Attached | 2 | 0.5% |
| 2 Unit Apartments | 12 | 3.2% |
| 3 or 4 Unit Apartments | 0 | 0.0% |
| 5 to 9 Unit Apartments | 6 | 1.6% |
| 10 or more Apartments | 0 | 0.0% |
| Mobile Home / Other | 119 | 31.8% |
| Total | 374 | 100.0% |
Housing Structures by Occupancy in Lynn
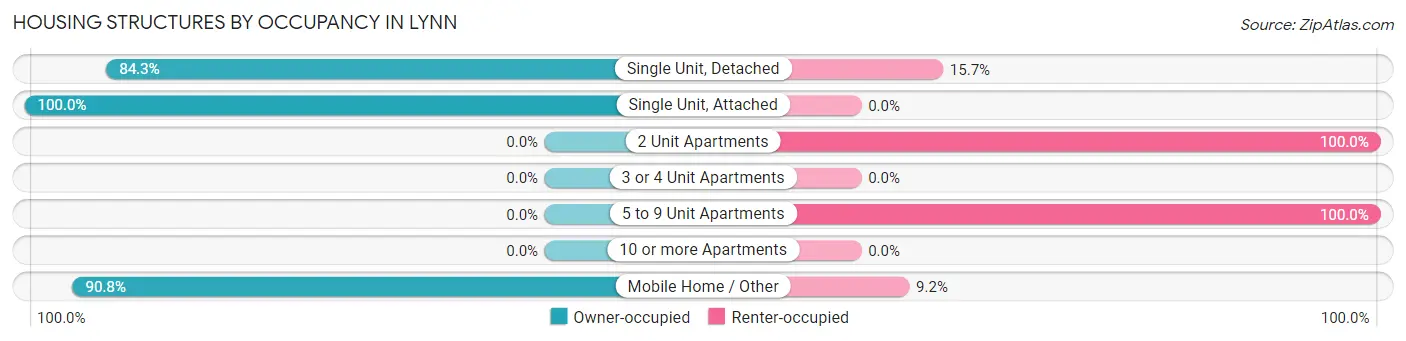
| Structure Type | Owner-occupied | Renter-occupied |
| Single Unit, Detached | 198 (84.3%) | 37 (15.7%) |
| Single Unit, Attached | 2 (100.0%) | 0 (0.0%) |
| 2 Unit Apartments | 0 (0.0%) | 12 (100.0%) |
| 3 or 4 Unit Apartments | 0 (0.0%) | 0 (0.0%) |
| 5 to 9 Unit Apartments | 0 (0.0%) | 6 (100.0%) |
| 10 or more Apartments | 0 (0.0%) | 0 (0.0%) |
| Mobile Home / Other | 108 (90.8%) | 11 (9.2%) |
| Total | 308 (82.4%) | 66 (17.6%) |
Housing Structures by Number of Rooms in Lynn
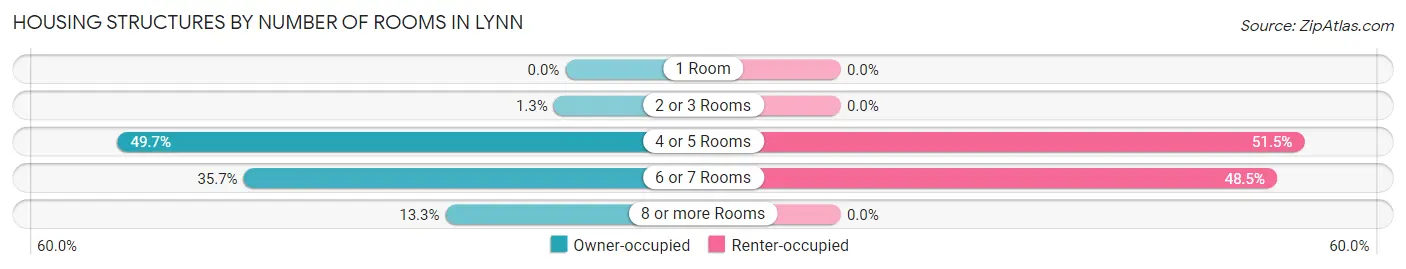
| Number of Rooms | Owner-occupied | Renter-occupied |
| 1 Room | 0 (0.0%) | 0 (0.0%) |
| 2 or 3 Rooms | 4 (1.3%) | 0 (0.0%) |
| 4 or 5 Rooms | 153 (49.7%) | 34 (51.5%) |
| 6 or 7 Rooms | 110 (35.7%) | 32 (48.5%) |
| 8 or more Rooms | 41 (13.3%) | 0 (0.0%) |
| Total | 308 (100.0%) | 66 (100.0%) |
Housing Structure by Heating Type in Lynn
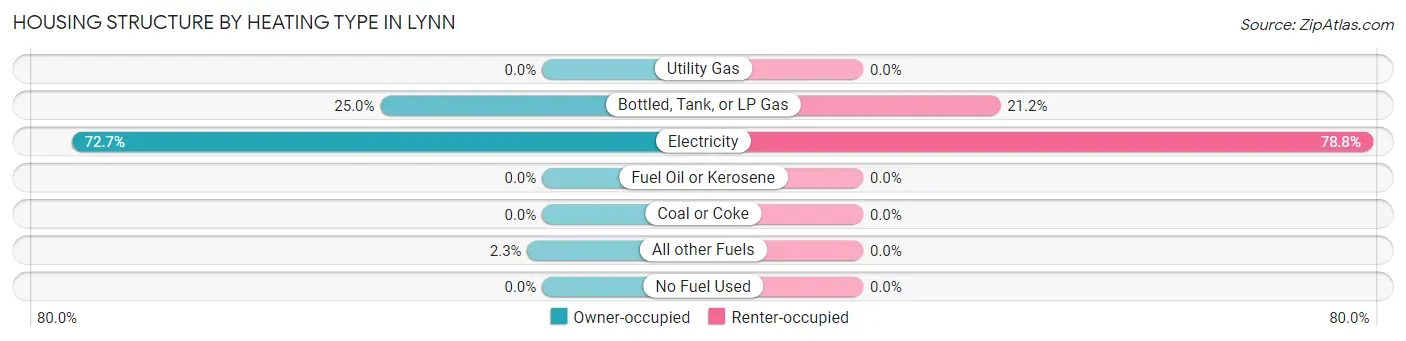
| Heating Type | Owner-occupied | Renter-occupied |
| Utility Gas | 0 (0.0%) | 0 (0.0%) |
| Bottled, Tank, or LP Gas | 77 (25.0%) | 14 (21.2%) |
| Electricity | 224 (72.7%) | 52 (78.8%) |
| Fuel Oil or Kerosene | 0 (0.0%) | 0 (0.0%) |
| Coal or Coke | 0 (0.0%) | 0 (0.0%) |
| All other Fuels | 7 (2.3%) | 0 (0.0%) |
| No Fuel Used | 0 (0.0%) | 0 (0.0%) |
| Total | 308 (100.0%) | 66 (100.0%) |
Household Vehicle Usage in Lynn
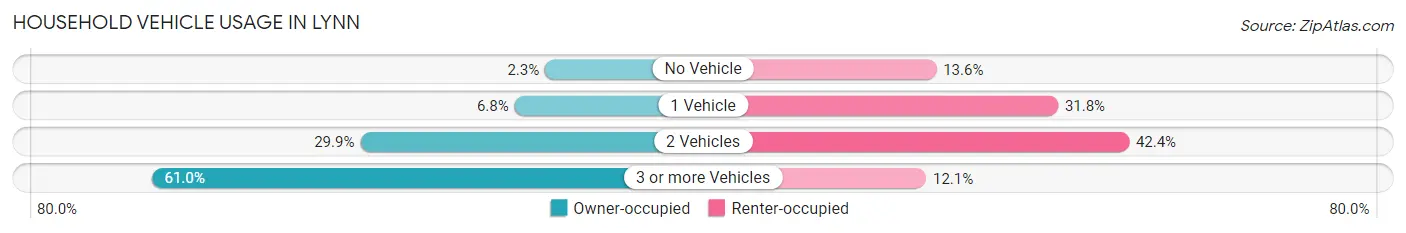
| Vehicles per Household | Owner-occupied | Renter-occupied |
| No Vehicle | 7 (2.3%) | 9 (13.6%) |
| 1 Vehicle | 21 (6.8%) | 21 (31.8%) |
| 2 Vehicles | 92 (29.9%) | 28 (42.4%) |
| 3 or more Vehicles | 188 (61.0%) | 8 (12.1%) |
| Total | 308 (100.0%) | 66 (100.0%) |
Real Estate & Mortgages in Lynn
Real Estate and Mortgage Overview in Lynn
| Characteristic | Without Mortgage | With Mortgage |
| Housing Units | 210 | 98 |
| Median Property Value | $63,300 | $77,500 |
| Median Household Income | $38,811 | $4 |
| Monthly Housing Costs | $382 | $0 |
| Real Estate Taxes | $199 | $30 |
Property Value by Mortgage Status in Lynn
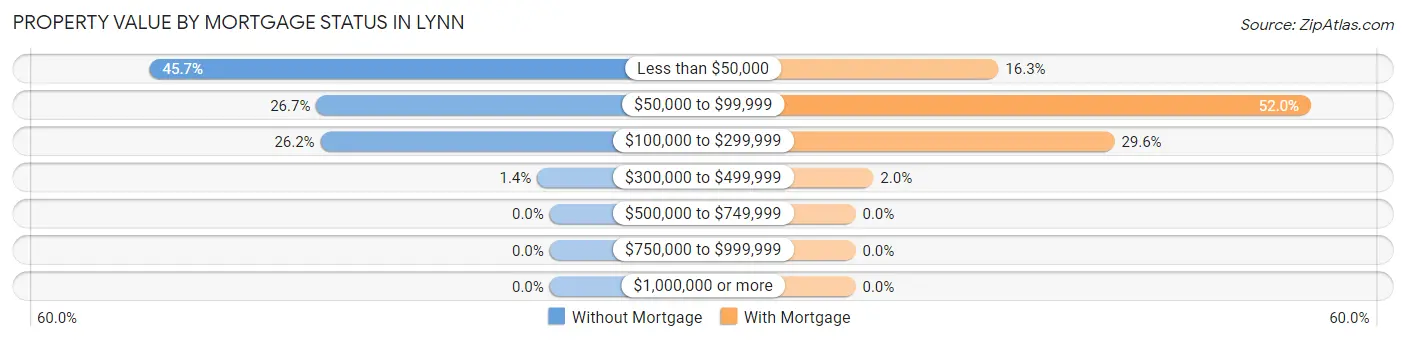
| Property Value | Without Mortgage | With Mortgage |
| Less than $50,000 | 96 (45.7%) | 16 (16.3%) |
| $50,000 to $99,999 | 56 (26.7%) | 51 (52.0%) |
| $100,000 to $299,999 | 55 (26.2%) | 29 (29.6%) |
| $300,000 to $499,999 | 3 (1.4%) | 2 (2.0%) |
| $500,000 to $749,999 | 0 (0.0%) | 0 (0.0%) |
| $750,000 to $999,999 | 0 (0.0%) | 0 (0.0%) |
| $1,000,000 or more | 0 (0.0%) | 0 (0.0%) |
| Total | 210 (100.0%) | 98 (100.0%) |
Household Income by Mortgage Status in Lynn
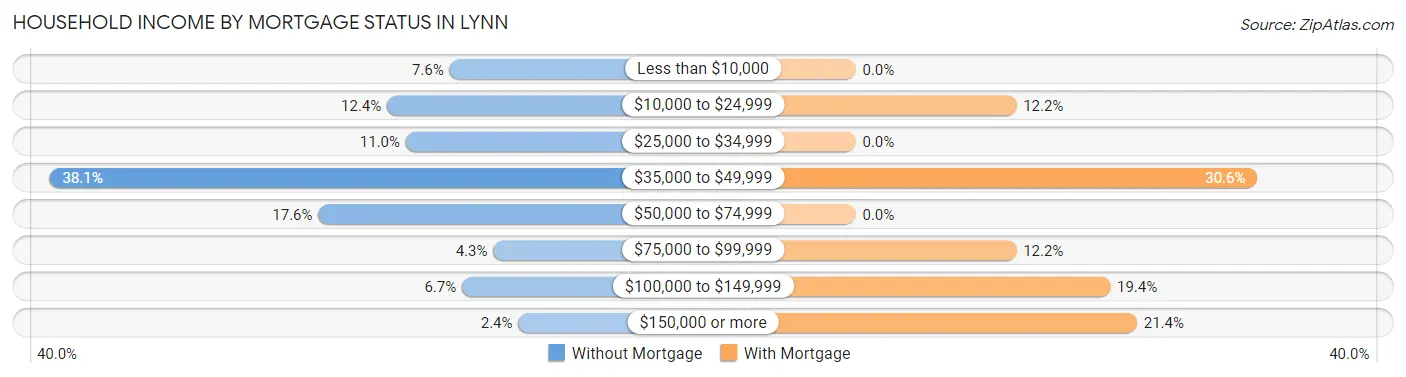
| Household Income | Without Mortgage | With Mortgage |
| Less than $10,000 | 16 (7.6%) | 0 (0.0%) |
| $10,000 to $24,999 | 26 (12.4%) | 12 (12.2%) |
| $25,000 to $34,999 | 23 (11.0%) | 0 (0.0%) |
| $35,000 to $49,999 | 80 (38.1%) | 30 (30.6%) |
| $50,000 to $74,999 | 37 (17.6%) | 0 (0.0%) |
| $75,000 to $99,999 | 9 (4.3%) | 12 (12.2%) |
| $100,000 to $149,999 | 14 (6.7%) | 19 (19.4%) |
| $150,000 or more | 5 (2.4%) | 21 (21.4%) |
| Total | 210 (100.0%) | 98 (100.0%) |
Property Value to Household Income Ratio in Lynn
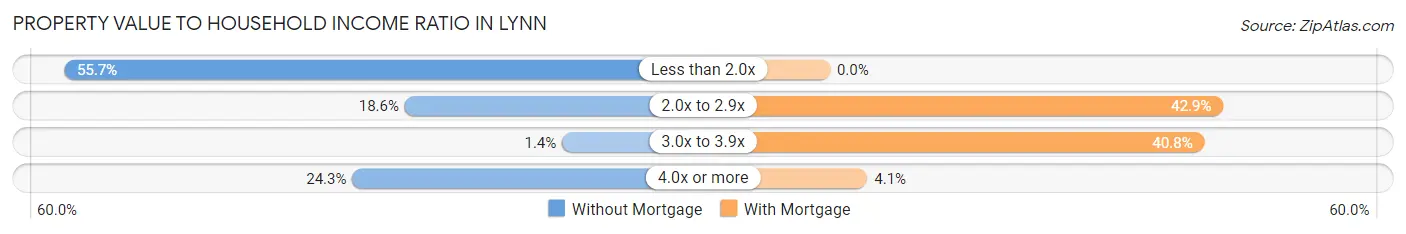
| Value-to-Income Ratio | Without Mortgage | With Mortgage |
| Less than 2.0x | 117 (55.7%) | 0 (0.0%) |
| 2.0x to 2.9x | 39 (18.6%) | 42 (42.9%) |
| 3.0x to 3.9x | 3 (1.4%) | 40 (40.8%) |
| 4.0x or more | 51 (24.3%) | 4 (4.1%) |
| Total | 210 (100.0%) | 98 (100.0%) |
Real Estate Taxes by Mortgage Status in Lynn
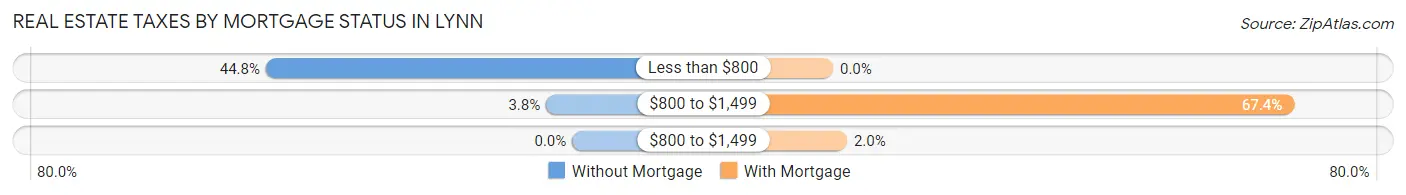
| Property Taxes | Without Mortgage | With Mortgage |
| Less than $800 | 94 (44.8%) | 0 (0.0%) |
| $800 to $1,499 | 8 (3.8%) | 66 (67.3%) |
| $800 to $1,499 | 0 (0.0%) | 2 (2.0%) |
| Total | 210 (100.0%) | 98 (100.0%) |
Health & Disability in Lynn
Health Insurance Coverage by Age in Lynn
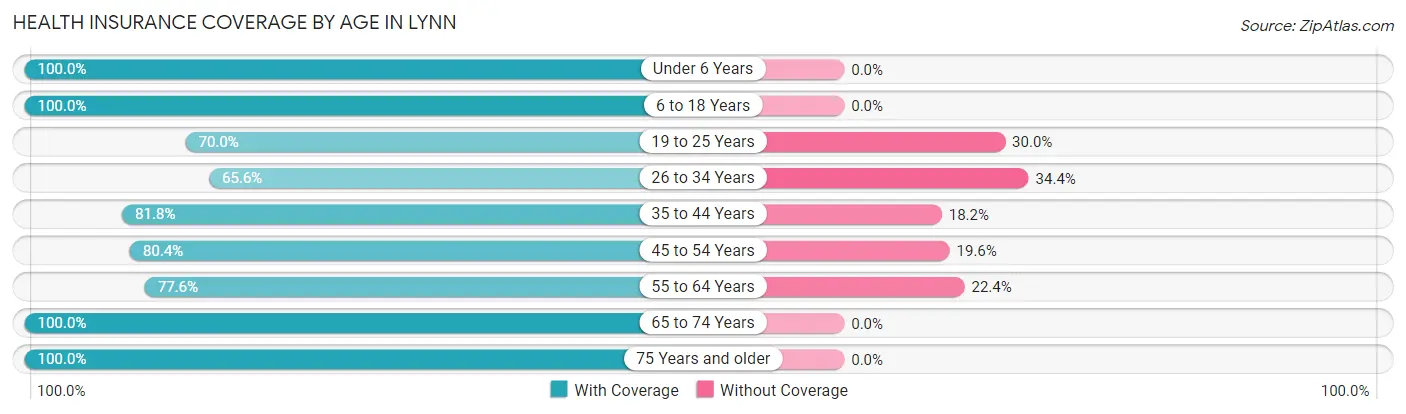
| Age Bracket | With Coverage | Without Coverage |
| Under 6 Years | 48 (100.0%) | 0 (0.0%) |
| 6 to 18 Years | 145 (100.0%) | 0 (0.0%) |
| 19 to 25 Years | 21 (70.0%) | 9 (30.0%) |
| 26 to 34 Years | 42 (65.6%) | 22 (34.4%) |
| 35 to 44 Years | 81 (81.8%) | 18 (18.2%) |
| 45 to 54 Years | 90 (80.4%) | 22 (19.6%) |
| 55 to 64 Years | 128 (77.6%) | 37 (22.4%) |
| 65 to 74 Years | 87 (100.0%) | 0 (0.0%) |
| 75 Years and older | 158 (100.0%) | 0 (0.0%) |
| Total | 800 (88.1%) | 108 (11.9%) |
Health Insurance Coverage by Citizenship Status in Lynn
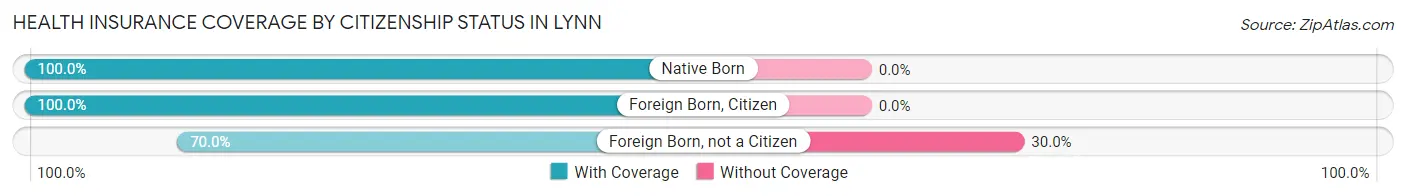
| Citizenship Status | With Coverage | Without Coverage |
| Native Born | 48 (100.0%) | 0 (0.0%) |
| Foreign Born, Citizen | 145 (100.0%) | 0 (0.0%) |
| Foreign Born, not a Citizen | 21 (70.0%) | 9 (30.0%) |
Health Insurance Coverage by Household Income in Lynn
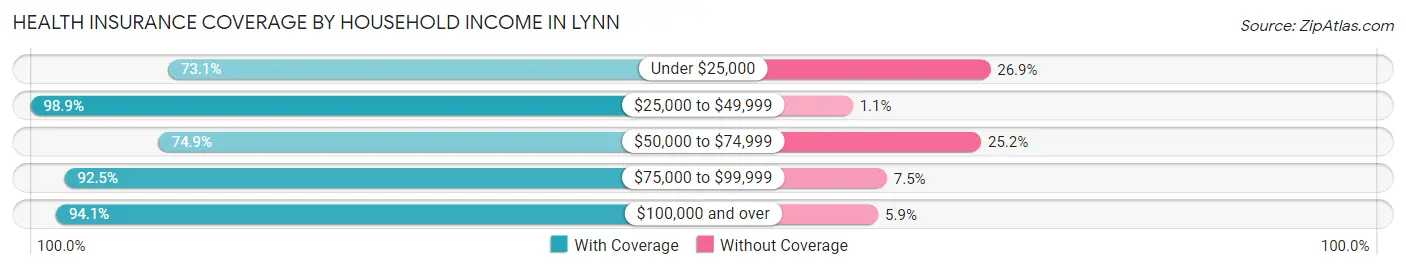
| Household Income | With Coverage | Without Coverage |
| Under $25,000 | 136 (73.1%) | 50 (26.9%) |
| $25,000 to $49,999 | 356 (98.9%) | 4 (1.1%) |
| $50,000 to $74,999 | 122 (74.9%) | 41 (25.2%) |
| $75,000 to $99,999 | 74 (92.5%) | 6 (7.5%) |
| $100,000 and over | 112 (94.1%) | 7 (5.9%) |
Public vs Private Health Insurance Coverage by Age in Lynn
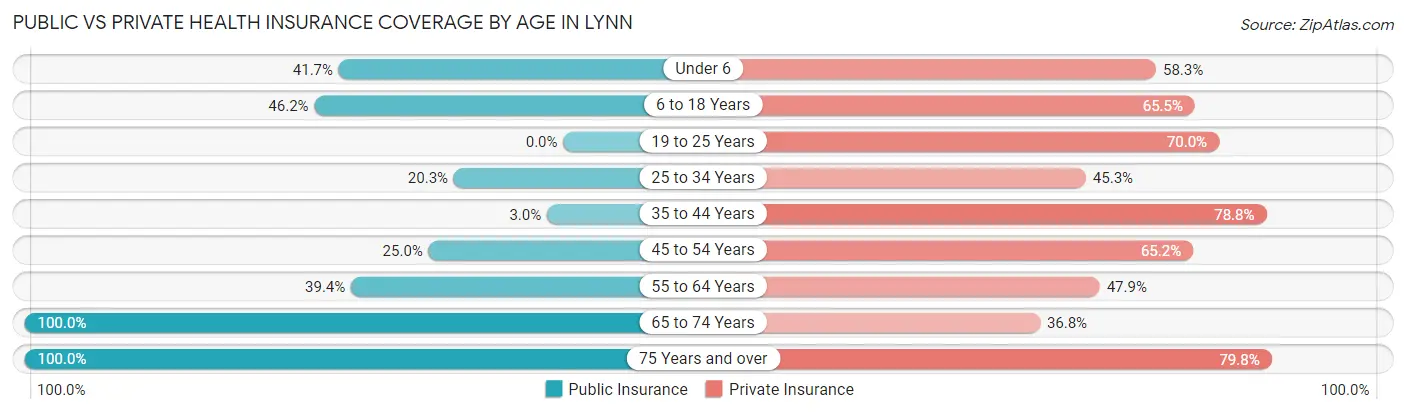
| Age Bracket | Public Insurance | Private Insurance |
| Under 6 | 20 (41.7%) | 28 (58.3%) |
| 6 to 18 Years | 67 (46.2%) | 95 (65.5%) |
| 19 to 25 Years | 0 (0.0%) | 21 (70.0%) |
| 25 to 34 Years | 13 (20.3%) | 29 (45.3%) |
| 35 to 44 Years | 3 (3.0%) | 78 (78.8%) |
| 45 to 54 Years | 28 (25.0%) | 73 (65.2%) |
| 55 to 64 Years | 65 (39.4%) | 79 (47.9%) |
| 65 to 74 Years | 87 (100.0%) | 32 (36.8%) |
| 75 Years and over | 158 (100.0%) | 126 (79.7%) |
| Total | 441 (48.6%) | 561 (61.8%) |
Disability Status by Sex by Age in Lynn
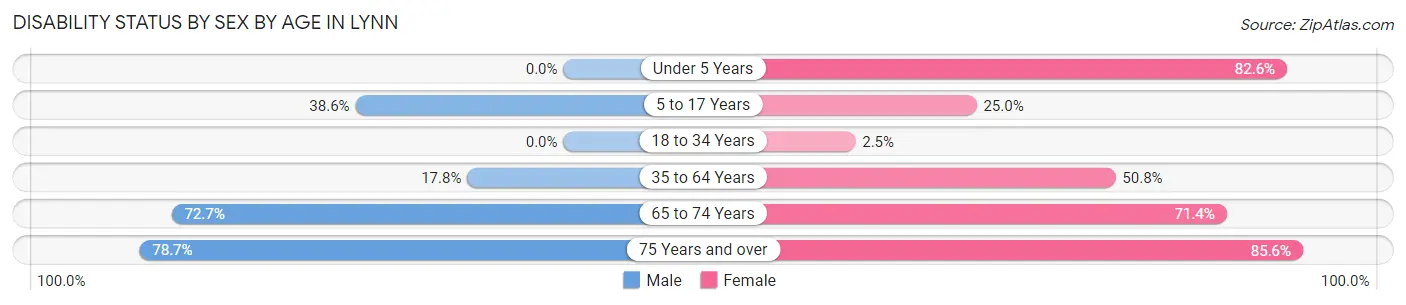
| Age Bracket | Male | Female |
| Under 5 Years | 0 (0.0%) | 19 (82.6%) |
| 5 to 17 Years | 22 (38.6%) | 24 (25.0%) |
| 18 to 34 Years | 0 (0.0%) | 1 (2.5%) |
| 35 to 64 Years | 33 (17.8%) | 97 (50.8%) |
| 65 to 74 Years | 48 (72.7%) | 15 (71.4%) |
| 75 Years and over | 48 (78.7%) | 83 (85.6%) |
Disability Class by Sex by Age in Lynn
Disability Class: Hearing Difficulty
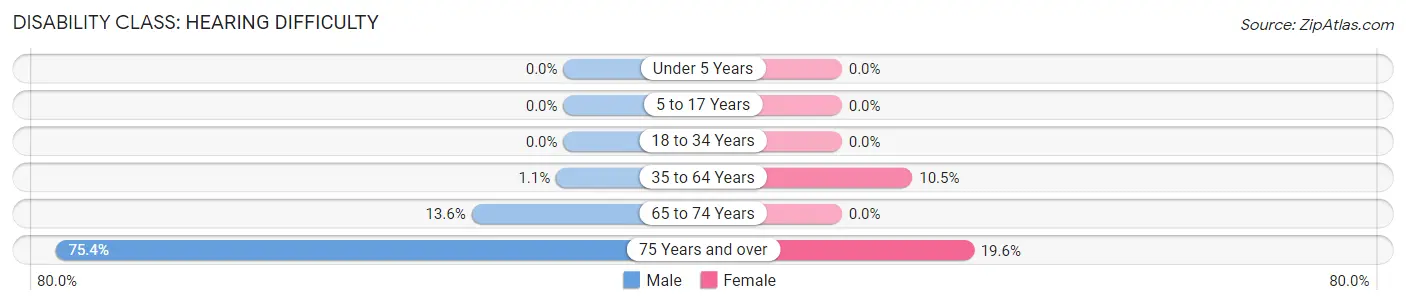
| Age Bracket | Male | Female |
| Under 5 Years | 0 (0.0%) | 0 (0.0%) |
| 5 to 17 Years | 0 (0.0%) | 0 (0.0%) |
| 18 to 34 Years | 0 (0.0%) | 0 (0.0%) |
| 35 to 64 Years | 2 (1.1%) | 20 (10.5%) |
| 65 to 74 Years | 9 (13.6%) | 0 (0.0%) |
| 75 Years and over | 46 (75.4%) | 19 (19.6%) |
Disability Class: Vision Difficulty
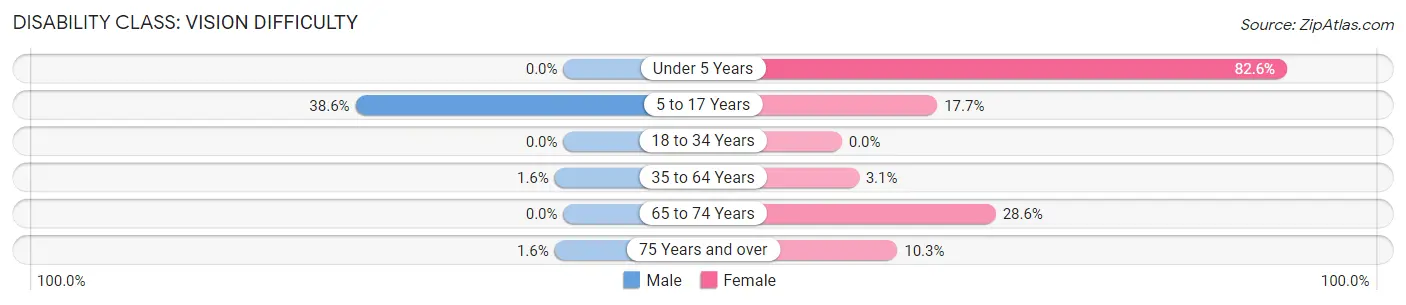
| Age Bracket | Male | Female |
| Under 5 Years | 0 (0.0%) | 19 (82.6%) |
| 5 to 17 Years | 22 (38.6%) | 17 (17.7%) |
| 18 to 34 Years | 0 (0.0%) | 0 (0.0%) |
| 35 to 64 Years | 3 (1.6%) | 6 (3.1%) |
| 65 to 74 Years | 0 (0.0%) | 6 (28.6%) |
| 75 Years and over | 1 (1.6%) | 10 (10.3%) |
Disability Class: Cognitive Difficulty
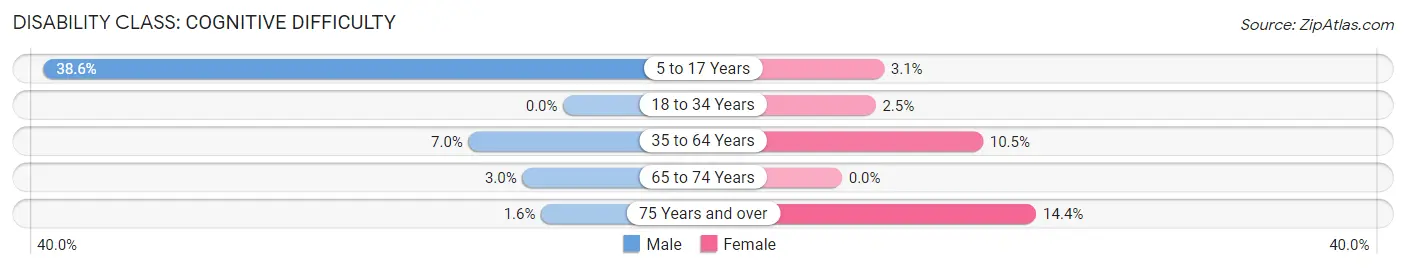
| Age Bracket | Male | Female |
| 5 to 17 Years | 22 (38.6%) | 3 (3.1%) |
| 18 to 34 Years | 0 (0.0%) | 1 (2.5%) |
| 35 to 64 Years | 13 (7.0%) | 20 (10.5%) |
| 65 to 74 Years | 2 (3.0%) | 0 (0.0%) |
| 75 Years and over | 1 (1.6%) | 14 (14.4%) |
Disability Class: Ambulatory Difficulty
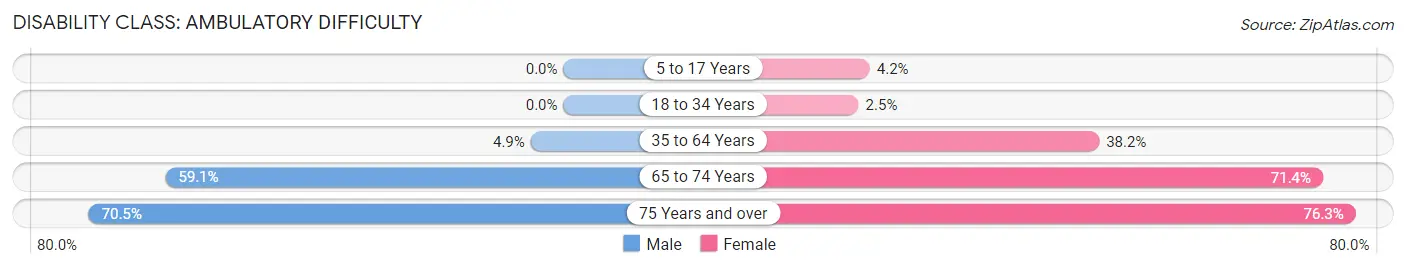
| Age Bracket | Male | Female |
| 5 to 17 Years | 0 (0.0%) | 4 (4.2%) |
| 18 to 34 Years | 0 (0.0%) | 1 (2.5%) |
| 35 to 64 Years | 9 (4.9%) | 73 (38.2%) |
| 65 to 74 Years | 39 (59.1%) | 15 (71.4%) |
| 75 Years and over | 43 (70.5%) | 74 (76.3%) |
Disability Class: Self-Care Difficulty
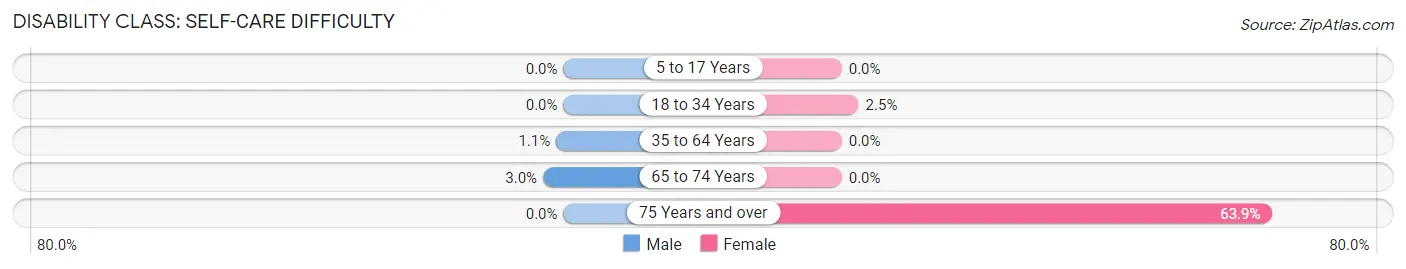
| Age Bracket | Male | Female |
| 5 to 17 Years | 0 (0.0%) | 0 (0.0%) |
| 18 to 34 Years | 0 (0.0%) | 1 (2.5%) |
| 35 to 64 Years | 2 (1.1%) | 0 (0.0%) |
| 65 to 74 Years | 2 (3.0%) | 0 (0.0%) |
| 75 Years and over | 0 (0.0%) | 62 (63.9%) |
Technology Access in Lynn
Computing Device Access in Lynn
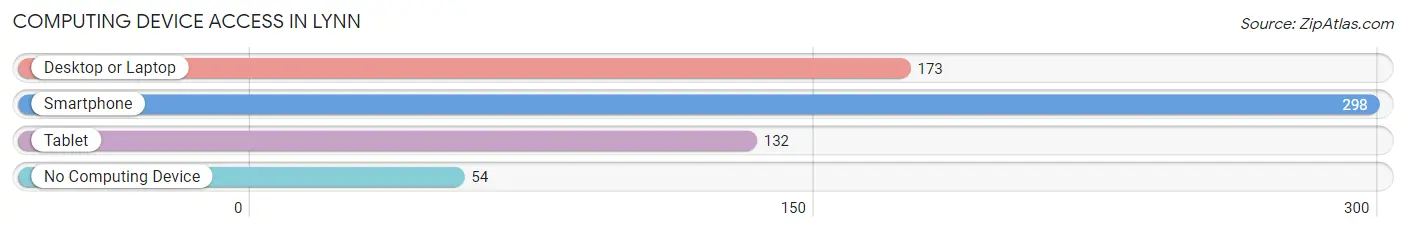
| Device Type | # Households | % Households |
| Desktop or Laptop | 173 | 46.3% |
| Smartphone | 298 | 79.7% |
| Tablet | 132 | 35.3% |
| No Computing Device | 54 | 14.4% |
| Total | 374 | 100.0% |
Internet Access in Lynn
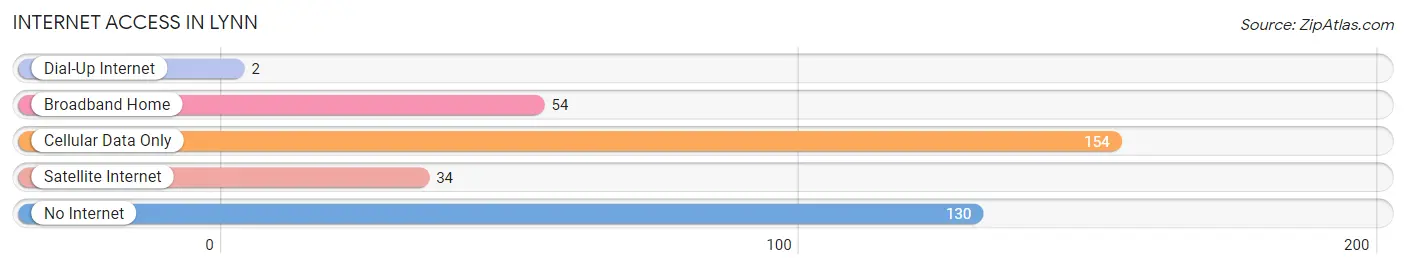
| Internet Type | # Households | % Households |
| Dial-Up Internet | 2 | 0.5% |
| Broadband Home | 54 | 14.4% |
| Cellular Data Only | 154 | 41.2% |
| Satellite Internet | 34 | 9.1% |
| No Internet | 130 | 34.8% |
| Total | 374 | 100.0% |
Lynn Summary
Lynn is a small town located in the northwest corner of Alabama, in the foothills of the Appalachian Mountains. It is situated in the northwest corner of the state, near the Tennessee border. The town is located in Franklin County, and is part of the Florence-Muscle Shoals Metropolitan Statistical Area. The population of Lynn in 2000 was 1,093.
Geography
Lynn is located in the northwest corner of Alabama, in the foothills of the Appalachian Mountains. It is situated in the northwest corner of the state, near the Tennessee border. The town is located in Franklin County, and is part of the Florence-Muscle Shoals Metropolitan Statistical Area. The town is situated on the banks of the Tennessee River, and is surrounded by rolling hills and forests. The town is located at an elevation of 590 feet above sea level.
Climate
Lynn has a humid subtropical climate, with hot, humid summers and mild winters. The average annual temperature is 64°F, with an average high of 79°F in July and an average low of 48°F in January. The average annual precipitation is 52 inches, with the wettest month being April, with an average of 6.3 inches of rain.
Demographics
In 2000, the population of Lynn was 1,093. The racial makeup of the town was 97.2% White, 0.9% African American, 0.4% Native American, 0.2% Asian, 0.1% Pacific Islander, 0.2% from other races, and 0.9% from two or more races. Hispanic or Latino of any race were 0.7% of the population.
Economy
The economy of Lynn is largely based on agriculture and forestry. The town is home to several small farms, as well as a sawmill and a lumber mill. The town also has a few small businesses, including a grocery store, a hardware store, and a few restaurants.
Education
Lynn is served by the Franklin County School District. The town has one public school, Lynn Elementary School, which serves students in grades K-8. The town also has a private school, Lynn Christian Academy, which serves students in grades K-12.
Conclusion
Lynn is a small town located in the northwest corner of Alabama, in the foothills of the Appalachian Mountains. It is situated in the northwest corner of the state, near the Tennessee border. The town is located in Franklin County, and is part of the Florence-Muscle Shoals Metropolitan Statistical Area. The population of Lynn in 2000 was 1,093. The economy of Lynn is largely based on agriculture and forestry, and the town is served by the Franklin County School District. Lynn is a quiet, rural town with a strong sense of community and a rich history.
Common Questions
What is Per Capita Income in Lynn?
Per Capita income in Lynn is $20,775.
What is the Median Family Income in Lynn?
Median Family Income in Lynn is $39,303.
What is the Median Household income in Lynn?
Median Household Income in Lynn is $38,934.
What is Income or Wage Gap in Lynn?
Income or Wage Gap in Lynn is 19.8%.
Women in Lynn earn 80.2 cents for every dollar earned by a man.
What is Inequality or Gini Index in Lynn?
Inequality or Gini Index in Lynn is 0.42.
What is the Total Population of Lynn?
Total Population of Lynn is 908.
What is the Total Male Population of Lynn?
Total Male Population of Lynn is 440.
What is the Total Female Population of Lynn?
Total Female Population of Lynn is 468.
What is the Ratio of Males per 100 Females in Lynn?
There are 94.02 Males per 100 Females in Lynn.
What is the Ratio of Females per 100 Males in Lynn?
There are 106.36 Females per 100 Males in Lynn.
What is the Median Population Age in Lynn?
Median Population Age in Lynn is 50.5 Years.
What is the Average Family Size in Lynn
Average Family Size in Lynn is 2.6 People.
What is the Average Household Size in Lynn
Average Household Size in Lynn is 2.4 People.
How Large is the Labor Force in Lynn?
There are 299 People in the Labor Forcein in Lynn.
What is the Percentage of People in the Labor Force in Lynn?
40.0% of People are in the Labor Force in Lynn.
What is the Unemployment Rate in Lynn?
Unemployment Rate in Lynn is 3.3%.