Loachapoka, AL Map & Demographics
Loachapoka Map
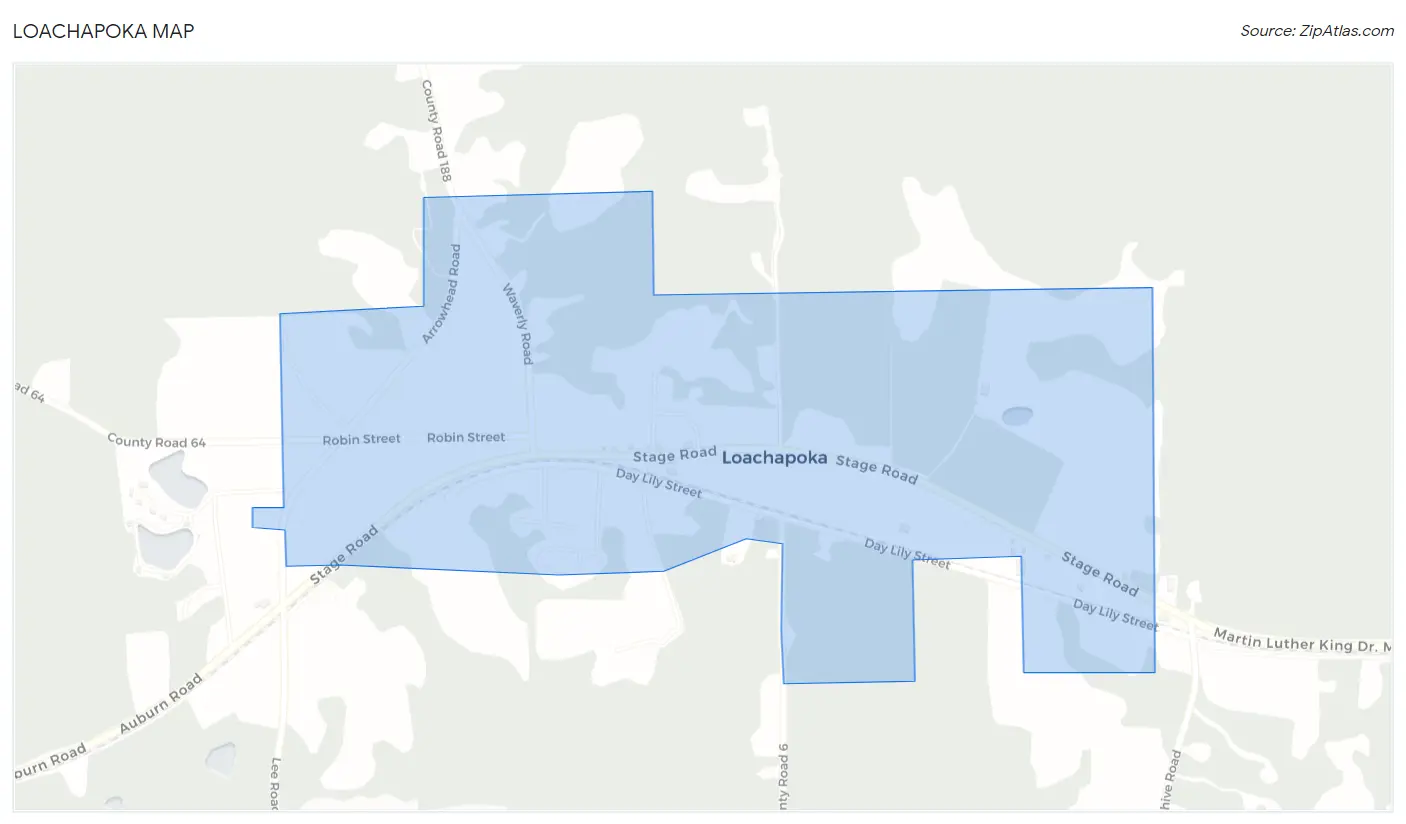
Loachapoka Overview
$33,889
PER CAPITA INCOME
$51,250
AVG HOUSEHOLD INCOME
0.44
INEQUALITY / GINI INDEX
227
TOTAL POPULATION
108
MALE POPULATION
119
FEMALE POPULATION
90.76
MALES / 100 FEMALES
110.19
FEMALES / 100 MALES
37.5
MEDIAN AGE
2.9
AVG FAMILY SIZE
2.3
AVG HOUSEHOLD SIZE
135
LABOR FORCE [ PEOPLE ]
67.5%
PERCENT IN LABOR FORCE
5.9%
UNEMPLOYMENT RATE
Loachapoka Zip Codes
Income in Loachapoka
Income Overview in Loachapoka
| Characteristic | Number | Measure |
| Per Capita Income | 227 | $33,889 |
| Median Family Income | 61 | $0 |
| Mean Family Income | 61 | $102,243 |
| Median Household Income | 98 | $51,250 |
| Mean Household Income | 98 | $79,578 |
| Income Deficit | 61 | $0 |
| Wage / Income Gap (%) | 227 | 0.00% |
| Wage / Income Gap ($) | 227 | 100.00¢ per $1 |
| Gini / Inequality Index | 227 | 0.44 |
Earnings by Sex in Loachapoka
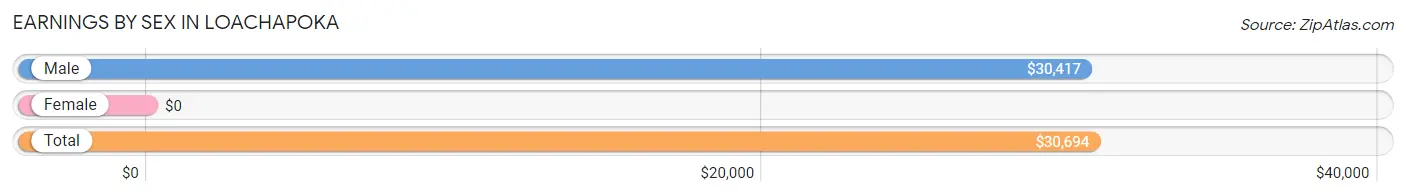
| Sex | Number | Average Earnings |
| Male | 65 (49.6%) | $30,417 |
| Female | 66 (50.4%) | $0 |
| Total | 131 (100.0%) | $30,694 |
Earnings by Sex by Income Bracket in Loachapoka
The most common earnings brackets in Loachapoka are $22,500 to $24,999 for men (15 | 23.1%) and $55,000 to $64,999 for women (14 | 21.2%).
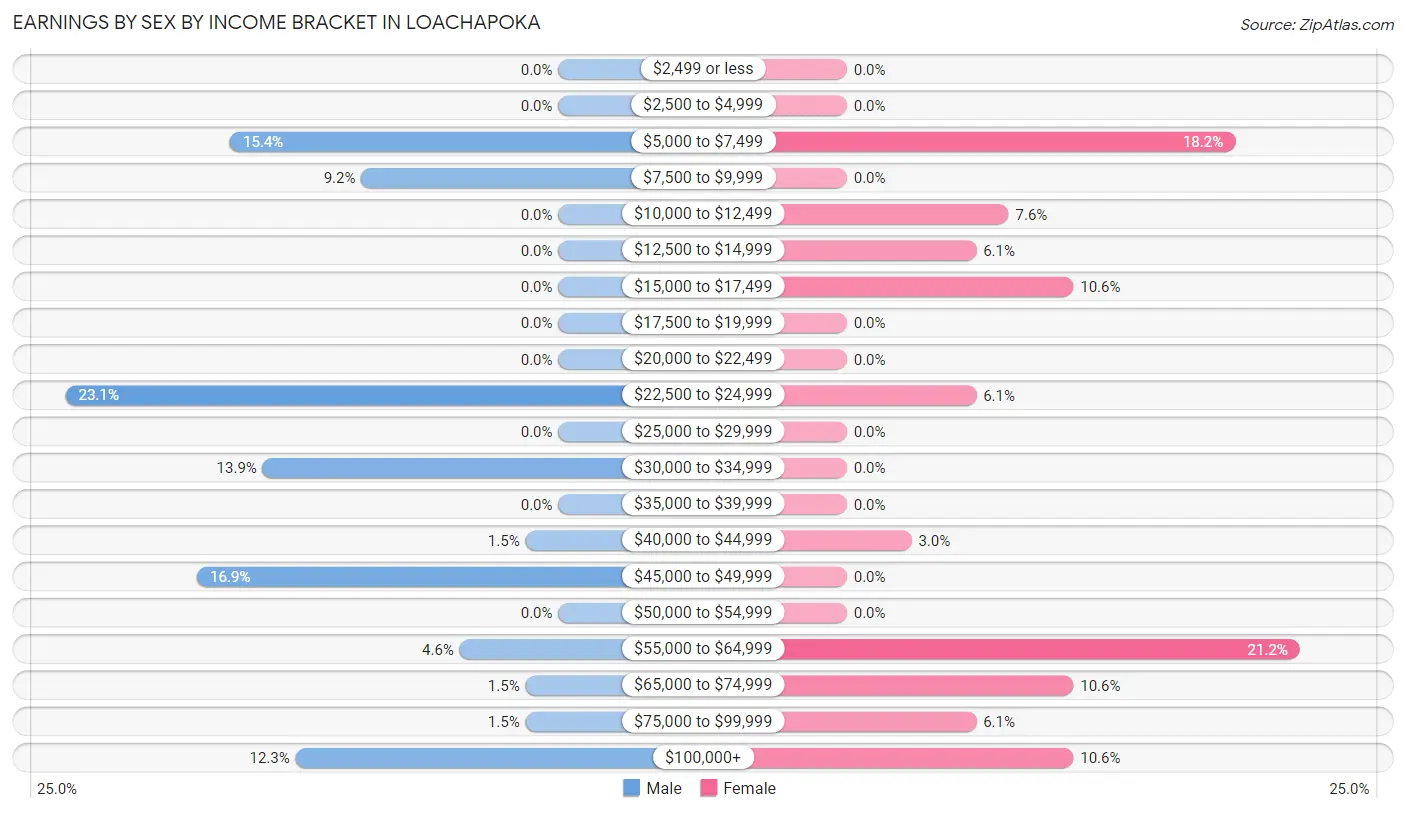
| Income | Male | Female |
| $2,499 or less | 0 (0.0%) | 0 (0.0%) |
| $2,500 to $4,999 | 0 (0.0%) | 0 (0.0%) |
| $5,000 to $7,499 | 10 (15.4%) | 12 (18.2%) |
| $7,500 to $9,999 | 6 (9.2%) | 0 (0.0%) |
| $10,000 to $12,499 | 0 (0.0%) | 5 (7.6%) |
| $12,500 to $14,999 | 0 (0.0%) | 4 (6.1%) |
| $15,000 to $17,499 | 0 (0.0%) | 7 (10.6%) |
| $17,500 to $19,999 | 0 (0.0%) | 0 (0.0%) |
| $20,000 to $22,499 | 0 (0.0%) | 0 (0.0%) |
| $22,500 to $24,999 | 15 (23.1%) | 4 (6.1%) |
| $25,000 to $29,999 | 0 (0.0%) | 0 (0.0%) |
| $30,000 to $34,999 | 9 (13.9%) | 0 (0.0%) |
| $35,000 to $39,999 | 0 (0.0%) | 0 (0.0%) |
| $40,000 to $44,999 | 1 (1.5%) | 2 (3.0%) |
| $45,000 to $49,999 | 11 (16.9%) | 0 (0.0%) |
| $50,000 to $54,999 | 0 (0.0%) | 0 (0.0%) |
| $55,000 to $64,999 | 3 (4.6%) | 14 (21.2%) |
| $65,000 to $74,999 | 1 (1.5%) | 7 (10.6%) |
| $75,000 to $99,999 | 1 (1.5%) | 4 (6.1%) |
| $100,000+ | 8 (12.3%) | 7 (10.6%) |
| Total | 65 (100.0%) | 66 (100.0%) |
Earnings by Sex by Educational Attainment in Loachapoka
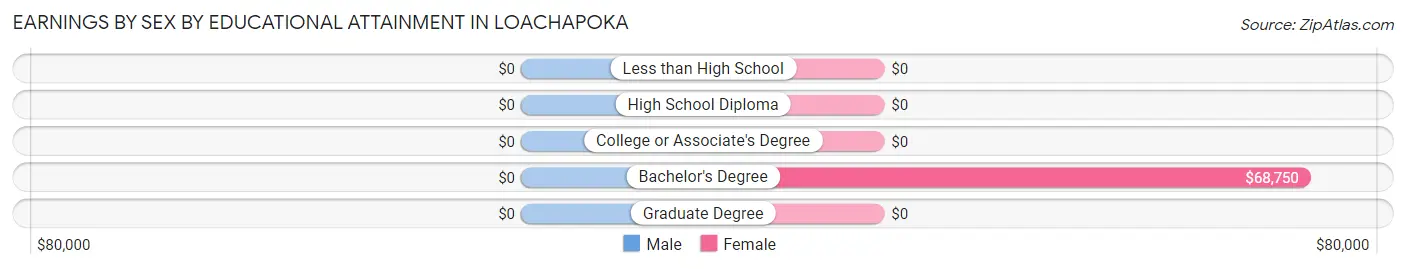
| Educational Attainment | Male Income | Female Income |
| Less than High School | - | - |
| High School Diploma | - | - |
| College or Associate's Degree | - | - |
| Bachelor's Degree | - | - |
| Graduate Degree | - | - |
| Total | $31,806 | $57,875 |
Family Income in Loachapoka
Family Income Brackets in Loachapoka
According to the Loachapoka family income data, there are 21 families falling into the $150,000 to $199,999 income range, which is the most common income bracket and makes up 34.4% of all families.
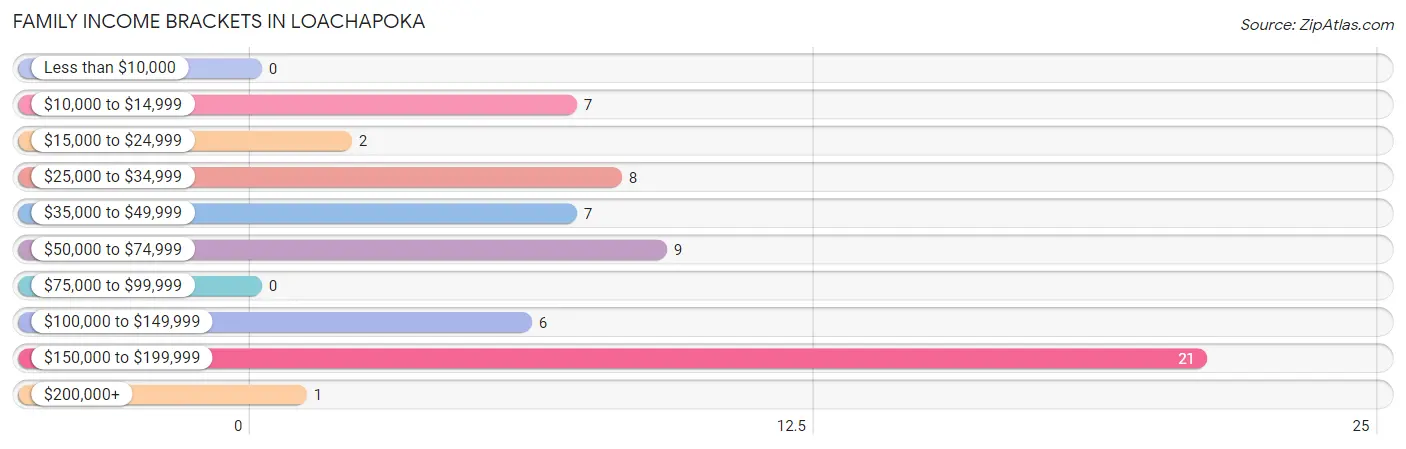
| Income Bracket | # Families | % Families |
| Less than $10,000 | 0 | 0.0% |
| $10,000 to $14,999 | 7 | 11.5% |
| $15,000 to $24,999 | 2 | 3.3% |
| $25,000 to $34,999 | 8 | 13.1% |
| $35,000 to $49,999 | 7 | 11.5% |
| $50,000 to $74,999 | 9 | 14.8% |
| $75,000 to $99,999 | 0 | 0.0% |
| $100,000 to $149,999 | 6 | 9.8% |
| $150,000 to $199,999 | 21 | 34.4% |
| $200,000+ | 1 | 1.6% |
Family Income by Famaliy Size in Loachapoka
3-person families (14 | 23.0%) account for the highest median family income in Loachapoka with $187,917 per family, while 3-person families (14 | 23.0%) have the highest median income of $62,639 per family member.
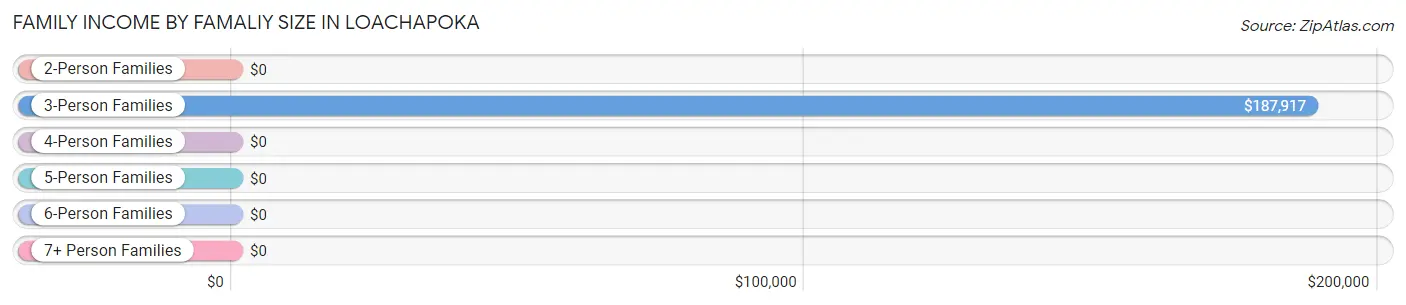
| Income Bracket | # Families | Median Income |
| 2-Person Families | 36 (59.0%) | $0 |
| 3-Person Families | 14 (23.0%) | $187,917 |
| 4-Person Families | 10 (16.4%) | $0 |
| 5-Person Families | 0 (0.0%) | $0 |
| 6-Person Families | 1 (1.6%) | $0 |
| 7+ Person Families | 0 (0.0%) | $0 |
| Total | 61 (100.0%) | $0 |
Family Income by Number of Earners in Loachapoka
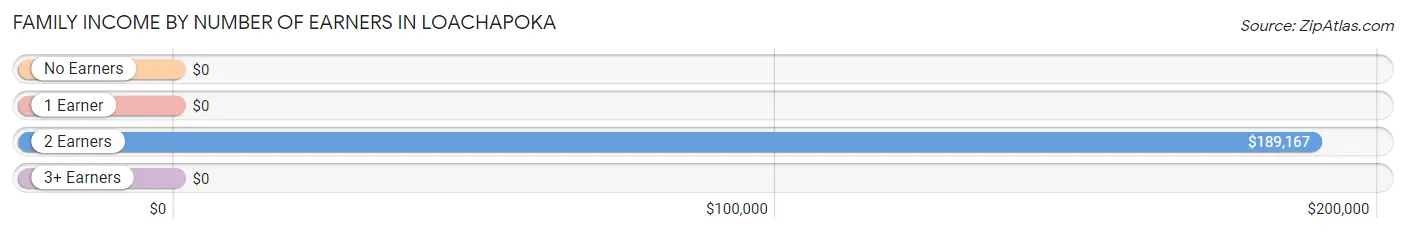
| Number of Earners | # Families | Median Income |
| No Earners | 17 (27.9%) | $0 |
| 1 Earner | 14 (23.0%) | $0 |
| 2 Earners | 28 (45.9%) | $189,167 |
| 3+ Earners | 2 (3.3%) | $0 |
| Total | 61 (100.0%) | $0 |
Household Income in Loachapoka
Household Income Brackets in Loachapoka
With 23 households falling in the category, the $35,000 to $49,999 income range is the most frequent in Loachapoka, accounting for 23.5% of all households.
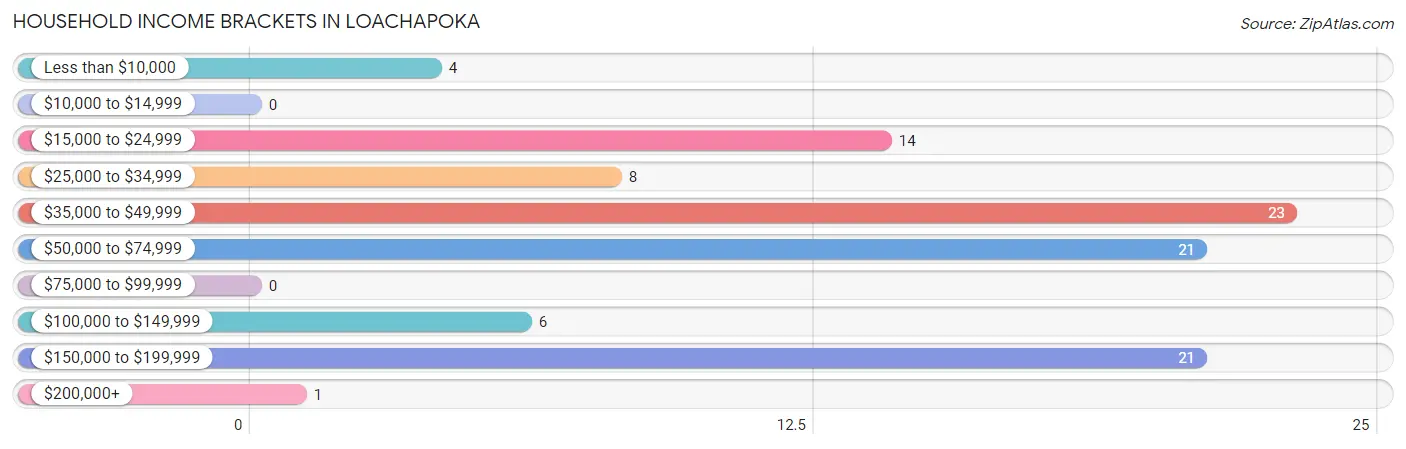
| Income Bracket | # Households | % Households |
| Less than $10,000 | 4 | 4.1% |
| $10,000 to $14,999 | 0 | 0.0% |
| $15,000 to $24,999 | 14 | 14.3% |
| $25,000 to $34,999 | 8 | 8.2% |
| $35,000 to $49,999 | 23 | 23.5% |
| $50,000 to $74,999 | 21 | 21.4% |
| $75,000 to $99,999 | 0 | 0.0% |
| $100,000 to $149,999 | 6 | 6.1% |
| $150,000 to $199,999 | 21 | 21.4% |
| $200,000+ | 1 | 1.0% |
Household Income by Householder Age in Loachapoka
The median household income in Loachapoka is $51,250, with the highest median household income of $188,958 found in the 45 to 64 years age bracket for the primary householder. A total of 25 households (25.5%) fall into this category.
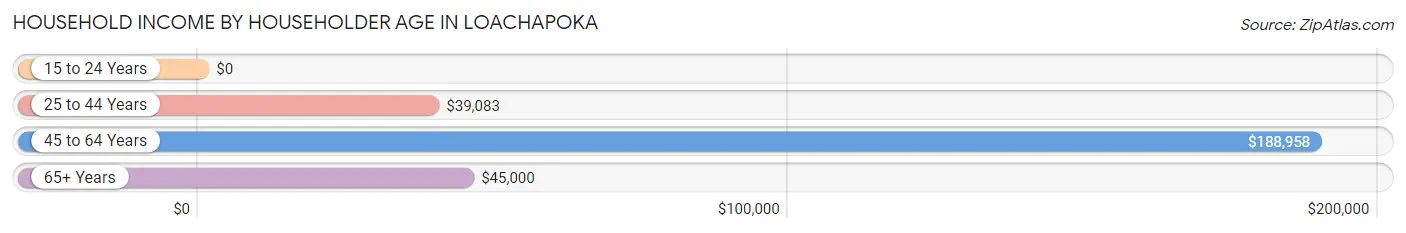
| Income Bracket | # Households | Median Income |
| 15 to 24 Years | 0 (0.0%) | $0 |
| 25 to 44 Years | 49 (50.0%) | $39,083 |
| 45 to 64 Years | 25 (25.5%) | $188,958 |
| 65+ Years | 24 (24.5%) | $45,000 |
| Total | 98 (100.0%) | $51,250 |
Poverty in Loachapoka
Income Below Poverty by Sex and Age in Loachapoka
With 6.5% poverty level for males and 16.8% for females among the residents of Loachapoka, 35 to 44 year old males and 6 to 11 year old females are the most vulnerable to poverty, with 7 males (43.8%) and 7 females (87.5%) in their respective age groups living below the poverty level.
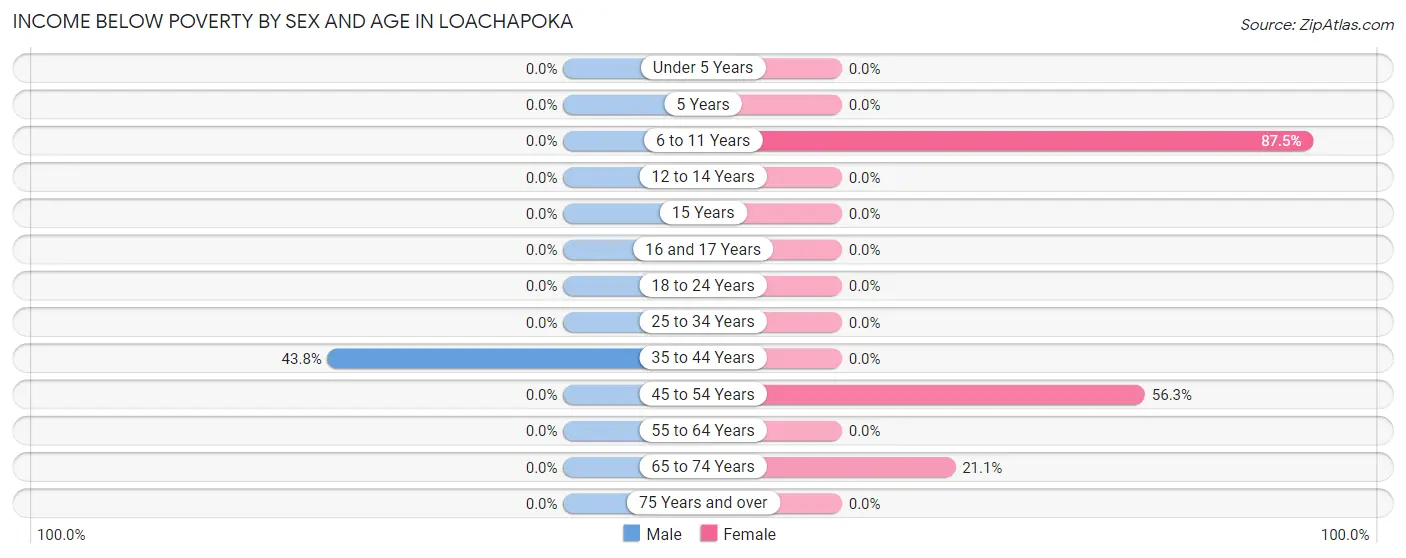
| Age Bracket | Male | Female |
| Under 5 Years | 0 (0.0%) | 0 (0.0%) |
| 5 Years | 0 (0.0%) | 0 (0.0%) |
| 6 to 11 Years | 0 (0.0%) | 7 (87.5%) |
| 12 to 14 Years | 0 (0.0%) | 0 (0.0%) |
| 15 Years | 0 (0.0%) | 0 (0.0%) |
| 16 and 17 Years | 0 (0.0%) | 0 (0.0%) |
| 18 to 24 Years | 0 (0.0%) | 0 (0.0%) |
| 25 to 34 Years | 0 (0.0%) | 0 (0.0%) |
| 35 to 44 Years | 7 (43.8%) | 0 (0.0%) |
| 45 to 54 Years | 0 (0.0%) | 9 (56.2%) |
| 55 to 64 Years | 0 (0.0%) | 0 (0.0%) |
| 65 to 74 Years | 0 (0.0%) | 4 (21.0%) |
| 75 Years and over | 0 (0.0%) | 0 (0.0%) |
| Total | 7 (6.5%) | 20 (16.8%) |
Income Above Poverty by Sex and Age in Loachapoka
According to the poverty statistics in Loachapoka, males aged under 5 years and females aged under 5 years are the age groups that are most secure financially, with 100.0% of males and 100.0% of females in these age groups living above the poverty line.
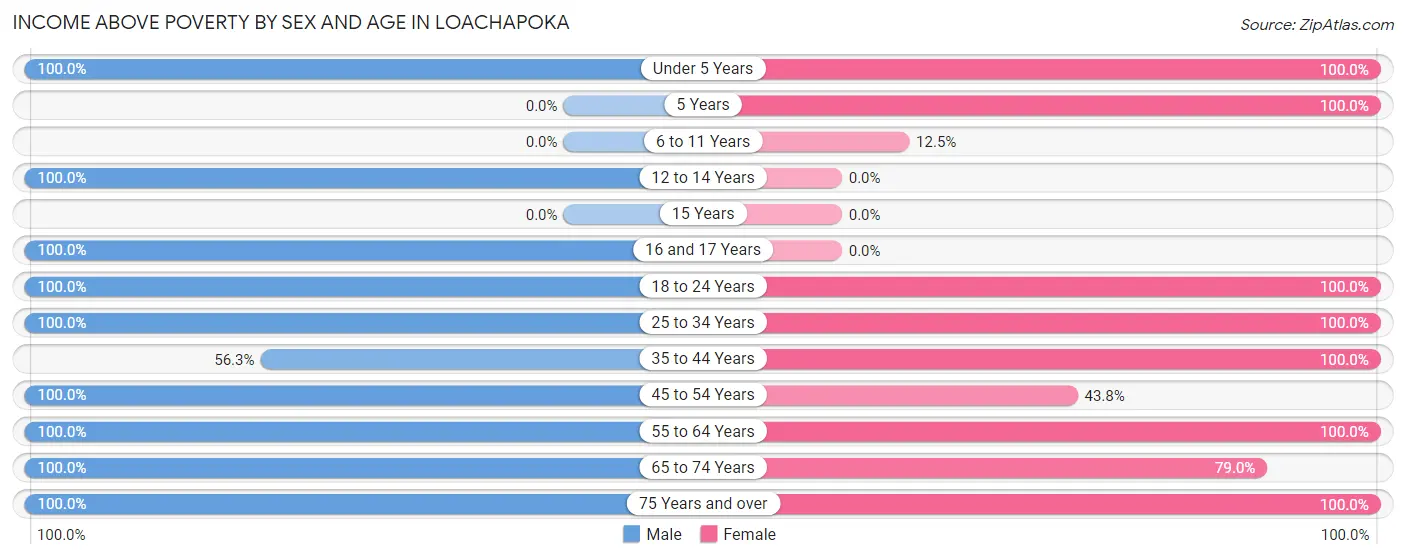
| Age Bracket | Male | Female |
| Under 5 Years | 1 (100.0%) | 1 (100.0%) |
| 5 Years | 0 (0.0%) | 16 (100.0%) |
| 6 to 11 Years | 0 (0.0%) | 1 (12.5%) |
| 12 to 14 Years | 1 (100.0%) | 0 (0.0%) |
| 15 Years | 0 (0.0%) | 0 (0.0%) |
| 16 and 17 Years | 1 (100.0%) | 0 (0.0%) |
| 18 to 24 Years | 27 (100.0%) | 5 (100.0%) |
| 25 to 34 Years | 21 (100.0%) | 9 (100.0%) |
| 35 to 44 Years | 9 (56.2%) | 24 (100.0%) |
| 45 to 54 Years | 2 (100.0%) | 7 (43.8%) |
| 55 to 64 Years | 20 (100.0%) | 17 (100.0%) |
| 65 to 74 Years | 12 (100.0%) | 15 (78.9%) |
| 75 Years and over | 7 (100.0%) | 4 (100.0%) |
| Total | 101 (93.5%) | 99 (83.2%) |
Income Below Poverty Among Married-Couple Families in Loachapoka
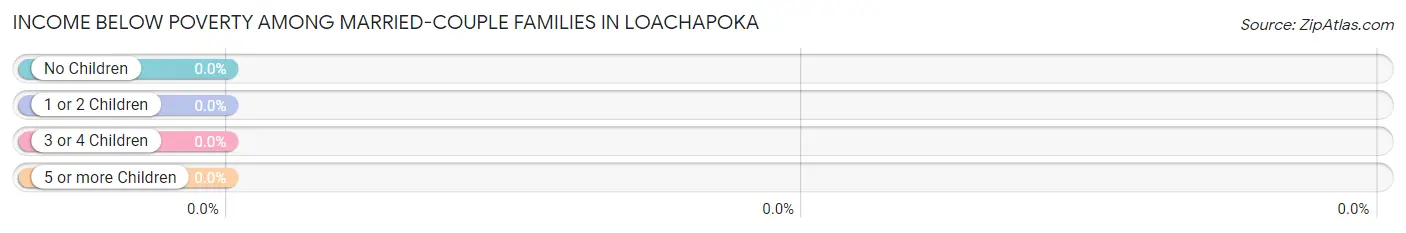
| Children | Above Poverty | Below Poverty |
| No Children | 34 (100.0%) | 0 (0.0%) |
| 1 or 2 Children | 9 (100.0%) | 0 (0.0%) |
| 3 or 4 Children | 1 (100.0%) | 0 (0.0%) |
| 5 or more Children | 0 (0.0%) | 0 (0.0%) |
| Total | 44 (100.0%) | 0 (0.0%) |
Income Below Poverty Among Single-Parent Households in Loachapoka
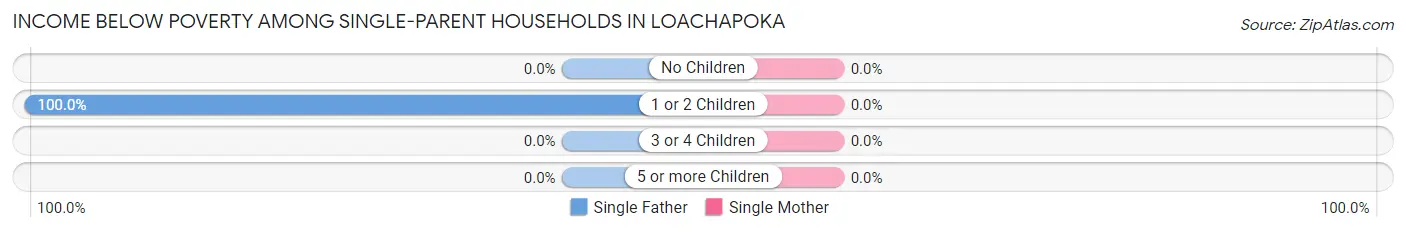
| Children | Single Father | Single Mother |
| No Children | 0 (0.0%) | 0 (0.0%) |
| 1 or 2 Children | 7 (100.0%) | 0 (0.0%) |
| 3 or 4 Children | 0 (0.0%) | 0 (0.0%) |
| 5 or more Children | 0 (0.0%) | 0 (0.0%) |
| Total | 7 (77.8%) | 0 (0.0%) |
Income Below Poverty Among Married-Couple vs Single-Parent Households in Loachapoka
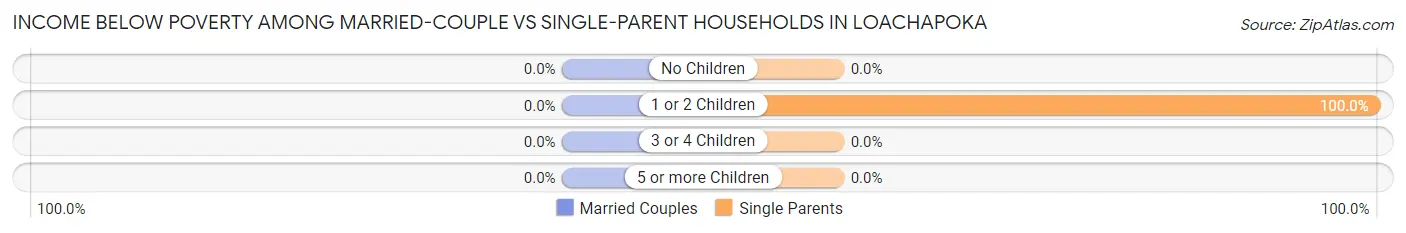
| Children | Married-Couple Families | Single-Parent Households |
| No Children | 0 (0.0%) | 0 (0.0%) |
| 1 or 2 Children | 0 (0.0%) | 7 (100.0%) |
| 3 or 4 Children | 0 (0.0%) | 0 (0.0%) |
| 5 or more Children | 0 (0.0%) | 0 (0.0%) |
| Total | 0 (0.0%) | 7 (41.2%) |
Race in Loachapoka
The most populous races in Loachapoka are White / Caucasian (146 | 64.3%), Black / African American (65 | 28.6%), and Two or more Races (15 | 6.6%).
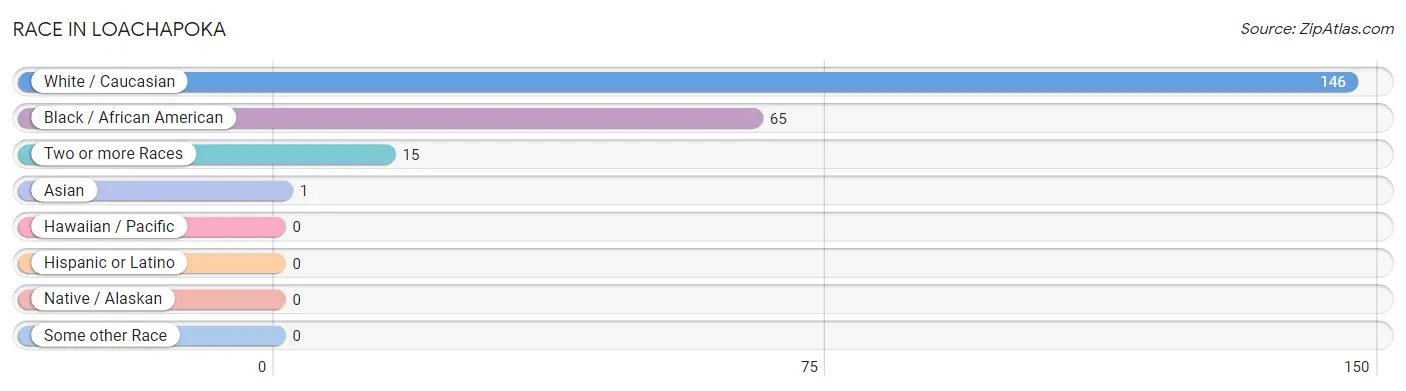
| Race | # Population | % Population |
| Asian | 1 | 0.4% |
| Black / African American | 65 | 28.6% |
| Hawaiian / Pacific | 0 | 0.0% |
| Hispanic or Latino | 0 | 0.0% |
| Native / Alaskan | 0 | 0.0% |
| White / Caucasian | 146 | 64.3% |
| Two or more Races | 15 | 6.6% |
| Some other Race | 0 | 0.0% |
| Total | 227 | 100.0% |
Ancestry in Loachapoka
The most populous ancestries reported in Loachapoka are American (50 | 22.0%), English (31 | 13.7%), German (31 | 13.7%), African (16 | 7.0%), and Subsaharan African (16 | 7.0%), together accounting for 63.4% of all Loachapoka residents.
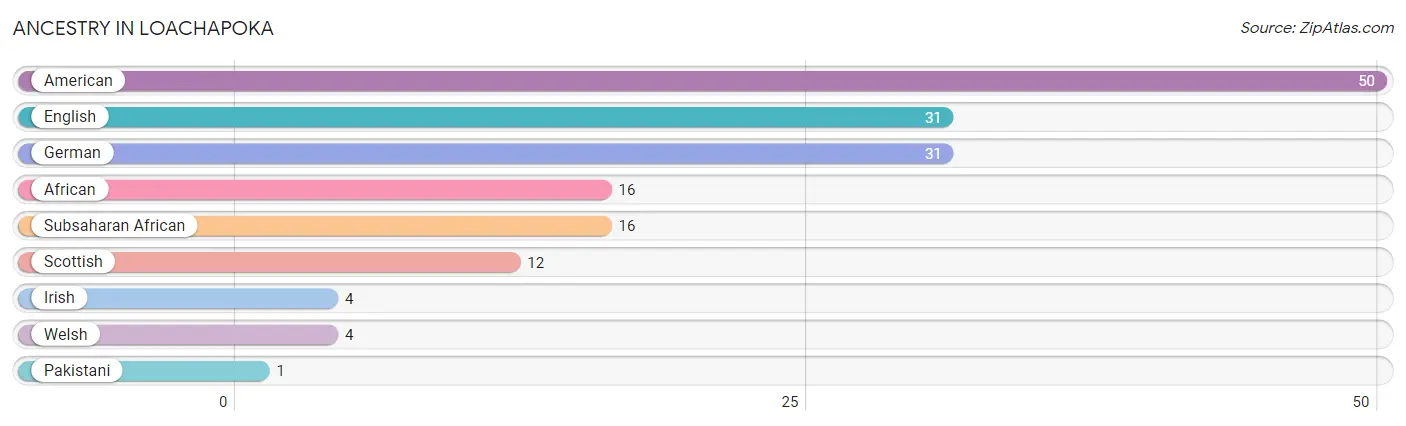
| Ancestry | # Population | % Population |
| African | 16 | 7.0% |
| American | 50 | 22.0% |
| English | 31 | 13.7% |
| German | 31 | 13.7% |
| Irish | 4 | 1.8% |
| Pakistani | 1 | 0.4% |
| Scottish | 12 | 5.3% |
| Subsaharan African | 16 | 7.0% |
| Welsh | 4 | 1.8% | View All 9 Rows |
Immigrants in Loachapoka
The most numerous immigrant groups reported in Loachapoka came from Asia (1 | 0.4%), South Eastern Asia (1 | 0.4%), and Thailand (1 | 0.4%), together accounting for 1.3% of all Loachapoka residents.
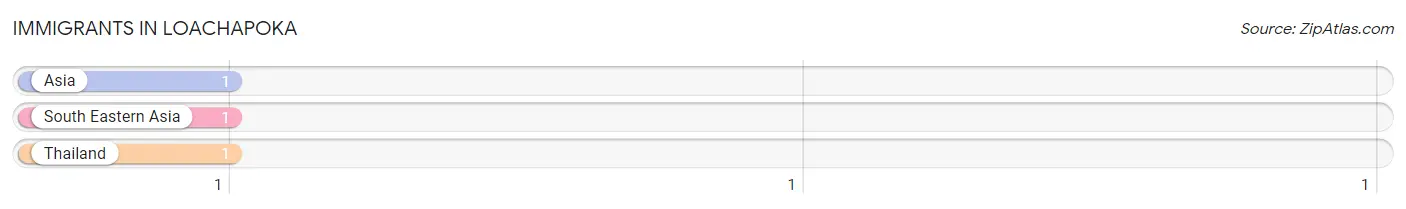
| Immigration Origin | # Population | % Population |
| Asia | 1 | 0.4% |
| South Eastern Asia | 1 | 0.4% |
| Thailand | 1 | 0.4% | View All 3 Rows |
Sex and Age in Loachapoka
Sex and Age in Loachapoka
The most populous age groups in Loachapoka are 20 to 24 Years (21 | 19.4%) for men and 5 to 9 Years (24 | 20.2%) for women.
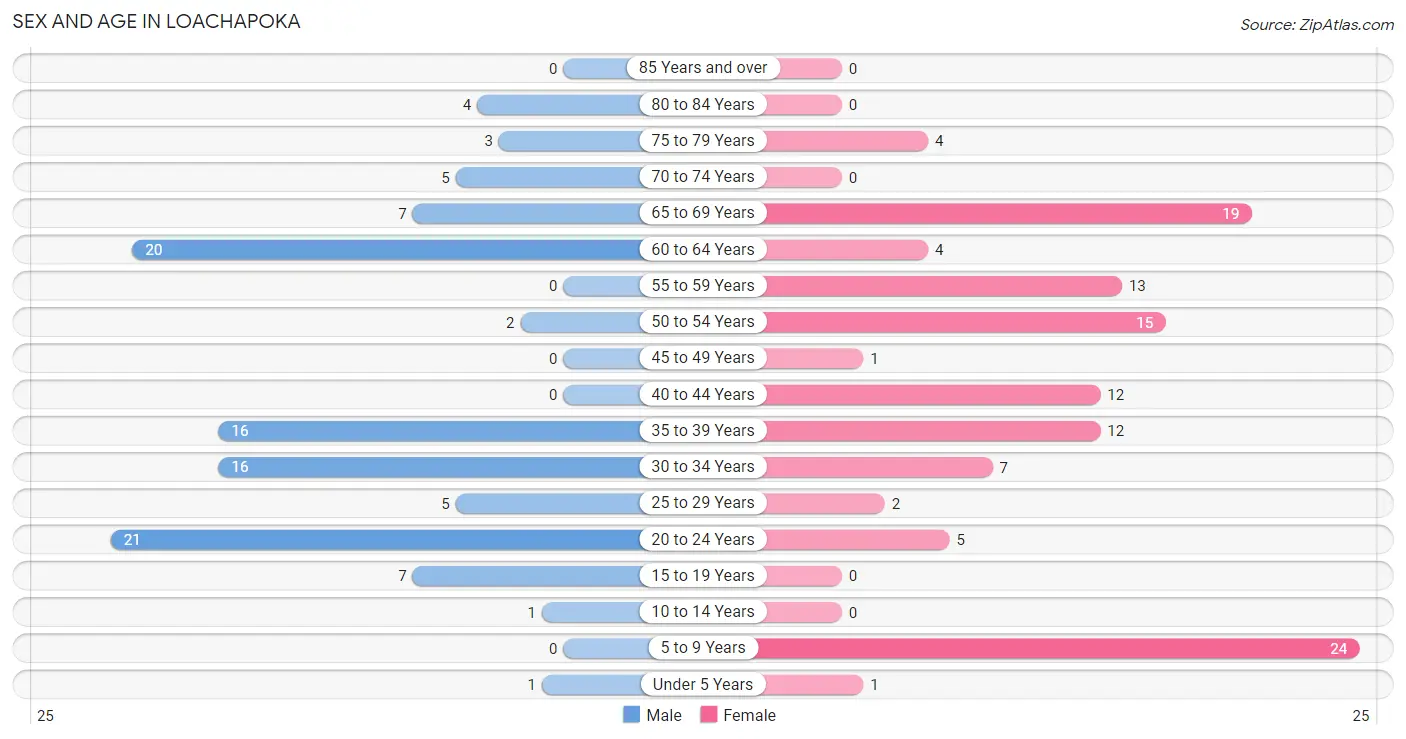
| Age Bracket | Male | Female |
| Under 5 Years | 1 (0.9%) | 1 (0.8%) |
| 5 to 9 Years | 0 (0.0%) | 24 (20.2%) |
| 10 to 14 Years | 1 (0.9%) | 0 (0.0%) |
| 15 to 19 Years | 7 (6.5%) | 0 (0.0%) |
| 20 to 24 Years | 21 (19.4%) | 5 (4.2%) |
| 25 to 29 Years | 5 (4.6%) | 2 (1.7%) |
| 30 to 34 Years | 16 (14.8%) | 7 (5.9%) |
| 35 to 39 Years | 16 (14.8%) | 12 (10.1%) |
| 40 to 44 Years | 0 (0.0%) | 12 (10.1%) |
| 45 to 49 Years | 0 (0.0%) | 1 (0.8%) |
| 50 to 54 Years | 2 (1.8%) | 15 (12.6%) |
| 55 to 59 Years | 0 (0.0%) | 13 (10.9%) |
| 60 to 64 Years | 20 (18.5%) | 4 (3.4%) |
| 65 to 69 Years | 7 (6.5%) | 19 (16.0%) |
| 70 to 74 Years | 5 (4.6%) | 0 (0.0%) |
| 75 to 79 Years | 3 (2.8%) | 4 (3.4%) |
| 80 to 84 Years | 4 (3.7%) | 0 (0.0%) |
| 85 Years and over | 0 (0.0%) | 0 (0.0%) |
| Total | 108 (100.0%) | 119 (100.0%) |
Families and Households in Loachapoka
Median Family Size in Loachapoka
The median family size in Loachapoka is 2.93 persons per family, with married-couple families (44 | 72.1%) accounting for the largest median family size of 3.2 persons per family. On the other hand, single female/mother families (8 | 13.1%) represent the smallest median family size with 2.00 persons per family.
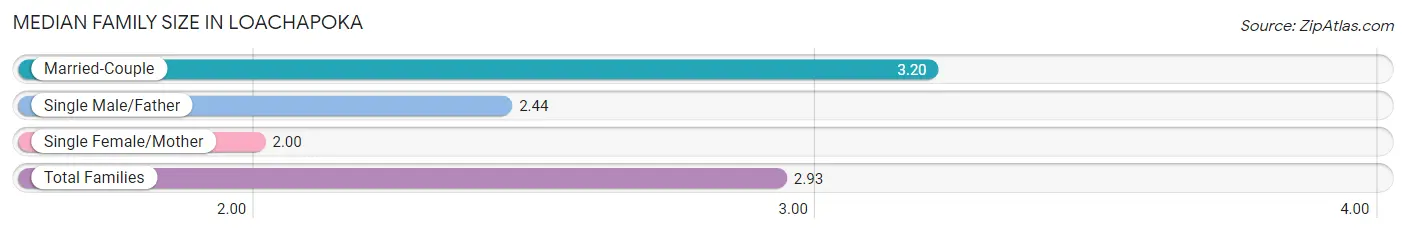
| Family Type | # Families | Family Size |
| Married-Couple | 44 (72.1%) | 3.20 |
| Single Male/Father | 9 (14.7%) | 2.44 |
| Single Female/Mother | 8 (13.1%) | 2.00 |
| Total Families | 61 (100.0%) | 2.93 |
Median Household Size in Loachapoka
The median household size in Loachapoka is 2.32 persons per household, with single male/father households (9 | 9.2%) accounting for the largest median household size of 3.44 persons per household. non-family households (37 | 37.8%) represent the smallest median household size with 1.05 persons per household.
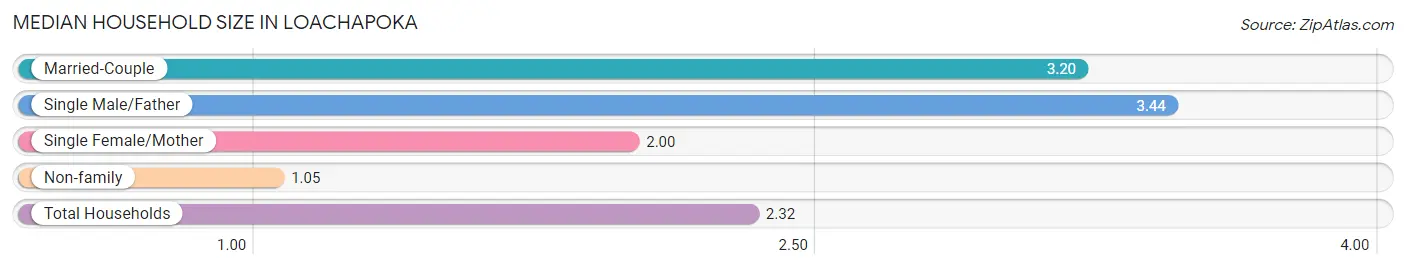
| Household Type | # Households | Household Size |
| Married-Couple | 44 (44.9%) | 3.20 |
| Single Male/Father | 9 (9.2%) | 3.44 |
| Single Female/Mother | 8 (8.2%) | 2.00 |
| Non-family | 37 (37.8%) | 1.05 |
| Total Households | 98 (100.0%) | 2.32 |
Household Size by Marriage Status in Loachapoka
Out of a total of 98 households in Loachapoka, 61 (62.2%) are family households, while 37 (37.8%) are nonfamily households. The most numerous type of family households are 2-person households, comprising 29, and the most common type of nonfamily households are 1-person households, comprising 22.
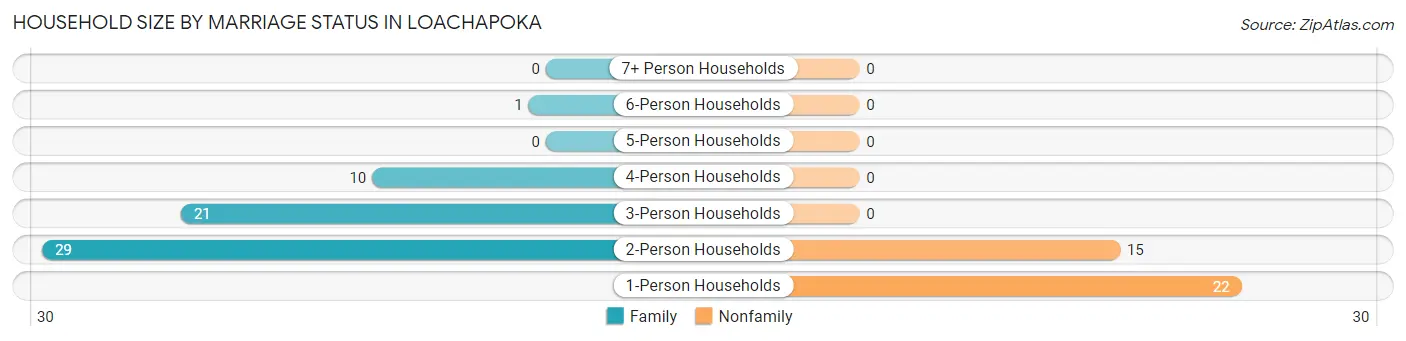
| Household Size | Family Households | Nonfamily Households |
| 1-Person Households | - | 22 (22.5%) |
| 2-Person Households | 29 (29.6%) | 15 (15.3%) |
| 3-Person Households | 21 (21.4%) | 0 (0.0%) |
| 4-Person Households | 10 (10.2%) | 0 (0.0%) |
| 5-Person Households | 0 (0.0%) | 0 (0.0%) |
| 6-Person Households | 1 (1.0%) | 0 (0.0%) |
| 7+ Person Households | 0 (0.0%) | 0 (0.0%) |
| Total | 61 (62.2%) | 37 (37.8%) |
Female Fertility in Loachapoka
Fertility by Age in Loachapoka
| Age Bracket | Women with Births | Births / 1,000 Women |
| 15 to 19 years | 0 (0.0%) | 0.0 |
| 20 to 34 years | 0 (0.0%) | 0.0 |
| 35 to 50 years | 0 (0.0%) | 0.0 |
| Total | 0 (0.0%) | 0.0 |
Fertility by Age by Marriage Status in Loachapoka
| Age Bracket | Married | Unmarried |
| 15 to 19 years | 0 (0.0%) | 0 (0.0%) |
| 20 to 34 years | 0 (0.0%) | 0 (0.0%) |
| 35 to 50 years | 0 (0.0%) | 0 (0.0%) |
| Total | 0 (0.0%) | 0 (0.0%) |
Fertility by Education in Loachapoka
| Educational Attainment | Women with Births | Births / 1,000 Women |
| Less than High School | 0 (0.0%) | 0.0 |
| High School Diploma | 0 (0.0%) | 0.0 |
| College or Associate's Degree | 0 (0.0%) | 0.0 |
| Bachelor's Degree | 0 (0.0%) | 0.0 |
| Graduate Degree | 0 (0.0%) | 0.0 |
| Total | 0 (0.0%) | 0.0 |
Fertility by Education by Marriage Status in Loachapoka
| Educational Attainment | Married | Unmarried |
| Less than High School | 0 (0.0%) | 0 (0.0%) |
| High School Diploma | 0 (0.0%) | 0 (0.0%) |
| College or Associate's Degree | 0 (0.0%) | 0 (0.0%) |
| Bachelor's Degree | 0 (0.0%) | 0 (0.0%) |
| Graduate Degree | 0 (0.0%) | 0 (0.0%) |
| Total | 0 (0.0%) | 0 (0.0%) |
Employment Characteristics in Loachapoka
Employment by Class of Employer in Loachapoka
Among the 118 employed individuals in Loachapoka, private company employees (79 | 66.9%), state government employees (10 | 8.5%), and self-employed (incorporated) (9 | 7.6%) make up the most common classes of employment.
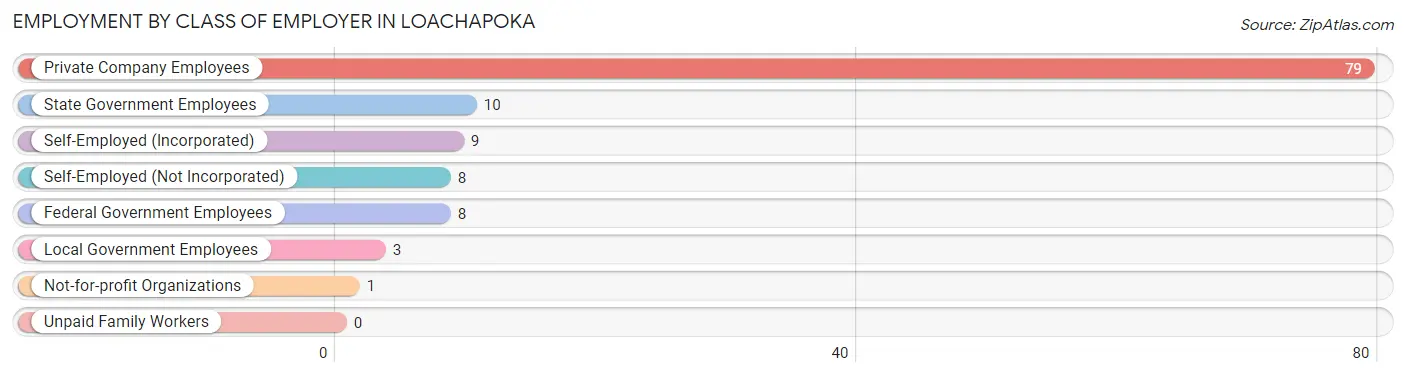
| Employer Class | # Employees | % Employees |
| Private Company Employees | 79 | 66.9% |
| Self-Employed (Incorporated) | 9 | 7.6% |
| Self-Employed (Not Incorporated) | 8 | 6.8% |
| Not-for-profit Organizations | 1 | 0.9% |
| Local Government Employees | 3 | 2.5% |
| State Government Employees | 10 | 8.5% |
| Federal Government Employees | 8 | 6.8% |
| Unpaid Family Workers | 0 | 0.0% |
| Total | 118 | 100.0% |
Employment Status by Age in Loachapoka
According to the labor force statistics for Loachapoka, out of the total population over 16 years of age (200), 67.5% or 135 individuals are in the labor force, with 5.9% or 8 of them unemployed. The age group with the highest labor force participation rate is 45 to 54 years, with 100.0% or 18 individuals in the labor force. Within the labor force, the 16 to 19 years age range has the highest percentage of unemployed individuals, with 100.0% or 6 of them being unemployed.
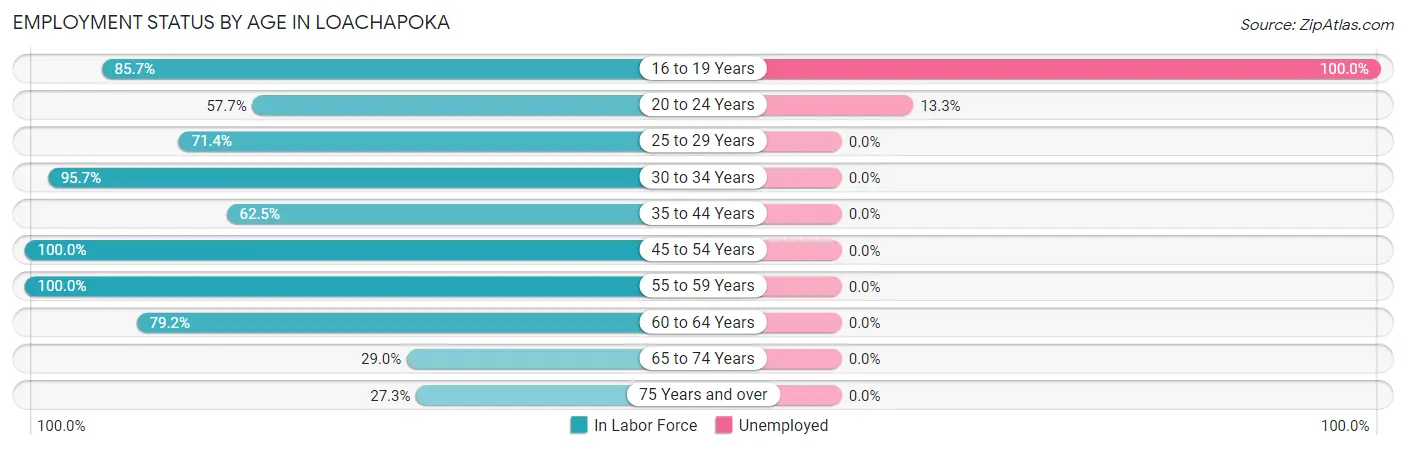
| Age Bracket | In Labor Force | Unemployed |
| 16 to 19 Years | 6 (85.7%) | 6 (100.0%) |
| 20 to 24 Years | 15 (57.7%) | 2 (13.3%) |
| 25 to 29 Years | 5 (71.4%) | 0 (0.0%) |
| 30 to 34 Years | 22 (95.7%) | 0 (0.0%) |
| 35 to 44 Years | 25 (62.5%) | 0 (0.0%) |
| 45 to 54 Years | 18 (100.0%) | 0 (0.0%) |
| 55 to 59 Years | 13 (100.0%) | 0 (0.0%) |
| 60 to 64 Years | 19 (79.2%) | 0 (0.0%) |
| 65 to 74 Years | 9 (29.0%) | 0 (0.0%) |
| 75 Years and over | 3 (27.3%) | 0 (0.0%) |
| Total | 135 (67.5%) | 8 (5.9%) |
Employment Status by Educational Attainment in Loachapoka
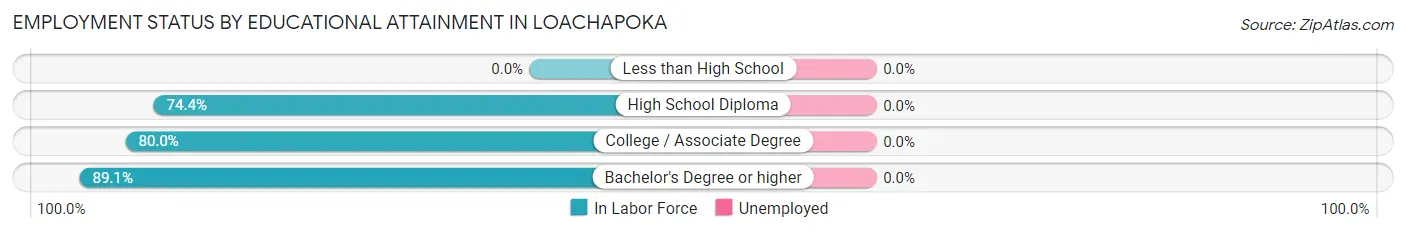
| Educational Attainment | In Labor Force | Unemployed |
| Less than High School | 0 (0.0%) | 0 (0.0%) |
| High School Diploma | 29 (74.4%) | 0 (0.0%) |
| College / Associate Degree | 32 (80.0%) | 0 (0.0%) |
| Bachelor's Degree or higher | 41 (89.1%) | 0 (0.0%) |
| Total | 102 (81.6%) | 0 (0.0%) |
Employment Occupations by Sex in Loachapoka
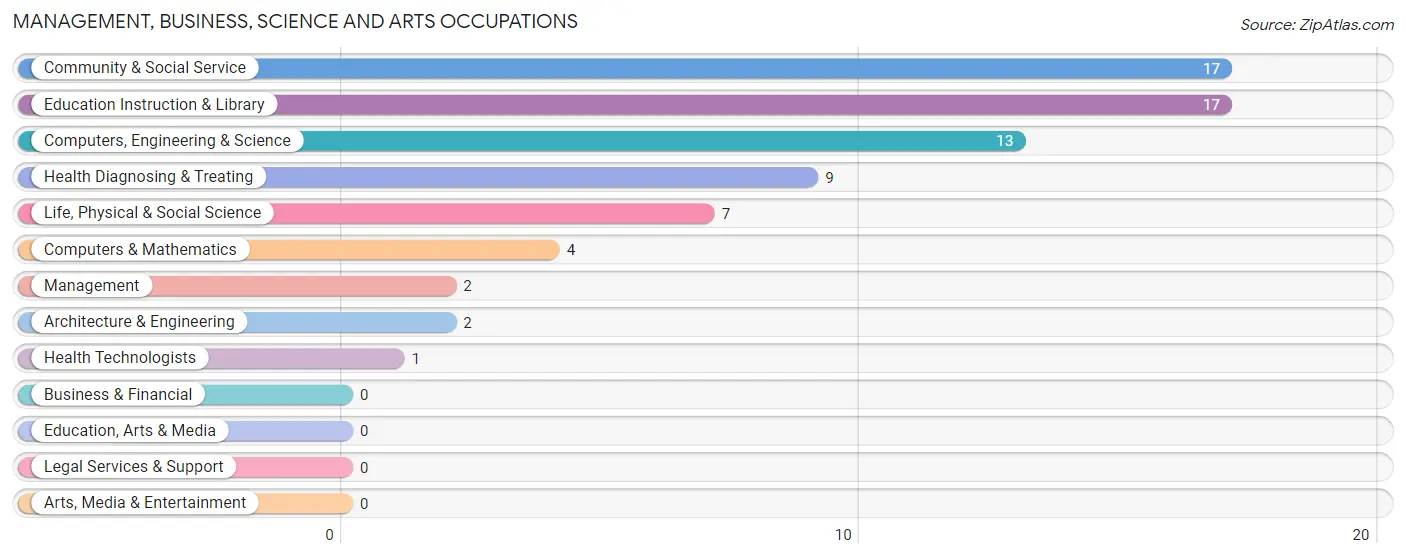
Management, Business, Science and Arts Occupations
The most common Management, Business, Science and Arts occupations in Loachapoka are Community & Social Service (17 | 13.4%), Education Instruction & Library (17 | 13.4%), Computers, Engineering & Science (13 | 10.2%), Health Diagnosing & Treating (9 | 7.1%), and Life, Physical & Social Science (7 | 5.5%).
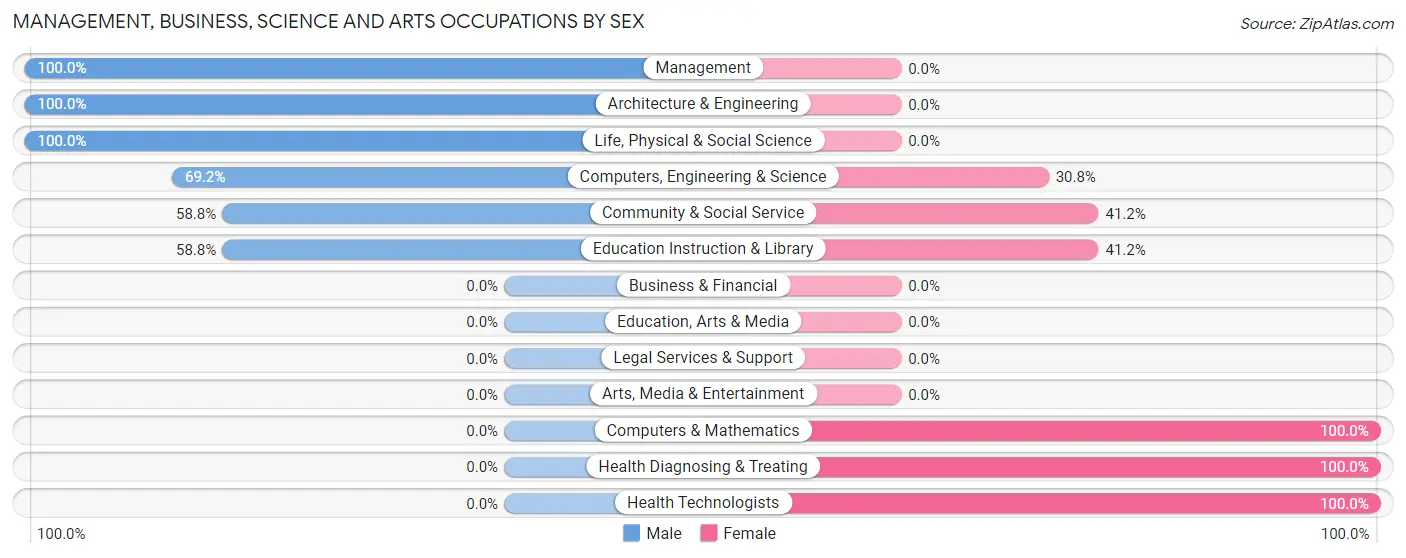
Management, Business, Science and Arts Occupations by Sex
Within the Management, Business, Science and Arts occupations in Loachapoka, the most male-oriented occupations are Management (100.0%), Architecture & Engineering (100.0%), and Life, Physical & Social Science (100.0%), while the most female-oriented occupations are Computers & Mathematics (100.0%), Health Diagnosing & Treating (100.0%), and Health Technologists (100.0%).
| Occupation | Male | Female |
| Management | 2 (100.0%) | 0 (0.0%) |
| Business & Financial | 0 (0.0%) | 0 (0.0%) |
| Computers, Engineering & Science | 9 (69.2%) | 4 (30.8%) |
| Computers & Mathematics | 0 (0.0%) | 4 (100.0%) |
| Architecture & Engineering | 2 (100.0%) | 0 (0.0%) |
| Life, Physical & Social Science | 7 (100.0%) | 0 (0.0%) |
| Community & Social Service | 10 (58.8%) | 7 (41.2%) |
| Education, Arts & Media | 0 (0.0%) | 0 (0.0%) |
| Legal Services & Support | 0 (0.0%) | 0 (0.0%) |
| Education Instruction & Library | 10 (58.8%) | 7 (41.2%) |
| Arts, Media & Entertainment | 0 (0.0%) | 0 (0.0%) |
| Health Diagnosing & Treating | 0 (0.0%) | 9 (100.0%) |
| Health Technologists | 0 (0.0%) | 1 (100.0%) |
| Total (Category) | 21 (51.2%) | 20 (48.8%) |
| Total (Overall) | 63 (49.6%) | 64 (50.4%) |
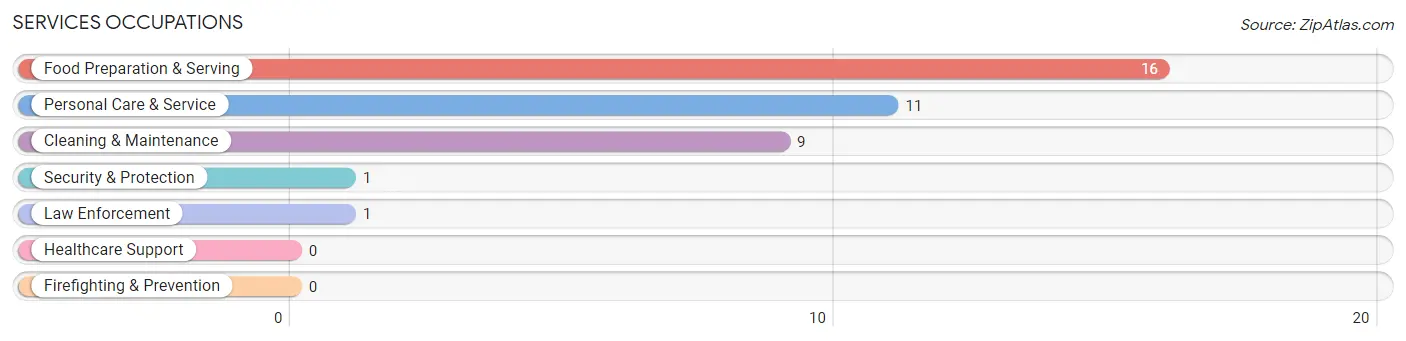
Services Occupations
The most common Services occupations in Loachapoka are Food Preparation & Serving (16 | 12.6%), Personal Care & Service (11 | 8.7%), Cleaning & Maintenance (9 | 7.1%), Security & Protection (1 | 0.8%), and Law Enforcement (1 | 0.8%).
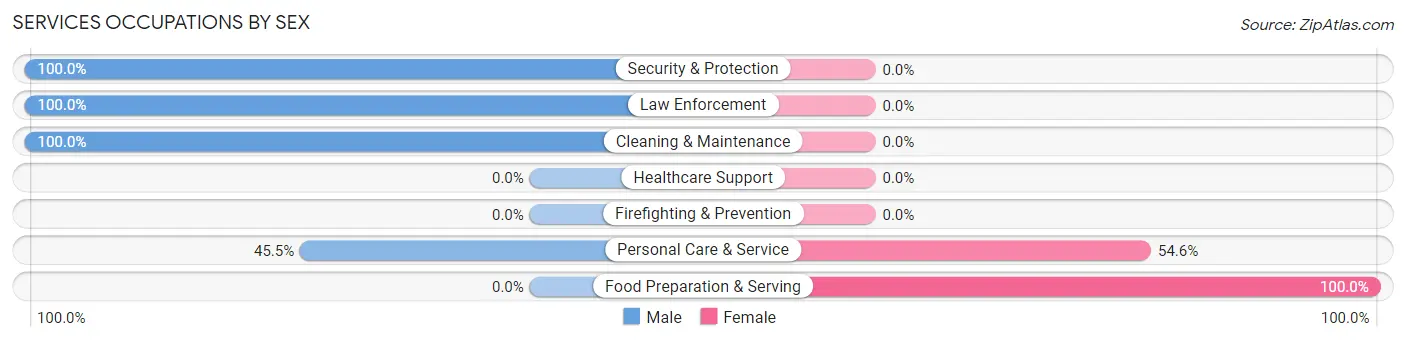
Services Occupations by Sex
Within the Services occupations in Loachapoka, the most male-oriented occupations are Security & Protection (100.0%), Law Enforcement (100.0%), and Cleaning & Maintenance (100.0%), while the most female-oriented occupations are Food Preparation & Serving (100.0%), and Personal Care & Service (54.5%).
| Occupation | Male | Female |
| Healthcare Support | 0 (0.0%) | 0 (0.0%) |
| Security & Protection | 1 (100.0%) | 0 (0.0%) |
| Firefighting & Prevention | 0 (0.0%) | 0 (0.0%) |
| Law Enforcement | 1 (100.0%) | 0 (0.0%) |
| Food Preparation & Serving | 0 (0.0%) | 16 (100.0%) |
| Cleaning & Maintenance | 9 (100.0%) | 0 (0.0%) |
| Personal Care & Service | 5 (45.5%) | 6 (54.5%) |
| Total (Category) | 15 (40.5%) | 22 (59.5%) |
| Total (Overall) | 63 (49.6%) | 64 (50.4%) |
Sales and Office Occupations
The most common Sales and Office occupations in Loachapoka are Office & Administration (14 | 11.0%), and Sales & Related (5 | 3.9%).
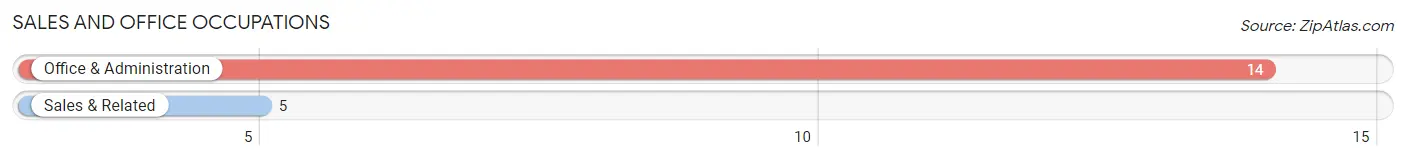
Sales and Office Occupations by Sex
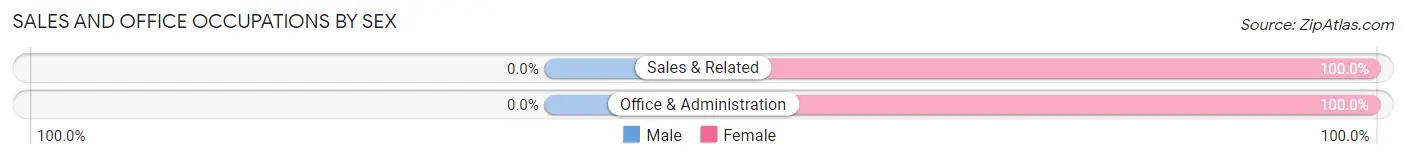
| Occupation | Male | Female |
| Sales & Related | 0 (0.0%) | 5 (100.0%) |
| Office & Administration | 0 (0.0%) | 14 (100.0%) |
| Total (Category) | 0 (0.0%) | 19 (100.0%) |
| Total (Overall) | 63 (49.6%) | 64 (50.4%) |
Natural Resources, Construction and Maintenance Occupations
The most common Natural Resources, Construction and Maintenance occupations in Loachapoka are , and Installation, Maintenance & Repair (18 | 14.2%).
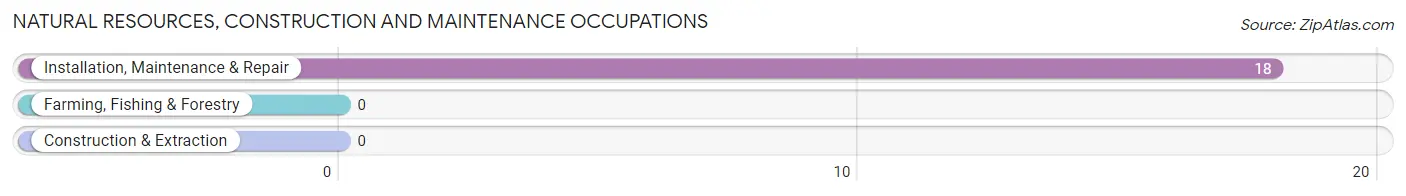
Natural Resources, Construction and Maintenance Occupations by Sex
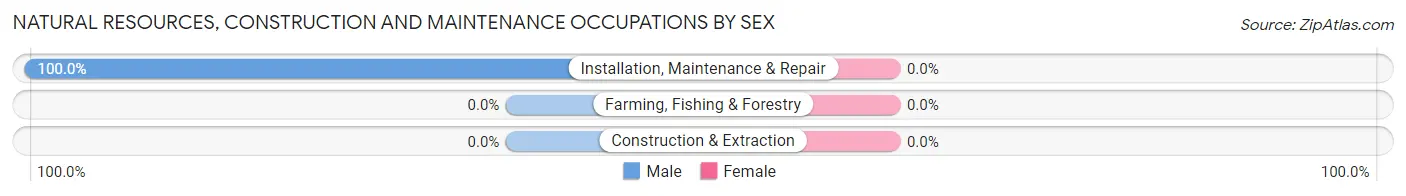
| Occupation | Male | Female |
| Farming, Fishing & Forestry | 0 (0.0%) | 0 (0.0%) |
| Construction & Extraction | 0 (0.0%) | 0 (0.0%) |
| Installation, Maintenance & Repair | 18 (100.0%) | 0 (0.0%) |
| Total (Category) | 18 (100.0%) | 0 (0.0%) |
| Total (Overall) | 63 (49.6%) | 64 (50.4%) |
Production, Transportation and Moving Occupations
The most common Production, Transportation and Moving occupations in Loachapoka are , and Production (12 | 9.5%).
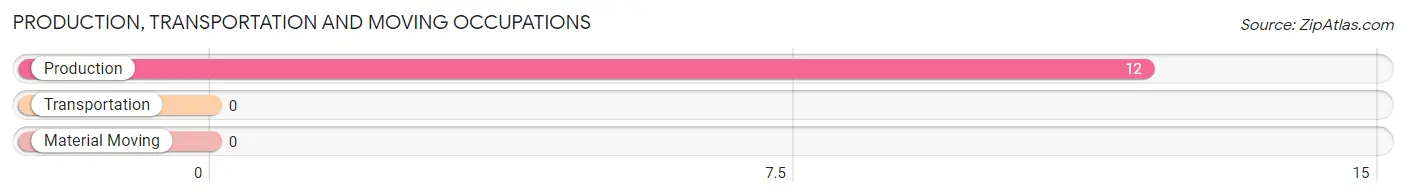
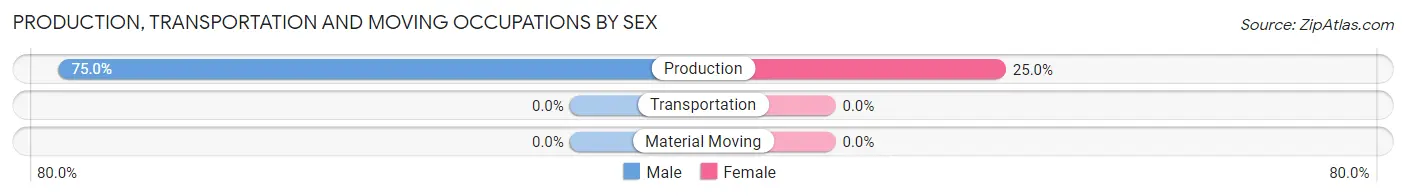
Production, Transportation and Moving Occupations by Sex
| Occupation | Male | Female |
| Production | 9 (75.0%) | 3 (25.0%) |
| Transportation | 0 (0.0%) | 0 (0.0%) |
| Material Moving | 0 (0.0%) | 0 (0.0%) |
| Total (Category) | 9 (75.0%) | 3 (25.0%) |
| Total (Overall) | 63 (49.6%) | 64 (50.4%) |
Employment Industries by Sex in Loachapoka
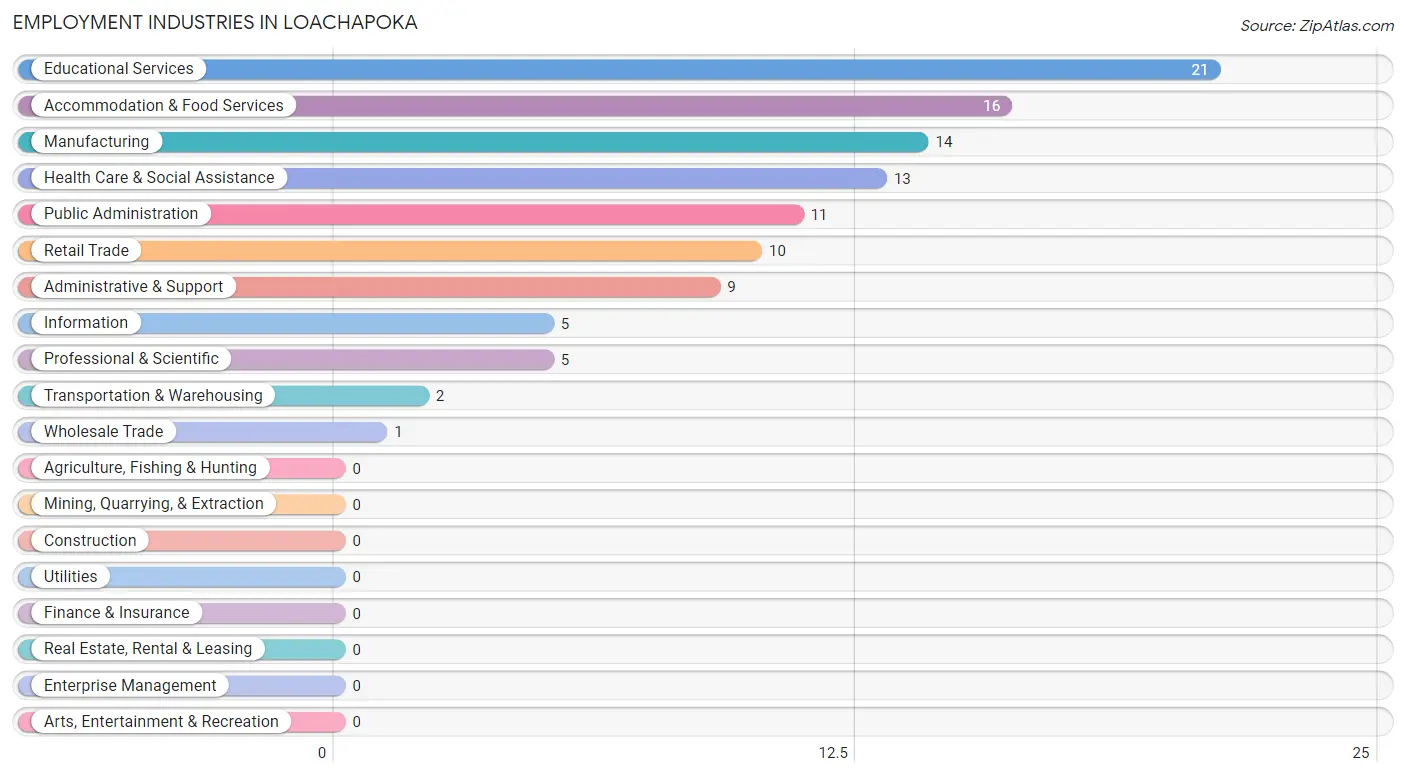
Employment Industries in Loachapoka
The major employment industries in Loachapoka include Educational Services (21 | 16.5%), Accommodation & Food Services (16 | 12.6%), Manufacturing (14 | 11.0%), Health Care & Social Assistance (13 | 10.2%), and Public Administration (11 | 8.7%).
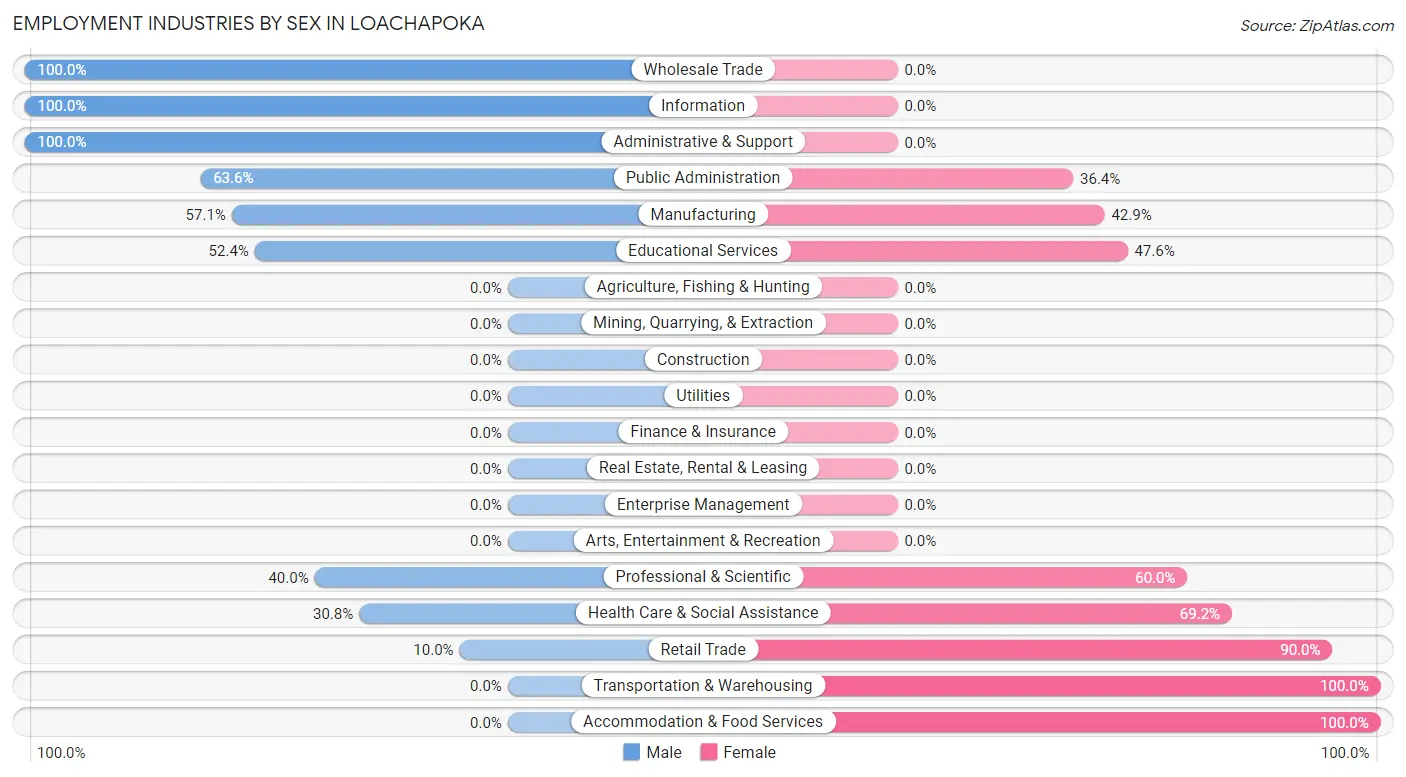
Employment Industries by Sex in Loachapoka
The Loachapoka industries that see more men than women are Wholesale Trade (100.0%), Information (100.0%), and Administrative & Support (100.0%), whereas the industries that tend to have a higher number of women are Transportation & Warehousing (100.0%), Accommodation & Food Services (100.0%), and Retail Trade (90.0%).
| Industry | Male | Female |
| Agriculture, Fishing & Hunting | 0 (0.0%) | 0 (0.0%) |
| Mining, Quarrying, & Extraction | 0 (0.0%) | 0 (0.0%) |
| Construction | 0 (0.0%) | 0 (0.0%) |
| Manufacturing | 8 (57.1%) | 6 (42.9%) |
| Wholesale Trade | 1 (100.0%) | 0 (0.0%) |
| Retail Trade | 1 (10.0%) | 9 (90.0%) |
| Transportation & Warehousing | 0 (0.0%) | 2 (100.0%) |
| Utilities | 0 (0.0%) | 0 (0.0%) |
| Information | 5 (100.0%) | 0 (0.0%) |
| Finance & Insurance | 0 (0.0%) | 0 (0.0%) |
| Real Estate, Rental & Leasing | 0 (0.0%) | 0 (0.0%) |
| Professional & Scientific | 2 (40.0%) | 3 (60.0%) |
| Enterprise Management | 0 (0.0%) | 0 (0.0%) |
| Administrative & Support | 9 (100.0%) | 0 (0.0%) |
| Educational Services | 11 (52.4%) | 10 (47.6%) |
| Health Care & Social Assistance | 4 (30.8%) | 9 (69.2%) |
| Arts, Entertainment & Recreation | 0 (0.0%) | 0 (0.0%) |
| Accommodation & Food Services | 0 (0.0%) | 16 (100.0%) |
| Public Administration | 7 (63.6%) | 4 (36.4%) |
| Total | 63 (49.6%) | 64 (50.4%) |
Education in Loachapoka
School Enrollment in Loachapoka
The most common levels of schooling among the 31 students in Loachapoka are kindergarten (16 | 51.6%), graduate / professional (7 | 22.6%), and college / undergraduate (5 | 16.1%).
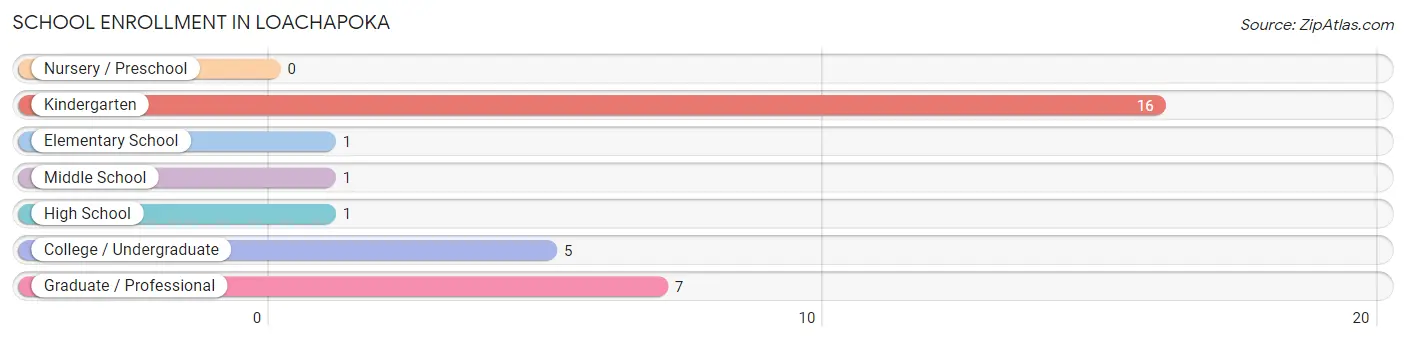
| School Level | # Students | % Students |
| Nursery / Preschool | 0 | 0.0% |
| Kindergarten | 16 | 51.6% |
| Elementary School | 1 | 3.2% |
| Middle School | 1 | 3.2% |
| High School | 1 | 3.2% |
| College / Undergraduate | 5 | 16.1% |
| Graduate / Professional | 7 | 22.6% |
| Total | 31 | 100.0% |
School Enrollment by Age by Funding Source in Loachapoka
Out of a total of 31 students who are enrolled in schools in Loachapoka, 18 (58.1%) attend a private institution, while the remaining 13 (41.9%) are enrolled in public schools. The age group of 5 to 9 year old has the highest likelihood of being enrolled in private schools, with 17 (100.0% in the age bracket) enrolled. Conversely, the age group of 15 to 17 year olds has the lowest likelihood of being enrolled in a private school, with 1 (100.0% in the age bracket) attending a public institution.
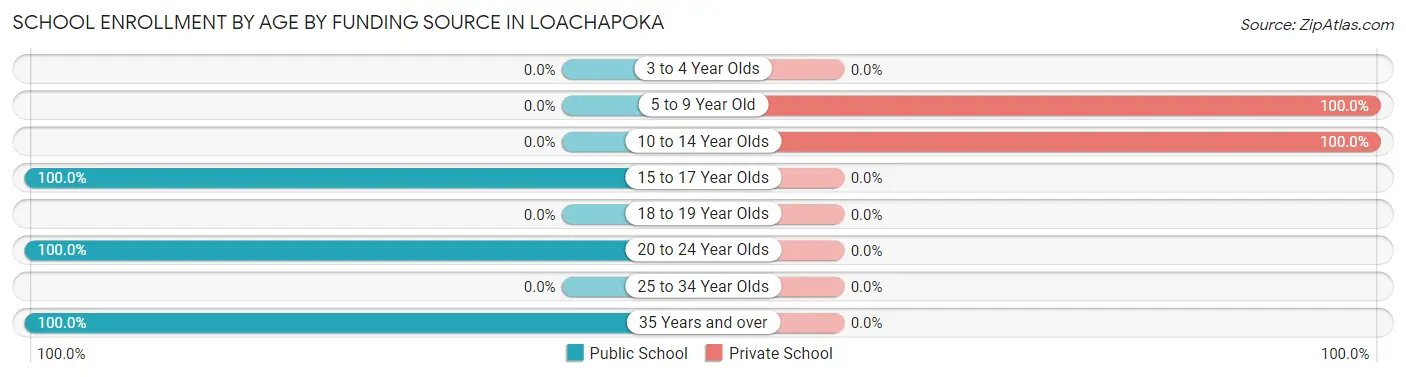
| Age Bracket | Public School | Private School |
| 3 to 4 Year Olds | 0 (0.0%) | 0 (0.0%) |
| 5 to 9 Year Old | 0 (0.0%) | 17 (100.0%) |
| 10 to 14 Year Olds | 0 (0.0%) | 1 (100.0%) |
| 15 to 17 Year Olds | 1 (100.0%) | 0 (0.0%) |
| 18 to 19 Year Olds | 0 (0.0%) | 0 (0.0%) |
| 20 to 24 Year Olds | 2 (100.0%) | 0 (0.0%) |
| 25 to 34 Year Olds | 0 (0.0%) | 0 (0.0%) |
| 35 Years and over | 10 (100.0%) | 0 (0.0%) |
| Total | 13 (41.9%) | 18 (58.1%) |
Educational Attainment by Field of Study in Loachapoka
Science & technology (16 | 21.6%), business (15 | 20.3%), bio, nature & agricultural (11 | 14.9%), education (9 | 12.2%), and arts & humanities (7 | 9.5%) are the most common fields of study among 74 individuals in Loachapoka who have obtained a bachelor's degree or higher.
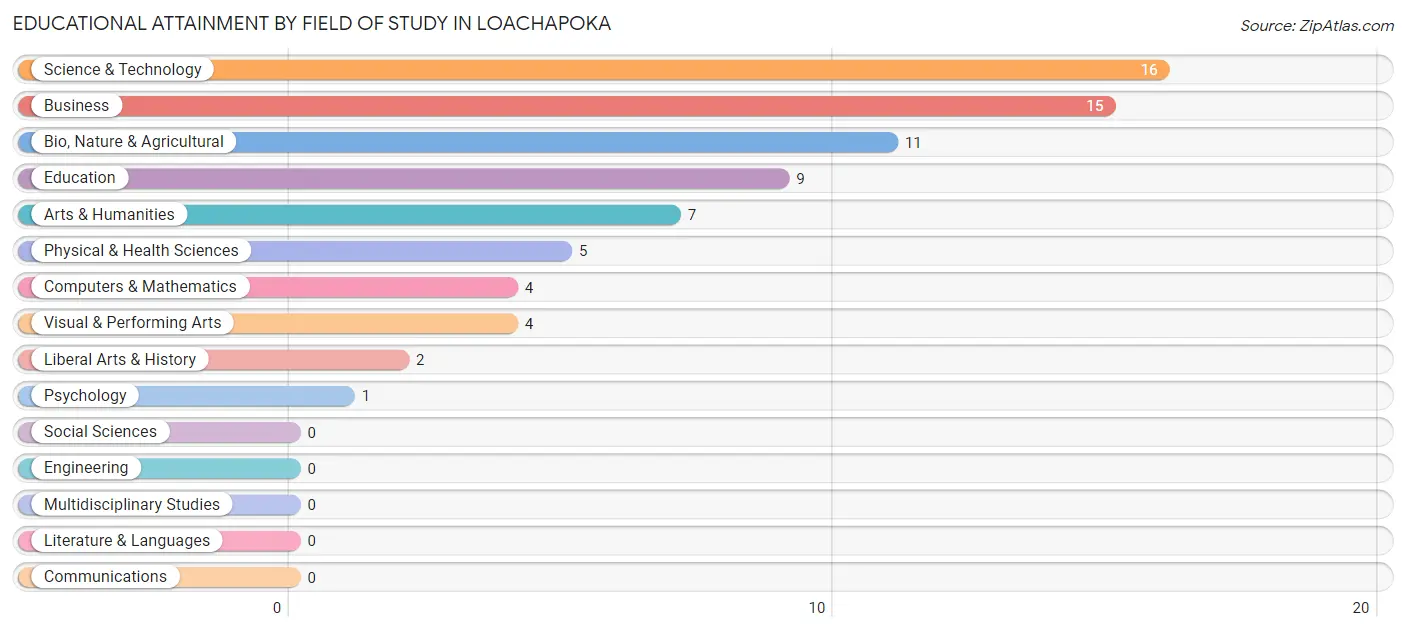
| Field of Study | # Graduates | % Graduates |
| Computers & Mathematics | 4 | 5.4% |
| Bio, Nature & Agricultural | 11 | 14.9% |
| Physical & Health Sciences | 5 | 6.8% |
| Psychology | 1 | 1.3% |
| Social Sciences | 0 | 0.0% |
| Engineering | 0 | 0.0% |
| Multidisciplinary Studies | 0 | 0.0% |
| Science & Technology | 16 | 21.6% |
| Business | 15 | 20.3% |
| Education | 9 | 12.2% |
| Literature & Languages | 0 | 0.0% |
| Liberal Arts & History | 2 | 2.7% |
| Visual & Performing Arts | 4 | 5.4% |
| Communications | 0 | 0.0% |
| Arts & Humanities | 7 | 9.5% |
| Total | 74 | 100.0% |
Transportation & Commute in Loachapoka
Vehicle Availability by Sex in Loachapoka
The most prevalent vehicle ownership categories in Loachapoka are males with 1 vehicle (18, accounting for 28.6%) and females with 1 vehicle (19, making up 32.7%).
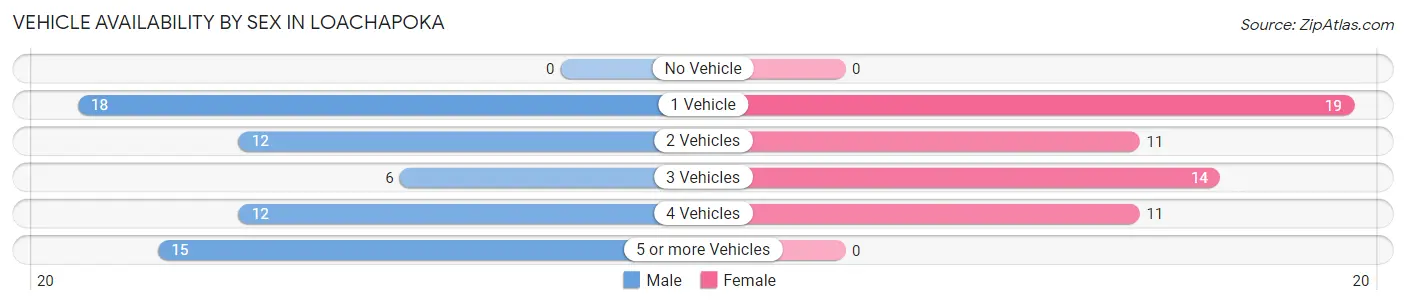
| Vehicles Available | Male | Female |
| No Vehicle | 0 (0.0%) | 0 (0.0%) |
| 1 Vehicle | 18 (28.6%) | 19 (34.5%) |
| 2 Vehicles | 12 (19.1%) | 11 (20.0%) |
| 3 Vehicles | 6 (9.5%) | 14 (25.5%) |
| 4 Vehicles | 12 (19.1%) | 11 (20.0%) |
| 5 or more Vehicles | 15 (23.8%) | 0 (0.0%) |
| Total | 63 (100.0%) | 55 (100.0%) |
Commute Time in Loachapoka
The most frequently occuring commute durations in Loachapoka are 30 to 34 minutes (27 commuters, 24.3%), 90 or more minutes (18 commuters, 16.2%), and 10 to 14 minutes (16 commuters, 14.4%).
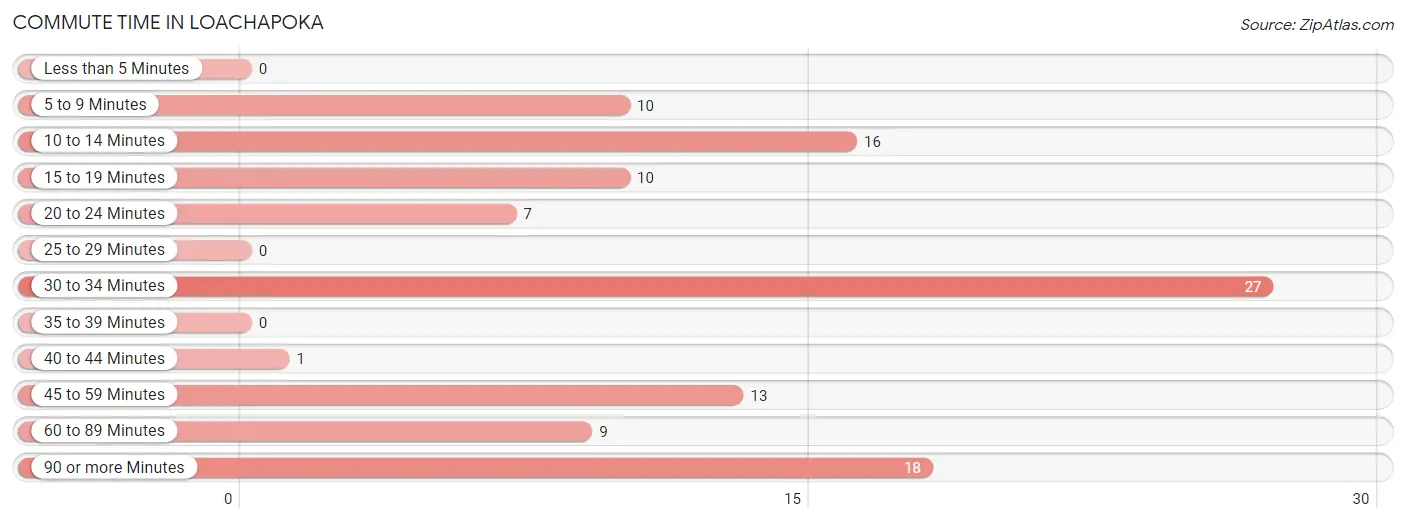
| Commute Time | # Commuters | % Commuters |
| Less than 5 Minutes | 0 | 0.0% |
| 5 to 9 Minutes | 10 | 9.0% |
| 10 to 14 Minutes | 16 | 14.4% |
| 15 to 19 Minutes | 10 | 9.0% |
| 20 to 24 Minutes | 7 | 6.3% |
| 25 to 29 Minutes | 0 | 0.0% |
| 30 to 34 Minutes | 27 | 24.3% |
| 35 to 39 Minutes | 0 | 0.0% |
| 40 to 44 Minutes | 1 | 0.9% |
| 45 to 59 Minutes | 13 | 11.7% |
| 60 to 89 Minutes | 9 | 8.1% |
| 90 or more Minutes | 18 | 16.2% |
Commute Time by Sex in Loachapoka
The most common commute times in Loachapoka are 30 to 34 minutes (16 commuters, 26.7%) for males and 10 to 14 minutes (12 commuters, 23.5%) for females.
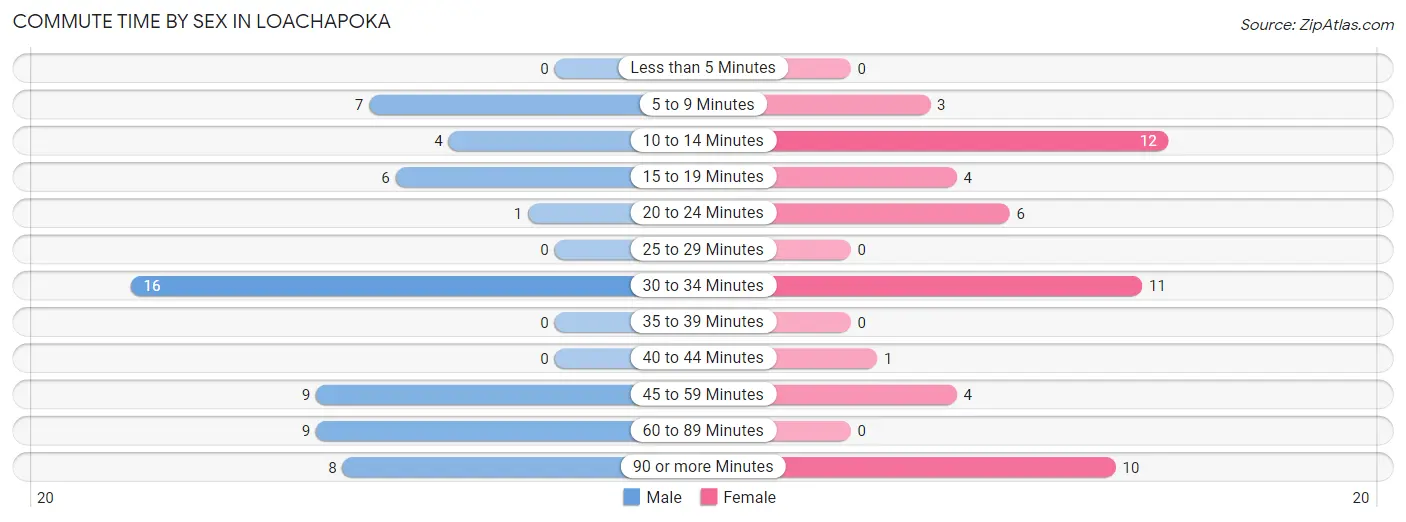
| Commute Time | Male | Female |
| Less than 5 Minutes | 0 (0.0%) | 0 (0.0%) |
| 5 to 9 Minutes | 7 (11.7%) | 3 (5.9%) |
| 10 to 14 Minutes | 4 (6.7%) | 12 (23.5%) |
| 15 to 19 Minutes | 6 (10.0%) | 4 (7.8%) |
| 20 to 24 Minutes | 1 (1.7%) | 6 (11.8%) |
| 25 to 29 Minutes | 0 (0.0%) | 0 (0.0%) |
| 30 to 34 Minutes | 16 (26.7%) | 11 (21.6%) |
| 35 to 39 Minutes | 0 (0.0%) | 0 (0.0%) |
| 40 to 44 Minutes | 0 (0.0%) | 1 (2.0%) |
| 45 to 59 Minutes | 9 (15.0%) | 4 (7.8%) |
| 60 to 89 Minutes | 9 (15.0%) | 0 (0.0%) |
| 90 or more Minutes | 8 (13.3%) | 10 (19.6%) |
Time of Departure to Work by Sex in Loachapoka
The most frequent times of departure to work in Loachapoka are 8:00 AM to 8:29 AM (21, 35.0%) for males and 6:30 AM to 6:59 AM (14, 27.5%) for females.
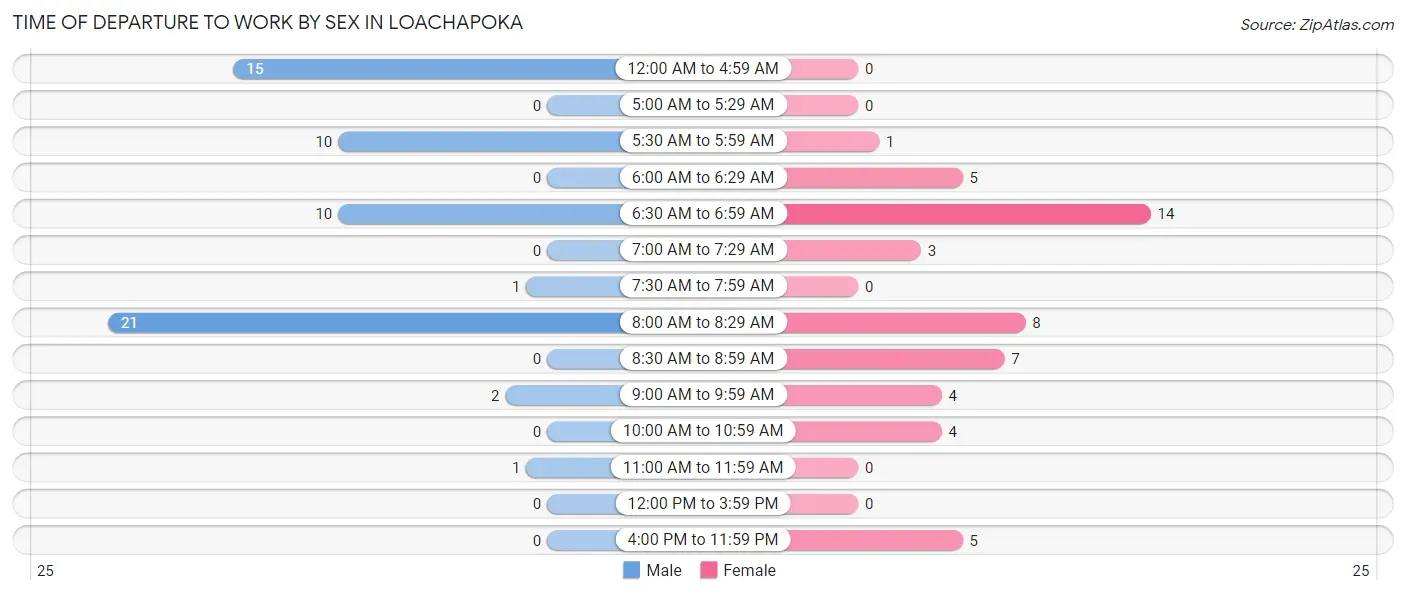
| Time of Departure | Male | Female |
| 12:00 AM to 4:59 AM | 15 (25.0%) | 0 (0.0%) |
| 5:00 AM to 5:29 AM | 0 (0.0%) | 0 (0.0%) |
| 5:30 AM to 5:59 AM | 10 (16.7%) | 1 (2.0%) |
| 6:00 AM to 6:29 AM | 0 (0.0%) | 5 (9.8%) |
| 6:30 AM to 6:59 AM | 10 (16.7%) | 14 (27.5%) |
| 7:00 AM to 7:29 AM | 0 (0.0%) | 3 (5.9%) |
| 7:30 AM to 7:59 AM | 1 (1.7%) | 0 (0.0%) |
| 8:00 AM to 8:29 AM | 21 (35.0%) | 8 (15.7%) |
| 8:30 AM to 8:59 AM | 0 (0.0%) | 7 (13.7%) |
| 9:00 AM to 9:59 AM | 2 (3.3%) | 4 (7.8%) |
| 10:00 AM to 10:59 AM | 0 (0.0%) | 4 (7.8%) |
| 11:00 AM to 11:59 AM | 1 (1.7%) | 0 (0.0%) |
| 12:00 PM to 3:59 PM | 0 (0.0%) | 0 (0.0%) |
| 4:00 PM to 11:59 PM | 0 (0.0%) | 5 (9.8%) |
| Total | 60 (100.0%) | 51 (100.0%) |
Housing Occupancy in Loachapoka
Occupancy by Ownership in Loachapoka
Of the total 98 dwellings in Loachapoka, owner-occupied units account for 51 (52.0%), while renter-occupied units make up 47 (48.0%).
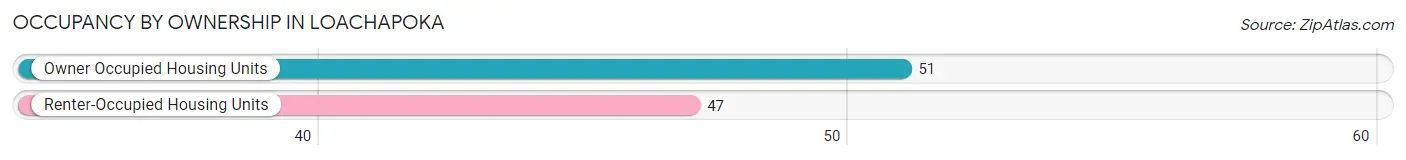
| Occupancy | # Housing Units | % Housing Units |
| Owner Occupied Housing Units | 51 | 52.0% |
| Renter-Occupied Housing Units | 47 | 48.0% |
| Total Occupied Housing Units | 98 | 100.0% |
Occupancy by Household Size in Loachapoka
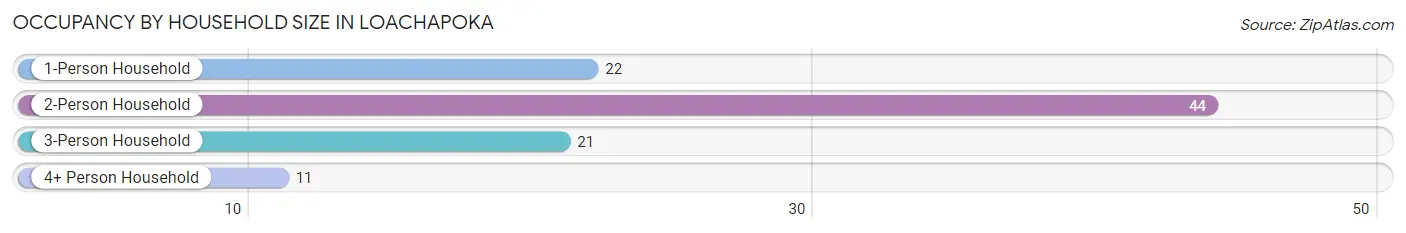
| Household Size | # Housing Units | % Housing Units |
| 1-Person Household | 22 | 22.5% |
| 2-Person Household | 44 | 44.9% |
| 3-Person Household | 21 | 21.4% |
| 4+ Person Household | 11 | 11.2% |
| Total Housing Units | 98 | 100.0% |
Occupancy by Ownership by Household Size in Loachapoka
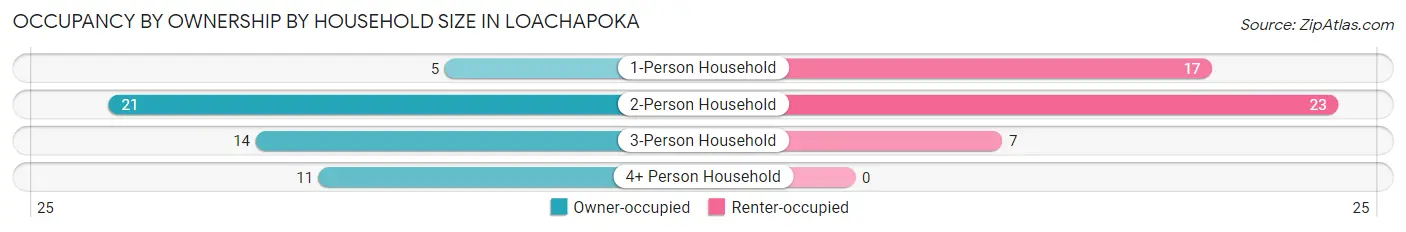
| Household Size | Owner-occupied | Renter-occupied |
| 1-Person Household | 5 (22.7%) | 17 (77.3%) |
| 2-Person Household | 21 (47.7%) | 23 (52.3%) |
| 3-Person Household | 14 (66.7%) | 7 (33.3%) |
| 4+ Person Household | 11 (100.0%) | 0 (0.0%) |
| Total Housing Units | 51 (52.0%) | 47 (48.0%) |
Occupancy by Educational Attainment in Loachapoka
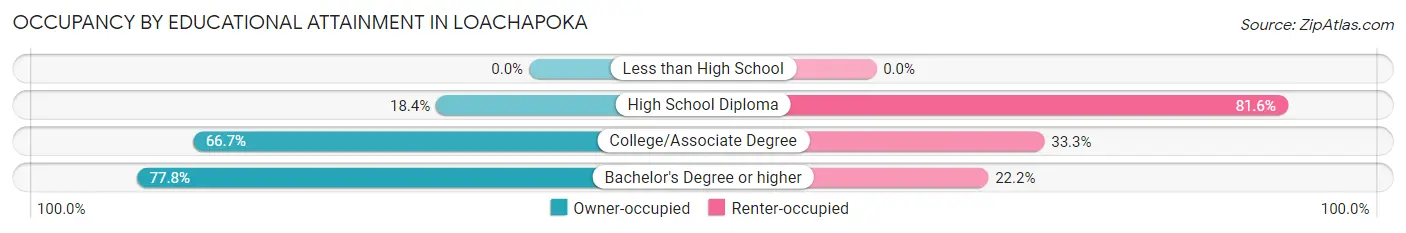
| Household Size | Owner-occupied | Renter-occupied |
| Less than High School | 0 (0.0%) | 0 (0.0%) |
| High School Diploma | 7 (18.4%) | 31 (81.6%) |
| College/Associate Degree | 16 (66.7%) | 8 (33.3%) |
| Bachelor's Degree or higher | 28 (77.8%) | 8 (22.2%) |
Occupancy by Age of Householder in Loachapoka
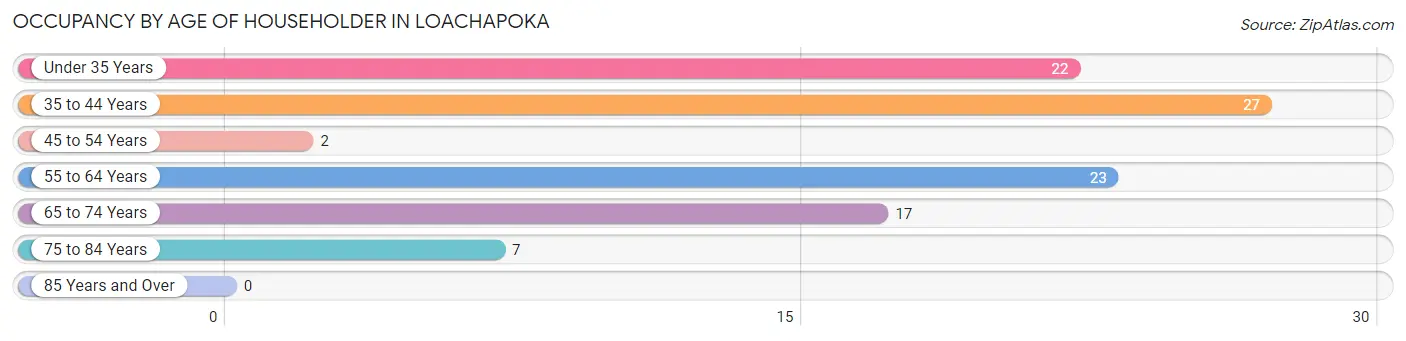
| Age Bracket | # Households | % Households |
| Under 35 Years | 22 | 22.5% |
| 35 to 44 Years | 27 | 27.6% |
| 45 to 54 Years | 2 | 2.0% |
| 55 to 64 Years | 23 | 23.5% |
| 65 to 74 Years | 17 | 17.3% |
| 75 to 84 Years | 7 | 7.1% |
| 85 Years and Over | 0 | 0.0% |
| Total | 98 | 100.0% |
Housing Finances in Loachapoka
Median Income by Occupancy in Loachapoka
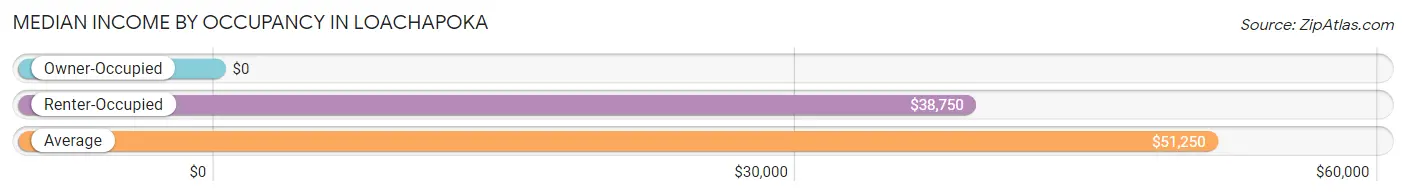
| Occupancy Type | # Households | Median Income |
| Owner-Occupied | 51 (52.0%) | $0 |
| Renter-Occupied | 47 (48.0%) | $38,750 |
| Average | 98 (100.0%) | $51,250 |
Occupancy by Householder Income Bracket in Loachapoka
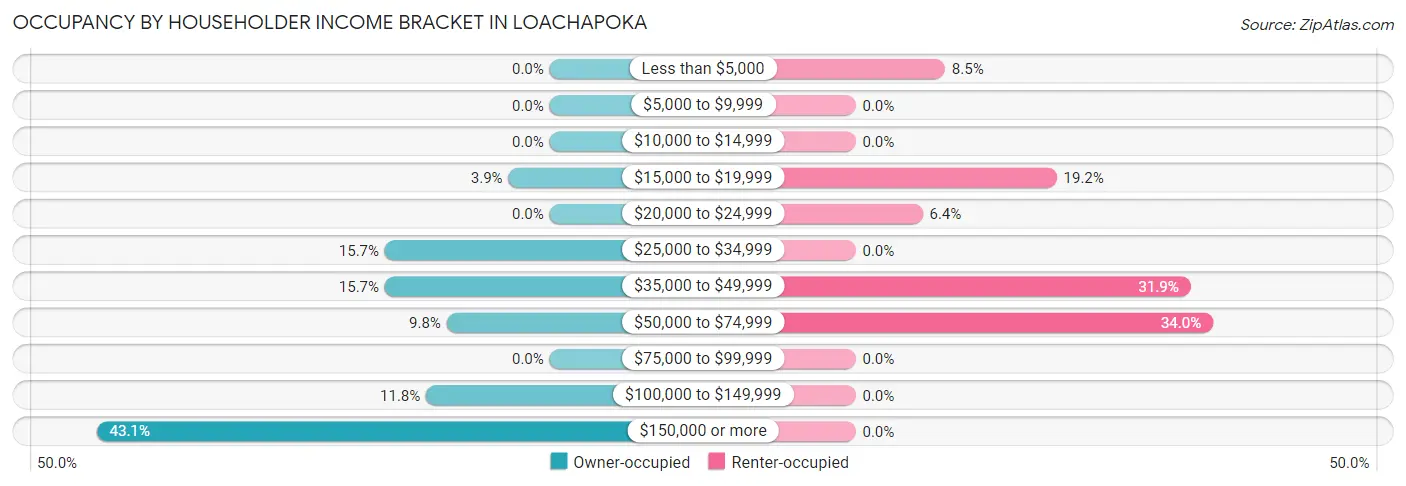
| Income Bracket | Owner-occupied | Renter-occupied |
| Less than $5,000 | 0 (0.0%) | 4 (8.5%) |
| $5,000 to $9,999 | 0 (0.0%) | 0 (0.0%) |
| $10,000 to $14,999 | 0 (0.0%) | 0 (0.0%) |
| $15,000 to $19,999 | 2 (3.9%) | 9 (19.2%) |
| $20,000 to $24,999 | 0 (0.0%) | 3 (6.4%) |
| $25,000 to $34,999 | 8 (15.7%) | 0 (0.0%) |
| $35,000 to $49,999 | 8 (15.7%) | 15 (31.9%) |
| $50,000 to $74,999 | 5 (9.8%) | 16 (34.0%) |
| $75,000 to $99,999 | 0 (0.0%) | 0 (0.0%) |
| $100,000 to $149,999 | 6 (11.8%) | 0 (0.0%) |
| $150,000 or more | 22 (43.1%) | 0 (0.0%) |
| Total | 51 (100.0%) | 47 (100.0%) |
Monthly Housing Cost Tiers in Loachapoka
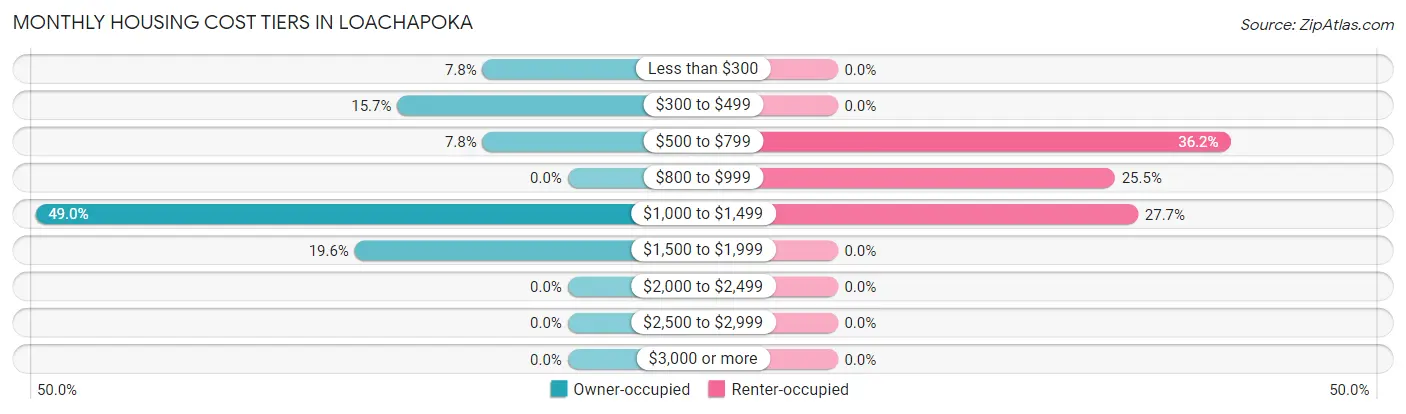
| Monthly Cost | Owner-occupied | Renter-occupied |
| Less than $300 | 4 (7.8%) | 0 (0.0%) |
| $300 to $499 | 8 (15.7%) | 0 (0.0%) |
| $500 to $799 | 4 (7.8%) | 17 (36.2%) |
| $800 to $999 | 0 (0.0%) | 12 (25.5%) |
| $1,000 to $1,499 | 25 (49.0%) | 13 (27.7%) |
| $1,500 to $1,999 | 10 (19.6%) | 0 (0.0%) |
| $2,000 to $2,499 | 0 (0.0%) | 0 (0.0%) |
| $2,500 to $2,999 | 0 (0.0%) | 0 (0.0%) |
| $3,000 or more | 0 (0.0%) | 0 (0.0%) |
| Total | 51 (100.0%) | 47 (100.0%) |
Physical Housing Characteristics in Loachapoka
Housing Structures in Loachapoka
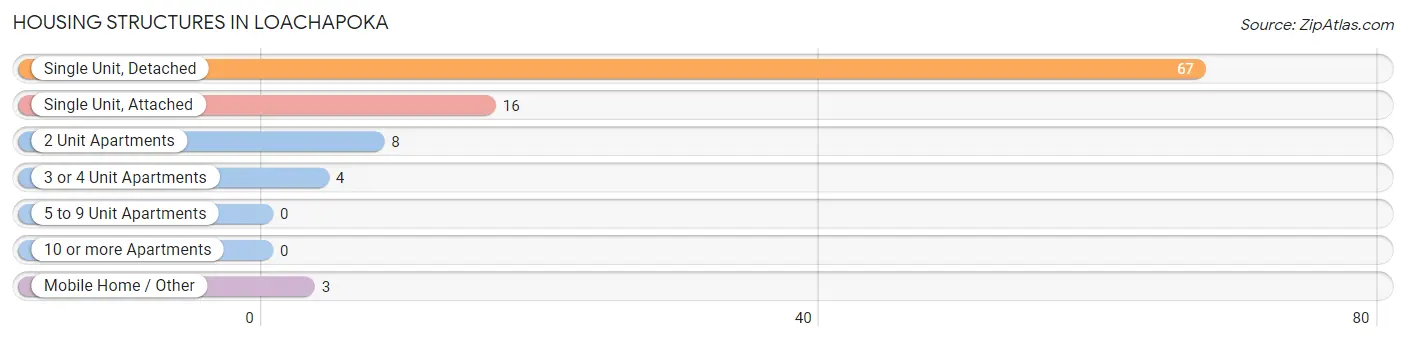
| Structure Type | # Housing Units | % Housing Units |
| Single Unit, Detached | 67 | 68.4% |
| Single Unit, Attached | 16 | 16.3% |
| 2 Unit Apartments | 8 | 8.2% |
| 3 or 4 Unit Apartments | 4 | 4.1% |
| 5 to 9 Unit Apartments | 0 | 0.0% |
| 10 or more Apartments | 0 | 0.0% |
| Mobile Home / Other | 3 | 3.1% |
| Total | 98 | 100.0% |
Housing Structures by Occupancy in Loachapoka
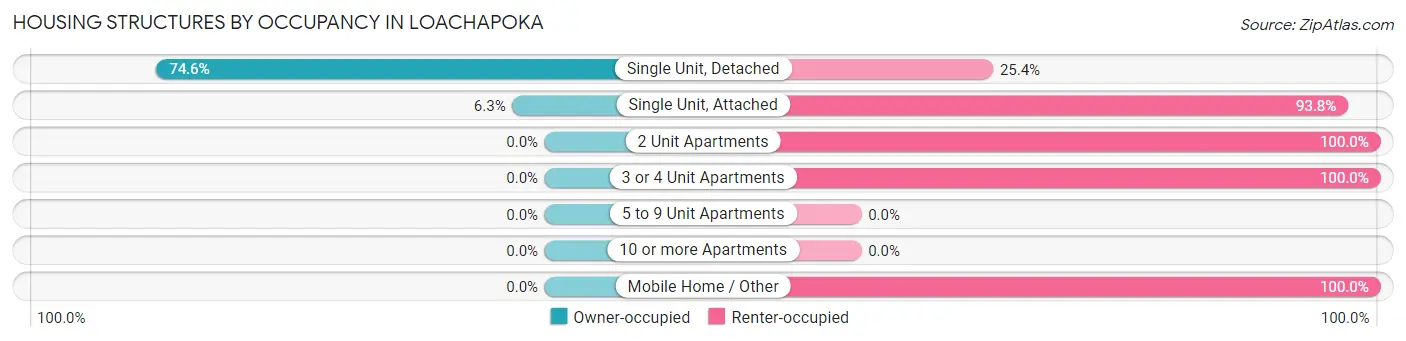
| Structure Type | Owner-occupied | Renter-occupied |
| Single Unit, Detached | 50 (74.6%) | 17 (25.4%) |
| Single Unit, Attached | 1 (6.2%) | 15 (93.8%) |
| 2 Unit Apartments | 0 (0.0%) | 8 (100.0%) |
| 3 or 4 Unit Apartments | 0 (0.0%) | 4 (100.0%) |
| 5 to 9 Unit Apartments | 0 (0.0%) | 0 (0.0%) |
| 10 or more Apartments | 0 (0.0%) | 0 (0.0%) |
| Mobile Home / Other | 0 (0.0%) | 3 (100.0%) |
| Total | 51 (52.0%) | 47 (48.0%) |
Housing Structures by Number of Rooms in Loachapoka
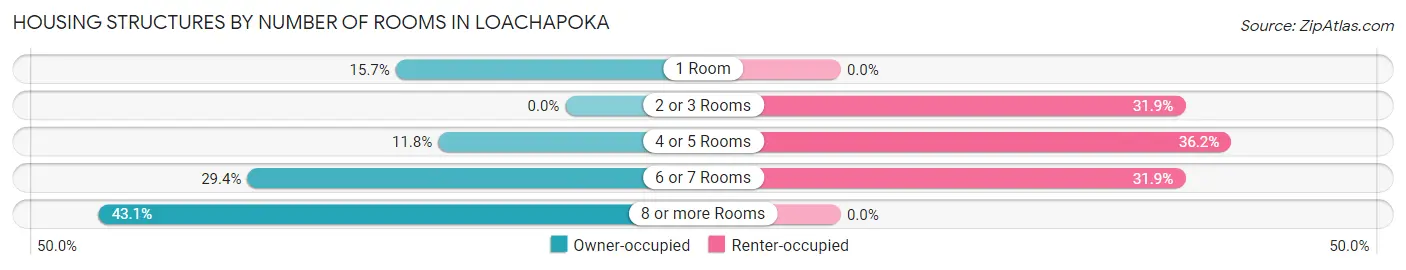
| Number of Rooms | Owner-occupied | Renter-occupied |
| 1 Room | 8 (15.7%) | 0 (0.0%) |
| 2 or 3 Rooms | 0 (0.0%) | 15 (31.9%) |
| 4 or 5 Rooms | 6 (11.8%) | 17 (36.2%) |
| 6 or 7 Rooms | 15 (29.4%) | 15 (31.9%) |
| 8 or more Rooms | 22 (43.1%) | 0 (0.0%) |
| Total | 51 (100.0%) | 47 (100.0%) |
Housing Structure by Heating Type in Loachapoka
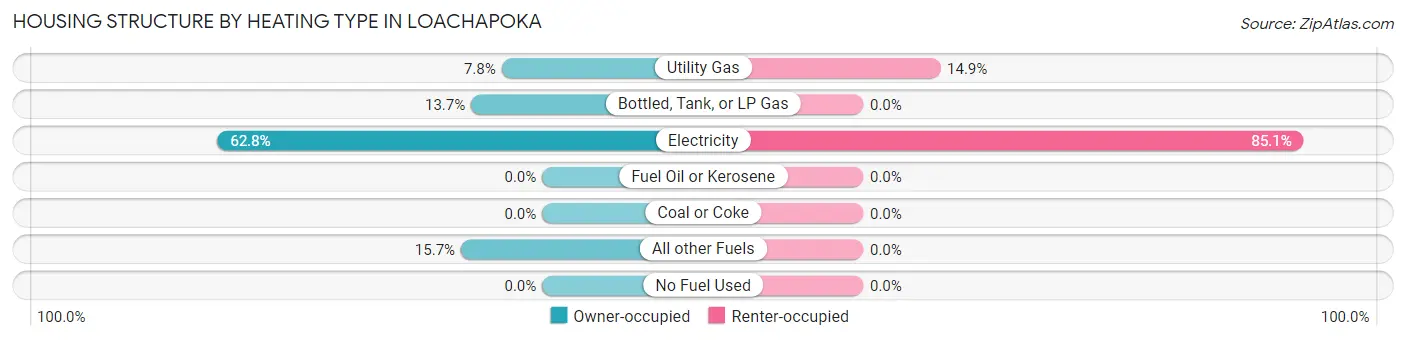
| Heating Type | Owner-occupied | Renter-occupied |
| Utility Gas | 4 (7.8%) | 7 (14.9%) |
| Bottled, Tank, or LP Gas | 7 (13.7%) | 0 (0.0%) |
| Electricity | 32 (62.7%) | 40 (85.1%) |
| Fuel Oil or Kerosene | 0 (0.0%) | 0 (0.0%) |
| Coal or Coke | 0 (0.0%) | 0 (0.0%) |
| All other Fuels | 8 (15.7%) | 0 (0.0%) |
| No Fuel Used | 0 (0.0%) | 0 (0.0%) |
| Total | 51 (100.0%) | 47 (100.0%) |
Household Vehicle Usage in Loachapoka
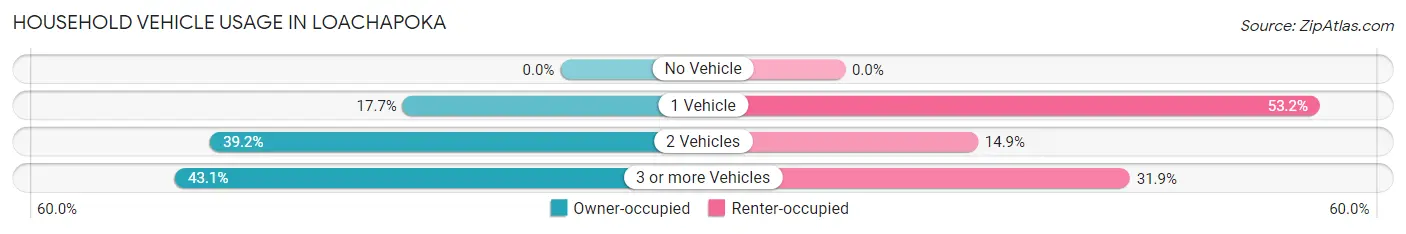
| Vehicles per Household | Owner-occupied | Renter-occupied |
| No Vehicle | 0 (0.0%) | 0 (0.0%) |
| 1 Vehicle | 9 (17.6%) | 25 (53.2%) |
| 2 Vehicles | 20 (39.2%) | 7 (14.9%) |
| 3 or more Vehicles | 22 (43.1%) | 15 (31.9%) |
| Total | 51 (100.0%) | 47 (100.0%) |
Real Estate & Mortgages in Loachapoka
Real Estate and Mortgage Overview in Loachapoka
| Characteristic | Without Mortgage | With Mortgage |
| Housing Units | 16 | 35 |
| Median Property Value | $187,500 | $197,900 |
| Median Household Income | - | - |
| Monthly Housing Costs | $325 | $0 |
| Real Estate Taxes | - | - |
Property Value by Mortgage Status in Loachapoka
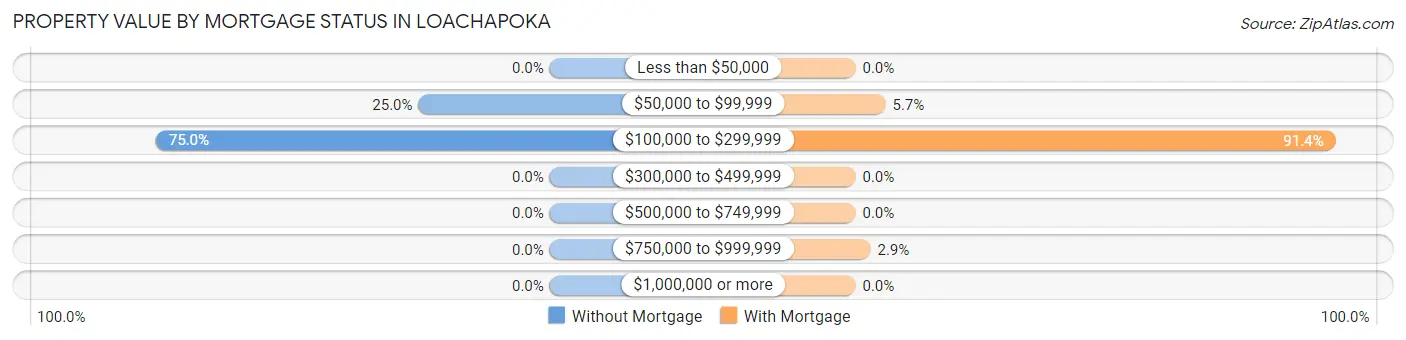
| Property Value | Without Mortgage | With Mortgage |
| Less than $50,000 | 0 (0.0%) | 0 (0.0%) |
| $50,000 to $99,999 | 4 (25.0%) | 2 (5.7%) |
| $100,000 to $299,999 | 12 (75.0%) | 32 (91.4%) |
| $300,000 to $499,999 | 0 (0.0%) | 0 (0.0%) |
| $500,000 to $749,999 | 0 (0.0%) | 0 (0.0%) |
| $750,000 to $999,999 | 0 (0.0%) | 1 (2.9%) |
| $1,000,000 or more | 0 (0.0%) | 0 (0.0%) |
| Total | 16 (100.0%) | 35 (100.0%) |
Household Income by Mortgage Status in Loachapoka
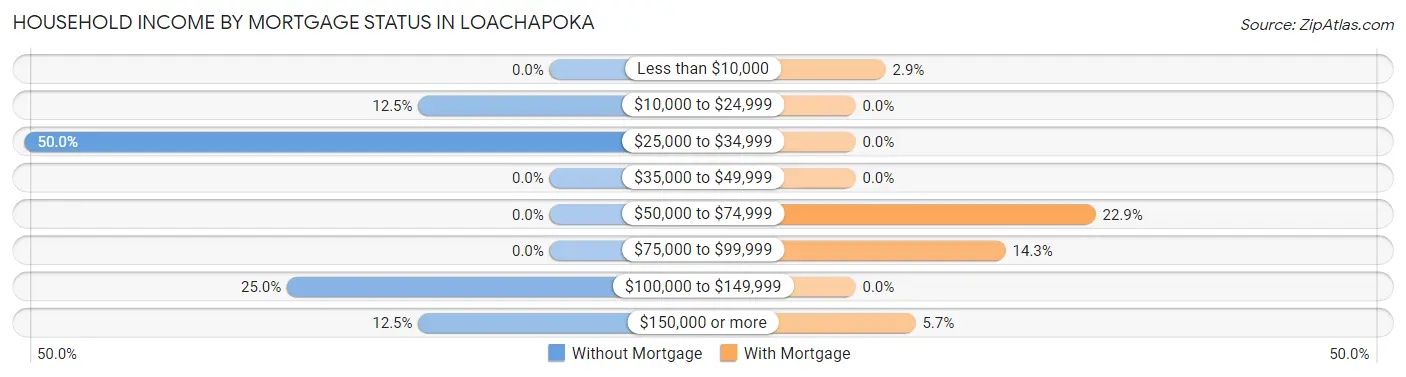
| Household Income | Without Mortgage | With Mortgage |
| Less than $10,000 | 0 (0.0%) | 1 (2.9%) |
| $10,000 to $24,999 | 2 (12.5%) | 0 (0.0%) |
| $25,000 to $34,999 | 8 (50.0%) | 0 (0.0%) |
| $35,000 to $49,999 | 0 (0.0%) | 0 (0.0%) |
| $50,000 to $74,999 | 0 (0.0%) | 8 (22.9%) |
| $75,000 to $99,999 | 0 (0.0%) | 5 (14.3%) |
| $100,000 to $149,999 | 4 (25.0%) | 0 (0.0%) |
| $150,000 or more | 2 (12.5%) | 2 (5.7%) |
| Total | 16 (100.0%) | 35 (100.0%) |
Property Value to Household Income Ratio in Loachapoka
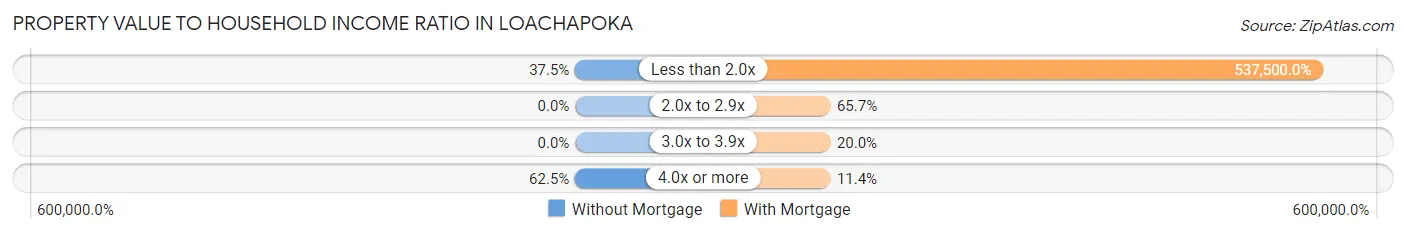
| Value-to-Income Ratio | Without Mortgage | With Mortgage |
| Less than 2.0x | 6 (37.5%) | 188,125 (537,500.0%) |
| 2.0x to 2.9x | 0 (0.0%) | 23 (65.7%) |
| 3.0x to 3.9x | 0 (0.0%) | 7 (20.0%) |
| 4.0x or more | 10 (62.5%) | 4 (11.4%) |
| Total | 16 (100.0%) | 35 (100.0%) |
Real Estate Taxes by Mortgage Status in Loachapoka
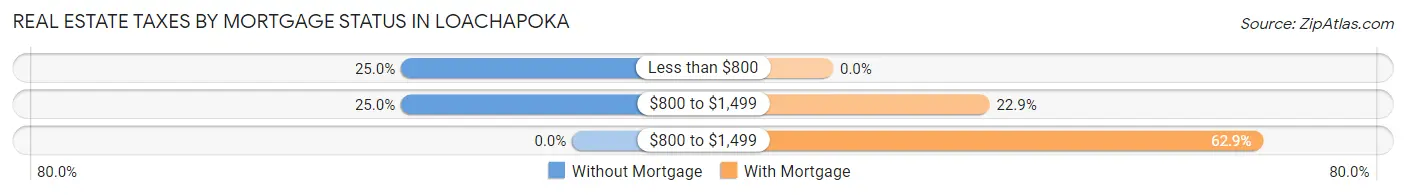
| Property Taxes | Without Mortgage | With Mortgage |
| Less than $800 | 4 (25.0%) | 0 (0.0%) |
| $800 to $1,499 | 4 (25.0%) | 8 (22.9%) |
| $800 to $1,499 | 0 (0.0%) | 22 (62.9%) |
| Total | 16 (100.0%) | 35 (100.0%) |
Health & Disability in Loachapoka
Health Insurance Coverage by Age in Loachapoka
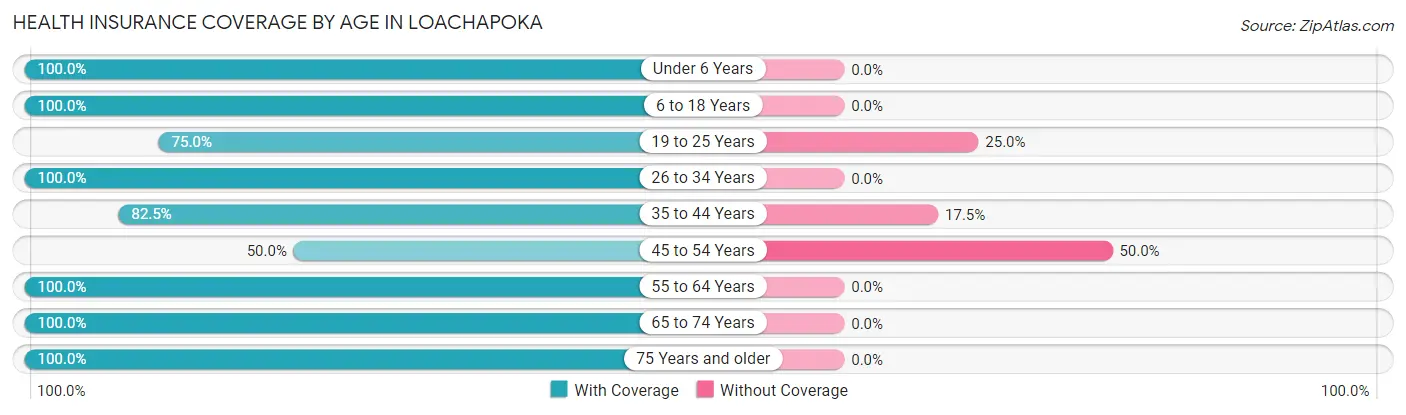
| Age Bracket | With Coverage | Without Coverage |
| Under 6 Years | 18 (100.0%) | 0 (0.0%) |
| 6 to 18 Years | 10 (100.0%) | 0 (0.0%) |
| 19 to 25 Years | 24 (75.0%) | 8 (25.0%) |
| 26 to 34 Years | 30 (100.0%) | 0 (0.0%) |
| 35 to 44 Years | 33 (82.5%) | 7 (17.5%) |
| 45 to 54 Years | 9 (50.0%) | 9 (50.0%) |
| 55 to 64 Years | 37 (100.0%) | 0 (0.0%) |
| 65 to 74 Years | 31 (100.0%) | 0 (0.0%) |
| 75 Years and older | 11 (100.0%) | 0 (0.0%) |
| Total | 203 (89.4%) | 24 (10.6%) |
Health Insurance Coverage by Citizenship Status in Loachapoka
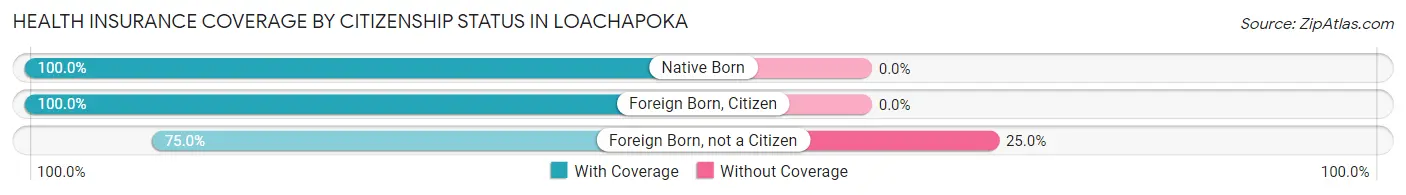
| Citizenship Status | With Coverage | Without Coverage |
| Native Born | 18 (100.0%) | 0 (0.0%) |
| Foreign Born, Citizen | 10 (100.0%) | 0 (0.0%) |
| Foreign Born, not a Citizen | 24 (75.0%) | 8 (25.0%) |
Health Insurance Coverage by Household Income in Loachapoka
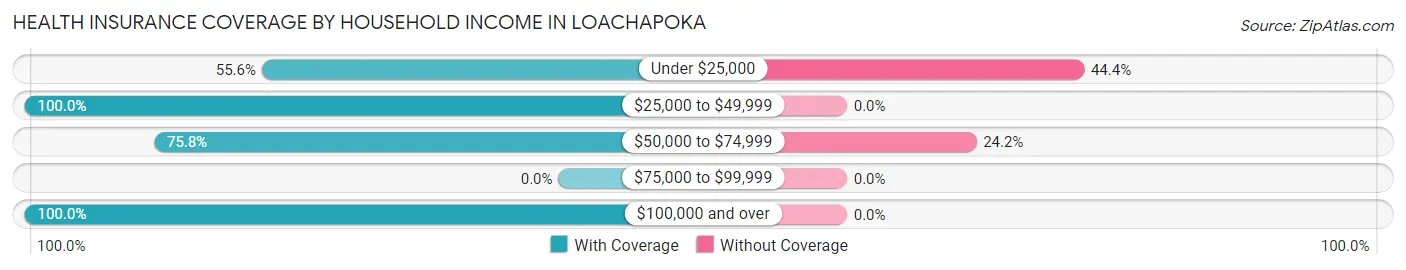
| Household Income | With Coverage | Without Coverage |
| Under $25,000 | 20 (55.6%) | 16 (44.4%) |
| $25,000 to $49,999 | 75 (100.0%) | 0 (0.0%) |
| $50,000 to $74,999 | 25 (75.8%) | 8 (24.2%) |
| $75,000 to $99,999 | 0 (0.0%) | 0 (0.0%) |
| $100,000 and over | 83 (100.0%) | 0 (0.0%) |
Public vs Private Health Insurance Coverage by Age in Loachapoka
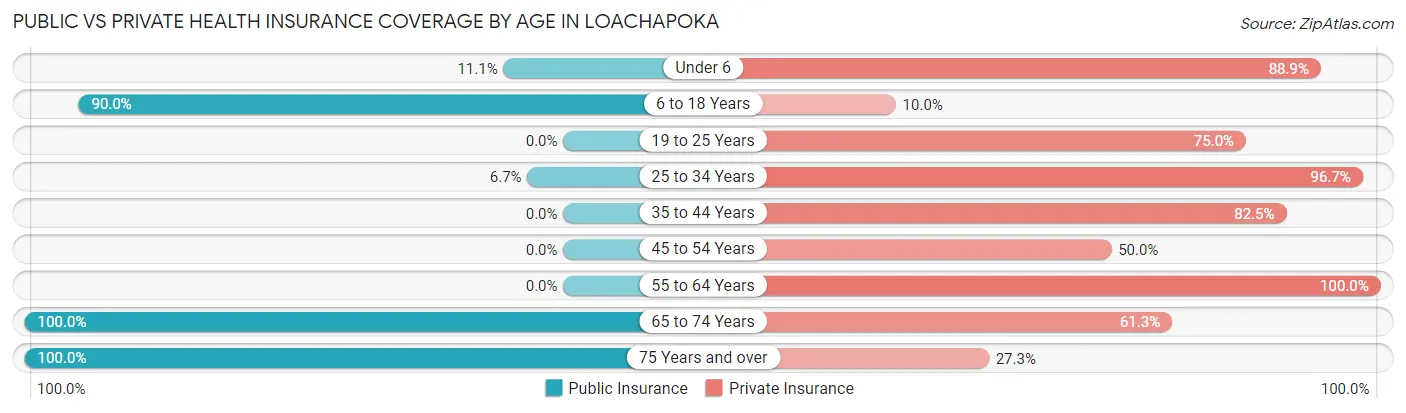
| Age Bracket | Public Insurance | Private Insurance |
| Under 6 | 2 (11.1%) | 16 (88.9%) |
| 6 to 18 Years | 9 (90.0%) | 1 (10.0%) |
| 19 to 25 Years | 0 (0.0%) | 24 (75.0%) |
| 25 to 34 Years | 2 (6.7%) | 29 (96.7%) |
| 35 to 44 Years | 0 (0.0%) | 33 (82.5%) |
| 45 to 54 Years | 0 (0.0%) | 9 (50.0%) |
| 55 to 64 Years | 0 (0.0%) | 37 (100.0%) |
| 65 to 74 Years | 31 (100.0%) | 19 (61.3%) |
| 75 Years and over | 11 (100.0%) | 3 (27.3%) |
| Total | 55 (24.2%) | 171 (75.3%) |
Disability Status by Sex by Age in Loachapoka
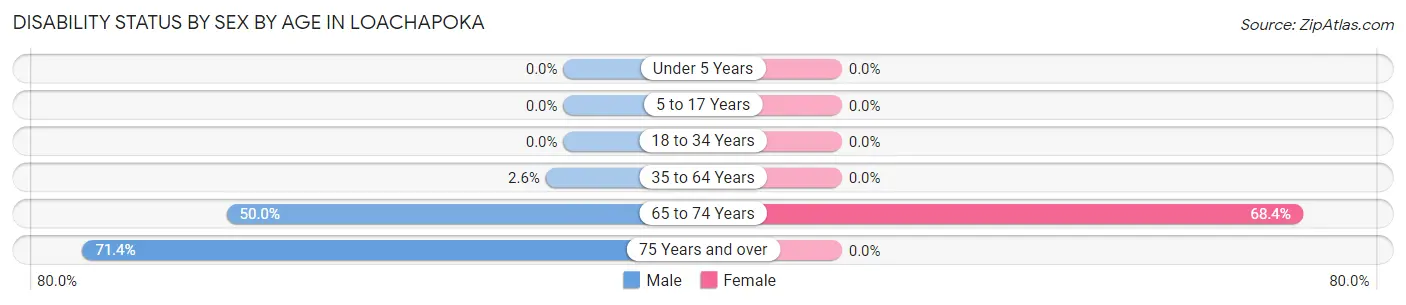
| Age Bracket | Male | Female |
| Under 5 Years | 0 (0.0%) | 0 (0.0%) |
| 5 to 17 Years | 0 (0.0%) | 0 (0.0%) |
| 18 to 34 Years | 0 (0.0%) | 0 (0.0%) |
| 35 to 64 Years | 1 (2.6%) | 0 (0.0%) |
| 65 to 74 Years | 6 (50.0%) | 13 (68.4%) |
| 75 Years and over | 5 (71.4%) | 0 (0.0%) |
Disability Class by Sex by Age in Loachapoka
Disability Class: Hearing Difficulty
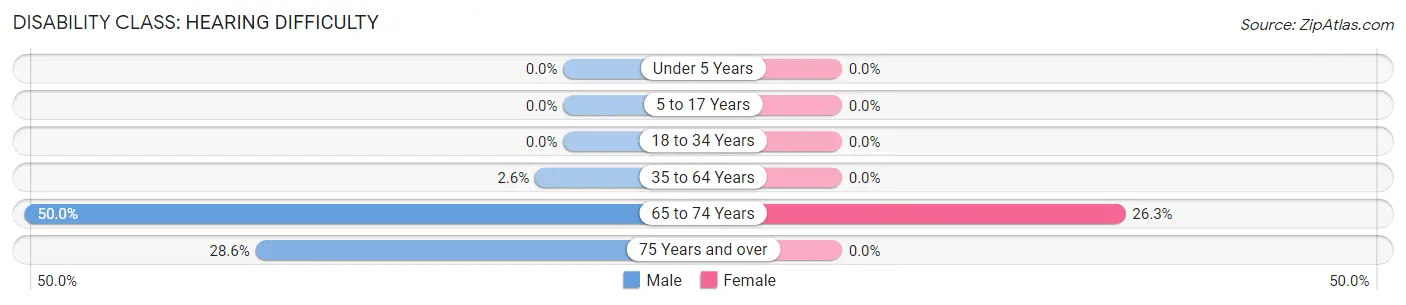
| Age Bracket | Male | Female |
| Under 5 Years | 0 (0.0%) | 0 (0.0%) |
| 5 to 17 Years | 0 (0.0%) | 0 (0.0%) |
| 18 to 34 Years | 0 (0.0%) | 0 (0.0%) |
| 35 to 64 Years | 1 (2.6%) | 0 (0.0%) |
| 65 to 74 Years | 6 (50.0%) | 5 (26.3%) |
| 75 Years and over | 2 (28.6%) | 0 (0.0%) |
Disability Class: Vision Difficulty
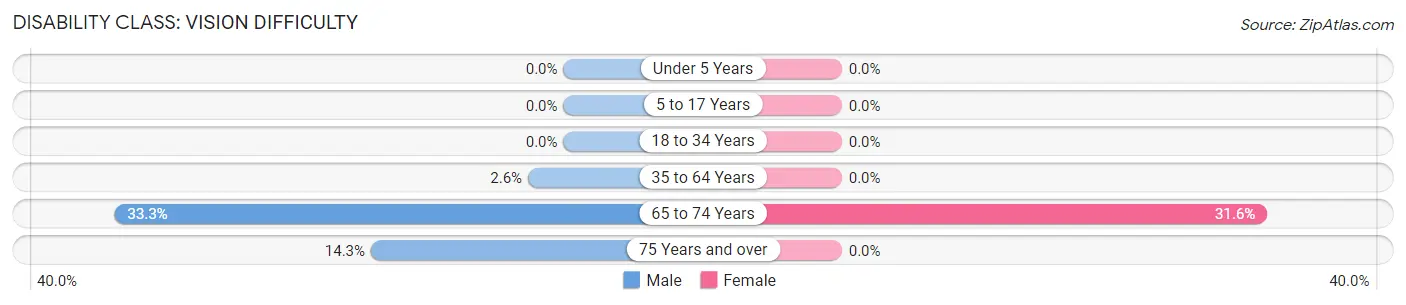
| Age Bracket | Male | Female |
| Under 5 Years | 0 (0.0%) | 0 (0.0%) |
| 5 to 17 Years | 0 (0.0%) | 0 (0.0%) |
| 18 to 34 Years | 0 (0.0%) | 0 (0.0%) |
| 35 to 64 Years | 1 (2.6%) | 0 (0.0%) |
| 65 to 74 Years | 4 (33.3%) | 6 (31.6%) |
| 75 Years and over | 1 (14.3%) | 0 (0.0%) |
Disability Class: Cognitive Difficulty
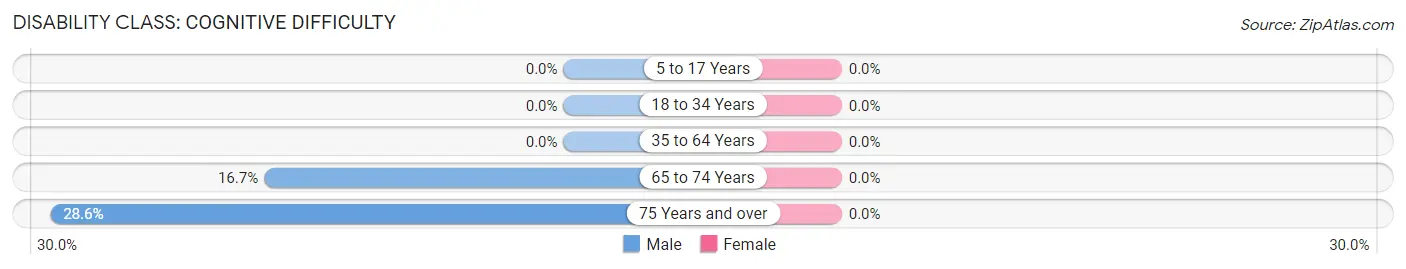
| Age Bracket | Male | Female |
| 5 to 17 Years | 0 (0.0%) | 0 (0.0%) |
| 18 to 34 Years | 0 (0.0%) | 0 (0.0%) |
| 35 to 64 Years | 0 (0.0%) | 0 (0.0%) |
| 65 to 74 Years | 2 (16.7%) | 0 (0.0%) |
| 75 Years and over | 2 (28.6%) | 0 (0.0%) |
Disability Class: Ambulatory Difficulty
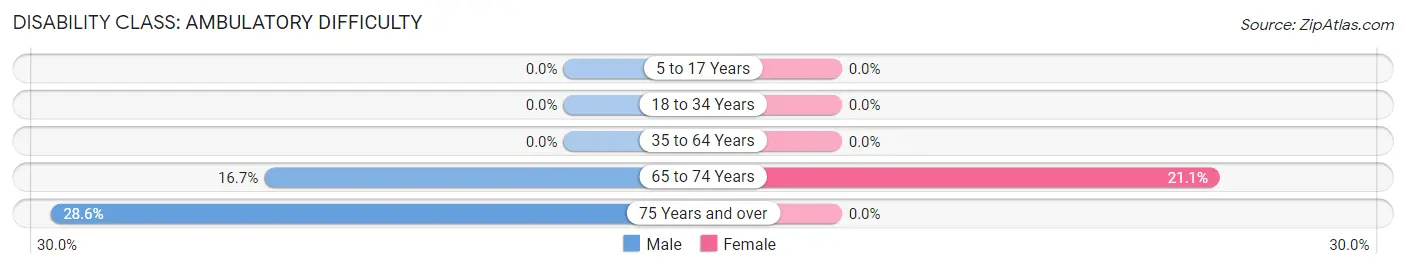
| Age Bracket | Male | Female |
| 5 to 17 Years | 0 (0.0%) | 0 (0.0%) |
| 18 to 34 Years | 0 (0.0%) | 0 (0.0%) |
| 35 to 64 Years | 0 (0.0%) | 0 (0.0%) |
| 65 to 74 Years | 2 (16.7%) | 4 (21.0%) |
| 75 Years and over | 2 (28.6%) | 0 (0.0%) |
Disability Class: Self-Care Difficulty
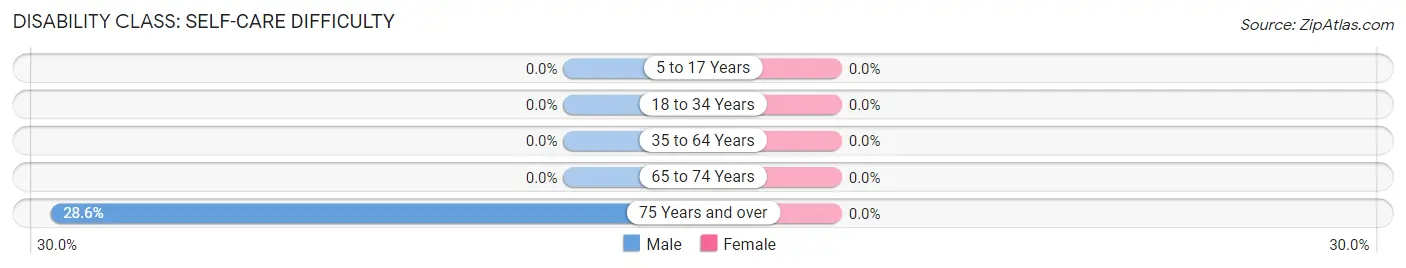
| Age Bracket | Male | Female |
| 5 to 17 Years | 0 (0.0%) | 0 (0.0%) |
| 18 to 34 Years | 0 (0.0%) | 0 (0.0%) |
| 35 to 64 Years | 0 (0.0%) | 0 (0.0%) |
| 65 to 74 Years | 0 (0.0%) | 0 (0.0%) |
| 75 Years and over | 2 (28.6%) | 0 (0.0%) |
Technology Access in Loachapoka
Computing Device Access in Loachapoka
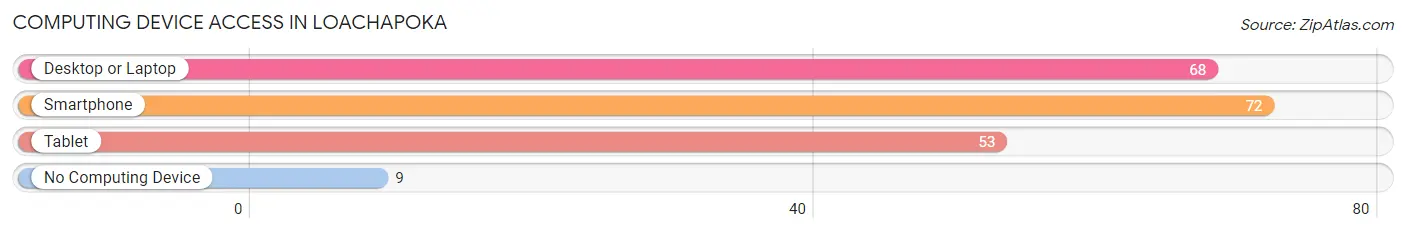
| Device Type | # Households | % Households |
| Desktop or Laptop | 68 | 69.4% |
| Smartphone | 72 | 73.5% |
| Tablet | 53 | 54.1% |
| No Computing Device | 9 | 9.2% |
| Total | 98 | 100.0% |
Internet Access in Loachapoka
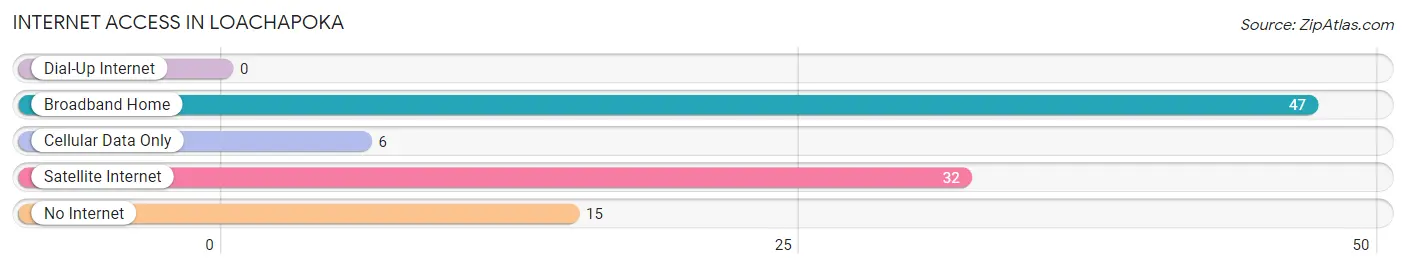
| Internet Type | # Households | % Households |
| Dial-Up Internet | 0 | 0.0% |
| Broadband Home | 47 | 48.0% |
| Cellular Data Only | 6 | 6.1% |
| Satellite Internet | 32 | 32.7% |
| No Internet | 15 | 15.3% |
| Total | 98 | 100.0% |
Loachapoka Summary
Loachapoka is a small unincorporated community located in Lee County, Alabama. It is situated about 10 miles east of Auburn and is part of the Auburn-Opelika Metropolitan Statistical Area. The population of Loachapoka was estimated to be around 500 in 2020.
History
Loachapoka was founded in 1832 by a group of Creek Indians who had been relocated from their ancestral lands in Georgia and Alabama. The name Loachapoka is derived from the Creek words “lo-cha-pok-a” which means “cane-brake”. The town was originally a trading post for the Creek Indians and was later used as a stop on the stagecoach route between Montgomery and Columbus, Georgia.
In the late 19th century, Loachapoka became a popular destination for wealthy plantation owners from the surrounding area. The town was home to several large plantations, including the Loachapoka Plantation, which was owned by the prominent local family of the same name.
In the early 20th century, Loachapoka was a thriving community with a population of over 1,000 people. The town had several stores, a post office, a bank, a hotel, and a cotton gin. The town also had a school, which was attended by both white and black students.
In the 1950s, the population of Loachapoka began to decline as many of the town’s residents moved away in search of better economic opportunities. By the 1970s, the population had dropped to around 500 people.
Geography
Loachapoka is located in the east-central part of Lee County, Alabama. It is situated about 10 miles east of Auburn and is part of the Auburn-Opelika Metropolitan Statistical Area. The town is located on the banks of the Loachapoka Creek, which is a tributary of the Tallapoosa River.
The terrain around Loachapoka is mostly flat with some rolling hills. The area is mostly covered in pine and hardwood forests. The climate is humid subtropical with hot summers and mild winters.
Economy
The economy of Loachapoka is largely based on agriculture. The town is home to several large farms and ranches, which produce a variety of crops, including cotton, corn, soybeans, and peanuts. The town also has several small businesses, including a grocery store, a hardware store, and a gas station.
Demographics
As of the 2010 census, the population of Loachapoka was estimated to be around 500 people. The racial makeup of the town was 97.2% White, 0.8% African American, 0.2% Native American, 0.2% Asian, and 1.6% from other races. The median household income was $31,250 and the median family income was $37,500.
Conclusion
Loachapoka is a small unincorporated community located in Lee County, Alabama. It is situated about 10 miles east of Auburn and is part of the Auburn-Opelika Metropolitan Statistical Area. The town was founded in 1832 by a group of Creek Indians and was once a thriving community with a population of over 1,000 people. Today, the population of Loachapoka is estimated to be around 500 people. The economy of the town is largely based on agriculture and the town is home to several small businesses. The racial makeup of the town is mostly White with a small percentage of African American, Native American, and Asian residents.
Common Questions
What is Per Capita Income in Loachapoka?
Per Capita income in Loachapoka is $33,889.
What is the Median Household income in Loachapoka?
Median Household Income in Loachapoka is $51,250.
What is Inequality or Gini Index in Loachapoka?
Inequality or Gini Index in Loachapoka is 0.44.
What is the Total Population of Loachapoka?
Total Population of Loachapoka is 227.
What is the Total Male Population of Loachapoka?
Total Male Population of Loachapoka is 108.
What is the Total Female Population of Loachapoka?
Total Female Population of Loachapoka is 119.
What is the Ratio of Males per 100 Females in Loachapoka?
There are 90.76 Males per 100 Females in Loachapoka.
What is the Ratio of Females per 100 Males in Loachapoka?
There are 110.19 Females per 100 Males in Loachapoka.
What is the Median Population Age in Loachapoka?
Median Population Age in Loachapoka is 37.5 Years.
What is the Average Family Size in Loachapoka
Average Family Size in Loachapoka is 2.9 People.
What is the Average Household Size in Loachapoka
Average Household Size in Loachapoka is 2.3 People.
How Large is the Labor Force in Loachapoka?
There are 135 People in the Labor Forcein in Loachapoka.
What is the Percentage of People in the Labor Force in Loachapoka?
67.5% of People are in the Labor Force in Loachapoka.
What is the Unemployment Rate in Loachapoka?
Unemployment Rate in Loachapoka is 5.9%.