Lincoln, AL Map & Demographics
Lincoln Map
Lincoln Overview
$33,550
PER CAPITA INCOME
$80,313
AVG FAMILY INCOME
$65,042
AVG HOUSEHOLD INCOME
48.3%
WAGE / INCOME GAP [ % ]
51.7¢/ $1
WAGE / INCOME GAP [ $ ]
0.47
INEQUALITY / GINI INDEX
6,968
TOTAL POPULATION
3,342
MALE POPULATION
3,626
FEMALE POPULATION
92.17
MALES / 100 FEMALES
108.50
FEMALES / 100 MALES
40.9
MEDIAN AGE
3.1
AVG FAMILY SIZE
2.6
AVG HOUSEHOLD SIZE
3,514
LABOR FORCE [ PEOPLE ]
64.6%
PERCENT IN LABOR FORCE
7.4%
UNEMPLOYMENT RATE
Lincoln Zip Codes
Lincoln Area Codes
Income in Lincoln
Income Overview in Lincoln
Per Capita Income in Lincoln is $33,550, while median incomes of families and households are $80,313 and $65,042 respectively.
| Characteristic | Number | Measure |
| Per Capita Income | 6,968 | $33,550 |
| Median Family Income | 1,956 | $80,313 |
| Mean Family Income | 1,956 | $101,143 |
| Median Household Income | 2,667 | $65,042 |
| Mean Household Income | 2,667 | $85,091 |
| Income Deficit | 1,956 | $0 |
| Wage / Income Gap (%) | 6,968 | 48.27% |
| Wage / Income Gap ($) | 6,968 | 51.73¢ per $1 |
| Gini / Inequality Index | 6,968 | 0.47 |
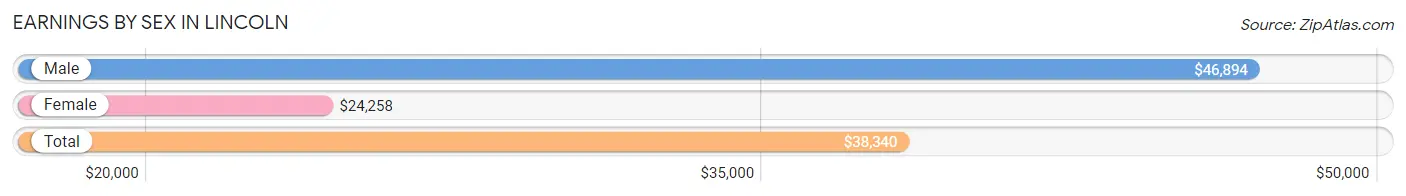
Earnings by Sex in Lincoln
Average Earnings in Lincoln are $38,340, $46,894 for men and $24,258 for women, a difference of 48.3%.
| Sex | Number | Average Earnings |
| Male | 1,740 (49.2%) | $46,894 |
| Female | 1,795 (50.8%) | $24,258 |
| Total | 3,535 (100.0%) | $38,340 |
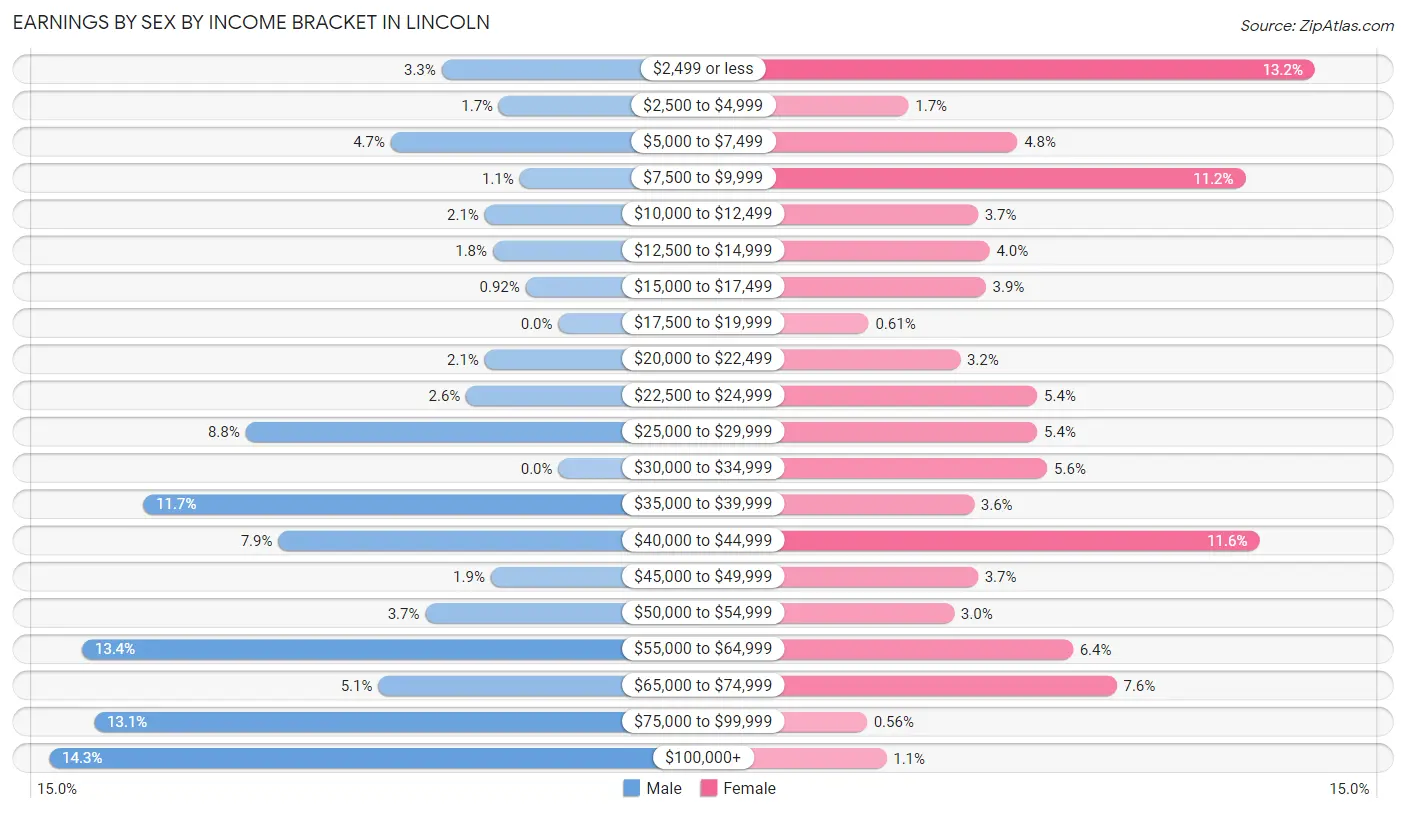
Earnings by Sex by Income Bracket in Lincoln
The most common earnings brackets in Lincoln are $100,000+ for men (249 | 14.3%) and $2,499 or less for women (236 | 13.2%).
| Income | Male | Female |
| $2,499 or less | 57 (3.3%) | 236 (13.2%) |
| $2,500 to $4,999 | 29 (1.7%) | 31 (1.7%) |
| $5,000 to $7,499 | 82 (4.7%) | 86 (4.8%) |
| $7,500 to $9,999 | 19 (1.1%) | 201 (11.2%) |
| $10,000 to $12,499 | 36 (2.1%) | 66 (3.7%) |
| $12,500 to $14,999 | 32 (1.8%) | 72 (4.0%) |
| $15,000 to $17,499 | 16 (0.9%) | 70 (3.9%) |
| $17,500 to $19,999 | 0 (0.0%) | 11 (0.6%) |
| $20,000 to $22,499 | 36 (2.1%) | 57 (3.2%) |
| $22,500 to $24,999 | 45 (2.6%) | 96 (5.3%) |
| $25,000 to $29,999 | 153 (8.8%) | 96 (5.3%) |
| $30,000 to $34,999 | 0 (0.0%) | 101 (5.6%) |
| $35,000 to $39,999 | 203 (11.7%) | 64 (3.6%) |
| $40,000 to $44,999 | 137 (7.9%) | 208 (11.6%) |
| $45,000 to $49,999 | 33 (1.9%) | 66 (3.7%) |
| $50,000 to $54,999 | 65 (3.7%) | 54 (3.0%) |
| $55,000 to $64,999 | 233 (13.4%) | 114 (6.4%) |
| $65,000 to $74,999 | 88 (5.1%) | 136 (7.6%) |
| $75,000 to $99,999 | 227 (13.1%) | 10 (0.6%) |
| $100,000+ | 249 (14.3%) | 20 (1.1%) |
| Total | 1,740 (100.0%) | 1,795 (100.0%) |
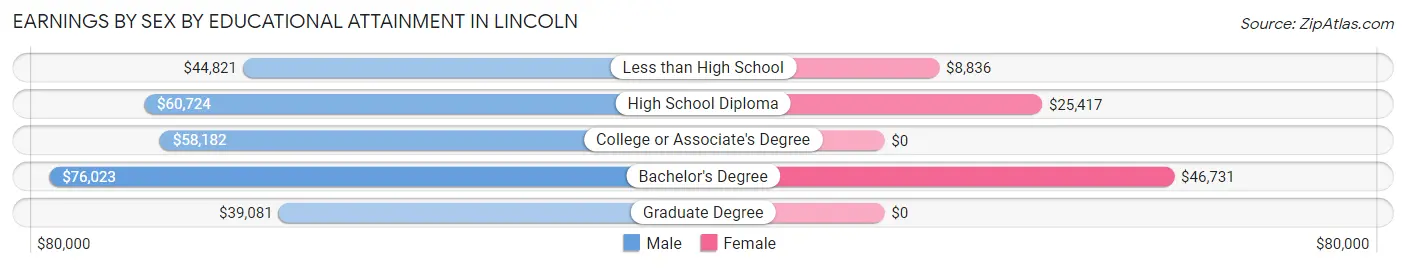
Earnings by Sex by Educational Attainment in Lincoln
Average earnings in Lincoln are $56,910 for men and $24,417 for women, a difference of 57.1%. Men with an educational attainment of bachelor's degree enjoy the highest average annual earnings of $76,023, while those with graduate degree education earn the least with $39,081. Women with an educational attainment of bachelor's degree earn the most with the average annual earnings of $46,731, while those with less than high school education have the smallest earnings of $8,836.
| Educational Attainment | Male Income | Female Income |
| Less than High School | $44,821 | $8,836 |
| High School Diploma | $60,724 | $25,417 |
| College or Associate's Degree | $58,182 | $0 |
| Bachelor's Degree | $76,023 | $46,731 |
| Graduate Degree | $39,081 | $0 |
| Total | $56,910 | $24,417 |
Family Income in Lincoln
Family Income Brackets in Lincoln
According to the Lincoln family income data, there are 403 families falling into the $100,000 to $149,999 income range, which is the most common income bracket and makes up 20.6% of all families. Conversely, the $25,000 to $34,999 income bracket is the least frequent group with only 53 families (2.7%) belonging to this category.
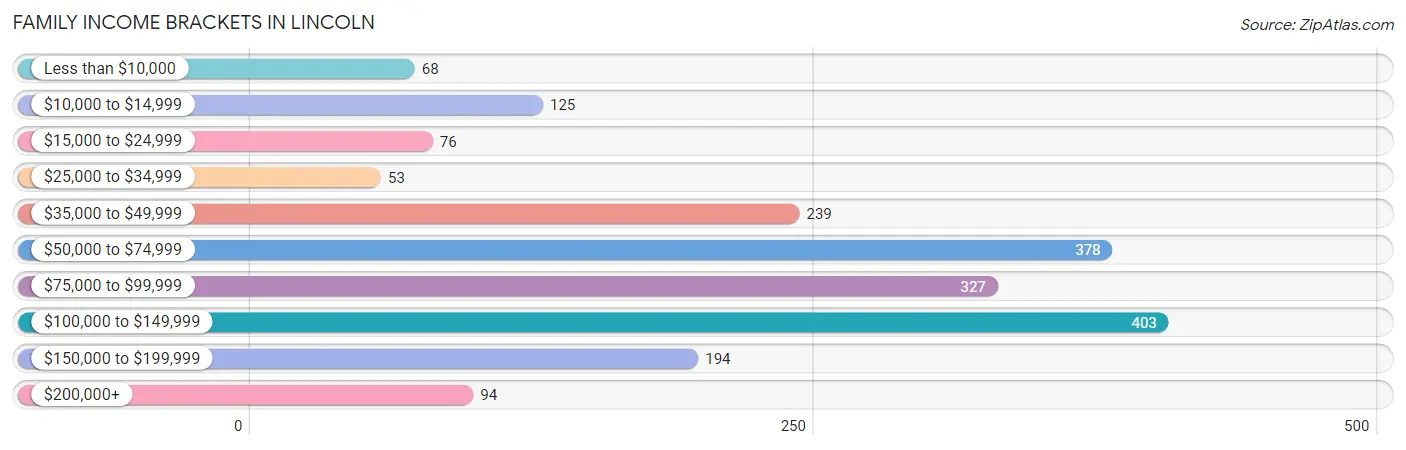
| Income Bracket | # Families | % Families |
| Less than $10,000 | 68 | 3.5% |
| $10,000 to $14,999 | 125 | 6.4% |
| $15,000 to $24,999 | 76 | 3.9% |
| $25,000 to $34,999 | 53 | 2.7% |
| $35,000 to $49,999 | 239 | 12.2% |
| $50,000 to $74,999 | 378 | 19.3% |
| $75,000 to $99,999 | 327 | 16.7% |
| $100,000 to $149,999 | 403 | 20.6% |
| $150,000 to $199,999 | 194 | 9.9% |
| $200,000+ | 94 | 4.8% |
Family Income by Famaliy Size in Lincoln
3-person families (423 | 21.6%) account for the highest median family income in Lincoln with $98,341 per family, while 2-person families (870 | 44.5%) have the highest median income of $35,644 per family member.
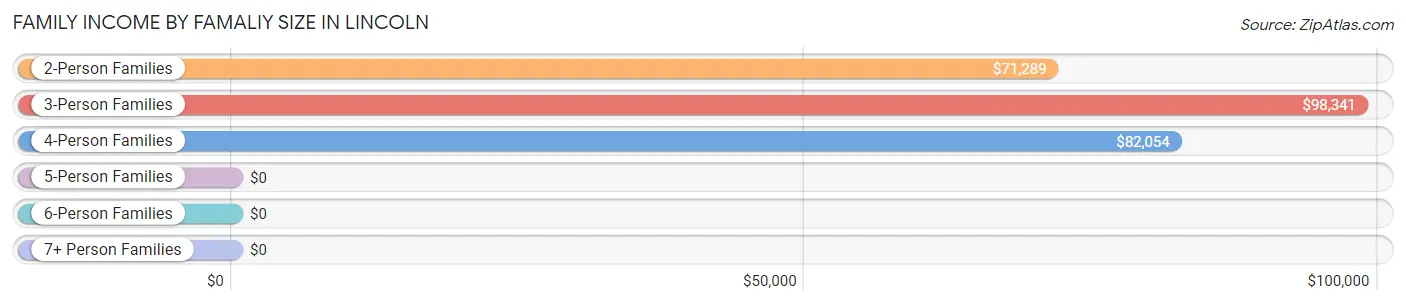
| Income Bracket | # Families | Median Income |
| 2-Person Families | 870 (44.5%) | $71,289 |
| 3-Person Families | 423 (21.6%) | $98,341 |
| 4-Person Families | 405 (20.7%) | $82,054 |
| 5-Person Families | 167 (8.5%) | $0 |
| 6-Person Families | 55 (2.8%) | $0 |
| 7+ Person Families | 36 (1.8%) | $0 |
| Total | 1,956 (100.0%) | $80,313 |
Family Income by Number of Earners in Lincoln
The median family income in Lincoln is $80,313, with families comprising 3+ earners (155) having the highest median family income of $193,438, while families with no earners (417) have the lowest median family income of $42,841, accounting for 7.9% and 21.3% of families, respectively.
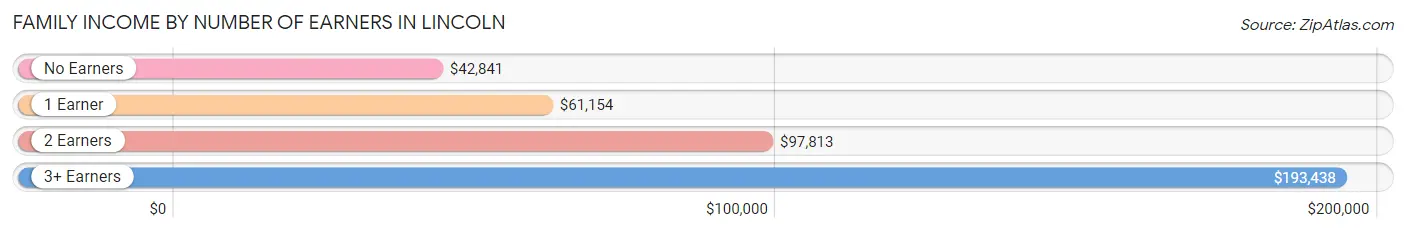
| Number of Earners | # Families | Median Income |
| No Earners | 417 (21.3%) | $42,841 |
| 1 Earner | 494 (25.3%) | $61,154 |
| 2 Earners | 890 (45.5%) | $97,813 |
| 3+ Earners | 155 (7.9%) | $193,438 |
| Total | 1,956 (100.0%) | $80,313 |
Household Income in Lincoln
Household Income Brackets in Lincoln
With 541 households falling in the category, the $50,000 to $74,999 income range is the most frequent in Lincoln, accounting for 20.3% of all households. In contrast, only 93 households (3.5%) fall into the $200,000+ income bracket, making it the least populous group.
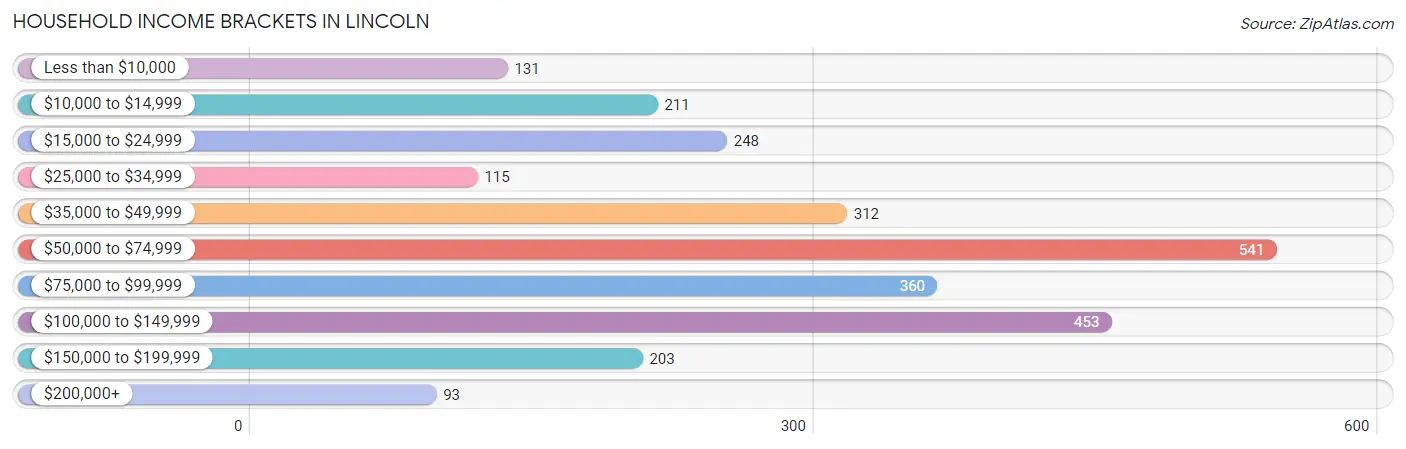
| Income Bracket | # Households | % Households |
| Less than $10,000 | 131 | 4.9% |
| $10,000 to $14,999 | 211 | 7.9% |
| $15,000 to $24,999 | 248 | 9.3% |
| $25,000 to $34,999 | 115 | 4.3% |
| $35,000 to $49,999 | 312 | 11.7% |
| $50,000 to $74,999 | 541 | 20.3% |
| $75,000 to $99,999 | 360 | 13.5% |
| $100,000 to $149,999 | 453 | 17.0% |
| $150,000 to $199,999 | 203 | 7.6% |
| $200,000+ | 93 | 3.5% |
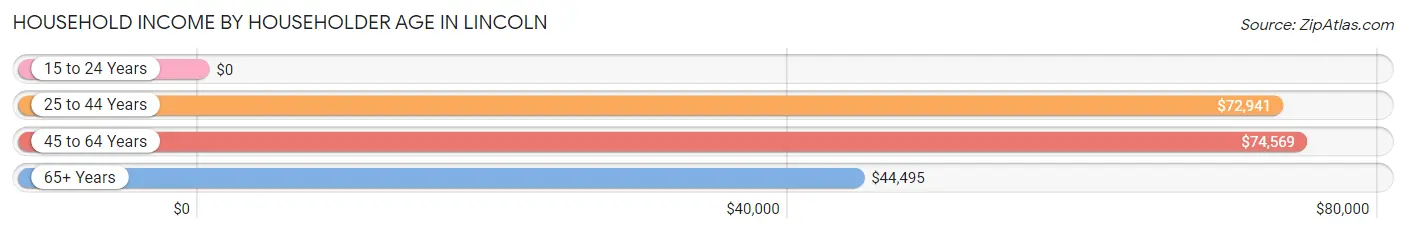
Household Income by Householder Age in Lincoln
The median household income in Lincoln is $65,042, with the highest median household income of $74,569 found in the 45 to 64 years age bracket for the primary householder. A total of 1,120 households (42.0%) fall into this category.
| Income Bracket | # Households | Median Income |
| 15 to 24 Years | 0 (0.0%) | $0 |
| 25 to 44 Years | 848 (31.8%) | $72,941 |
| 45 to 64 Years | 1,120 (42.0%) | $74,569 |
| 65+ Years | 699 (26.2%) | $44,495 |
| Total | 2,667 (100.0%) | $65,042 |
Poverty in Lincoln
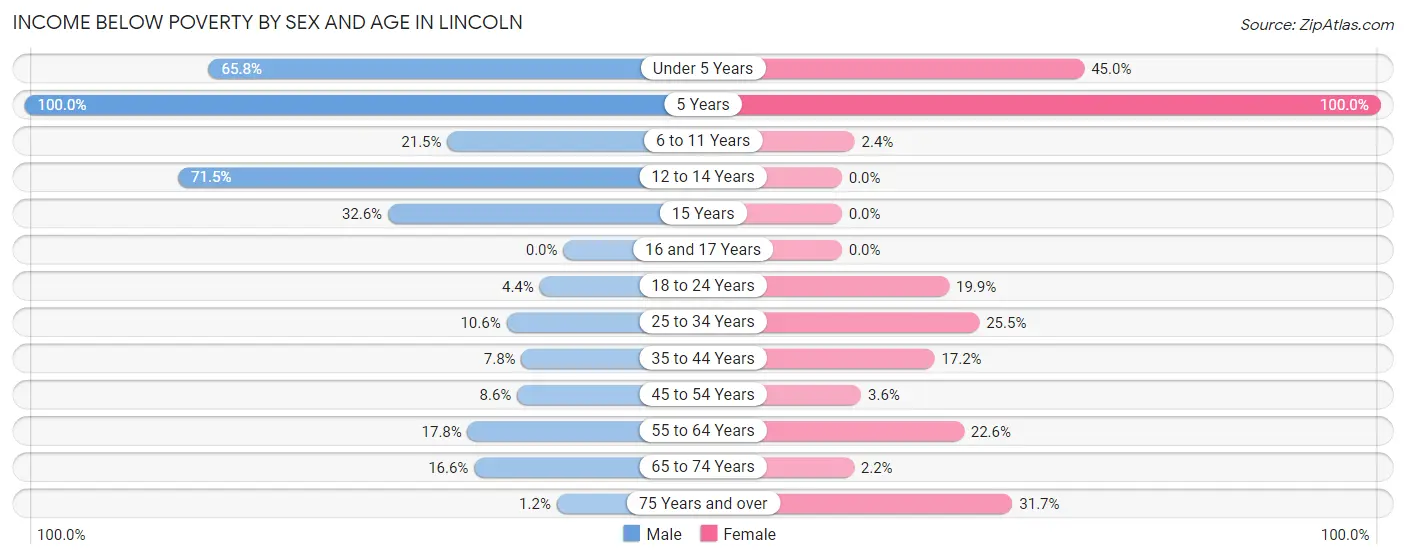
Income Below Poverty by Sex and Age in Lincoln
With 18.0% poverty level for males and 16.0% for females among the residents of Lincoln, 5 year old males and 5 year old females are the most vulnerable to poverty, with 10 males (100.0%) and 36 females (100.0%) in their respective age groups living below the poverty level.
| Age Bracket | Male | Female |
| Under 5 Years | 79 (65.8%) | 117 (45.0%) |
| 5 Years | 10 (100.0%) | 36 (100.0%) |
| 6 to 11 Years | 59 (21.5%) | 7 (2.4%) |
| 12 to 14 Years | 163 (71.5%) | 0 (0.0%) |
| 15 Years | 42 (32.6%) | 0 (0.0%) |
| 16 and 17 Years | 0 (0.0%) | 0 (0.0%) |
| 18 to 24 Years | 13 (4.4%) | 44 (19.9%) |
| 25 to 34 Years | 42 (10.5%) | 112 (25.5%) |
| 35 to 44 Years | 36 (7.8%) | 59 (17.2%) |
| 45 to 54 Years | 40 (8.6%) | 23 (3.6%) |
| 55 to 64 Years | 70 (17.8%) | 108 (22.6%) |
| 65 to 74 Years | 47 (16.6%) | 10 (2.2%) |
| 75 Years and over | 2 (1.2%) | 63 (31.7%) |
| Total | 603 (18.0%) | 579 (16.0%) |
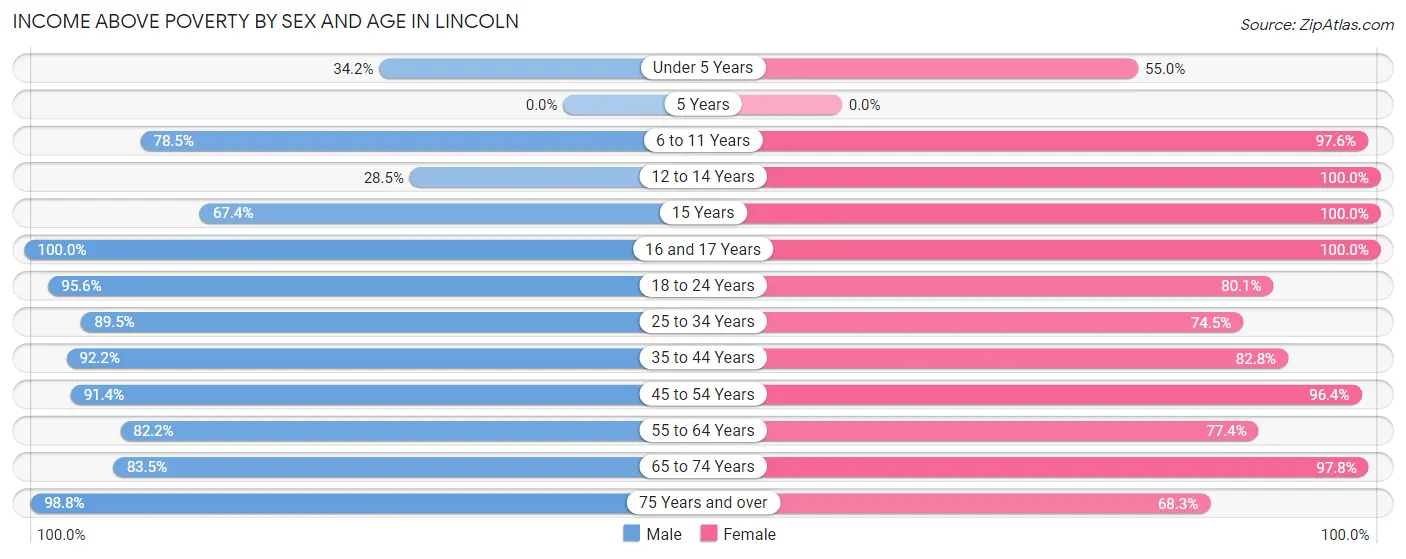
Income Above Poverty by Sex and Age in Lincoln
According to the poverty statistics in Lincoln, males aged 16 and 17 years and females aged 12 to 14 years are the age groups that are most secure financially, with 100.0% of males and 100.0% of females in these age groups living above the poverty line.
| Age Bracket | Male | Female |
| Under 5 Years | 41 (34.2%) | 143 (55.0%) |
| 5 Years | 0 (0.0%) | 0 (0.0%) |
| 6 to 11 Years | 215 (78.5%) | 287 (97.6%) |
| 12 to 14 Years | 65 (28.5%) | 156 (100.0%) |
| 15 Years | 87 (67.4%) | 21 (100.0%) |
| 16 and 17 Years | 117 (100.0%) | 90 (100.0%) |
| 18 to 24 Years | 282 (95.6%) | 177 (80.1%) |
| 25 to 34 Years | 356 (89.4%) | 327 (74.5%) |
| 35 to 44 Years | 427 (92.2%) | 284 (82.8%) |
| 45 to 54 Years | 427 (91.4%) | 620 (96.4%) |
| 55 to 64 Years | 324 (82.2%) | 369 (77.4%) |
| 65 to 74 Years | 237 (83.5%) | 437 (97.8%) |
| 75 Years and over | 161 (98.8%) | 136 (68.3%) |
| Total | 2,739 (82.0%) | 3,047 (84.0%) |
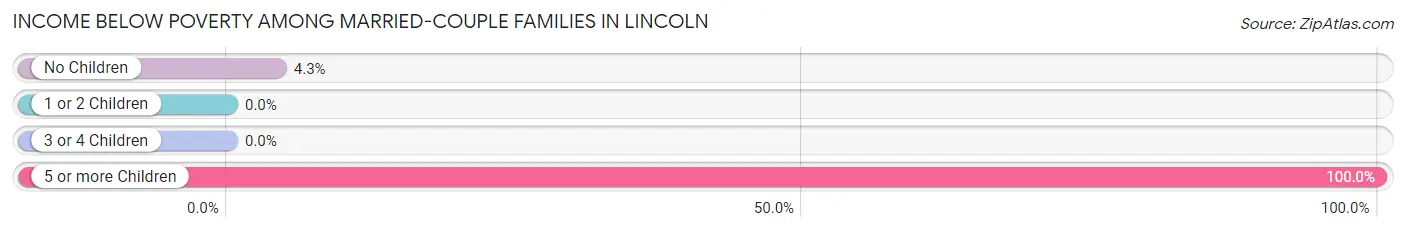
Income Below Poverty Among Married-Couple Families in Lincoln
The poverty statistics for married-couple families in Lincoln show that 3.4% or 51 of the total 1,508 families live below the poverty line. Families with 5 or more children have the highest poverty rate of 100.0%, comprising of 16 families. On the other hand, families with 1 or 2 children have the lowest poverty rate of 0.0%, which includes 0 families.
| Children | Above Poverty | Below Poverty |
| No Children | 788 (95.8%) | 35 (4.3%) |
| 1 or 2 Children | 577 (100.0%) | 0 (0.0%) |
| 3 or 4 Children | 92 (100.0%) | 0 (0.0%) |
| 5 or more Children | 0 (0.0%) | 16 (100.0%) |
| Total | 1,457 (96.6%) | 51 (3.4%) |
Income Below Poverty Among Single-Parent Households in Lincoln
According to the poverty data in Lincoln, 13.7% or 17 single-father households and 46.9% or 152 single-mother households are living below the poverty line. Among single-father households, those with 1 or 2 children have the highest poverty rate, with 15 households (19.2%) experiencing poverty. Likewise, among single-mother households, those with 5 or more children have the highest poverty rate, with 55 households (100.0%) falling below the poverty line.
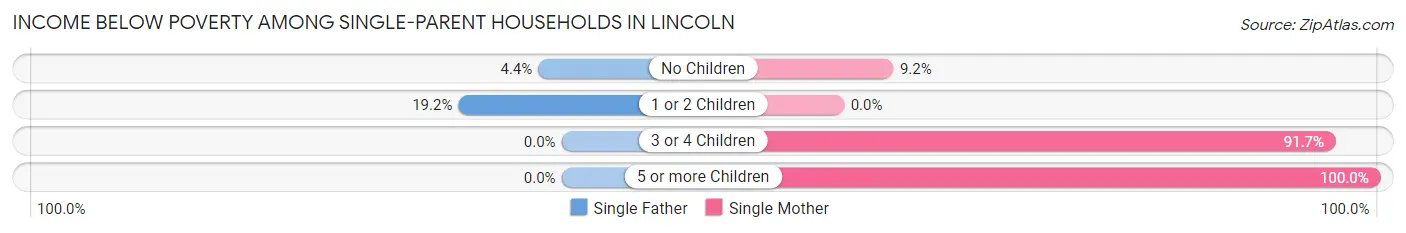
| Children | Single Father | Single Mother |
| No Children | 2 (4.3%) | 9 (9.2%) |
| 1 or 2 Children | 15 (19.2%) | 0 (0.0%) |
| 3 or 4 Children | 0 (0.0%) | 88 (91.7%) |
| 5 or more Children | 0 (0.0%) | 55 (100.0%) |
| Total | 17 (13.7%) | 152 (46.9%) |
Income Below Poverty Among Married-Couple vs Single-Parent Households in Lincoln
The poverty data for Lincoln shows that 51 of the married-couple family households (3.4%) and 169 of the single-parent households (37.7%) are living below the poverty level. Within the married-couple family households, those with 5 or more children have the highest poverty rate, with 16 households (100.0%) falling below the poverty line. Among the single-parent households, those with 5 or more children have the highest poverty rate, with 55 household (100.0%) living below poverty.
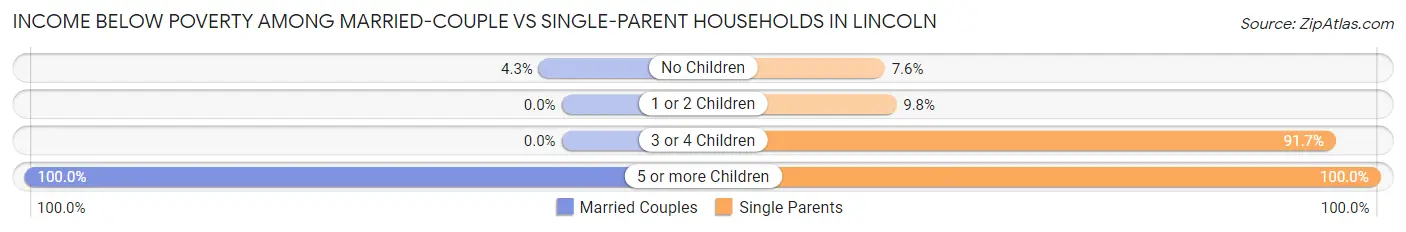
| Children | Married-Couple Families | Single-Parent Households |
| No Children | 35 (4.3%) | 11 (7.6%) |
| 1 or 2 Children | 0 (0.0%) | 15 (9.8%) |
| 3 or 4 Children | 0 (0.0%) | 88 (91.7%) |
| 5 or more Children | 16 (100.0%) | 55 (100.0%) |
| Total | 51 (3.4%) | 169 (37.7%) |
Race in Lincoln
The most populous races in Lincoln are White / Caucasian (4,520 | 64.9%), Black / African American (1,823 | 26.2%), and Two or more Races (350 | 5.0%).
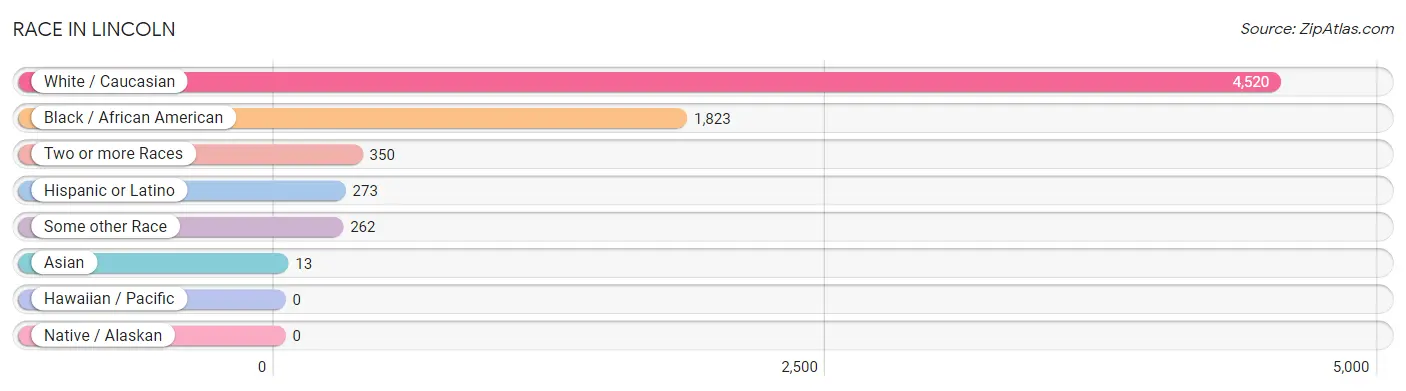
| Race | # Population | % Population |
| Asian | 13 | 0.2% |
| Black / African American | 1,823 | 26.2% |
| Hawaiian / Pacific | 0 | 0.0% |
| Hispanic or Latino | 273 | 3.9% |
| Native / Alaskan | 0 | 0.0% |
| White / Caucasian | 4,520 | 64.9% |
| Two or more Races | 350 | 5.0% |
| Some other Race | 262 | 3.8% |
| Total | 6,968 | 100.0% |
Ancestry in Lincoln
The most populous ancestries reported in Lincoln are Irish (732 | 10.5%), English (660 | 9.5%), American (591 | 8.5%), German (321 | 4.6%), and Mexican (262 | 3.8%), together accounting for 36.8% of all Lincoln residents.
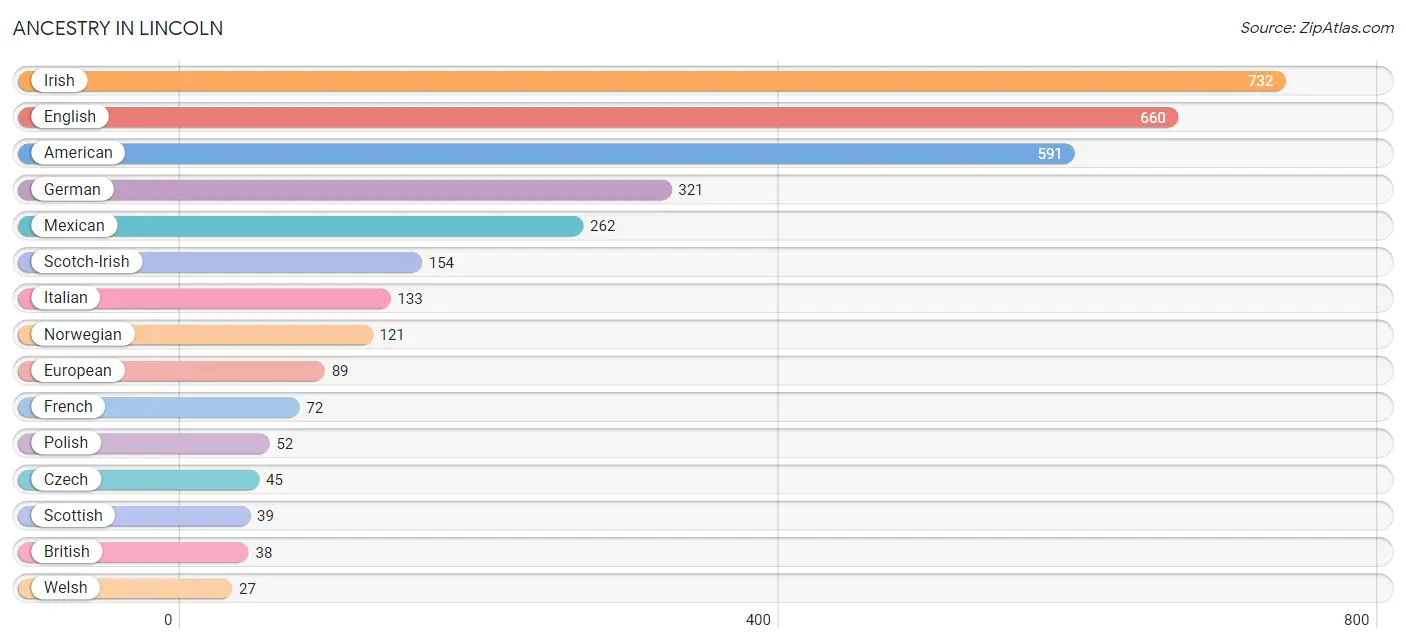
| Ancestry | # Population | % Population |
| African | 24 | 0.3% |
| American | 591 | 8.5% |
| British | 38 | 0.5% |
| Canadian | 16 | 0.2% |
| Colombian | 11 | 0.2% |
| Czech | 45 | 0.6% |
| English | 660 | 9.5% |
| European | 89 | 1.3% |
| French | 72 | 1.0% |
| German | 321 | 4.6% |
| Irish | 732 | 10.5% |
| Italian | 133 | 1.9% |
| Korean | 16 | 0.2% |
| Luxembourger | 18 | 0.3% |
| Mexican | 262 | 3.8% |
| Northern European | 10 | 0.1% |
| Norwegian | 121 | 1.7% |
| Polish | 52 | 0.7% |
| Russian | 8 | 0.1% |
| Scotch-Irish | 154 | 2.2% |
| Scottish | 39 | 0.6% |
| Seminole | 6 | 0.1% |
| South American | 11 | 0.2% |
| Subsaharan African | 24 | 0.3% |
| Swiss | 12 | 0.2% |
| Welsh | 27 | 0.4% | View All 26 Rows |
Immigrants in Lincoln
The most numerous immigrant groups reported in Lincoln came from Central America (55 | 0.8%), Latin America (55 | 0.8%), Mexico (55 | 0.8%), Asia (13 | 0.2%), and Philippines (13 | 0.2%), together accounting for 2.8% of all Lincoln residents.
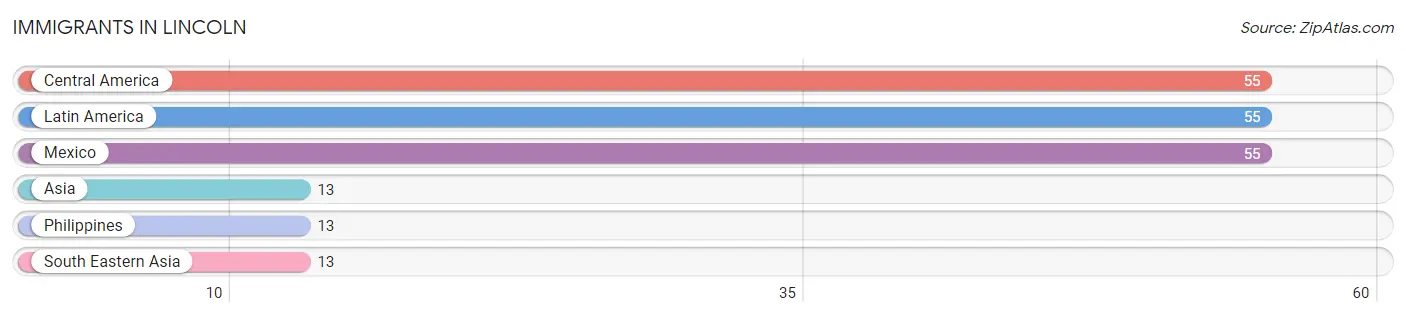
| Immigration Origin | # Population | % Population |
| Asia | 13 | 0.2% |
| Central America | 55 | 0.8% |
| Latin America | 55 | 0.8% |
| Mexico | 55 | 0.8% |
| Philippines | 13 | 0.2% |
| South Eastern Asia | 13 | 0.2% | View All 6 Rows |
Sex and Age in Lincoln
Sex and Age in Lincoln
The most populous age groups in Lincoln are 40 to 44 Years (352 | 10.5%) for men and 45 to 49 Years (434 | 12.0%) for women.
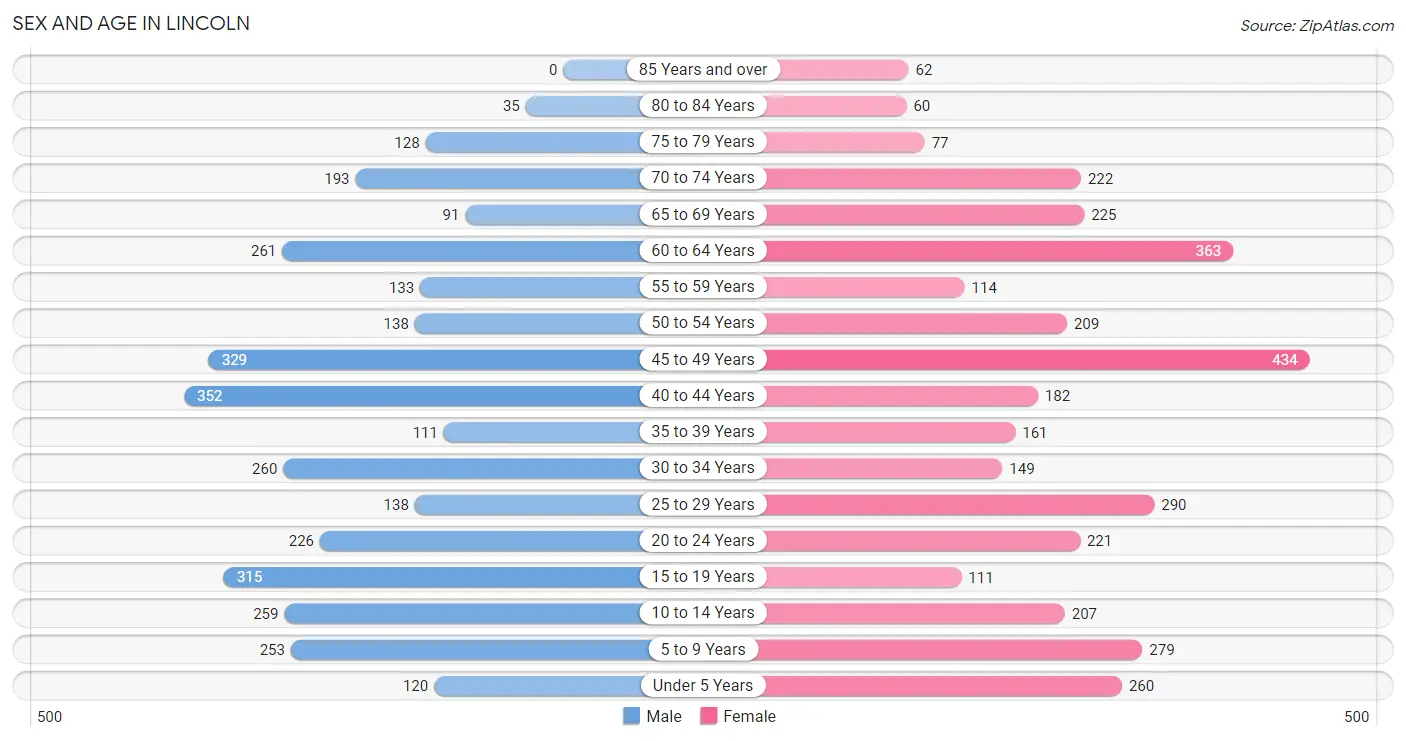
| Age Bracket | Male | Female |
| Under 5 Years | 120 (3.6%) | 260 (7.2%) |
| 5 to 9 Years | 253 (7.6%) | 279 (7.7%) |
| 10 to 14 Years | 259 (7.7%) | 207 (5.7%) |
| 15 to 19 Years | 315 (9.4%) | 111 (3.1%) |
| 20 to 24 Years | 226 (6.8%) | 221 (6.1%) |
| 25 to 29 Years | 138 (4.1%) | 290 (8.0%) |
| 30 to 34 Years | 260 (7.8%) | 149 (4.1%) |
| 35 to 39 Years | 111 (3.3%) | 161 (4.4%) |
| 40 to 44 Years | 352 (10.5%) | 182 (5.0%) |
| 45 to 49 Years | 329 (9.8%) | 434 (12.0%) |
| 50 to 54 Years | 138 (4.1%) | 209 (5.8%) |
| 55 to 59 Years | 133 (4.0%) | 114 (3.1%) |
| 60 to 64 Years | 261 (7.8%) | 363 (10.0%) |
| 65 to 69 Years | 91 (2.7%) | 225 (6.2%) |
| 70 to 74 Years | 193 (5.8%) | 222 (6.1%) |
| 75 to 79 Years | 128 (3.8%) | 77 (2.1%) |
| 80 to 84 Years | 35 (1.1%) | 60 (1.7%) |
| 85 Years and over | 0 (0.0%) | 62 (1.7%) |
| Total | 3,342 (100.0%) | 3,626 (100.0%) |
Families and Households in Lincoln
Median Family Size in Lincoln
The median family size in Lincoln is 3.08 persons per family, with single female/mother families (324 | 16.6%) accounting for the largest median family size of 3.62 persons per family. On the other hand, single male/father families (124 | 6.3%) represent the smallest median family size with 2.21 persons per family.
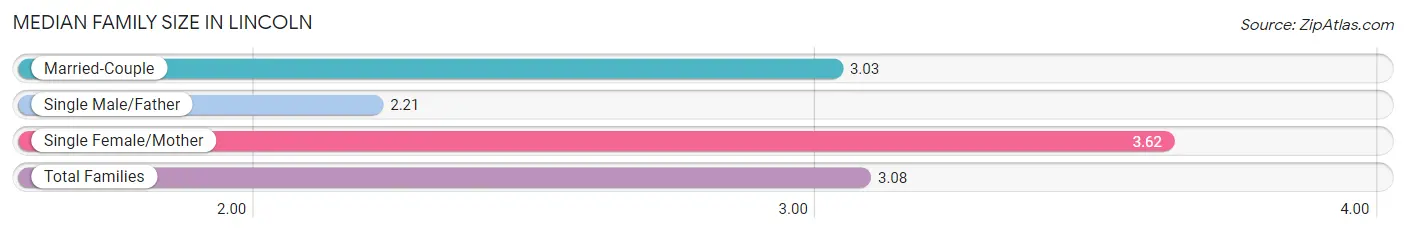
| Family Type | # Families | Family Size |
| Married-Couple | 1,508 (77.1%) | 3.03 |
| Single Male/Father | 124 (6.3%) | 2.21 |
| Single Female/Mother | 324 (16.6%) | 3.62 |
| Total Families | 1,956 (100.0%) | 3.08 |
Median Household Size in Lincoln
The median household size in Lincoln is 2.60 persons per household, with single female/mother households (324 | 12.1%) accounting for the largest median household size of 3.62 persons per household. non-family households (711 | 26.7%) represent the smallest median household size with 1.19 persons per household.
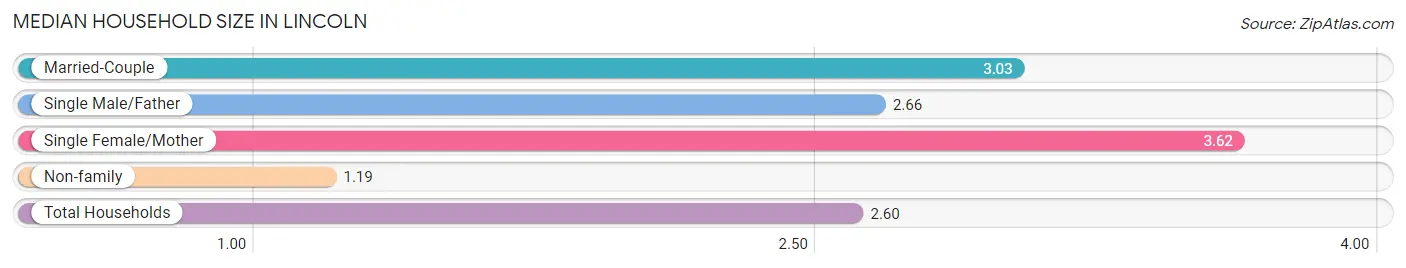
| Household Type | # Households | Household Size |
| Married-Couple | 1,508 (56.5%) | 3.03 |
| Single Male/Father | 124 (4.6%) | 2.66 |
| Single Female/Mother | 324 (12.1%) | 3.62 |
| Non-family | 711 (26.7%) | 1.19 |
| Total Households | 2,667 (100.0%) | 2.60 |
Household Size by Marriage Status in Lincoln
Out of a total of 2,667 households in Lincoln, 1,956 (73.3%) are family households, while 711 (26.7%) are nonfamily households. The most numerous type of family households are 2-person households, comprising 810, and the most common type of nonfamily households are 1-person households, comprising 623.
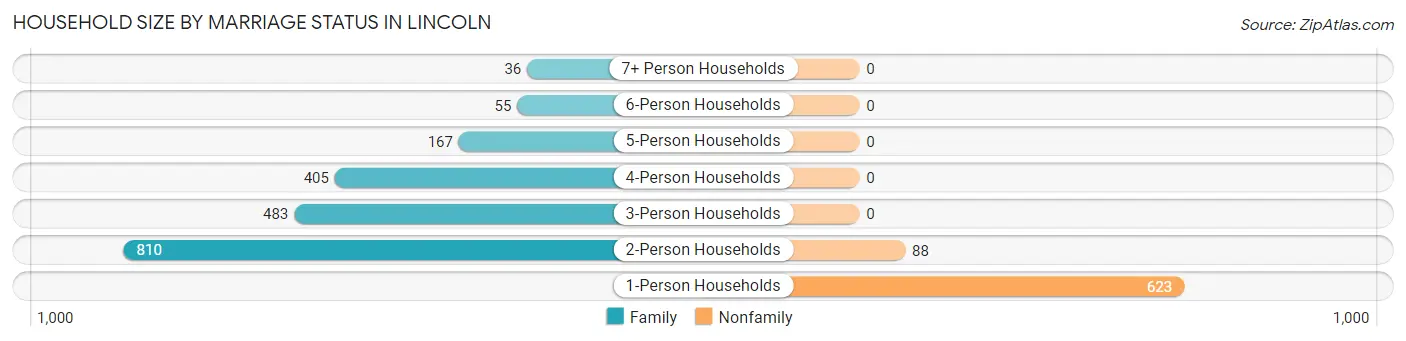
| Household Size | Family Households | Nonfamily Households |
| 1-Person Households | - | 623 (23.4%) |
| 2-Person Households | 810 (30.4%) | 88 (3.3%) |
| 3-Person Households | 483 (18.1%) | 0 (0.0%) |
| 4-Person Households | 405 (15.2%) | 0 (0.0%) |
| 5-Person Households | 167 (6.3%) | 0 (0.0%) |
| 6-Person Households | 55 (2.1%) | 0 (0.0%) |
| 7+ Person Households | 36 (1.3%) | 0 (0.0%) |
| Total | 1,956 (73.3%) | 711 (26.7%) |
Female Fertility in Lincoln
Fertility by Age in Lincoln
Average fertility rate in Lincoln is 31.0 births per 1,000 women. Women in the age bracket of 20 to 34 years have the highest fertility rate with 76.0 births per 1,000 women. Women in the age bracket of 20 to 34 years acount for 100.0% of all women with births.
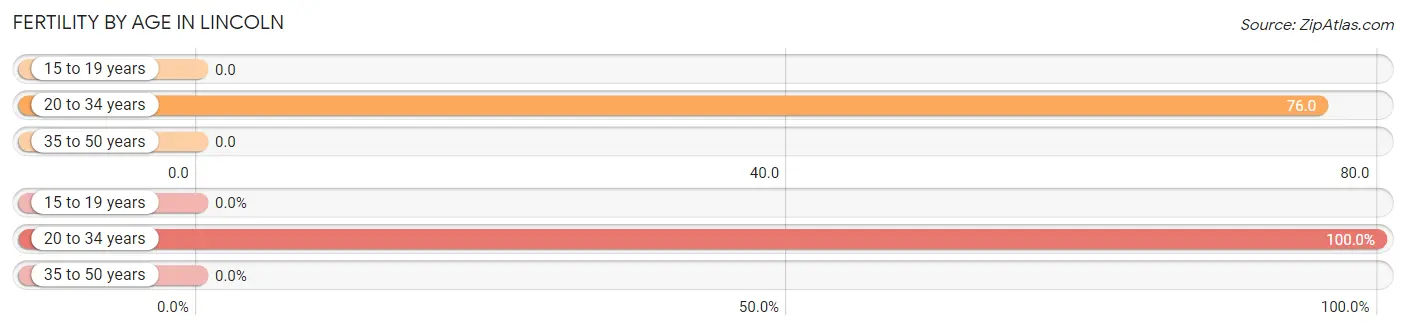
| Age Bracket | Women with Births | Births / 1,000 Women |
| 15 to 19 years | 0 (0.0%) | 0.0 |
| 20 to 34 years | 50 (100.0%) | 76.0 |
| 35 to 50 years | 0 (0.0%) | 0.0 |
| Total | 50 (100.0%) | 31.0 |
Fertility by Age by Marriage Status in Lincoln
22.0% of women with births (50) in Lincoln are married. The highest percentage of unmarried women with births falls into 20 to 34 years age bracket with 78.0% of them unmarried at the time of birth, while the lowest percentage of unmarried women with births belong to 20 to 34 years age bracket with 78.0% of them unmarried.

| Age Bracket | Married | Unmarried |
| 15 to 19 years | 0 (0.0%) | 0 (0.0%) |
| 20 to 34 years | 11 (22.0%) | 39 (78.0%) |
| 35 to 50 years | 0 (0.0%) | 0 (0.0%) |
| Total | 11 (22.0%) | 39 (78.0%) |
Fertility by Education in Lincoln
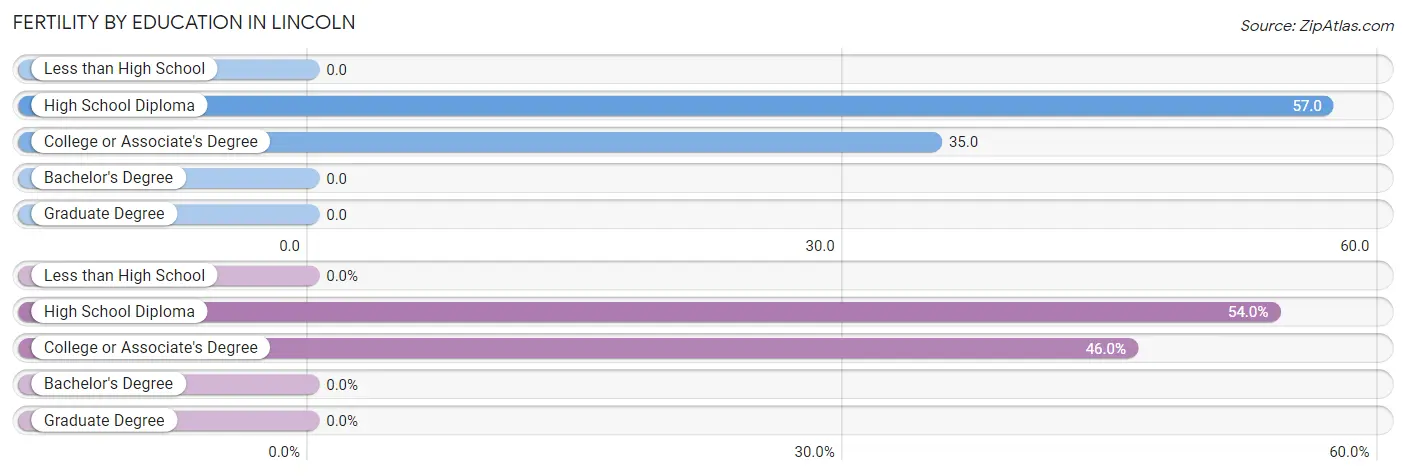
| Educational Attainment | Women with Births | Births / 1,000 Women |
| Less than High School | 0 (0.0%) | 0.0 |
| High School Diploma | 27 (54.0%) | 57.0 |
| College or Associate's Degree | 23 (46.0%) | 35.0 |
| Bachelor's Degree | 0 (0.0%) | 0.0 |
| Graduate Degree | 0 (0.0%) | 0.0 |
| Total | 50 (100.0%) | 31.0 |
Fertility by Education by Marriage Status in Lincoln
78.0% of women with births in Lincoln are unmarried. Women with the educational attainment of college or associate's degree are most likely to be married with 47.8% of them married at childbirth, while women with the educational attainment of high school diploma are least likely to be married with 100.0% of them unmarried at childbirth.
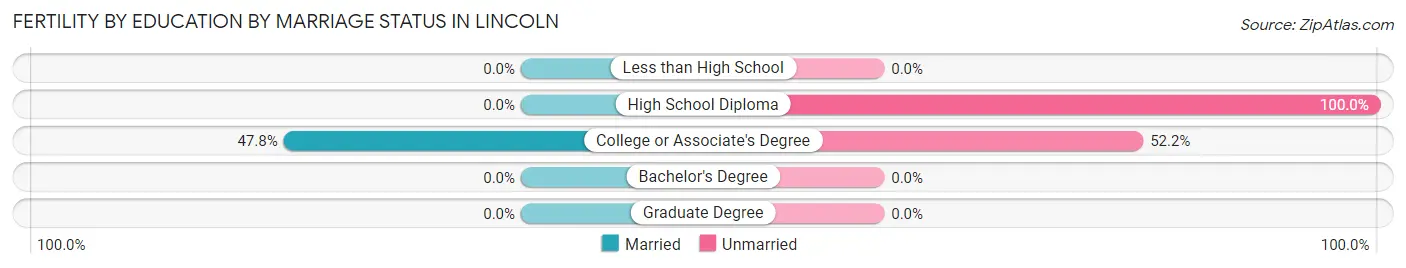
| Educational Attainment | Married | Unmarried |
| Less than High School | 0 (0.0%) | 0 (0.0%) |
| High School Diploma | 0 (0.0%) | 27 (100.0%) |
| College or Associate's Degree | 11 (47.8%) | 12 (52.2%) |
| Bachelor's Degree | 0 (0.0%) | 0 (0.0%) |
| Graduate Degree | 0 (0.0%) | 0 (0.0%) |
| Total | 11 (22.0%) | 39 (78.0%) |
Employment Characteristics in Lincoln
Employment by Class of Employer in Lincoln
Among the 3,170 employed individuals in Lincoln, private company employees (2,348 | 74.1%), federal government employees (304 | 9.6%), and state government employees (130 | 4.1%) make up the most common classes of employment.
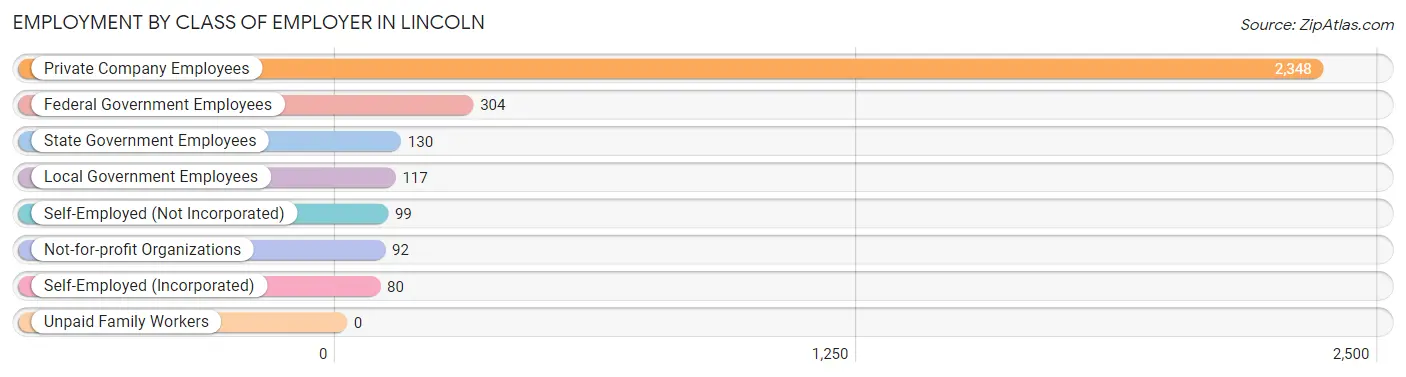
| Employer Class | # Employees | % Employees |
| Private Company Employees | 2,348 | 74.1% |
| Self-Employed (Incorporated) | 80 | 2.5% |
| Self-Employed (Not Incorporated) | 99 | 3.1% |
| Not-for-profit Organizations | 92 | 2.9% |
| Local Government Employees | 117 | 3.7% |
| State Government Employees | 130 | 4.1% |
| Federal Government Employees | 304 | 9.6% |
| Unpaid Family Workers | 0 | 0.0% |
| Total | 3,170 | 100.0% |
Employment Status by Age in Lincoln
According to the labor force statistics for Lincoln, out of the total population over 16 years of age (5,440), 64.6% or 3,514 individuals are in the labor force, with 7.4% or 260 of them unemployed. The age group with the highest labor force participation rate is 25 to 29 years, with 93.5% or 400 individuals in the labor force. Within the labor force, the 16 to 19 years age range has the highest percentage of unemployed individuals, with 38.1% or 53 of them being unemployed.
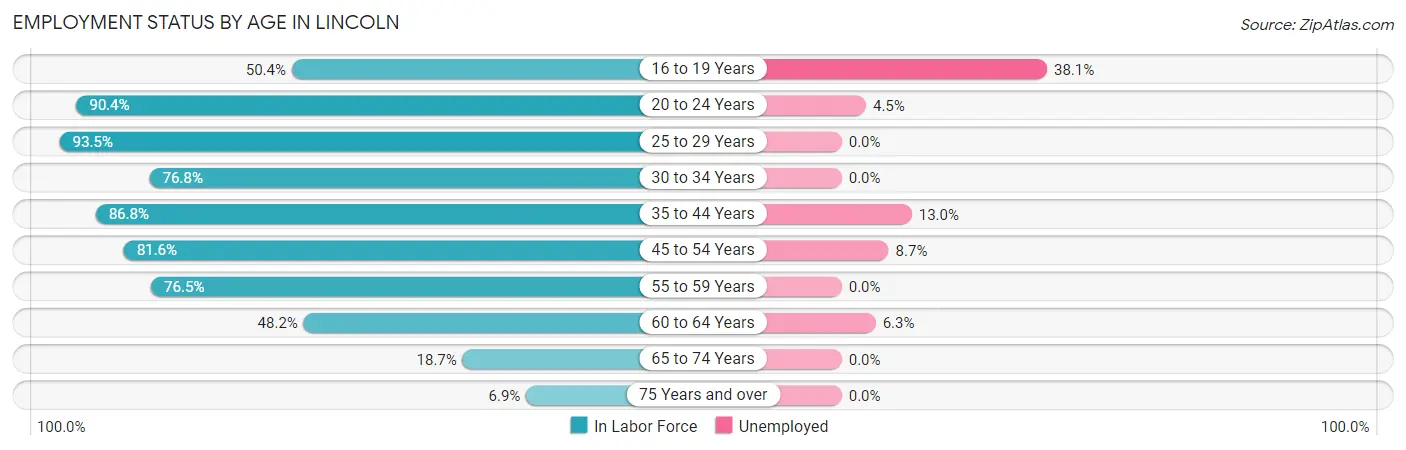
| Age Bracket | In Labor Force | Unemployed |
| 16 to 19 Years | 139 (50.4%) | 53 (38.1%) |
| 20 to 24 Years | 404 (90.4%) | 18 (4.5%) |
| 25 to 29 Years | 400 (93.5%) | 0 (0.0%) |
| 30 to 34 Years | 314 (76.8%) | 0 (0.0%) |
| 35 to 44 Years | 700 (86.8%) | 91 (13.0%) |
| 45 to 54 Years | 906 (81.6%) | 79 (8.7%) |
| 55 to 59 Years | 189 (76.5%) | 0 (0.0%) |
| 60 to 64 Years | 301 (48.2%) | 19 (6.3%) |
| 65 to 74 Years | 137 (18.7%) | 0 (0.0%) |
| 75 Years and over | 25 (6.9%) | 0 (0.0%) |
| Total | 3,514 (64.6%) | 260 (7.4%) |
Employment Status by Educational Attainment in Lincoln
According to labor force statistics for Lincoln, 77.5% of individuals (2,809) out of the total population between 25 and 64 years of age (3,624) are in the labor force, with 6.7% or 188 of them being unemployed. The group with the highest labor force participation rate are those with the educational attainment of bachelor's degree or higher, with 82.7% or 588 individuals in the labor force. Within the labor force, individuals with less than high school education have the highest percentage of unemployment, with 14.3% or 19 of them being unemployed.
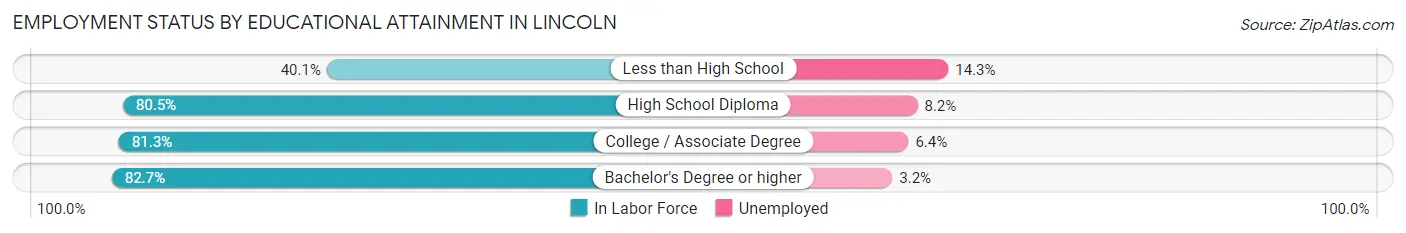
| Educational Attainment | In Labor Force | Unemployed |
| Less than High School | 133 (40.1%) | 47 (14.3%) |
| High School Diploma | 993 (80.5%) | 101 (8.2%) |
| College / Associate Degree | 1,096 (81.3%) | 86 (6.4%) |
| Bachelor's Degree or higher | 588 (82.7%) | 23 (3.2%) |
| Total | 2,809 (77.5%) | 243 (6.7%) |
Employment Occupations by Sex in Lincoln
Management, Business, Science and Arts Occupations
The most common Management, Business, Science and Arts occupations in Lincoln are Management (409 | 12.6%), Health Diagnosing & Treating (169 | 5.2%), Community & Social Service (165 | 5.1%), Business & Financial (113 | 3.5%), and Education Instruction & Library (94 | 2.9%).
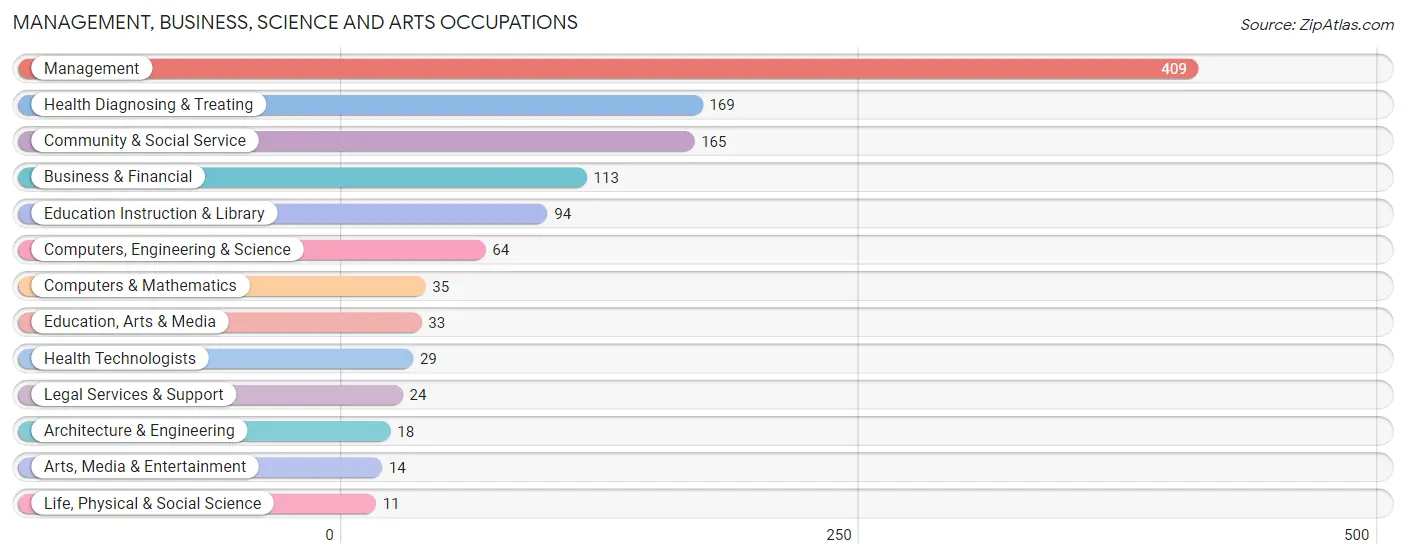
Management, Business, Science and Arts Occupations by Sex
Within the Management, Business, Science and Arts occupations in Lincoln, the most male-oriented occupations are Computers & Mathematics (100.0%), Architecture & Engineering (100.0%), and Legal Services & Support (100.0%), while the most female-oriented occupations are Life, Physical & Social Science (100.0%), Education Instruction & Library (100.0%), and Health Diagnosing & Treating (100.0%).
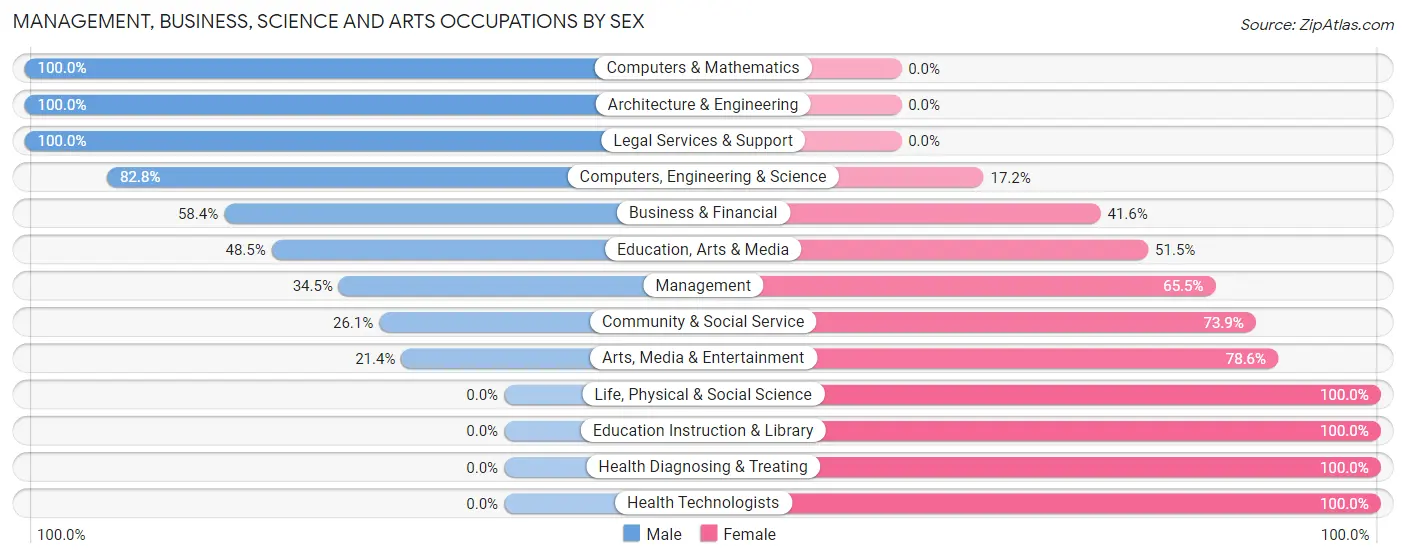
| Occupation | Male | Female |
| Management | 141 (34.5%) | 268 (65.5%) |
| Business & Financial | 66 (58.4%) | 47 (41.6%) |
| Computers, Engineering & Science | 53 (82.8%) | 11 (17.2%) |
| Computers & Mathematics | 35 (100.0%) | 0 (0.0%) |
| Architecture & Engineering | 18 (100.0%) | 0 (0.0%) |
| Life, Physical & Social Science | 0 (0.0%) | 11 (100.0%) |
| Community & Social Service | 43 (26.1%) | 122 (73.9%) |
| Education, Arts & Media | 16 (48.5%) | 17 (51.5%) |
| Legal Services & Support | 24 (100.0%) | 0 (0.0%) |
| Education Instruction & Library | 0 (0.0%) | 94 (100.0%) |
| Arts, Media & Entertainment | 3 (21.4%) | 11 (78.6%) |
| Health Diagnosing & Treating | 0 (0.0%) | 169 (100.0%) |
| Health Technologists | 0 (0.0%) | 29 (100.0%) |
| Total (Category) | 303 (32.9%) | 617 (67.1%) |
| Total (Overall) | 1,662 (51.1%) | 1,593 (48.9%) |
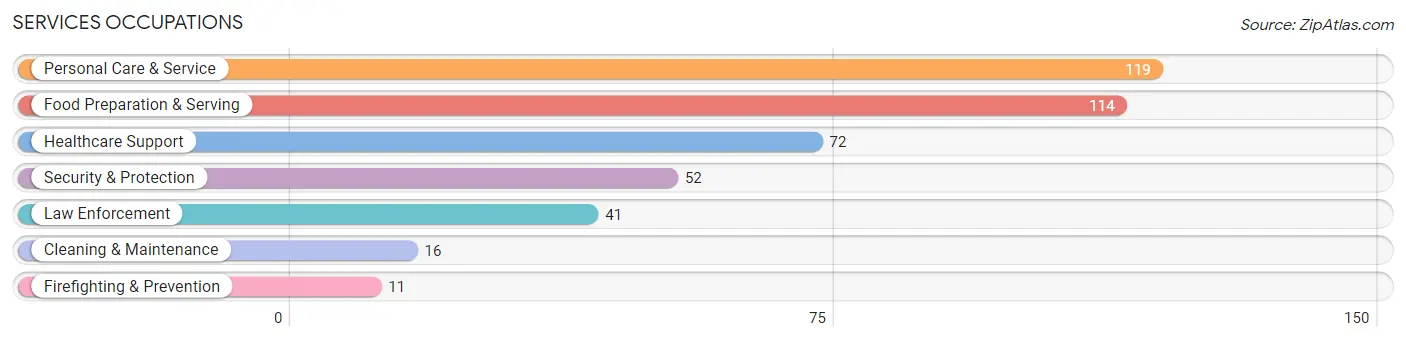
Services Occupations
The most common Services occupations in Lincoln are Personal Care & Service (119 | 3.7%), Food Preparation & Serving (114 | 3.5%), Healthcare Support (72 | 2.2%), Security & Protection (52 | 1.6%), and Law Enforcement (41 | 1.3%).
Services Occupations by Sex
Within the Services occupations in Lincoln, the most male-oriented occupations are Law Enforcement (100.0%), Cleaning & Maintenance (100.0%), and Security & Protection (78.8%), while the most female-oriented occupations are Healthcare Support (100.0%), Firefighting & Prevention (100.0%), and Personal Care & Service (79.0%).
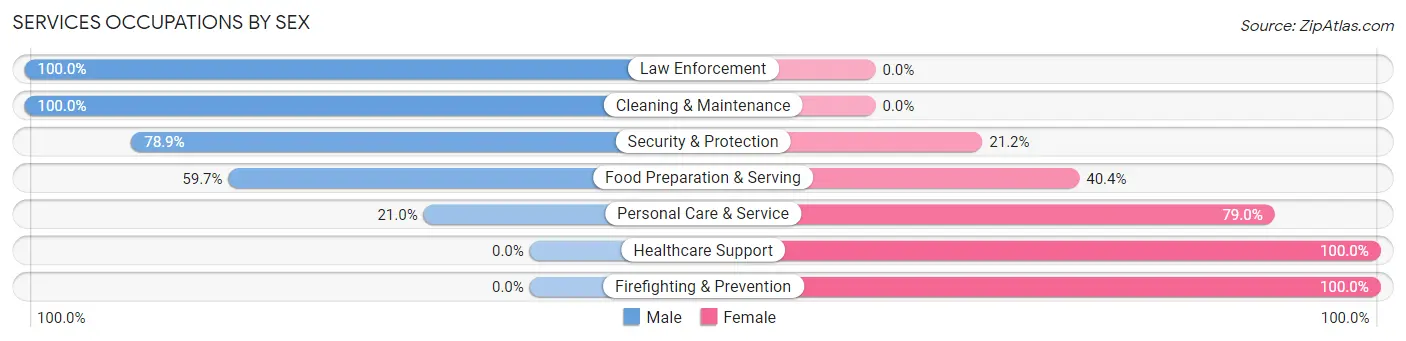
| Occupation | Male | Female |
| Healthcare Support | 0 (0.0%) | 72 (100.0%) |
| Security & Protection | 41 (78.8%) | 11 (21.1%) |
| Firefighting & Prevention | 0 (0.0%) | 11 (100.0%) |
| Law Enforcement | 41 (100.0%) | 0 (0.0%) |
| Food Preparation & Serving | 68 (59.7%) | 46 (40.4%) |
| Cleaning & Maintenance | 16 (100.0%) | 0 (0.0%) |
| Personal Care & Service | 25 (21.0%) | 94 (79.0%) |
| Total (Category) | 150 (40.2%) | 223 (59.8%) |
| Total (Overall) | 1,662 (51.1%) | 1,593 (48.9%) |
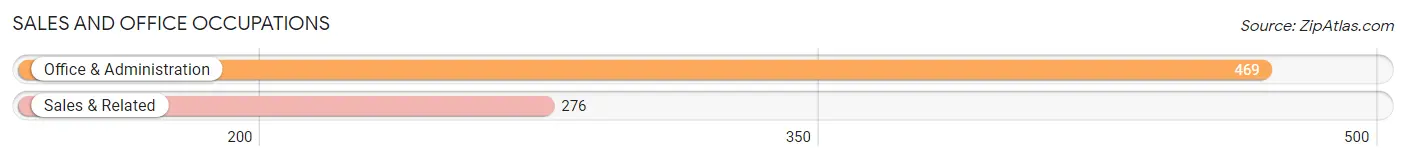
Sales and Office Occupations
The most common Sales and Office occupations in Lincoln are Office & Administration (469 | 14.4%), and Sales & Related (276 | 8.5%).
Sales and Office Occupations by Sex
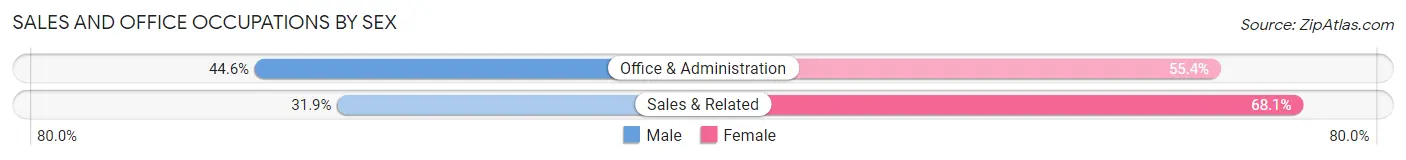
| Occupation | Male | Female |
| Sales & Related | 88 (31.9%) | 188 (68.1%) |
| Office & Administration | 209 (44.6%) | 260 (55.4%) |
| Total (Category) | 297 (39.9%) | 448 (60.1%) |
| Total (Overall) | 1,662 (51.1%) | 1,593 (48.9%) |
Natural Resources, Construction and Maintenance Occupations
The most common Natural Resources, Construction and Maintenance occupations in Lincoln are Construction & Extraction (182 | 5.6%), and Installation, Maintenance & Repair (137 | 4.2%).
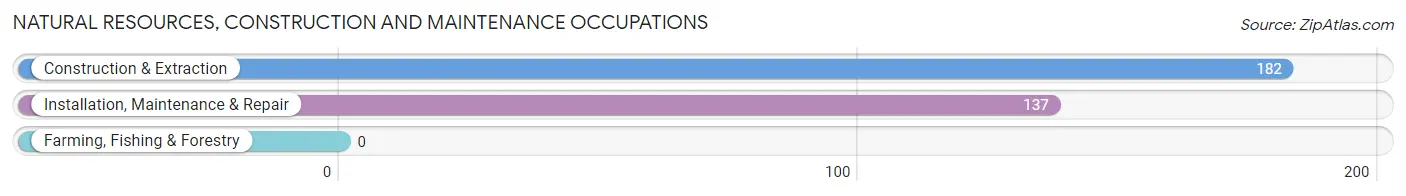
Natural Resources, Construction and Maintenance Occupations by Sex

| Occupation | Male | Female |
| Farming, Fishing & Forestry | 0 (0.0%) | 0 (0.0%) |
| Construction & Extraction | 182 (100.0%) | 0 (0.0%) |
| Installation, Maintenance & Repair | 137 (100.0%) | 0 (0.0%) |
| Total (Category) | 319 (100.0%) | 0 (0.0%) |
| Total (Overall) | 1,662 (51.1%) | 1,593 (48.9%) |
Production, Transportation and Moving Occupations
The most common Production, Transportation and Moving occupations in Lincoln are Production (637 | 19.6%), Material Moving (143 | 4.4%), and Transportation (118 | 3.6%).
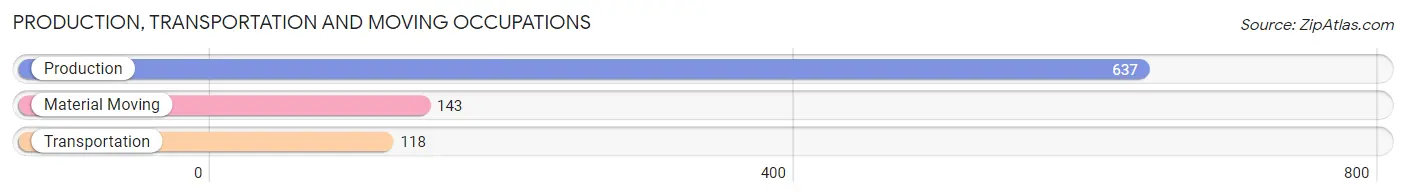
Production, Transportation and Moving Occupations by Sex
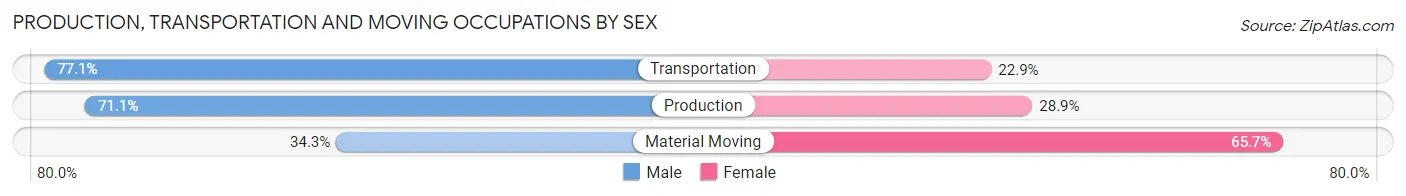
| Occupation | Male | Female |
| Production | 453 (71.1%) | 184 (28.9%) |
| Transportation | 91 (77.1%) | 27 (22.9%) |
| Material Moving | 49 (34.3%) | 94 (65.7%) |
| Total (Category) | 593 (66.0%) | 305 (34.0%) |
| Total (Overall) | 1,662 (51.1%) | 1,593 (48.9%) |
Employment Industries by Sex in Lincoln
Employment Industries in Lincoln
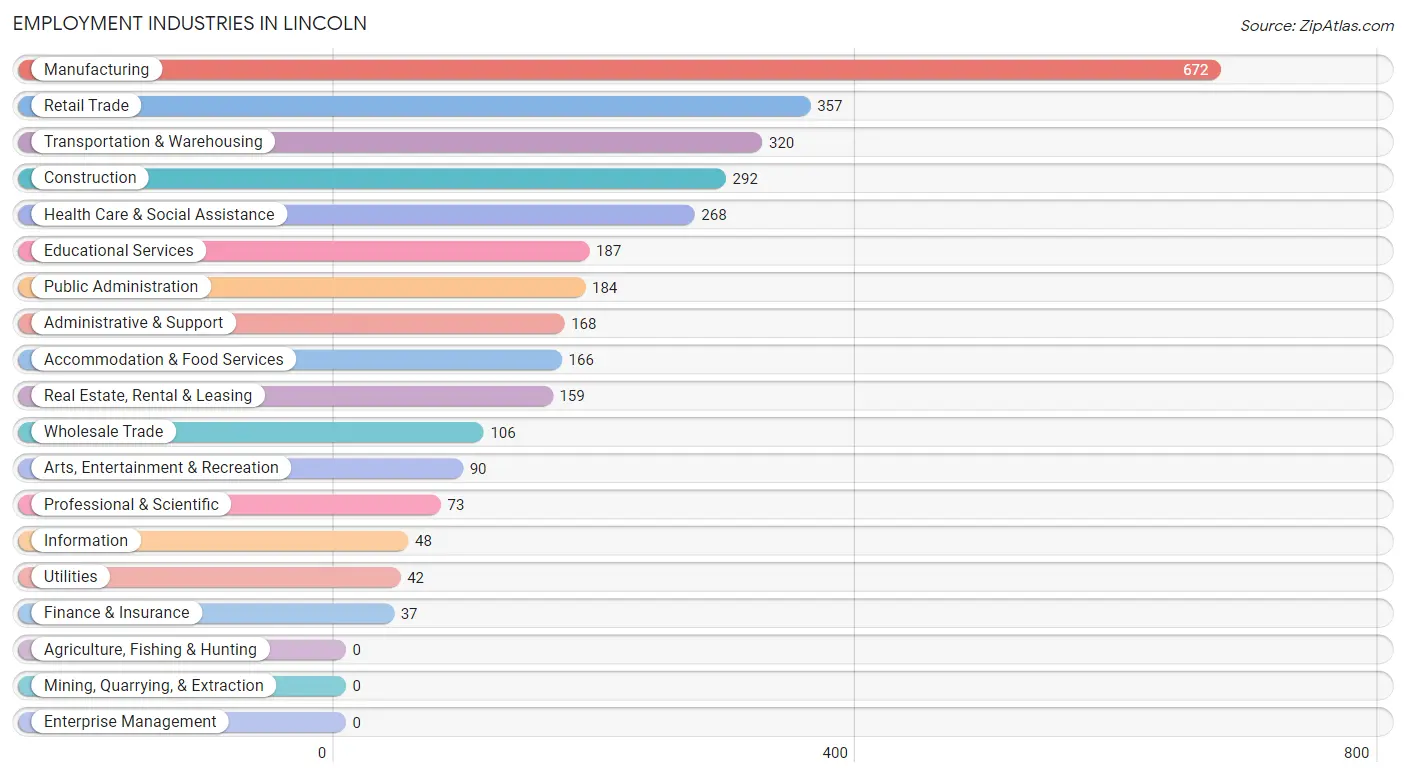
The major employment industries in Lincoln include Manufacturing (672 | 20.6%), Retail Trade (357 | 11.0%), Transportation & Warehousing (320 | 9.8%), Construction (292 | 9.0%), and Health Care & Social Assistance (268 | 8.2%).
Employment Industries by Sex in Lincoln
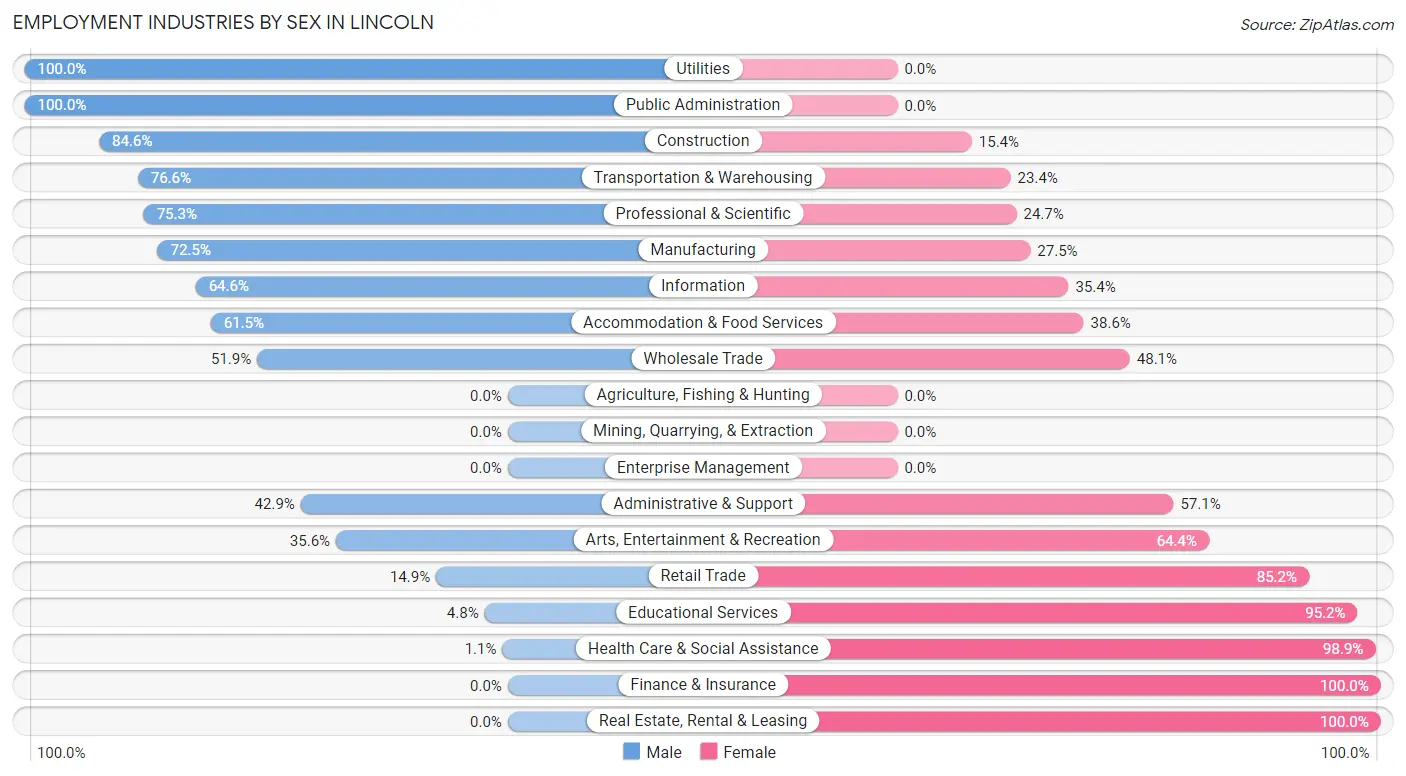
The Lincoln industries that see more men than women are Utilities (100.0%), Public Administration (100.0%), and Construction (84.6%), whereas the industries that tend to have a higher number of women are Finance & Insurance (100.0%), Real Estate, Rental & Leasing (100.0%), and Health Care & Social Assistance (98.9%).
| Industry | Male | Female |
| Agriculture, Fishing & Hunting | 0 (0.0%) | 0 (0.0%) |
| Mining, Quarrying, & Extraction | 0 (0.0%) | 0 (0.0%) |
| Construction | 247 (84.6%) | 45 (15.4%) |
| Manufacturing | 487 (72.5%) | 185 (27.5%) |
| Wholesale Trade | 55 (51.9%) | 51 (48.1%) |
| Retail Trade | 53 (14.8%) | 304 (85.2%) |
| Transportation & Warehousing | 245 (76.6%) | 75 (23.4%) |
| Utilities | 42 (100.0%) | 0 (0.0%) |
| Information | 31 (64.6%) | 17 (35.4%) |
| Finance & Insurance | 0 (0.0%) | 37 (100.0%) |
| Real Estate, Rental & Leasing | 0 (0.0%) | 159 (100.0%) |
| Professional & Scientific | 55 (75.3%) | 18 (24.7%) |
| Enterprise Management | 0 (0.0%) | 0 (0.0%) |
| Administrative & Support | 72 (42.9%) | 96 (57.1%) |
| Educational Services | 9 (4.8%) | 178 (95.2%) |
| Health Care & Social Assistance | 3 (1.1%) | 265 (98.9%) |
| Arts, Entertainment & Recreation | 32 (35.6%) | 58 (64.4%) |
| Accommodation & Food Services | 102 (61.5%) | 64 (38.6%) |
| Public Administration | 184 (100.0%) | 0 (0.0%) |
| Total | 1,662 (51.1%) | 1,593 (48.9%) |
Education in Lincoln
School Enrollment in Lincoln
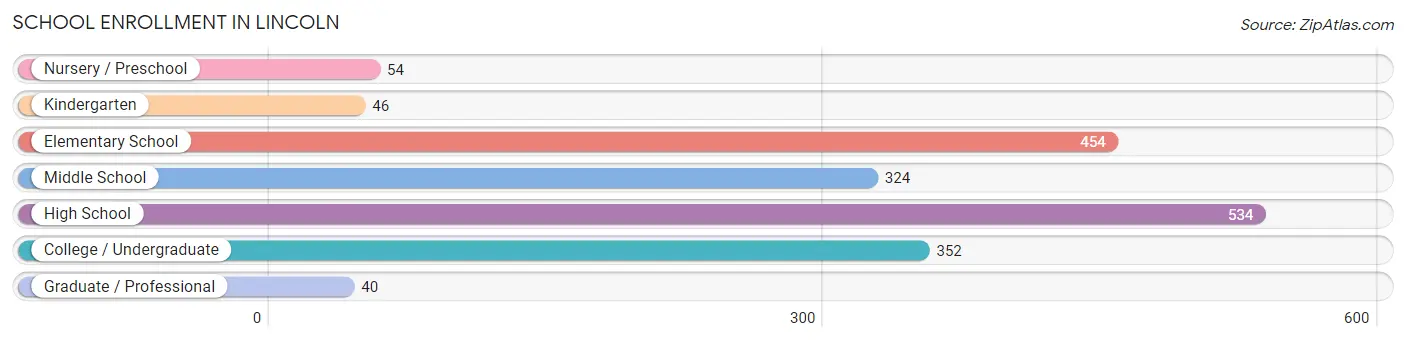
The most common levels of schooling among the 1,804 students in Lincoln are high school (534 | 29.6%), elementary school (454 | 25.2%), and college / undergraduate (352 | 19.5%).
| School Level | # Students | % Students |
| Nursery / Preschool | 54 | 3.0% |
| Kindergarten | 46 | 2.5% |
| Elementary School | 454 | 25.2% |
| Middle School | 324 | 18.0% |
| High School | 534 | 29.6% |
| College / Undergraduate | 352 | 19.5% |
| Graduate / Professional | 40 | 2.2% |
| Total | 1,804 | 100.0% |
School Enrollment by Age by Funding Source in Lincoln
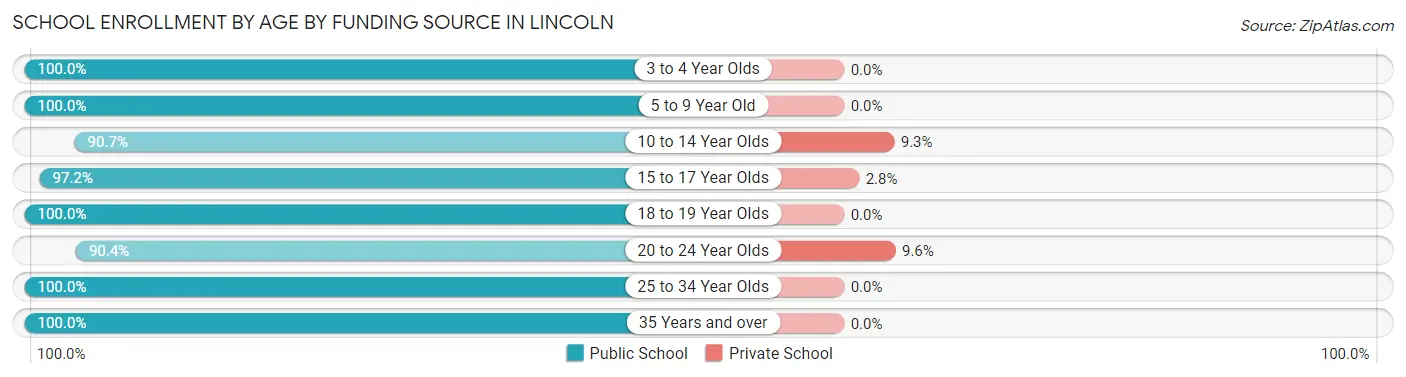
Out of a total of 1,804 students who are enrolled in schools in Lincoln, 63 (3.5%) attend a private institution, while the remaining 1,741 (96.5%) are enrolled in public schools. The age group of 20 to 24 year olds has the highest likelihood of being enrolled in private schools, with 11 (9.6% in the age bracket) enrolled. Conversely, the age group of 3 to 4 year olds has the lowest likelihood of being enrolled in a private school, with 54 (100.0% in the age bracket) attending a public institution.
| Age Bracket | Public School | Private School |
| 3 to 4 Year Olds | 54 (100.0%) | 0 (0.0%) |
| 5 to 9 Year Old | 500 (100.0%) | 0 (0.0%) |
| 10 to 14 Year Olds | 408 (90.7%) | 42 (9.3%) |
| 15 to 17 Year Olds | 347 (97.2%) | 10 (2.8%) |
| 18 to 19 Year Olds | 61 (100.0%) | 0 (0.0%) |
| 20 to 24 Year Olds | 104 (90.4%) | 11 (9.6%) |
| 25 to 34 Year Olds | 148 (100.0%) | 0 (0.0%) |
| 35 Years and over | 119 (100.0%) | 0 (0.0%) |
| Total | 1,741 (96.5%) | 63 (3.5%) |
Educational Attainment by Field of Study in Lincoln
Business (275 | 28.4%), education (202 | 20.8%), science & technology (115 | 11.9%), liberal arts & history (102 | 10.5%), and literature & languages (73 | 7.5%) are the most common fields of study among 969 individuals in Lincoln who have obtained a bachelor's degree or higher.
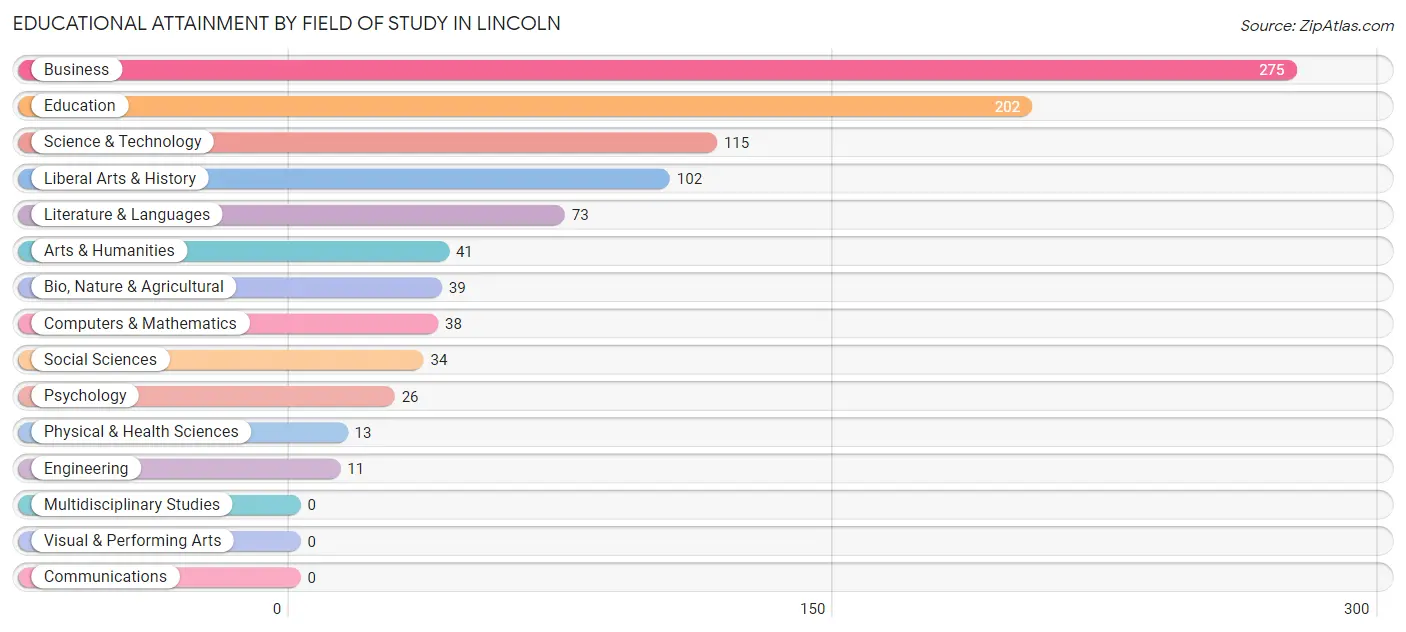
| Field of Study | # Graduates | % Graduates |
| Computers & Mathematics | 38 | 3.9% |
| Bio, Nature & Agricultural | 39 | 4.0% |
| Physical & Health Sciences | 13 | 1.3% |
| Psychology | 26 | 2.7% |
| Social Sciences | 34 | 3.5% |
| Engineering | 11 | 1.1% |
| Multidisciplinary Studies | 0 | 0.0% |
| Science & Technology | 115 | 11.9% |
| Business | 275 | 28.4% |
| Education | 202 | 20.8% |
| Literature & Languages | 73 | 7.5% |
| Liberal Arts & History | 102 | 10.5% |
| Visual & Performing Arts | 0 | 0.0% |
| Communications | 0 | 0.0% |
| Arts & Humanities | 41 | 4.2% |
| Total | 969 | 100.0% |
Transportation & Commute in Lincoln
Vehicle Availability by Sex in Lincoln
The most prevalent vehicle ownership categories in Lincoln are males with 2 vehicles (592, accounting for 36.1%) and females with 2 vehicles (512, making up 38.7%).
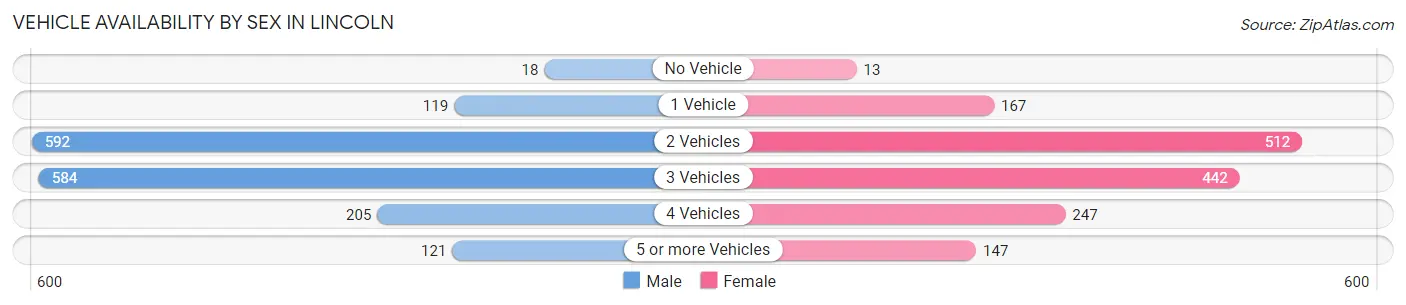
| Vehicles Available | Male | Female |
| No Vehicle | 18 (1.1%) | 13 (0.9%) |
| 1 Vehicle | 119 (7.3%) | 167 (10.9%) |
| 2 Vehicles | 592 (36.1%) | 512 (33.5%) |
| 3 Vehicles | 584 (35.6%) | 442 (28.9%) |
| 4 Vehicles | 205 (12.5%) | 247 (16.2%) |
| 5 or more Vehicles | 121 (7.4%) | 147 (9.6%) |
| Total | 1,639 (100.0%) | 1,528 (100.0%) |
Commute Time in Lincoln
The most frequently occuring commute durations in Lincoln are 15 to 19 minutes (592 commuters, 19.0%), 20 to 24 minutes (531 commuters, 17.0%), and 10 to 14 minutes (413 commuters, 13.2%).
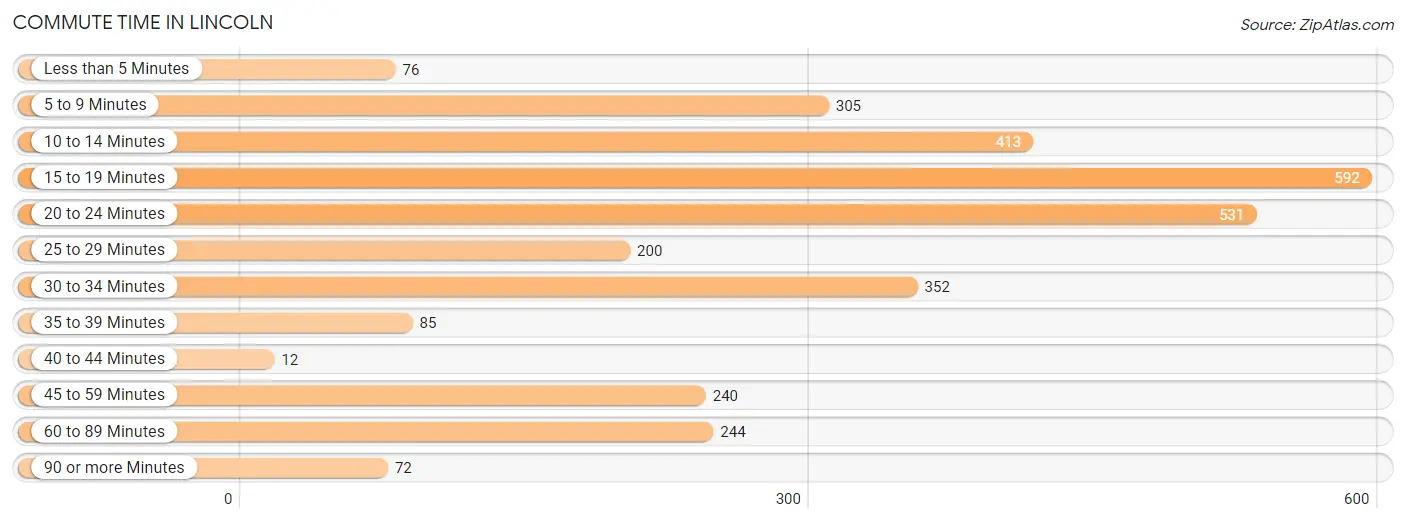
| Commute Time | # Commuters | % Commuters |
| Less than 5 Minutes | 76 | 2.4% |
| 5 to 9 Minutes | 305 | 9.8% |
| 10 to 14 Minutes | 413 | 13.2% |
| 15 to 19 Minutes | 592 | 19.0% |
| 20 to 24 Minutes | 531 | 17.0% |
| 25 to 29 Minutes | 200 | 6.4% |
| 30 to 34 Minutes | 352 | 11.3% |
| 35 to 39 Minutes | 85 | 2.7% |
| 40 to 44 Minutes | 12 | 0.4% |
| 45 to 59 Minutes | 240 | 7.7% |
| 60 to 89 Minutes | 244 | 7.8% |
| 90 or more Minutes | 72 | 2.3% |
Commute Time by Sex in Lincoln
The most common commute times in Lincoln are 20 to 24 minutes (356 commuters, 21.8%) for males and 15 to 19 minutes (293 commuters, 19.7%) for females.
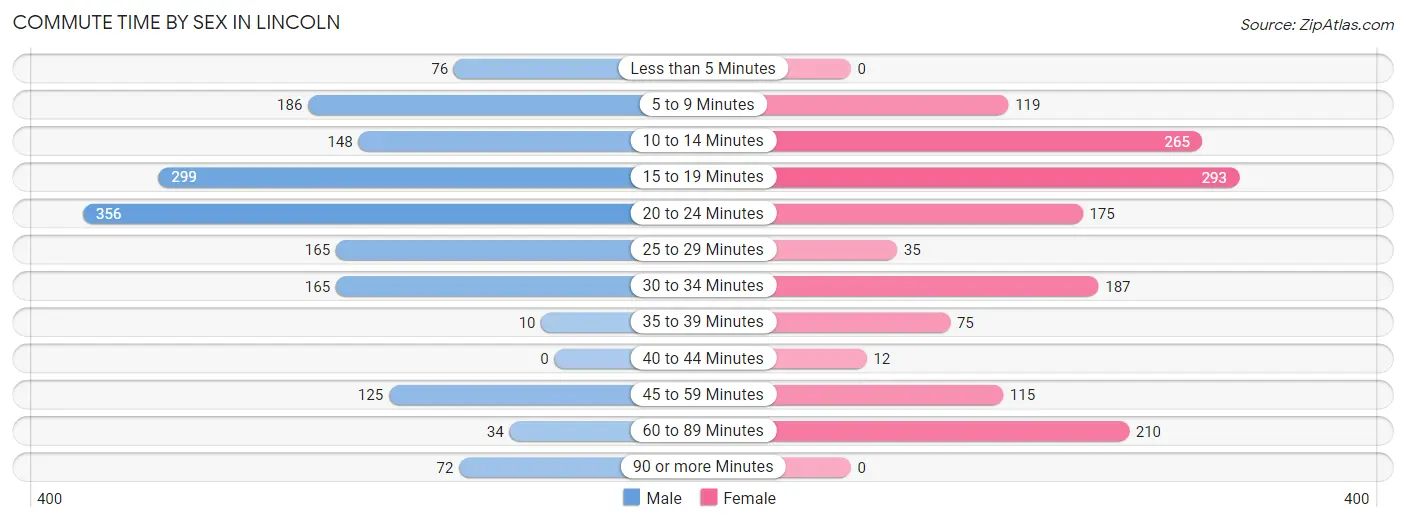
| Commute Time | Male | Female |
| Less than 5 Minutes | 76 (4.6%) | 0 (0.0%) |
| 5 to 9 Minutes | 186 (11.4%) | 119 (8.0%) |
| 10 to 14 Minutes | 148 (9.0%) | 265 (17.8%) |
| 15 to 19 Minutes | 299 (18.3%) | 293 (19.7%) |
| 20 to 24 Minutes | 356 (21.8%) | 175 (11.8%) |
| 25 to 29 Minutes | 165 (10.1%) | 35 (2.4%) |
| 30 to 34 Minutes | 165 (10.1%) | 187 (12.6%) |
| 35 to 39 Minutes | 10 (0.6%) | 75 (5.1%) |
| 40 to 44 Minutes | 0 (0.0%) | 12 (0.8%) |
| 45 to 59 Minutes | 125 (7.6%) | 115 (7.7%) |
| 60 to 89 Minutes | 34 (2.1%) | 210 (14.1%) |
| 90 or more Minutes | 72 (4.4%) | 0 (0.0%) |
Time of Departure to Work by Sex in Lincoln
The most frequent times of departure to work in Lincoln are 6:00 AM to 6:29 AM (300, 18.3%) for males and 5:00 AM to 5:29 AM (339, 22.8%) for females.
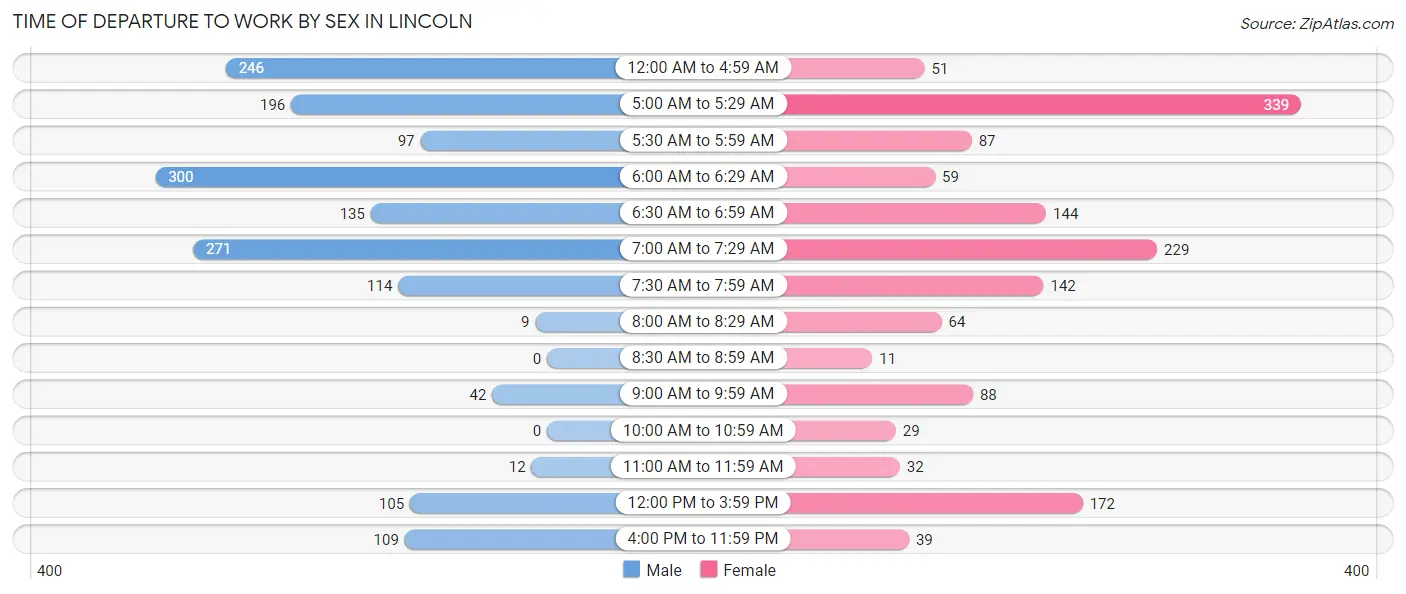
| Time of Departure | Male | Female |
| 12:00 AM to 4:59 AM | 246 (15.0%) | 51 (3.4%) |
| 5:00 AM to 5:29 AM | 196 (12.0%) | 339 (22.8%) |
| 5:30 AM to 5:59 AM | 97 (5.9%) | 87 (5.9%) |
| 6:00 AM to 6:29 AM | 300 (18.3%) | 59 (4.0%) |
| 6:30 AM to 6:59 AM | 135 (8.3%) | 144 (9.7%) |
| 7:00 AM to 7:29 AM | 271 (16.6%) | 229 (15.4%) |
| 7:30 AM to 7:59 AM | 114 (7.0%) | 142 (9.6%) |
| 8:00 AM to 8:29 AM | 9 (0.5%) | 64 (4.3%) |
| 8:30 AM to 8:59 AM | 0 (0.0%) | 11 (0.7%) |
| 9:00 AM to 9:59 AM | 42 (2.6%) | 88 (5.9%) |
| 10:00 AM to 10:59 AM | 0 (0.0%) | 29 (1.9%) |
| 11:00 AM to 11:59 AM | 12 (0.7%) | 32 (2.1%) |
| 12:00 PM to 3:59 PM | 105 (6.4%) | 172 (11.6%) |
| 4:00 PM to 11:59 PM | 109 (6.7%) | 39 (2.6%) |
| Total | 1,636 (100.0%) | 1,486 (100.0%) |
Housing Occupancy in Lincoln
Occupancy by Ownership in Lincoln
Of the total 2,667 dwellings in Lincoln, owner-occupied units account for 2,297 (86.1%), while renter-occupied units make up 370 (13.9%).
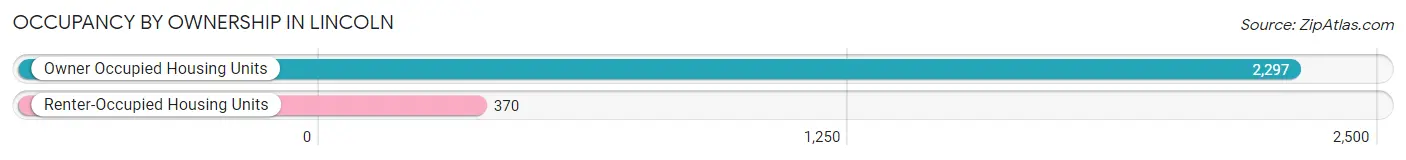
| Occupancy | # Housing Units | % Housing Units |
| Owner Occupied Housing Units | 2,297 | 86.1% |
| Renter-Occupied Housing Units | 370 | 13.9% |
| Total Occupied Housing Units | 2,667 | 100.0% |
Occupancy by Household Size in Lincoln
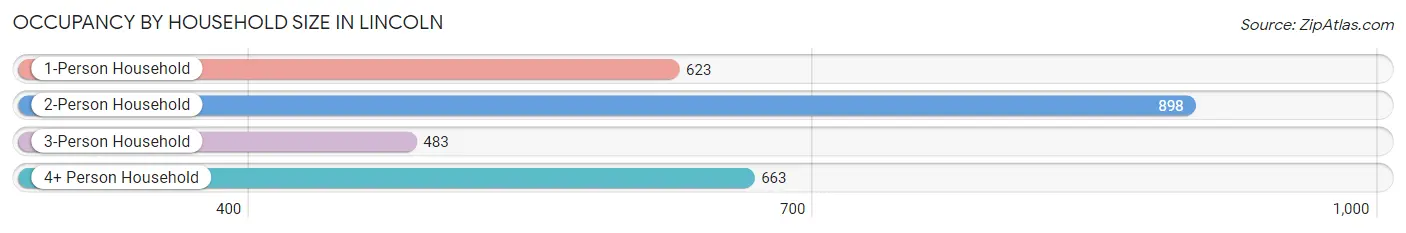
| Household Size | # Housing Units | % Housing Units |
| 1-Person Household | 623 | 23.4% |
| 2-Person Household | 898 | 33.7% |
| 3-Person Household | 483 | 18.1% |
| 4+ Person Household | 663 | 24.9% |
| Total Housing Units | 2,667 | 100.0% |
Occupancy by Ownership by Household Size in Lincoln
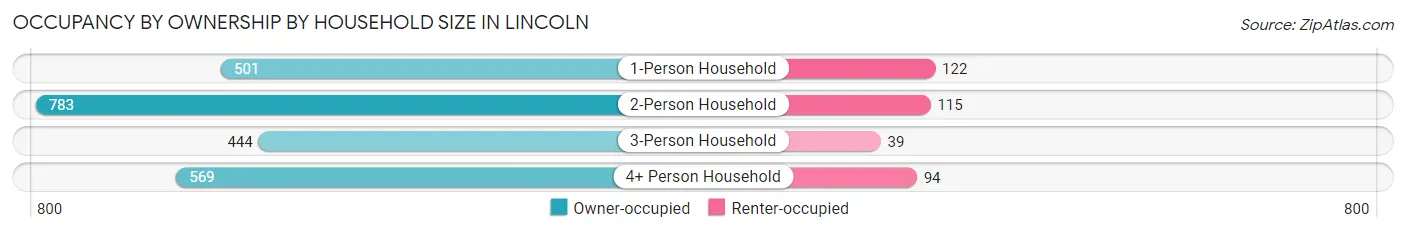
| Household Size | Owner-occupied | Renter-occupied |
| 1-Person Household | 501 (80.4%) | 122 (19.6%) |
| 2-Person Household | 783 (87.2%) | 115 (12.8%) |
| 3-Person Household | 444 (91.9%) | 39 (8.1%) |
| 4+ Person Household | 569 (85.8%) | 94 (14.2%) |
| Total Housing Units | 2,297 (86.1%) | 370 (13.9%) |
Occupancy by Educational Attainment in Lincoln

| Household Size | Owner-occupied | Renter-occupied |
| Less than High School | 139 (62.3%) | 84 (37.7%) |
| High School Diploma | 868 (90.0%) | 96 (10.0%) |
| College/Associate Degree | 812 (87.6%) | 115 (12.4%) |
| Bachelor's Degree or higher | 478 (86.4%) | 75 (13.6%) |
Occupancy by Age of Householder in Lincoln
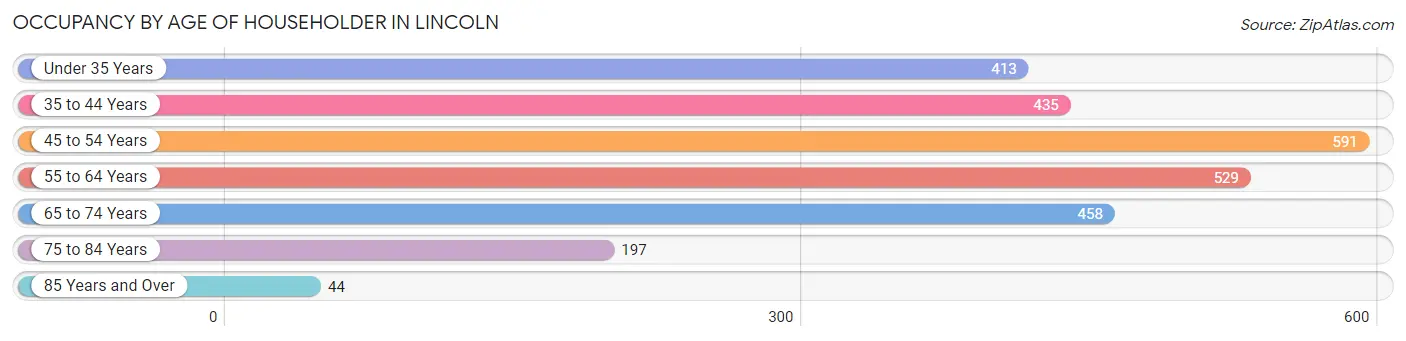
| Age Bracket | # Households | % Households |
| Under 35 Years | 413 | 15.5% |
| 35 to 44 Years | 435 | 16.3% |
| 45 to 54 Years | 591 | 22.2% |
| 55 to 64 Years | 529 | 19.8% |
| 65 to 74 Years | 458 | 17.2% |
| 75 to 84 Years | 197 | 7.4% |
| 85 Years and Over | 44 | 1.7% |
| Total | 2,667 | 100.0% |
Housing Finances in Lincoln
Median Income by Occupancy in Lincoln
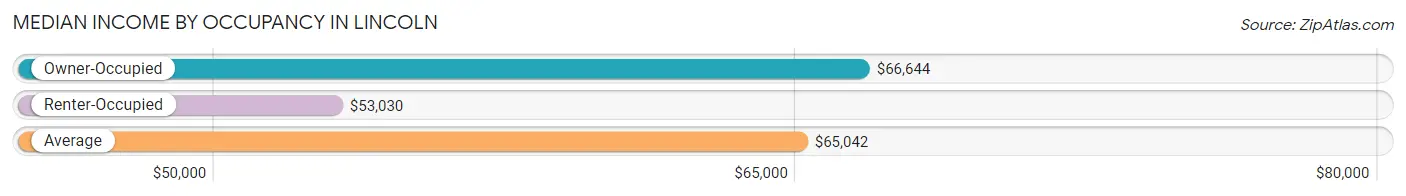
| Occupancy Type | # Households | Median Income |
| Owner-Occupied | 2,297 (86.1%) | $66,644 |
| Renter-Occupied | 370 (13.9%) | $53,030 |
| Average | 2,667 (100.0%) | $65,042 |
Occupancy by Householder Income Bracket in Lincoln
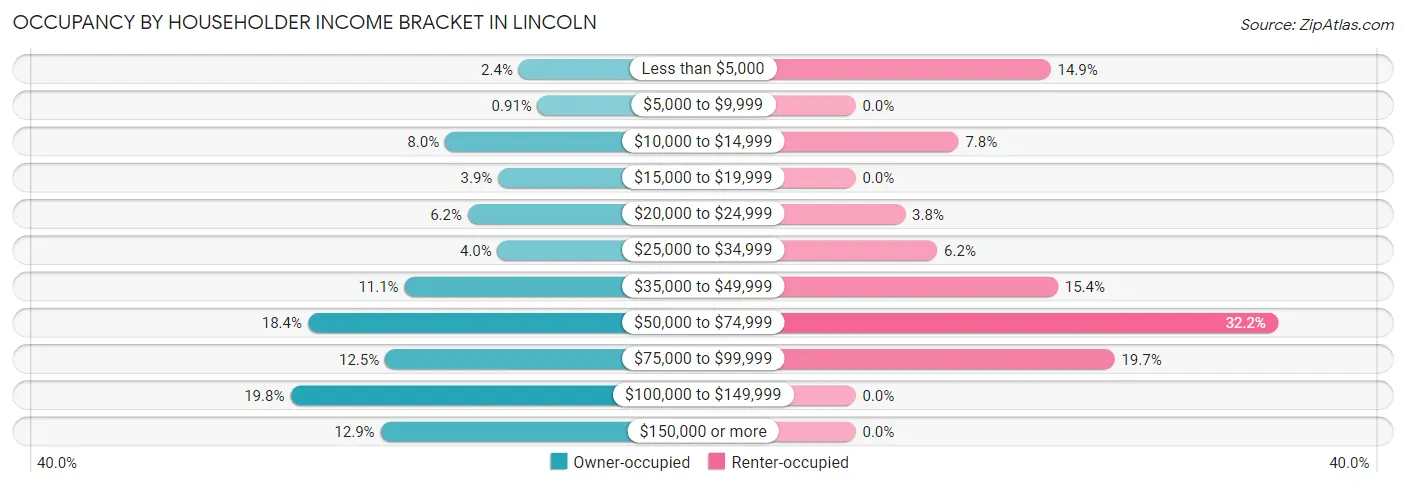
| Income Bracket | Owner-occupied | Renter-occupied |
| Less than $5,000 | 54 (2.4%) | 55 (14.9%) |
| $5,000 to $9,999 | 21 (0.9%) | 0 (0.0%) |
| $10,000 to $14,999 | 183 (8.0%) | 29 (7.8%) |
| $15,000 to $19,999 | 90 (3.9%) | 0 (0.0%) |
| $20,000 to $24,999 | 143 (6.2%) | 14 (3.8%) |
| $25,000 to $34,999 | 91 (4.0%) | 23 (6.2%) |
| $35,000 to $49,999 | 254 (11.1%) | 57 (15.4%) |
| $50,000 to $74,999 | 423 (18.4%) | 119 (32.2%) |
| $75,000 to $99,999 | 288 (12.5%) | 73 (19.7%) |
| $100,000 to $149,999 | 454 (19.8%) | 0 (0.0%) |
| $150,000 or more | 296 (12.9%) | 0 (0.0%) |
| Total | 2,297 (100.0%) | 370 (100.0%) |
Monthly Housing Cost Tiers in Lincoln
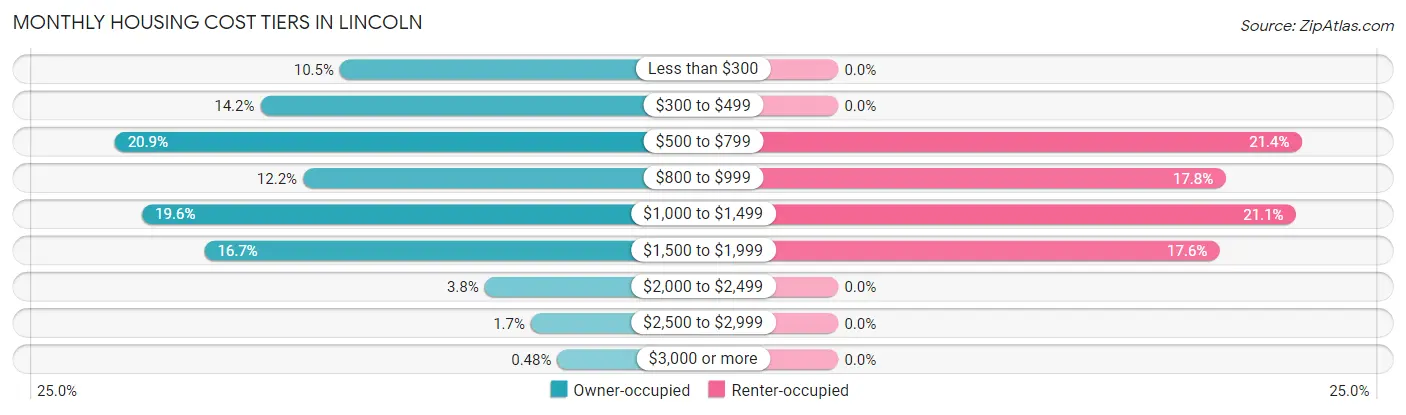
| Monthly Cost | Owner-occupied | Renter-occupied |
| Less than $300 | 241 (10.5%) | 0 (0.0%) |
| $300 to $499 | 325 (14.1%) | 0 (0.0%) |
| $500 to $799 | 479 (20.8%) | 79 (21.3%) |
| $800 to $999 | 280 (12.2%) | 66 (17.8%) |
| $1,000 to $1,499 | 450 (19.6%) | 78 (21.1%) |
| $1,500 to $1,999 | 384 (16.7%) | 65 (17.6%) |
| $2,000 to $2,499 | 88 (3.8%) | 0 (0.0%) |
| $2,500 to $2,999 | 39 (1.7%) | 0 (0.0%) |
| $3,000 or more | 11 (0.5%) | 0 (0.0%) |
| Total | 2,297 (100.0%) | 370 (100.0%) |
Physical Housing Characteristics in Lincoln
Housing Structures in Lincoln
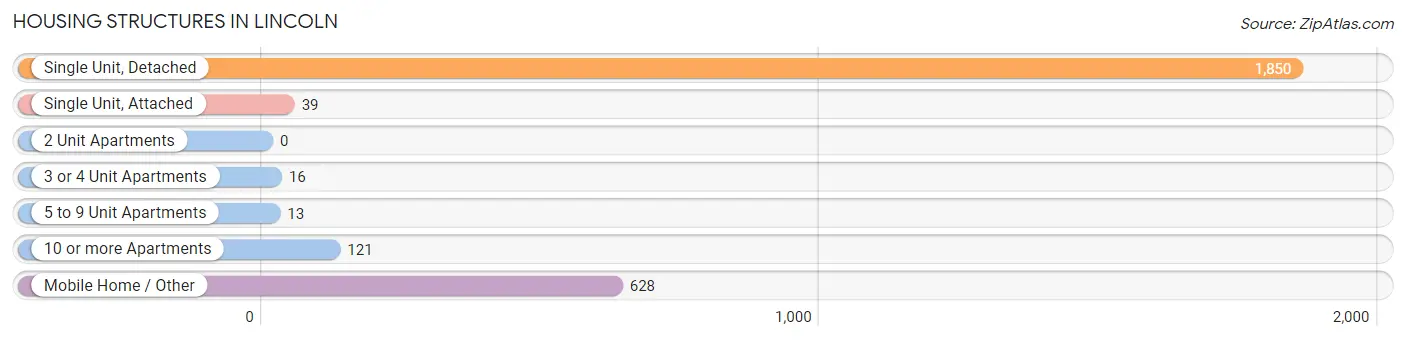
| Structure Type | # Housing Units | % Housing Units |
| Single Unit, Detached | 1,850 | 69.4% |
| Single Unit, Attached | 39 | 1.5% |
| 2 Unit Apartments | 0 | 0.0% |
| 3 or 4 Unit Apartments | 16 | 0.6% |
| 5 to 9 Unit Apartments | 13 | 0.5% |
| 10 or more Apartments | 121 | 4.5% |
| Mobile Home / Other | 628 | 23.5% |
| Total | 2,667 | 100.0% |
Housing Structures by Occupancy in Lincoln
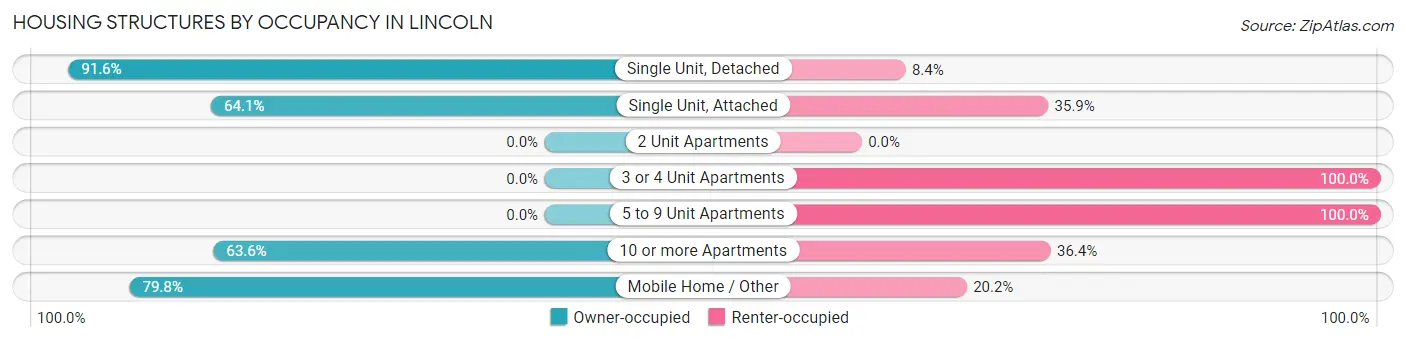
| Structure Type | Owner-occupied | Renter-occupied |
| Single Unit, Detached | 1,694 (91.6%) | 156 (8.4%) |
| Single Unit, Attached | 25 (64.1%) | 14 (35.9%) |
| 2 Unit Apartments | 0 (0.0%) | 0 (0.0%) |
| 3 or 4 Unit Apartments | 0 (0.0%) | 16 (100.0%) |
| 5 to 9 Unit Apartments | 0 (0.0%) | 13 (100.0%) |
| 10 or more Apartments | 77 (63.6%) | 44 (36.4%) |
| Mobile Home / Other | 501 (79.8%) | 127 (20.2%) |
| Total | 2,297 (86.1%) | 370 (13.9%) |
Housing Structures by Number of Rooms in Lincoln
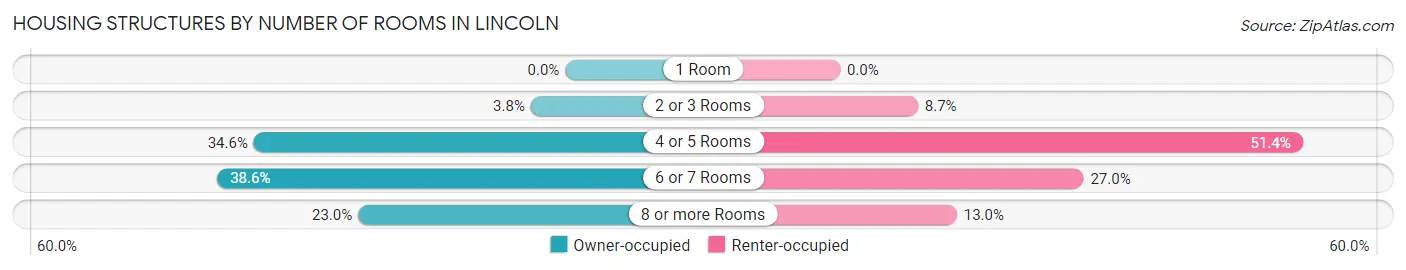
| Number of Rooms | Owner-occupied | Renter-occupied |
| 1 Room | 0 (0.0%) | 0 (0.0%) |
| 2 or 3 Rooms | 88 (3.8%) | 32 (8.6%) |
| 4 or 5 Rooms | 794 (34.6%) | 190 (51.3%) |
| 6 or 7 Rooms | 887 (38.6%) | 100 (27.0%) |
| 8 or more Rooms | 528 (23.0%) | 48 (13.0%) |
| Total | 2,297 (100.0%) | 370 (100.0%) |
Housing Structure by Heating Type in Lincoln
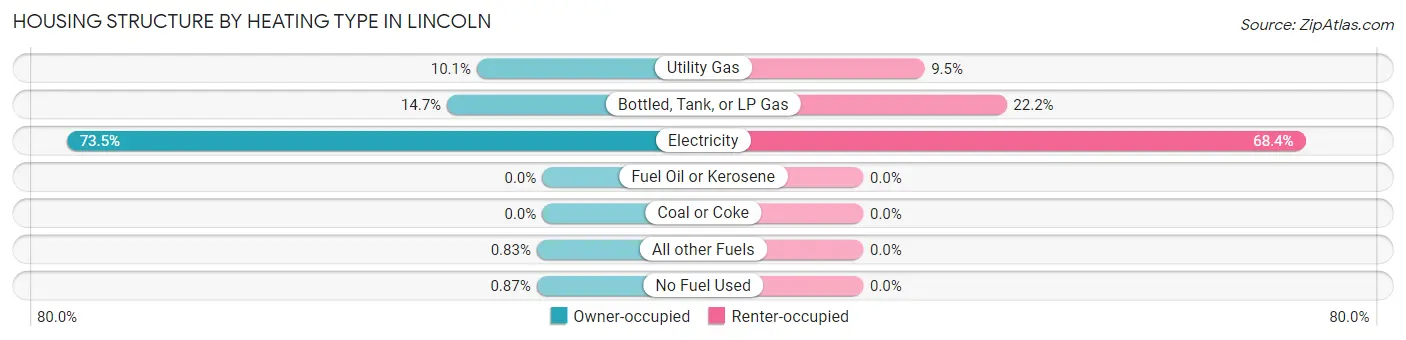
| Heating Type | Owner-occupied | Renter-occupied |
| Utility Gas | 232 (10.1%) | 35 (9.5%) |
| Bottled, Tank, or LP Gas | 338 (14.7%) | 82 (22.2%) |
| Electricity | 1,688 (73.5%) | 253 (68.4%) |
| Fuel Oil or Kerosene | 0 (0.0%) | 0 (0.0%) |
| Coal or Coke | 0 (0.0%) | 0 (0.0%) |
| All other Fuels | 19 (0.8%) | 0 (0.0%) |
| No Fuel Used | 20 (0.9%) | 0 (0.0%) |
| Total | 2,297 (100.0%) | 370 (100.0%) |
Household Vehicle Usage in Lincoln
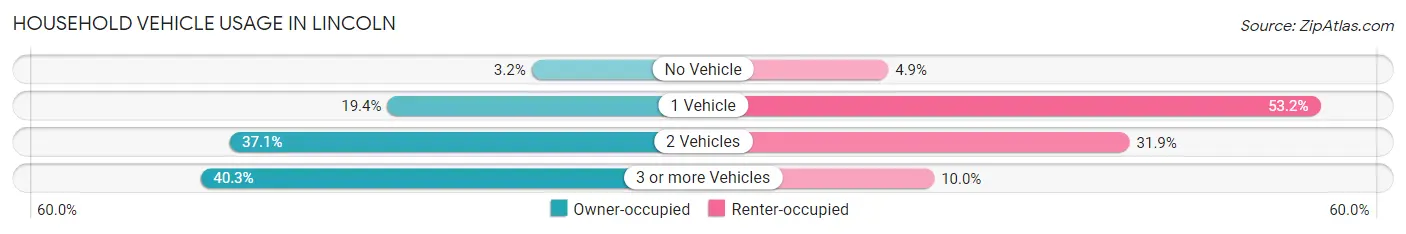
| Vehicles per Household | Owner-occupied | Renter-occupied |
| No Vehicle | 74 (3.2%) | 18 (4.9%) |
| 1 Vehicle | 445 (19.4%) | 197 (53.2%) |
| 2 Vehicles | 852 (37.1%) | 118 (31.9%) |
| 3 or more Vehicles | 926 (40.3%) | 37 (10.0%) |
| Total | 2,297 (100.0%) | 370 (100.0%) |
Real Estate & Mortgages in Lincoln
Real Estate and Mortgage Overview in Lincoln
| Characteristic | Without Mortgage | With Mortgage |
| Housing Units | 1,023 | 1,274 |
| Median Property Value | $125,800 | $195,400 |
| Median Household Income | $49,399 | $253 |
| Monthly Housing Costs | $394 | $11 |
| Real Estate Taxes | $507 | $143 |
Property Value by Mortgage Status in Lincoln
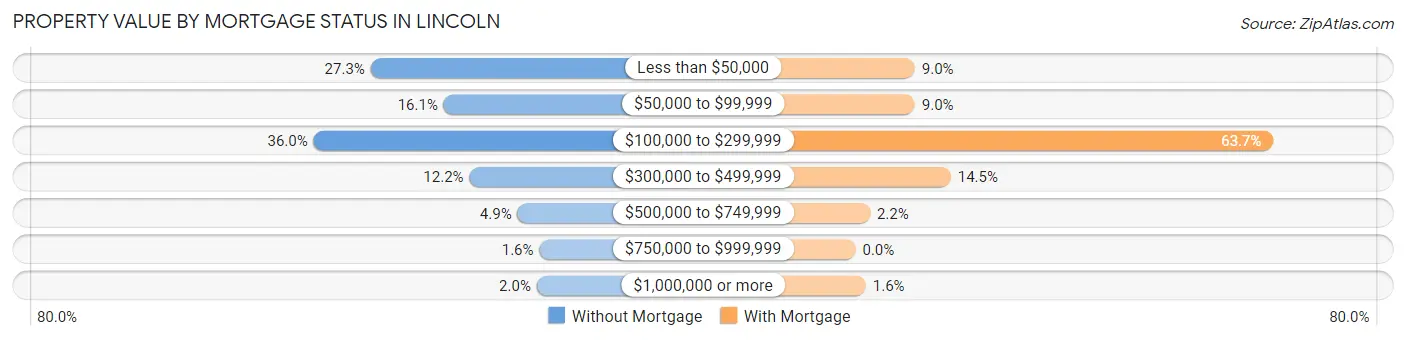
| Property Value | Without Mortgage | With Mortgage |
| Less than $50,000 | 279 (27.3%) | 115 (9.0%) |
| $50,000 to $99,999 | 165 (16.1%) | 115 (9.0%) |
| $100,000 to $299,999 | 368 (36.0%) | 811 (63.7%) |
| $300,000 to $499,999 | 125 (12.2%) | 185 (14.5%) |
| $500,000 to $749,999 | 50 (4.9%) | 28 (2.2%) |
| $750,000 to $999,999 | 16 (1.6%) | 0 (0.0%) |
| $1,000,000 or more | 20 (2.0%) | 20 (1.6%) |
| Total | 1,023 (100.0%) | 1,274 (100.0%) |
Household Income by Mortgage Status in Lincoln
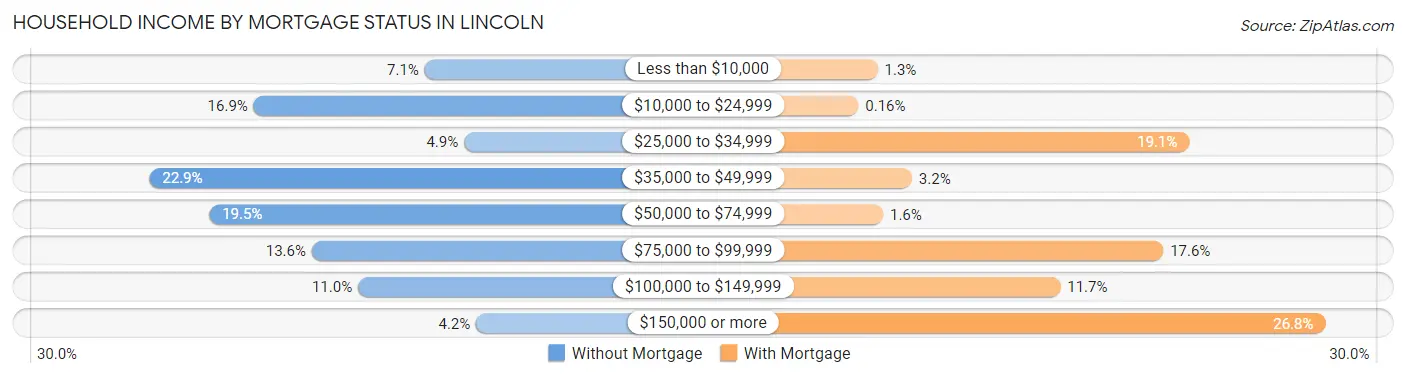
| Household Income | Without Mortgage | With Mortgage |
| Less than $10,000 | 73 (7.1%) | 16 (1.3%) |
| $10,000 to $24,999 | 173 (16.9%) | 2 (0.2%) |
| $25,000 to $34,999 | 50 (4.9%) | 243 (19.1%) |
| $35,000 to $49,999 | 234 (22.9%) | 41 (3.2%) |
| $50,000 to $74,999 | 199 (19.5%) | 20 (1.6%) |
| $75,000 to $99,999 | 139 (13.6%) | 224 (17.6%) |
| $100,000 to $149,999 | 112 (11.0%) | 149 (11.7%) |
| $150,000 or more | 43 (4.2%) | 342 (26.8%) |
| Total | 1,023 (100.0%) | 1,274 (100.0%) |
Property Value to Household Income Ratio in Lincoln
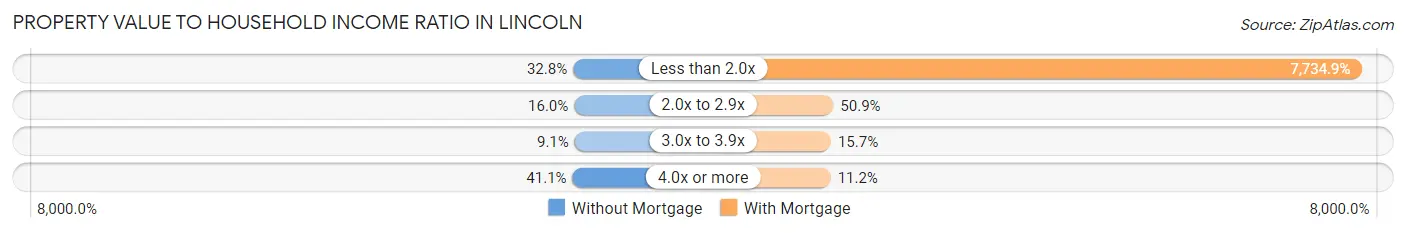
| Value-to-Income Ratio | Without Mortgage | With Mortgage |
| Less than 2.0x | 335 (32.8%) | 98,542 (7,734.9%) |
| 2.0x to 2.9x | 164 (16.0%) | 648 (50.9%) |
| 3.0x to 3.9x | 93 (9.1%) | 200 (15.7%) |
| 4.0x or more | 420 (41.1%) | 142 (11.2%) |
| Total | 1,023 (100.0%) | 1,274 (100.0%) |
Real Estate Taxes by Mortgage Status in Lincoln
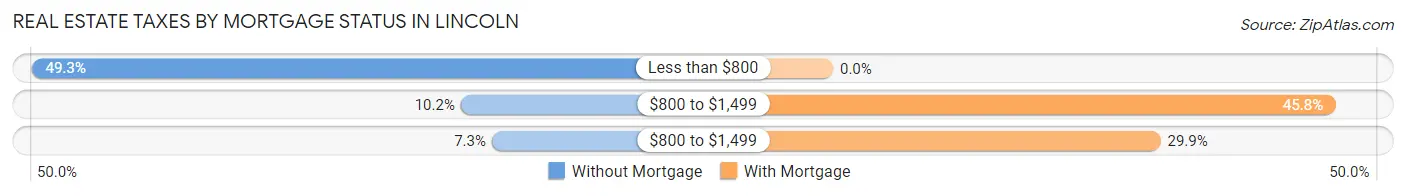
| Property Taxes | Without Mortgage | With Mortgage |
| Less than $800 | 504 (49.3%) | 0 (0.0%) |
| $800 to $1,499 | 104 (10.2%) | 584 (45.8%) |
| $800 to $1,499 | 75 (7.3%) | 381 (29.9%) |
| Total | 1,023 (100.0%) | 1,274 (100.0%) |
Health & Disability in Lincoln
Health Insurance Coverage by Age in Lincoln
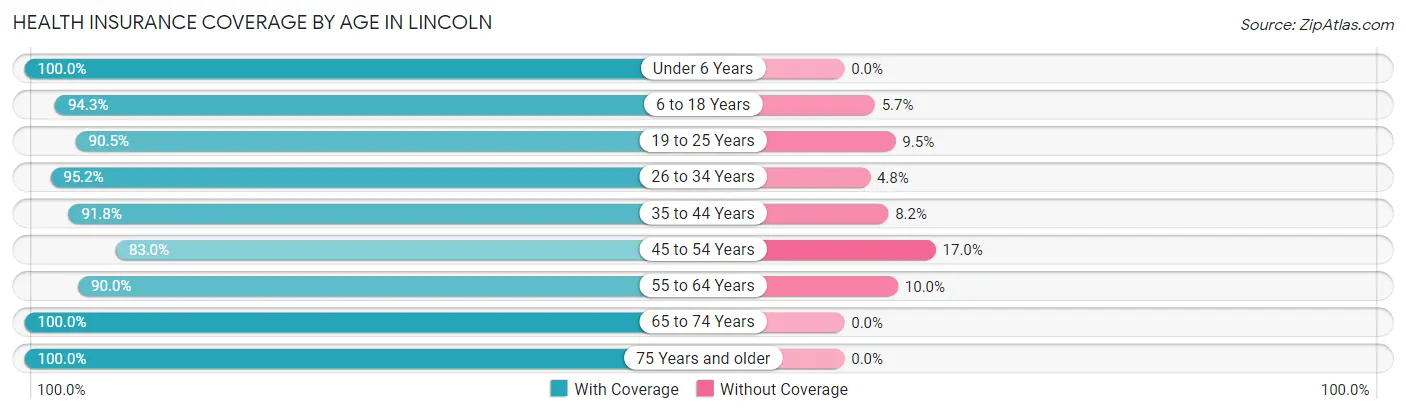
| Age Bracket | With Coverage | Without Coverage |
| Under 6 Years | 426 (100.0%) | 0 (0.0%) |
| 6 to 18 Years | 1,297 (94.3%) | 78 (5.7%) |
| 19 to 25 Years | 465 (90.5%) | 49 (9.5%) |
| 26 to 34 Years | 736 (95.2%) | 37 (4.8%) |
| 35 to 44 Years | 740 (91.8%) | 66 (8.2%) |
| 45 to 54 Years | 921 (83.0%) | 189 (17.0%) |
| 55 to 64 Years | 784 (90.0%) | 87 (10.0%) |
| 65 to 74 Years | 731 (100.0%) | 0 (0.0%) |
| 75 Years and older | 362 (100.0%) | 0 (0.0%) |
| Total | 6,462 (92.7%) | 506 (7.3%) |
Health Insurance Coverage by Citizenship Status in Lincoln
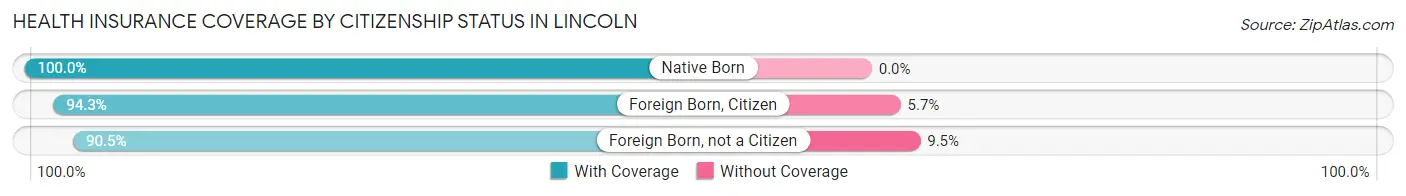
| Citizenship Status | With Coverage | Without Coverage |
| Native Born | 426 (100.0%) | 0 (0.0%) |
| Foreign Born, Citizen | 1,297 (94.3%) | 78 (5.7%) |
| Foreign Born, not a Citizen | 465 (90.5%) | 49 (9.5%) |
Health Insurance Coverage by Household Income in Lincoln
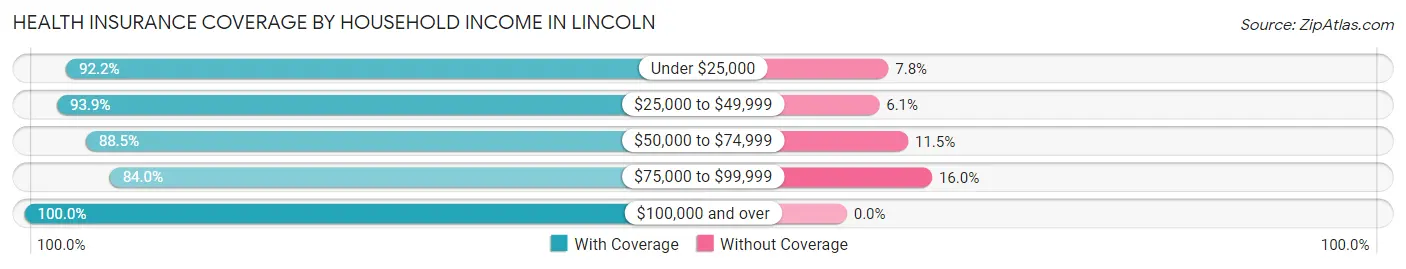
| Household Income | With Coverage | Without Coverage |
| Under $25,000 | 1,148 (92.2%) | 97 (7.8%) |
| $25,000 to $49,999 | 1,171 (93.9%) | 76 (6.1%) |
| $50,000 to $74,999 | 1,142 (88.5%) | 148 (11.5%) |
| $75,000 to $99,999 | 811 (84.0%) | 154 (16.0%) |
| $100,000 and over | 2,177 (100.0%) | 0 (0.0%) |
Public vs Private Health Insurance Coverage by Age in Lincoln
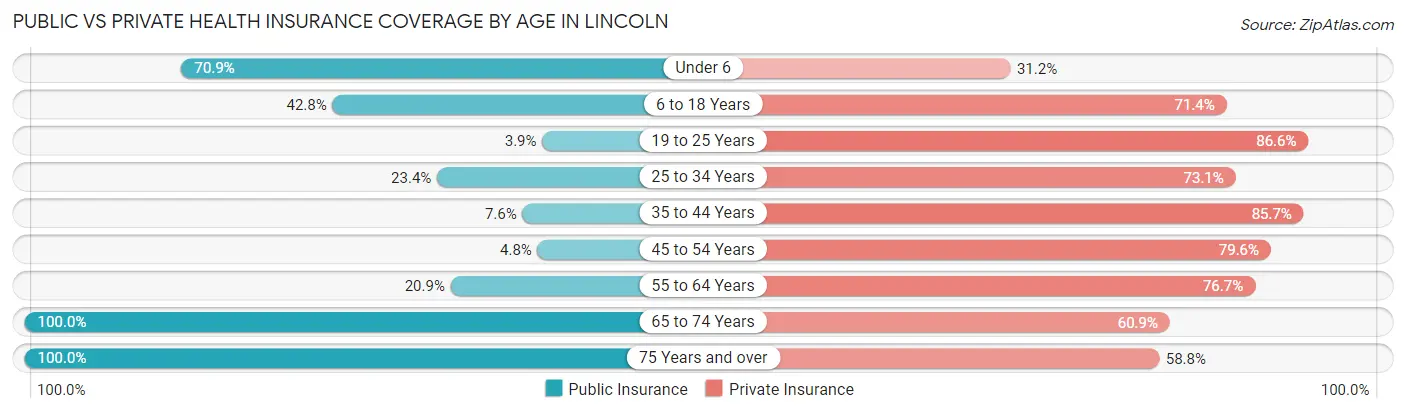
| Age Bracket | Public Insurance | Private Insurance |
| Under 6 | 302 (70.9%) | 133 (31.2%) |
| 6 to 18 Years | 589 (42.8%) | 982 (71.4%) |
| 19 to 25 Years | 20 (3.9%) | 445 (86.6%) |
| 25 to 34 Years | 181 (23.4%) | 565 (73.1%) |
| 35 to 44 Years | 61 (7.6%) | 691 (85.7%) |
| 45 to 54 Years | 53 (4.8%) | 884 (79.6%) |
| 55 to 64 Years | 182 (20.9%) | 668 (76.7%) |
| 65 to 74 Years | 731 (100.0%) | 445 (60.9%) |
| 75 Years and over | 362 (100.0%) | 213 (58.8%) |
| Total | 2,481 (35.6%) | 5,026 (72.1%) |
Disability Status by Sex by Age in Lincoln
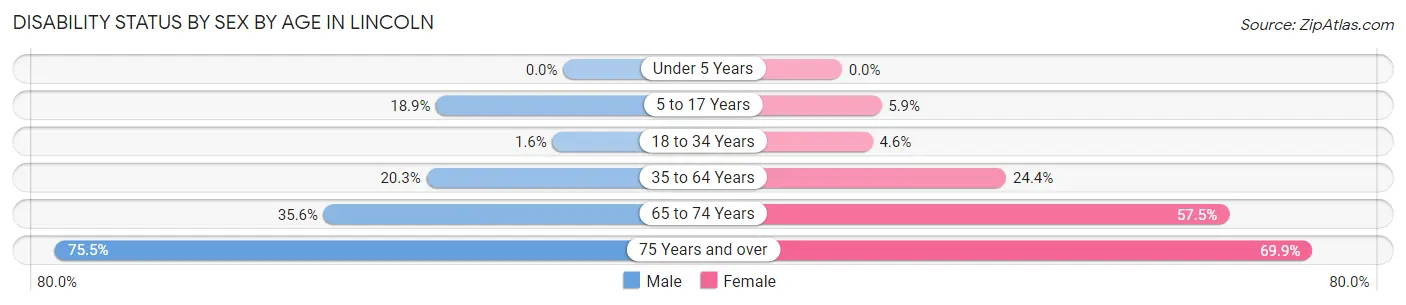
| Age Bracket | Male | Female |
| Under 5 Years | 0 (0.0%) | 0 (0.0%) |
| 5 to 17 Years | 143 (18.9%) | 35 (5.9%) |
| 18 to 34 Years | 11 (1.6%) | 30 (4.5%) |
| 35 to 64 Years | 269 (20.3%) | 357 (24.4%) |
| 65 to 74 Years | 101 (35.6%) | 257 (57.5%) |
| 75 Years and over | 123 (75.5%) | 139 (69.9%) |
Disability Class by Sex by Age in Lincoln
Disability Class: Hearing Difficulty
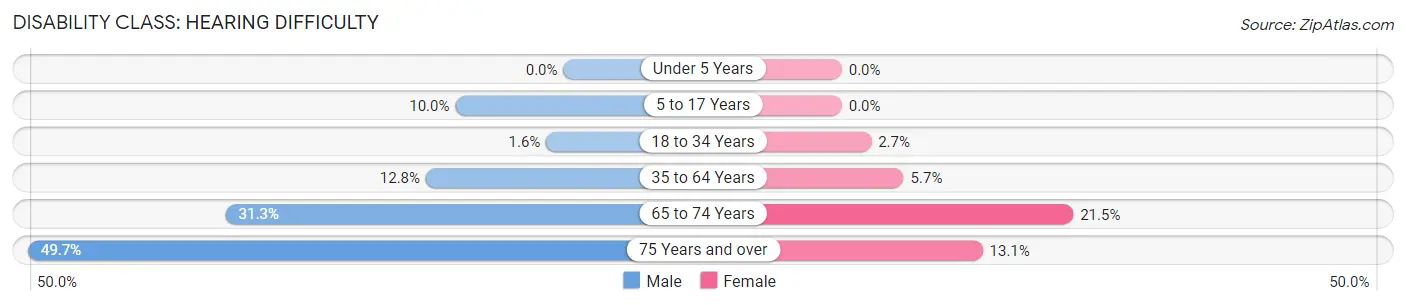
| Age Bracket | Male | Female |
| Under 5 Years | 0 (0.0%) | 0 (0.0%) |
| 5 to 17 Years | 76 (10.0%) | 0 (0.0%) |
| 18 to 34 Years | 11 (1.6%) | 18 (2.7%) |
| 35 to 64 Years | 169 (12.8%) | 84 (5.7%) |
| 65 to 74 Years | 89 (31.3%) | 96 (21.5%) |
| 75 Years and over | 81 (49.7%) | 26 (13.1%) |
Disability Class: Vision Difficulty
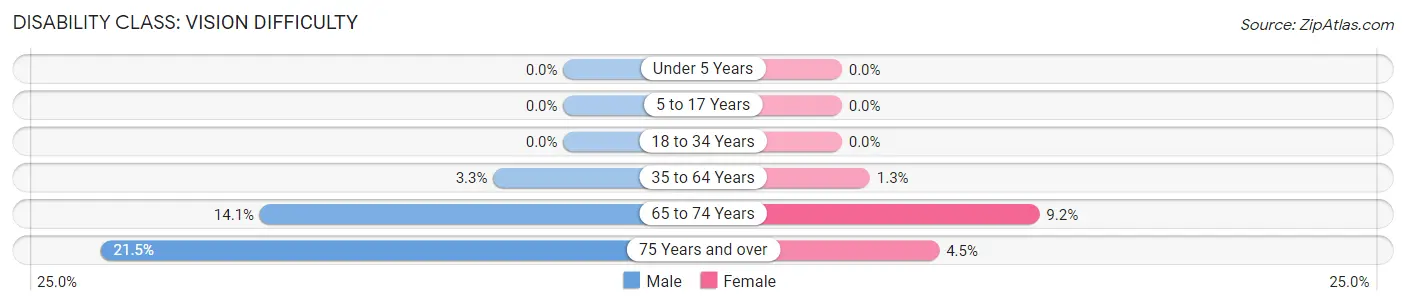
| Age Bracket | Male | Female |
| Under 5 Years | 0 (0.0%) | 0 (0.0%) |
| 5 to 17 Years | 0 (0.0%) | 0 (0.0%) |
| 18 to 34 Years | 0 (0.0%) | 0 (0.0%) |
| 35 to 64 Years | 43 (3.3%) | 19 (1.3%) |
| 65 to 74 Years | 40 (14.1%) | 41 (9.2%) |
| 75 Years and over | 35 (21.5%) | 9 (4.5%) |
Disability Class: Cognitive Difficulty
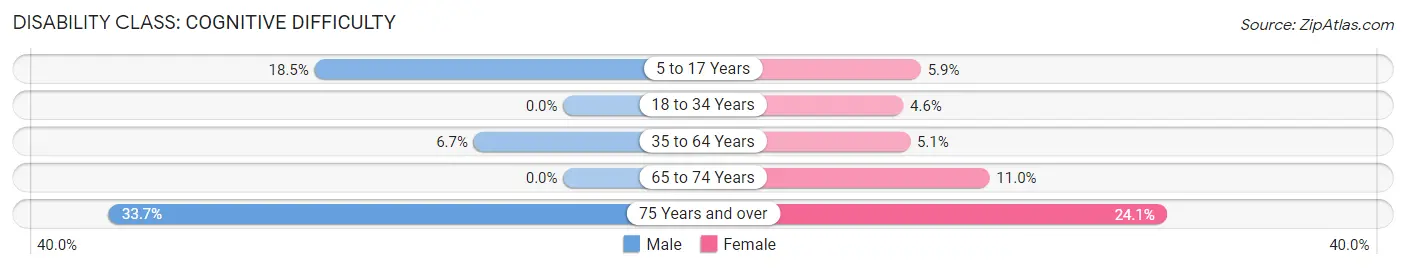
| Age Bracket | Male | Female |
| 5 to 17 Years | 140 (18.5%) | 35 (5.9%) |
| 18 to 34 Years | 0 (0.0%) | 30 (4.5%) |
| 35 to 64 Years | 88 (6.7%) | 74 (5.1%) |
| 65 to 74 Years | 0 (0.0%) | 49 (11.0%) |
| 75 Years and over | 55 (33.7%) | 48 (24.1%) |
Disability Class: Ambulatory Difficulty
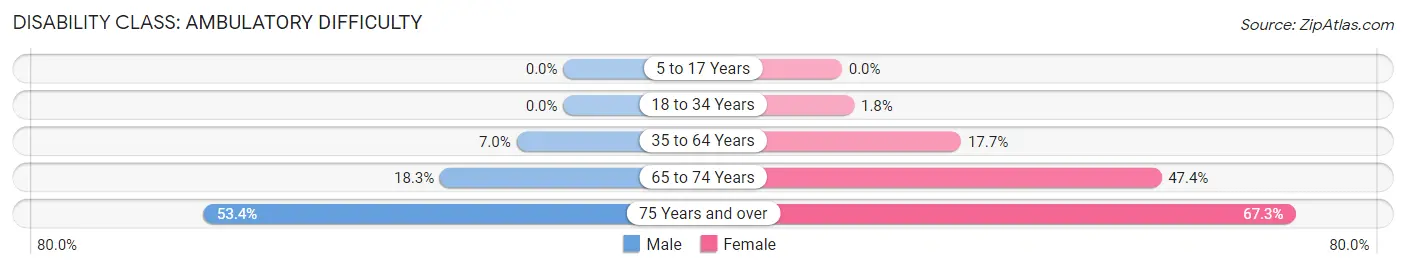
| Age Bracket | Male | Female |
| 5 to 17 Years | 0 (0.0%) | 0 (0.0%) |
| 18 to 34 Years | 0 (0.0%) | 12 (1.8%) |
| 35 to 64 Years | 92 (7.0%) | 259 (17.7%) |
| 65 to 74 Years | 52 (18.3%) | 212 (47.4%) |
| 75 Years and over | 87 (53.4%) | 134 (67.3%) |
Disability Class: Self-Care Difficulty
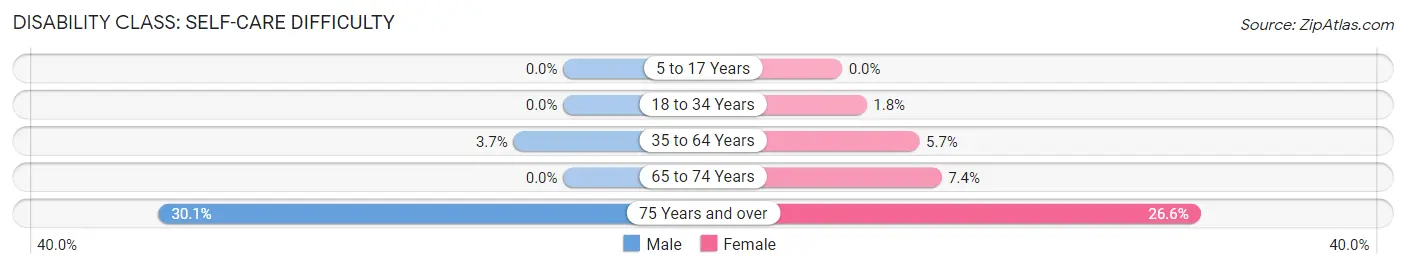
| Age Bracket | Male | Female |
| 5 to 17 Years | 0 (0.0%) | 0 (0.0%) |
| 18 to 34 Years | 0 (0.0%) | 12 (1.8%) |
| 35 to 64 Years | 49 (3.7%) | 84 (5.7%) |
| 65 to 74 Years | 0 (0.0%) | 33 (7.4%) |
| 75 Years and over | 49 (30.1%) | 53 (26.6%) |
Technology Access in Lincoln
Computing Device Access in Lincoln
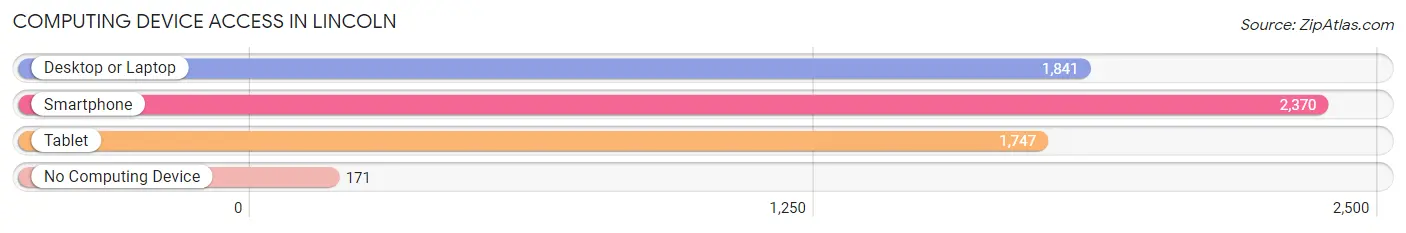
| Device Type | # Households | % Households |
| Desktop or Laptop | 1,841 | 69.0% |
| Smartphone | 2,370 | 88.9% |
| Tablet | 1,747 | 65.5% |
| No Computing Device | 171 | 6.4% |
| Total | 2,667 | 100.0% |
Internet Access in Lincoln
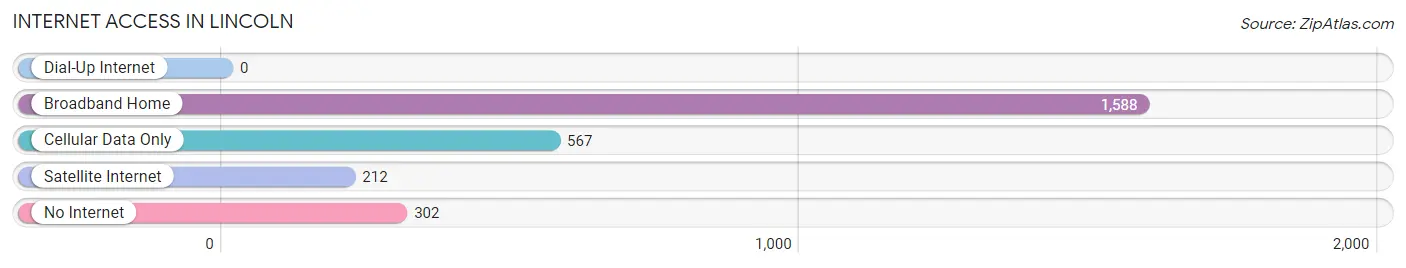
| Internet Type | # Households | % Households |
| Dial-Up Internet | 0 | 0.0% |
| Broadband Home | 1,588 | 59.5% |
| Cellular Data Only | 567 | 21.3% |
| Satellite Internet | 212 | 8.0% |
| No Internet | 302 | 11.3% |
| Total | 2,667 | 100.0% |
Lincoln Summary
Lincoln, Alabama is a small town located in Talladega County in the state of Alabama. It is situated in the foothills of the Appalachian Mountains and is part of the Birmingham-Hoover Metropolitan Statistical Area. The town has a population of approximately 2,000 people and is known for its rural charm and friendly atmosphere.
History
Lincoln was founded in 1871 by a group of settlers from Georgia. The town was named after Abraham Lincoln, the 16th President of the United States. The town was originally a farming community and the main crops grown were cotton, corn, and wheat. The town was also home to a number of small businesses, including a sawmill, a gristmill, and a cotton gin.
In the early 1900s, the town began to grow and develop. The first school was built in 1906 and the first bank opened in 1907. The town also had a post office, a hotel, and a number of stores.
In the 1920s, the town experienced a period of growth and prosperity. The population increased from 1,000 to 2,000 and the town was home to a number of businesses, including a movie theater, a drug store, and a number of restaurants.
In the 1950s, the town began to decline as the local economy shifted away from agriculture and towards manufacturing. The population decreased and many of the businesses closed.
In the late 1970s, the town began to experience a resurgence. The population increased and new businesses opened. The town also began to attract tourists, who were drawn to the town’s rural charm and friendly atmosphere.
Geography
Lincoln is located in the foothills of the Appalachian Mountains in the northeastern part of Talladega County. The town is situated at the intersection of US Highway 78 and Alabama State Route 77. The town is surrounded by rolling hills and forests and is located approximately 30 miles east of Birmingham.
The climate in Lincoln is mild and humid. The average temperature in the summer is around 80 degrees Fahrenheit and the average temperature in the winter is around 50 degrees Fahrenheit. The town receives an average of 48 inches of rain per year.
Economy
The economy of Lincoln is largely based on tourism. The town is home to a number of attractions, including the Talladega National Forest, the Talladega Superspeedway, and the Talladega Scenic Byway. The town is also home to a number of small businesses, including restaurants, shops, and galleries.
The town is also home to a number of manufacturing companies, including a furniture factory, a plastics factory, and a metal fabrication plant. The town is also home to a number of agricultural businesses, including a dairy farm and a number of vegetable farms.
Demographics
As of the 2010 census, the population of Lincoln was 2,037. The racial makeup of the town was 79.3% White, 17.7% African American, 0.3% Native American, 0.2% Asian, 0.1% Pacific Islander, and 2.4% from other races. The median household income was $31,250 and the median family income was $37,500.
The town is home to a number of churches, including Baptist, Methodist, and Presbyterian. The town is also home to a number of schools, including Lincoln Elementary School, Lincoln Middle School, and Lincoln High School. The town is served by the Talladega County School System.
Common Questions
What is Per Capita Income in Lincoln?
Per Capita income in Lincoln is $33,550.
What is the Median Family Income in Lincoln?
Median Family Income in Lincoln is $80,313.
What is the Median Household income in Lincoln?
Median Household Income in Lincoln is $65,042.
What is Income or Wage Gap in Lincoln?
Income or Wage Gap in Lincoln is 48.3%.
Women in Lincoln earn 51.7 cents for every dollar earned by a man.
What is Inequality or Gini Index in Lincoln?
Inequality or Gini Index in Lincoln is 0.47.
What is the Total Population of Lincoln?
Total Population of Lincoln is 6,968.
What is the Total Male Population of Lincoln?
Total Male Population of Lincoln is 3,342.
What is the Total Female Population of Lincoln?
Total Female Population of Lincoln is 3,626.
What is the Ratio of Males per 100 Females in Lincoln?
There are 92.17 Males per 100 Females in Lincoln.
What is the Ratio of Females per 100 Males in Lincoln?
There are 108.50 Females per 100 Males in Lincoln.
What is the Median Population Age in Lincoln?
Median Population Age in Lincoln is 40.9 Years.
What is the Average Family Size in Lincoln
Average Family Size in Lincoln is 3.1 People.
What is the Average Household Size in Lincoln
Average Household Size in Lincoln is 2.6 People.
How Large is the Labor Force in Lincoln?
There are 3,514 People in the Labor Forcein in Lincoln.
What is the Percentage of People in the Labor Force in Lincoln?
64.6% of People are in the Labor Force in Lincoln.
What is the Unemployment Rate in Lincoln?
Unemployment Rate in Lincoln is 7.4%.