Leeds, AL Map & Demographics
Leeds Map
Leeds Overview
$34,822
PER CAPITA INCOME
$80,098
AVG FAMILY INCOME
$67,159
AVG HOUSEHOLD INCOME
9.7%
WAGE / INCOME GAP [ % ]
90.3¢/ $1
WAGE / INCOME GAP [ $ ]
$6,974
FAMILY INCOME DEFICIT
0.39
INEQUALITY / GINI INDEX
12,292
TOTAL POPULATION
6,486
MALE POPULATION
5,806
FEMALE POPULATION
111.71
MALES / 100 FEMALES
89.52
FEMALES / 100 MALES
40.9
MEDIAN AGE
3.1
AVG FAMILY SIZE
2.6
AVG HOUSEHOLD SIZE
6,332
LABOR FORCE [ PEOPLE ]
65.0%
PERCENT IN LABOR FORCE
1.4%
UNEMPLOYMENT RATE
Leeds Zip Codes
Leeds Area Codes
Income in Leeds
Income Overview in Leeds
Per Capita Income in Leeds is $34,822, while median incomes of families and households are $80,098 and $67,159 respectively.
| Characteristic | Number | Measure |
| Per Capita Income | 12,292 | $34,822 |
| Median Family Income | 3,193 | $80,098 |
| Mean Family Income | 3,193 | $99,564 |
| Median Household Income | 4,703 | $67,159 |
| Mean Household Income | 4,703 | $86,798 |
| Income Deficit | 3,193 | $6,974 |
| Wage / Income Gap (%) | 12,292 | 9.69% |
| Wage / Income Gap ($) | 12,292 | 90.31¢ per $1 |
| Gini / Inequality Index | 12,292 | 0.39 |
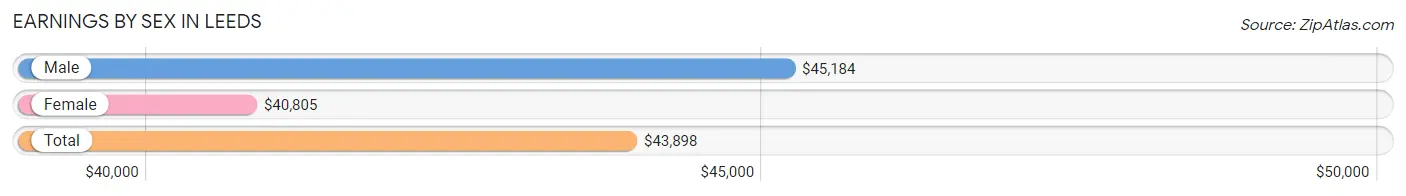
Earnings by Sex in Leeds
Average Earnings in Leeds are $43,898, $45,184 for men and $40,805 for women, a difference of 9.7%.
| Sex | Number | Average Earnings |
| Male | 3,691 (56.1%) | $45,184 |
| Female | 2,888 (43.9%) | $40,805 |
| Total | 6,579 (100.0%) | $43,898 |
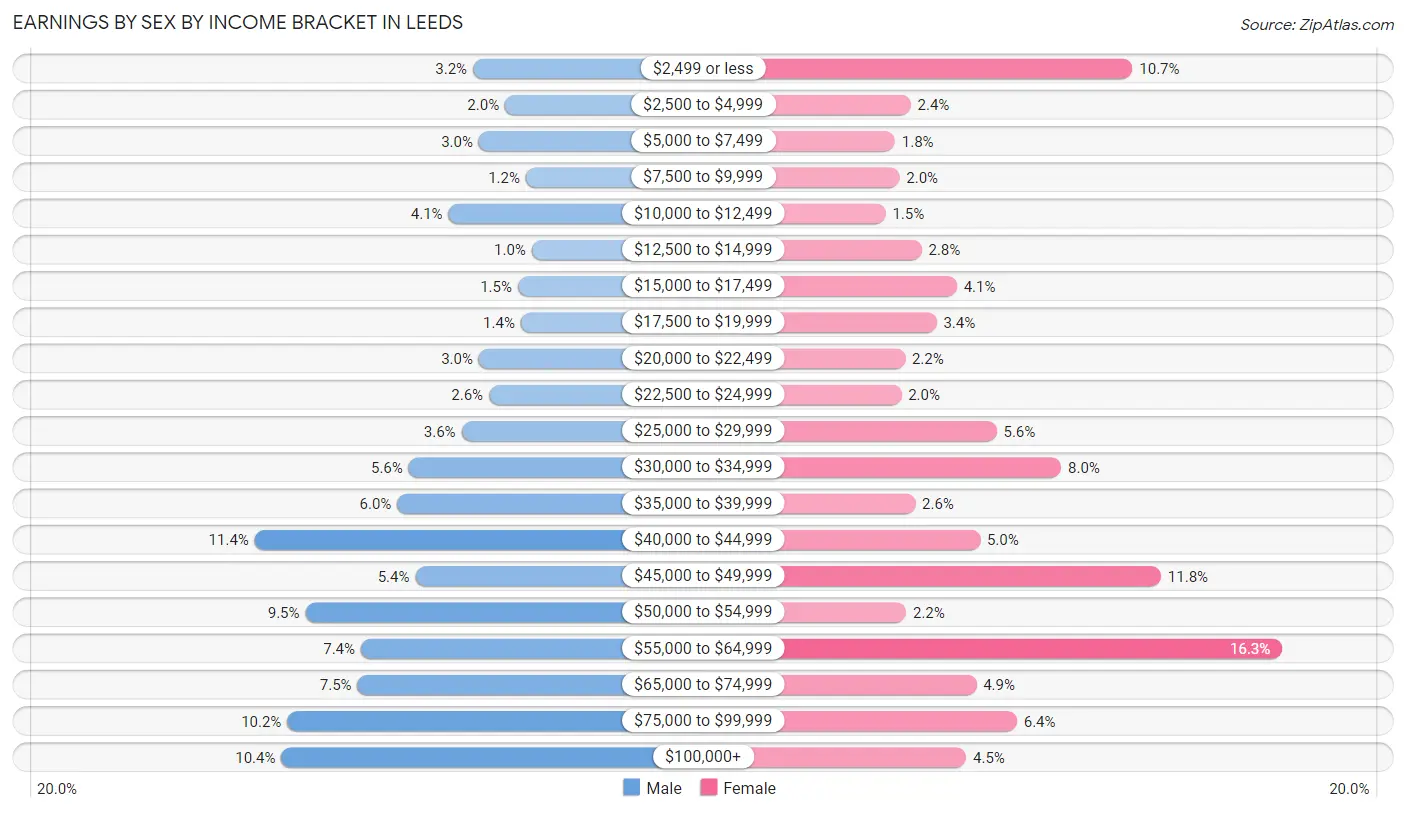
Earnings by Sex by Income Bracket in Leeds
The most common earnings brackets in Leeds are $40,000 to $44,999 for men (420 | 11.4%) and $55,000 to $64,999 for women (471 | 16.3%).
| Income | Male | Female |
| $2,499 or less | 118 (3.2%) | 309 (10.7%) |
| $2,500 to $4,999 | 74 (2.0%) | 69 (2.4%) |
| $5,000 to $7,499 | 110 (3.0%) | 52 (1.8%) |
| $7,500 to $9,999 | 45 (1.2%) | 57 (2.0%) |
| $10,000 to $12,499 | 152 (4.1%) | 42 (1.5%) |
| $12,500 to $14,999 | 37 (1.0%) | 81 (2.8%) |
| $15,000 to $17,499 | 56 (1.5%) | 119 (4.1%) |
| $17,500 to $19,999 | 52 (1.4%) | 97 (3.4%) |
| $20,000 to $22,499 | 110 (3.0%) | 63 (2.2%) |
| $22,500 to $24,999 | 96 (2.6%) | 59 (2.0%) |
| $25,000 to $29,999 | 134 (3.6%) | 162 (5.6%) |
| $30,000 to $34,999 | 207 (5.6%) | 232 (8.0%) |
| $35,000 to $39,999 | 223 (6.0%) | 74 (2.6%) |
| $40,000 to $44,999 | 420 (11.4%) | 144 (5.0%) |
| $45,000 to $49,999 | 198 (5.4%) | 340 (11.8%) |
| $50,000 to $54,999 | 350 (9.5%) | 64 (2.2%) |
| $55,000 to $64,999 | 273 (7.4%) | 471 (16.3%) |
| $65,000 to $74,999 | 278 (7.5%) | 140 (4.9%) |
| $75,000 to $99,999 | 375 (10.2%) | 184 (6.4%) |
| $100,000+ | 383 (10.4%) | 129 (4.5%) |
| Total | 3,691 (100.0%) | 2,888 (100.0%) |
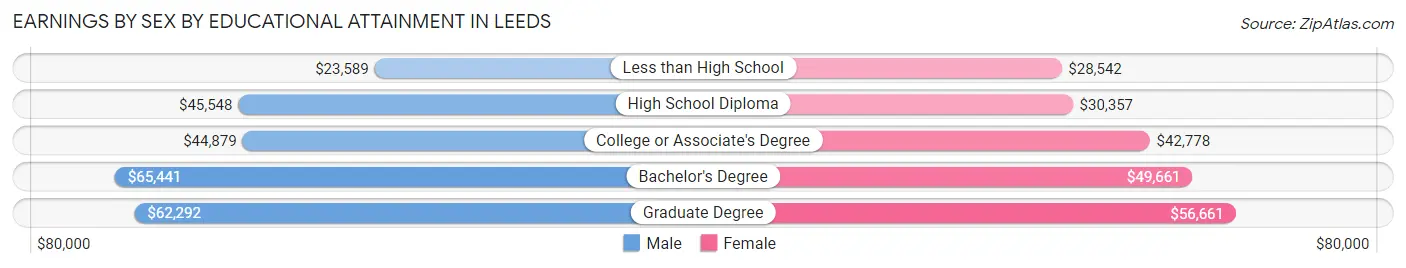
Earnings by Sex by Educational Attainment in Leeds
Average earnings in Leeds are $46,482 for men and $45,496 for women, a difference of 2.1%. Men with an educational attainment of bachelor's degree enjoy the highest average annual earnings of $65,441, while those with less than high school education earn the least with $23,589. Women with an educational attainment of graduate degree earn the most with the average annual earnings of $56,661, while those with less than high school education have the smallest earnings of $28,542.
| Educational Attainment | Male Income | Female Income |
| Less than High School | $23,589 | $28,542 |
| High School Diploma | $45,548 | $30,357 |
| College or Associate's Degree | $44,879 | $42,778 |
| Bachelor's Degree | $65,441 | $49,661 |
| Graduate Degree | $62,292 | $56,661 |
| Total | $46,482 | $45,496 |
Family Income in Leeds
Family Income Brackets in Leeds
According to the Leeds family income data, there are 686 families falling into the $100,000 to $149,999 income range, which is the most common income bracket and makes up 21.5% of all families. Conversely, the $10,000 to $14,999 income bracket is the least frequent group with only 26 families (0.8%) belonging to this category.
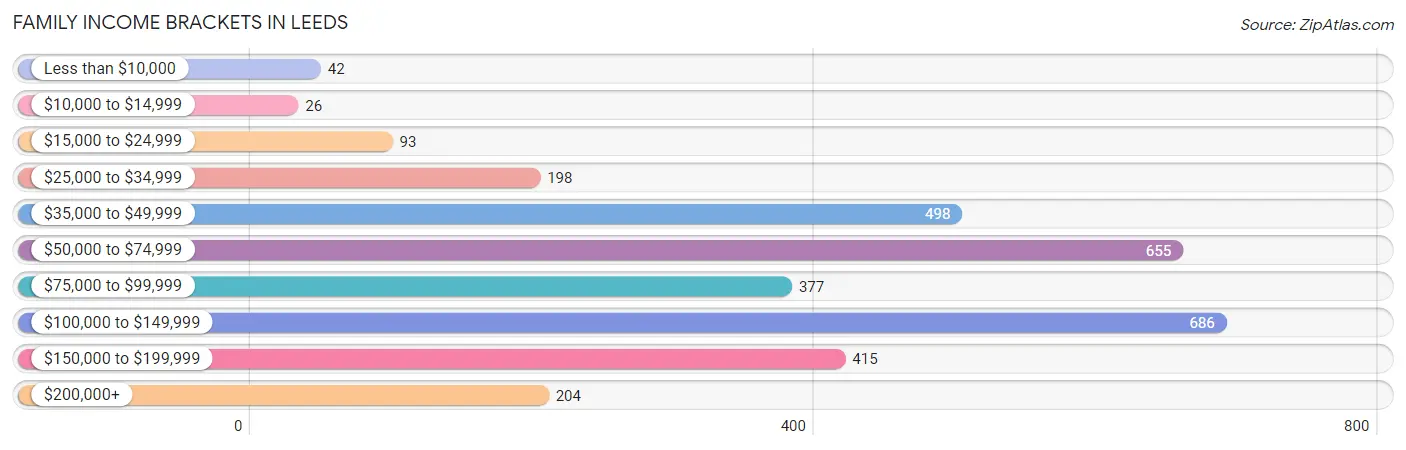
| Income Bracket | # Families | % Families |
| Less than $10,000 | 42 | 1.3% |
| $10,000 to $14,999 | 26 | 0.8% |
| $15,000 to $24,999 | 93 | 2.9% |
| $25,000 to $34,999 | 198 | 6.2% |
| $35,000 to $49,999 | 498 | 15.6% |
| $50,000 to $74,999 | 655 | 20.5% |
| $75,000 to $99,999 | 377 | 11.8% |
| $100,000 to $149,999 | 686 | 21.5% |
| $150,000 to $199,999 | 415 | 13.0% |
| $200,000+ | 204 | 6.4% |
Family Income by Famaliy Size in Leeds
5-person families (181 | 5.7%) account for the highest median family income in Leeds with $120,250 per family, while 2-person families (1,707 | 53.5%) have the highest median income of $36,068 per family member.
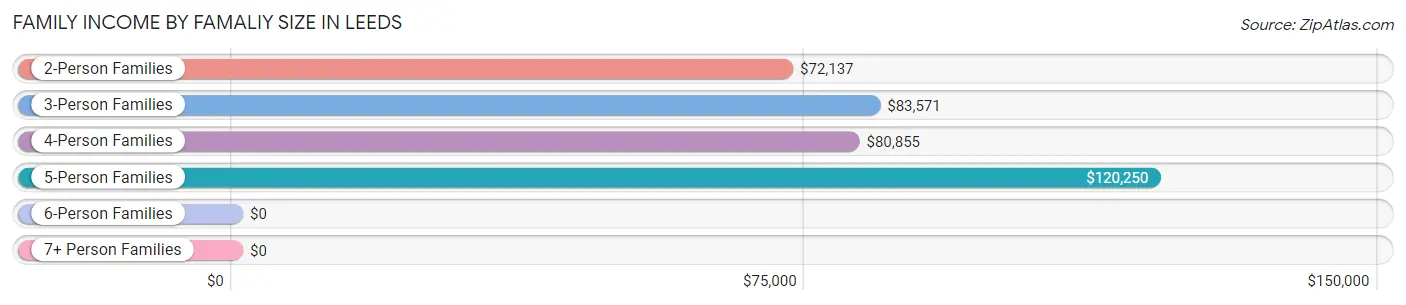
| Income Bracket | # Families | Median Income |
| 2-Person Families | 1,707 (53.5%) | $72,137 |
| 3-Person Families | 528 (16.5%) | $83,571 |
| 4-Person Families | 673 (21.1%) | $80,855 |
| 5-Person Families | 181 (5.7%) | $120,250 |
| 6-Person Families | 88 (2.8%) | $0 |
| 7+ Person Families | 16 (0.5%) | $0 |
| Total | 3,193 (100.0%) | $80,098 |
Family Income by Number of Earners in Leeds
The median family income in Leeds is $80,098, with families comprising 2 earners (1,387) having the highest median family income of $103,984, while families with no earners (399) have the lowest median family income of $46,523, accounting for 43.4% and 12.5% of families, respectively.
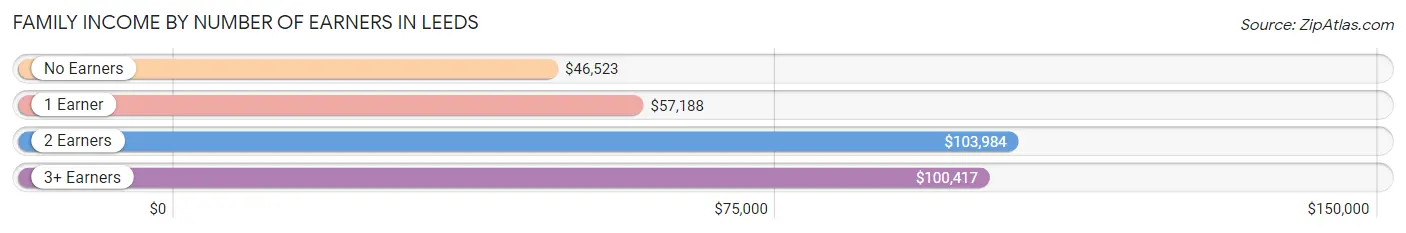
| Number of Earners | # Families | Median Income |
| No Earners | 399 (12.5%) | $46,523 |
| 1 Earner | 1,174 (36.8%) | $57,188 |
| 2 Earners | 1,387 (43.4%) | $103,984 |
| 3+ Earners | 233 (7.3%) | $100,417 |
| Total | 3,193 (100.0%) | $80,098 |
Household Income in Leeds
Household Income Brackets in Leeds
With 1,002 households falling in the category, the $50,000 to $74,999 income range is the most frequent in Leeds, accounting for 21.3% of all households. In contrast, only 113 households (2.4%) fall into the $10,000 to $14,999 income bracket, making it the least populous group.
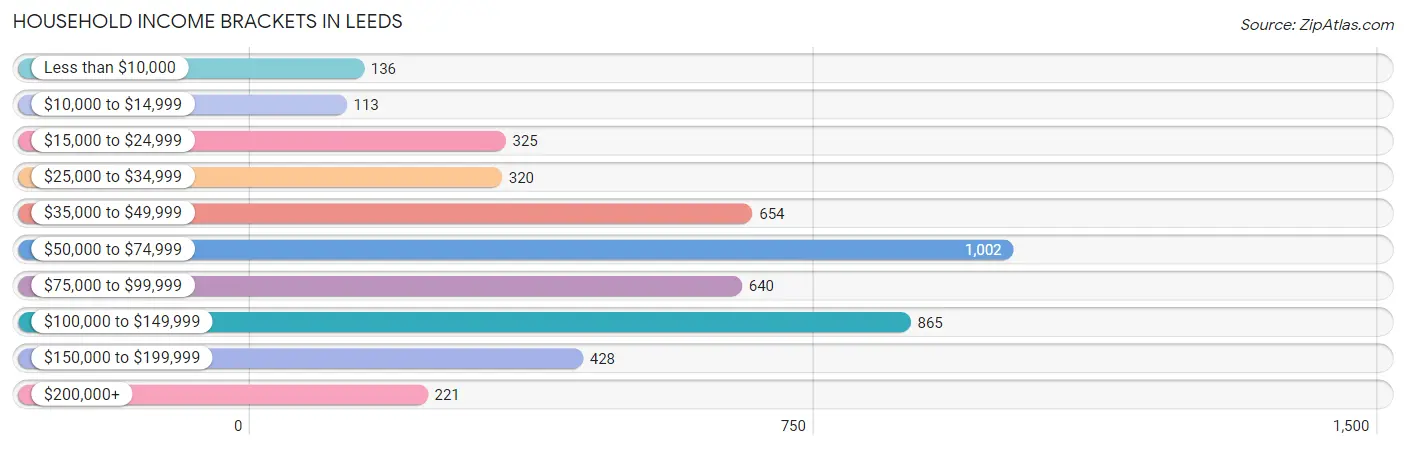
| Income Bracket | # Households | % Households |
| Less than $10,000 | 136 | 2.9% |
| $10,000 to $14,999 | 113 | 2.4% |
| $15,000 to $24,999 | 325 | 6.9% |
| $25,000 to $34,999 | 320 | 6.8% |
| $35,000 to $49,999 | 654 | 13.9% |
| $50,000 to $74,999 | 1,002 | 21.3% |
| $75,000 to $99,999 | 640 | 13.6% |
| $100,000 to $149,999 | 865 | 18.4% |
| $150,000 to $199,999 | 428 | 9.1% |
| $200,000+ | 221 | 4.7% |
Household Income by Householder Age in Leeds
The median household income in Leeds is $67,159, with the highest median household income of $82,645 found in the 45 to 64 years age bracket for the primary householder. A total of 1,745 households (37.1%) fall into this category. Meanwhile, the 15 to 24 years age bracket for the primary householder has the lowest median household income of $0, with 71 households (1.5%) in this group.
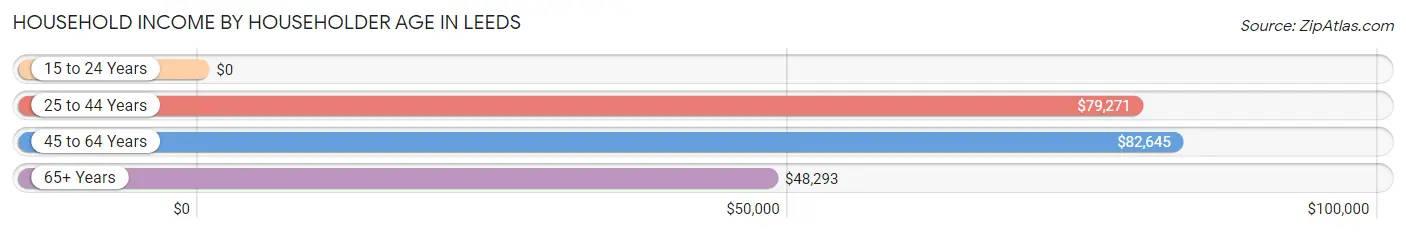
| Income Bracket | # Households | Median Income |
| 15 to 24 Years | 71 (1.5%) | $0 |
| 25 to 44 Years | 1,565 (33.3%) | $79,271 |
| 45 to 64 Years | 1,745 (37.1%) | $82,645 |
| 65+ Years | 1,322 (28.1%) | $48,293 |
| Total | 4,703 (100.0%) | $67,159 |
Poverty in Leeds
Income Below Poverty by Sex and Age in Leeds
With 8.0% poverty level for males and 8.3% for females among the residents of Leeds, under 5 year old males and under 5 year old females are the most vulnerable to poverty, with 80 males (24.7%) and 49 females (18.0%) in their respective age groups living below the poverty level.
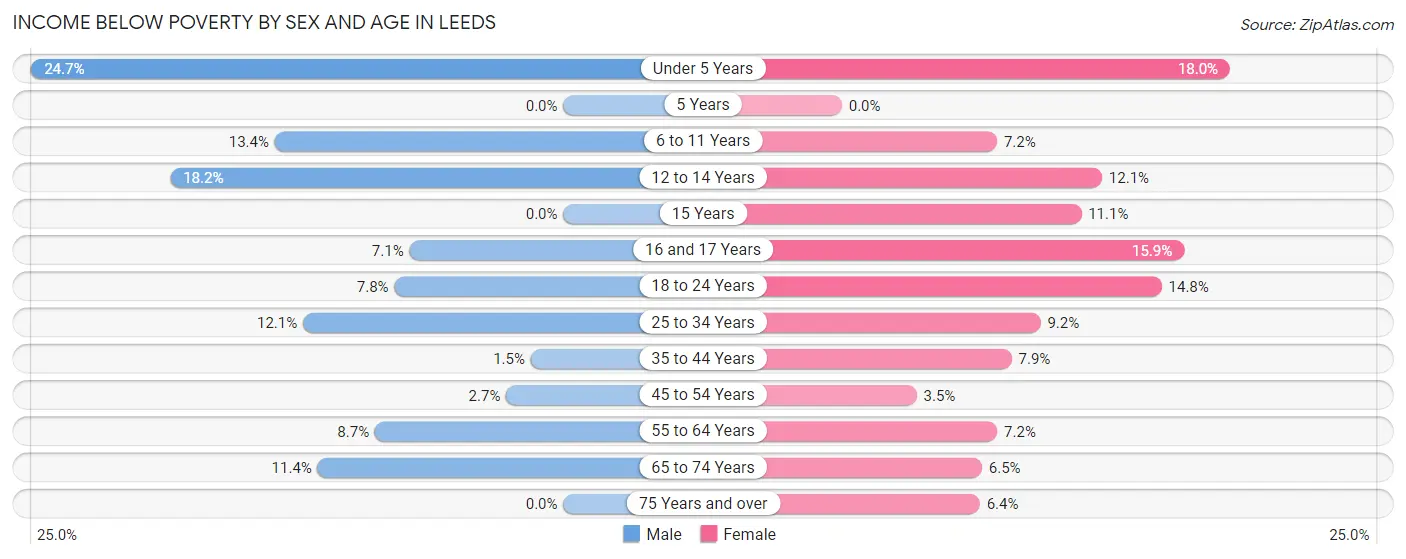
| Age Bracket | Male | Female |
| Under 5 Years | 80 (24.7%) | 49 (18.0%) |
| 5 Years | 0 (0.0%) | 0 (0.0%) |
| 6 to 11 Years | 62 (13.4%) | 39 (7.2%) |
| 12 to 14 Years | 60 (18.2%) | 14 (12.1%) |
| 15 Years | 0 (0.0%) | 6 (11.1%) |
| 16 and 17 Years | 15 (7.1%) | 27 (15.9%) |
| 18 to 24 Years | 25 (7.8%) | 42 (14.8%) |
| 25 to 34 Years | 91 (12.1%) | 82 (9.2%) |
| 35 to 44 Years | 13 (1.5%) | 66 (7.9%) |
| 45 to 54 Years | 28 (2.6%) | 21 (3.5%) |
| 55 to 64 Years | 73 (8.7%) | 58 (7.2%) |
| 65 to 74 Years | 74 (11.4%) | 44 (6.5%) |
| 75 Years and over | 0 (0.0%) | 32 (6.4%) |
| Total | 521 (8.0%) | 480 (8.3%) |
Income Above Poverty by Sex and Age in Leeds
According to the poverty statistics in Leeds, males aged 5 years and females aged 5 years are the age groups that are most secure financially, with 100.0% of males and 100.0% of females in these age groups living above the poverty line.
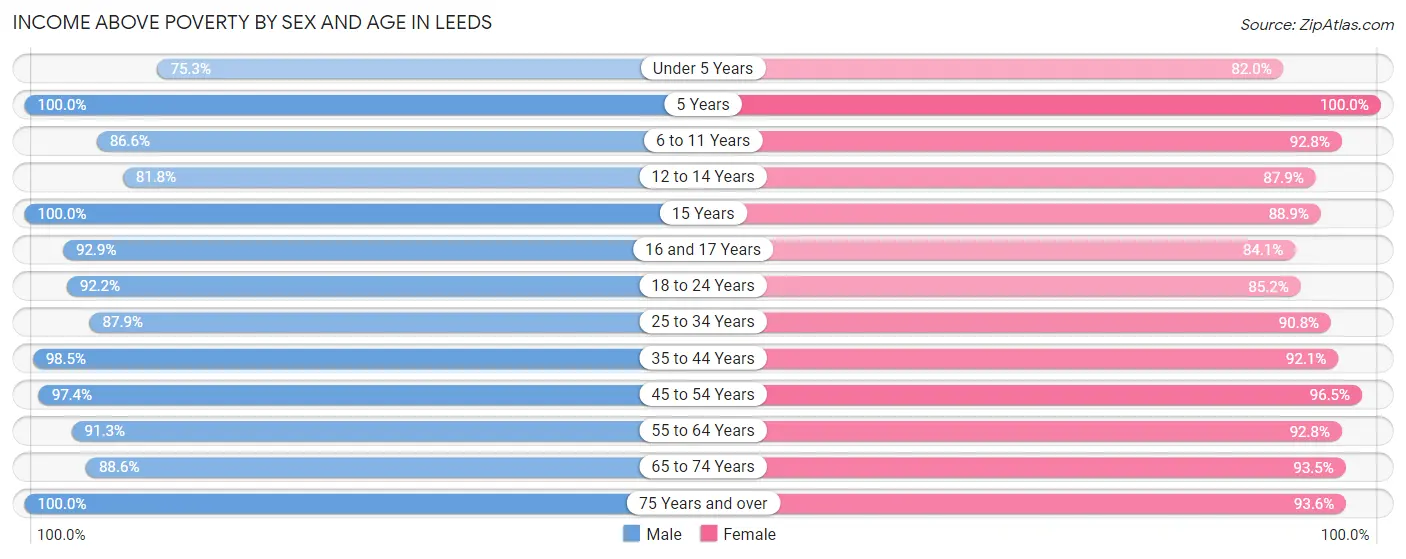
| Age Bracket | Male | Female |
| Under 5 Years | 244 (75.3%) | 223 (82.0%) |
| 5 Years | 157 (100.0%) | 56 (100.0%) |
| 6 to 11 Years | 401 (86.6%) | 503 (92.8%) |
| 12 to 14 Years | 269 (81.8%) | 102 (87.9%) |
| 15 Years | 237 (100.0%) | 48 (88.9%) |
| 16 and 17 Years | 195 (92.9%) | 143 (84.1%) |
| 18 to 24 Years | 294 (92.2%) | 241 (85.2%) |
| 25 to 34 Years | 662 (87.9%) | 807 (90.8%) |
| 35 to 44 Years | 848 (98.5%) | 772 (92.1%) |
| 45 to 54 Years | 1,029 (97.4%) | 584 (96.5%) |
| 55 to 64 Years | 762 (91.3%) | 746 (92.8%) |
| 65 to 74 Years | 575 (88.6%) | 633 (93.5%) |
| 75 Years and over | 292 (100.0%) | 468 (93.6%) |
| Total | 5,965 (92.0%) | 5,326 (91.7%) |
Income Below Poverty Among Married-Couple Families in Leeds
The poverty statistics for married-couple families in Leeds show that 2.1% or 51 of the total 2,425 families live below the poverty line. Families with no children have the highest poverty rate of 2.9%, comprising of 40 families. On the other hand, families with 3 or 4 children have the lowest poverty rate of 0.0%, which includes 0 families.
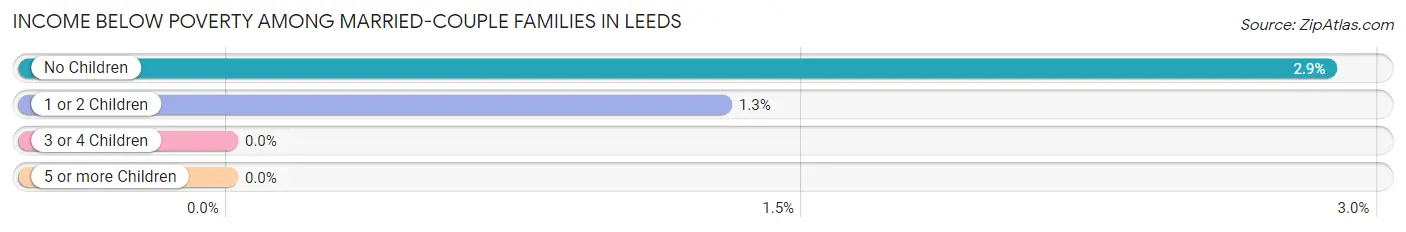
| Children | Above Poverty | Below Poverty |
| No Children | 1,355 (97.1%) | 40 (2.9%) |
| 1 or 2 Children | 843 (98.7%) | 11 (1.3%) |
| 3 or 4 Children | 176 (100.0%) | 0 (0.0%) |
| 5 or more Children | 0 (0.0%) | 0 (0.0%) |
| Total | 2,374 (97.9%) | 51 (2.1%) |
Income Below Poverty Among Single-Parent Households in Leeds
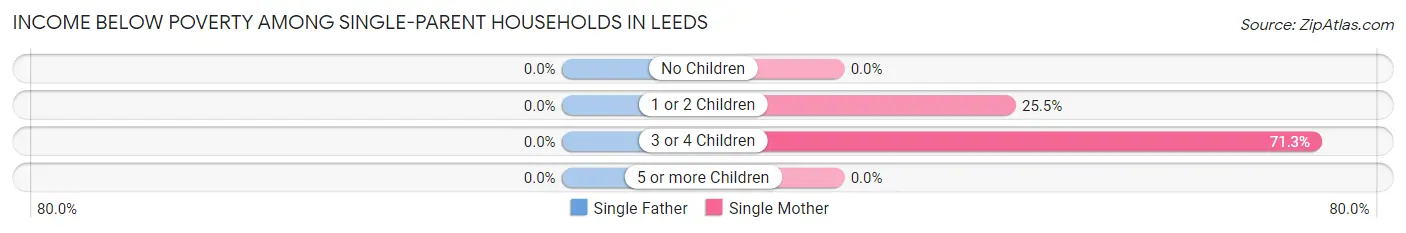
| Children | Single Father | Single Mother |
| No Children | 0 (0.0%) | 0 (0.0%) |
| 1 or 2 Children | 0 (0.0%) | 72 (25.5%) |
| 3 or 4 Children | 0 (0.0%) | 57 (71.3%) |
| 5 or more Children | 0 (0.0%) | 0 (0.0%) |
| Total | 0 (0.0%) | 129 (23.7%) |
Income Below Poverty Among Married-Couple vs Single-Parent Households in Leeds
The poverty data for Leeds shows that 51 of the married-couple family households (2.1%) and 129 of the single-parent households (16.8%) are living below the poverty level. Within the married-couple family households, those with no children have the highest poverty rate, with 40 households (2.9%) falling below the poverty line. Among the single-parent households, those with 3 or 4 children have the highest poverty rate, with 57 household (71.3%) living below poverty.
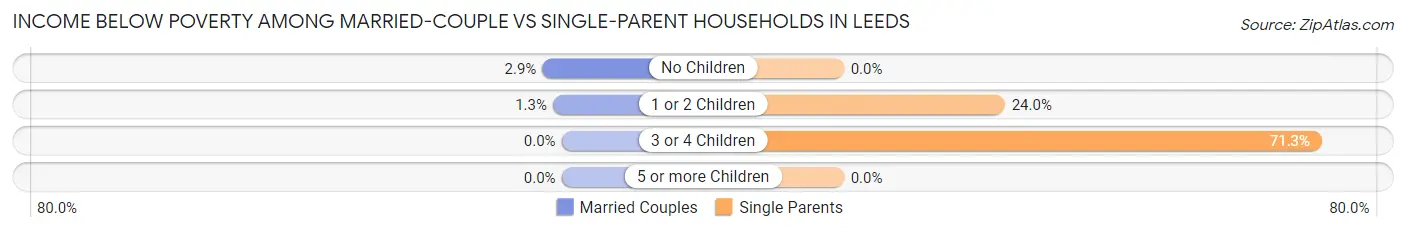
| Children | Married-Couple Families | Single-Parent Households |
| No Children | 40 (2.9%) | 0 (0.0%) |
| 1 or 2 Children | 11 (1.3%) | 72 (24.0%) |
| 3 or 4 Children | 0 (0.0%) | 57 (71.3%) |
| 5 or more Children | 0 (0.0%) | 0 (0.0%) |
| Total | 51 (2.1%) | 129 (16.8%) |
Race in Leeds
The most populous races in Leeds are White / Caucasian (9,240 | 75.2%), Black / African American (1,834 | 14.9%), and Hispanic or Latino (1,009 | 8.2%).
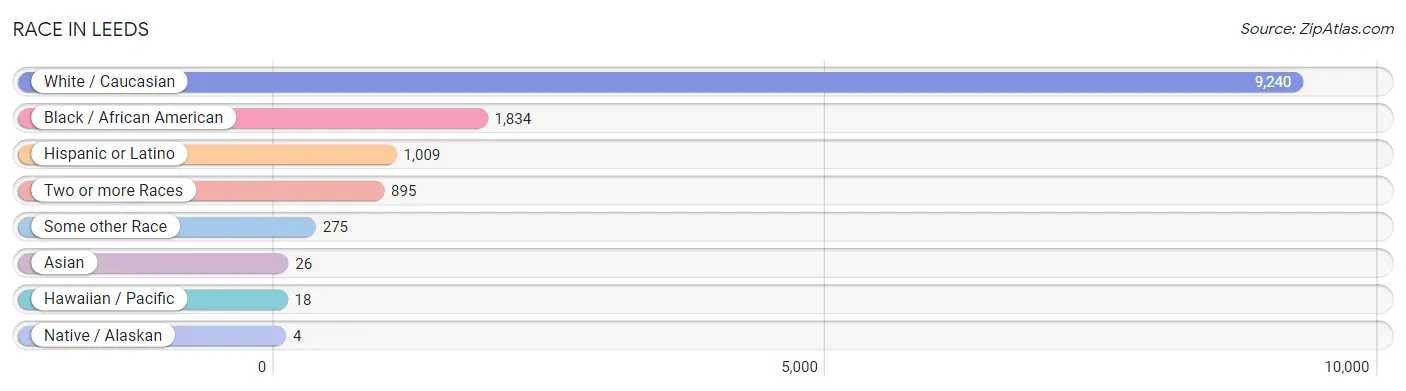
| Race | # Population | % Population |
| Asian | 26 | 0.2% |
| Black / African American | 1,834 | 14.9% |
| Hawaiian / Pacific | 18 | 0.2% |
| Hispanic or Latino | 1,009 | 8.2% |
| Native / Alaskan | 4 | 0.0% |
| White / Caucasian | 9,240 | 75.2% |
| Two or more Races | 895 | 7.3% |
| Some other Race | 275 | 2.2% |
| Total | 12,292 | 100.0% |
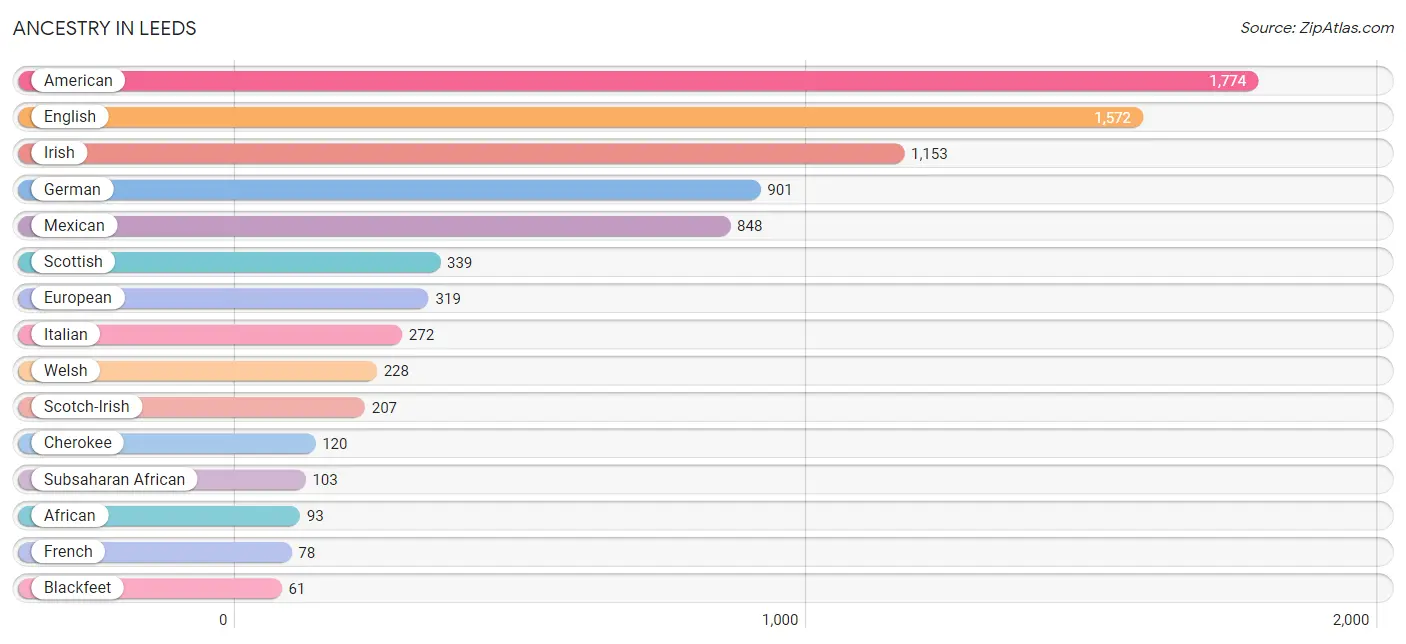
Ancestry in Leeds
The most populous ancestries reported in Leeds are American (1,774 | 14.4%), English (1,572 | 12.8%), Irish (1,153 | 9.4%), German (901 | 7.3%), and Mexican (848 | 6.9%), together accounting for 50.8% of all Leeds residents.
| Ancestry | # Population | % Population |
| African | 93 | 0.8% |
| American | 1,774 | 14.4% |
| Arab | 12 | 0.1% |
| Austrian | 4 | 0.0% |
| Bhutanese | 25 | 0.2% |
| Blackfeet | 61 | 0.5% |
| British | 50 | 0.4% |
| Cajun | 11 | 0.1% |
| Canadian | 34 | 0.3% |
| Celtic | 13 | 0.1% |
| Central American | 32 | 0.3% |
| Cherokee | 120 | 1.0% |
| Cuban | 30 | 0.2% |
| Danish | 8 | 0.1% |
| Dutch | 33 | 0.3% |
| Eastern European | 10 | 0.1% |
| English | 1,572 | 12.8% |
| European | 319 | 2.6% |
| French | 78 | 0.6% |
| German | 901 | 7.3% |
| Guatemalan | 14 | 0.1% |
| Honduran | 5 | 0.0% |
| Hungarian | 47 | 0.4% |
| Irish | 1,153 | 9.4% |
| Italian | 272 | 2.2% |
| Jamaican | 7 | 0.1% |
| Jordanian | 6 | 0.1% |
| Kenyan | 10 | 0.1% |
| Korean | 10 | 0.1% |
| Lebanese | 6 | 0.1% |
| Mexican | 848 | 6.9% |
| Native Hawaiian | 18 | 0.2% |
| Polish | 31 | 0.3% |
| Puerto Rican | 20 | 0.2% |
| Salvadoran | 13 | 0.1% |
| Scandinavian | 33 | 0.3% |
| Scotch-Irish | 207 | 1.7% |
| Scottish | 339 | 2.8% |
| South American | 55 | 0.4% |
| Spanish | 24 | 0.2% |
| Subsaharan African | 103 | 0.8% |
| Swedish | 38 | 0.3% |
| Venezuelan | 55 | 0.4% |
| Welsh | 228 | 1.8% | View All 44 Rows |
Immigrants in Leeds
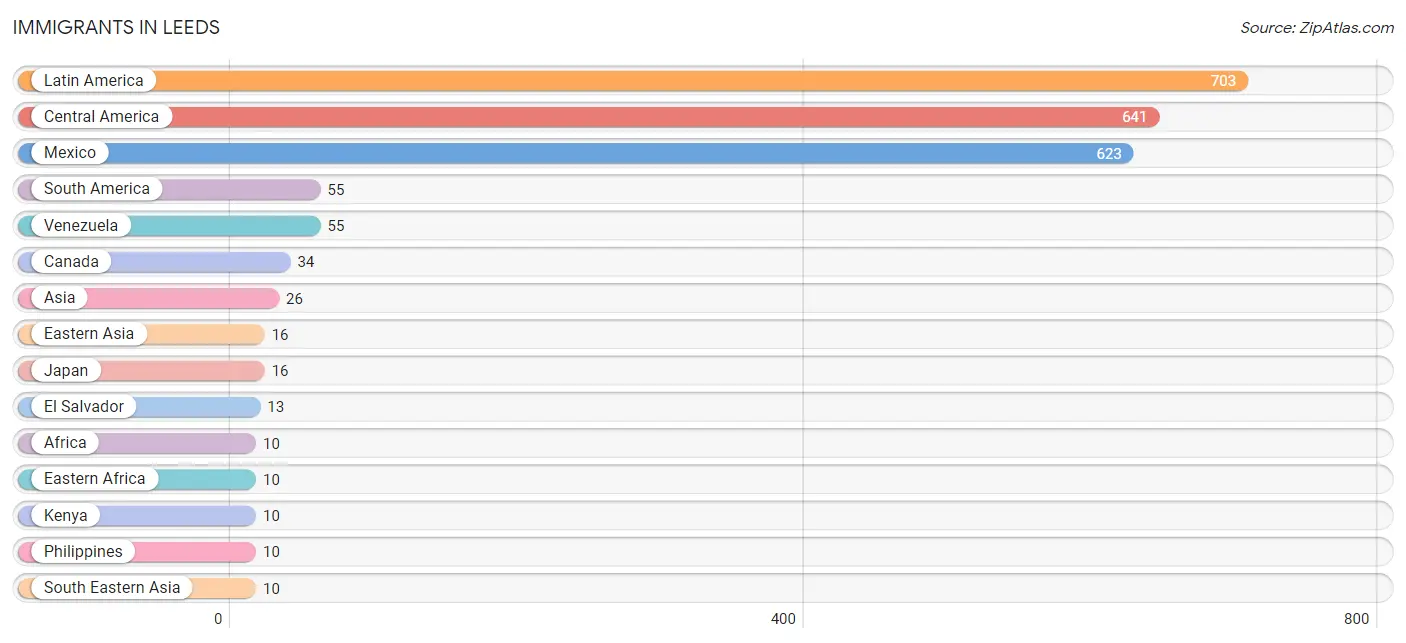
The most numerous immigrant groups reported in Leeds came from Latin America (703 | 5.7%), Central America (641 | 5.2%), Mexico (623 | 5.1%), South America (55 | 0.4%), and Venezuela (55 | 0.4%), together accounting for 16.9% of all Leeds residents.
| Immigration Origin | # Population | % Population |
| Africa | 10 | 0.1% |
| Asia | 26 | 0.2% |
| Canada | 34 | 0.3% |
| Caribbean | 7 | 0.1% |
| Central America | 641 | 5.2% |
| Eastern Africa | 10 | 0.1% |
| Eastern Asia | 16 | 0.1% |
| El Salvador | 13 | 0.1% |
| Honduras | 5 | 0.0% |
| Jamaica | 7 | 0.1% |
| Japan | 16 | 0.1% |
| Kenya | 10 | 0.1% |
| Latin America | 703 | 5.7% |
| Mexico | 623 | 5.1% |
| Philippines | 10 | 0.1% |
| South America | 55 | 0.4% |
| South Eastern Asia | 10 | 0.1% |
| Venezuela | 55 | 0.4% | View All 18 Rows |
Sex and Age in Leeds
Sex and Age in Leeds
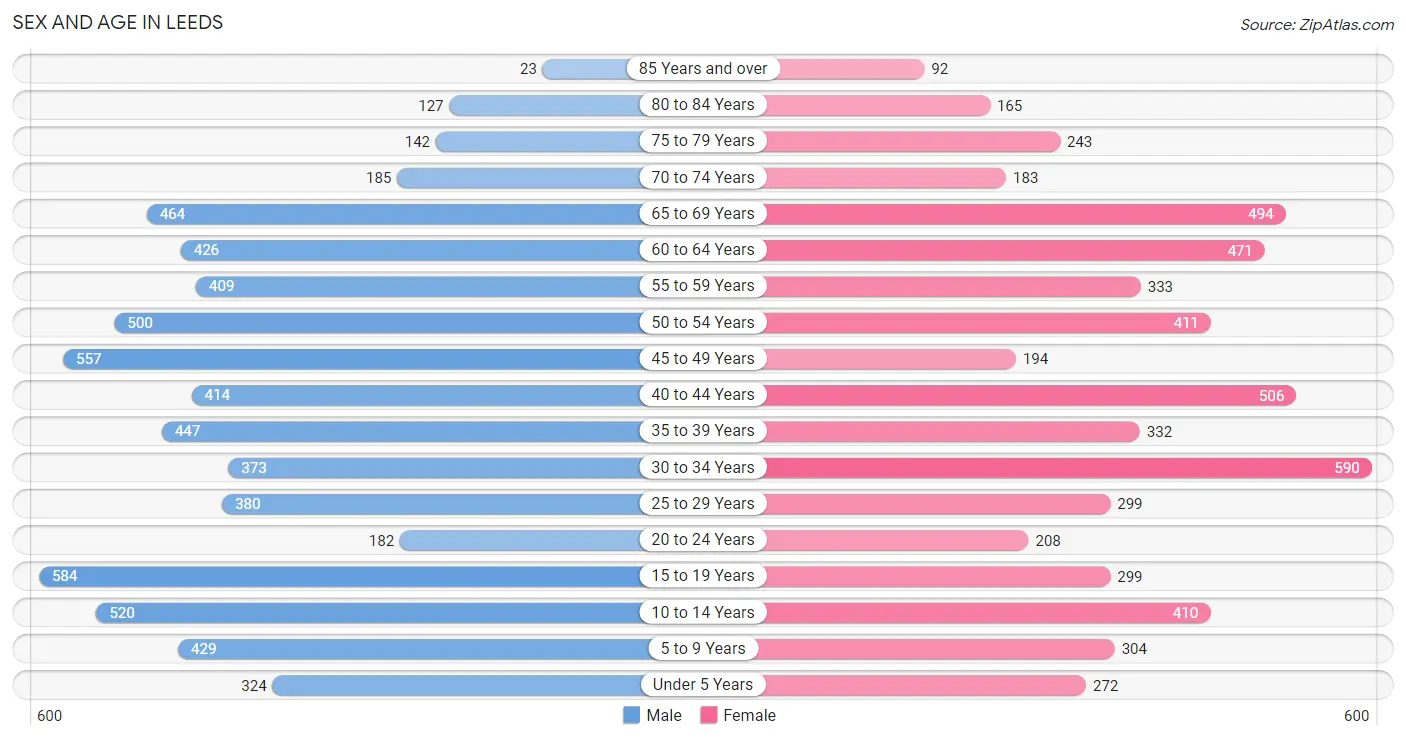
The most populous age groups in Leeds are 15 to 19 Years (584 | 9.0%) for men and 30 to 34 Years (590 | 10.2%) for women.
| Age Bracket | Male | Female |
| Under 5 Years | 324 (5.0%) | 272 (4.7%) |
| 5 to 9 Years | 429 (6.6%) | 304 (5.2%) |
| 10 to 14 Years | 520 (8.0%) | 410 (7.1%) |
| 15 to 19 Years | 584 (9.0%) | 299 (5.1%) |
| 20 to 24 Years | 182 (2.8%) | 208 (3.6%) |
| 25 to 29 Years | 380 (5.9%) | 299 (5.1%) |
| 30 to 34 Years | 373 (5.8%) | 590 (10.2%) |
| 35 to 39 Years | 447 (6.9%) | 332 (5.7%) |
| 40 to 44 Years | 414 (6.4%) | 506 (8.7%) |
| 45 to 49 Years | 557 (8.6%) | 194 (3.3%) |
| 50 to 54 Years | 500 (7.7%) | 411 (7.1%) |
| 55 to 59 Years | 409 (6.3%) | 333 (5.7%) |
| 60 to 64 Years | 426 (6.6%) | 471 (8.1%) |
| 65 to 69 Years | 464 (7.1%) | 494 (8.5%) |
| 70 to 74 Years | 185 (2.9%) | 183 (3.2%) |
| 75 to 79 Years | 142 (2.2%) | 243 (4.2%) |
| 80 to 84 Years | 127 (2.0%) | 165 (2.8%) |
| 85 Years and over | 23 (0.4%) | 92 (1.6%) |
| Total | 6,486 (100.0%) | 5,806 (100.0%) |
Families and Households in Leeds
Median Family Size in Leeds
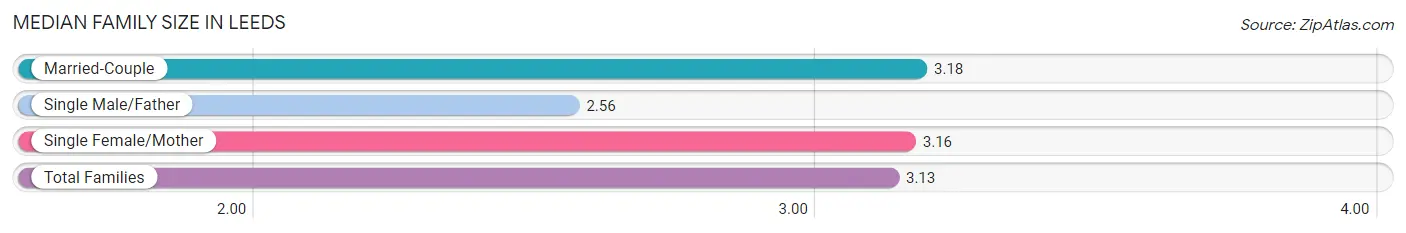
The median family size in Leeds is 3.13 persons per family, with married-couple families (2,425 | 75.9%) accounting for the largest median family size of 3.18 persons per family. On the other hand, single male/father families (224 | 7.0%) represent the smallest median family size with 2.56 persons per family.
| Family Type | # Families | Family Size |
| Married-Couple | 2,425 (75.9%) | 3.18 |
| Single Male/Father | 224 (7.0%) | 2.56 |
| Single Female/Mother | 544 (17.0%) | 3.16 |
| Total Families | 3,193 (100.0%) | 3.13 |
Median Household Size in Leeds
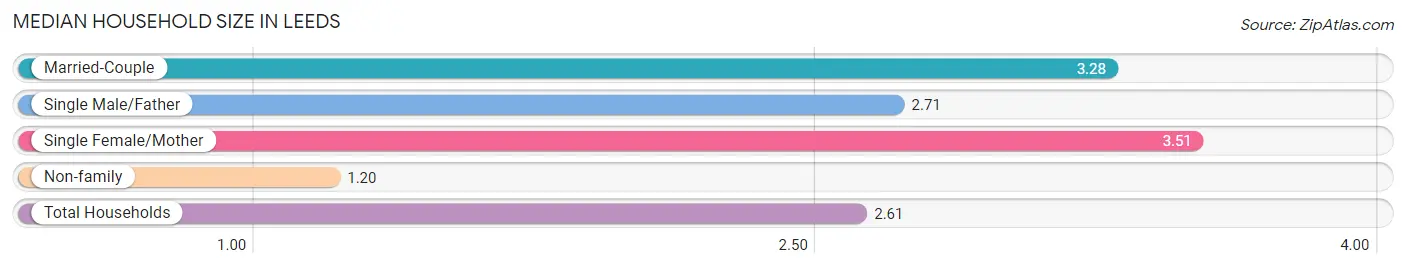
The median household size in Leeds is 2.61 persons per household, with single female/mother households (544 | 11.6%) accounting for the largest median household size of 3.51 persons per household. non-family households (1,510 | 32.1%) represent the smallest median household size with 1.20 persons per household.
| Household Type | # Households | Household Size |
| Married-Couple | 2,425 (51.6%) | 3.28 |
| Single Male/Father | 224 (4.8%) | 2.71 |
| Single Female/Mother | 544 (11.6%) | 3.51 |
| Non-family | 1,510 (32.1%) | 1.20 |
| Total Households | 4,703 (100.0%) | 2.61 |
Household Size by Marriage Status in Leeds
Out of a total of 4,703 households in Leeds, 3,193 (67.9%) are family households, while 1,510 (32.1%) are nonfamily households. The most numerous type of family households are 2-person households, comprising 1,436, and the most common type of nonfamily households are 1-person households, comprising 1,304.
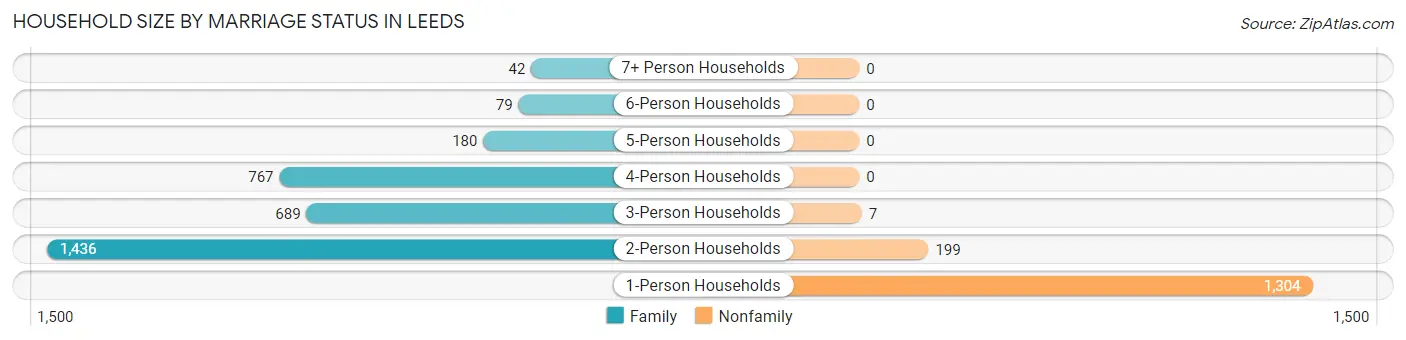
| Household Size | Family Households | Nonfamily Households |
| 1-Person Households | - | 1,304 (27.7%) |
| 2-Person Households | 1,436 (30.5%) | 199 (4.2%) |
| 3-Person Households | 689 (14.6%) | 7 (0.2%) |
| 4-Person Households | 767 (16.3%) | 0 (0.0%) |
| 5-Person Households | 180 (3.8%) | 0 (0.0%) |
| 6-Person Households | 79 (1.7%) | 0 (0.0%) |
| 7+ Person Households | 42 (0.9%) | 0 (0.0%) |
| Total | 3,193 (67.9%) | 1,510 (32.1%) |
Female Fertility in Leeds
Fertility by Age in Leeds
Average fertility rate in Leeds is 81.0 births per 1,000 women. Women in the age bracket of 20 to 34 years have the highest fertility rate with 180.0 births per 1,000 women. Women in the age bracket of 20 to 34 years acount for 95.2% of all women with births.
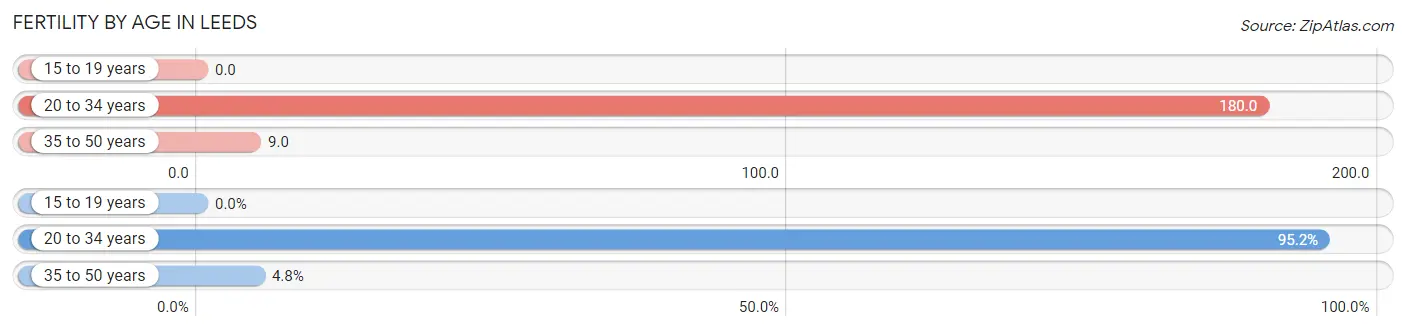
| Age Bracket | Women with Births | Births / 1,000 Women |
| 15 to 19 years | 0 (0.0%) | 0.0 |
| 20 to 34 years | 197 (95.2%) | 180.0 |
| 35 to 50 years | 10 (4.8%) | 9.0 |
| Total | 207 (100.0%) | 81.0 |
Fertility by Age by Marriage Status in Leeds
58.9% of women with births (207) in Leeds are married. The highest percentage of unmarried women with births falls into 20 to 34 years age bracket with 43.1% of them unmarried at the time of birth, while the lowest percentage of unmarried women with births belong to 35 to 50 years age bracket with 0.0% of them unmarried.
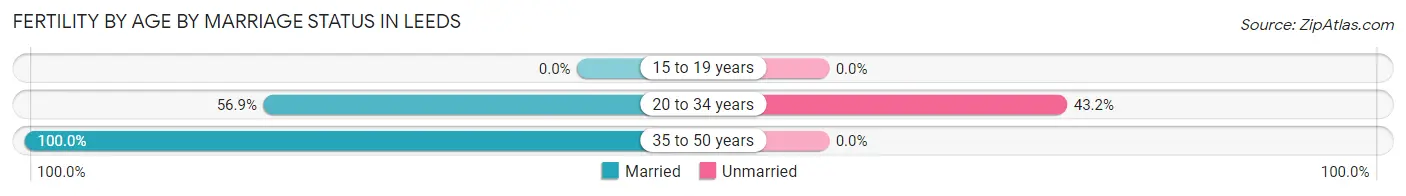
| Age Bracket | Married | Unmarried |
| 15 to 19 years | 0 (0.0%) | 0 (0.0%) |
| 20 to 34 years | 112 (56.9%) | 85 (43.1%) |
| 35 to 50 years | 10 (100.0%) | 0 (0.0%) |
| Total | 122 (58.9%) | 85 (41.1%) |
Fertility by Education in Leeds
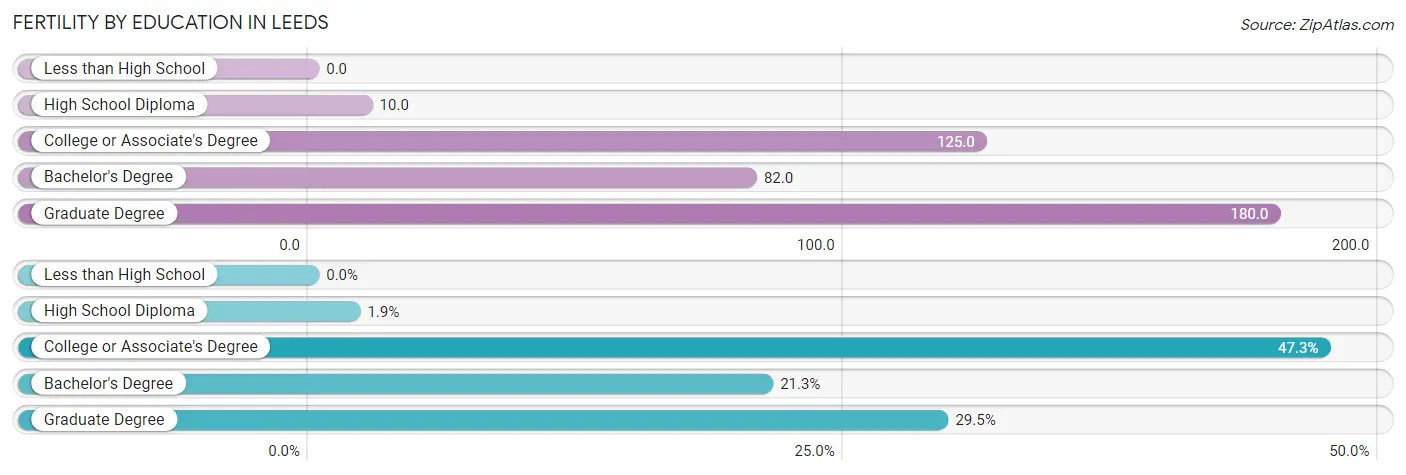
| Educational Attainment | Women with Births | Births / 1,000 Women |
| Less than High School | 0 (0.0%) | 0.0 |
| High School Diploma | 4 (1.9%) | 10.0 |
| College or Associate's Degree | 98 (47.3%) | 125.0 |
| Bachelor's Degree | 44 (21.3%) | 82.0 |
| Graduate Degree | 61 (29.5%) | 180.0 |
| Total | 207 (100.0%) | 81.0 |
Fertility by Education by Marriage Status in Leeds
41.1% of women with births in Leeds are unmarried. Women with the educational attainment of bachelor's degree are most likely to be married with 100.0% of them married at childbirth, while women with the educational attainment of high school diploma are least likely to be married with 100.0% of them unmarried at childbirth.
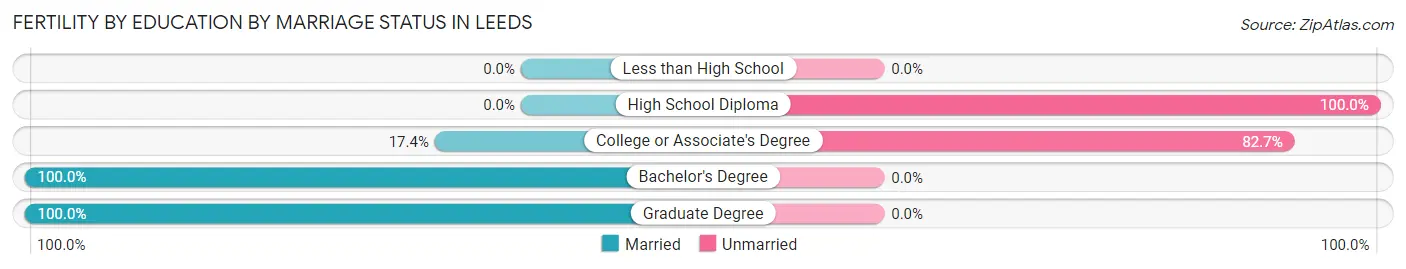
| Educational Attainment | Married | Unmarried |
| Less than High School | 0 (0.0%) | 0 (0.0%) |
| High School Diploma | 0 (0.0%) | 4 (100.0%) |
| College or Associate's Degree | 17 (17.3%) | 81 (82.7%) |
| Bachelor's Degree | 44 (100.0%) | 0 (0.0%) |
| Graduate Degree | 61 (100.0%) | 0 (0.0%) |
| Total | 122 (58.9%) | 85 (41.1%) |
Employment Characteristics in Leeds
Employment by Class of Employer in Leeds
Among the 6,190 employed individuals in Leeds, private company employees (4,900 | 79.2%), not-for-profit organizations (381 | 6.2%), and local government employees (254 | 4.1%) make up the most common classes of employment.
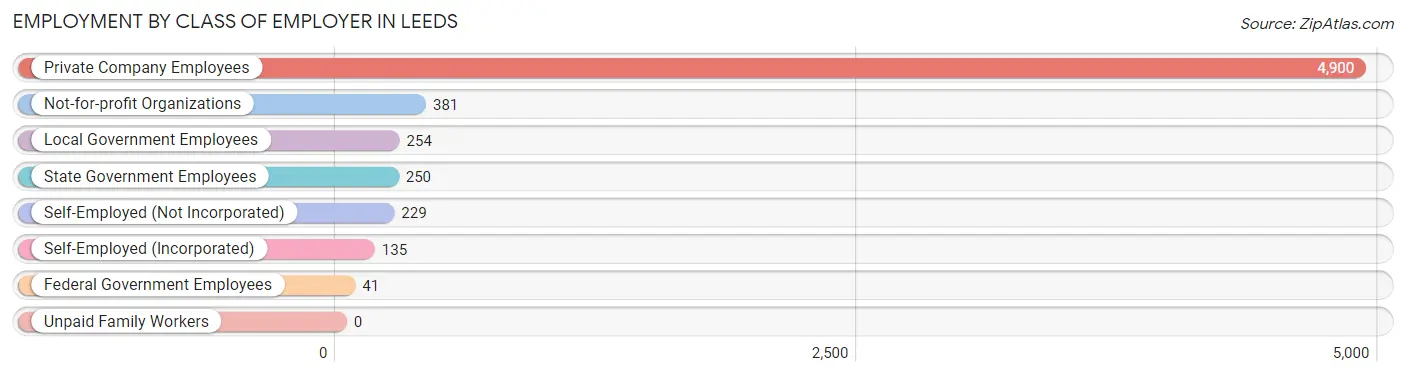
| Employer Class | # Employees | % Employees |
| Private Company Employees | 4,900 | 79.2% |
| Self-Employed (Incorporated) | 135 | 2.2% |
| Self-Employed (Not Incorporated) | 229 | 3.7% |
| Not-for-profit Organizations | 381 | 6.2% |
| Local Government Employees | 254 | 4.1% |
| State Government Employees | 250 | 4.0% |
| Federal Government Employees | 41 | 0.7% |
| Unpaid Family Workers | 0 | 0.0% |
| Total | 6,190 | 100.0% |
Employment Status by Age in Leeds
According to the labor force statistics for Leeds, out of the total population over 16 years of age (9,742), 65.0% or 6,332 individuals are in the labor force, with 1.4% or 89 of them unemployed. The age group with the highest labor force participation rate is 20 to 24 years, with 90.5% or 353 individuals in the labor force. Within the labor force, the 20 to 24 years age range has the highest percentage of unemployed individuals, with 3.7% or 13 of them being unemployed.
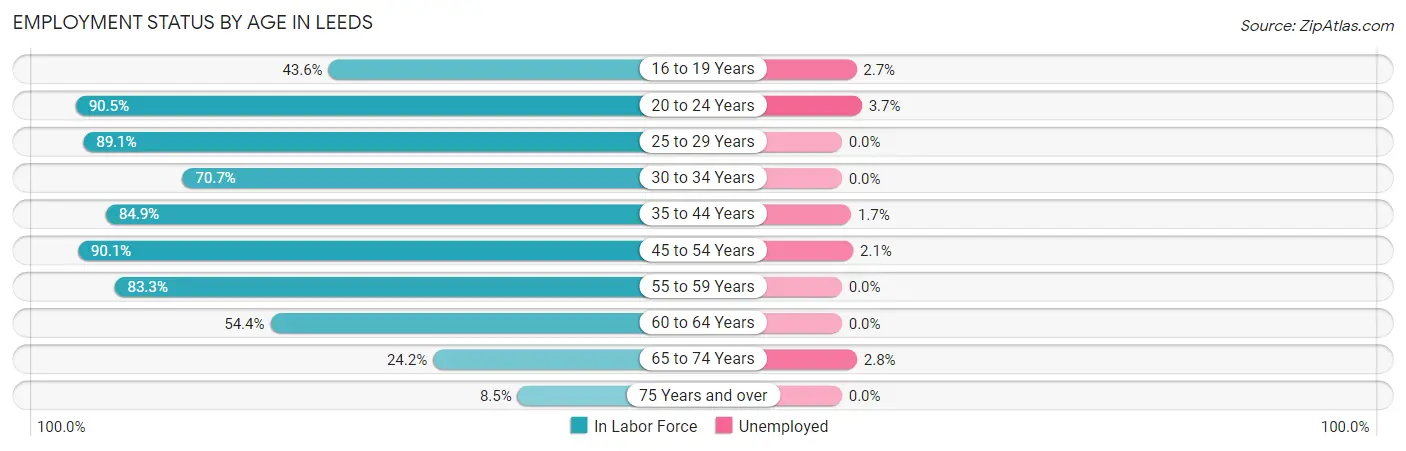
| Age Bracket | In Labor Force | Unemployed |
| 16 to 19 Years | 258 (43.6%) | 7 (2.7%) |
| 20 to 24 Years | 353 (90.5%) | 13 (3.7%) |
| 25 to 29 Years | 605 (89.1%) | 0 (0.0%) |
| 30 to 34 Years | 681 (70.7%) | 0 (0.0%) |
| 35 to 44 Years | 1,442 (84.9%) | 25 (1.7%) |
| 45 to 54 Years | 1,497 (90.1%) | 31 (2.1%) |
| 55 to 59 Years | 618 (83.3%) | 0 (0.0%) |
| 60 to 64 Years | 488 (54.4%) | 0 (0.0%) |
| 65 to 74 Years | 321 (24.2%) | 9 (2.8%) |
| 75 Years and over | 67 (8.5%) | 0 (0.0%) |
| Total | 6,332 (65.0%) | 89 (1.4%) |
Employment Status by Educational Attainment in Leeds
According to labor force statistics for Leeds, 80.3% of individuals (5,334) out of the total population between 25 and 64 years of age (6,642) are in the labor force, with 1.1% or 59 of them being unemployed. The group with the highest labor force participation rate are those with the educational attainment of bachelor's degree or higher, with 86.3% or 1,683 individuals in the labor force. Within the labor force, individuals with high school diploma education have the highest percentage of unemployment, with 1.7% or 22 of them being unemployed.
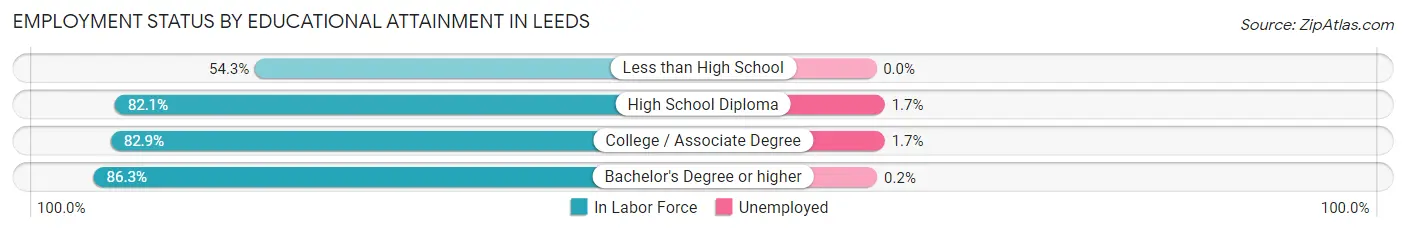
| Educational Attainment | In Labor Force | Unemployed |
| Less than High School | 431 (54.3%) | 0 (0.0%) |
| High School Diploma | 1,291 (82.1%) | 27 (1.7%) |
| College / Associate Degree | 1,927 (82.9%) | 40 (1.7%) |
| Bachelor's Degree or higher | 1,683 (86.3%) | 4 (0.2%) |
| Total | 5,334 (80.3%) | 73 (1.1%) |
Employment Occupations by Sex in Leeds
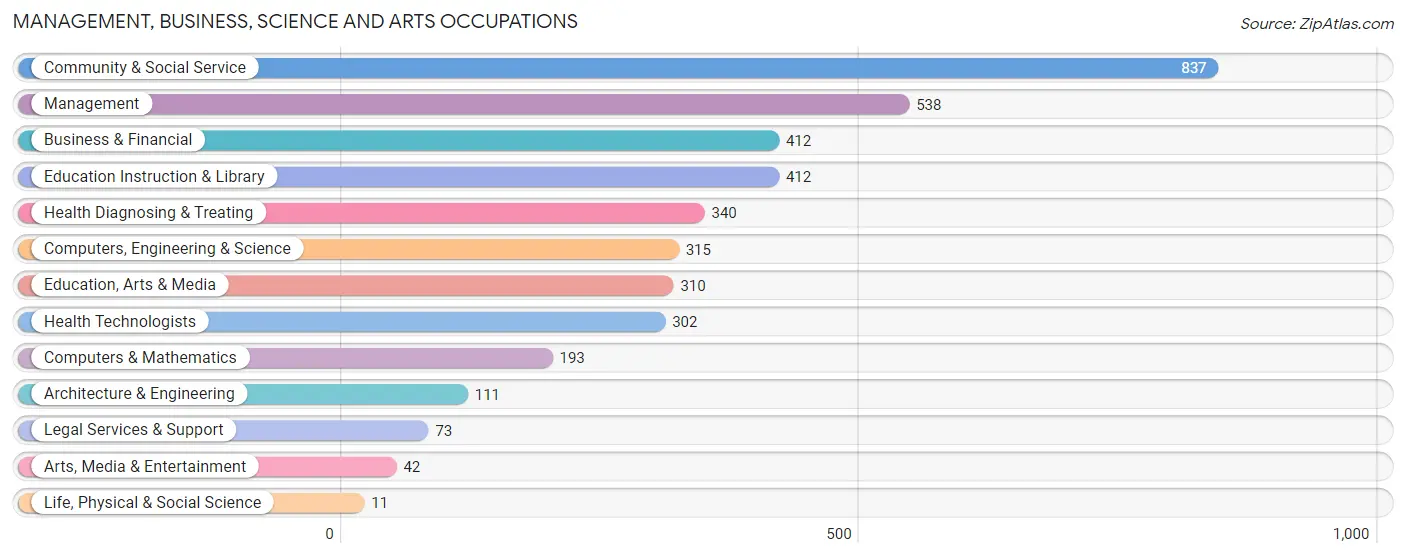
Management, Business, Science and Arts Occupations
The most common Management, Business, Science and Arts occupations in Leeds are Community & Social Service (837 | 13.4%), Management (538 | 8.6%), Business & Financial (412 | 6.6%), Education Instruction & Library (412 | 6.6%), and Health Diagnosing & Treating (340 | 5.4%).
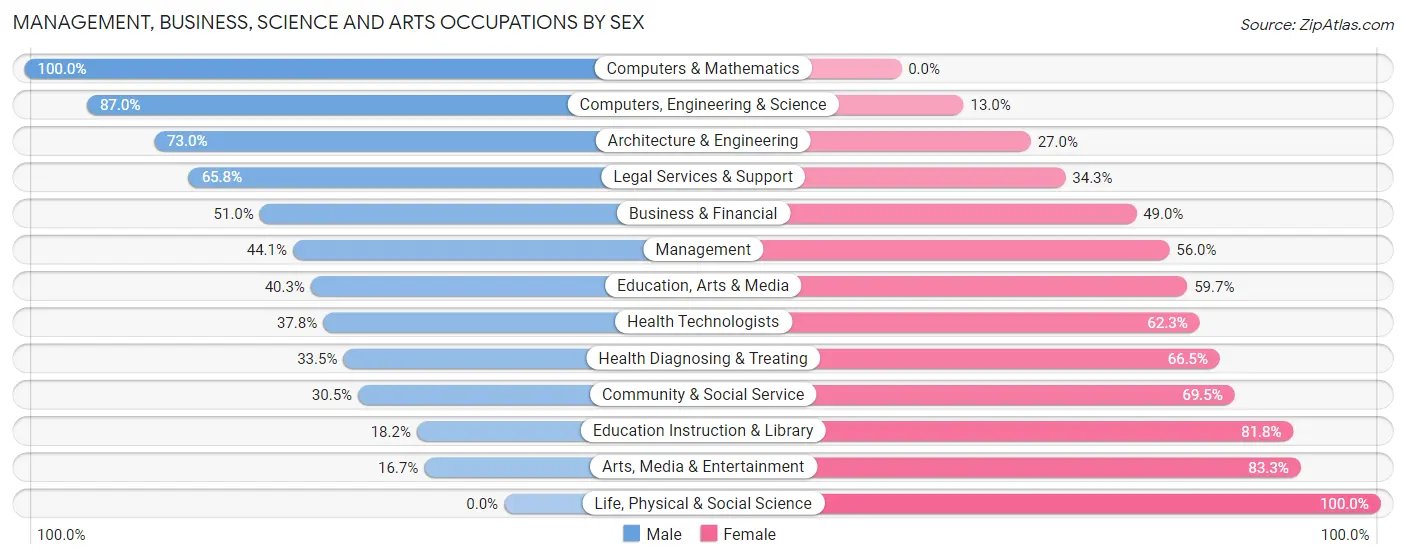
Management, Business, Science and Arts Occupations by Sex
Within the Management, Business, Science and Arts occupations in Leeds, the most male-oriented occupations are Computers & Mathematics (100.0%), Computers, Engineering & Science (87.0%), and Architecture & Engineering (73.0%), while the most female-oriented occupations are Life, Physical & Social Science (100.0%), Arts, Media & Entertainment (83.3%), and Education Instruction & Library (81.8%).
| Occupation | Male | Female |
| Management | 237 (44.1%) | 301 (55.9%) |
| Business & Financial | 210 (51.0%) | 202 (49.0%) |
| Computers, Engineering & Science | 274 (87.0%) | 41 (13.0%) |
| Computers & Mathematics | 193 (100.0%) | 0 (0.0%) |
| Architecture & Engineering | 81 (73.0%) | 30 (27.0%) |
| Life, Physical & Social Science | 0 (0.0%) | 11 (100.0%) |
| Community & Social Service | 255 (30.5%) | 582 (69.5%) |
| Education, Arts & Media | 125 (40.3%) | 185 (59.7%) |
| Legal Services & Support | 48 (65.7%) | 25 (34.3%) |
| Education Instruction & Library | 75 (18.2%) | 337 (81.8%) |
| Arts, Media & Entertainment | 7 (16.7%) | 35 (83.3%) |
| Health Diagnosing & Treating | 114 (33.5%) | 226 (66.5%) |
| Health Technologists | 114 (37.8%) | 188 (62.3%) |
| Total (Category) | 1,090 (44.6%) | 1,352 (55.4%) |
| Total (Overall) | 3,534 (56.6%) | 2,711 (43.4%) |
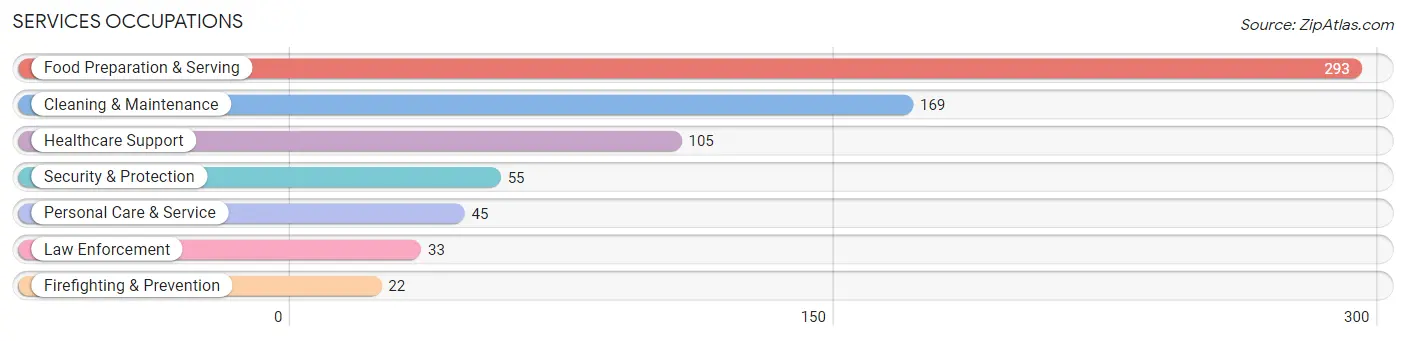
Services Occupations
The most common Services occupations in Leeds are Food Preparation & Serving (293 | 4.7%), Cleaning & Maintenance (169 | 2.7%), Healthcare Support (105 | 1.7%), Security & Protection (55 | 0.9%), and Personal Care & Service (45 | 0.7%).
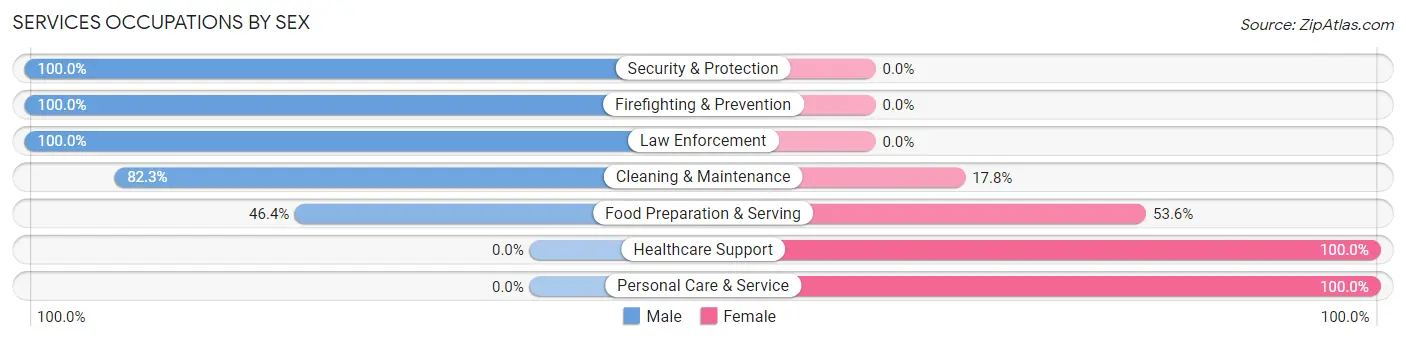
Services Occupations by Sex
Within the Services occupations in Leeds, the most male-oriented occupations are Security & Protection (100.0%), Firefighting & Prevention (100.0%), and Law Enforcement (100.0%), while the most female-oriented occupations are Healthcare Support (100.0%), Personal Care & Service (100.0%), and Food Preparation & Serving (53.6%).
| Occupation | Male | Female |
| Healthcare Support | 0 (0.0%) | 105 (100.0%) |
| Security & Protection | 55 (100.0%) | 0 (0.0%) |
| Firefighting & Prevention | 22 (100.0%) | 0 (0.0%) |
| Law Enforcement | 33 (100.0%) | 0 (0.0%) |
| Food Preparation & Serving | 136 (46.4%) | 157 (53.6%) |
| Cleaning & Maintenance | 139 (82.3%) | 30 (17.7%) |
| Personal Care & Service | 0 (0.0%) | 45 (100.0%) |
| Total (Category) | 330 (49.5%) | 337 (50.5%) |
| Total (Overall) | 3,534 (56.6%) | 2,711 (43.4%) |
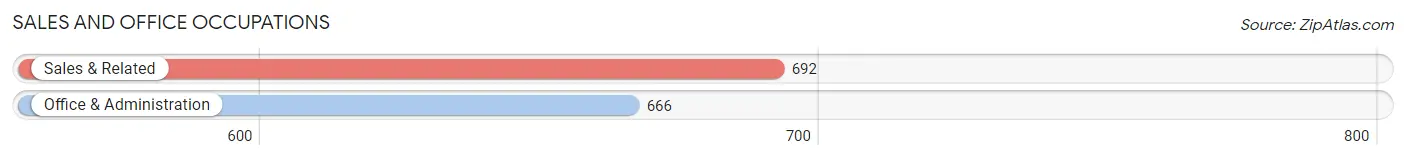
Sales and Office Occupations
The most common Sales and Office occupations in Leeds are Sales & Related (692 | 11.1%), and Office & Administration (666 | 10.7%).
Sales and Office Occupations by Sex
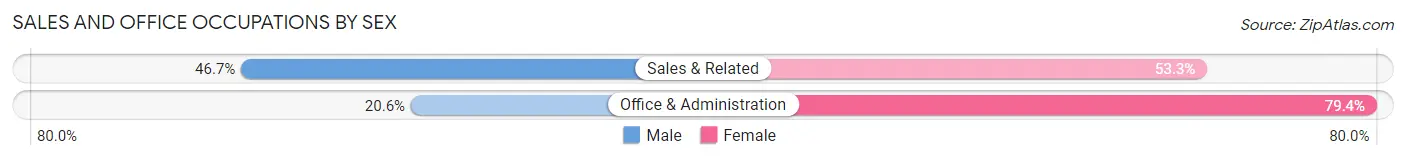
| Occupation | Male | Female |
| Sales & Related | 323 (46.7%) | 369 (53.3%) |
| Office & Administration | 137 (20.6%) | 529 (79.4%) |
| Total (Category) | 460 (33.9%) | 898 (66.1%) |
| Total (Overall) | 3,534 (56.6%) | 2,711 (43.4%) |
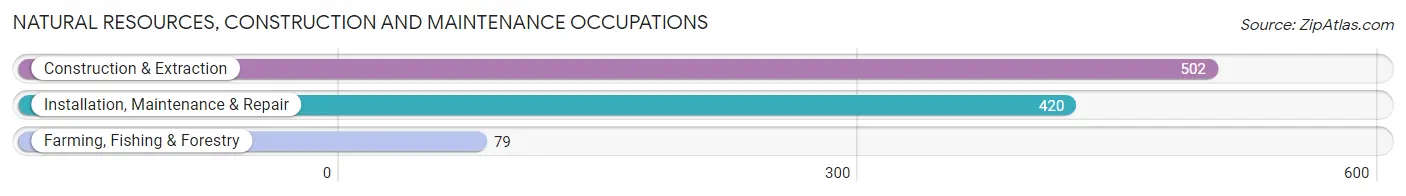
Natural Resources, Construction and Maintenance Occupations
The most common Natural Resources, Construction and Maintenance occupations in Leeds are Construction & Extraction (502 | 8.0%), Installation, Maintenance & Repair (420 | 6.7%), and Farming, Fishing & Forestry (79 | 1.3%).
Natural Resources, Construction and Maintenance Occupations by Sex
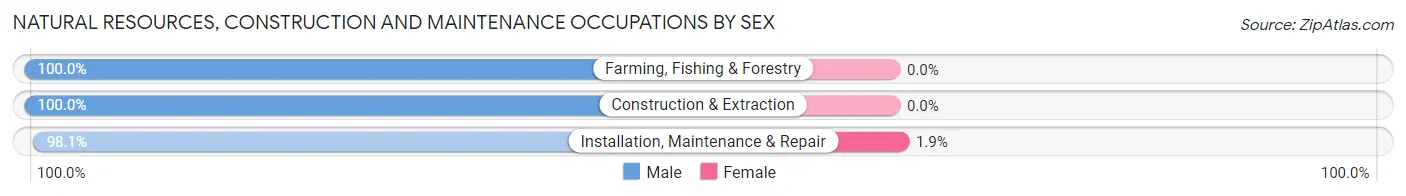
| Occupation | Male | Female |
| Farming, Fishing & Forestry | 79 (100.0%) | 0 (0.0%) |
| Construction & Extraction | 502 (100.0%) | 0 (0.0%) |
| Installation, Maintenance & Repair | 412 (98.1%) | 8 (1.9%) |
| Total (Category) | 993 (99.2%) | 8 (0.8%) |
| Total (Overall) | 3,534 (56.6%) | 2,711 (43.4%) |
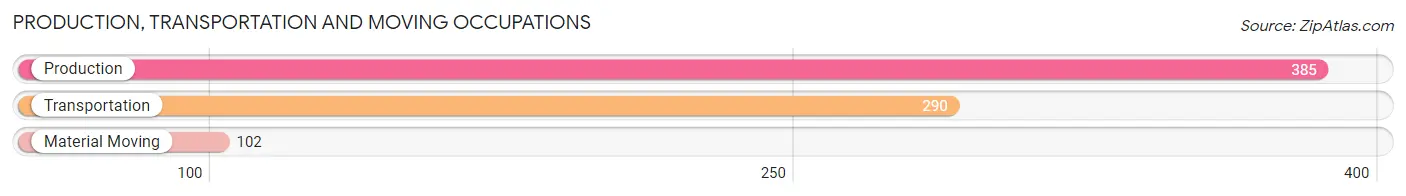
Production, Transportation and Moving Occupations
The most common Production, Transportation and Moving occupations in Leeds are Production (385 | 6.2%), Transportation (290 | 4.6%), and Material Moving (102 | 1.6%).
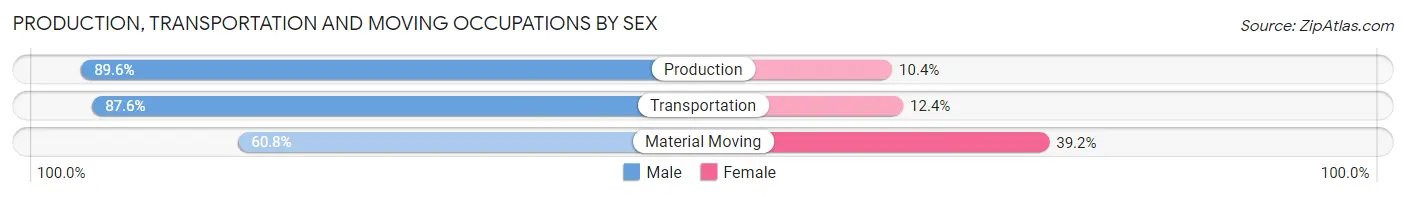
Production, Transportation and Moving Occupations by Sex
| Occupation | Male | Female |
| Production | 345 (89.6%) | 40 (10.4%) |
| Transportation | 254 (87.6%) | 36 (12.4%) |
| Material Moving | 62 (60.8%) | 40 (39.2%) |
| Total (Category) | 661 (85.1%) | 116 (14.9%) |
| Total (Overall) | 3,534 (56.6%) | 2,711 (43.4%) |
Employment Industries by Sex in Leeds
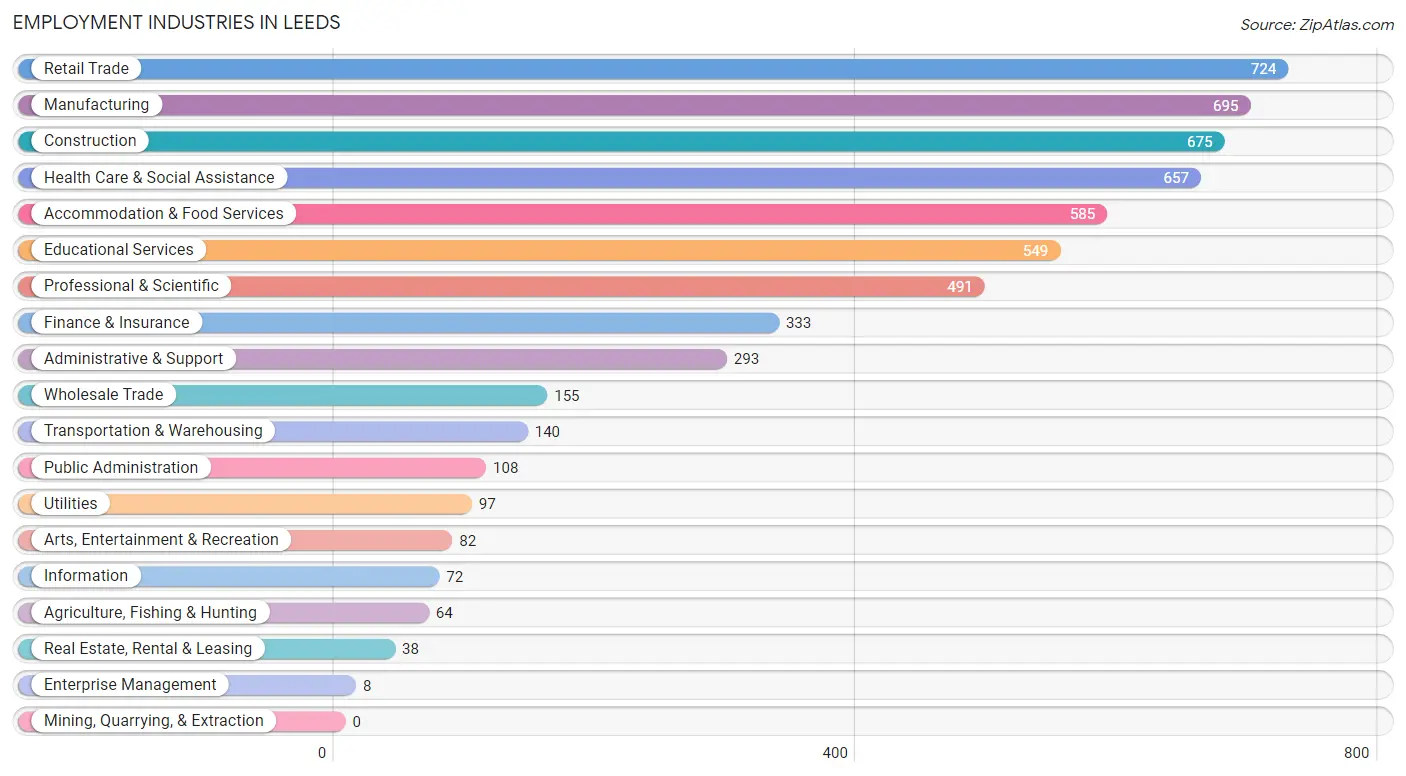
Employment Industries in Leeds
The major employment industries in Leeds include Retail Trade (724 | 11.6%), Manufacturing (695 | 11.1%), Construction (675 | 10.8%), Health Care & Social Assistance (657 | 10.5%), and Accommodation & Food Services (585 | 9.4%).
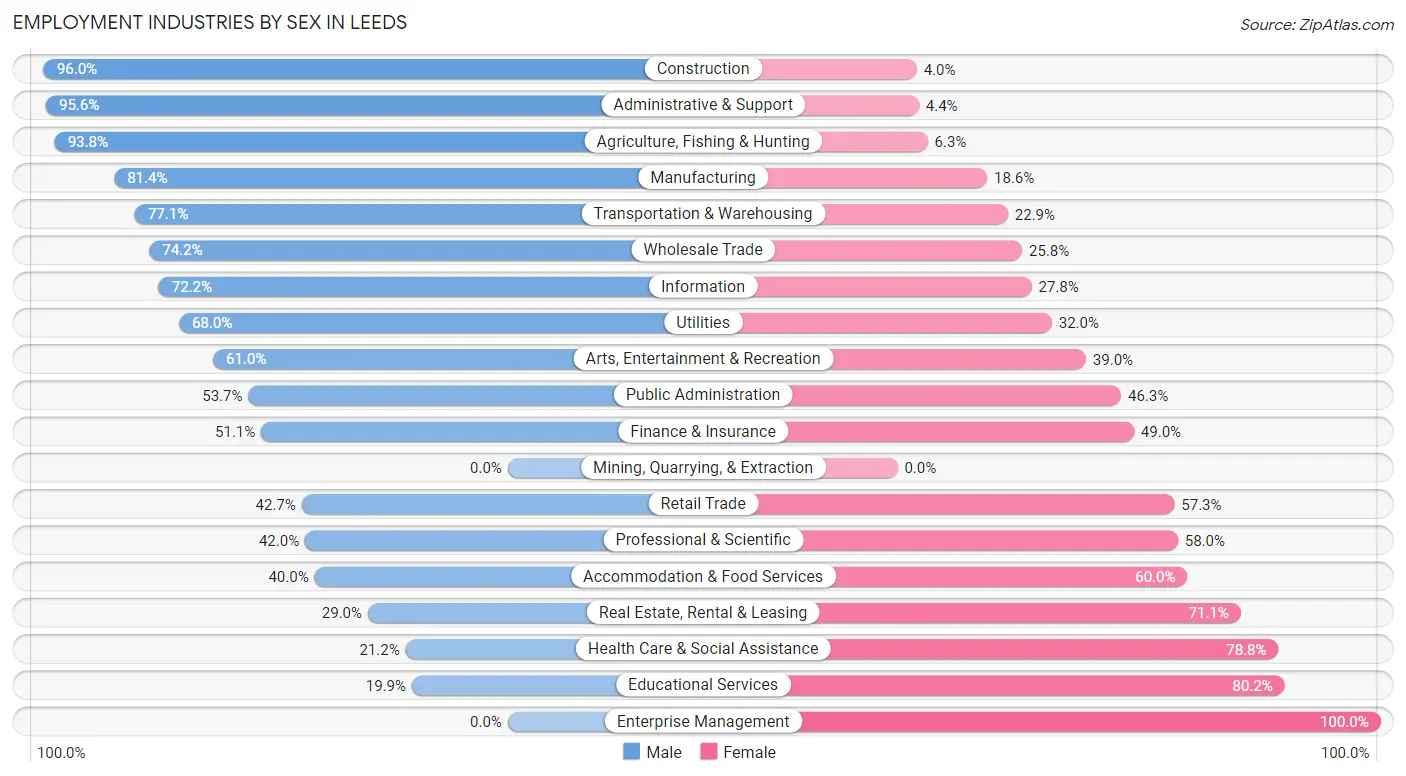
Employment Industries by Sex in Leeds
The Leeds industries that see more men than women are Construction (96.0%), Administrative & Support (95.6%), and Agriculture, Fishing & Hunting (93.8%), whereas the industries that tend to have a higher number of women are Enterprise Management (100.0%), Educational Services (80.1%), and Health Care & Social Assistance (78.8%).
| Industry | Male | Female |
| Agriculture, Fishing & Hunting | 60 (93.8%) | 4 (6.2%) |
| Mining, Quarrying, & Extraction | 0 (0.0%) | 0 (0.0%) |
| Construction | 648 (96.0%) | 27 (4.0%) |
| Manufacturing | 566 (81.4%) | 129 (18.6%) |
| Wholesale Trade | 115 (74.2%) | 40 (25.8%) |
| Retail Trade | 309 (42.7%) | 415 (57.3%) |
| Transportation & Warehousing | 108 (77.1%) | 32 (22.9%) |
| Utilities | 66 (68.0%) | 31 (32.0%) |
| Information | 52 (72.2%) | 20 (27.8%) |
| Finance & Insurance | 170 (51.0%) | 163 (48.9%) |
| Real Estate, Rental & Leasing | 11 (28.9%) | 27 (71.1%) |
| Professional & Scientific | 206 (42.0%) | 285 (58.0%) |
| Enterprise Management | 0 (0.0%) | 8 (100.0%) |
| Administrative & Support | 280 (95.6%) | 13 (4.4%) |
| Educational Services | 109 (19.9%) | 440 (80.1%) |
| Health Care & Social Assistance | 139 (21.2%) | 518 (78.8%) |
| Arts, Entertainment & Recreation | 50 (61.0%) | 32 (39.0%) |
| Accommodation & Food Services | 234 (40.0%) | 351 (60.0%) |
| Public Administration | 58 (53.7%) | 50 (46.3%) |
| Total | 3,534 (56.6%) | 2,711 (43.4%) |
Education in Leeds
School Enrollment in Leeds
The most common levels of schooling among the 2,861 students in Leeds are high school (808 | 28.2%), middle school (801 | 28.0%), and elementary school (553 | 19.3%).
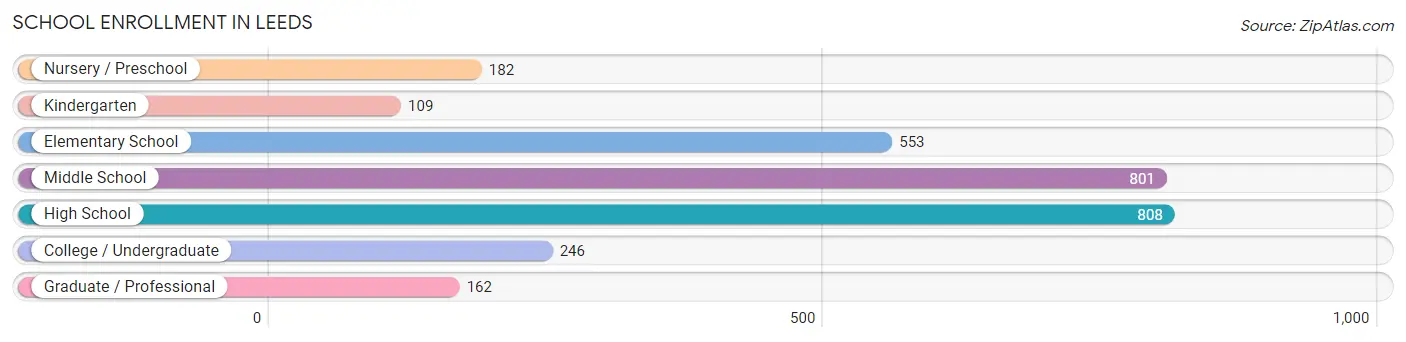
| School Level | # Students | % Students |
| Nursery / Preschool | 182 | 6.4% |
| Kindergarten | 109 | 3.8% |
| Elementary School | 553 | 19.3% |
| Middle School | 801 | 28.0% |
| High School | 808 | 28.2% |
| College / Undergraduate | 246 | 8.6% |
| Graduate / Professional | 162 | 5.7% |
| Total | 2,861 | 100.0% |
School Enrollment by Age by Funding Source in Leeds
Out of a total of 2,861 students who are enrolled in schools in Leeds, 526 (18.4%) attend a private institution, while the remaining 2,335 (81.6%) are enrolled in public schools. The age group of 25 to 34 year olds has the highest likelihood of being enrolled in private schools, with 46 (39.3% in the age bracket) enrolled. Conversely, the age group of 15 to 17 year olds has the lowest likelihood of being enrolled in a private school, with 578 (86.1% in the age bracket) attending a public institution.
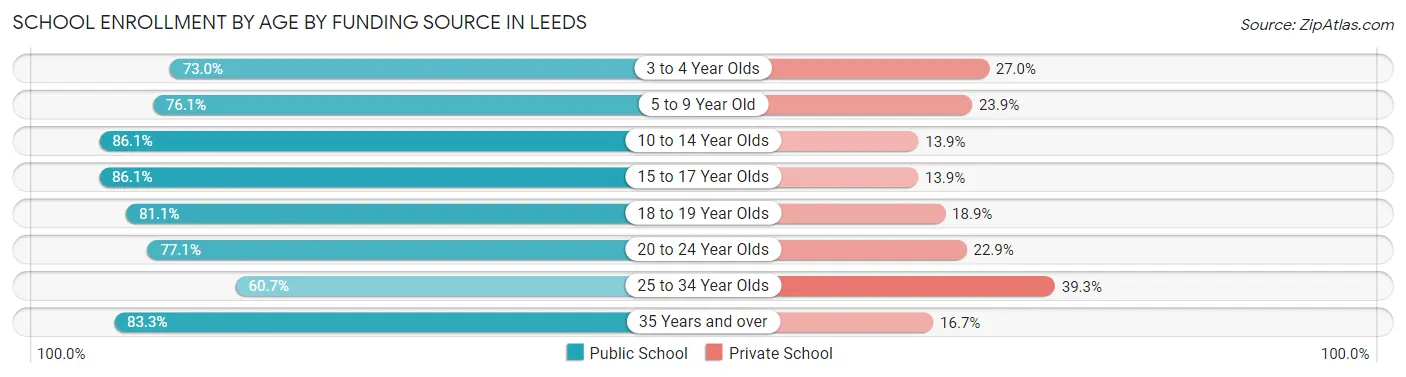
| Age Bracket | Public School | Private School |
| 3 to 4 Year Olds | 81 (73.0%) | 30 (27.0%) |
| 5 to 9 Year Old | 500 (76.1%) | 157 (23.9%) |
| 10 to 14 Year Olds | 792 (86.1%) | 128 (13.9%) |
| 15 to 17 Year Olds | 578 (86.1%) | 93 (13.9%) |
| 18 to 19 Year Olds | 133 (81.1%) | 31 (18.9%) |
| 20 to 24 Year Olds | 64 (77.1%) | 19 (22.9%) |
| 25 to 34 Year Olds | 71 (60.7%) | 46 (39.3%) |
| 35 Years and over | 115 (83.3%) | 23 (16.7%) |
| Total | 2,335 (81.6%) | 526 (18.4%) |
Educational Attainment by Field of Study in Leeds
Business (452 | 16.3%), education (410 | 14.8%), science & technology (284 | 10.2%), arts & humanities (233 | 8.4%), and liberal arts & history (230 | 8.3%) are the most common fields of study among 2,773 individuals in Leeds who have obtained a bachelor's degree or higher.
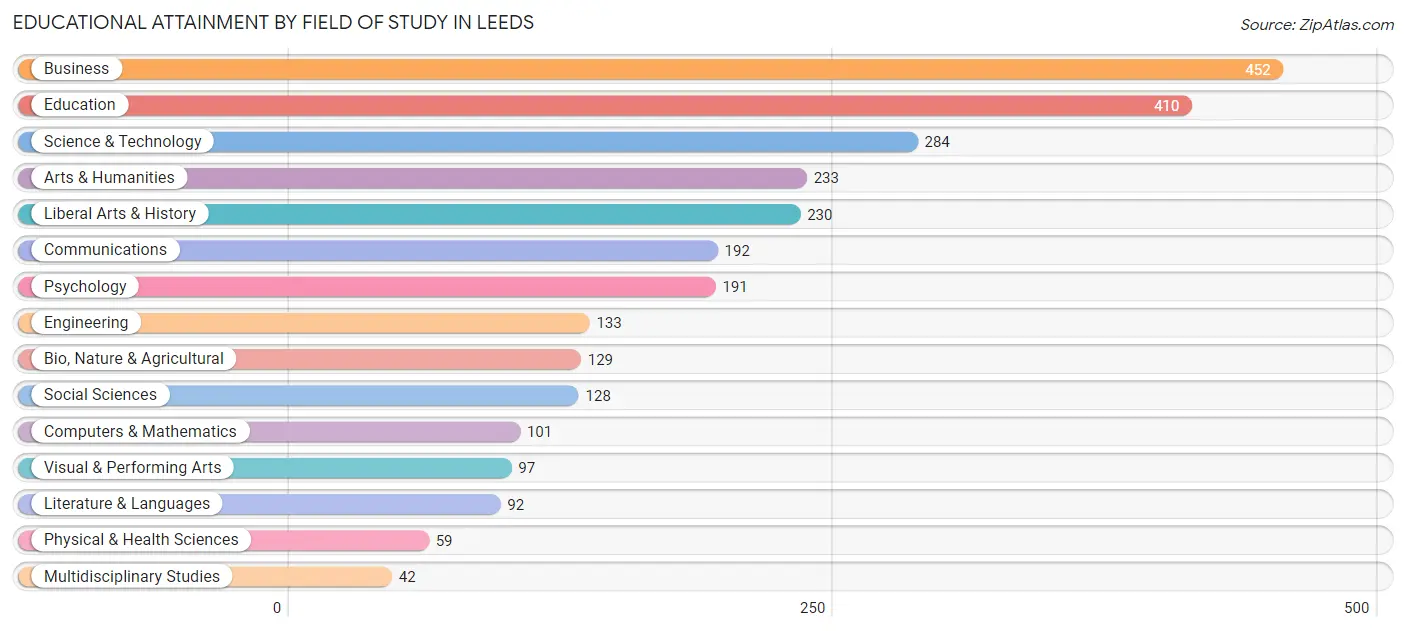
| Field of Study | # Graduates | % Graduates |
| Computers & Mathematics | 101 | 3.6% |
| Bio, Nature & Agricultural | 129 | 4.6% |
| Physical & Health Sciences | 59 | 2.1% |
| Psychology | 191 | 6.9% |
| Social Sciences | 128 | 4.6% |
| Engineering | 133 | 4.8% |
| Multidisciplinary Studies | 42 | 1.5% |
| Science & Technology | 284 | 10.2% |
| Business | 452 | 16.3% |
| Education | 410 | 14.8% |
| Literature & Languages | 92 | 3.3% |
| Liberal Arts & History | 230 | 8.3% |
| Visual & Performing Arts | 97 | 3.5% |
| Communications | 192 | 6.9% |
| Arts & Humanities | 233 | 8.4% |
| Total | 2,773 | 100.0% |
Transportation & Commute in Leeds
Vehicle Availability by Sex in Leeds
The most prevalent vehicle ownership categories in Leeds are males with 2 vehicles (1,316, accounting for 37.4%) and females with 2 vehicles (1,311, making up 49.2%).
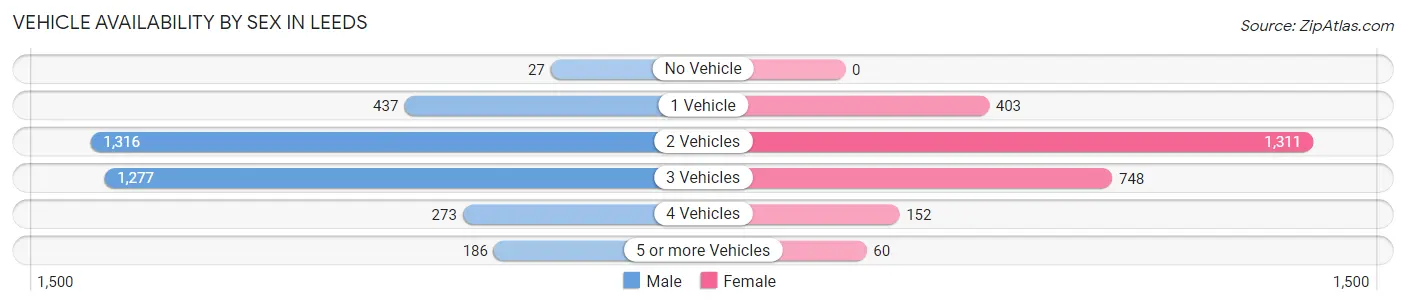
| Vehicles Available | Male | Female |
| No Vehicle | 27 (0.8%) | 0 (0.0%) |
| 1 Vehicle | 437 (12.4%) | 403 (15.1%) |
| 2 Vehicles | 1,316 (37.4%) | 1,311 (49.0%) |
| 3 Vehicles | 1,277 (36.3%) | 748 (28.0%) |
| 4 Vehicles | 273 (7.8%) | 152 (5.7%) |
| 5 or more Vehicles | 186 (5.3%) | 60 (2.2%) |
| Total | 3,516 (100.0%) | 2,674 (100.0%) |
Commute Time in Leeds
The most frequently occuring commute durations in Leeds are 30 to 34 minutes (1,171 commuters, 20.1%), 10 to 14 minutes (823 commuters, 14.1%), and 20 to 24 minutes (781 commuters, 13.4%).
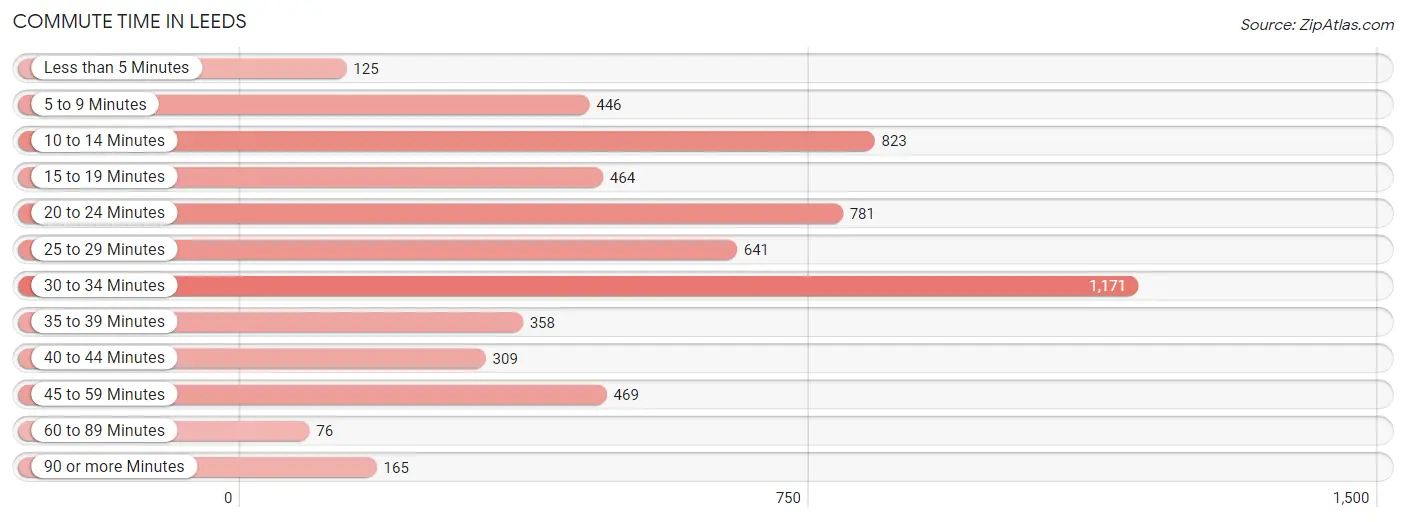
| Commute Time | # Commuters | % Commuters |
| Less than 5 Minutes | 125 | 2.1% |
| 5 to 9 Minutes | 446 | 7.6% |
| 10 to 14 Minutes | 823 | 14.1% |
| 15 to 19 Minutes | 464 | 8.0% |
| 20 to 24 Minutes | 781 | 13.4% |
| 25 to 29 Minutes | 641 | 11.0% |
| 30 to 34 Minutes | 1,171 | 20.1% |
| 35 to 39 Minutes | 358 | 6.1% |
| 40 to 44 Minutes | 309 | 5.3% |
| 45 to 59 Minutes | 469 | 8.1% |
| 60 to 89 Minutes | 76 | 1.3% |
| 90 or more Minutes | 165 | 2.8% |
Commute Time by Sex in Leeds
The most common commute times in Leeds are 30 to 34 minutes (759 commuters, 22.9%) for males and 25 to 29 minutes (416 commuters, 16.6%) for females.
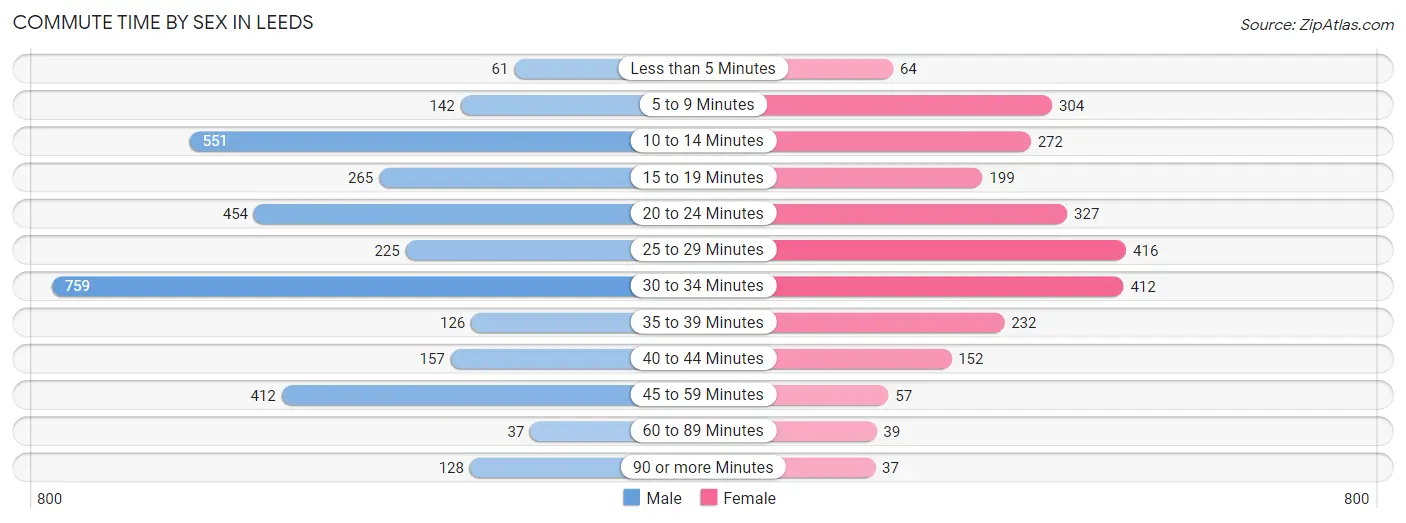
| Commute Time | Male | Female |
| Less than 5 Minutes | 61 (1.8%) | 64 (2.5%) |
| 5 to 9 Minutes | 142 (4.3%) | 304 (12.1%) |
| 10 to 14 Minutes | 551 (16.6%) | 272 (10.8%) |
| 15 to 19 Minutes | 265 (8.0%) | 199 (7.9%) |
| 20 to 24 Minutes | 454 (13.7%) | 327 (13.0%) |
| 25 to 29 Minutes | 225 (6.8%) | 416 (16.6%) |
| 30 to 34 Minutes | 759 (22.9%) | 412 (16.4%) |
| 35 to 39 Minutes | 126 (3.8%) | 232 (9.2%) |
| 40 to 44 Minutes | 157 (4.7%) | 152 (6.0%) |
| 45 to 59 Minutes | 412 (12.4%) | 57 (2.3%) |
| 60 to 89 Minutes | 37 (1.1%) | 39 (1.5%) |
| 90 or more Minutes | 128 (3.9%) | 37 (1.5%) |
Time of Departure to Work by Sex in Leeds
The most frequent times of departure to work in Leeds are 7:30 AM to 7:59 AM (747, 22.5%) for males and 6:30 AM to 6:59 AM (426, 17.0%) for females.
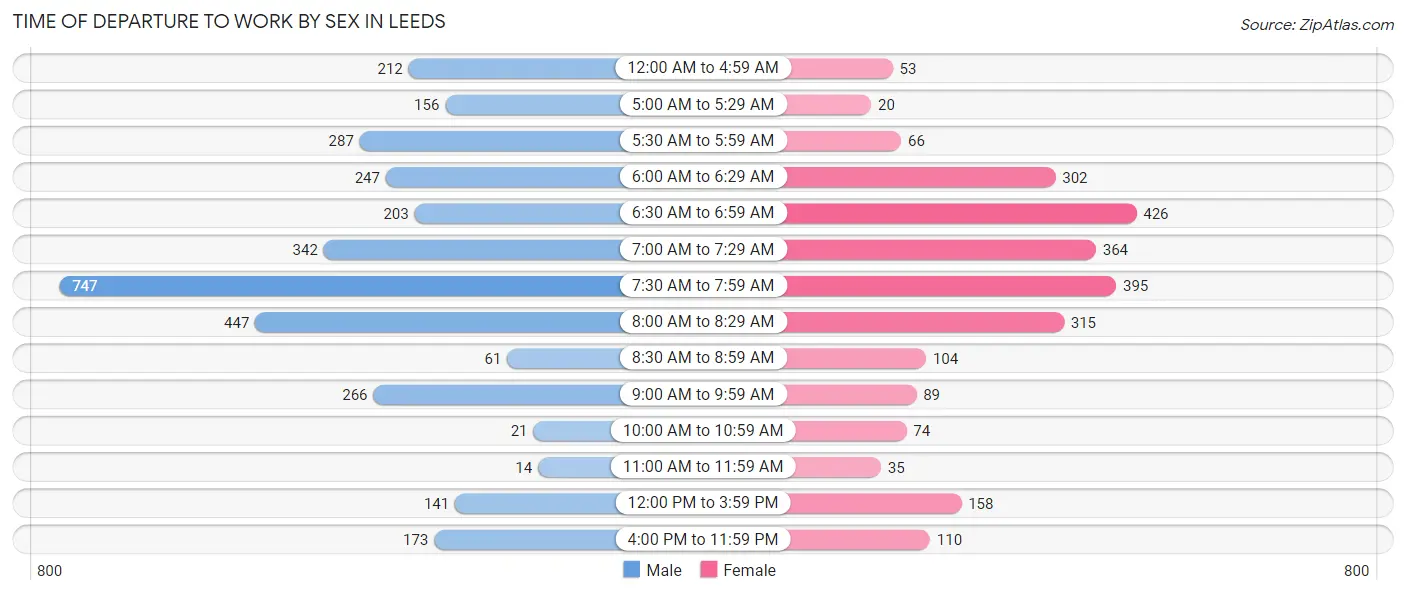
| Time of Departure | Male | Female |
| 12:00 AM to 4:59 AM | 212 (6.4%) | 53 (2.1%) |
| 5:00 AM to 5:29 AM | 156 (4.7%) | 20 (0.8%) |
| 5:30 AM to 5:59 AM | 287 (8.6%) | 66 (2.6%) |
| 6:00 AM to 6:29 AM | 247 (7.4%) | 302 (12.0%) |
| 6:30 AM to 6:59 AM | 203 (6.1%) | 426 (17.0%) |
| 7:00 AM to 7:29 AM | 342 (10.3%) | 364 (14.5%) |
| 7:30 AM to 7:59 AM | 747 (22.5%) | 395 (15.7%) |
| 8:00 AM to 8:29 AM | 447 (13.5%) | 315 (12.5%) |
| 8:30 AM to 8:59 AM | 61 (1.8%) | 104 (4.1%) |
| 9:00 AM to 9:59 AM | 266 (8.0%) | 89 (3.5%) |
| 10:00 AM to 10:59 AM | 21 (0.6%) | 74 (2.9%) |
| 11:00 AM to 11:59 AM | 14 (0.4%) | 35 (1.4%) |
| 12:00 PM to 3:59 PM | 141 (4.3%) | 158 (6.3%) |
| 4:00 PM to 11:59 PM | 173 (5.2%) | 110 (4.4%) |
| Total | 3,317 (100.0%) | 2,511 (100.0%) |
Housing Occupancy in Leeds
Occupancy by Ownership in Leeds
Of the total 4,703 dwellings in Leeds, owner-occupied units account for 3,485 (74.1%), while renter-occupied units make up 1,218 (25.9%).
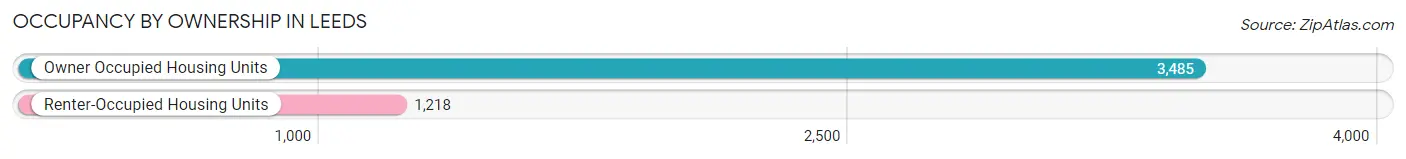
| Occupancy | # Housing Units | % Housing Units |
| Owner Occupied Housing Units | 3,485 | 74.1% |
| Renter-Occupied Housing Units | 1,218 | 25.9% |
| Total Occupied Housing Units | 4,703 | 100.0% |
Occupancy by Household Size in Leeds
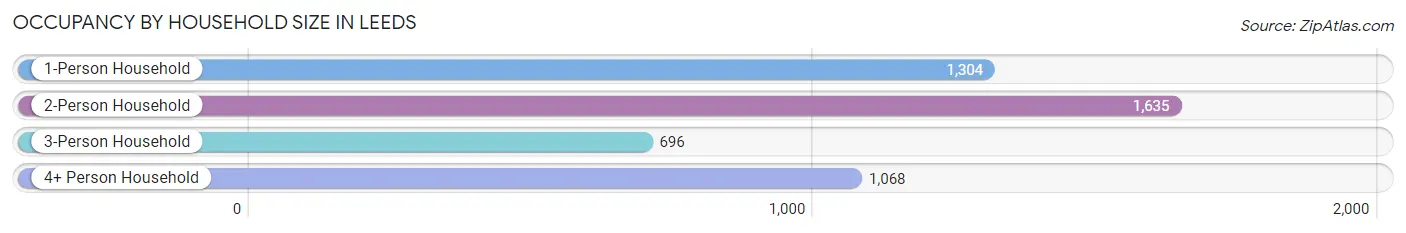
| Household Size | # Housing Units | % Housing Units |
| 1-Person Household | 1,304 | 27.7% |
| 2-Person Household | 1,635 | 34.8% |
| 3-Person Household | 696 | 14.8% |
| 4+ Person Household | 1,068 | 22.7% |
| Total Housing Units | 4,703 | 100.0% |
Occupancy by Ownership by Household Size in Leeds
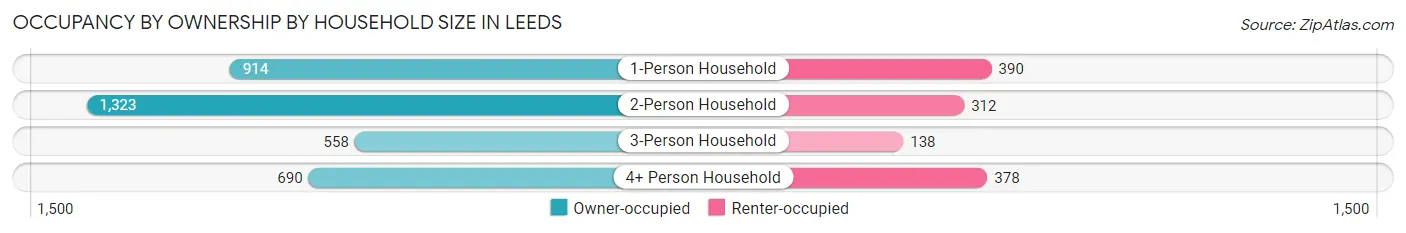
| Household Size | Owner-occupied | Renter-occupied |
| 1-Person Household | 914 (70.1%) | 390 (29.9%) |
| 2-Person Household | 1,323 (80.9%) | 312 (19.1%) |
| 3-Person Household | 558 (80.2%) | 138 (19.8%) |
| 4+ Person Household | 690 (64.6%) | 378 (35.4%) |
| Total Housing Units | 3,485 (74.1%) | 1,218 (25.9%) |
Occupancy by Educational Attainment in Leeds
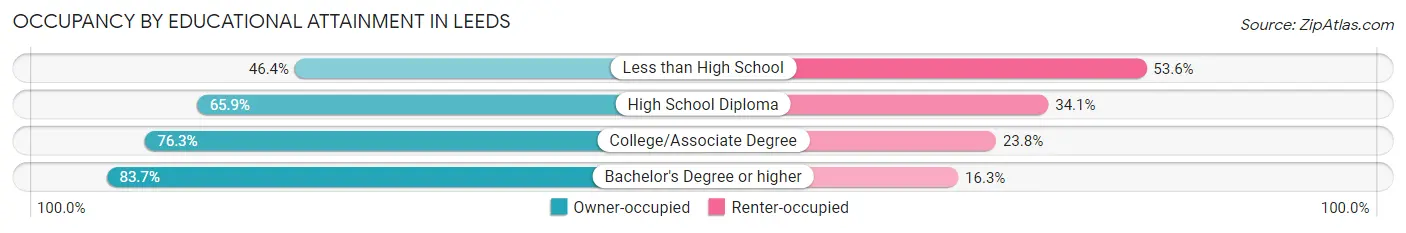
| Household Size | Owner-occupied | Renter-occupied |
| Less than High School | 188 (46.4%) | 217 (53.6%) |
| High School Diploma | 685 (65.9%) | 355 (34.1%) |
| College/Associate Degree | 1,185 (76.2%) | 369 (23.7%) |
| Bachelor's Degree or higher | 1,427 (83.7%) | 277 (16.3%) |
Occupancy by Age of Householder in Leeds
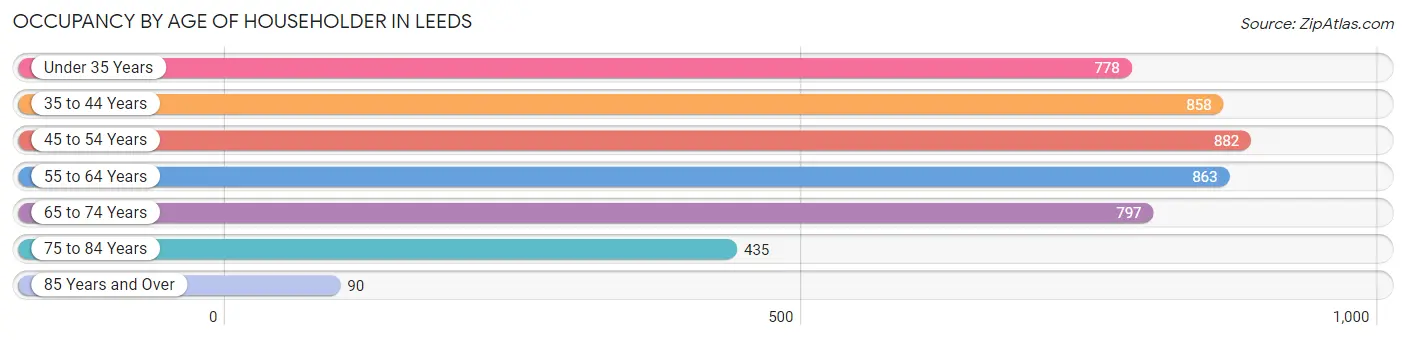
| Age Bracket | # Households | % Households |
| Under 35 Years | 778 | 16.5% |
| 35 to 44 Years | 858 | 18.2% |
| 45 to 54 Years | 882 | 18.8% |
| 55 to 64 Years | 863 | 18.3% |
| 65 to 74 Years | 797 | 17.0% |
| 75 to 84 Years | 435 | 9.2% |
| 85 Years and Over | 90 | 1.9% |
| Total | 4,703 | 100.0% |
Housing Finances in Leeds
Median Income by Occupancy in Leeds
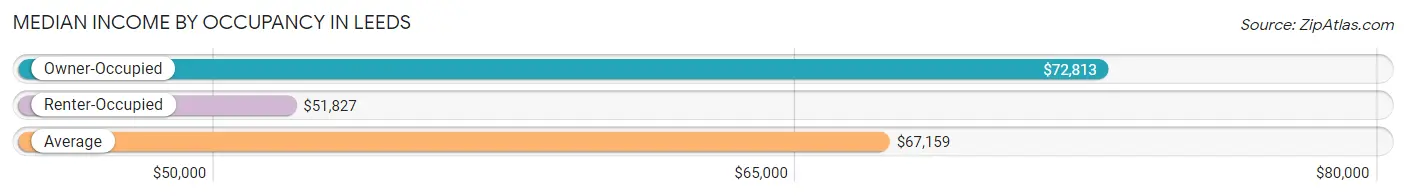
| Occupancy Type | # Households | Median Income |
| Owner-Occupied | 3,485 (74.1%) | $72,813 |
| Renter-Occupied | 1,218 (25.9%) | $51,827 |
| Average | 4,703 (100.0%) | $67,159 |
Occupancy by Householder Income Bracket in Leeds
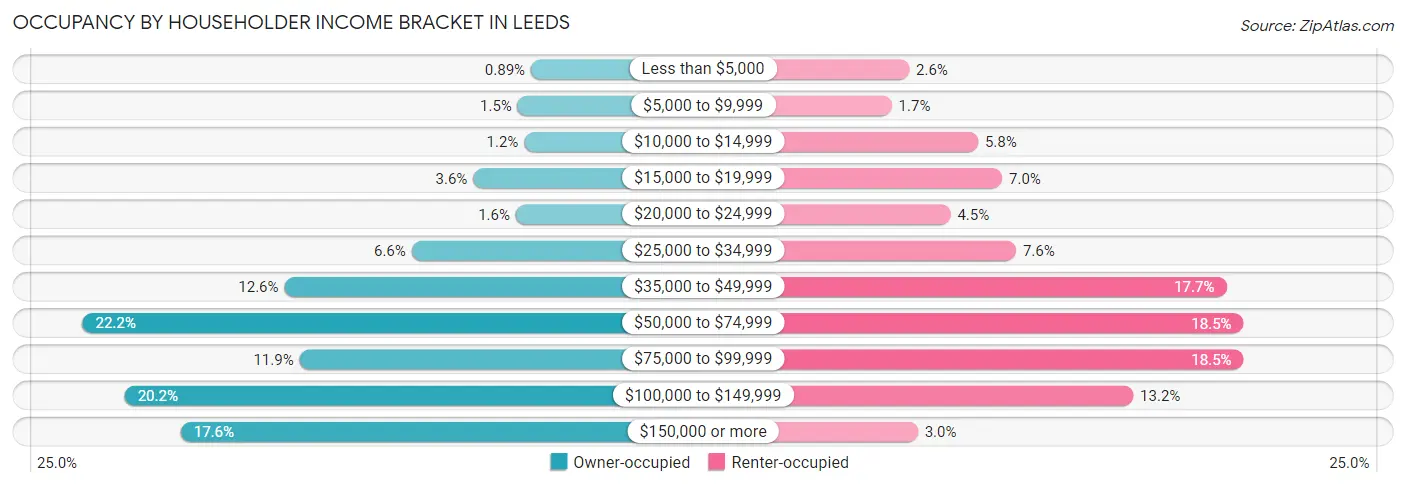
| Income Bracket | Owner-occupied | Renter-occupied |
| Less than $5,000 | 31 (0.9%) | 31 (2.5%) |
| $5,000 to $9,999 | 53 (1.5%) | 21 (1.7%) |
| $10,000 to $14,999 | 42 (1.2%) | 71 (5.8%) |
| $15,000 to $19,999 | 127 (3.6%) | 85 (7.0%) |
| $20,000 to $24,999 | 56 (1.6%) | 55 (4.5%) |
| $25,000 to $34,999 | 229 (6.6%) | 93 (7.6%) |
| $35,000 to $49,999 | 440 (12.6%) | 215 (17.6%) |
| $50,000 to $74,999 | 775 (22.2%) | 225 (18.5%) |
| $75,000 to $99,999 | 415 (11.9%) | 225 (18.5%) |
| $100,000 to $149,999 | 705 (20.2%) | 161 (13.2%) |
| $150,000 or more | 612 (17.6%) | 36 (3.0%) |
| Total | 3,485 (100.0%) | 1,218 (100.0%) |
Monthly Housing Cost Tiers in Leeds
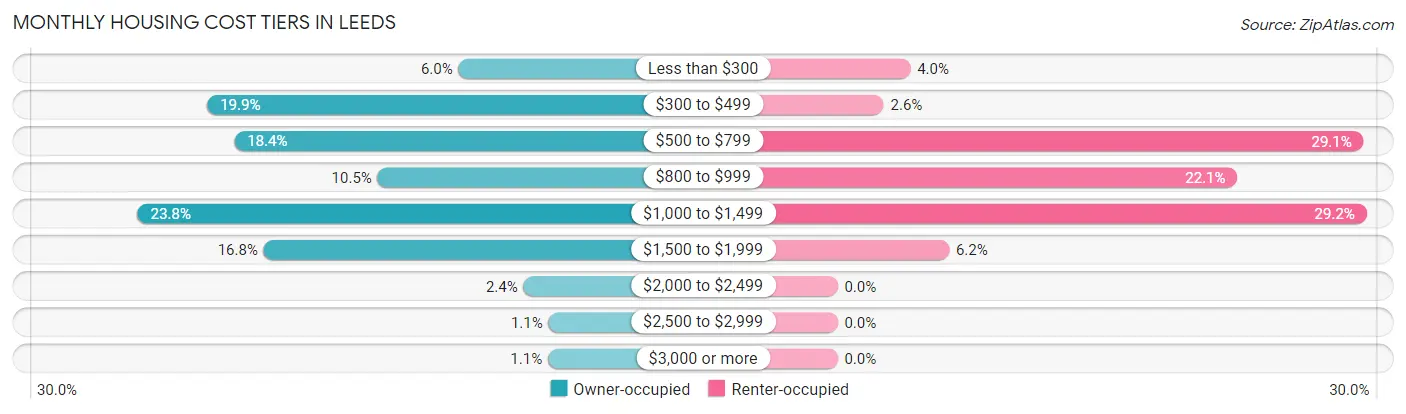
| Monthly Cost | Owner-occupied | Renter-occupied |
| Less than $300 | 210 (6.0%) | 49 (4.0%) |
| $300 to $499 | 694 (19.9%) | 31 (2.5%) |
| $500 to $799 | 642 (18.4%) | 354 (29.1%) |
| $800 to $999 | 366 (10.5%) | 269 (22.1%) |
| $1,000 to $1,499 | 828 (23.8%) | 356 (29.2%) |
| $1,500 to $1,999 | 585 (16.8%) | 75 (6.2%) |
| $2,000 to $2,499 | 85 (2.4%) | 0 (0.0%) |
| $2,500 to $2,999 | 37 (1.1%) | 0 (0.0%) |
| $3,000 or more | 38 (1.1%) | 0 (0.0%) |
| Total | 3,485 (100.0%) | 1,218 (100.0%) |
Physical Housing Characteristics in Leeds
Housing Structures in Leeds
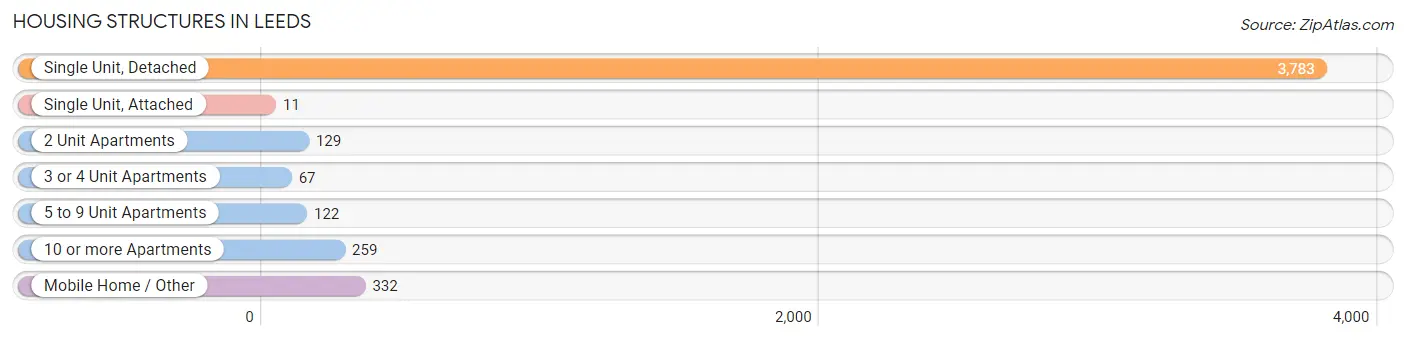
| Structure Type | # Housing Units | % Housing Units |
| Single Unit, Detached | 3,783 | 80.4% |
| Single Unit, Attached | 11 | 0.2% |
| 2 Unit Apartments | 129 | 2.7% |
| 3 or 4 Unit Apartments | 67 | 1.4% |
| 5 to 9 Unit Apartments | 122 | 2.6% |
| 10 or more Apartments | 259 | 5.5% |
| Mobile Home / Other | 332 | 7.1% |
| Total | 4,703 | 100.0% |
Housing Structures by Occupancy in Leeds
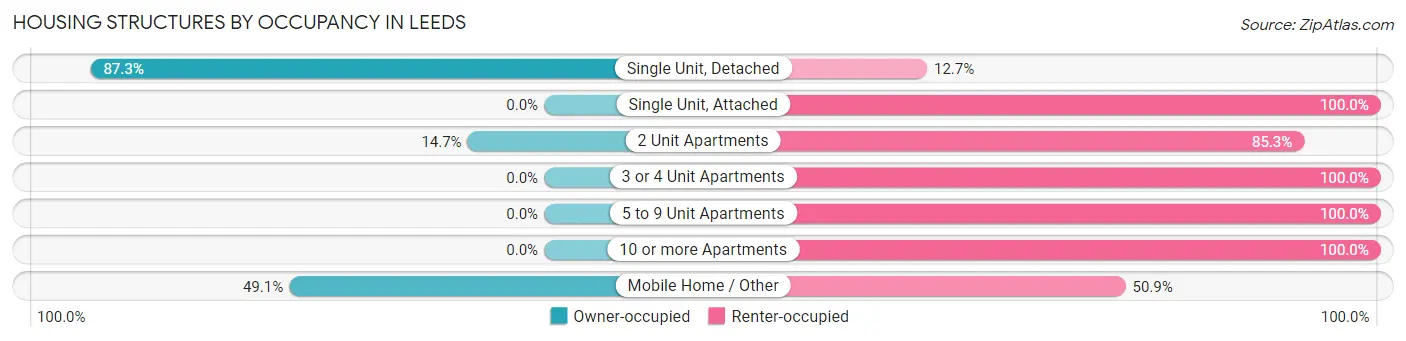
| Structure Type | Owner-occupied | Renter-occupied |
| Single Unit, Detached | 3,303 (87.3%) | 480 (12.7%) |
| Single Unit, Attached | 0 (0.0%) | 11 (100.0%) |
| 2 Unit Apartments | 19 (14.7%) | 110 (85.3%) |
| 3 or 4 Unit Apartments | 0 (0.0%) | 67 (100.0%) |
| 5 to 9 Unit Apartments | 0 (0.0%) | 122 (100.0%) |
| 10 or more Apartments | 0 (0.0%) | 259 (100.0%) |
| Mobile Home / Other | 163 (49.1%) | 169 (50.9%) |
| Total | 3,485 (74.1%) | 1,218 (25.9%) |
Housing Structures by Number of Rooms in Leeds
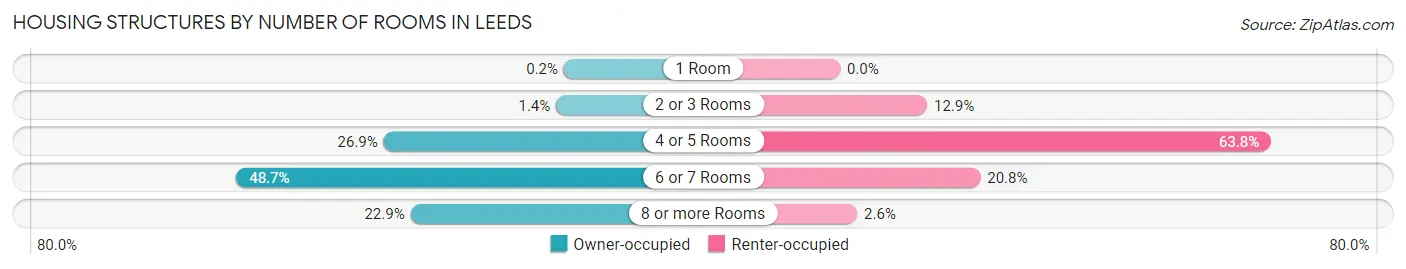
| Number of Rooms | Owner-occupied | Renter-occupied |
| 1 Room | 7 (0.2%) | 0 (0.0%) |
| 2 or 3 Rooms | 47 (1.3%) | 157 (12.9%) |
| 4 or 5 Rooms | 937 (26.9%) | 777 (63.8%) |
| 6 or 7 Rooms | 1,696 (48.7%) | 253 (20.8%) |
| 8 or more Rooms | 798 (22.9%) | 31 (2.5%) |
| Total | 3,485 (100.0%) | 1,218 (100.0%) |
Housing Structure by Heating Type in Leeds
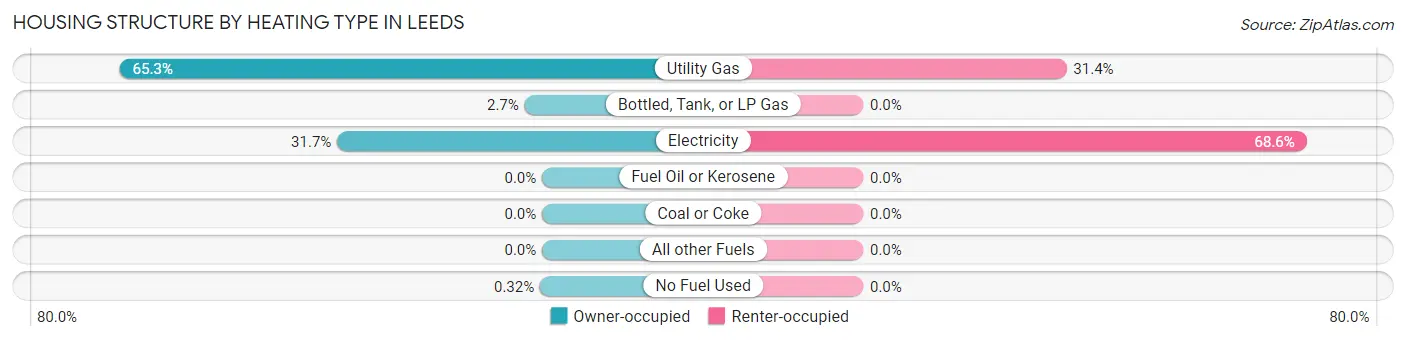
| Heating Type | Owner-occupied | Renter-occupied |
| Utility Gas | 2,276 (65.3%) | 383 (31.4%) |
| Bottled, Tank, or LP Gas | 94 (2.7%) | 0 (0.0%) |
| Electricity | 1,104 (31.7%) | 835 (68.6%) |
| Fuel Oil or Kerosene | 0 (0.0%) | 0 (0.0%) |
| Coal or Coke | 0 (0.0%) | 0 (0.0%) |
| All other Fuels | 0 (0.0%) | 0 (0.0%) |
| No Fuel Used | 11 (0.3%) | 0 (0.0%) |
| Total | 3,485 (100.0%) | 1,218 (100.0%) |
Household Vehicle Usage in Leeds
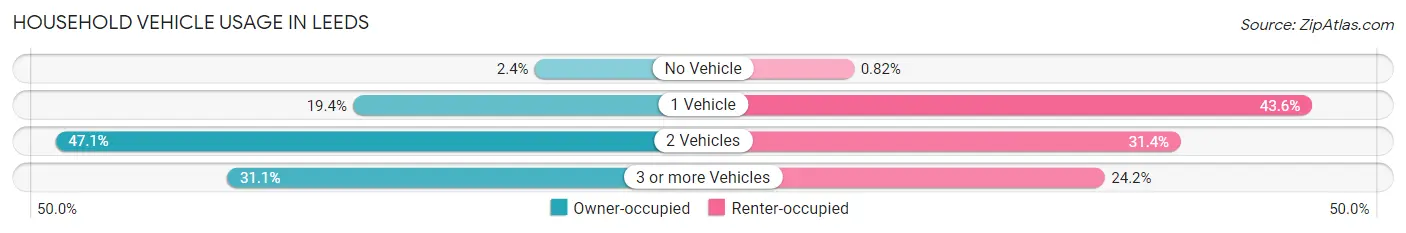
| Vehicles per Household | Owner-occupied | Renter-occupied |
| No Vehicle | 84 (2.4%) | 10 (0.8%) |
| 1 Vehicle | 675 (19.4%) | 531 (43.6%) |
| 2 Vehicles | 1,642 (47.1%) | 382 (31.4%) |
| 3 or more Vehicles | 1,084 (31.1%) | 295 (24.2%) |
| Total | 3,485 (100.0%) | 1,218 (100.0%) |
Real Estate & Mortgages in Leeds
Real Estate and Mortgage Overview in Leeds
| Characteristic | Without Mortgage | With Mortgage |
| Housing Units | 1,505 | 1,980 |
| Median Property Value | $182,100 | $207,900 |
| Median Household Income | $63,179 | $347 |
| Monthly Housing Costs | $470 | $38 |
| Real Estate Taxes | $824 | $121 |
Property Value by Mortgage Status in Leeds
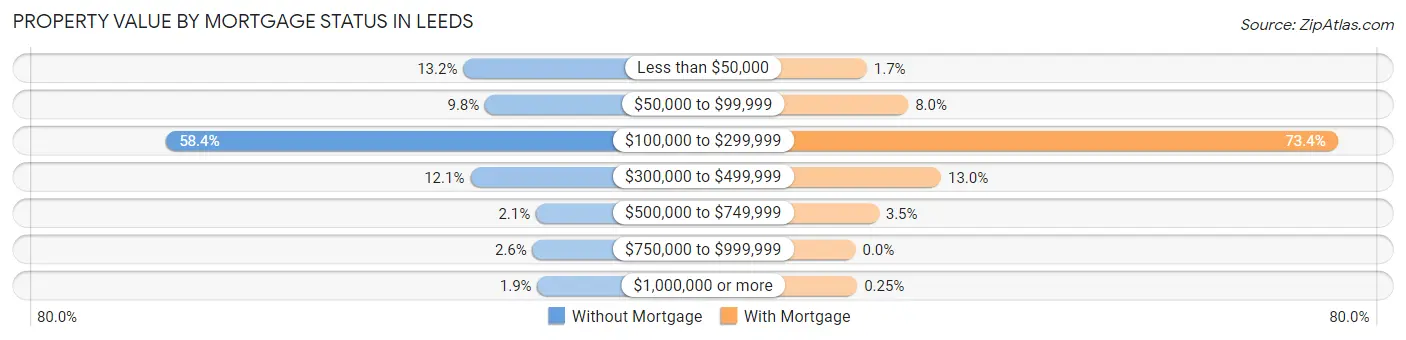
| Property Value | Without Mortgage | With Mortgage |
| Less than $50,000 | 198 (13.2%) | 34 (1.7%) |
| $50,000 to $99,999 | 148 (9.8%) | 159 (8.0%) |
| $100,000 to $299,999 | 879 (58.4%) | 1,454 (73.4%) |
| $300,000 to $499,999 | 182 (12.1%) | 258 (13.0%) |
| $500,000 to $749,999 | 31 (2.1%) | 70 (3.5%) |
| $750,000 to $999,999 | 39 (2.6%) | 0 (0.0%) |
| $1,000,000 or more | 28 (1.9%) | 5 (0.3%) |
| Total | 1,505 (100.0%) | 1,980 (100.0%) |
Household Income by Mortgage Status in Leeds
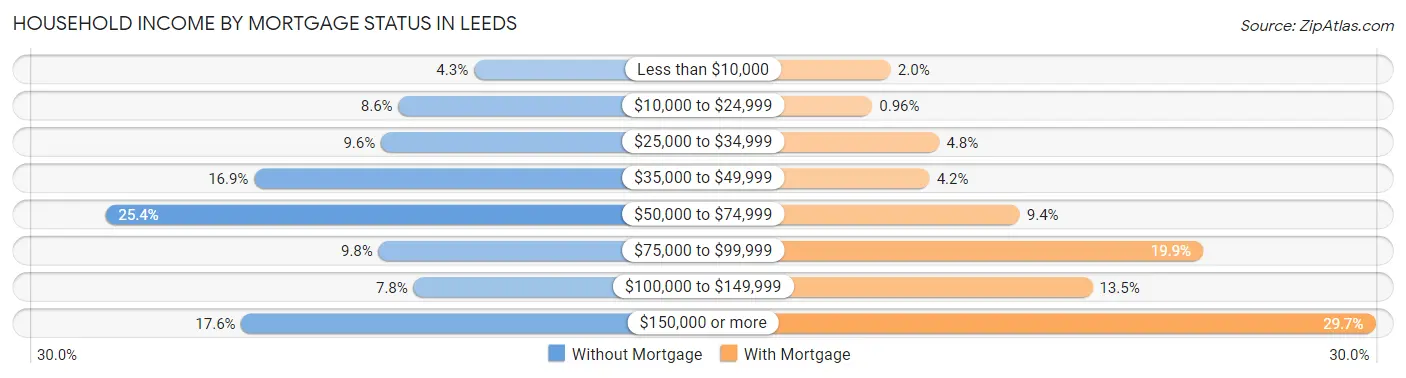
| Household Income | Without Mortgage | With Mortgage |
| Less than $10,000 | 65 (4.3%) | 40 (2.0%) |
| $10,000 to $24,999 | 130 (8.6%) | 19 (1.0%) |
| $25,000 to $34,999 | 145 (9.6%) | 95 (4.8%) |
| $35,000 to $49,999 | 254 (16.9%) | 84 (4.2%) |
| $50,000 to $74,999 | 382 (25.4%) | 186 (9.4%) |
| $75,000 to $99,999 | 147 (9.8%) | 393 (19.9%) |
| $100,000 to $149,999 | 117 (7.8%) | 268 (13.5%) |
| $150,000 or more | 265 (17.6%) | 588 (29.7%) |
| Total | 1,505 (100.0%) | 1,980 (100.0%) |
Property Value to Household Income Ratio in Leeds
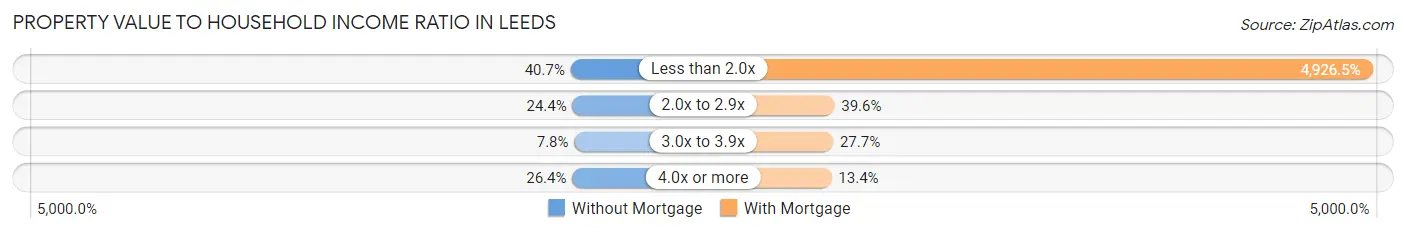
| Value-to-Income Ratio | Without Mortgage | With Mortgage |
| Less than 2.0x | 612 (40.7%) | 97,545 (4,926.5%) |
| 2.0x to 2.9x | 367 (24.4%) | 784 (39.6%) |
| 3.0x to 3.9x | 118 (7.8%) | 549 (27.7%) |
| 4.0x or more | 397 (26.4%) | 265 (13.4%) |
| Total | 1,505 (100.0%) | 1,980 (100.0%) |
Real Estate Taxes by Mortgage Status in Leeds
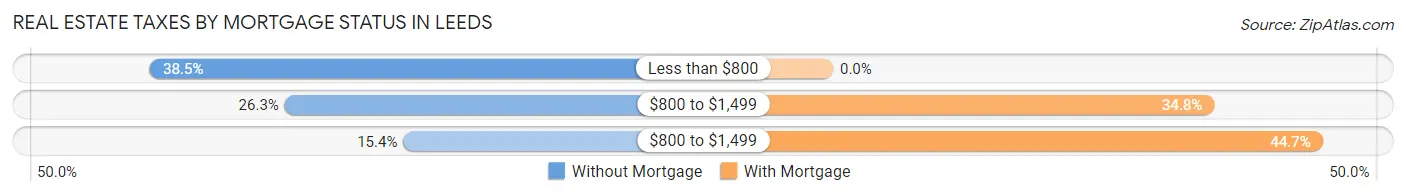
| Property Taxes | Without Mortgage | With Mortgage |
| Less than $800 | 580 (38.5%) | 0 (0.0%) |
| $800 to $1,499 | 395 (26.3%) | 689 (34.8%) |
| $800 to $1,499 | 232 (15.4%) | 885 (44.7%) |
| Total | 1,505 (100.0%) | 1,980 (100.0%) |
Health & Disability in Leeds
Health Insurance Coverage by Age in Leeds
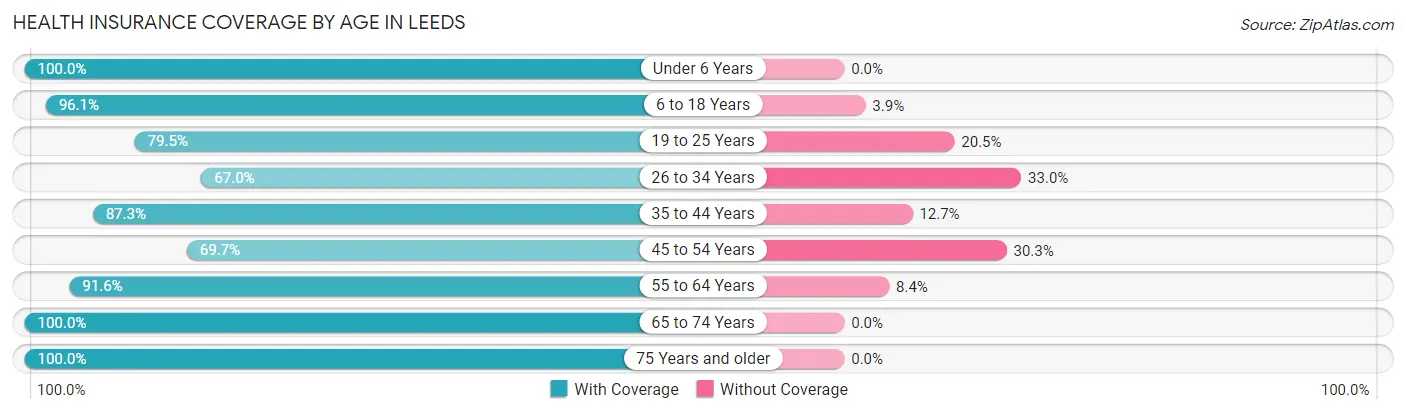
| Age Bracket | With Coverage | Without Coverage |
| Under 6 Years | 809 (100.0%) | 0 (0.0%) |
| 6 to 18 Years | 2,147 (96.1%) | 88 (3.9%) |
| 19 to 25 Years | 507 (79.5%) | 131 (20.5%) |
| 26 to 34 Years | 1,000 (67.0%) | 492 (33.0%) |
| 35 to 44 Years | 1,483 (87.3%) | 216 (12.7%) |
| 45 to 54 Years | 1,159 (69.7%) | 503 (30.3%) |
| 55 to 64 Years | 1,502 (91.6%) | 137 (8.4%) |
| 65 to 74 Years | 1,326 (100.0%) | 0 (0.0%) |
| 75 Years and older | 792 (100.0%) | 0 (0.0%) |
| Total | 10,725 (87.3%) | 1,567 (12.8%) |
Health Insurance Coverage by Citizenship Status in Leeds
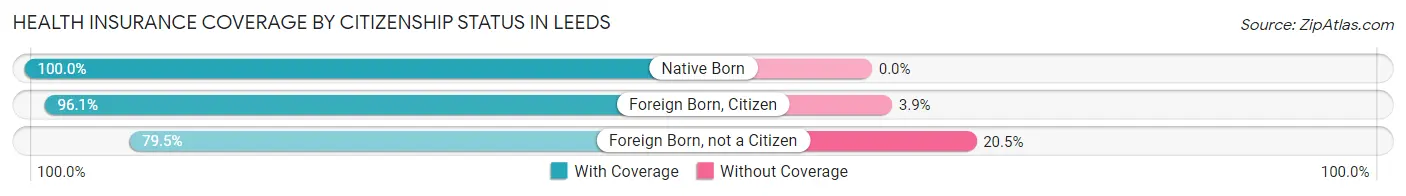
| Citizenship Status | With Coverage | Without Coverage |
| Native Born | 809 (100.0%) | 0 (0.0%) |
| Foreign Born, Citizen | 2,147 (96.1%) | 88 (3.9%) |
| Foreign Born, not a Citizen | 507 (79.5%) | 131 (20.5%) |
Health Insurance Coverage by Household Income in Leeds
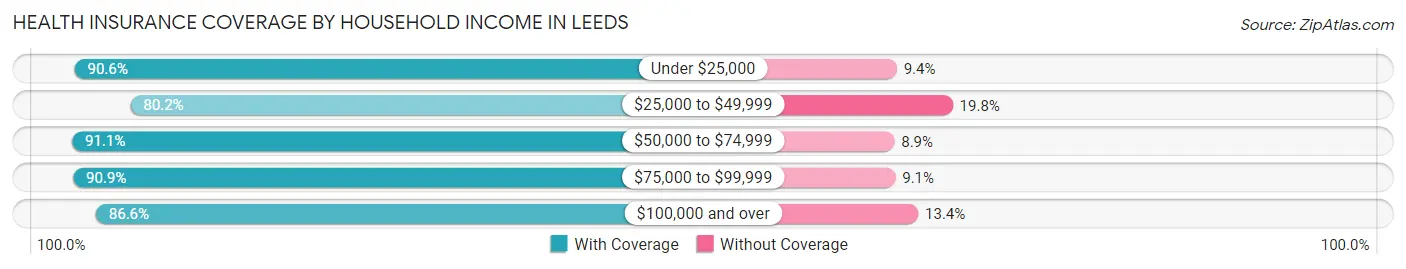
| Household Income | With Coverage | Without Coverage |
| Under $25,000 | 775 (90.6%) | 80 (9.4%) |
| $25,000 to $49,999 | 1,759 (80.2%) | 435 (19.8%) |
| $50,000 to $74,999 | 2,293 (91.1%) | 224 (8.9%) |
| $75,000 to $99,999 | 1,502 (90.9%) | 150 (9.1%) |
| $100,000 and over | 4,396 (86.6%) | 678 (13.4%) |
Public vs Private Health Insurance Coverage by Age in Leeds
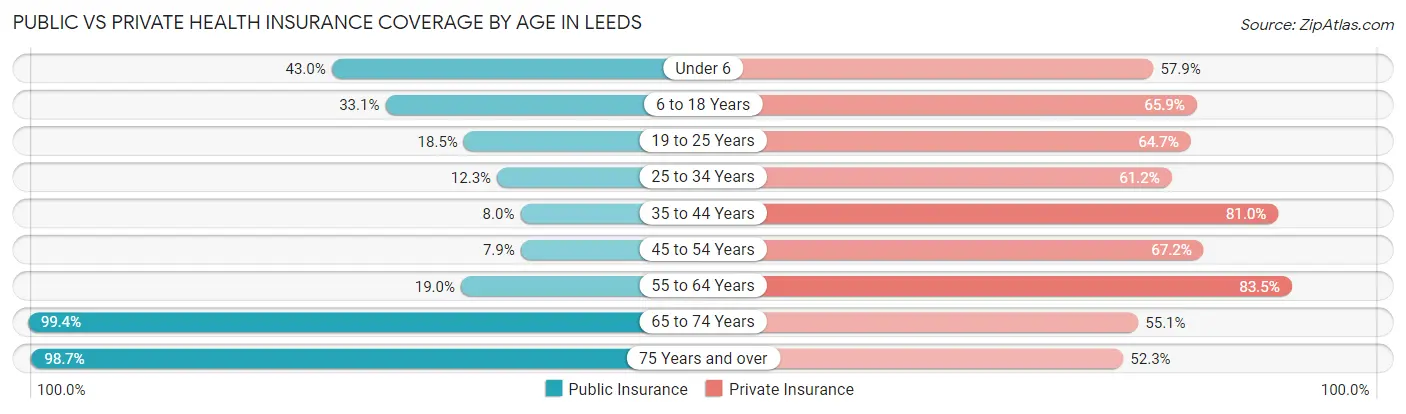
| Age Bracket | Public Insurance | Private Insurance |
| Under 6 | 348 (43.0%) | 468 (57.9%) |
| 6 to 18 Years | 739 (33.1%) | 1,472 (65.9%) |
| 19 to 25 Years | 118 (18.5%) | 413 (64.7%) |
| 25 to 34 Years | 184 (12.3%) | 913 (61.2%) |
| 35 to 44 Years | 136 (8.0%) | 1,376 (81.0%) |
| 45 to 54 Years | 132 (7.9%) | 1,116 (67.1%) |
| 55 to 64 Years | 312 (19.0%) | 1,368 (83.5%) |
| 65 to 74 Years | 1,318 (99.4%) | 730 (55.0%) |
| 75 Years and over | 782 (98.7%) | 414 (52.3%) |
| Total | 4,069 (33.1%) | 8,270 (67.3%) |
Disability Status by Sex by Age in Leeds
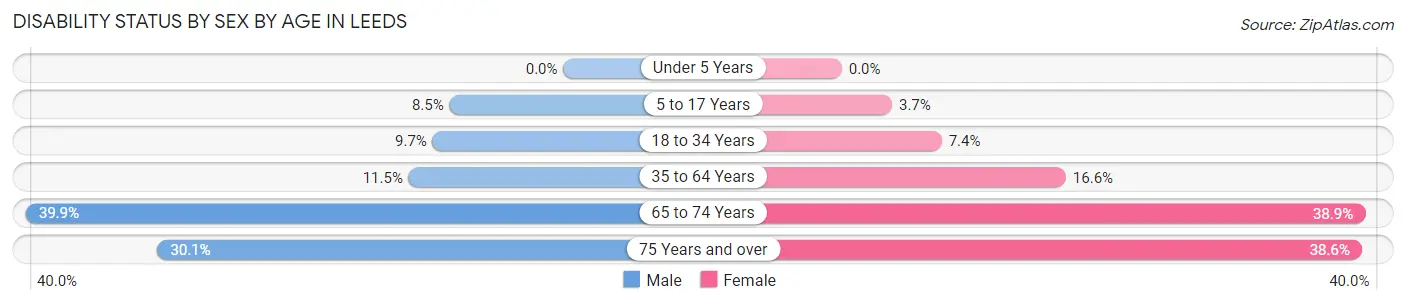
| Age Bracket | Male | Female |
| Under 5 Years | 0 (0.0%) | 0 (0.0%) |
| 5 to 17 Years | 118 (8.5%) | 35 (3.7%) |
| 18 to 34 Years | 104 (9.7%) | 87 (7.4%) |
| 35 to 64 Years | 316 (11.5%) | 374 (16.6%) |
| 65 to 74 Years | 259 (39.9%) | 263 (38.9%) |
| 75 Years and over | 88 (30.1%) | 193 (38.6%) |
Disability Class by Sex by Age in Leeds
Disability Class: Hearing Difficulty
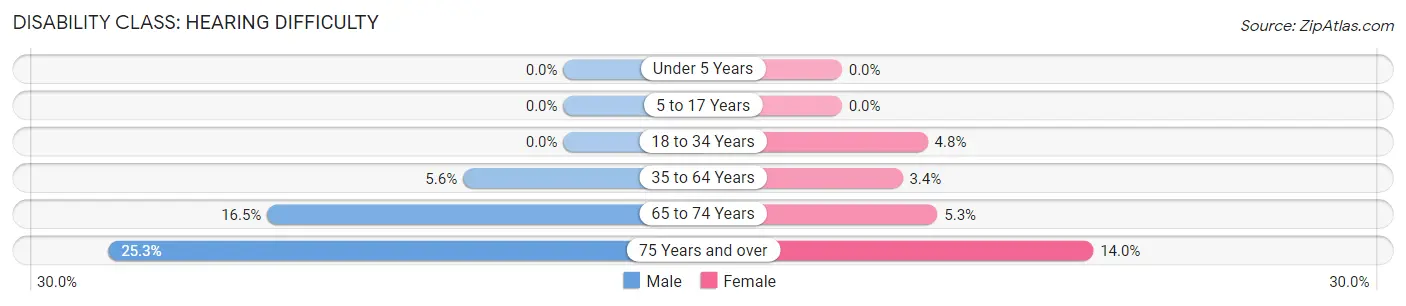
| Age Bracket | Male | Female |
| Under 5 Years | 0 (0.0%) | 0 (0.0%) |
| 5 to 17 Years | 0 (0.0%) | 0 (0.0%) |
| 18 to 34 Years | 0 (0.0%) | 56 (4.8%) |
| 35 to 64 Years | 154 (5.6%) | 76 (3.4%) |
| 65 to 74 Years | 107 (16.5%) | 36 (5.3%) |
| 75 Years and over | 74 (25.3%) | 70 (14.0%) |
Disability Class: Vision Difficulty
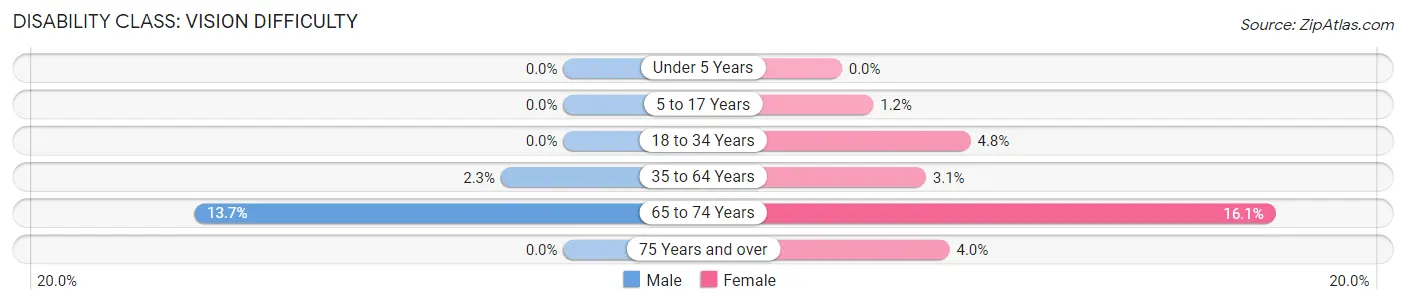
| Age Bracket | Male | Female |
| Under 5 Years | 0 (0.0%) | 0 (0.0%) |
| 5 to 17 Years | 0 (0.0%) | 11 (1.2%) |
| 18 to 34 Years | 0 (0.0%) | 56 (4.8%) |
| 35 to 64 Years | 64 (2.3%) | 70 (3.1%) |
| 65 to 74 Years | 89 (13.7%) | 109 (16.1%) |
| 75 Years and over | 0 (0.0%) | 20 (4.0%) |
Disability Class: Cognitive Difficulty
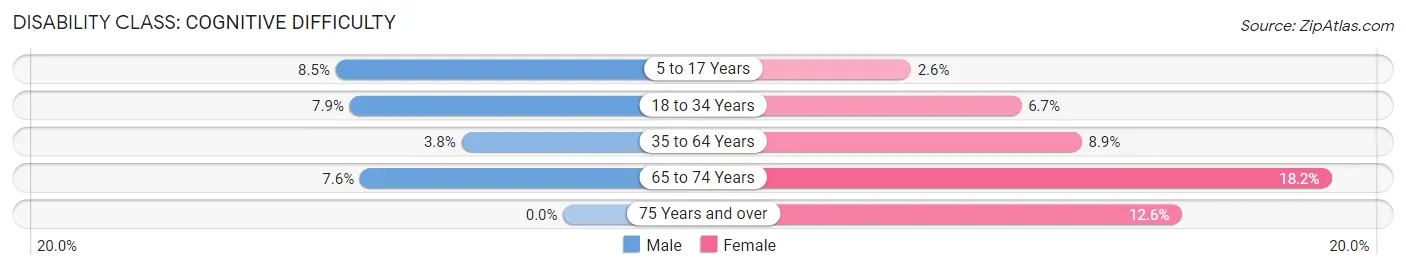
| Age Bracket | Male | Female |
| 5 to 17 Years | 118 (8.5%) | 24 (2.6%) |
| 18 to 34 Years | 85 (7.9%) | 78 (6.7%) |
| 35 to 64 Years | 104 (3.8%) | 200 (8.9%) |
| 65 to 74 Years | 49 (7.5%) | 123 (18.2%) |
| 75 Years and over | 0 (0.0%) | 63 (12.6%) |
Disability Class: Ambulatory Difficulty
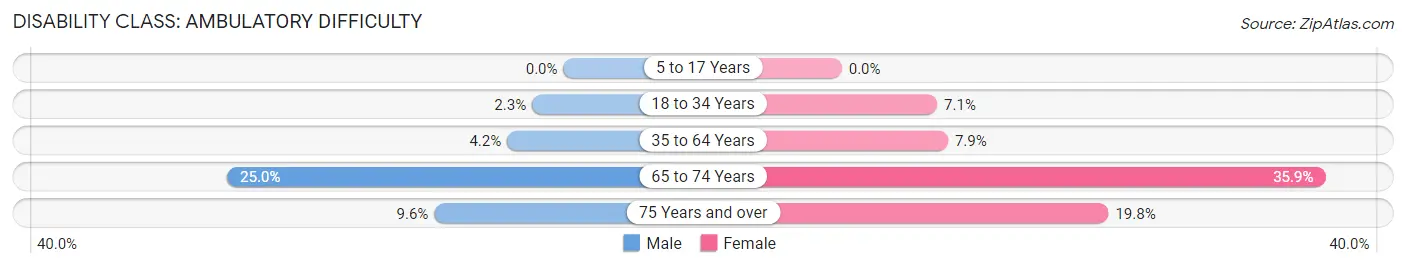
| Age Bracket | Male | Female |
| 5 to 17 Years | 0 (0.0%) | 0 (0.0%) |
| 18 to 34 Years | 25 (2.3%) | 83 (7.1%) |
| 35 to 64 Years | 115 (4.2%) | 177 (7.9%) |
| 65 to 74 Years | 162 (25.0%) | 243 (35.9%) |
| 75 Years and over | 28 (9.6%) | 99 (19.8%) |
Disability Class: Self-Care Difficulty
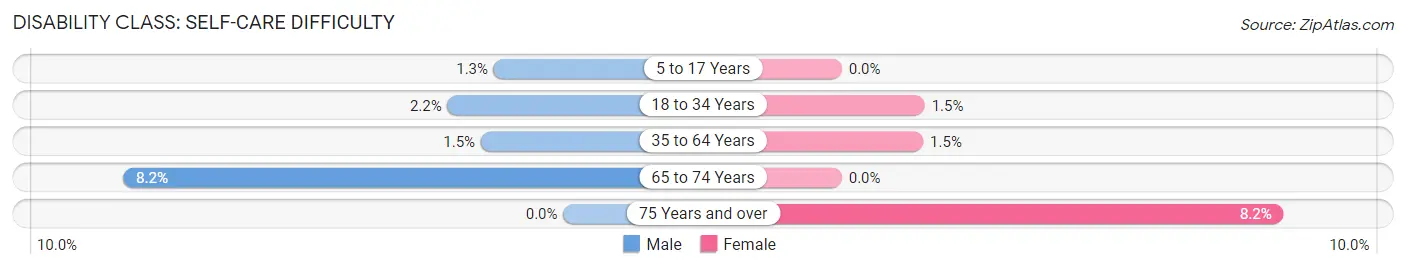
| Age Bracket | Male | Female |
| 5 to 17 Years | 18 (1.3%) | 0 (0.0%) |
| 18 to 34 Years | 23 (2.1%) | 18 (1.5%) |
| 35 to 64 Years | 42 (1.5%) | 34 (1.5%) |
| 65 to 74 Years | 53 (8.2%) | 0 (0.0%) |
| 75 Years and over | 0 (0.0%) | 41 (8.2%) |
Technology Access in Leeds
Computing Device Access in Leeds
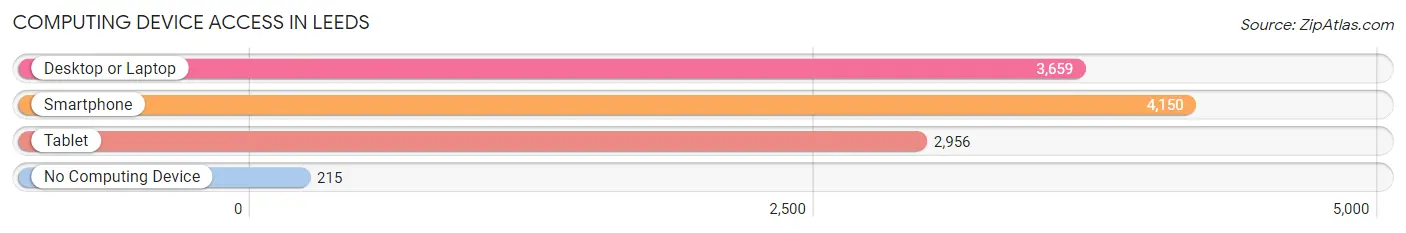
| Device Type | # Households | % Households |
| Desktop or Laptop | 3,659 | 77.8% |
| Smartphone | 4,150 | 88.2% |
| Tablet | 2,956 | 62.8% |
| No Computing Device | 215 | 4.6% |
| Total | 4,703 | 100.0% |
Internet Access in Leeds
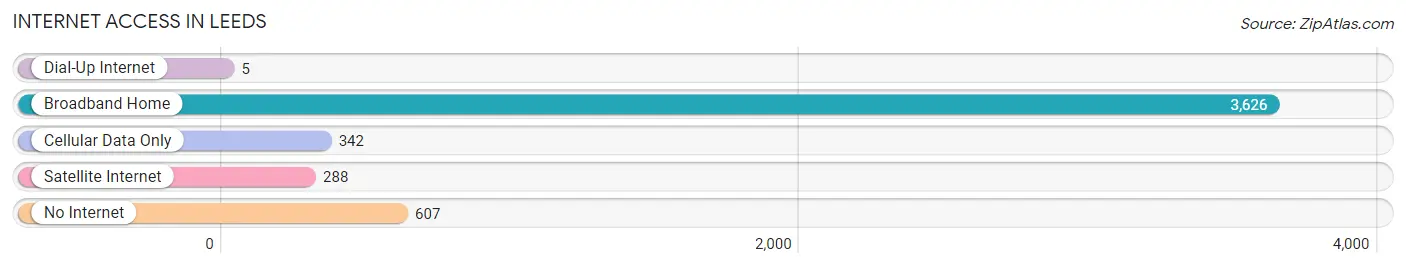
| Internet Type | # Households | % Households |
| Dial-Up Internet | 5 | 0.1% |
| Broadband Home | 3,626 | 77.1% |
| Cellular Data Only | 342 | 7.3% |
| Satellite Internet | 288 | 6.1% |
| No Internet | 607 | 12.9% |
| Total | 4,703 | 100.0% |
Leeds Summary
Leeds is a city located in Jefferson County, Alabama, United States. It is situated in the north-central part of the state, approximately 15 miles east of Birmingham. The city is part of the Birmingham-Hoover Metropolitan Statistical Area. As of the 2010 census, the population of Leeds was 11,773.
History
Leeds was founded in 1877 by railroad workers who were constructing a line from Birmingham to Atlanta. The city was named after Leeds, England, and was incorporated in 1887. The city was initially a farming community, but it soon developed into a manufacturing center. The city was home to several cotton mills, a brick factory, and a furniture factory.
In the early 20th century, Leeds experienced a period of growth and prosperity. The city was home to several banks, a movie theater, and a variety of stores. The city also had a thriving African-American community, with several churches, businesses, and a school.
In the 1950s, the city began to decline as the manufacturing industry moved away. The city was hit hard by the Great Recession of 2008, and the population has declined since then.
Geography
Leeds is located at 33°45'N 86°37'W. The city is situated in the foothills of the Appalachian Mountains, and is surrounded by rolling hills and forests. The city is located near the Cahaba River, and is approximately 15 miles east of Birmingham.
The climate in Leeds is humid subtropical, with hot, humid summers and mild winters. The average annual temperature is 64°F, and the average annual precipitation is 51 inches.
Economy
Leeds is a small city with a diverse economy. The city is home to several manufacturing companies, including a steel mill, a paper mill, and a furniture factory. The city is also home to several retail stores, restaurants, and other businesses.
The city is home to several educational institutions, including the University of Alabama at Birmingham, Jefferson State Community College, and the Leeds School of Business.
Demographics
As of the 2010 census, the population of Leeds was 11,773. The racial makeup of the city was 73.3% White, 22.2% African American, 0.3% Native American, 1.2% Asian, 0.1% Pacific Islander, 1.2% from other races, and 1.7% from two or more races. Hispanic or Latino of any race were 3.2% of the population.
The median income for a household in Leeds was $37,945, and the median income for a family was $45,945. The per capita income for the city was $19,945. About 16.2% of families and 19.2% of the population were below the poverty line, including 28.2% of those under age 18 and 11.2% of those age 65 or over.
Common Questions
What is Per Capita Income in Leeds?
Per Capita income in Leeds is $34,822.
What is the Median Family Income in Leeds?
Median Family Income in Leeds is $80,098.
What is the Median Household income in Leeds?
Median Household Income in Leeds is $67,159.
What is Income or Wage Gap in Leeds?
Income or Wage Gap in Leeds is 9.7%.
Women in Leeds earn 90.3 cents for every dollar earned by a man.
What is Family Income Deficit in Leeds?
Family Income Deficit in Leeds is $6,974.
Families that are below poverty line in Leeds earn $6,974 less on average than the poverty threshold level.
What is Inequality or Gini Index in Leeds?
Inequality or Gini Index in Leeds is 0.39.
What is the Total Population of Leeds?
Total Population of Leeds is 12,292.
What is the Total Male Population of Leeds?
Total Male Population of Leeds is 6,486.
What is the Total Female Population of Leeds?
Total Female Population of Leeds is 5,806.
What is the Ratio of Males per 100 Females in Leeds?
There are 111.71 Males per 100 Females in Leeds.
What is the Ratio of Females per 100 Males in Leeds?
There are 89.52 Females per 100 Males in Leeds.
What is the Median Population Age in Leeds?
Median Population Age in Leeds is 40.9 Years.
What is the Average Family Size in Leeds
Average Family Size in Leeds is 3.1 People.
What is the Average Household Size in Leeds
Average Household Size in Leeds is 2.6 People.
How Large is the Labor Force in Leeds?
There are 6,332 People in the Labor Forcein in Leeds.
What is the Percentage of People in the Labor Force in Leeds?
65.0% of People are in the Labor Force in Leeds.
What is the Unemployment Rate in Leeds?
Unemployment Rate in Leeds is 1.4%.