Hollis Crossroads, AL Map & Demographics
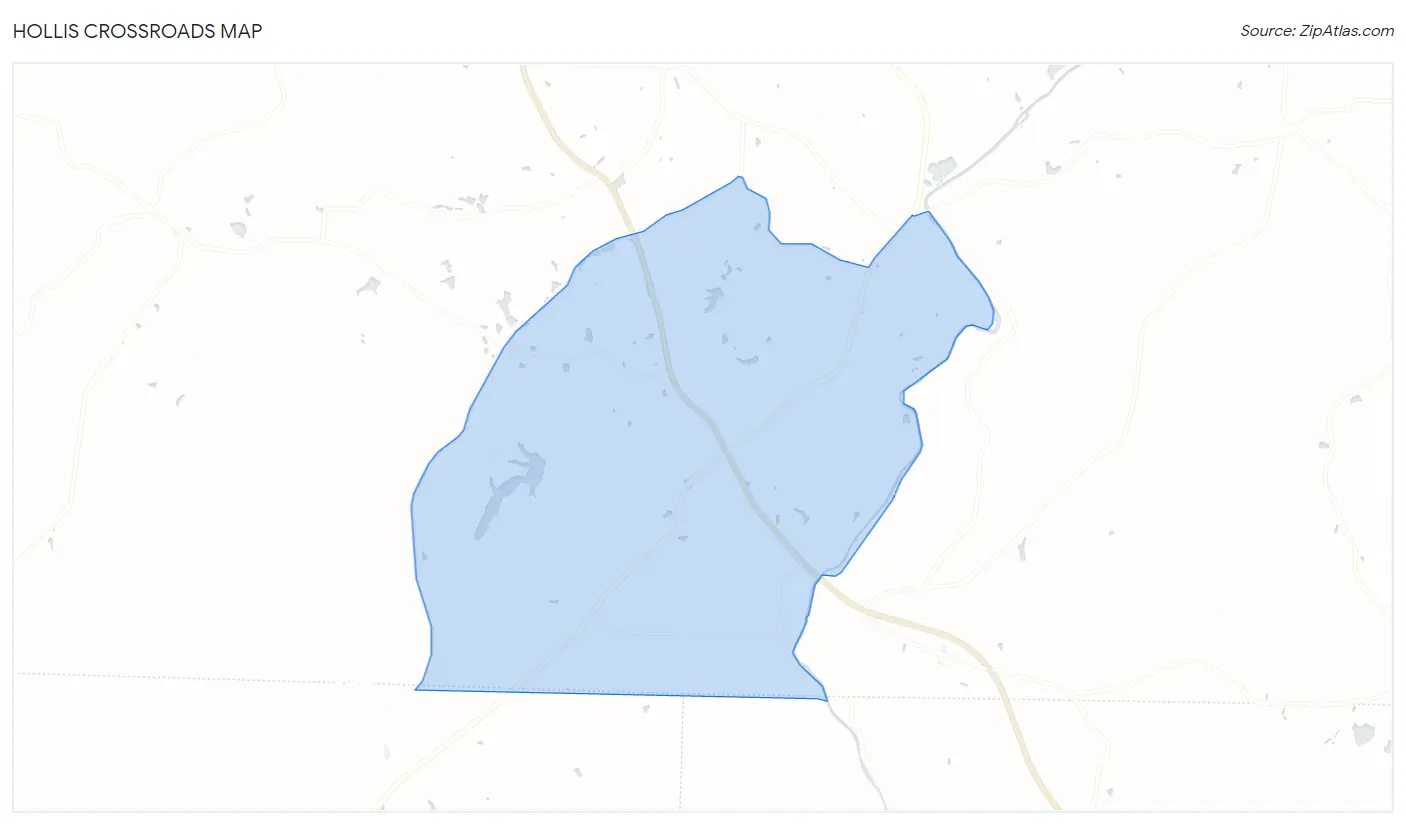
Hollis Crossroads Map
Hollis Crossroads Overview
$26,179
PER CAPITA INCOME
$62,857
AVG FAMILY INCOME
$60,489
AVG HOUSEHOLD INCOME
0.33
INEQUALITY / GINI INDEX
607
TOTAL POPULATION
315
MALE POPULATION
292
FEMALE POPULATION
107.88
MALES / 100 FEMALES
92.70
FEMALES / 100 MALES
35.5
MEDIAN AGE
3.5
AVG FAMILY SIZE
3.1
AVG HOUSEHOLD SIZE
239
LABOR FORCE [ PEOPLE ]
54.0%
PERCENT IN LABOR FORCE
Income in Hollis Crossroads
Income Overview in Hollis Crossroads
Per Capita Income in Hollis Crossroads is $26,179, while median incomes of families and households are $62,857 and $60,489 respectively.
| Characteristic | Number | Measure |
| Per Capita Income | 607 | $26,179 |
| Median Family Income | 158 | $62,857 |
| Mean Family Income | 158 | $84,949 |
| Median Household Income | 197 | $60,489 |
| Mean Household Income | 197 | $73,989 |
| Income Deficit | 158 | $0 |
| Wage / Income Gap (%) | 607 | 0.00% |
| Wage / Income Gap ($) | 607 | 100.00¢ per $1 |
| Gini / Inequality Index | 607 | 0.33 |
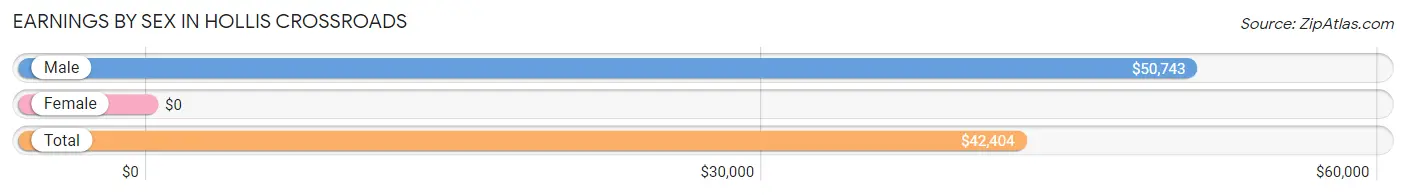
Earnings by Sex in Hollis Crossroads
| Sex | Number | Average Earnings |
| Male | 150 (61.0%) | $50,743 |
| Female | 96 (39.0%) | $0 |
| Total | 246 (100.0%) | $42,404 |
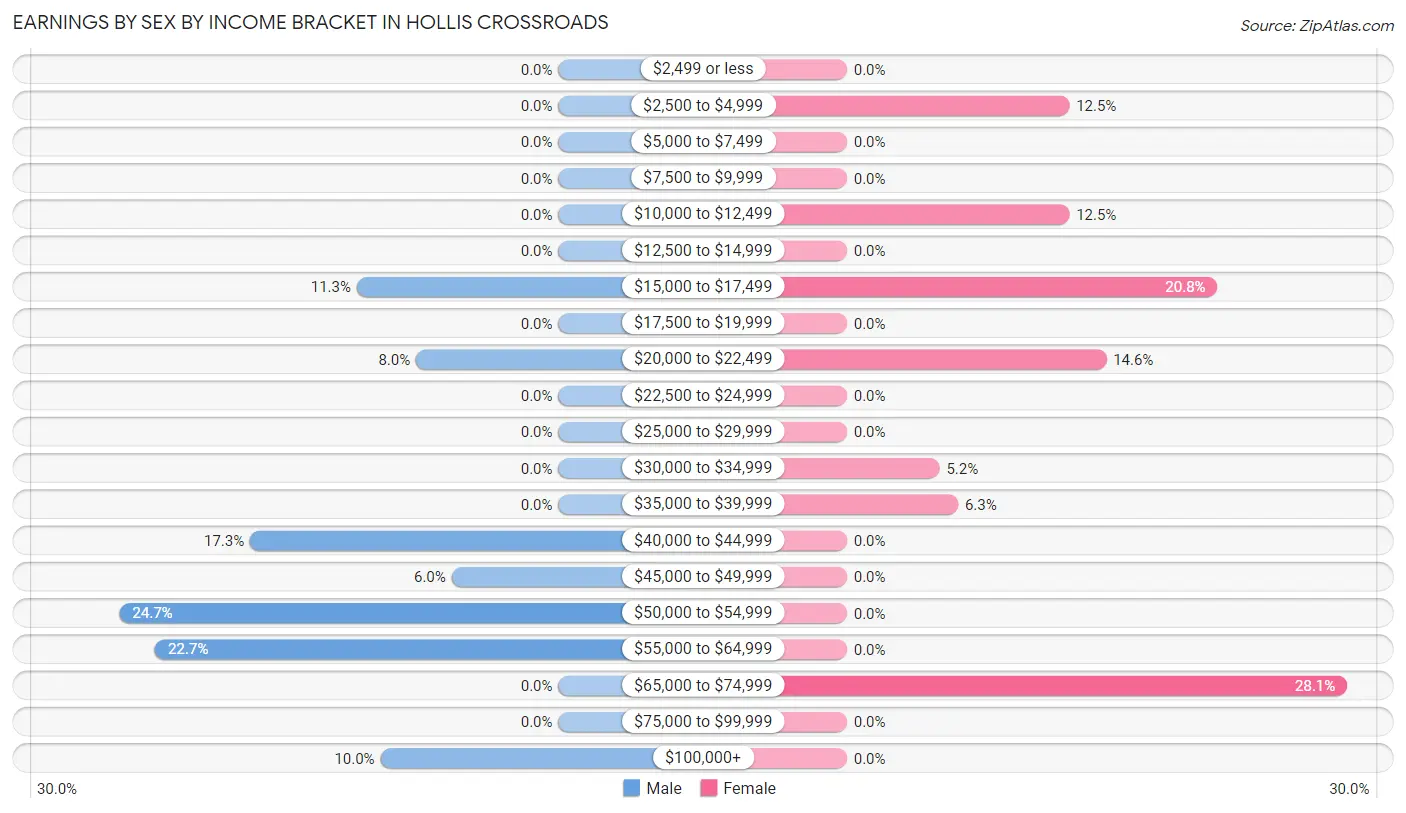
Earnings by Sex by Income Bracket in Hollis Crossroads
The most common earnings brackets in Hollis Crossroads are $50,000 to $54,999 for men (37 | 24.7%) and $65,000 to $74,999 for women (27 | 28.1%).
| Income | Male | Female |
| $2,499 or less | 0 (0.0%) | 0 (0.0%) |
| $2,500 to $4,999 | 0 (0.0%) | 12 (12.5%) |
| $5,000 to $7,499 | 0 (0.0%) | 0 (0.0%) |
| $7,500 to $9,999 | 0 (0.0%) | 0 (0.0%) |
| $10,000 to $12,499 | 0 (0.0%) | 12 (12.5%) |
| $12,500 to $14,999 | 0 (0.0%) | 0 (0.0%) |
| $15,000 to $17,499 | 17 (11.3%) | 20 (20.8%) |
| $17,500 to $19,999 | 0 (0.0%) | 0 (0.0%) |
| $20,000 to $22,499 | 12 (8.0%) | 14 (14.6%) |
| $22,500 to $24,999 | 0 (0.0%) | 0 (0.0%) |
| $25,000 to $29,999 | 0 (0.0%) | 0 (0.0%) |
| $30,000 to $34,999 | 0 (0.0%) | 5 (5.2%) |
| $35,000 to $39,999 | 0 (0.0%) | 6 (6.2%) |
| $40,000 to $44,999 | 26 (17.3%) | 0 (0.0%) |
| $45,000 to $49,999 | 9 (6.0%) | 0 (0.0%) |
| $50,000 to $54,999 | 37 (24.7%) | 0 (0.0%) |
| $55,000 to $64,999 | 34 (22.7%) | 0 (0.0%) |
| $65,000 to $74,999 | 0 (0.0%) | 27 (28.1%) |
| $75,000 to $99,999 | 0 (0.0%) | 0 (0.0%) |
| $100,000+ | 15 (10.0%) | 0 (0.0%) |
| Total | 150 (100.0%) | 96 (100.0%) |
Earnings by Sex by Educational Attainment in Hollis Crossroads
| Educational Attainment | Male Income | Female Income |
| Less than High School | - | - |
| High School Diploma | - | - |
| College or Associate's Degree | - | - |
| Bachelor's Degree | - | - |
| Graduate Degree | - | - |
| Total | $50,743 | $0 |
Family Income in Hollis Crossroads
Family Income Brackets in Hollis Crossroads
According to the Hollis Crossroads family income data, there are 78 families falling into the $50,000 to $74,999 income range, which is the most common income bracket and makes up 49.4% of all families.
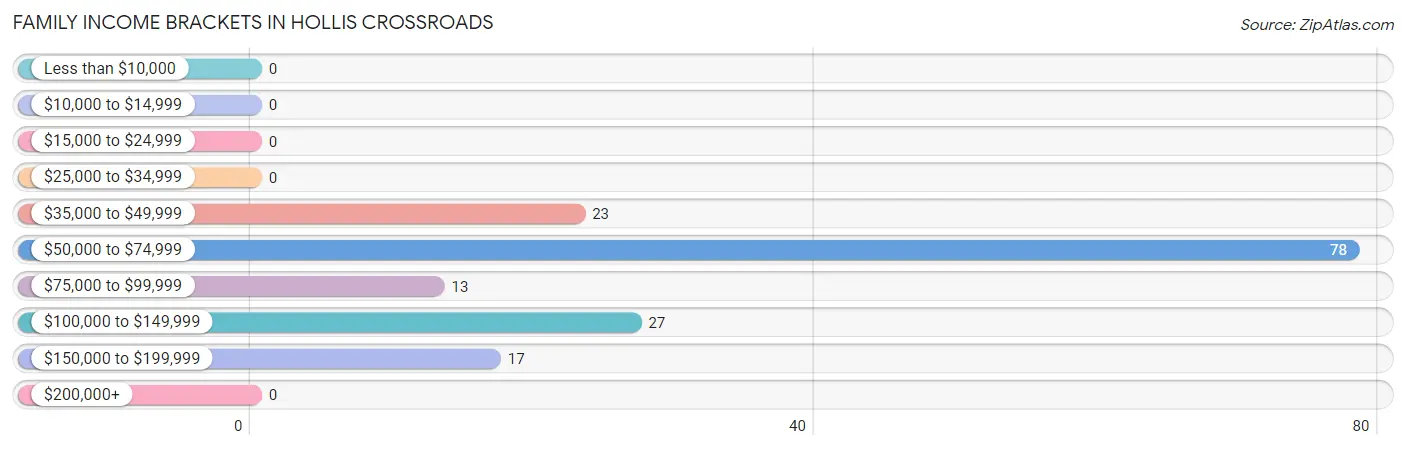
| Income Bracket | # Families | % Families |
| Less than $10,000 | 0 | 0.0% |
| $10,000 to $14,999 | 0 | 0.0% |
| $15,000 to $24,999 | 0 | 0.0% |
| $25,000 to $34,999 | 0 | 0.0% |
| $35,000 to $49,999 | 23 | 14.6% |
| $50,000 to $74,999 | 78 | 49.4% |
| $75,000 to $99,999 | 13 | 8.2% |
| $100,000 to $149,999 | 27 | 17.1% |
| $150,000 to $199,999 | 17 | 10.8% |
| $200,000+ | 0 | 0.0% |
Family Income by Famaliy Size in Hollis Crossroads
2-person families (103 | 65.2%) account for the highest median family income in Hollis Crossroads with $61,793 per family, while 2-person families (103 | 65.2%) have the highest median income of $30,896 per family member.
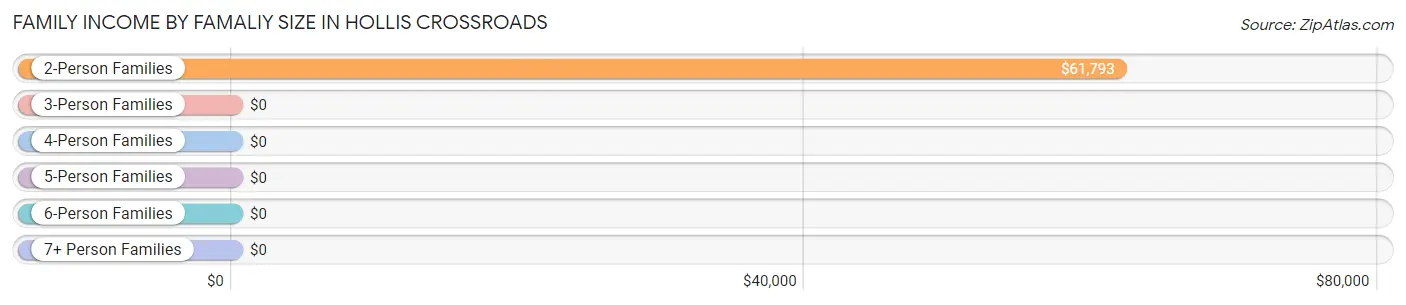
| Income Bracket | # Families | Median Income |
| 2-Person Families | 103 (65.2%) | $61,793 |
| 3-Person Families | 0 (0.0%) | $0 |
| 4-Person Families | 22 (13.9%) | $0 |
| 5-Person Families | 26 (16.5%) | $0 |
| 6-Person Families | 0 (0.0%) | $0 |
| 7+ Person Families | 7 (4.4%) | $0 |
| Total | 158 (100.0%) | $62,857 |
Family Income by Number of Earners in Hollis Crossroads
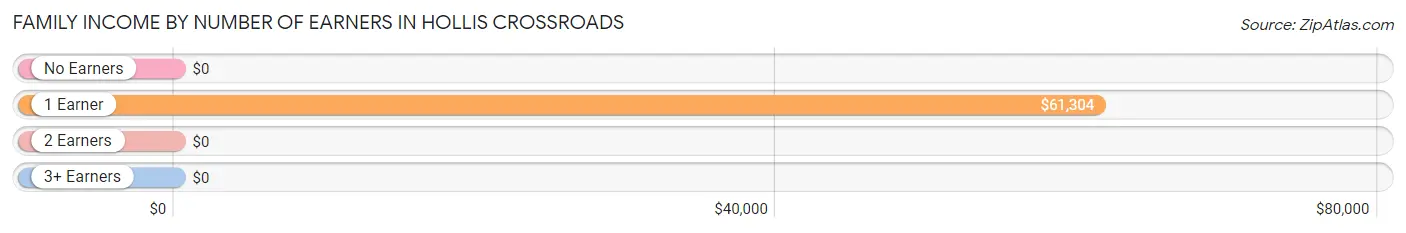
| Number of Earners | # Families | Median Income |
| No Earners | 24 (15.2%) | $0 |
| 1 Earner | 80 (50.6%) | $61,304 |
| 2 Earners | 48 (30.4%) | $0 |
| 3+ Earners | 6 (3.8%) | $0 |
| Total | 158 (100.0%) | $62,857 |
Household Income in Hollis Crossroads
Household Income Brackets in Hollis Crossroads
With 86 households falling in the category, the $50,000 to $74,999 income range is the most frequent in Hollis Crossroads, accounting for 43.6% of all households.
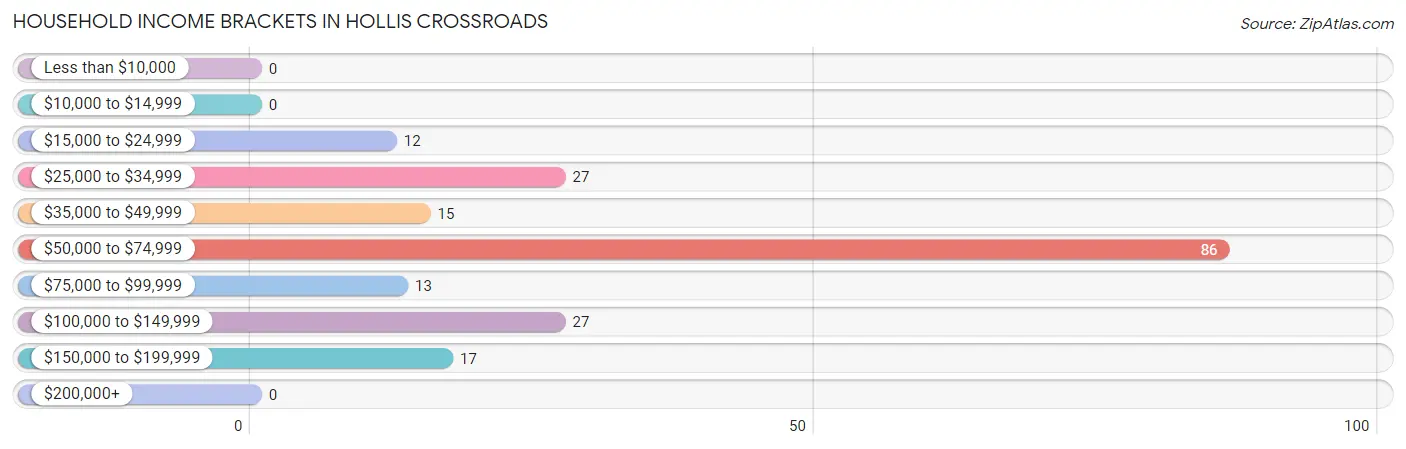
| Income Bracket | # Households | % Households |
| Less than $10,000 | 0 | 0.0% |
| $10,000 to $14,999 | 0 | 0.0% |
| $15,000 to $24,999 | 12 | 6.1% |
| $25,000 to $34,999 | 27 | 13.7% |
| $35,000 to $49,999 | 15 | 7.6% |
| $50,000 to $74,999 | 86 | 43.7% |
| $75,000 to $99,999 | 13 | 6.6% |
| $100,000 to $149,999 | 27 | 13.7% |
| $150,000 to $199,999 | 17 | 8.6% |
| $200,000+ | 0 | 0.0% |
Household Income by Householder Age in Hollis Crossroads
The median household income in Hollis Crossroads is $60,489, with the highest median household income of $58,958 found in the 65+ years age bracket for the primary householder. A total of 92 households (46.7%) fall into this category. Meanwhile, the 15 to 24 years age bracket for the primary householder has the lowest median household income of $0, with 26 households (13.2%) in this group.
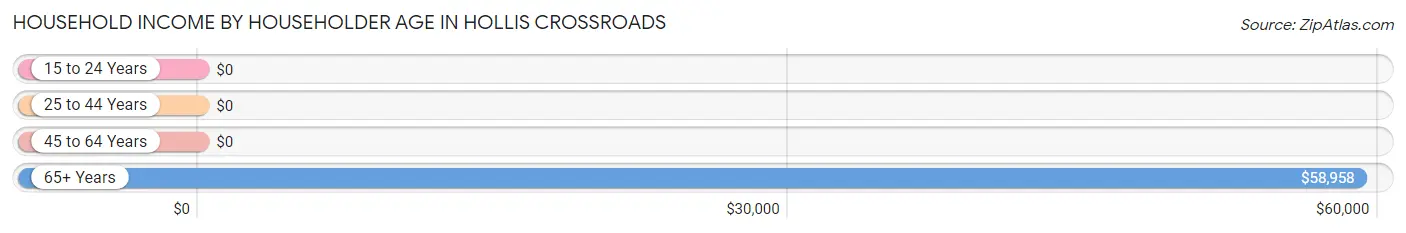
| Income Bracket | # Households | Median Income |
| 15 to 24 Years | 26 (13.2%) | $0 |
| 25 to 44 Years | 64 (32.5%) | $0 |
| 45 to 64 Years | 15 (7.6%) | $0 |
| 65+ Years | 92 (46.7%) | $58,958 |
| Total | 197 (100.0%) | $60,489 |
Poverty in Hollis Crossroads
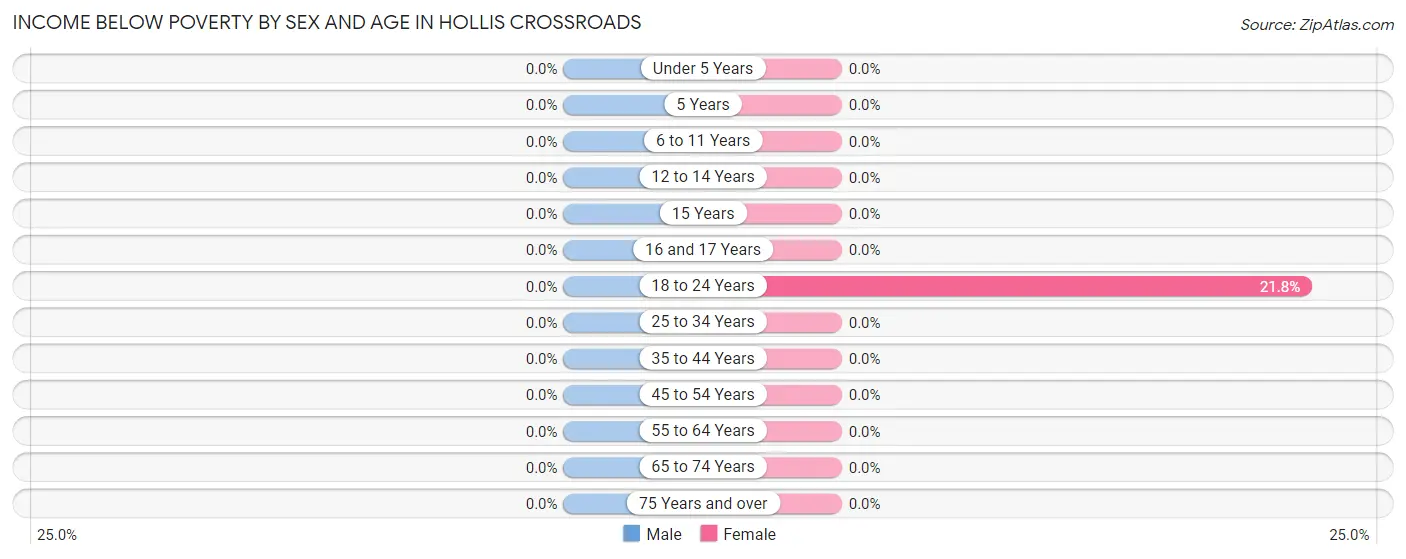
Income Below Poverty by Sex and Age in Hollis Crossroads
| Age Bracket | Male | Female |
| Under 5 Years | 0 (0.0%) | 0 (0.0%) |
| 5 Years | 0 (0.0%) | 0 (0.0%) |
| 6 to 11 Years | 0 (0.0%) | 0 (0.0%) |
| 12 to 14 Years | 0 (0.0%) | 0 (0.0%) |
| 15 Years | 0 (0.0%) | 0 (0.0%) |
| 16 and 17 Years | 0 (0.0%) | 0 (0.0%) |
| 18 to 24 Years | 0 (0.0%) | 12 (21.8%) |
| 25 to 34 Years | 0 (0.0%) | 0 (0.0%) |
| 35 to 44 Years | 0 (0.0%) | 0 (0.0%) |
| 45 to 54 Years | 0 (0.0%) | 0 (0.0%) |
| 55 to 64 Years | 0 (0.0%) | 0 (0.0%) |
| 65 to 74 Years | 0 (0.0%) | 0 (0.0%) |
| 75 Years and over | 0 (0.0%) | 0 (0.0%) |
| Total | 0 (0.0%) | 12 (4.1%) |
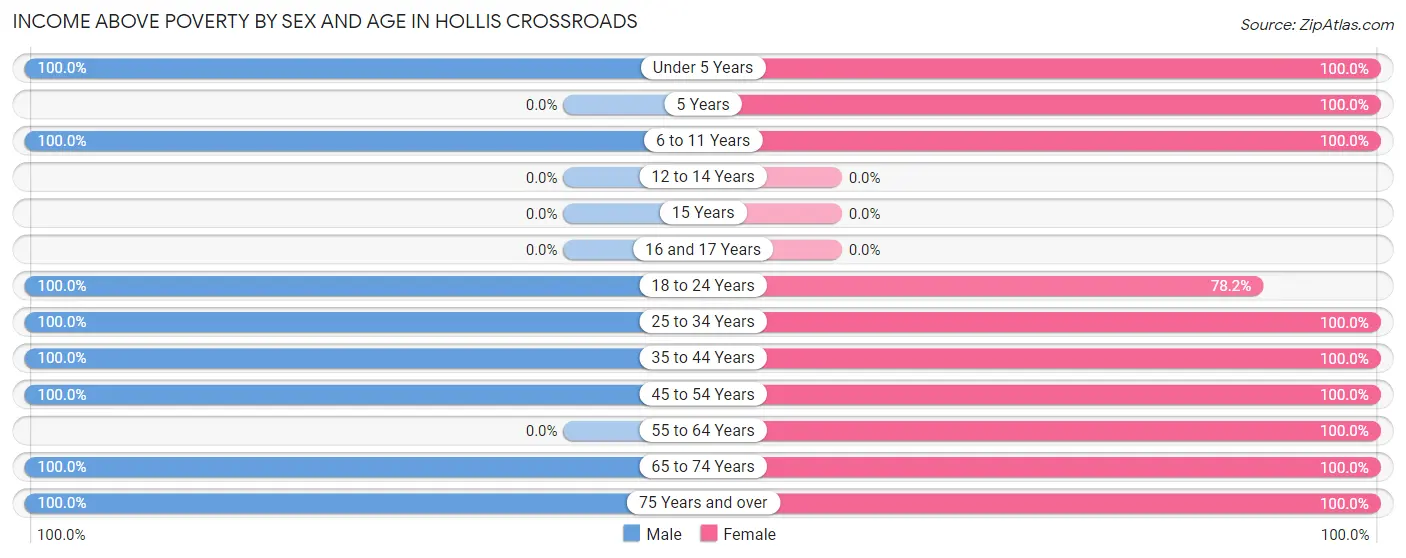
Income Above Poverty by Sex and Age in Hollis Crossroads
According to the poverty statistics in Hollis Crossroads, males aged under 5 years and females aged under 5 years are the age groups that are most secure financially, with 100.0% of males and 100.0% of females in these age groups living above the poverty line.
| Age Bracket | Male | Female |
| Under 5 Years | 60 (100.0%) | 17 (100.0%) |
| 5 Years | 0 (0.0%) | 24 (100.0%) |
| 6 to 11 Years | 21 (100.0%) | 42 (100.0%) |
| 12 to 14 Years | 0 (0.0%) | 0 (0.0%) |
| 15 Years | 0 (0.0%) | 0 (0.0%) |
| 16 and 17 Years | 0 (0.0%) | 0 (0.0%) |
| 18 to 24 Years | 12 (100.0%) | 43 (78.2%) |
| 25 to 34 Years | 43 (100.0%) | 12 (100.0%) |
| 35 to 44 Years | 65 (100.0%) | 48 (100.0%) |
| 45 to 54 Years | 16 (100.0%) | 29 (100.0%) |
| 55 to 64 Years | 0 (0.0%) | 12 (100.0%) |
| 65 to 74 Years | 76 (100.0%) | 13 (100.0%) |
| 75 Years and over | 22 (100.0%) | 40 (100.0%) |
| Total | 315 (100.0%) | 280 (95.9%) |
Income Below Poverty Among Married-Couple Families in Hollis Crossroads
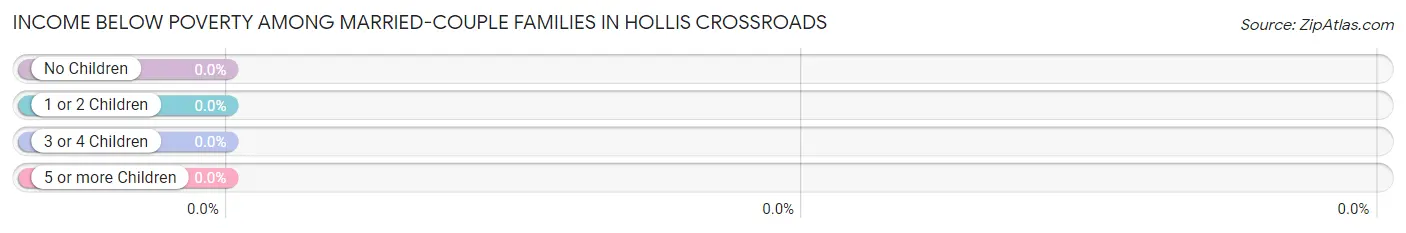
| Children | Above Poverty | Below Poverty |
| No Children | 84 (100.0%) | 0 (0.0%) |
| 1 or 2 Children | 23 (100.0%) | 0 (0.0%) |
| 3 or 4 Children | 20 (100.0%) | 0 (0.0%) |
| 5 or more Children | 7 (100.0%) | 0 (0.0%) |
| Total | 134 (100.0%) | 0 (0.0%) |
Income Below Poverty Among Single-Parent Households in Hollis Crossroads
| Children | Single Father | Single Mother |
| No Children | 0 (0.0%) | 0 (0.0%) |
| 1 or 2 Children | 0 (0.0%) | 0 (0.0%) |
| 3 or 4 Children | 0 (0.0%) | 0 (0.0%) |
| 5 or more Children | 0 (0.0%) | 0 (0.0%) |
| Total | 0 (0.0%) | 0 (0.0%) |
Income Below Poverty Among Married-Couple vs Single-Parent Households in Hollis Crossroads
| Children | Married-Couple Families | Single-Parent Households |
| No Children | 0 (0.0%) | 0 (0.0%) |
| 1 or 2 Children | 0 (0.0%) | 0 (0.0%) |
| 3 or 4 Children | 0 (0.0%) | 0 (0.0%) |
| 5 or more Children | 0 (0.0%) | 0 (0.0%) |
| Total | 0 (0.0%) | 0 (0.0%) |
Race in Hollis Crossroads
The most populous races in Hollis Crossroads are White / Caucasian (512 | 84.4%), Hispanic or Latino (95 | 15.7%), and Some other Race (95 | 15.7%).
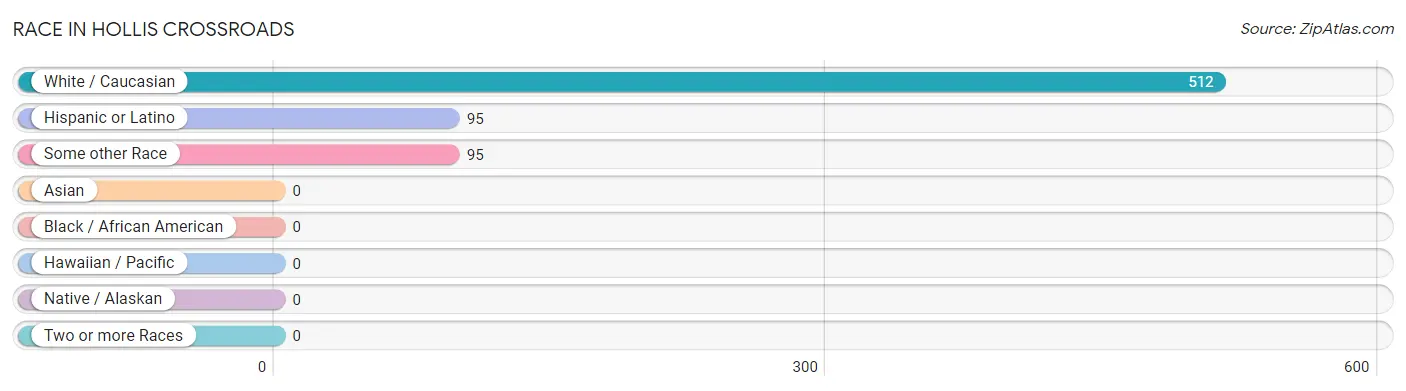
| Race | # Population | % Population |
| Asian | 0 | 0.0% |
| Black / African American | 0 | 0.0% |
| Hawaiian / Pacific | 0 | 0.0% |
| Hispanic or Latino | 95 | 15.7% |
| Native / Alaskan | 0 | 0.0% |
| White / Caucasian | 512 | 84.4% |
| Two or more Races | 0 | 0.0% |
| Some other Race | 95 | 15.7% |
| Total | 607 | 100.0% |
Ancestry in Hollis Crossroads
The most populous ancestries reported in Hollis Crossroads are English (145 | 23.9%), Mexican (95 | 15.7%), Irish (71 | 11.7%), American (38 | 6.3%), and Scotch-Irish (12 | 2.0%), together accounting for 59.5% of all Hollis Crossroads residents.
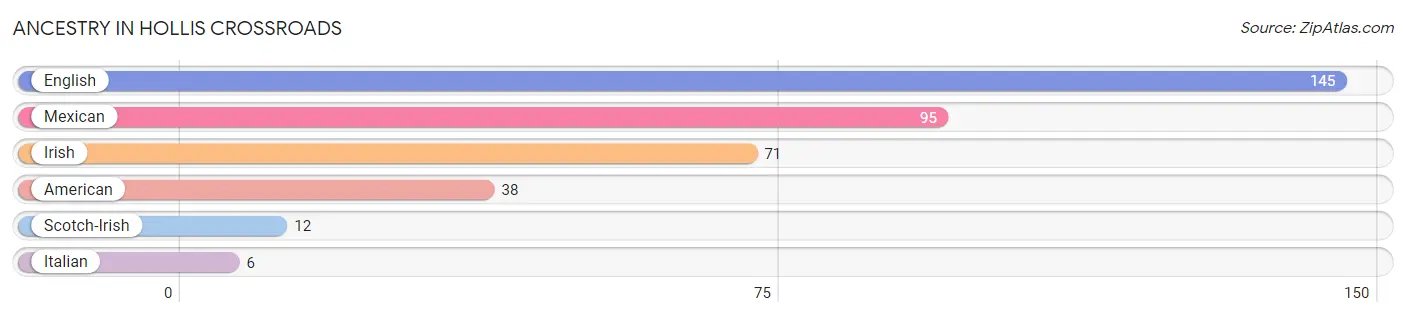
| Ancestry | # Population | % Population |
| American | 38 | 6.3% |
| English | 145 | 23.9% |
| Irish | 71 | 11.7% |
| Italian | 6 | 1.0% |
| Mexican | 95 | 15.7% |
| Scotch-Irish | 12 | 2.0% | View All 6 Rows |
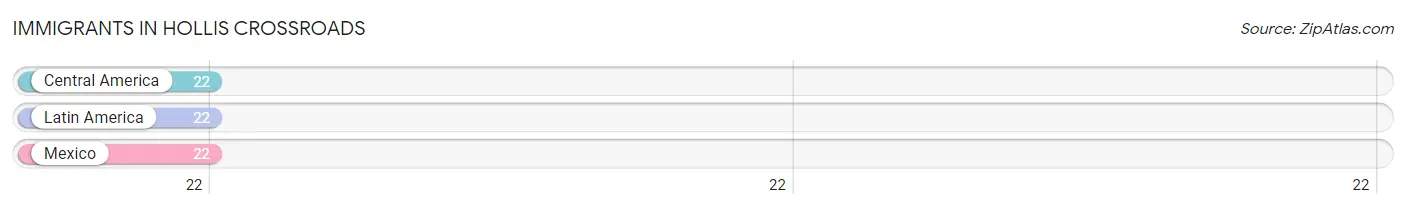
Immigrants in Hollis Crossroads
The most numerous immigrant groups reported in Hollis Crossroads came from Central America (22 | 3.6%), Latin America (22 | 3.6%), and Mexico (22 | 3.6%), together accounting for 10.9% of all Hollis Crossroads residents.
| Immigration Origin | # Population | % Population |
| Central America | 22 | 3.6% |
| Latin America | 22 | 3.6% |
| Mexico | 22 | 3.6% | View All 3 Rows |
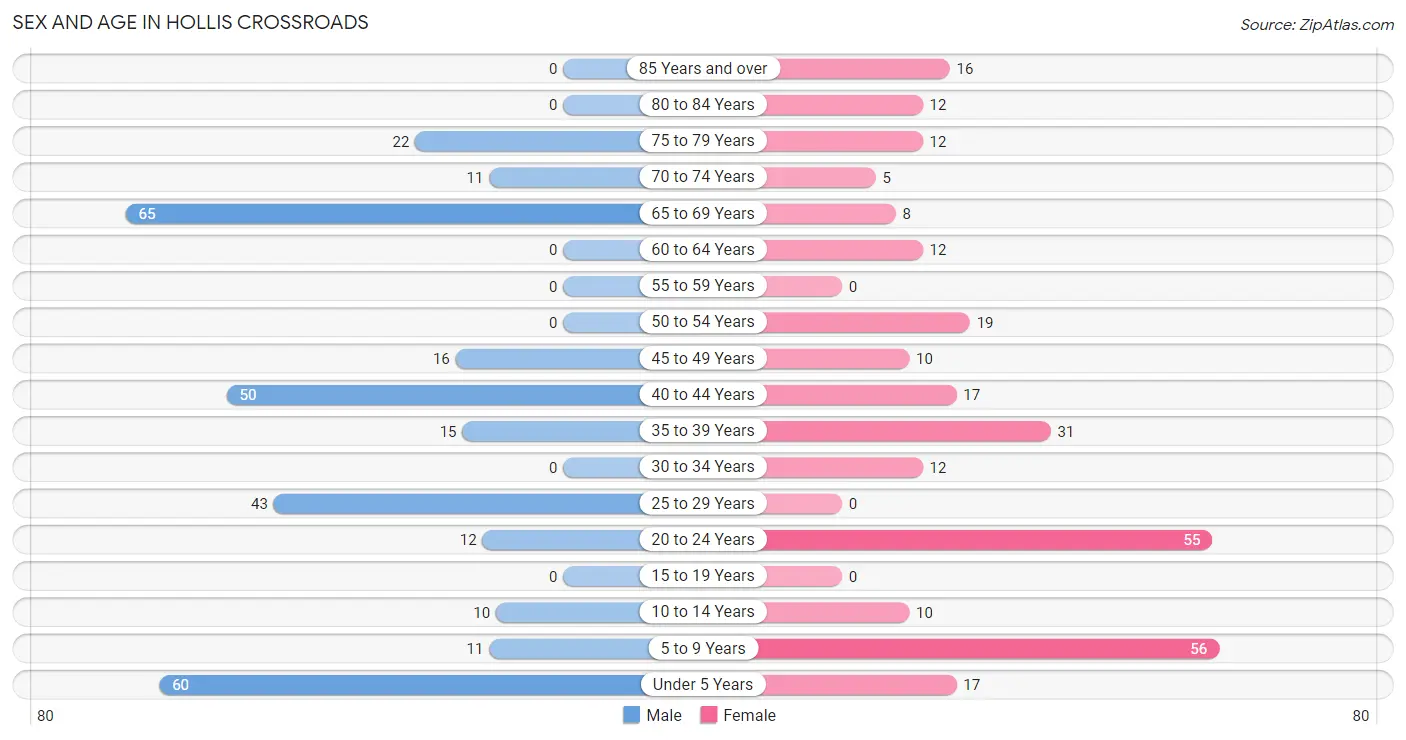
Sex and Age in Hollis Crossroads
Sex and Age in Hollis Crossroads
The most populous age groups in Hollis Crossroads are 65 to 69 Years (65 | 20.6%) for men and 5 to 9 Years (56 | 19.2%) for women.
| Age Bracket | Male | Female |
| Under 5 Years | 60 (19.1%) | 17 (5.8%) |
| 5 to 9 Years | 11 (3.5%) | 56 (19.2%) |
| 10 to 14 Years | 10 (3.2%) | 10 (3.4%) |
| 15 to 19 Years | 0 (0.0%) | 0 (0.0%) |
| 20 to 24 Years | 12 (3.8%) | 55 (18.8%) |
| 25 to 29 Years | 43 (13.7%) | 0 (0.0%) |
| 30 to 34 Years | 0 (0.0%) | 12 (4.1%) |
| 35 to 39 Years | 15 (4.8%) | 31 (10.6%) |
| 40 to 44 Years | 50 (15.9%) | 17 (5.8%) |
| 45 to 49 Years | 16 (5.1%) | 10 (3.4%) |
| 50 to 54 Years | 0 (0.0%) | 19 (6.5%) |
| 55 to 59 Years | 0 (0.0%) | 0 (0.0%) |
| 60 to 64 Years | 0 (0.0%) | 12 (4.1%) |
| 65 to 69 Years | 65 (20.6%) | 8 (2.7%) |
| 70 to 74 Years | 11 (3.5%) | 5 (1.7%) |
| 75 to 79 Years | 22 (7.0%) | 12 (4.1%) |
| 80 to 84 Years | 0 (0.0%) | 12 (4.1%) |
| 85 Years and over | 0 (0.0%) | 16 (5.5%) |
| Total | 315 (100.0%) | 292 (100.0%) |
Families and Households in Hollis Crossroads
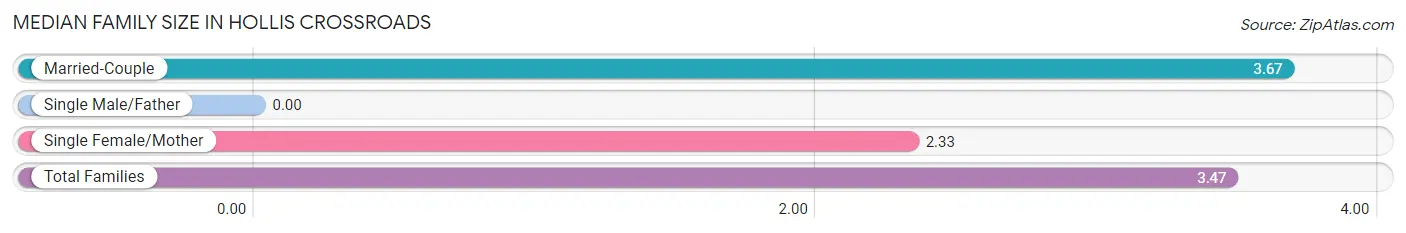
Median Family Size in Hollis Crossroads
| Family Type | # Families | Family Size |
| Married-Couple | 134 (84.8%) | 3.67 |
| Single Male/Father | 0 (0.0%) | - |
| Single Female/Mother | 24 (15.2%) | 2.33 |
| Total Families | 158 (100.0%) | 3.47 |
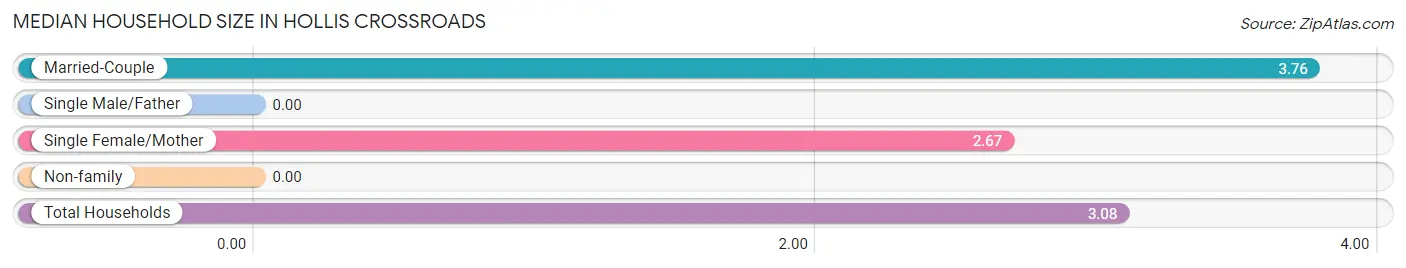
Median Household Size in Hollis Crossroads
| Household Type | # Households | Household Size |
| Married-Couple | 134 (68.0%) | 3.76 |
| Single Male/Father | 0 (0.0%) | - |
| Single Female/Mother | 24 (12.2%) | 2.67 |
| Non-family | 39 (19.8%) | - |
| Total Households | 197 (100.0%) | 3.08 |
Household Size by Marriage Status in Hollis Crossroads
Out of a total of 197 households in Hollis Crossroads, 158 (80.2%) are family households, while 39 (19.8%) are nonfamily households. The most numerous type of family households are 2-person households, comprising 95, and the most common type of nonfamily households are 1-person households, comprising 39.
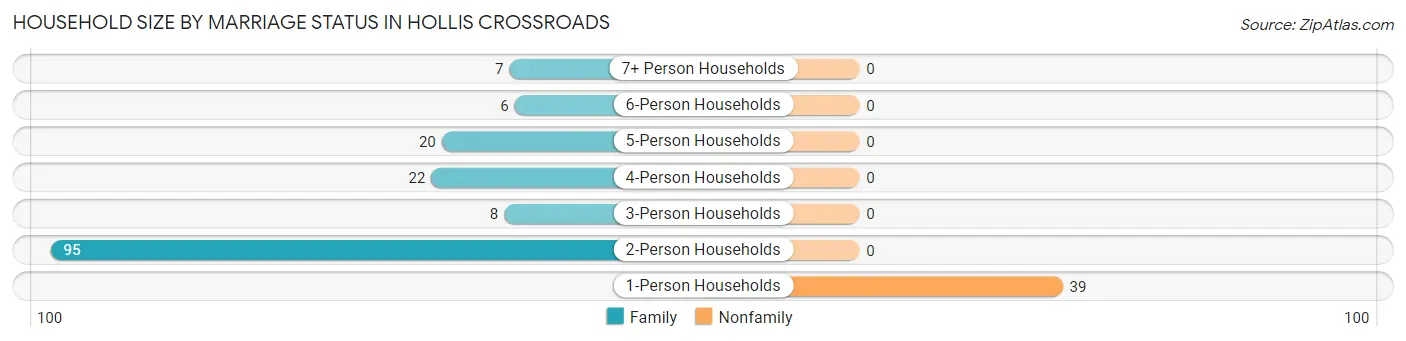
| Household Size | Family Households | Nonfamily Households |
| 1-Person Households | - | 39 (19.8%) |
| 2-Person Households | 95 (48.2%) | 0 (0.0%) |
| 3-Person Households | 8 (4.1%) | 0 (0.0%) |
| 4-Person Households | 22 (11.2%) | 0 (0.0%) |
| 5-Person Households | 20 (10.2%) | 0 (0.0%) |
| 6-Person Households | 6 (3.0%) | 0 (0.0%) |
| 7+ Person Households | 7 (3.5%) | 0 (0.0%) |
| Total | 158 (80.2%) | 39 (19.8%) |
Female Fertility in Hollis Crossroads
Fertility by Age in Hollis Crossroads
Average fertility rate in Hollis Crossroads is 96.0 births per 1,000 women. Women in the age bracket of 20 to 34 years have the highest fertility rate with 179.0 births per 1,000 women. Women in the age bracket of 20 to 34 years acount for 100.0% of all women with births.
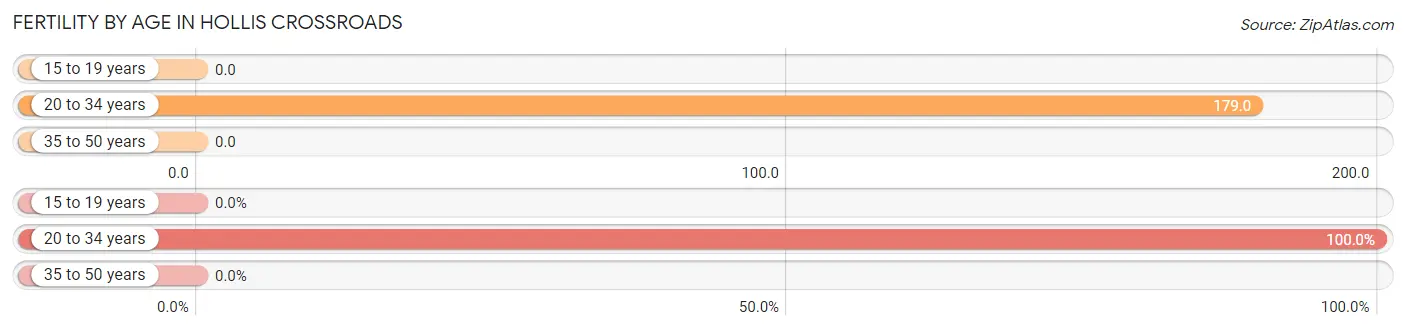
| Age Bracket | Women with Births | Births / 1,000 Women |
| 15 to 19 years | 0 (0.0%) | 0.0 |
| 20 to 34 years | 12 (100.0%) | 179.0 |
| 35 to 50 years | 0 (0.0%) | 0.0 |
| Total | 12 (100.0%) | 96.0 |
Fertility by Age by Marriage Status in Hollis Crossroads
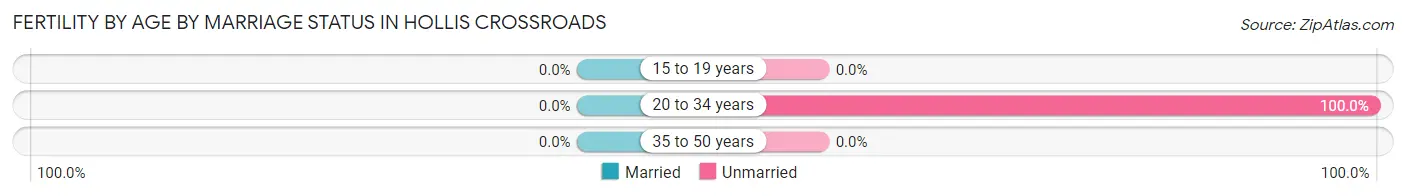
| Age Bracket | Married | Unmarried |
| 15 to 19 years | 0 (0.0%) | 0 (0.0%) |
| 20 to 34 years | 0 (0.0%) | 12 (100.0%) |
| 35 to 50 years | 0 (0.0%) | 0 (0.0%) |
| Total | 0 (0.0%) | 12 (100.0%) |
Fertility by Education in Hollis Crossroads
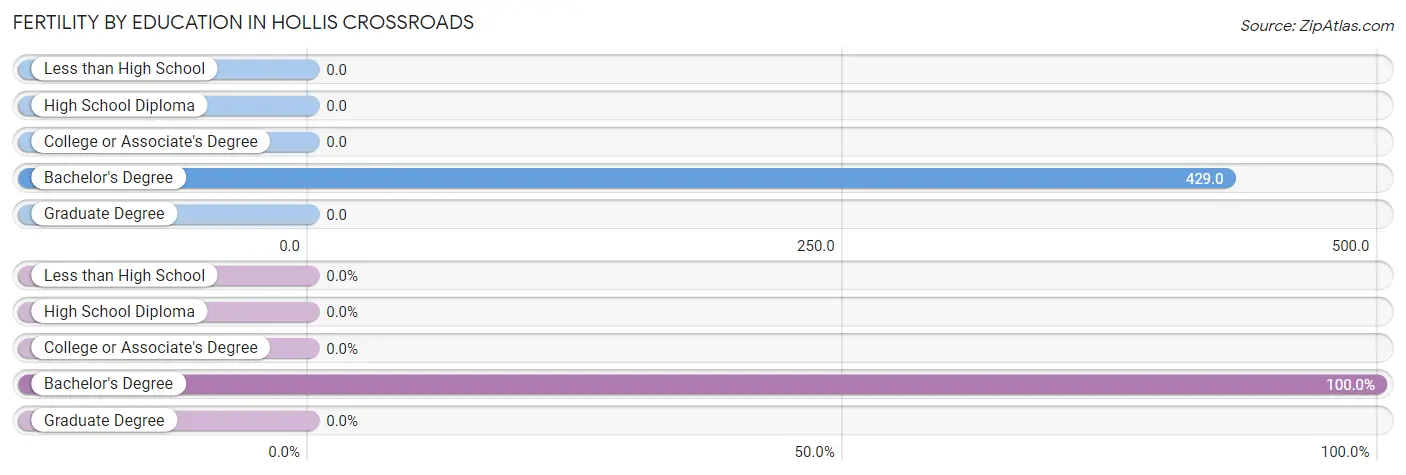
| Educational Attainment | Women with Births | Births / 1,000 Women |
| Less than High School | 0 (0.0%) | 0.0 |
| High School Diploma | 0 (0.0%) | 0.0 |
| College or Associate's Degree | 0 (0.0%) | 0.0 |
| Bachelor's Degree | 12 (100.0%) | 429.0 |
| Graduate Degree | 0 (0.0%) | 0.0 |
| Total | 12 (100.0%) | 96.0 |
Fertility by Education by Marriage Status in Hollis Crossroads
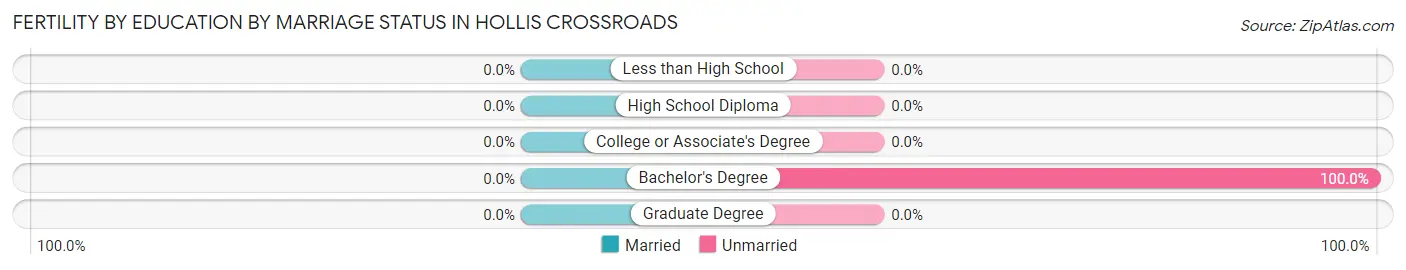
| Educational Attainment | Married | Unmarried |
| Less than High School | 0 (0.0%) | 0 (0.0%) |
| High School Diploma | 0 (0.0%) | 0 (0.0%) |
| College or Associate's Degree | 0 (0.0%) | 0 (0.0%) |
| Bachelor's Degree | 0 (0.0%) | 12 (100.0%) |
| Graduate Degree | 0 (0.0%) | 0 (0.0%) |
| Total | 0 (0.0%) | 12 (100.0%) |
Employment Characteristics in Hollis Crossroads
Employment by Class of Employer in Hollis Crossroads
Among the 239 employed individuals in Hollis Crossroads, private company employees (202 | 84.5%), local government employees (23 | 9.6%), and self-employed (incorporated) (8 | 3.4%) make up the most common classes of employment.
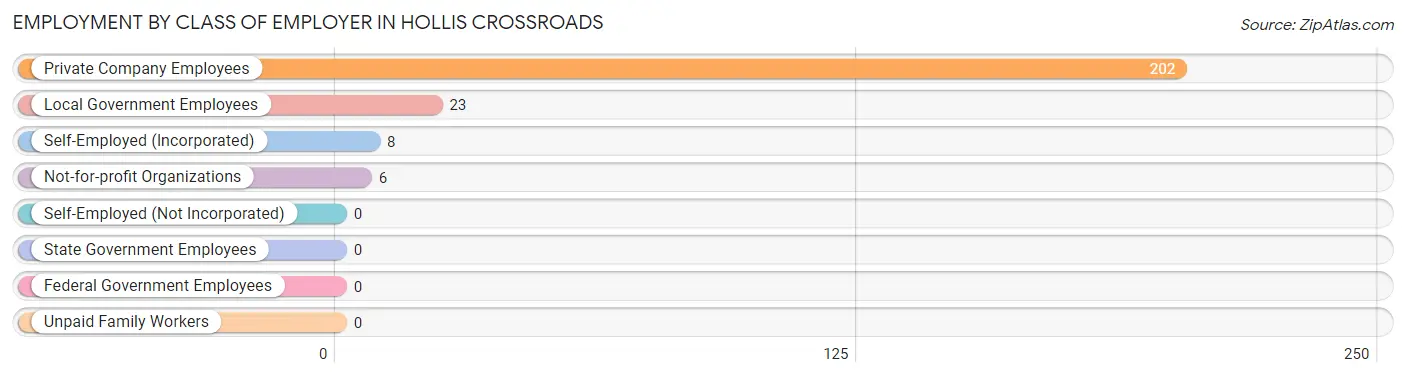
| Employer Class | # Employees | % Employees |
| Private Company Employees | 202 | 84.5% |
| Self-Employed (Incorporated) | 8 | 3.4% |
| Self-Employed (Not Incorporated) | 0 | 0.0% |
| Not-for-profit Organizations | 6 | 2.5% |
| Local Government Employees | 23 | 9.6% |
| State Government Employees | 0 | 0.0% |
| Federal Government Employees | 0 | 0.0% |
| Unpaid Family Workers | 0 | 0.0% |
| Total | 239 | 100.0% |
Employment Status by Age in Hollis Crossroads
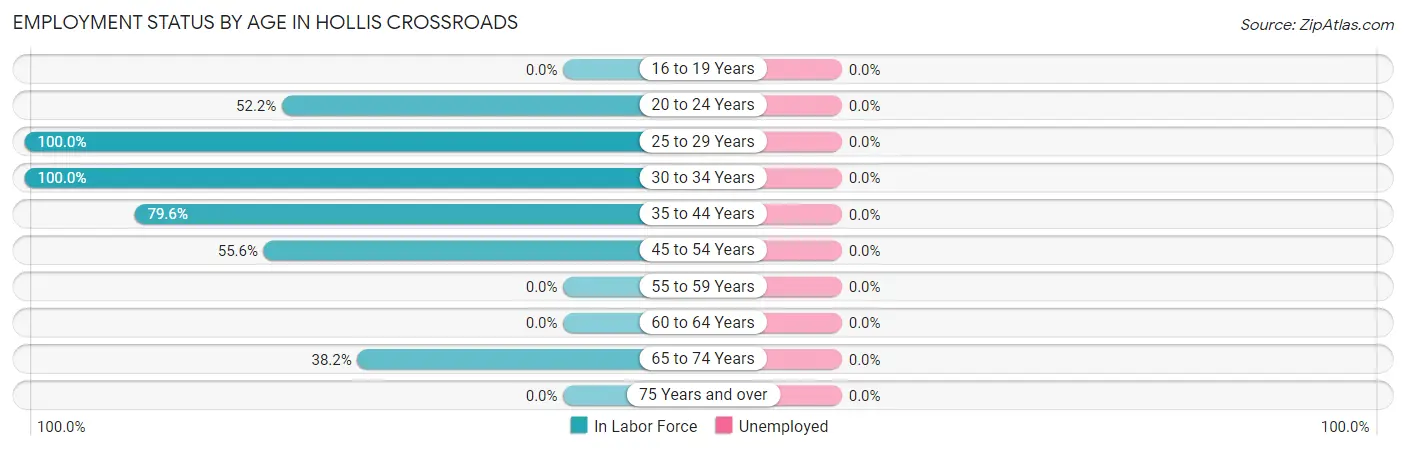
| Age Bracket | In Labor Force | Unemployed |
| 16 to 19 Years | 0 (0.0%) | 0 (0.0%) |
| 20 to 24 Years | 35 (52.2%) | 0 (0.0%) |
| 25 to 29 Years | 43 (100.0%) | 0 (0.0%) |
| 30 to 34 Years | 12 (100.0%) | 0 (0.0%) |
| 35 to 44 Years | 90 (79.6%) | 0 (0.0%) |
| 45 to 54 Years | 25 (55.6%) | 0 (0.0%) |
| 55 to 59 Years | 0 (0.0%) | 0 (0.0%) |
| 60 to 64 Years | 0 (0.0%) | 0 (0.0%) |
| 65 to 74 Years | 34 (38.2%) | 0 (0.0%) |
| 75 Years and over | 0 (0.0%) | 0 (0.0%) |
| Total | 239 (54.0%) | 0 (0.0%) |
Employment Status by Educational Attainment in Hollis Crossroads
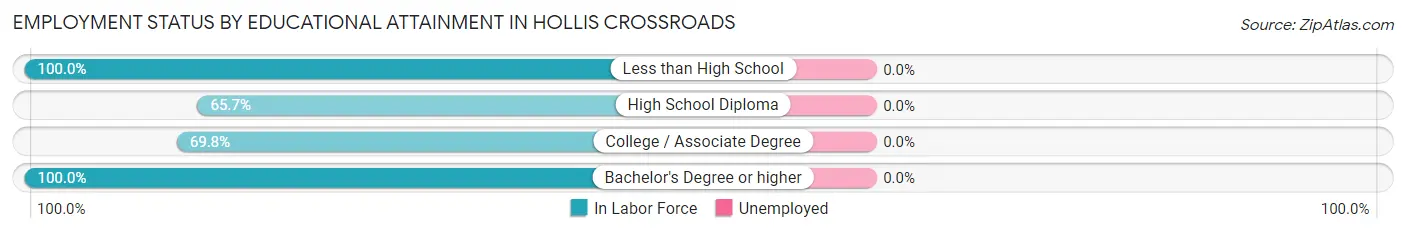
| Educational Attainment | In Labor Force | Unemployed |
| Less than High School | 42 (100.0%) | 0 (0.0%) |
| High School Diploma | 44 (65.7%) | 0 (0.0%) |
| College / Associate Degree | 74 (69.8%) | 0 (0.0%) |
| Bachelor's Degree or higher | 10 (100.0%) | 0 (0.0%) |
| Total | 170 (75.6%) | 0 (0.0%) |
Employment Occupations by Sex in Hollis Crossroads
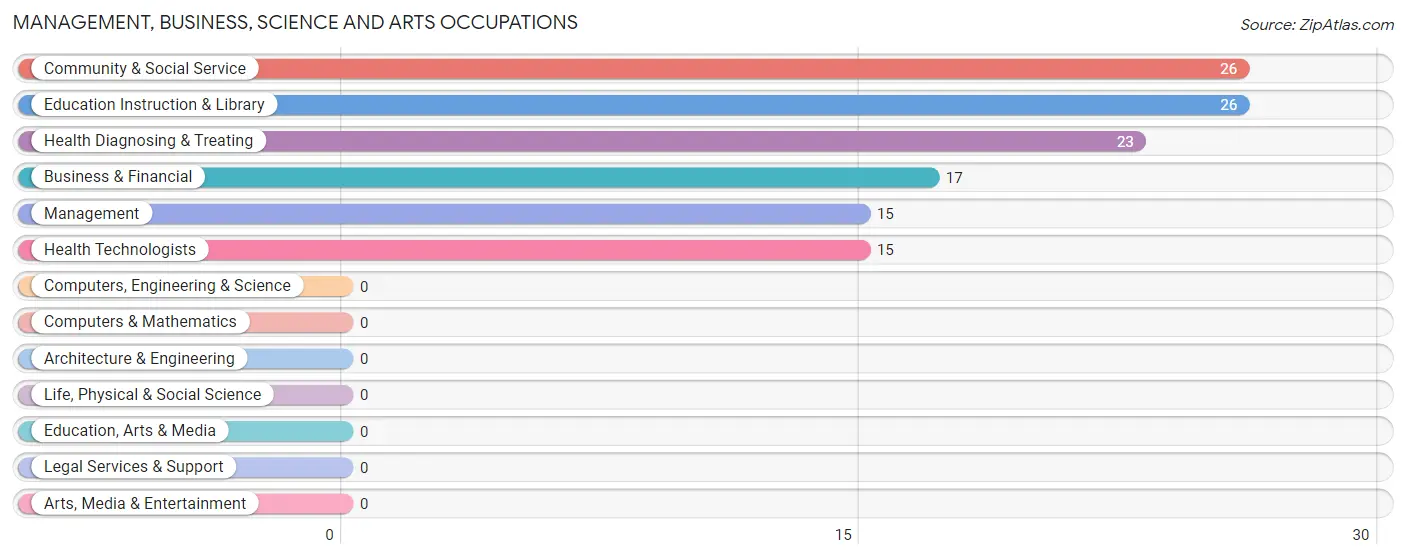
Management, Business, Science and Arts Occupations
The most common Management, Business, Science and Arts occupations in Hollis Crossroads are Community & Social Service (26 | 10.9%), Education Instruction & Library (26 | 10.9%), Health Diagnosing & Treating (23 | 9.6%), Business & Financial (17 | 7.1%), and Management (15 | 6.3%).
Management, Business, Science and Arts Occupations by Sex
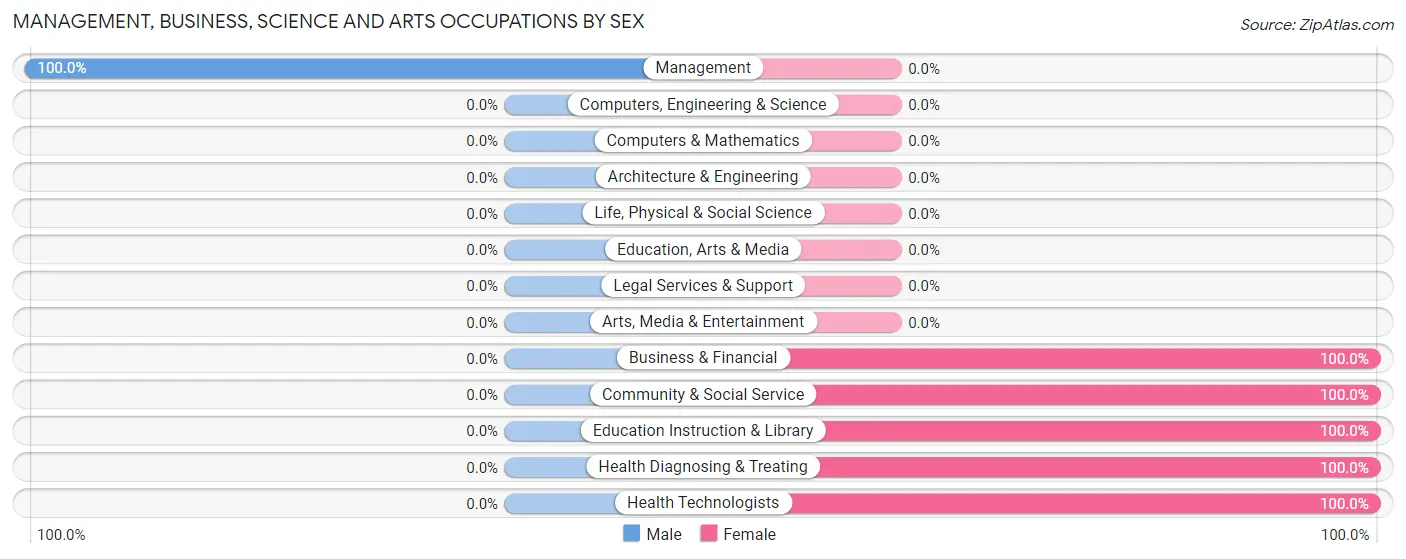
| Occupation | Male | Female |
| Management | 15 (100.0%) | 0 (0.0%) |
| Business & Financial | 0 (0.0%) | 17 (100.0%) |
| Computers, Engineering & Science | 0 (0.0%) | 0 (0.0%) |
| Computers & Mathematics | 0 (0.0%) | 0 (0.0%) |
| Architecture & Engineering | 0 (0.0%) | 0 (0.0%) |
| Life, Physical & Social Science | 0 (0.0%) | 0 (0.0%) |
| Community & Social Service | 0 (0.0%) | 26 (100.0%) |
| Education, Arts & Media | 0 (0.0%) | 0 (0.0%) |
| Legal Services & Support | 0 (0.0%) | 0 (0.0%) |
| Education Instruction & Library | 0 (0.0%) | 26 (100.0%) |
| Arts, Media & Entertainment | 0 (0.0%) | 0 (0.0%) |
| Health Diagnosing & Treating | 0 (0.0%) | 23 (100.0%) |
| Health Technologists | 0 (0.0%) | 15 (100.0%) |
| Total (Category) | 15 (18.5%) | 66 (81.5%) |
| Total (Overall) | 143 (59.8%) | 96 (40.2%) |
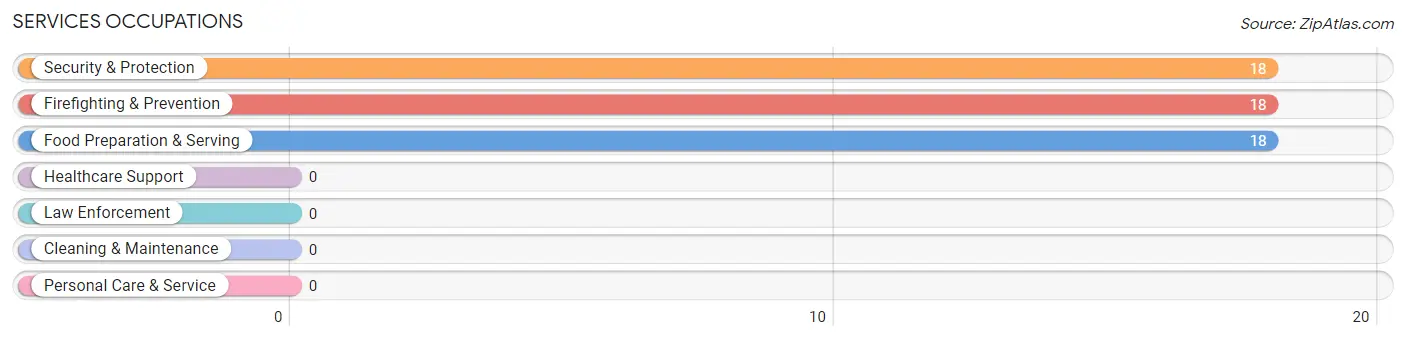
Services Occupations
The most common Services occupations in Hollis Crossroads are Security & Protection (18 | 7.5%), Firefighting & Prevention (18 | 7.5%), and Food Preparation & Serving (18 | 7.5%).
Services Occupations by Sex
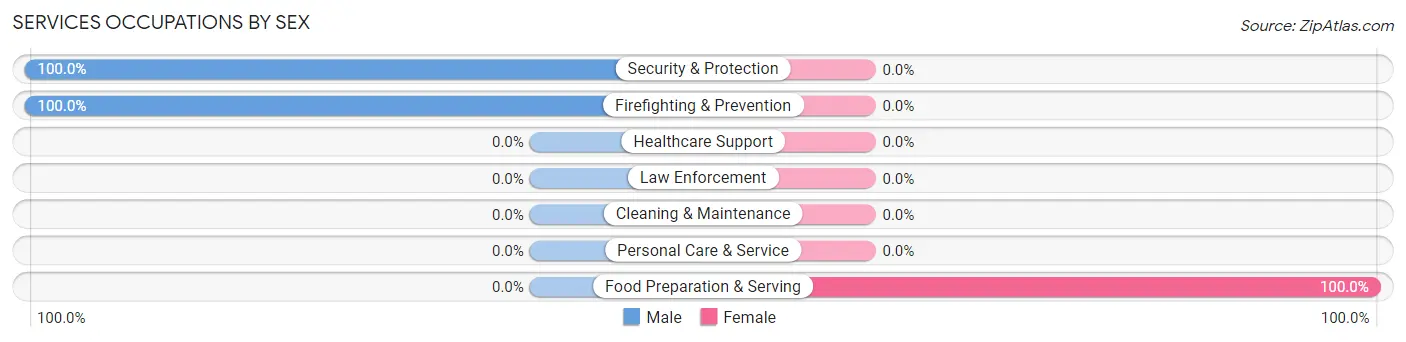
| Occupation | Male | Female |
| Healthcare Support | 0 (0.0%) | 0 (0.0%) |
| Security & Protection | 18 (100.0%) | 0 (0.0%) |
| Firefighting & Prevention | 18 (100.0%) | 0 (0.0%) |
| Law Enforcement | 0 (0.0%) | 0 (0.0%) |
| Food Preparation & Serving | 0 (0.0%) | 18 (100.0%) |
| Cleaning & Maintenance | 0 (0.0%) | 0 (0.0%) |
| Personal Care & Service | 0 (0.0%) | 0 (0.0%) |
| Total (Category) | 18 (50.0%) | 18 (50.0%) |
| Total (Overall) | 143 (59.8%) | 96 (40.2%) |
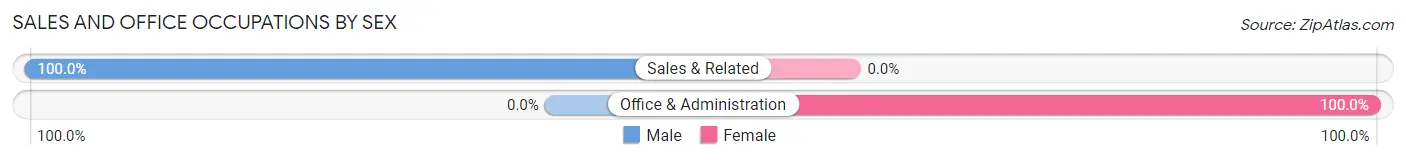
Sales and Office Occupations
The most common Sales and Office occupations in Hollis Crossroads are Sales & Related (26 | 10.9%), and Office & Administration (12 | 5.0%).
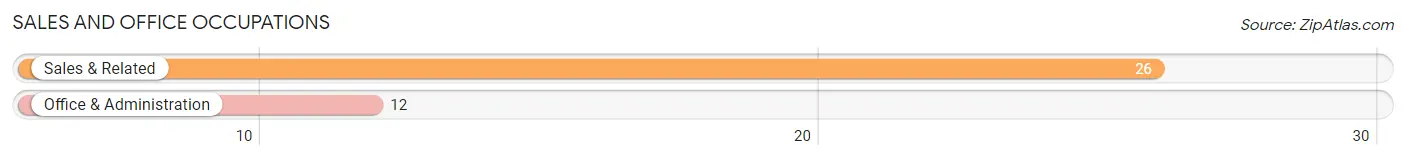
Sales and Office Occupations by Sex
| Occupation | Male | Female |
| Sales & Related | 26 (100.0%) | 0 (0.0%) |
| Office & Administration | 0 (0.0%) | 12 (100.0%) |
| Total (Category) | 26 (68.4%) | 12 (31.6%) |
| Total (Overall) | 143 (59.8%) | 96 (40.2%) |
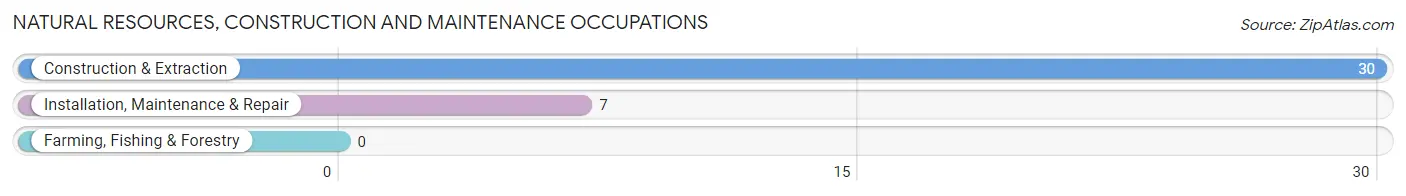
Natural Resources, Construction and Maintenance Occupations
The most common Natural Resources, Construction and Maintenance occupations in Hollis Crossroads are Construction & Extraction (30 | 12.6%), and Installation, Maintenance & Repair (7 | 2.9%).
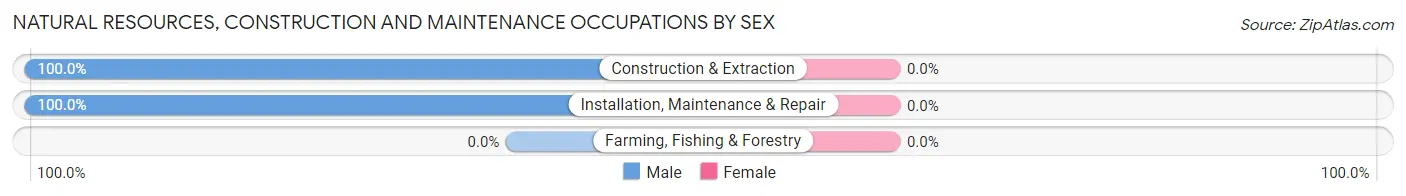
Natural Resources, Construction and Maintenance Occupations by Sex
| Occupation | Male | Female |
| Farming, Fishing & Forestry | 0 (0.0%) | 0 (0.0%) |
| Construction & Extraction | 30 (100.0%) | 0 (0.0%) |
| Installation, Maintenance & Repair | 7 (100.0%) | 0 (0.0%) |
| Total (Category) | 37 (100.0%) | 0 (0.0%) |
| Total (Overall) | 143 (59.8%) | 96 (40.2%) |
Production, Transportation and Moving Occupations
The most common Production, Transportation and Moving occupations in Hollis Crossroads are Production (27 | 11.3%), and Transportation (20 | 8.4%).
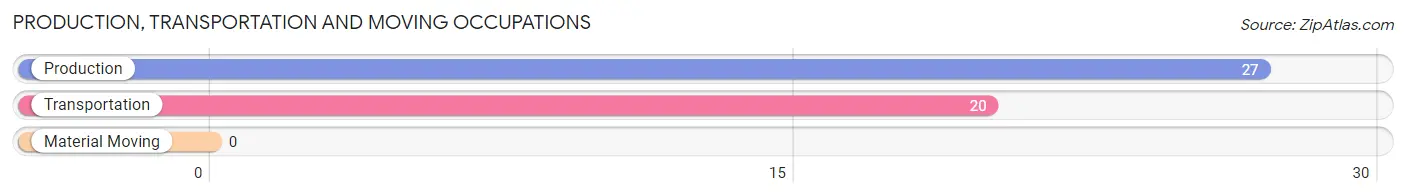
Production, Transportation and Moving Occupations by Sex
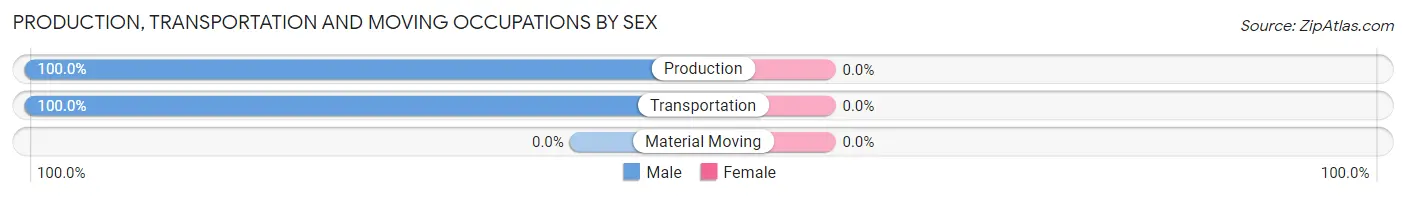
| Occupation | Male | Female |
| Production | 27 (100.0%) | 0 (0.0%) |
| Transportation | 20 (100.0%) | 0 (0.0%) |
| Material Moving | 0 (0.0%) | 0 (0.0%) |
| Total (Category) | 47 (100.0%) | 0 (0.0%) |
| Total (Overall) | 143 (59.8%) | 96 (40.2%) |
Employment Industries by Sex in Hollis Crossroads
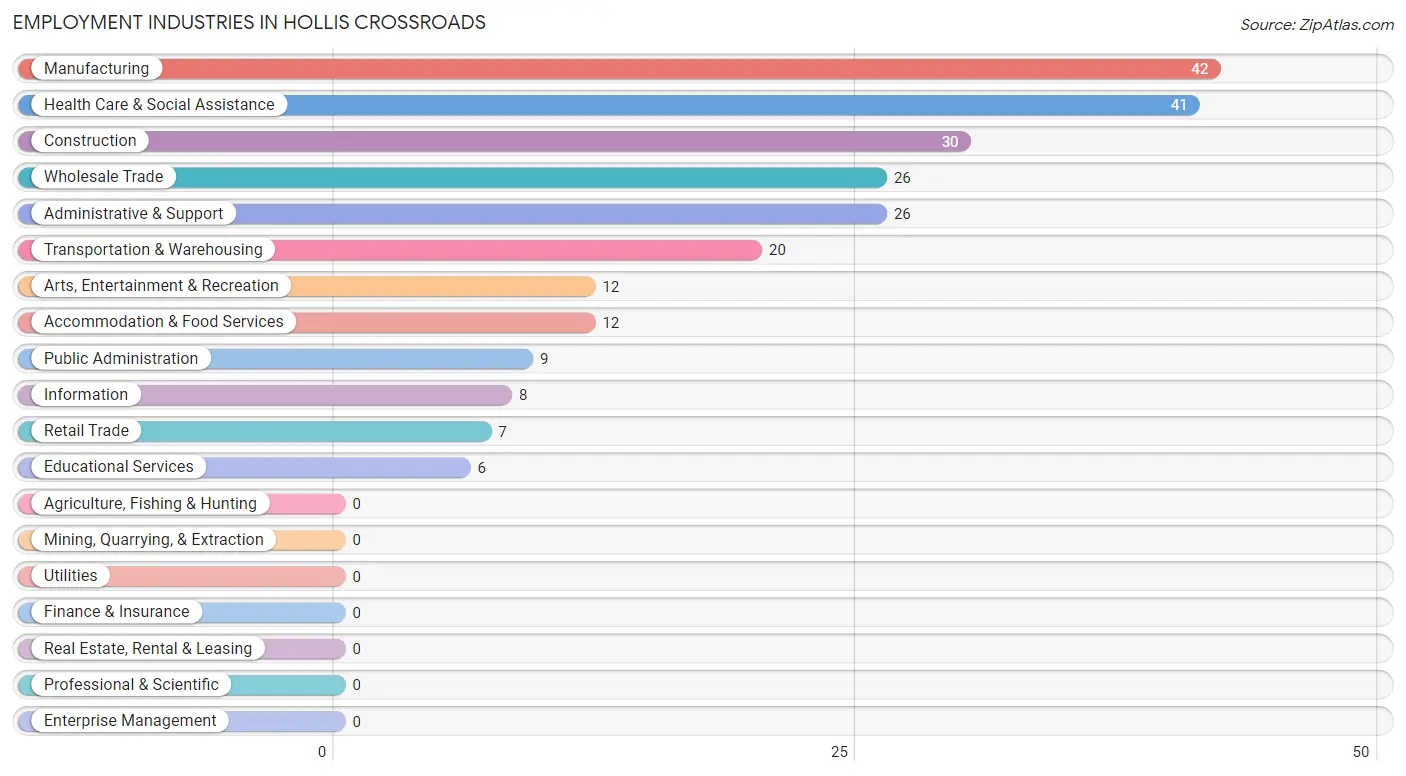
Employment Industries in Hollis Crossroads
The major employment industries in Hollis Crossroads include Manufacturing (42 | 17.6%), Health Care & Social Assistance (41 | 17.2%), Construction (30 | 12.6%), Wholesale Trade (26 | 10.9%), and Administrative & Support (26 | 10.9%).
Employment Industries by Sex in Hollis Crossroads
The Hollis Crossroads industries that see more men than women are Construction (100.0%), Manufacturing (100.0%), and Wholesale Trade (100.0%), whereas the industries that tend to have a higher number of women are Information (100.0%), Educational Services (100.0%), and Health Care & Social Assistance (100.0%).
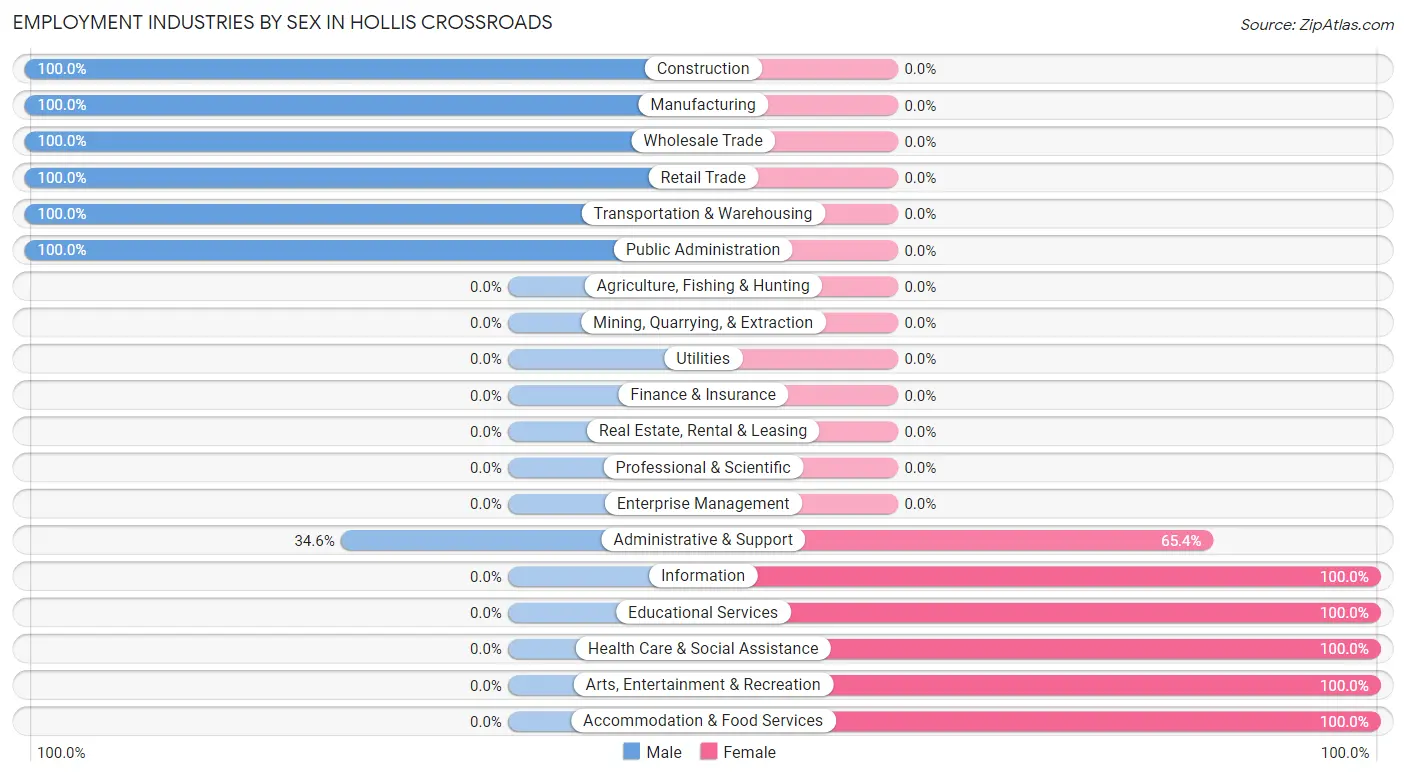
| Industry | Male | Female |
| Agriculture, Fishing & Hunting | 0 (0.0%) | 0 (0.0%) |
| Mining, Quarrying, & Extraction | 0 (0.0%) | 0 (0.0%) |
| Construction | 30 (100.0%) | 0 (0.0%) |
| Manufacturing | 42 (100.0%) | 0 (0.0%) |
| Wholesale Trade | 26 (100.0%) | 0 (0.0%) |
| Retail Trade | 7 (100.0%) | 0 (0.0%) |
| Transportation & Warehousing | 20 (100.0%) | 0 (0.0%) |
| Utilities | 0 (0.0%) | 0 (0.0%) |
| Information | 0 (0.0%) | 8 (100.0%) |
| Finance & Insurance | 0 (0.0%) | 0 (0.0%) |
| Real Estate, Rental & Leasing | 0 (0.0%) | 0 (0.0%) |
| Professional & Scientific | 0 (0.0%) | 0 (0.0%) |
| Enterprise Management | 0 (0.0%) | 0 (0.0%) |
| Administrative & Support | 9 (34.6%) | 17 (65.4%) |
| Educational Services | 0 (0.0%) | 6 (100.0%) |
| Health Care & Social Assistance | 0 (0.0%) | 41 (100.0%) |
| Arts, Entertainment & Recreation | 0 (0.0%) | 12 (100.0%) |
| Accommodation & Food Services | 0 (0.0%) | 12 (100.0%) |
| Public Administration | 9 (100.0%) | 0 (0.0%) |
| Total | 143 (59.8%) | 96 (40.2%) |
Education in Hollis Crossroads
School Enrollment in Hollis Crossroads
The most common levels of schooling among the 137 students in Hollis Crossroads are elementary school (43 | 31.4%), college / undergraduate (40 | 29.2%), and kindergarten (24 | 17.5%).
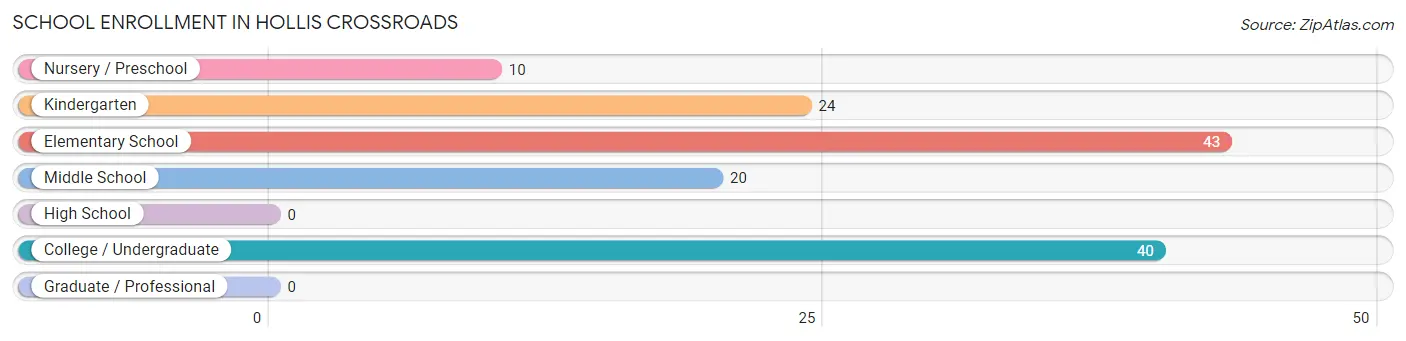
| School Level | # Students | % Students |
| Nursery / Preschool | 10 | 7.3% |
| Kindergarten | 24 | 17.5% |
| Elementary School | 43 | 31.4% |
| Middle School | 20 | 14.6% |
| High School | 0 | 0.0% |
| College / Undergraduate | 40 | 29.2% |
| Graduate / Professional | 0 | 0.0% |
| Total | 137 | 100.0% |
School Enrollment by Age by Funding Source in Hollis Crossroads
Out of a total of 137 students who are enrolled in schools in Hollis Crossroads, 36 (26.3%) attend a private institution, while the remaining 101 (73.7%) are enrolled in public schools. The age group of 3 to 4 year olds has the highest likelihood of being enrolled in private schools, with 10 (100.0% in the age bracket) enrolled. Conversely, the age group of 35 years and over has the lowest likelihood of being enrolled in a private school, with 23 (100.0% in the age bracket) attending a public institution.
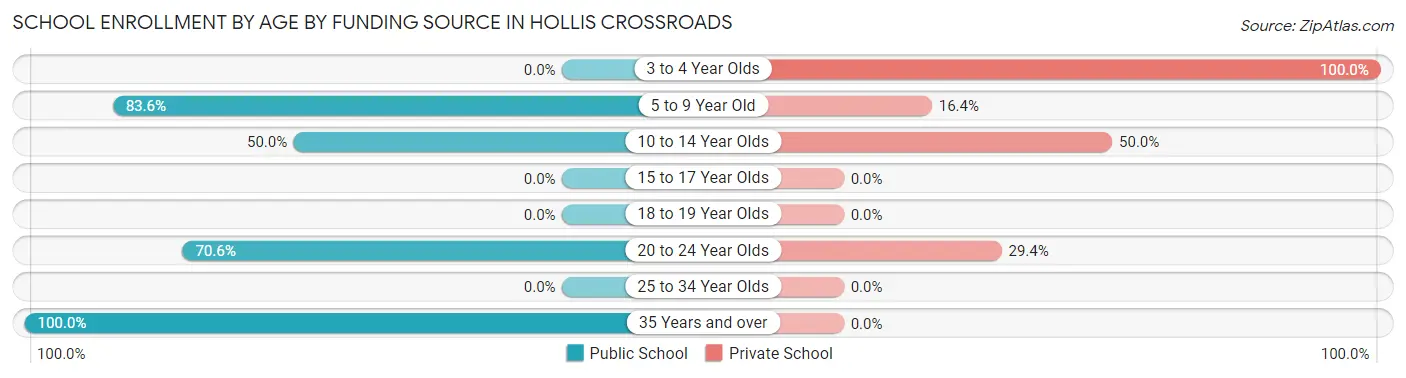
| Age Bracket | Public School | Private School |
| 3 to 4 Year Olds | 0 (0.0%) | 10 (100.0%) |
| 5 to 9 Year Old | 56 (83.6%) | 11 (16.4%) |
| 10 to 14 Year Olds | 10 (50.0%) | 10 (50.0%) |
| 15 to 17 Year Olds | 0 (0.0%) | 0 (0.0%) |
| 18 to 19 Year Olds | 0 (0.0%) | 0 (0.0%) |
| 20 to 24 Year Olds | 12 (70.6%) | 5 (29.4%) |
| 25 to 34 Year Olds | 0 (0.0%) | 0 (0.0%) |
| 35 Years and over | 23 (100.0%) | 0 (0.0%) |
| Total | 101 (73.7%) | 36 (26.3%) |
Educational Attainment by Field of Study in Hollis Crossroads
Business (11 | 52.4%), and science & technology (10 | 47.6%) are the most common fields of study among 21 individuals in Hollis Crossroads who have obtained a bachelor's degree or higher.
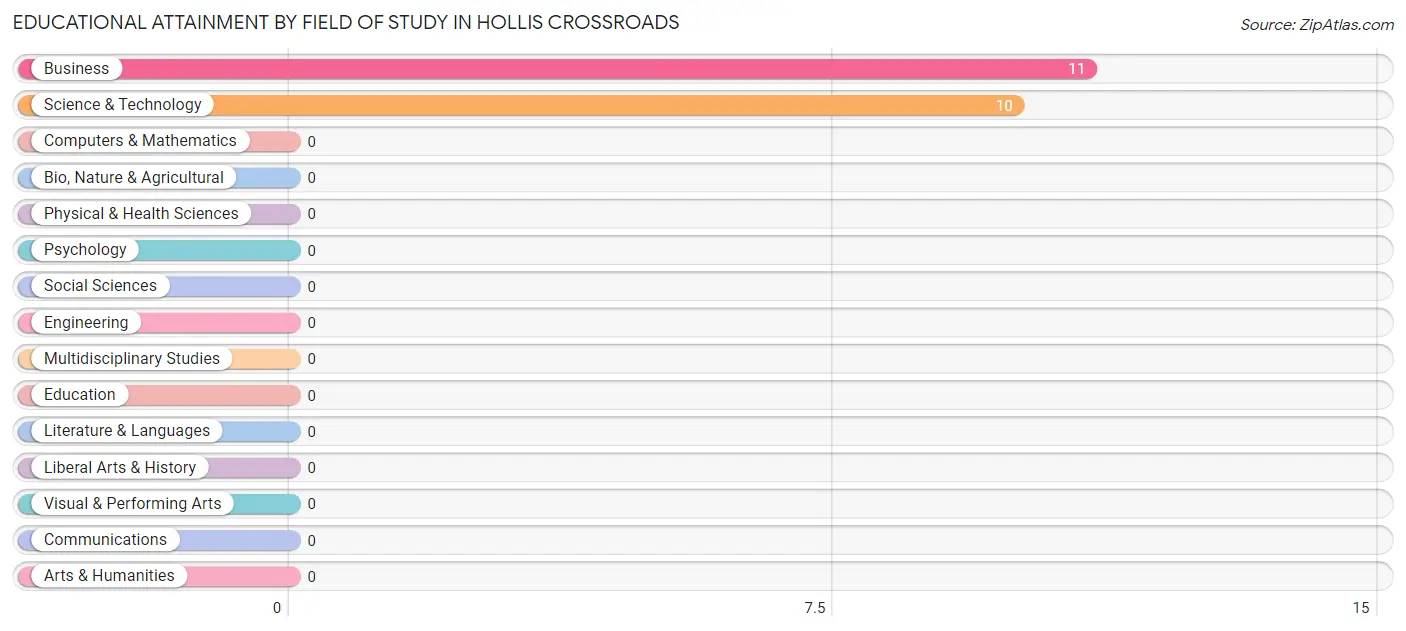
| Field of Study | # Graduates | % Graduates |
| Computers & Mathematics | 0 | 0.0% |
| Bio, Nature & Agricultural | 0 | 0.0% |
| Physical & Health Sciences | 0 | 0.0% |
| Psychology | 0 | 0.0% |
| Social Sciences | 0 | 0.0% |
| Engineering | 0 | 0.0% |
| Multidisciplinary Studies | 0 | 0.0% |
| Science & Technology | 10 | 47.6% |
| Business | 11 | 52.4% |
| Education | 0 | 0.0% |
| Literature & Languages | 0 | 0.0% |
| Liberal Arts & History | 0 | 0.0% |
| Visual & Performing Arts | 0 | 0.0% |
| Communications | 0 | 0.0% |
| Arts & Humanities | 0 | 0.0% |
| Total | 21 | 100.0% |
Transportation & Commute in Hollis Crossroads
Vehicle Availability by Sex in Hollis Crossroads
The most prevalent vehicle ownership categories in Hollis Crossroads are males with 2 vehicles (73, accounting for 51.0%) and females with 2 vehicles (43, making up 76.0%).
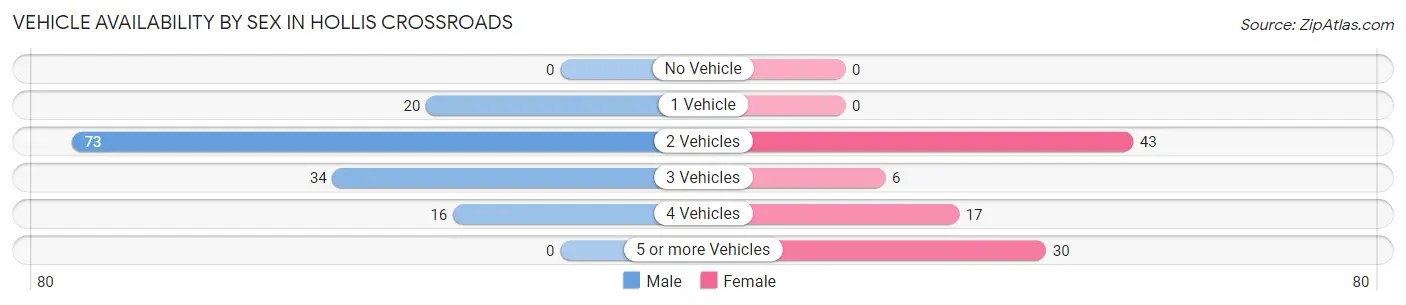
| Vehicles Available | Male | Female |
| No Vehicle | 0 (0.0%) | 0 (0.0%) |
| 1 Vehicle | 20 (14.0%) | 0 (0.0%) |
| 2 Vehicles | 73 (51.0%) | 43 (44.8%) |
| 3 Vehicles | 34 (23.8%) | 6 (6.2%) |
| 4 Vehicles | 16 (11.2%) | 17 (17.7%) |
| 5 or more Vehicles | 0 (0.0%) | 30 (31.2%) |
| Total | 143 (100.0%) | 96 (100.0%) |
Commute Time in Hollis Crossroads
The most frequently occuring commute durations in Hollis Crossroads are 30 to 34 minutes (45 commuters, 20.3%), 15 to 19 minutes (38 commuters, 17.1%), and 10 to 14 minutes (30 commuters, 13.5%).
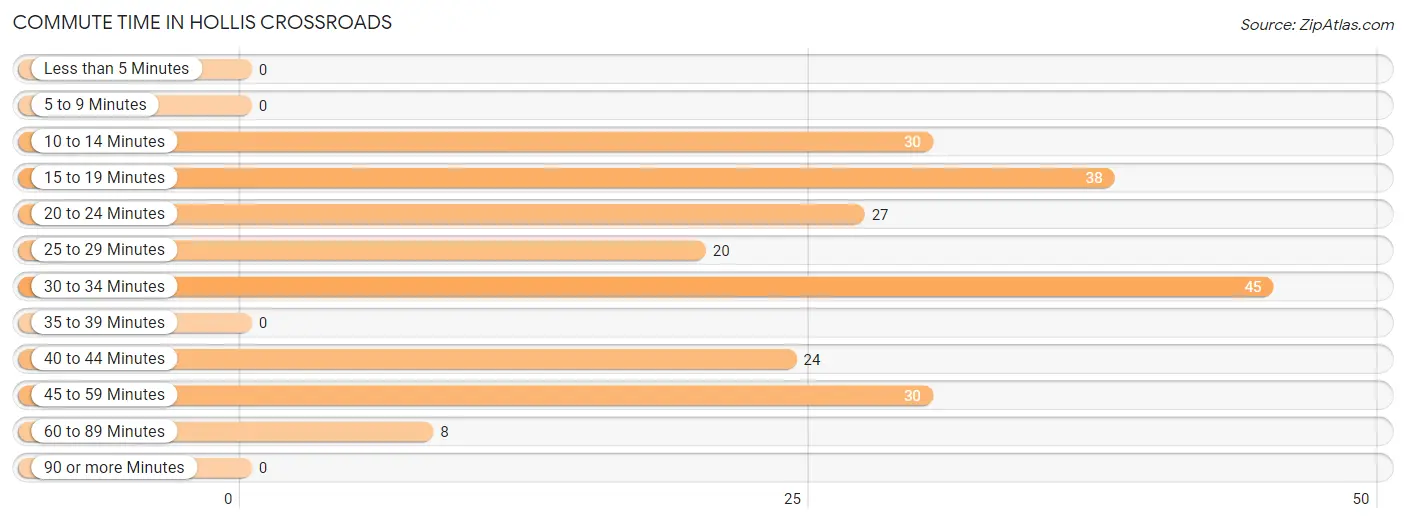
| Commute Time | # Commuters | % Commuters |
| Less than 5 Minutes | 0 | 0.0% |
| 5 to 9 Minutes | 0 | 0.0% |
| 10 to 14 Minutes | 30 | 13.5% |
| 15 to 19 Minutes | 38 | 17.1% |
| 20 to 24 Minutes | 27 | 12.2% |
| 25 to 29 Minutes | 20 | 9.0% |
| 30 to 34 Minutes | 45 | 20.3% |
| 35 to 39 Minutes | 0 | 0.0% |
| 40 to 44 Minutes | 24 | 10.8% |
| 45 to 59 Minutes | 30 | 13.5% |
| 60 to 89 Minutes | 8 | 3.6% |
| 90 or more Minutes | 0 | 0.0% |
Commute Time by Sex in Hollis Crossroads
The most common commute times in Hollis Crossroads are 45 to 59 minutes (30 commuters, 21.0%) for males and 30 to 34 minutes (30 commuters, 38.0%) for females.
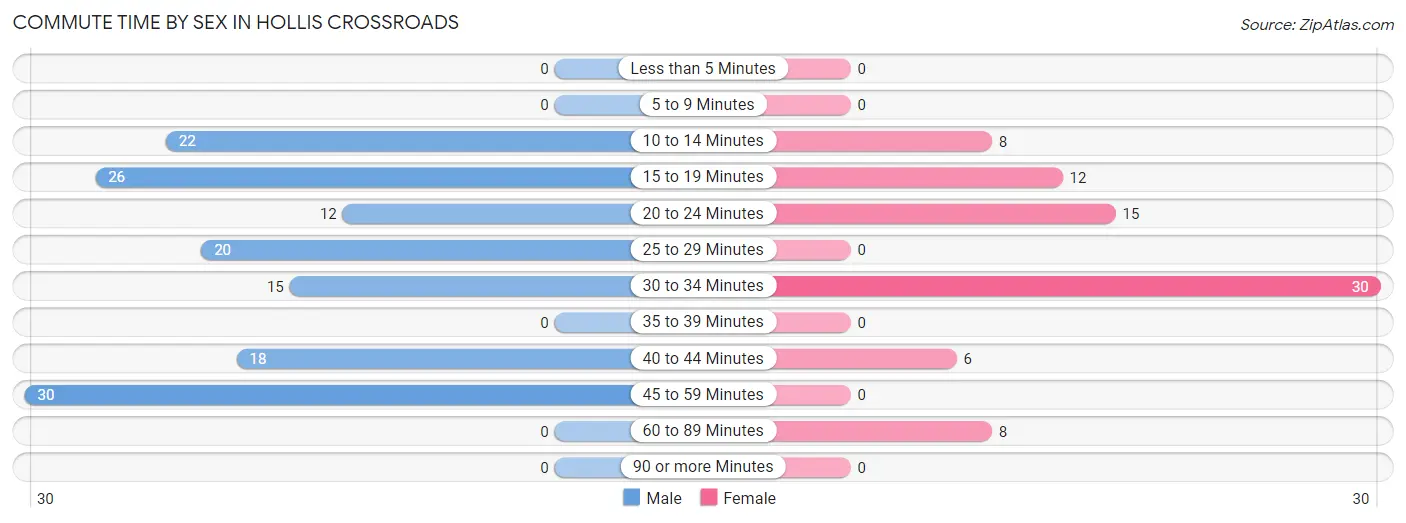
| Commute Time | Male | Female |
| Less than 5 Minutes | 0 (0.0%) | 0 (0.0%) |
| 5 to 9 Minutes | 0 (0.0%) | 0 (0.0%) |
| 10 to 14 Minutes | 22 (15.4%) | 8 (10.1%) |
| 15 to 19 Minutes | 26 (18.2%) | 12 (15.2%) |
| 20 to 24 Minutes | 12 (8.4%) | 15 (19.0%) |
| 25 to 29 Minutes | 20 (14.0%) | 0 (0.0%) |
| 30 to 34 Minutes | 15 (10.5%) | 30 (38.0%) |
| 35 to 39 Minutes | 0 (0.0%) | 0 (0.0%) |
| 40 to 44 Minutes | 18 (12.6%) | 6 (7.6%) |
| 45 to 59 Minutes | 30 (21.0%) | 0 (0.0%) |
| 60 to 89 Minutes | 0 (0.0%) | 8 (10.1%) |
| 90 or more Minutes | 0 (0.0%) | 0 (0.0%) |
Time of Departure to Work by Sex in Hollis Crossroads
The most frequent times of departure to work in Hollis Crossroads are 7:00 AM to 7:29 AM (34, 23.8%) for males and 6:00 AM to 6:29 AM (45, 57.0%) for females.
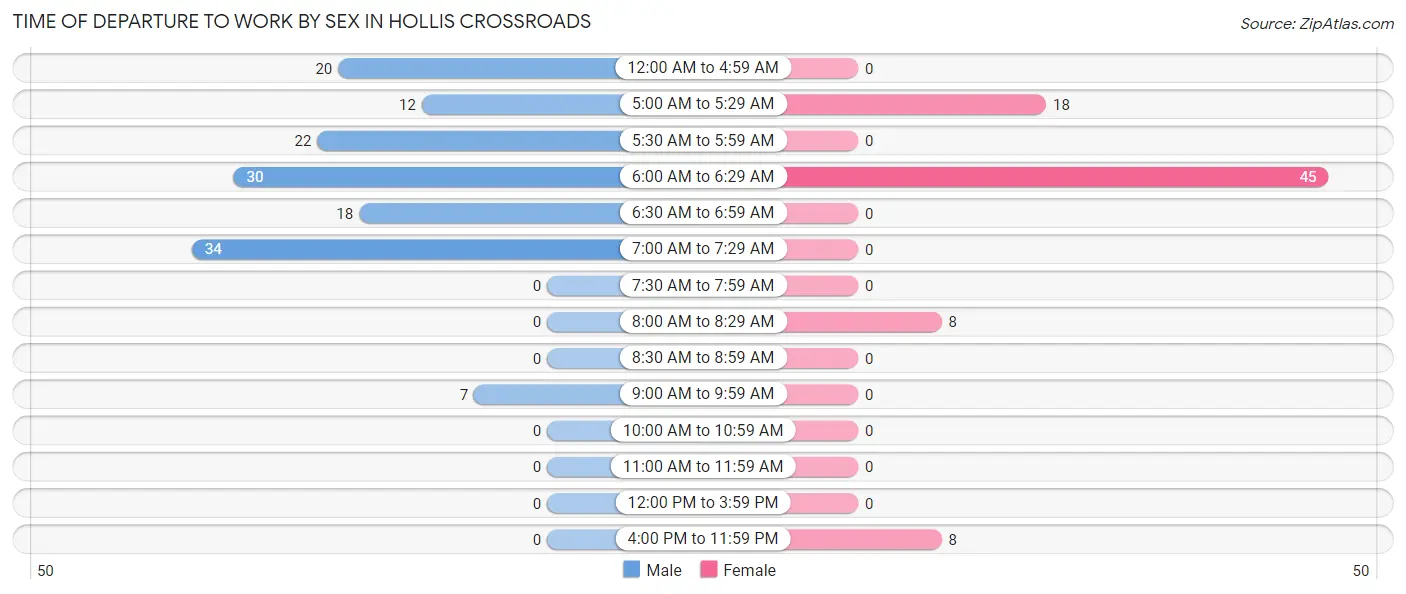
| Time of Departure | Male | Female |
| 12:00 AM to 4:59 AM | 20 (14.0%) | 0 (0.0%) |
| 5:00 AM to 5:29 AM | 12 (8.4%) | 18 (22.8%) |
| 5:30 AM to 5:59 AM | 22 (15.4%) | 0 (0.0%) |
| 6:00 AM to 6:29 AM | 30 (21.0%) | 45 (57.0%) |
| 6:30 AM to 6:59 AM | 18 (12.6%) | 0 (0.0%) |
| 7:00 AM to 7:29 AM | 34 (23.8%) | 0 (0.0%) |
| 7:30 AM to 7:59 AM | 0 (0.0%) | 0 (0.0%) |
| 8:00 AM to 8:29 AM | 0 (0.0%) | 8 (10.1%) |
| 8:30 AM to 8:59 AM | 0 (0.0%) | 0 (0.0%) |
| 9:00 AM to 9:59 AM | 7 (4.9%) | 0 (0.0%) |
| 10:00 AM to 10:59 AM | 0 (0.0%) | 0 (0.0%) |
| 11:00 AM to 11:59 AM | 0 (0.0%) | 0 (0.0%) |
| 12:00 PM to 3:59 PM | 0 (0.0%) | 0 (0.0%) |
| 4:00 PM to 11:59 PM | 0 (0.0%) | 8 (10.1%) |
| Total | 143 (100.0%) | 79 (100.0%) |
Housing Occupancy in Hollis Crossroads
Occupancy by Ownership in Hollis Crossroads
Of the total 197 dwellings in Hollis Crossroads, owner-occupied units account for 148 (75.1%), while renter-occupied units make up 49 (24.9%).
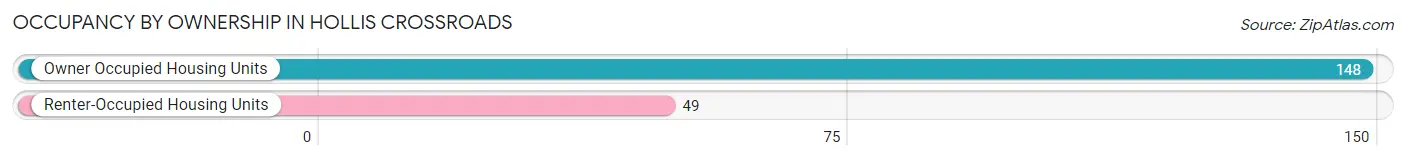
| Occupancy | # Housing Units | % Housing Units |
| Owner Occupied Housing Units | 148 | 75.1% |
| Renter-Occupied Housing Units | 49 | 24.9% |
| Total Occupied Housing Units | 197 | 100.0% |
Occupancy by Household Size in Hollis Crossroads
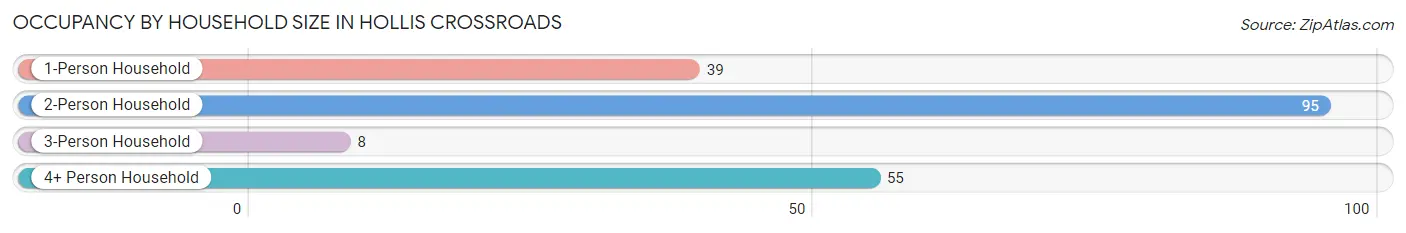
| Household Size | # Housing Units | % Housing Units |
| 1-Person Household | 39 | 19.8% |
| 2-Person Household | 95 | 48.2% |
| 3-Person Household | 8 | 4.1% |
| 4+ Person Household | 55 | 27.9% |
| Total Housing Units | 197 | 100.0% |
Occupancy by Ownership by Household Size in Hollis Crossroads
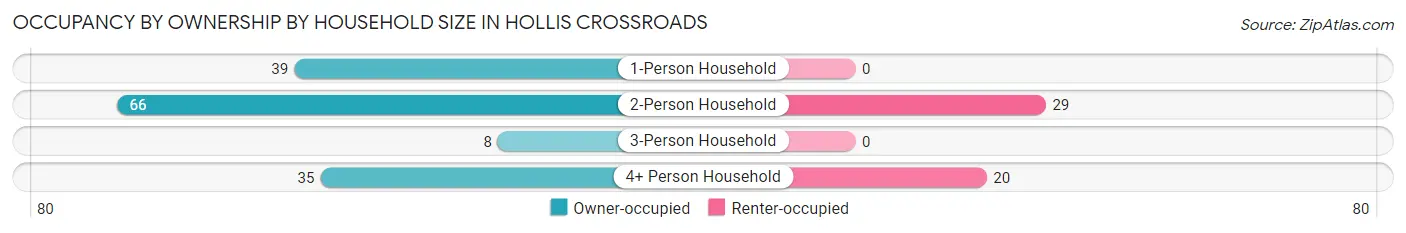
| Household Size | Owner-occupied | Renter-occupied |
| 1-Person Household | 39 (100.0%) | 0 (0.0%) |
| 2-Person Household | 66 (69.5%) | 29 (30.5%) |
| 3-Person Household | 8 (100.0%) | 0 (0.0%) |
| 4+ Person Household | 35 (63.6%) | 20 (36.4%) |
| Total Housing Units | 148 (75.1%) | 49 (24.9%) |
Occupancy by Educational Attainment in Hollis Crossroads
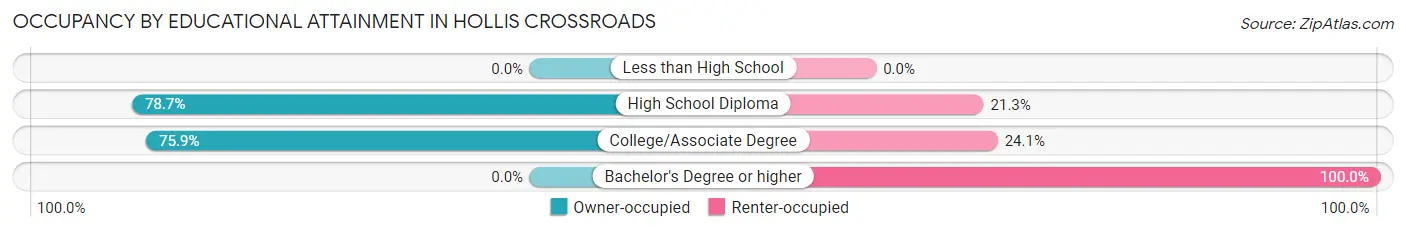
| Household Size | Owner-occupied | Renter-occupied |
| Less than High School | 0 (0.0%) | 0 (0.0%) |
| High School Diploma | 85 (78.7%) | 23 (21.3%) |
| College/Associate Degree | 63 (75.9%) | 20 (24.1%) |
| Bachelor's Degree or higher | 0 (0.0%) | 6 (100.0%) |
Occupancy by Age of Householder in Hollis Crossroads
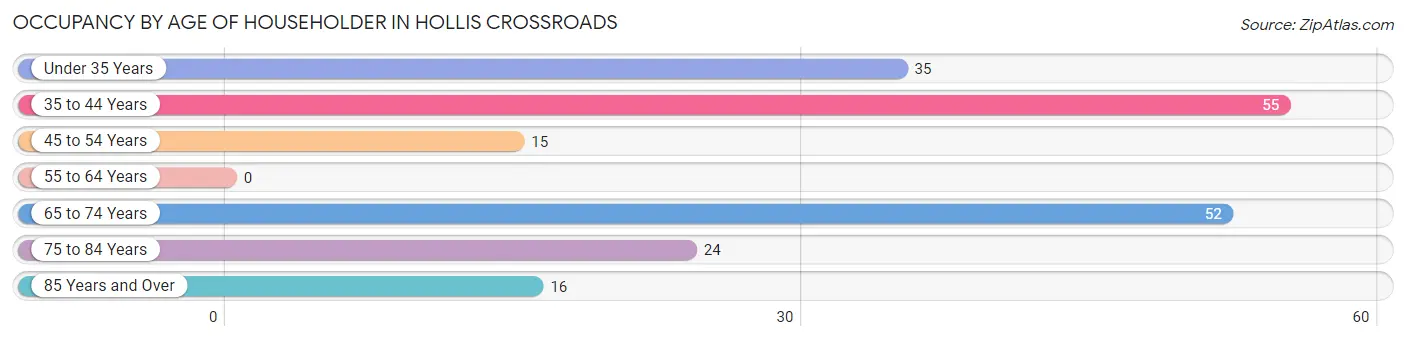
| Age Bracket | # Households | % Households |
| Under 35 Years | 35 | 17.8% |
| 35 to 44 Years | 55 | 27.9% |
| 45 to 54 Years | 15 | 7.6% |
| 55 to 64 Years | 0 | 0.0% |
| 65 to 74 Years | 52 | 26.4% |
| 75 to 84 Years | 24 | 12.2% |
| 85 Years and Over | 16 | 8.1% |
| Total | 197 | 100.0% |
Housing Finances in Hollis Crossroads
Median Income by Occupancy in Hollis Crossroads
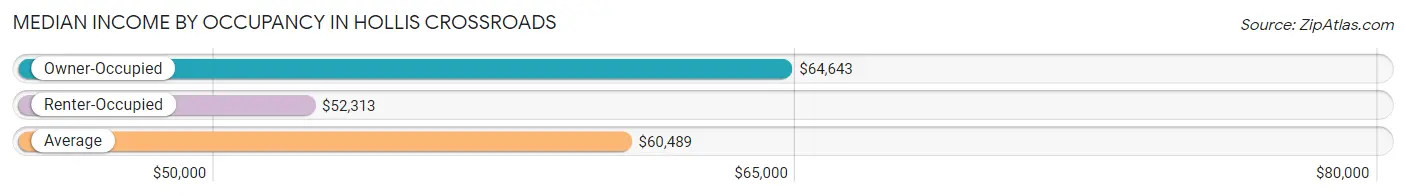
| Occupancy Type | # Households | Median Income |
| Owner-Occupied | 148 (75.1%) | $64,643 |
| Renter-Occupied | 49 (24.9%) | $52,313 |
| Average | 197 (100.0%) | $60,489 |
Occupancy by Householder Income Bracket in Hollis Crossroads
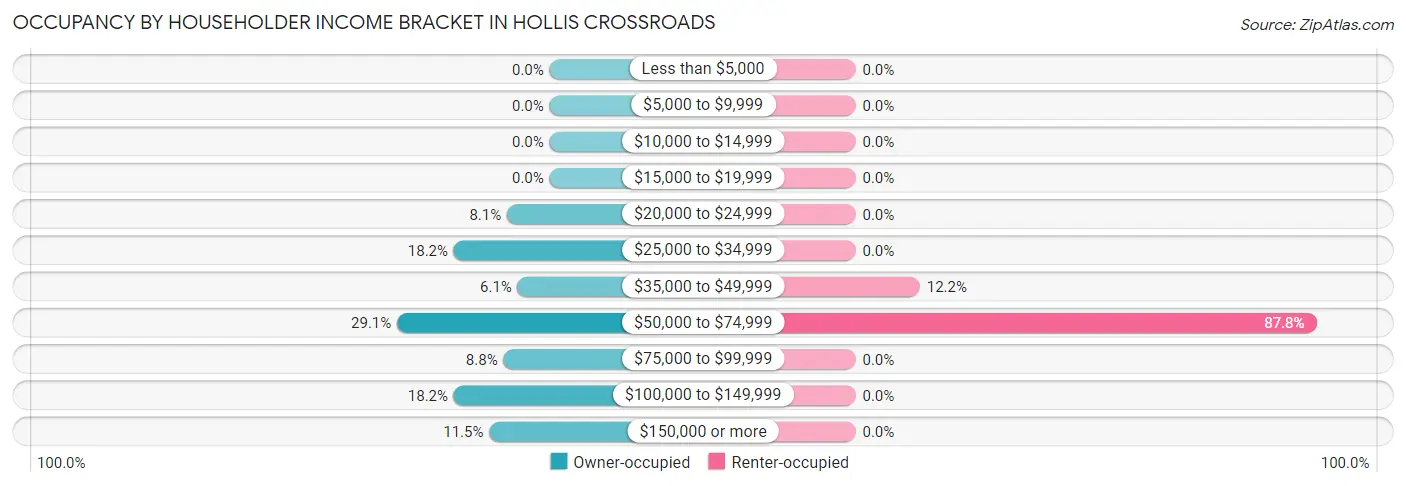
| Income Bracket | Owner-occupied | Renter-occupied |
| Less than $5,000 | 0 (0.0%) | 0 (0.0%) |
| $5,000 to $9,999 | 0 (0.0%) | 0 (0.0%) |
| $10,000 to $14,999 | 0 (0.0%) | 0 (0.0%) |
| $15,000 to $19,999 | 0 (0.0%) | 0 (0.0%) |
| $20,000 to $24,999 | 12 (8.1%) | 0 (0.0%) |
| $25,000 to $34,999 | 27 (18.2%) | 0 (0.0%) |
| $35,000 to $49,999 | 9 (6.1%) | 6 (12.2%) |
| $50,000 to $74,999 | 43 (29.0%) | 43 (87.8%) |
| $75,000 to $99,999 | 13 (8.8%) | 0 (0.0%) |
| $100,000 to $149,999 | 27 (18.2%) | 0 (0.0%) |
| $150,000 or more | 17 (11.5%) | 0 (0.0%) |
| Total | 148 (100.0%) | 49 (100.0%) |
Monthly Housing Cost Tiers in Hollis Crossroads
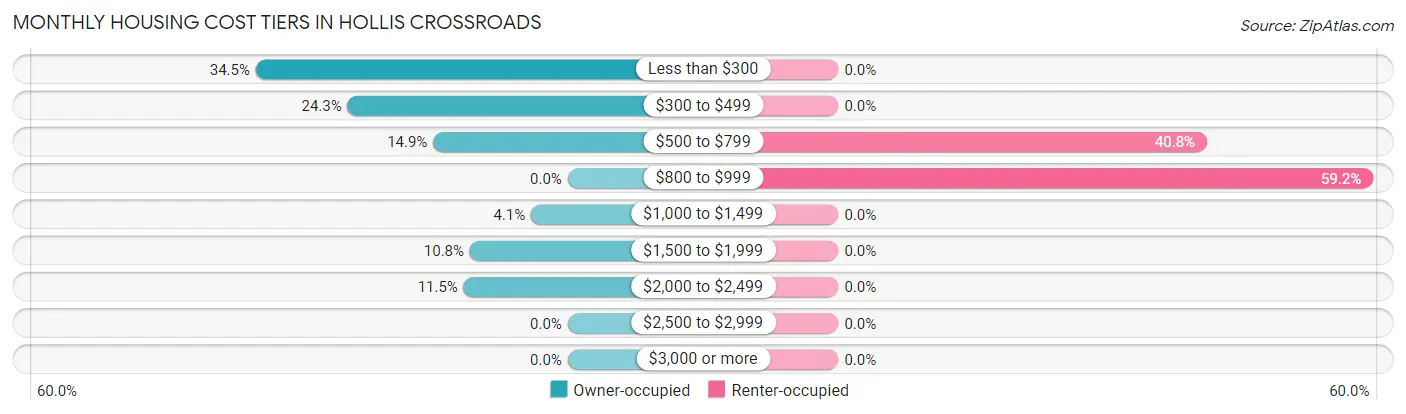
| Monthly Cost | Owner-occupied | Renter-occupied |
| Less than $300 | 51 (34.5%) | 0 (0.0%) |
| $300 to $499 | 36 (24.3%) | 0 (0.0%) |
| $500 to $799 | 22 (14.9%) | 20 (40.8%) |
| $800 to $999 | 0 (0.0%) | 29 (59.2%) |
| $1,000 to $1,499 | 6 (4.1%) | 0 (0.0%) |
| $1,500 to $1,999 | 16 (10.8%) | 0 (0.0%) |
| $2,000 to $2,499 | 17 (11.5%) | 0 (0.0%) |
| $2,500 to $2,999 | 0 (0.0%) | 0 (0.0%) |
| $3,000 or more | 0 (0.0%) | 0 (0.0%) |
| Total | 148 (100.0%) | 49 (100.0%) |
Physical Housing Characteristics in Hollis Crossroads
Housing Structures in Hollis Crossroads
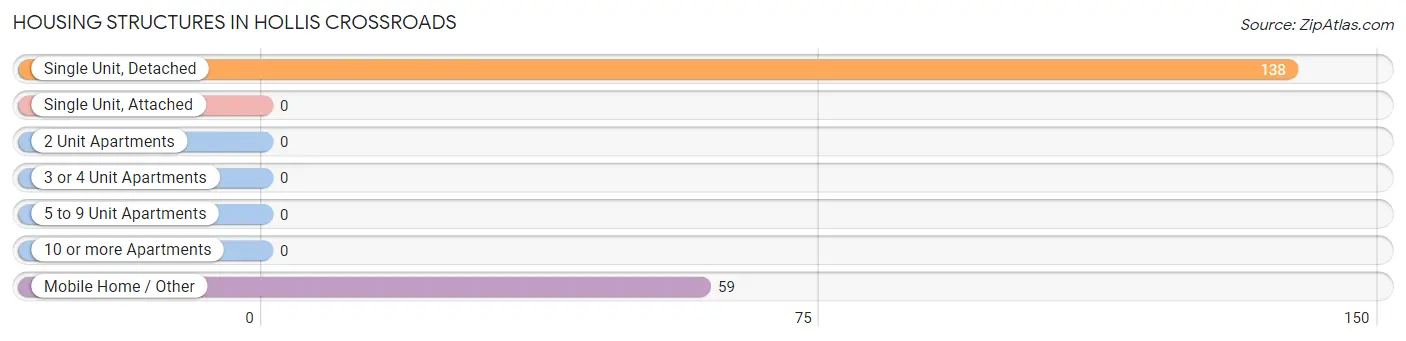
| Structure Type | # Housing Units | % Housing Units |
| Single Unit, Detached | 138 | 70.1% |
| Single Unit, Attached | 0 | 0.0% |
| 2 Unit Apartments | 0 | 0.0% |
| 3 or 4 Unit Apartments | 0 | 0.0% |
| 5 to 9 Unit Apartments | 0 | 0.0% |
| 10 or more Apartments | 0 | 0.0% |
| Mobile Home / Other | 59 | 29.9% |
| Total | 197 | 100.0% |
Housing Structures by Occupancy in Hollis Crossroads
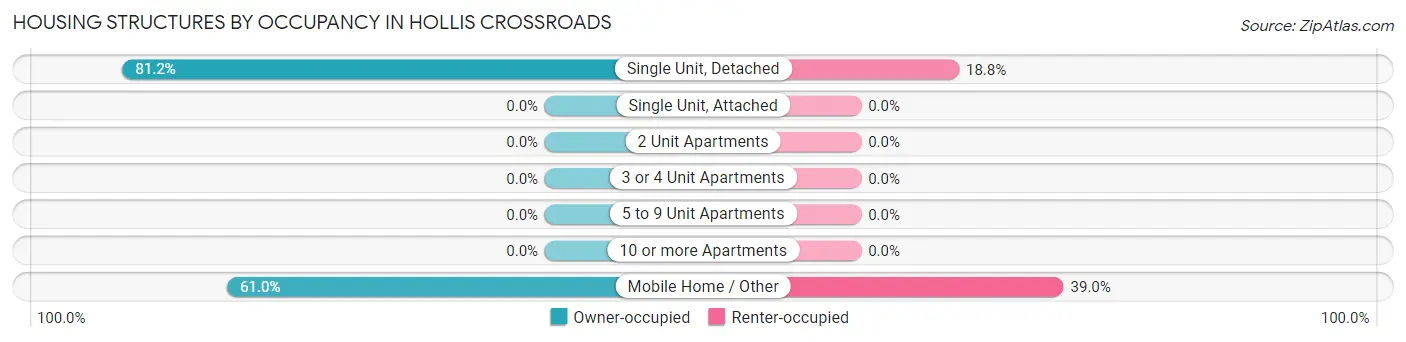
| Structure Type | Owner-occupied | Renter-occupied |
| Single Unit, Detached | 112 (81.2%) | 26 (18.8%) |
| Single Unit, Attached | 0 (0.0%) | 0 (0.0%) |
| 2 Unit Apartments | 0 (0.0%) | 0 (0.0%) |
| 3 or 4 Unit Apartments | 0 (0.0%) | 0 (0.0%) |
| 5 to 9 Unit Apartments | 0 (0.0%) | 0 (0.0%) |
| 10 or more Apartments | 0 (0.0%) | 0 (0.0%) |
| Mobile Home / Other | 36 (61.0%) | 23 (39.0%) |
| Total | 148 (75.1%) | 49 (24.9%) |
Housing Structures by Number of Rooms in Hollis Crossroads
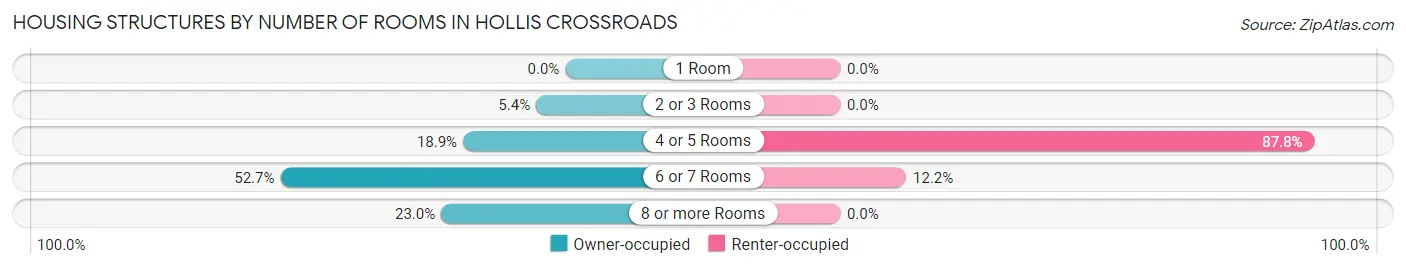
| Number of Rooms | Owner-occupied | Renter-occupied |
| 1 Room | 0 (0.0%) | 0 (0.0%) |
| 2 or 3 Rooms | 8 (5.4%) | 0 (0.0%) |
| 4 or 5 Rooms | 28 (18.9%) | 43 (87.8%) |
| 6 or 7 Rooms | 78 (52.7%) | 6 (12.2%) |
| 8 or more Rooms | 34 (23.0%) | 0 (0.0%) |
| Total | 148 (100.0%) | 49 (100.0%) |
Housing Structure by Heating Type in Hollis Crossroads
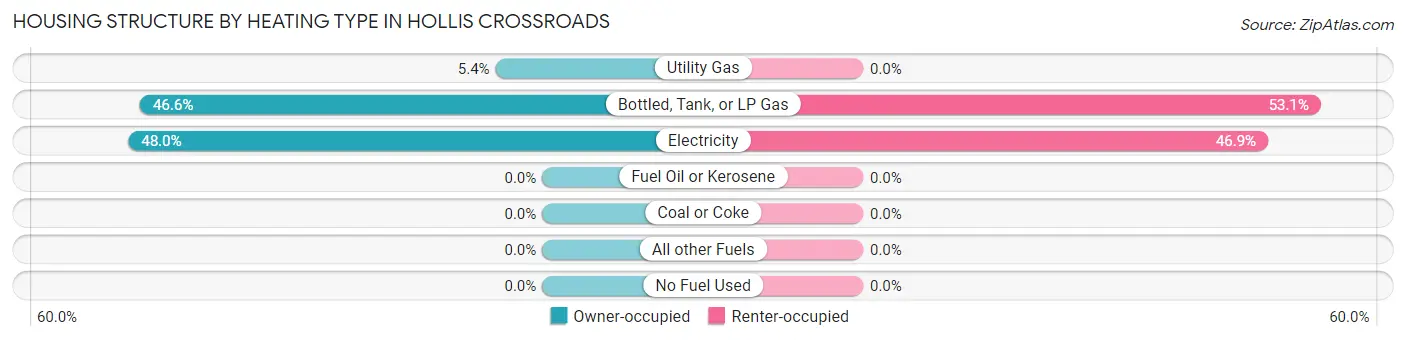
| Heating Type | Owner-occupied | Renter-occupied |
| Utility Gas | 8 (5.4%) | 0 (0.0%) |
| Bottled, Tank, or LP Gas | 69 (46.6%) | 26 (53.1%) |
| Electricity | 71 (48.0%) | 23 (46.9%) |
| Fuel Oil or Kerosene | 0 (0.0%) | 0 (0.0%) |
| Coal or Coke | 0 (0.0%) | 0 (0.0%) |
| All other Fuels | 0 (0.0%) | 0 (0.0%) |
| No Fuel Used | 0 (0.0%) | 0 (0.0%) |
| Total | 148 (100.0%) | 49 (100.0%) |
Household Vehicle Usage in Hollis Crossroads
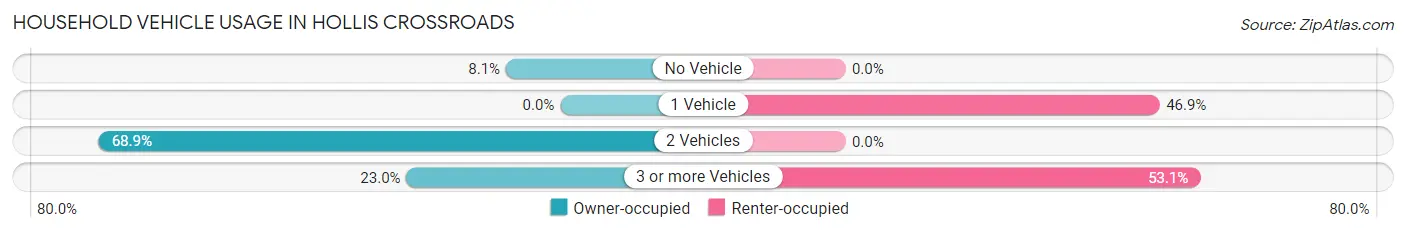
| Vehicles per Household | Owner-occupied | Renter-occupied |
| No Vehicle | 12 (8.1%) | 0 (0.0%) |
| 1 Vehicle | 0 (0.0%) | 23 (46.9%) |
| 2 Vehicles | 102 (68.9%) | 0 (0.0%) |
| 3 or more Vehicles | 34 (23.0%) | 26 (53.1%) |
| Total | 148 (100.0%) | 49 (100.0%) |
Real Estate & Mortgages in Hollis Crossroads
Real Estate and Mortgage Overview in Hollis Crossroads
| Characteristic | Without Mortgage | With Mortgage |
| Housing Units | 104 | 44 |
| Median Property Value | $121,900 | $211,800 |
| Median Household Income | $53,750 | $17 |
| Monthly Housing Costs | $306 | $0 |
| Real Estate Taxes | $372 | $0 |
Property Value by Mortgage Status in Hollis Crossroads
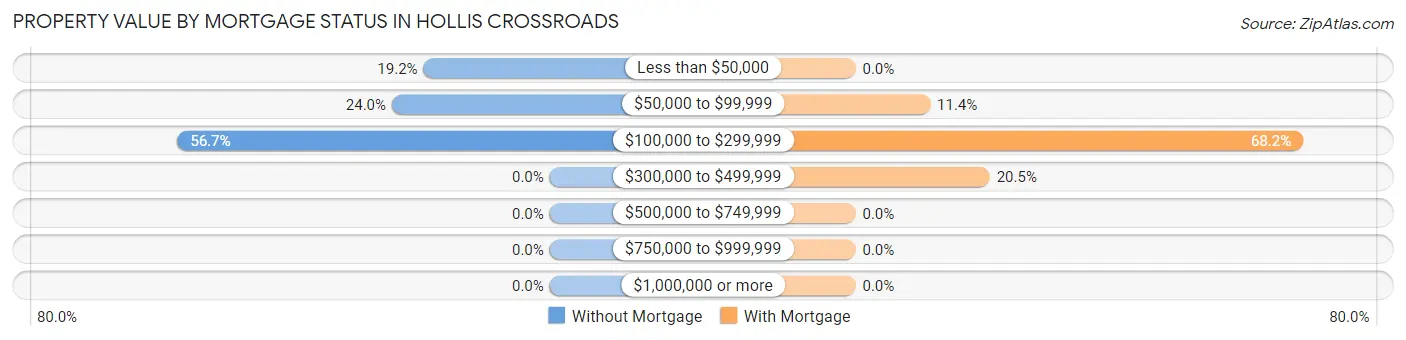
| Property Value | Without Mortgage | With Mortgage |
| Less than $50,000 | 20 (19.2%) | 0 (0.0%) |
| $50,000 to $99,999 | 25 (24.0%) | 5 (11.4%) |
| $100,000 to $299,999 | 59 (56.7%) | 30 (68.2%) |
| $300,000 to $499,999 | 0 (0.0%) | 9 (20.4%) |
| $500,000 to $749,999 | 0 (0.0%) | 0 (0.0%) |
| $750,000 to $999,999 | 0 (0.0%) | 0 (0.0%) |
| $1,000,000 or more | 0 (0.0%) | 0 (0.0%) |
| Total | 104 (100.0%) | 44 (100.0%) |
Household Income by Mortgage Status in Hollis Crossroads
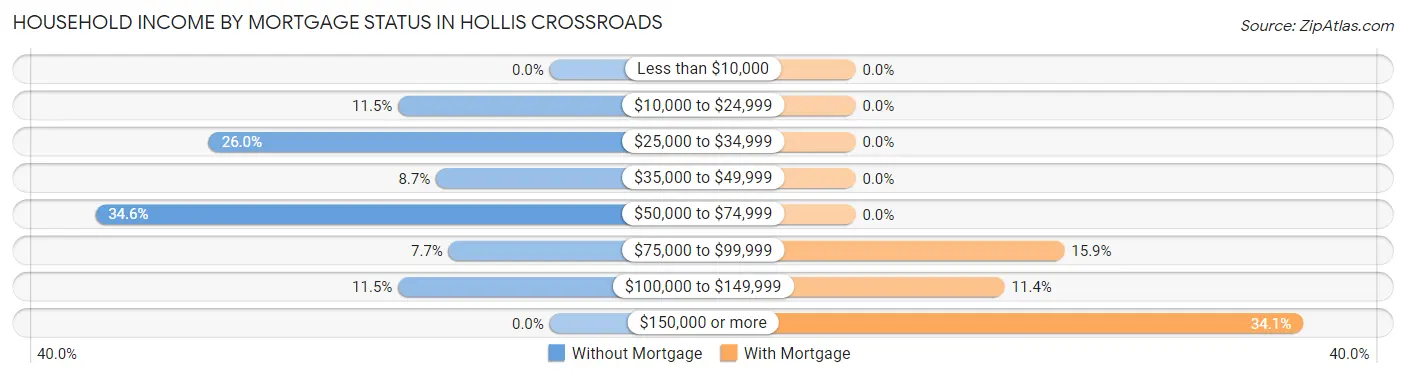
| Household Income | Without Mortgage | With Mortgage |
| Less than $10,000 | 0 (0.0%) | 0 (0.0%) |
| $10,000 to $24,999 | 12 (11.5%) | 0 (0.0%) |
| $25,000 to $34,999 | 27 (26.0%) | 0 (0.0%) |
| $35,000 to $49,999 | 9 (8.6%) | 0 (0.0%) |
| $50,000 to $74,999 | 36 (34.6%) | 0 (0.0%) |
| $75,000 to $99,999 | 8 (7.7%) | 7 (15.9%) |
| $100,000 to $149,999 | 12 (11.5%) | 5 (11.4%) |
| $150,000 or more | 0 (0.0%) | 15 (34.1%) |
| Total | 104 (100.0%) | 44 (100.0%) |
Property Value to Household Income Ratio in Hollis Crossroads
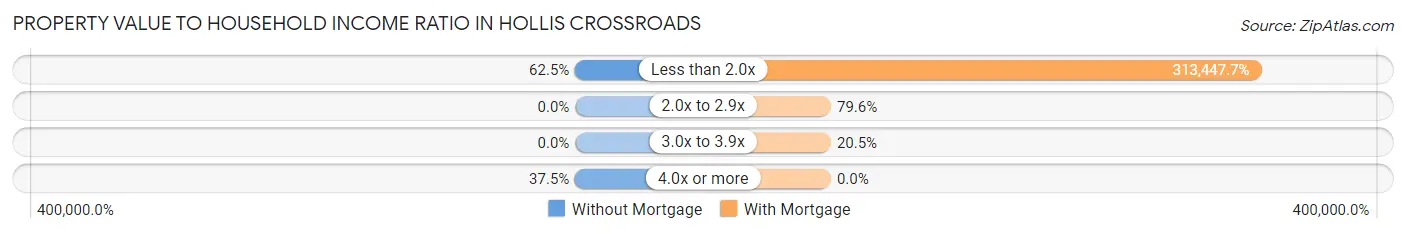
| Value-to-Income Ratio | Without Mortgage | With Mortgage |
| Less than 2.0x | 65 (62.5%) | 137,917 (313,447.7%) |
| 2.0x to 2.9x | 0 (0.0%) | 35 (79.5%) |
| 3.0x to 3.9x | 0 (0.0%) | 9 (20.4%) |
| 4.0x or more | 39 (37.5%) | 0 (0.0%) |
| Total | 104 (100.0%) | 44 (100.0%) |
Real Estate Taxes by Mortgage Status in Hollis Crossroads
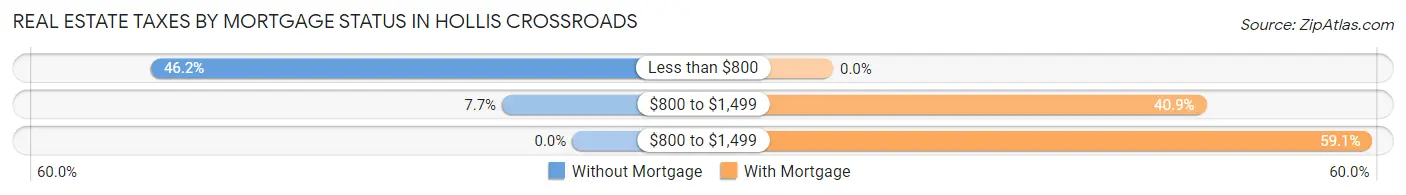
| Property Taxes | Without Mortgage | With Mortgage |
| Less than $800 | 48 (46.2%) | 0 (0.0%) |
| $800 to $1,499 | 8 (7.7%) | 18 (40.9%) |
| $800 to $1,499 | 0 (0.0%) | 26 (59.1%) |
| Total | 104 (100.0%) | 44 (100.0%) |
Health & Disability in Hollis Crossroads
Health Insurance Coverage by Age in Hollis Crossroads
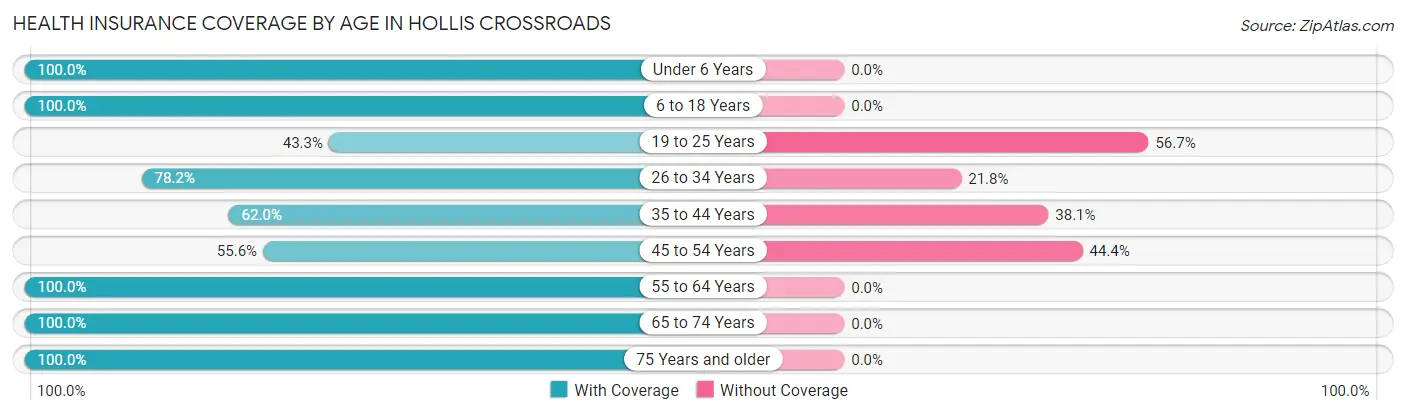
| Age Bracket | With Coverage | Without Coverage |
| Under 6 Years | 101 (100.0%) | 0 (0.0%) |
| 6 to 18 Years | 63 (100.0%) | 0 (0.0%) |
| 19 to 25 Years | 29 (43.3%) | 38 (56.7%) |
| 26 to 34 Years | 43 (78.2%) | 12 (21.8%) |
| 35 to 44 Years | 70 (62.0%) | 43 (38.1%) |
| 45 to 54 Years | 25 (55.6%) | 20 (44.4%) |
| 55 to 64 Years | 12 (100.0%) | 0 (0.0%) |
| 65 to 74 Years | 89 (100.0%) | 0 (0.0%) |
| 75 Years and older | 62 (100.0%) | 0 (0.0%) |
| Total | 494 (81.4%) | 113 (18.6%) |
Health Insurance Coverage by Citizenship Status in Hollis Crossroads
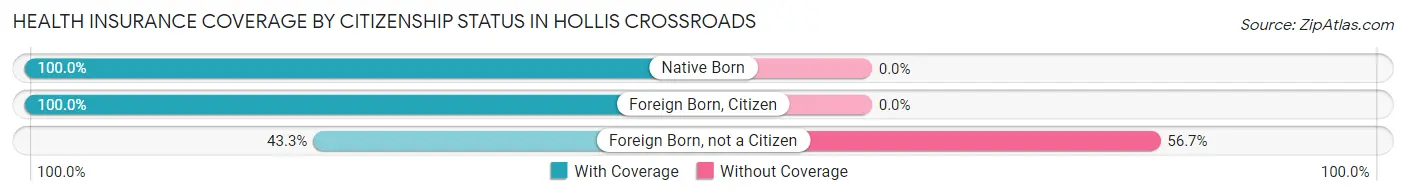
| Citizenship Status | With Coverage | Without Coverage |
| Native Born | 101 (100.0%) | 0 (0.0%) |
| Foreign Born, Citizen | 63 (100.0%) | 0 (0.0%) |
| Foreign Born, not a Citizen | 29 (43.3%) | 38 (56.7%) |
Health Insurance Coverage by Household Income in Hollis Crossroads
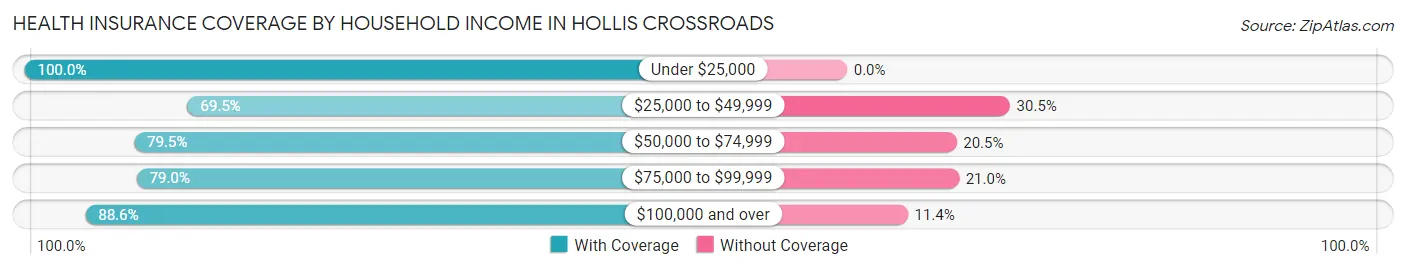
| Household Income | With Coverage | Without Coverage |
| Under $25,000 | 12 (100.0%) | 0 (0.0%) |
| $25,000 to $49,999 | 41 (69.5%) | 18 (30.5%) |
| $50,000 to $74,999 | 244 (79.5%) | 63 (20.5%) |
| $75,000 to $99,999 | 49 (79.0%) | 13 (21.0%) |
| $100,000 and over | 148 (88.6%) | 19 (11.4%) |
Public vs Private Health Insurance Coverage by Age in Hollis Crossroads
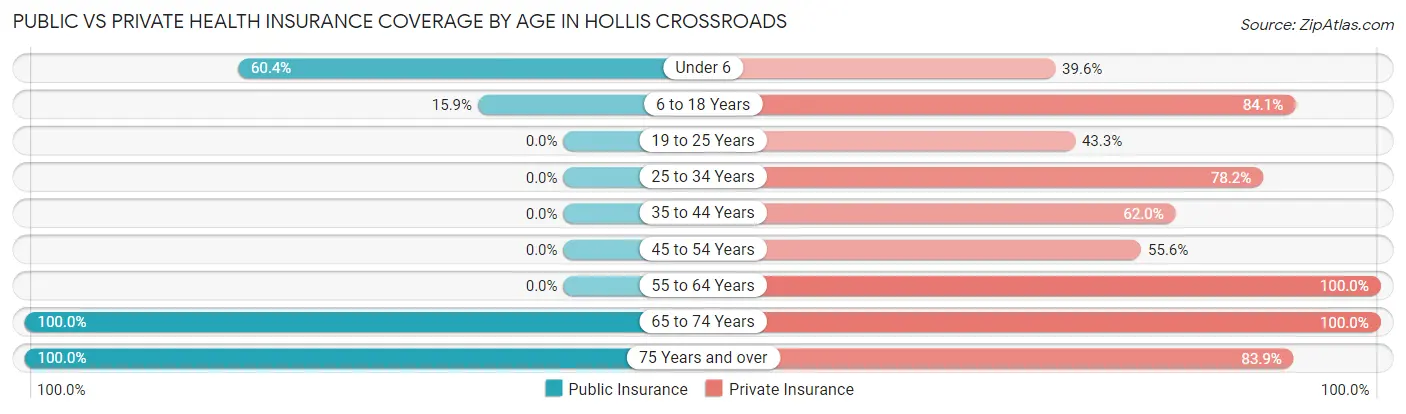
| Age Bracket | Public Insurance | Private Insurance |
| Under 6 | 61 (60.4%) | 40 (39.6%) |
| 6 to 18 Years | 10 (15.9%) | 53 (84.1%) |
| 19 to 25 Years | 0 (0.0%) | 29 (43.3%) |
| 25 to 34 Years | 0 (0.0%) | 43 (78.2%) |
| 35 to 44 Years | 0 (0.0%) | 70 (62.0%) |
| 45 to 54 Years | 0 (0.0%) | 25 (55.6%) |
| 55 to 64 Years | 0 (0.0%) | 12 (100.0%) |
| 65 to 74 Years | 89 (100.0%) | 89 (100.0%) |
| 75 Years and over | 62 (100.0%) | 52 (83.9%) |
| Total | 222 (36.6%) | 413 (68.0%) |
Disability Status by Sex by Age in Hollis Crossroads
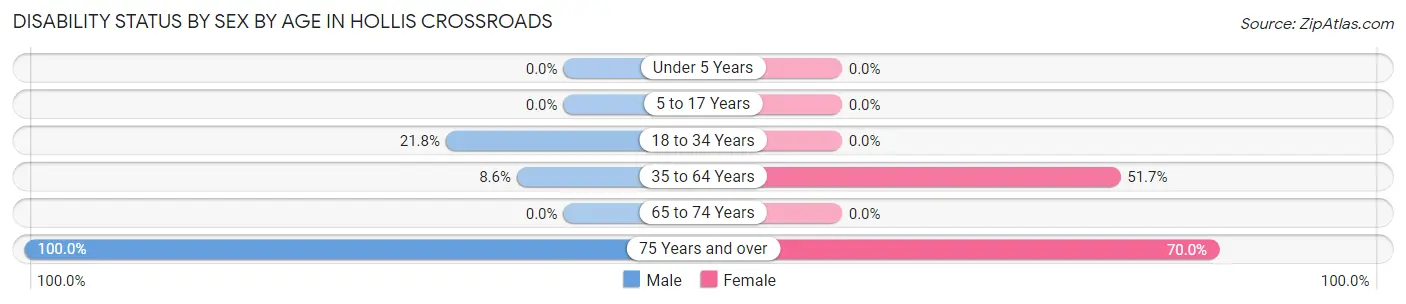
| Age Bracket | Male | Female |
| Under 5 Years | 0 (0.0%) | 0 (0.0%) |
| 5 to 17 Years | 0 (0.0%) | 0 (0.0%) |
| 18 to 34 Years | 12 (21.8%) | 0 (0.0%) |
| 35 to 64 Years | 7 (8.6%) | 46 (51.7%) |
| 65 to 74 Years | 0 (0.0%) | 0 (0.0%) |
| 75 Years and over | 22 (100.0%) | 28 (70.0%) |
Disability Class by Sex by Age in Hollis Crossroads
Disability Class: Hearing Difficulty
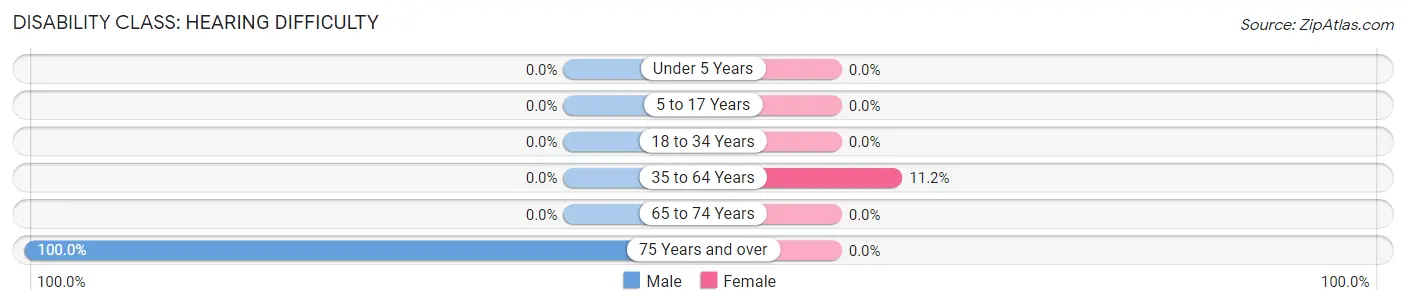
| Age Bracket | Male | Female |
| Under 5 Years | 0 (0.0%) | 0 (0.0%) |
| 5 to 17 Years | 0 (0.0%) | 0 (0.0%) |
| 18 to 34 Years | 0 (0.0%) | 0 (0.0%) |
| 35 to 64 Years | 0 (0.0%) | 10 (11.2%) |
| 65 to 74 Years | 0 (0.0%) | 0 (0.0%) |
| 75 Years and over | 22 (100.0%) | 0 (0.0%) |
Disability Class: Vision Difficulty
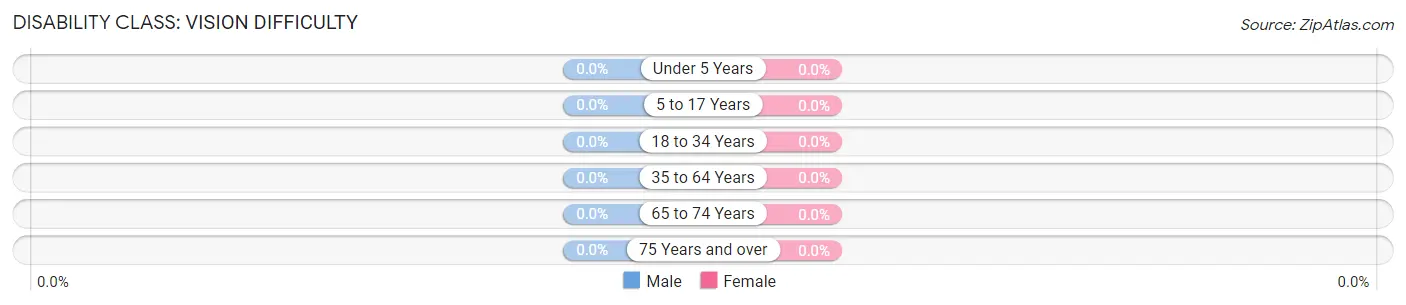
| Age Bracket | Male | Female |
| Under 5 Years | 0 (0.0%) | 0 (0.0%) |
| 5 to 17 Years | 0 (0.0%) | 0 (0.0%) |
| 18 to 34 Years | 0 (0.0%) | 0 (0.0%) |
| 35 to 64 Years | 0 (0.0%) | 0 (0.0%) |
| 65 to 74 Years | 0 (0.0%) | 0 (0.0%) |
| 75 Years and over | 0 (0.0%) | 0 (0.0%) |
Disability Class: Cognitive Difficulty
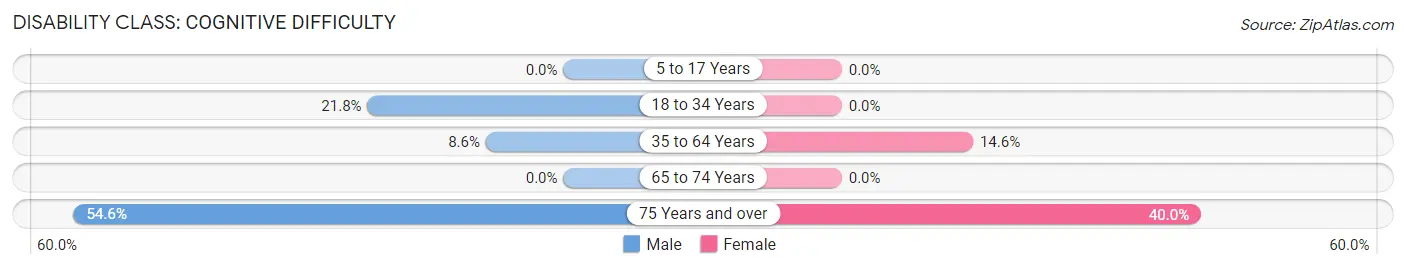
| Age Bracket | Male | Female |
| 5 to 17 Years | 0 (0.0%) | 0 (0.0%) |
| 18 to 34 Years | 12 (21.8%) | 0 (0.0%) |
| 35 to 64 Years | 7 (8.6%) | 13 (14.6%) |
| 65 to 74 Years | 0 (0.0%) | 0 (0.0%) |
| 75 Years and over | 12 (54.5%) | 16 (40.0%) |
Disability Class: Ambulatory Difficulty
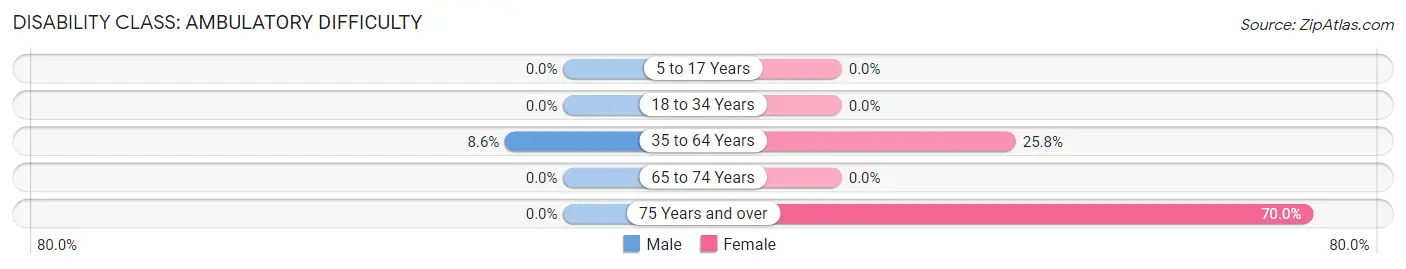
| Age Bracket | Male | Female |
| 5 to 17 Years | 0 (0.0%) | 0 (0.0%) |
| 18 to 34 Years | 0 (0.0%) | 0 (0.0%) |
| 35 to 64 Years | 7 (8.6%) | 23 (25.8%) |
| 65 to 74 Years | 0 (0.0%) | 0 (0.0%) |
| 75 Years and over | 0 (0.0%) | 28 (70.0%) |
Disability Class: Self-Care Difficulty
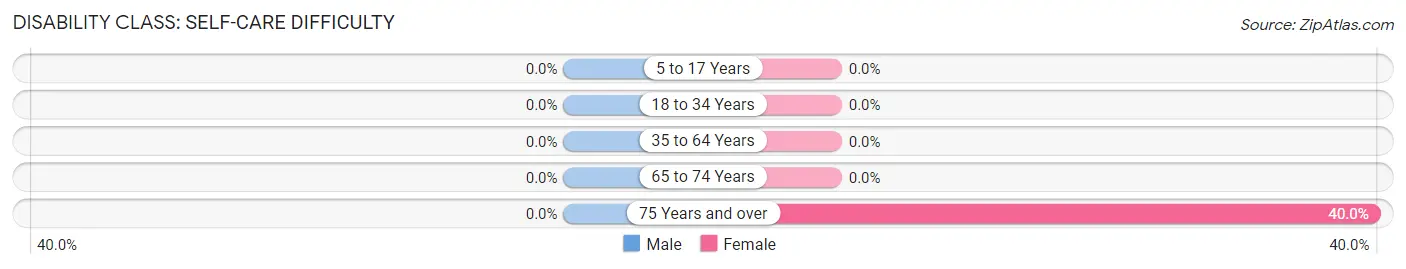
| Age Bracket | Male | Female |
| 5 to 17 Years | 0 (0.0%) | 0 (0.0%) |
| 18 to 34 Years | 0 (0.0%) | 0 (0.0%) |
| 35 to 64 Years | 0 (0.0%) | 0 (0.0%) |
| 65 to 74 Years | 0 (0.0%) | 0 (0.0%) |
| 75 Years and over | 0 (0.0%) | 16 (40.0%) |
Technology Access in Hollis Crossroads
Computing Device Access in Hollis Crossroads
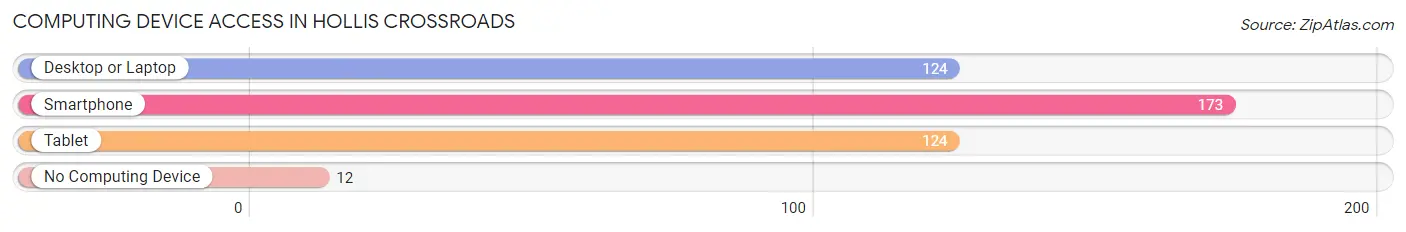
| Device Type | # Households | % Households |
| Desktop or Laptop | 124 | 62.9% |
| Smartphone | 173 | 87.8% |
| Tablet | 124 | 62.9% |
| No Computing Device | 12 | 6.1% |
| Total | 197 | 100.0% |
Internet Access in Hollis Crossroads
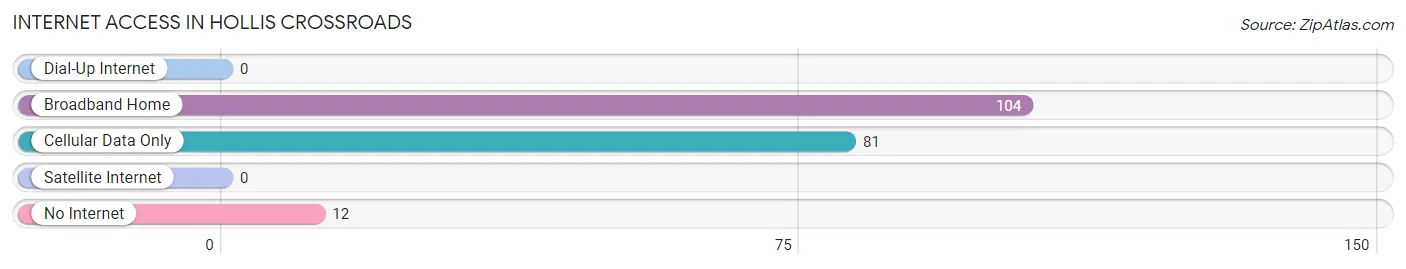
| Internet Type | # Households | % Households |
| Dial-Up Internet | 0 | 0.0% |
| Broadband Home | 104 | 52.8% |
| Cellular Data Only | 81 | 41.1% |
| Satellite Internet | 0 | 0.0% |
| No Internet | 12 | 6.1% |
| Total | 197 | 100.0% |
Hollis Crossroads Summary
Hollis Crossroads is an unincorporated community located in the northeastern corner of Limestone County, Alabama. It is situated at the intersection of U.S. Highway 72 and Alabama State Route 99. The community is located approximately 10 miles east of Athens and 15 miles west of Huntsville.
History
Hollis Crossroads was established in the early 1800s and was named after the Hollis family, who were among the first settlers in the area. The community was originally a small farming community, but it grew in size and importance after the completion of the railroad in the late 1800s. The railroad allowed for the transportation of goods and people to and from the area, and it also provided employment opportunities for many of the local residents.
The community was also home to a number of businesses, including a general store, a blacksmith shop, a cotton gin, and a grist mill. The community also had a post office, which was established in 1891 and closed in 1907.
Geography
Hollis Crossroads is located in the northeastern corner of Limestone County, Alabama. It is situated at the intersection of U.S. Highway 72 and Alabama State Route 99. The community is located approximately 10 miles east of Athens and 15 miles west of Huntsville.
The terrain in the area is mostly flat, with some rolling hills. The area is mostly rural, with some small towns and villages scattered throughout the area. The nearest major city is Huntsville, which is located approximately 15 miles to the east.
Economy
The economy of Hollis Crossroads is largely based on agriculture. The area is home to a number of farms, which produce a variety of crops, including corn, soybeans, cotton, and hay. The area is also home to a number of livestock farms, which produce beef, pork, and poultry.
In addition to agriculture, the area is also home to a number of small businesses, including convenience stores, gas stations, restaurants, and other retail establishments. The area is also home to a number of manufacturing companies, which produce a variety of products, including furniture, clothing, and automotive parts.
Demographics
As of the 2010 census, the population of Hollis Crossroads was 1,845. The racial makeup of the community was 97.3% White, 0.7% African American, 0.2% Native American, 0.2% Asian, 0.1% Pacific Islander, 0.7% from other races, and 0.9% from two or more races. Hispanic or Latino of any race were 1.7% of the population.
The median household income in the area was $37,917, and the median family income was $45,938. The per capita income in the area was $18,945. Approximately 11.3% of the population was below the poverty line.
Conclusion
Hollis Crossroads is an unincorporated community located in the northeastern corner of Limestone County, Alabama. It is situated at the intersection of U.S. Highway 72 and Alabama State Route 99. The community is located approximately 10 miles east of Athens and 15 miles west of Huntsville. The economy of Hollis Crossroads is largely based on agriculture, with some small businesses and manufacturing companies also present in the area. As of the 2010 census, the population of Hollis Crossroads was 1,845. The racial makeup of the community was 97.3% White, 0.7% African American, 0.2% Native American, 0.2% Asian, 0.1% Pacific Islander, 0.7% from other races, and 0.9% from two or more races. The median household income in the area was $37,917, and the median family income was $45,938.
Common Questions
What is Per Capita Income in Hollis Crossroads?
Per Capita income in Hollis Crossroads is $26,179.
What is the Median Family Income in Hollis Crossroads?
Median Family Income in Hollis Crossroads is $62,857.
What is the Median Household income in Hollis Crossroads?
Median Household Income in Hollis Crossroads is $60,489.
What is Inequality or Gini Index in Hollis Crossroads?
Inequality or Gini Index in Hollis Crossroads is 0.33.
What is the Total Population of Hollis Crossroads?
Total Population of Hollis Crossroads is 607.
What is the Total Male Population of Hollis Crossroads?
Total Male Population of Hollis Crossroads is 315.
What is the Total Female Population of Hollis Crossroads?
Total Female Population of Hollis Crossroads is 292.
What is the Ratio of Males per 100 Females in Hollis Crossroads?
There are 107.88 Males per 100 Females in Hollis Crossroads.
What is the Ratio of Females per 100 Males in Hollis Crossroads?
There are 92.70 Females per 100 Males in Hollis Crossroads.
What is the Median Population Age in Hollis Crossroads?
Median Population Age in Hollis Crossroads is 35.5 Years.
What is the Average Family Size in Hollis Crossroads
Average Family Size in Hollis Crossroads is 3.5 People.
What is the Average Household Size in Hollis Crossroads
Average Household Size in Hollis Crossroads is 3.1 People.
How Large is the Labor Force in Hollis Crossroads?
There are 239 People in the Labor Forcein in Hollis Crossroads.
What is the Percentage of People in the Labor Force in Hollis Crossroads?
54.0% of People are in the Labor Force in Hollis Crossroads.