Geneva, AL Map & Demographics
Geneva Map
Geneva Overview
$26,439
PER CAPITA INCOME
$54,333
AVG FAMILY INCOME
$44,756
AVG HOUSEHOLD INCOME
49.7%
WAGE / INCOME GAP [ % ]
50.3¢/ $1
WAGE / INCOME GAP [ $ ]
0.46
INEQUALITY / GINI INDEX
4,235
TOTAL POPULATION
1,957
MALE POPULATION
2,278
FEMALE POPULATION
85.91
MALES / 100 FEMALES
116.40
FEMALES / 100 MALES
50.2
MEDIAN AGE
2.7
AVG FAMILY SIZE
2.2
AVG HOUSEHOLD SIZE
1,749
LABOR FORCE [ PEOPLE ]
48.6%
PERCENT IN LABOR FORCE
8.4%
UNEMPLOYMENT RATE
Geneva Zip Codes
Geneva Area Codes
Income in Geneva
Income Overview in Geneva
Per Capita Income in Geneva is $26,439, while median incomes of families and households are $54,333 and $44,756 respectively.
| Characteristic | Number | Measure |
| Per Capita Income | 4,235 | $26,439 |
| Median Family Income | 1,050 | $54,333 |
| Mean Family Income | 1,050 | $74,782 |
| Median Household Income | 1,832 | $44,756 |
| Mean Household Income | 1,832 | $61,969 |
| Income Deficit | 1,050 | $0 |
| Wage / Income Gap (%) | 4,235 | 49.73% |
| Wage / Income Gap ($) | 4,235 | 50.27¢ per $1 |
| Gini / Inequality Index | 4,235 | 0.46 |
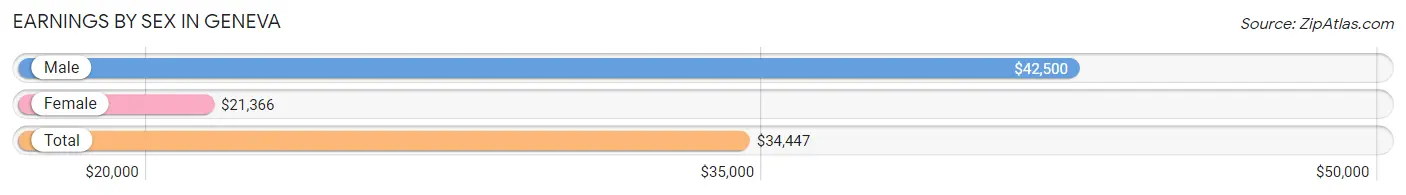
Earnings by Sex in Geneva
Average Earnings in Geneva are $34,447, $42,500 for men and $21,366 for women, a difference of 49.7%.
| Sex | Number | Average Earnings |
| Male | 1,064 (59.9%) | $42,500 |
| Female | 711 (40.1%) | $21,366 |
| Total | 1,775 (100.0%) | $34,447 |
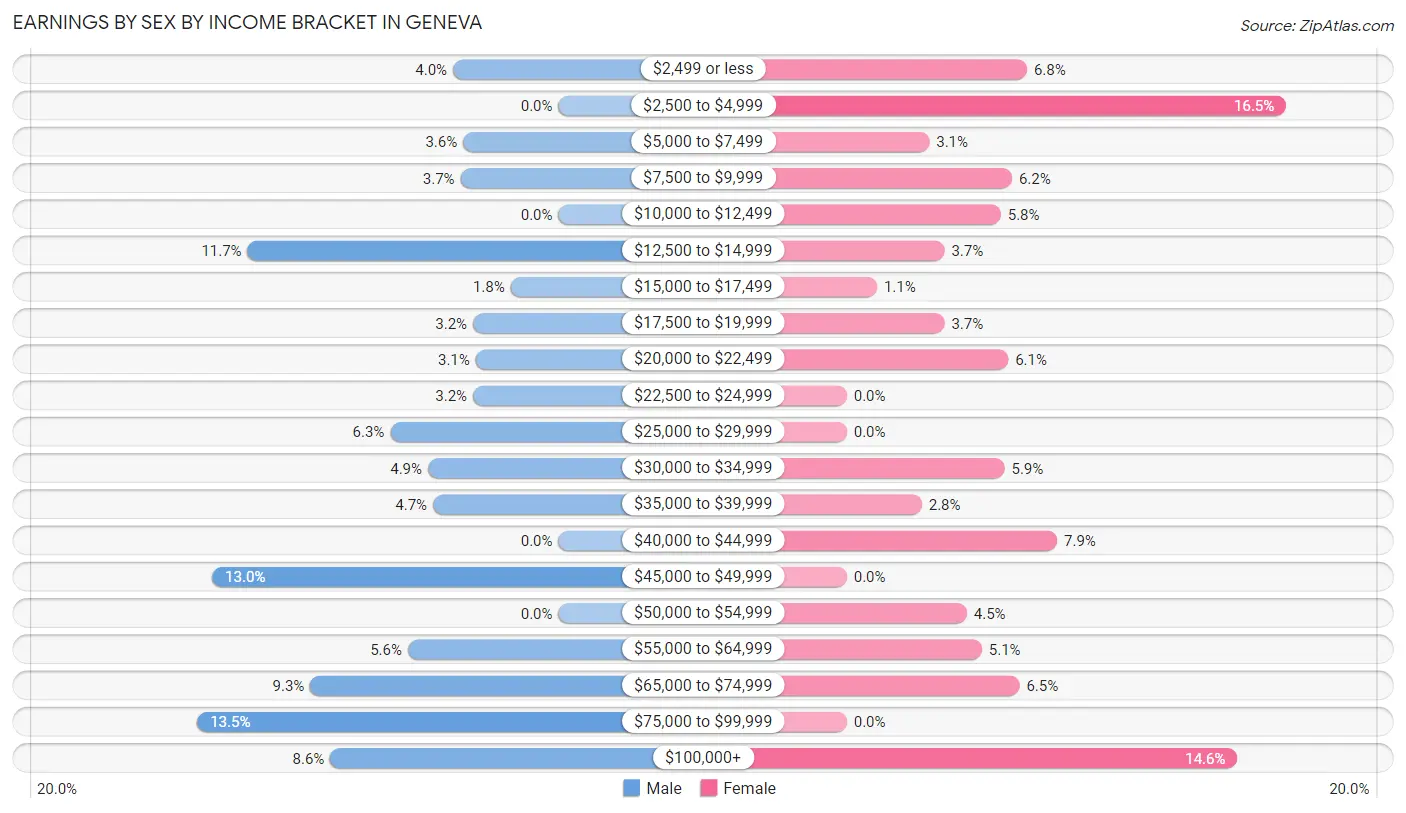
Earnings by Sex by Income Bracket in Geneva
The most common earnings brackets in Geneva are $75,000 to $99,999 for men (144 | 13.5%) and $2,500 to $4,999 for women (117 | 16.5%).
| Income | Male | Female |
| $2,499 or less | 42 (4.0%) | 48 (6.8%) |
| $2,500 to $4,999 | 0 (0.0%) | 117 (16.5%) |
| $5,000 to $7,499 | 38 (3.6%) | 22 (3.1%) |
| $7,500 to $9,999 | 39 (3.7%) | 44 (6.2%) |
| $10,000 to $12,499 | 0 (0.0%) | 41 (5.8%) |
| $12,500 to $14,999 | 124 (11.7%) | 26 (3.7%) |
| $15,000 to $17,499 | 19 (1.8%) | 8 (1.1%) |
| $17,500 to $19,999 | 34 (3.2%) | 26 (3.7%) |
| $20,000 to $22,499 | 33 (3.1%) | 43 (6.0%) |
| $22,500 to $24,999 | 34 (3.2%) | 0 (0.0%) |
| $25,000 to $29,999 | 67 (6.3%) | 0 (0.0%) |
| $30,000 to $34,999 | 52 (4.9%) | 42 (5.9%) |
| $35,000 to $39,999 | 50 (4.7%) | 20 (2.8%) |
| $40,000 to $44,999 | 0 (0.0%) | 56 (7.9%) |
| $45,000 to $49,999 | 138 (13.0%) | 0 (0.0%) |
| $50,000 to $54,999 | 0 (0.0%) | 32 (4.5%) |
| $55,000 to $64,999 | 60 (5.6%) | 36 (5.1%) |
| $65,000 to $74,999 | 99 (9.3%) | 46 (6.5%) |
| $75,000 to $99,999 | 144 (13.5%) | 0 (0.0%) |
| $100,000+ | 91 (8.6%) | 104 (14.6%) |
| Total | 1,064 (100.0%) | 711 (100.0%) |
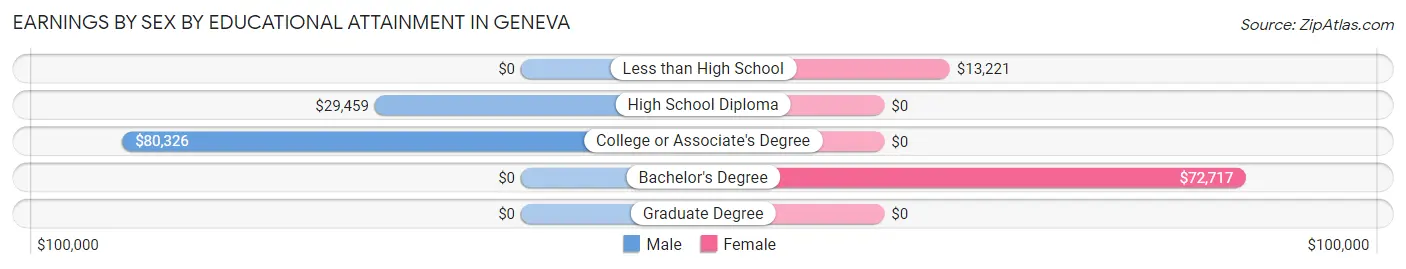
Earnings by Sex by Educational Attainment in Geneva
Average earnings in Geneva are $45,304 for men and $40,139 for women, a difference of 11.4%. Men with an educational attainment of college or associate's degree enjoy the highest average annual earnings of $80,326, while those with high school diploma education earn the least with $29,459. Women with an educational attainment of bachelor's degree earn the most with the average annual earnings of $72,717, while those with less than high school education have the smallest earnings of $13,221.
| Educational Attainment | Male Income | Female Income |
| Less than High School | - | - |
| High School Diploma | $29,459 | $0 |
| College or Associate's Degree | $80,326 | $0 |
| Bachelor's Degree | - | - |
| Graduate Degree | - | - |
| Total | $45,304 | $40,139 |
Family Income in Geneva
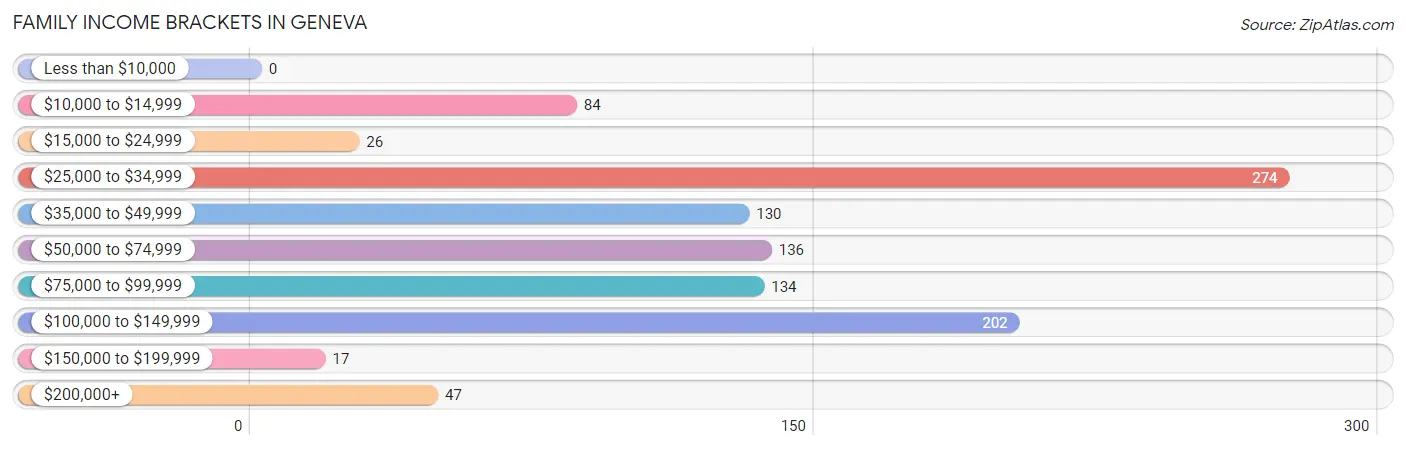
Family Income Brackets in Geneva
According to the Geneva family income data, there are 274 families falling into the $25,000 to $34,999 income range, which is the most common income bracket and makes up 26.1% of all families.
| Income Bracket | # Families | % Families |
| Less than $10,000 | 0 | 0.0% |
| $10,000 to $14,999 | 84 | 8.0% |
| $15,000 to $24,999 | 26 | 2.5% |
| $25,000 to $34,999 | 274 | 26.1% |
| $35,000 to $49,999 | 130 | 12.4% |
| $50,000 to $74,999 | 136 | 13.0% |
| $75,000 to $99,999 | 134 | 12.8% |
| $100,000 to $149,999 | 202 | 19.2% |
| $150,000 to $199,999 | 17 | 1.6% |
| $200,000+ | 47 | 4.5% |
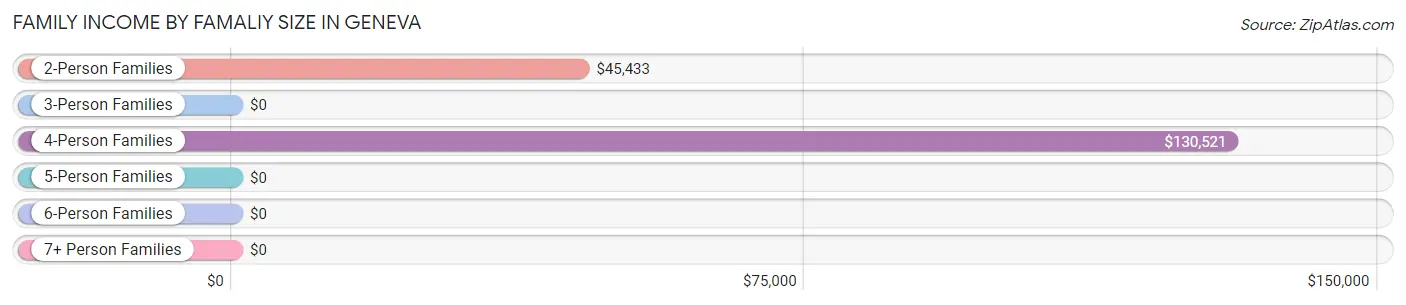
Family Income by Famaliy Size in Geneva
4-person families (237 | 22.6%) account for the highest median family income in Geneva with $130,521 per family, while 4-person families (237 | 22.6%) have the highest median income of $32,630 per family member.
| Income Bracket | # Families | Median Income |
| 2-Person Families | 647 (61.6%) | $45,433 |
| 3-Person Families | 114 (10.9%) | $0 |
| 4-Person Families | 237 (22.6%) | $130,521 |
| 5-Person Families | 52 (5.0%) | $0 |
| 6-Person Families | 0 (0.0%) | $0 |
| 7+ Person Families | 0 (0.0%) | $0 |
| Total | 1,050 (100.0%) | $54,333 |
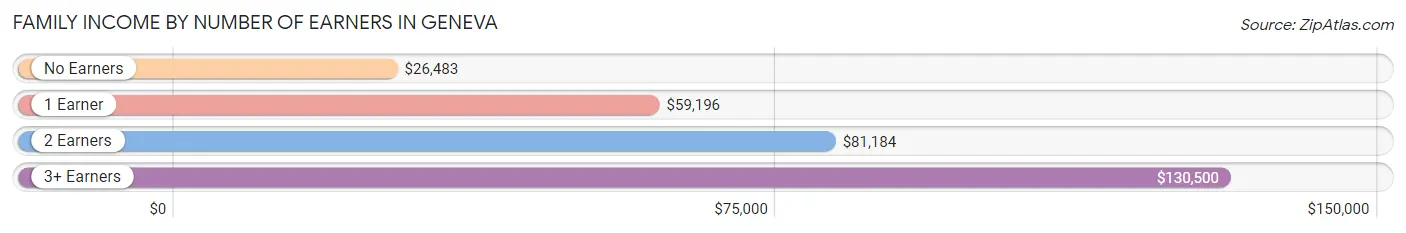
Family Income by Number of Earners in Geneva
The median family income in Geneva is $54,333, with families comprising 3+ earners (96) having the highest median family income of $130,500, while families with no earners (366) have the lowest median family income of $26,483, accounting for 9.1% and 34.9% of families, respectively.
| Number of Earners | # Families | Median Income |
| No Earners | 366 (34.9%) | $26,483 |
| 1 Earner | 314 (29.9%) | $59,196 |
| 2 Earners | 274 (26.1%) | $81,184 |
| 3+ Earners | 96 (9.1%) | $130,500 |
| Total | 1,050 (100.0%) | $54,333 |
Household Income in Geneva
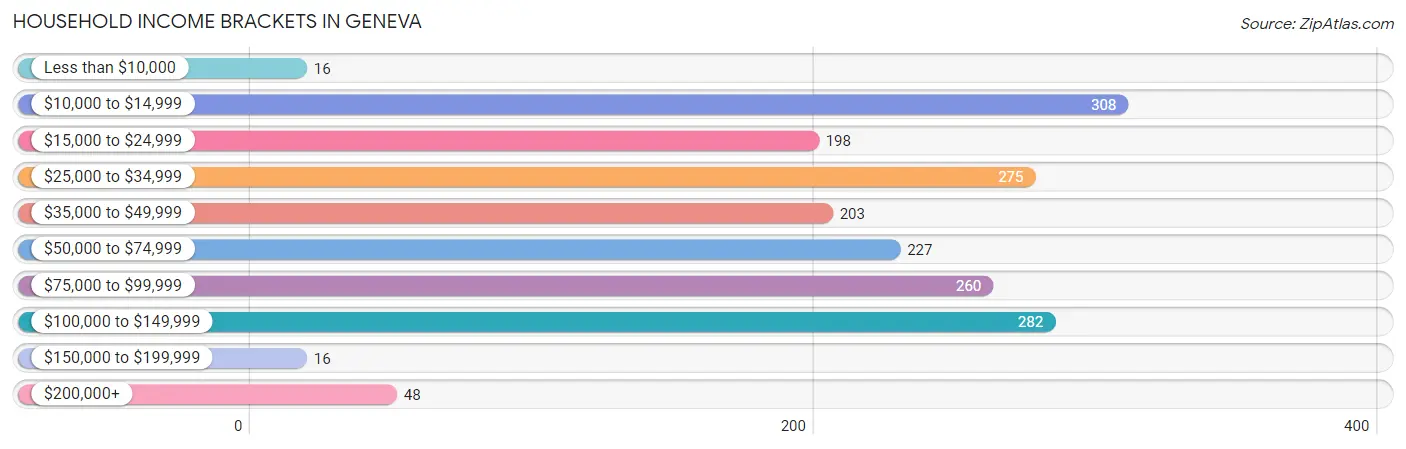
Household Income Brackets in Geneva
With 308 households falling in the category, the $10,000 to $14,999 income range is the most frequent in Geneva, accounting for 16.8% of all households. In contrast, only 16 households (0.9%) fall into the less than $10,000 income bracket, making it the least populous group.
| Income Bracket | # Households | % Households |
| Less than $10,000 | 16 | 0.9% |
| $10,000 to $14,999 | 308 | 16.8% |
| $15,000 to $24,999 | 198 | 10.8% |
| $25,000 to $34,999 | 275 | 15.0% |
| $35,000 to $49,999 | 203 | 11.1% |
| $50,000 to $74,999 | 227 | 12.4% |
| $75,000 to $99,999 | 260 | 14.2% |
| $100,000 to $149,999 | 282 | 15.4% |
| $150,000 to $199,999 | 16 | 0.9% |
| $200,000+ | 48 | 2.6% |
Household Income by Householder Age in Geneva
The median household income in Geneva is $44,756, with the highest median household income of $86,184 found in the 25 to 44 years age bracket for the primary householder. A total of 346 households (18.9%) fall into this category. Meanwhile, the 15 to 24 years age bracket for the primary householder has the lowest median household income of $0, with 50 households (2.7%) in this group.
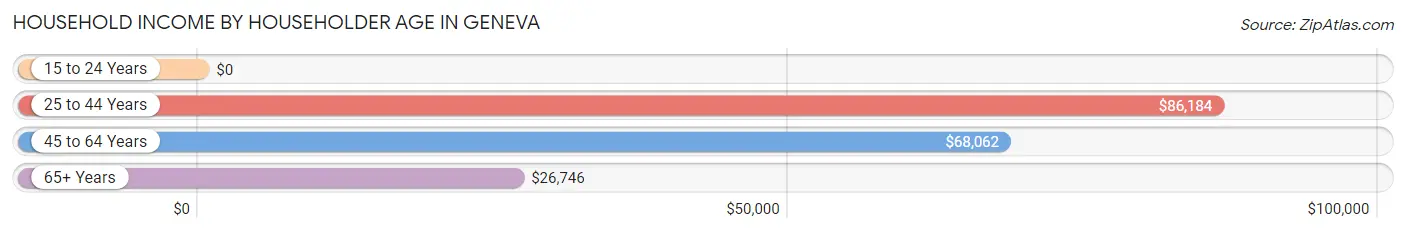
| Income Bracket | # Households | Median Income |
| 15 to 24 Years | 50 (2.7%) | $0 |
| 25 to 44 Years | 346 (18.9%) | $86,184 |
| 45 to 64 Years | 746 (40.7%) | $68,062 |
| 65+ Years | 690 (37.7%) | $26,746 |
| Total | 1,832 (100.0%) | $44,756 |
Poverty in Geneva
Income Below Poverty by Sex and Age in Geneva
With 23.8% poverty level for males and 28.2% for females among the residents of Geneva, 16 and 17 year old males and 12 to 14 year old females are the most vulnerable to poverty, with 29 males (100.0%) and 58 females (55.2%) in their respective age groups living below the poverty level.
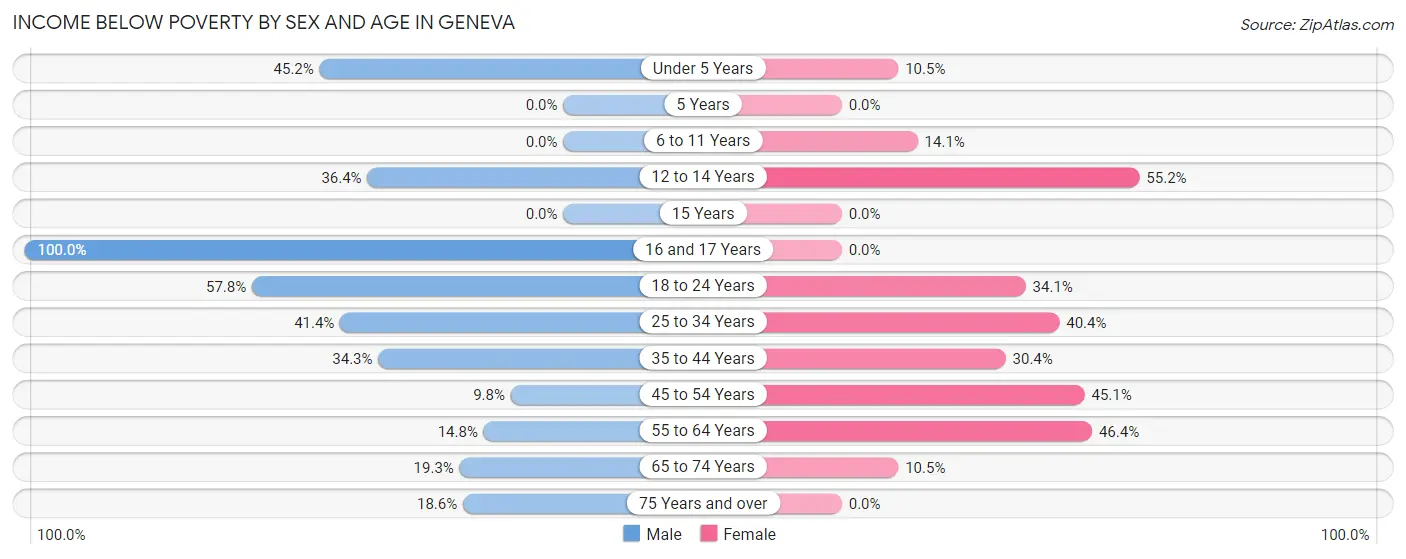
| Age Bracket | Male | Female |
| Under 5 Years | 19 (45.2%) | 11 (10.5%) |
| 5 Years | 0 (0.0%) | 0 (0.0%) |
| 6 to 11 Years | 0 (0.0%) | 29 (14.1%) |
| 12 to 14 Years | 16 (36.4%) | 58 (55.2%) |
| 15 Years | 0 (0.0%) | 0 (0.0%) |
| 16 and 17 Years | 29 (100.0%) | 0 (0.0%) |
| 18 to 24 Years | 26 (57.8%) | 57 (34.1%) |
| 25 to 34 Years | 128 (41.4%) | 44 (40.4%) |
| 35 to 44 Years | 68 (34.3%) | 45 (30.4%) |
| 45 to 54 Years | 33 (9.8%) | 210 (45.1%) |
| 55 to 64 Years | 56 (14.8%) | 137 (46.4%) |
| 65 to 74 Years | 36 (19.3%) | 24 (10.5%) |
| 75 Years and over | 35 (18.6%) | 0 (0.0%) |
| Total | 446 (23.8%) | 615 (28.2%) |
Income Above Poverty by Sex and Age in Geneva
According to the poverty statistics in Geneva, males aged 6 to 11 years and females aged 16 and 17 years are the age groups that are most secure financially, with 100.0% of males and 100.0% of females in these age groups living above the poverty line.
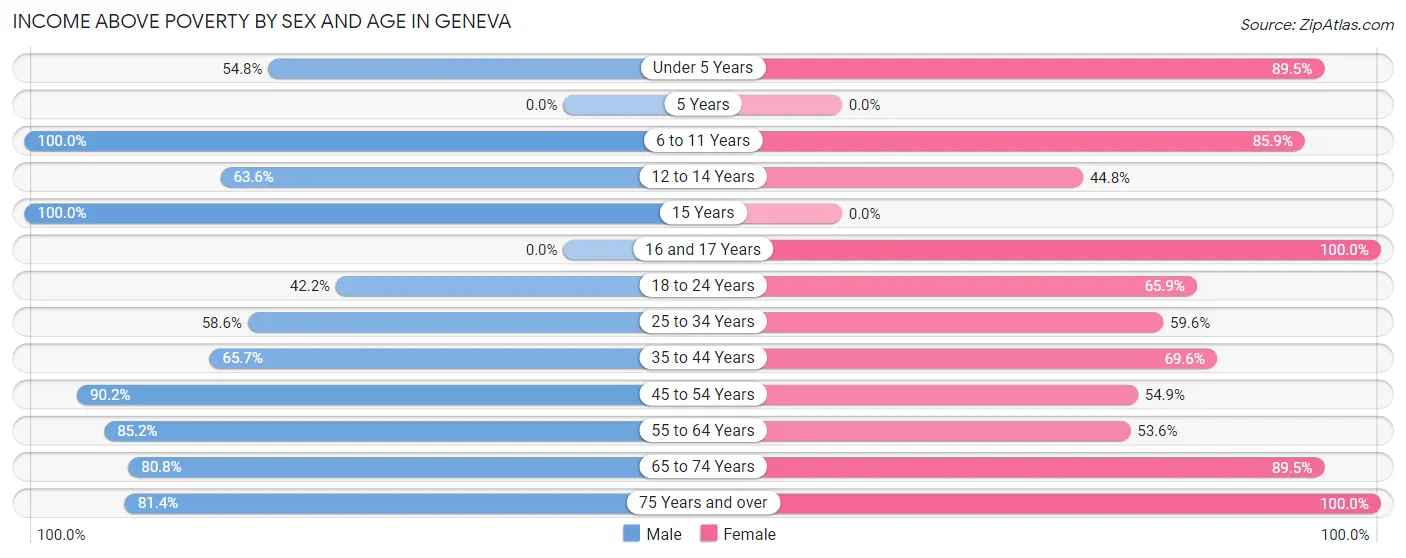
| Age Bracket | Male | Female |
| Under 5 Years | 23 (54.8%) | 94 (89.5%) |
| 5 Years | 0 (0.0%) | 0 (0.0%) |
| 6 to 11 Years | 86 (100.0%) | 177 (85.9%) |
| 12 to 14 Years | 28 (63.6%) | 47 (44.8%) |
| 15 Years | 31 (100.0%) | 0 (0.0%) |
| 16 and 17 Years | 0 (0.0%) | 86 (100.0%) |
| 18 to 24 Years | 19 (42.2%) | 110 (65.9%) |
| 25 to 34 Years | 181 (58.6%) | 65 (59.6%) |
| 35 to 44 Years | 130 (65.7%) | 103 (69.6%) |
| 45 to 54 Years | 305 (90.2%) | 256 (54.9%) |
| 55 to 64 Years | 323 (85.2%) | 158 (53.6%) |
| 65 to 74 Years | 151 (80.7%) | 205 (89.5%) |
| 75 Years and over | 153 (81.4%) | 265 (100.0%) |
| Total | 1,430 (76.2%) | 1,566 (71.8%) |
Income Below Poverty Among Married-Couple Families in Geneva
The poverty statistics for married-couple families in Geneva show that 6.3% or 50 of the total 799 families live below the poverty line. Families with no children have the highest poverty rate of 6.8%, comprising of 36 families. On the other hand, families with 3 or 4 children have the lowest poverty rate of 0.0%, which includes 0 families.
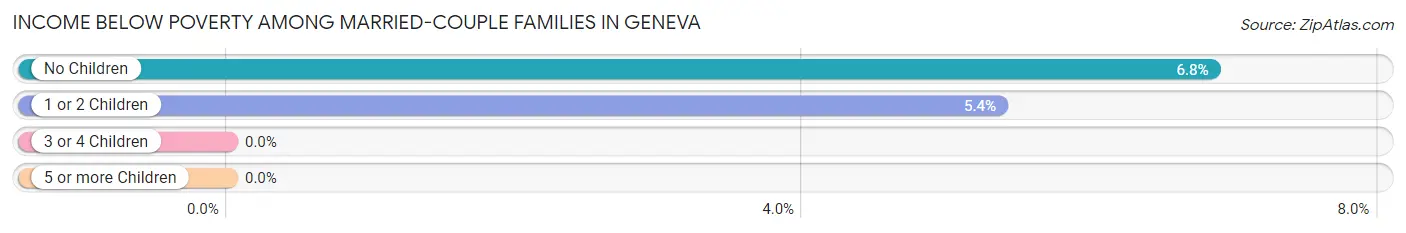
| Children | Above Poverty | Below Poverty |
| No Children | 490 (93.2%) | 36 (6.8%) |
| 1 or 2 Children | 247 (94.6%) | 14 (5.4%) |
| 3 or 4 Children | 12 (100.0%) | 0 (0.0%) |
| 5 or more Children | 0 (0.0%) | 0 (0.0%) |
| Total | 749 (93.7%) | 50 (6.3%) |
Income Below Poverty Among Single-Parent Households in Geneva
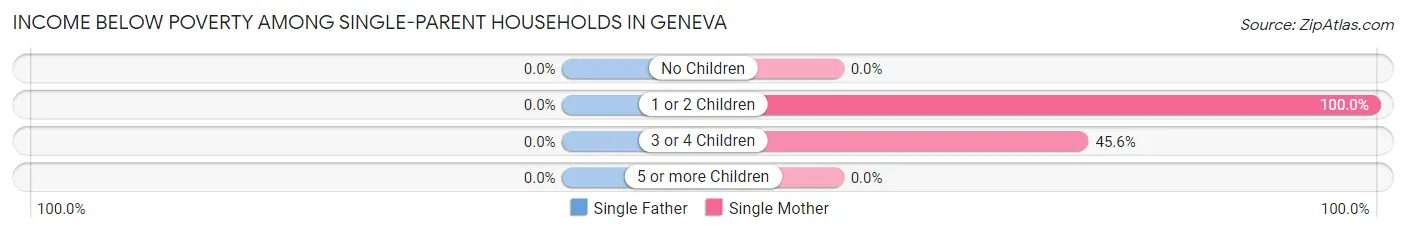
| Children | Single Father | Single Mother |
| No Children | 0 (0.0%) | 0 (0.0%) |
| 1 or 2 Children | 0 (0.0%) | 48 (100.0%) |
| 3 or 4 Children | 0 (0.0%) | 26 (45.6%) |
| 5 or more Children | 0 (0.0%) | 0 (0.0%) |
| Total | 0 (0.0%) | 74 (38.5%) |
Income Below Poverty Among Married-Couple vs Single-Parent Households in Geneva
The poverty data for Geneva shows that 50 of the married-couple family households (6.3%) and 74 of the single-parent households (29.5%) are living below the poverty level. Within the married-couple family households, those with no children have the highest poverty rate, with 36 households (6.8%) falling below the poverty line. Among the single-parent households, those with 1 or 2 children have the highest poverty rate, with 48 household (100.0%) living below poverty.
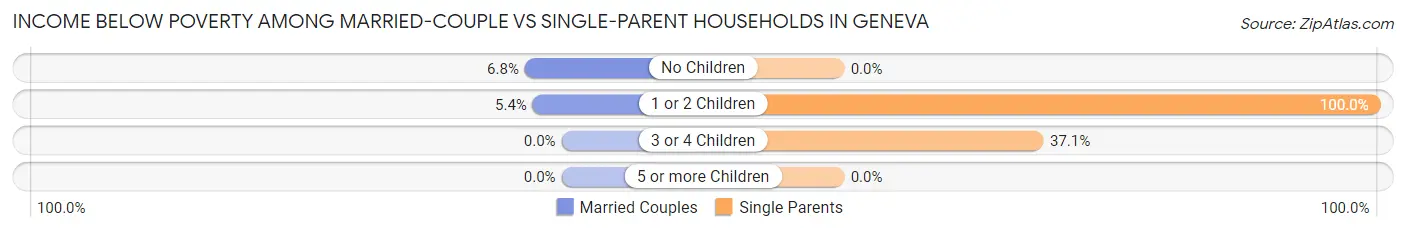
| Children | Married-Couple Families | Single-Parent Households |
| No Children | 36 (6.8%) | 0 (0.0%) |
| 1 or 2 Children | 14 (5.4%) | 48 (100.0%) |
| 3 or 4 Children | 0 (0.0%) | 26 (37.1%) |
| 5 or more Children | 0 (0.0%) | 0 (0.0%) |
| Total | 50 (6.3%) | 74 (29.5%) |
Race in Geneva
The most populous races in Geneva are White / Caucasian (3,403 | 80.3%), Black / African American (496 | 11.7%), and Hispanic or Latino (206 | 4.9%).
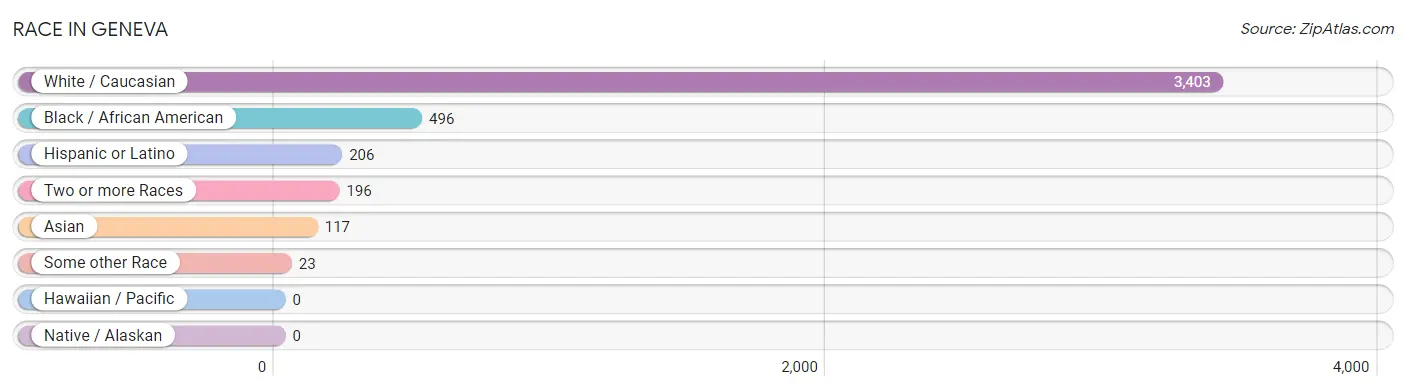
| Race | # Population | % Population |
| Asian | 117 | 2.8% |
| Black / African American | 496 | 11.7% |
| Hawaiian / Pacific | 0 | 0.0% |
| Hispanic or Latino | 206 | 4.9% |
| Native / Alaskan | 0 | 0.0% |
| White / Caucasian | 3,403 | 80.3% |
| Two or more Races | 196 | 4.6% |
| Some other Race | 23 | 0.5% |
| Total | 4,235 | 100.0% |
Ancestry in Geneva
The most populous ancestries reported in Geneva are American (910 | 21.5%), German (479 | 11.3%), English (421 | 9.9%), Irish (248 | 5.9%), and Mexican (193 | 4.6%), together accounting for 53.2% of all Geneva residents.
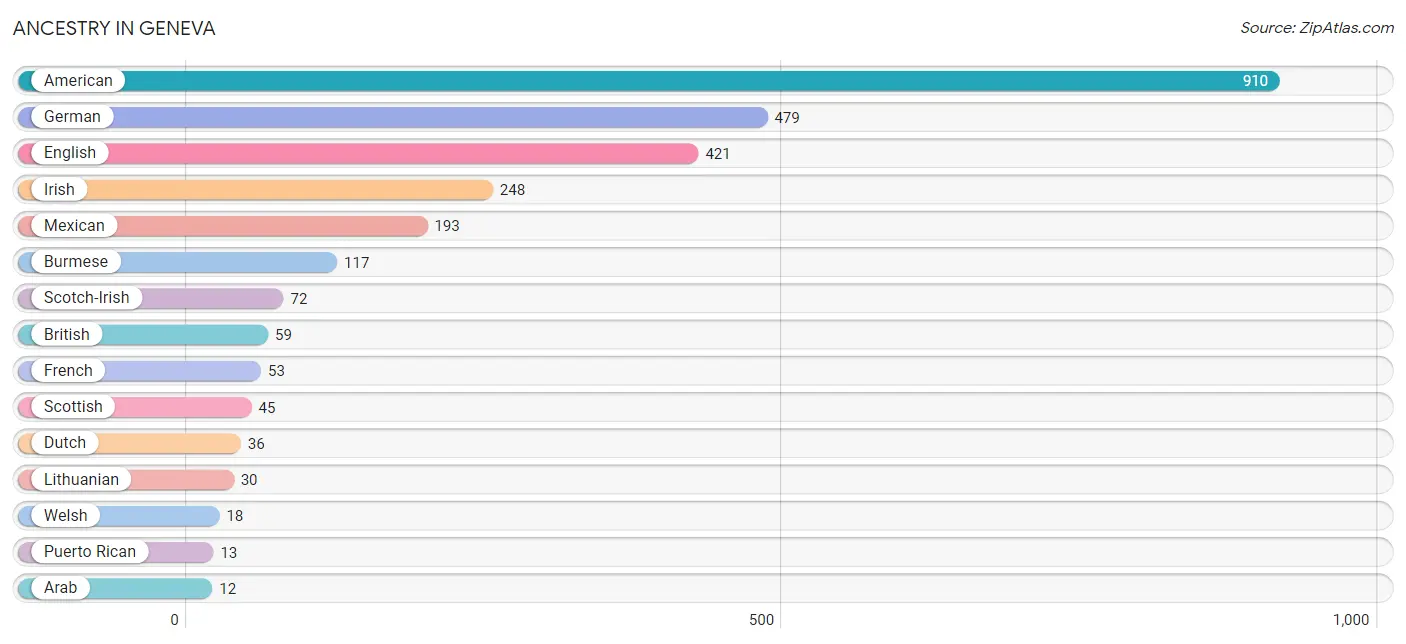
| Ancestry | # Population | % Population |
| American | 910 | 21.5% |
| Arab | 12 | 0.3% |
| British | 59 | 1.4% |
| British West Indian | 12 | 0.3% |
| Burmese | 117 | 2.8% |
| Creek | 2 | 0.1% |
| Dutch | 36 | 0.9% |
| English | 421 | 9.9% |
| French | 53 | 1.3% |
| German | 479 | 11.3% |
| Irish | 248 | 5.9% |
| Lithuanian | 30 | 0.7% |
| Mexican | 193 | 4.6% |
| Puerto Rican | 13 | 0.3% |
| Scotch-Irish | 72 | 1.7% |
| Scottish | 45 | 1.1% |
| Syrian | 12 | 0.3% |
| Welsh | 18 | 0.4% | View All 18 Rows |
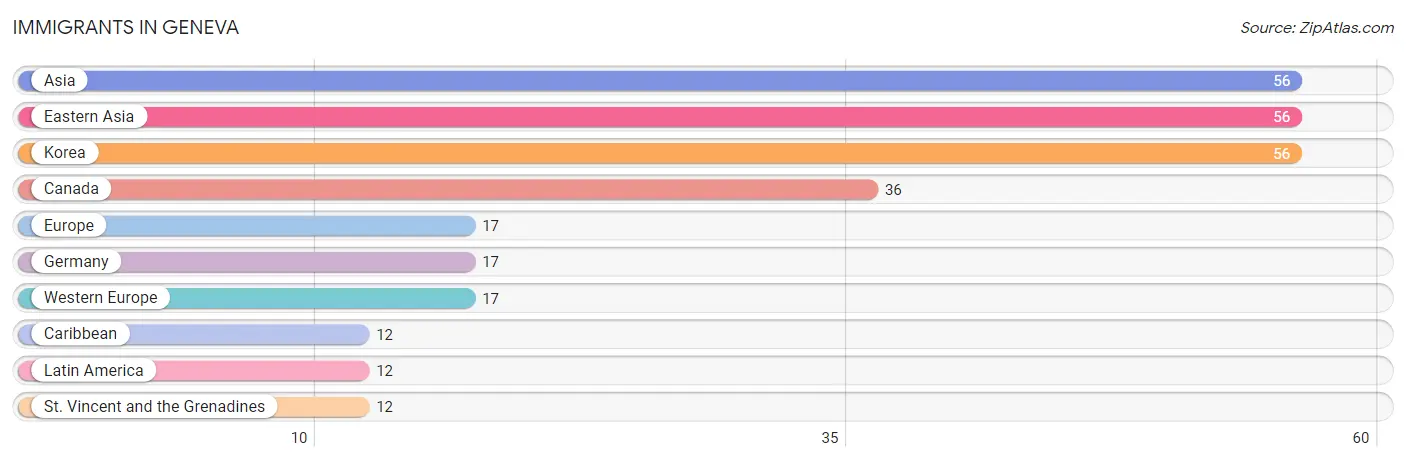
Immigrants in Geneva
The most numerous immigrant groups reported in Geneva came from Asia (56 | 1.3%), Eastern Asia (56 | 1.3%), Korea (56 | 1.3%), Canada (36 | 0.9%), and Europe (17 | 0.4%), together accounting for 5.2% of all Geneva residents.
| Immigration Origin | # Population | % Population |
| Asia | 56 | 1.3% |
| Canada | 36 | 0.9% |
| Caribbean | 12 | 0.3% |
| Eastern Asia | 56 | 1.3% |
| Europe | 17 | 0.4% |
| Germany | 17 | 0.4% |
| Korea | 56 | 1.3% |
| Latin America | 12 | 0.3% |
| St. Vincent and the Grenadines | 12 | 0.3% |
| Western Europe | 17 | 0.4% | View All 10 Rows |
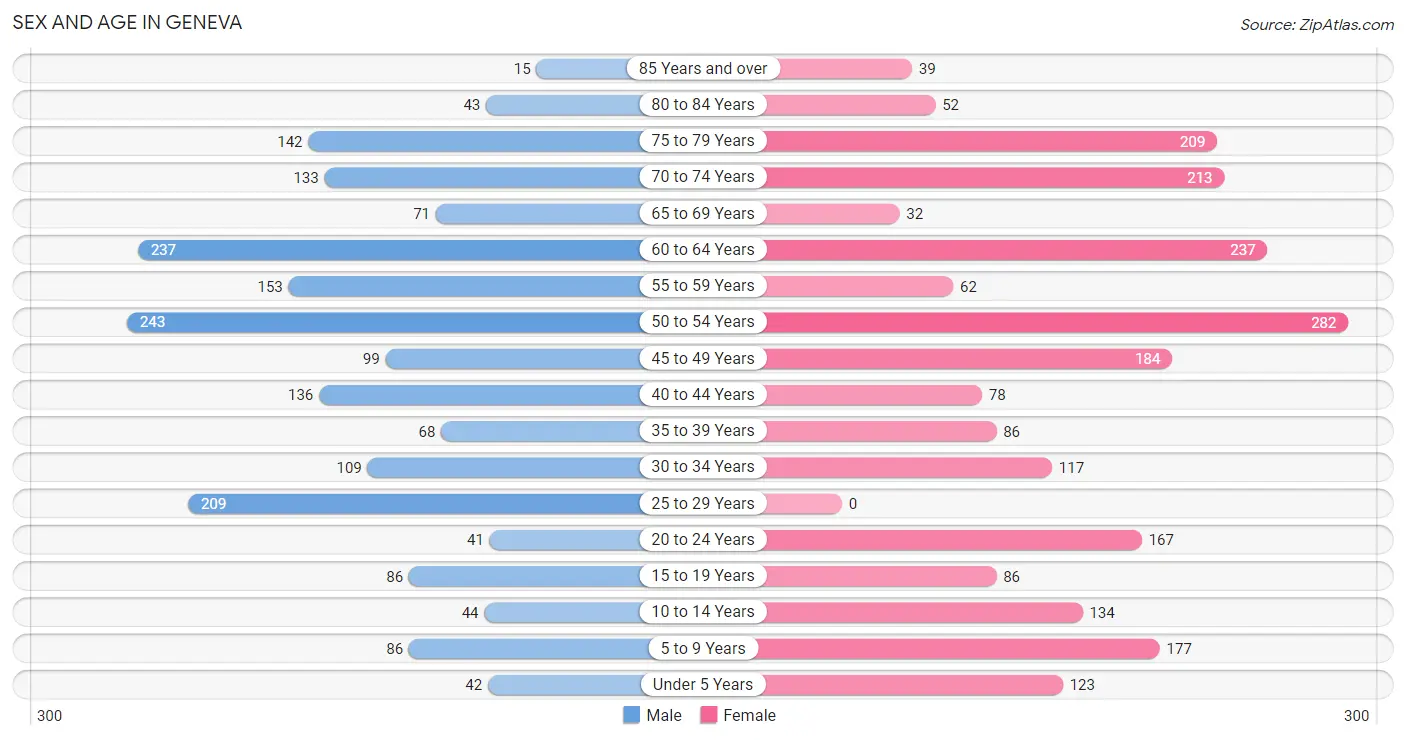
Sex and Age in Geneva
Sex and Age in Geneva
The most populous age groups in Geneva are 50 to 54 Years (243 | 12.4%) for men and 50 to 54 Years (282 | 12.4%) for women.
| Age Bracket | Male | Female |
| Under 5 Years | 42 (2.1%) | 123 (5.4%) |
| 5 to 9 Years | 86 (4.4%) | 177 (7.8%) |
| 10 to 14 Years | 44 (2.2%) | 134 (5.9%) |
| 15 to 19 Years | 86 (4.4%) | 86 (3.8%) |
| 20 to 24 Years | 41 (2.1%) | 167 (7.3%) |
| 25 to 29 Years | 209 (10.7%) | 0 (0.0%) |
| 30 to 34 Years | 109 (5.6%) | 117 (5.1%) |
| 35 to 39 Years | 68 (3.5%) | 86 (3.8%) |
| 40 to 44 Years | 136 (7.0%) | 78 (3.4%) |
| 45 to 49 Years | 99 (5.1%) | 184 (8.1%) |
| 50 to 54 Years | 243 (12.4%) | 282 (12.4%) |
| 55 to 59 Years | 153 (7.8%) | 62 (2.7%) |
| 60 to 64 Years | 237 (12.1%) | 237 (10.4%) |
| 65 to 69 Years | 71 (3.6%) | 32 (1.4%) |
| 70 to 74 Years | 133 (6.8%) | 213 (9.3%) |
| 75 to 79 Years | 142 (7.3%) | 209 (9.2%) |
| 80 to 84 Years | 43 (2.2%) | 52 (2.3%) |
| 85 Years and over | 15 (0.8%) | 39 (1.7%) |
| Total | 1,957 (100.0%) | 2,278 (100.0%) |
Families and Households in Geneva
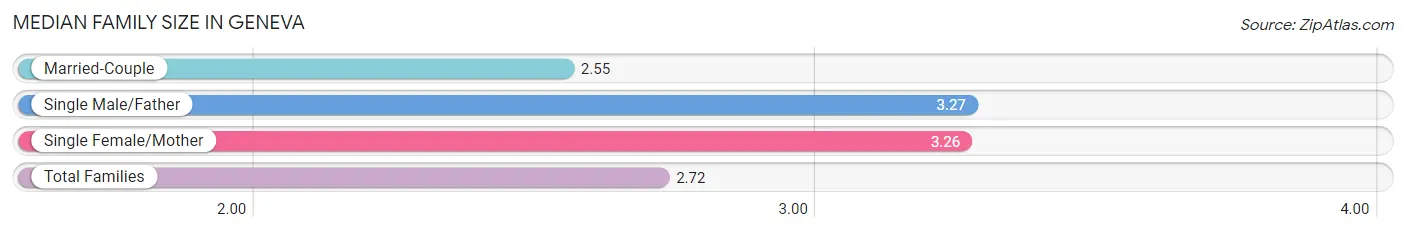
Median Family Size in Geneva
The median family size in Geneva is 2.72 persons per family, with single male/father families (59 | 5.6%) accounting for the largest median family size of 3.27 persons per family. On the other hand, married-couple families (799 | 76.1%) represent the smallest median family size with 2.55 persons per family.
| Family Type | # Families | Family Size |
| Married-Couple | 799 (76.1%) | 2.55 |
| Single Male/Father | 59 (5.6%) | 3.27 |
| Single Female/Mother | 192 (18.3%) | 3.26 |
| Total Families | 1,050 (100.0%) | 2.72 |
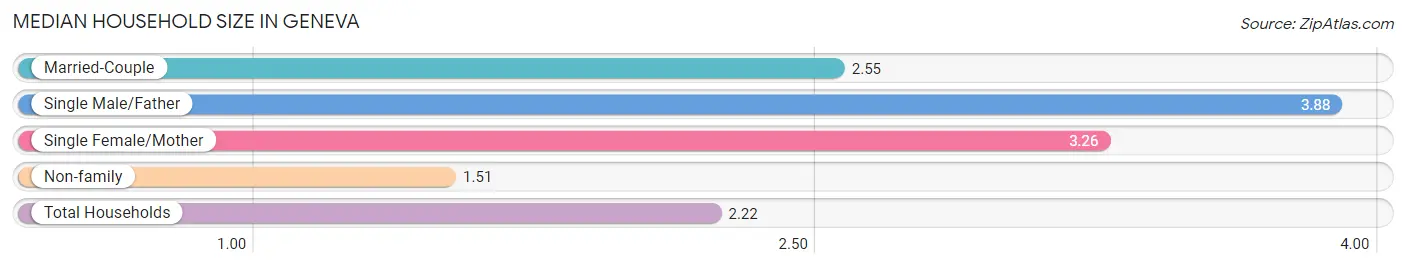
Median Household Size in Geneva
The median household size in Geneva is 2.22 persons per household, with single male/father households (59 | 3.2%) accounting for the largest median household size of 3.88 persons per household. non-family households (782 | 42.7%) represent the smallest median household size with 1.51 persons per household.
| Household Type | # Households | Household Size |
| Married-Couple | 799 (43.6%) | 2.55 |
| Single Male/Father | 59 (3.2%) | 3.88 |
| Single Female/Mother | 192 (10.5%) | 3.26 |
| Non-family | 782 (42.7%) | 1.51 |
| Total Households | 1,832 (100.0%) | 2.22 |
Household Size by Marriage Status in Geneva
Out of a total of 1,832 households in Geneva, 1,050 (57.3%) are family households, while 782 (42.7%) are nonfamily households. The most numerous type of family households are 2-person households, comprising 647, and the most common type of nonfamily households are 1-person households, comprising 599.
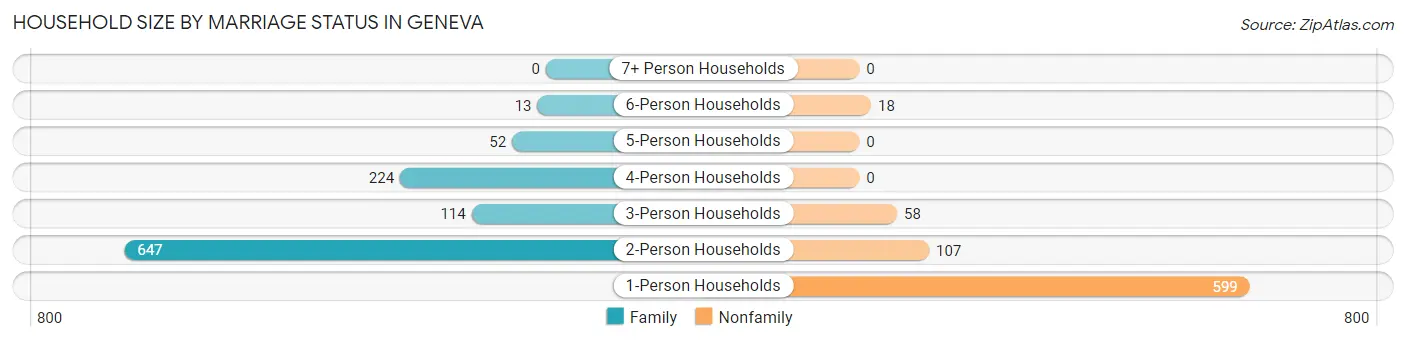
| Household Size | Family Households | Nonfamily Households |
| 1-Person Households | - | 599 (32.7%) |
| 2-Person Households | 647 (35.3%) | 107 (5.8%) |
| 3-Person Households | 114 (6.2%) | 58 (3.2%) |
| 4-Person Households | 224 (12.2%) | 0 (0.0%) |
| 5-Person Households | 52 (2.8%) | 0 (0.0%) |
| 6-Person Households | 13 (0.7%) | 18 (1.0%) |
| 7+ Person Households | 0 (0.0%) | 0 (0.0%) |
| Total | 1,050 (57.3%) | 782 (42.7%) |
Female Fertility in Geneva
Fertility by Age in Geneva
Average fertility rate in Geneva is 47.0 births per 1,000 women. Women in the age bracket of 20 to 34 years have the highest fertility rate with 144.0 births per 1,000 women. Women in the age bracket of 20 to 34 years acount for 100.0% of all women with births.
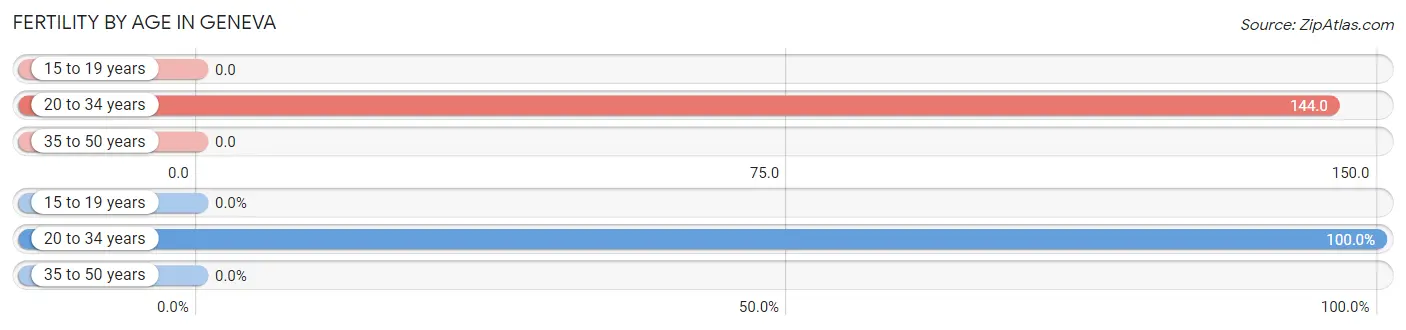
| Age Bracket | Women with Births | Births / 1,000 Women |
| 15 to 19 years | 0 (0.0%) | 0.0 |
| 20 to 34 years | 41 (100.0%) | 144.0 |
| 35 to 50 years | 0 (0.0%) | 0.0 |
| Total | 41 (100.0%) | 47.0 |
Fertility by Age by Marriage Status in Geneva
24.4% of women with births (41) in Geneva are married. The highest percentage of unmarried women with births falls into 20 to 34 years age bracket with 75.6% of them unmarried at the time of birth, while the lowest percentage of unmarried women with births belong to 20 to 34 years age bracket with 75.6% of them unmarried.
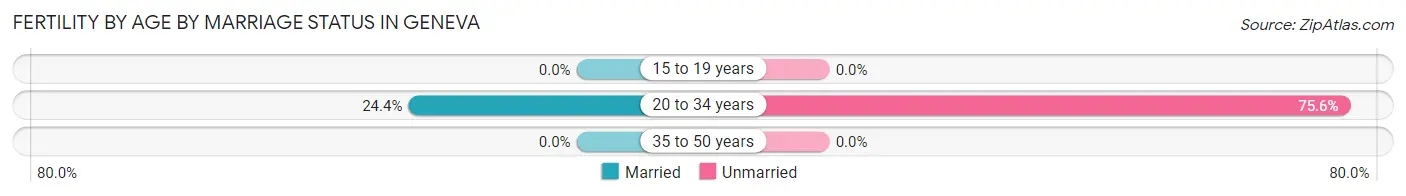
| Age Bracket | Married | Unmarried |
| 15 to 19 years | 0 (0.0%) | 0 (0.0%) |
| 20 to 34 years | 10 (24.4%) | 31 (75.6%) |
| 35 to 50 years | 0 (0.0%) | 0 (0.0%) |
| Total | 10 (24.4%) | 31 (75.6%) |
Fertility by Education in Geneva
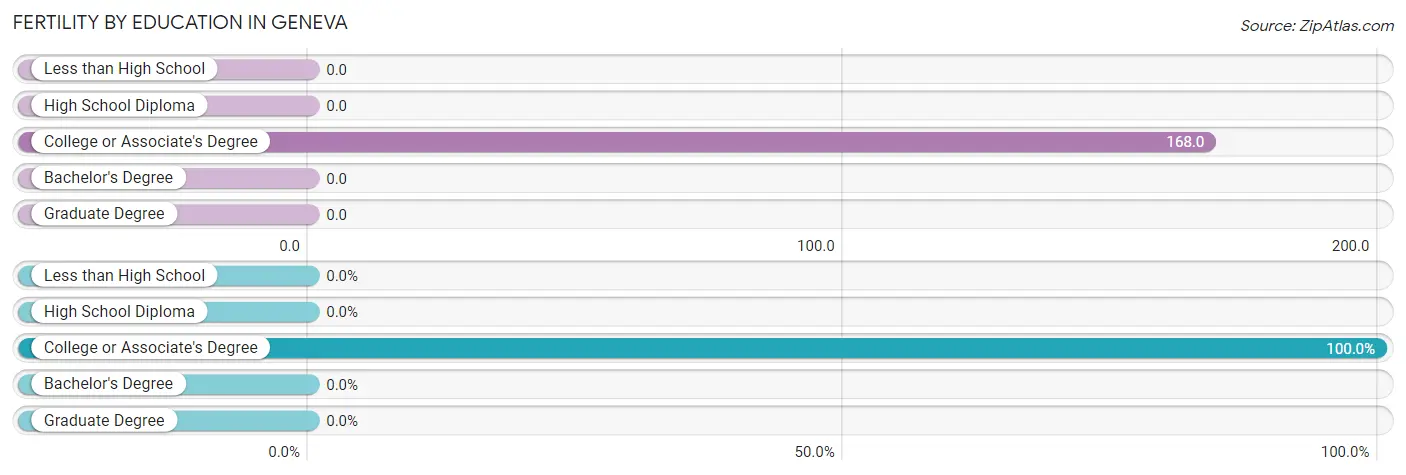
| Educational Attainment | Women with Births | Births / 1,000 Women |
| Less than High School | 0 (0.0%) | 0.0 |
| High School Diploma | 0 (0.0%) | 0.0 |
| College or Associate's Degree | 41 (100.0%) | 168.0 |
| Bachelor's Degree | 0 (0.0%) | 0.0 |
| Graduate Degree | 0 (0.0%) | 0.0 |
| Total | 41 (100.0%) | 47.0 |
Fertility by Education by Marriage Status in Geneva
75.6% of women with births in Geneva are unmarried. Women with the educational attainment of college or associate's degree are most likely to be married with 24.4% of them married at childbirth, while women with the educational attainment of college or associate's degree are least likely to be married with 75.6% of them unmarried at childbirth.
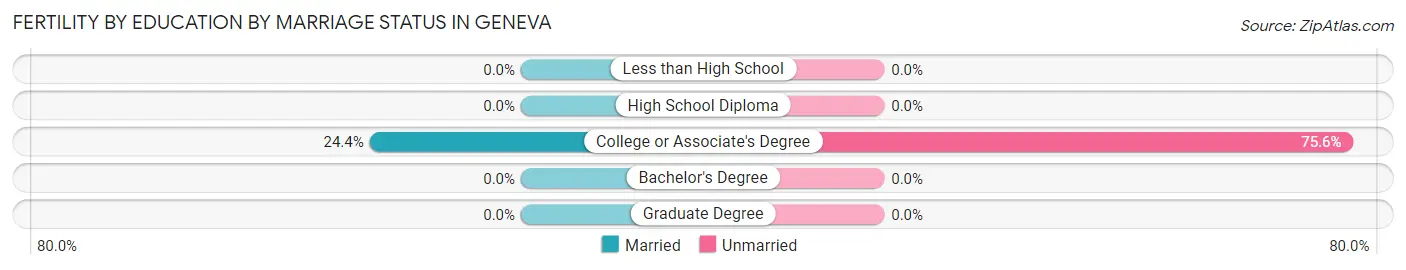
| Educational Attainment | Married | Unmarried |
| Less than High School | 0 (0.0%) | 0 (0.0%) |
| High School Diploma | 0 (0.0%) | 0 (0.0%) |
| College or Associate's Degree | 10 (24.4%) | 31 (75.6%) |
| Bachelor's Degree | 0 (0.0%) | 0 (0.0%) |
| Graduate Degree | 0 (0.0%) | 0 (0.0%) |
| Total | 10 (24.4%) | 31 (75.6%) |
Employment Characteristics in Geneva
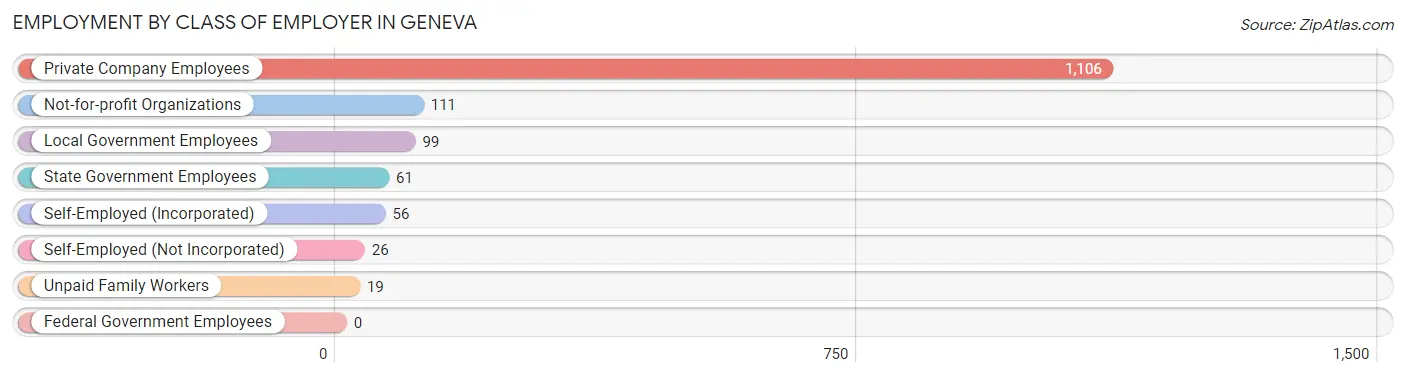
Employment by Class of Employer in Geneva
Among the 1,478 employed individuals in Geneva, private company employees (1,106 | 74.8%), not-for-profit organizations (111 | 7.5%), and local government employees (99 | 6.7%) make up the most common classes of employment.
| Employer Class | # Employees | % Employees |
| Private Company Employees | 1,106 | 74.8% |
| Self-Employed (Incorporated) | 56 | 3.8% |
| Self-Employed (Not Incorporated) | 26 | 1.8% |
| Not-for-profit Organizations | 111 | 7.5% |
| Local Government Employees | 99 | 6.7% |
| State Government Employees | 61 | 4.1% |
| Federal Government Employees | 0 | 0.0% |
| Unpaid Family Workers | 19 | 1.3% |
| Total | 1,478 | 100.0% |
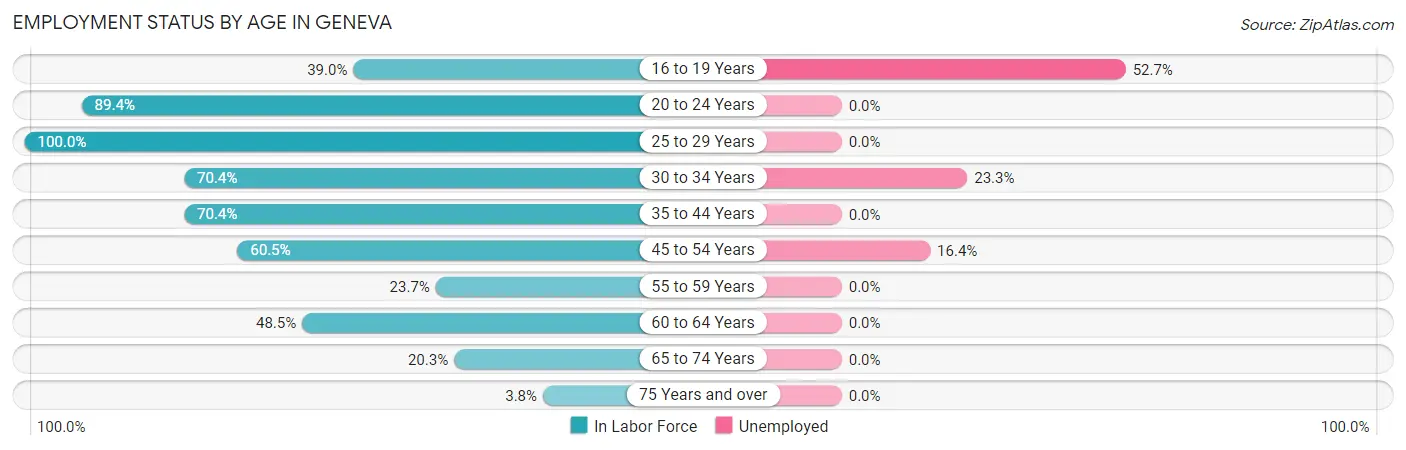
Employment Status by Age in Geneva
According to the labor force statistics for Geneva, out of the total population over 16 years of age (3,598), 48.6% or 1,749 individuals are in the labor force, with 8.4% or 147 of them unemployed. The age group with the highest labor force participation rate is 25 to 29 years, with 100.0% or 209 individuals in the labor force. Within the labor force, the 16 to 19 years age range has the highest percentage of unemployed individuals, with 52.7% or 29 of them being unemployed.
| Age Bracket | In Labor Force | Unemployed |
| 16 to 19 Years | 55 (39.0%) | 29 (52.7%) |
| 20 to 24 Years | 186 (89.4%) | 0 (0.0%) |
| 25 to 29 Years | 209 (100.0%) | 0 (0.0%) |
| 30 to 34 Years | 159 (70.4%) | 37 (23.3%) |
| 35 to 44 Years | 259 (70.4%) | 0 (0.0%) |
| 45 to 54 Years | 489 (60.5%) | 80 (16.4%) |
| 55 to 59 Years | 51 (23.7%) | 0 (0.0%) |
| 60 to 64 Years | 230 (48.5%) | 0 (0.0%) |
| 65 to 74 Years | 91 (20.3%) | 0 (0.0%) |
| 75 Years and over | 19 (3.8%) | 0 (0.0%) |
| Total | 1,749 (48.6%) | 147 (8.4%) |
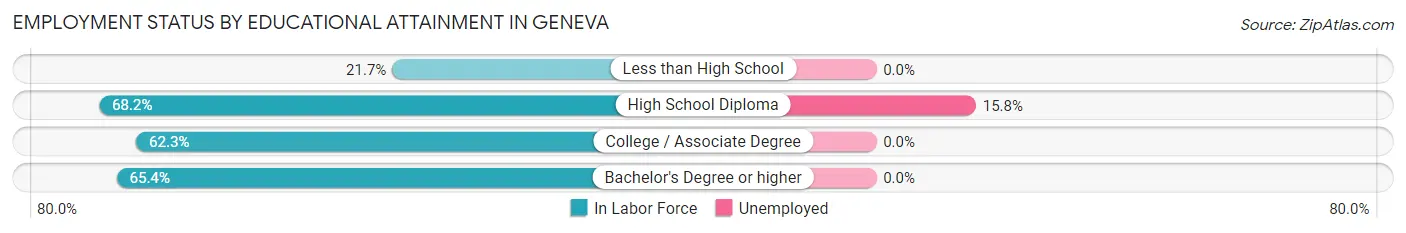
Employment Status by Educational Attainment in Geneva
According to labor force statistics for Geneva, 60.7% of individuals (1,396) out of the total population between 25 and 64 years of age (2,300) are in the labor force, with 8.4% or 117 of them being unemployed. The group with the highest labor force participation rate are those with the educational attainment of high school diploma, with 68.2% or 740 individuals in the labor force. Within the labor force, individuals with high school diploma education have the highest percentage of unemployment, with 15.8% or 117 of them being unemployed.
| Educational Attainment | In Labor Force | Unemployed |
| Less than High School | 60 (21.7%) | 0 (0.0%) |
| High School Diploma | 740 (68.2%) | 171 (15.8%) |
| College / Associate Degree | 332 (62.3%) | 0 (0.0%) |
| Bachelor's Degree or higher | 265 (65.4%) | 0 (0.0%) |
| Total | 1,396 (60.7%) | 193 (8.4%) |
Employment Occupations by Sex in Geneva
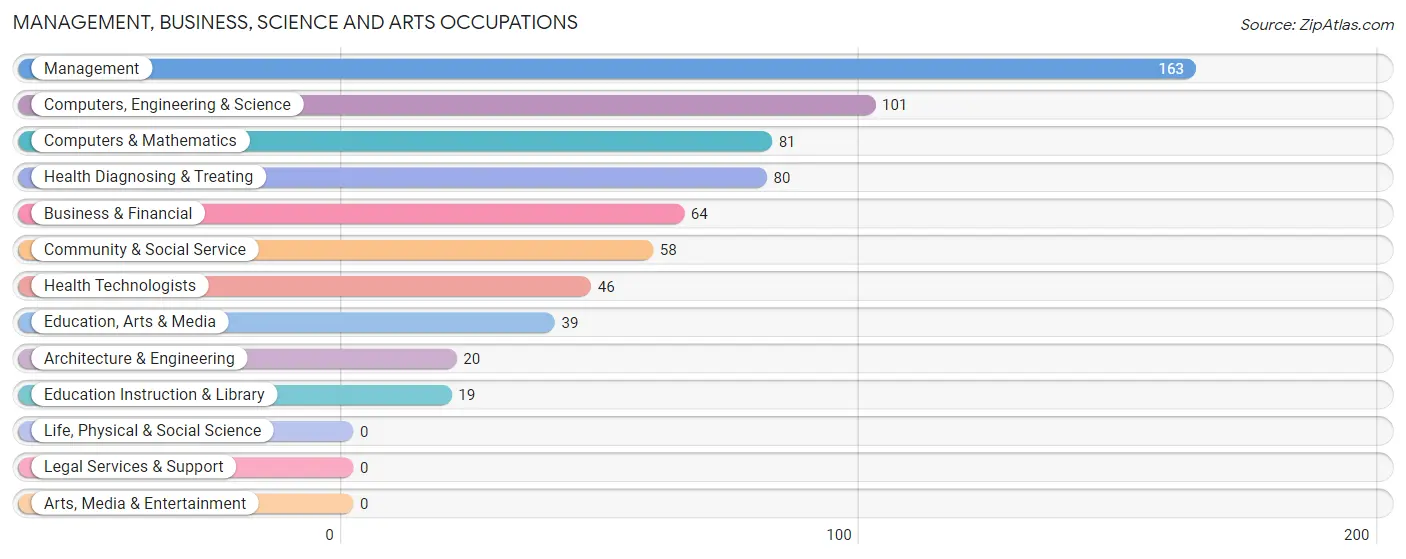
Management, Business, Science and Arts Occupations
The most common Management, Business, Science and Arts occupations in Geneva are Management (163 | 10.2%), Computers, Engineering & Science (101 | 6.3%), Computers & Mathematics (81 | 5.1%), Health Diagnosing & Treating (80 | 5.0%), and Business & Financial (64 | 4.0%).
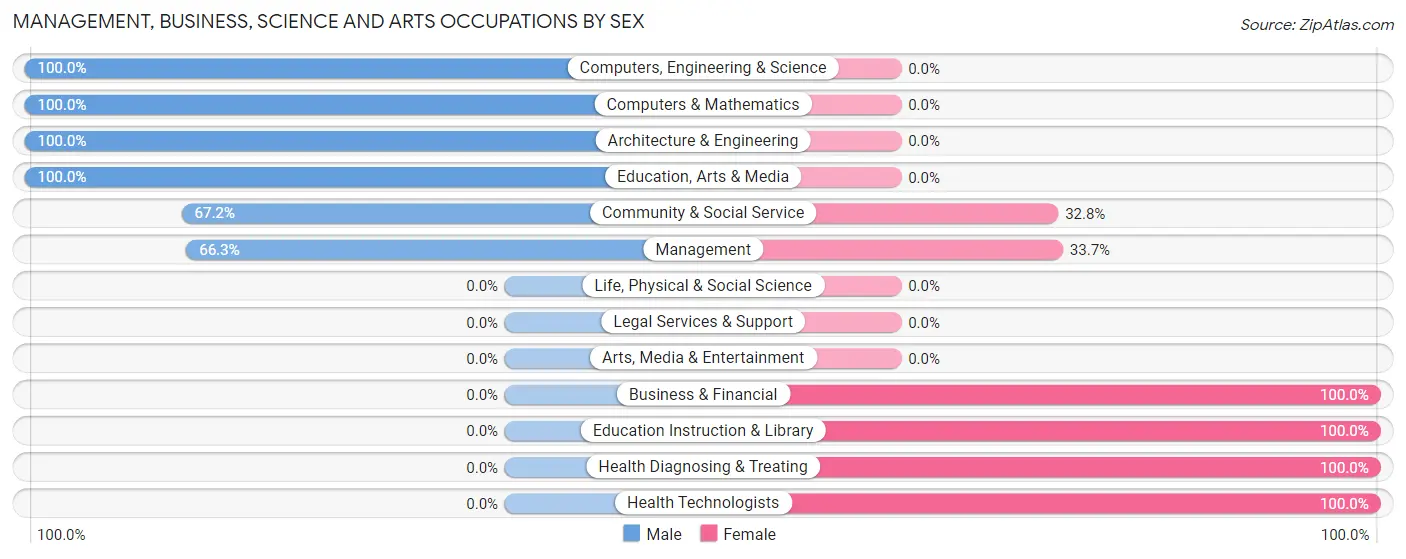
Management, Business, Science and Arts Occupations by Sex
Within the Management, Business, Science and Arts occupations in Geneva, the most male-oriented occupations are Computers, Engineering & Science (100.0%), Computers & Mathematics (100.0%), and Architecture & Engineering (100.0%), while the most female-oriented occupations are Business & Financial (100.0%), Education Instruction & Library (100.0%), and Health Diagnosing & Treating (100.0%).
| Occupation | Male | Female |
| Management | 108 (66.3%) | 55 (33.7%) |
| Business & Financial | 0 (0.0%) | 64 (100.0%) |
| Computers, Engineering & Science | 101 (100.0%) | 0 (0.0%) |
| Computers & Mathematics | 81 (100.0%) | 0 (0.0%) |
| Architecture & Engineering | 20 (100.0%) | 0 (0.0%) |
| Life, Physical & Social Science | 0 (0.0%) | 0 (0.0%) |
| Community & Social Service | 39 (67.2%) | 19 (32.8%) |
| Education, Arts & Media | 39 (100.0%) | 0 (0.0%) |
| Legal Services & Support | 0 (0.0%) | 0 (0.0%) |
| Education Instruction & Library | 0 (0.0%) | 19 (100.0%) |
| Arts, Media & Entertainment | 0 (0.0%) | 0 (0.0%) |
| Health Diagnosing & Treating | 0 (0.0%) | 80 (100.0%) |
| Health Technologists | 0 (0.0%) | 46 (100.0%) |
| Total (Category) | 248 (53.2%) | 218 (46.8%) |
| Total (Overall) | 956 (59.7%) | 646 (40.3%) |
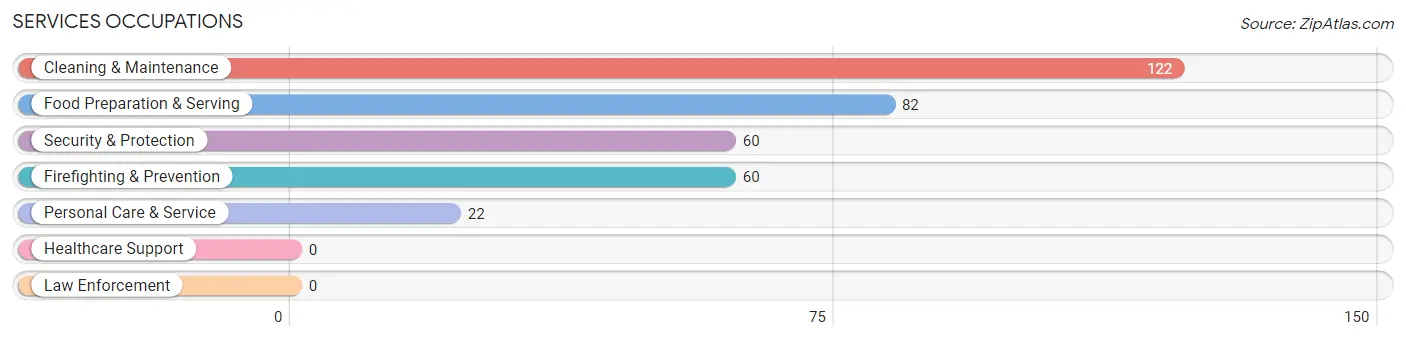
Services Occupations
The most common Services occupations in Geneva are Cleaning & Maintenance (122 | 7.6%), Food Preparation & Serving (82 | 5.1%), Security & Protection (60 | 3.7%), Firefighting & Prevention (60 | 3.7%), and Personal Care & Service (22 | 1.4%).
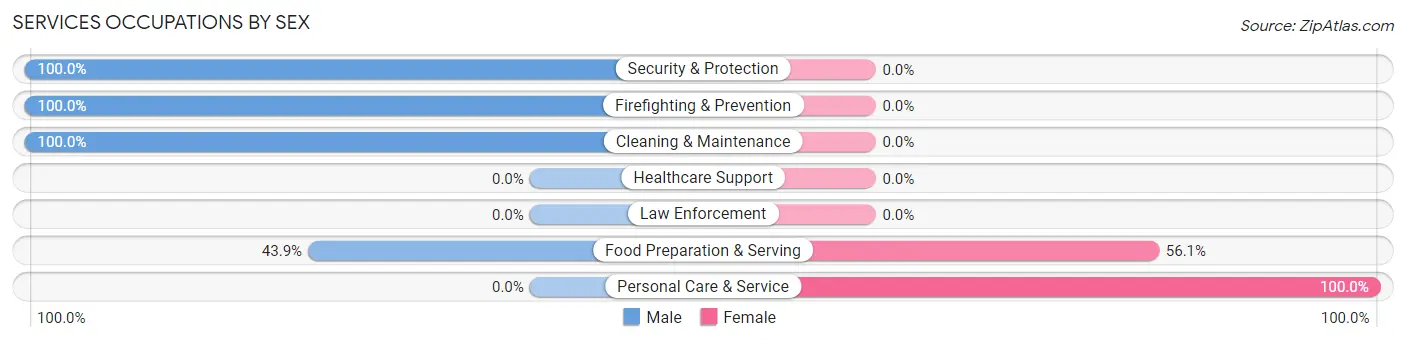
Services Occupations by Sex
Within the Services occupations in Geneva, the most male-oriented occupations are Security & Protection (100.0%), Firefighting & Prevention (100.0%), and Cleaning & Maintenance (100.0%), while the most female-oriented occupations are Personal Care & Service (100.0%), and Food Preparation & Serving (56.1%).
| Occupation | Male | Female |
| Healthcare Support | 0 (0.0%) | 0 (0.0%) |
| Security & Protection | 60 (100.0%) | 0 (0.0%) |
| Firefighting & Prevention | 60 (100.0%) | 0 (0.0%) |
| Law Enforcement | 0 (0.0%) | 0 (0.0%) |
| Food Preparation & Serving | 36 (43.9%) | 46 (56.1%) |
| Cleaning & Maintenance | 122 (100.0%) | 0 (0.0%) |
| Personal Care & Service | 0 (0.0%) | 22 (100.0%) |
| Total (Category) | 218 (76.2%) | 68 (23.8%) |
| Total (Overall) | 956 (59.7%) | 646 (40.3%) |
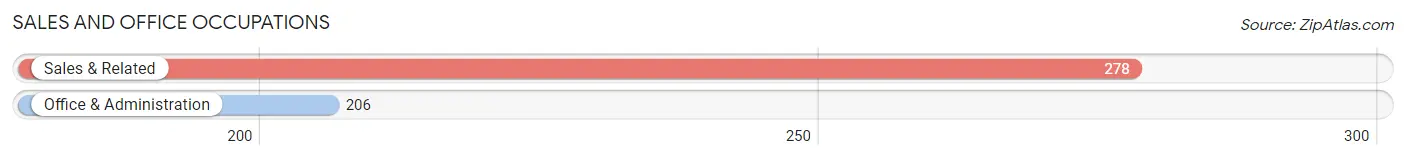
Sales and Office Occupations
The most common Sales and Office occupations in Geneva are Sales & Related (278 | 17.3%), and Office & Administration (206 | 12.9%).
Sales and Office Occupations by Sex
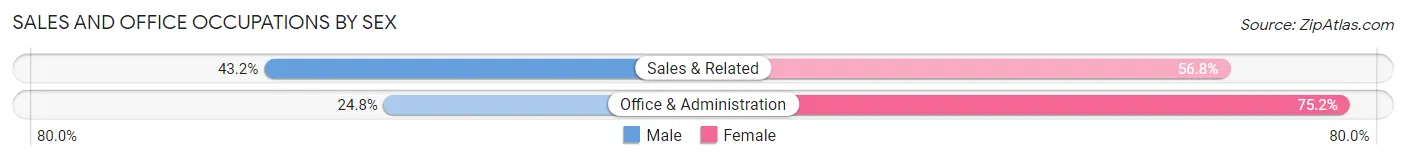
| Occupation | Male | Female |
| Sales & Related | 120 (43.2%) | 158 (56.8%) |
| Office & Administration | 51 (24.8%) | 155 (75.2%) |
| Total (Category) | 171 (35.3%) | 313 (64.7%) |
| Total (Overall) | 956 (59.7%) | 646 (40.3%) |
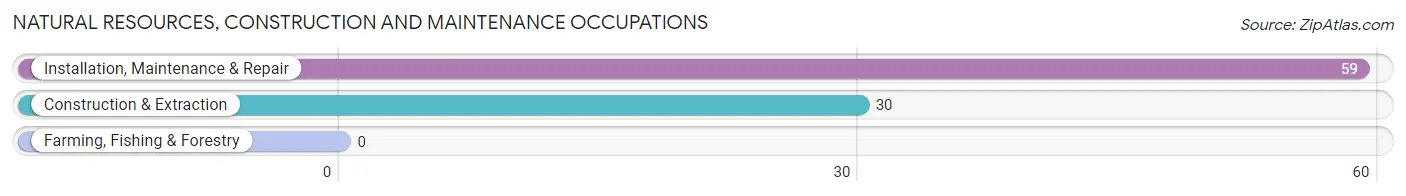
Natural Resources, Construction and Maintenance Occupations
The most common Natural Resources, Construction and Maintenance occupations in Geneva are Installation, Maintenance & Repair (59 | 3.7%), and Construction & Extraction (30 | 1.9%).
Natural Resources, Construction and Maintenance Occupations by Sex
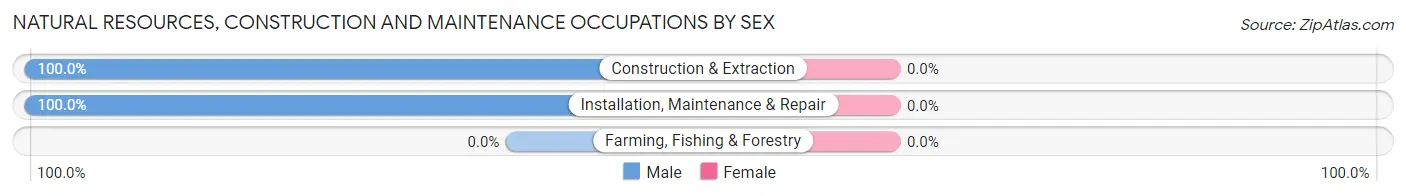
| Occupation | Male | Female |
| Farming, Fishing & Forestry | 0 (0.0%) | 0 (0.0%) |
| Construction & Extraction | 30 (100.0%) | 0 (0.0%) |
| Installation, Maintenance & Repair | 59 (100.0%) | 0 (0.0%) |
| Total (Category) | 89 (100.0%) | 0 (0.0%) |
| Total (Overall) | 956 (59.7%) | 646 (40.3%) |
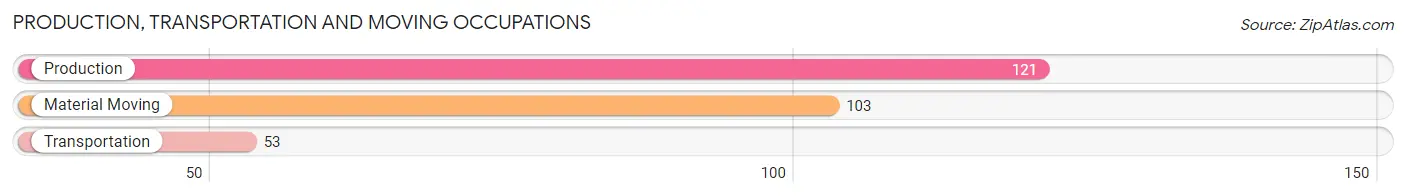
Production, Transportation and Moving Occupations
The most common Production, Transportation and Moving occupations in Geneva are Production (121 | 7.5%), Material Moving (103 | 6.4%), and Transportation (53 | 3.3%).
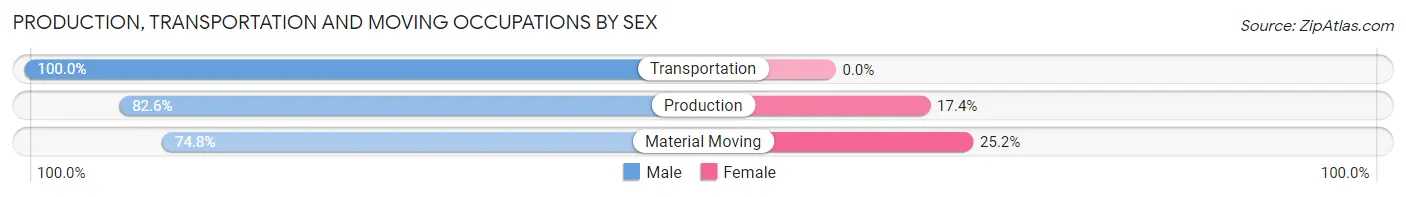
Production, Transportation and Moving Occupations by Sex
| Occupation | Male | Female |
| Production | 100 (82.6%) | 21 (17.4%) |
| Transportation | 53 (100.0%) | 0 (0.0%) |
| Material Moving | 77 (74.8%) | 26 (25.2%) |
| Total (Category) | 230 (83.0%) | 47 (17.0%) |
| Total (Overall) | 956 (59.7%) | 646 (40.3%) |
Employment Industries by Sex in Geneva
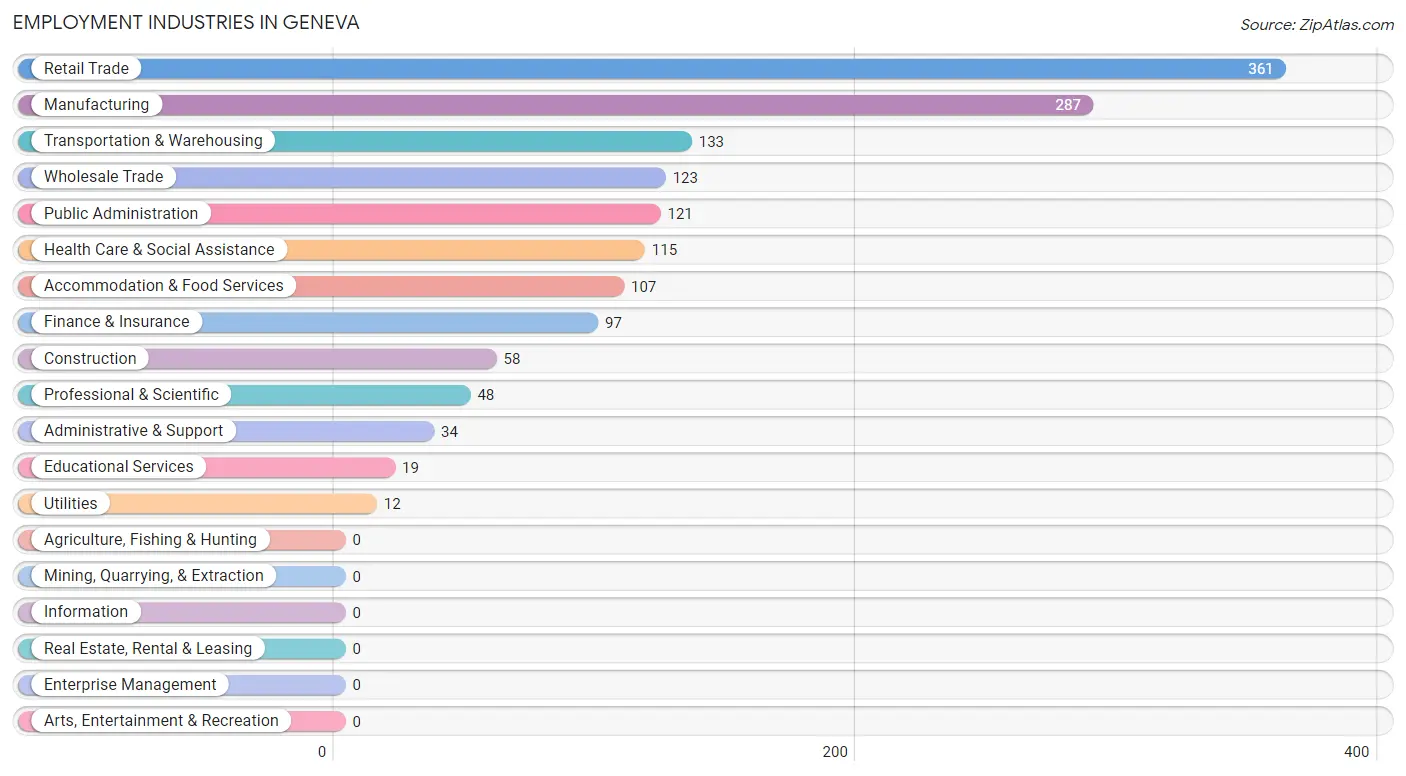
Employment Industries in Geneva
The major employment industries in Geneva include Retail Trade (361 | 22.5%), Manufacturing (287 | 17.9%), Transportation & Warehousing (133 | 8.3%), Wholesale Trade (123 | 7.7%), and Public Administration (121 | 7.5%).
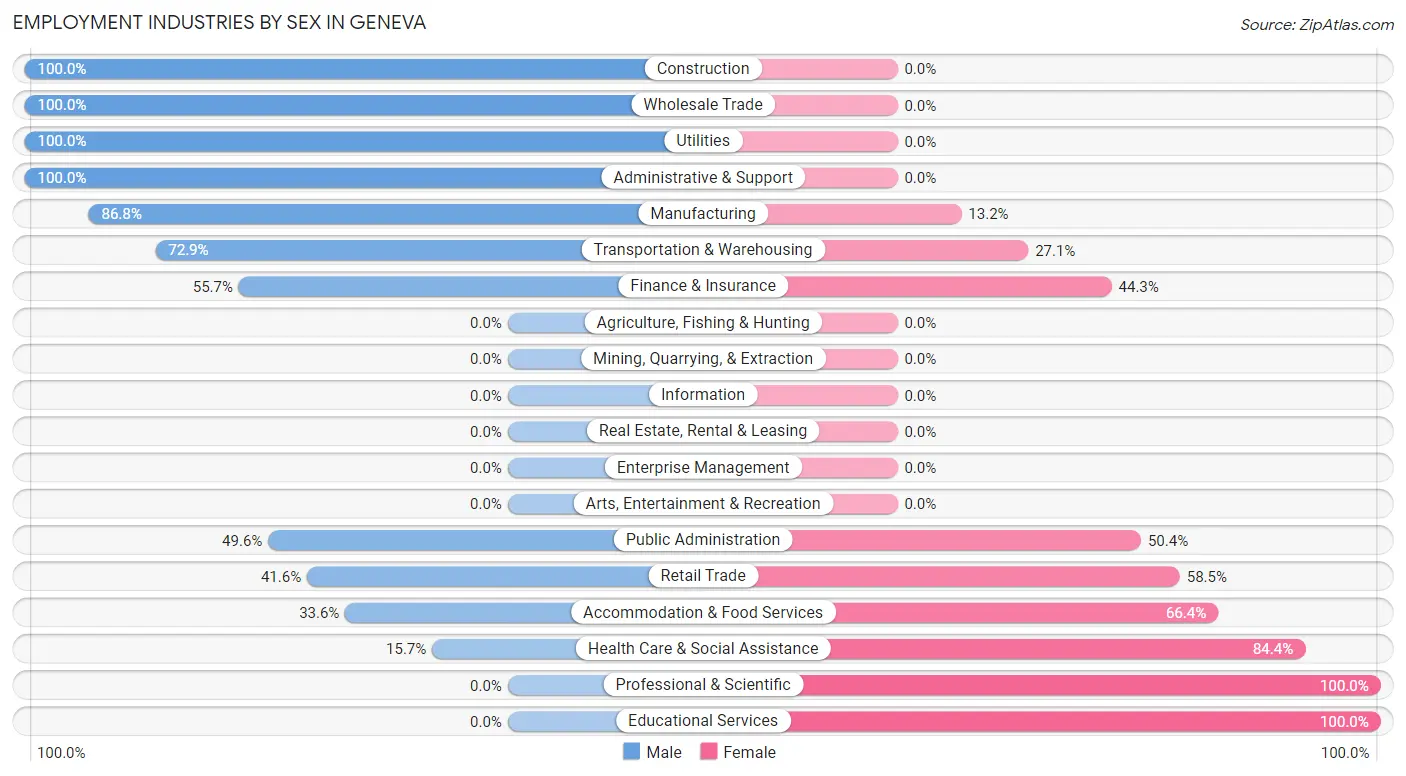
Employment Industries by Sex in Geneva
The Geneva industries that see more men than women are Construction (100.0%), Wholesale Trade (100.0%), and Utilities (100.0%), whereas the industries that tend to have a higher number of women are Professional & Scientific (100.0%), Educational Services (100.0%), and Health Care & Social Assistance (84.4%).
| Industry | Male | Female |
| Agriculture, Fishing & Hunting | 0 (0.0%) | 0 (0.0%) |
| Mining, Quarrying, & Extraction | 0 (0.0%) | 0 (0.0%) |
| Construction | 58 (100.0%) | 0 (0.0%) |
| Manufacturing | 249 (86.8%) | 38 (13.2%) |
| Wholesale Trade | 123 (100.0%) | 0 (0.0%) |
| Retail Trade | 150 (41.5%) | 211 (58.5%) |
| Transportation & Warehousing | 97 (72.9%) | 36 (27.1%) |
| Utilities | 12 (100.0%) | 0 (0.0%) |
| Information | 0 (0.0%) | 0 (0.0%) |
| Finance & Insurance | 54 (55.7%) | 43 (44.3%) |
| Real Estate, Rental & Leasing | 0 (0.0%) | 0 (0.0%) |
| Professional & Scientific | 0 (0.0%) | 48 (100.0%) |
| Enterprise Management | 0 (0.0%) | 0 (0.0%) |
| Administrative & Support | 34 (100.0%) | 0 (0.0%) |
| Educational Services | 0 (0.0%) | 19 (100.0%) |
| Health Care & Social Assistance | 18 (15.7%) | 97 (84.4%) |
| Arts, Entertainment & Recreation | 0 (0.0%) | 0 (0.0%) |
| Accommodation & Food Services | 36 (33.6%) | 71 (66.4%) |
| Public Administration | 60 (49.6%) | 61 (50.4%) |
| Total | 956 (59.7%) | 646 (40.3%) |
Education in Geneva
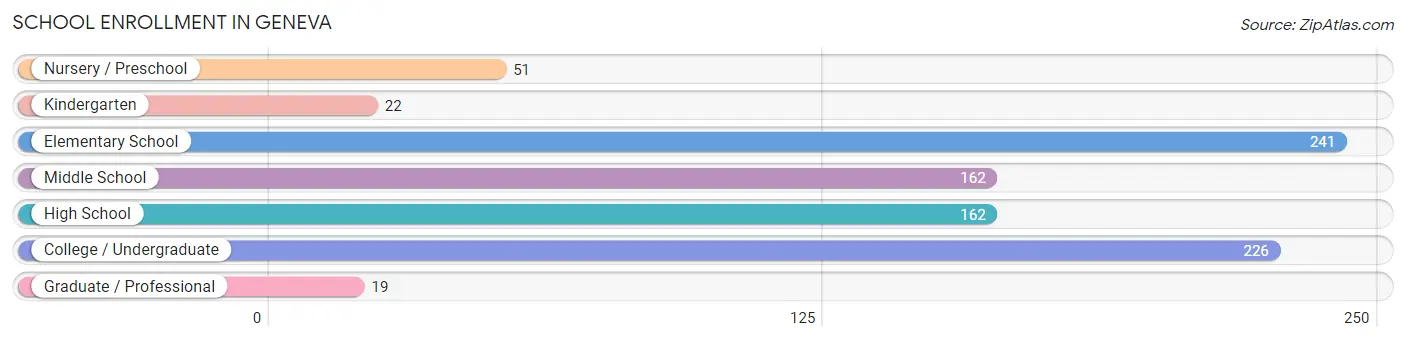
School Enrollment in Geneva
The most common levels of schooling among the 883 students in Geneva are elementary school (241 | 27.3%), college / undergraduate (226 | 25.6%), and middle school (162 | 18.3%).
| School Level | # Students | % Students |
| Nursery / Preschool | 51 | 5.8% |
| Kindergarten | 22 | 2.5% |
| Elementary School | 241 | 27.3% |
| Middle School | 162 | 18.3% |
| High School | 162 | 18.3% |
| College / Undergraduate | 226 | 25.6% |
| Graduate / Professional | 19 | 2.1% |
| Total | 883 | 100.0% |
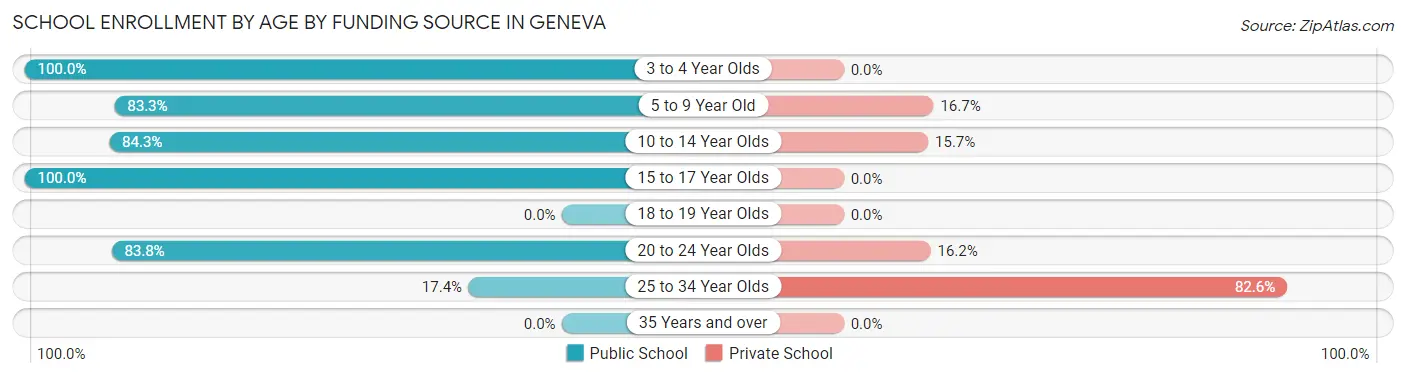
School Enrollment by Age by Funding Source in Geneva
Out of a total of 883 students who are enrolled in schools in Geneva, 184 (20.8%) attend a private institution, while the remaining 699 (79.2%) are enrolled in public schools. The age group of 25 to 34 year olds has the highest likelihood of being enrolled in private schools, with 90 (82.6% in the age bracket) enrolled. Conversely, the age group of 3 to 4 year olds has the lowest likelihood of being enrolled in a private school, with 51 (100.0% in the age bracket) attending a public institution.
| Age Bracket | Public School | Private School |
| 3 to 4 Year Olds | 51 (100.0%) | 0 (0.0%) |
| 5 to 9 Year Old | 219 (83.3%) | 44 (16.7%) |
| 10 to 14 Year Olds | 150 (84.3%) | 28 (15.7%) |
| 15 to 17 Year Olds | 146 (100.0%) | 0 (0.0%) |
| 18 to 19 Year Olds | 0 (0.0%) | 0 (0.0%) |
| 20 to 24 Year Olds | 114 (83.8%) | 22 (16.2%) |
| 25 to 34 Year Olds | 19 (17.4%) | 90 (82.6%) |
| 35 Years and over | 0 (0.0%) | 0 (0.0%) |
| Total | 699 (79.2%) | 184 (20.8%) |
Educational Attainment by Field of Study in Geneva
Business (203 | 37.7%), education (84 | 15.6%), science & technology (65 | 12.1%), psychology (49 | 9.1%), and liberal arts & history (43 | 8.0%) are the most common fields of study among 538 individuals in Geneva who have obtained a bachelor's degree or higher.
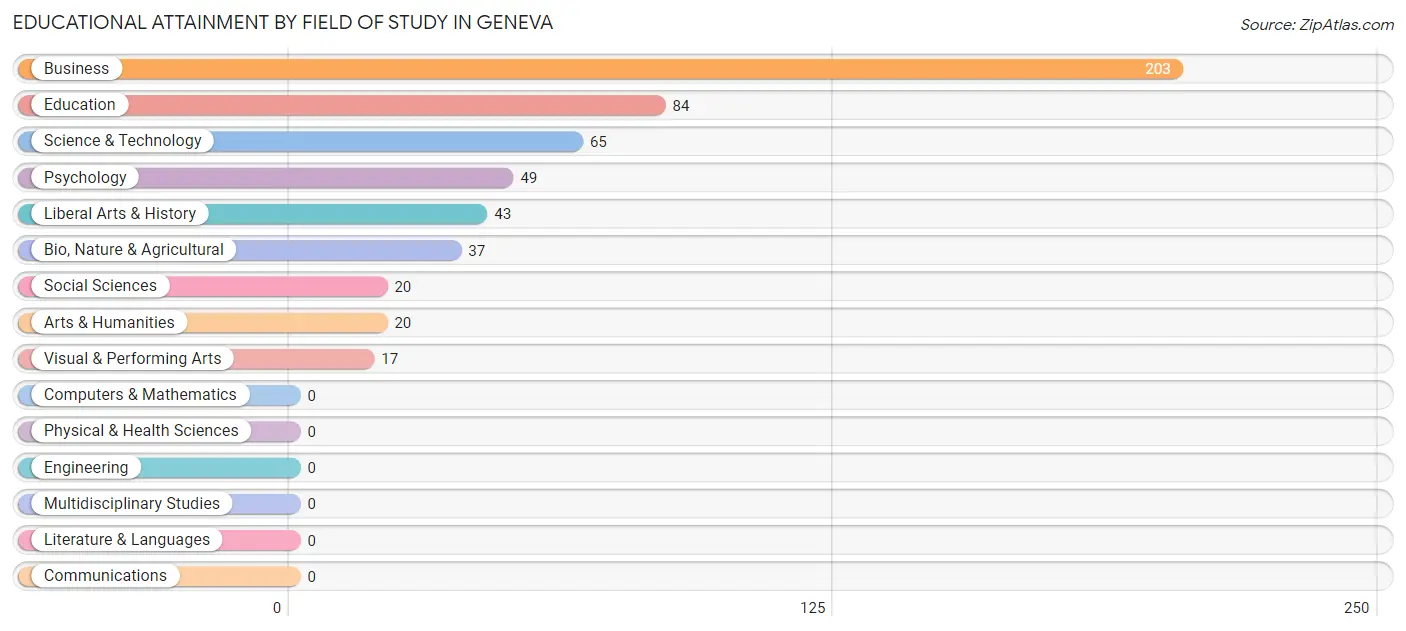
| Field of Study | # Graduates | % Graduates |
| Computers & Mathematics | 0 | 0.0% |
| Bio, Nature & Agricultural | 37 | 6.9% |
| Physical & Health Sciences | 0 | 0.0% |
| Psychology | 49 | 9.1% |
| Social Sciences | 20 | 3.7% |
| Engineering | 0 | 0.0% |
| Multidisciplinary Studies | 0 | 0.0% |
| Science & Technology | 65 | 12.1% |
| Business | 203 | 37.7% |
| Education | 84 | 15.6% |
| Literature & Languages | 0 | 0.0% |
| Liberal Arts & History | 43 | 8.0% |
| Visual & Performing Arts | 17 | 3.2% |
| Communications | 0 | 0.0% |
| Arts & Humanities | 20 | 3.7% |
| Total | 538 | 100.0% |
Transportation & Commute in Geneva
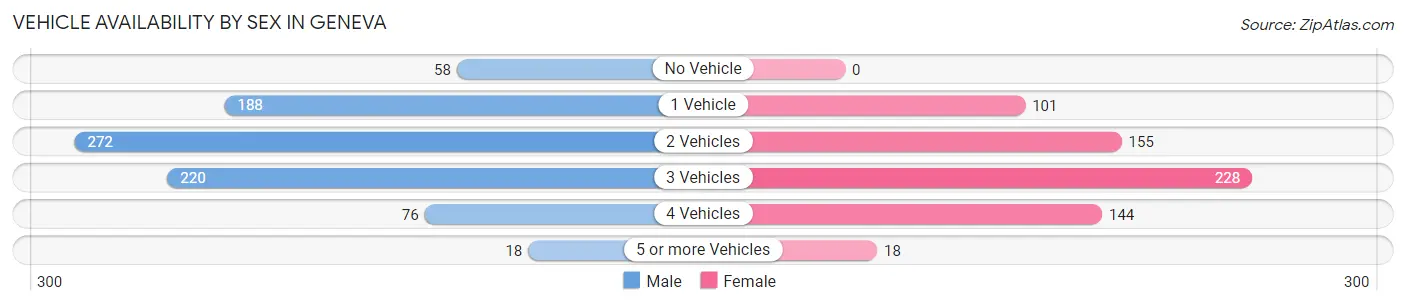
Vehicle Availability by Sex in Geneva
The most prevalent vehicle ownership categories in Geneva are males with 2 vehicles (272, accounting for 32.7%) and females with 2 vehicles (155, making up 42.1%).
| Vehicles Available | Male | Female |
| No Vehicle | 58 (7.0%) | 0 (0.0%) |
| 1 Vehicle | 188 (22.6%) | 101 (15.6%) |
| 2 Vehicles | 272 (32.7%) | 155 (24.0%) |
| 3 Vehicles | 220 (26.4%) | 228 (35.3%) |
| 4 Vehicles | 76 (9.1%) | 144 (22.3%) |
| 5 or more Vehicles | 18 (2.2%) | 18 (2.8%) |
| Total | 832 (100.0%) | 646 (100.0%) |
Commute Time in Geneva
The most frequently occuring commute durations in Geneva are 5 to 9 minutes (389 commuters, 27.5%), 10 to 14 minutes (318 commuters, 22.5%), and less than 5 minutes (226 commuters, 16.0%).
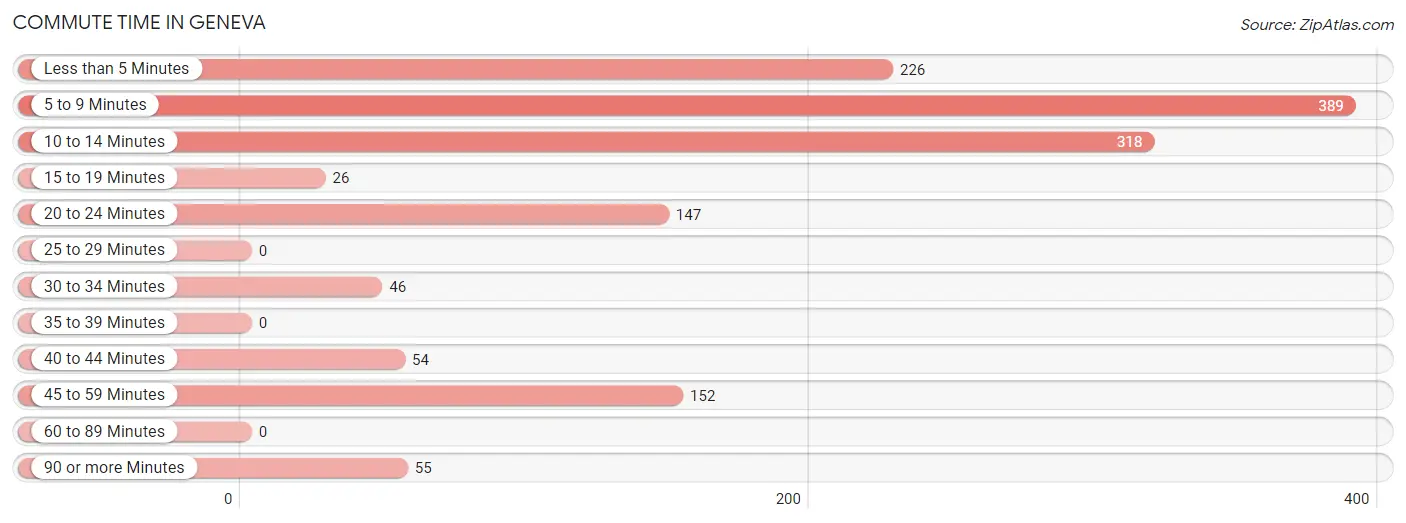
| Commute Time | # Commuters | % Commuters |
| Less than 5 Minutes | 226 | 16.0% |
| 5 to 9 Minutes | 389 | 27.5% |
| 10 to 14 Minutes | 318 | 22.5% |
| 15 to 19 Minutes | 26 | 1.8% |
| 20 to 24 Minutes | 147 | 10.4% |
| 25 to 29 Minutes | 0 | 0.0% |
| 30 to 34 Minutes | 46 | 3.3% |
| 35 to 39 Minutes | 0 | 0.0% |
| 40 to 44 Minutes | 54 | 3.8% |
| 45 to 59 Minutes | 152 | 10.8% |
| 60 to 89 Minutes | 0 | 0.0% |
| 90 or more Minutes | 55 | 3.9% |
Commute Time by Sex in Geneva
The most common commute times in Geneva are 5 to 9 minutes (173 commuters, 21.8%) for males and 5 to 9 minutes (216 commuters, 34.8%) for females.
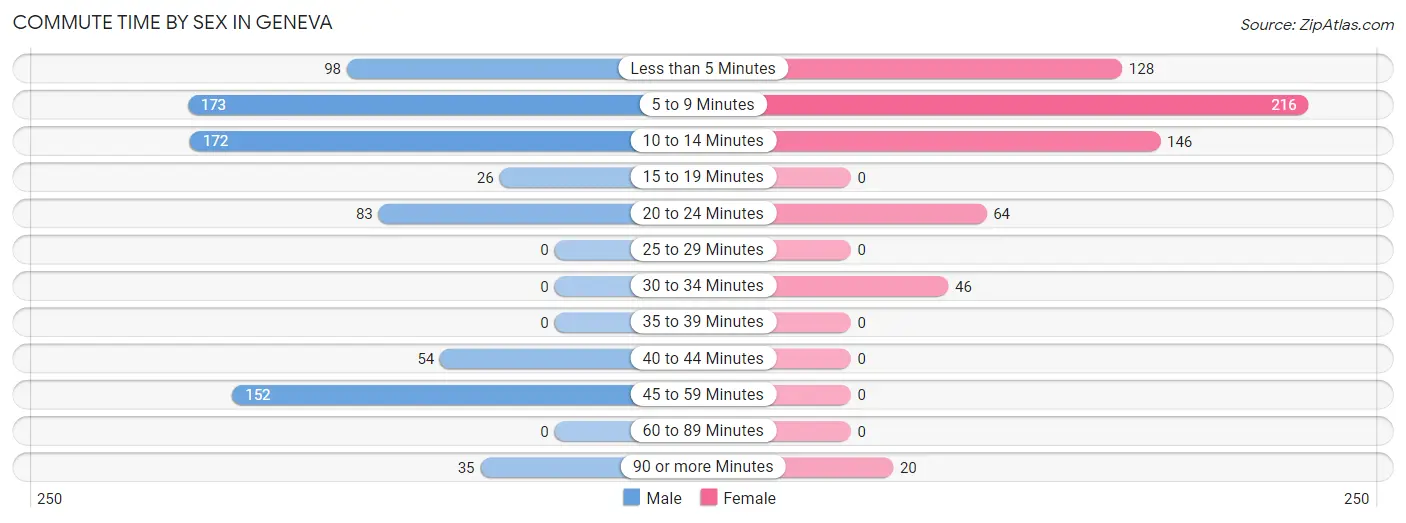
| Commute Time | Male | Female |
| Less than 5 Minutes | 98 (12.4%) | 128 (20.6%) |
| 5 to 9 Minutes | 173 (21.8%) | 216 (34.8%) |
| 10 to 14 Minutes | 172 (21.7%) | 146 (23.5%) |
| 15 to 19 Minutes | 26 (3.3%) | 0 (0.0%) |
| 20 to 24 Minutes | 83 (10.5%) | 64 (10.3%) |
| 25 to 29 Minutes | 0 (0.0%) | 0 (0.0%) |
| 30 to 34 Minutes | 0 (0.0%) | 46 (7.4%) |
| 35 to 39 Minutes | 0 (0.0%) | 0 (0.0%) |
| 40 to 44 Minutes | 54 (6.8%) | 0 (0.0%) |
| 45 to 59 Minutes | 152 (19.2%) | 0 (0.0%) |
| 60 to 89 Minutes | 0 (0.0%) | 0 (0.0%) |
| 90 or more Minutes | 35 (4.4%) | 20 (3.2%) |
Time of Departure to Work by Sex in Geneva
The most frequent times of departure to work in Geneva are 7:30 AM to 7:59 AM (187, 23.6%) for males and 7:30 AM to 7:59 AM (180, 29.0%) for females.
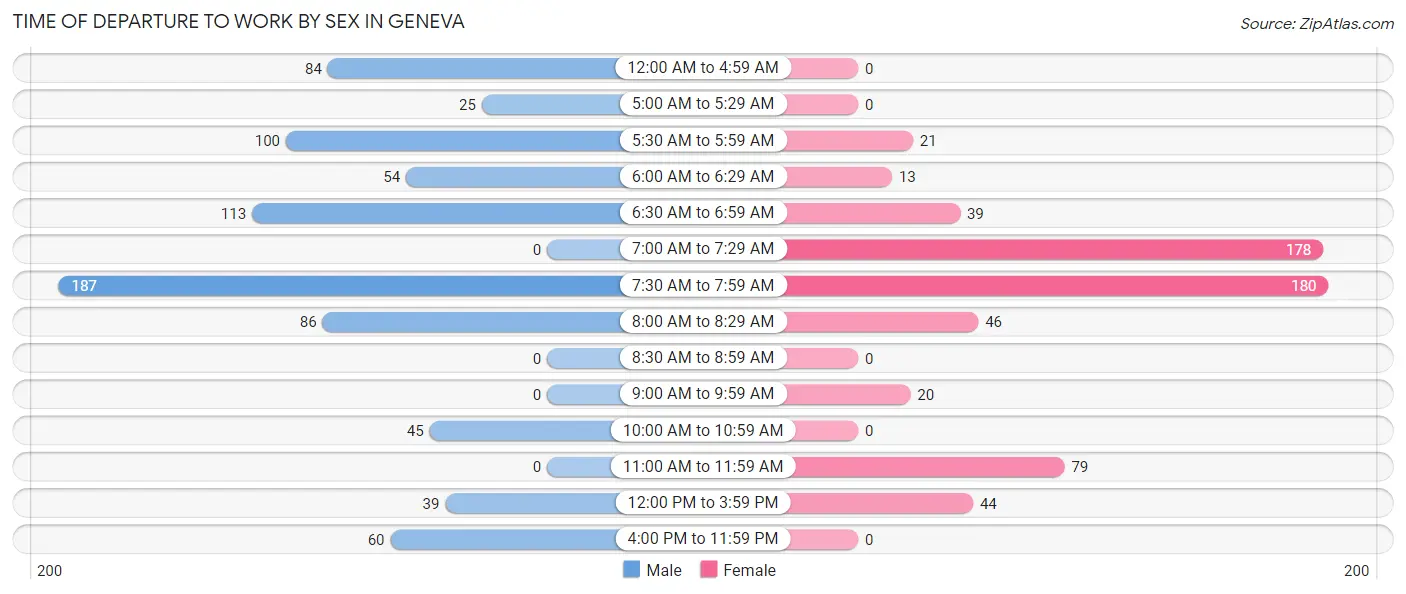
| Time of Departure | Male | Female |
| 12:00 AM to 4:59 AM | 84 (10.6%) | 0 (0.0%) |
| 5:00 AM to 5:29 AM | 25 (3.2%) | 0 (0.0%) |
| 5:30 AM to 5:59 AM | 100 (12.6%) | 21 (3.4%) |
| 6:00 AM to 6:29 AM | 54 (6.8%) | 13 (2.1%) |
| 6:30 AM to 6:59 AM | 113 (14.2%) | 39 (6.3%) |
| 7:00 AM to 7:29 AM | 0 (0.0%) | 178 (28.7%) |
| 7:30 AM to 7:59 AM | 187 (23.6%) | 180 (29.0%) |
| 8:00 AM to 8:29 AM | 86 (10.8%) | 46 (7.4%) |
| 8:30 AM to 8:59 AM | 0 (0.0%) | 0 (0.0%) |
| 9:00 AM to 9:59 AM | 0 (0.0%) | 20 (3.2%) |
| 10:00 AM to 10:59 AM | 45 (5.7%) | 0 (0.0%) |
| 11:00 AM to 11:59 AM | 0 (0.0%) | 79 (12.7%) |
| 12:00 PM to 3:59 PM | 39 (4.9%) | 44 (7.1%) |
| 4:00 PM to 11:59 PM | 60 (7.6%) | 0 (0.0%) |
| Total | 793 (100.0%) | 620 (100.0%) |
Housing Occupancy in Geneva
Occupancy by Ownership in Geneva
Of the total 1,832 dwellings in Geneva, owner-occupied units account for 1,157 (63.2%), while renter-occupied units make up 675 (36.8%).
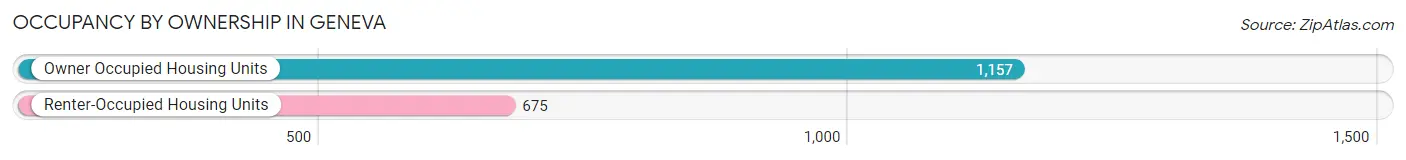
| Occupancy | # Housing Units | % Housing Units |
| Owner Occupied Housing Units | 1,157 | 63.2% |
| Renter-Occupied Housing Units | 675 | 36.8% |
| Total Occupied Housing Units | 1,832 | 100.0% |
Occupancy by Household Size in Geneva
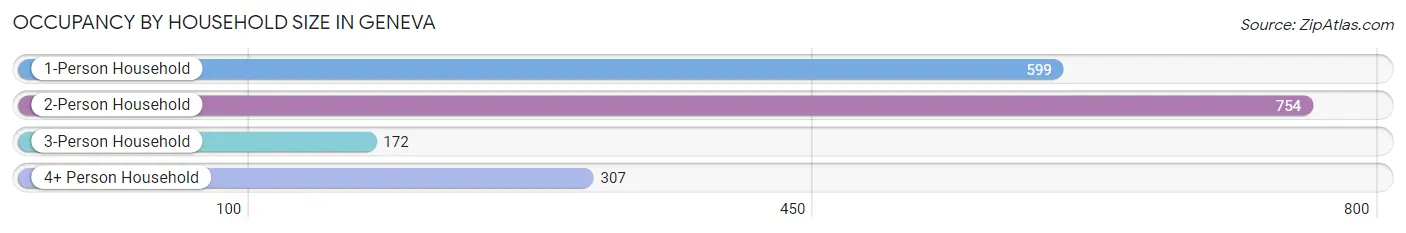
| Household Size | # Housing Units | % Housing Units |
| 1-Person Household | 599 | 32.7% |
| 2-Person Household | 754 | 41.2% |
| 3-Person Household | 172 | 9.4% |
| 4+ Person Household | 307 | 16.8% |
| Total Housing Units | 1,832 | 100.0% |
Occupancy by Ownership by Household Size in Geneva
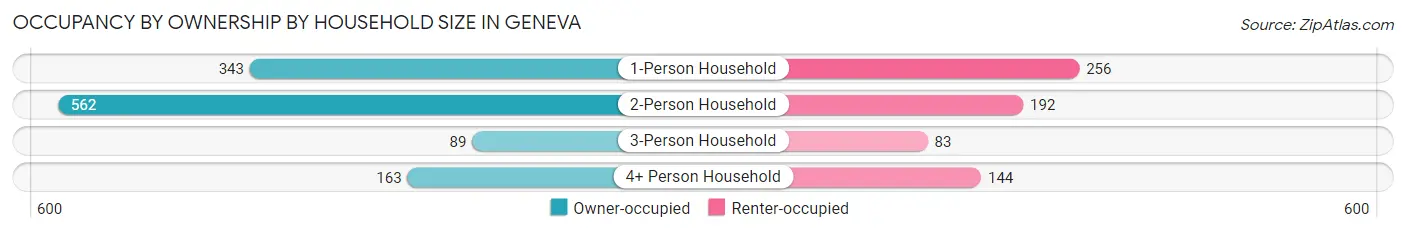
| Household Size | Owner-occupied | Renter-occupied |
| 1-Person Household | 343 (57.3%) | 256 (42.7%) |
| 2-Person Household | 562 (74.5%) | 192 (25.5%) |
| 3-Person Household | 89 (51.7%) | 83 (48.3%) |
| 4+ Person Household | 163 (53.1%) | 144 (46.9%) |
| Total Housing Units | 1,157 (63.2%) | 675 (36.8%) |
Occupancy by Educational Attainment in Geneva
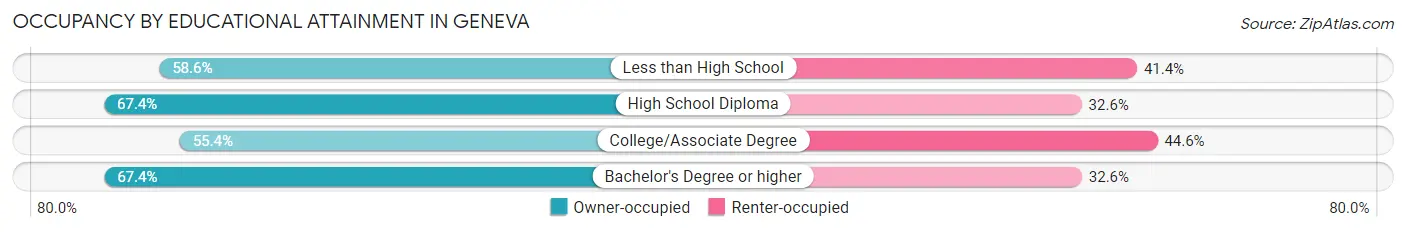
| Household Size | Owner-occupied | Renter-occupied |
| Less than High School | 95 (58.6%) | 67 (41.4%) |
| High School Diploma | 546 (67.4%) | 264 (32.6%) |
| College/Associate Degree | 293 (55.4%) | 236 (44.6%) |
| Bachelor's Degree or higher | 223 (67.4%) | 108 (32.6%) |
Occupancy by Age of Householder in Geneva
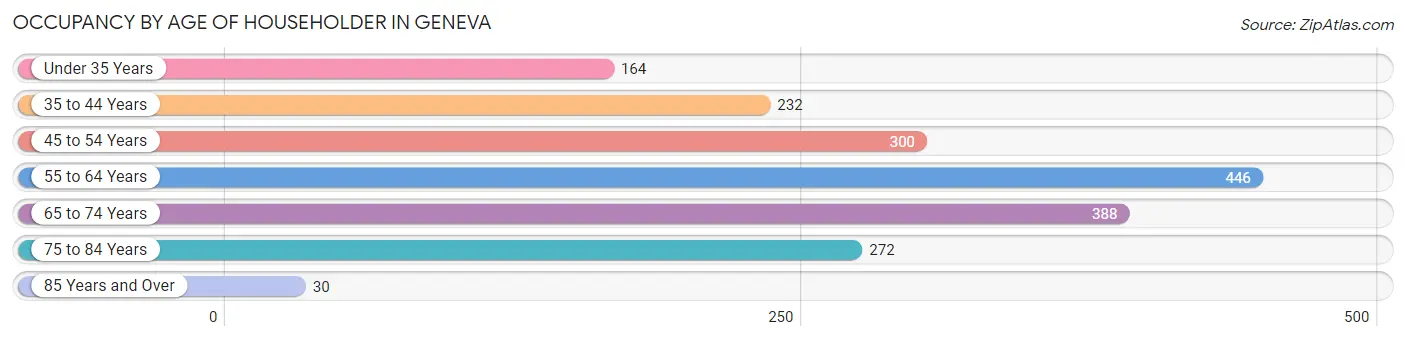
| Age Bracket | # Households | % Households |
| Under 35 Years | 164 | 8.9% |
| 35 to 44 Years | 232 | 12.7% |
| 45 to 54 Years | 300 | 16.4% |
| 55 to 64 Years | 446 | 24.3% |
| 65 to 74 Years | 388 | 21.2% |
| 75 to 84 Years | 272 | 14.8% |
| 85 Years and Over | 30 | 1.6% |
| Total | 1,832 | 100.0% |
Housing Finances in Geneva
Median Income by Occupancy in Geneva
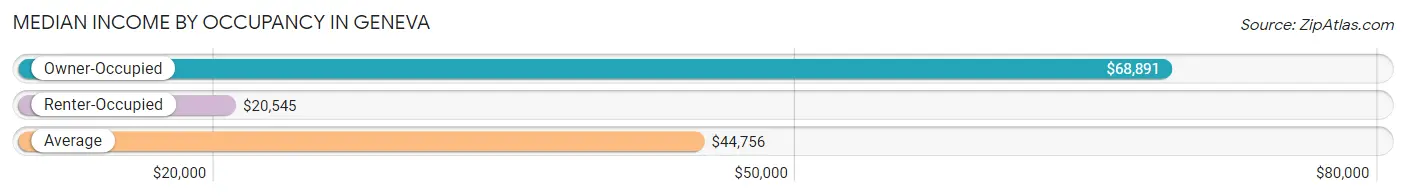
| Occupancy Type | # Households | Median Income |
| Owner-Occupied | 1,157 (63.2%) | $68,891 |
| Renter-Occupied | 675 (36.8%) | $20,545 |
| Average | 1,832 (100.0%) | $44,756 |
Occupancy by Householder Income Bracket in Geneva
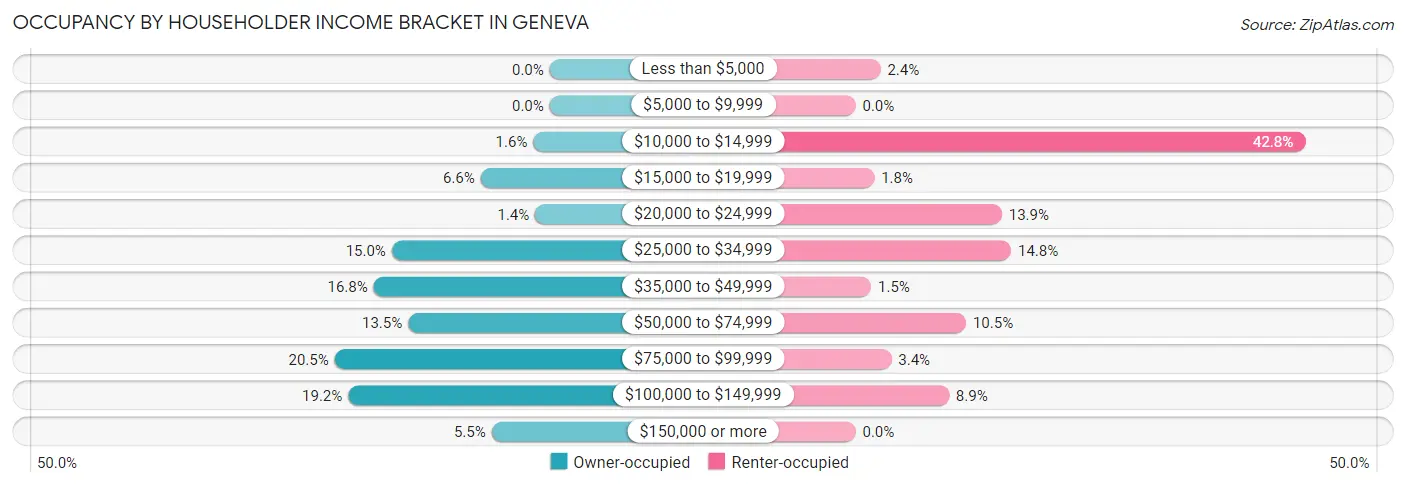
| Income Bracket | Owner-occupied | Renter-occupied |
| Less than $5,000 | 0 (0.0%) | 16 (2.4%) |
| $5,000 to $9,999 | 0 (0.0%) | 0 (0.0%) |
| $10,000 to $14,999 | 18 (1.6%) | 289 (42.8%) |
| $15,000 to $19,999 | 76 (6.6%) | 12 (1.8%) |
| $20,000 to $24,999 | 16 (1.4%) | 94 (13.9%) |
| $25,000 to $34,999 | 174 (15.0%) | 100 (14.8%) |
| $35,000 to $49,999 | 194 (16.8%) | 10 (1.5%) |
| $50,000 to $74,999 | 156 (13.5%) | 71 (10.5%) |
| $75,000 to $99,999 | 237 (20.5%) | 23 (3.4%) |
| $100,000 to $149,999 | 222 (19.2%) | 60 (8.9%) |
| $150,000 or more | 64 (5.5%) | 0 (0.0%) |
| Total | 1,157 (100.0%) | 675 (100.0%) |
Monthly Housing Cost Tiers in Geneva
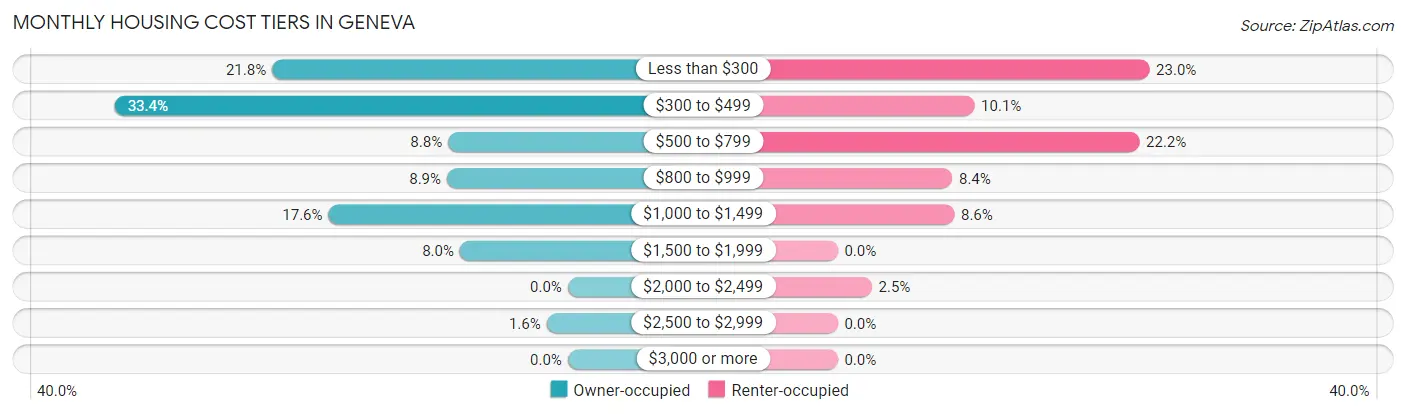
| Monthly Cost | Owner-occupied | Renter-occupied |
| Less than $300 | 252 (21.8%) | 155 (23.0%) |
| $300 to $499 | 386 (33.4%) | 68 (10.1%) |
| $500 to $799 | 102 (8.8%) | 150 (22.2%) |
| $800 to $999 | 103 (8.9%) | 57 (8.4%) |
| $1,000 to $1,499 | 204 (17.6%) | 58 (8.6%) |
| $1,500 to $1,999 | 92 (8.0%) | 0 (0.0%) |
| $2,000 to $2,499 | 0 (0.0%) | 17 (2.5%) |
| $2,500 to $2,999 | 18 (1.6%) | 0 (0.0%) |
| $3,000 or more | 0 (0.0%) | 0 (0.0%) |
| Total | 1,157 (100.0%) | 675 (100.0%) |
Physical Housing Characteristics in Geneva
Housing Structures in Geneva
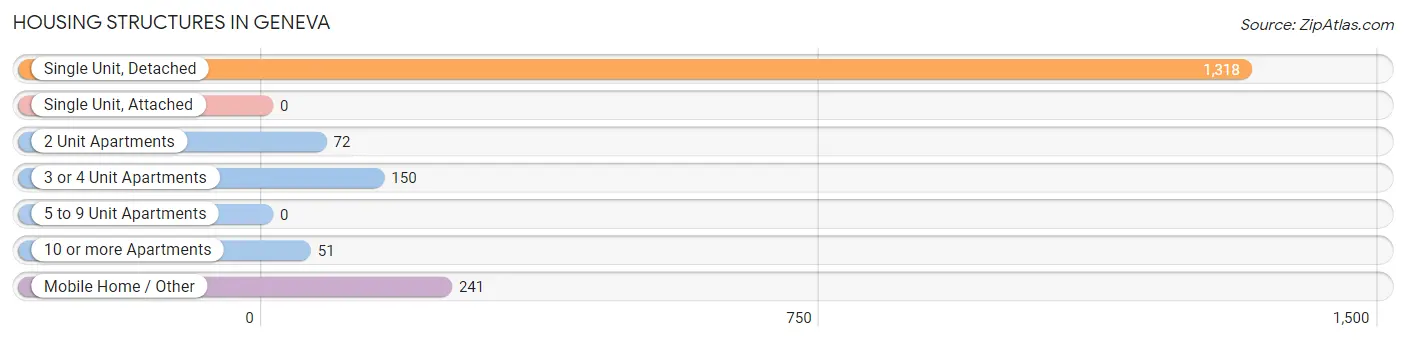
| Structure Type | # Housing Units | % Housing Units |
| Single Unit, Detached | 1,318 | 71.9% |
| Single Unit, Attached | 0 | 0.0% |
| 2 Unit Apartments | 72 | 3.9% |
| 3 or 4 Unit Apartments | 150 | 8.2% |
| 5 to 9 Unit Apartments | 0 | 0.0% |
| 10 or more Apartments | 51 | 2.8% |
| Mobile Home / Other | 241 | 13.2% |
| Total | 1,832 | 100.0% |
Housing Structures by Occupancy in Geneva
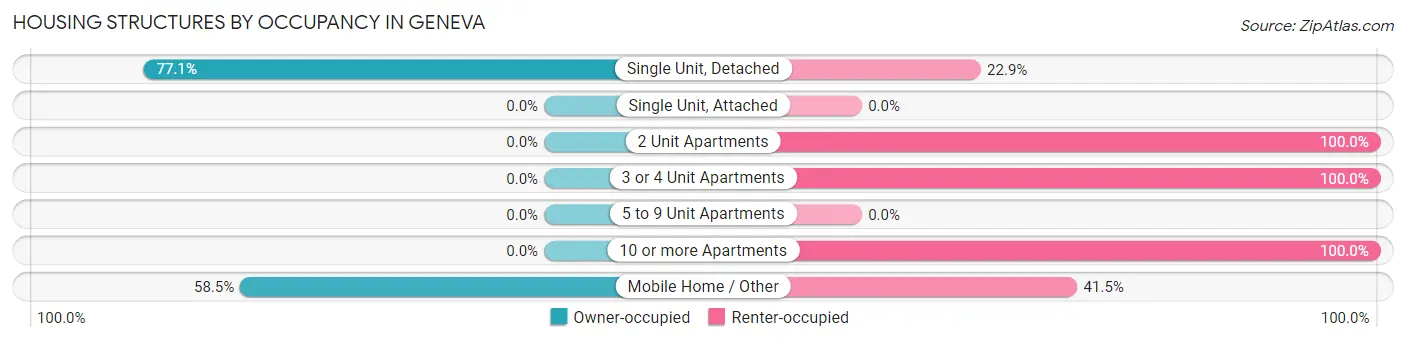
| Structure Type | Owner-occupied | Renter-occupied |
| Single Unit, Detached | 1,016 (77.1%) | 302 (22.9%) |
| Single Unit, Attached | 0 (0.0%) | 0 (0.0%) |
| 2 Unit Apartments | 0 (0.0%) | 72 (100.0%) |
| 3 or 4 Unit Apartments | 0 (0.0%) | 150 (100.0%) |
| 5 to 9 Unit Apartments | 0 (0.0%) | 0 (0.0%) |
| 10 or more Apartments | 0 (0.0%) | 51 (100.0%) |
| Mobile Home / Other | 141 (58.5%) | 100 (41.5%) |
| Total | 1,157 (63.2%) | 675 (36.8%) |
Housing Structures by Number of Rooms in Geneva
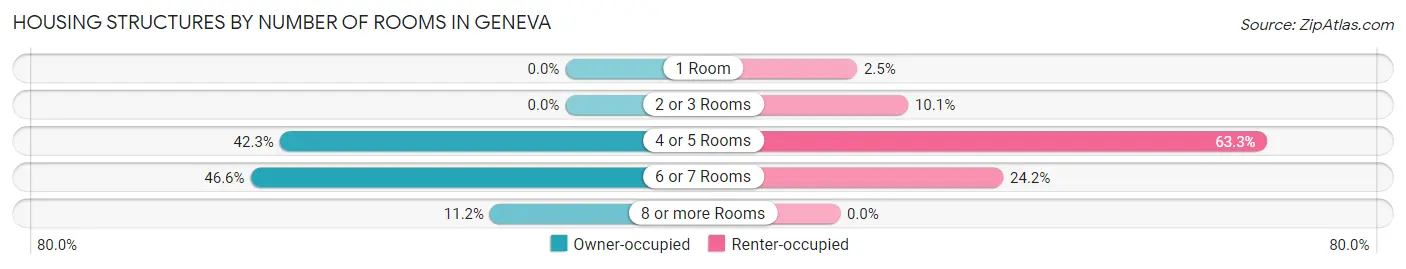
| Number of Rooms | Owner-occupied | Renter-occupied |
| 1 Room | 0 (0.0%) | 17 (2.5%) |
| 2 or 3 Rooms | 0 (0.0%) | 68 (10.1%) |
| 4 or 5 Rooms | 489 (42.3%) | 427 (63.3%) |
| 6 or 7 Rooms | 539 (46.6%) | 163 (24.1%) |
| 8 or more Rooms | 129 (11.2%) | 0 (0.0%) |
| Total | 1,157 (100.0%) | 675 (100.0%) |
Housing Structure by Heating Type in Geneva
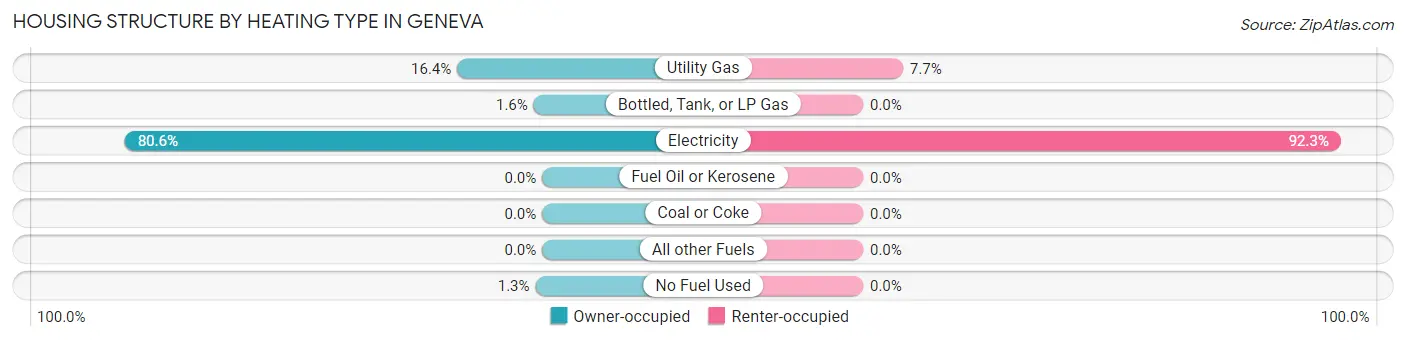
| Heating Type | Owner-occupied | Renter-occupied |
| Utility Gas | 190 (16.4%) | 52 (7.7%) |
| Bottled, Tank, or LP Gas | 19 (1.6%) | 0 (0.0%) |
| Electricity | 933 (80.6%) | 623 (92.3%) |
| Fuel Oil or Kerosene | 0 (0.0%) | 0 (0.0%) |
| Coal or Coke | 0 (0.0%) | 0 (0.0%) |
| All other Fuels | 0 (0.0%) | 0 (0.0%) |
| No Fuel Used | 15 (1.3%) | 0 (0.0%) |
| Total | 1,157 (100.0%) | 675 (100.0%) |
Household Vehicle Usage in Geneva
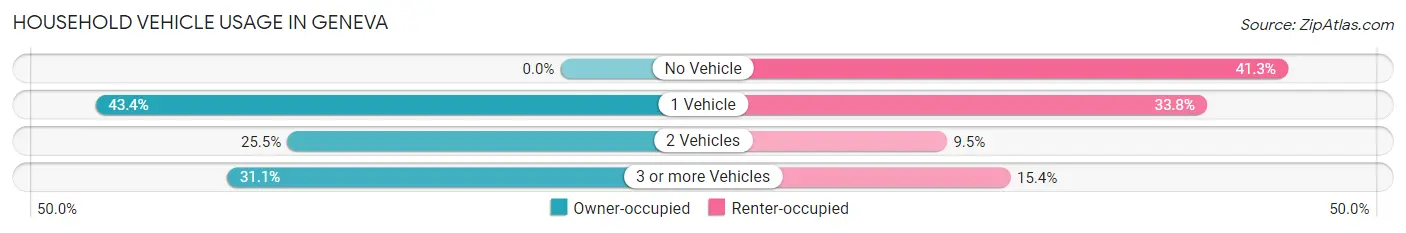
| Vehicles per Household | Owner-occupied | Renter-occupied |
| No Vehicle | 0 (0.0%) | 279 (41.3%) |
| 1 Vehicle | 502 (43.4%) | 228 (33.8%) |
| 2 Vehicles | 295 (25.5%) | 64 (9.5%) |
| 3 or more Vehicles | 360 (31.1%) | 104 (15.4%) |
| Total | 1,157 (100.0%) | 675 (100.0%) |
Real Estate & Mortgages in Geneva
Real Estate and Mortgage Overview in Geneva
| Characteristic | Without Mortgage | With Mortgage |
| Housing Units | 691 | 466 |
| Median Property Value | $63,500 | $146,800 |
| Median Household Income | $48,750 | $35 |
| Monthly Housing Costs | $369 | $0 |
| Real Estate Taxes | $282 | $78 |
Property Value by Mortgage Status in Geneva
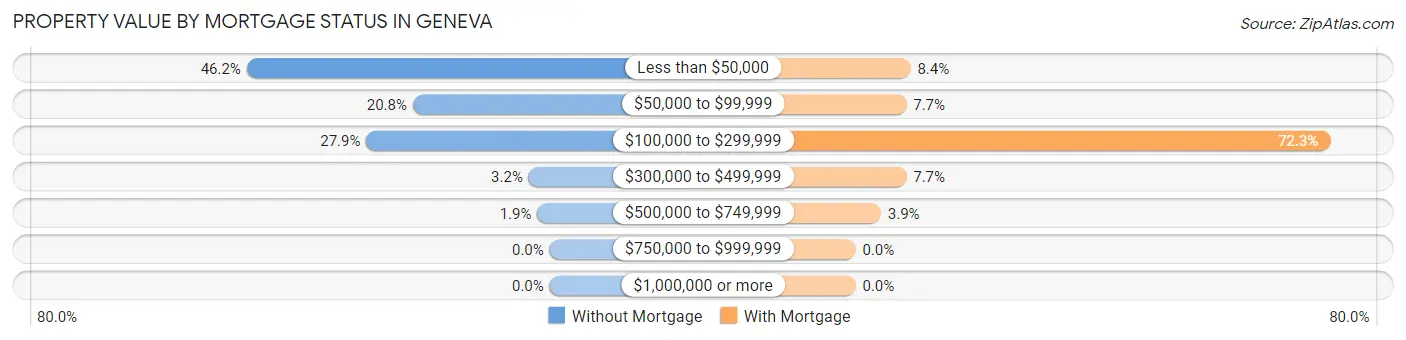
| Property Value | Without Mortgage | With Mortgage |
| Less than $50,000 | 319 (46.2%) | 39 (8.4%) |
| $50,000 to $99,999 | 144 (20.8%) | 36 (7.7%) |
| $100,000 to $299,999 | 193 (27.9%) | 337 (72.3%) |
| $300,000 to $499,999 | 22 (3.2%) | 36 (7.7%) |
| $500,000 to $749,999 | 13 (1.9%) | 18 (3.9%) |
| $750,000 to $999,999 | 0 (0.0%) | 0 (0.0%) |
| $1,000,000 or more | 0 (0.0%) | 0 (0.0%) |
| Total | 691 (100.0%) | 466 (100.0%) |
Household Income by Mortgage Status in Geneva
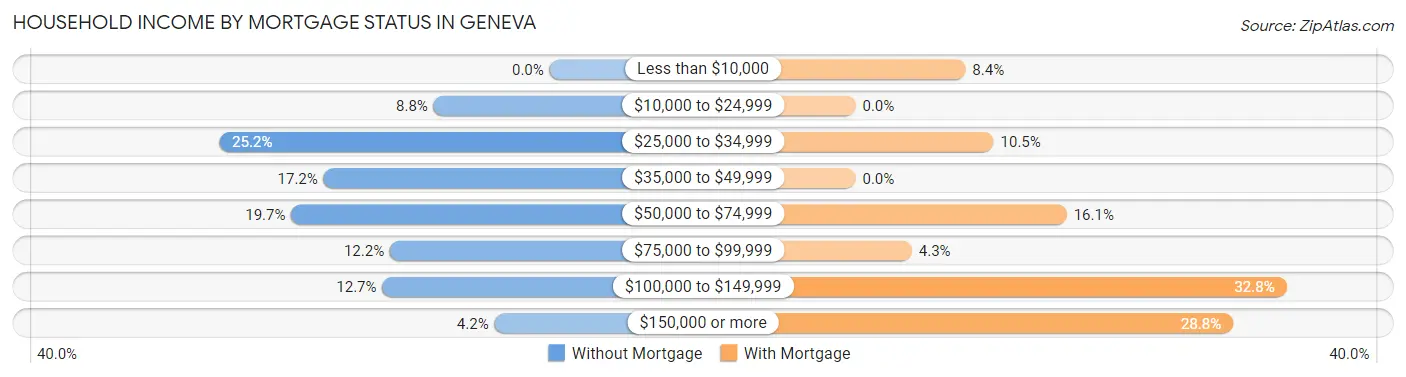
| Household Income | Without Mortgage | With Mortgage |
| Less than $10,000 | 0 (0.0%) | 39 (8.4%) |
| $10,000 to $24,999 | 61 (8.8%) | 0 (0.0%) |
| $25,000 to $34,999 | 174 (25.2%) | 49 (10.5%) |
| $35,000 to $49,999 | 119 (17.2%) | 0 (0.0%) |
| $50,000 to $74,999 | 136 (19.7%) | 75 (16.1%) |
| $75,000 to $99,999 | 84 (12.2%) | 20 (4.3%) |
| $100,000 to $149,999 | 88 (12.7%) | 153 (32.8%) |
| $150,000 or more | 29 (4.2%) | 134 (28.8%) |
| Total | 691 (100.0%) | 466 (100.0%) |
Property Value to Household Income Ratio in Geneva
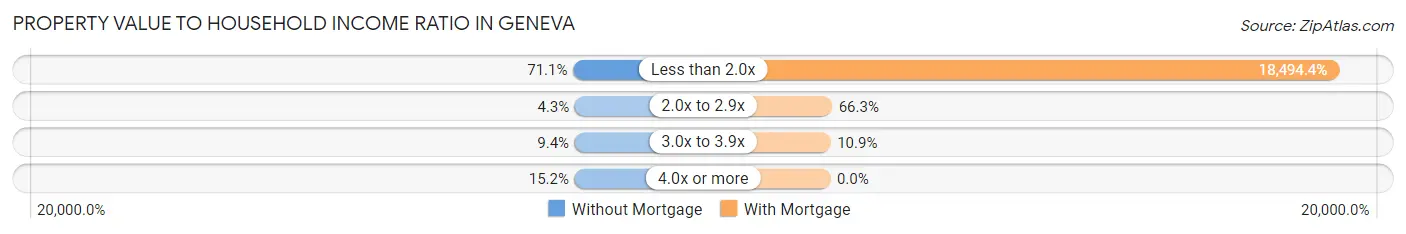
| Value-to-Income Ratio | Without Mortgage | With Mortgage |
| Less than 2.0x | 491 (71.1%) | 86,184 (18,494.4%) |
| 2.0x to 2.9x | 30 (4.3%) | 309 (66.3%) |
| 3.0x to 3.9x | 65 (9.4%) | 51 (10.9%) |
| 4.0x or more | 105 (15.2%) | 0 (0.0%) |
| Total | 691 (100.0%) | 466 (100.0%) |
Real Estate Taxes by Mortgage Status in Geneva
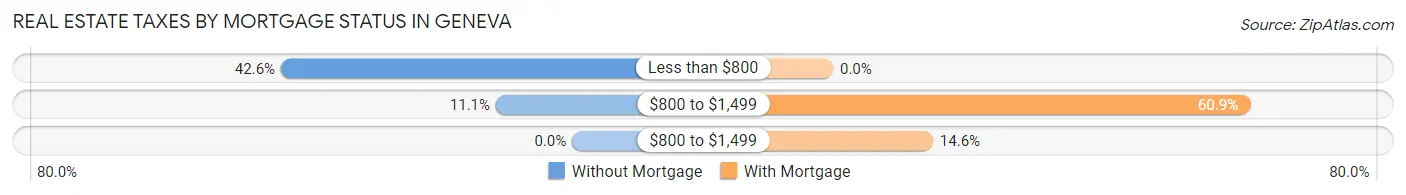
| Property Taxes | Without Mortgage | With Mortgage |
| Less than $800 | 294 (42.5%) | 0 (0.0%) |
| $800 to $1,499 | 77 (11.1%) | 284 (60.9%) |
| $800 to $1,499 | 0 (0.0%) | 68 (14.6%) |
| Total | 691 (100.0%) | 466 (100.0%) |
Health & Disability in Geneva
Health Insurance Coverage by Age in Geneva
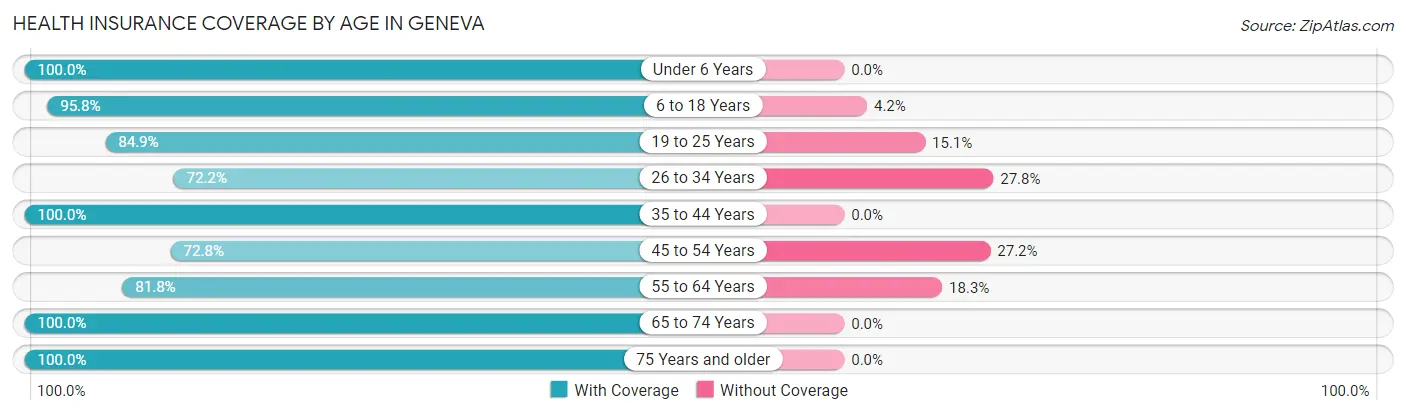
| Age Bracket | With Coverage | Without Coverage |
| Under 6 Years | 165 (100.0%) | 0 (0.0%) |
| 6 to 18 Years | 587 (95.8%) | 26 (4.2%) |
| 19 to 25 Years | 186 (84.9%) | 33 (15.1%) |
| 26 to 34 Years | 278 (72.2%) | 107 (27.8%) |
| 35 to 44 Years | 346 (100.0%) | 0 (0.0%) |
| 45 to 54 Years | 585 (72.8%) | 219 (27.2%) |
| 55 to 64 Years | 551 (81.8%) | 123 (18.2%) |
| 65 to 74 Years | 416 (100.0%) | 0 (0.0%) |
| 75 Years and older | 453 (100.0%) | 0 (0.0%) |
| Total | 3,567 (87.5%) | 508 (12.5%) |
Health Insurance Coverage by Citizenship Status in Geneva
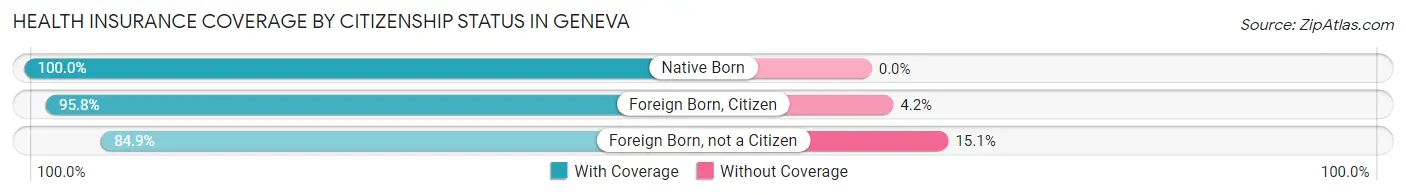
| Citizenship Status | With Coverage | Without Coverage |
| Native Born | 165 (100.0%) | 0 (0.0%) |
| Foreign Born, Citizen | 587 (95.8%) | 26 (4.2%) |
| Foreign Born, not a Citizen | 186 (84.9%) | 33 (15.1%) |
Health Insurance Coverage by Household Income in Geneva
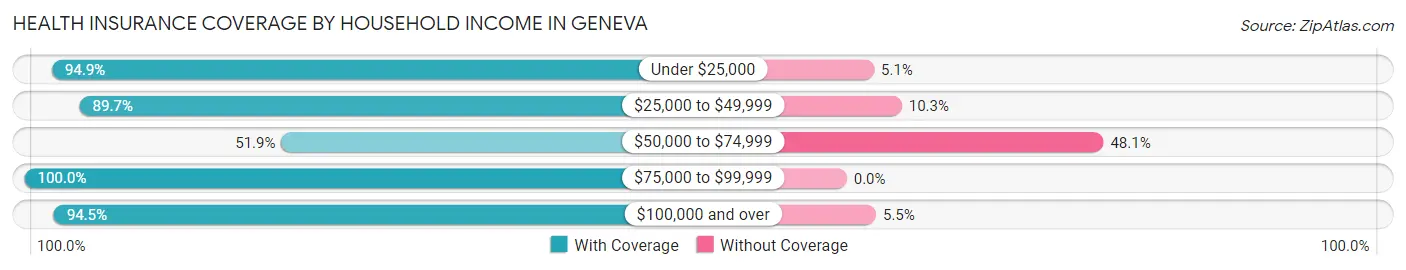
| Household Income | With Coverage | Without Coverage |
| Under $25,000 | 760 (94.9%) | 41 (5.1%) |
| $25,000 to $49,999 | 861 (89.7%) | 99 (10.3%) |
| $50,000 to $74,999 | 339 (51.9%) | 314 (48.1%) |
| $75,000 to $99,999 | 675 (100.0%) | 0 (0.0%) |
| $100,000 and over | 932 (94.5%) | 54 (5.5%) |
Public vs Private Health Insurance Coverage by Age in Geneva
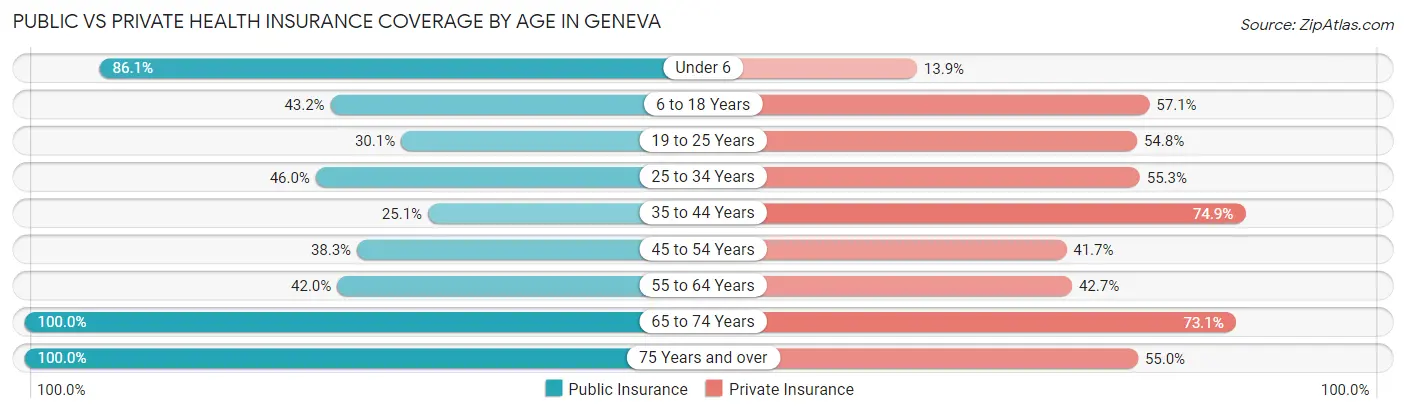
| Age Bracket | Public Insurance | Private Insurance |
| Under 6 | 142 (86.1%) | 23 (13.9%) |
| 6 to 18 Years | 265 (43.2%) | 350 (57.1%) |
| 19 to 25 Years | 66 (30.1%) | 120 (54.8%) |
| 25 to 34 Years | 177 (46.0%) | 213 (55.3%) |
| 35 to 44 Years | 87 (25.1%) | 259 (74.9%) |
| 45 to 54 Years | 308 (38.3%) | 335 (41.7%) |
| 55 to 64 Years | 283 (42.0%) | 288 (42.7%) |
| 65 to 74 Years | 416 (100.0%) | 304 (73.1%) |
| 75 Years and over | 453 (100.0%) | 249 (55.0%) |
| Total | 2,197 (53.9%) | 2,141 (52.5%) |
Disability Status by Sex by Age in Geneva
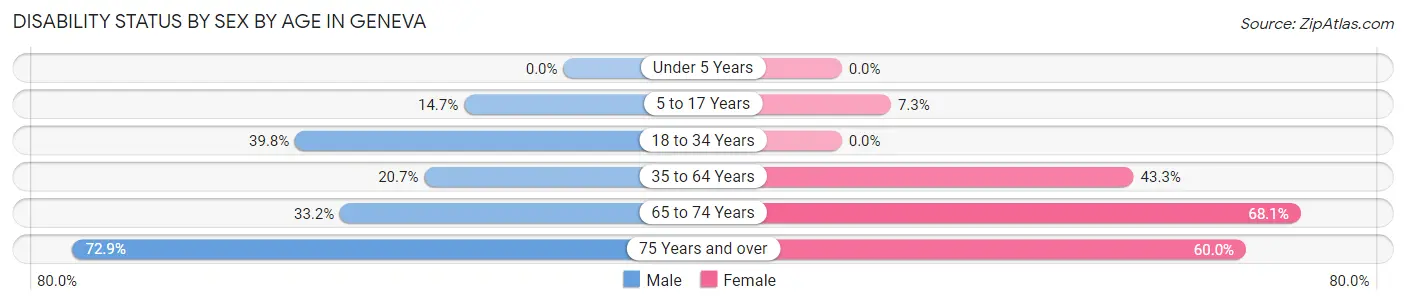
| Age Bracket | Male | Female |
| Under 5 Years | 0 (0.0%) | 0 (0.0%) |
| 5 to 17 Years | 28 (14.7%) | 29 (7.3%) |
| 18 to 34 Years | 141 (39.8%) | 0 (0.0%) |
| 35 to 64 Years | 189 (20.7%) | 394 (43.3%) |
| 65 to 74 Years | 62 (33.2%) | 156 (68.1%) |
| 75 Years and over | 137 (72.9%) | 159 (60.0%) |
Disability Class by Sex by Age in Geneva
Disability Class: Hearing Difficulty
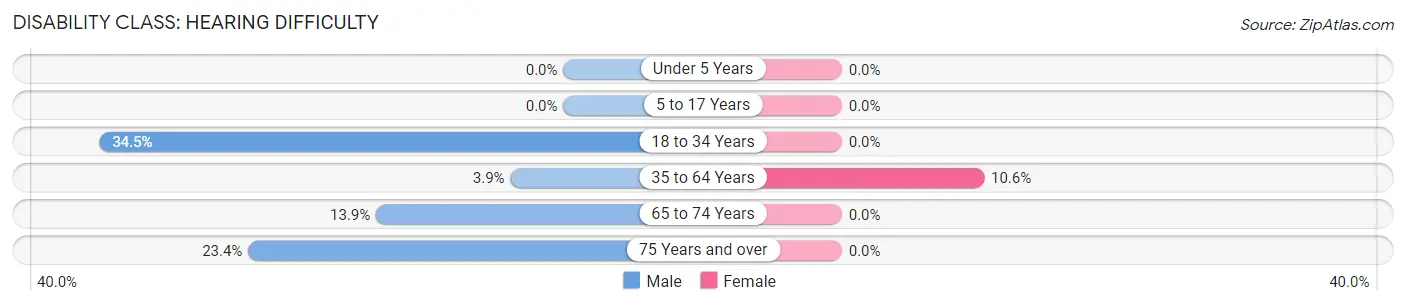
| Age Bracket | Male | Female |
| Under 5 Years | 0 (0.0%) | 0 (0.0%) |
| 5 to 17 Years | 0 (0.0%) | 0 (0.0%) |
| 18 to 34 Years | 122 (34.5%) | 0 (0.0%) |
| 35 to 64 Years | 36 (3.9%) | 96 (10.6%) |
| 65 to 74 Years | 26 (13.9%) | 0 (0.0%) |
| 75 Years and over | 44 (23.4%) | 0 (0.0%) |
Disability Class: Vision Difficulty
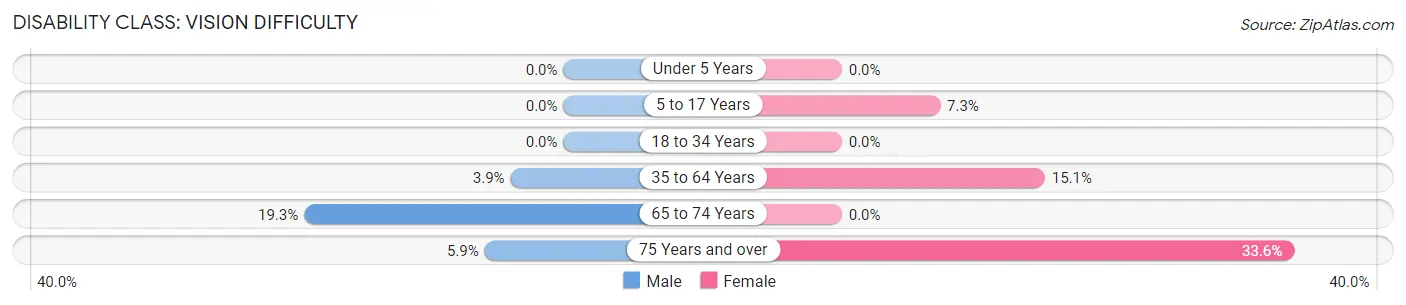
| Age Bracket | Male | Female |
| Under 5 Years | 0 (0.0%) | 0 (0.0%) |
| 5 to 17 Years | 0 (0.0%) | 29 (7.3%) |
| 18 to 34 Years | 0 (0.0%) | 0 (0.0%) |
| 35 to 64 Years | 36 (3.9%) | 137 (15.1%) |
| 65 to 74 Years | 36 (19.3%) | 0 (0.0%) |
| 75 Years and over | 11 (5.9%) | 89 (33.6%) |
Disability Class: Cognitive Difficulty
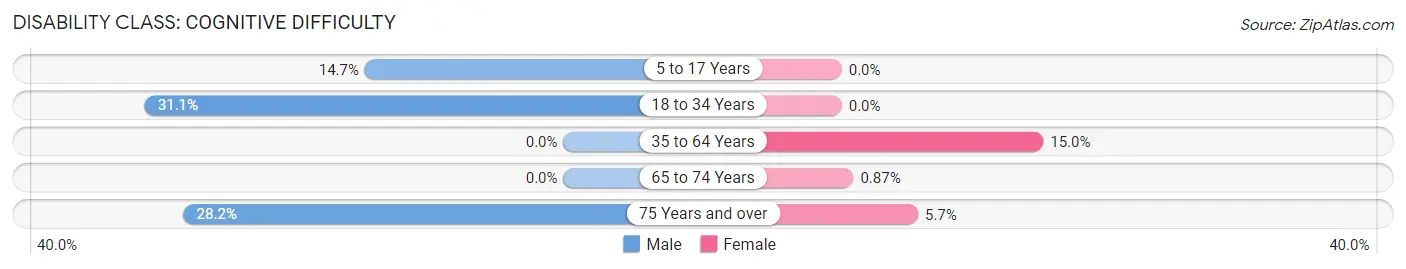
| Age Bracket | Male | Female |
| 5 to 17 Years | 28 (14.7%) | 0 (0.0%) |
| 18 to 34 Years | 110 (31.1%) | 0 (0.0%) |
| 35 to 64 Years | 0 (0.0%) | 136 (15.0%) |
| 65 to 74 Years | 0 (0.0%) | 2 (0.9%) |
| 75 Years and over | 53 (28.2%) | 15 (5.7%) |
Disability Class: Ambulatory Difficulty
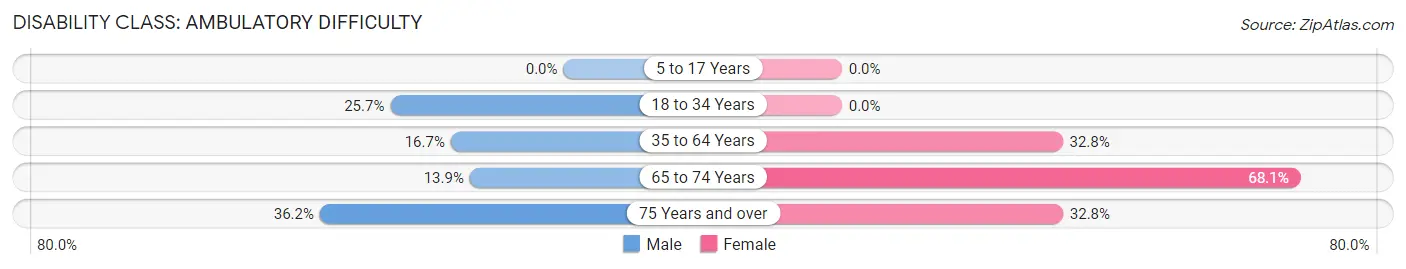
| Age Bracket | Male | Female |
| 5 to 17 Years | 0 (0.0%) | 0 (0.0%) |
| 18 to 34 Years | 91 (25.7%) | 0 (0.0%) |
| 35 to 64 Years | 153 (16.7%) | 298 (32.8%) |
| 65 to 74 Years | 26 (13.9%) | 156 (68.1%) |
| 75 Years and over | 68 (36.2%) | 87 (32.8%) |
Disability Class: Self-Care Difficulty
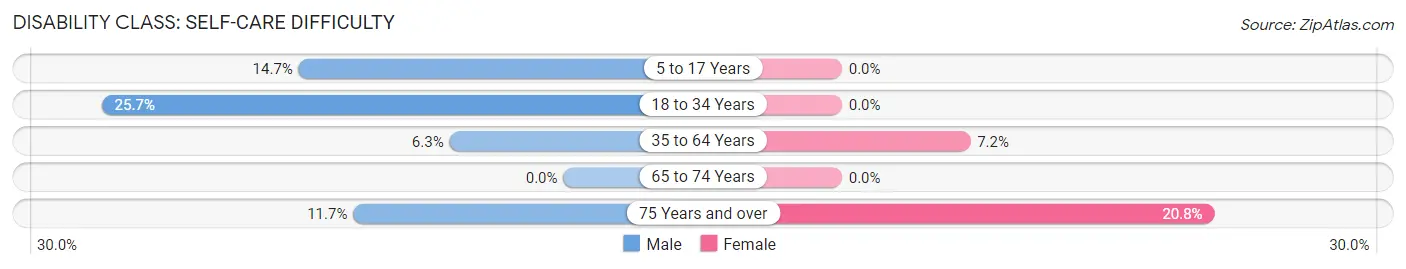
| Age Bracket | Male | Female |
| 5 to 17 Years | 28 (14.7%) | 0 (0.0%) |
| 18 to 34 Years | 91 (25.7%) | 0 (0.0%) |
| 35 to 64 Years | 58 (6.3%) | 65 (7.1%) |
| 65 to 74 Years | 0 (0.0%) | 0 (0.0%) |
| 75 Years and over | 22 (11.7%) | 55 (20.7%) |
Technology Access in Geneva
Computing Device Access in Geneva
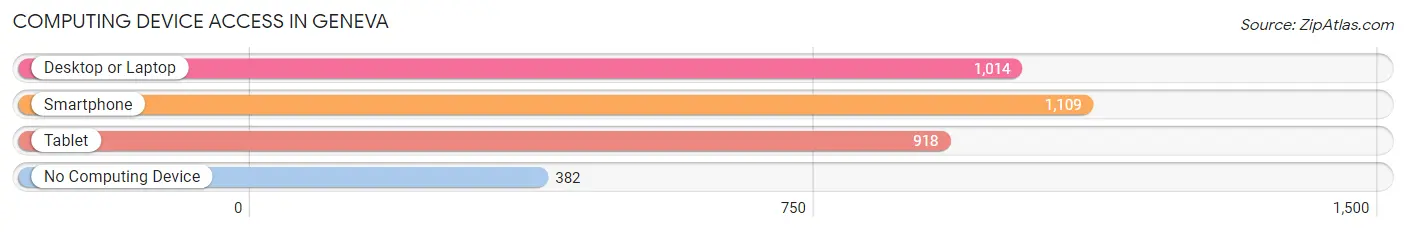
| Device Type | # Households | % Households |
| Desktop or Laptop | 1,014 | 55.3% |
| Smartphone | 1,109 | 60.5% |
| Tablet | 918 | 50.1% |
| No Computing Device | 382 | 20.8% |
| Total | 1,832 | 100.0% |
Internet Access in Geneva
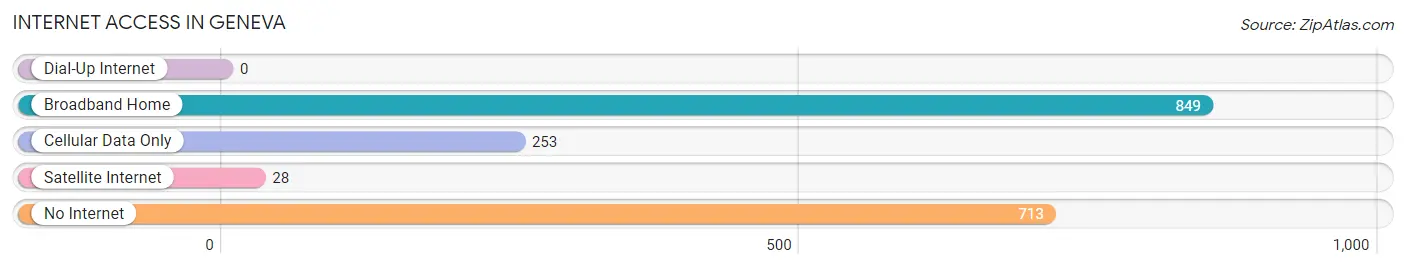
| Internet Type | # Households | % Households |
| Dial-Up Internet | 0 | 0.0% |
| Broadband Home | 849 | 46.3% |
| Cellular Data Only | 253 | 13.8% |
| Satellite Internet | 28 | 1.5% |
| No Internet | 713 | 38.9% |
| Total | 1,832 | 100.0% |
Geneva Summary
Geneva, Alabama is a small city located in the southeastern corner of the state, in the heart of the Wiregrass region. It is the county seat of Geneva County and is part of the Dothan Metropolitan Statistical Area. The city has a population of approximately 3,000 people and is known for its rural charm and friendly atmosphere.
History
Geneva was founded in 1836 and named after Geneva, Switzerland. The city was originally part of the Creek Indian Nation and was part of the original land cession of 1832. The city was incorporated in 1843 and was the first county seat of Geneva County. During the Civil War, the city was the site of a major battle between Union and Confederate forces. The Battle of Geneva was fought on April 5, 1865 and resulted in a Confederate victory.
Geography
Geneva is located in the southeastern corner of Alabama, in the heart of the Wiregrass region. The city is situated on the banks of the Choctawhatchee River and is surrounded by rolling hills and pine forests. The city has a total area of 8.2 square miles, all of which is land. The climate is humid subtropical, with hot, humid summers and mild winters.
Economy
Geneva’s economy is largely based on agriculture and manufacturing. The city is home to several large poultry processing plants, as well as a number of smaller businesses. The city is also home to a number of retail stores, restaurants, and other businesses. The city is also home to a number of government offices, including the Geneva County Courthouse.
Demographics
As of the 2010 census, Geneva had a population of 3,000 people. The racial makeup of the city was 73.3% White, 24.2% African American, 0.3% Native American, 0.7% Asian, 0.1% Pacific Islander, and 1.4% from two or more races. The median household income was $30,938 and the median family income was $37,813. The per capita income was $15,945.
Geneva is a small city with a rich history and a friendly atmosphere. The city is home to a diverse population and a strong economy based on agriculture and manufacturing. The city is also home to a number of government offices and businesses, making it a great place to live and work.
Common Questions
What is Per Capita Income in Geneva?
Per Capita income in Geneva is $26,439.
What is the Median Family Income in Geneva?
Median Family Income in Geneva is $54,333.
What is the Median Household income in Geneva?
Median Household Income in Geneva is $44,756.
What is Income or Wage Gap in Geneva?
Income or Wage Gap in Geneva is 49.7%.
Women in Geneva earn 50.3 cents for every dollar earned by a man.
What is Inequality or Gini Index in Geneva?
Inequality or Gini Index in Geneva is 0.46.
What is the Total Population of Geneva?
Total Population of Geneva is 4,235.
What is the Total Male Population of Geneva?
Total Male Population of Geneva is 1,957.
What is the Total Female Population of Geneva?
Total Female Population of Geneva is 2,278.
What is the Ratio of Males per 100 Females in Geneva?
There are 85.91 Males per 100 Females in Geneva.
What is the Ratio of Females per 100 Males in Geneva?
There are 116.40 Females per 100 Males in Geneva.
What is the Median Population Age in Geneva?
Median Population Age in Geneva is 50.2 Years.
What is the Average Family Size in Geneva
Average Family Size in Geneva is 2.7 People.
What is the Average Household Size in Geneva
Average Household Size in Geneva is 2.2 People.
How Large is the Labor Force in Geneva?
There are 1,749 People in the Labor Forcein in Geneva.
What is the Percentage of People in the Labor Force in Geneva?
48.6% of People are in the Labor Force in Geneva.
What is the Unemployment Rate in Geneva?
Unemployment Rate in Geneva is 8.4%.