Geiger, AL Map & Demographics
Geiger Map
Geiger Overview
$17,642
PER CAPITA INCOME
$44,375
AVG FAMILY INCOME
$40,000
AVG HOUSEHOLD INCOME
55.8%
WAGE / INCOME GAP [ % ]
44.2¢/ $1
WAGE / INCOME GAP [ $ ]
0.28
INEQUALITY / GINI INDEX
286
TOTAL POPULATION
122
MALE POPULATION
164
FEMALE POPULATION
74.39
MALES / 100 FEMALES
134.43
FEMALES / 100 MALES
51.7
MEDIAN AGE
3.0
AVG FAMILY SIZE
2.6
AVG HOUSEHOLD SIZE
119
LABOR FORCE [ PEOPLE ]
45.8%
PERCENT IN LABOR FORCE
14.7%
UNEMPLOYMENT RATE
Income in Geiger
Income Overview in Geiger
Per Capita Income in Geiger is $17,642, while median incomes of families and households are $44,375 and $40,000 respectively.
| Characteristic | Number | Measure |
| Per Capita Income | 286 | $17,642 |
| Median Family Income | 87 | $44,375 |
| Mean Family Income | 87 | $48,680 |
| Median Household Income | 108 | $40,000 |
| Mean Household Income | 108 | $45,440 |
| Income Deficit | 87 | $0 |
| Wage / Income Gap (%) | 286 | 55.80% |
| Wage / Income Gap ($) | 286 | 44.20¢ per $1 |
| Gini / Inequality Index | 286 | 0.28 |
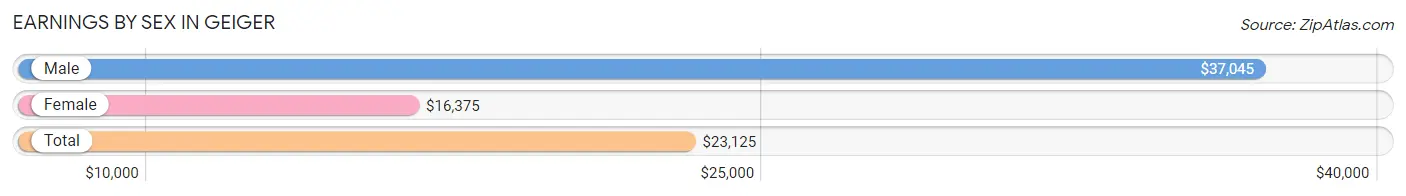
Earnings by Sex in Geiger
Average Earnings in Geiger are $23,125, $37,045 for men and $16,375 for women, a difference of 55.8%.
| Sex | Number | Average Earnings |
| Male | 40 (34.5%) | $37,045 |
| Female | 76 (65.5%) | $16,375 |
| Total | 116 (100.0%) | $23,125 |
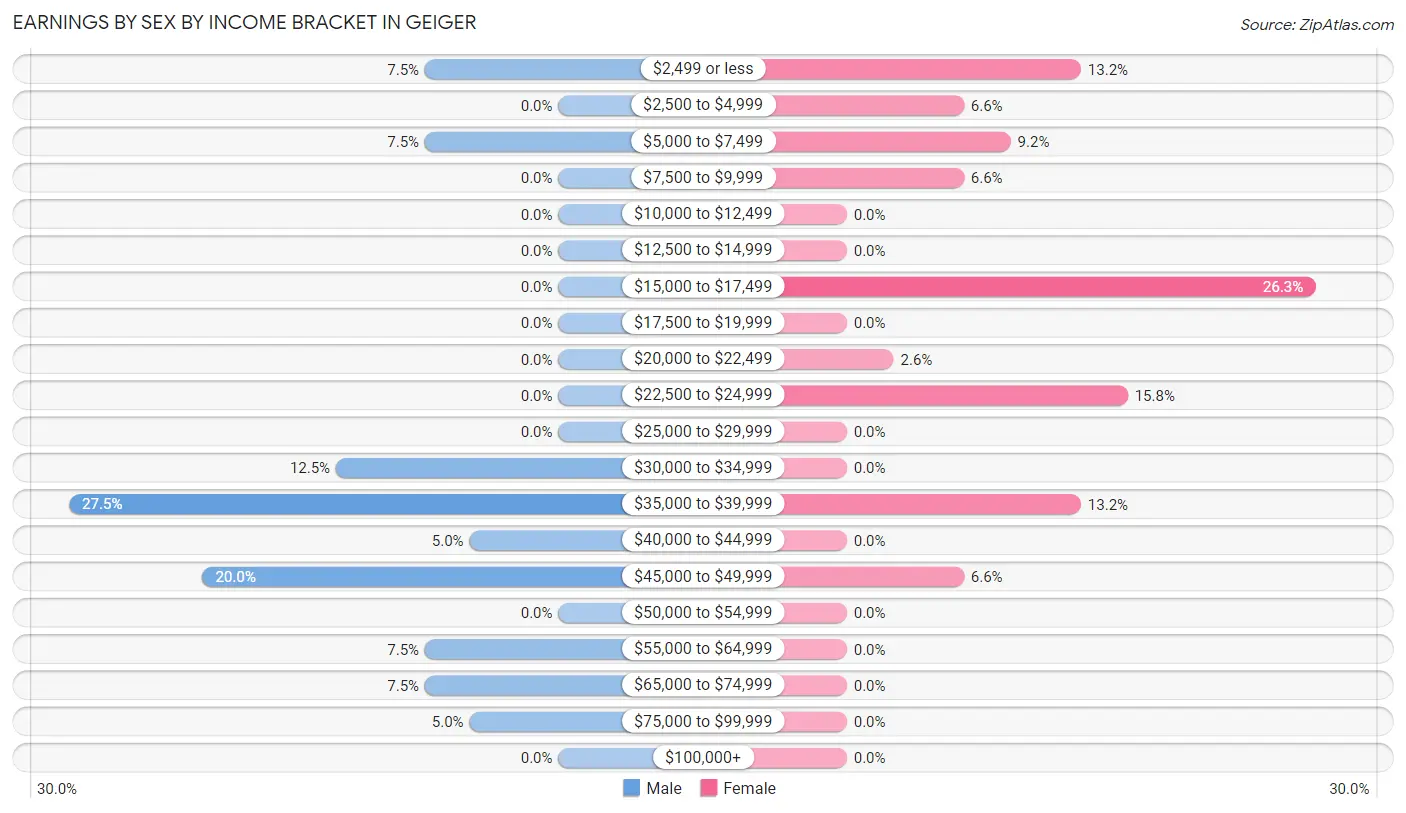
Earnings by Sex by Income Bracket in Geiger
The most common earnings brackets in Geiger are $35,000 to $39,999 for men (11 | 27.5%) and $15,000 to $17,499 for women (20 | 26.3%).
| Income | Male | Female |
| $2,499 or less | 3 (7.5%) | 10 (13.2%) |
| $2,500 to $4,999 | 0 (0.0%) | 5 (6.6%) |
| $5,000 to $7,499 | 3 (7.5%) | 7 (9.2%) |
| $7,500 to $9,999 | 0 (0.0%) | 5 (6.6%) |
| $10,000 to $12,499 | 0 (0.0%) | 0 (0.0%) |
| $12,500 to $14,999 | 0 (0.0%) | 0 (0.0%) |
| $15,000 to $17,499 | 0 (0.0%) | 20 (26.3%) |
| $17,500 to $19,999 | 0 (0.0%) | 0 (0.0%) |
| $20,000 to $22,499 | 0 (0.0%) | 2 (2.6%) |
| $22,500 to $24,999 | 0 (0.0%) | 12 (15.8%) |
| $25,000 to $29,999 | 0 (0.0%) | 0 (0.0%) |
| $30,000 to $34,999 | 5 (12.5%) | 0 (0.0%) |
| $35,000 to $39,999 | 11 (27.5%) | 10 (13.2%) |
| $40,000 to $44,999 | 2 (5.0%) | 0 (0.0%) |
| $45,000 to $49,999 | 8 (20.0%) | 5 (6.6%) |
| $50,000 to $54,999 | 0 (0.0%) | 0 (0.0%) |
| $55,000 to $64,999 | 3 (7.5%) | 0 (0.0%) |
| $65,000 to $74,999 | 3 (7.5%) | 0 (0.0%) |
| $75,000 to $99,999 | 2 (5.0%) | 0 (0.0%) |
| $100,000+ | 0 (0.0%) | 0 (0.0%) |
| Total | 40 (100.0%) | 76 (100.0%) |
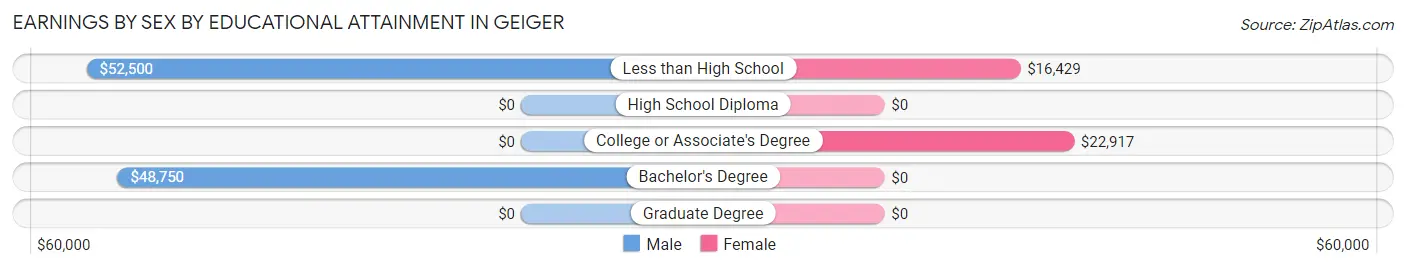
Earnings by Sex by Educational Attainment in Geiger
Average earnings in Geiger are $47,656 for men and $17,063 for women, a difference of 64.2%. Men with an educational attainment of less than high school enjoy the highest average annual earnings of $52,500, while those with bachelor's degree education earn the least with $48,750. Women with an educational attainment of college or associate's degree earn the most with the average annual earnings of $22,917, while those with less than high school education have the smallest earnings of $16,429.
| Educational Attainment | Male Income | Female Income |
| Less than High School | $52,500 | $16,429 |
| High School Diploma | - | - |
| College or Associate's Degree | - | - |
| Bachelor's Degree | $48,750 | $0 |
| Graduate Degree | - | - |
| Total | $47,656 | $17,063 |
Family Income in Geiger
Family Income Brackets in Geiger
According to the Geiger family income data, there are 31 families falling into the $25,000 to $34,999 income range, which is the most common income bracket and makes up 35.6% of all families.
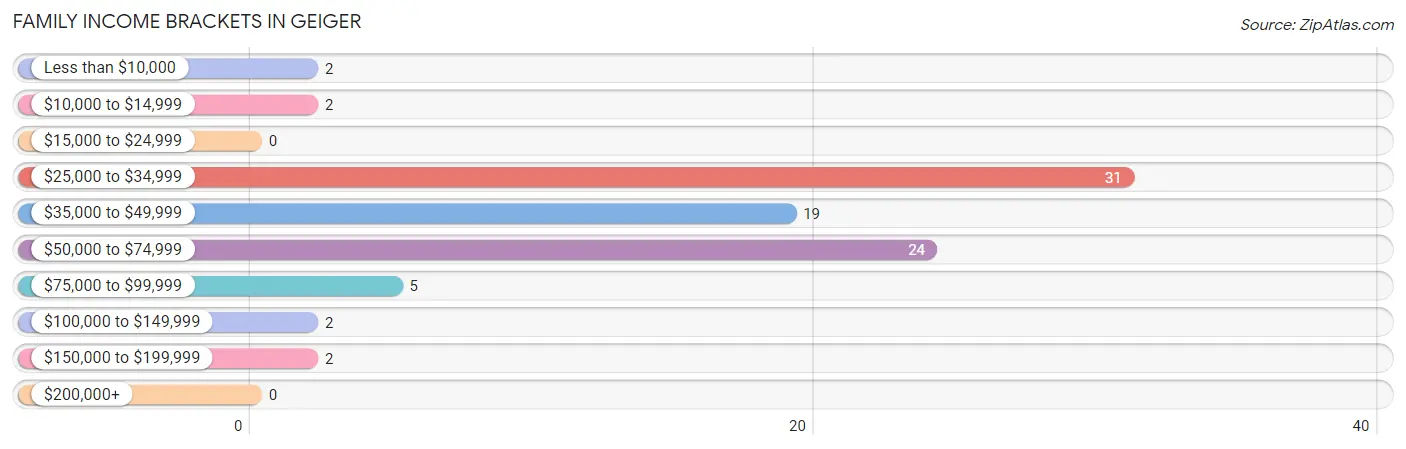
| Income Bracket | # Families | % Families |
| Less than $10,000 | 2 | 2.3% |
| $10,000 to $14,999 | 2 | 2.3% |
| $15,000 to $24,999 | 0 | 0.0% |
| $25,000 to $34,999 | 31 | 35.6% |
| $35,000 to $49,999 | 19 | 21.8% |
| $50,000 to $74,999 | 24 | 27.6% |
| $75,000 to $99,999 | 5 | 5.7% |
| $100,000 to $149,999 | 2 | 2.3% |
| $150,000 to $199,999 | 2 | 2.3% |
| $200,000+ | 0 | 0.0% |
Family Income by Famaliy Size in Geiger
3-person families (12 | 13.8%) account for the highest median family income in Geiger with $48,750 per family, while 2-person families (57 | 65.5%) have the highest median income of $20,156 per family member.
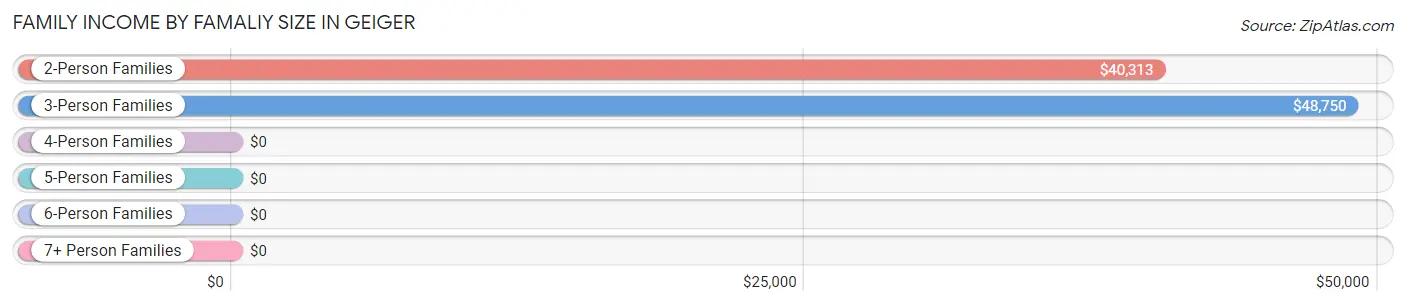
| Income Bracket | # Families | Median Income |
| 2-Person Families | 57 (65.5%) | $40,313 |
| 3-Person Families | 12 (13.8%) | $48,750 |
| 4-Person Families | 15 (17.2%) | $0 |
| 5-Person Families | 3 (3.5%) | $0 |
| 6-Person Families | 0 (0.0%) | $0 |
| 7+ Person Families | 0 (0.0%) | $0 |
| Total | 87 (100.0%) | $44,375 |
Family Income by Number of Earners in Geiger
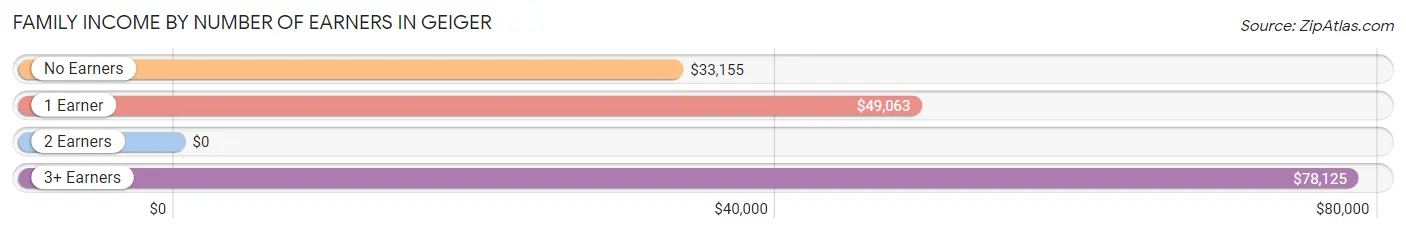
| Number of Earners | # Families | Median Income |
| No Earners | 35 (40.2%) | $33,155 |
| 1 Earner | 28 (32.2%) | $49,063 |
| 2 Earners | 15 (17.2%) | $0 |
| 3+ Earners | 9 (10.3%) | $78,125 |
| Total | 87 (100.0%) | $44,375 |
Household Income in Geiger
Household Income Brackets in Geiger
With 37 households falling in the category, the $50,000 to $74,999 income range is the most frequent in Geiger, accounting for 34.3% of all households.
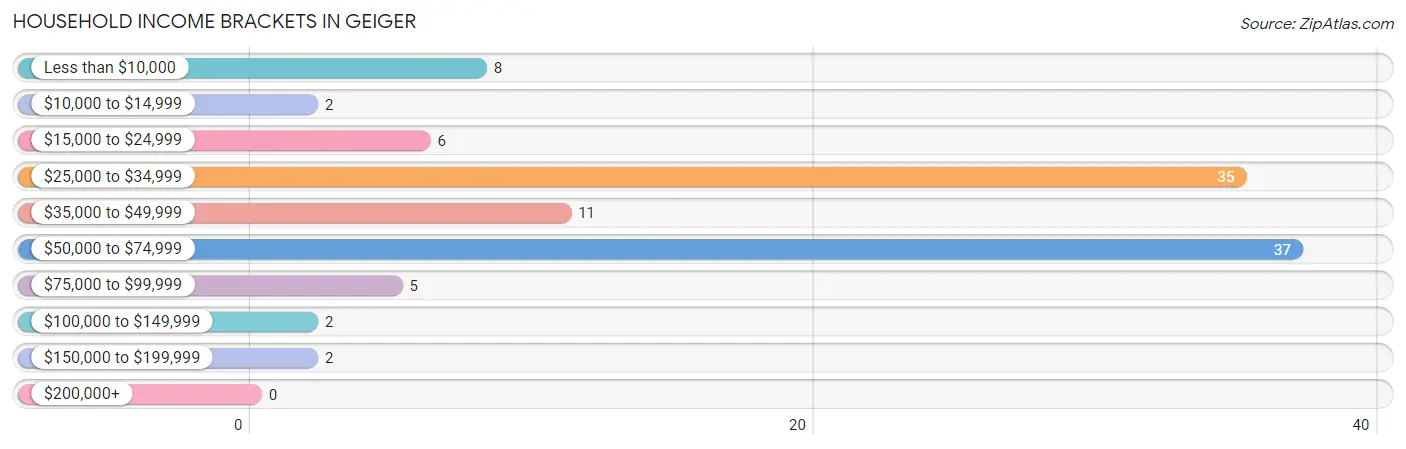
| Income Bracket | # Households | % Households |
| Less than $10,000 | 8 | 7.4% |
| $10,000 to $14,999 | 2 | 1.9% |
| $15,000 to $24,999 | 6 | 5.6% |
| $25,000 to $34,999 | 35 | 32.4% |
| $35,000 to $49,999 | 11 | 10.2% |
| $50,000 to $74,999 | 37 | 34.3% |
| $75,000 to $99,999 | 5 | 4.6% |
| $100,000 to $149,999 | 2 | 1.9% |
| $150,000 to $199,999 | 2 | 1.9% |
| $200,000+ | 0 | 0.0% |
Household Income by Householder Age in Geiger
The median household income in Geiger is $40,000, with the highest median household income of $57,500 found in the 45 to 64 years age bracket for the primary householder. A total of 28 households (25.9%) fall into this category.
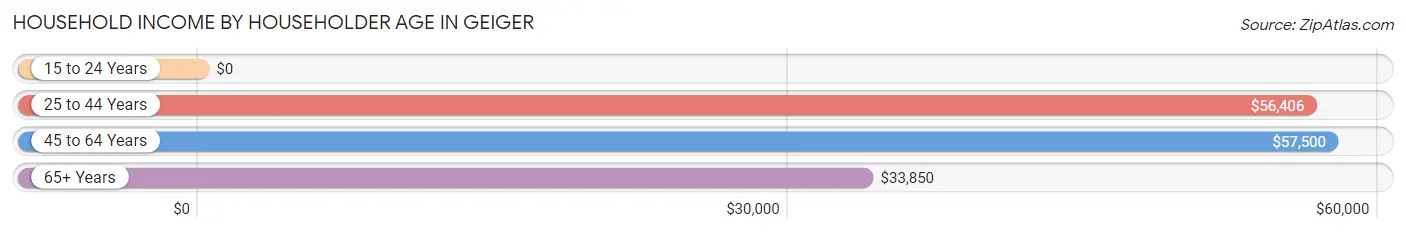
| Income Bracket | # Households | Median Income |
| 15 to 24 Years | 0 (0.0%) | $0 |
| 25 to 44 Years | 13 (12.0%) | $56,406 |
| 45 to 64 Years | 28 (25.9%) | $57,500 |
| 65+ Years | 67 (62.0%) | $33,850 |
| Total | 108 (100.0%) | $40,000 |
Poverty in Geiger
Income Below Poverty by Sex and Age in Geiger
With 3.3% poverty level for males and 15.2% for females among the residents of Geiger, 25 to 34 year old males and 25 to 34 year old females are the most vulnerable to poverty, with 3 males (27.3%) and 5 females (41.7%) in their respective age groups living below the poverty level.
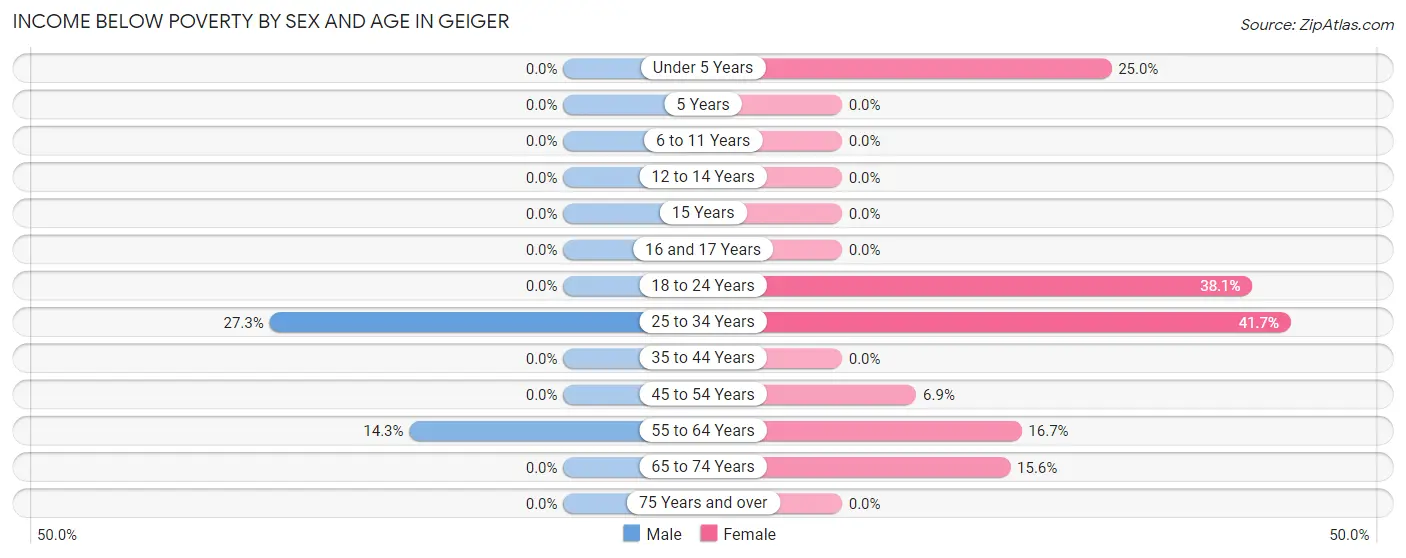
| Age Bracket | Male | Female |
| Under 5 Years | 0 (0.0%) | 3 (25.0%) |
| 5 Years | 0 (0.0%) | 0 (0.0%) |
| 6 to 11 Years | 0 (0.0%) | 0 (0.0%) |
| 12 to 14 Years | 0 (0.0%) | 0 (0.0%) |
| 15 Years | 0 (0.0%) | 0 (0.0%) |
| 16 and 17 Years | 0 (0.0%) | 0 (0.0%) |
| 18 to 24 Years | 0 (0.0%) | 8 (38.1%) |
| 25 to 34 Years | 3 (27.3%) | 5 (41.7%) |
| 35 to 44 Years | 0 (0.0%) | 0 (0.0%) |
| 45 to 54 Years | 0 (0.0%) | 2 (6.9%) |
| 55 to 64 Years | 1 (14.3%) | 2 (16.7%) |
| 65 to 74 Years | 0 (0.0%) | 5 (15.6%) |
| 75 Years and over | 0 (0.0%) | 0 (0.0%) |
| Total | 4 (3.3%) | 25 (15.2%) |
Income Above Poverty by Sex and Age in Geiger
According to the poverty statistics in Geiger, males aged under 5 years and females aged 6 to 11 years are the age groups that are most secure financially, with 100.0% of males and 100.0% of females in these age groups living above the poverty line.
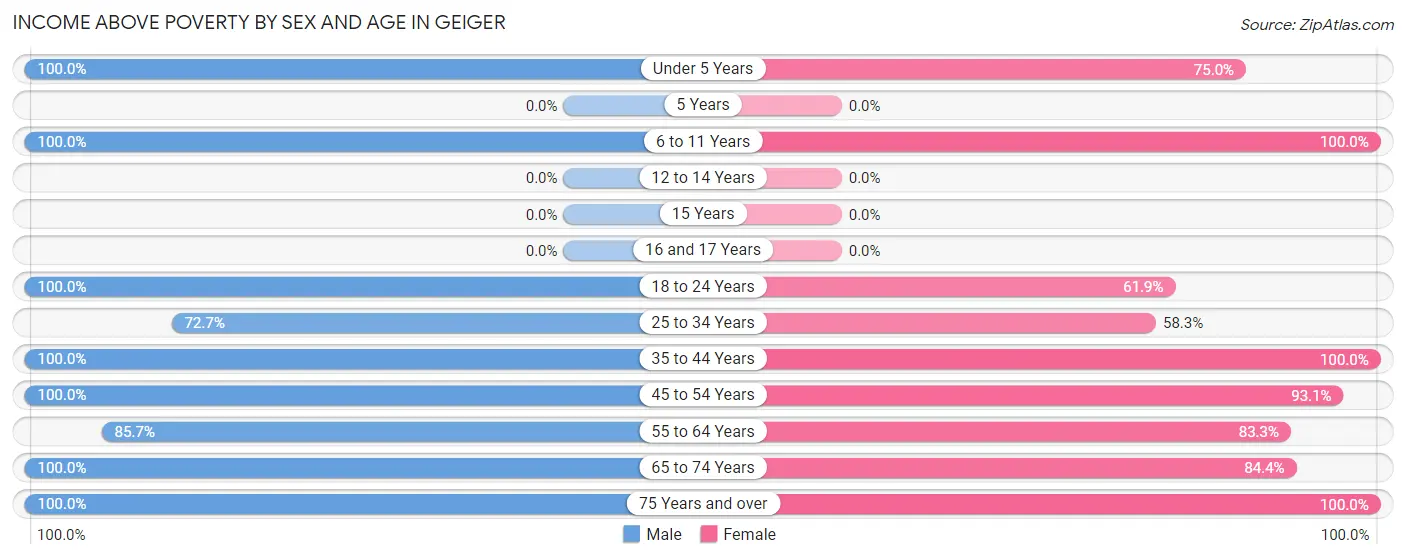
| Age Bracket | Male | Female |
| Under 5 Years | 3 (100.0%) | 9 (75.0%) |
| 5 Years | 0 (0.0%) | 0 (0.0%) |
| 6 to 11 Years | 9 (100.0%) | 2 (100.0%) |
| 12 to 14 Years | 0 (0.0%) | 0 (0.0%) |
| 15 Years | 0 (0.0%) | 0 (0.0%) |
| 16 and 17 Years | 0 (0.0%) | 0 (0.0%) |
| 18 to 24 Years | 43 (100.0%) | 13 (61.9%) |
| 25 to 34 Years | 8 (72.7%) | 7 (58.3%) |
| 35 to 44 Years | 3 (100.0%) | 2 (100.0%) |
| 45 to 54 Years | 3 (100.0%) | 27 (93.1%) |
| 55 to 64 Years | 6 (85.7%) | 10 (83.3%) |
| 65 to 74 Years | 7 (100.0%) | 27 (84.4%) |
| 75 Years and over | 36 (100.0%) | 42 (100.0%) |
| Total | 118 (96.7%) | 139 (84.8%) |
Income Below Poverty Among Married-Couple Families in Geiger
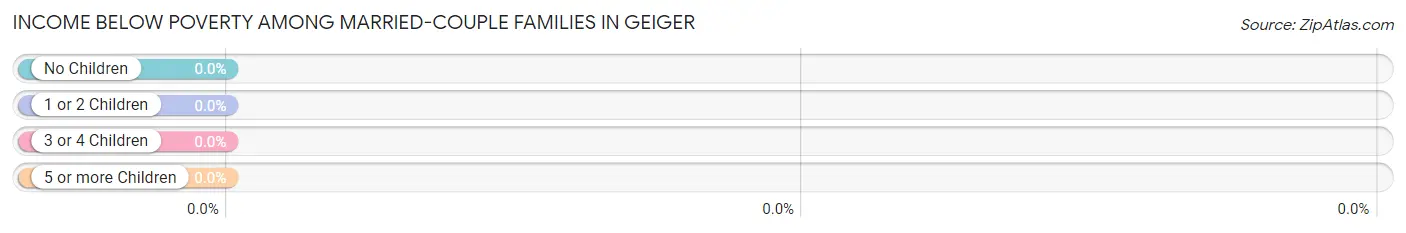
| Children | Above Poverty | Below Poverty |
| No Children | 52 (100.0%) | 0 (0.0%) |
| 1 or 2 Children | 0 (0.0%) | 0 (0.0%) |
| 3 or 4 Children | 3 (100.0%) | 0 (0.0%) |
| 5 or more Children | 0 (0.0%) | 0 (0.0%) |
| Total | 55 (100.0%) | 0 (0.0%) |
Income Below Poverty Among Single-Parent Households in Geiger
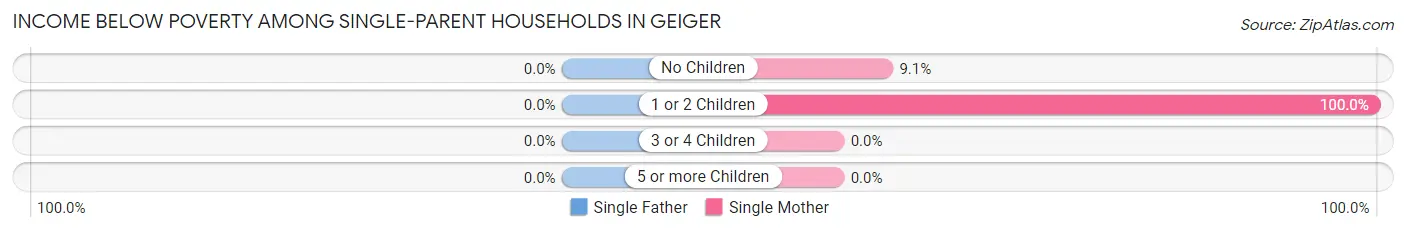
| Children | Single Father | Single Mother |
| No Children | 0 (0.0%) | 2 (9.1%) |
| 1 or 2 Children | 0 (0.0%) | 2 (100.0%) |
| 3 or 4 Children | 0 (0.0%) | 0 (0.0%) |
| 5 or more Children | 0 (0.0%) | 0 (0.0%) |
| Total | 0 (0.0%) | 4 (16.7%) |
Income Below Poverty Among Married-Couple vs Single-Parent Households in Geiger
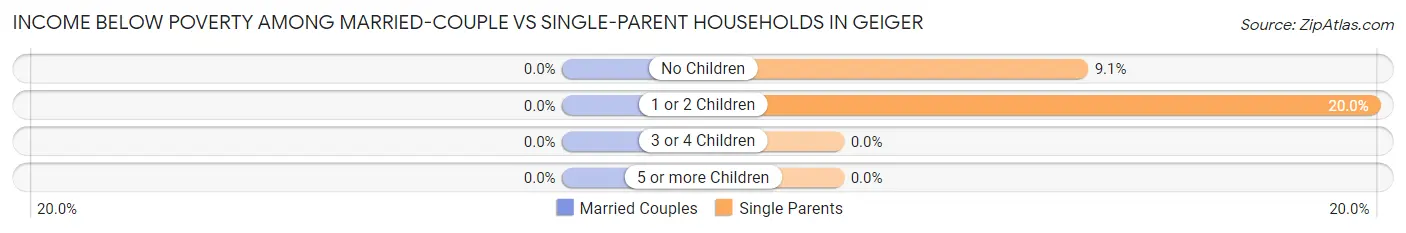
| Children | Married-Couple Families | Single-Parent Households |
| No Children | 0 (0.0%) | 2 (9.1%) |
| 1 or 2 Children | 0 (0.0%) | 2 (20.0%) |
| 3 or 4 Children | 0 (0.0%) | 0 (0.0%) |
| 5 or more Children | 0 (0.0%) | 0 (0.0%) |
| Total | 0 (0.0%) | 4 (12.5%) |
Race in Geiger
The most populous races in Geiger are Black / African American (166 | 58.0%), White / Caucasian (109 | 38.1%), and Hispanic or Latino (28 | 9.8%).
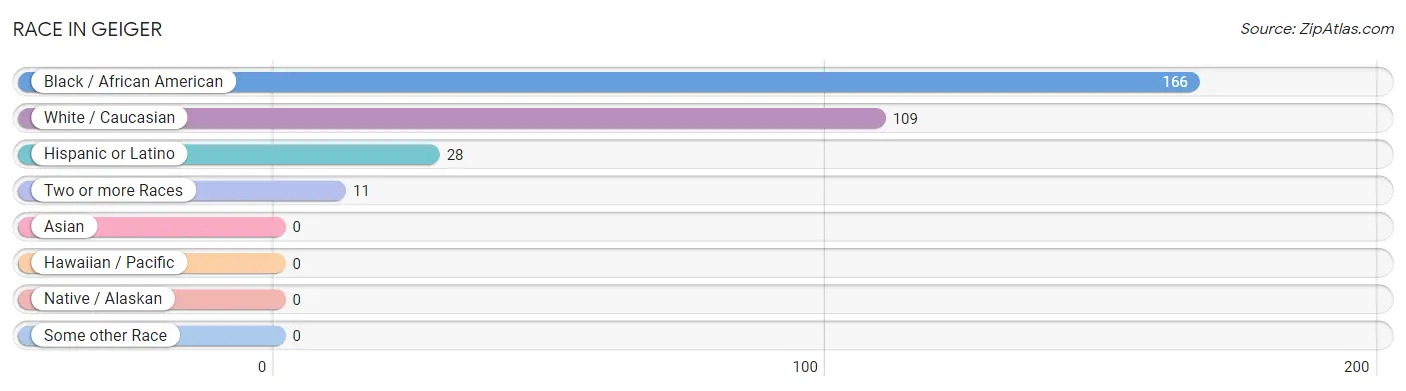
| Race | # Population | % Population |
| Asian | 0 | 0.0% |
| Black / African American | 166 | 58.0% |
| Hawaiian / Pacific | 0 | 0.0% |
| Hispanic or Latino | 28 | 9.8% |
| Native / Alaskan | 0 | 0.0% |
| White / Caucasian | 109 | 38.1% |
| Two or more Races | 11 | 3.8% |
| Some other Race | 0 | 0.0% |
| Total | 286 | 100.0% |
Ancestry in Geiger
The most populous ancestries reported in Geiger are American (45 | 15.7%), Mexican (28 | 9.8%), German (9 | 3.2%), Dutch (5 | 1.8%), and Finnish (4 | 1.4%), together accounting for 31.8% of all Geiger residents.
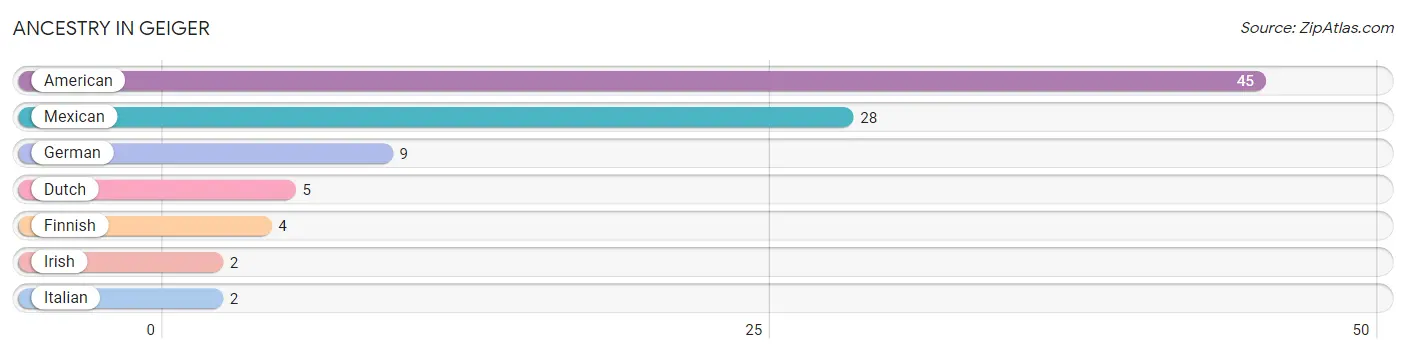
| Ancestry | # Population | % Population |
| American | 45 | 15.7% |
| Dutch | 5 | 1.8% |
| Finnish | 4 | 1.4% |
| German | 9 | 3.2% |
| Irish | 2 | 0.7% |
| Italian | 2 | 0.7% |
| Mexican | 28 | 9.8% | View All 7 Rows |
Immigrants in Geiger
The most numerous immigrant groups reported in Geiger came from Central America (8 | 2.8%), Latin America (8 | 2.8%), Mexico (8 | 2.8%), Europe (4 | 1.4%), and Northern Europe (4 | 1.4%), together accounting for 11.2% of all Geiger residents.
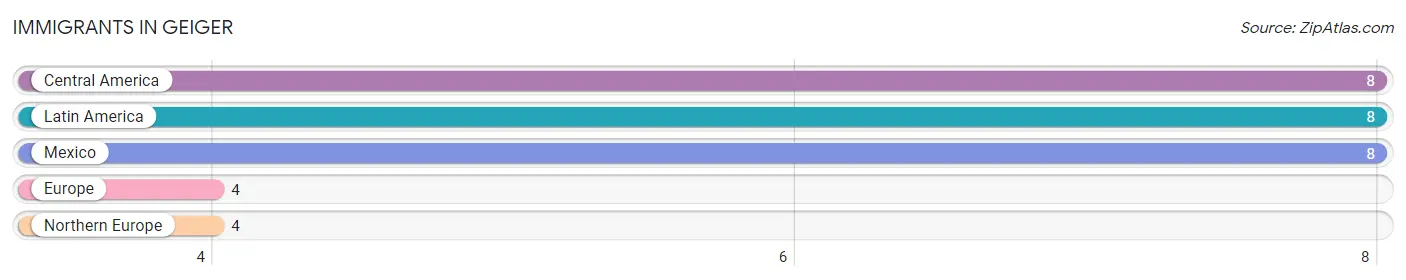
| Immigration Origin | # Population | % Population |
| Central America | 8 | 2.8% |
| Europe | 4 | 1.4% |
| Latin America | 8 | 2.8% |
| Mexico | 8 | 2.8% |
| Northern Europe | 4 | 1.4% | View All 5 Rows |
Sex and Age in Geiger
Sex and Age in Geiger
The most populous age groups in Geiger are 20 to 24 Years (43 | 35.2%) for men and 75 to 79 Years (33 | 20.1%) for women.
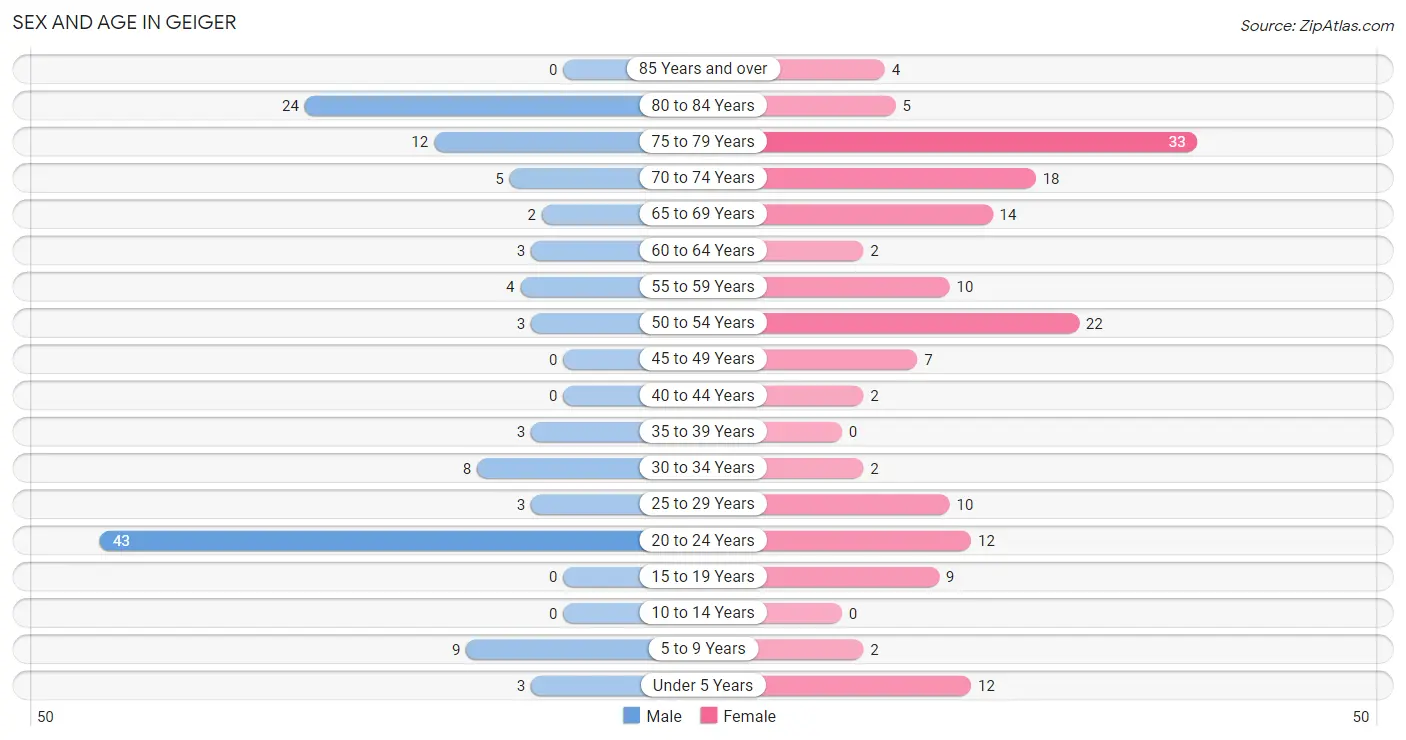
| Age Bracket | Male | Female |
| Under 5 Years | 3 (2.5%) | 12 (7.3%) |
| 5 to 9 Years | 9 (7.4%) | 2 (1.2%) |
| 10 to 14 Years | 0 (0.0%) | 0 (0.0%) |
| 15 to 19 Years | 0 (0.0%) | 9 (5.5%) |
| 20 to 24 Years | 43 (35.2%) | 12 (7.3%) |
| 25 to 29 Years | 3 (2.5%) | 10 (6.1%) |
| 30 to 34 Years | 8 (6.6%) | 2 (1.2%) |
| 35 to 39 Years | 3 (2.5%) | 0 (0.0%) |
| 40 to 44 Years | 0 (0.0%) | 2 (1.2%) |
| 45 to 49 Years | 0 (0.0%) | 7 (4.3%) |
| 50 to 54 Years | 3 (2.5%) | 22 (13.4%) |
| 55 to 59 Years | 4 (3.3%) | 10 (6.1%) |
| 60 to 64 Years | 3 (2.5%) | 2 (1.2%) |
| 65 to 69 Years | 2 (1.6%) | 14 (8.5%) |
| 70 to 74 Years | 5 (4.1%) | 18 (11.0%) |
| 75 to 79 Years | 12 (9.8%) | 33 (20.1%) |
| 80 to 84 Years | 24 (19.7%) | 5 (3.0%) |
| 85 Years and over | 0 (0.0%) | 4 (2.4%) |
| Total | 122 (100.0%) | 164 (100.0%) |
Families and Households in Geiger
Median Family Size in Geiger
The median family size in Geiger is 2.99 persons per family, with married-couple families (55 | 63.2%) accounting for the largest median family size of 3.22 persons per family. On the other hand, single female/mother families (24 | 27.6%) represent the smallest median family size with 2.50 persons per family.
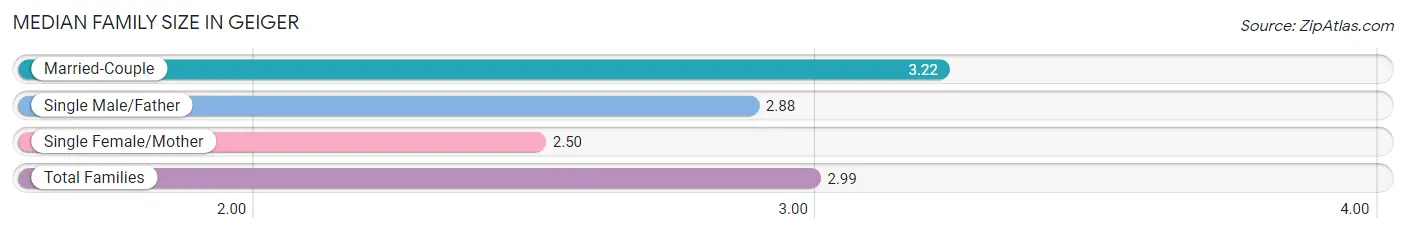
| Family Type | # Families | Family Size |
| Married-Couple | 55 (63.2%) | 3.22 |
| Single Male/Father | 8 (9.2%) | 2.88 |
| Single Female/Mother | 24 (27.6%) | 2.50 |
| Total Families | 87 (100.0%) | 2.99 |
Median Household Size in Geiger
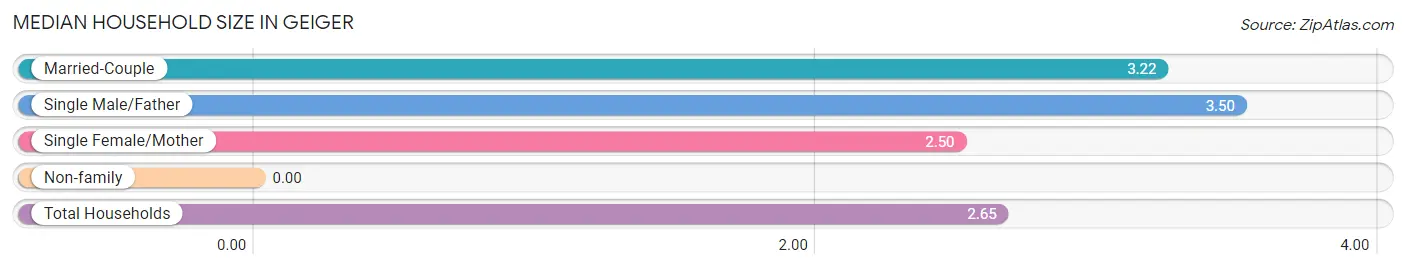
| Household Type | # Households | Household Size |
| Married-Couple | 55 (50.9%) | 3.22 |
| Single Male/Father | 8 (7.4%) | 3.50 |
| Single Female/Mother | 24 (22.2%) | 2.50 |
| Non-family | 21 (19.4%) | - |
| Total Households | 108 (100.0%) | 2.65 |
Household Size by Marriage Status in Geiger
Out of a total of 108 households in Geiger, 87 (80.6%) are family households, while 21 (19.4%) are nonfamily households. The most numerous type of family households are 2-person households, comprising 57, and the most common type of nonfamily households are 1-person households, comprising 21.
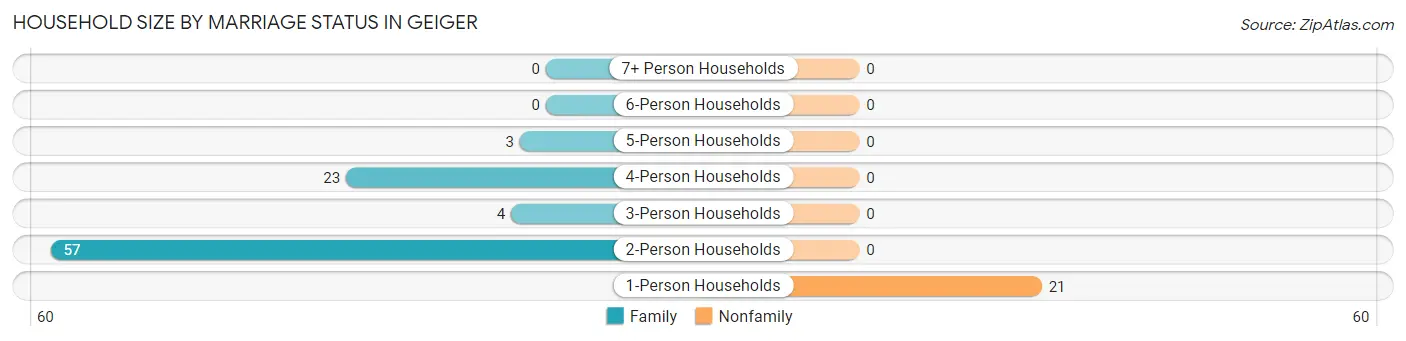
| Household Size | Family Households | Nonfamily Households |
| 1-Person Households | - | 21 (19.4%) |
| 2-Person Households | 57 (52.8%) | 0 (0.0%) |
| 3-Person Households | 4 (3.7%) | 0 (0.0%) |
| 4-Person Households | 23 (21.3%) | 0 (0.0%) |
| 5-Person Households | 3 (2.8%) | 0 (0.0%) |
| 6-Person Households | 0 (0.0%) | 0 (0.0%) |
| 7+ Person Households | 0 (0.0%) | 0 (0.0%) |
| Total | 87 (80.6%) | 21 (19.4%) |
Female Fertility in Geiger
Fertility by Age in Geiger
| Age Bracket | Women with Births | Births / 1,000 Women |
| 15 to 19 years | 0 (0.0%) | 0.0 |
| 20 to 34 years | 0 (0.0%) | 0.0 |
| 35 to 50 years | 0 (0.0%) | 0.0 |
| Total | 0 (0.0%) | 0.0 |
Fertility by Age by Marriage Status in Geiger
| Age Bracket | Married | Unmarried |
| 15 to 19 years | 0 (0.0%) | 0 (0.0%) |
| 20 to 34 years | 0 (0.0%) | 0 (0.0%) |
| 35 to 50 years | 0 (0.0%) | 0 (0.0%) |
| Total | 0 (0.0%) | 0 (0.0%) |
Fertility by Education in Geiger
| Educational Attainment | Women with Births | Births / 1,000 Women |
| Less than High School | 0 (0.0%) | 0.0 |
| High School Diploma | 0 (0.0%) | 0.0 |
| College or Associate's Degree | 0 (0.0%) | 0.0 |
| Bachelor's Degree | 0 (0.0%) | 0.0 |
| Graduate Degree | 0 (0.0%) | 0.0 |
| Total | 0 (0.0%) | 0.0 |
Fertility by Education by Marriage Status in Geiger
| Educational Attainment | Married | Unmarried |
| Less than High School | 0 (0.0%) | 0 (0.0%) |
| High School Diploma | 0 (0.0%) | 0 (0.0%) |
| College or Associate's Degree | 0 (0.0%) | 0 (0.0%) |
| Bachelor's Degree | 0 (0.0%) | 0 (0.0%) |
| Graduate Degree | 0 (0.0%) | 0 (0.0%) |
| Total | 0 (0.0%) | 0 (0.0%) |
Employment Characteristics in Geiger
Employment by Class of Employer in Geiger
Among the 102 employed individuals in Geiger, private company employees (75 | 73.5%), federal government employees (13 | 12.8%), and self-employed (not incorporated) (8 | 7.8%) make up the most common classes of employment.
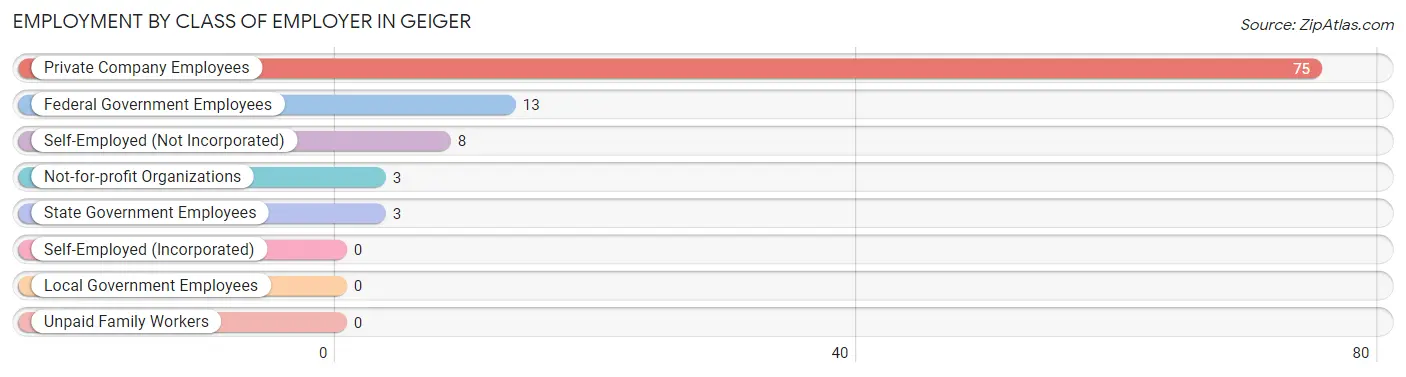
| Employer Class | # Employees | % Employees |
| Private Company Employees | 75 | 73.5% |
| Self-Employed (Incorporated) | 0 | 0.0% |
| Self-Employed (Not Incorporated) | 8 | 7.8% |
| Not-for-profit Organizations | 3 | 2.9% |
| Local Government Employees | 0 | 0.0% |
| State Government Employees | 3 | 2.9% |
| Federal Government Employees | 13 | 12.8% |
| Unpaid Family Workers | 0 | 0.0% |
| Total | 102 | 100.0% |
Employment Status by Age in Geiger
According to the labor force statistics for Geiger, out of the total population over 16 years of age (260), 45.8% or 119 individuals are in the labor force, with 14.7% or 17 of them unemployed. The age group with the highest labor force participation rate is 25 to 29 years, with 100.0% or 13 individuals in the labor force. Within the labor force, the 20 to 24 years age range has the highest percentage of unemployed individuals, with 56.7% or 17 of them being unemployed.
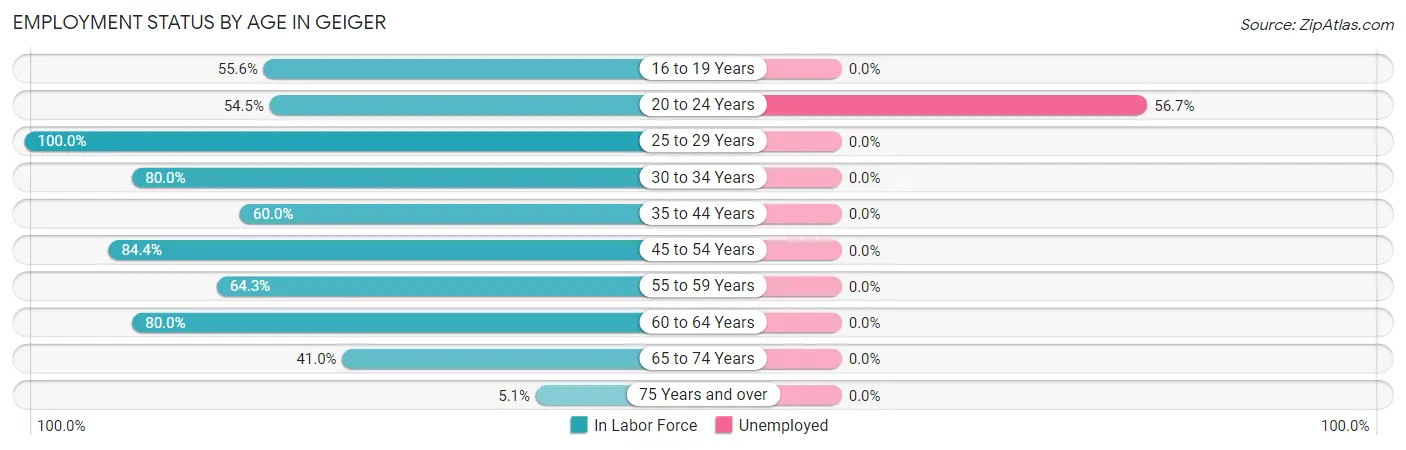
| Age Bracket | In Labor Force | Unemployed |
| 16 to 19 Years | 5 (55.6%) | 0 (0.0%) |
| 20 to 24 Years | 30 (54.5%) | 17 (56.7%) |
| 25 to 29 Years | 13 (100.0%) | 0 (0.0%) |
| 30 to 34 Years | 8 (80.0%) | 0 (0.0%) |
| 35 to 44 Years | 3 (60.0%) | 0 (0.0%) |
| 45 to 54 Years | 27 (84.4%) | 0 (0.0%) |
| 55 to 59 Years | 9 (64.3%) | 0 (0.0%) |
| 60 to 64 Years | 4 (80.0%) | 0 (0.0%) |
| 65 to 74 Years | 16 (41.0%) | 0 (0.0%) |
| 75 Years and over | 4 (5.1%) | 0 (0.0%) |
| Total | 119 (45.8%) | 17 (14.7%) |
Employment Status by Educational Attainment in Geiger
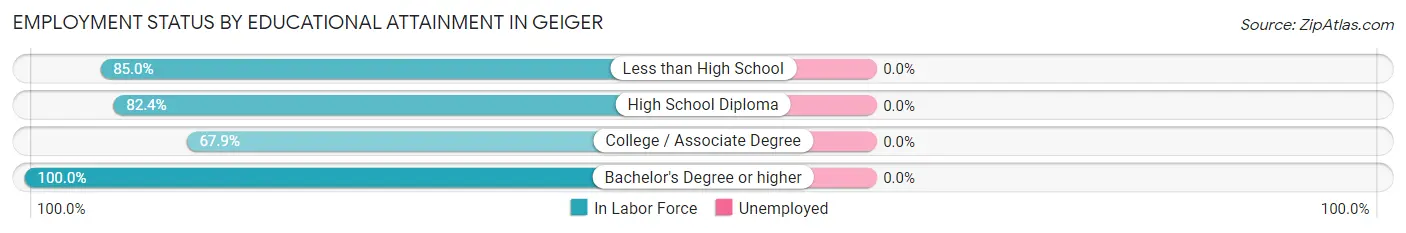
| Educational Attainment | In Labor Force | Unemployed |
| Less than High School | 17 (85.0%) | 0 (0.0%) |
| High School Diploma | 14 (82.4%) | 0 (0.0%) |
| College / Associate Degree | 19 (67.9%) | 0 (0.0%) |
| Bachelor's Degree or higher | 14 (100.0%) | 0 (0.0%) |
| Total | 64 (81.0%) | 0 (0.0%) |
Employment Occupations by Sex in Geiger
Management, Business, Science and Arts Occupations
The most common Management, Business, Science and Arts occupations in Geiger are Health Diagnosing & Treating (3 | 3.0%), and Health Technologists (3 | 3.0%).
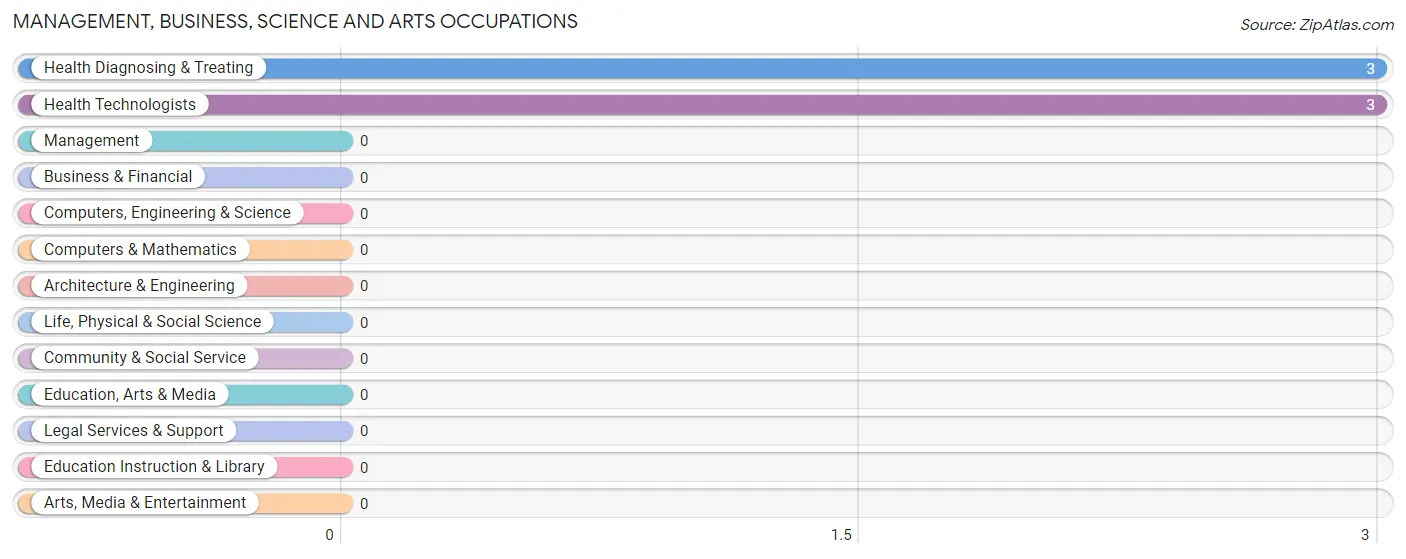
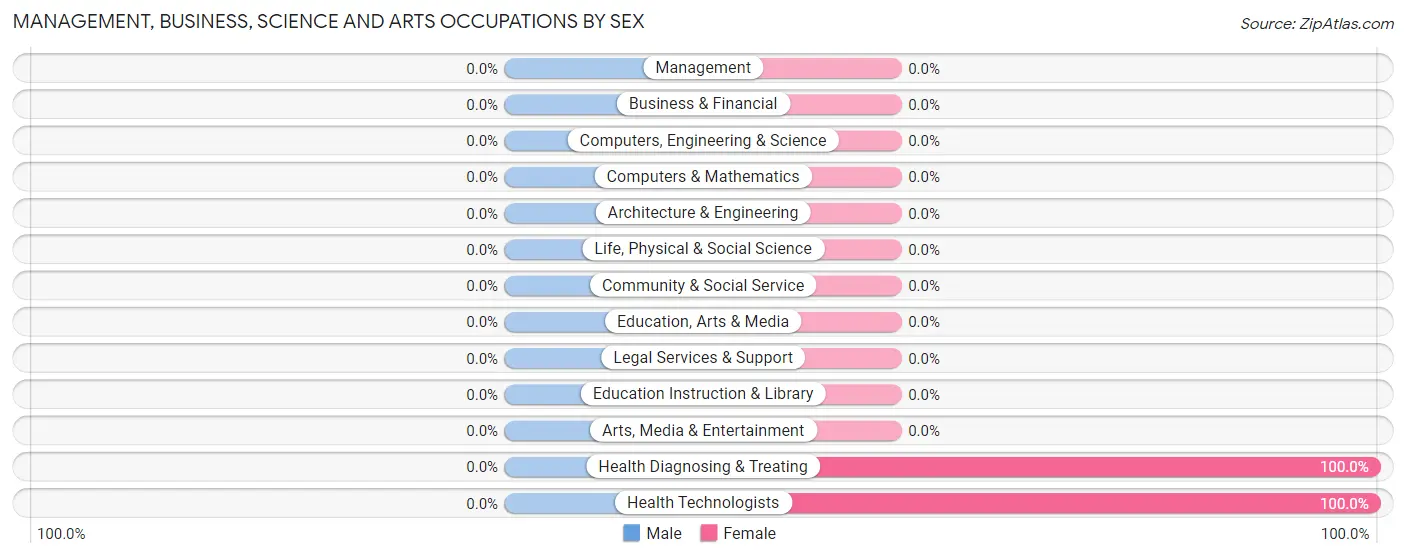
Management, Business, Science and Arts Occupations by Sex
| Occupation | Male | Female |
| Management | 0 (0.0%) | 0 (0.0%) |
| Business & Financial | 0 (0.0%) | 0 (0.0%) |
| Computers, Engineering & Science | 0 (0.0%) | 0 (0.0%) |
| Computers & Mathematics | 0 (0.0%) | 0 (0.0%) |
| Architecture & Engineering | 0 (0.0%) | 0 (0.0%) |
| Life, Physical & Social Science | 0 (0.0%) | 0 (0.0%) |
| Community & Social Service | 0 (0.0%) | 0 (0.0%) |
| Education, Arts & Media | 0 (0.0%) | 0 (0.0%) |
| Legal Services & Support | 0 (0.0%) | 0 (0.0%) |
| Education Instruction & Library | 0 (0.0%) | 0 (0.0%) |
| Arts, Media & Entertainment | 0 (0.0%) | 0 (0.0%) |
| Health Diagnosing & Treating | 0 (0.0%) | 3 (100.0%) |
| Health Technologists | 0 (0.0%) | 3 (100.0%) |
| Total (Category) | 0 (0.0%) | 3 (100.0%) |
| Total (Overall) | 34 (34.3%) | 65 (65.7%) |
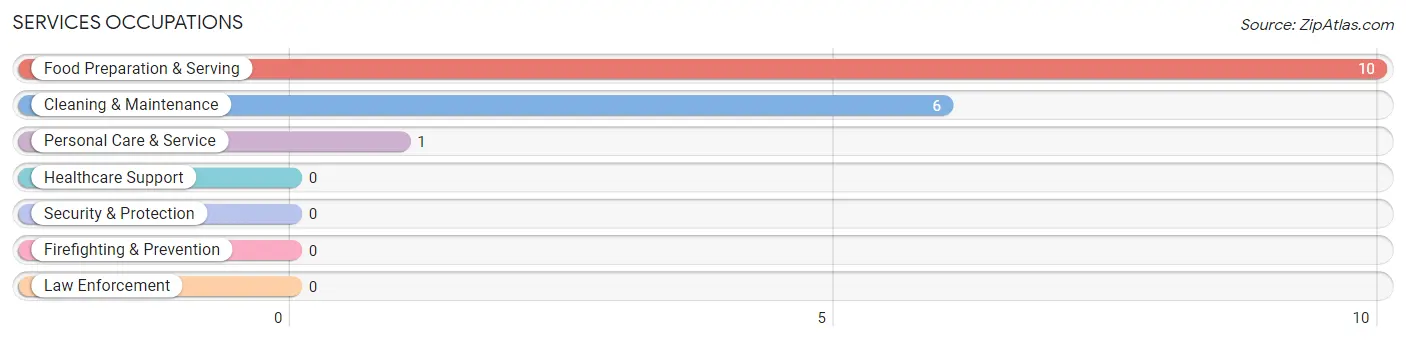
Services Occupations
The most common Services occupations in Geiger are Food Preparation & Serving (10 | 10.1%), Cleaning & Maintenance (6 | 6.1%), and Personal Care & Service (1 | 1.0%).
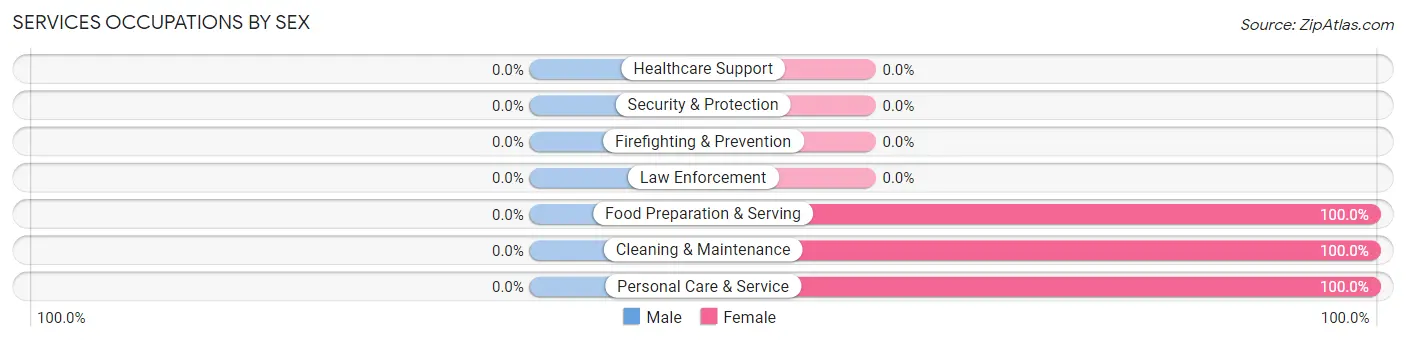
Services Occupations by Sex
| Occupation | Male | Female |
| Healthcare Support | 0 (0.0%) | 0 (0.0%) |
| Security & Protection | 0 (0.0%) | 0 (0.0%) |
| Firefighting & Prevention | 0 (0.0%) | 0 (0.0%) |
| Law Enforcement | 0 (0.0%) | 0 (0.0%) |
| Food Preparation & Serving | 0 (0.0%) | 10 (100.0%) |
| Cleaning & Maintenance | 0 (0.0%) | 6 (100.0%) |
| Personal Care & Service | 0 (0.0%) | 1 (100.0%) |
| Total (Category) | 0 (0.0%) | 17 (100.0%) |
| Total (Overall) | 34 (34.3%) | 65 (65.7%) |
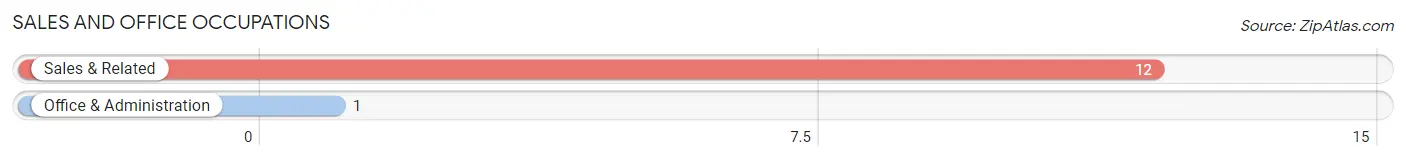
Sales and Office Occupations
The most common Sales and Office occupations in Geiger are Sales & Related (12 | 12.1%), and Office & Administration (1 | 1.0%).
Sales and Office Occupations by Sex
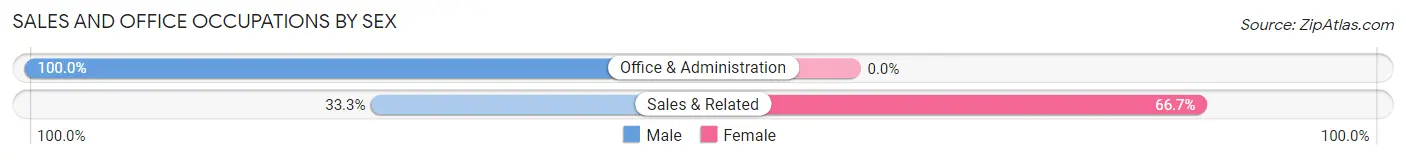
| Occupation | Male | Female |
| Sales & Related | 4 (33.3%) | 8 (66.7%) |
| Office & Administration | 1 (100.0%) | 0 (0.0%) |
| Total (Category) | 5 (38.5%) | 8 (61.5%) |
| Total (Overall) | 34 (34.3%) | 65 (65.7%) |
Natural Resources, Construction and Maintenance Occupations
The most common Natural Resources, Construction and Maintenance occupations in Geiger are Farming, Fishing & Forestry (18 | 18.2%), and Construction & Extraction (9 | 9.1%).

Natural Resources, Construction and Maintenance Occupations by Sex
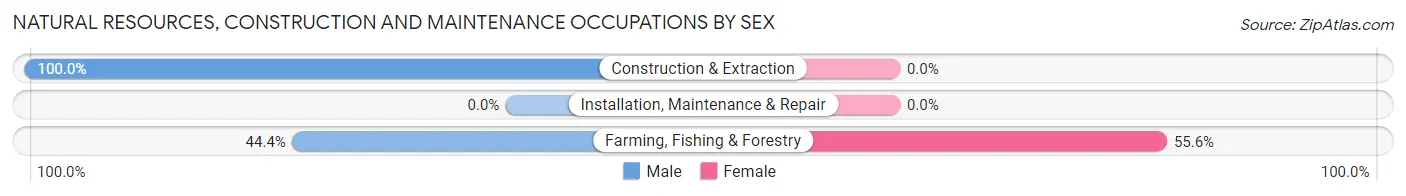
| Occupation | Male | Female |
| Farming, Fishing & Forestry | 8 (44.4%) | 10 (55.6%) |
| Construction & Extraction | 9 (100.0%) | 0 (0.0%) |
| Installation, Maintenance & Repair | 0 (0.0%) | 0 (0.0%) |
| Total (Category) | 17 (63.0%) | 10 (37.0%) |
| Total (Overall) | 34 (34.3%) | 65 (65.7%) |
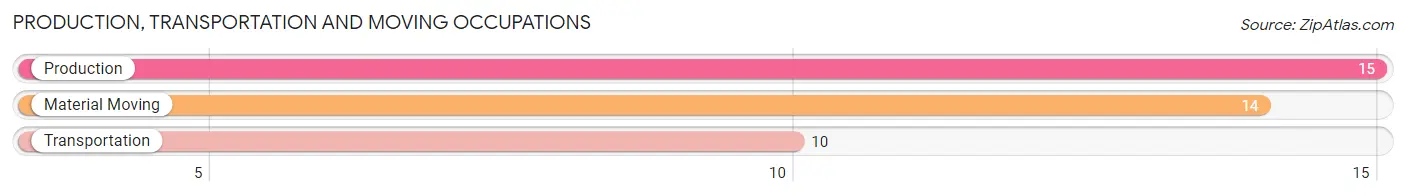
Production, Transportation and Moving Occupations
The most common Production, Transportation and Moving occupations in Geiger are Production (15 | 15.1%), Material Moving (14 | 14.1%), and Transportation (10 | 10.1%).
Production, Transportation and Moving Occupations by Sex
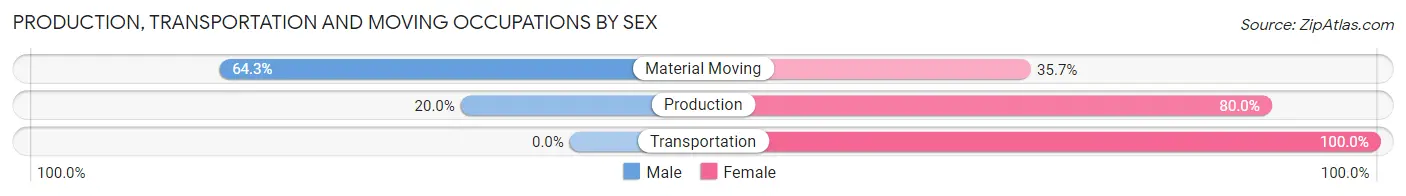
| Occupation | Male | Female |
| Production | 3 (20.0%) | 12 (80.0%) |
| Transportation | 0 (0.0%) | 10 (100.0%) |
| Material Moving | 9 (64.3%) | 5 (35.7%) |
| Total (Category) | 12 (30.8%) | 27 (69.2%) |
| Total (Overall) | 34 (34.3%) | 65 (65.7%) |
Employment Industries by Sex in Geiger
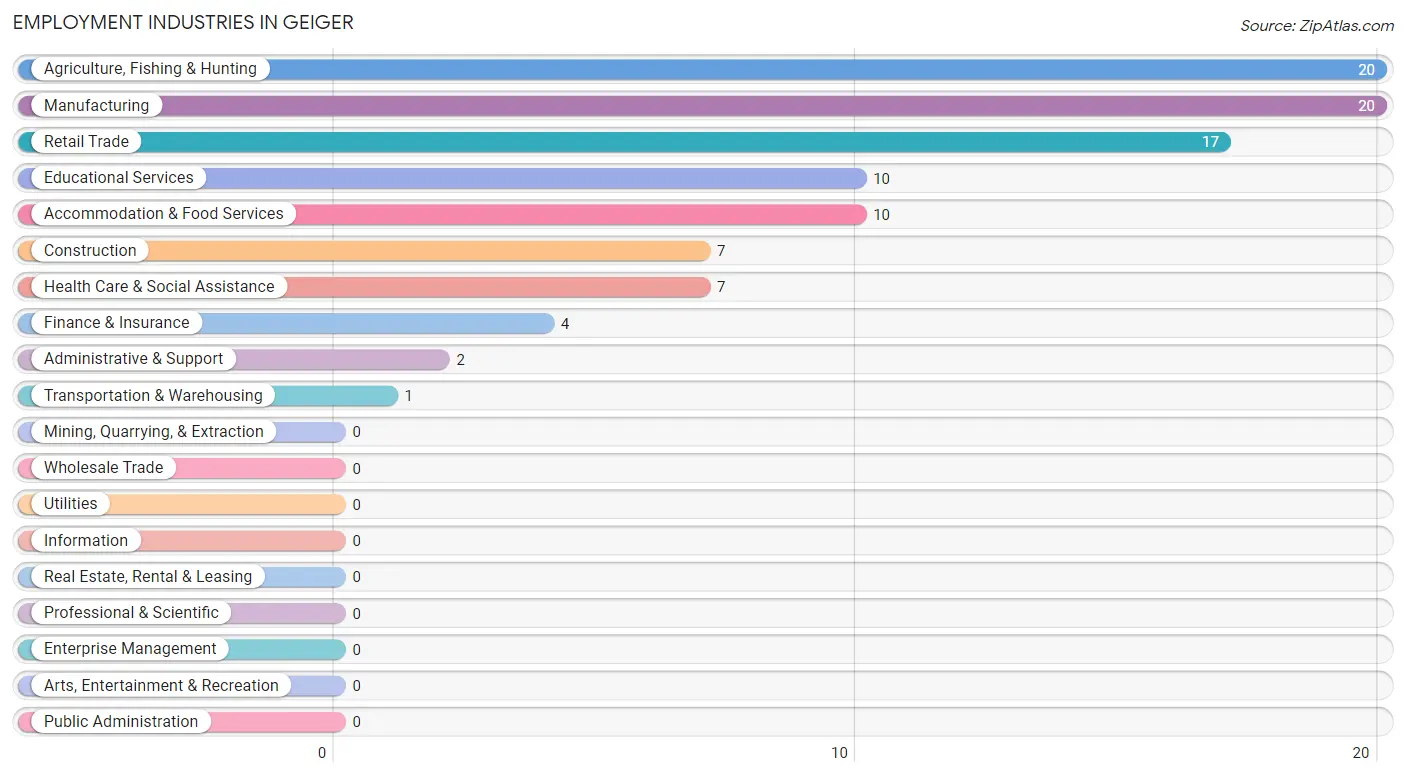
Employment Industries in Geiger
The major employment industries in Geiger include Agriculture, Fishing & Hunting (20 | 20.2%), Manufacturing (20 | 20.2%), Retail Trade (17 | 17.2%), Educational Services (10 | 10.1%), and Accommodation & Food Services (10 | 10.1%).
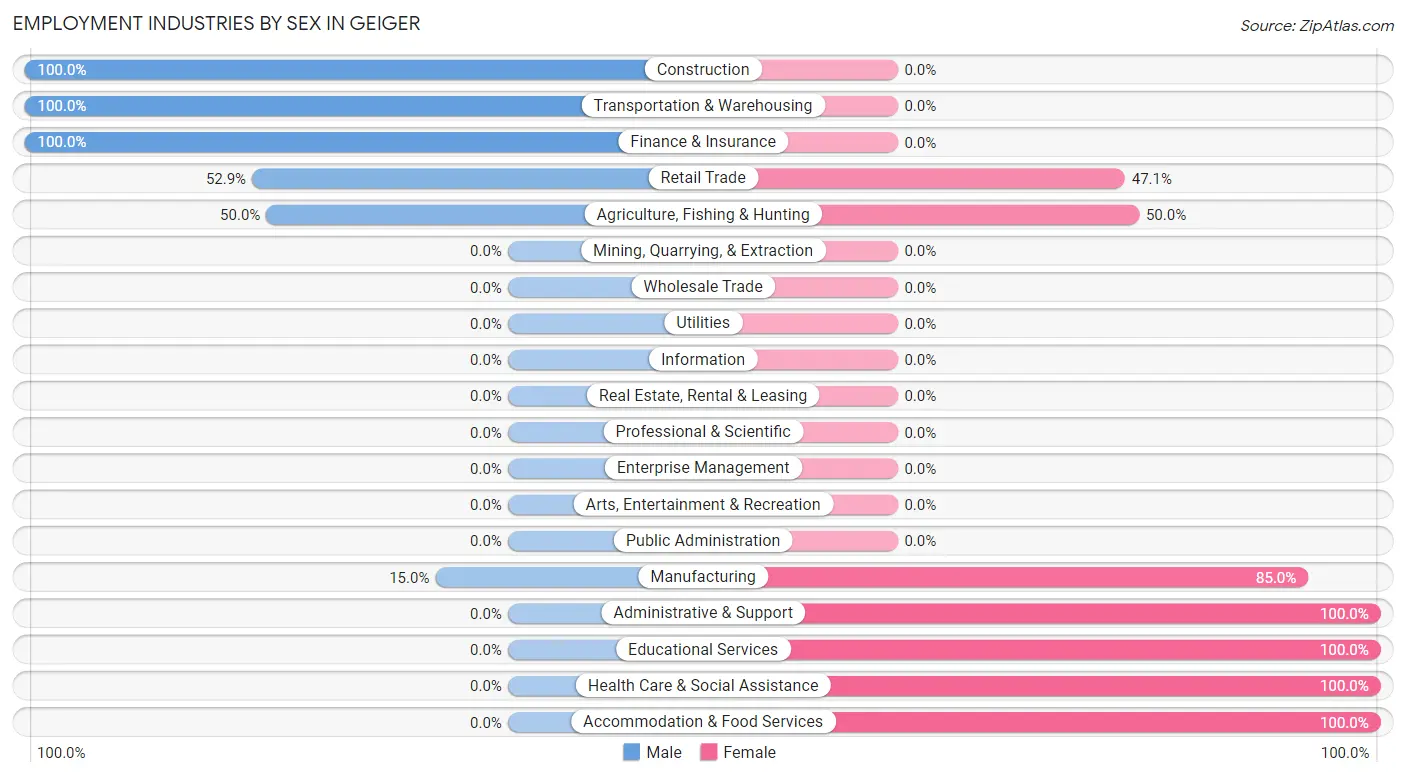
Employment Industries by Sex in Geiger
The Geiger industries that see more men than women are Construction (100.0%), Transportation & Warehousing (100.0%), and Finance & Insurance (100.0%), whereas the industries that tend to have a higher number of women are Administrative & Support (100.0%), Educational Services (100.0%), and Health Care & Social Assistance (100.0%).
| Industry | Male | Female |
| Agriculture, Fishing & Hunting | 10 (50.0%) | 10 (50.0%) |
| Mining, Quarrying, & Extraction | 0 (0.0%) | 0 (0.0%) |
| Construction | 7 (100.0%) | 0 (0.0%) |
| Manufacturing | 3 (15.0%) | 17 (85.0%) |
| Wholesale Trade | 0 (0.0%) | 0 (0.0%) |
| Retail Trade | 9 (52.9%) | 8 (47.1%) |
| Transportation & Warehousing | 1 (100.0%) | 0 (0.0%) |
| Utilities | 0 (0.0%) | 0 (0.0%) |
| Information | 0 (0.0%) | 0 (0.0%) |
| Finance & Insurance | 4 (100.0%) | 0 (0.0%) |
| Real Estate, Rental & Leasing | 0 (0.0%) | 0 (0.0%) |
| Professional & Scientific | 0 (0.0%) | 0 (0.0%) |
| Enterprise Management | 0 (0.0%) | 0 (0.0%) |
| Administrative & Support | 0 (0.0%) | 2 (100.0%) |
| Educational Services | 0 (0.0%) | 10 (100.0%) |
| Health Care & Social Assistance | 0 (0.0%) | 7 (100.0%) |
| Arts, Entertainment & Recreation | 0 (0.0%) | 0 (0.0%) |
| Accommodation & Food Services | 0 (0.0%) | 10 (100.0%) |
| Public Administration | 0 (0.0%) | 0 (0.0%) |
| Total | 34 (34.3%) | 65 (65.7%) |
Education in Geiger
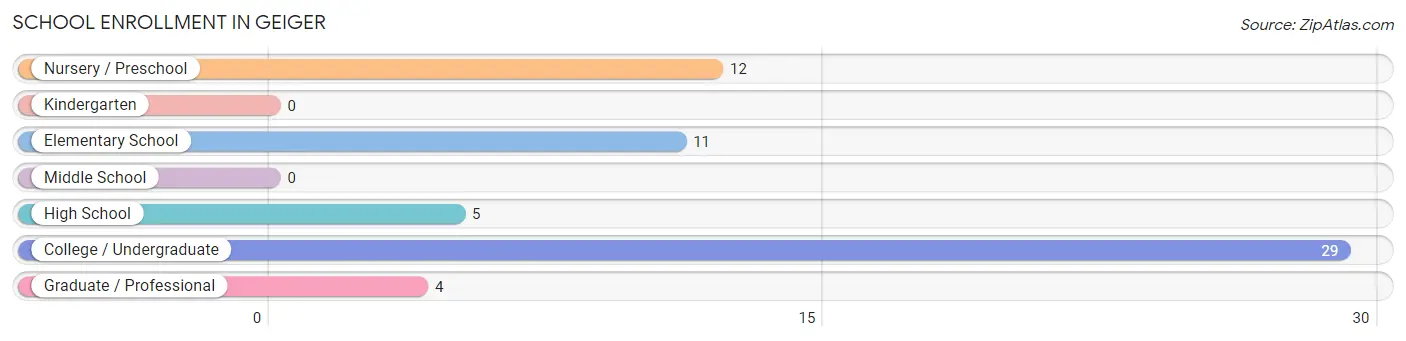
School Enrollment in Geiger
The most common levels of schooling among the 61 students in Geiger are college / undergraduate (29 | 47.5%), nursery / preschool (12 | 19.7%), and elementary school (11 | 18.0%).
| School Level | # Students | % Students |
| Nursery / Preschool | 12 | 19.7% |
| Kindergarten | 0 | 0.0% |
| Elementary School | 11 | 18.0% |
| Middle School | 0 | 0.0% |
| High School | 5 | 8.2% |
| College / Undergraduate | 29 | 47.5% |
| Graduate / Professional | 4 | 6.6% |
| Total | 61 | 100.0% |
School Enrollment by Age by Funding Source in Geiger
Out of a total of 61 students who are enrolled in schools in Geiger, 5 (8.2%) attend a private institution, while the remaining 56 (91.8%) are enrolled in public schools. The age group of 5 to 9 year old has the highest likelihood of being enrolled in private schools, with 5 (45.5% in the age bracket) enrolled. Conversely, the age group of 3 to 4 year olds has the lowest likelihood of being enrolled in a private school, with 12 (100.0% in the age bracket) attending a public institution.
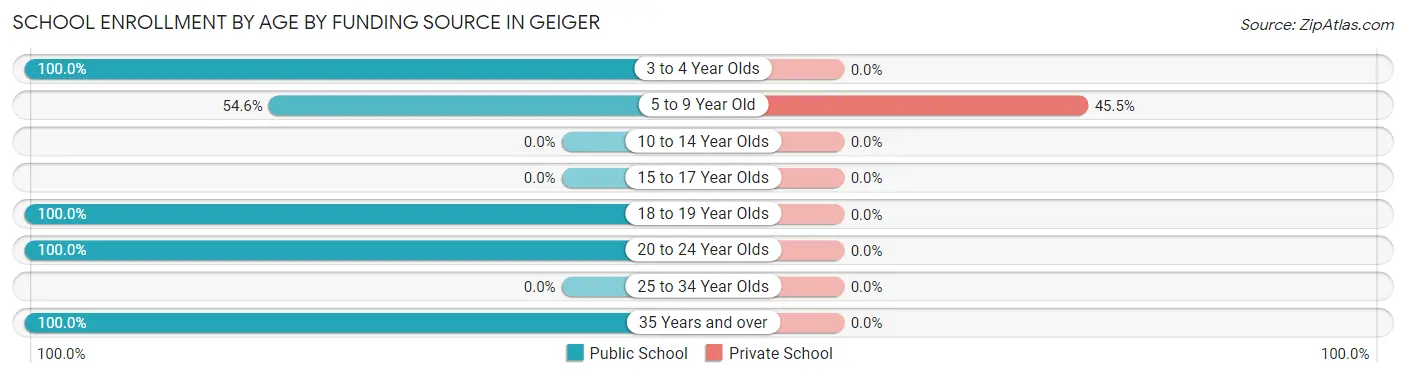
| Age Bracket | Public School | Private School |
| 3 to 4 Year Olds | 12 (100.0%) | 0 (0.0%) |
| 5 to 9 Year Old | 6 (54.5%) | 5 (45.5%) |
| 10 to 14 Year Olds | 0 (0.0%) | 0 (0.0%) |
| 15 to 17 Year Olds | 0 (0.0%) | 0 (0.0%) |
| 18 to 19 Year Olds | 9 (100.0%) | 0 (0.0%) |
| 20 to 24 Year Olds | 24 (100.0%) | 0 (0.0%) |
| 25 to 34 Year Olds | 0 (0.0%) | 0 (0.0%) |
| 35 Years and over | 5 (100.0%) | 0 (0.0%) |
| Total | 56 (91.8%) | 5 (8.2%) |
Educational Attainment by Field of Study in Geiger
Education (31 | 40.8%), arts & humanities (30 | 39.5%), bio, nature & agricultural (10 | 13.2%), visual & performing arts (3 | 4.0%), and physical & health sciences (1 | 1.3%) are the most common fields of study among 76 individuals in Geiger who have obtained a bachelor's degree or higher.
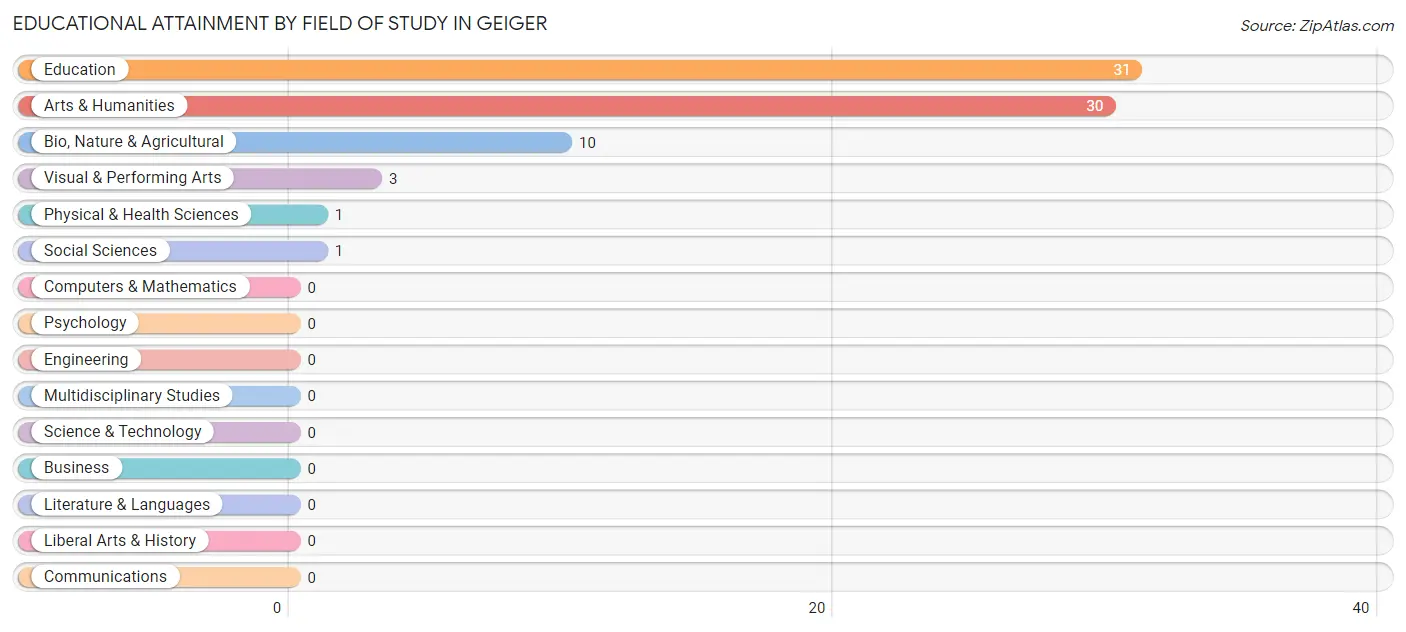
| Field of Study | # Graduates | % Graduates |
| Computers & Mathematics | 0 | 0.0% |
| Bio, Nature & Agricultural | 10 | 13.2% |
| Physical & Health Sciences | 1 | 1.3% |
| Psychology | 0 | 0.0% |
| Social Sciences | 1 | 1.3% |
| Engineering | 0 | 0.0% |
| Multidisciplinary Studies | 0 | 0.0% |
| Science & Technology | 0 | 0.0% |
| Business | 0 | 0.0% |
| Education | 31 | 40.8% |
| Literature & Languages | 0 | 0.0% |
| Liberal Arts & History | 0 | 0.0% |
| Visual & Performing Arts | 3 | 4.0% |
| Communications | 0 | 0.0% |
| Arts & Humanities | 30 | 39.5% |
| Total | 76 | 100.0% |
Transportation & Commute in Geiger
Vehicle Availability by Sex in Geiger
The most prevalent vehicle ownership categories in Geiger are males with 2 vehicles (14, accounting for 37.8%) and females with 2 vehicles (5, making up 21.5%).
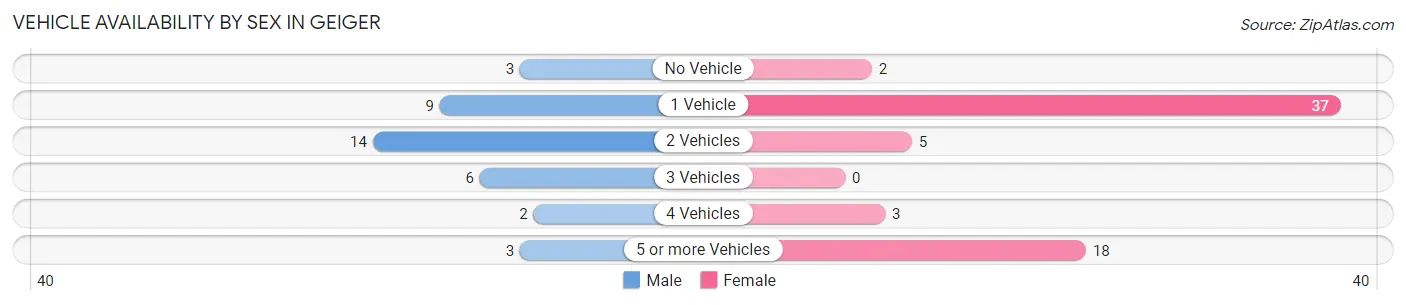
| Vehicles Available | Male | Female |
| No Vehicle | 3 (8.1%) | 2 (3.1%) |
| 1 Vehicle | 9 (24.3%) | 37 (56.9%) |
| 2 Vehicles | 14 (37.8%) | 5 (7.7%) |
| 3 Vehicles | 6 (16.2%) | 0 (0.0%) |
| 4 Vehicles | 2 (5.4%) | 3 (4.6%) |
| 5 or more Vehicles | 3 (8.1%) | 18 (27.7%) |
| Total | 37 (100.0%) | 65 (100.0%) |
Commute Time in Geiger
The most frequently occuring commute durations in Geiger are 60 to 89 minutes (23 commuters, 22.8%), 15 to 19 minutes (20 commuters, 19.8%), and 35 to 39 minutes (14 commuters, 13.9%).
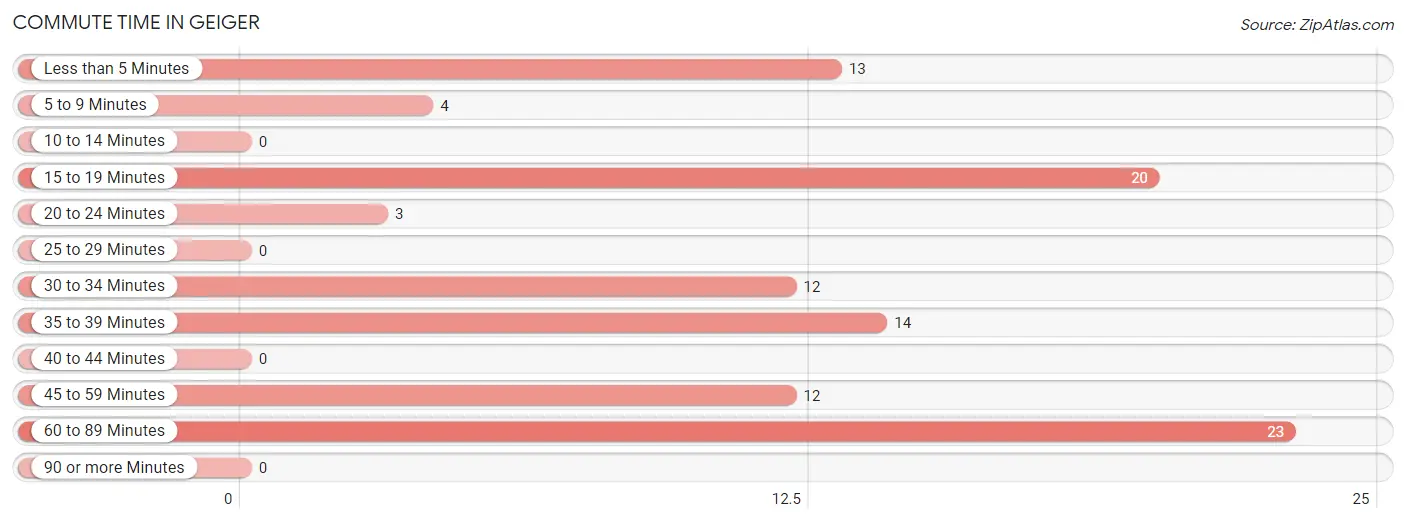
| Commute Time | # Commuters | % Commuters |
| Less than 5 Minutes | 13 | 12.9% |
| 5 to 9 Minutes | 4 | 4.0% |
| 10 to 14 Minutes | 0 | 0.0% |
| 15 to 19 Minutes | 20 | 19.8% |
| 20 to 24 Minutes | 3 | 3.0% |
| 25 to 29 Minutes | 0 | 0.0% |
| 30 to 34 Minutes | 12 | 11.9% |
| 35 to 39 Minutes | 14 | 13.9% |
| 40 to 44 Minutes | 0 | 0.0% |
| 45 to 59 Minutes | 12 | 11.9% |
| 60 to 89 Minutes | 23 | 22.8% |
| 90 or more Minutes | 0 | 0.0% |
Commute Time by Sex in Geiger
The most common commute times in Geiger are 60 to 89 minutes (12 commuters, 32.4%) for males and 15 to 19 minutes (15 commuters, 23.4%) for females.
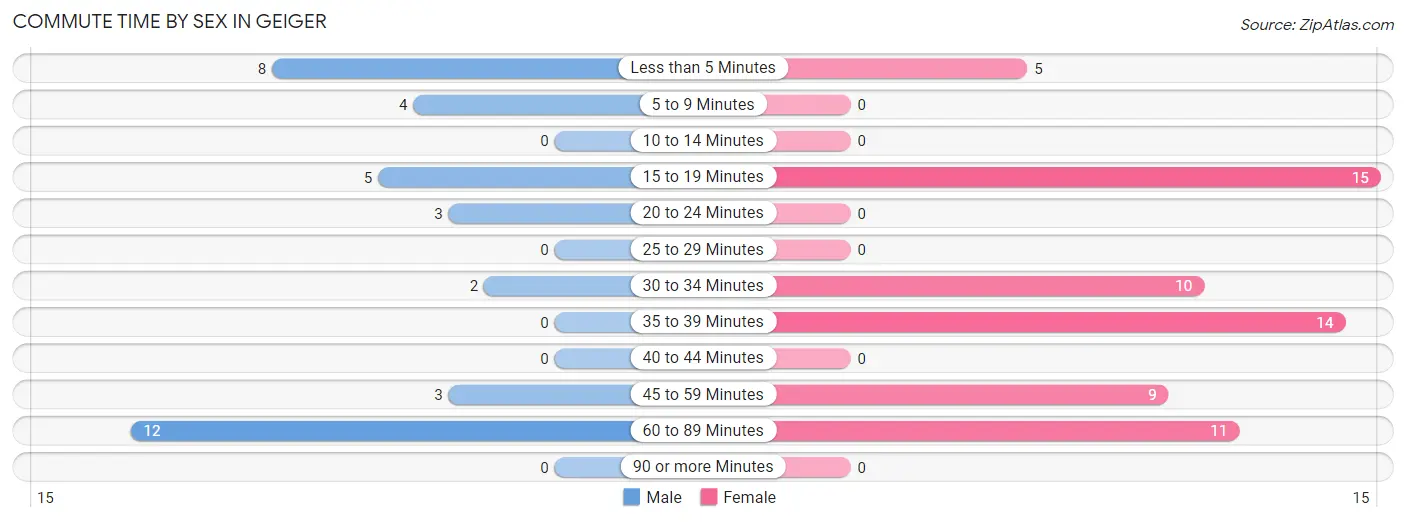
| Commute Time | Male | Female |
| Less than 5 Minutes | 8 (21.6%) | 5 (7.8%) |
| 5 to 9 Minutes | 4 (10.8%) | 0 (0.0%) |
| 10 to 14 Minutes | 0 (0.0%) | 0 (0.0%) |
| 15 to 19 Minutes | 5 (13.5%) | 15 (23.4%) |
| 20 to 24 Minutes | 3 (8.1%) | 0 (0.0%) |
| 25 to 29 Minutes | 0 (0.0%) | 0 (0.0%) |
| 30 to 34 Minutes | 2 (5.4%) | 10 (15.6%) |
| 35 to 39 Minutes | 0 (0.0%) | 14 (21.9%) |
| 40 to 44 Minutes | 0 (0.0%) | 0 (0.0%) |
| 45 to 59 Minutes | 3 (8.1%) | 9 (14.1%) |
| 60 to 89 Minutes | 12 (32.4%) | 11 (17.2%) |
| 90 or more Minutes | 0 (0.0%) | 0 (0.0%) |
Time of Departure to Work by Sex in Geiger
The most frequent times of departure to work in Geiger are 6:30 AM to 6:59 AM (13, 35.1%) for males and 10:00 AM to 10:59 AM (15, 23.4%) for females.
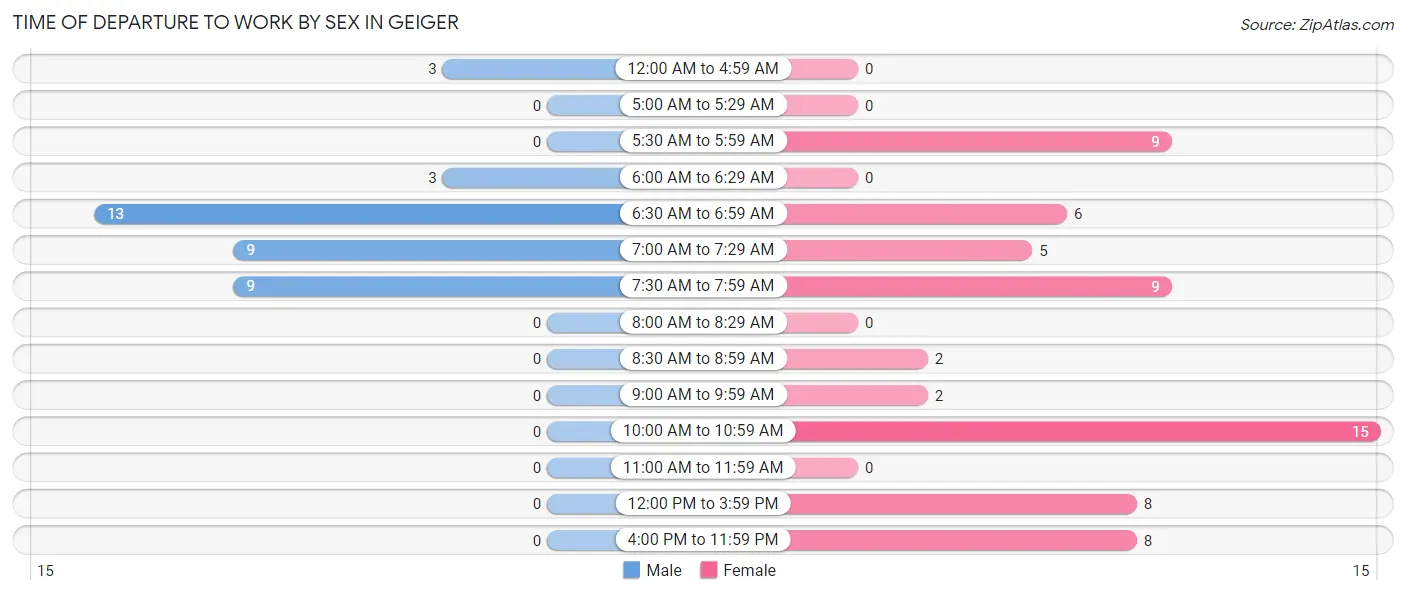
| Time of Departure | Male | Female |
| 12:00 AM to 4:59 AM | 3 (8.1%) | 0 (0.0%) |
| 5:00 AM to 5:29 AM | 0 (0.0%) | 0 (0.0%) |
| 5:30 AM to 5:59 AM | 0 (0.0%) | 9 (14.1%) |
| 6:00 AM to 6:29 AM | 3 (8.1%) | 0 (0.0%) |
| 6:30 AM to 6:59 AM | 13 (35.1%) | 6 (9.4%) |
| 7:00 AM to 7:29 AM | 9 (24.3%) | 5 (7.8%) |
| 7:30 AM to 7:59 AM | 9 (24.3%) | 9 (14.1%) |
| 8:00 AM to 8:29 AM | 0 (0.0%) | 0 (0.0%) |
| 8:30 AM to 8:59 AM | 0 (0.0%) | 2 (3.1%) |
| 9:00 AM to 9:59 AM | 0 (0.0%) | 2 (3.1%) |
| 10:00 AM to 10:59 AM | 0 (0.0%) | 15 (23.4%) |
| 11:00 AM to 11:59 AM | 0 (0.0%) | 0 (0.0%) |
| 12:00 PM to 3:59 PM | 0 (0.0%) | 8 (12.5%) |
| 4:00 PM to 11:59 PM | 0 (0.0%) | 8 (12.5%) |
| Total | 37 (100.0%) | 64 (100.0%) |
Housing Occupancy in Geiger
Occupancy by Ownership in Geiger
Of the total 108 dwellings in Geiger, owner-occupied units account for 97 (89.8%), while renter-occupied units make up 11 (10.2%).
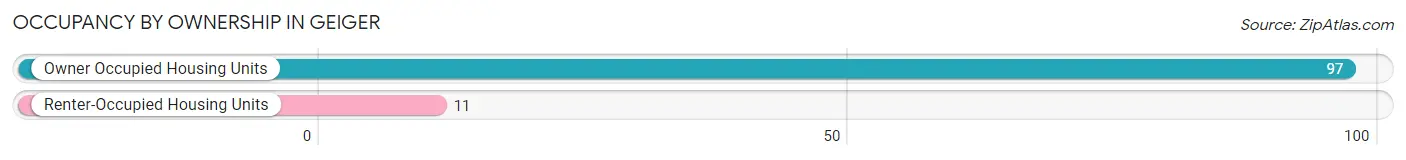
| Occupancy | # Housing Units | % Housing Units |
| Owner Occupied Housing Units | 97 | 89.8% |
| Renter-Occupied Housing Units | 11 | 10.2% |
| Total Occupied Housing Units | 108 | 100.0% |
Occupancy by Household Size in Geiger
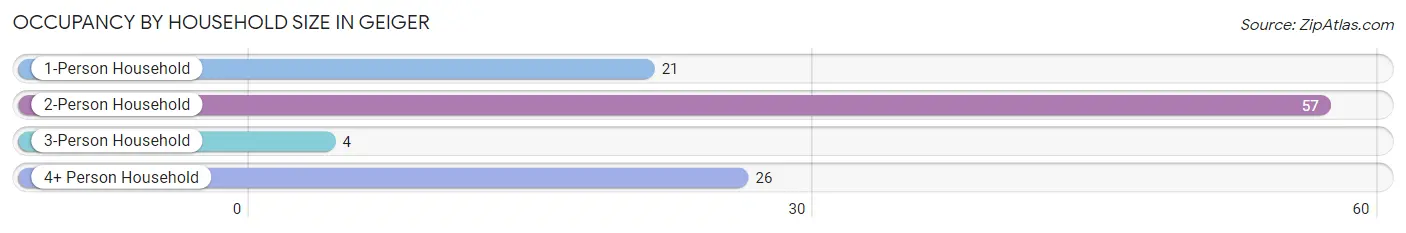
| Household Size | # Housing Units | % Housing Units |
| 1-Person Household | 21 | 19.4% |
| 2-Person Household | 57 | 52.8% |
| 3-Person Household | 4 | 3.7% |
| 4+ Person Household | 26 | 24.1% |
| Total Housing Units | 108 | 100.0% |
Occupancy by Ownership by Household Size in Geiger
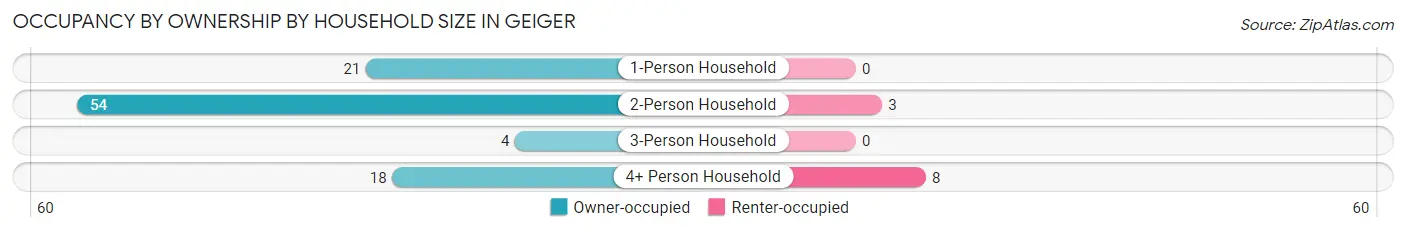
| Household Size | Owner-occupied | Renter-occupied |
| 1-Person Household | 21 (100.0%) | 0 (0.0%) |
| 2-Person Household | 54 (94.7%) | 3 (5.3%) |
| 3-Person Household | 4 (100.0%) | 0 (0.0%) |
| 4+ Person Household | 18 (69.2%) | 8 (30.8%) |
| Total Housing Units | 97 (89.8%) | 11 (10.2%) |
Occupancy by Educational Attainment in Geiger
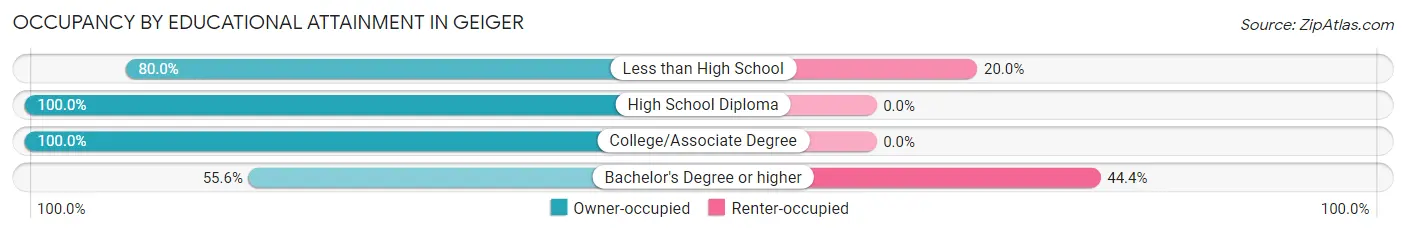
| Household Size | Owner-occupied | Renter-occupied |
| Less than High School | 12 (80.0%) | 3 (20.0%) |
| High School Diploma | 56 (100.0%) | 0 (0.0%) |
| College/Associate Degree | 19 (100.0%) | 0 (0.0%) |
| Bachelor's Degree or higher | 10 (55.6%) | 8 (44.4%) |
Occupancy by Age of Householder in Geiger
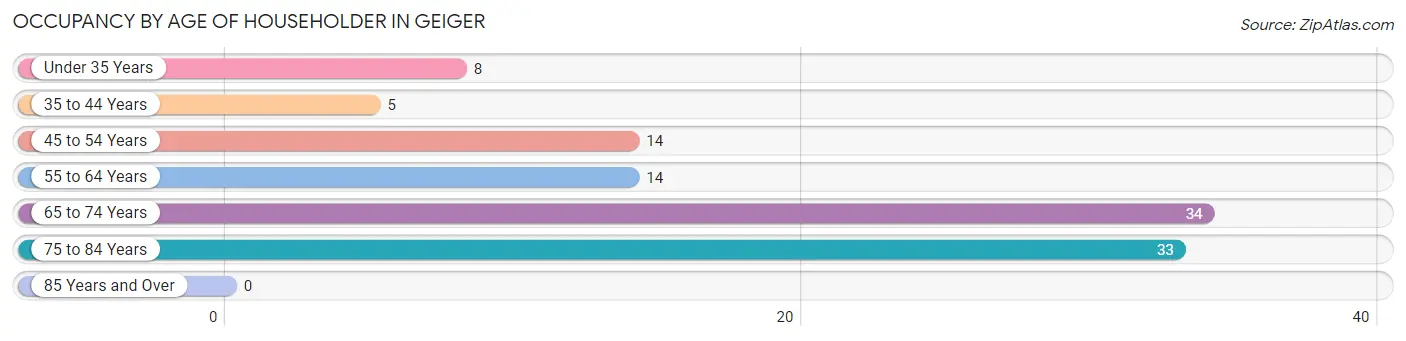
| Age Bracket | # Households | % Households |
| Under 35 Years | 8 | 7.4% |
| 35 to 44 Years | 5 | 4.6% |
| 45 to 54 Years | 14 | 13.0% |
| 55 to 64 Years | 14 | 13.0% |
| 65 to 74 Years | 34 | 31.5% |
| 75 to 84 Years | 33 | 30.6% |
| 85 Years and Over | 0 | 0.0% |
| Total | 108 | 100.0% |
Housing Finances in Geiger
Median Income by Occupancy in Geiger
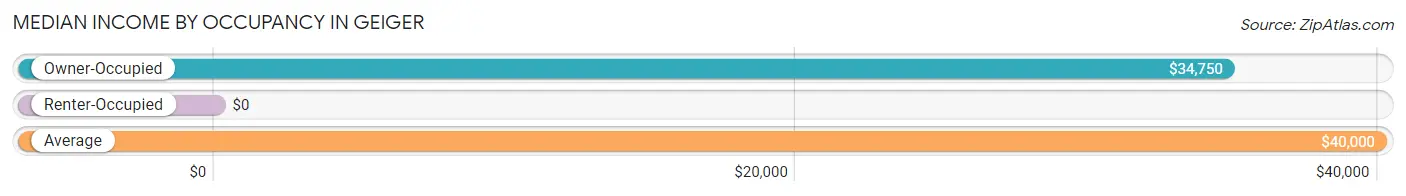
| Occupancy Type | # Households | Median Income |
| Owner-Occupied | 97 (89.8%) | $34,750 |
| Renter-Occupied | 11 (10.2%) | $0 |
| Average | 108 (100.0%) | $40,000 |
Occupancy by Householder Income Bracket in Geiger
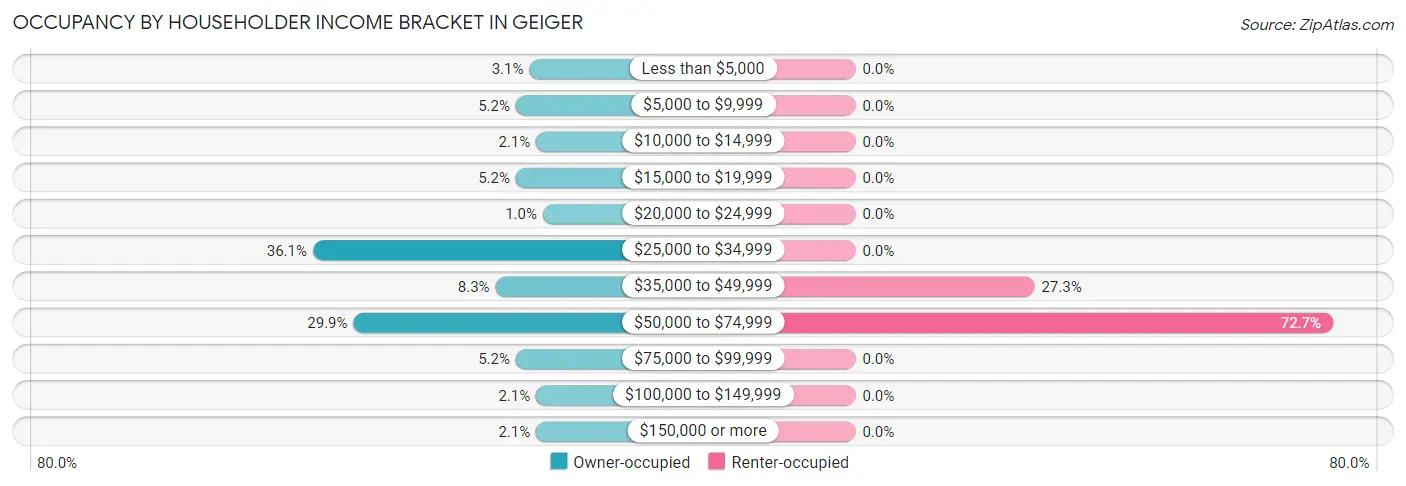
| Income Bracket | Owner-occupied | Renter-occupied |
| Less than $5,000 | 3 (3.1%) | 0 (0.0%) |
| $5,000 to $9,999 | 5 (5.1%) | 0 (0.0%) |
| $10,000 to $14,999 | 2 (2.1%) | 0 (0.0%) |
| $15,000 to $19,999 | 5 (5.1%) | 0 (0.0%) |
| $20,000 to $24,999 | 1 (1.0%) | 0 (0.0%) |
| $25,000 to $34,999 | 35 (36.1%) | 0 (0.0%) |
| $35,000 to $49,999 | 8 (8.3%) | 3 (27.3%) |
| $50,000 to $74,999 | 29 (29.9%) | 8 (72.7%) |
| $75,000 to $99,999 | 5 (5.1%) | 0 (0.0%) |
| $100,000 to $149,999 | 2 (2.1%) | 0 (0.0%) |
| $150,000 or more | 2 (2.1%) | 0 (0.0%) |
| Total | 97 (100.0%) | 11 (100.0%) |
Monthly Housing Cost Tiers in Geiger
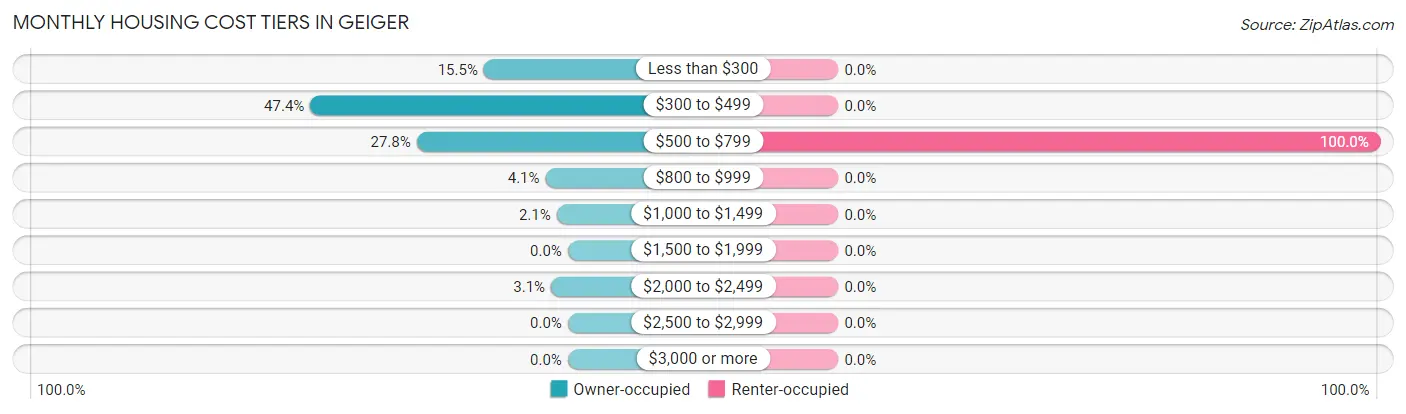
| Monthly Cost | Owner-occupied | Renter-occupied |
| Less than $300 | 15 (15.5%) | 0 (0.0%) |
| $300 to $499 | 46 (47.4%) | 0 (0.0%) |
| $500 to $799 | 27 (27.8%) | 11 (100.0%) |
| $800 to $999 | 4 (4.1%) | 0 (0.0%) |
| $1,000 to $1,499 | 2 (2.1%) | 0 (0.0%) |
| $1,500 to $1,999 | 0 (0.0%) | 0 (0.0%) |
| $2,000 to $2,499 | 3 (3.1%) | 0 (0.0%) |
| $2,500 to $2,999 | 0 (0.0%) | 0 (0.0%) |
| $3,000 or more | 0 (0.0%) | 0 (0.0%) |
| Total | 97 (100.0%) | 11 (100.0%) |
Physical Housing Characteristics in Geiger
Housing Structures in Geiger
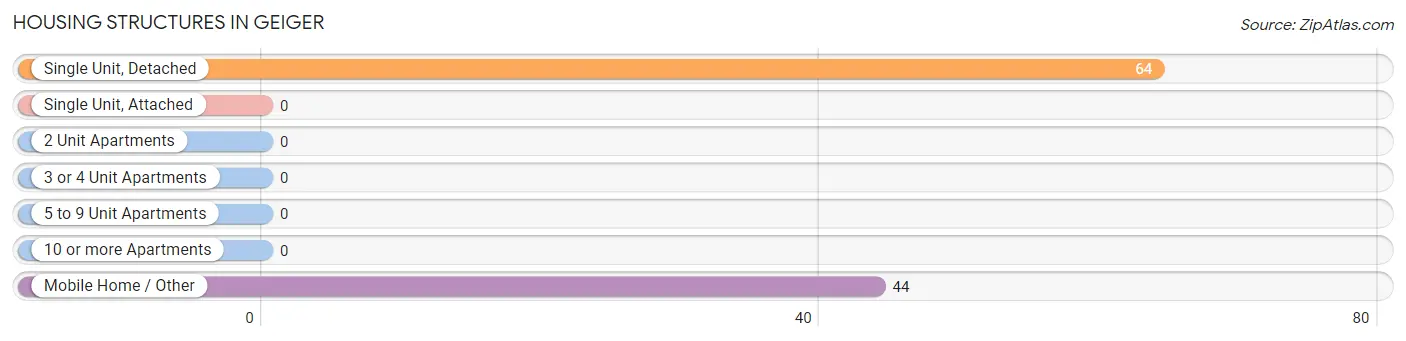
| Structure Type | # Housing Units | % Housing Units |
| Single Unit, Detached | 64 | 59.3% |
| Single Unit, Attached | 0 | 0.0% |
| 2 Unit Apartments | 0 | 0.0% |
| 3 or 4 Unit Apartments | 0 | 0.0% |
| 5 to 9 Unit Apartments | 0 | 0.0% |
| 10 or more Apartments | 0 | 0.0% |
| Mobile Home / Other | 44 | 40.7% |
| Total | 108 | 100.0% |
Housing Structures by Occupancy in Geiger
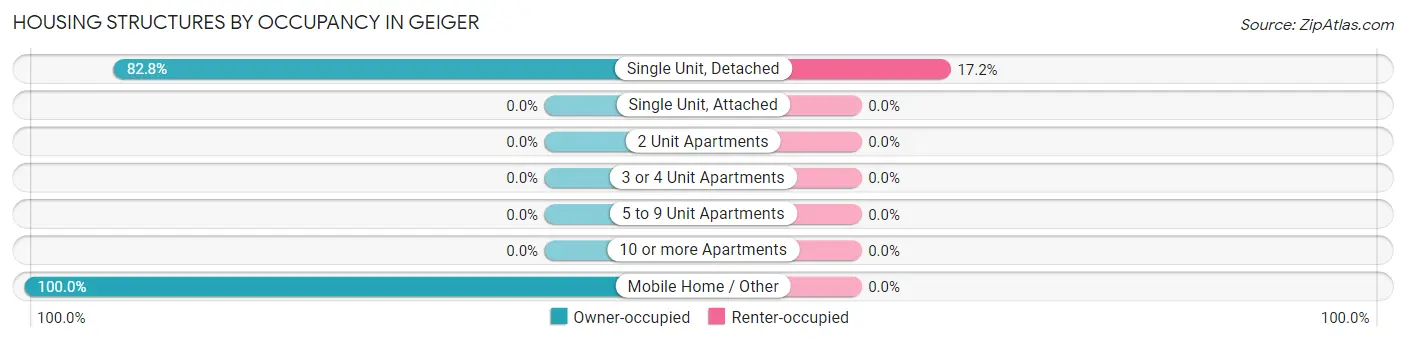
| Structure Type | Owner-occupied | Renter-occupied |
| Single Unit, Detached | 53 (82.8%) | 11 (17.2%) |
| Single Unit, Attached | 0 (0.0%) | 0 (0.0%) |
| 2 Unit Apartments | 0 (0.0%) | 0 (0.0%) |
| 3 or 4 Unit Apartments | 0 (0.0%) | 0 (0.0%) |
| 5 to 9 Unit Apartments | 0 (0.0%) | 0 (0.0%) |
| 10 or more Apartments | 0 (0.0%) | 0 (0.0%) |
| Mobile Home / Other | 44 (100.0%) | 0 (0.0%) |
| Total | 97 (89.8%) | 11 (10.2%) |
Housing Structures by Number of Rooms in Geiger
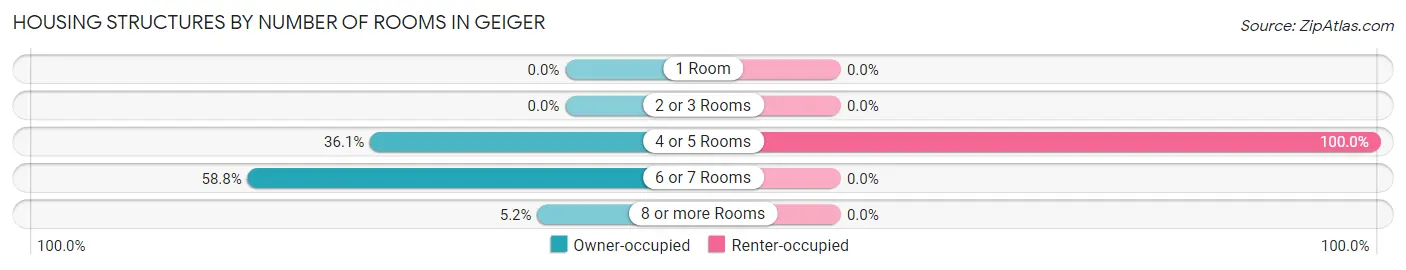
| Number of Rooms | Owner-occupied | Renter-occupied |
| 1 Room | 0 (0.0%) | 0 (0.0%) |
| 2 or 3 Rooms | 0 (0.0%) | 0 (0.0%) |
| 4 or 5 Rooms | 35 (36.1%) | 11 (100.0%) |
| 6 or 7 Rooms | 57 (58.8%) | 0 (0.0%) |
| 8 or more Rooms | 5 (5.1%) | 0 (0.0%) |
| Total | 97 (100.0%) | 11 (100.0%) |
Housing Structure by Heating Type in Geiger
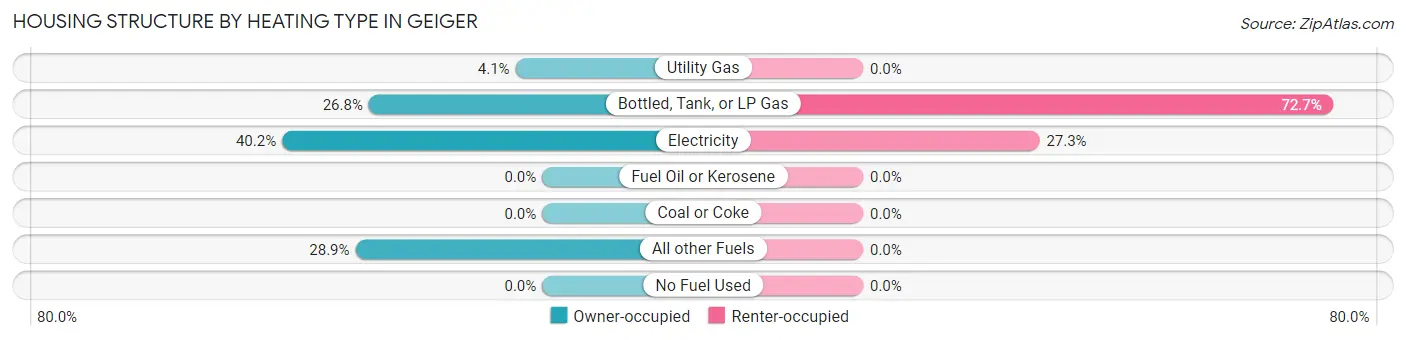
| Heating Type | Owner-occupied | Renter-occupied |
| Utility Gas | 4 (4.1%) | 0 (0.0%) |
| Bottled, Tank, or LP Gas | 26 (26.8%) | 8 (72.7%) |
| Electricity | 39 (40.2%) | 3 (27.3%) |
| Fuel Oil or Kerosene | 0 (0.0%) | 0 (0.0%) |
| Coal or Coke | 0 (0.0%) | 0 (0.0%) |
| All other Fuels | 28 (28.9%) | 0 (0.0%) |
| No Fuel Used | 0 (0.0%) | 0 (0.0%) |
| Total | 97 (100.0%) | 11 (100.0%) |
Household Vehicle Usage in Geiger
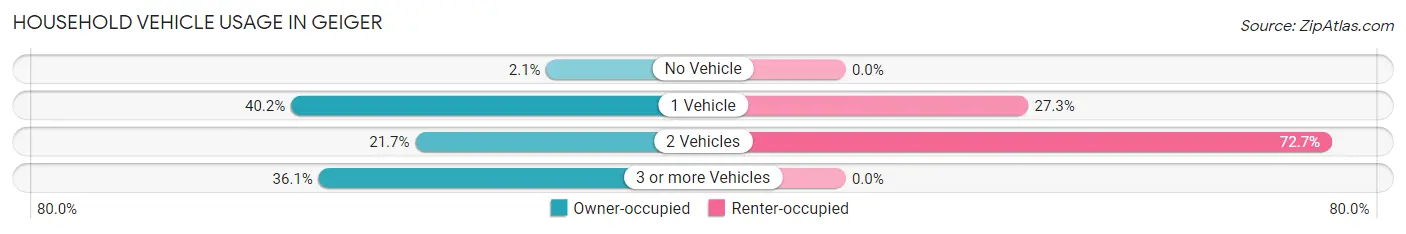
| Vehicles per Household | Owner-occupied | Renter-occupied |
| No Vehicle | 2 (2.1%) | 0 (0.0%) |
| 1 Vehicle | 39 (40.2%) | 3 (27.3%) |
| 2 Vehicles | 21 (21.6%) | 8 (72.7%) |
| 3 or more Vehicles | 35 (36.1%) | 0 (0.0%) |
| Total | 97 (100.0%) | 11 (100.0%) |
Real Estate & Mortgages in Geiger
Real Estate and Mortgage Overview in Geiger
| Characteristic | Without Mortgage | With Mortgage |
| Housing Units | 81 | 16 |
| Median Property Value | - | - |
| Median Household Income | $33,950 | $2 |
| Monthly Housing Costs | $445 | $0 |
| Real Estate Taxes | $334 | $7 |
Property Value by Mortgage Status in Geiger
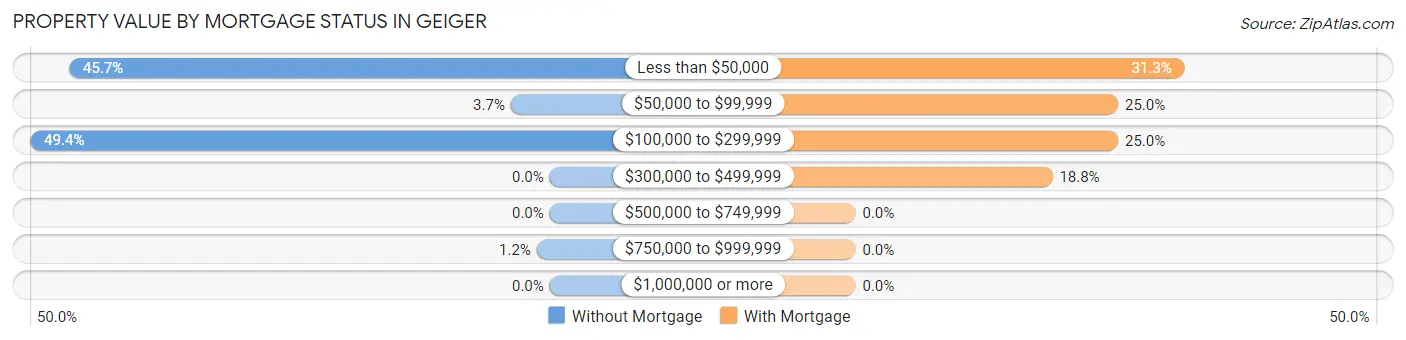
| Property Value | Without Mortgage | With Mortgage |
| Less than $50,000 | 37 (45.7%) | 5 (31.2%) |
| $50,000 to $99,999 | 3 (3.7%) | 4 (25.0%) |
| $100,000 to $299,999 | 40 (49.4%) | 4 (25.0%) |
| $300,000 to $499,999 | 0 (0.0%) | 3 (18.8%) |
| $500,000 to $749,999 | 0 (0.0%) | 0 (0.0%) |
| $750,000 to $999,999 | 1 (1.2%) | 0 (0.0%) |
| $1,000,000 or more | 0 (0.0%) | 0 (0.0%) |
| Total | 81 (100.0%) | 16 (100.0%) |
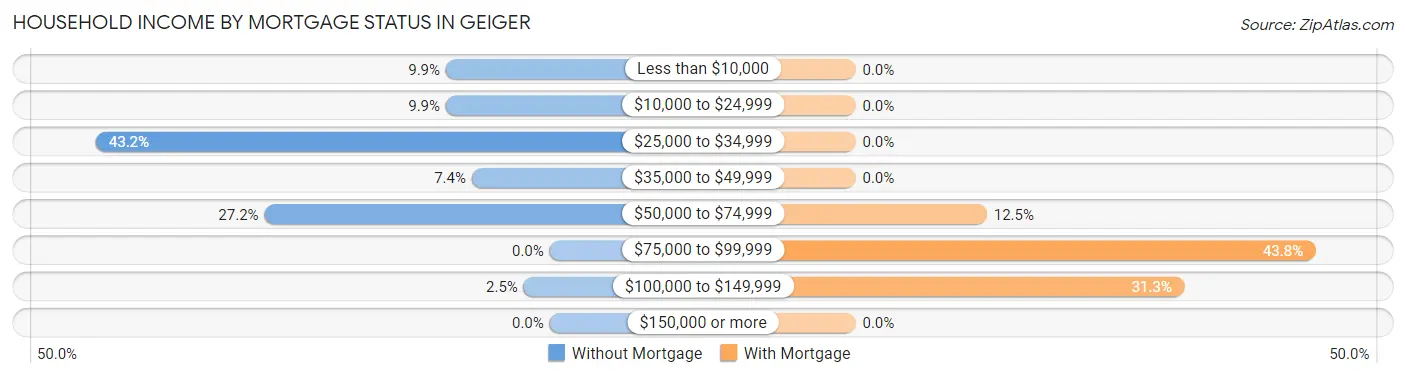
Household Income by Mortgage Status in Geiger
| Household Income | Without Mortgage | With Mortgage |
| Less than $10,000 | 8 (9.9%) | 0 (0.0%) |
| $10,000 to $24,999 | 8 (9.9%) | 0 (0.0%) |
| $25,000 to $34,999 | 35 (43.2%) | 0 (0.0%) |
| $35,000 to $49,999 | 6 (7.4%) | 0 (0.0%) |
| $50,000 to $74,999 | 22 (27.2%) | 2 (12.5%) |
| $75,000 to $99,999 | 0 (0.0%) | 7 (43.8%) |
| $100,000 to $149,999 | 2 (2.5%) | 5 (31.2%) |
| $150,000 or more | 0 (0.0%) | 0 (0.0%) |
| Total | 81 (100.0%) | 16 (100.0%) |
Property Value to Household Income Ratio in Geiger
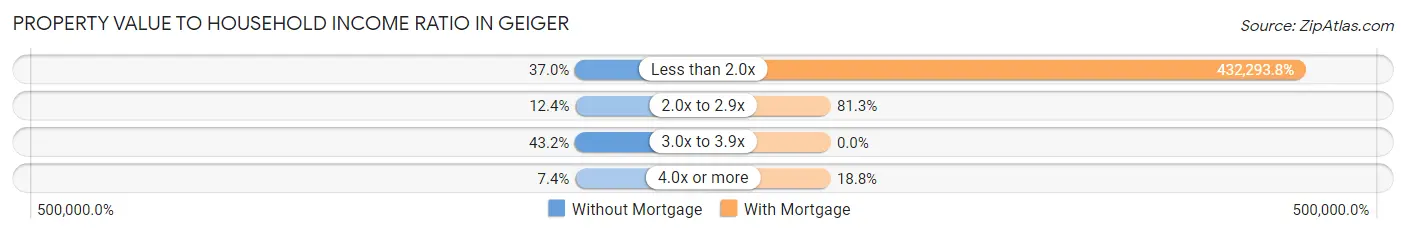
| Value-to-Income Ratio | Without Mortgage | With Mortgage |
| Less than 2.0x | 30 (37.0%) | 69,167 (432,293.8%) |
| 2.0x to 2.9x | 10 (12.3%) | 13 (81.2%) |
| 3.0x to 3.9x | 35 (43.2%) | 0 (0.0%) |
| 4.0x or more | 6 (7.4%) | 3 (18.8%) |
| Total | 81 (100.0%) | 16 (100.0%) |
Real Estate Taxes by Mortgage Status in Geiger
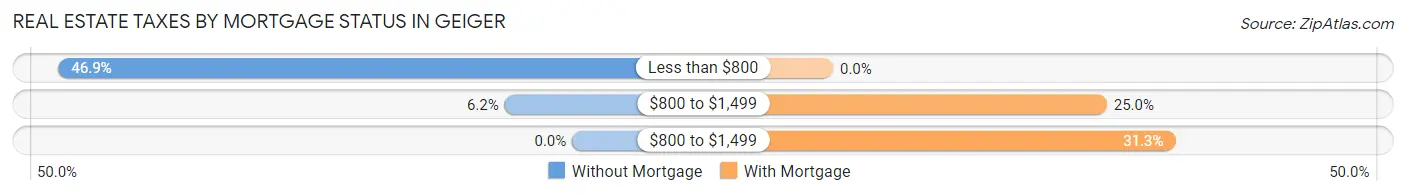
| Property Taxes | Without Mortgage | With Mortgage |
| Less than $800 | 38 (46.9%) | 0 (0.0%) |
| $800 to $1,499 | 5 (6.2%) | 4 (25.0%) |
| $800 to $1,499 | 0 (0.0%) | 5 (31.2%) |
| Total | 81 (100.0%) | 16 (100.0%) |
Health & Disability in Geiger
Health Insurance Coverage by Age in Geiger
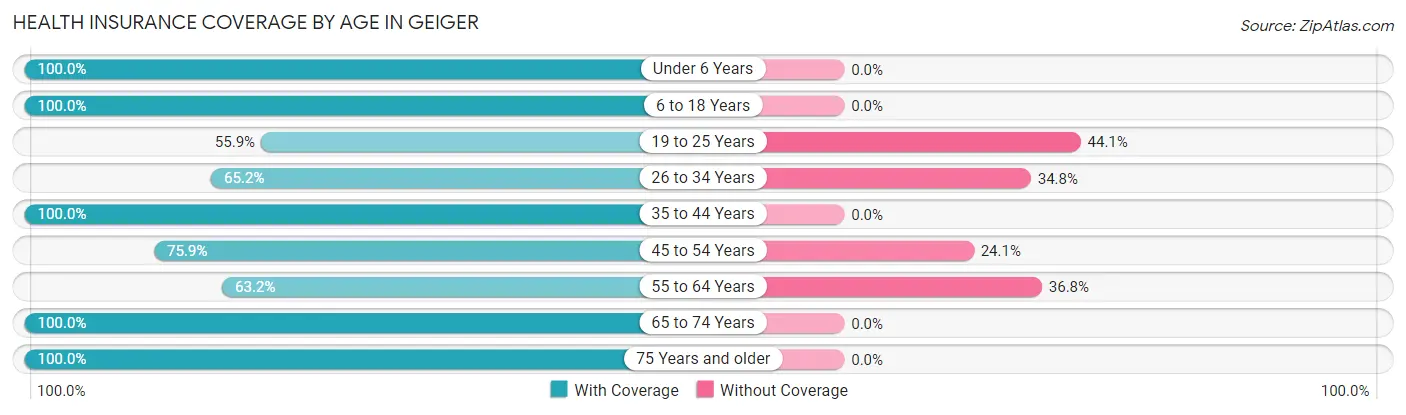
| Age Bracket | With Coverage | Without Coverage |
| Under 6 Years | 15 (100.0%) | 0 (0.0%) |
| 6 to 18 Years | 16 (100.0%) | 0 (0.0%) |
| 19 to 25 Years | 33 (55.9%) | 26 (44.1%) |
| 26 to 34 Years | 15 (65.2%) | 8 (34.8%) |
| 35 to 44 Years | 5 (100.0%) | 0 (0.0%) |
| 45 to 54 Years | 22 (75.9%) | 7 (24.1%) |
| 55 to 64 Years | 12 (63.2%) | 7 (36.8%) |
| 65 to 74 Years | 39 (100.0%) | 0 (0.0%) |
| 75 Years and older | 78 (100.0%) | 0 (0.0%) |
| Total | 235 (83.0%) | 48 (17.0%) |
Health Insurance Coverage by Citizenship Status in Geiger
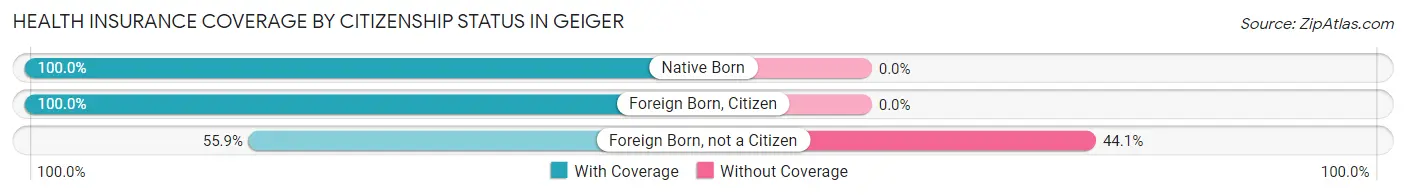
| Citizenship Status | With Coverage | Without Coverage |
| Native Born | 15 (100.0%) | 0 (0.0%) |
| Foreign Born, Citizen | 16 (100.0%) | 0 (0.0%) |
| Foreign Born, not a Citizen | 33 (55.9%) | 26 (44.1%) |
Health Insurance Coverage by Household Income in Geiger
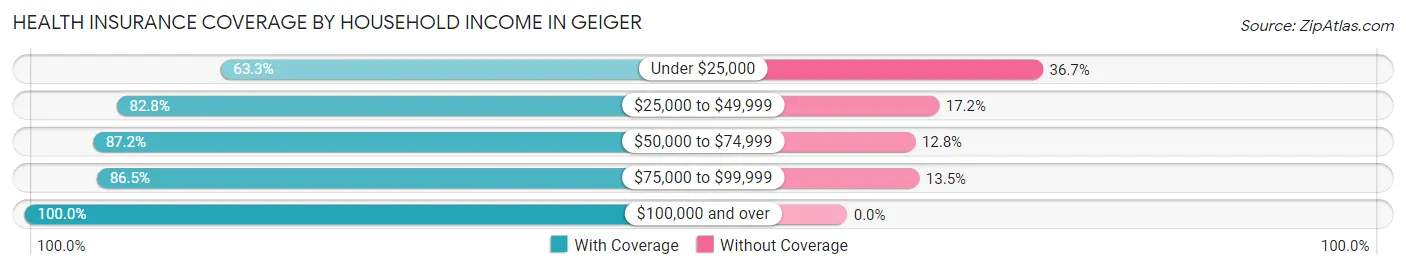
| Household Income | With Coverage | Without Coverage |
| Under $25,000 | 19 (63.3%) | 11 (36.7%) |
| $25,000 to $49,999 | 96 (82.8%) | 20 (17.2%) |
| $50,000 to $74,999 | 82 (87.2%) | 12 (12.8%) |
| $75,000 to $99,999 | 32 (86.5%) | 5 (13.5%) |
| $100,000 and over | 6 (100.0%) | 0 (0.0%) |
Public vs Private Health Insurance Coverage by Age in Geiger
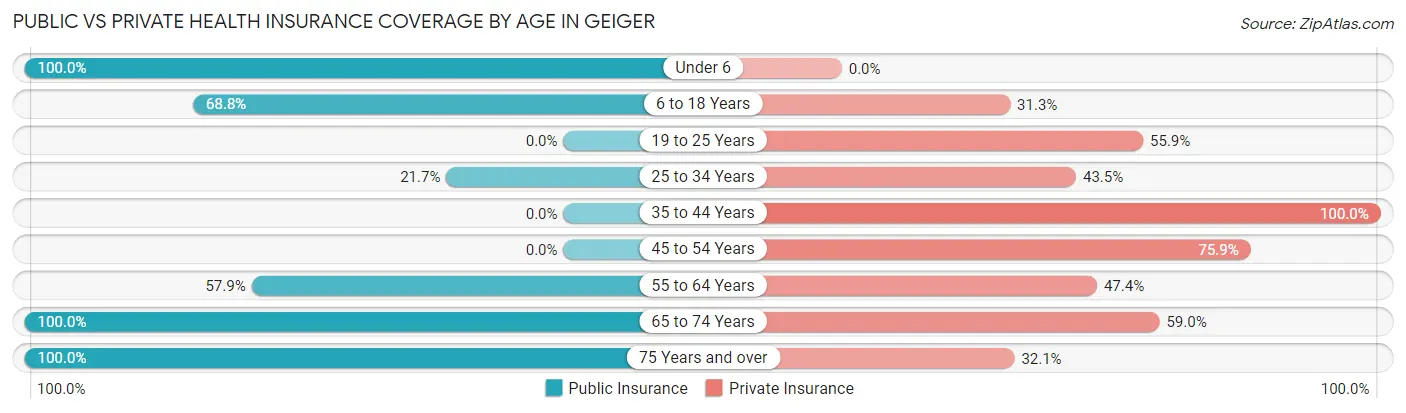
| Age Bracket | Public Insurance | Private Insurance |
| Under 6 | 15 (100.0%) | 0 (0.0%) |
| 6 to 18 Years | 11 (68.8%) | 5 (31.2%) |
| 19 to 25 Years | 0 (0.0%) | 33 (55.9%) |
| 25 to 34 Years | 5 (21.7%) | 10 (43.5%) |
| 35 to 44 Years | 0 (0.0%) | 5 (100.0%) |
| 45 to 54 Years | 0 (0.0%) | 22 (75.9%) |
| 55 to 64 Years | 11 (57.9%) | 9 (47.4%) |
| 65 to 74 Years | 39 (100.0%) | 23 (59.0%) |
| 75 Years and over | 78 (100.0%) | 25 (32.1%) |
| Total | 159 (56.2%) | 132 (46.6%) |
Disability Status by Sex by Age in Geiger
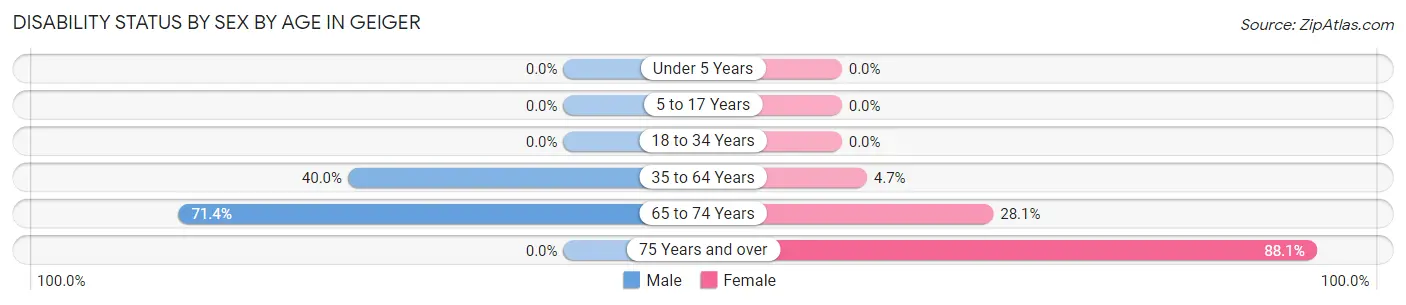
| Age Bracket | Male | Female |
| Under 5 Years | 0 (0.0%) | 0 (0.0%) |
| 5 to 17 Years | 0 (0.0%) | 0 (0.0%) |
| 18 to 34 Years | 0 (0.0%) | 0 (0.0%) |
| 35 to 64 Years | 4 (40.0%) | 2 (4.6%) |
| 65 to 74 Years | 5 (71.4%) | 9 (28.1%) |
| 75 Years and over | 0 (0.0%) | 37 (88.1%) |
Disability Class by Sex by Age in Geiger
Disability Class: Hearing Difficulty
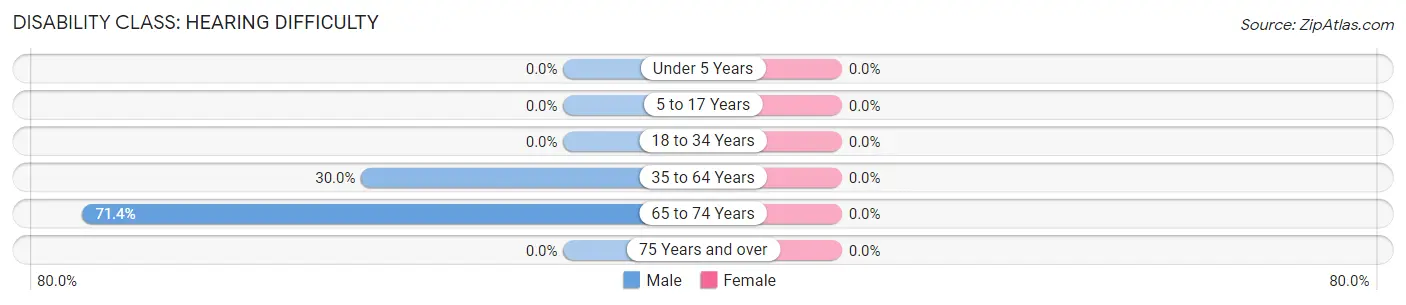
| Age Bracket | Male | Female |
| Under 5 Years | 0 (0.0%) | 0 (0.0%) |
| 5 to 17 Years | 0 (0.0%) | 0 (0.0%) |
| 18 to 34 Years | 0 (0.0%) | 0 (0.0%) |
| 35 to 64 Years | 3 (30.0%) | 0 (0.0%) |
| 65 to 74 Years | 5 (71.4%) | 0 (0.0%) |
| 75 Years and over | 0 (0.0%) | 0 (0.0%) |
Disability Class: Vision Difficulty
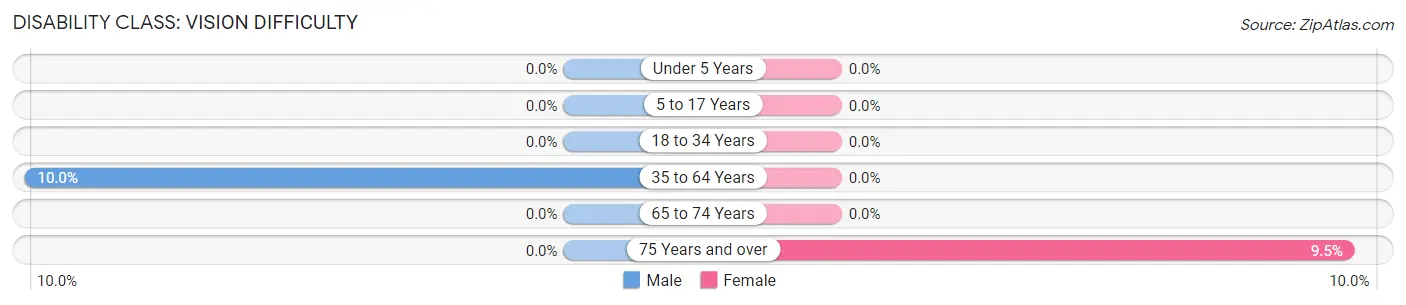
| Age Bracket | Male | Female |
| Under 5 Years | 0 (0.0%) | 0 (0.0%) |
| 5 to 17 Years | 0 (0.0%) | 0 (0.0%) |
| 18 to 34 Years | 0 (0.0%) | 0 (0.0%) |
| 35 to 64 Years | 1 (10.0%) | 0 (0.0%) |
| 65 to 74 Years | 0 (0.0%) | 0 (0.0%) |
| 75 Years and over | 0 (0.0%) | 4 (9.5%) |
Disability Class: Cognitive Difficulty
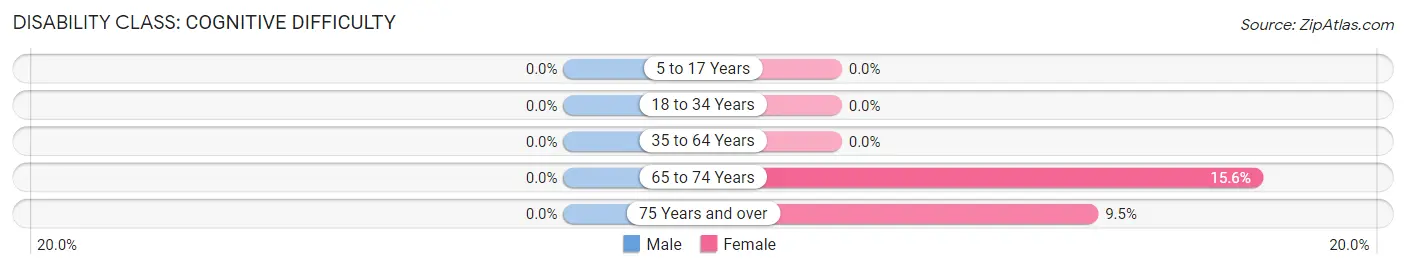
| Age Bracket | Male | Female |
| 5 to 17 Years | 0 (0.0%) | 0 (0.0%) |
| 18 to 34 Years | 0 (0.0%) | 0 (0.0%) |
| 35 to 64 Years | 0 (0.0%) | 0 (0.0%) |
| 65 to 74 Years | 0 (0.0%) | 5 (15.6%) |
| 75 Years and over | 0 (0.0%) | 4 (9.5%) |
Disability Class: Ambulatory Difficulty
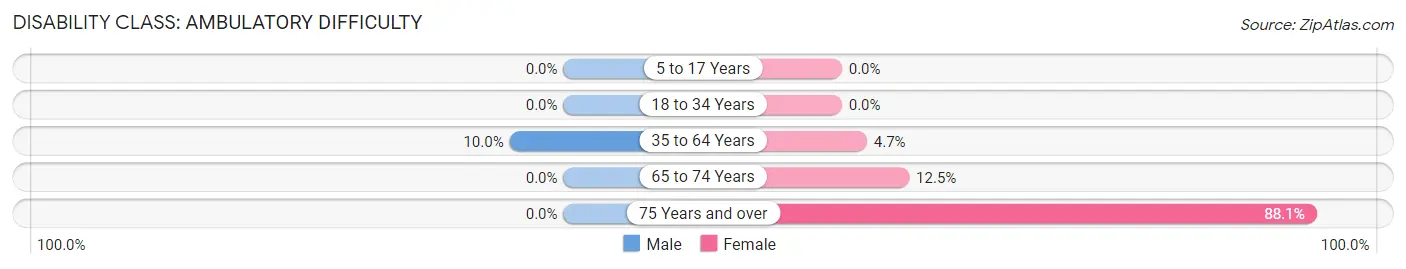
| Age Bracket | Male | Female |
| 5 to 17 Years | 0 (0.0%) | 0 (0.0%) |
| 18 to 34 Years | 0 (0.0%) | 0 (0.0%) |
| 35 to 64 Years | 1 (10.0%) | 2 (4.6%) |
| 65 to 74 Years | 0 (0.0%) | 4 (12.5%) |
| 75 Years and over | 0 (0.0%) | 37 (88.1%) |
Disability Class: Self-Care Difficulty
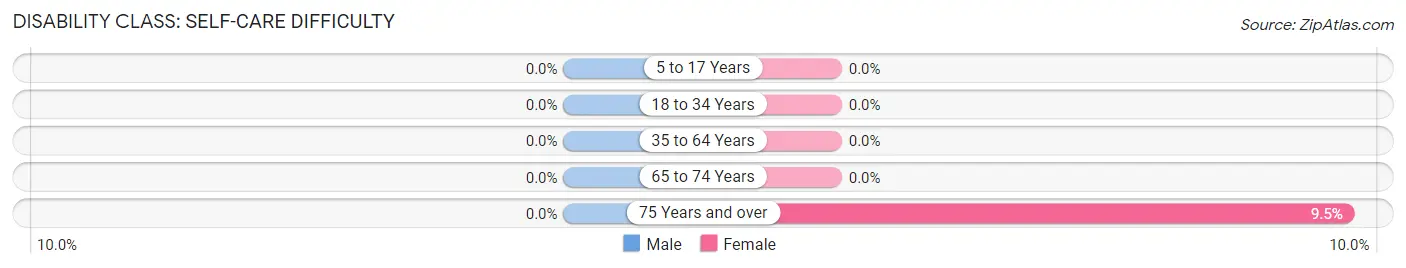
| Age Bracket | Male | Female |
| 5 to 17 Years | 0 (0.0%) | 0 (0.0%) |
| 18 to 34 Years | 0 (0.0%) | 0 (0.0%) |
| 35 to 64 Years | 0 (0.0%) | 0 (0.0%) |
| 65 to 74 Years | 0 (0.0%) | 0 (0.0%) |
| 75 Years and over | 0 (0.0%) | 4 (9.5%) |
Technology Access in Geiger
Computing Device Access in Geiger
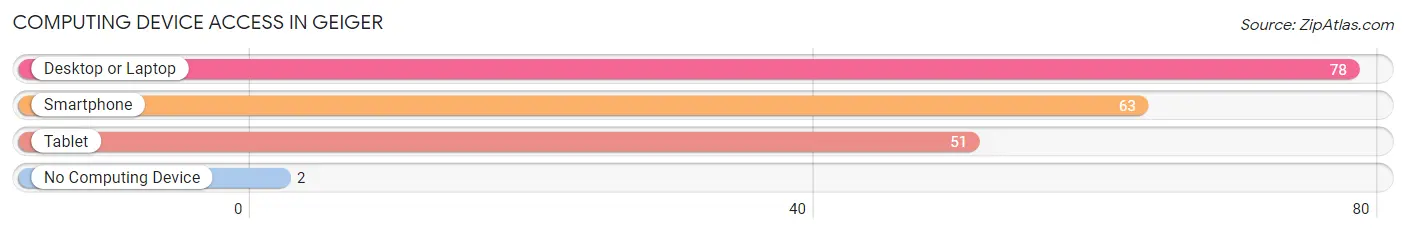
| Device Type | # Households | % Households |
| Desktop or Laptop | 78 | 72.2% |
| Smartphone | 63 | 58.3% |
| Tablet | 51 | 47.2% |
| No Computing Device | 2 | 1.8% |
| Total | 108 | 100.0% |
Internet Access in Geiger
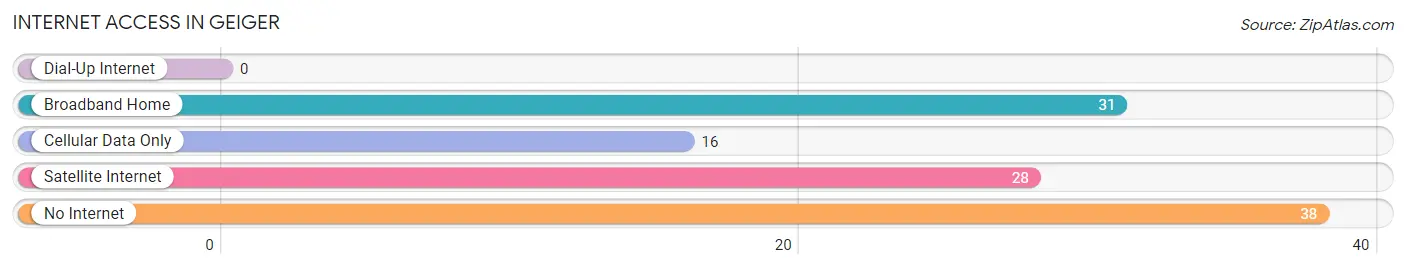
| Internet Type | # Households | % Households |
| Dial-Up Internet | 0 | 0.0% |
| Broadband Home | 31 | 28.7% |
| Cellular Data Only | 16 | 14.8% |
| Satellite Internet | 28 | 25.9% |
| No Internet | 38 | 35.2% |
| Total | 108 | 100.0% |
Geiger Summary
Geiger is a small town located in the northwest corner of Alabama, in the county of Colbert. It is situated on the banks of the Tennessee River, and is home to a population of just over 1,000 people. Geiger is a rural community, with a strong agricultural base, and is known for its scenic beauty and outdoor recreation opportunities.
Geography
Geiger is located in the northwest corner of Alabama, in the county of Colbert. It is situated on the banks of the Tennessee River, and is bordered by the states of Tennessee and Mississippi. The town is located in the foothills of the Appalachian Mountains, and is surrounded by rolling hills and lush forests. The climate in Geiger is mild, with hot summers and cool winters.
Economy
Geiger’s economy is largely based on agriculture. The town is home to several farms, which produce a variety of crops, including corn, soybeans, cotton, and hay. The town also has a thriving timber industry, with several sawmills located in the area. In addition, Geiger is home to several small businesses, including restaurants, convenience stores, and auto repair shops.
Demographics
As of the 2010 census, Geiger had a population of 1,072 people. The racial makeup of the town was 95.3% White, 1.2% African American, 0.3% Native American, 0.2% Asian, 0.1% Pacific Islander, and 2.9% from other races. The median household income in Geiger was $30,938, and the median age was 41.7 years.
History
Geiger was first settled in the early 1800s by settlers from Tennessee and Mississippi. The town was originally known as “Geiger’s Crossroads”, and was named after the local postmaster, John Geiger. The town was officially incorporated in 1887, and the first post office was established in 1888. In the early 1900s, the town experienced a period of growth, as the timber industry began to flourish. The town also became a popular destination for tourists, who came to enjoy the scenic beauty of the area.
Today, Geiger is a small, rural community, with a strong agricultural base. The town is known for its scenic beauty and outdoor recreation opportunities, and is a popular destination for tourists and outdoor enthusiasts. Geiger is also home to several small businesses, which provide employment opportunities for the local population.
Common Questions
What is Per Capita Income in Geiger?
Per Capita income in Geiger is $17,642.
What is the Median Family Income in Geiger?
Median Family Income in Geiger is $44,375.
What is the Median Household income in Geiger?
Median Household Income in Geiger is $40,000.
What is Income or Wage Gap in Geiger?
Income or Wage Gap in Geiger is 55.8%.
Women in Geiger earn 44.2 cents for every dollar earned by a man.
What is Inequality or Gini Index in Geiger?
Inequality or Gini Index in Geiger is 0.28.
What is the Total Population of Geiger?
Total Population of Geiger is 286.
What is the Total Male Population of Geiger?
Total Male Population of Geiger is 122.
What is the Total Female Population of Geiger?
Total Female Population of Geiger is 164.
What is the Ratio of Males per 100 Females in Geiger?
There are 74.39 Males per 100 Females in Geiger.
What is the Ratio of Females per 100 Males in Geiger?
There are 134.43 Females per 100 Males in Geiger.
What is the Median Population Age in Geiger?
Median Population Age in Geiger is 51.7 Years.
What is the Average Family Size in Geiger
Average Family Size in Geiger is 3.0 People.
What is the Average Household Size in Geiger
Average Household Size in Geiger is 2.6 People.
How Large is the Labor Force in Geiger?
There are 119 People in the Labor Forcein in Geiger.
What is the Percentage of People in the Labor Force in Geiger?
45.8% of People are in the Labor Force in Geiger.
What is the Unemployment Rate in Geiger?
Unemployment Rate in Geiger is 14.7%.