Fort Deposit, AL Map & Demographics
Fort Deposit Map
Fort Deposit Overview
$15,694
PER CAPITA INCOME
$32,609
AVG FAMILY INCOME
$20,542
AVG HOUSEHOLD INCOME
31.2%
WAGE / INCOME GAP [ % ]
68.8¢/ $1
WAGE / INCOME GAP [ $ ]
0.50
INEQUALITY / GINI INDEX
1,734
TOTAL POPULATION
865
MALE POPULATION
869
FEMALE POPULATION
99.54
MALES / 100 FEMALES
100.46
FEMALES / 100 MALES
34.3
MEDIAN AGE
3.7
AVG FAMILY SIZE
2.8
AVG HOUSEHOLD SIZE
595
LABOR FORCE [ PEOPLE ]
44.5%
PERCENT IN LABOR FORCE
22.6%
UNEMPLOYMENT RATE
Fort Deposit Zip Codes
Fort Deposit Area Codes
Income in Fort Deposit
Income Overview in Fort Deposit
Per Capita Income in Fort Deposit is $15,694, while median incomes of families and households are $32,609 and $20,542 respectively.
| Characteristic | Number | Measure |
| Per Capita Income | 1,734 | $15,694 |
| Median Family Income | 380 | $32,609 |
| Mean Family Income | 380 | $51,046 |
| Median Household Income | 611 | $20,542 |
| Mean Household Income | 611 | $40,600 |
| Income Deficit | 380 | $0 |
| Wage / Income Gap (%) | 1,734 | 31.24% |
| Wage / Income Gap ($) | 1,734 | 68.76¢ per $1 |
| Gini / Inequality Index | 1,734 | 0.50 |
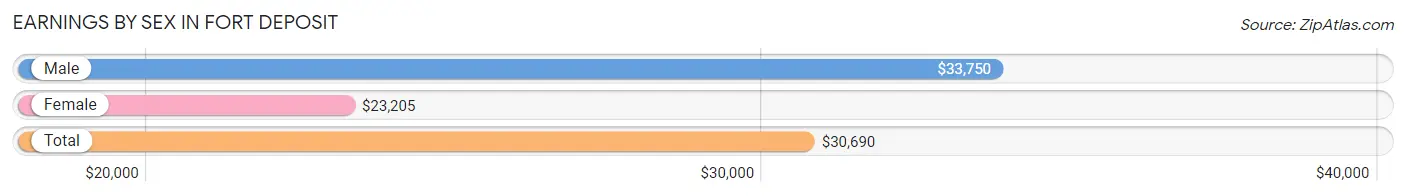
Earnings by Sex in Fort Deposit
Average Earnings in Fort Deposit are $30,690, $33,750 for men and $23,205 for women, a difference of 31.2%.
| Sex | Number | Average Earnings |
| Male | 356 (60.5%) | $33,750 |
| Female | 232 (39.5%) | $23,205 |
| Total | 588 (100.0%) | $30,690 |
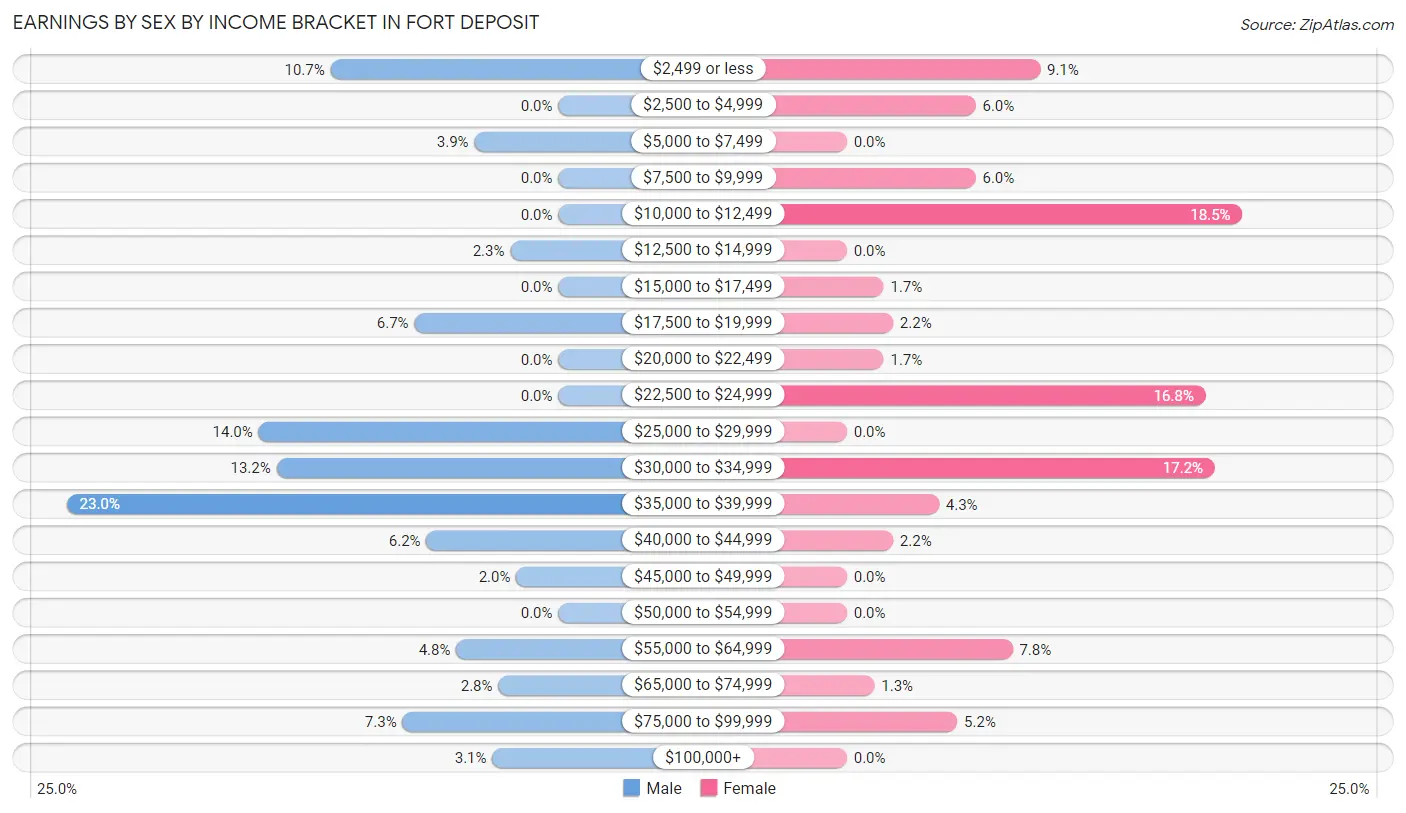
Earnings by Sex by Income Bracket in Fort Deposit
The most common earnings brackets in Fort Deposit are $35,000 to $39,999 for men (82 | 23.0%) and $10,000 to $12,499 for women (43 | 18.5%).
| Income | Male | Female |
| $2,499 or less | 38 (10.7%) | 21 (9.0%) |
| $2,500 to $4,999 | 0 (0.0%) | 14 (6.0%) |
| $5,000 to $7,499 | 14 (3.9%) | 0 (0.0%) |
| $7,500 to $9,999 | 0 (0.0%) | 14 (6.0%) |
| $10,000 to $12,499 | 0 (0.0%) | 43 (18.5%) |
| $12,500 to $14,999 | 8 (2.2%) | 0 (0.0%) |
| $15,000 to $17,499 | 0 (0.0%) | 4 (1.7%) |
| $17,500 to $19,999 | 24 (6.7%) | 5 (2.2%) |
| $20,000 to $22,499 | 0 (0.0%) | 4 (1.7%) |
| $22,500 to $24,999 | 0 (0.0%) | 39 (16.8%) |
| $25,000 to $29,999 | 50 (14.0%) | 0 (0.0%) |
| $30,000 to $34,999 | 47 (13.2%) | 40 (17.2%) |
| $35,000 to $39,999 | 82 (23.0%) | 10 (4.3%) |
| $40,000 to $44,999 | 22 (6.2%) | 5 (2.2%) |
| $45,000 to $49,999 | 7 (2.0%) | 0 (0.0%) |
| $50,000 to $54,999 | 0 (0.0%) | 0 (0.0%) |
| $55,000 to $64,999 | 17 (4.8%) | 18 (7.8%) |
| $65,000 to $74,999 | 10 (2.8%) | 3 (1.3%) |
| $75,000 to $99,999 | 26 (7.3%) | 12 (5.2%) |
| $100,000+ | 11 (3.1%) | 0 (0.0%) |
| Total | 356 (100.0%) | 232 (100.0%) |
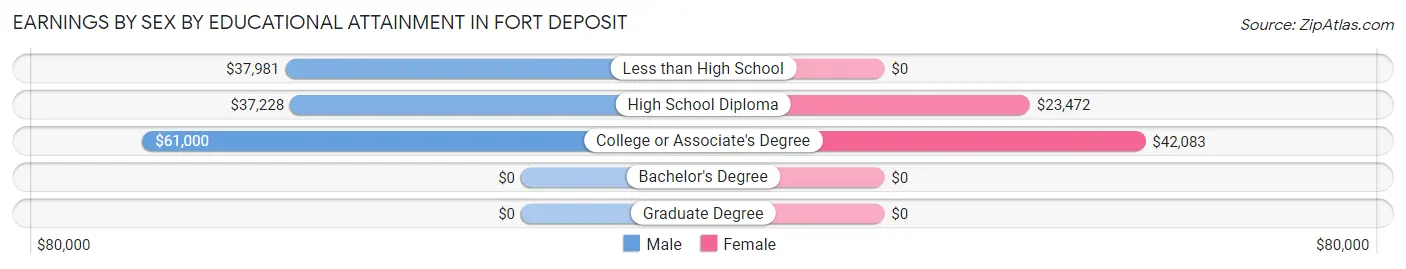
Earnings by Sex by Educational Attainment in Fort Deposit
Average earnings in Fort Deposit are $38,220 for men and $30,074 for women, a difference of 21.3%. Men with an educational attainment of college or associate's degree enjoy the highest average annual earnings of $61,000, while those with high school diploma education earn the least with $37,228. Women with an educational attainment of college or associate's degree earn the most with the average annual earnings of $42,083, while those with high school diploma education have the smallest earnings of $23,472.
| Educational Attainment | Male Income | Female Income |
| Less than High School | $37,981 | $0 |
| High School Diploma | $37,228 | $23,472 |
| College or Associate's Degree | $61,000 | $42,083 |
| Bachelor's Degree | - | - |
| Graduate Degree | - | - |
| Total | $38,220 | $30,074 |
Family Income in Fort Deposit
Family Income Brackets in Fort Deposit
According to the Fort Deposit family income data, there are 105 families falling into the $75,000 to $99,999 income range, which is the most common income bracket and makes up 27.6% of all families. Conversely, the $200,000+ income bracket is the least frequent group with only 7 families (1.8%) belonging to this category.
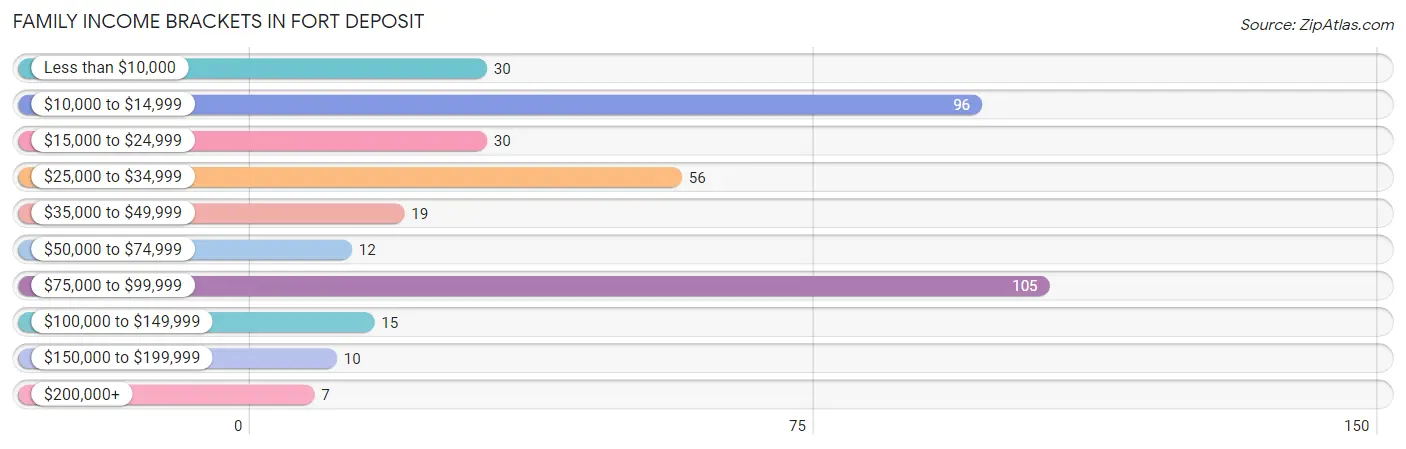
| Income Bracket | # Families | % Families |
| Less than $10,000 | 30 | 7.9% |
| $10,000 to $14,999 | 96 | 25.3% |
| $15,000 to $24,999 | 30 | 7.9% |
| $25,000 to $34,999 | 56 | 14.7% |
| $35,000 to $49,999 | 19 | 5.0% |
| $50,000 to $74,999 | 12 | 3.2% |
| $75,000 to $99,999 | 105 | 27.6% |
| $100,000 to $149,999 | 15 | 3.9% |
| $150,000 to $199,999 | 10 | 2.6% |
| $200,000+ | 7 | 1.8% |
Family Income by Famaliy Size in Fort Deposit
4-person families (91 | 23.9%) account for the highest median family income in Fort Deposit with $86,065 per family, while 4-person families (91 | 23.9%) have the highest median income of $21,516 per family member.
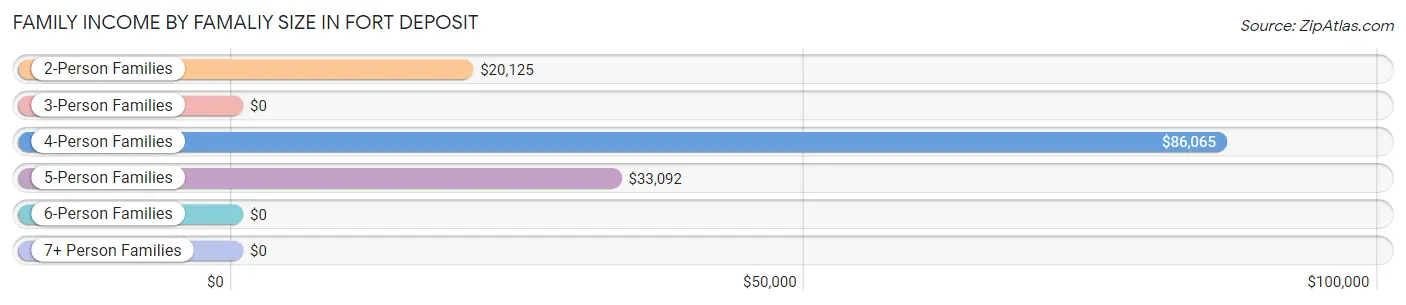
| Income Bracket | # Families | Median Income |
| 2-Person Families | 166 (43.7%) | $20,125 |
| 3-Person Families | 61 (16.1%) | $0 |
| 4-Person Families | 91 (23.9%) | $86,065 |
| 5-Person Families | 41 (10.8%) | $33,092 |
| 6-Person Families | 11 (2.9%) | $0 |
| 7+ Person Families | 10 (2.6%) | $0 |
| Total | 380 (100.0%) | $32,609 |
Family Income by Number of Earners in Fort Deposit
The median family income in Fort Deposit is $32,609, with families comprising 3+ earners (36) having the highest median family income of $87,045, while families with no earners (159) have the lowest median family income of $12,210, accounting for 9.5% and 41.8% of families, respectively.
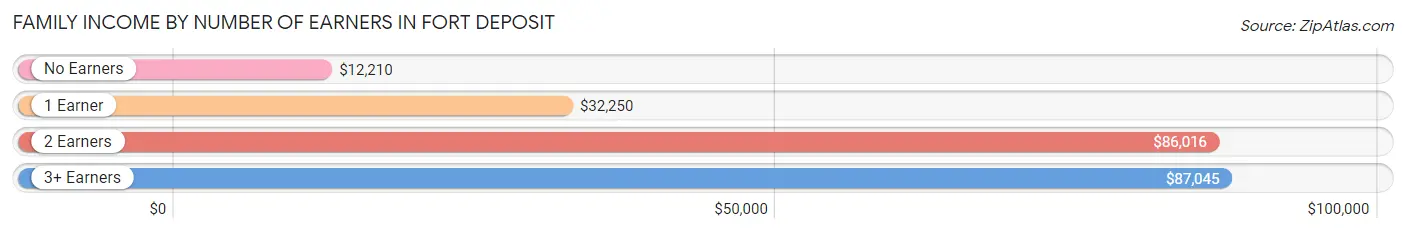
| Number of Earners | # Families | Median Income |
| No Earners | 159 (41.8%) | $12,210 |
| 1 Earner | 76 (20.0%) | $32,250 |
| 2 Earners | 109 (28.7%) | $86,016 |
| 3+ Earners | 36 (9.5%) | $87,045 |
| Total | 380 (100.0%) | $32,609 |
Household Income in Fort Deposit
Household Income Brackets in Fort Deposit
With 235 households falling in the category, the $10,000 to $14,999 income range is the most frequent in Fort Deposit, accounting for 38.5% of all households. In contrast, only 7 households (1.1%) fall into the $200,000+ income bracket, making it the least populous group.
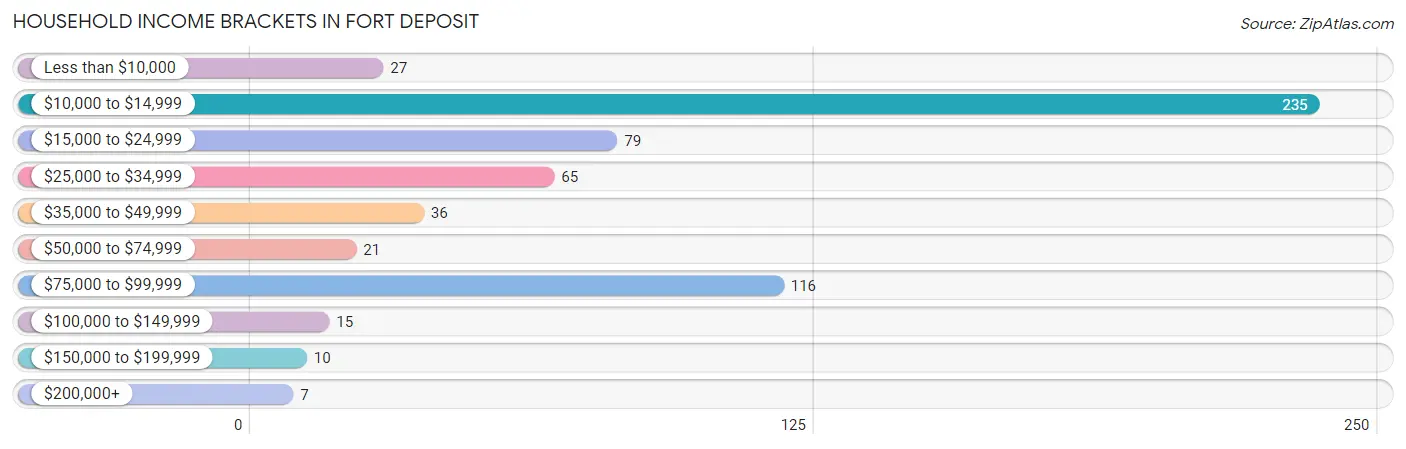
| Income Bracket | # Households | % Households |
| Less than $10,000 | 27 | 4.4% |
| $10,000 to $14,999 | 235 | 38.5% |
| $15,000 to $24,999 | 79 | 12.9% |
| $25,000 to $34,999 | 65 | 10.6% |
| $35,000 to $49,999 | 36 | 5.9% |
| $50,000 to $74,999 | 21 | 3.4% |
| $75,000 to $99,999 | 116 | 19.0% |
| $100,000 to $149,999 | 15 | 2.5% |
| $150,000 to $199,999 | 10 | 1.6% |
| $200,000+ | 7 | 1.1% |
Household Income by Householder Age in Fort Deposit
The median household income in Fort Deposit is $20,542, with the highest median household income of $16,750 found in the 65+ years age bracket for the primary householder. A total of 203 households (33.2%) fall into this category. Meanwhile, the 15 to 24 years age bracket for the primary householder has the lowest median household income of $0, with 23 households (3.8%) in this group.
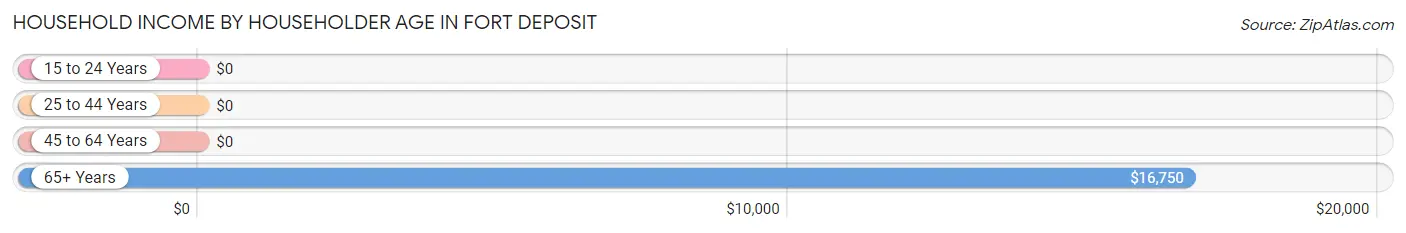
| Income Bracket | # Households | Median Income |
| 15 to 24 Years | 23 (3.8%) | $0 |
| 25 to 44 Years | 153 (25.0%) | $0 |
| 45 to 64 Years | 232 (38.0%) | $0 |
| 65+ Years | 203 (33.2%) | $16,750 |
| Total | 611 (100.0%) | $20,542 |
Poverty in Fort Deposit
Income Below Poverty by Sex and Age in Fort Deposit
With 32.5% poverty level for males and 54.9% for females among the residents of Fort Deposit, 12 to 14 year old males and 5 year old females are the most vulnerable to poverty, with 45 males (100.0%) and 26 females (100.0%) in their respective age groups living below the poverty level.
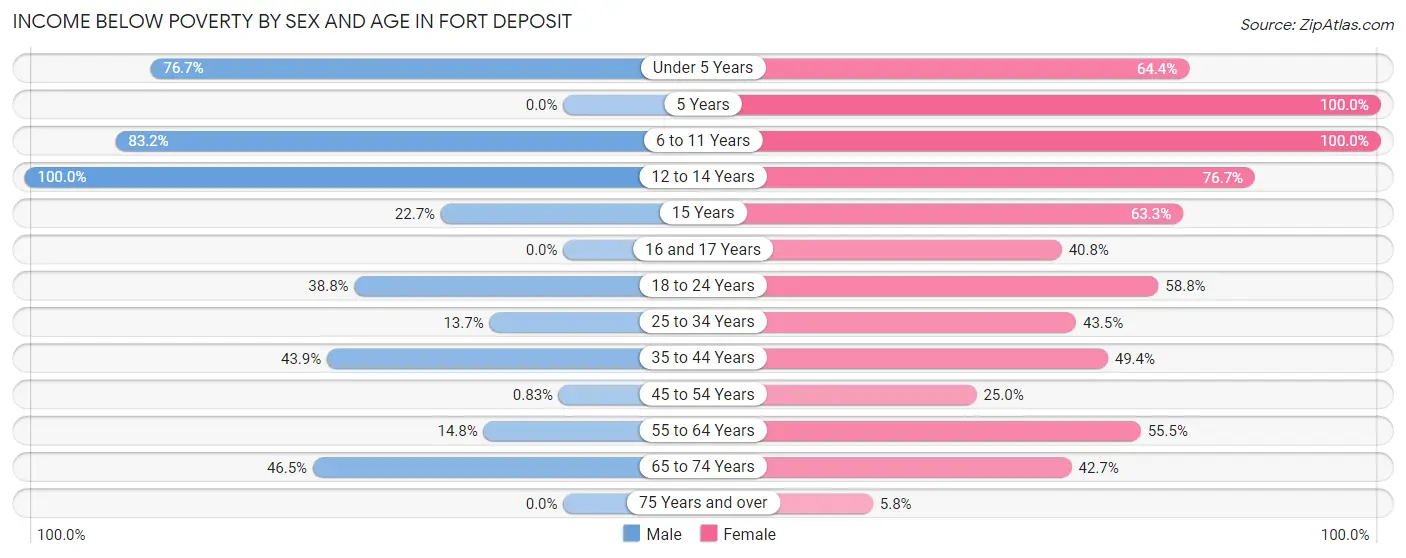
| Age Bracket | Male | Female |
| Under 5 Years | 23 (76.7%) | 29 (64.4%) |
| 5 Years | 0 (0.0%) | 26 (100.0%) |
| 6 to 11 Years | 74 (83.2%) | 77 (100.0%) |
| 12 to 14 Years | 45 (100.0%) | 23 (76.7%) |
| 15 Years | 5 (22.7%) | 19 (63.3%) |
| 16 and 17 Years | 0 (0.0%) | 20 (40.8%) |
| 18 to 24 Years | 38 (38.8%) | 67 (58.8%) |
| 25 to 34 Years | 24 (13.7%) | 40 (43.5%) |
| 35 to 44 Years | 25 (43.9%) | 40 (49.4%) |
| 45 to 54 Years | 1 (0.8%) | 8 (25.0%) |
| 55 to 64 Years | 12 (14.8%) | 96 (55.5%) |
| 65 to 74 Years | 33 (46.5%) | 29 (42.6%) |
| 75 Years and over | 0 (0.0%) | 3 (5.8%) |
| Total | 280 (32.5%) | 477 (54.9%) |
Income Above Poverty by Sex and Age in Fort Deposit
According to the poverty statistics in Fort Deposit, males aged 16 and 17 years and females aged 75 years and over are the age groups that are most secure financially, with 100.0% of males and 94.2% of females in these age groups living above the poverty line.
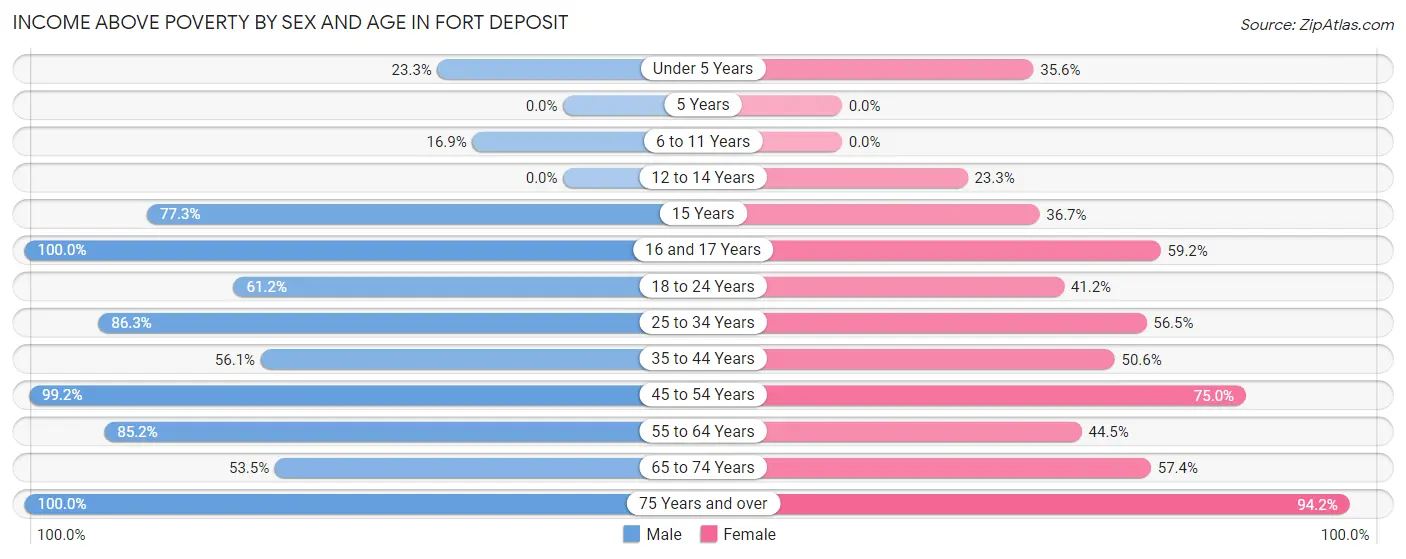
| Age Bracket | Male | Female |
| Under 5 Years | 7 (23.3%) | 16 (35.6%) |
| 5 Years | 0 (0.0%) | 0 (0.0%) |
| 6 to 11 Years | 15 (16.9%) | 0 (0.0%) |
| 12 to 14 Years | 0 (0.0%) | 7 (23.3%) |
| 15 Years | 17 (77.3%) | 11 (36.7%) |
| 16 and 17 Years | 7 (100.0%) | 29 (59.2%) |
| 18 to 24 Years | 60 (61.2%) | 47 (41.2%) |
| 25 to 34 Years | 151 (86.3%) | 52 (56.5%) |
| 35 to 44 Years | 32 (56.1%) | 41 (50.6%) |
| 45 to 54 Years | 119 (99.2%) | 24 (75.0%) |
| 55 to 64 Years | 69 (85.2%) | 77 (44.5%) |
| 65 to 74 Years | 38 (53.5%) | 39 (57.4%) |
| 75 Years and over | 66 (100.0%) | 49 (94.2%) |
| Total | 581 (67.5%) | 392 (45.1%) |
Income Below Poverty Among Married-Couple Families in Fort Deposit
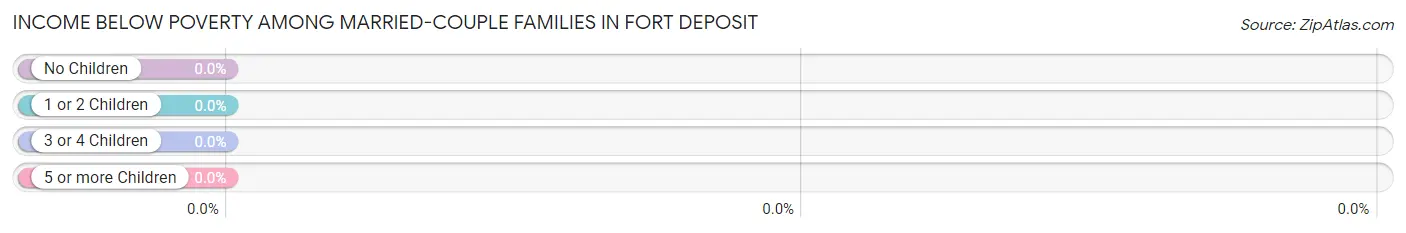
| Children | Above Poverty | Below Poverty |
| No Children | 97 (100.0%) | 0 (0.0%) |
| 1 or 2 Children | 62 (100.0%) | 0 (0.0%) |
| 3 or 4 Children | 0 (0.0%) | 0 (0.0%) |
| 5 or more Children | 0 (0.0%) | 0 (0.0%) |
| Total | 159 (100.0%) | 0 (0.0%) |
Income Below Poverty Among Single-Parent Households in Fort Deposit
According to the poverty data in Fort Deposit, 100.0% or 16 single-father households and 69.8% or 143 single-mother households are living below the poverty line. Among single-father households, those with 3 or 4 children have the highest poverty rate, with 16 households (100.0%) experiencing poverty. Likewise, among single-mother households, those with 3 or 4 children have the highest poverty rate, with 19 households (100.0%) falling below the poverty line.
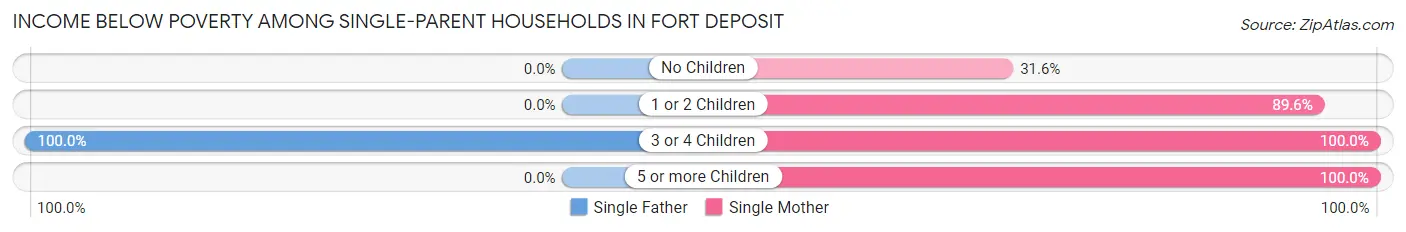
| Children | Single Father | Single Mother |
| No Children | 0 (0.0%) | 24 (31.6%) |
| 1 or 2 Children | 0 (0.0%) | 86 (89.6%) |
| 3 or 4 Children | 16 (100.0%) | 19 (100.0%) |
| 5 or more Children | 0 (0.0%) | 14 (100.0%) |
| Total | 16 (100.0%) | 143 (69.8%) |
Income Below Poverty Among Married-Couple vs Single-Parent Households in Fort Deposit
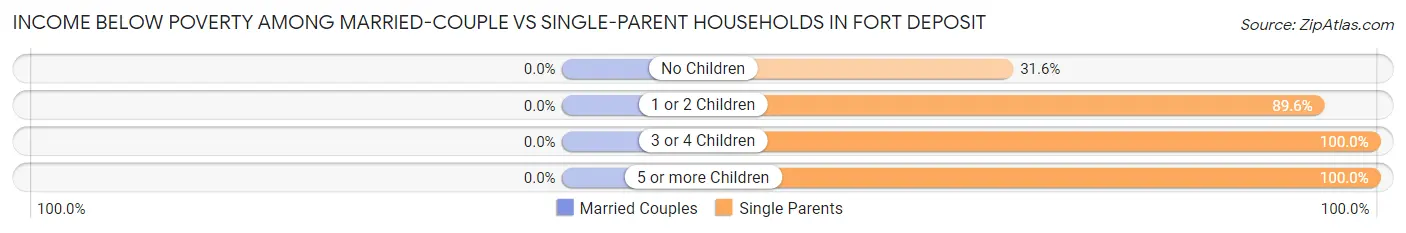
| Children | Married-Couple Families | Single-Parent Households |
| No Children | 0 (0.0%) | 24 (31.6%) |
| 1 or 2 Children | 0 (0.0%) | 86 (89.6%) |
| 3 or 4 Children | 0 (0.0%) | 35 (100.0%) |
| 5 or more Children | 0 (0.0%) | 14 (100.0%) |
| Total | 0 (0.0%) | 159 (72.0%) |
Race in Fort Deposit
The most populous races in Fort Deposit are Black / African American (1,497 | 86.3%), White / Caucasian (229 | 13.2%), and Two or more Races (8 | 0.5%).
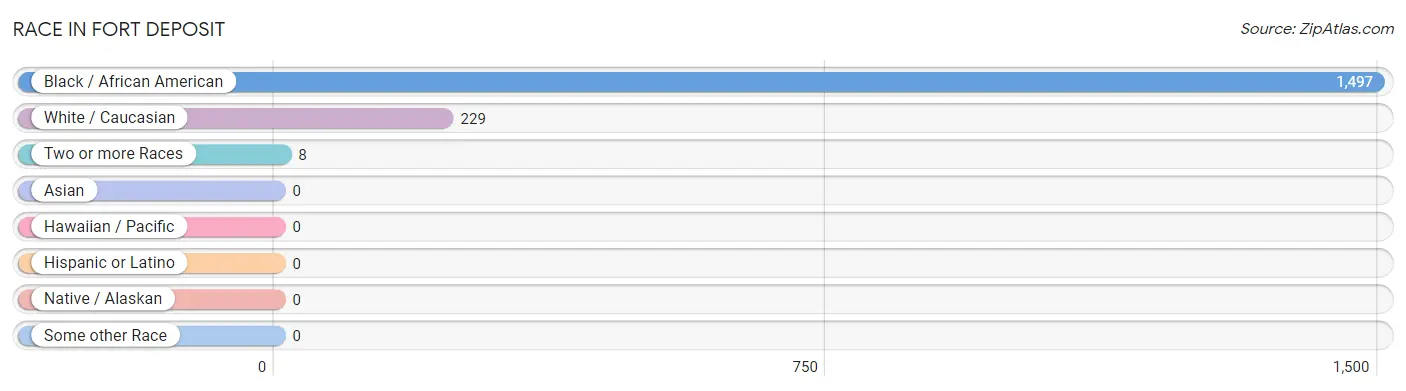
| Race | # Population | % Population |
| Asian | 0 | 0.0% |
| Black / African American | 1,497 | 86.3% |
| Hawaiian / Pacific | 0 | 0.0% |
| Hispanic or Latino | 0 | 0.0% |
| Native / Alaskan | 0 | 0.0% |
| White / Caucasian | 229 | 13.2% |
| Two or more Races | 8 | 0.5% |
| Some other Race | 0 | 0.0% |
| Total | 1,734 | 100.0% |
Ancestry in Fort Deposit
The most populous ancestries reported in Fort Deposit are American (505 | 29.1%), English (53 | 3.1%), German (45 | 2.6%), Arab (8 | 0.5%), and Israeli (8 | 0.5%), together accounting for 35.7% of all Fort Deposit residents.
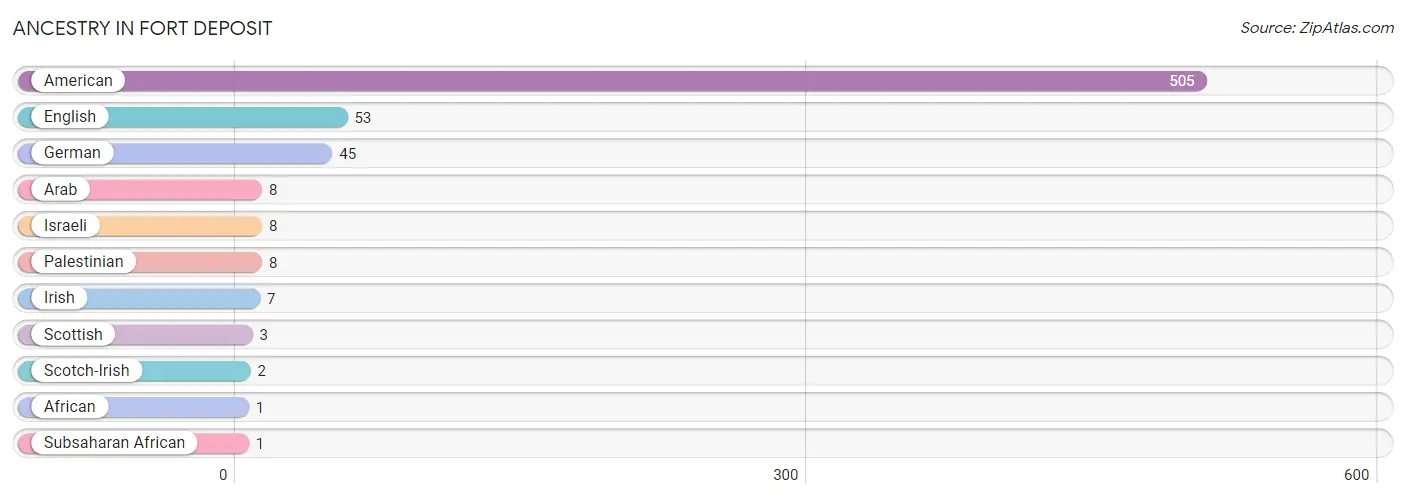
| Ancestry | # Population | % Population |
| African | 1 | 0.1% |
| American | 505 | 29.1% |
| Arab | 8 | 0.5% |
| English | 53 | 3.1% |
| German | 45 | 2.6% |
| Irish | 7 | 0.4% |
| Israeli | 8 | 0.5% |
| Palestinian | 8 | 0.5% |
| Scotch-Irish | 2 | 0.1% |
| Scottish | 3 | 0.2% |
| Subsaharan African | 1 | 0.1% | View All 11 Rows |
Immigrants in Fort Deposit

| Immigration Origin | # Population | % Population | View All 0 Rows |
Sex and Age in Fort Deposit
Sex and Age in Fort Deposit
The most populous age groups in Fort Deposit are 30 to 34 Years (121 | 14.0%) for men and 55 to 59 Years (102 | 11.7%) for women.
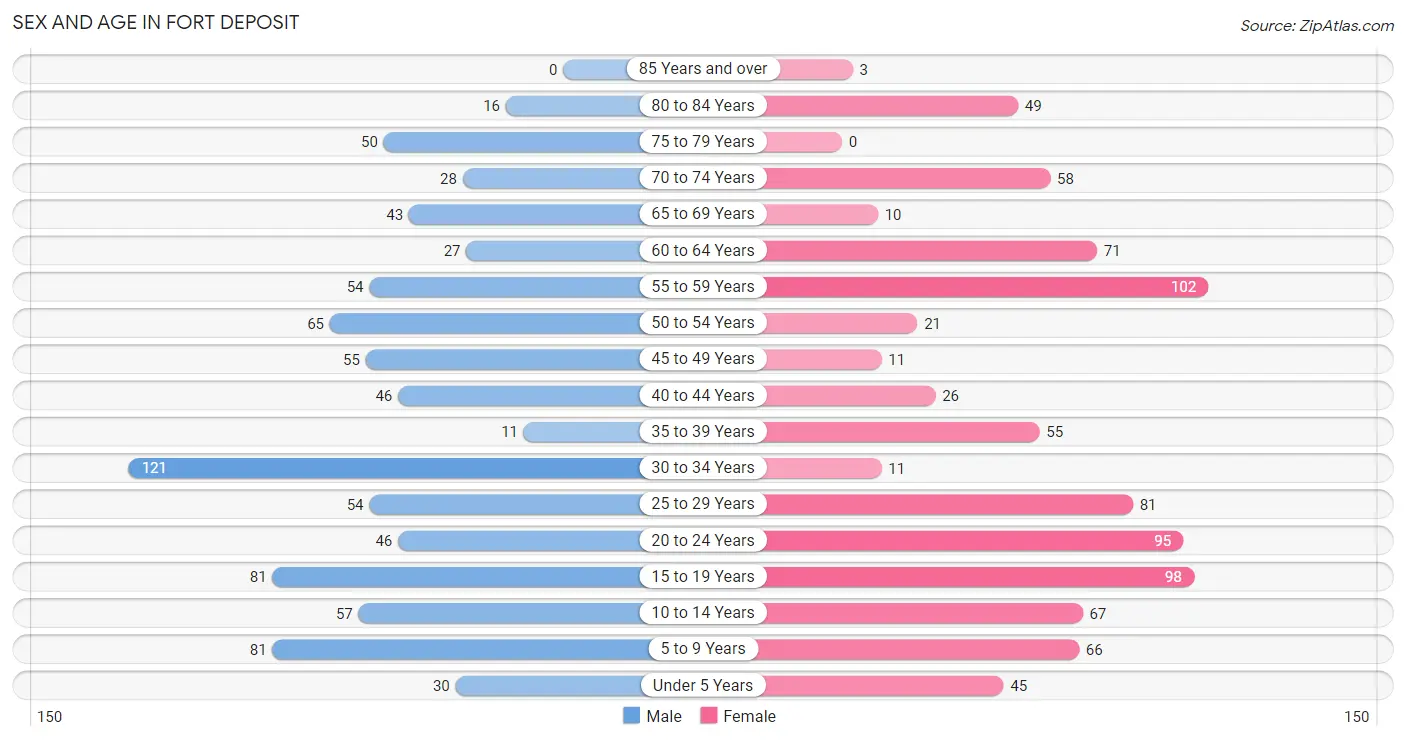
| Age Bracket | Male | Female |
| Under 5 Years | 30 (3.5%) | 45 (5.2%) |
| 5 to 9 Years | 81 (9.4%) | 66 (7.6%) |
| 10 to 14 Years | 57 (6.6%) | 67 (7.7%) |
| 15 to 19 Years | 81 (9.4%) | 98 (11.3%) |
| 20 to 24 Years | 46 (5.3%) | 95 (10.9%) |
| 25 to 29 Years | 54 (6.2%) | 81 (9.3%) |
| 30 to 34 Years | 121 (14.0%) | 11 (1.3%) |
| 35 to 39 Years | 11 (1.3%) | 55 (6.3%) |
| 40 to 44 Years | 46 (5.3%) | 26 (3.0%) |
| 45 to 49 Years | 55 (6.4%) | 11 (1.3%) |
| 50 to 54 Years | 65 (7.5%) | 21 (2.4%) |
| 55 to 59 Years | 54 (6.2%) | 102 (11.7%) |
| 60 to 64 Years | 27 (3.1%) | 71 (8.2%) |
| 65 to 69 Years | 43 (5.0%) | 10 (1.1%) |
| 70 to 74 Years | 28 (3.2%) | 58 (6.7%) |
| 75 to 79 Years | 50 (5.8%) | 0 (0.0%) |
| 80 to 84 Years | 16 (1.8%) | 49 (5.6%) |
| 85 Years and over | 0 (0.0%) | 3 (0.4%) |
| Total | 865 (100.0%) | 869 (100.0%) |
Families and Households in Fort Deposit
Median Family Size in Fort Deposit
The median family size in Fort Deposit is 3.73 persons per family, with single male/father families (16 | 4.2%) accounting for the largest median family size of 4.25 persons per family. On the other hand, married-couple families (159 | 41.8%) represent the smallest median family size with 3.26 persons per family.
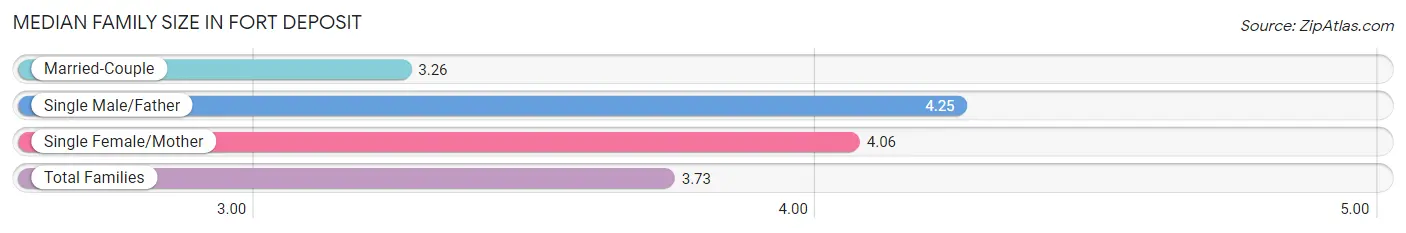
| Family Type | # Families | Family Size |
| Married-Couple | 159 (41.8%) | 3.26 |
| Single Male/Father | 16 (4.2%) | 4.25 |
| Single Female/Mother | 205 (53.9%) | 4.06 |
| Total Families | 380 (100.0%) | 3.73 |
Median Household Size in Fort Deposit
The median household size in Fort Deposit is 2.84 persons per household, with single female/mother households (205 | 33.6%) accounting for the largest median household size of 4.26 persons per household. non-family households (231 | 37.8%) represent the smallest median household size with 1.17 persons per household.
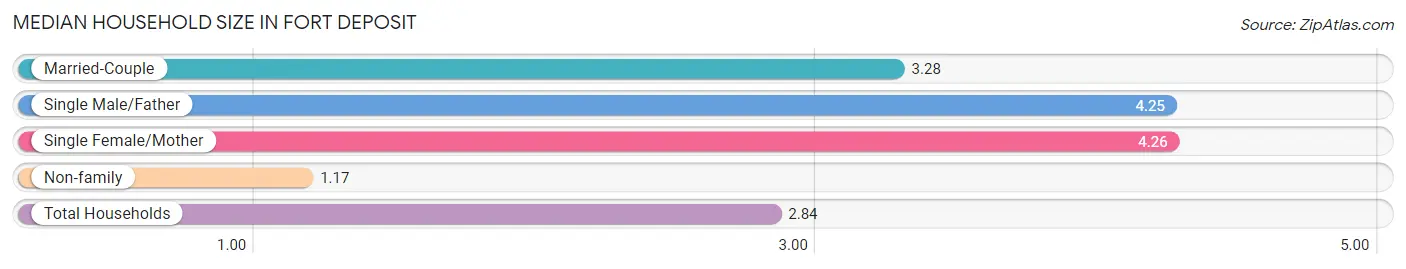
| Household Type | # Households | Household Size |
| Married-Couple | 159 (26.0%) | 3.28 |
| Single Male/Father | 16 (2.6%) | 4.25 |
| Single Female/Mother | 205 (33.6%) | 4.26 |
| Non-family | 231 (37.8%) | 1.17 |
| Total Households | 611 (100.0%) | 2.84 |
Household Size by Marriage Status in Fort Deposit
Out of a total of 611 households in Fort Deposit, 380 (62.2%) are family households, while 231 (37.8%) are nonfamily households. The most numerous type of family households are 2-person households, comprising 153, and the most common type of nonfamily households are 1-person households, comprising 210.
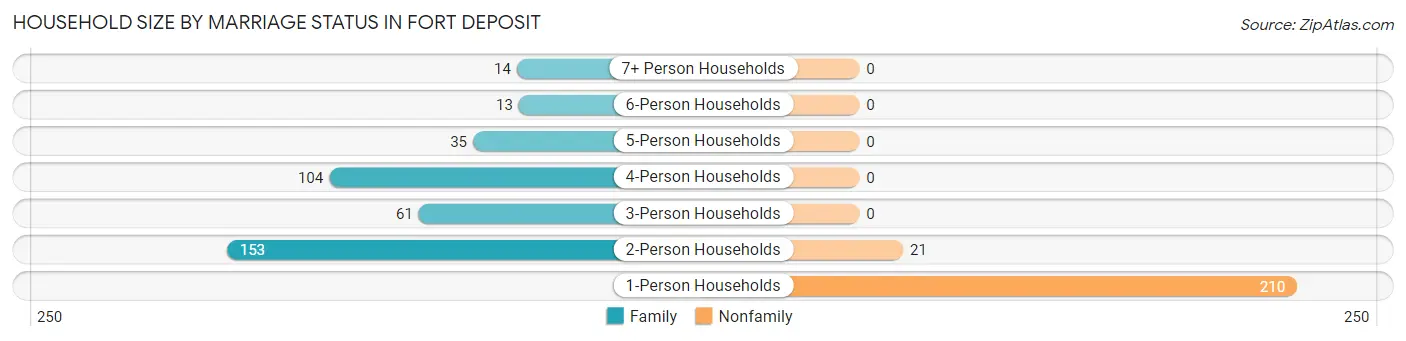
| Household Size | Family Households | Nonfamily Households |
| 1-Person Households | - | 210 (34.4%) |
| 2-Person Households | 153 (25.0%) | 21 (3.4%) |
| 3-Person Households | 61 (10.0%) | 0 (0.0%) |
| 4-Person Households | 104 (17.0%) | 0 (0.0%) |
| 5-Person Households | 35 (5.7%) | 0 (0.0%) |
| 6-Person Households | 13 (2.1%) | 0 (0.0%) |
| 7+ Person Households | 14 (2.3%) | 0 (0.0%) |
| Total | 380 (62.2%) | 231 (37.8%) |
Female Fertility in Fort Deposit
Fertility by Age in Fort Deposit
| Age Bracket | Women with Births | Births / 1,000 Women |
| 15 to 19 years | 0 (0.0%) | 0.0 |
| 20 to 34 years | 0 (0.0%) | 0.0 |
| 35 to 50 years | 0 (0.0%) | 0.0 |
| Total | 0 (0.0%) | 0.0 |
Fertility by Age by Marriage Status in Fort Deposit
| Age Bracket | Married | Unmarried |
| 15 to 19 years | 0 (0.0%) | 0 (0.0%) |
| 20 to 34 years | 0 (0.0%) | 0 (0.0%) |
| 35 to 50 years | 0 (0.0%) | 0 (0.0%) |
| Total | 0 (0.0%) | 0 (0.0%) |
Fertility by Education in Fort Deposit
| Educational Attainment | Women with Births | Births / 1,000 Women |
| Less than High School | 0 (0.0%) | 0.0 |
| High School Diploma | 0 (0.0%) | 0.0 |
| College or Associate's Degree | 0 (0.0%) | 0.0 |
| Bachelor's Degree | 0 (0.0%) | 0.0 |
| Graduate Degree | 0 (0.0%) | 0.0 |
| Total | 0 (0.0%) | 0.0 |
Fertility by Education by Marriage Status in Fort Deposit
| Educational Attainment | Married | Unmarried |
| Less than High School | 0 (0.0%) | 0 (0.0%) |
| High School Diploma | 0 (0.0%) | 0 (0.0%) |
| College or Associate's Degree | 0 (0.0%) | 0 (0.0%) |
| Bachelor's Degree | 0 (0.0%) | 0 (0.0%) |
| Graduate Degree | 0 (0.0%) | 0 (0.0%) |
| Total | 0 (0.0%) | 0 (0.0%) |
Employment Characteristics in Fort Deposit
Employment by Class of Employer in Fort Deposit
Among the 456 employed individuals in Fort Deposit, private company employees (371 | 81.4%), self-employed (not incorporated) (35 | 7.7%), and local government employees (21 | 4.6%) make up the most common classes of employment.
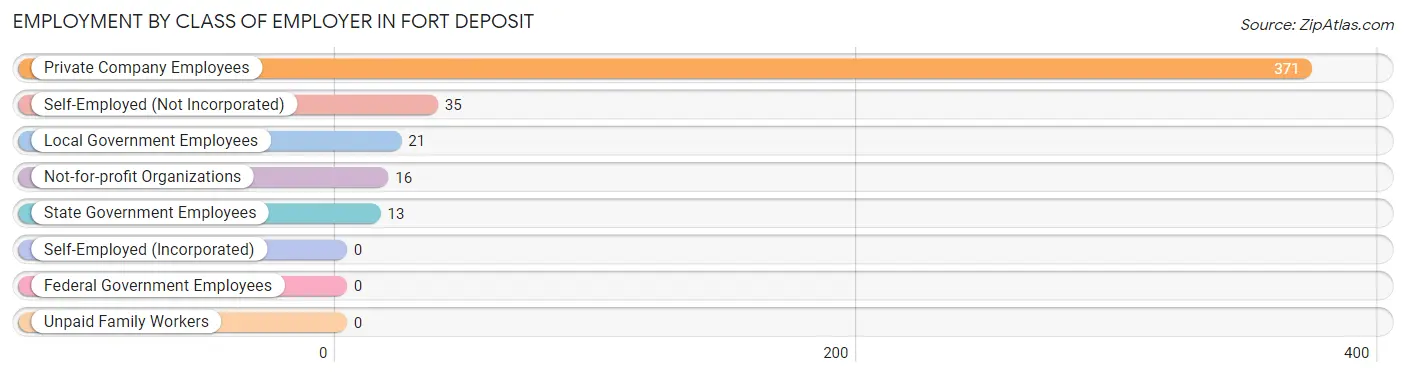
| Employer Class | # Employees | % Employees |
| Private Company Employees | 371 | 81.4% |
| Self-Employed (Incorporated) | 0 | 0.0% |
| Self-Employed (Not Incorporated) | 35 | 7.7% |
| Not-for-profit Organizations | 16 | 3.5% |
| Local Government Employees | 21 | 4.6% |
| State Government Employees | 13 | 2.9% |
| Federal Government Employees | 0 | 0.0% |
| Unpaid Family Workers | 0 | 0.0% |
| Total | 456 | 100.0% |
Employment Status by Age in Fort Deposit
According to the labor force statistics for Fort Deposit, out of the total population over 16 years of age (1,336), 44.5% or 595 individuals are in the labor force, with 22.6% or 134 of them unemployed. The age group with the highest labor force participation rate is 45 to 54 years, with 82.2% or 125 individuals in the labor force. Within the labor force, the 16 to 19 years age range has the highest percentage of unemployed individuals, with 52.4% or 44 of them being unemployed.
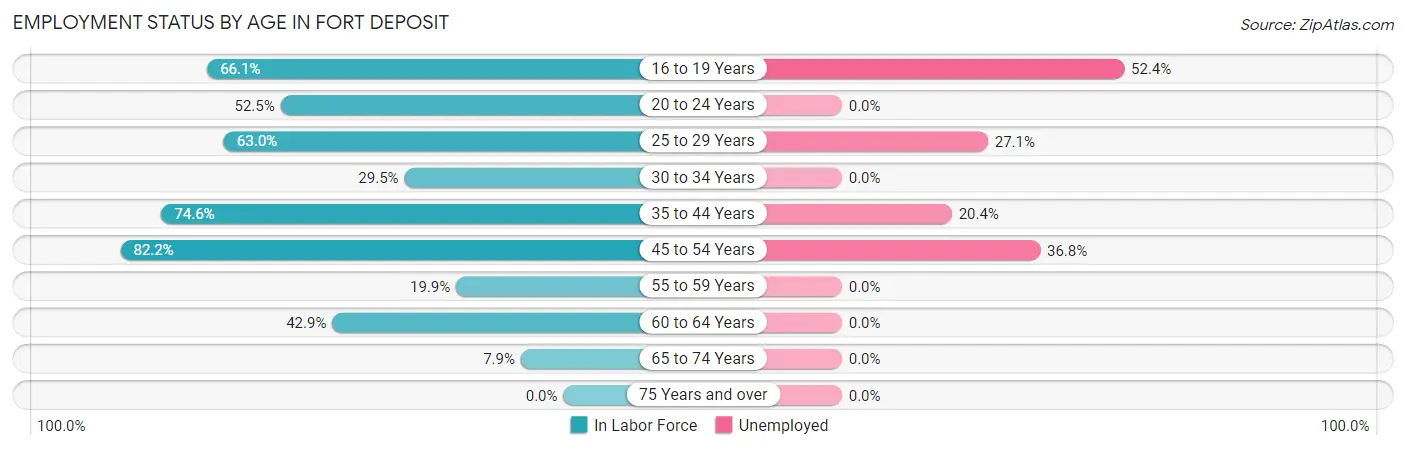
| Age Bracket | In Labor Force | Unemployed |
| 16 to 19 Years | 84 (66.1%) | 44 (52.4%) |
| 20 to 24 Years | 74 (52.5%) | 0 (0.0%) |
| 25 to 29 Years | 85 (63.0%) | 23 (27.1%) |
| 30 to 34 Years | 39 (29.5%) | 0 (0.0%) |
| 35 to 44 Years | 103 (74.6%) | 21 (20.4%) |
| 45 to 54 Years | 125 (82.2%) | 46 (36.8%) |
| 55 to 59 Years | 31 (19.9%) | 0 (0.0%) |
| 60 to 64 Years | 42 (42.9%) | 0 (0.0%) |
| 65 to 74 Years | 11 (7.9%) | 0 (0.0%) |
| 75 Years and over | 0 (0.0%) | 0 (0.0%) |
| Total | 595 (44.5%) | 134 (22.6%) |
Employment Status by Educational Attainment in Fort Deposit
According to labor force statistics for Fort Deposit, 52.4% of individuals (425) out of the total population between 25 and 64 years of age (811) are in the labor force, with 21.2% or 90 of them being unemployed. The group with the highest labor force participation rate are those with the educational attainment of bachelor's degree or higher, with 100.0% or 47 individuals in the labor force. Within the labor force, individuals with less than high school education have the highest percentage of unemployment, with 30.0% or 21 of them being unemployed.
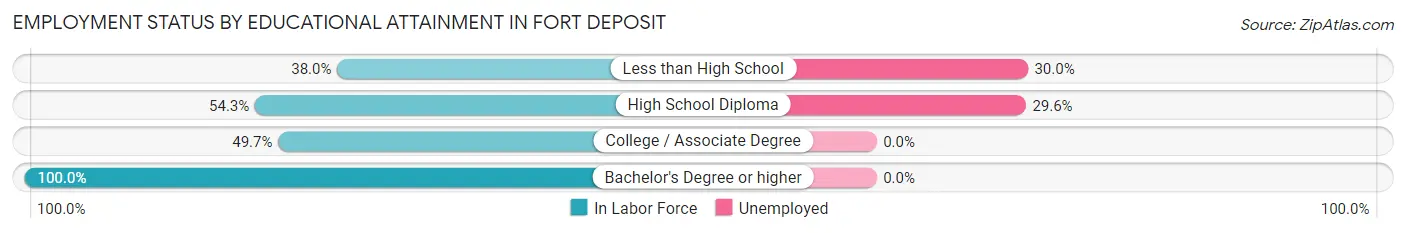
| Educational Attainment | In Labor Force | Unemployed |
| Less than High School | 70 (38.0%) | 55 (30.0%) |
| High School Diploma | 233 (54.3%) | 127 (29.6%) |
| College / Associate Degree | 75 (49.7%) | 0 (0.0%) |
| Bachelor's Degree or higher | 47 (100.0%) | 0 (0.0%) |
| Total | 425 (52.4%) | 172 (21.2%) |
Employment Occupations by Sex in Fort Deposit
Management, Business, Science and Arts Occupations
The most common Management, Business, Science and Arts occupations in Fort Deposit are Health Diagnosing & Treating (30 | 6.5%), Health Technologists (26 | 5.7%), Community & Social Service (22 | 4.8%), Education Instruction & Library (22 | 4.8%), and Management (3 | 0.6%).
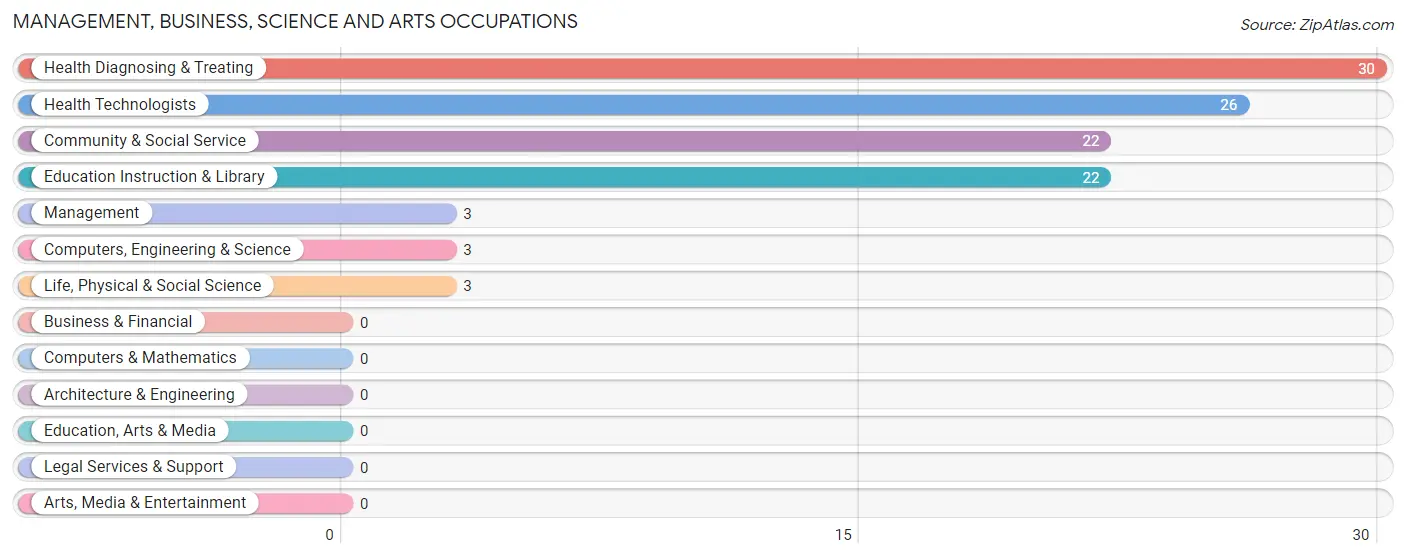
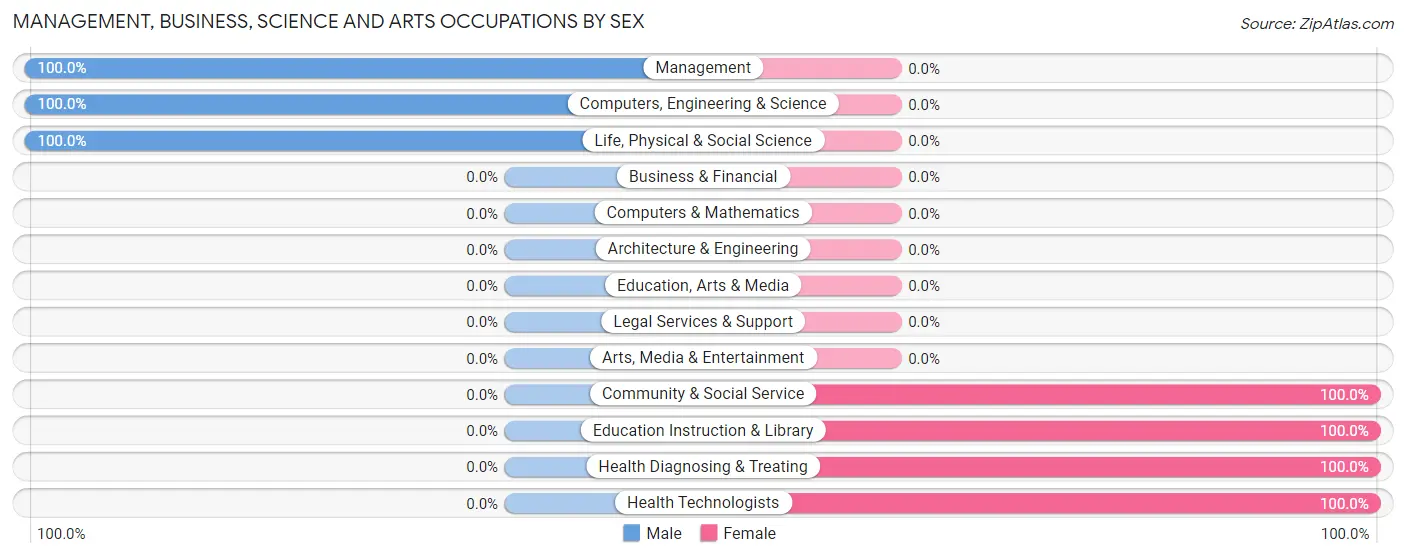
Management, Business, Science and Arts Occupations by Sex
Within the Management, Business, Science and Arts occupations in Fort Deposit, the most male-oriented occupations are Management (100.0%), Computers, Engineering & Science (100.0%), and Life, Physical & Social Science (100.0%), while the most female-oriented occupations are Community & Social Service (100.0%), Education Instruction & Library (100.0%), and Health Diagnosing & Treating (100.0%).
| Occupation | Male | Female |
| Management | 3 (100.0%) | 0 (0.0%) |
| Business & Financial | 0 (0.0%) | 0 (0.0%) |
| Computers, Engineering & Science | 3 (100.0%) | 0 (0.0%) |
| Computers & Mathematics | 0 (0.0%) | 0 (0.0%) |
| Architecture & Engineering | 0 (0.0%) | 0 (0.0%) |
| Life, Physical & Social Science | 3 (100.0%) | 0 (0.0%) |
| Community & Social Service | 0 (0.0%) | 22 (100.0%) |
| Education, Arts & Media | 0 (0.0%) | 0 (0.0%) |
| Legal Services & Support | 0 (0.0%) | 0 (0.0%) |
| Education Instruction & Library | 0 (0.0%) | 22 (100.0%) |
| Arts, Media & Entertainment | 0 (0.0%) | 0 (0.0%) |
| Health Diagnosing & Treating | 0 (0.0%) | 30 (100.0%) |
| Health Technologists | 0 (0.0%) | 26 (100.0%) |
| Total (Category) | 6 (10.3%) | 52 (89.7%) |
| Total (Overall) | 237 (51.5%) | 223 (48.5%) |
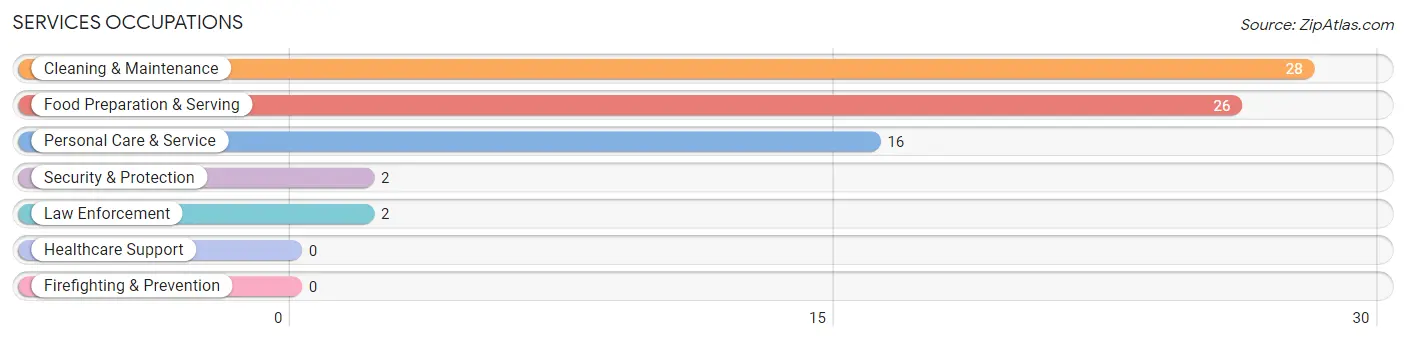
Services Occupations
The most common Services occupations in Fort Deposit are Cleaning & Maintenance (28 | 6.1%), Food Preparation & Serving (26 | 5.7%), Personal Care & Service (16 | 3.5%), Security & Protection (2 | 0.4%), and Law Enforcement (2 | 0.4%).
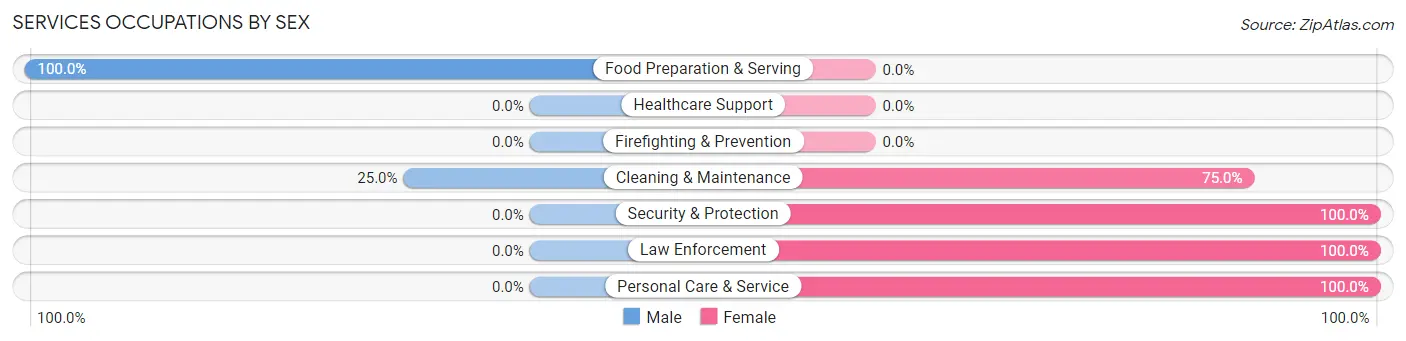
Services Occupations by Sex
Within the Services occupations in Fort Deposit, the most male-oriented occupations are Food Preparation & Serving (100.0%), and Cleaning & Maintenance (25.0%), while the most female-oriented occupations are Security & Protection (100.0%), Law Enforcement (100.0%), and Personal Care & Service (100.0%).
| Occupation | Male | Female |
| Healthcare Support | 0 (0.0%) | 0 (0.0%) |
| Security & Protection | 0 (0.0%) | 2 (100.0%) |
| Firefighting & Prevention | 0 (0.0%) | 0 (0.0%) |
| Law Enforcement | 0 (0.0%) | 2 (100.0%) |
| Food Preparation & Serving | 26 (100.0%) | 0 (0.0%) |
| Cleaning & Maintenance | 7 (25.0%) | 21 (75.0%) |
| Personal Care & Service | 0 (0.0%) | 16 (100.0%) |
| Total (Category) | 33 (45.8%) | 39 (54.2%) |
| Total (Overall) | 237 (51.5%) | 223 (48.5%) |
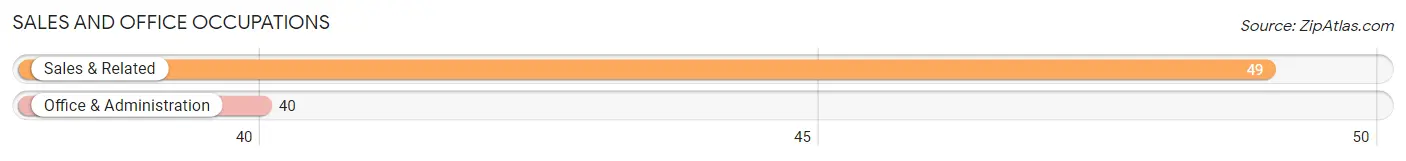
Sales and Office Occupations
The most common Sales and Office occupations in Fort Deposit are Sales & Related (49 | 10.6%), and Office & Administration (40 | 8.7%).
Sales and Office Occupations by Sex
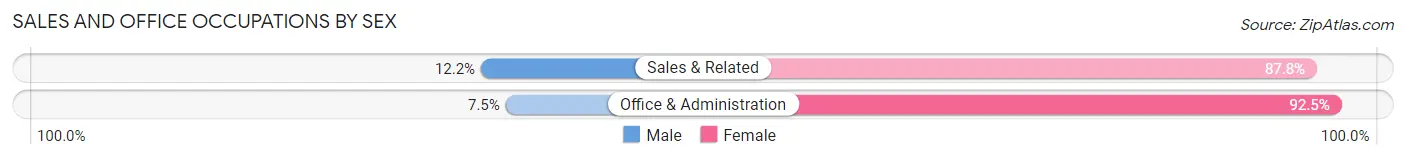
| Occupation | Male | Female |
| Sales & Related | 6 (12.2%) | 43 (87.8%) |
| Office & Administration | 3 (7.5%) | 37 (92.5%) |
| Total (Category) | 9 (10.1%) | 80 (89.9%) |
| Total (Overall) | 237 (51.5%) | 223 (48.5%) |
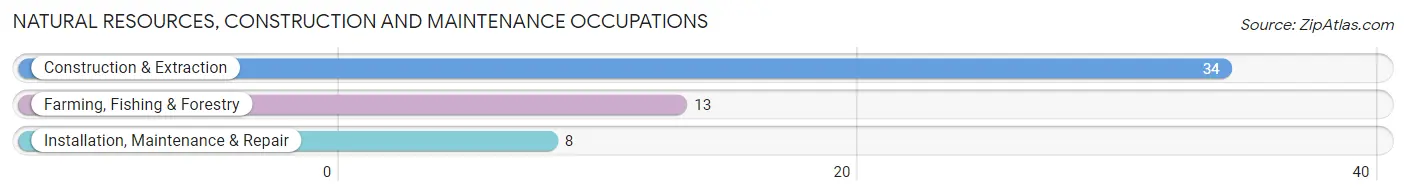
Natural Resources, Construction and Maintenance Occupations
The most common Natural Resources, Construction and Maintenance occupations in Fort Deposit are Construction & Extraction (34 | 7.4%), Farming, Fishing & Forestry (13 | 2.8%), and Installation, Maintenance & Repair (8 | 1.7%).
Natural Resources, Construction and Maintenance Occupations by Sex
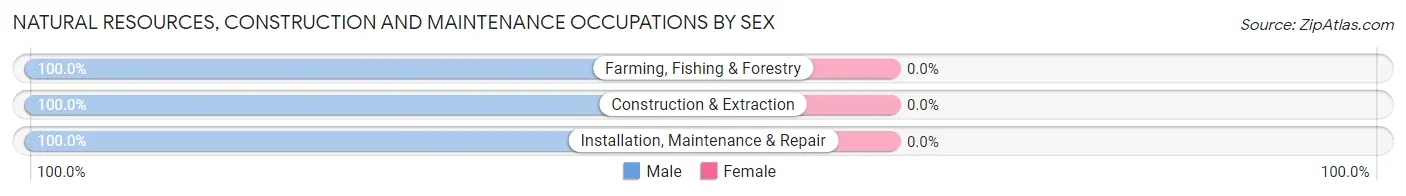
| Occupation | Male | Female |
| Farming, Fishing & Forestry | 13 (100.0%) | 0 (0.0%) |
| Construction & Extraction | 34 (100.0%) | 0 (0.0%) |
| Installation, Maintenance & Repair | 8 (100.0%) | 0 (0.0%) |
| Total (Category) | 55 (100.0%) | 0 (0.0%) |
| Total (Overall) | 237 (51.5%) | 223 (48.5%) |
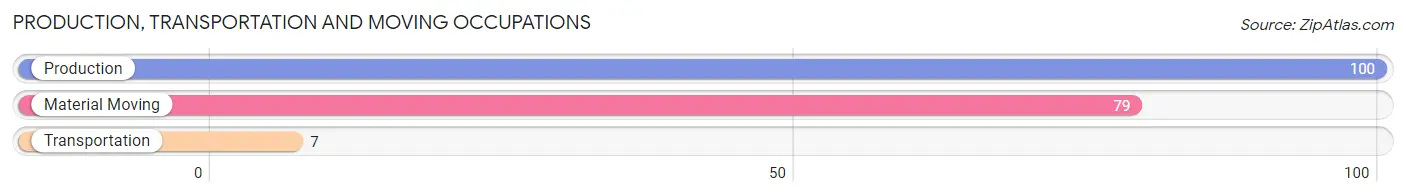
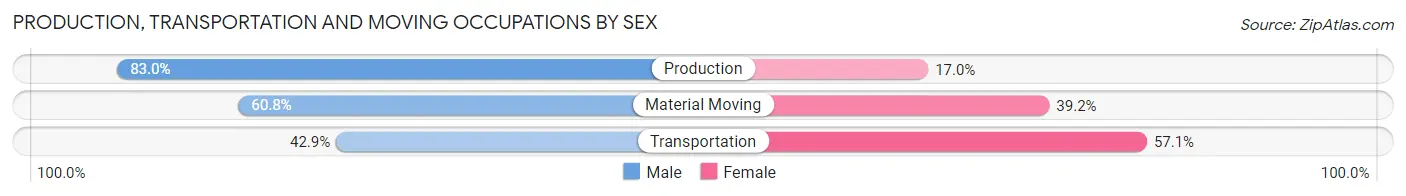
Production, Transportation and Moving Occupations
The most common Production, Transportation and Moving occupations in Fort Deposit are Production (100 | 21.7%), Material Moving (79 | 17.2%), and Transportation (7 | 1.5%).
Production, Transportation and Moving Occupations by Sex
| Occupation | Male | Female |
| Production | 83 (83.0%) | 17 (17.0%) |
| Transportation | 3 (42.9%) | 4 (57.1%) |
| Material Moving | 48 (60.8%) | 31 (39.2%) |
| Total (Category) | 134 (72.0%) | 52 (28.0%) |
| Total (Overall) | 237 (51.5%) | 223 (48.5%) |
Employment Industries by Sex in Fort Deposit
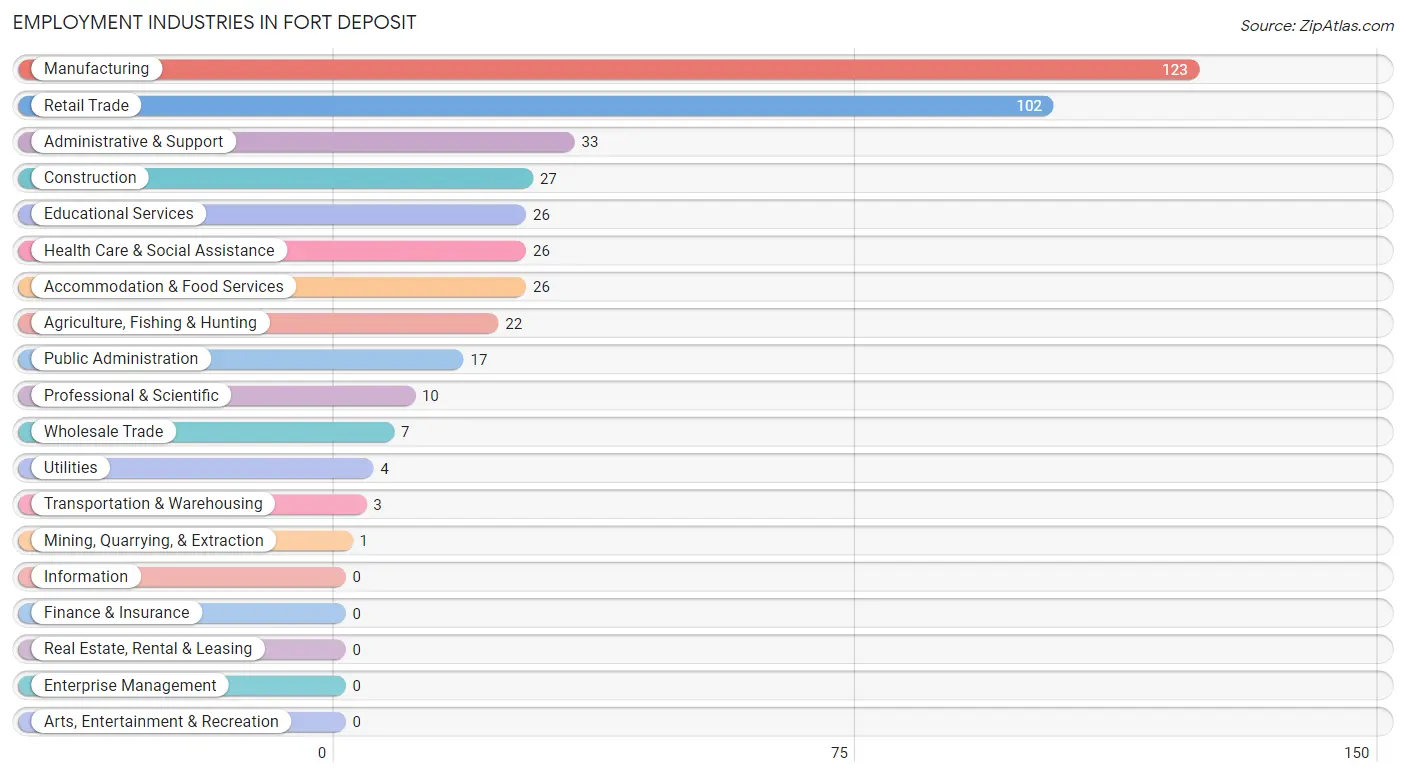
Employment Industries in Fort Deposit
The major employment industries in Fort Deposit include Manufacturing (123 | 26.7%), Retail Trade (102 | 22.2%), Administrative & Support (33 | 7.2%), Construction (27 | 5.9%), and Educational Services (26 | 5.7%).
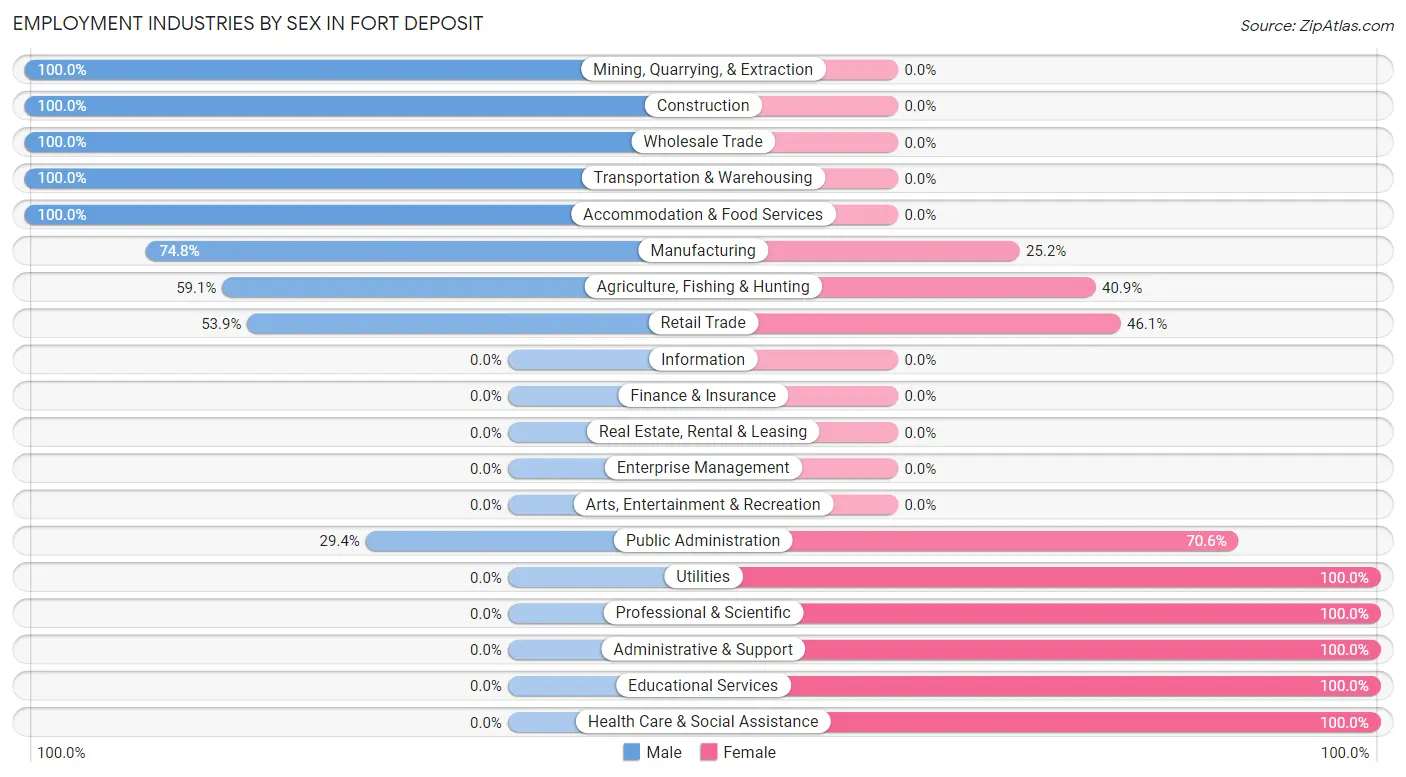
Employment Industries by Sex in Fort Deposit
The Fort Deposit industries that see more men than women are Mining, Quarrying, & Extraction (100.0%), Construction (100.0%), and Wholesale Trade (100.0%), whereas the industries that tend to have a higher number of women are Utilities (100.0%), Professional & Scientific (100.0%), and Administrative & Support (100.0%).
| Industry | Male | Female |
| Agriculture, Fishing & Hunting | 13 (59.1%) | 9 (40.9%) |
| Mining, Quarrying, & Extraction | 1 (100.0%) | 0 (0.0%) |
| Construction | 27 (100.0%) | 0 (0.0%) |
| Manufacturing | 92 (74.8%) | 31 (25.2%) |
| Wholesale Trade | 7 (100.0%) | 0 (0.0%) |
| Retail Trade | 55 (53.9%) | 47 (46.1%) |
| Transportation & Warehousing | 3 (100.0%) | 0 (0.0%) |
| Utilities | 0 (0.0%) | 4 (100.0%) |
| Information | 0 (0.0%) | 0 (0.0%) |
| Finance & Insurance | 0 (0.0%) | 0 (0.0%) |
| Real Estate, Rental & Leasing | 0 (0.0%) | 0 (0.0%) |
| Professional & Scientific | 0 (0.0%) | 10 (100.0%) |
| Enterprise Management | 0 (0.0%) | 0 (0.0%) |
| Administrative & Support | 0 (0.0%) | 33 (100.0%) |
| Educational Services | 0 (0.0%) | 26 (100.0%) |
| Health Care & Social Assistance | 0 (0.0%) | 26 (100.0%) |
| Arts, Entertainment & Recreation | 0 (0.0%) | 0 (0.0%) |
| Accommodation & Food Services | 26 (100.0%) | 0 (0.0%) |
| Public Administration | 5 (29.4%) | 12 (70.6%) |
| Total | 237 (51.5%) | 223 (48.5%) |
Education in Fort Deposit
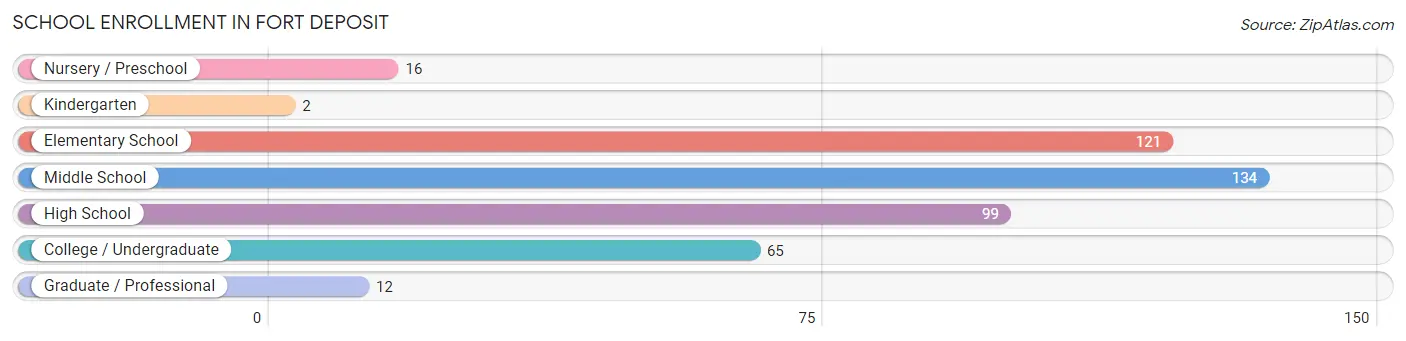
School Enrollment in Fort Deposit
The most common levels of schooling among the 449 students in Fort Deposit are middle school (134 | 29.8%), elementary school (121 | 27.0%), and high school (99 | 22.1%).
| School Level | # Students | % Students |
| Nursery / Preschool | 16 | 3.6% |
| Kindergarten | 2 | 0.4% |
| Elementary School | 121 | 27.0% |
| Middle School | 134 | 29.8% |
| High School | 99 | 22.1% |
| College / Undergraduate | 65 | 14.5% |
| Graduate / Professional | 12 | 2.7% |
| Total | 449 | 100.0% |
School Enrollment by Age by Funding Source in Fort Deposit
Out of a total of 449 students who are enrolled in schools in Fort Deposit, 62 (13.8%) attend a private institution, while the remaining 387 (86.2%) are enrolled in public schools. The age group of 3 to 4 year olds has the highest likelihood of being enrolled in private schools, with 16 (100.0% in the age bracket) enrolled. Conversely, the age group of 10 to 14 year olds has the lowest likelihood of being enrolled in a private school, with 124 (100.0% in the age bracket) attending a public institution.
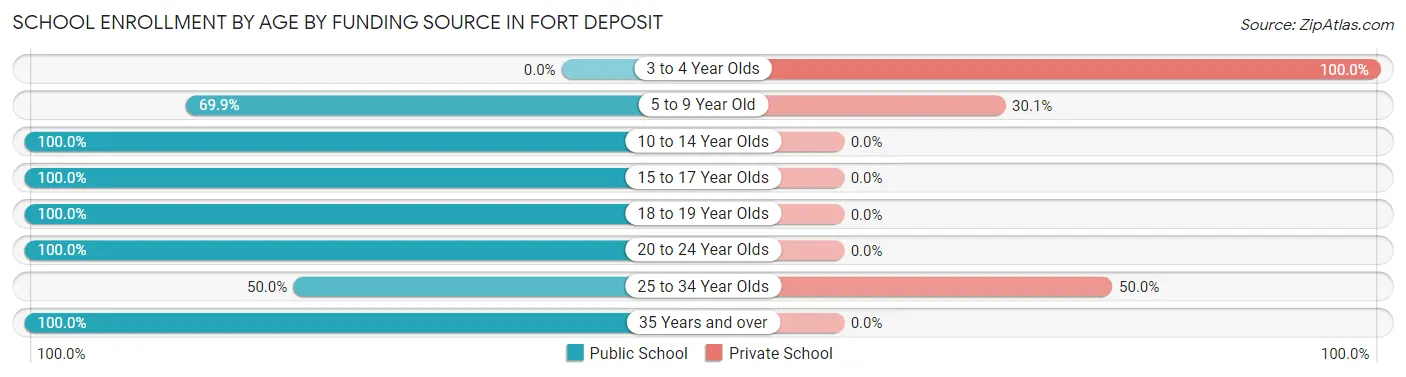
| Age Bracket | Public School | Private School |
| 3 to 4 Year Olds | 0 (0.0%) | 16 (100.0%) |
| 5 to 9 Year Old | 86 (69.9%) | 37 (30.1%) |
| 10 to 14 Year Olds | 124 (100.0%) | 0 (0.0%) |
| 15 to 17 Year Olds | 97 (100.0%) | 0 (0.0%) |
| 18 to 19 Year Olds | 19 (100.0%) | 0 (0.0%) |
| 20 to 24 Year Olds | 44 (100.0%) | 0 (0.0%) |
| 25 to 34 Year Olds | 9 (50.0%) | 9 (50.0%) |
| 35 Years and over | 8 (100.0%) | 0 (0.0%) |
| Total | 387 (86.2%) | 62 (13.8%) |
Educational Attainment by Field of Study in Fort Deposit
Business (31 | 52.5%), bio, nature & agricultural (22 | 37.3%), arts & humanities (4 | 6.8%), and psychology (2 | 3.4%) are the most common fields of study among 59 individuals in Fort Deposit who have obtained a bachelor's degree or higher.
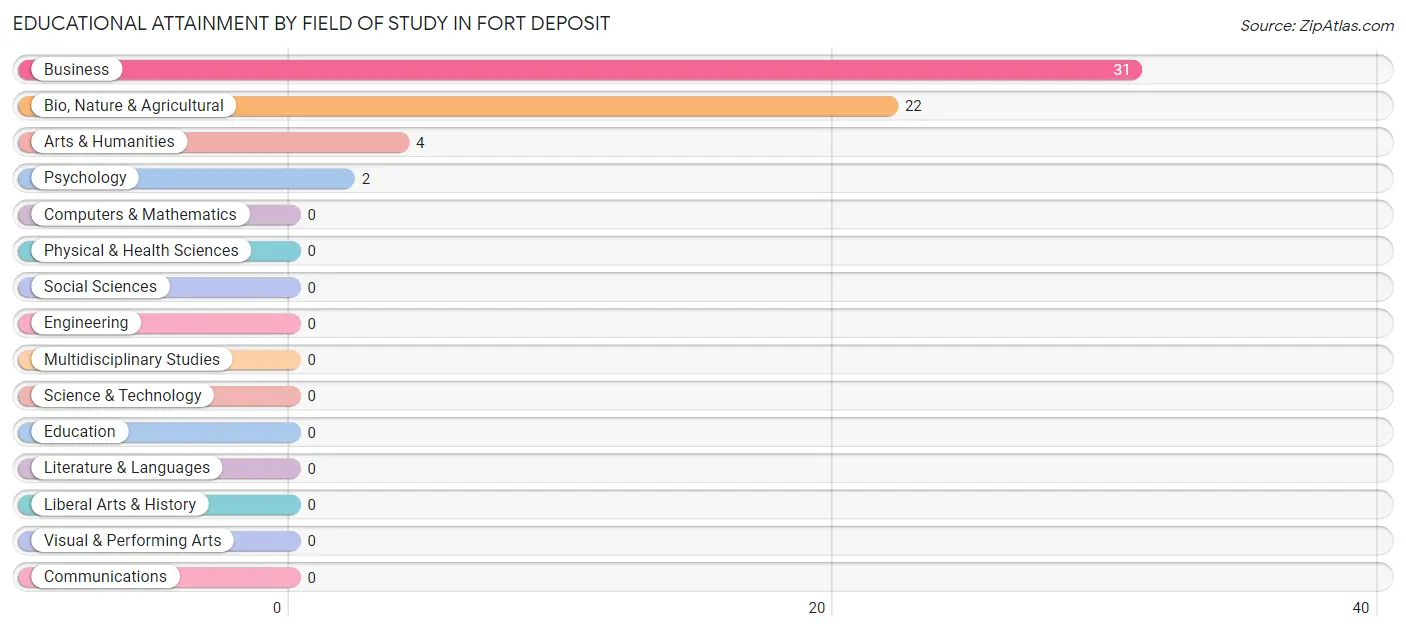
| Field of Study | # Graduates | % Graduates |
| Computers & Mathematics | 0 | 0.0% |
| Bio, Nature & Agricultural | 22 | 37.3% |
| Physical & Health Sciences | 0 | 0.0% |
| Psychology | 2 | 3.4% |
| Social Sciences | 0 | 0.0% |
| Engineering | 0 | 0.0% |
| Multidisciplinary Studies | 0 | 0.0% |
| Science & Technology | 0 | 0.0% |
| Business | 31 | 52.5% |
| Education | 0 | 0.0% |
| Literature & Languages | 0 | 0.0% |
| Liberal Arts & History | 0 | 0.0% |
| Visual & Performing Arts | 0 | 0.0% |
| Communications | 0 | 0.0% |
| Arts & Humanities | 4 | 6.8% |
| Total | 59 | 100.0% |
Transportation & Commute in Fort Deposit
Vehicle Availability by Sex in Fort Deposit
The most prevalent vehicle ownership categories in Fort Deposit are males with 1 vehicle (105, accounting for 44.3%) and females with 1 vehicle (50, making up 47.9%).
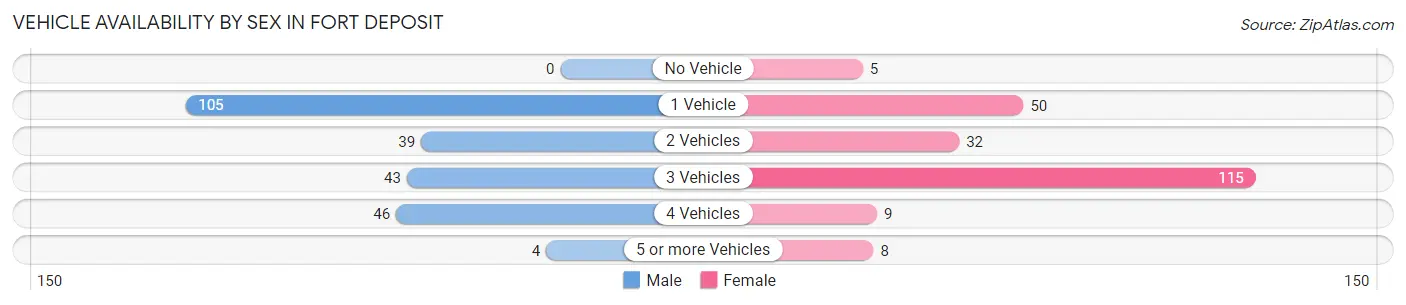
| Vehicles Available | Male | Female |
| No Vehicle | 0 (0.0%) | 5 (2.3%) |
| 1 Vehicle | 105 (44.3%) | 50 (22.8%) |
| 2 Vehicles | 39 (16.5%) | 32 (14.6%) |
| 3 Vehicles | 43 (18.1%) | 115 (52.5%) |
| 4 Vehicles | 46 (19.4%) | 9 (4.1%) |
| 5 or more Vehicles | 4 (1.7%) | 8 (3.6%) |
| Total | 237 (100.0%) | 219 (100.0%) |
Commute Time in Fort Deposit
The most frequently occuring commute durations in Fort Deposit are 30 to 34 minutes (137 commuters, 31.4%), 15 to 19 minutes (66 commuters, 15.1%), and 45 to 59 minutes (53 commuters, 12.1%).
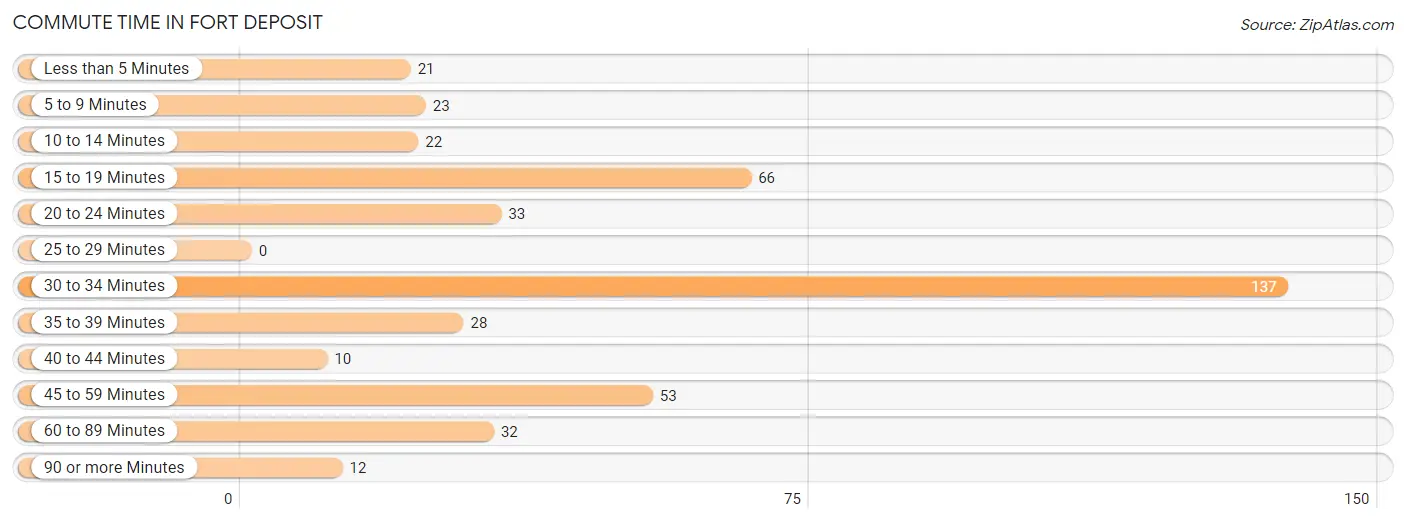
| Commute Time | # Commuters | % Commuters |
| Less than 5 Minutes | 21 | 4.8% |
| 5 to 9 Minutes | 23 | 5.3% |
| 10 to 14 Minutes | 22 | 5.0% |
| 15 to 19 Minutes | 66 | 15.1% |
| 20 to 24 Minutes | 33 | 7.5% |
| 25 to 29 Minutes | 0 | 0.0% |
| 30 to 34 Minutes | 137 | 31.4% |
| 35 to 39 Minutes | 28 | 6.4% |
| 40 to 44 Minutes | 10 | 2.3% |
| 45 to 59 Minutes | 53 | 12.1% |
| 60 to 89 Minutes | 32 | 7.3% |
| 90 or more Minutes | 12 | 2.8% |
Commute Time by Sex in Fort Deposit
The most common commute times in Fort Deposit are 30 to 34 minutes (101 commuters, 43.2%) for males and 30 to 34 minutes (36 commuters, 17.7%) for females.
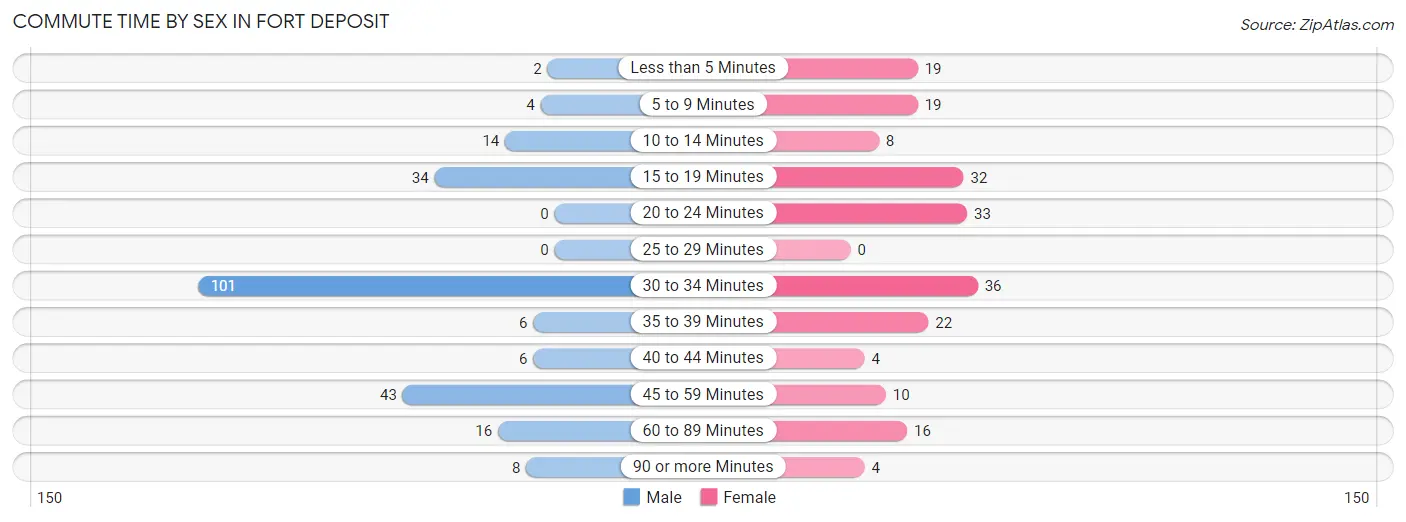
| Commute Time | Male | Female |
| Less than 5 Minutes | 2 (0.9%) | 19 (9.4%) |
| 5 to 9 Minutes | 4 (1.7%) | 19 (9.4%) |
| 10 to 14 Minutes | 14 (6.0%) | 8 (3.9%) |
| 15 to 19 Minutes | 34 (14.5%) | 32 (15.8%) |
| 20 to 24 Minutes | 0 (0.0%) | 33 (16.3%) |
| 25 to 29 Minutes | 0 (0.0%) | 0 (0.0%) |
| 30 to 34 Minutes | 101 (43.2%) | 36 (17.7%) |
| 35 to 39 Minutes | 6 (2.6%) | 22 (10.8%) |
| 40 to 44 Minutes | 6 (2.6%) | 4 (2.0%) |
| 45 to 59 Minutes | 43 (18.4%) | 10 (4.9%) |
| 60 to 89 Minutes | 16 (6.8%) | 16 (7.9%) |
| 90 or more Minutes | 8 (3.4%) | 4 (2.0%) |
Time of Departure to Work by Sex in Fort Deposit
The most frequent times of departure to work in Fort Deposit are 7:00 AM to 7:29 AM (62, 26.5%) for males and 6:30 AM to 6:59 AM (42, 20.7%) for females.
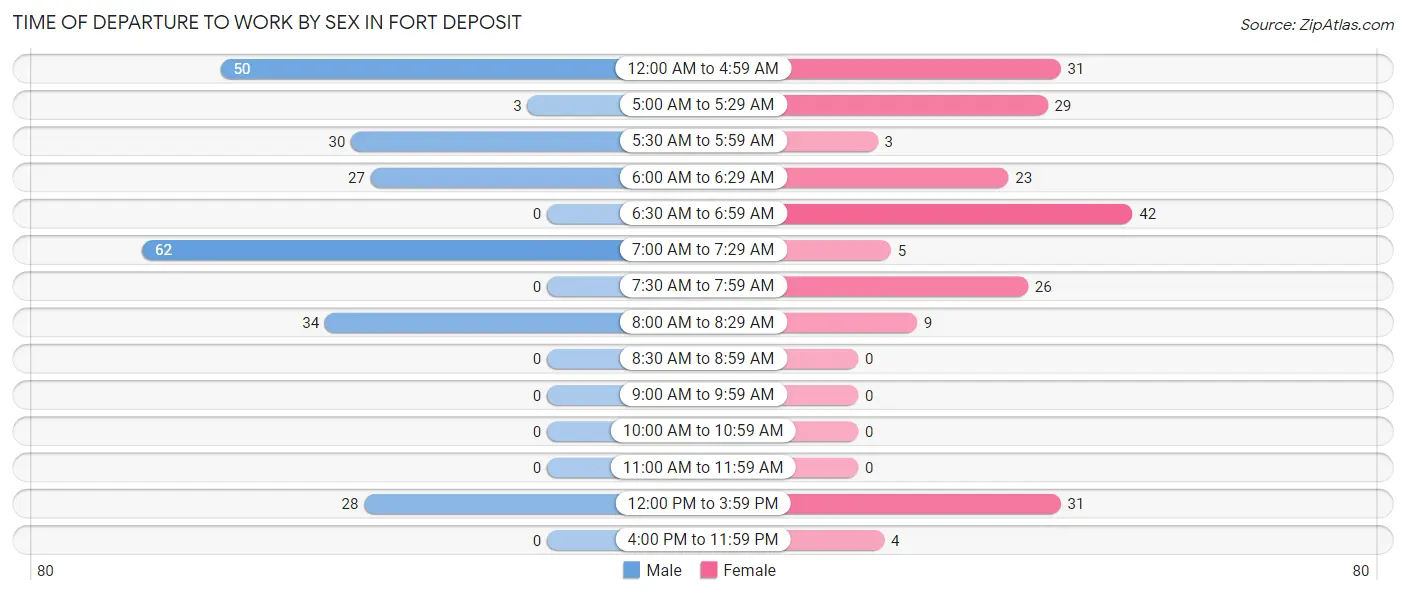
| Time of Departure | Male | Female |
| 12:00 AM to 4:59 AM | 50 (21.4%) | 31 (15.3%) |
| 5:00 AM to 5:29 AM | 3 (1.3%) | 29 (14.3%) |
| 5:30 AM to 5:59 AM | 30 (12.8%) | 3 (1.5%) |
| 6:00 AM to 6:29 AM | 27 (11.5%) | 23 (11.3%) |
| 6:30 AM to 6:59 AM | 0 (0.0%) | 42 (20.7%) |
| 7:00 AM to 7:29 AM | 62 (26.5%) | 5 (2.5%) |
| 7:30 AM to 7:59 AM | 0 (0.0%) | 26 (12.8%) |
| 8:00 AM to 8:29 AM | 34 (14.5%) | 9 (4.4%) |
| 8:30 AM to 8:59 AM | 0 (0.0%) | 0 (0.0%) |
| 9:00 AM to 9:59 AM | 0 (0.0%) | 0 (0.0%) |
| 10:00 AM to 10:59 AM | 0 (0.0%) | 0 (0.0%) |
| 11:00 AM to 11:59 AM | 0 (0.0%) | 0 (0.0%) |
| 12:00 PM to 3:59 PM | 28 (12.0%) | 31 (15.3%) |
| 4:00 PM to 11:59 PM | 0 (0.0%) | 4 (2.0%) |
| Total | 234 (100.0%) | 203 (100.0%) |
Housing Occupancy in Fort Deposit
Occupancy by Ownership in Fort Deposit
Of the total 611 dwellings in Fort Deposit, owner-occupied units account for 390 (63.8%), while renter-occupied units make up 221 (36.2%).
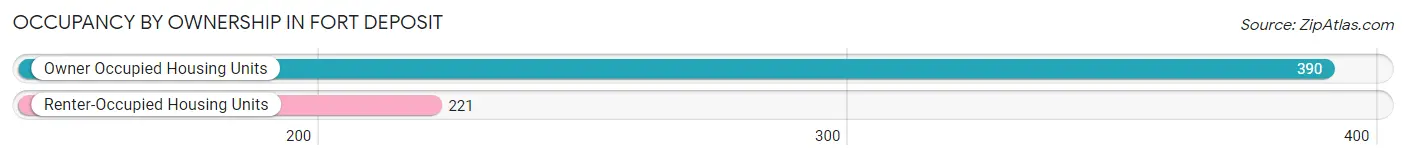
| Occupancy | # Housing Units | % Housing Units |
| Owner Occupied Housing Units | 390 | 63.8% |
| Renter-Occupied Housing Units | 221 | 36.2% |
| Total Occupied Housing Units | 611 | 100.0% |
Occupancy by Household Size in Fort Deposit
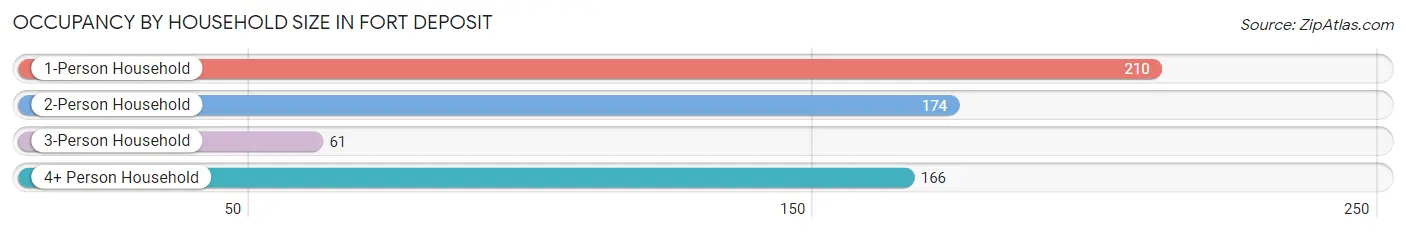
| Household Size | # Housing Units | % Housing Units |
| 1-Person Household | 210 | 34.4% |
| 2-Person Household | 174 | 28.5% |
| 3-Person Household | 61 | 10.0% |
| 4+ Person Household | 166 | 27.2% |
| Total Housing Units | 611 | 100.0% |
Occupancy by Ownership by Household Size in Fort Deposit
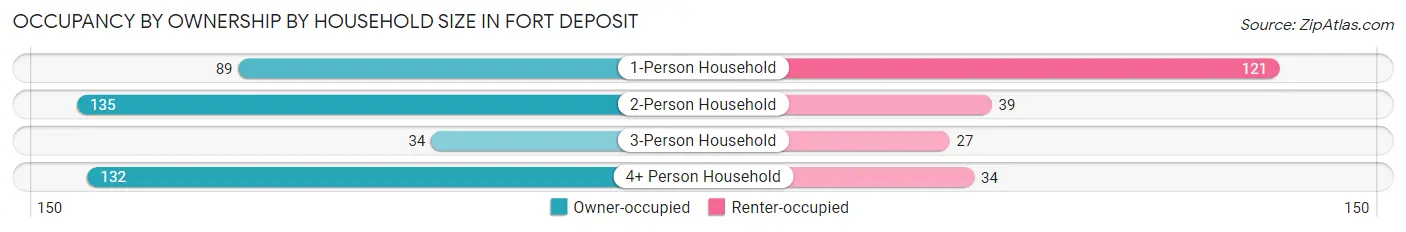
| Household Size | Owner-occupied | Renter-occupied |
| 1-Person Household | 89 (42.4%) | 121 (57.6%) |
| 2-Person Household | 135 (77.6%) | 39 (22.4%) |
| 3-Person Household | 34 (55.7%) | 27 (44.3%) |
| 4+ Person Household | 132 (79.5%) | 34 (20.5%) |
| Total Housing Units | 390 (63.8%) | 221 (36.2%) |
Occupancy by Educational Attainment in Fort Deposit
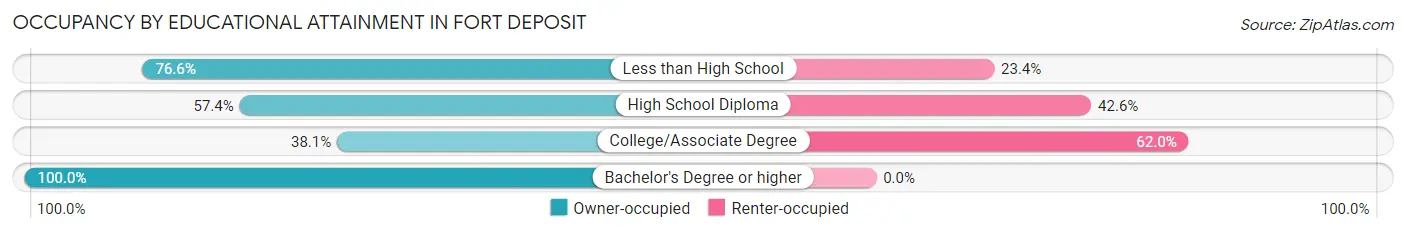
| Household Size | Owner-occupied | Renter-occupied |
| Less than High School | 154 (76.6%) | 47 (23.4%) |
| High School Diploma | 140 (57.4%) | 104 (42.6%) |
| College/Associate Degree | 43 (38.1%) | 70 (62.0%) |
| Bachelor's Degree or higher | 53 (100.0%) | 0 (0.0%) |
Occupancy by Age of Householder in Fort Deposit
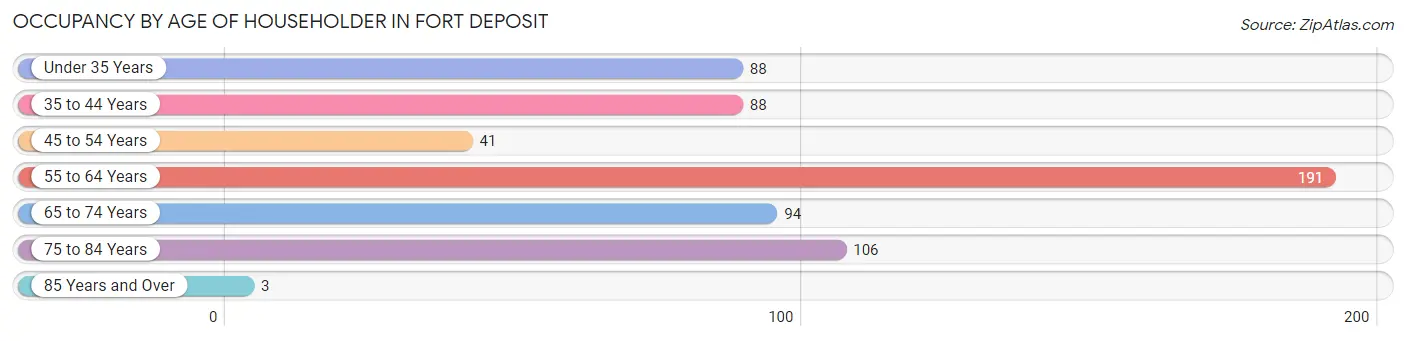
| Age Bracket | # Households | % Households |
| Under 35 Years | 88 | 14.4% |
| 35 to 44 Years | 88 | 14.4% |
| 45 to 54 Years | 41 | 6.7% |
| 55 to 64 Years | 191 | 31.3% |
| 65 to 74 Years | 94 | 15.4% |
| 75 to 84 Years | 106 | 17.3% |
| 85 Years and Over | 3 | 0.5% |
| Total | 611 | 100.0% |
Housing Finances in Fort Deposit
Median Income by Occupancy in Fort Deposit
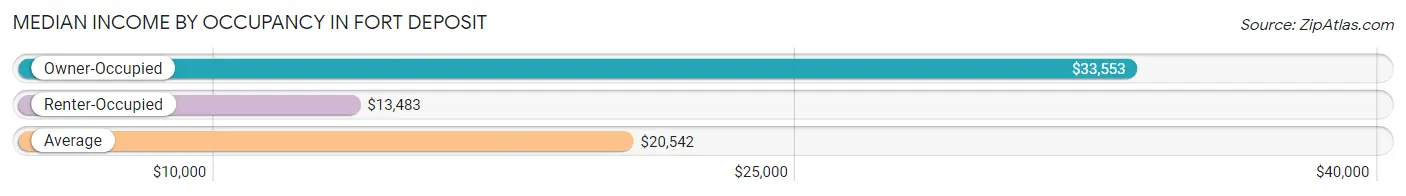
| Occupancy Type | # Households | Median Income |
| Owner-Occupied | 390 (63.8%) | $33,553 |
| Renter-Occupied | 221 (36.2%) | $13,483 |
| Average | 611 (100.0%) | $20,542 |
Occupancy by Householder Income Bracket in Fort Deposit
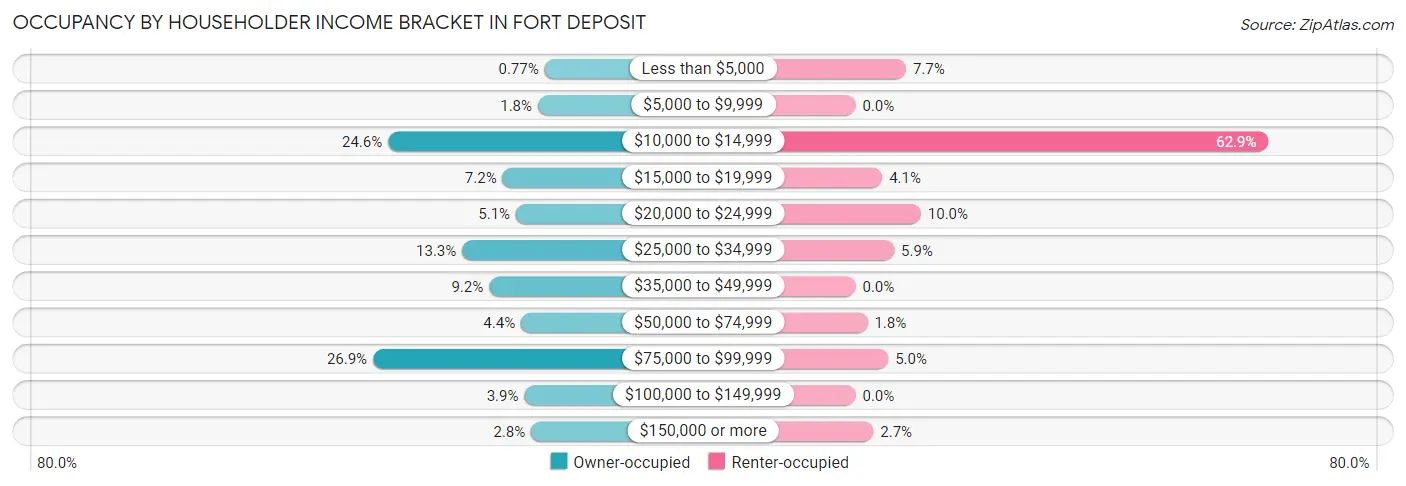
| Income Bracket | Owner-occupied | Renter-occupied |
| Less than $5,000 | 3 (0.8%) | 17 (7.7%) |
| $5,000 to $9,999 | 7 (1.8%) | 0 (0.0%) |
| $10,000 to $14,999 | 96 (24.6%) | 139 (62.9%) |
| $15,000 to $19,999 | 28 (7.2%) | 9 (4.1%) |
| $20,000 to $24,999 | 20 (5.1%) | 22 (10.0%) |
| $25,000 to $34,999 | 52 (13.3%) | 13 (5.9%) |
| $35,000 to $49,999 | 36 (9.2%) | 0 (0.0%) |
| $50,000 to $74,999 | 17 (4.4%) | 4 (1.8%) |
| $75,000 to $99,999 | 105 (26.9%) | 11 (5.0%) |
| $100,000 to $149,999 | 15 (3.8%) | 0 (0.0%) |
| $150,000 or more | 11 (2.8%) | 6 (2.7%) |
| Total | 390 (100.0%) | 221 (100.0%) |
Monthly Housing Cost Tiers in Fort Deposit
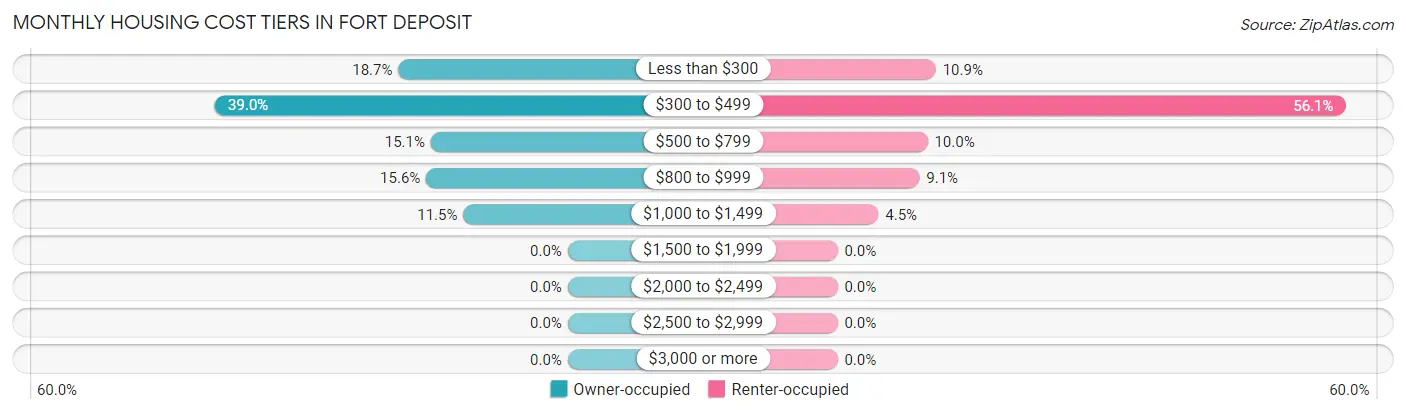
| Monthly Cost | Owner-occupied | Renter-occupied |
| Less than $300 | 73 (18.7%) | 24 (10.9%) |
| $300 to $499 | 152 (39.0%) | 124 (56.1%) |
| $500 to $799 | 59 (15.1%) | 22 (10.0%) |
| $800 to $999 | 61 (15.6%) | 20 (9.0%) |
| $1,000 to $1,499 | 45 (11.5%) | 10 (4.5%) |
| $1,500 to $1,999 | 0 (0.0%) | 0 (0.0%) |
| $2,000 to $2,499 | 0 (0.0%) | 0 (0.0%) |
| $2,500 to $2,999 | 0 (0.0%) | 0 (0.0%) |
| $3,000 or more | 0 (0.0%) | 0 (0.0%) |
| Total | 390 (100.0%) | 221 (100.0%) |
Physical Housing Characteristics in Fort Deposit
Housing Structures in Fort Deposit
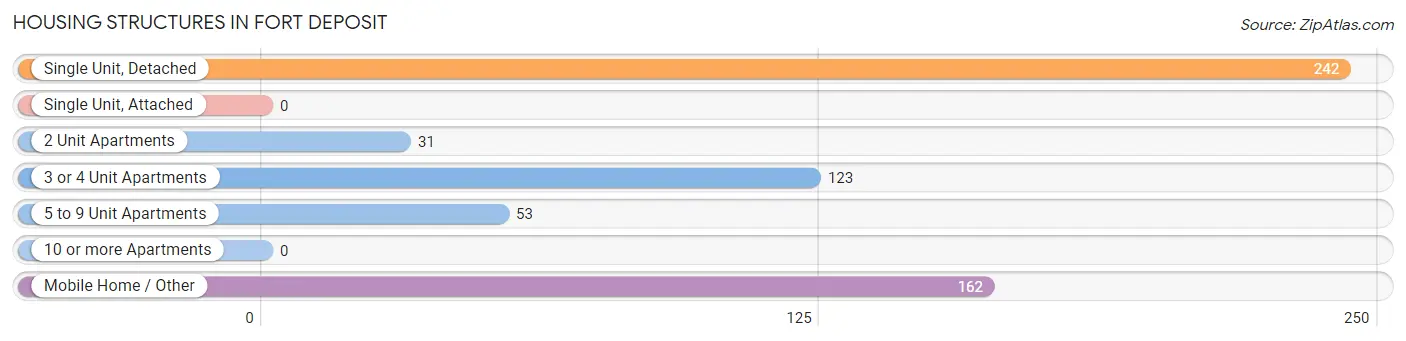
| Structure Type | # Housing Units | % Housing Units |
| Single Unit, Detached | 242 | 39.6% |
| Single Unit, Attached | 0 | 0.0% |
| 2 Unit Apartments | 31 | 5.1% |
| 3 or 4 Unit Apartments | 123 | 20.1% |
| 5 to 9 Unit Apartments | 53 | 8.7% |
| 10 or more Apartments | 0 | 0.0% |
| Mobile Home / Other | 162 | 26.5% |
| Total | 611 | 100.0% |
Housing Structures by Occupancy in Fort Deposit
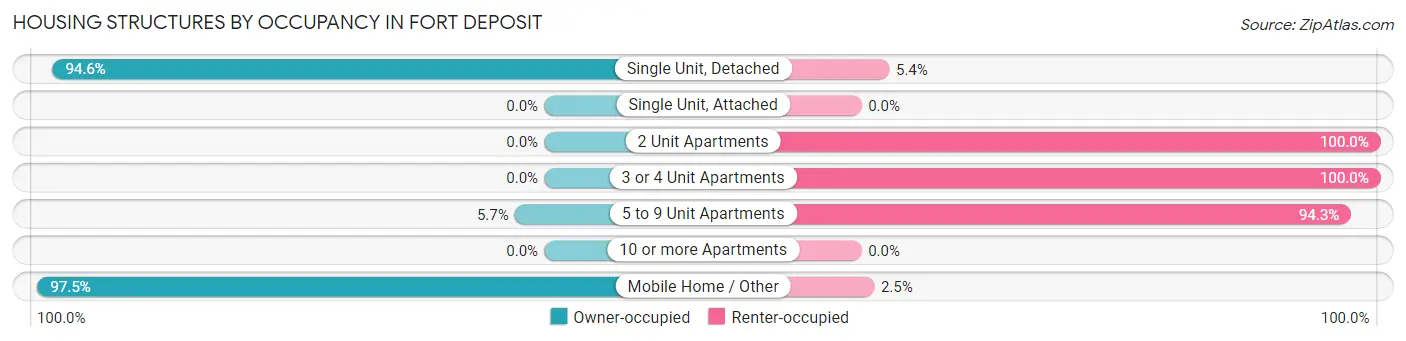
| Structure Type | Owner-occupied | Renter-occupied |
| Single Unit, Detached | 229 (94.6%) | 13 (5.4%) |
| Single Unit, Attached | 0 (0.0%) | 0 (0.0%) |
| 2 Unit Apartments | 0 (0.0%) | 31 (100.0%) |
| 3 or 4 Unit Apartments | 0 (0.0%) | 123 (100.0%) |
| 5 to 9 Unit Apartments | 3 (5.7%) | 50 (94.3%) |
| 10 or more Apartments | 0 (0.0%) | 0 (0.0%) |
| Mobile Home / Other | 158 (97.5%) | 4 (2.5%) |
| Total | 390 (63.8%) | 221 (36.2%) |
Housing Structures by Number of Rooms in Fort Deposit
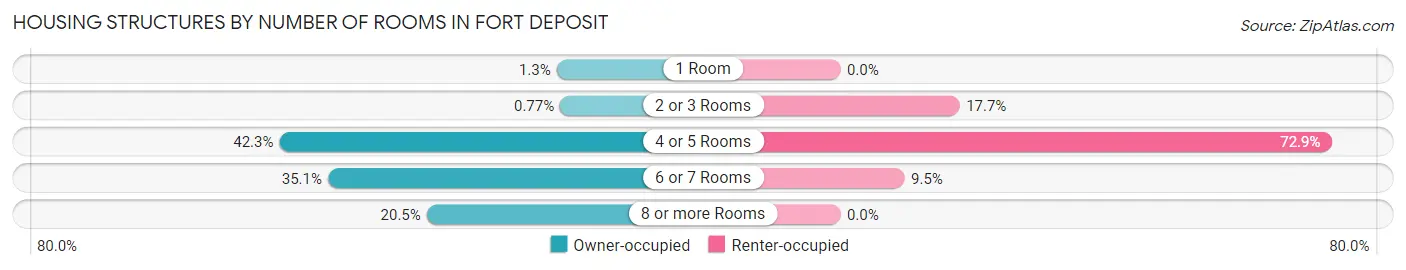
| Number of Rooms | Owner-occupied | Renter-occupied |
| 1 Room | 5 (1.3%) | 0 (0.0%) |
| 2 or 3 Rooms | 3 (0.8%) | 39 (17.6%) |
| 4 or 5 Rooms | 165 (42.3%) | 161 (72.9%) |
| 6 or 7 Rooms | 137 (35.1%) | 21 (9.5%) |
| 8 or more Rooms | 80 (20.5%) | 0 (0.0%) |
| Total | 390 (100.0%) | 221 (100.0%) |
Housing Structure by Heating Type in Fort Deposit
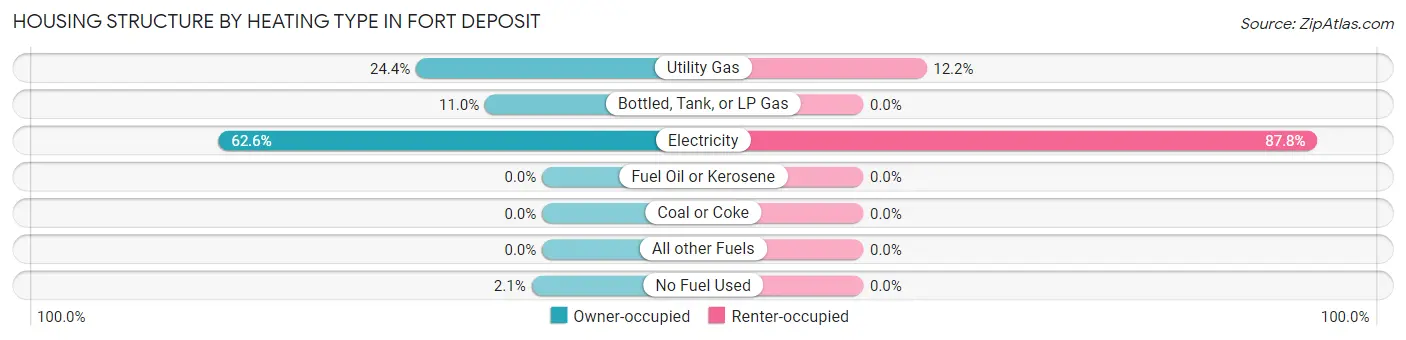
| Heating Type | Owner-occupied | Renter-occupied |
| Utility Gas | 95 (24.4%) | 27 (12.2%) |
| Bottled, Tank, or LP Gas | 43 (11.0%) | 0 (0.0%) |
| Electricity | 244 (62.6%) | 194 (87.8%) |
| Fuel Oil or Kerosene | 0 (0.0%) | 0 (0.0%) |
| Coal or Coke | 0 (0.0%) | 0 (0.0%) |
| All other Fuels | 0 (0.0%) | 0 (0.0%) |
| No Fuel Used | 8 (2.1%) | 0 (0.0%) |
| Total | 390 (100.0%) | 221 (100.0%) |
Household Vehicle Usage in Fort Deposit
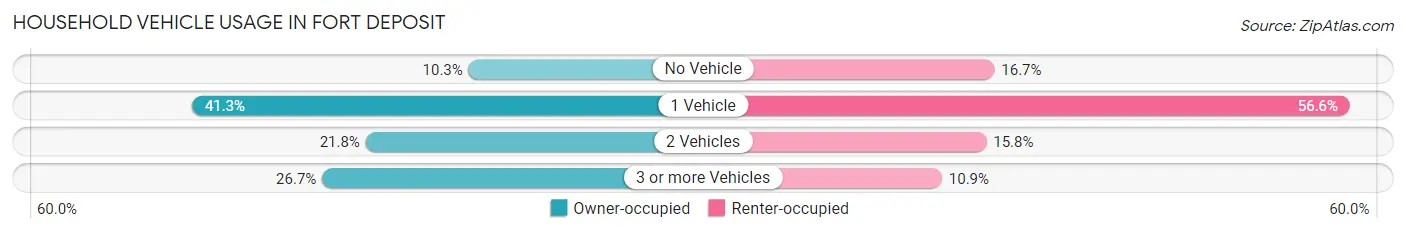
| Vehicles per Household | Owner-occupied | Renter-occupied |
| No Vehicle | 40 (10.3%) | 37 (16.7%) |
| 1 Vehicle | 161 (41.3%) | 125 (56.6%) |
| 2 Vehicles | 85 (21.8%) | 35 (15.8%) |
| 3 or more Vehicles | 104 (26.7%) | 24 (10.9%) |
| Total | 390 (100.0%) | 221 (100.0%) |
Real Estate & Mortgages in Fort Deposit
Real Estate and Mortgage Overview in Fort Deposit
| Characteristic | Without Mortgage | With Mortgage |
| Housing Units | 275 | 115 |
| Median Property Value | $50,700 | $76,800 |
| Median Household Income | $32,102 | $4 |
| Monthly Housing Costs | $380 | $0 |
| Real Estate Taxes | $291 | $71 |
Property Value by Mortgage Status in Fort Deposit
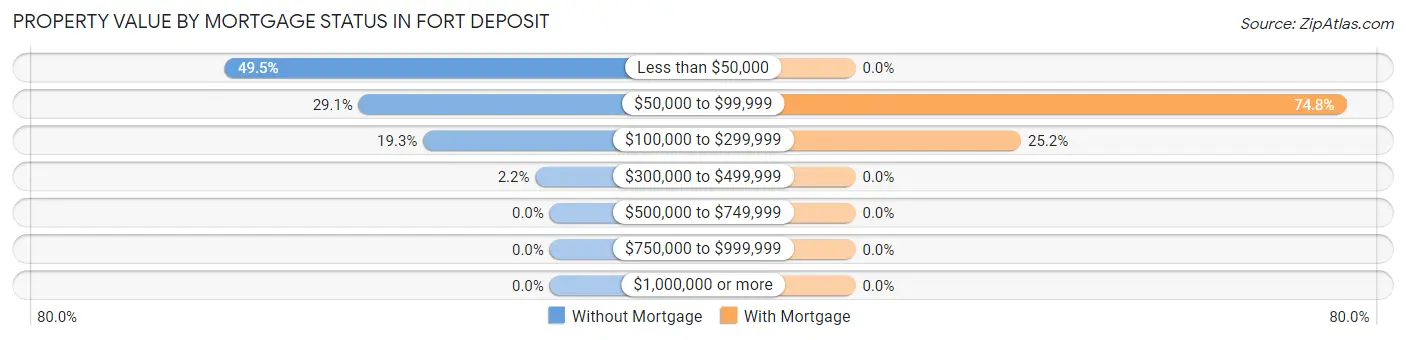
| Property Value | Without Mortgage | With Mortgage |
| Less than $50,000 | 136 (49.4%) | 0 (0.0%) |
| $50,000 to $99,999 | 80 (29.1%) | 86 (74.8%) |
| $100,000 to $299,999 | 53 (19.3%) | 29 (25.2%) |
| $300,000 to $499,999 | 6 (2.2%) | 0 (0.0%) |
| $500,000 to $749,999 | 0 (0.0%) | 0 (0.0%) |
| $750,000 to $999,999 | 0 (0.0%) | 0 (0.0%) |
| $1,000,000 or more | 0 (0.0%) | 0 (0.0%) |
| Total | 275 (100.0%) | 115 (100.0%) |
Household Income by Mortgage Status in Fort Deposit
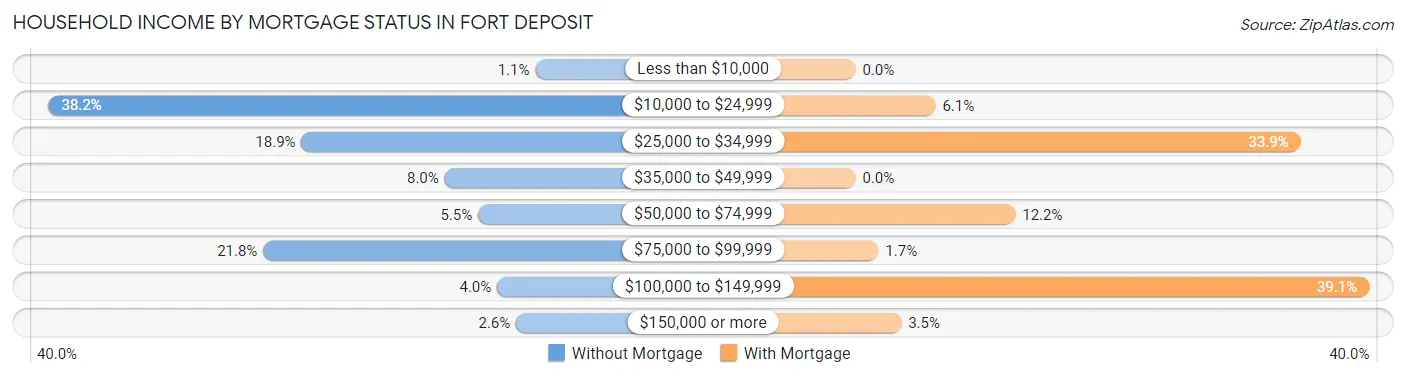
| Household Income | Without Mortgage | With Mortgage |
| Less than $10,000 | 3 (1.1%) | 0 (0.0%) |
| $10,000 to $24,999 | 105 (38.2%) | 7 (6.1%) |
| $25,000 to $34,999 | 52 (18.9%) | 39 (33.9%) |
| $35,000 to $49,999 | 22 (8.0%) | 0 (0.0%) |
| $50,000 to $74,999 | 15 (5.4%) | 14 (12.2%) |
| $75,000 to $99,999 | 60 (21.8%) | 2 (1.7%) |
| $100,000 to $149,999 | 11 (4.0%) | 45 (39.1%) |
| $150,000 or more | 7 (2.5%) | 4 (3.5%) |
| Total | 275 (100.0%) | 115 (100.0%) |
Property Value to Household Income Ratio in Fort Deposit
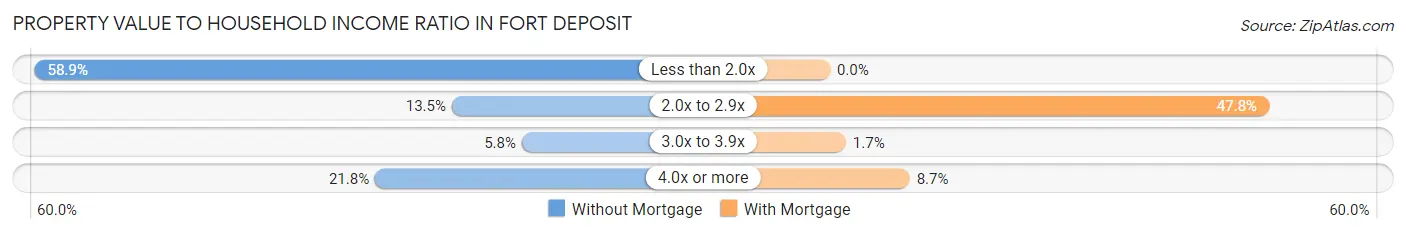
| Value-to-Income Ratio | Without Mortgage | With Mortgage |
| Less than 2.0x | 162 (58.9%) | 0 (0.0%) |
| 2.0x to 2.9x | 37 (13.5%) | 55 (47.8%) |
| 3.0x to 3.9x | 16 (5.8%) | 2 (1.7%) |
| 4.0x or more | 60 (21.8%) | 10 (8.7%) |
| Total | 275 (100.0%) | 115 (100.0%) |
Real Estate Taxes by Mortgage Status in Fort Deposit
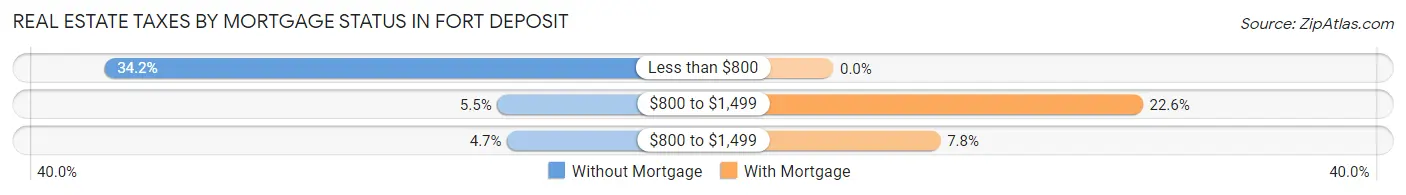
| Property Taxes | Without Mortgage | With Mortgage |
| Less than $800 | 94 (34.2%) | 0 (0.0%) |
| $800 to $1,499 | 15 (5.4%) | 26 (22.6%) |
| $800 to $1,499 | 13 (4.7%) | 9 (7.8%) |
| Total | 275 (100.0%) | 115 (100.0%) |
Health & Disability in Fort Deposit
Health Insurance Coverage by Age in Fort Deposit
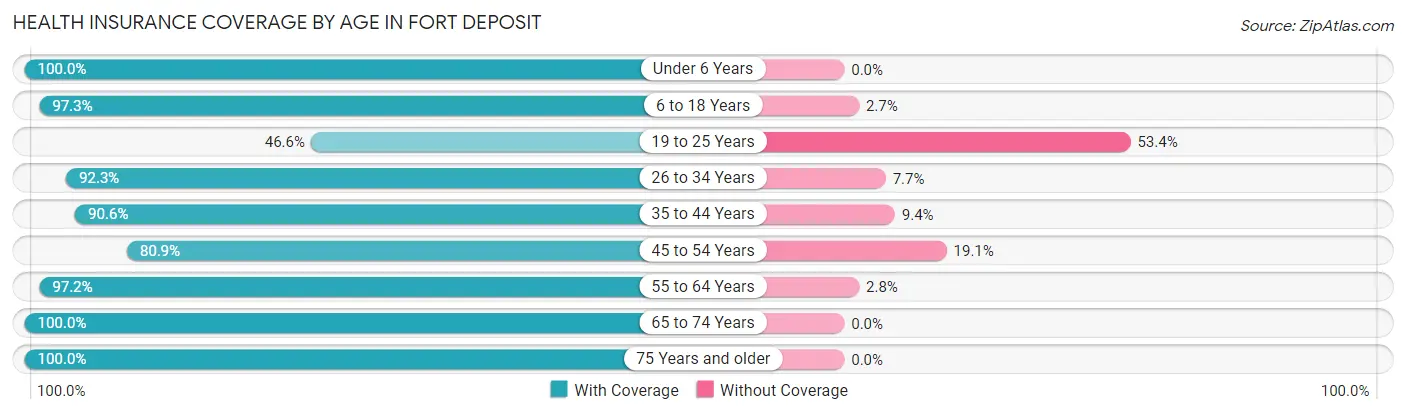
| Age Bracket | With Coverage | Without Coverage |
| Under 6 Years | 101 (100.0%) | 0 (0.0%) |
| 6 to 18 Years | 355 (97.3%) | 10 (2.7%) |
| 19 to 25 Years | 97 (46.6%) | 111 (53.4%) |
| 26 to 34 Years | 239 (92.3%) | 20 (7.7%) |
| 35 to 44 Years | 125 (90.6%) | 13 (9.4%) |
| 45 to 54 Years | 123 (80.9%) | 29 (19.1%) |
| 55 to 64 Years | 247 (97.2%) | 7 (2.8%) |
| 65 to 74 Years | 139 (100.0%) | 0 (0.0%) |
| 75 Years and older | 118 (100.0%) | 0 (0.0%) |
| Total | 1,544 (89.0%) | 190 (11.0%) |
Health Insurance Coverage by Citizenship Status in Fort Deposit
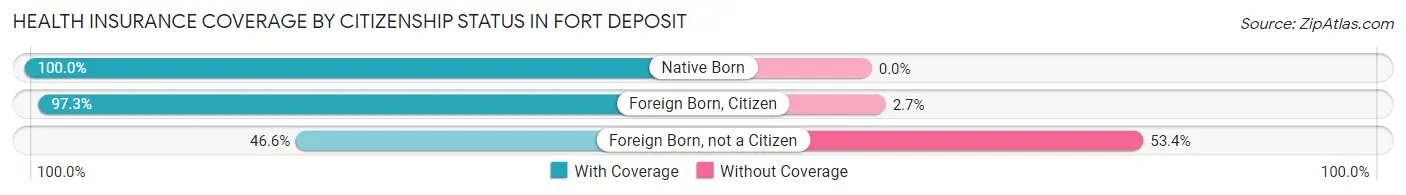
| Citizenship Status | With Coverage | Without Coverage |
| Native Born | 101 (100.0%) | 0 (0.0%) |
| Foreign Born, Citizen | 355 (97.3%) | 10 (2.7%) |
| Foreign Born, not a Citizen | 97 (46.6%) | 111 (53.4%) |
Health Insurance Coverage by Household Income in Fort Deposit
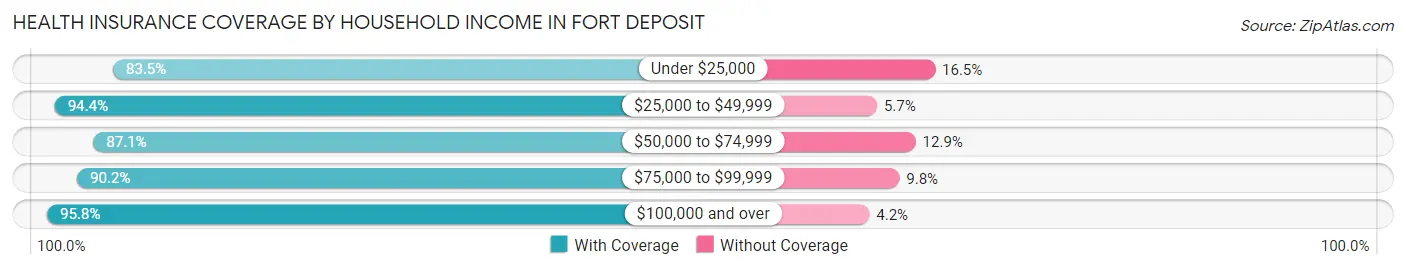
| Household Income | With Coverage | Without Coverage |
| Under $25,000 | 530 (83.5%) | 105 (16.5%) |
| $25,000 to $49,999 | 384 (94.4%) | 23 (5.7%) |
| $50,000 to $74,999 | 54 (87.1%) | 8 (12.9%) |
| $75,000 to $99,999 | 440 (90.2%) | 48 (9.8%) |
| $100,000 and over | 136 (95.8%) | 6 (4.2%) |
Public vs Private Health Insurance Coverage by Age in Fort Deposit
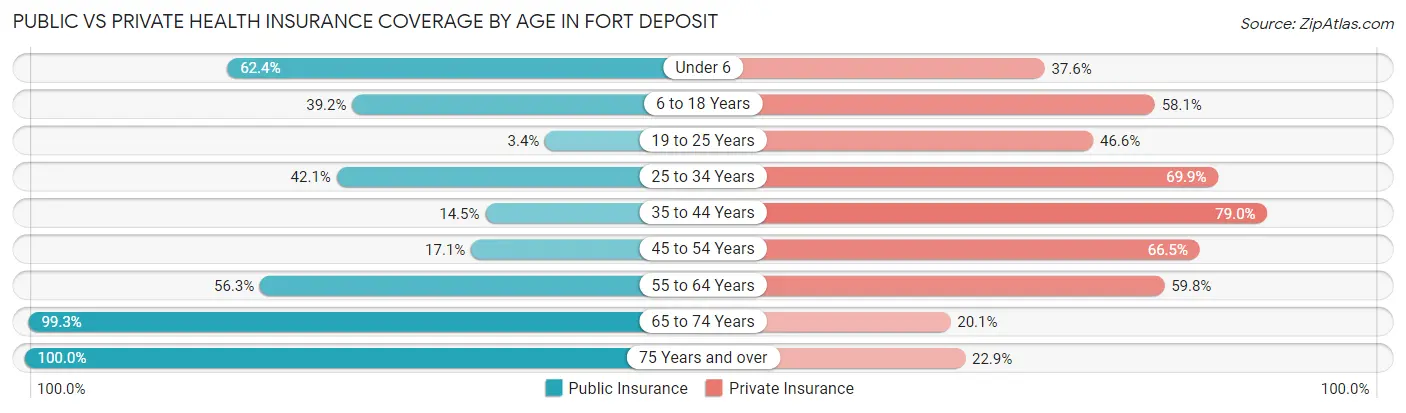
| Age Bracket | Public Insurance | Private Insurance |
| Under 6 | 63 (62.4%) | 38 (37.6%) |
| 6 to 18 Years | 143 (39.2%) | 212 (58.1%) |
| 19 to 25 Years | 7 (3.4%) | 97 (46.6%) |
| 25 to 34 Years | 109 (42.1%) | 181 (69.9%) |
| 35 to 44 Years | 20 (14.5%) | 109 (79.0%) |
| 45 to 54 Years | 26 (17.1%) | 101 (66.4%) |
| 55 to 64 Years | 143 (56.3%) | 152 (59.8%) |
| 65 to 74 Years | 138 (99.3%) | 28 (20.1%) |
| 75 Years and over | 118 (100.0%) | 27 (22.9%) |
| Total | 767 (44.2%) | 945 (54.5%) |
Disability Status by Sex by Age in Fort Deposit
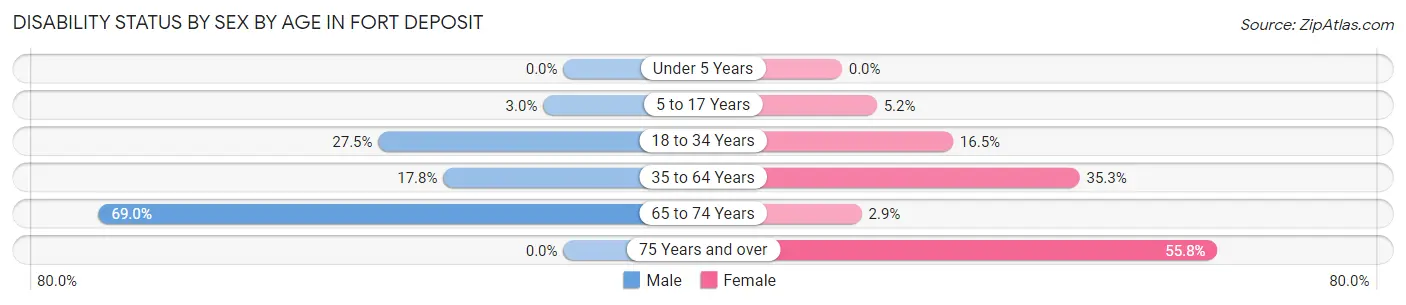
| Age Bracket | Male | Female |
| Under 5 Years | 0 (0.0%) | 0 (0.0%) |
| 5 to 17 Years | 5 (3.0%) | 11 (5.2%) |
| 18 to 34 Years | 75 (27.5%) | 34 (16.5%) |
| 35 to 64 Years | 46 (17.8%) | 101 (35.3%) |
| 65 to 74 Years | 49 (69.0%) | 2 (2.9%) |
| 75 Years and over | 0 (0.0%) | 29 (55.8%) |
Disability Class by Sex by Age in Fort Deposit
Disability Class: Hearing Difficulty
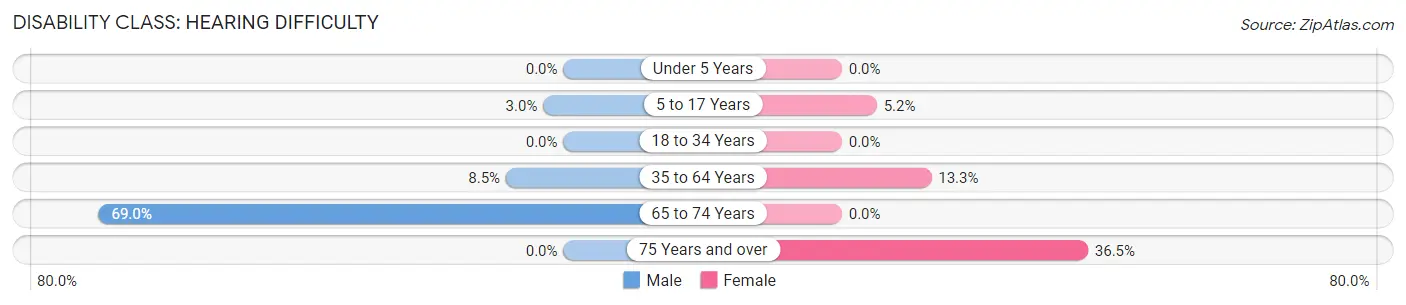
| Age Bracket | Male | Female |
| Under 5 Years | 0 (0.0%) | 0 (0.0%) |
| 5 to 17 Years | 5 (3.0%) | 11 (5.2%) |
| 18 to 34 Years | 0 (0.0%) | 0 (0.0%) |
| 35 to 64 Years | 22 (8.5%) | 38 (13.3%) |
| 65 to 74 Years | 49 (69.0%) | 0 (0.0%) |
| 75 Years and over | 0 (0.0%) | 19 (36.5%) |
Disability Class: Vision Difficulty
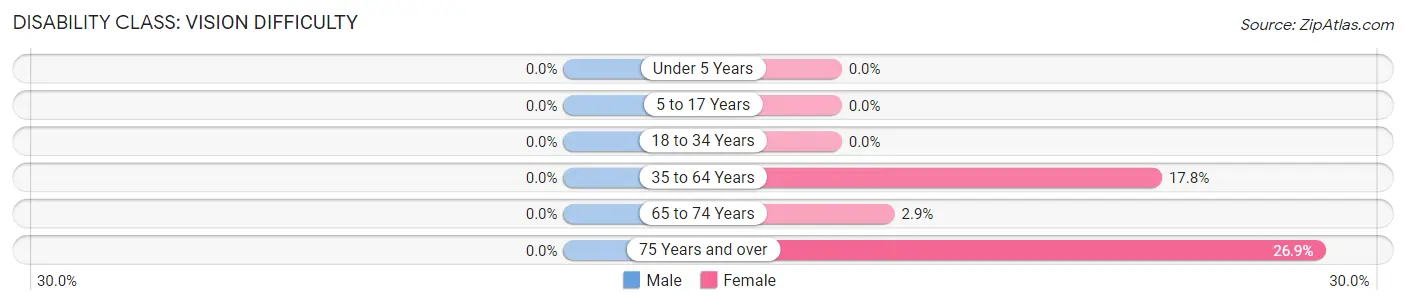
| Age Bracket | Male | Female |
| Under 5 Years | 0 (0.0%) | 0 (0.0%) |
| 5 to 17 Years | 0 (0.0%) | 0 (0.0%) |
| 18 to 34 Years | 0 (0.0%) | 0 (0.0%) |
| 35 to 64 Years | 0 (0.0%) | 51 (17.8%) |
| 65 to 74 Years | 0 (0.0%) | 2 (2.9%) |
| 75 Years and over | 0 (0.0%) | 14 (26.9%) |
Disability Class: Cognitive Difficulty
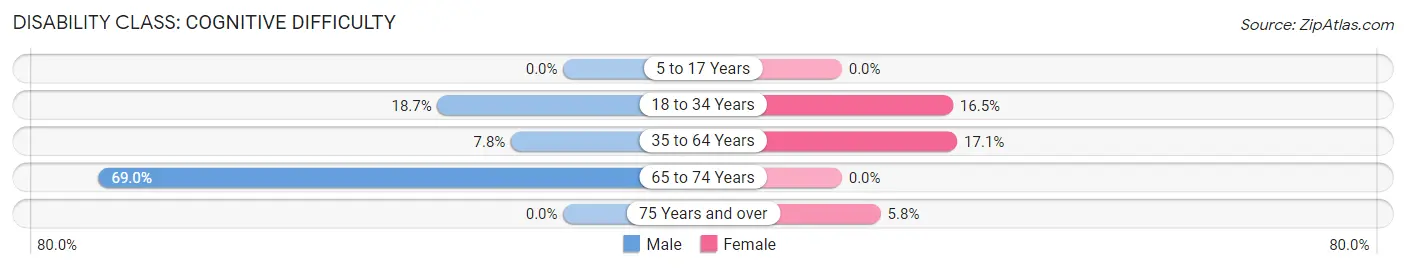
| Age Bracket | Male | Female |
| 5 to 17 Years | 0 (0.0%) | 0 (0.0%) |
| 18 to 34 Years | 51 (18.7%) | 34 (16.5%) |
| 35 to 64 Years | 20 (7.7%) | 49 (17.1%) |
| 65 to 74 Years | 49 (69.0%) | 0 (0.0%) |
| 75 Years and over | 0 (0.0%) | 3 (5.8%) |
Disability Class: Ambulatory Difficulty
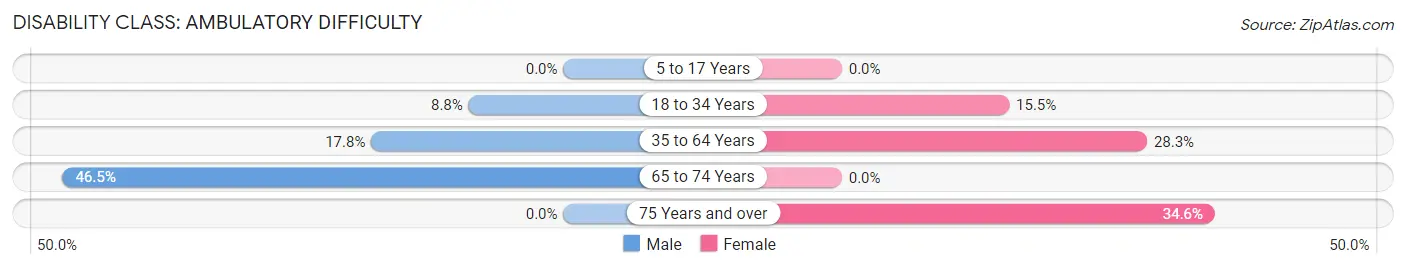
| Age Bracket | Male | Female |
| 5 to 17 Years | 0 (0.0%) | 0 (0.0%) |
| 18 to 34 Years | 24 (8.8%) | 32 (15.5%) |
| 35 to 64 Years | 46 (17.8%) | 81 (28.3%) |
| 65 to 74 Years | 33 (46.5%) | 0 (0.0%) |
| 75 Years and over | 0 (0.0%) | 18 (34.6%) |
Disability Class: Self-Care Difficulty
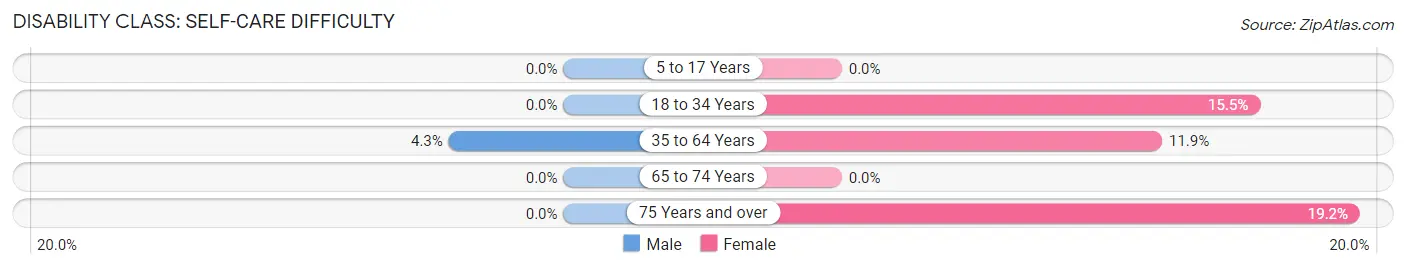
| Age Bracket | Male | Female |
| 5 to 17 Years | 0 (0.0%) | 0 (0.0%) |
| 18 to 34 Years | 0 (0.0%) | 32 (15.5%) |
| 35 to 64 Years | 11 (4.3%) | 34 (11.9%) |
| 65 to 74 Years | 0 (0.0%) | 0 (0.0%) |
| 75 Years and over | 0 (0.0%) | 10 (19.2%) |
Technology Access in Fort Deposit
Computing Device Access in Fort Deposit
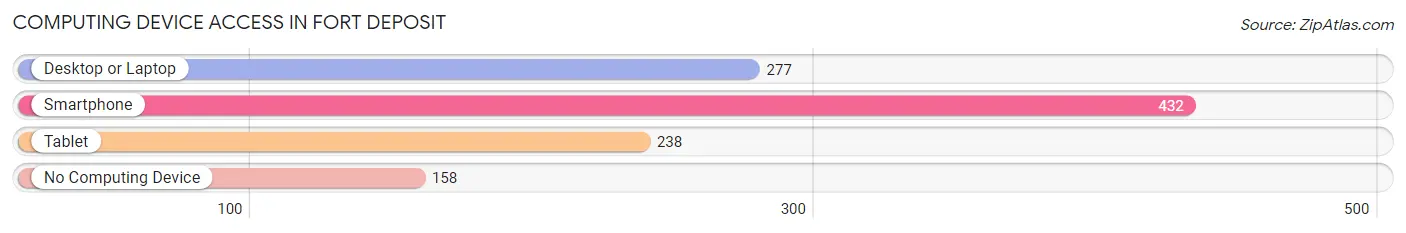
| Device Type | # Households | % Households |
| Desktop or Laptop | 277 | 45.3% |
| Smartphone | 432 | 70.7% |
| Tablet | 238 | 39.0% |
| No Computing Device | 158 | 25.9% |
| Total | 611 | 100.0% |
Internet Access in Fort Deposit
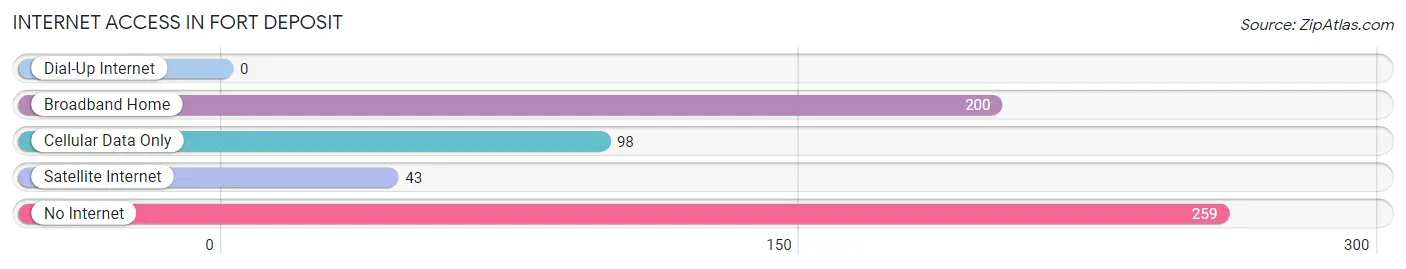
| Internet Type | # Households | % Households |
| Dial-Up Internet | 0 | 0.0% |
| Broadband Home | 200 | 32.7% |
| Cellular Data Only | 98 | 16.0% |
| Satellite Internet | 43 | 7.0% |
| No Internet | 259 | 42.4% |
| Total | 611 | 100.0% |
Fort Deposit Summary
Introduction
Fort Deposit is a small town located in Lowndes County, Alabama. It is situated on the banks of the Alabama River and is part of the Montgomery Metropolitan Statistical Area. The town was founded in 1819 and was named after a fort that was built in the area during the Creek War of 1813-1814. The town has a population of 1,845 as of the 2010 census and is known for its historic buildings and its rural charm.
History
Fort Deposit was founded in 1819 by settlers from Georgia and South Carolina. The town was named after a fort that was built in the area during the Creek War of 1813-1814. The fort was used to protect settlers from Native American attacks. The town was incorporated in 1821 and was the county seat of Lowndes County until 1868 when it was moved to Hayneville.
The town was an important stop on the stagecoach route between Montgomery and Mobile. It was also a major trading center for cotton and other agricultural products. During the Civil War, the town was occupied by Union forces and served as a supply depot. After the war, the town experienced a period of growth and prosperity.
In the late 19th century, Fort Deposit was a major center for the timber industry. The town was also home to several sawmills and a cotton gin. The town experienced a period of decline in the early 20th century as the timber industry declined and the Great Depression hit the area.
Geography
Fort Deposit is located in Lowndes County, Alabama. It is situated on the banks of the Alabama River and is part of the Montgomery Metropolitan Statistical Area. The town has a total area of 2.2 square miles, all of which is land. The town is located in the Black Belt region of Alabama and is known for its rural charm.
Economy
Fort Deposit has a diverse economy. The town is home to several small businesses, including a grocery store, a hardware store, and a restaurant. The town is also home to a number of manufacturing companies, including a furniture manufacturer and a plastics manufacturer. The town is also home to a number of agricultural businesses, including a cotton gin and a poultry farm.
Demographics
As of the 2010 census, Fort Deposit had a population of 1,845. The racial makeup of the town was 79.3% White, 18.2% African American, 0.3% Native American, 0.2% Asian, 0.1% Pacific Islander, 0.7% from other races, and 1.4% from two or more races. Hispanic or Latino of any race were 1.7% of the population.
Conclusion
Fort Deposit is a small town located in Lowndes County, Alabama. It was founded in 1819 and was named after a fort that was built in the area during the Creek War of 1813-1814. The town has a population of 1,845 as of the 2010 census and is known for its historic buildings and its rural charm. The town has a diverse economy and is home to several small businesses, manufacturing companies, and agricultural businesses. The racial makeup of the town is 79.3% White, 18.2% African American, 0.3% Native American, 0.2% Asian, 0.1% Pacific Islander, 0.7% from other races, and 1.4% from two or more races.
Common Questions
What is Per Capita Income in Fort Deposit?
Per Capita income in Fort Deposit is $15,694.
What is the Median Family Income in Fort Deposit?
Median Family Income in Fort Deposit is $32,609.
What is the Median Household income in Fort Deposit?
Median Household Income in Fort Deposit is $20,542.
What is Income or Wage Gap in Fort Deposit?
Income or Wage Gap in Fort Deposit is 31.2%.
Women in Fort Deposit earn 68.8 cents for every dollar earned by a man.
What is Inequality or Gini Index in Fort Deposit?
Inequality or Gini Index in Fort Deposit is 0.50.
What is the Total Population of Fort Deposit?
Total Population of Fort Deposit is 1,734.
What is the Total Male Population of Fort Deposit?
Total Male Population of Fort Deposit is 865.
What is the Total Female Population of Fort Deposit?
Total Female Population of Fort Deposit is 869.
What is the Ratio of Males per 100 Females in Fort Deposit?
There are 99.54 Males per 100 Females in Fort Deposit.
What is the Ratio of Females per 100 Males in Fort Deposit?
There are 100.46 Females per 100 Males in Fort Deposit.
What is the Median Population Age in Fort Deposit?
Median Population Age in Fort Deposit is 34.3 Years.
What is the Average Family Size in Fort Deposit
Average Family Size in Fort Deposit is 3.7 People.
What is the Average Household Size in Fort Deposit
Average Household Size in Fort Deposit is 2.8 People.
How Large is the Labor Force in Fort Deposit?
There are 595 People in the Labor Forcein in Fort Deposit.
What is the Percentage of People in the Labor Force in Fort Deposit?
44.5% of People are in the Labor Force in Fort Deposit.
What is the Unemployment Rate in Fort Deposit?
Unemployment Rate in Fort Deposit is 22.6%.