Forkland, AL
Forkland Map
Forkland Overview
995
TOTAL POPULATION
314
MALE POPULATION
681
FEMALE POPULATION
46.11
MALES / 100 FEMALES
216.88
FEMALES / 100 MALES
44.0
MEDIAN AGE
5.8
AVG FAMILY SIZE
3.4
AVG HOUSEHOLD SIZE
$14,487
PER CAPITA INCOME
$29,020
AVG FAMILY INCOME
$28,367
AVG HOUSEHOLD INCOME
21.7%
WAGE / INCOME GAP [ % ]
78.3¢/ $1
WAGE / INCOME GAP [ $ ]
0.44
INEQUALITY / GINI INDEX
205
LABOR FORCE [ PEOPLE ]
24.7%
PERCENT IN LABOR FORCE
6.8%
UNEMPLOYMENT RATE
Forkland Zip Codes
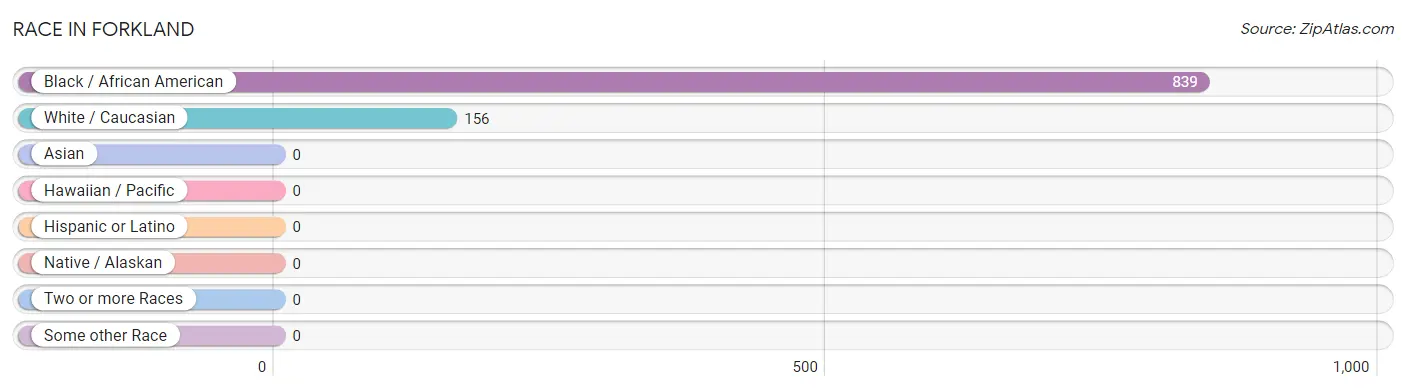
Race in Forkland
The most populous races in Forkland are Black / African American (839 | 84.3%), and White / Caucasian (156 | 15.7%).
| Race | # Population | % Population |
| Asian | 0 | 0.0% |
| Black / African American | 839 | 84.3% |
| Hawaiian / Pacific | 0 | 0.0% |
| Hispanic or Latino | 0 | 0.0% |
| Native / Alaskan | 0 | 0.0% |
| White / Caucasian | 156 | 15.7% |
| Two or more Races | 0 | 0.0% |
| Some other Race | 0 | 0.0% |
| Total | 995 | 100.0% |
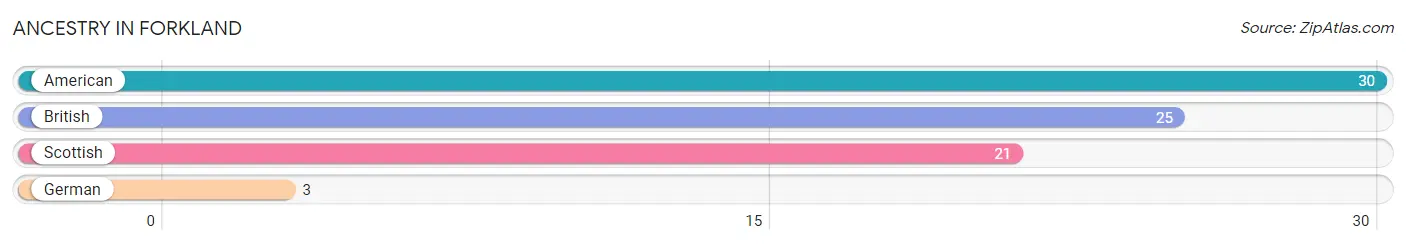
Ancestry in Forkland
The most populous ancestries reported in Forkland are American (30 | 3.0%), British (25 | 2.5%), Scottish (21 | 2.1%), and German (3 | 0.3%), together accounting for 7.9% of all Forkland residents.
| Ancestry | # Population | % Population |
| American | 30 | 3.0% |
| British | 25 | 2.5% |
| German | 3 | 0.3% |
| Scottish | 21 | 2.1% | View All 4 Rows |
Immigrants in Forkland

| Immigration Origin | # Population | % Population | View All 0 Rows |
Sex and Age in Forkland
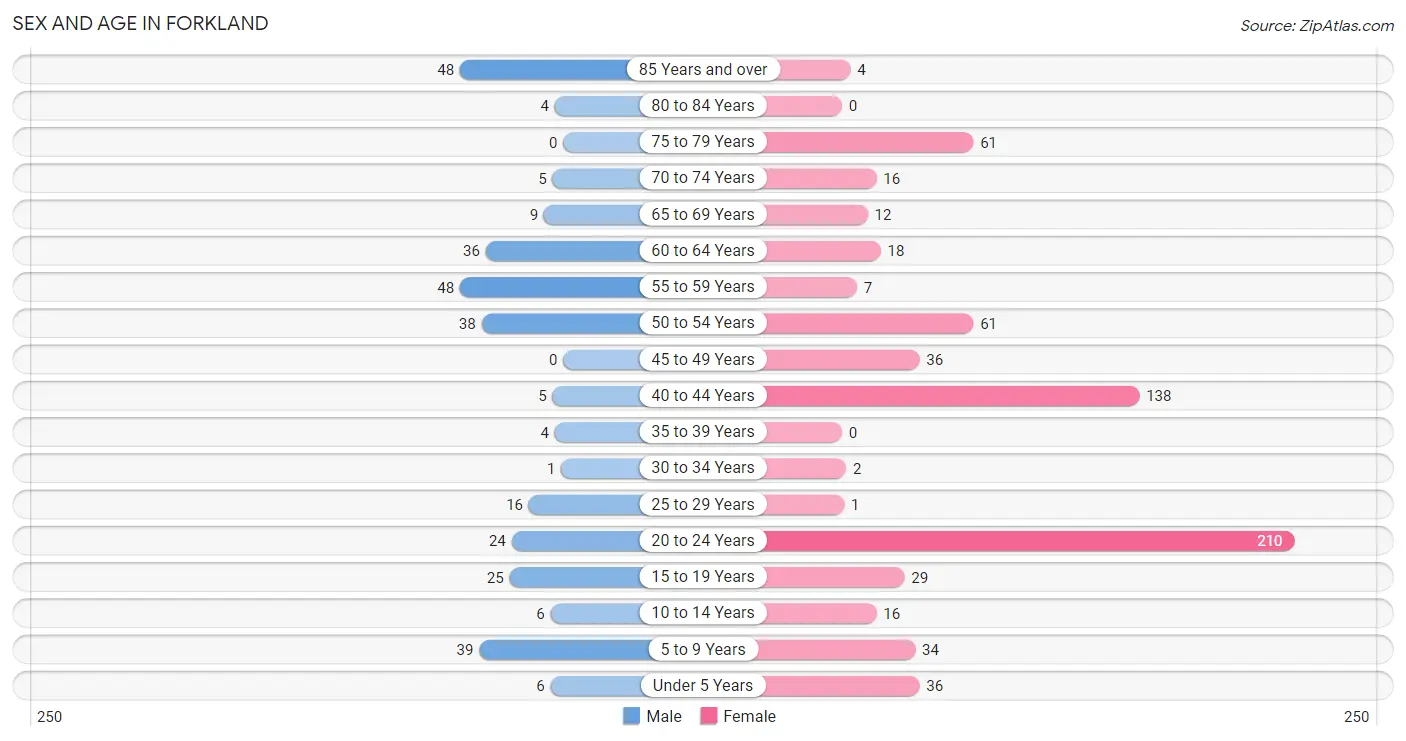
Sex and Age in Forkland
The most populous age groups in Forkland are 55 to 59 Years (48 | 15.3%) for men and 20 to 24 Years (210 | 30.8%) for women.
| Age Bracket | Male | Female |
| Under 5 Years | 6 (1.9%) | 36 (5.3%) |
| 5 to 9 Years | 39 (12.4%) | 34 (5.0%) |
| 10 to 14 Years | 6 (1.9%) | 16 (2.4%) |
| 15 to 19 Years | 25 (8.0%) | 29 (4.3%) |
| 20 to 24 Years | 24 (7.6%) | 210 (30.8%) |
| 25 to 29 Years | 16 (5.1%) | 1 (0.2%) |
| 30 to 34 Years | 1 (0.3%) | 2 (0.3%) |
| 35 to 39 Years | 4 (1.3%) | 0 (0.0%) |
| 40 to 44 Years | 5 (1.6%) | 138 (20.3%) |
| 45 to 49 Years | 0 (0.0%) | 36 (5.3%) |
| 50 to 54 Years | 38 (12.1%) | 61 (9.0%) |
| 55 to 59 Years | 48 (15.3%) | 7 (1.0%) |
| 60 to 64 Years | 36 (11.5%) | 18 (2.6%) |
| 65 to 69 Years | 9 (2.9%) | 12 (1.8%) |
| 70 to 74 Years | 5 (1.6%) | 16 (2.4%) |
| 75 to 79 Years | 0 (0.0%) | 61 (9.0%) |
| 80 to 84 Years | 4 (1.3%) | 0 (0.0%) |
| 85 Years and over | 48 (15.3%) | 4 (0.6%) |
| Total | 314 (100.0%) | 681 (100.0%) |
Families and Households in Forkland
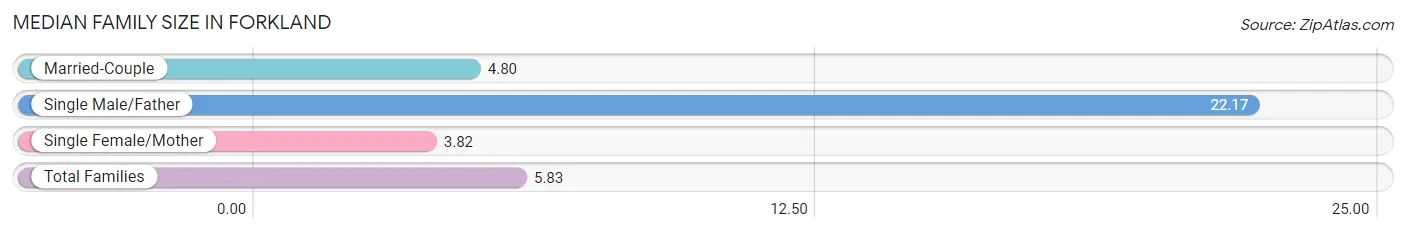
Median Family Size in Forkland
The median family size in Forkland is 5.83 persons per family, with single male/father families (12 | 8.6%) accounting for the largest median family size of 22.17 persons per family. On the other hand, single female/mother families (67 | 48.2%) represent the smallest median family size with 3.82 persons per family.
| Family Type | # Families | Family Size |
| Married-Couple | 60 (43.2%) | 4.80 |
| Single Male/Father | 12 (8.6%) | 22.17 |
| Single Female/Mother | 67 (48.2%) | 3.82 |
| Total Families | 139 (100.0%) | 5.83 |
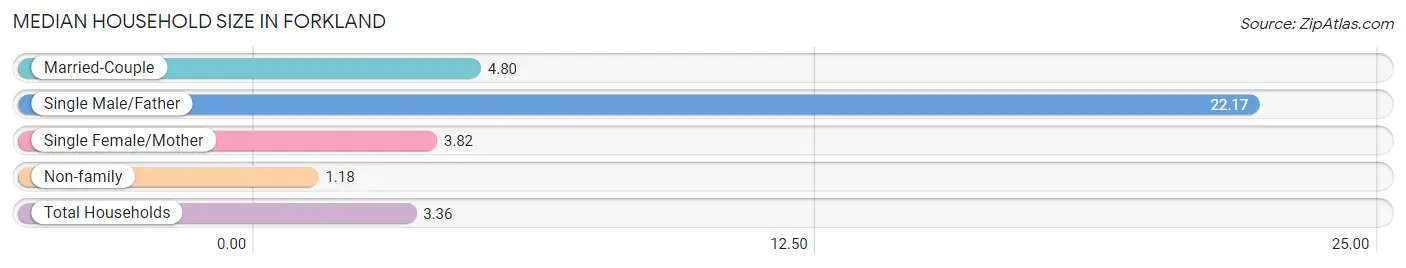
Median Household Size in Forkland
The median household size in Forkland is 3.36 persons per household, with single male/father households (12 | 4.1%) accounting for the largest median household size of 22.17 persons per household. non-family households (157 | 53.0%) represent the smallest median household size with 1.18 persons per household.
| Household Type | # Households | Household Size |
| Married-Couple | 60 (20.3%) | 4.80 |
| Single Male/Father | 12 (4.1%) | 22.17 |
| Single Female/Mother | 67 (22.6%) | 3.82 |
| Non-family | 157 (53.0%) | 1.18 |
| Total Households | 296 (100.0%) | 3.36 |
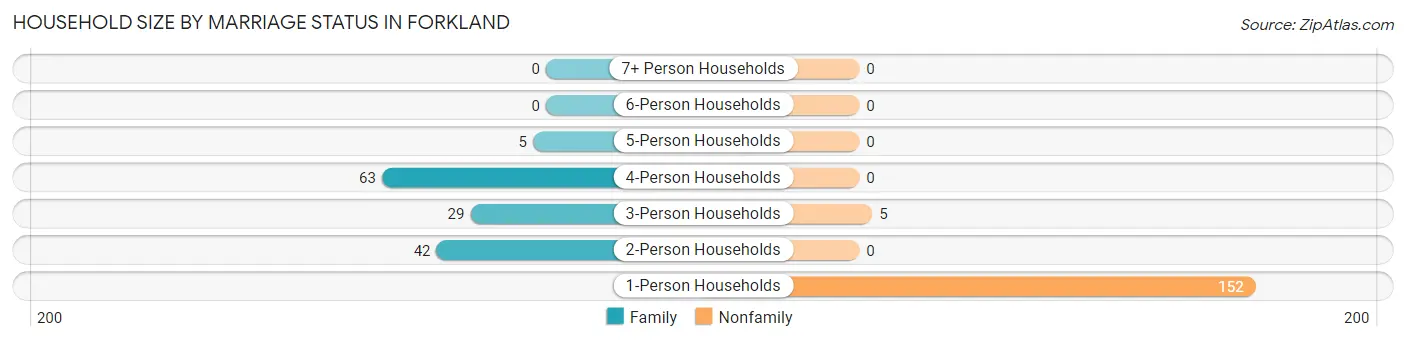
Household Size by Marriage Status in Forkland
Out of a total of 296 households in Forkland, 139 (47.0%) are family households, while 157 (53.0%) are nonfamily households. The most numerous type of family households are 4-person households, comprising 63, and the most common type of nonfamily households are 1-person households, comprising 152.
| Household Size | Family Households | Nonfamily Households |
| 1-Person Households | - | 152 (51.3%) |
| 2-Person Households | 42 (14.2%) | 0 (0.0%) |
| 3-Person Households | 29 (9.8%) | 5 (1.7%) |
| 4-Person Households | 63 (21.3%) | 0 (0.0%) |
| 5-Person Households | 5 (1.7%) | 0 (0.0%) |
| 6-Person Households | 0 (0.0%) | 0 (0.0%) |
| 7+ Person Households | 0 (0.0%) | 0 (0.0%) |
| Total | 139 (47.0%) | 157 (53.0%) |
Female Fertility in Forkland
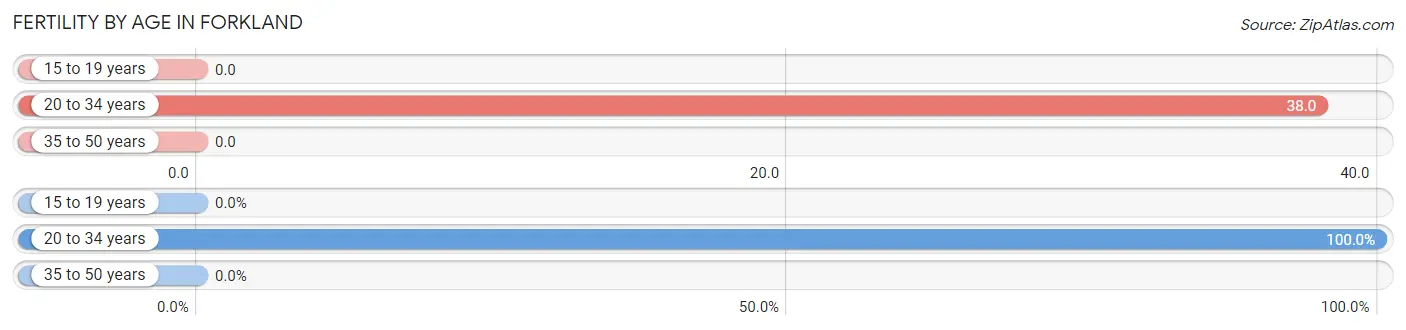
Fertility by Age in Forkland
Average fertility rate in Forkland is 18.0 births per 1,000 women. Women in the age bracket of 20 to 34 years have the highest fertility rate with 38.0 births per 1,000 women. Women in the age bracket of 20 to 34 years acount for 100.0% of all women with births.
| Age Bracket | Women with Births | Births / 1,000 Women |
| 15 to 19 years | 0 (0.0%) | 0.0 |
| 20 to 34 years | 8 (100.0%) | 38.0 |
| 35 to 50 years | 0 (0.0%) | 0.0 |
| Total | 8 (100.0%) | 18.0 |
Fertility by Age by Marriage Status in Forkland
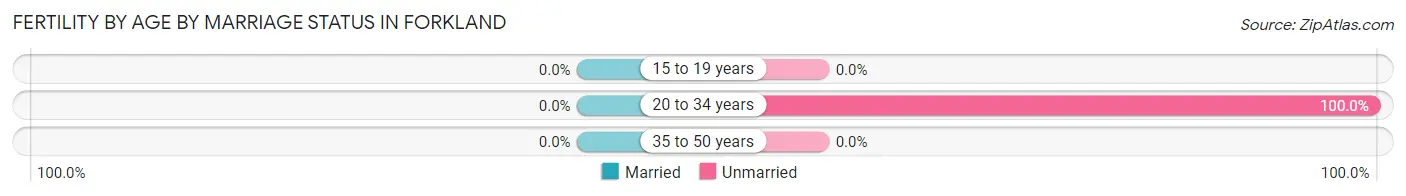
| Age Bracket | Married | Unmarried |
| 15 to 19 years | 0 (0.0%) | 0 (0.0%) |
| 20 to 34 years | 0 (0.0%) | 8 (100.0%) |
| 35 to 50 years | 0 (0.0%) | 0 (0.0%) |
| Total | 0 (0.0%) | 8 (100.0%) |
Fertility by Education in Forkland
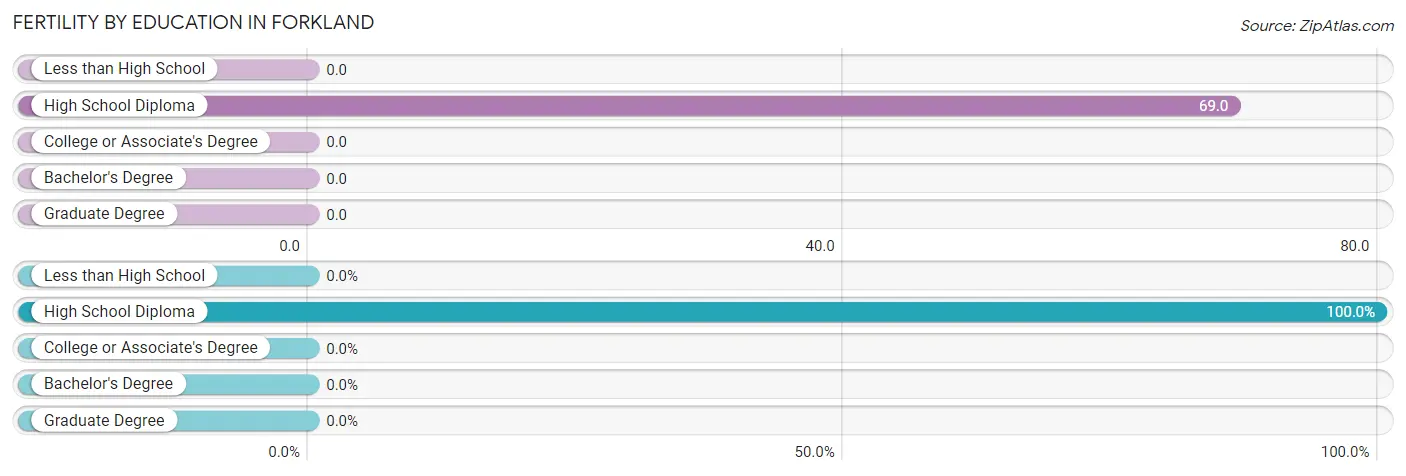
| Educational Attainment | Women with Births | Births / 1,000 Women |
| Less than High School | 0 (0.0%) | 0.0 |
| High School Diploma | 8 (100.0%) | 69.0 |
| College or Associate's Degree | 0 (0.0%) | 0.0 |
| Bachelor's Degree | 0 (0.0%) | 0.0 |
| Graduate Degree | 0 (0.0%) | 0.0 |
| Total | 8 (100.0%) | 18.0 |
Fertility by Education by Marriage Status in Forkland
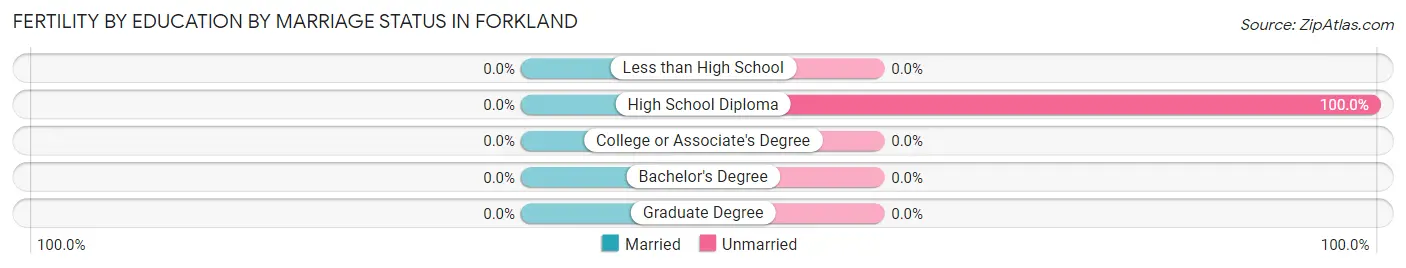
| Educational Attainment | Married | Unmarried |
| Less than High School | 0 (0.0%) | 0 (0.0%) |
| High School Diploma | 0 (0.0%) | 8 (100.0%) |
| College or Associate's Degree | 0 (0.0%) | 0 (0.0%) |
| Bachelor's Degree | 0 (0.0%) | 0 (0.0%) |
| Graduate Degree | 0 (0.0%) | 0 (0.0%) |
| Total | 0 (0.0%) | 8 (100.0%) |
Income in Forkland
Income Overview in Forkland
Per Capita Income in Forkland is $14,487, while median incomes of families and households are $29,020 and $28,367 respectively.
| Characteristic | Number | Measure |
| Per Capita Income | 995 | $14,487 |
| Median Family Income | 139 | $29,020 |
| Mean Family Income | 139 | $42,131 |
| Median Household Income | 296 | $28,367 |
| Mean Household Income | 296 | $42,494 |
| Income Deficit | 139 | $0 |
| Wage / Income Gap (%) | 995 | 21.68% |
| Wage / Income Gap ($) | 995 | 78.32¢ per $1 |
| Gini / Inequality Index | 995 | 0.44 |
Earnings by Sex in Forkland
Average Earnings in Forkland are $25,076, $26,406 for men and $20,682 for women, a difference of 21.7%.
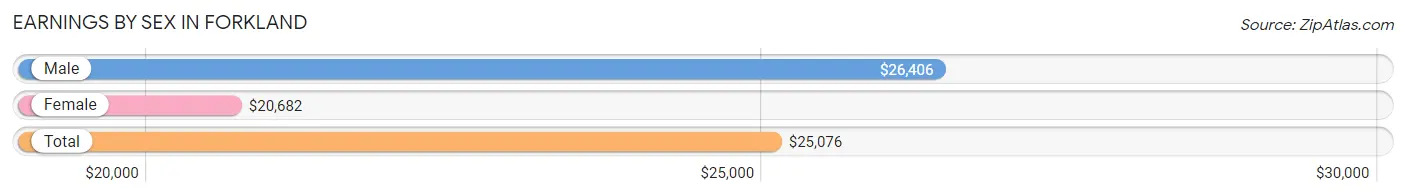
| Sex | Number | Average Earnings |
| Male | 116 (59.8%) | $26,406 |
| Female | 78 (40.2%) | $20,682 |
| Total | 194 (100.0%) | $25,076 |
Earnings by Sex by Income Bracket in Forkland
The most common earnings brackets in Forkland are $2,500 to $4,999 for men (27 | 23.3%) and $25,000 to $29,999 for women (17 | 21.8%).
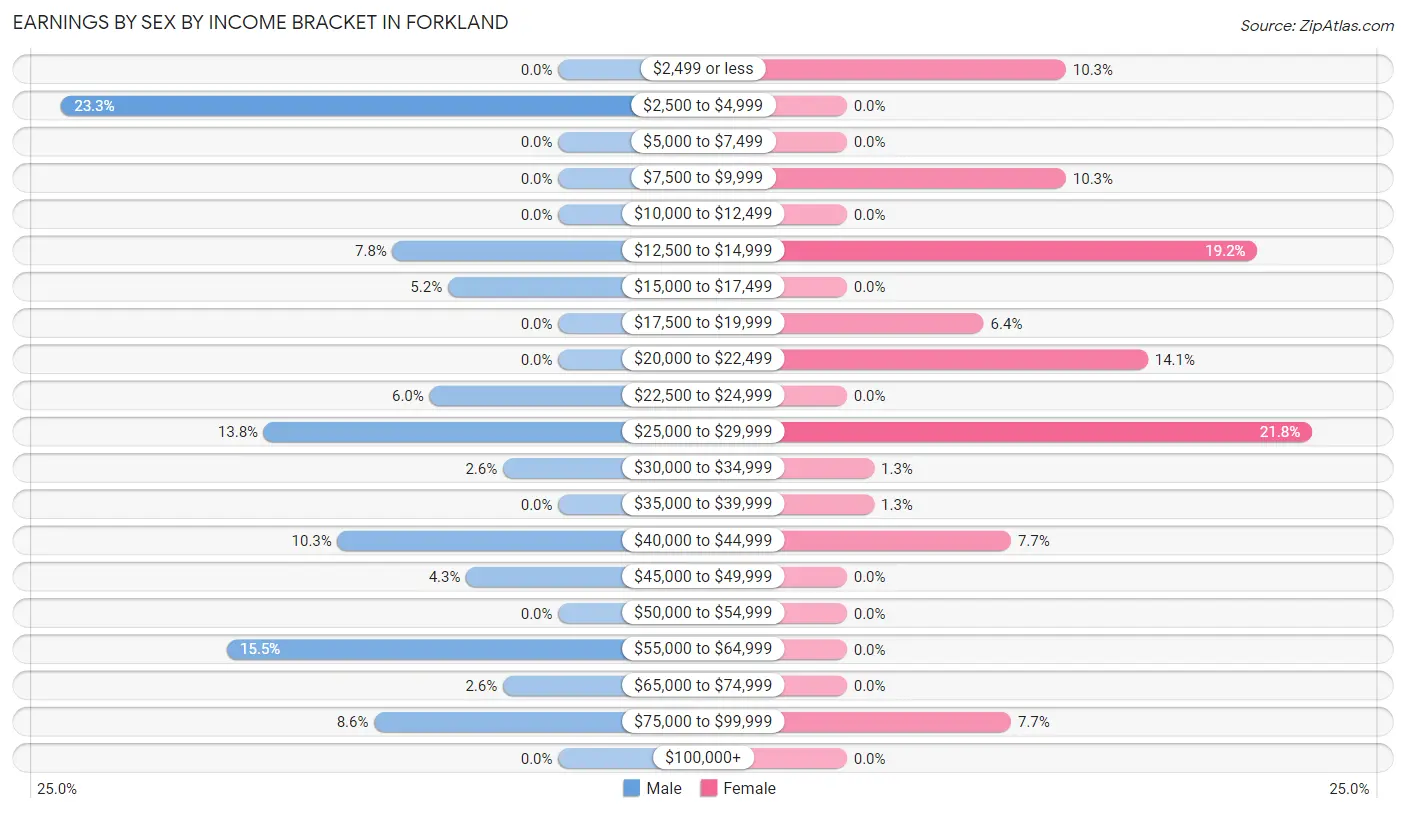
| Income | Male | Female |
| $2,499 or less | 0 (0.0%) | 8 (10.3%) |
| $2,500 to $4,999 | 27 (23.3%) | 0 (0.0%) |
| $5,000 to $7,499 | 0 (0.0%) | 0 (0.0%) |
| $7,500 to $9,999 | 0 (0.0%) | 8 (10.3%) |
| $10,000 to $12,499 | 0 (0.0%) | 0 (0.0%) |
| $12,500 to $14,999 | 9 (7.8%) | 15 (19.2%) |
| $15,000 to $17,499 | 6 (5.2%) | 0 (0.0%) |
| $17,500 to $19,999 | 0 (0.0%) | 5 (6.4%) |
| $20,000 to $22,499 | 0 (0.0%) | 11 (14.1%) |
| $22,500 to $24,999 | 7 (6.0%) | 0 (0.0%) |
| $25,000 to $29,999 | 16 (13.8%) | 17 (21.8%) |
| $30,000 to $34,999 | 3 (2.6%) | 1 (1.3%) |
| $35,000 to $39,999 | 0 (0.0%) | 1 (1.3%) |
| $40,000 to $44,999 | 12 (10.3%) | 6 (7.7%) |
| $45,000 to $49,999 | 5 (4.3%) | 0 (0.0%) |
| $50,000 to $54,999 | 0 (0.0%) | 0 (0.0%) |
| $55,000 to $64,999 | 18 (15.5%) | 0 (0.0%) |
| $65,000 to $74,999 | 3 (2.6%) | 0 (0.0%) |
| $75,000 to $99,999 | 10 (8.6%) | 6 (7.7%) |
| $100,000+ | 0 (0.0%) | 0 (0.0%) |
| Total | 116 (100.0%) | 78 (100.0%) |
Earnings by Sex by Educational Attainment in Forkland
Average earnings in Forkland are $28,750 for men and $22,159 for women, a difference of 22.9%. Men with an educational attainment of high school diploma enjoy the highest average annual earnings of $25,156, while those with high school diploma education earn the least with $25,156. Women with an educational attainment of college or associate's degree earn the most with the average annual earnings of $25,515, while those with college or associate's degree education have the smallest earnings of $25,515.
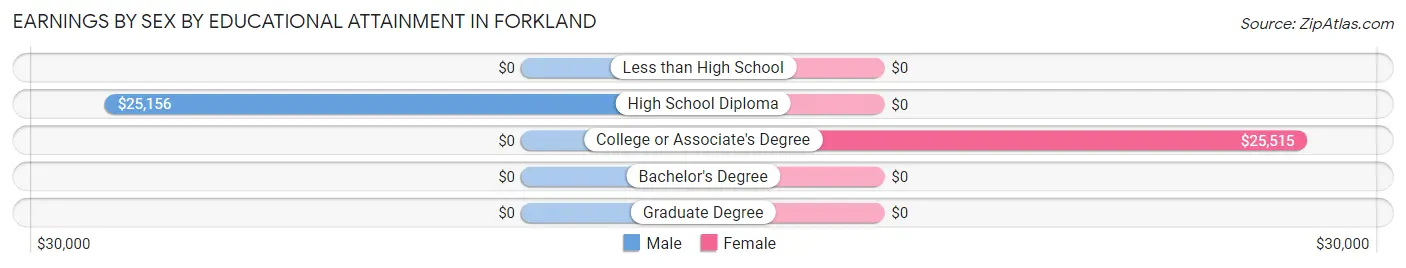
| Educational Attainment | Male Income | Female Income |
| Less than High School | - | - |
| High School Diploma | $25,156 | $0 |
| College or Associate's Degree | - | - |
| Bachelor's Degree | - | - |
| Graduate Degree | - | - |
| Total | $28,750 | $22,159 |
Family Income in Forkland
Family Income Brackets in Forkland
According to the Forkland family income data, there are 37 families falling into the $25,000 to $34,999 income range, which is the most common income bracket and makes up 26.6% of all families.
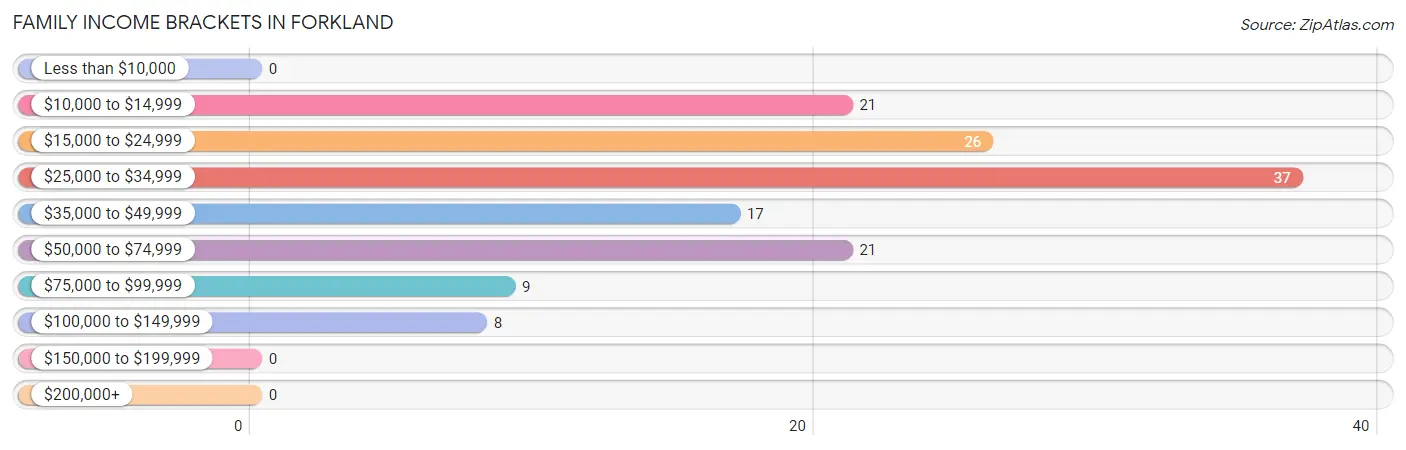
| Income Bracket | # Families | % Families |
| Less than $10,000 | 0 | 0.0% |
| $10,000 to $14,999 | 21 | 15.1% |
| $15,000 to $24,999 | 26 | 18.7% |
| $25,000 to $34,999 | 37 | 26.6% |
| $35,000 to $49,999 | 17 | 12.2% |
| $50,000 to $74,999 | 21 | 15.1% |
| $75,000 to $99,999 | 9 | 6.5% |
| $100,000 to $149,999 | 8 | 5.8% |
| $150,000 to $199,999 | 0 | 0.0% |
| $200,000+ | 0 | 0.0% |
Family Income by Famaliy Size in Forkland
2-person families (42 | 30.2%) account for the highest median family income in Forkland with $21,471 per family, while 2-person families (42 | 30.2%) have the highest median income of $10,736 per family member.
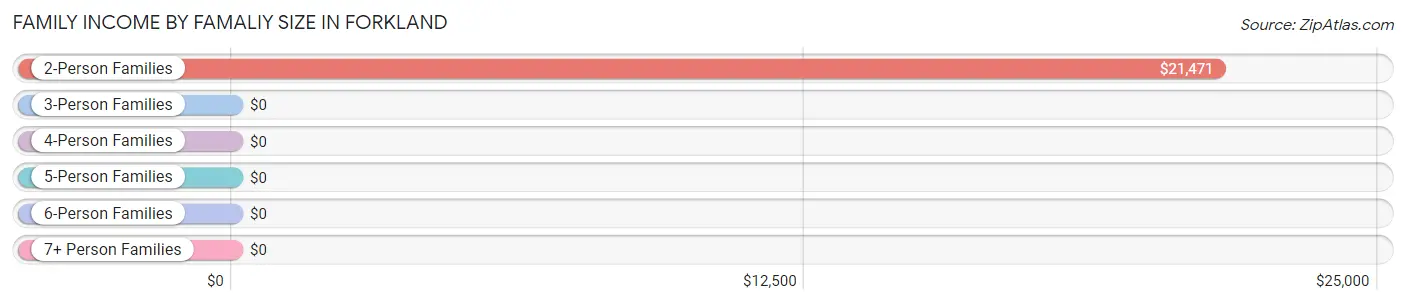
| Income Bracket | # Families | Median Income |
| 2-Person Families | 42 (30.2%) | $21,471 |
| 3-Person Families | 29 (20.9%) | $0 |
| 4-Person Families | 63 (45.3%) | $0 |
| 5-Person Families | 5 (3.6%) | $0 |
| 6-Person Families | 0 (0.0%) | $0 |
| 7+ Person Families | 0 (0.0%) | $0 |
| Total | 139 (100.0%) | $29,020 |
Family Income by Number of Earners in Forkland
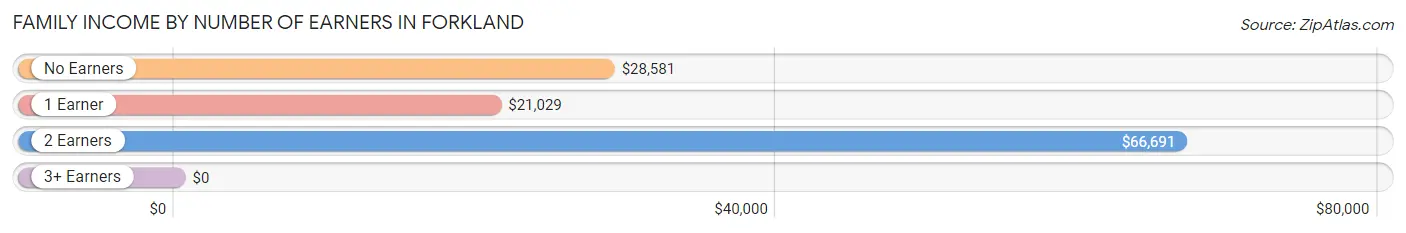
| Number of Earners | # Families | Median Income |
| No Earners | 58 (41.7%) | $28,581 |
| 1 Earner | 48 (34.5%) | $21,029 |
| 2 Earners | 31 (22.3%) | $66,691 |
| 3+ Earners | 2 (1.4%) | $0 |
| Total | 139 (100.0%) | $29,020 |
Household Income in Forkland
Household Income Brackets in Forkland
With 70 households falling in the category, the $10,000 to $14,999 income range is the most frequent in Forkland, accounting for 23.6% of all households.
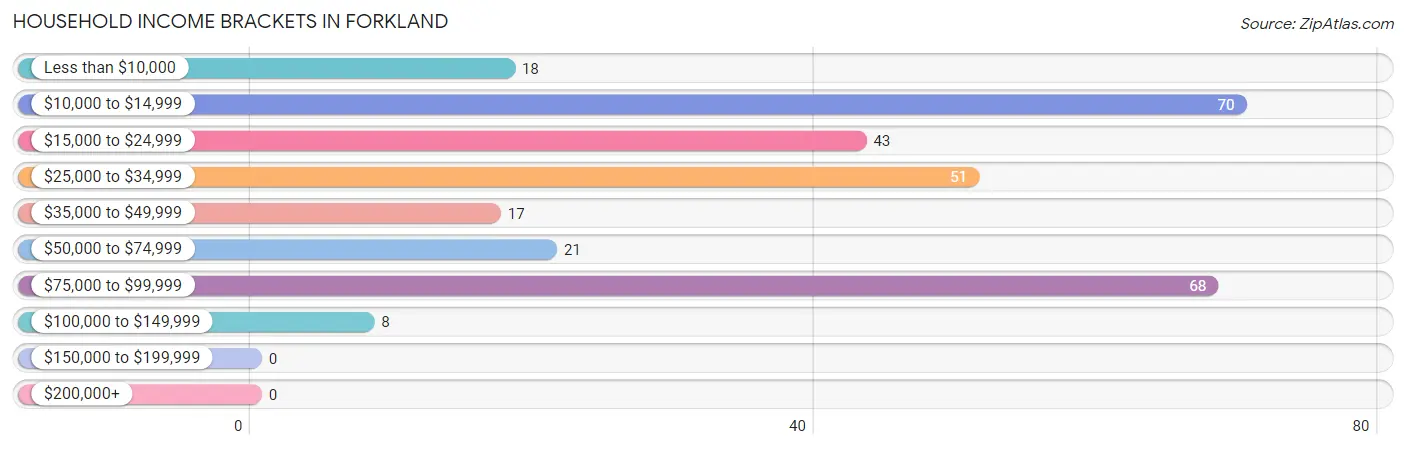
| Income Bracket | # Households | % Households |
| Less than $10,000 | 18 | 6.1% |
| $10,000 to $14,999 | 70 | 23.6% |
| $15,000 to $24,999 | 43 | 14.5% |
| $25,000 to $34,999 | 51 | 17.2% |
| $35,000 to $49,999 | 17 | 5.7% |
| $50,000 to $74,999 | 21 | 7.1% |
| $75,000 to $99,999 | 68 | 23.0% |
| $100,000 to $149,999 | 8 | 2.7% |
| $150,000 to $199,999 | 0 | 0.0% |
| $200,000+ | 0 | 0.0% |
Household Income by Householder Age in Forkland
The median household income in Forkland is $28,367, with the highest median household income of $21,103 found in the 45 to 64 years age bracket for the primary householder. A total of 141 households (47.6%) fall into this category.
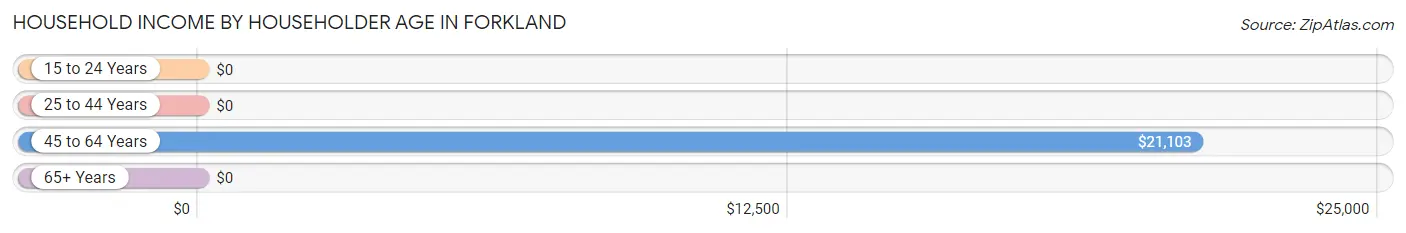
| Income Bracket | # Households | Median Income |
| 15 to 24 Years | 0 (0.0%) | $0 |
| 25 to 44 Years | 5 (1.7%) | $0 |
| 45 to 64 Years | 141 (47.6%) | $21,103 |
| 65+ Years | 150 (50.7%) | $0 |
| Total | 296 (100.0%) | $28,367 |
Poverty in Forkland
Income Below Poverty by Sex and Age in Forkland
With 36.9% poverty level for males and 29.7% for females among the residents of Forkland, 5 year old males and 75 year old and over females are the most vulnerable to poverty, with 12 males (100.0%) and 65 females (100.0%) in their respective age groups living below the poverty level.
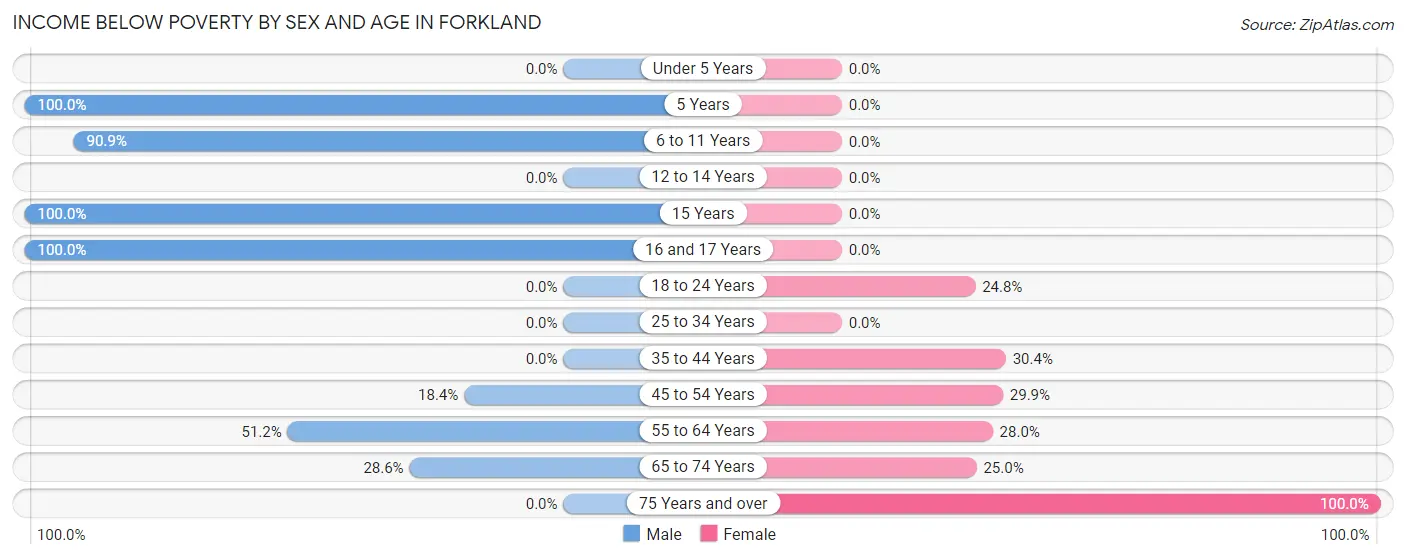
| Age Bracket | Male | Female |
| Under 5 Years | 0 (0.0%) | 0 (0.0%) |
| 5 Years | 12 (100.0%) | 0 (0.0%) |
| 6 to 11 Years | 30 (90.9%) | 0 (0.0%) |
| 12 to 14 Years | 0 (0.0%) | 0 (0.0%) |
| 15 Years | 5 (100.0%) | 0 (0.0%) |
| 16 and 17 Years | 15 (100.0%) | 0 (0.0%) |
| 18 to 24 Years | 0 (0.0%) | 52 (24.8%) |
| 25 to 34 Years | 0 (0.0%) | 0 (0.0%) |
| 35 to 44 Years | 0 (0.0%) | 42 (30.4%) |
| 45 to 54 Years | 7 (18.4%) | 29 (29.9%) |
| 55 to 64 Years | 43 (51.2%) | 7 (28.0%) |
| 65 to 74 Years | 4 (28.6%) | 7 (25.0%) |
| 75 Years and over | 0 (0.0%) | 65 (100.0%) |
| Total | 116 (36.9%) | 202 (29.7%) |
Income Above Poverty by Sex and Age in Forkland
According to the poverty statistics in Forkland, males aged under 5 years and females aged under 5 years are the age groups that are most secure financially, with 100.0% of males and 100.0% of females in these age groups living above the poverty line.
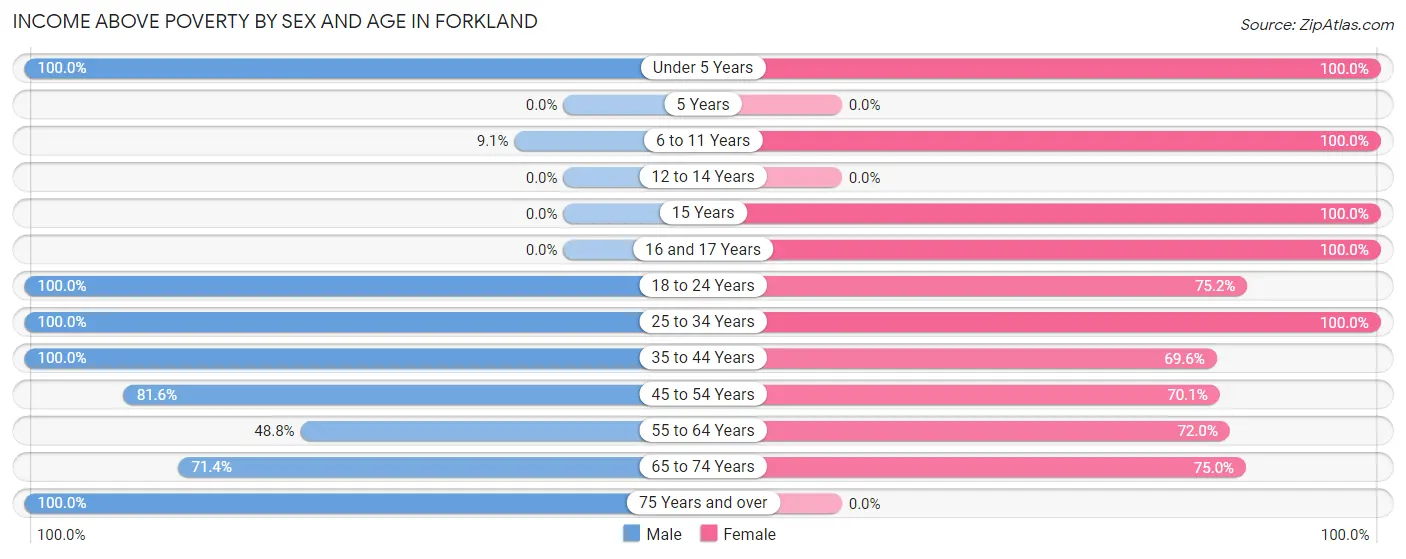
| Age Bracket | Male | Female |
| Under 5 Years | 6 (100.0%) | 36 (100.0%) |
| 5 Years | 0 (0.0%) | 0 (0.0%) |
| 6 to 11 Years | 3 (9.1%) | 50 (100.0%) |
| 12 to 14 Years | 0 (0.0%) | 0 (0.0%) |
| 15 Years | 0 (0.0%) | 24 (100.0%) |
| 16 and 17 Years | 0 (0.0%) | 5 (100.0%) |
| 18 to 24 Years | 29 (100.0%) | 158 (75.2%) |
| 25 to 34 Years | 17 (100.0%) | 3 (100.0%) |
| 35 to 44 Years | 9 (100.0%) | 96 (69.6%) |
| 45 to 54 Years | 31 (81.6%) | 68 (70.1%) |
| 55 to 64 Years | 41 (48.8%) | 18 (72.0%) |
| 65 to 74 Years | 10 (71.4%) | 21 (75.0%) |
| 75 Years and over | 52 (100.0%) | 0 (0.0%) |
| Total | 198 (63.1%) | 479 (70.3%) |
Income Below Poverty Among Married-Couple Families in Forkland
The poverty statistics for married-couple families in Forkland show that 25.0% or 15 of the total 60 families live below the poverty line. Families with 1 or 2 children have the highest poverty rate of 34.1%, comprising of 15 families. On the other hand, families with no children have the lowest poverty rate of 0.0%, which includes 0 families.
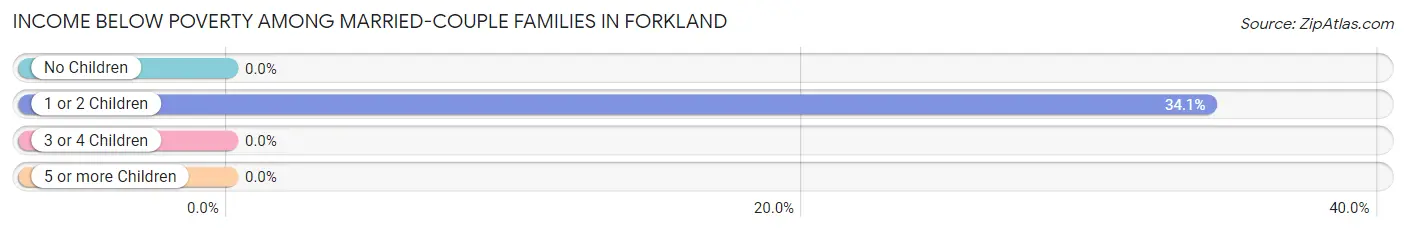
| Children | Above Poverty | Below Poverty |
| No Children | 16 (100.0%) | 0 (0.0%) |
| 1 or 2 Children | 29 (65.9%) | 15 (34.1%) |
| 3 or 4 Children | 0 (0.0%) | 0 (0.0%) |
| 5 or more Children | 0 (0.0%) | 0 (0.0%) |
| Total | 45 (75.0%) | 15 (25.0%) |
Income Below Poverty Among Single-Parent Households in Forkland
According to the poverty data in Forkland, 91.7% or 11 single-father households and 59.7% or 40 single-mother households are living below the poverty line. Among single-father households, those with 1 or 2 children have the highest poverty rate, with 11 households (100.0%) experiencing poverty. Likewise, among single-mother households, those with 1 or 2 children have the highest poverty rate, with 37 households (100.0%) falling below the poverty line.
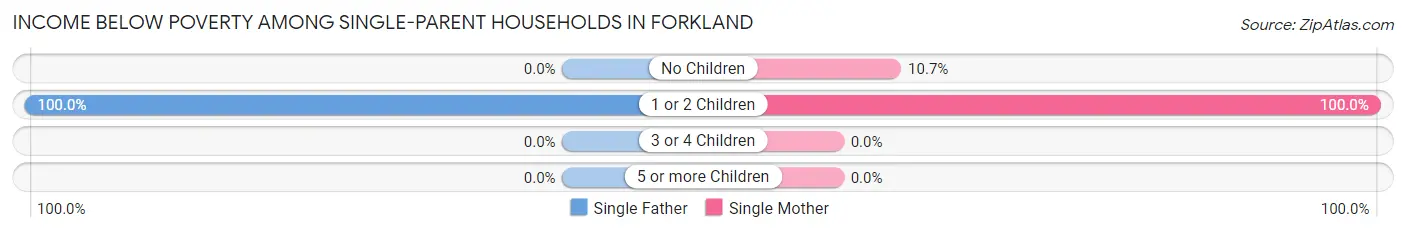
| Children | Single Father | Single Mother |
| No Children | 0 (0.0%) | 3 (10.7%) |
| 1 or 2 Children | 11 (100.0%) | 37 (100.0%) |
| 3 or 4 Children | 0 (0.0%) | 0 (0.0%) |
| 5 or more Children | 0 (0.0%) | 0 (0.0%) |
| Total | 11 (91.7%) | 40 (59.7%) |
Income Below Poverty Among Married-Couple vs Single-Parent Households in Forkland
The poverty data for Forkland shows that 15 of the married-couple family households (25.0%) and 51 of the single-parent households (64.6%) are living below the poverty level. Within the married-couple family households, those with 1 or 2 children have the highest poverty rate, with 15 households (34.1%) falling below the poverty line. Among the single-parent households, those with 1 or 2 children have the highest poverty rate, with 48 household (100.0%) living below poverty.
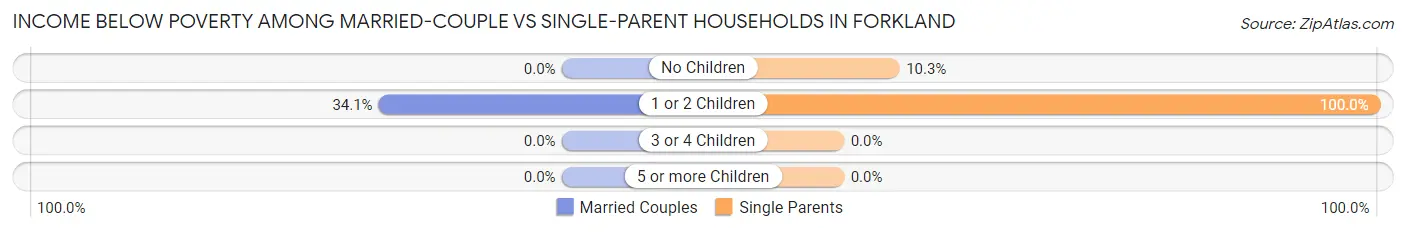
| Children | Married-Couple Families | Single-Parent Households |
| No Children | 0 (0.0%) | 3 (10.3%) |
| 1 or 2 Children | 15 (34.1%) | 48 (100.0%) |
| 3 or 4 Children | 0 (0.0%) | 0 (0.0%) |
| 5 or more Children | 0 (0.0%) | 0 (0.0%) |
| Total | 15 (25.0%) | 51 (64.6%) |
Employment Characteristics in Forkland
Employment by Class of Employer in Forkland
Among the 149 employed individuals in Forkland, private company employees (118 | 79.2%), local government employees (16 | 10.7%), and state government employees (9 | 6.0%) make up the most common classes of employment.
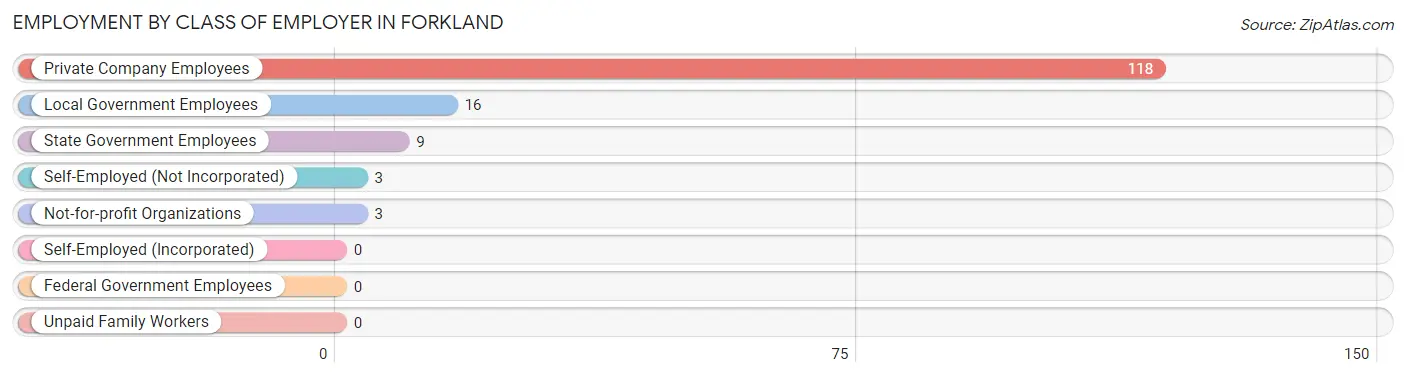
| Employer Class | # Employees | % Employees |
| Private Company Employees | 118 | 79.2% |
| Self-Employed (Incorporated) | 0 | 0.0% |
| Self-Employed (Not Incorporated) | 3 | 2.0% |
| Not-for-profit Organizations | 3 | 2.0% |
| Local Government Employees | 16 | 10.7% |
| State Government Employees | 9 | 6.0% |
| Federal Government Employees | 0 | 0.0% |
| Unpaid Family Workers | 0 | 0.0% |
| Total | 149 | 100.0% |
Employment Status by Age in Forkland
According to the labor force statistics for Forkland, out of the total population over 16 years of age (829), 24.7% or 205 individuals are in the labor force, with 6.8% or 14 of them unemployed. The age group with the highest labor force participation rate is 25 to 29 years, with 100.0% or 17 individuals in the labor force. Within the labor force, the 45 to 54 years age range has the highest percentage of unemployed individuals, with 16.7% or 14 of them being unemployed.
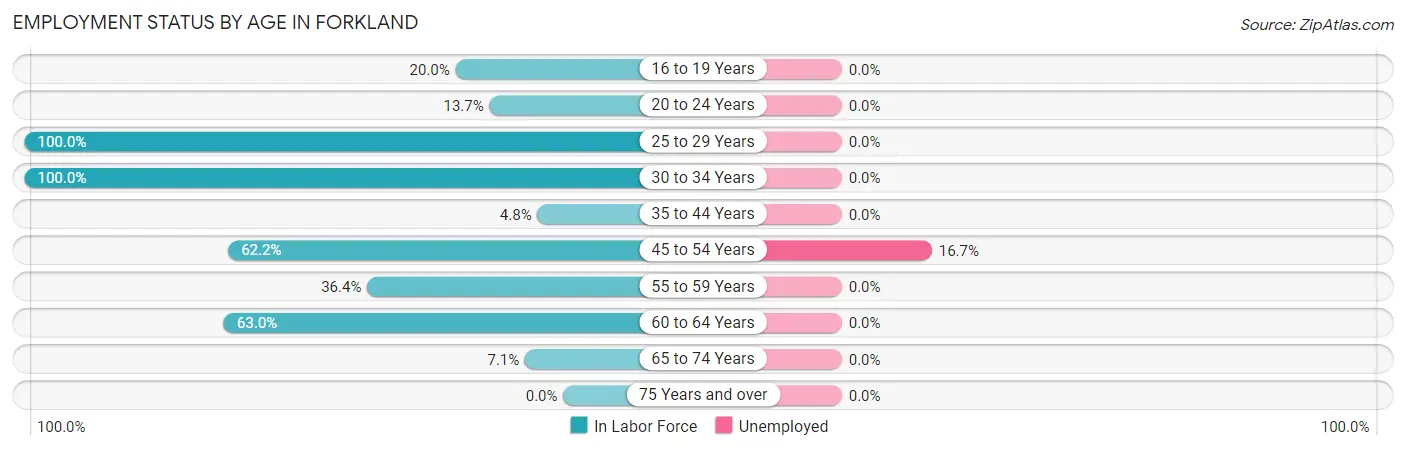
| Age Bracket | In Labor Force | Unemployed |
| 16 to 19 Years | 5 (20.0%) | 0 (0.0%) |
| 20 to 24 Years | 32 (13.7%) | 0 (0.0%) |
| 25 to 29 Years | 17 (100.0%) | 0 (0.0%) |
| 30 to 34 Years | 3 (100.0%) | 0 (0.0%) |
| 35 to 44 Years | 7 (4.8%) | 0 (0.0%) |
| 45 to 54 Years | 84 (62.2%) | 14 (16.7%) |
| 55 to 59 Years | 20 (36.4%) | 0 (0.0%) |
| 60 to 64 Years | 34 (63.0%) | 0 (0.0%) |
| 65 to 74 Years | 3 (7.1%) | 0 (0.0%) |
| 75 Years and over | 0 (0.0%) | 0 (0.0%) |
| Total | 205 (24.7%) | 14 (6.8%) |
Employment Status by Educational Attainment in Forkland
According to labor force statistics for Forkland, 40.1% of individuals (165) out of the total population between 25 and 64 years of age (411) are in the labor force, with 8.5% or 14 of them being unemployed. The group with the highest labor force participation rate are those with the educational attainment of college / associate degree, with 72.1% or 49 individuals in the labor force. Within the labor force, individuals with high school diploma education have the highest percentage of unemployment, with 20.9% or 14 of them being unemployed.
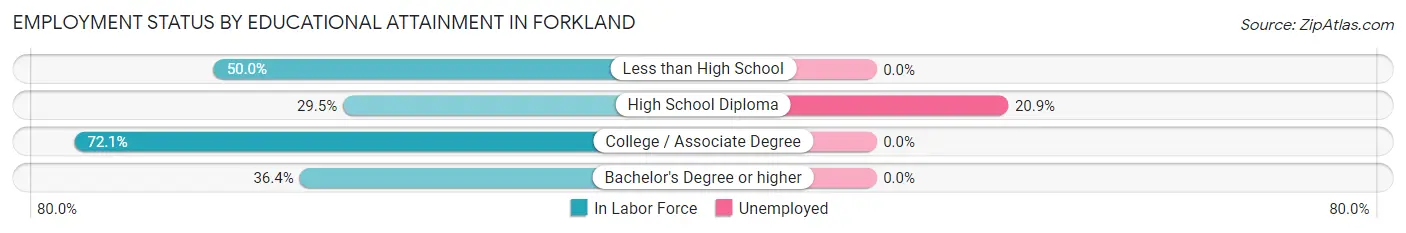
| Educational Attainment | In Labor Force | Unemployed |
| Less than High School | 25 (50.0%) | 0 (0.0%) |
| High School Diploma | 67 (29.5%) | 47 (20.9%) |
| College / Associate Degree | 49 (72.1%) | 0 (0.0%) |
| Bachelor's Degree or higher | 24 (36.4%) | 0 (0.0%) |
| Total | 165 (40.1%) | 35 (8.5%) |
Employment Occupations by Sex in Forkland
Management, Business, Science and Arts Occupations
The most common Management, Business, Science and Arts occupations in Forkland are Community & Social Service (22 | 11.5%), Education, Arts & Media (17 | 8.9%), Management (14 | 7.3%), Health Diagnosing & Treating (6 | 3.1%), and Health Technologists (6 | 3.1%).
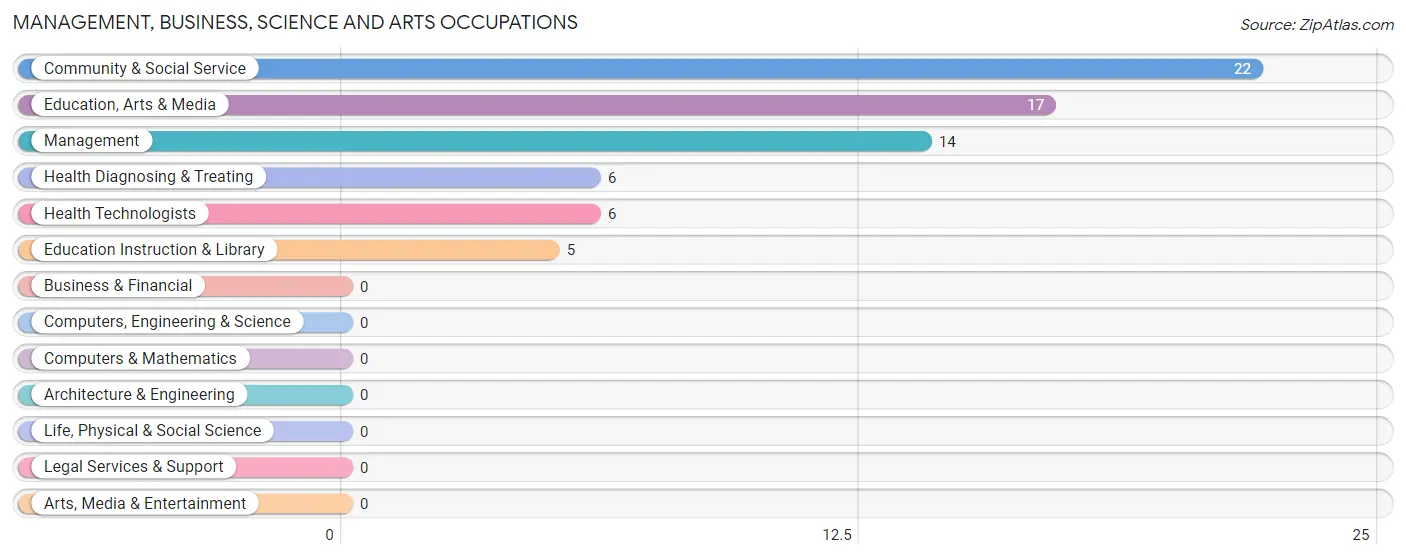
Management, Business, Science and Arts Occupations by Sex
Within the Management, Business, Science and Arts occupations in Forkland, the most male-oriented occupations are Education Instruction & Library (100.0%), and Community & Social Service (22.7%), while the most female-oriented occupations are Management (100.0%), Education, Arts & Media (100.0%), and Health Diagnosing & Treating (100.0%).
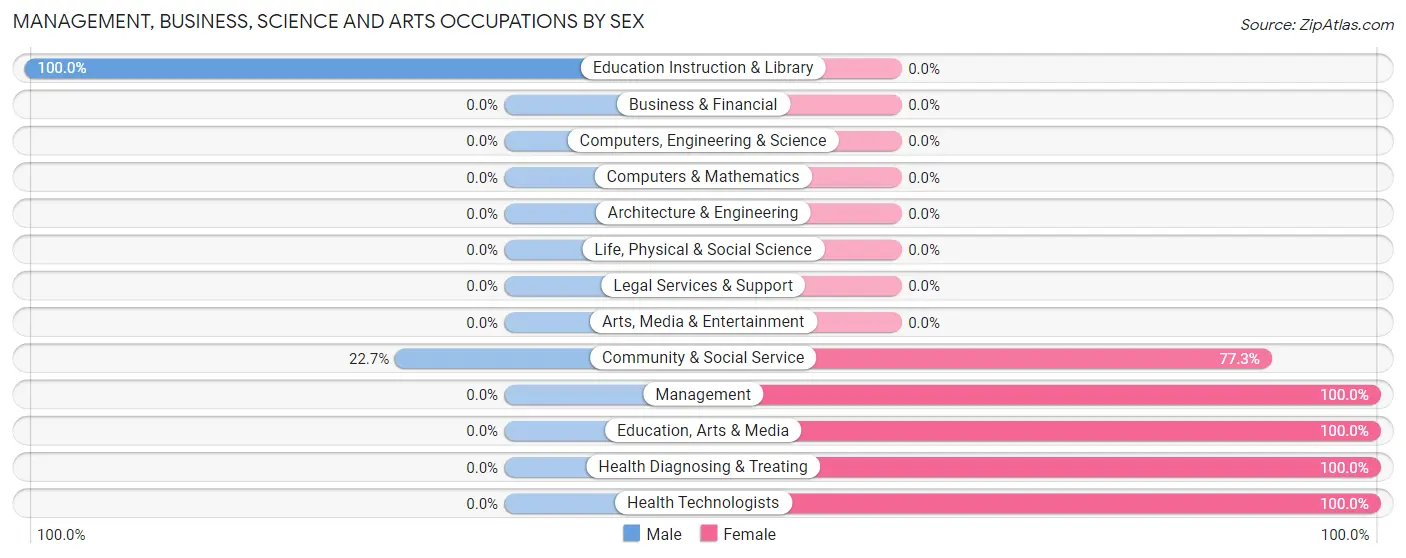
| Occupation | Male | Female |
| Management | 0 (0.0%) | 14 (100.0%) |
| Business & Financial | 0 (0.0%) | 0 (0.0%) |
| Computers, Engineering & Science | 0 (0.0%) | 0 (0.0%) |
| Computers & Mathematics | 0 (0.0%) | 0 (0.0%) |
| Architecture & Engineering | 0 (0.0%) | 0 (0.0%) |
| Life, Physical & Social Science | 0 (0.0%) | 0 (0.0%) |
| Community & Social Service | 5 (22.7%) | 17 (77.3%) |
| Education, Arts & Media | 0 (0.0%) | 17 (100.0%) |
| Legal Services & Support | 0 (0.0%) | 0 (0.0%) |
| Education Instruction & Library | 5 (100.0%) | 0 (0.0%) |
| Arts, Media & Entertainment | 0 (0.0%) | 0 (0.0%) |
| Health Diagnosing & Treating | 0 (0.0%) | 6 (100.0%) |
| Health Technologists | 0 (0.0%) | 6 (100.0%) |
| Total (Category) | 5 (11.9%) | 37 (88.1%) |
| Total (Overall) | 116 (60.7%) | 75 (39.3%) |
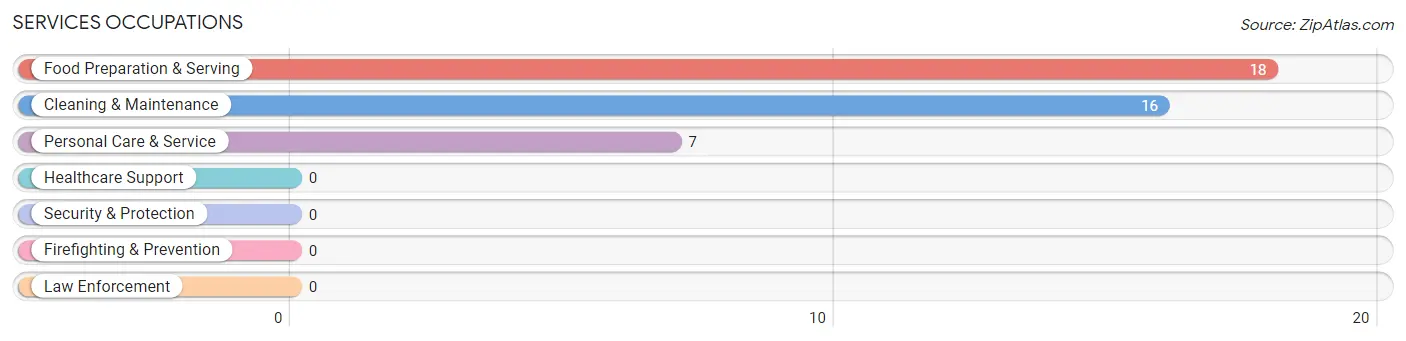
Services Occupations
The most common Services occupations in Forkland are Food Preparation & Serving (18 | 9.4%), Cleaning & Maintenance (16 | 8.4%), and Personal Care & Service (7 | 3.7%).
Services Occupations by Sex
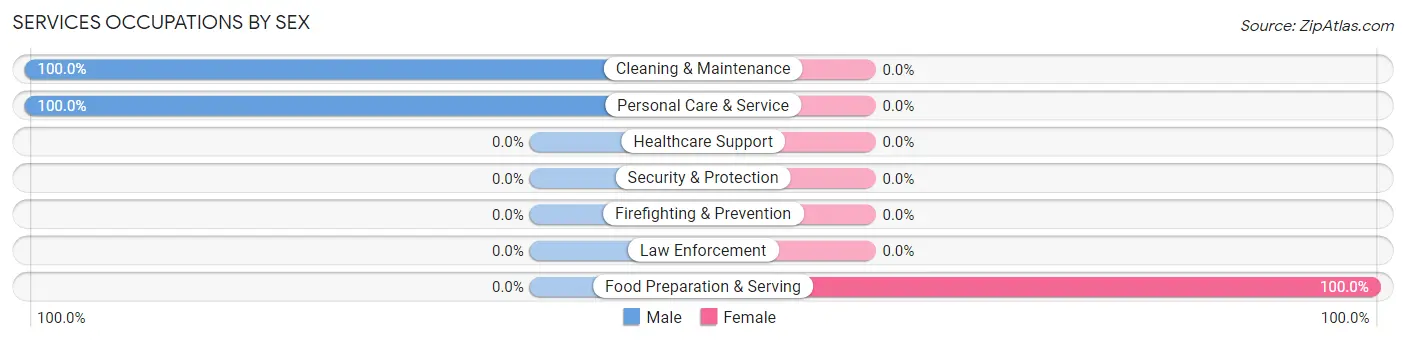
| Occupation | Male | Female |
| Healthcare Support | 0 (0.0%) | 0 (0.0%) |
| Security & Protection | 0 (0.0%) | 0 (0.0%) |
| Firefighting & Prevention | 0 (0.0%) | 0 (0.0%) |
| Law Enforcement | 0 (0.0%) | 0 (0.0%) |
| Food Preparation & Serving | 0 (0.0%) | 18 (100.0%) |
| Cleaning & Maintenance | 16 (100.0%) | 0 (0.0%) |
| Personal Care & Service | 7 (100.0%) | 0 (0.0%) |
| Total (Category) | 23 (56.1%) | 18 (43.9%) |
| Total (Overall) | 116 (60.7%) | 75 (39.3%) |
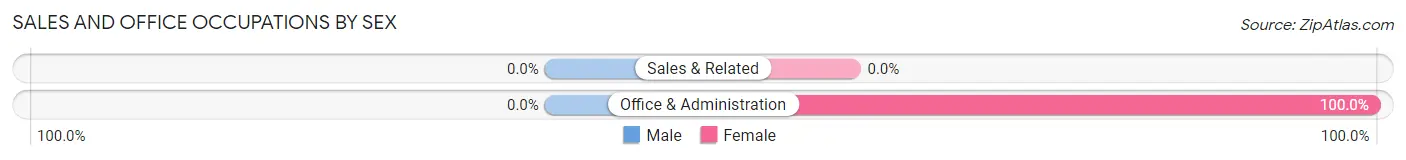
Sales and Office Occupations
The most common Sales and Office occupations in Forkland are , and Office & Administration (5 | 2.6%).
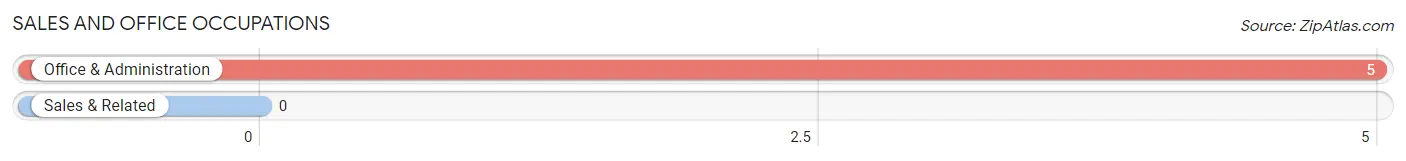
Sales and Office Occupations by Sex
| Occupation | Male | Female |
| Sales & Related | 0 (0.0%) | 0 (0.0%) |
| Office & Administration | 0 (0.0%) | 5 (100.0%) |
| Total (Category) | 0 (0.0%) | 5 (100.0%) |
| Total (Overall) | 116 (60.7%) | 75 (39.3%) |
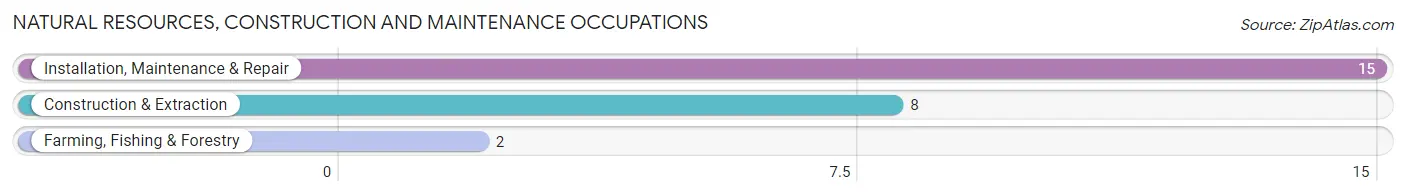
Natural Resources, Construction and Maintenance Occupations
The most common Natural Resources, Construction and Maintenance occupations in Forkland are Installation, Maintenance & Repair (15 | 7.9%), Construction & Extraction (8 | 4.2%), and Farming, Fishing & Forestry (2 | 1.1%).
Natural Resources, Construction and Maintenance Occupations by Sex
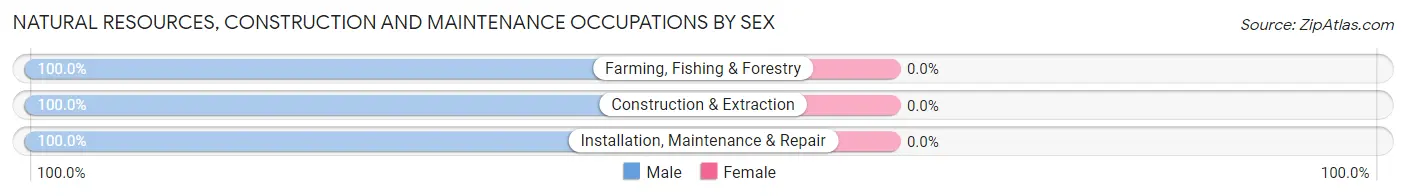
| Occupation | Male | Female |
| Farming, Fishing & Forestry | 2 (100.0%) | 0 (0.0%) |
| Construction & Extraction | 8 (100.0%) | 0 (0.0%) |
| Installation, Maintenance & Repair | 15 (100.0%) | 0 (0.0%) |
| Total (Category) | 25 (100.0%) | 0 (0.0%) |
| Total (Overall) | 116 (60.7%) | 75 (39.3%) |
Production, Transportation and Moving Occupations
The most common Production, Transportation and Moving occupations in Forkland are Production (35 | 18.3%), Transportation (35 | 18.3%), and Material Moving (8 | 4.2%).
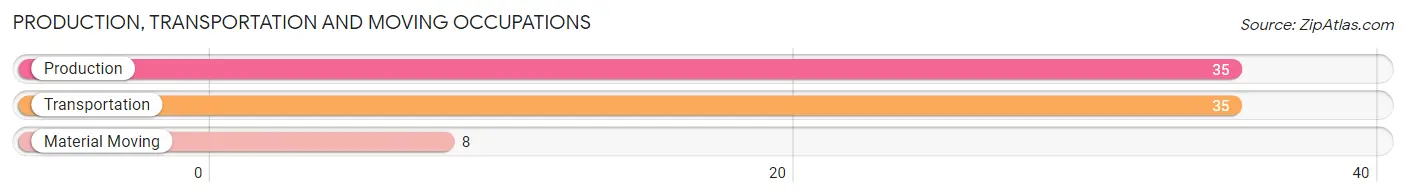
Production, Transportation and Moving Occupations by Sex
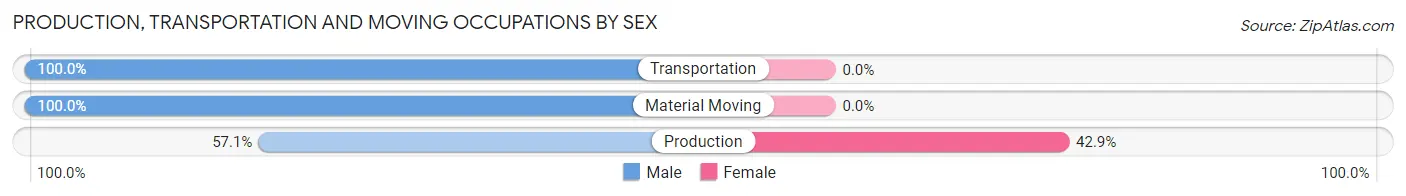
| Occupation | Male | Female |
| Production | 20 (57.1%) | 15 (42.9%) |
| Transportation | 35 (100.0%) | 0 (0.0%) |
| Material Moving | 8 (100.0%) | 0 (0.0%) |
| Total (Category) | 63 (80.8%) | 15 (19.2%) |
| Total (Overall) | 116 (60.7%) | 75 (39.3%) |
Employment Industries by Sex in Forkland
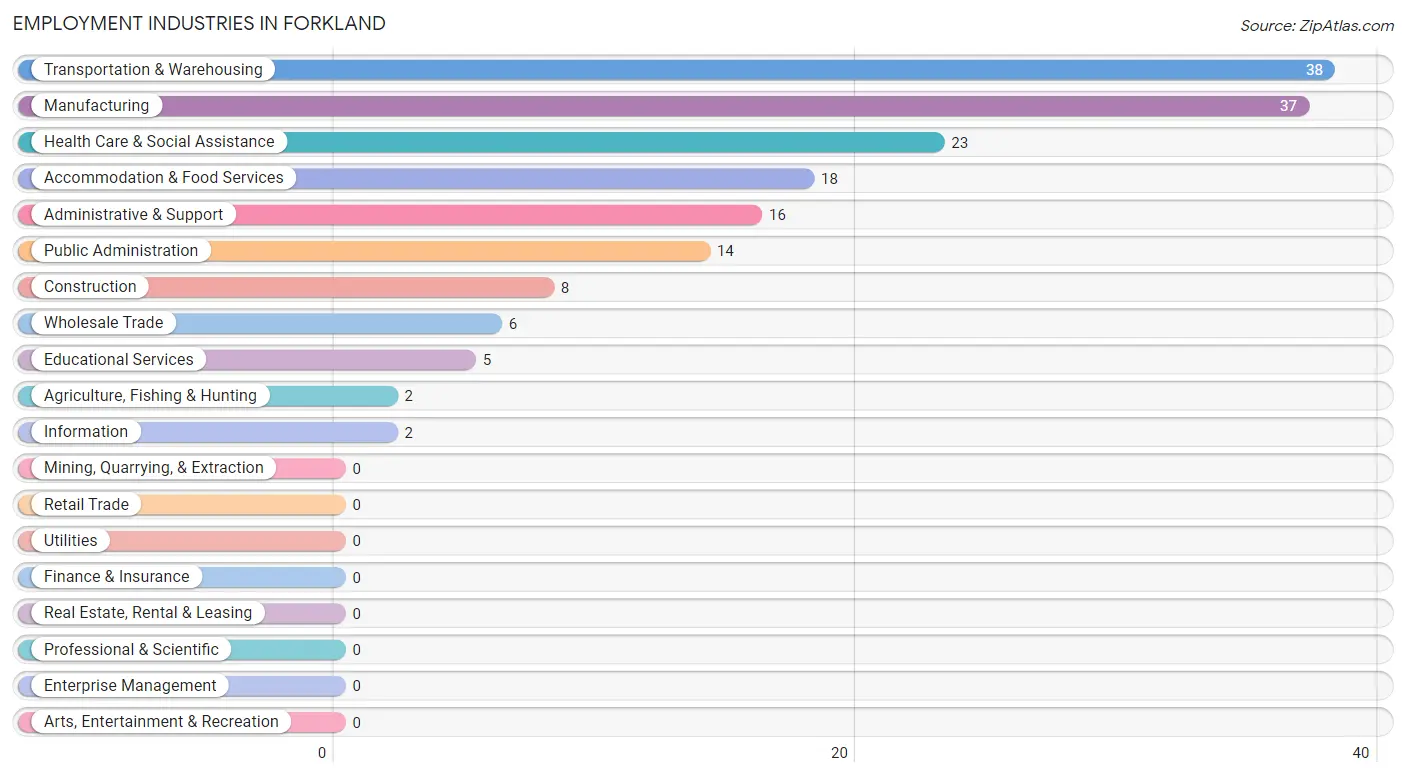
Employment Industries in Forkland
The major employment industries in Forkland include Transportation & Warehousing (38 | 19.9%), Manufacturing (37 | 19.4%), Health Care & Social Assistance (23 | 12.0%), Accommodation & Food Services (18 | 9.4%), and Administrative & Support (16 | 8.4%).
Employment Industries by Sex in Forkland
The Forkland industries that see more men than women are Agriculture, Fishing & Hunting (100.0%), Construction (100.0%), and Transportation & Warehousing (100.0%), whereas the industries that tend to have a higher number of women are Wholesale Trade (100.0%), Information (100.0%), and Health Care & Social Assistance (100.0%).
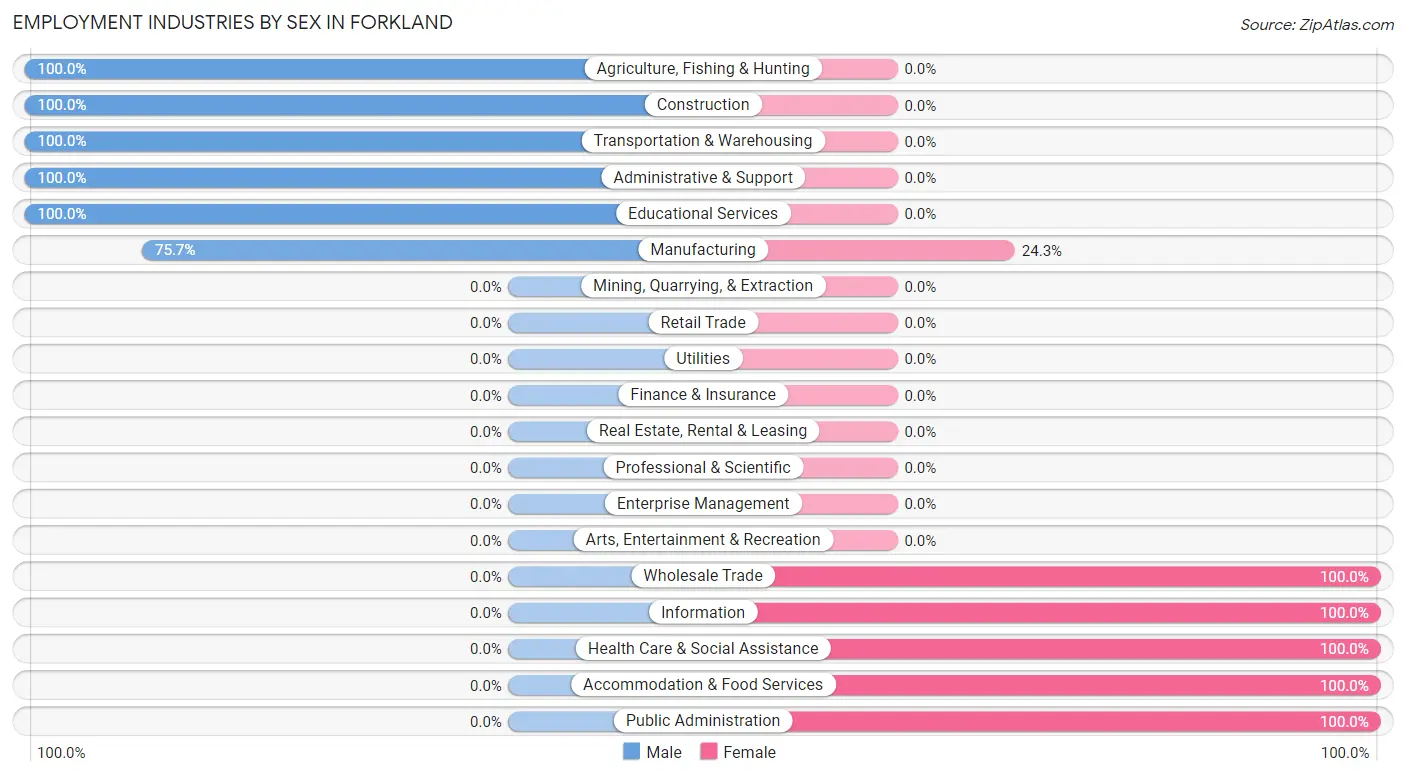
| Industry | Male | Female |
| Agriculture, Fishing & Hunting | 2 (100.0%) | 0 (0.0%) |
| Mining, Quarrying, & Extraction | 0 (0.0%) | 0 (0.0%) |
| Construction | 8 (100.0%) | 0 (0.0%) |
| Manufacturing | 28 (75.7%) | 9 (24.3%) |
| Wholesale Trade | 0 (0.0%) | 6 (100.0%) |
| Retail Trade | 0 (0.0%) | 0 (0.0%) |
| Transportation & Warehousing | 38 (100.0%) | 0 (0.0%) |
| Utilities | 0 (0.0%) | 0 (0.0%) |
| Information | 0 (0.0%) | 2 (100.0%) |
| Finance & Insurance | 0 (0.0%) | 0 (0.0%) |
| Real Estate, Rental & Leasing | 0 (0.0%) | 0 (0.0%) |
| Professional & Scientific | 0 (0.0%) | 0 (0.0%) |
| Enterprise Management | 0 (0.0%) | 0 (0.0%) |
| Administrative & Support | 16 (100.0%) | 0 (0.0%) |
| Educational Services | 5 (100.0%) | 0 (0.0%) |
| Health Care & Social Assistance | 0 (0.0%) | 23 (100.0%) |
| Arts, Entertainment & Recreation | 0 (0.0%) | 0 (0.0%) |
| Accommodation & Food Services | 0 (0.0%) | 18 (100.0%) |
| Public Administration | 0 (0.0%) | 14 (100.0%) |
| Total | 116 (60.7%) | 75 (39.3%) |
Education in Forkland
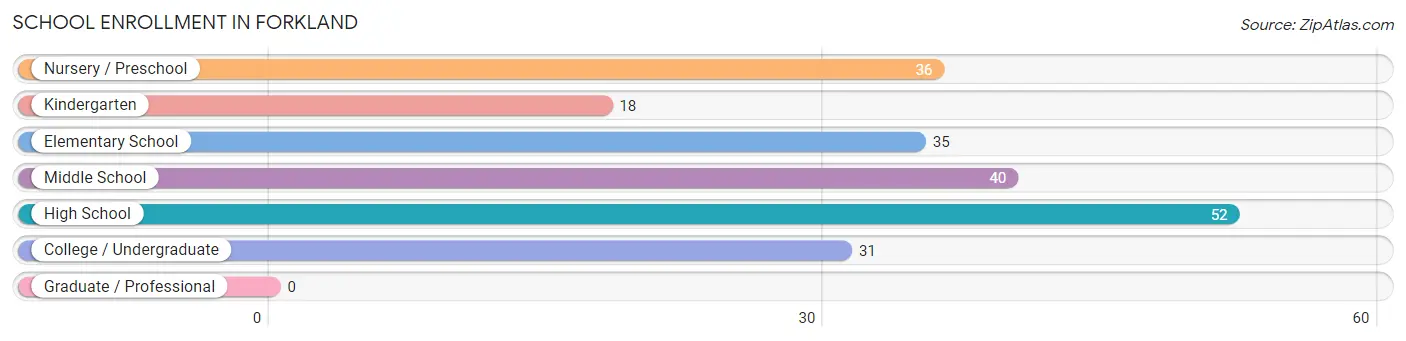
School Enrollment in Forkland
The most common levels of schooling among the 212 students in Forkland are high school (52 | 24.5%), middle school (40 | 18.9%), and nursery / preschool (36 | 17.0%).
| School Level | # Students | % Students |
| Nursery / Preschool | 36 | 17.0% |
| Kindergarten | 18 | 8.5% |
| Elementary School | 35 | 16.5% |
| Middle School | 40 | 18.9% |
| High School | 52 | 24.5% |
| College / Undergraduate | 31 | 14.6% |
| Graduate / Professional | 0 | 0.0% |
| Total | 212 | 100.0% |
School Enrollment by Age by Funding Source in Forkland
Out of a total of 212 students who are enrolled in schools in Forkland, 44 (20.8%) attend a private institution, while the remaining 168 (79.2%) are enrolled in public schools. The age group of 18 to 19 year olds has the highest likelihood of being enrolled in private schools, with 5 (100.0% in the age bracket) enrolled. Conversely, the age group of 5 to 9 year old has the lowest likelihood of being enrolled in a private school, with 71 (100.0% in the age bracket) attending a public institution.
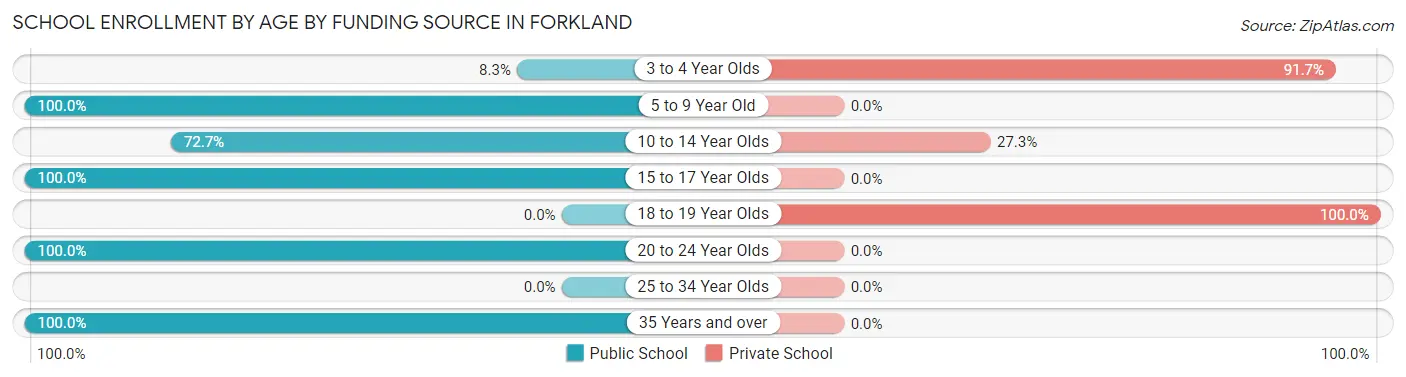
| Age Bracket | Public School | Private School |
| 3 to 4 Year Olds | 3 (8.3%) | 33 (91.7%) |
| 5 to 9 Year Old | 71 (100.0%) | 0 (0.0%) |
| 10 to 14 Year Olds | 16 (72.7%) | 6 (27.3%) |
| 15 to 17 Year Olds | 49 (100.0%) | 0 (0.0%) |
| 18 to 19 Year Olds | 0 (0.0%) | 5 (100.0%) |
| 20 to 24 Year Olds | 26 (100.0%) | 0 (0.0%) |
| 25 to 34 Year Olds | 0 (0.0%) | 0 (0.0%) |
| 35 Years and over | 3 (100.0%) | 0 (0.0%) |
| Total | 168 (79.2%) | 44 (20.8%) |
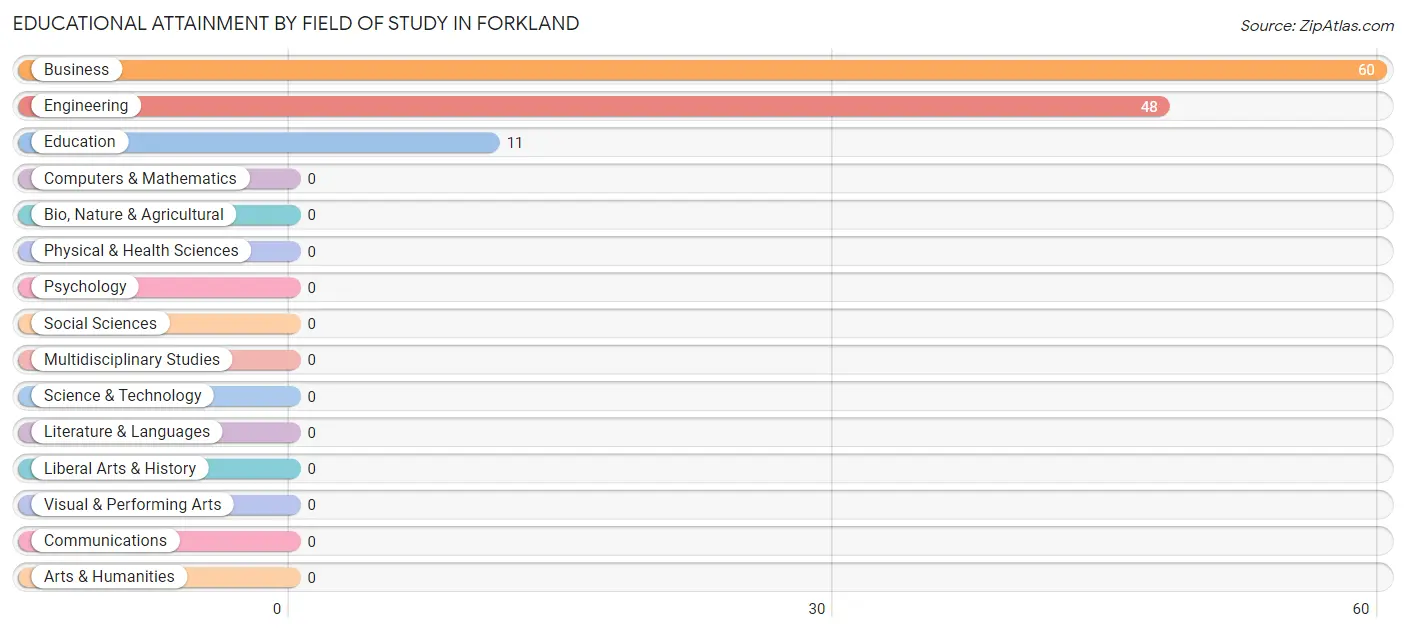
Educational Attainment by Field of Study in Forkland
Business (60 | 50.4%), engineering (48 | 40.3%), and education (11 | 9.2%) are the most common fields of study among 119 individuals in Forkland who have obtained a bachelor's degree or higher.
| Field of Study | # Graduates | % Graduates |
| Computers & Mathematics | 0 | 0.0% |
| Bio, Nature & Agricultural | 0 | 0.0% |
| Physical & Health Sciences | 0 | 0.0% |
| Psychology | 0 | 0.0% |
| Social Sciences | 0 | 0.0% |
| Engineering | 48 | 40.3% |
| Multidisciplinary Studies | 0 | 0.0% |
| Science & Technology | 0 | 0.0% |
| Business | 60 | 50.4% |
| Education | 11 | 9.2% |
| Literature & Languages | 0 | 0.0% |
| Liberal Arts & History | 0 | 0.0% |
| Visual & Performing Arts | 0 | 0.0% |
| Communications | 0 | 0.0% |
| Arts & Humanities | 0 | 0.0% |
| Total | 119 | 100.0% |
Transportation & Commute in Forkland
Vehicle Availability by Sex in Forkland
The most prevalent vehicle ownership categories in Forkland are males with 4 vehicles (34, accounting for 35.4%) and females with 4 vehicles (11, making up 64.1%).
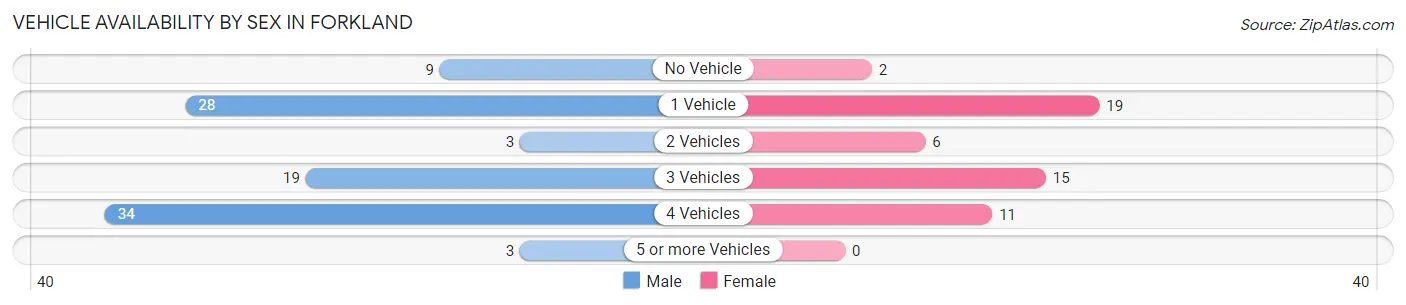
| Vehicles Available | Male | Female |
| No Vehicle | 9 (9.4%) | 2 (3.8%) |
| 1 Vehicle | 28 (29.2%) | 19 (35.8%) |
| 2 Vehicles | 3 (3.1%) | 6 (11.3%) |
| 3 Vehicles | 19 (19.8%) | 15 (28.3%) |
| 4 Vehicles | 34 (35.4%) | 11 (20.7%) |
| 5 or more Vehicles | 3 (3.1%) | 0 (0.0%) |
| Total | 96 (100.0%) | 53 (100.0%) |
Commute Time in Forkland
The most frequently occuring commute durations in Forkland are 60 to 89 minutes (50 commuters, 33.6%), 20 to 24 minutes (34 commuters, 22.8%), and 45 to 59 minutes (18 commuters, 12.1%).
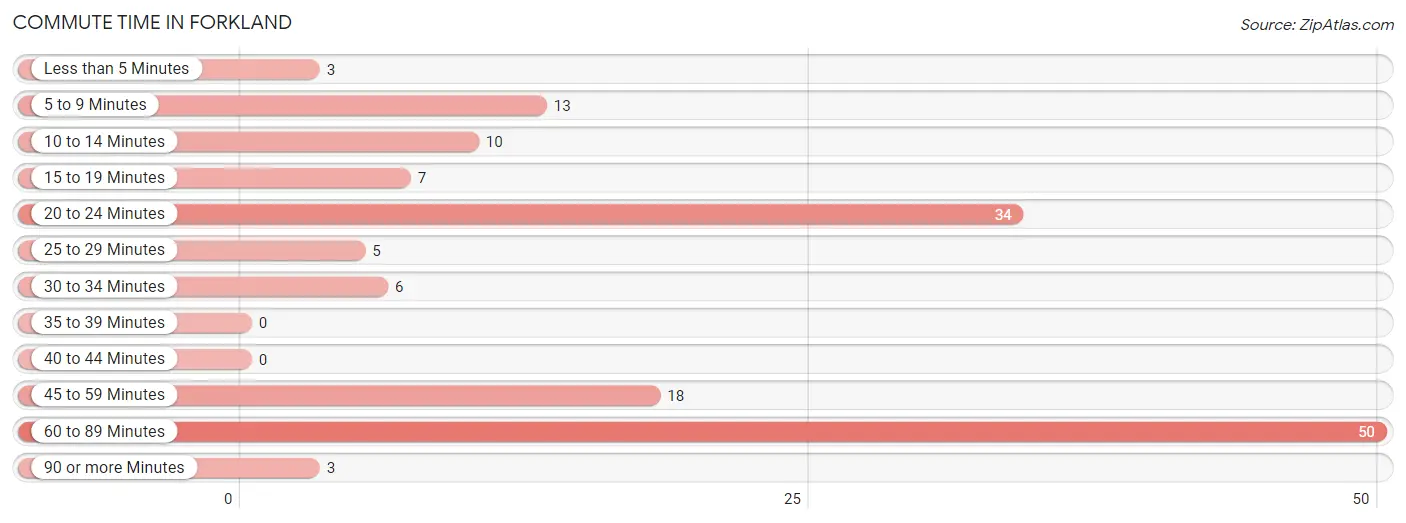
| Commute Time | # Commuters | % Commuters |
| Less than 5 Minutes | 3 | 2.0% |
| 5 to 9 Minutes | 13 | 8.7% |
| 10 to 14 Minutes | 10 | 6.7% |
| 15 to 19 Minutes | 7 | 4.7% |
| 20 to 24 Minutes | 34 | 22.8% |
| 25 to 29 Minutes | 5 | 3.4% |
| 30 to 34 Minutes | 6 | 4.0% |
| 35 to 39 Minutes | 0 | 0.0% |
| 40 to 44 Minutes | 0 | 0.0% |
| 45 to 59 Minutes | 18 | 12.1% |
| 60 to 89 Minutes | 50 | 33.6% |
| 90 or more Minutes | 3 | 2.0% |
Commute Time by Sex in Forkland
The most common commute times in Forkland are 60 to 89 minutes (50 commuters, 52.1%) for males and 20 to 24 minutes (28 commuters, 52.8%) for females.
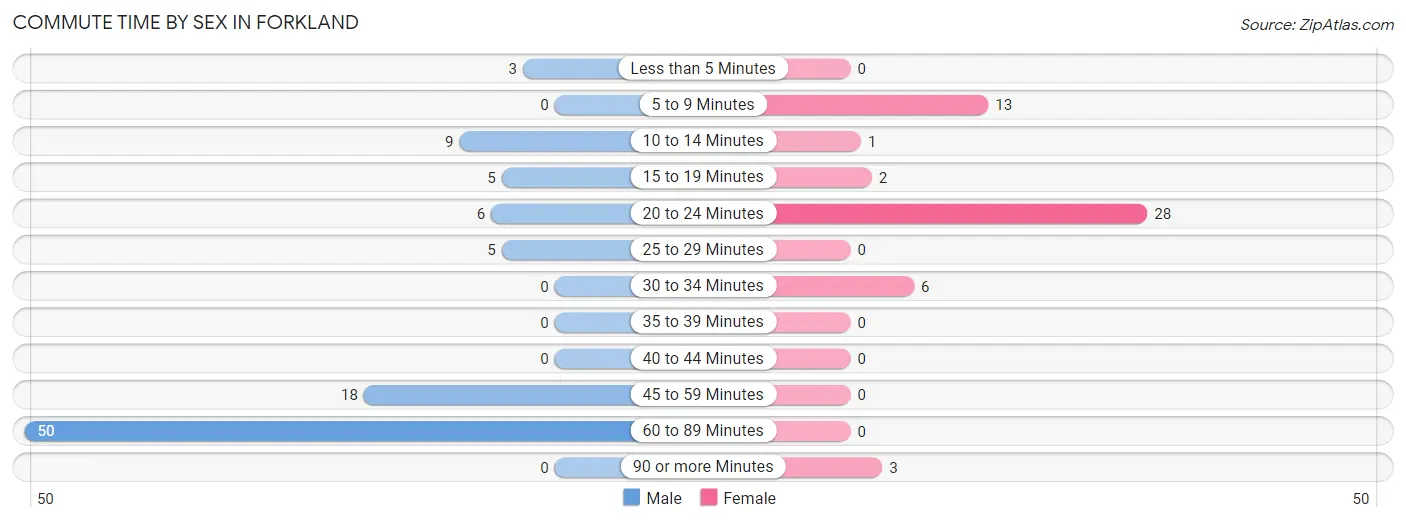
| Commute Time | Male | Female |
| Less than 5 Minutes | 3 (3.1%) | 0 (0.0%) |
| 5 to 9 Minutes | 0 (0.0%) | 13 (24.5%) |
| 10 to 14 Minutes | 9 (9.4%) | 1 (1.9%) |
| 15 to 19 Minutes | 5 (5.2%) | 2 (3.8%) |
| 20 to 24 Minutes | 6 (6.2%) | 28 (52.8%) |
| 25 to 29 Minutes | 5 (5.2%) | 0 (0.0%) |
| 30 to 34 Minutes | 0 (0.0%) | 6 (11.3%) |
| 35 to 39 Minutes | 0 (0.0%) | 0 (0.0%) |
| 40 to 44 Minutes | 0 (0.0%) | 0 (0.0%) |
| 45 to 59 Minutes | 18 (18.8%) | 0 (0.0%) |
| 60 to 89 Minutes | 50 (52.1%) | 0 (0.0%) |
| 90 or more Minutes | 0 (0.0%) | 3 (5.7%) |
Time of Departure to Work by Sex in Forkland
The most frequent times of departure to work in Forkland are 5:00 AM to 5:29 AM (28, 29.2%) for males and 4:00 PM to 11:59 PM (17, 32.1%) for females.
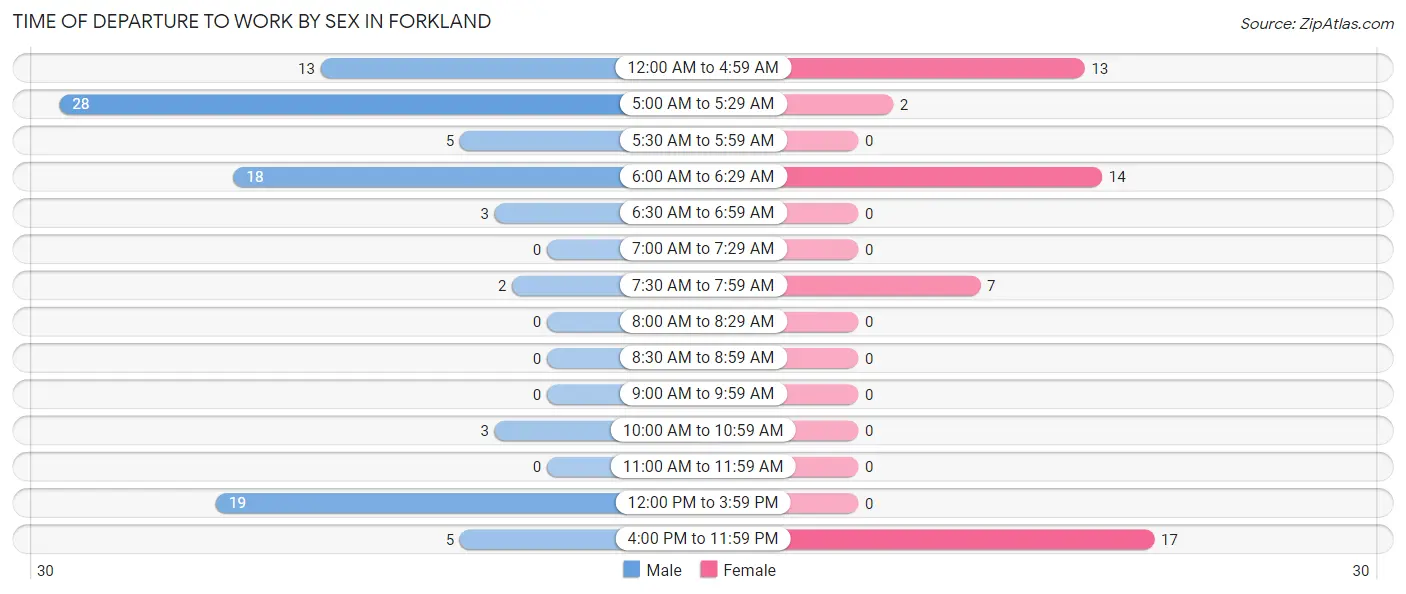
| Time of Departure | Male | Female |
| 12:00 AM to 4:59 AM | 13 (13.5%) | 13 (24.5%) |
| 5:00 AM to 5:29 AM | 28 (29.2%) | 2 (3.8%) |
| 5:30 AM to 5:59 AM | 5 (5.2%) | 0 (0.0%) |
| 6:00 AM to 6:29 AM | 18 (18.8%) | 14 (26.4%) |
| 6:30 AM to 6:59 AM | 3 (3.1%) | 0 (0.0%) |
| 7:00 AM to 7:29 AM | 0 (0.0%) | 0 (0.0%) |
| 7:30 AM to 7:59 AM | 2 (2.1%) | 7 (13.2%) |
| 8:00 AM to 8:29 AM | 0 (0.0%) | 0 (0.0%) |
| 8:30 AM to 8:59 AM | 0 (0.0%) | 0 (0.0%) |
| 9:00 AM to 9:59 AM | 0 (0.0%) | 0 (0.0%) |
| 10:00 AM to 10:59 AM | 3 (3.1%) | 0 (0.0%) |
| 11:00 AM to 11:59 AM | 0 (0.0%) | 0 (0.0%) |
| 12:00 PM to 3:59 PM | 19 (19.8%) | 0 (0.0%) |
| 4:00 PM to 11:59 PM | 5 (5.2%) | 17 (32.1%) |
| Total | 96 (100.0%) | 53 (100.0%) |
Housing Occupancy in Forkland
Occupancy by Ownership in Forkland
Of the total 296 dwellings in Forkland, owner-occupied units account for 184 (62.2%), while renter-occupied units make up 112 (37.8%).
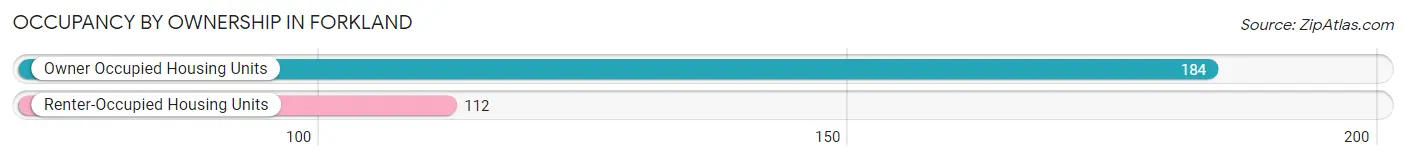
| Occupancy | # Housing Units | % Housing Units |
| Owner Occupied Housing Units | 184 | 62.2% |
| Renter-Occupied Housing Units | 112 | 37.8% |
| Total Occupied Housing Units | 296 | 100.0% |
Occupancy by Household Size in Forkland
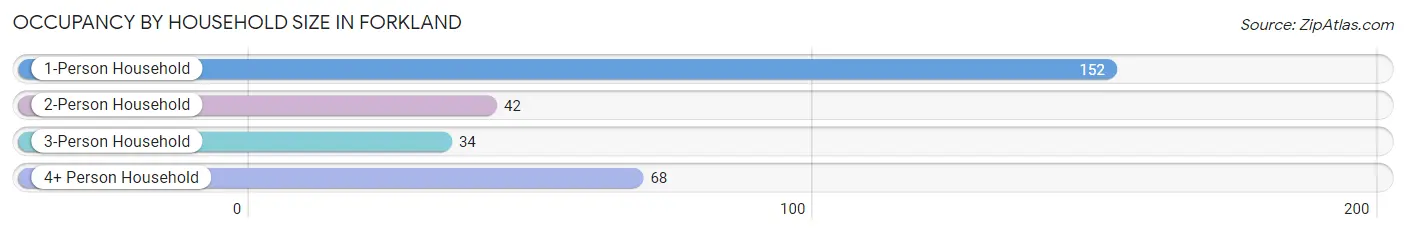
| Household Size | # Housing Units | % Housing Units |
| 1-Person Household | 152 | 51.3% |
| 2-Person Household | 42 | 14.2% |
| 3-Person Household | 34 | 11.5% |
| 4+ Person Household | 68 | 23.0% |
| Total Housing Units | 296 | 100.0% |
Occupancy by Ownership by Household Size in Forkland
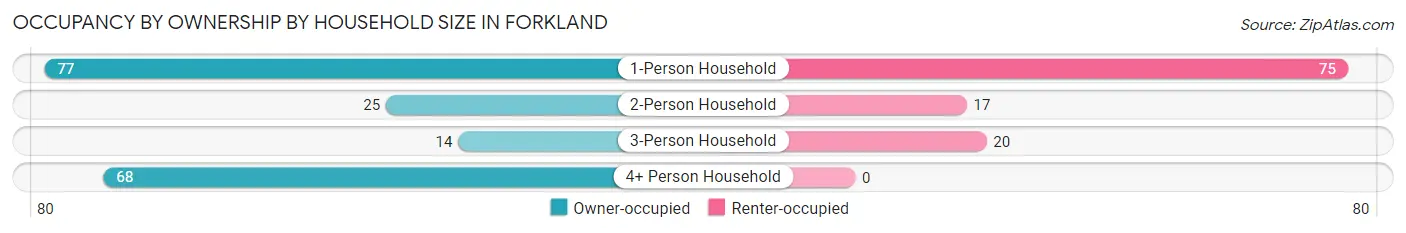
| Household Size | Owner-occupied | Renter-occupied |
| 1-Person Household | 77 (50.7%) | 75 (49.3%) |
| 2-Person Household | 25 (59.5%) | 17 (40.5%) |
| 3-Person Household | 14 (41.2%) | 20 (58.8%) |
| 4+ Person Household | 68 (100.0%) | 0 (0.0%) |
| Total Housing Units | 184 (62.2%) | 112 (37.8%) |
Occupancy by Educational Attainment in Forkland
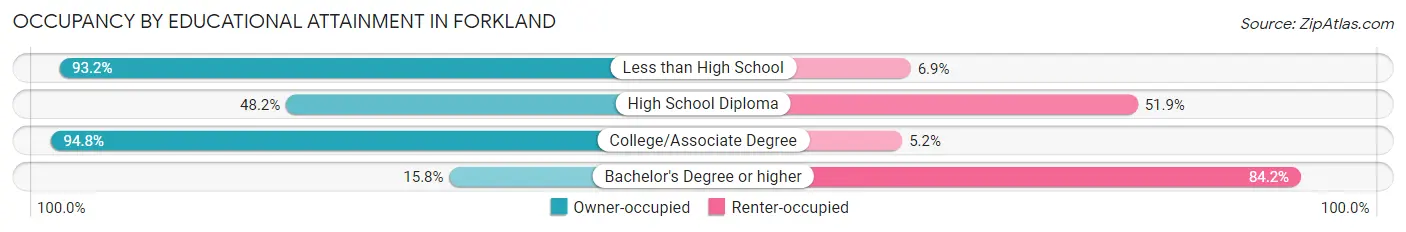
| Household Size | Owner-occupied | Renter-occupied |
| Less than High School | 68 (93.1%) | 5 (6.9%) |
| High School Diploma | 52 (48.1%) | 56 (51.8%) |
| College/Associate Degree | 55 (94.8%) | 3 (5.2%) |
| Bachelor's Degree or higher | 9 (15.8%) | 48 (84.2%) |
Occupancy by Age of Householder in Forkland
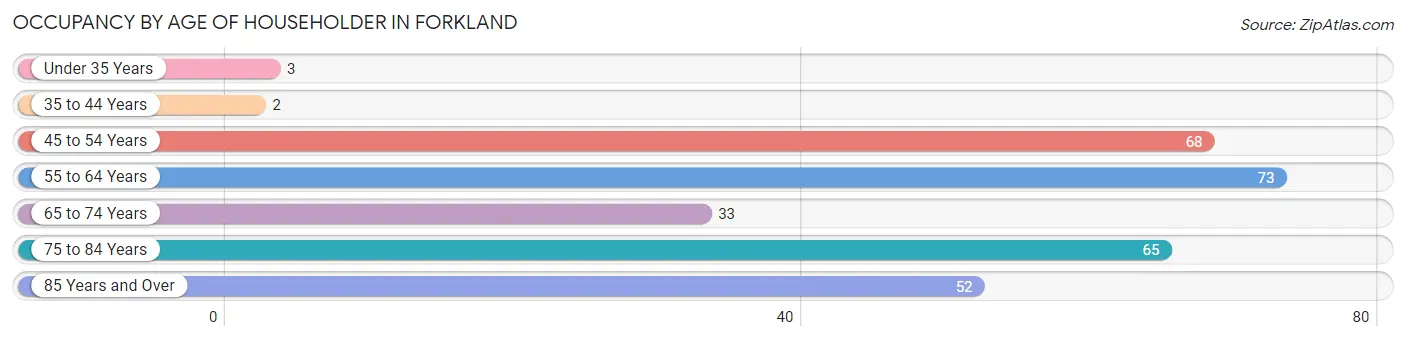
| Age Bracket | # Households | % Households |
| Under 35 Years | 3 | 1.0% |
| 35 to 44 Years | 2 | 0.7% |
| 45 to 54 Years | 68 | 23.0% |
| 55 to 64 Years | 73 | 24.7% |
| 65 to 74 Years | 33 | 11.2% |
| 75 to 84 Years | 65 | 22.0% |
| 85 Years and Over | 52 | 17.6% |
| Total | 296 | 100.0% |
Housing Finances in Forkland
Median Income by Occupancy in Forkland
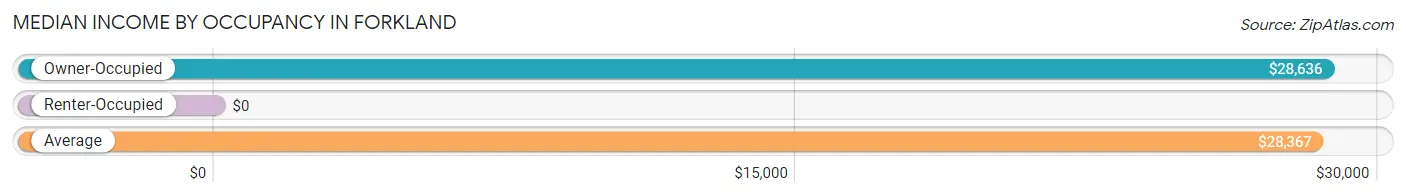
| Occupancy Type | # Households | Median Income |
| Owner-Occupied | 184 (62.2%) | $28,636 |
| Renter-Occupied | 112 (37.8%) | $0 |
| Average | 296 (100.0%) | $28,367 |
Occupancy by Householder Income Bracket in Forkland
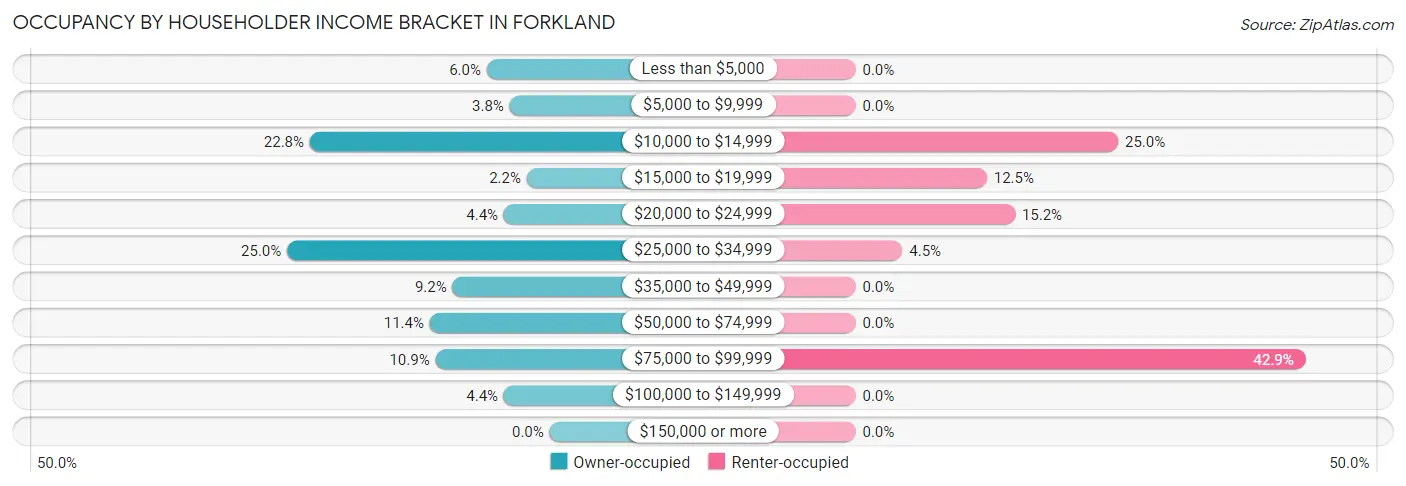
| Income Bracket | Owner-occupied | Renter-occupied |
| Less than $5,000 | 11 (6.0%) | 0 (0.0%) |
| $5,000 to $9,999 | 7 (3.8%) | 0 (0.0%) |
| $10,000 to $14,999 | 42 (22.8%) | 28 (25.0%) |
| $15,000 to $19,999 | 4 (2.2%) | 14 (12.5%) |
| $20,000 to $24,999 | 8 (4.3%) | 17 (15.2%) |
| $25,000 to $34,999 | 46 (25.0%) | 5 (4.5%) |
| $35,000 to $49,999 | 17 (9.2%) | 0 (0.0%) |
| $50,000 to $74,999 | 21 (11.4%) | 0 (0.0%) |
| $75,000 to $99,999 | 20 (10.9%) | 48 (42.9%) |
| $100,000 to $149,999 | 8 (4.3%) | 0 (0.0%) |
| $150,000 or more | 0 (0.0%) | 0 (0.0%) |
| Total | 184 (100.0%) | 112 (100.0%) |
Monthly Housing Cost Tiers in Forkland
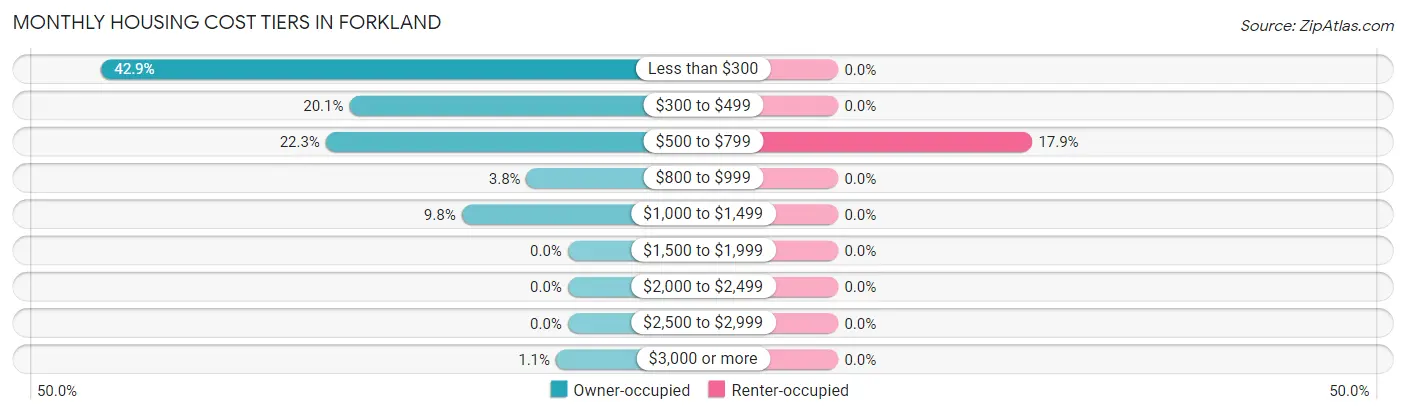
| Monthly Cost | Owner-occupied | Renter-occupied |
| Less than $300 | 79 (42.9%) | 0 (0.0%) |
| $300 to $499 | 37 (20.1%) | 0 (0.0%) |
| $500 to $799 | 41 (22.3%) | 20 (17.9%) |
| $800 to $999 | 7 (3.8%) | 0 (0.0%) |
| $1,000 to $1,499 | 18 (9.8%) | 0 (0.0%) |
| $1,500 to $1,999 | 0 (0.0%) | 0 (0.0%) |
| $2,000 to $2,499 | 0 (0.0%) | 0 (0.0%) |
| $2,500 to $2,999 | 0 (0.0%) | 0 (0.0%) |
| $3,000 or more | 2 (1.1%) | 0 (0.0%) |
| Total | 184 (100.0%) | 112 (100.0%) |
Physical Housing Characteristics in Forkland
Housing Structures in Forkland
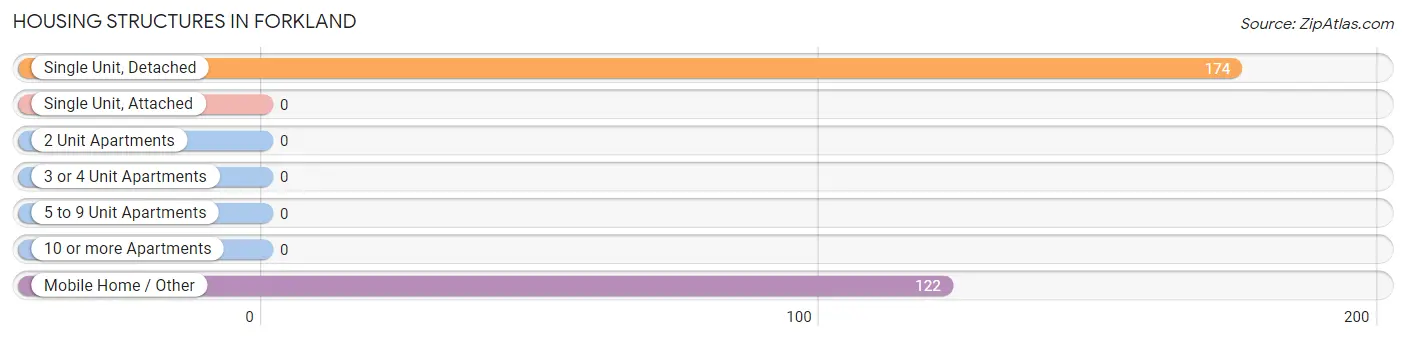
| Structure Type | # Housing Units | % Housing Units |
| Single Unit, Detached | 174 | 58.8% |
| Single Unit, Attached | 0 | 0.0% |
| 2 Unit Apartments | 0 | 0.0% |
| 3 or 4 Unit Apartments | 0 | 0.0% |
| 5 to 9 Unit Apartments | 0 | 0.0% |
| 10 or more Apartments | 0 | 0.0% |
| Mobile Home / Other | 122 | 41.2% |
| Total | 296 | 100.0% |
Housing Structures by Occupancy in Forkland
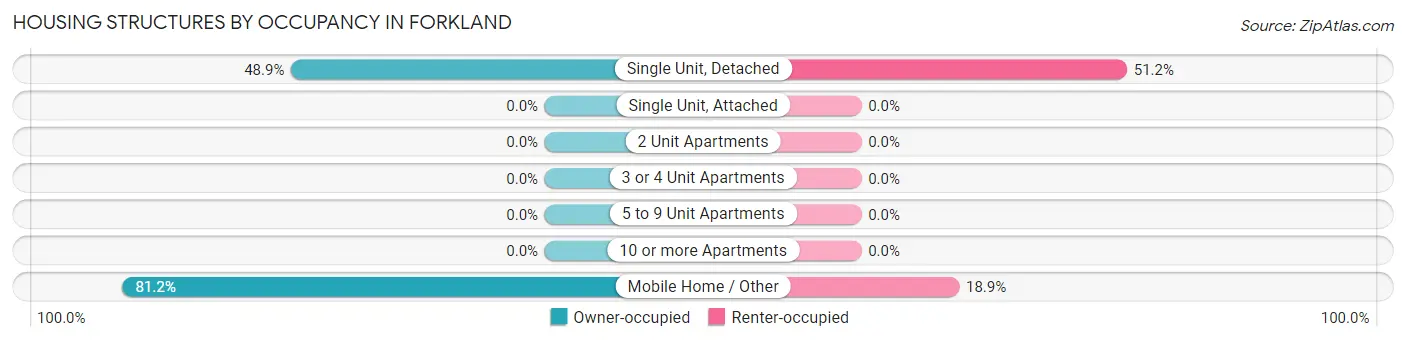
| Structure Type | Owner-occupied | Renter-occupied |
| Single Unit, Detached | 85 (48.8%) | 89 (51.1%) |
| Single Unit, Attached | 0 (0.0%) | 0 (0.0%) |
| 2 Unit Apartments | 0 (0.0%) | 0 (0.0%) |
| 3 or 4 Unit Apartments | 0 (0.0%) | 0 (0.0%) |
| 5 to 9 Unit Apartments | 0 (0.0%) | 0 (0.0%) |
| 10 or more Apartments | 0 (0.0%) | 0 (0.0%) |
| Mobile Home / Other | 99 (81.1%) | 23 (18.9%) |
| Total | 184 (62.2%) | 112 (37.8%) |
Housing Structures by Number of Rooms in Forkland
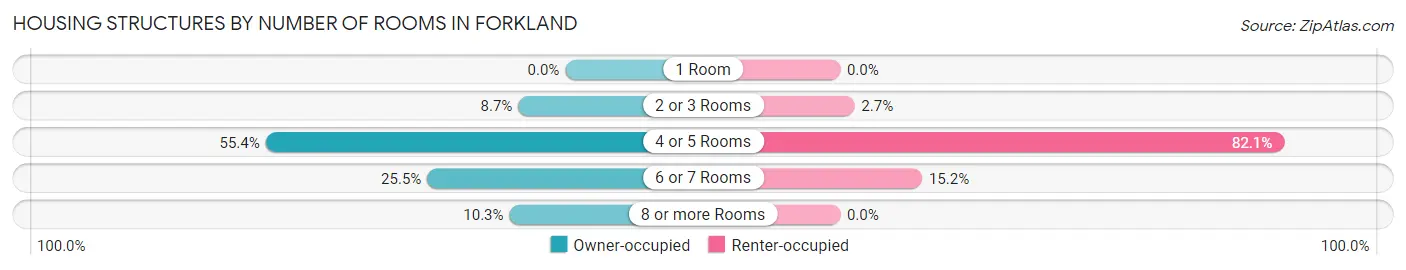
| Number of Rooms | Owner-occupied | Renter-occupied |
| 1 Room | 0 (0.0%) | 0 (0.0%) |
| 2 or 3 Rooms | 16 (8.7%) | 3 (2.7%) |
| 4 or 5 Rooms | 102 (55.4%) | 92 (82.1%) |
| 6 or 7 Rooms | 47 (25.5%) | 17 (15.2%) |
| 8 or more Rooms | 19 (10.3%) | 0 (0.0%) |
| Total | 184 (100.0%) | 112 (100.0%) |
Housing Structure by Heating Type in Forkland
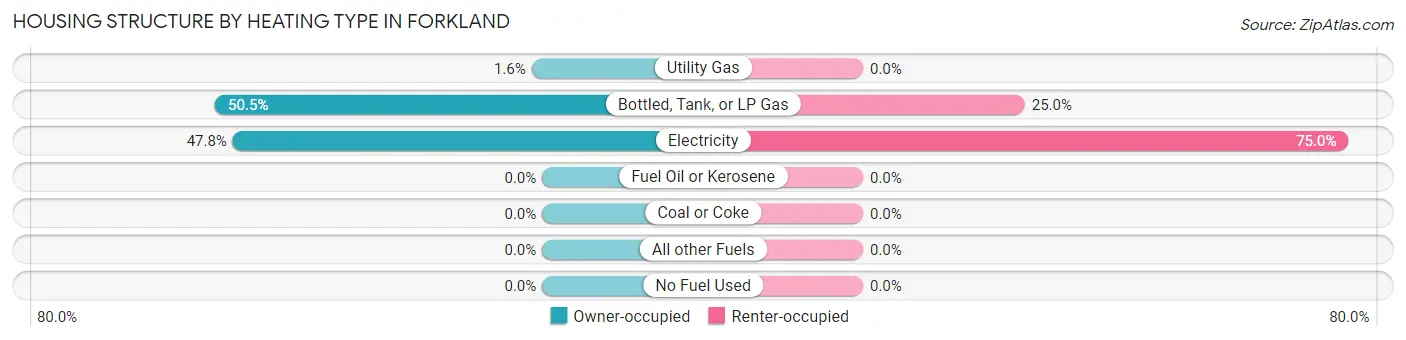
| Heating Type | Owner-occupied | Renter-occupied |
| Utility Gas | 3 (1.6%) | 0 (0.0%) |
| Bottled, Tank, or LP Gas | 93 (50.5%) | 28 (25.0%) |
| Electricity | 88 (47.8%) | 84 (75.0%) |
| Fuel Oil or Kerosene | 0 (0.0%) | 0 (0.0%) |
| Coal or Coke | 0 (0.0%) | 0 (0.0%) |
| All other Fuels | 0 (0.0%) | 0 (0.0%) |
| No Fuel Used | 0 (0.0%) | 0 (0.0%) |
| Total | 184 (100.0%) | 112 (100.0%) |
Household Vehicle Usage in Forkland
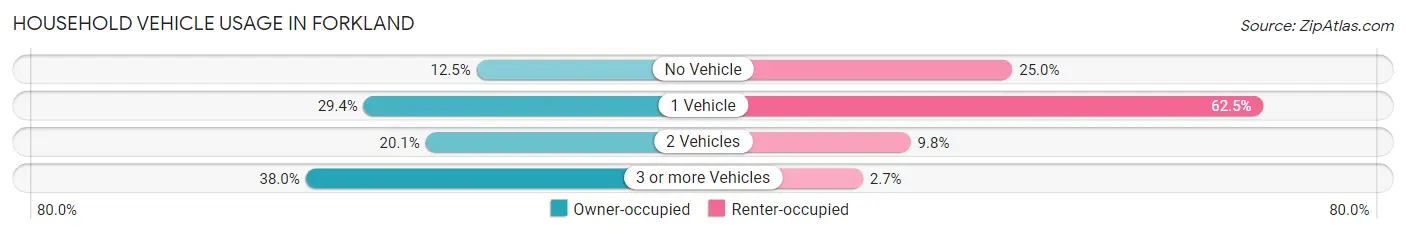
| Vehicles per Household | Owner-occupied | Renter-occupied |
| No Vehicle | 23 (12.5%) | 28 (25.0%) |
| 1 Vehicle | 54 (29.3%) | 70 (62.5%) |
| 2 Vehicles | 37 (20.1%) | 11 (9.8%) |
| 3 or more Vehicles | 70 (38.0%) | 3 (2.7%) |
| Total | 184 (100.0%) | 112 (100.0%) |
Real Estate & Mortgages in Forkland
Real Estate and Mortgage Overview in Forkland
| Characteristic | Without Mortgage | With Mortgage |
| Housing Units | 147 | 37 |
| Median Property Value | $54,200 | $102,100 |
| Median Household Income | $28,142 | $0 |
| Monthly Housing Costs | $246 | $2 |
| Real Estate Taxes | $260 | $22 |
Property Value by Mortgage Status in Forkland
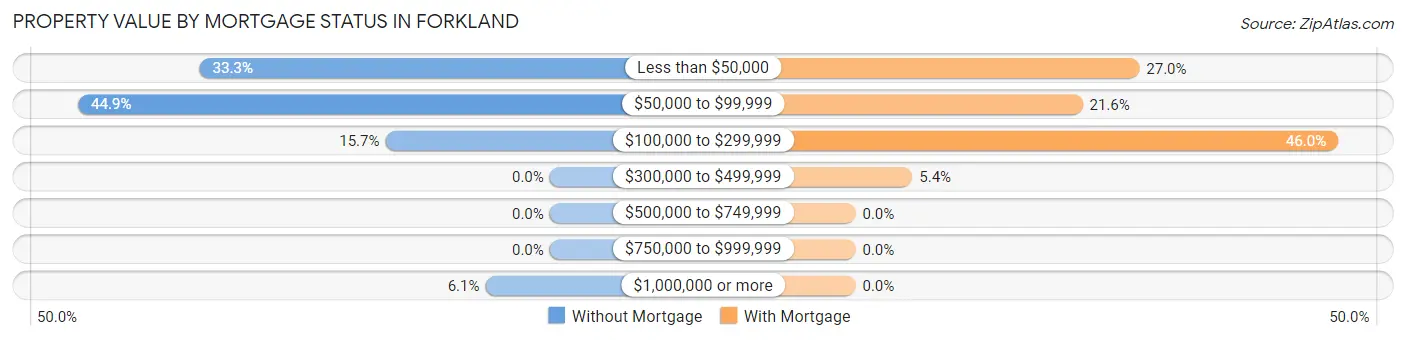
| Property Value | Without Mortgage | With Mortgage |
| Less than $50,000 | 49 (33.3%) | 10 (27.0%) |
| $50,000 to $99,999 | 66 (44.9%) | 8 (21.6%) |
| $100,000 to $299,999 | 23 (15.7%) | 17 (46.0%) |
| $300,000 to $499,999 | 0 (0.0%) | 2 (5.4%) |
| $500,000 to $749,999 | 0 (0.0%) | 0 (0.0%) |
| $750,000 to $999,999 | 0 (0.0%) | 0 (0.0%) |
| $1,000,000 or more | 9 (6.1%) | 0 (0.0%) |
| Total | 147 (100.0%) | 37 (100.0%) |
Household Income by Mortgage Status in Forkland
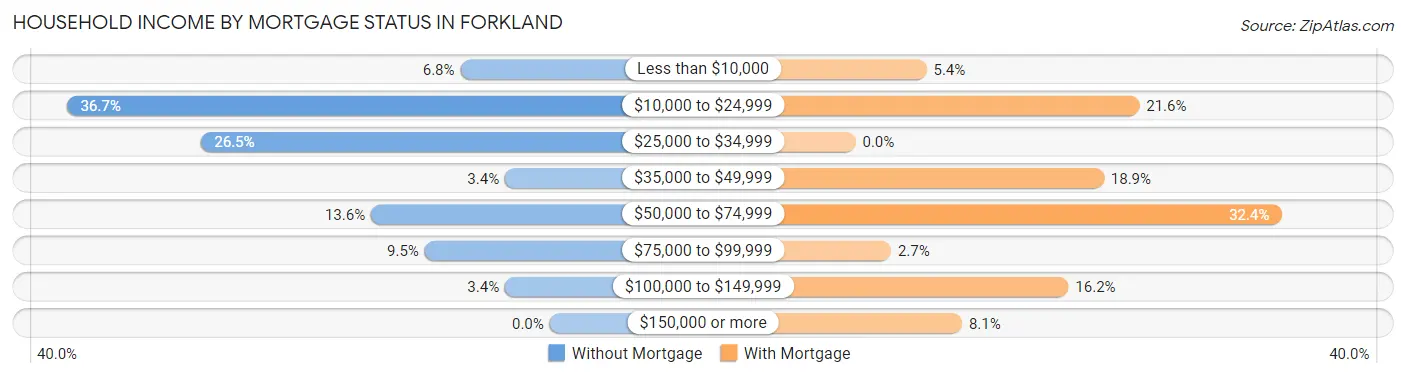
| Household Income | Without Mortgage | With Mortgage |
| Less than $10,000 | 10 (6.8%) | 2 (5.4%) |
| $10,000 to $24,999 | 54 (36.7%) | 8 (21.6%) |
| $25,000 to $34,999 | 39 (26.5%) | 0 (0.0%) |
| $35,000 to $49,999 | 5 (3.4%) | 7 (18.9%) |
| $50,000 to $74,999 | 20 (13.6%) | 12 (32.4%) |
| $75,000 to $99,999 | 14 (9.5%) | 1 (2.7%) |
| $100,000 to $149,999 | 5 (3.4%) | 6 (16.2%) |
| $150,000 or more | 0 (0.0%) | 3 (8.1%) |
| Total | 147 (100.0%) | 37 (100.0%) |
Property Value to Household Income Ratio in Forkland
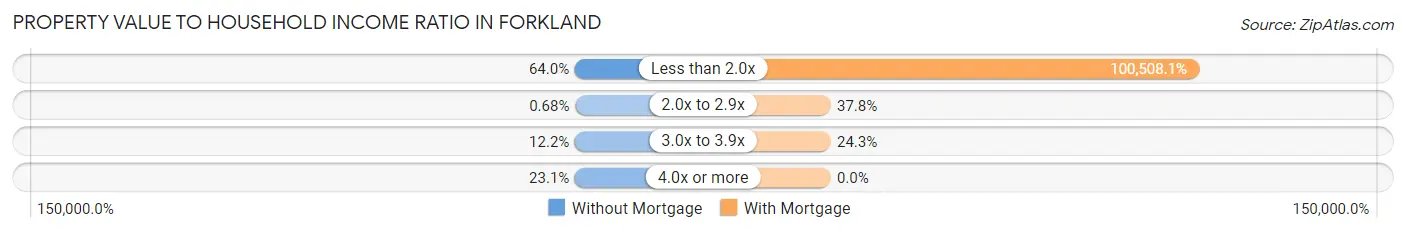
| Value-to-Income Ratio | Without Mortgage | With Mortgage |
| Less than 2.0x | 94 (63.9%) | 37,188 (100,508.1%) |
| 2.0x to 2.9x | 1 (0.7%) | 14 (37.8%) |
| 3.0x to 3.9x | 18 (12.2%) | 9 (24.3%) |
| 4.0x or more | 34 (23.1%) | 0 (0.0%) |
| Total | 147 (100.0%) | 37 (100.0%) |
Real Estate Taxes by Mortgage Status in Forkland
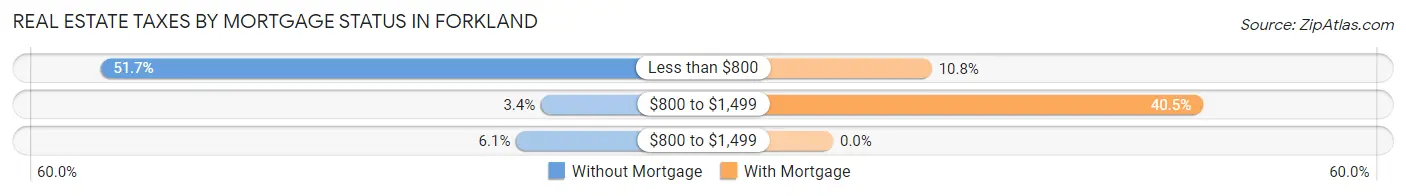
| Property Taxes | Without Mortgage | With Mortgage |
| Less than $800 | 76 (51.7%) | 4 (10.8%) |
| $800 to $1,499 | 5 (3.4%) | 15 (40.5%) |
| $800 to $1,499 | 9 (6.1%) | 0 (0.0%) |
| Total | 147 (100.0%) | 37 (100.0%) |
Health & Disability in Forkland
Health Insurance Coverage by Age in Forkland
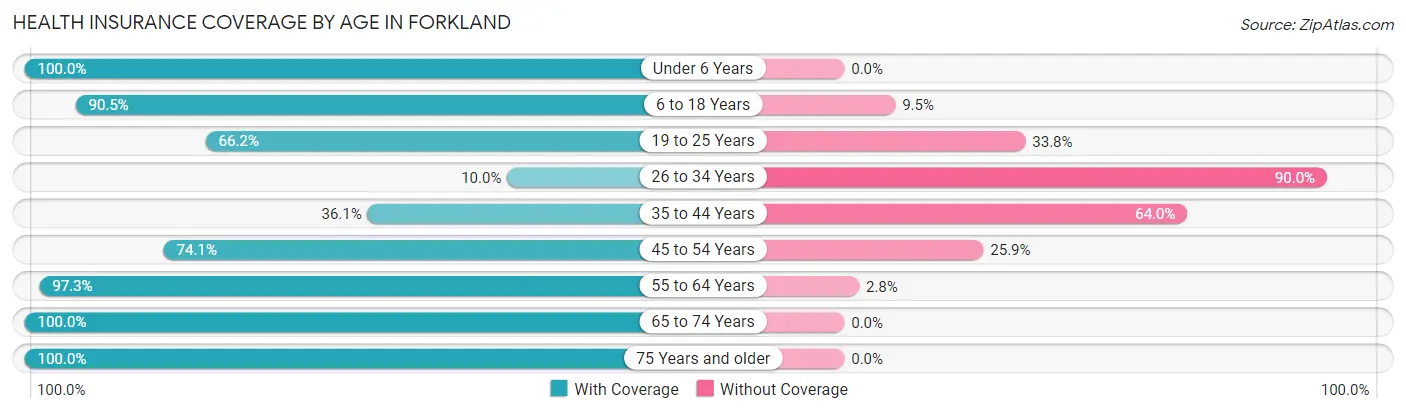
| Age Bracket | With Coverage | Without Coverage |
| Under 6 Years | 54 (100.0%) | 0 (0.0%) |
| 6 to 18 Years | 124 (90.5%) | 13 (9.5%) |
| 19 to 25 Years | 155 (66.2%) | 79 (33.8%) |
| 26 to 34 Years | 2 (10.0%) | 18 (90.0%) |
| 35 to 44 Years | 53 (36.0%) | 94 (63.9%) |
| 45 to 54 Years | 100 (74.1%) | 35 (25.9%) |
| 55 to 64 Years | 106 (97.3%) | 3 (2.8%) |
| 65 to 74 Years | 42 (100.0%) | 0 (0.0%) |
| 75 Years and older | 117 (100.0%) | 0 (0.0%) |
| Total | 753 (75.7%) | 242 (24.3%) |
Health Insurance Coverage by Citizenship Status in Forkland
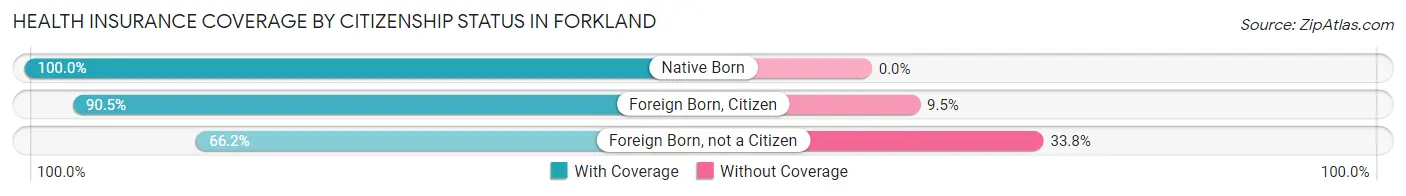
| Citizenship Status | With Coverage | Without Coverage |
| Native Born | 54 (100.0%) | 0 (0.0%) |
| Foreign Born, Citizen | 124 (90.5%) | 13 (9.5%) |
| Foreign Born, not a Citizen | 155 (66.2%) | 79 (33.8%) |
Health Insurance Coverage by Household Income in Forkland
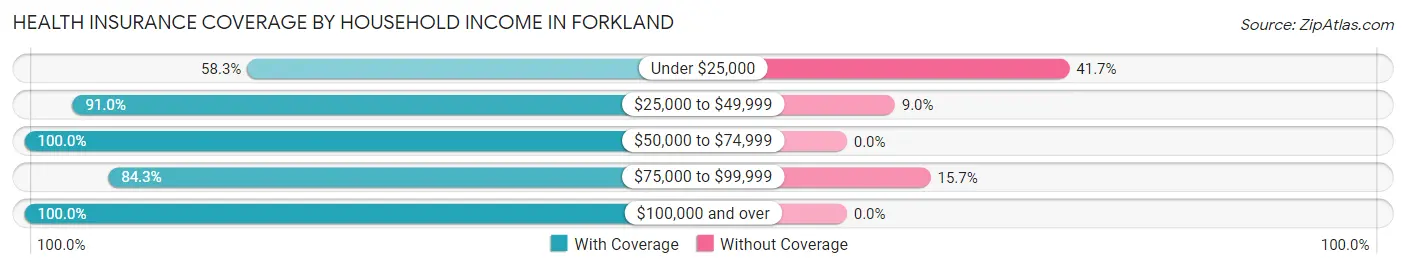
| Household Income | With Coverage | Without Coverage |
| Under $25,000 | 281 (58.3%) | 201 (41.7%) |
| $25,000 to $49,999 | 253 (91.0%) | 25 (9.0%) |
| $50,000 to $74,999 | 91 (100.0%) | 0 (0.0%) |
| $75,000 to $99,999 | 86 (84.3%) | 16 (15.7%) |
| $100,000 and over | 42 (100.0%) | 0 (0.0%) |
Public vs Private Health Insurance Coverage by Age in Forkland
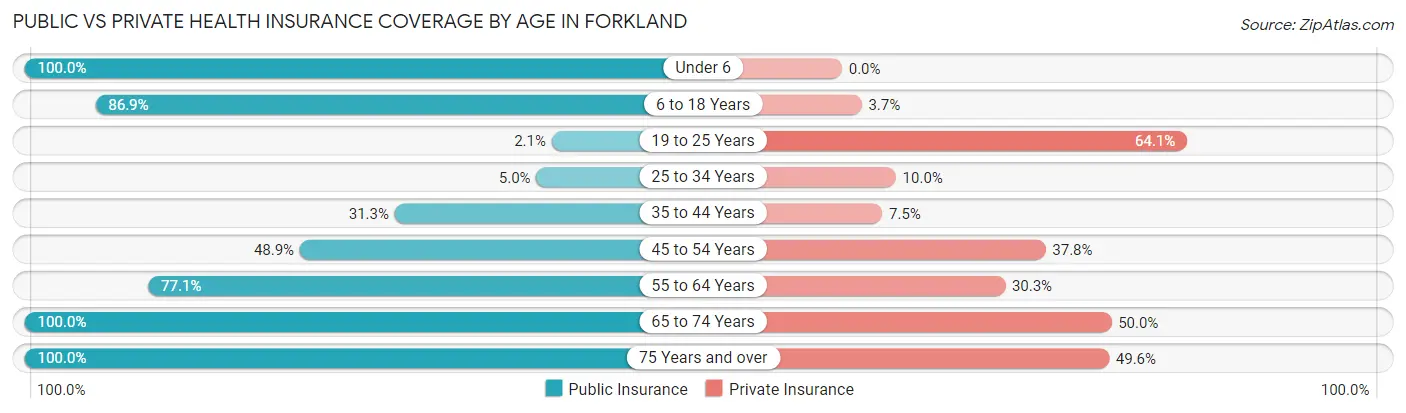
| Age Bracket | Public Insurance | Private Insurance |
| Under 6 | 54 (100.0%) | 0 (0.0%) |
| 6 to 18 Years | 119 (86.9%) | 5 (3.6%) |
| 19 to 25 Years | 5 (2.1%) | 150 (64.1%) |
| 25 to 34 Years | 1 (5.0%) | 2 (10.0%) |
| 35 to 44 Years | 46 (31.3%) | 11 (7.5%) |
| 45 to 54 Years | 66 (48.9%) | 51 (37.8%) |
| 55 to 64 Years | 84 (77.1%) | 33 (30.3%) |
| 65 to 74 Years | 42 (100.0%) | 21 (50.0%) |
| 75 Years and over | 117 (100.0%) | 58 (49.6%) |
| Total | 534 (53.7%) | 331 (33.3%) |
Disability Status by Sex by Age in Forkland
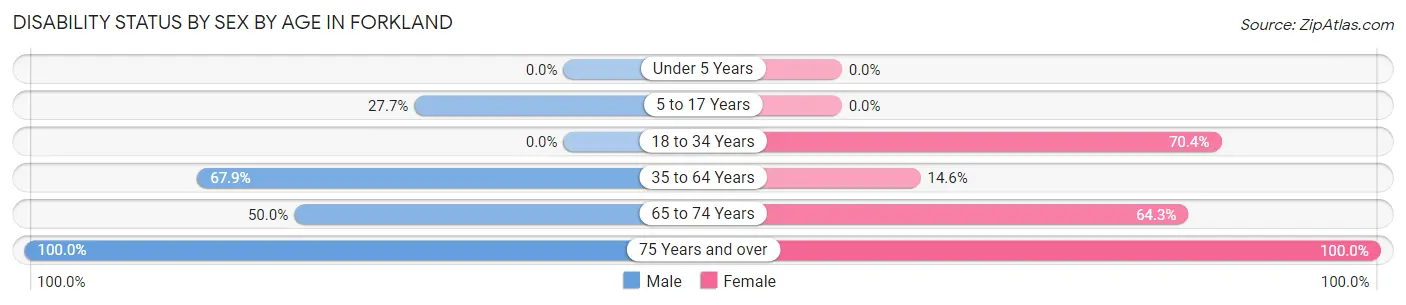
| Age Bracket | Male | Female |
| Under 5 Years | 0 (0.0%) | 0 (0.0%) |
| 5 to 17 Years | 18 (27.7%) | 0 (0.0%) |
| 18 to 34 Years | 0 (0.0%) | 150 (70.4%) |
| 35 to 64 Years | 89 (67.9%) | 38 (14.6%) |
| 65 to 74 Years | 7 (50.0%) | 18 (64.3%) |
| 75 Years and over | 52 (100.0%) | 65 (100.0%) |
Disability Class by Sex by Age in Forkland
Disability Class: Hearing Difficulty
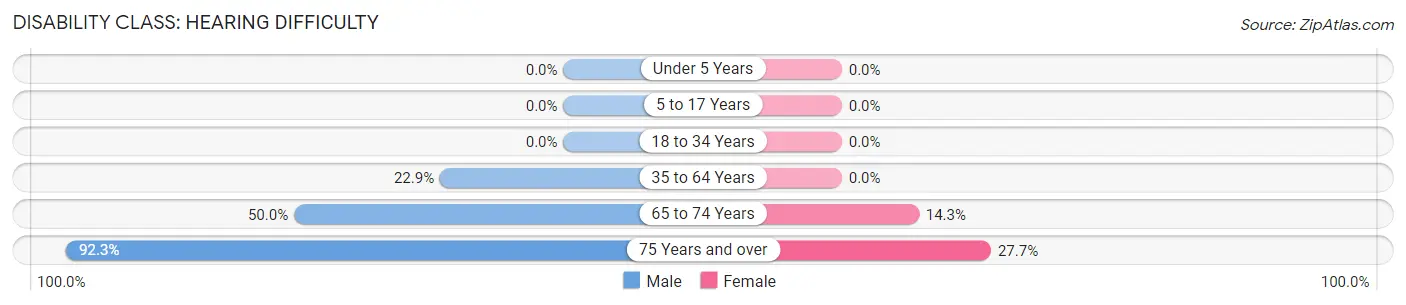
| Age Bracket | Male | Female |
| Under 5 Years | 0 (0.0%) | 0 (0.0%) |
| 5 to 17 Years | 0 (0.0%) | 0 (0.0%) |
| 18 to 34 Years | 0 (0.0%) | 0 (0.0%) |
| 35 to 64 Years | 30 (22.9%) | 0 (0.0%) |
| 65 to 74 Years | 7 (50.0%) | 4 (14.3%) |
| 75 Years and over | 48 (92.3%) | 18 (27.7%) |
Disability Class: Vision Difficulty
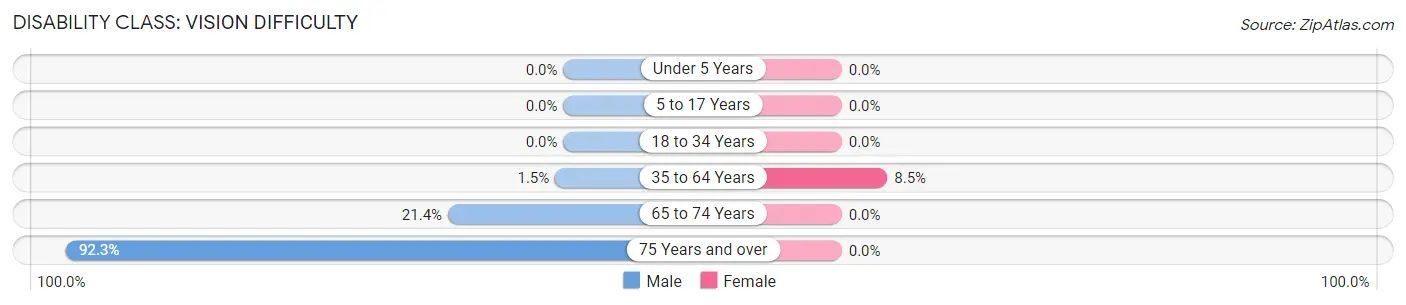
| Age Bracket | Male | Female |
| Under 5 Years | 0 (0.0%) | 0 (0.0%) |
| 5 to 17 Years | 0 (0.0%) | 0 (0.0%) |
| 18 to 34 Years | 0 (0.0%) | 0 (0.0%) |
| 35 to 64 Years | 2 (1.5%) | 22 (8.5%) |
| 65 to 74 Years | 3 (21.4%) | 0 (0.0%) |
| 75 Years and over | 48 (92.3%) | 0 (0.0%) |
Disability Class: Cognitive Difficulty
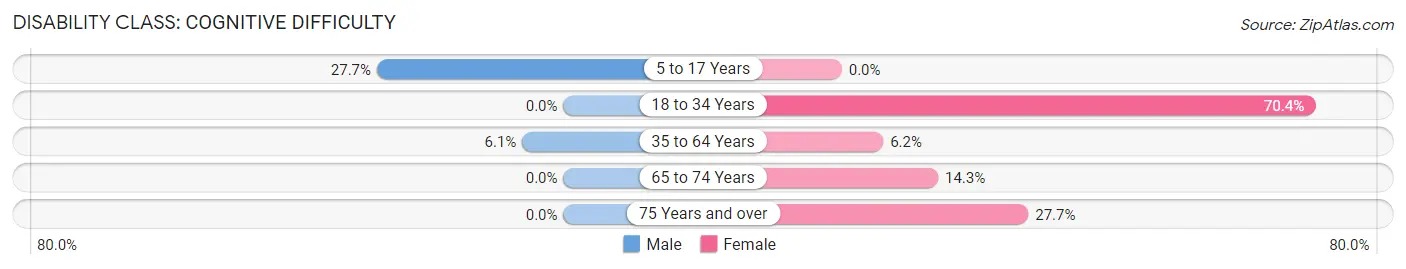
| Age Bracket | Male | Female |
| 5 to 17 Years | 18 (27.7%) | 0 (0.0%) |
| 18 to 34 Years | 0 (0.0%) | 150 (70.4%) |
| 35 to 64 Years | 8 (6.1%) | 16 (6.1%) |
| 65 to 74 Years | 0 (0.0%) | 4 (14.3%) |
| 75 Years and over | 0 (0.0%) | 18 (27.7%) |
Disability Class: Ambulatory Difficulty
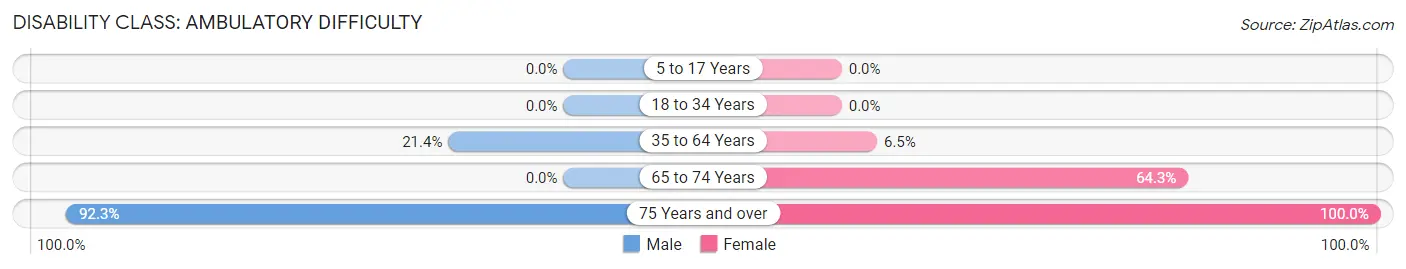
| Age Bracket | Male | Female |
| 5 to 17 Years | 0 (0.0%) | 0 (0.0%) |
| 18 to 34 Years | 0 (0.0%) | 0 (0.0%) |
| 35 to 64 Years | 28 (21.4%) | 17 (6.5%) |
| 65 to 74 Years | 0 (0.0%) | 18 (64.3%) |
| 75 Years and over | 48 (92.3%) | 65 (100.0%) |
Disability Class: Self-Care Difficulty
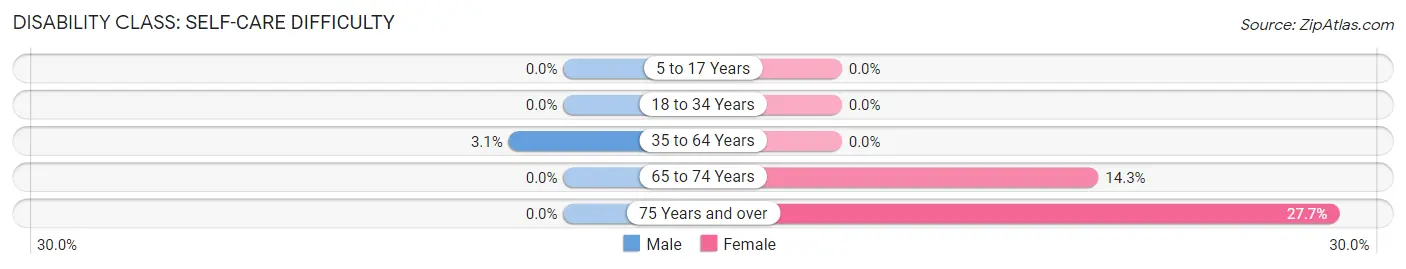
| Age Bracket | Male | Female |
| 5 to 17 Years | 0 (0.0%) | 0 (0.0%) |
| 18 to 34 Years | 0 (0.0%) | 0 (0.0%) |
| 35 to 64 Years | 4 (3.0%) | 0 (0.0%) |
| 65 to 74 Years | 0 (0.0%) | 4 (14.3%) |
| 75 Years and over | 0 (0.0%) | 18 (27.7%) |
Technology Access in Forkland
Computing Device Access in Forkland
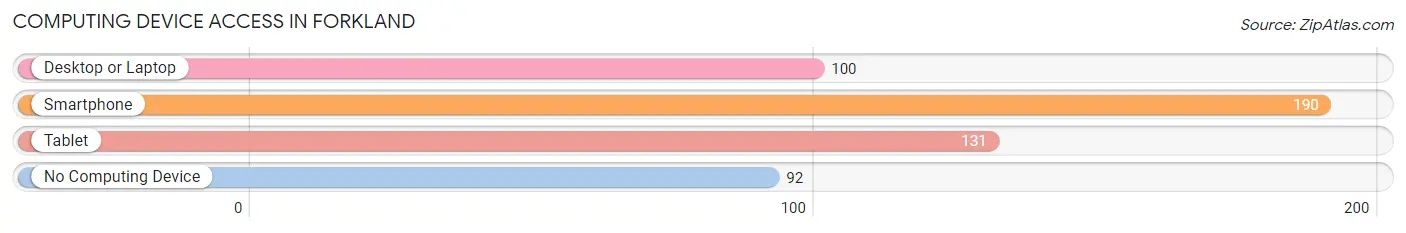
| Device Type | # Households | % Households |
| Desktop or Laptop | 100 | 33.8% |
| Smartphone | 190 | 64.2% |
| Tablet | 131 | 44.3% |
| No Computing Device | 92 | 31.1% |
| Total | 296 | 100.0% |
Internet Access in Forkland
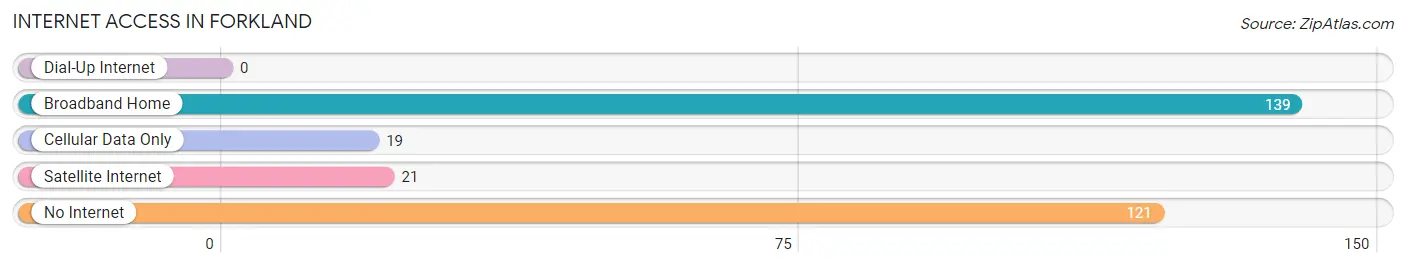
| Internet Type | # Households | % Households |
| Dial-Up Internet | 0 | 0.0% |
| Broadband Home | 139 | 47.0% |
| Cellular Data Only | 19 | 6.4% |
| Satellite Internet | 21 | 7.1% |
| No Internet | 121 | 40.9% |
| Total | 296 | 100.0% |
Forkland Summary
Forkland is a small town located in Greene County, Alabama. It is situated on the banks of the Tombigbee River, approximately 20 miles south of Tuscaloosa. The town was founded in 1819 and is one of the oldest settlements in the state. The population of Forkland was estimated to be around 500 in 2020.
Geography
Forkland is located in the Black Belt region of Alabama, which is characterized by its rich, dark soil. The town is situated on the banks of the Tombigbee River, which is a major tributary of the Mobile River. The town is surrounded by rolling hills and forests, and is located in a rural area. The climate in Forkland is humid subtropical, with hot summers and mild winters.
Economy
Forkland’s economy is largely based on agriculture. The town is home to several farms, which produce cotton, soybeans, corn, and other crops. The town also has a few small businesses, including a grocery store, a gas station, and a few restaurants.
Demographics
Forkland is a predominantly African American town, with a population that is approximately 90% African American. The median household income in Forkland is $25,000, which is lower than the national average. The town has a high poverty rate, with nearly 40% of the population living below the poverty line.
History
Forkland was founded in 1819 by a group of settlers from Georgia. The town was named after a nearby creek, which was named after a Native American chief. The town was an important trading post for the area, and was a major stop on the stagecoach route between Mobile and Tuscaloosa.
In the late 19th century, Forkland became a center for the timber industry. The town was home to several sawmills, which supplied lumber to the surrounding area. The timber industry declined in the early 20th century, and the town’s economy shifted to agriculture.
Forkland was also an important stop on the Underground Railroad. The town was home to several abolitionists, who helped runaway slaves escape to freedom.
Forkland is a small town with a rich history and a unique culture. The town is home to a diverse population, and is a great place to visit and explore. The town is a great example of the rural South, and is a great place to experience the culture and history of the region.
Common Questions
What is the Total Population of Forkland?
Total Population of Forkland is 995.
What is the Total Male Population of Forkland?
Total Male Population of Forkland is 314.
What is the Total Female Population of Forkland?
Total Female Population of Forkland is 681.
What is the Ratio of Males per 100 Females in Forkland?
There are 46.11 Males per 100 Females in Forkland.
What is the Ratio of Females per 100 Males in Forkland?
There are 216.88 Females per 100 Males in Forkland.
What is the Median Population Age in Forkland?
Median Population Age in Forkland is 44.0 Years.
What is the Average Family Size in Forkland
Average Family Size in Forkland is 5.8 People.
What is the Average Household Size in Forkland
Average Household Size in Forkland is 3.4 People.
What is Per Capita Income in Forkland?
Per Capita income in Forkland is $14,487.
What is the Median Family Income in Forkland?
Median Family Income in Forkland is $29,020.
What is the Median Household income in Forkland?
Median Household Income in Forkland is $28,367.
What is Income or Wage Gap in Forkland?
Income or Wage Gap in Forkland is 21.7%.
Women in Forkland earn 78.3 cents for every dollar earned by a man.
What is Inequality or Gini Index in Forkland?
Inequality or Gini Index in Forkland is 0.44.
How Large is the Labor Force in Forkland?
There are 205 People in the Labor Forcein in Forkland.
What is the Percentage of People in the Labor Force in Forkland?
24.7% of People are in the Labor Force in Forkland.
What is the Unemployment Rate in Forkland?
Unemployment Rate in Forkland is 6.8%.