Five Points, AL Map & Demographics
Five Points Map
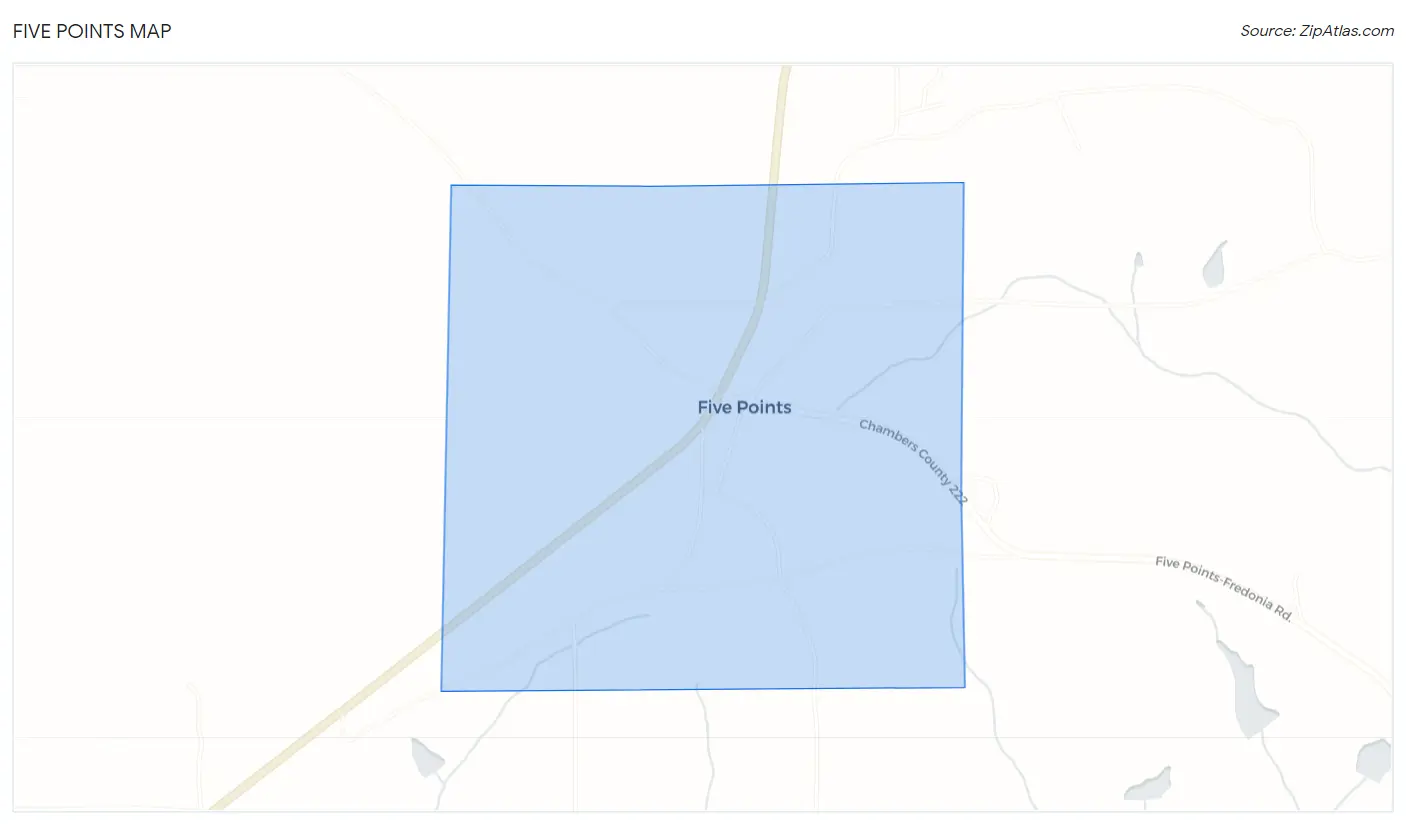
Five Points Overview
$18,493
PER CAPITA INCOME
$81,071
AVG FAMILY INCOME
$76,667
AVG HOUSEHOLD INCOME
0.30
INEQUALITY / GINI INDEX
155
TOTAL POPULATION
59
MALE POPULATION
96
FEMALE POPULATION
61.46
MALES / 100 FEMALES
162.71
FEMALES / 100 MALES
39.0
MEDIAN AGE
4.1
AVG FAMILY SIZE
3.5
AVG HOUSEHOLD SIZE
58
LABOR FORCE [ PEOPLE ]
39.2%
PERCENT IN LABOR FORCE
3.4%
UNEMPLOYMENT RATE
Five Points Zip Codes
Five Points Area Codes
Income in Five Points
Income Overview in Five Points
Per Capita Income in Five Points is $18,493, while median incomes of families and households are $81,071 and $76,667 respectively.
| Characteristic | Number | Measure |
| Per Capita Income | 155 | $18,493 |
| Median Family Income | 36 | $81,071 |
| Mean Family Income | 36 | $69,589 |
| Median Household Income | 44 | $76,667 |
| Mean Household Income | 44 | $61,430 |
| Income Deficit | 36 | $0 |
| Wage / Income Gap (%) | 155 | 0.00% |
| Wage / Income Gap ($) | 155 | 100.00¢ per $1 |
| Gini / Inequality Index | 155 | 0.30 |
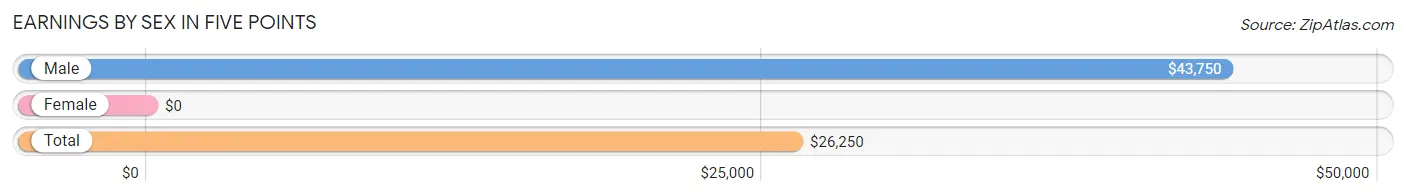
Earnings by Sex in Five Points
| Sex | Number | Average Earnings |
| Male | 38 (53.5%) | $43,750 |
| Female | 33 (46.5%) | $0 |
| Total | 71 (100.0%) | $26,250 |
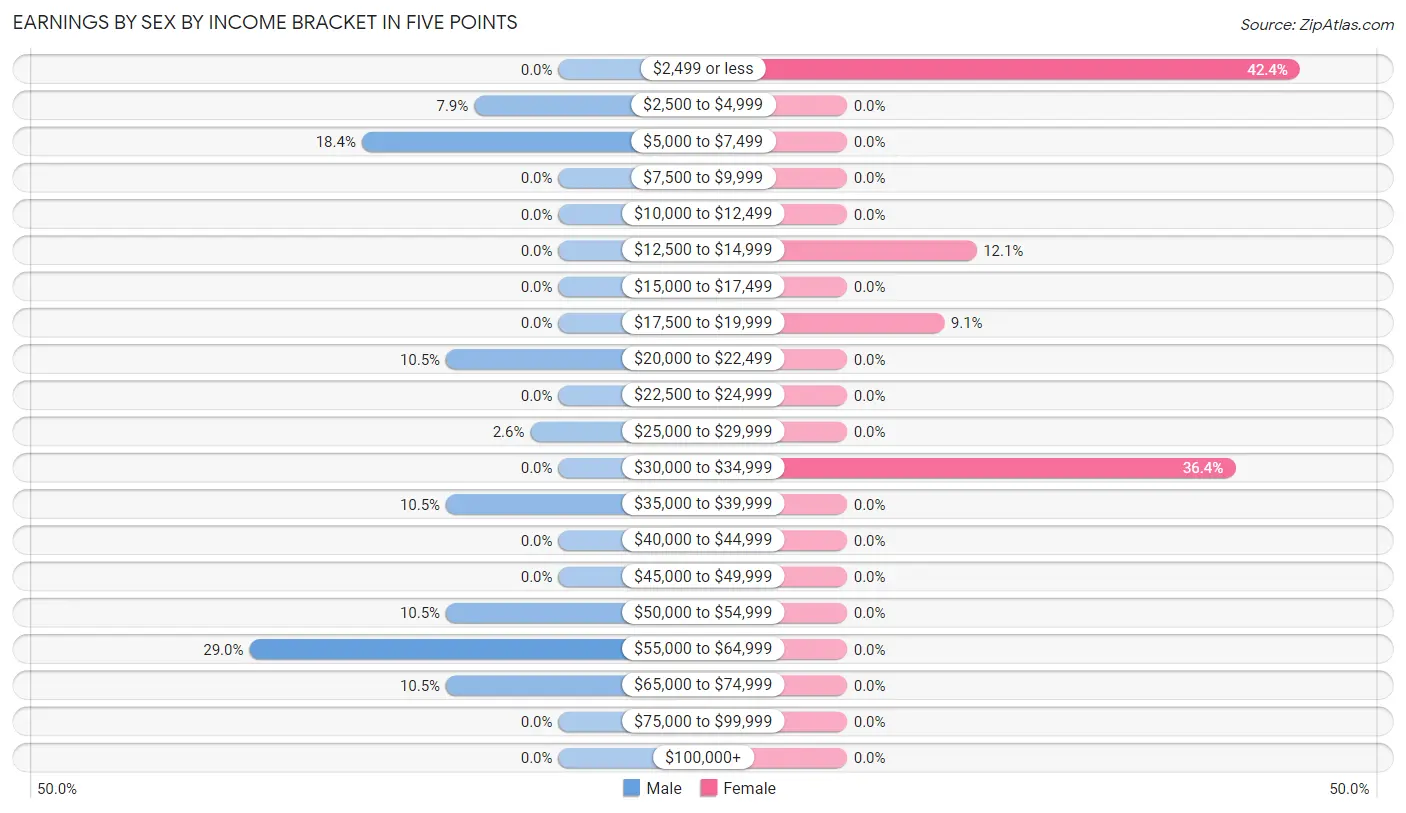
Earnings by Sex by Income Bracket in Five Points
The most common earnings brackets in Five Points are $55,000 to $64,999 for men (11 | 28.9%) and $2,499 or less for women (14 | 42.4%).
| Income | Male | Female |
| $2,499 or less | 0 (0.0%) | 14 (42.4%) |
| $2,500 to $4,999 | 3 (7.9%) | 0 (0.0%) |
| $5,000 to $7,499 | 7 (18.4%) | 0 (0.0%) |
| $7,500 to $9,999 | 0 (0.0%) | 0 (0.0%) |
| $10,000 to $12,499 | 0 (0.0%) | 0 (0.0%) |
| $12,500 to $14,999 | 0 (0.0%) | 4 (12.1%) |
| $15,000 to $17,499 | 0 (0.0%) | 0 (0.0%) |
| $17,500 to $19,999 | 0 (0.0%) | 3 (9.1%) |
| $20,000 to $22,499 | 4 (10.5%) | 0 (0.0%) |
| $22,500 to $24,999 | 0 (0.0%) | 0 (0.0%) |
| $25,000 to $29,999 | 1 (2.6%) | 0 (0.0%) |
| $30,000 to $34,999 | 0 (0.0%) | 12 (36.4%) |
| $35,000 to $39,999 | 4 (10.5%) | 0 (0.0%) |
| $40,000 to $44,999 | 0 (0.0%) | 0 (0.0%) |
| $45,000 to $49,999 | 0 (0.0%) | 0 (0.0%) |
| $50,000 to $54,999 | 4 (10.5%) | 0 (0.0%) |
| $55,000 to $64,999 | 11 (28.9%) | 0 (0.0%) |
| $65,000 to $74,999 | 4 (10.5%) | 0 (0.0%) |
| $75,000 to $99,999 | 0 (0.0%) | 0 (0.0%) |
| $100,000+ | 0 (0.0%) | 0 (0.0%) |
| Total | 38 (100.0%) | 33 (100.0%) |
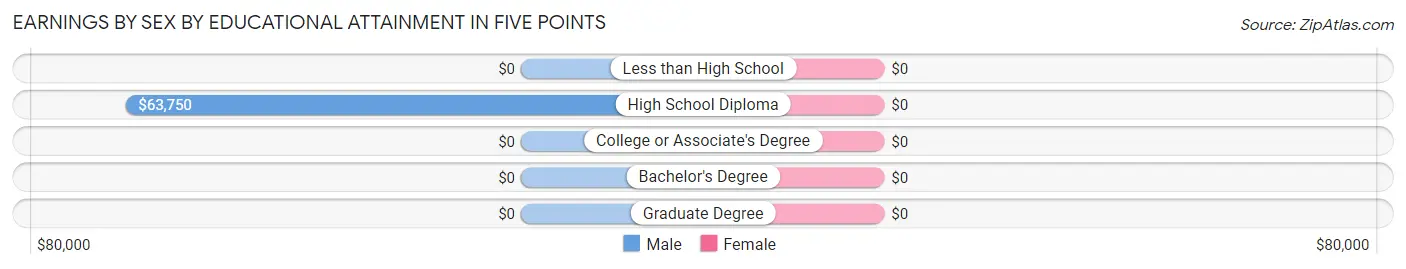
Earnings by Sex by Educational Attainment in Five Points
| Educational Attainment | Male Income | Female Income |
| Less than High School | - | - |
| High School Diploma | $63,750 | $0 |
| College or Associate's Degree | - | - |
| Bachelor's Degree | - | - |
| Graduate Degree | - | - |
| Total | $62,841 | $0 |
Family Income in Five Points
Family Income Brackets in Five Points
According to the Five Points family income data, there are 24 families falling into the $75,000 to $99,999 income range, which is the most common income bracket and makes up 66.7% of all families.
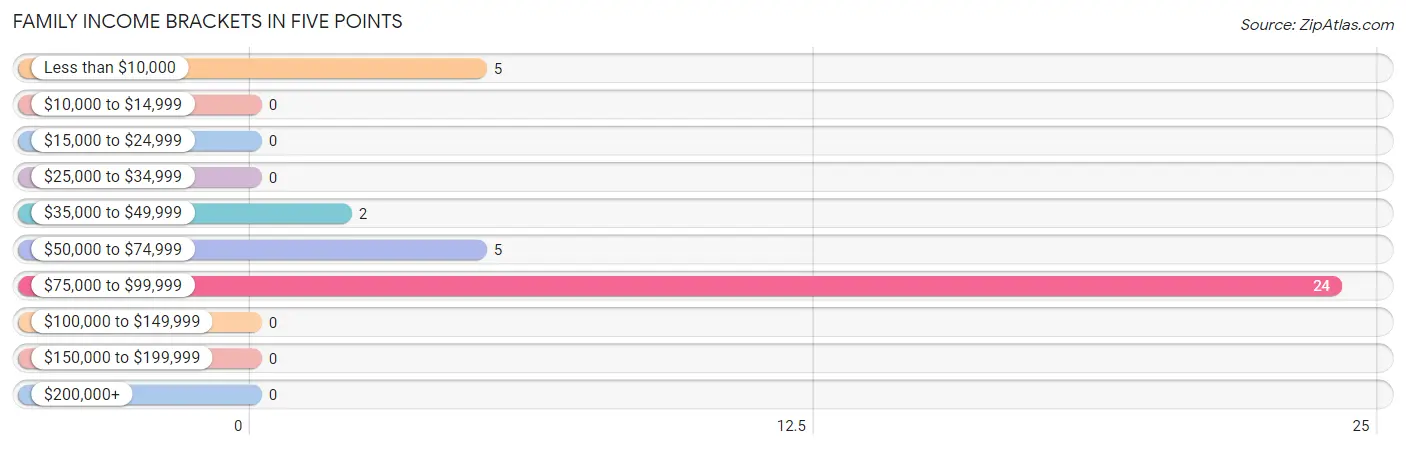
| Income Bracket | # Families | % Families |
| Less than $10,000 | 5 | 13.9% |
| $10,000 to $14,999 | 0 | 0.0% |
| $15,000 to $24,999 | 0 | 0.0% |
| $25,000 to $34,999 | 0 | 0.0% |
| $35,000 to $49,999 | 2 | 5.6% |
| $50,000 to $74,999 | 5 | 13.9% |
| $75,000 to $99,999 | 24 | 66.7% |
| $100,000 to $149,999 | 0 | 0.0% |
| $150,000 to $199,999 | 0 | 0.0% |
| $200,000+ | 0 | 0.0% |
Family Income by Famaliy Size in Five Points
3-person families (21 | 58.3%) account for the highest median family income in Five Points with $95,313 per family, while 3-person families (21 | 58.3%) have the highest median income of $31,771 per family member.
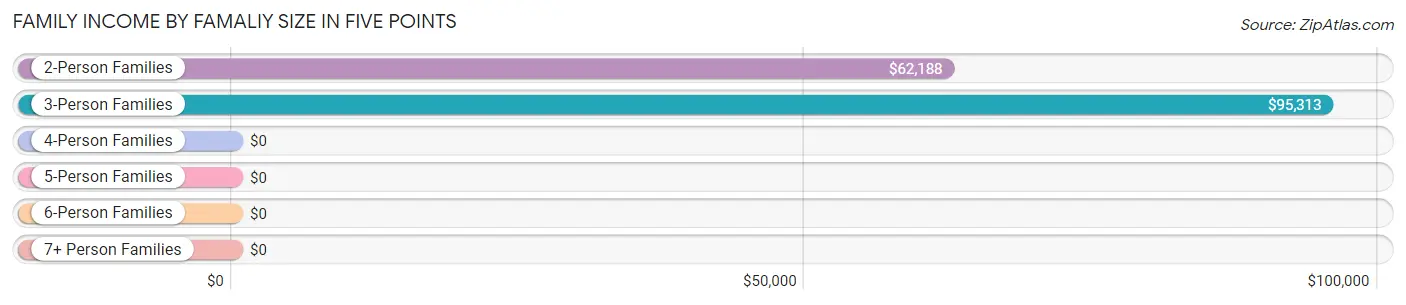
| Income Bracket | # Families | Median Income |
| 2-Person Families | 9 (25.0%) | $62,188 |
| 3-Person Families | 21 (58.3%) | $95,313 |
| 4-Person Families | 3 (8.3%) | $0 |
| 5-Person Families | 3 (8.3%) | $0 |
| 6-Person Families | 0 (0.0%) | $0 |
| 7+ Person Families | 0 (0.0%) | $0 |
| Total | 36 (100.0%) | $81,071 |
Family Income by Number of Earners in Five Points
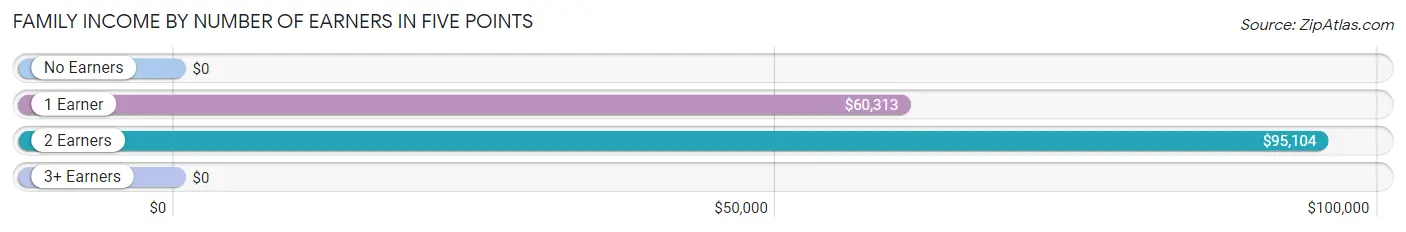
| Number of Earners | # Families | Median Income |
| No Earners | 3 (8.3%) | $0 |
| 1 Earner | 7 (19.4%) | $60,313 |
| 2 Earners | 23 (63.9%) | $95,104 |
| 3+ Earners | 3 (8.3%) | $0 |
| Total | 36 (100.0%) | $81,071 |
Household Income in Five Points
Household Income Brackets in Five Points
With 24 households falling in the category, the $75,000 to $99,999 income range is the most frequent in Five Points, accounting for 54.5% of all households.
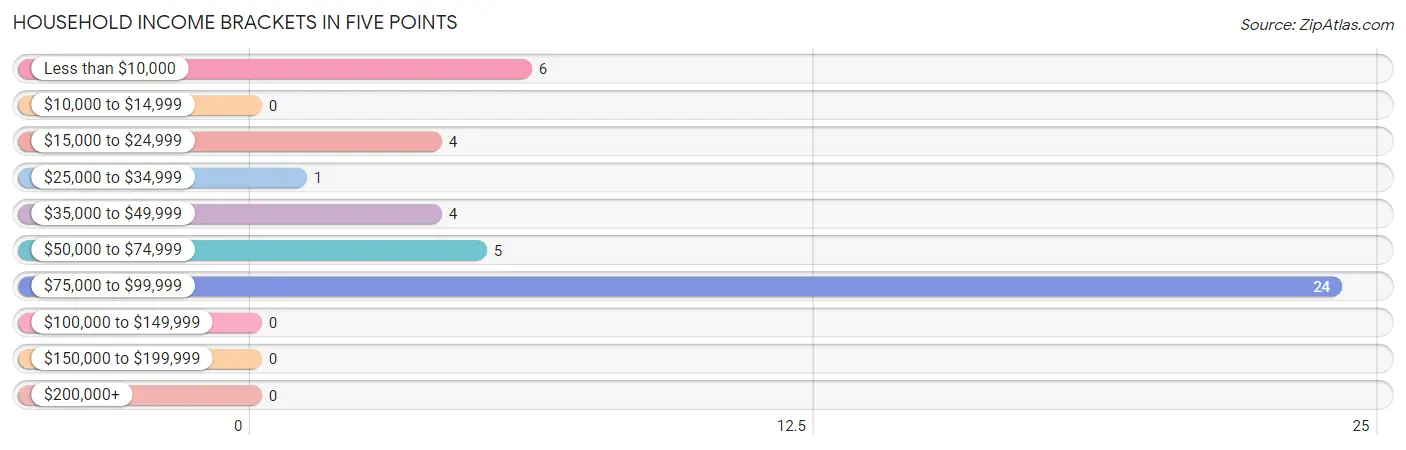
| Income Bracket | # Households | % Households |
| Less than $10,000 | 6 | 13.6% |
| $10,000 to $14,999 | 0 | 0.0% |
| $15,000 to $24,999 | 4 | 9.1% |
| $25,000 to $34,999 | 1 | 2.3% |
| $35,000 to $49,999 | 4 | 9.1% |
| $50,000 to $74,999 | 5 | 11.4% |
| $75,000 to $99,999 | 24 | 54.5% |
| $100,000 to $149,999 | 0 | 0.0% |
| $150,000 to $199,999 | 0 | 0.0% |
| $200,000+ | 0 | 0.0% |
Household Income by Householder Age in Five Points
The median household income in Five Points is $76,667, with the highest median household income of $80,536 found in the 45 to 64 years age bracket for the primary householder. A total of 35 households (79.5%) fall into this category.
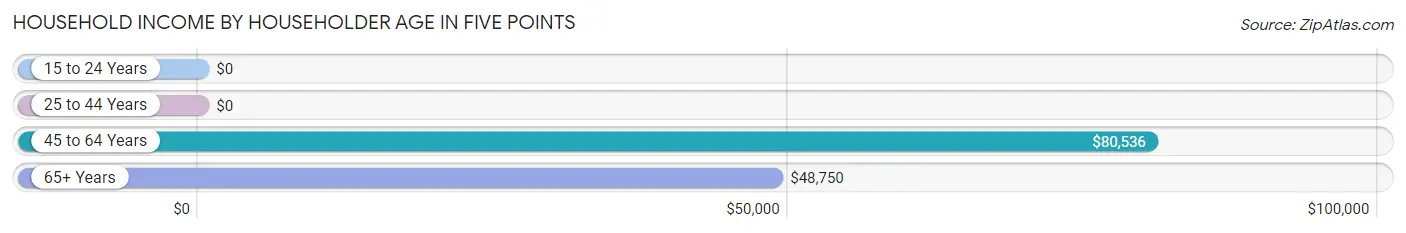
| Income Bracket | # Households | Median Income |
| 15 to 24 Years | 0 (0.0%) | $0 |
| 25 to 44 Years | 2 (4.5%) | $0 |
| 45 to 64 Years | 35 (79.5%) | $80,536 |
| 65+ Years | 7 (15.9%) | $48,750 |
| Total | 44 (100.0%) | $76,667 |
Poverty in Five Points
Income Below Poverty by Sex and Age in Five Points
With 15.2% poverty level for males and 22.9% for females among the residents of Five Points, under 5 year old males and under 5 year old females are the most vulnerable to poverty, with 1 males (100.0%) and 1 females (100.0%) in their respective age groups living below the poverty level.
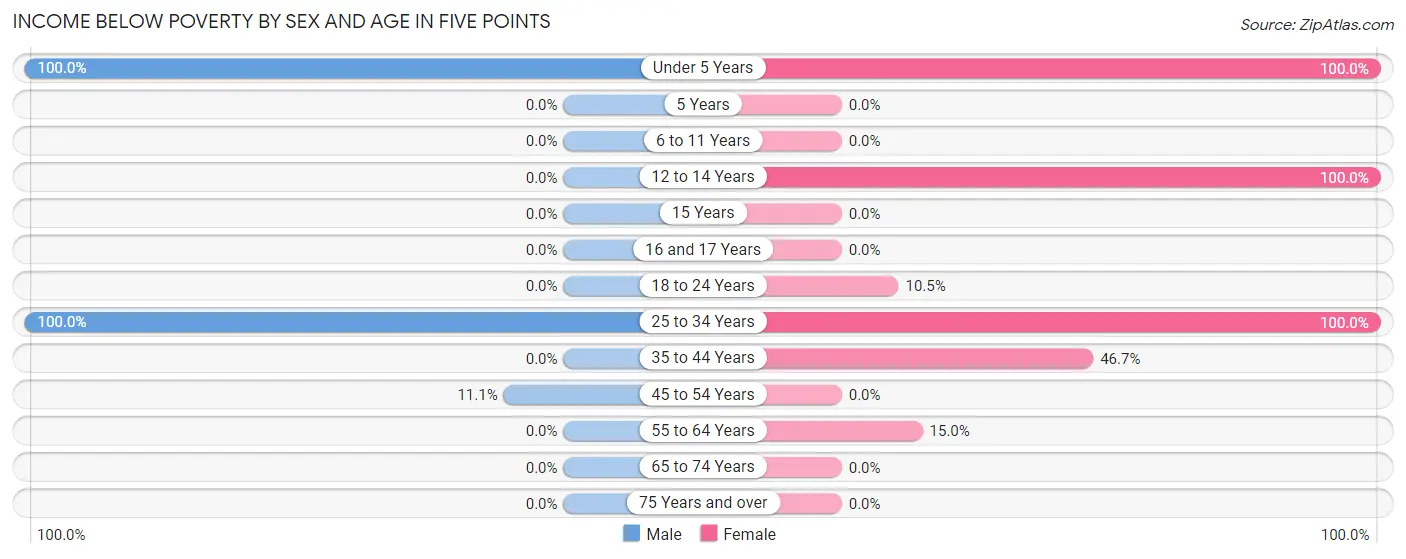
| Age Bracket | Male | Female |
| Under 5 Years | 1 (100.0%) | 1 (100.0%) |
| 5 Years | 0 (0.0%) | 0 (0.0%) |
| 6 to 11 Years | 0 (0.0%) | 0 (0.0%) |
| 12 to 14 Years | 0 (0.0%) | 5 (100.0%) |
| 15 Years | 0 (0.0%) | 0 (0.0%) |
| 16 and 17 Years | 0 (0.0%) | 0 (0.0%) |
| 18 to 24 Years | 0 (0.0%) | 4 (10.5%) |
| 25 to 34 Years | 7 (100.0%) | 2 (100.0%) |
| 35 to 44 Years | 0 (0.0%) | 7 (46.7%) |
| 45 to 54 Years | 1 (11.1%) | 0 (0.0%) |
| 55 to 64 Years | 0 (0.0%) | 3 (15.0%) |
| 65 to 74 Years | 0 (0.0%) | 0 (0.0%) |
| 75 Years and over | 0 (0.0%) | 0 (0.0%) |
| Total | 9 (15.2%) | 22 (22.9%) |
Income Above Poverty by Sex and Age in Five Points
According to the poverty statistics in Five Points, males aged 18 to 24 years and females aged 16 and 17 years are the age groups that are most secure financially, with 100.0% of males and 100.0% of females in these age groups living above the poverty line.
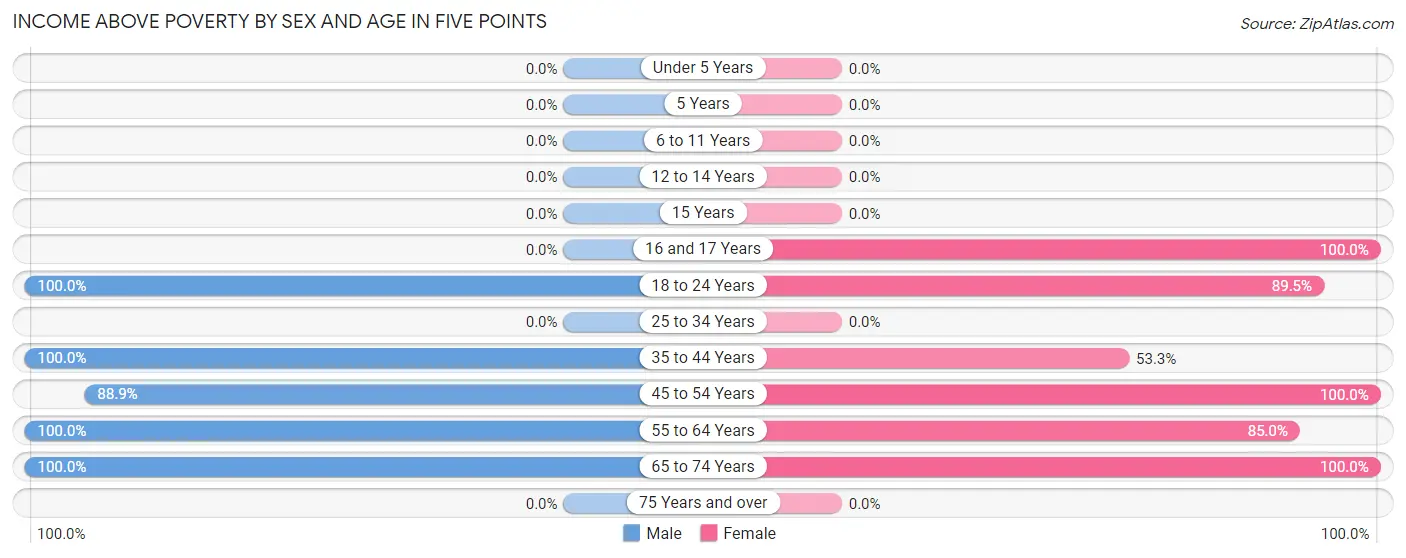
| Age Bracket | Male | Female |
| Under 5 Years | 0 (0.0%) | 0 (0.0%) |
| 5 Years | 0 (0.0%) | 0 (0.0%) |
| 6 to 11 Years | 0 (0.0%) | 0 (0.0%) |
| 12 to 14 Years | 0 (0.0%) | 0 (0.0%) |
| 15 Years | 0 (0.0%) | 0 (0.0%) |
| 16 and 17 Years | 0 (0.0%) | 2 (100.0%) |
| 18 to 24 Years | 11 (100.0%) | 34 (89.5%) |
| 25 to 34 Years | 0 (0.0%) | 0 (0.0%) |
| 35 to 44 Years | 4 (100.0%) | 8 (53.3%) |
| 45 to 54 Years | 8 (88.9%) | 5 (100.0%) |
| 55 to 64 Years | 15 (100.0%) | 17 (85.0%) |
| 65 to 74 Years | 12 (100.0%) | 8 (100.0%) |
| 75 Years and over | 0 (0.0%) | 0 (0.0%) |
| Total | 50 (84.8%) | 74 (77.1%) |
Income Below Poverty Among Married-Couple Families in Five Points
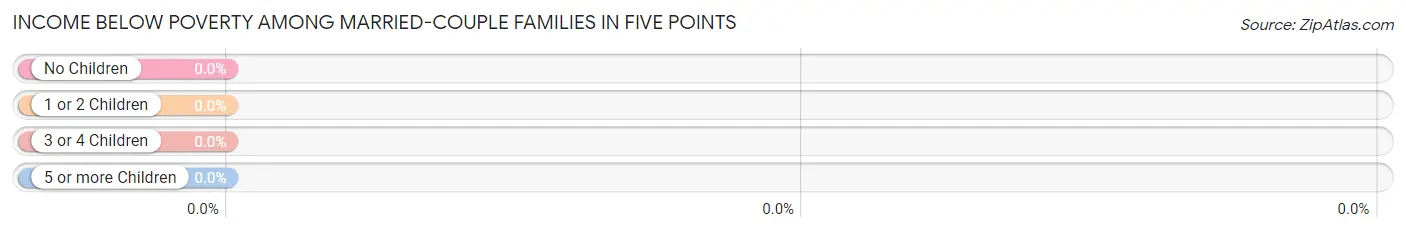
| Children | Above Poverty | Below Poverty |
| No Children | 22 (100.0%) | 0 (0.0%) |
| 1 or 2 Children | 3 (100.0%) | 0 (0.0%) |
| 3 or 4 Children | 0 (0.0%) | 0 (0.0%) |
| 5 or more Children | 0 (0.0%) | 0 (0.0%) |
| Total | 25 (100.0%) | 0 (0.0%) |
Income Below Poverty Among Single-Parent Households in Five Points
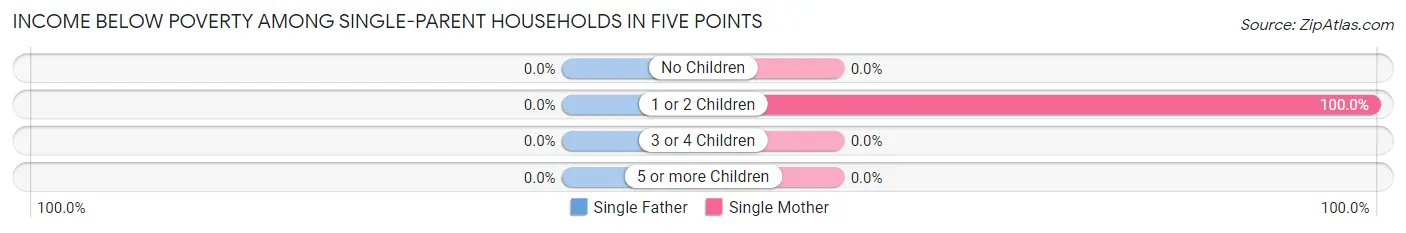
| Children | Single Father | Single Mother |
| No Children | 0 (0.0%) | 0 (0.0%) |
| 1 or 2 Children | 0 (0.0%) | 5 (100.0%) |
| 3 or 4 Children | 0 (0.0%) | 0 (0.0%) |
| 5 or more Children | 0 (0.0%) | 0 (0.0%) |
| Total | 0 (0.0%) | 5 (71.4%) |
Income Below Poverty Among Married-Couple vs Single-Parent Households in Five Points
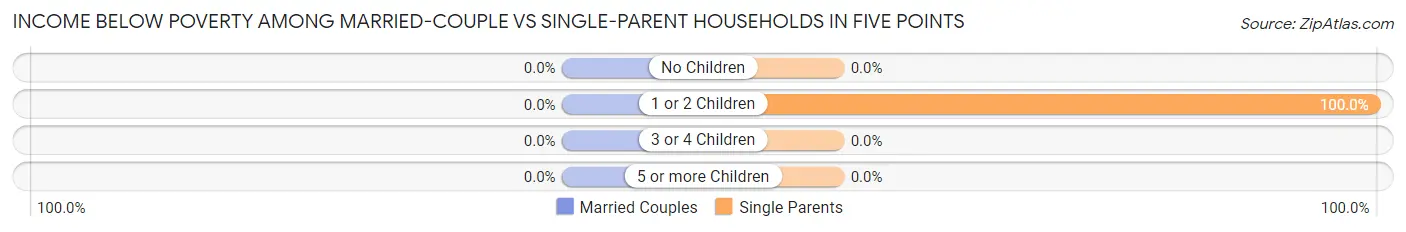
| Children | Married-Couple Families | Single-Parent Households |
| No Children | 0 (0.0%) | 0 (0.0%) |
| 1 or 2 Children | 0 (0.0%) | 5 (100.0%) |
| 3 or 4 Children | 0 (0.0%) | 0 (0.0%) |
| 5 or more Children | 0 (0.0%) | 0 (0.0%) |
| Total | 0 (0.0%) | 5 (45.5%) |
Race in Five Points
The most populous races in Five Points are White / Caucasian (94 | 60.7%), Black / African American (60 | 38.7%), and Two or more Races (1 | 0.6%).
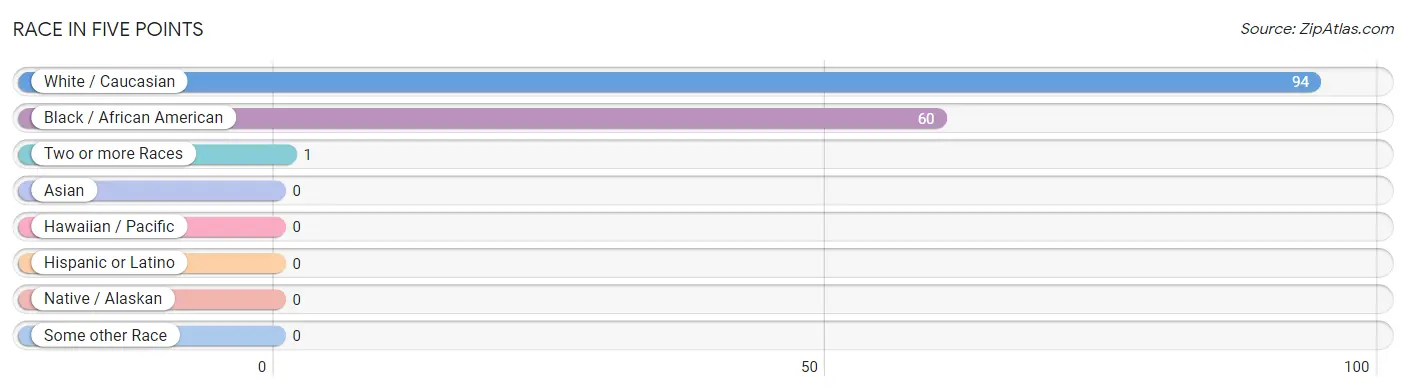
| Race | # Population | % Population |
| Asian | 0 | 0.0% |
| Black / African American | 60 | 38.7% |
| Hawaiian / Pacific | 0 | 0.0% |
| Hispanic or Latino | 0 | 0.0% |
| Native / Alaskan | 0 | 0.0% |
| White / Caucasian | 94 | 60.7% |
| Two or more Races | 1 | 0.6% |
| Some other Race | 0 | 0.0% |
| Total | 155 | 100.0% |
Ancestry in Five Points
The most populous ancestries reported in Five Points are American (54 | 34.8%), English (18 | 11.6%), Irish (10 | 6.5%), German (3 | 1.9%), and Italian (2 | 1.3%), together accounting for 56.1% of all Five Points residents.
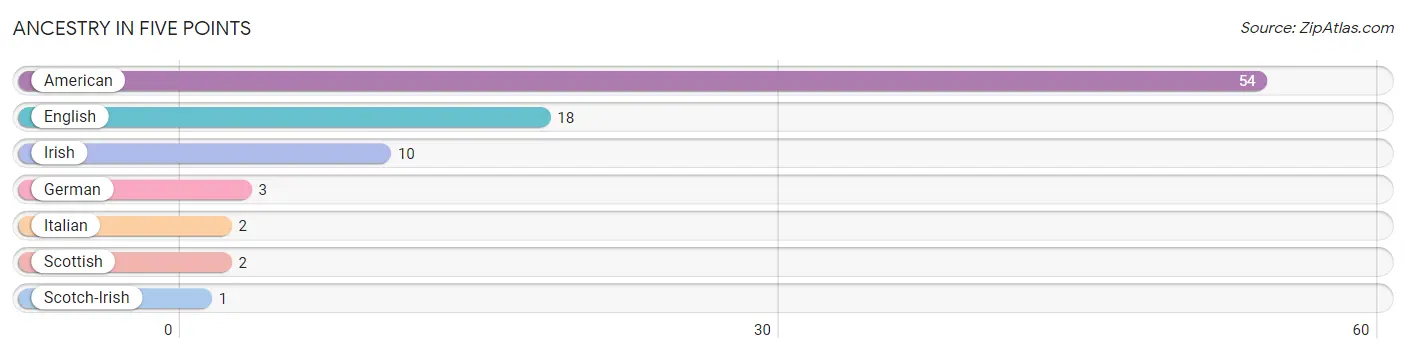
| Ancestry | # Population | % Population |
| American | 54 | 34.8% |
| English | 18 | 11.6% |
| German | 3 | 1.9% |
| Irish | 10 | 6.5% |
| Italian | 2 | 1.3% |
| Scotch-Irish | 1 | 0.6% |
| Scottish | 2 | 1.3% | View All 7 Rows |
Immigrants in Five Points

| Immigration Origin | # Population | % Population | View All 0 Rows |
Sex and Age in Five Points
Sex and Age in Five Points
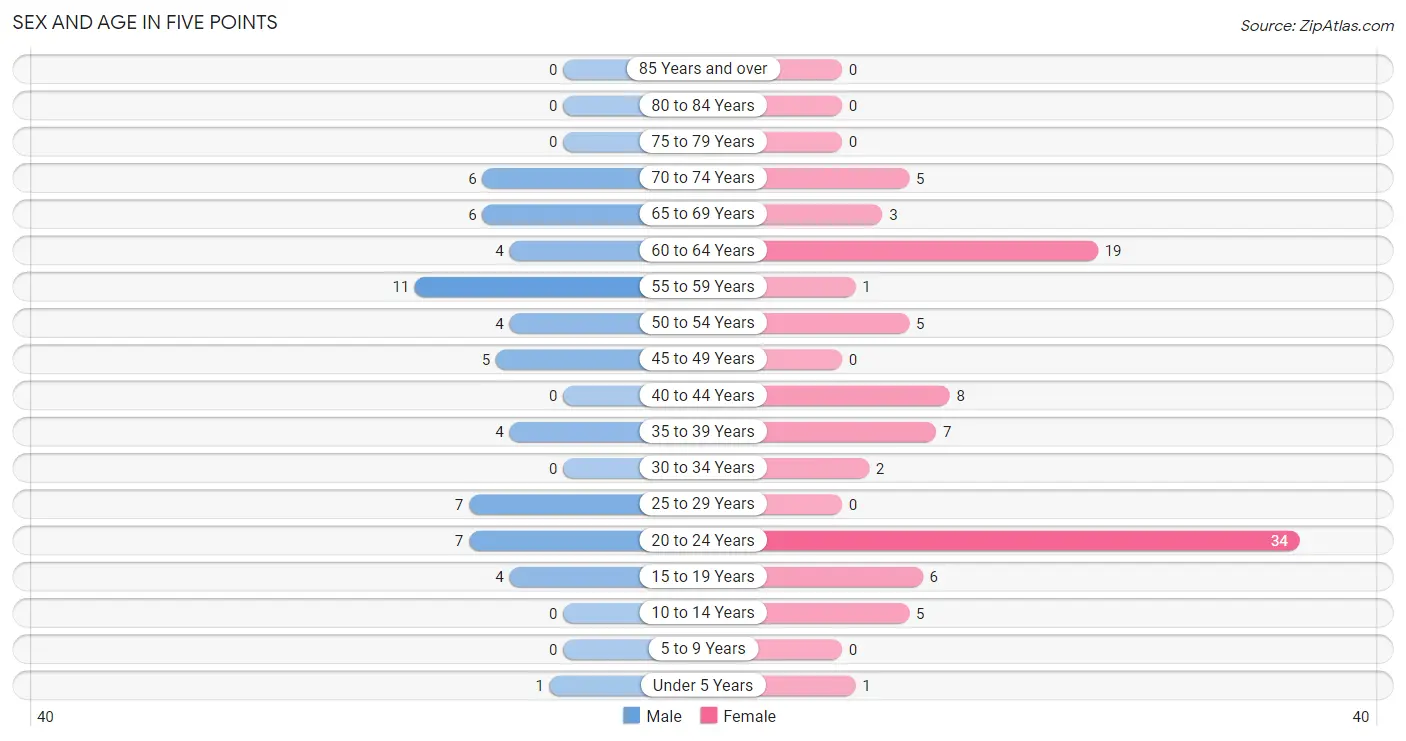
The most populous age groups in Five Points are 55 to 59 Years (11 | 18.6%) for men and 20 to 24 Years (34 | 35.4%) for women.
| Age Bracket | Male | Female |
| Under 5 Years | 1 (1.7%) | 1 (1.0%) |
| 5 to 9 Years | 0 (0.0%) | 0 (0.0%) |
| 10 to 14 Years | 0 (0.0%) | 5 (5.2%) |
| 15 to 19 Years | 4 (6.8%) | 6 (6.2%) |
| 20 to 24 Years | 7 (11.9%) | 34 (35.4%) |
| 25 to 29 Years | 7 (11.9%) | 0 (0.0%) |
| 30 to 34 Years | 0 (0.0%) | 2 (2.1%) |
| 35 to 39 Years | 4 (6.8%) | 7 (7.3%) |
| 40 to 44 Years | 0 (0.0%) | 8 (8.3%) |
| 45 to 49 Years | 5 (8.5%) | 0 (0.0%) |
| 50 to 54 Years | 4 (6.8%) | 5 (5.2%) |
| 55 to 59 Years | 11 (18.6%) | 1 (1.0%) |
| 60 to 64 Years | 4 (6.8%) | 19 (19.8%) |
| 65 to 69 Years | 6 (10.2%) | 3 (3.1%) |
| 70 to 74 Years | 6 (10.2%) | 5 (5.2%) |
| 75 to 79 Years | 0 (0.0%) | 0 (0.0%) |
| 80 to 84 Years | 0 (0.0%) | 0 (0.0%) |
| 85 Years and over | 0 (0.0%) | 0 (0.0%) |
| Total | 59 (100.0%) | 96 (100.0%) |
Families and Households in Five Points
Median Family Size in Five Points
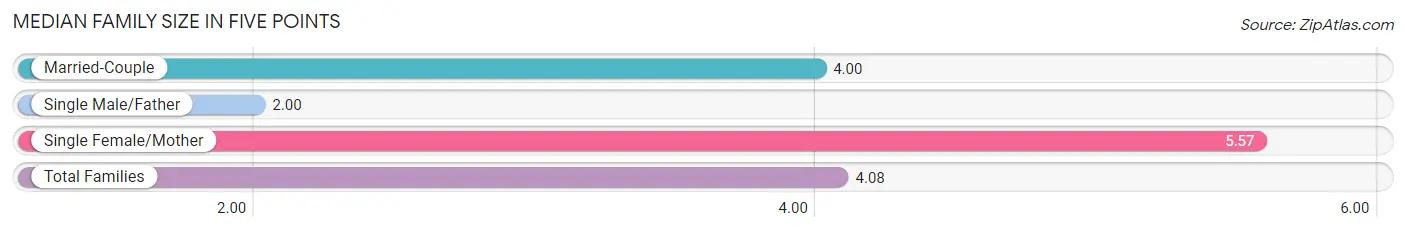
The median family size in Five Points is 4.08 persons per family, with single female/mother families (7 | 19.4%) accounting for the largest median family size of 5.57 persons per family. On the other hand, single male/father families (4 | 11.1%) represent the smallest median family size with 2.00 persons per family.
| Family Type | # Families | Family Size |
| Married-Couple | 25 (69.4%) | 4.00 |
| Single Male/Father | 4 (11.1%) | 2.00 |
| Single Female/Mother | 7 (19.4%) | 5.57 |
| Total Families | 36 (100.0%) | 4.08 |
Median Household Size in Five Points
| Household Type | # Households | Household Size |
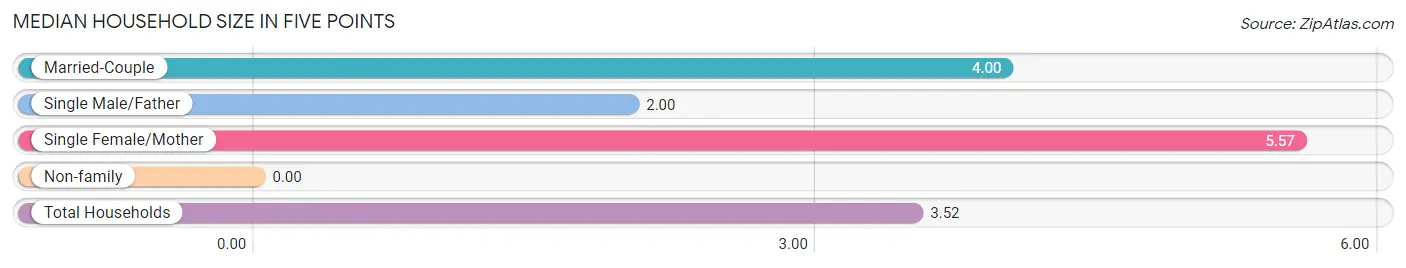
| Married-Couple | 25 (56.8%) | 4.00 |
| Single Male/Father | 4 (9.1%) | 2.00 |
| Single Female/Mother | 7 (15.9%) | 5.57 |
| Non-family | 8 (18.2%) | - |
| Total Households | 44 (100.0%) | 3.52 |
Household Size by Marriage Status in Five Points
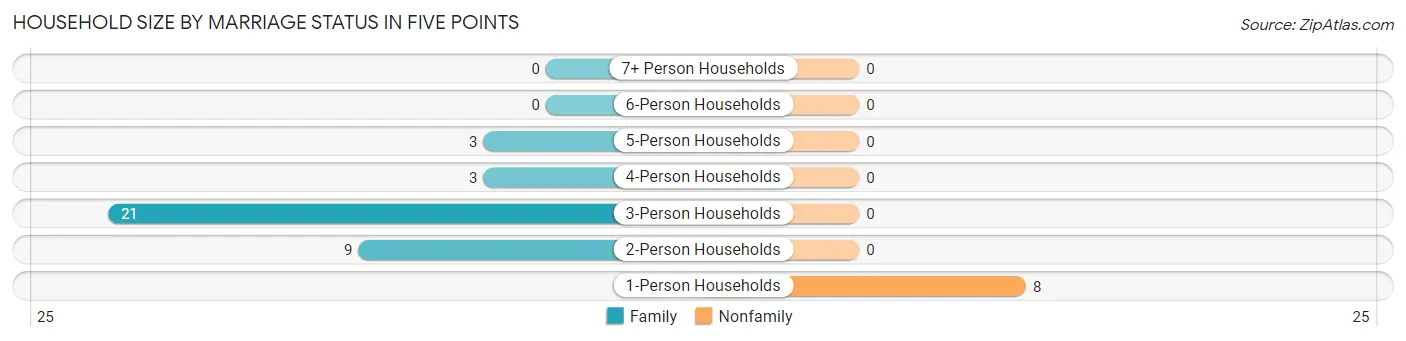
Out of a total of 44 households in Five Points, 36 (81.8%) are family households, while 8 (18.2%) are nonfamily households. The most numerous type of family households are 3-person households, comprising 21, and the most common type of nonfamily households are 1-person households, comprising 8.
| Household Size | Family Households | Nonfamily Households |
| 1-Person Households | - | 8 (18.2%) |
| 2-Person Households | 9 (20.4%) | 0 (0.0%) |
| 3-Person Households | 21 (47.7%) | 0 (0.0%) |
| 4-Person Households | 3 (6.8%) | 0 (0.0%) |
| 5-Person Households | 3 (6.8%) | 0 (0.0%) |
| 6-Person Households | 0 (0.0%) | 0 (0.0%) |
| 7+ Person Households | 0 (0.0%) | 0 (0.0%) |
| Total | 36 (81.8%) | 8 (18.2%) |
Female Fertility in Five Points
Fertility by Age in Five Points
| Age Bracket | Women with Births | Births / 1,000 Women |
| 15 to 19 years | 0 (0.0%) | 0.0 |
| 20 to 34 years | 0 (0.0%) | 0.0 |
| 35 to 50 years | 0 (0.0%) | 0.0 |
| Total | 0 (0.0%) | 0.0 |
Fertility by Age by Marriage Status in Five Points
| Age Bracket | Married | Unmarried |
| 15 to 19 years | 0 (0.0%) | 0 (0.0%) |
| 20 to 34 years | 0 (0.0%) | 0 (0.0%) |
| 35 to 50 years | 0 (0.0%) | 0 (0.0%) |
| Total | 0 (0.0%) | 0 (0.0%) |
Fertility by Education in Five Points
| Educational Attainment | Women with Births | Births / 1,000 Women |
| Less than High School | 0 (0.0%) | 0.0 |
| High School Diploma | 0 (0.0%) | 0.0 |
| College or Associate's Degree | 0 (0.0%) | 0.0 |
| Bachelor's Degree | 0 (0.0%) | 0.0 |
| Graduate Degree | 0 (0.0%) | 0.0 |
| Total | 0 (0.0%) | 0.0 |
Fertility by Education by Marriage Status in Five Points
| Educational Attainment | Married | Unmarried |
| Less than High School | 0 (0.0%) | 0 (0.0%) |
| High School Diploma | 0 (0.0%) | 0 (0.0%) |
| College or Associate's Degree | 0 (0.0%) | 0 (0.0%) |
| Bachelor's Degree | 0 (0.0%) | 0 (0.0%) |
| Graduate Degree | 0 (0.0%) | 0 (0.0%) |
| Total | 0 (0.0%) | 0 (0.0%) |
Employment Characteristics in Five Points
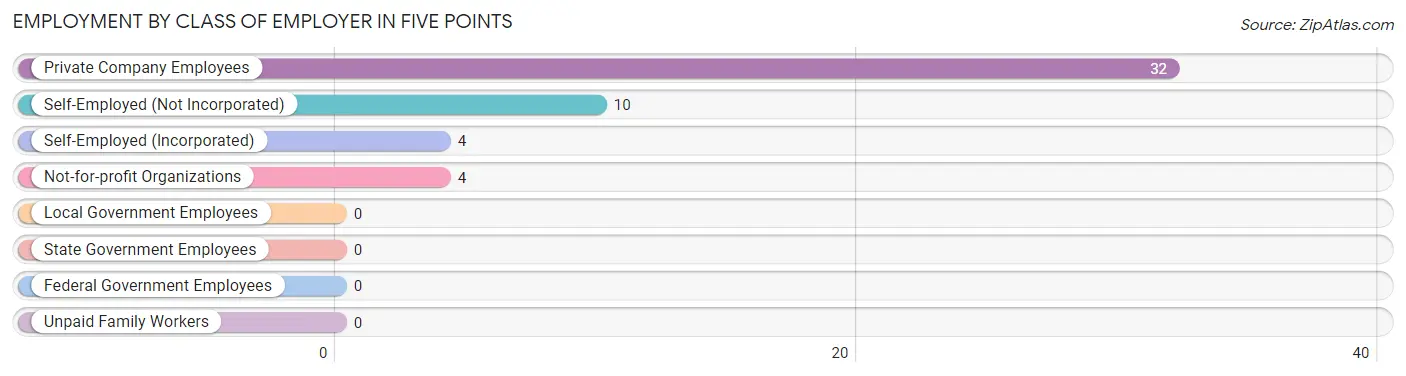
Employment by Class of Employer in Five Points
Among the 50 employed individuals in Five Points, private company employees (32 | 64.0%), self-employed (not incorporated) (10 | 20.0%), and self-employed (incorporated) (4 | 8.0%) make up the most common classes of employment.
| Employer Class | # Employees | % Employees |
| Private Company Employees | 32 | 64.0% |
| Self-Employed (Incorporated) | 4 | 8.0% |
| Self-Employed (Not Incorporated) | 10 | 20.0% |
| Not-for-profit Organizations | 4 | 8.0% |
| Local Government Employees | 0 | 0.0% |
| State Government Employees | 0 | 0.0% |
| Federal Government Employees | 0 | 0.0% |
| Unpaid Family Workers | 0 | 0.0% |
| Total | 50 | 100.0% |
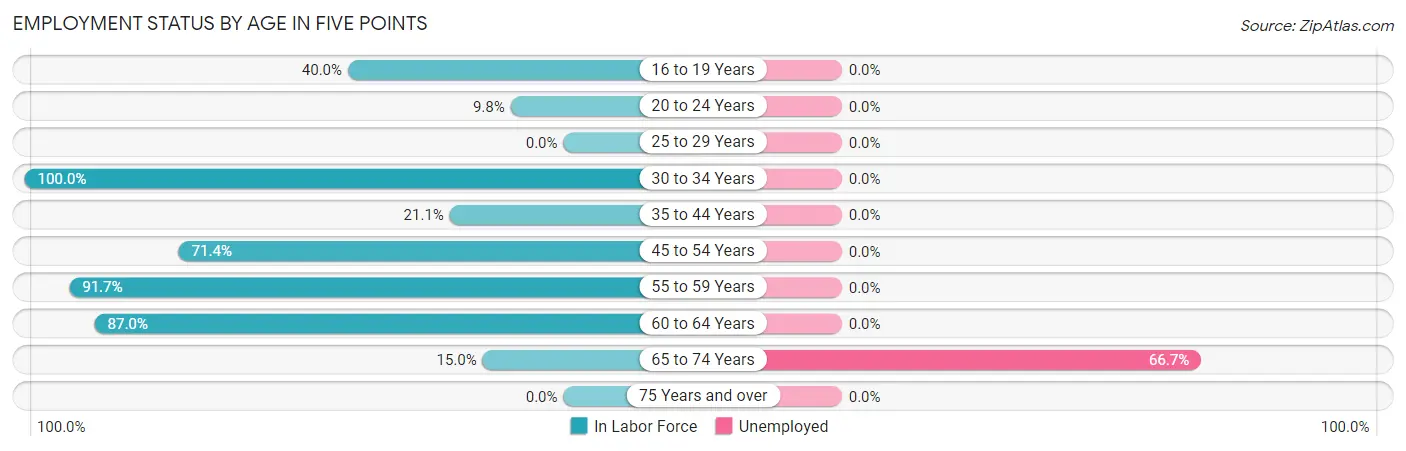
Employment Status by Age in Five Points
According to the labor force statistics for Five Points, out of the total population over 16 years of age (148), 39.2% or 58 individuals are in the labor force, with 3.4% or 2 of them unemployed. The age group with the highest labor force participation rate is 30 to 34 years, with 100.0% or 2 individuals in the labor force. Within the labor force, the 65 to 74 years age range has the highest percentage of unemployed individuals, with 66.7% or 2 of them being unemployed.
| Age Bracket | In Labor Force | Unemployed |
| 16 to 19 Years | 4 (40.0%) | 0 (0.0%) |
| 20 to 24 Years | 4 (9.8%) | 0 (0.0%) |
| 25 to 29 Years | 0 (0.0%) | 0 (0.0%) |
| 30 to 34 Years | 2 (100.0%) | 0 (0.0%) |
| 35 to 44 Years | 4 (21.1%) | 0 (0.0%) |
| 45 to 54 Years | 10 (71.4%) | 0 (0.0%) |
| 55 to 59 Years | 11 (91.7%) | 0 (0.0%) |
| 60 to 64 Years | 20 (87.0%) | 0 (0.0%) |
| 65 to 74 Years | 3 (15.0%) | 2 (66.7%) |
| 75 Years and over | 0 (0.0%) | 0 (0.0%) |
| Total | 58 (39.2%) | 2 (3.4%) |
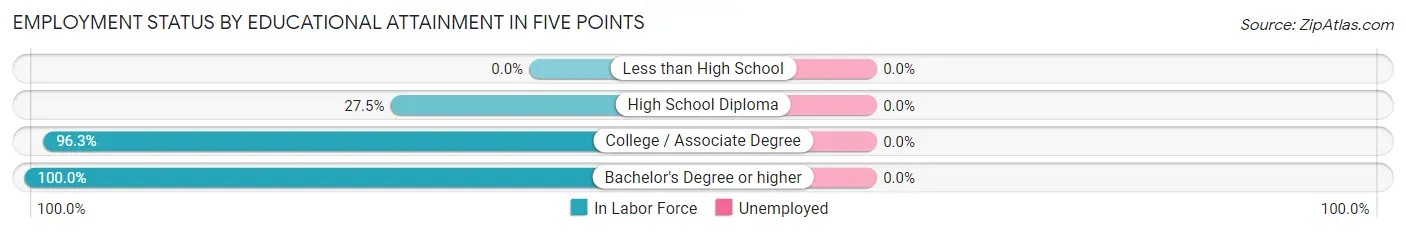
Employment Status by Educational Attainment in Five Points
| Educational Attainment | In Labor Force | Unemployed |
| Less than High School | 0 (0.0%) | 0 (0.0%) |
| High School Diploma | 11 (27.5%) | 0 (0.0%) |
| College / Associate Degree | 26 (96.3%) | 0 (0.0%) |
| Bachelor's Degree or higher | 10 (100.0%) | 0 (0.0%) |
| Total | 47 (61.0%) | 0 (0.0%) |
Employment Occupations by Sex in Five Points
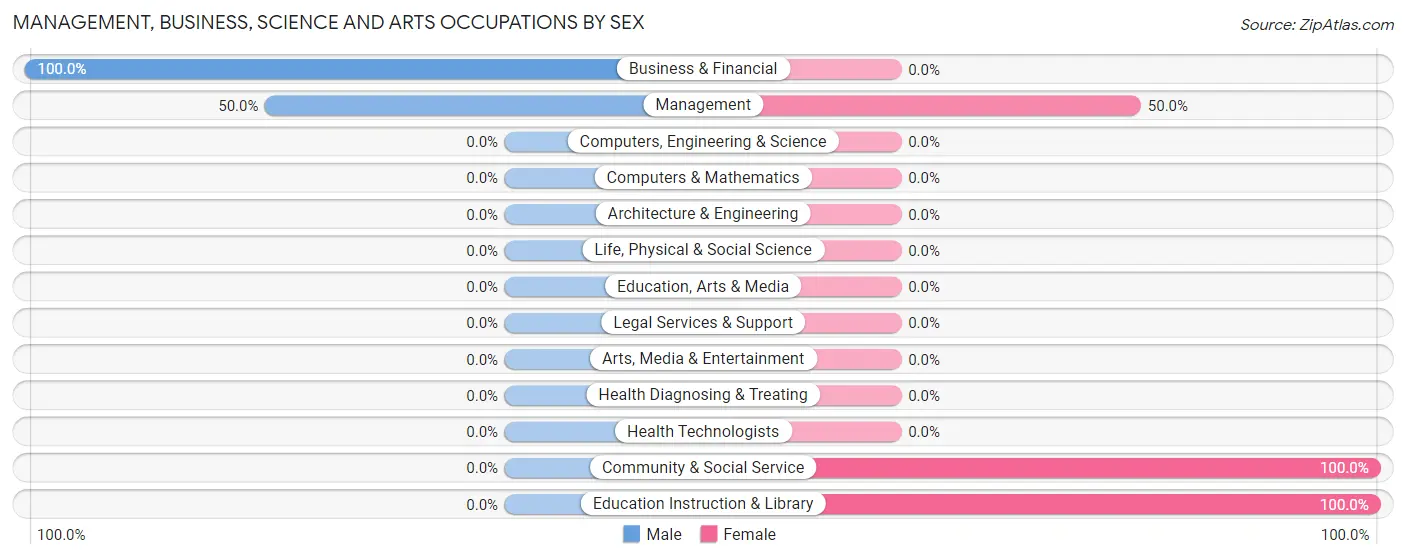
Management, Business, Science and Arts Occupations
The most common Management, Business, Science and Arts occupations in Five Points are Management (6 | 10.7%), Business & Financial (4 | 7.1%), Community & Social Service (4 | 7.1%), and Education Instruction & Library (4 | 7.1%).
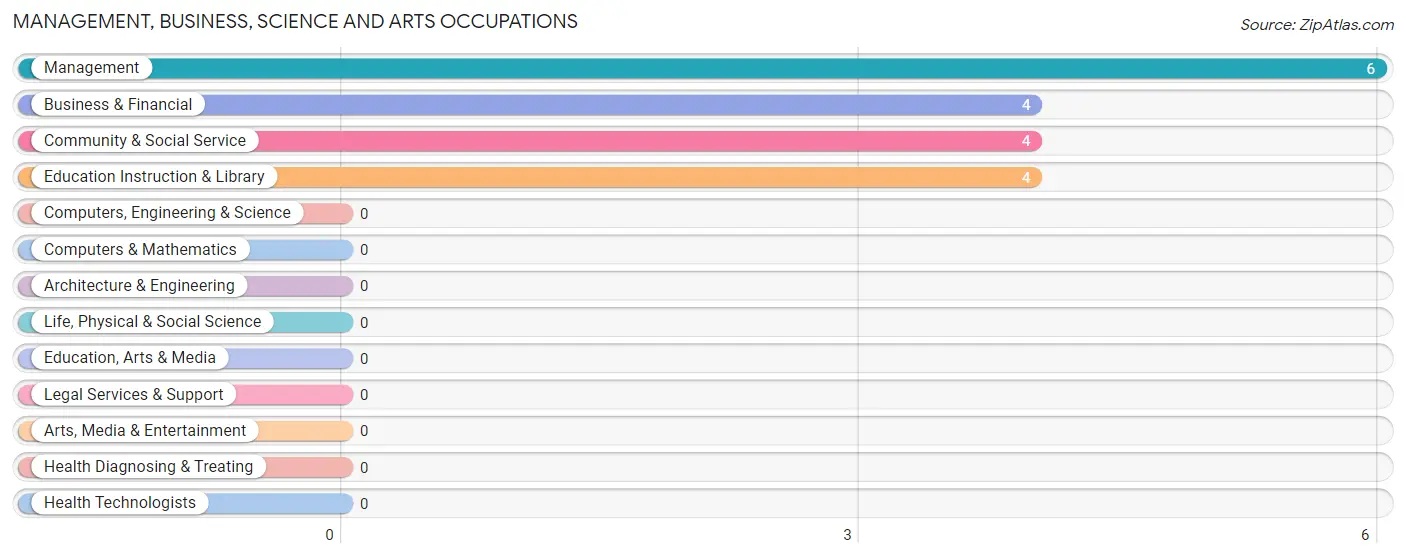
Management, Business, Science and Arts Occupations by Sex
Within the Management, Business, Science and Arts occupations in Five Points, the most male-oriented occupations are Business & Financial (100.0%), and Management (50.0%), while the most female-oriented occupations are Community & Social Service (100.0%), Education Instruction & Library (100.0%), and Management (50.0%).
| Occupation | Male | Female |
| Management | 3 (50.0%) | 3 (50.0%) |
| Business & Financial | 4 (100.0%) | 0 (0.0%) |
| Computers, Engineering & Science | 0 (0.0%) | 0 (0.0%) |
| Computers & Mathematics | 0 (0.0%) | 0 (0.0%) |
| Architecture & Engineering | 0 (0.0%) | 0 (0.0%) |
| Life, Physical & Social Science | 0 (0.0%) | 0 (0.0%) |
| Community & Social Service | 0 (0.0%) | 4 (100.0%) |
| Education, Arts & Media | 0 (0.0%) | 0 (0.0%) |
| Legal Services & Support | 0 (0.0%) | 0 (0.0%) |
| Education Instruction & Library | 0 (0.0%) | 4 (100.0%) |
| Arts, Media & Entertainment | 0 (0.0%) | 0 (0.0%) |
| Health Diagnosing & Treating | 0 (0.0%) | 0 (0.0%) |
| Health Technologists | 0 (0.0%) | 0 (0.0%) |
| Total (Category) | 7 (50.0%) | 7 (50.0%) |
| Total (Overall) | 35 (62.5%) | 21 (37.5%) |
Services Occupations
Services Occupations by Sex
| Occupation | Male | Female |
| Healthcare Support | 0 (0.0%) | 0 (0.0%) |
| Security & Protection | 0 (0.0%) | 0 (0.0%) |
| Firefighting & Prevention | 0 (0.0%) | 0 (0.0%) |
| Law Enforcement | 0 (0.0%) | 0 (0.0%) |
| Food Preparation & Serving | 0 (0.0%) | 0 (0.0%) |
| Cleaning & Maintenance | 0 (0.0%) | 0 (0.0%) |
| Personal Care & Service | 0 (0.0%) | 0 (0.0%) |
| Total (Category) | 0 (0.0%) | 0 (0.0%) |
| Total (Overall) | 35 (62.5%) | 21 (37.5%) |
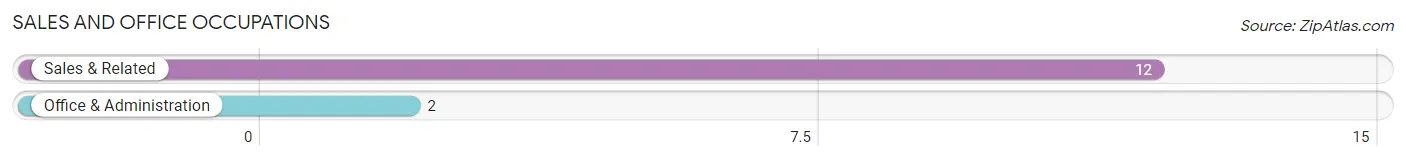
Sales and Office Occupations
The most common Sales and Office occupations in Five Points are Sales & Related (12 | 21.4%), and Office & Administration (2 | 3.6%).
Sales and Office Occupations by Sex
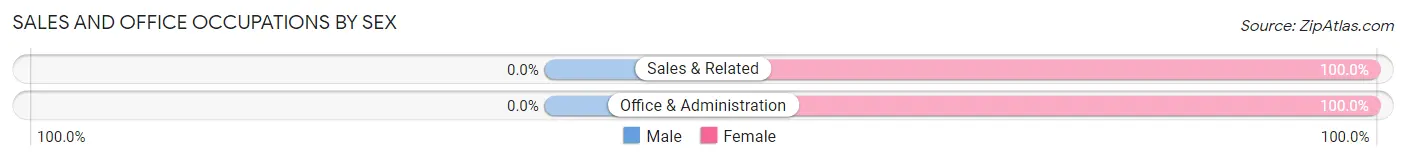
| Occupation | Male | Female |
| Sales & Related | 0 (0.0%) | 12 (100.0%) |
| Office & Administration | 0 (0.0%) | 2 (100.0%) |
| Total (Category) | 0 (0.0%) | 14 (100.0%) |
| Total (Overall) | 35 (62.5%) | 21 (37.5%) |
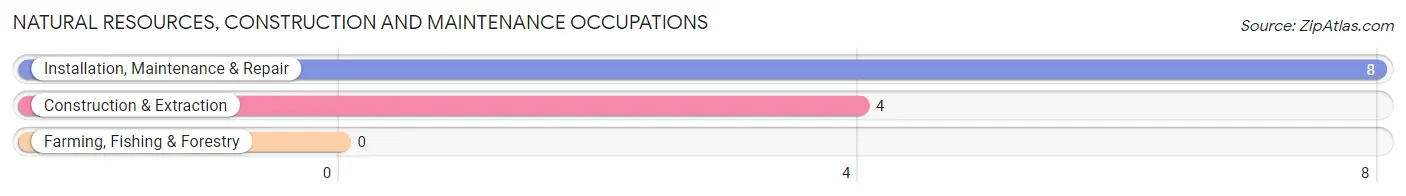
Natural Resources, Construction and Maintenance Occupations
The most common Natural Resources, Construction and Maintenance occupations in Five Points are Installation, Maintenance & Repair (8 | 14.3%), and Construction & Extraction (4 | 7.1%).
Natural Resources, Construction and Maintenance Occupations by Sex
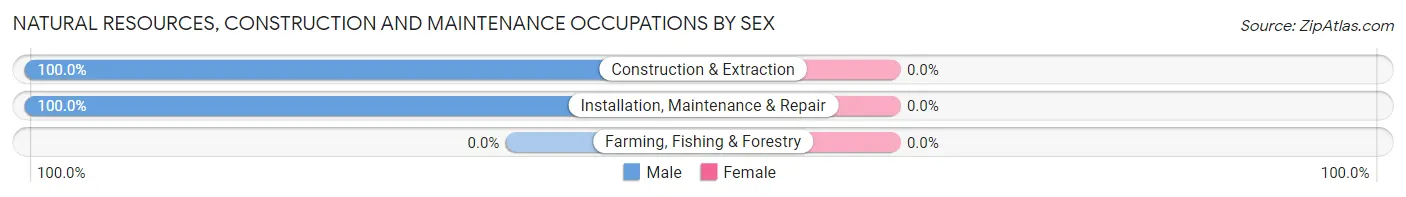
| Occupation | Male | Female |
| Farming, Fishing & Forestry | 0 (0.0%) | 0 (0.0%) |
| Construction & Extraction | 4 (100.0%) | 0 (0.0%) |
| Installation, Maintenance & Repair | 8 (100.0%) | 0 (0.0%) |
| Total (Category) | 12 (100.0%) | 0 (0.0%) |
| Total (Overall) | 35 (62.5%) | 21 (37.5%) |
Production, Transportation and Moving Occupations
The most common Production, Transportation and Moving occupations in Five Points are , and Production (16 | 28.6%).

Production, Transportation and Moving Occupations by Sex
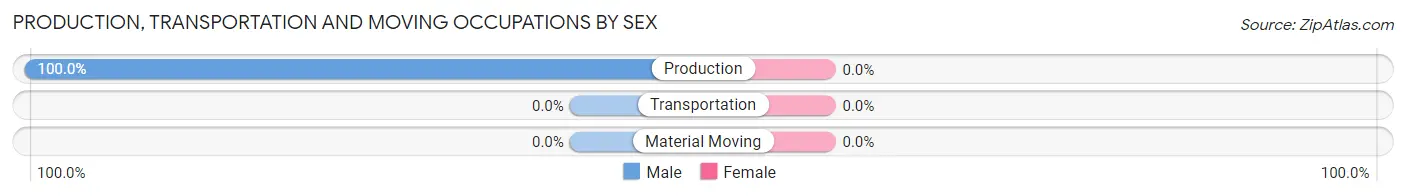
| Occupation | Male | Female |
| Production | 16 (100.0%) | 0 (0.0%) |
| Transportation | 0 (0.0%) | 0 (0.0%) |
| Material Moving | 0 (0.0%) | 0 (0.0%) |
| Total (Category) | 16 (100.0%) | 0 (0.0%) |
| Total (Overall) | 35 (62.5%) | 21 (37.5%) |
Employment Industries by Sex in Five Points
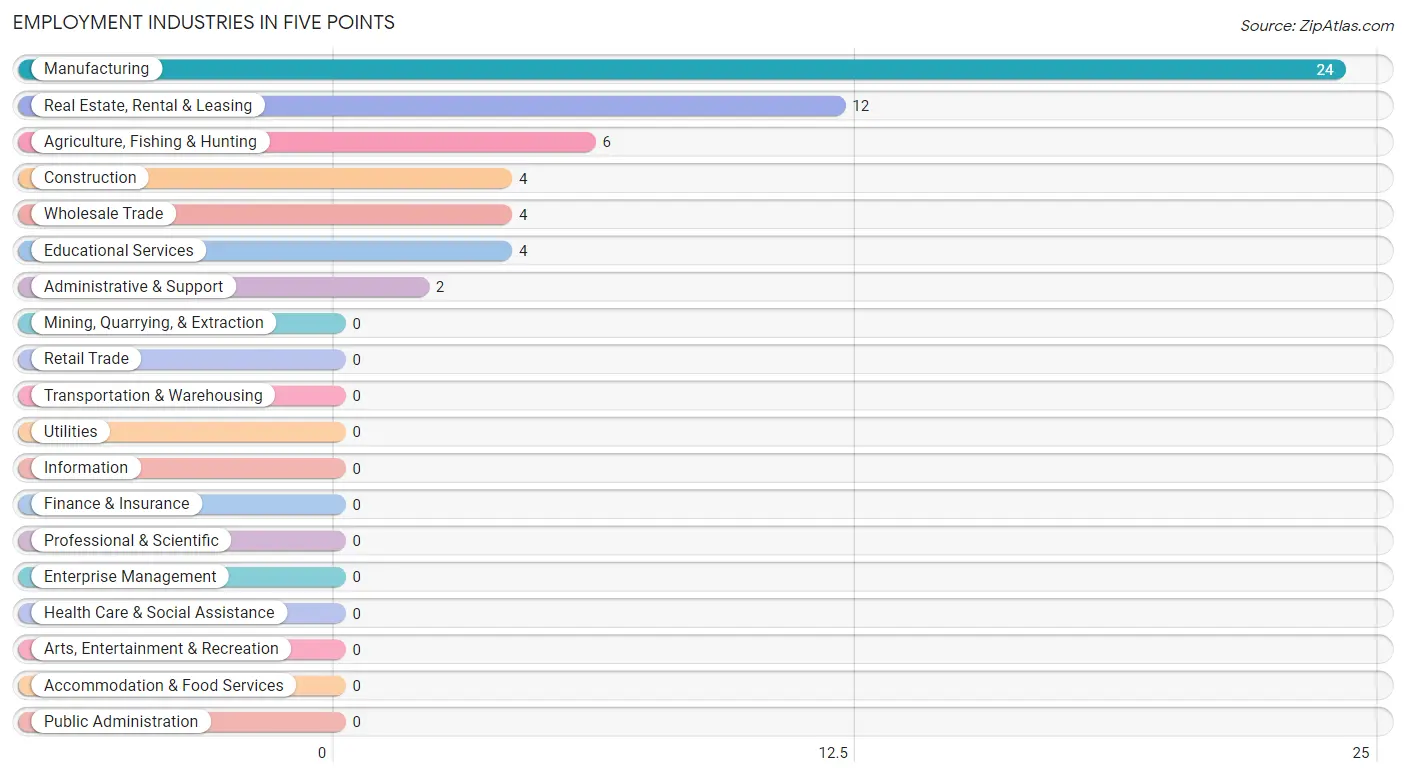
Employment Industries in Five Points
The major employment industries in Five Points include Manufacturing (24 | 42.9%), Real Estate, Rental & Leasing (12 | 21.4%), Agriculture, Fishing & Hunting (6 | 10.7%), Construction (4 | 7.1%), and Wholesale Trade (4 | 7.1%).
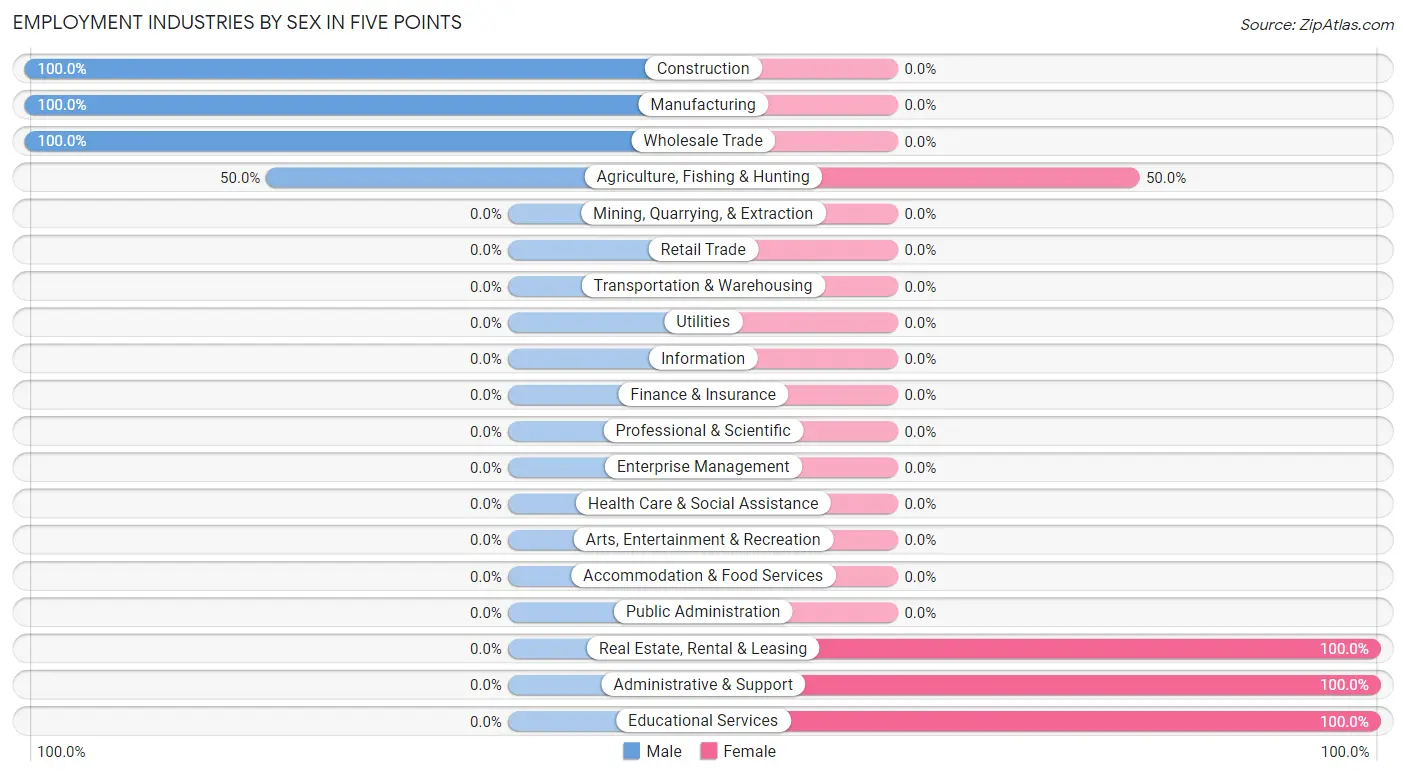
Employment Industries by Sex in Five Points
The Five Points industries that see more men than women are Construction (100.0%), Manufacturing (100.0%), and Wholesale Trade (100.0%), whereas the industries that tend to have a higher number of women are Real Estate, Rental & Leasing (100.0%), Administrative & Support (100.0%), and Educational Services (100.0%).
| Industry | Male | Female |
| Agriculture, Fishing & Hunting | 3 (50.0%) | 3 (50.0%) |
| Mining, Quarrying, & Extraction | 0 (0.0%) | 0 (0.0%) |
| Construction | 4 (100.0%) | 0 (0.0%) |
| Manufacturing | 24 (100.0%) | 0 (0.0%) |
| Wholesale Trade | 4 (100.0%) | 0 (0.0%) |
| Retail Trade | 0 (0.0%) | 0 (0.0%) |
| Transportation & Warehousing | 0 (0.0%) | 0 (0.0%) |
| Utilities | 0 (0.0%) | 0 (0.0%) |
| Information | 0 (0.0%) | 0 (0.0%) |
| Finance & Insurance | 0 (0.0%) | 0 (0.0%) |
| Real Estate, Rental & Leasing | 0 (0.0%) | 12 (100.0%) |
| Professional & Scientific | 0 (0.0%) | 0 (0.0%) |
| Enterprise Management | 0 (0.0%) | 0 (0.0%) |
| Administrative & Support | 0 (0.0%) | 2 (100.0%) |
| Educational Services | 0 (0.0%) | 4 (100.0%) |
| Health Care & Social Assistance | 0 (0.0%) | 0 (0.0%) |
| Arts, Entertainment & Recreation | 0 (0.0%) | 0 (0.0%) |
| Accommodation & Food Services | 0 (0.0%) | 0 (0.0%) |
| Public Administration | 0 (0.0%) | 0 (0.0%) |
| Total | 35 (62.5%) | 21 (37.5%) |
Education in Five Points
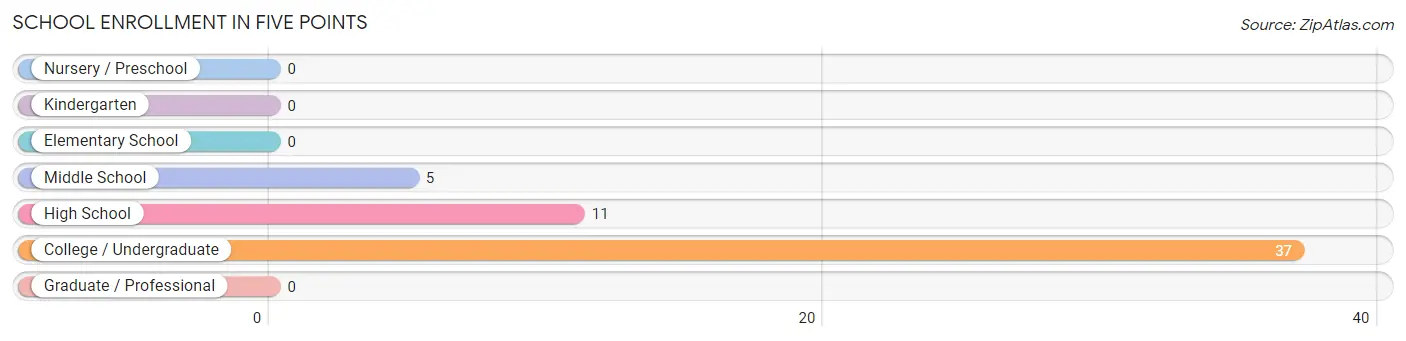
School Enrollment in Five Points
The most common levels of schooling among the 53 students in Five Points are college / undergraduate (37 | 69.8%), high school (11 | 20.7%), and middle school (5 | 9.4%).
| School Level | # Students | % Students |
| Nursery / Preschool | 0 | 0.0% |
| Kindergarten | 0 | 0.0% |
| Elementary School | 0 | 0.0% |
| Middle School | 5 | 9.4% |
| High School | 11 | 20.7% |
| College / Undergraduate | 37 | 69.8% |
| Graduate / Professional | 0 | 0.0% |
| Total | 53 | 100.0% |
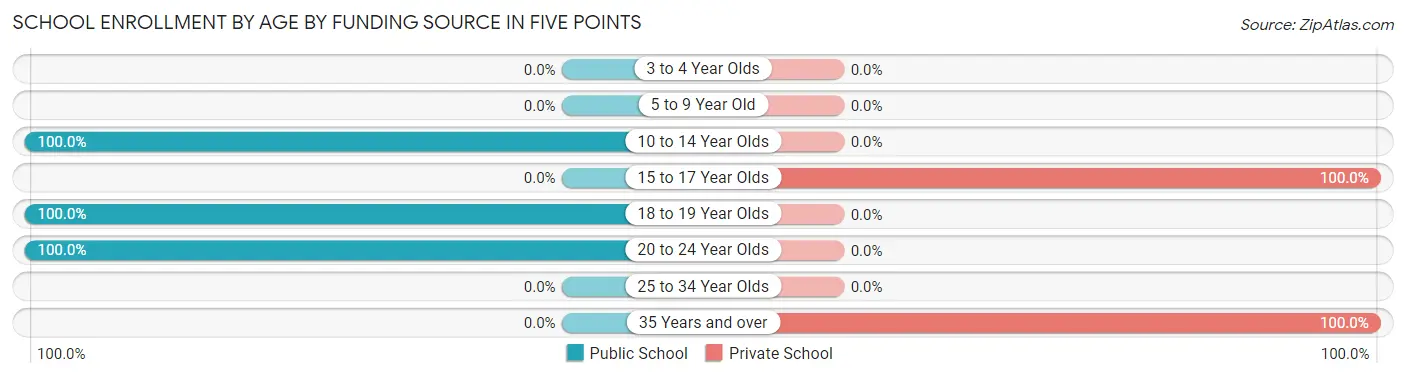
School Enrollment by Age by Funding Source in Five Points
Out of a total of 53 students who are enrolled in schools in Five Points, 3 (5.7%) attend a private institution, while the remaining 50 (94.3%) are enrolled in public schools. The age group of 15 to 17 year olds has the highest likelihood of being enrolled in private schools, with 2 (100.0% in the age bracket) enrolled. Conversely, the age group of 10 to 14 year olds has the lowest likelihood of being enrolled in a private school, with 5 (100.0% in the age bracket) attending a public institution.
| Age Bracket | Public School | Private School |
| 3 to 4 Year Olds | 0 (0.0%) | 0 (0.0%) |
| 5 to 9 Year Old | 0 (0.0%) | 0 (0.0%) |
| 10 to 14 Year Olds | 5 (100.0%) | 0 (0.0%) |
| 15 to 17 Year Olds | 0 (0.0%) | 2 (100.0%) |
| 18 to 19 Year Olds | 8 (100.0%) | 0 (0.0%) |
| 20 to 24 Year Olds | 37 (100.0%) | 0 (0.0%) |
| 25 to 34 Year Olds | 0 (0.0%) | 0 (0.0%) |
| 35 Years and over | 0 (0.0%) | 1 (100.0%) |
| Total | 50 (94.3%) | 3 (5.7%) |
Educational Attainment by Field of Study in Five Points
Bio, nature & agricultural (6 | 60.0%), and physical & health sciences (4 | 40.0%) are the most common fields of study among 10 individuals in Five Points who have obtained a bachelor's degree or higher.
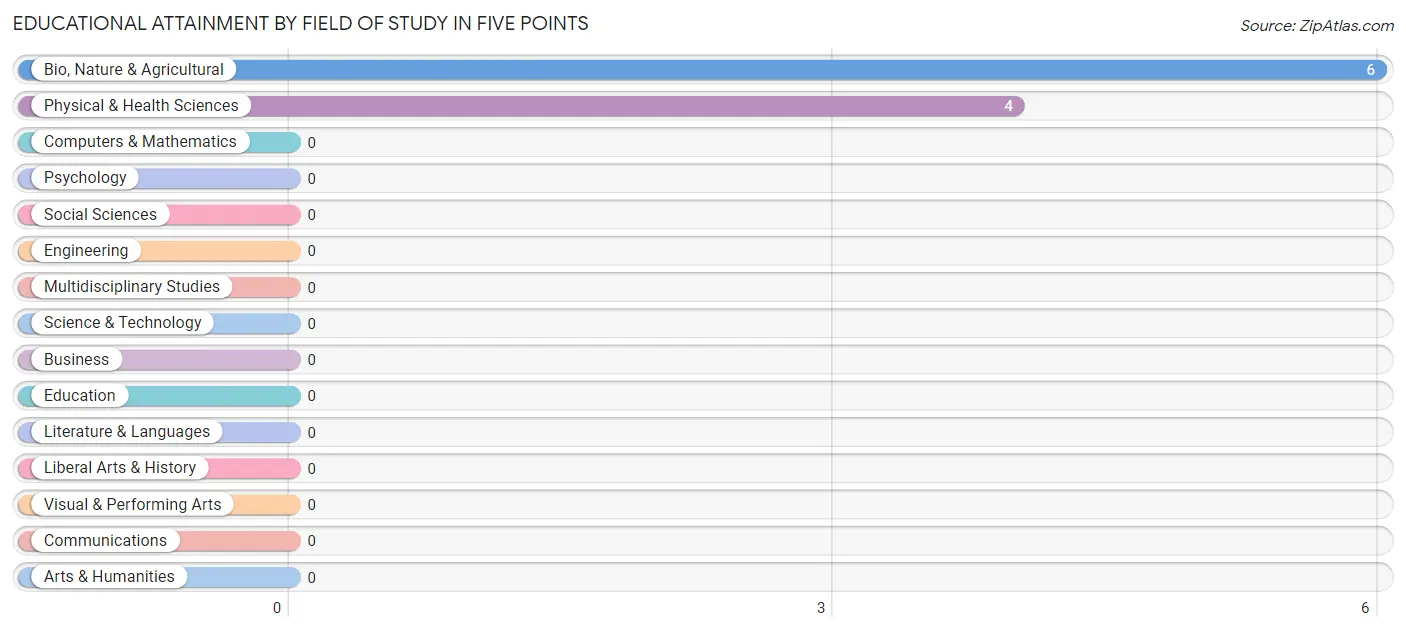
| Field of Study | # Graduates | % Graduates |
| Computers & Mathematics | 0 | 0.0% |
| Bio, Nature & Agricultural | 6 | 60.0% |
| Physical & Health Sciences | 4 | 40.0% |
| Psychology | 0 | 0.0% |
| Social Sciences | 0 | 0.0% |
| Engineering | 0 | 0.0% |
| Multidisciplinary Studies | 0 | 0.0% |
| Science & Technology | 0 | 0.0% |
| Business | 0 | 0.0% |
| Education | 0 | 0.0% |
| Literature & Languages | 0 | 0.0% |
| Liberal Arts & History | 0 | 0.0% |
| Visual & Performing Arts | 0 | 0.0% |
| Communications | 0 | 0.0% |
| Arts & Humanities | 0 | 0.0% |
| Total | 10 | 100.0% |
Transportation & Commute in Five Points
Vehicle Availability by Sex in Five Points
The most prevalent vehicle ownership categories in Five Points are males with 3 vehicles (12, accounting for 38.7%) and females with 3 vehicles (12, making up 63.2%).
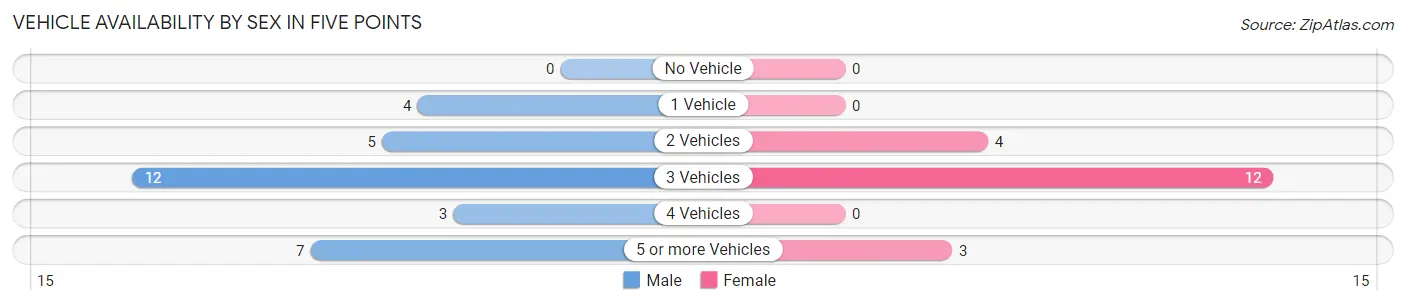
| Vehicles Available | Male | Female |
| No Vehicle | 0 (0.0%) | 0 (0.0%) |
| 1 Vehicle | 4 (12.9%) | 0 (0.0%) |
| 2 Vehicles | 5 (16.1%) | 4 (21.0%) |
| 3 Vehicles | 12 (38.7%) | 12 (63.2%) |
| 4 Vehicles | 3 (9.7%) | 0 (0.0%) |
| 5 or more Vehicles | 7 (22.6%) | 3 (15.8%) |
| Total | 31 (100.0%) | 19 (100.0%) |
Commute Time in Five Points
The most frequently occuring commute durations in Five Points are less than 5 minutes (14 commuters, 28.0%), 25 to 29 minutes (12 commuters, 24.0%), and 30 to 34 minutes (12 commuters, 24.0%).
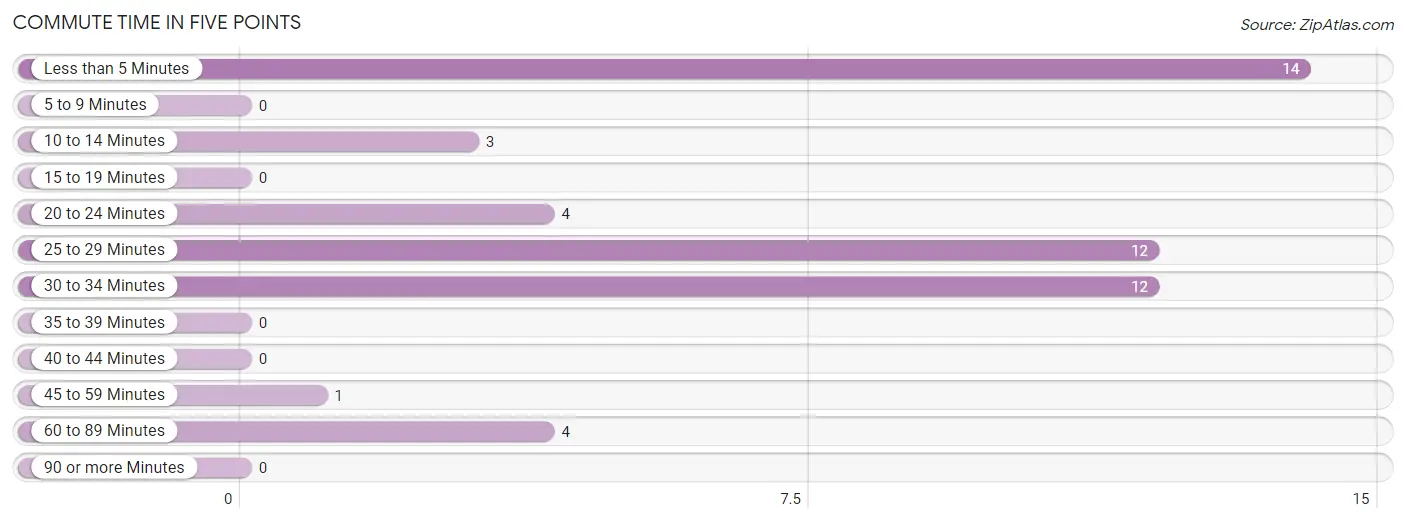
| Commute Time | # Commuters | % Commuters |
| Less than 5 Minutes | 14 | 28.0% |
| 5 to 9 Minutes | 0 | 0.0% |
| 10 to 14 Minutes | 3 | 6.0% |
| 15 to 19 Minutes | 0 | 0.0% |
| 20 to 24 Minutes | 4 | 8.0% |
| 25 to 29 Minutes | 12 | 24.0% |
| 30 to 34 Minutes | 12 | 24.0% |
| 35 to 39 Minutes | 0 | 0.0% |
| 40 to 44 Minutes | 0 | 0.0% |
| 45 to 59 Minutes | 1 | 2.0% |
| 60 to 89 Minutes | 4 | 8.0% |
| 90 or more Minutes | 0 | 0.0% |
Commute Time by Sex in Five Points
The most common commute times in Five Points are 30 to 34 minutes (12 commuters, 38.7%) for males and 25 to 29 minutes (12 commuters, 63.2%) for females.
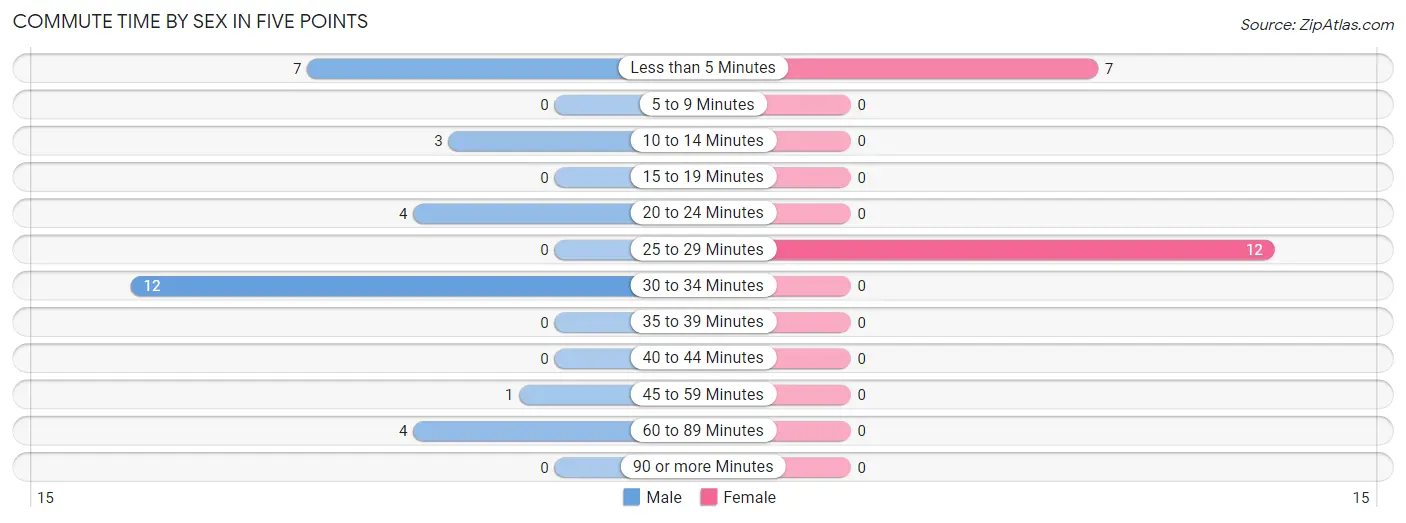
| Commute Time | Male | Female |
| Less than 5 Minutes | 7 (22.6%) | 7 (36.8%) |
| 5 to 9 Minutes | 0 (0.0%) | 0 (0.0%) |
| 10 to 14 Minutes | 3 (9.7%) | 0 (0.0%) |
| 15 to 19 Minutes | 0 (0.0%) | 0 (0.0%) |
| 20 to 24 Minutes | 4 (12.9%) | 0 (0.0%) |
| 25 to 29 Minutes | 0 (0.0%) | 12 (63.2%) |
| 30 to 34 Minutes | 12 (38.7%) | 0 (0.0%) |
| 35 to 39 Minutes | 0 (0.0%) | 0 (0.0%) |
| 40 to 44 Minutes | 0 (0.0%) | 0 (0.0%) |
| 45 to 59 Minutes | 1 (3.2%) | 0 (0.0%) |
| 60 to 89 Minutes | 4 (12.9%) | 0 (0.0%) |
| 90 or more Minutes | 0 (0.0%) | 0 (0.0%) |
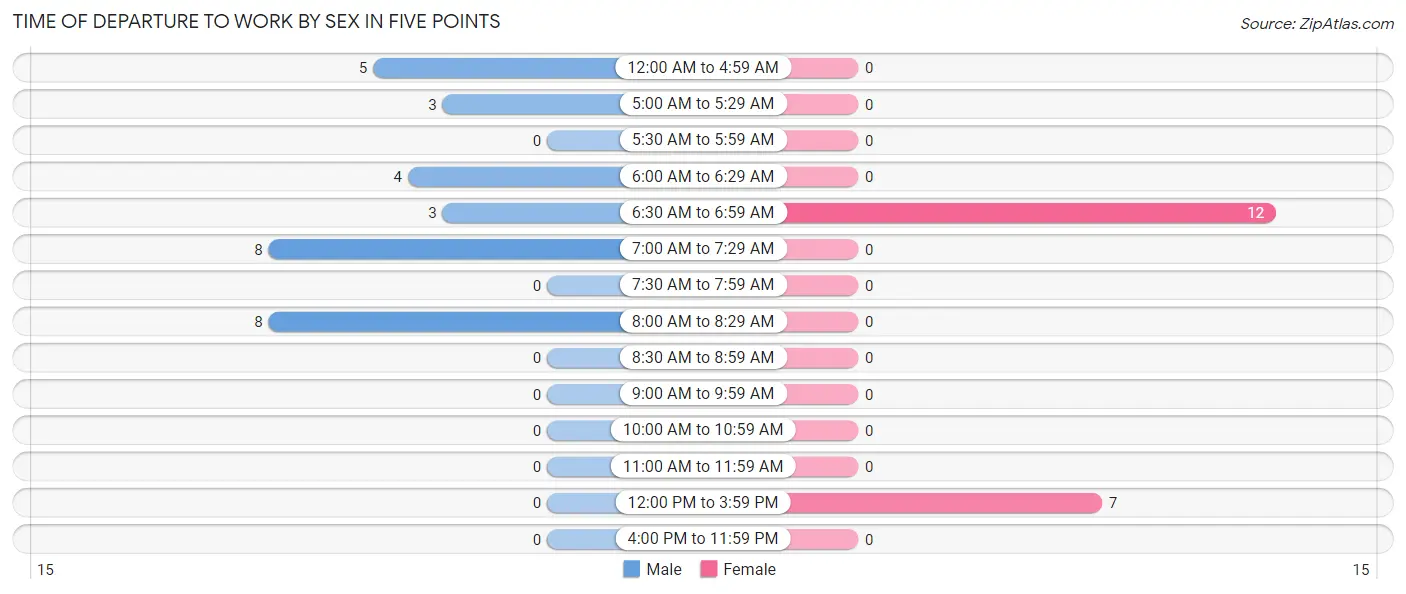
Time of Departure to Work by Sex in Five Points
The most frequent times of departure to work in Five Points are 7:00 AM to 7:29 AM (8, 25.8%) for males and 6:30 AM to 6:59 AM (12, 63.2%) for females.
| Time of Departure | Male | Female |
| 12:00 AM to 4:59 AM | 5 (16.1%) | 0 (0.0%) |
| 5:00 AM to 5:29 AM | 3 (9.7%) | 0 (0.0%) |
| 5:30 AM to 5:59 AM | 0 (0.0%) | 0 (0.0%) |
| 6:00 AM to 6:29 AM | 4 (12.9%) | 0 (0.0%) |
| 6:30 AM to 6:59 AM | 3 (9.7%) | 12 (63.2%) |
| 7:00 AM to 7:29 AM | 8 (25.8%) | 0 (0.0%) |
| 7:30 AM to 7:59 AM | 0 (0.0%) | 0 (0.0%) |
| 8:00 AM to 8:29 AM | 8 (25.8%) | 0 (0.0%) |
| 8:30 AM to 8:59 AM | 0 (0.0%) | 0 (0.0%) |
| 9:00 AM to 9:59 AM | 0 (0.0%) | 0 (0.0%) |
| 10:00 AM to 10:59 AM | 0 (0.0%) | 0 (0.0%) |
| 11:00 AM to 11:59 AM | 0 (0.0%) | 0 (0.0%) |
| 12:00 PM to 3:59 PM | 0 (0.0%) | 7 (36.8%) |
| 4:00 PM to 11:59 PM | 0 (0.0%) | 0 (0.0%) |
| Total | 31 (100.0%) | 19 (100.0%) |
Housing Occupancy in Five Points
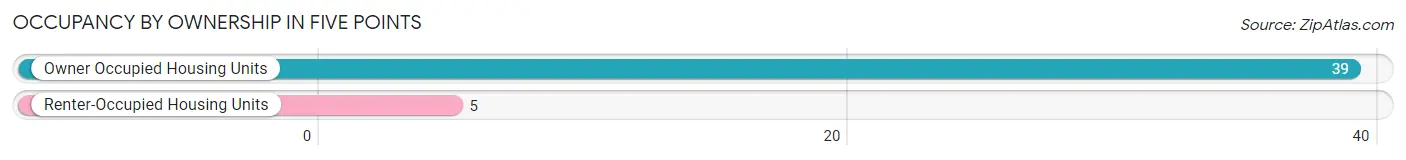
Occupancy by Ownership in Five Points
Of the total 44 dwellings in Five Points, owner-occupied units account for 39 (88.6%), while renter-occupied units make up 5 (11.4%).
| Occupancy | # Housing Units | % Housing Units |
| Owner Occupied Housing Units | 39 | 88.6% |
| Renter-Occupied Housing Units | 5 | 11.4% |
| Total Occupied Housing Units | 44 | 100.0% |
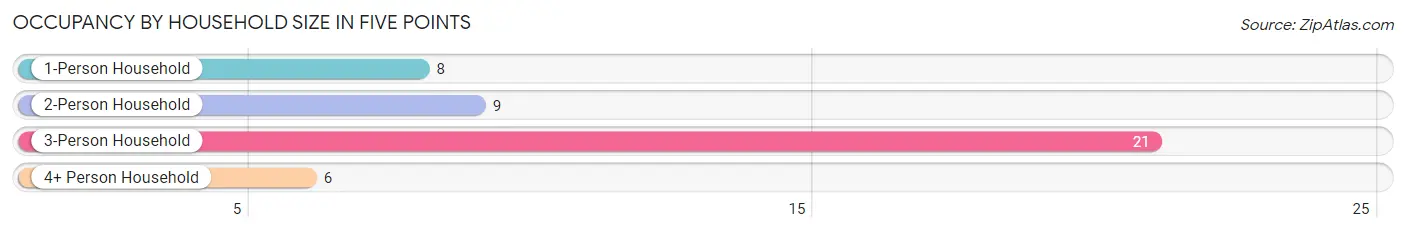
Occupancy by Household Size in Five Points
| Household Size | # Housing Units | % Housing Units |
| 1-Person Household | 8 | 18.2% |
| 2-Person Household | 9 | 20.4% |
| 3-Person Household | 21 | 47.7% |
| 4+ Person Household | 6 | 13.6% |
| Total Housing Units | 44 | 100.0% |
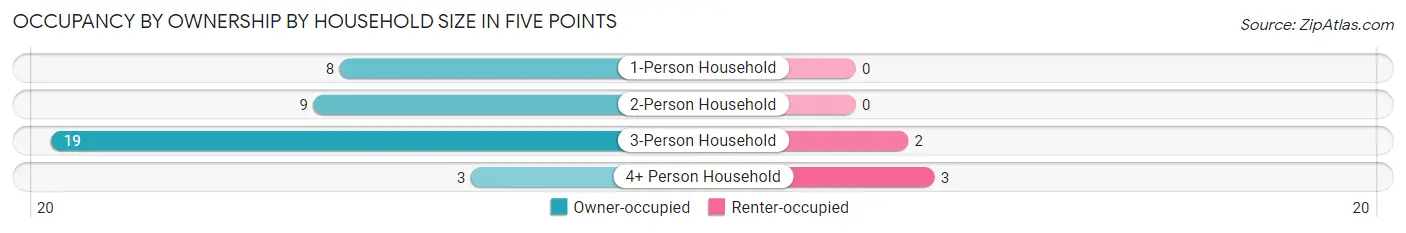
Occupancy by Ownership by Household Size in Five Points
| Household Size | Owner-occupied | Renter-occupied |
| 1-Person Household | 8 (100.0%) | 0 (0.0%) |
| 2-Person Household | 9 (100.0%) | 0 (0.0%) |
| 3-Person Household | 19 (90.5%) | 2 (9.5%) |
| 4+ Person Household | 3 (50.0%) | 3 (50.0%) |
| Total Housing Units | 39 (88.6%) | 5 (11.4%) |
Occupancy by Educational Attainment in Five Points
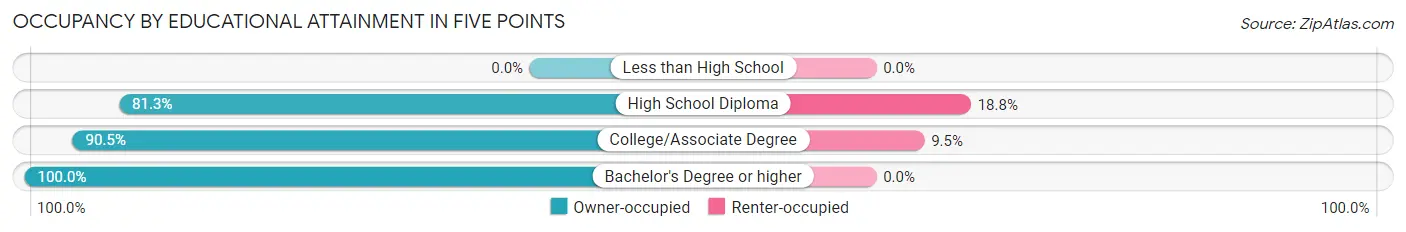
| Household Size | Owner-occupied | Renter-occupied |
| Less than High School | 0 (0.0%) | 0 (0.0%) |
| High School Diploma | 13 (81.2%) | 3 (18.8%) |
| College/Associate Degree | 19 (90.5%) | 2 (9.5%) |
| Bachelor's Degree or higher | 7 (100.0%) | 0 (0.0%) |
Occupancy by Age of Householder in Five Points
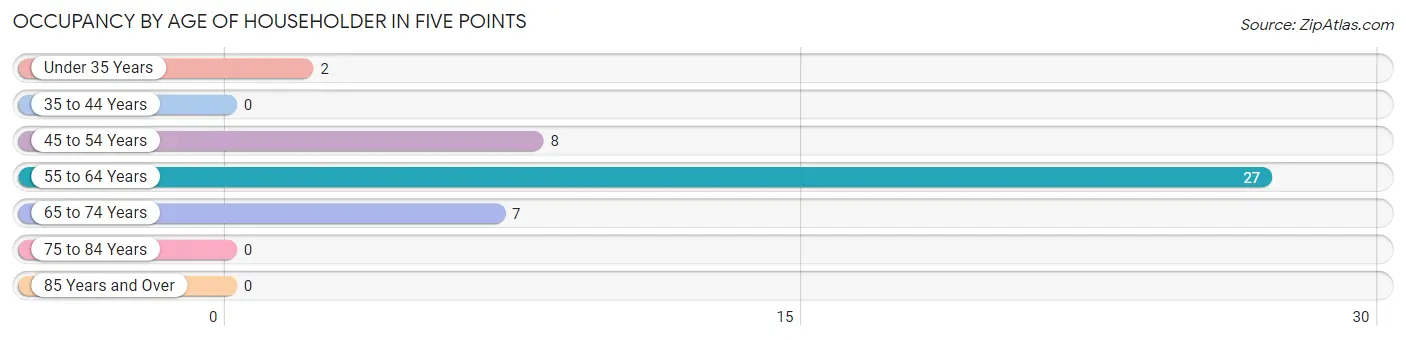
| Age Bracket | # Households | % Households |
| Under 35 Years | 2 | 4.5% |
| 35 to 44 Years | 0 | 0.0% |
| 45 to 54 Years | 8 | 18.2% |
| 55 to 64 Years | 27 | 61.4% |
| 65 to 74 Years | 7 | 15.9% |
| 75 to 84 Years | 0 | 0.0% |
| 85 Years and Over | 0 | 0.0% |
| Total | 44 | 100.0% |
Housing Finances in Five Points
Median Income by Occupancy in Five Points
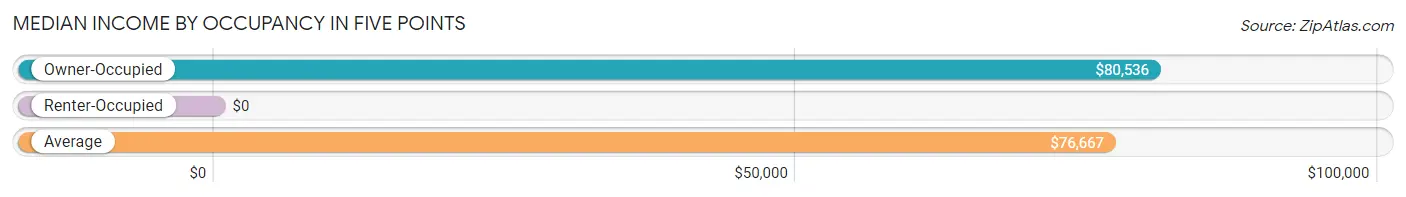
| Occupancy Type | # Households | Median Income |
| Owner-Occupied | 39 (88.6%) | $80,536 |
| Renter-Occupied | 5 (11.4%) | $0 |
| Average | 44 (100.0%) | $76,667 |
Occupancy by Householder Income Bracket in Five Points
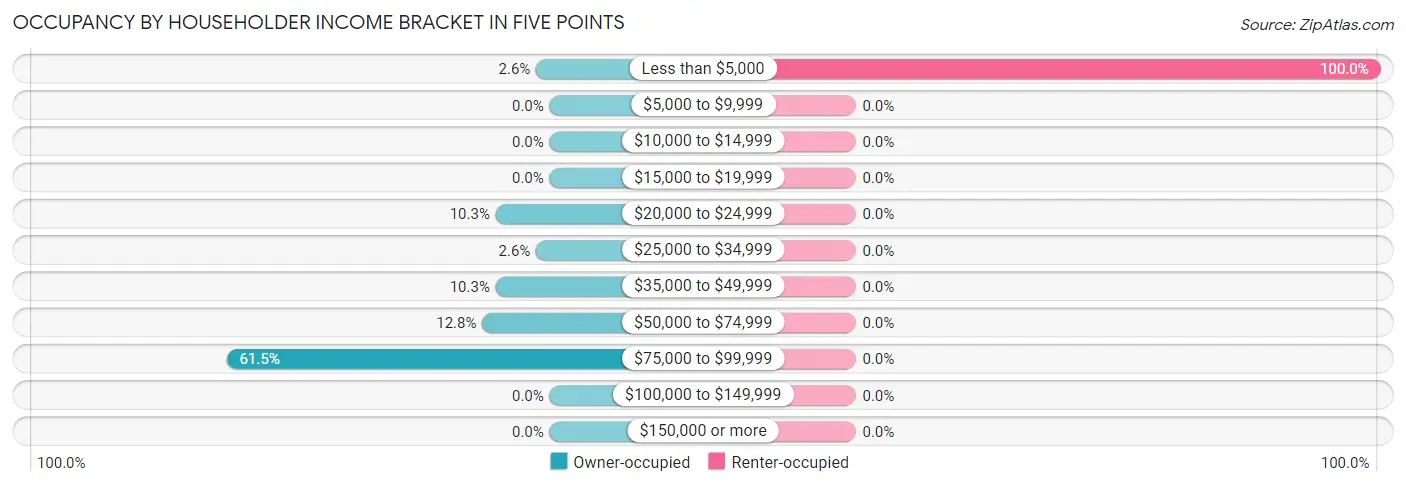
| Income Bracket | Owner-occupied | Renter-occupied |
| Less than $5,000 | 1 (2.6%) | 5 (100.0%) |
| $5,000 to $9,999 | 0 (0.0%) | 0 (0.0%) |
| $10,000 to $14,999 | 0 (0.0%) | 0 (0.0%) |
| $15,000 to $19,999 | 0 (0.0%) | 0 (0.0%) |
| $20,000 to $24,999 | 4 (10.3%) | 0 (0.0%) |
| $25,000 to $34,999 | 1 (2.6%) | 0 (0.0%) |
| $35,000 to $49,999 | 4 (10.3%) | 0 (0.0%) |
| $50,000 to $74,999 | 5 (12.8%) | 0 (0.0%) |
| $75,000 to $99,999 | 24 (61.5%) | 0 (0.0%) |
| $100,000 to $149,999 | 0 (0.0%) | 0 (0.0%) |
| $150,000 or more | 0 (0.0%) | 0 (0.0%) |
| Total | 39 (100.0%) | 5 (100.0%) |
Monthly Housing Cost Tiers in Five Points
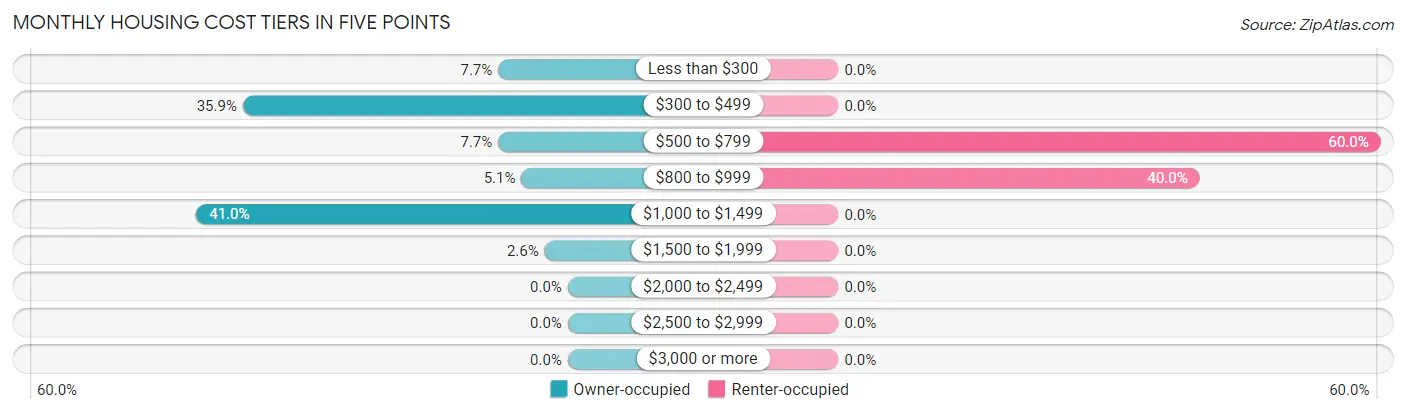
| Monthly Cost | Owner-occupied | Renter-occupied |
| Less than $300 | 3 (7.7%) | 0 (0.0%) |
| $300 to $499 | 14 (35.9%) | 0 (0.0%) |
| $500 to $799 | 3 (7.7%) | 3 (60.0%) |
| $800 to $999 | 2 (5.1%) | 2 (40.0%) |
| $1,000 to $1,499 | 16 (41.0%) | 0 (0.0%) |
| $1,500 to $1,999 | 1 (2.6%) | 0 (0.0%) |
| $2,000 to $2,499 | 0 (0.0%) | 0 (0.0%) |
| $2,500 to $2,999 | 0 (0.0%) | 0 (0.0%) |
| $3,000 or more | 0 (0.0%) | 0 (0.0%) |
| Total | 39 (100.0%) | 5 (100.0%) |
Physical Housing Characteristics in Five Points
Housing Structures in Five Points
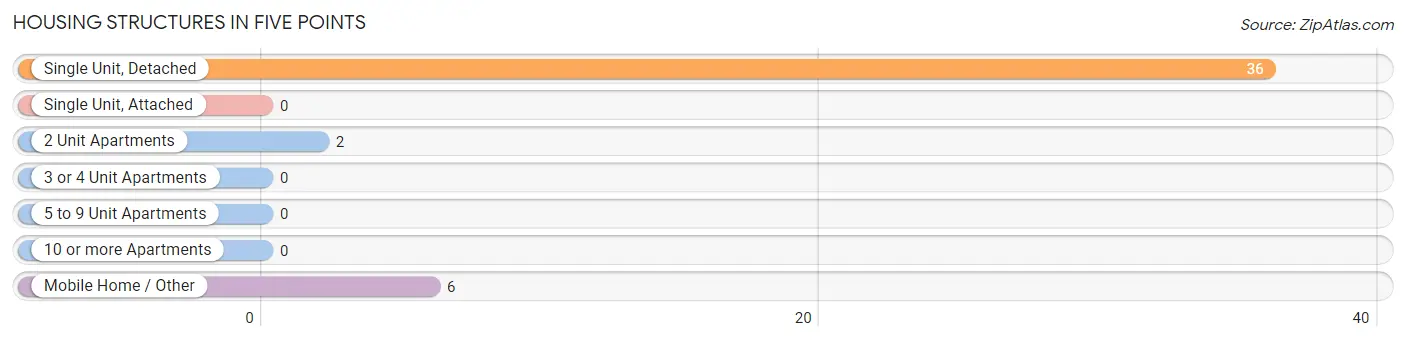
| Structure Type | # Housing Units | % Housing Units |
| Single Unit, Detached | 36 | 81.8% |
| Single Unit, Attached | 0 | 0.0% |
| 2 Unit Apartments | 2 | 4.5% |
| 3 or 4 Unit Apartments | 0 | 0.0% |
| 5 to 9 Unit Apartments | 0 | 0.0% |
| 10 or more Apartments | 0 | 0.0% |
| Mobile Home / Other | 6 | 13.6% |
| Total | 44 | 100.0% |
Housing Structures by Occupancy in Five Points
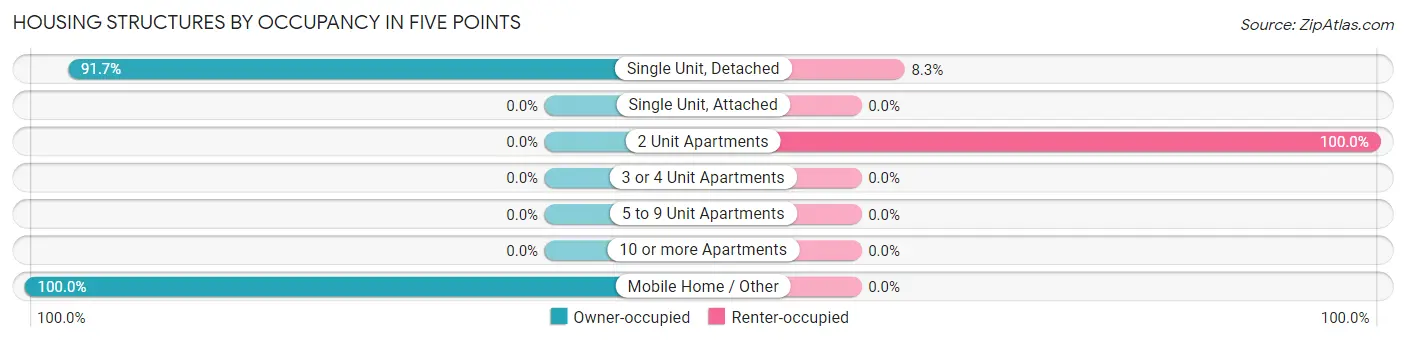
| Structure Type | Owner-occupied | Renter-occupied |
| Single Unit, Detached | 33 (91.7%) | 3 (8.3%) |
| Single Unit, Attached | 0 (0.0%) | 0 (0.0%) |
| 2 Unit Apartments | 0 (0.0%) | 2 (100.0%) |
| 3 or 4 Unit Apartments | 0 (0.0%) | 0 (0.0%) |
| 5 to 9 Unit Apartments | 0 (0.0%) | 0 (0.0%) |
| 10 or more Apartments | 0 (0.0%) | 0 (0.0%) |
| Mobile Home / Other | 6 (100.0%) | 0 (0.0%) |
| Total | 39 (88.6%) | 5 (11.4%) |
Housing Structures by Number of Rooms in Five Points
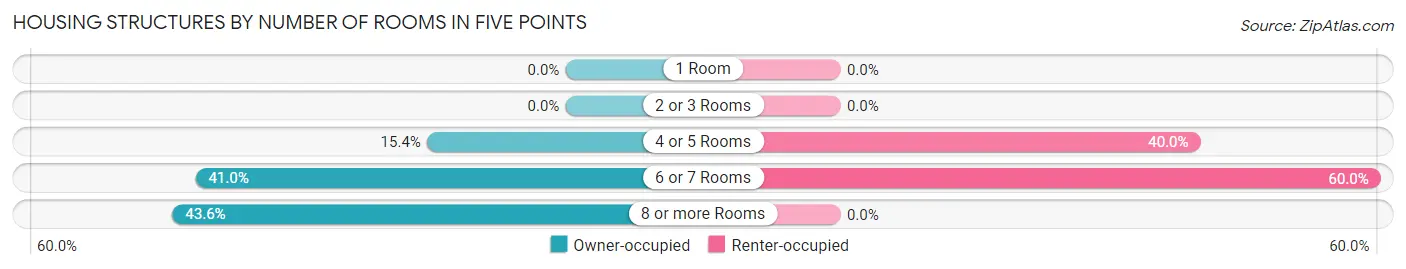
| Number of Rooms | Owner-occupied | Renter-occupied |
| 1 Room | 0 (0.0%) | 0 (0.0%) |
| 2 or 3 Rooms | 0 (0.0%) | 0 (0.0%) |
| 4 or 5 Rooms | 6 (15.4%) | 2 (40.0%) |
| 6 or 7 Rooms | 16 (41.0%) | 3 (60.0%) |
| 8 or more Rooms | 17 (43.6%) | 0 (0.0%) |
| Total | 39 (100.0%) | 5 (100.0%) |
Housing Structure by Heating Type in Five Points
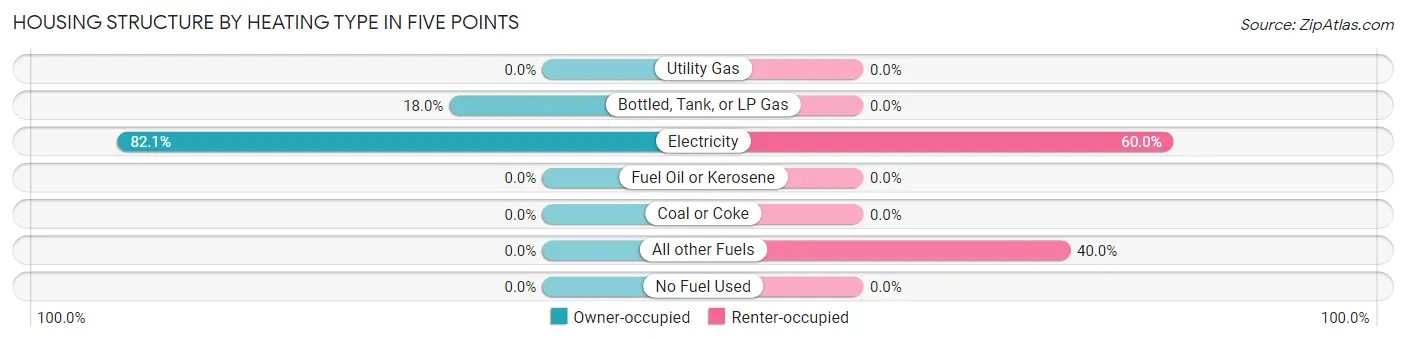
| Heating Type | Owner-occupied | Renter-occupied |
| Utility Gas | 0 (0.0%) | 0 (0.0%) |
| Bottled, Tank, or LP Gas | 7 (17.9%) | 0 (0.0%) |
| Electricity | 32 (82.1%) | 3 (60.0%) |
| Fuel Oil or Kerosene | 0 (0.0%) | 0 (0.0%) |
| Coal or Coke | 0 (0.0%) | 0 (0.0%) |
| All other Fuels | 0 (0.0%) | 2 (40.0%) |
| No Fuel Used | 0 (0.0%) | 0 (0.0%) |
| Total | 39 (100.0%) | 5 (100.0%) |
Household Vehicle Usage in Five Points
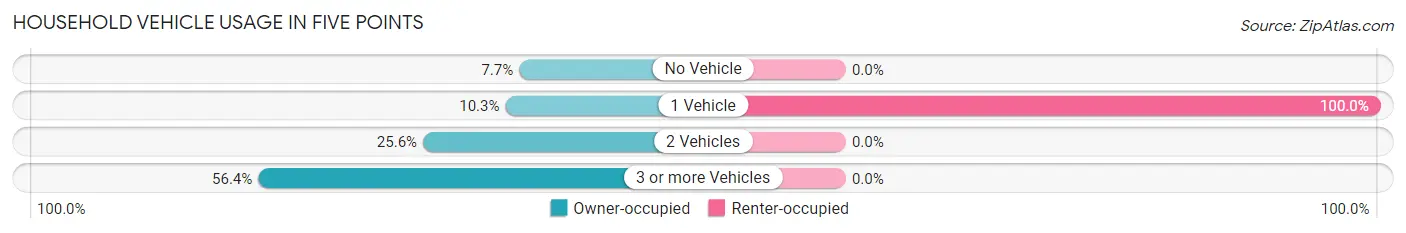
| Vehicles per Household | Owner-occupied | Renter-occupied |
| No Vehicle | 3 (7.7%) | 0 (0.0%) |
| 1 Vehicle | 4 (10.3%) | 5 (100.0%) |
| 2 Vehicles | 10 (25.6%) | 0 (0.0%) |
| 3 or more Vehicles | 22 (56.4%) | 0 (0.0%) |
| Total | 39 (100.0%) | 5 (100.0%) |
Real Estate & Mortgages in Five Points
Real Estate and Mortgage Overview in Five Points
| Characteristic | Without Mortgage | With Mortgage |
| Housing Units | 19 | 20 |
| Median Property Value | - | - |
| Median Household Income | $61,563 | $0 |
| Monthly Housing Costs | $380 | $0 |
| Real Estate Taxes | $199 | $0 |
Property Value by Mortgage Status in Five Points
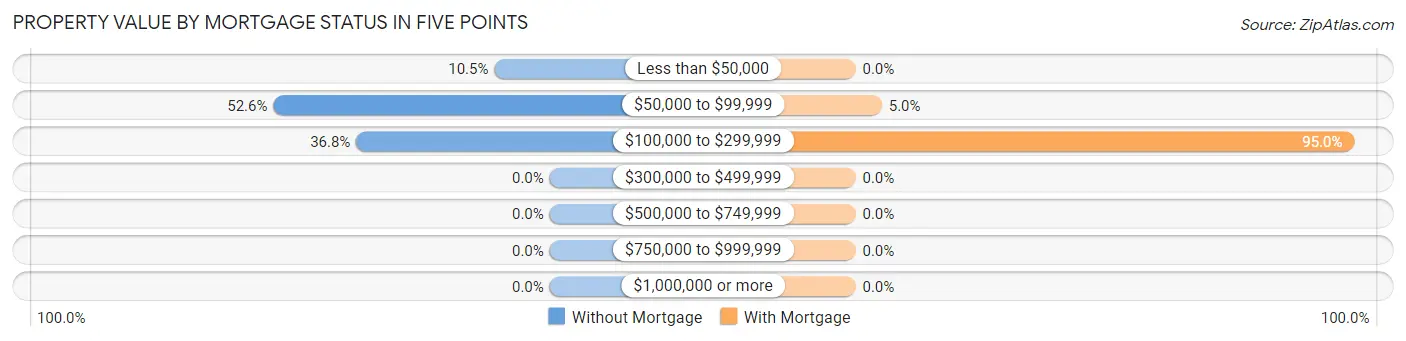
| Property Value | Without Mortgage | With Mortgage |
| Less than $50,000 | 2 (10.5%) | 0 (0.0%) |
| $50,000 to $99,999 | 10 (52.6%) | 1 (5.0%) |
| $100,000 to $299,999 | 7 (36.8%) | 19 (95.0%) |
| $300,000 to $499,999 | 0 (0.0%) | 0 (0.0%) |
| $500,000 to $749,999 | 0 (0.0%) | 0 (0.0%) |
| $750,000 to $999,999 | 0 (0.0%) | 0 (0.0%) |
| $1,000,000 or more | 0 (0.0%) | 0 (0.0%) |
| Total | 19 (100.0%) | 20 (100.0%) |
Household Income by Mortgage Status in Five Points
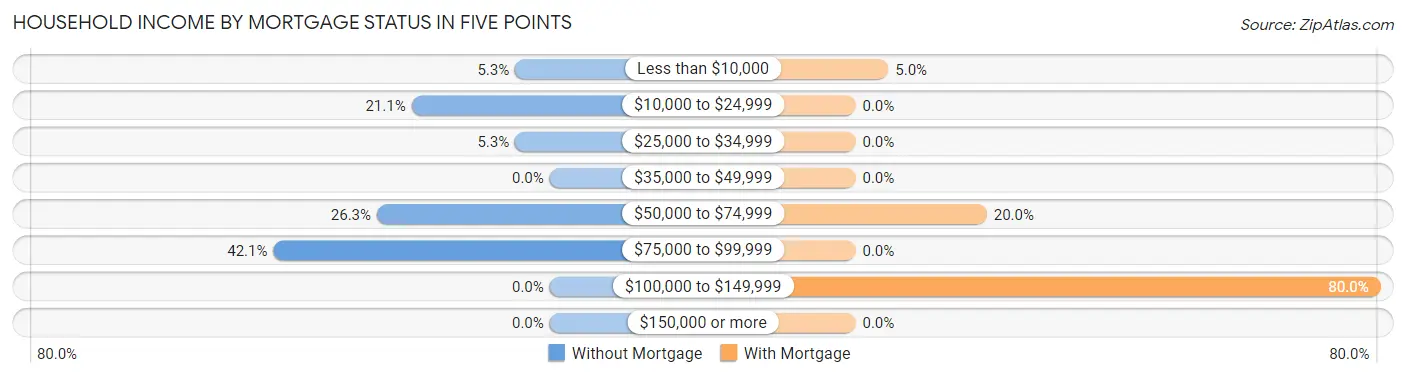
| Household Income | Without Mortgage | With Mortgage |
| Less than $10,000 | 1 (5.3%) | 1 (5.0%) |
| $10,000 to $24,999 | 4 (21.0%) | 0 (0.0%) |
| $25,000 to $34,999 | 1 (5.3%) | 0 (0.0%) |
| $35,000 to $49,999 | 0 (0.0%) | 0 (0.0%) |
| $50,000 to $74,999 | 5 (26.3%) | 4 (20.0%) |
| $75,000 to $99,999 | 8 (42.1%) | 0 (0.0%) |
| $100,000 to $149,999 | 0 (0.0%) | 16 (80.0%) |
| $150,000 or more | 0 (0.0%) | 0 (0.0%) |
| Total | 19 (100.0%) | 20 (100.0%) |
Property Value to Household Income Ratio in Five Points
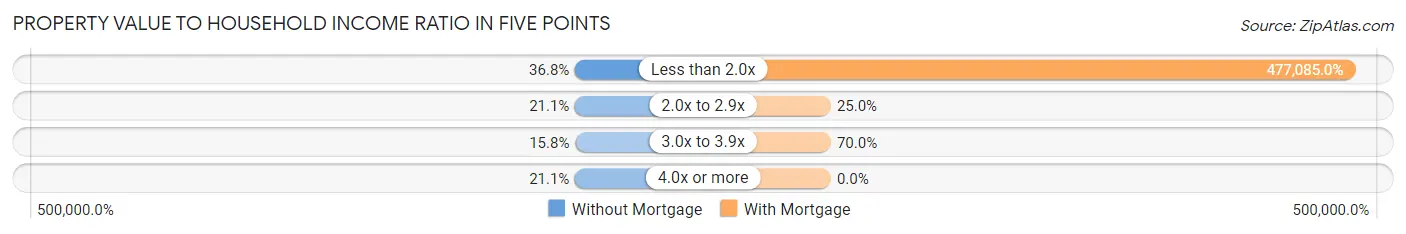
| Value-to-Income Ratio | Without Mortgage | With Mortgage |
| Less than 2.0x | 7 (36.8%) | 95,417 (477,085.0%) |
| 2.0x to 2.9x | 4 (21.0%) | 5 (25.0%) |
| 3.0x to 3.9x | 3 (15.8%) | 14 (70.0%) |
| 4.0x or more | 4 (21.0%) | 0 (0.0%) |
| Total | 19 (100.0%) | 20 (100.0%) |
Real Estate Taxes by Mortgage Status in Five Points
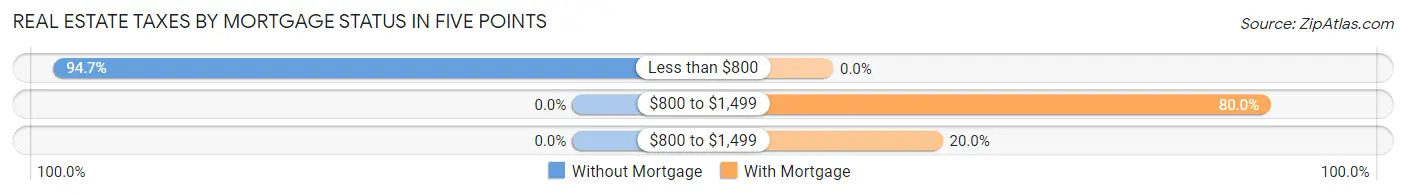
| Property Taxes | Without Mortgage | With Mortgage |
| Less than $800 | 18 (94.7%) | 0 (0.0%) |
| $800 to $1,499 | 0 (0.0%) | 16 (80.0%) |
| $800 to $1,499 | 0 (0.0%) | 4 (20.0%) |
| Total | 19 (100.0%) | 20 (100.0%) |
Health & Disability in Five Points
Health Insurance Coverage by Age in Five Points
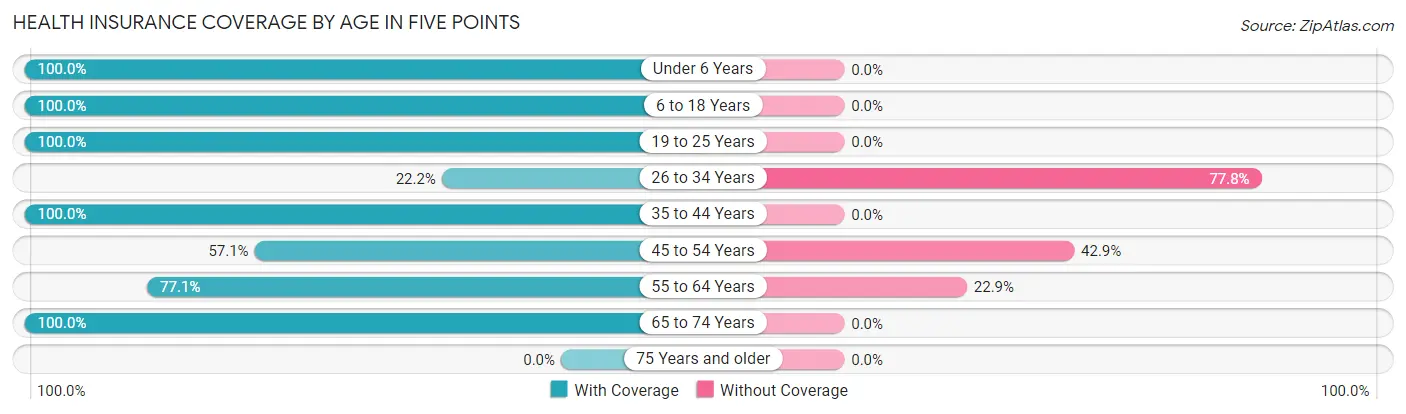
| Age Bracket | With Coverage | Without Coverage |
| Under 6 Years | 2 (100.0%) | 0 (0.0%) |
| 6 to 18 Years | 15 (100.0%) | 0 (0.0%) |
| 19 to 25 Years | 41 (100.0%) | 0 (0.0%) |
| 26 to 34 Years | 2 (22.2%) | 7 (77.8%) |
| 35 to 44 Years | 19 (100.0%) | 0 (0.0%) |
| 45 to 54 Years | 8 (57.1%) | 6 (42.9%) |
| 55 to 64 Years | 27 (77.1%) | 8 (22.9%) |
| 65 to 74 Years | 20 (100.0%) | 0 (0.0%) |
| 75 Years and older | 0 (0.0%) | 0 (0.0%) |
| Total | 134 (86.5%) | 21 (13.6%) |
Health Insurance Coverage by Citizenship Status in Five Points
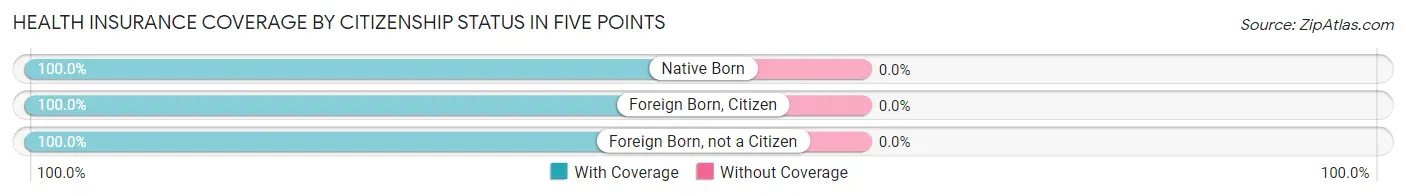
| Citizenship Status | With Coverage | Without Coverage |
| Native Born | 2 (100.0%) | 0 (0.0%) |
| Foreign Born, Citizen | 15 (100.0%) | 0 (0.0%) |
| Foreign Born, not a Citizen | 41 (100.0%) | 0 (0.0%) |
Health Insurance Coverage by Household Income in Five Points
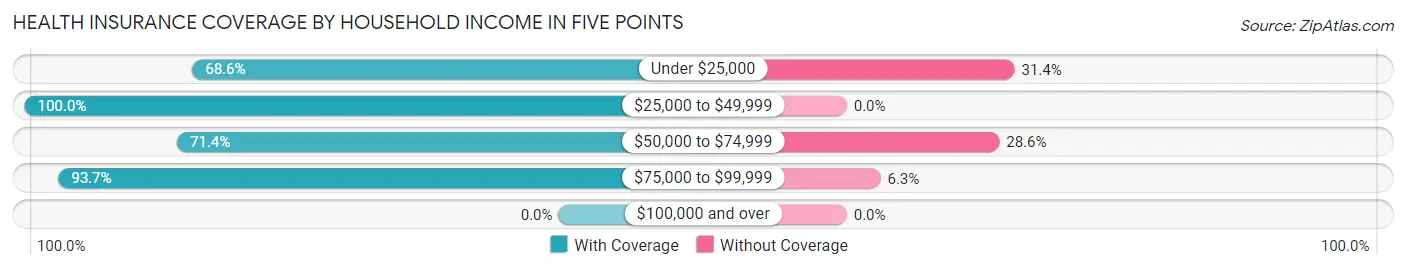
| Household Income | With Coverage | Without Coverage |
| Under $25,000 | 24 (68.6%) | 11 (31.4%) |
| $25,000 to $49,999 | 11 (100.0%) | 0 (0.0%) |
| $50,000 to $74,999 | 10 (71.4%) | 4 (28.6%) |
| $75,000 to $99,999 | 89 (93.7%) | 6 (6.3%) |
| $100,000 and over | 0 (0.0%) | 0 (0.0%) |
Public vs Private Health Insurance Coverage by Age in Five Points
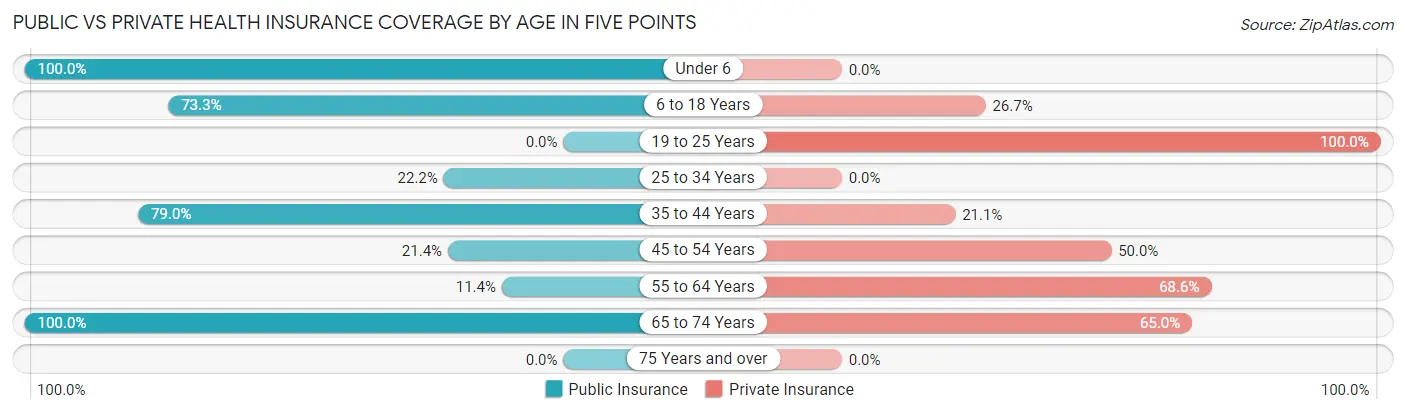
| Age Bracket | Public Insurance | Private Insurance |
| Under 6 | 2 (100.0%) | 0 (0.0%) |
| 6 to 18 Years | 11 (73.3%) | 4 (26.7%) |
| 19 to 25 Years | 0 (0.0%) | 41 (100.0%) |
| 25 to 34 Years | 2 (22.2%) | 0 (0.0%) |
| 35 to 44 Years | 15 (78.9%) | 4 (21.0%) |
| 45 to 54 Years | 3 (21.4%) | 7 (50.0%) |
| 55 to 64 Years | 4 (11.4%) | 24 (68.6%) |
| 65 to 74 Years | 20 (100.0%) | 13 (65.0%) |
| 75 Years and over | 0 (0.0%) | 0 (0.0%) |
| Total | 57 (36.8%) | 93 (60.0%) |
Disability Status by Sex by Age in Five Points
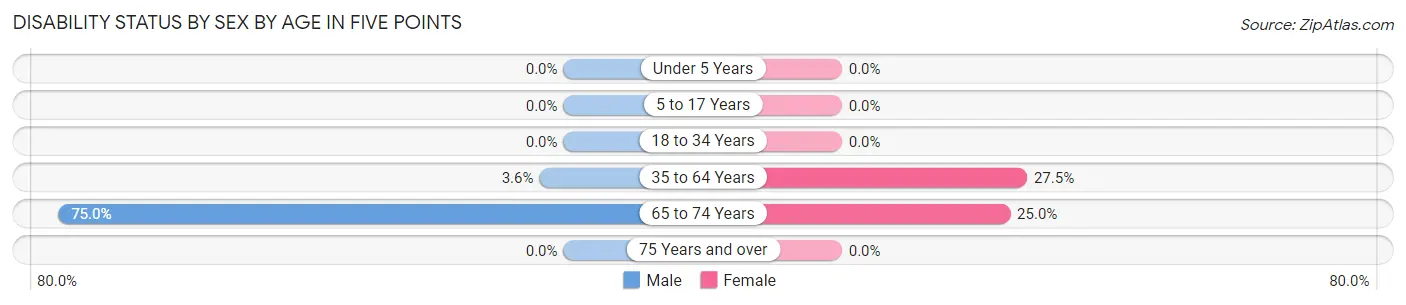
| Age Bracket | Male | Female |
| Under 5 Years | 0 (0.0%) | 0 (0.0%) |
| 5 to 17 Years | 0 (0.0%) | 0 (0.0%) |
| 18 to 34 Years | 0 (0.0%) | 0 (0.0%) |
| 35 to 64 Years | 1 (3.6%) | 11 (27.5%) |
| 65 to 74 Years | 9 (75.0%) | 2 (25.0%) |
| 75 Years and over | 0 (0.0%) | 0 (0.0%) |
Disability Class by Sex by Age in Five Points
Disability Class: Hearing Difficulty
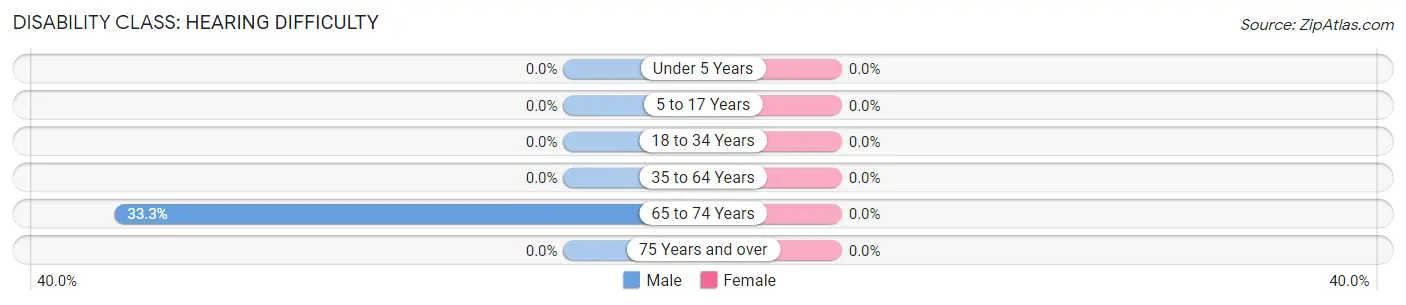
| Age Bracket | Male | Female |
| Under 5 Years | 0 (0.0%) | 0 (0.0%) |
| 5 to 17 Years | 0 (0.0%) | 0 (0.0%) |
| 18 to 34 Years | 0 (0.0%) | 0 (0.0%) |
| 35 to 64 Years | 0 (0.0%) | 0 (0.0%) |
| 65 to 74 Years | 4 (33.3%) | 0 (0.0%) |
| 75 Years and over | 0 (0.0%) | 0 (0.0%) |
Disability Class: Vision Difficulty
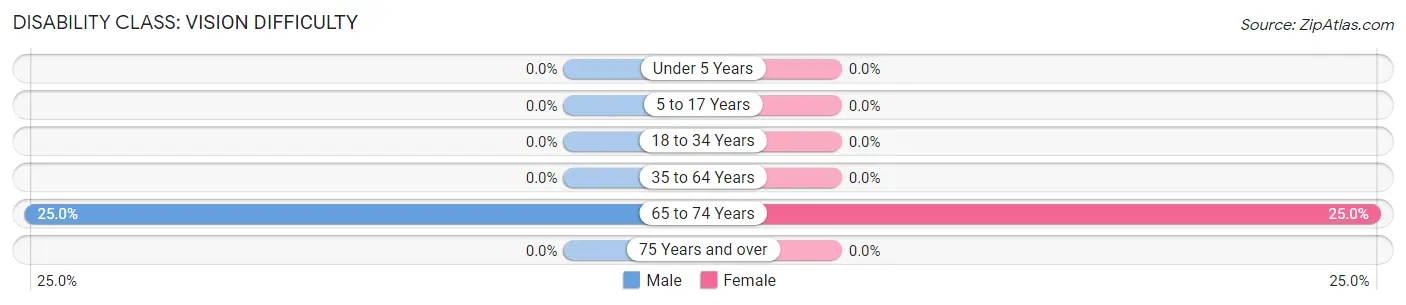
| Age Bracket | Male | Female |
| Under 5 Years | 0 (0.0%) | 0 (0.0%) |
| 5 to 17 Years | 0 (0.0%) | 0 (0.0%) |
| 18 to 34 Years | 0 (0.0%) | 0 (0.0%) |
| 35 to 64 Years | 0 (0.0%) | 0 (0.0%) |
| 65 to 74 Years | 3 (25.0%) | 2 (25.0%) |
| 75 Years and over | 0 (0.0%) | 0 (0.0%) |
Disability Class: Cognitive Difficulty
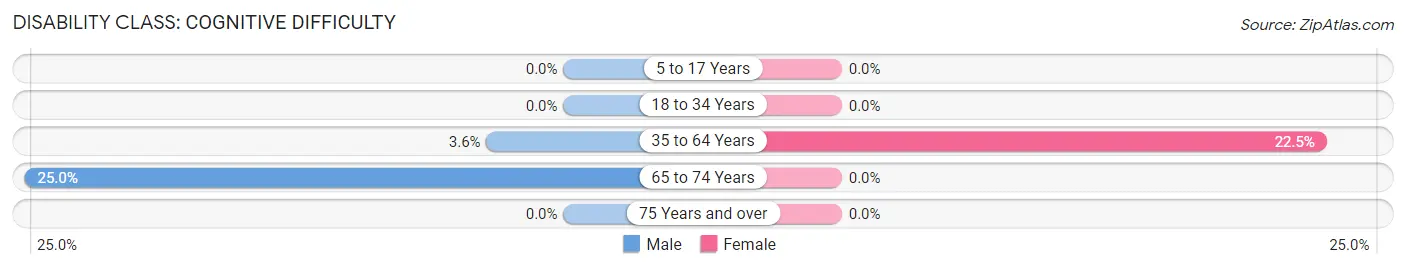
| Age Bracket | Male | Female |
| 5 to 17 Years | 0 (0.0%) | 0 (0.0%) |
| 18 to 34 Years | 0 (0.0%) | 0 (0.0%) |
| 35 to 64 Years | 1 (3.6%) | 9 (22.5%) |
| 65 to 74 Years | 3 (25.0%) | 0 (0.0%) |
| 75 Years and over | 0 (0.0%) | 0 (0.0%) |
Disability Class: Ambulatory Difficulty
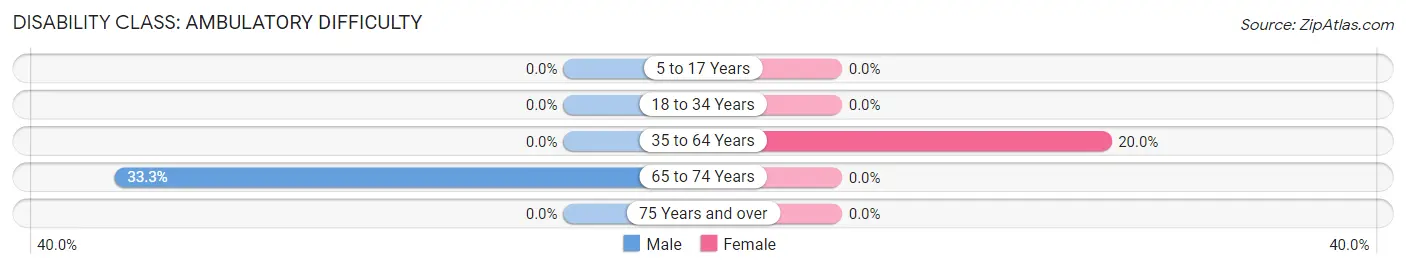
| Age Bracket | Male | Female |
| 5 to 17 Years | 0 (0.0%) | 0 (0.0%) |
| 18 to 34 Years | 0 (0.0%) | 0 (0.0%) |
| 35 to 64 Years | 0 (0.0%) | 8 (20.0%) |
| 65 to 74 Years | 4 (33.3%) | 0 (0.0%) |
| 75 Years and over | 0 (0.0%) | 0 (0.0%) |
Disability Class: Self-Care Difficulty
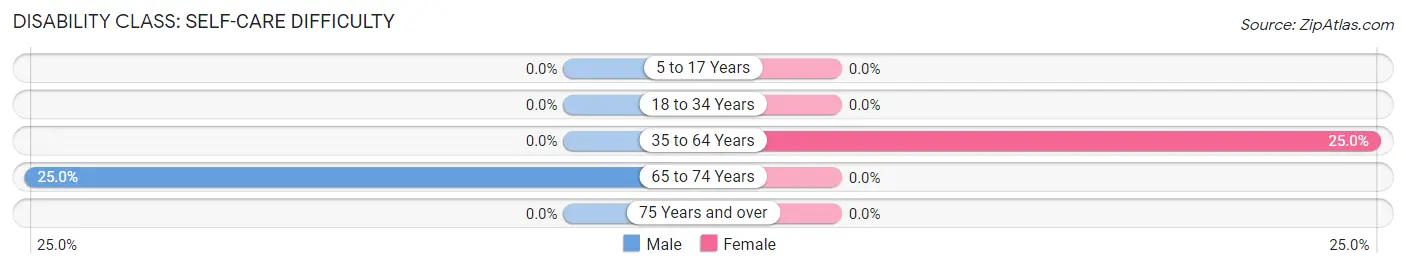
| Age Bracket | Male | Female |
| 5 to 17 Years | 0 (0.0%) | 0 (0.0%) |
| 18 to 34 Years | 0 (0.0%) | 0 (0.0%) |
| 35 to 64 Years | 0 (0.0%) | 10 (25.0%) |
| 65 to 74 Years | 3 (25.0%) | 0 (0.0%) |
| 75 Years and over | 0 (0.0%) | 0 (0.0%) |
Technology Access in Five Points
Computing Device Access in Five Points
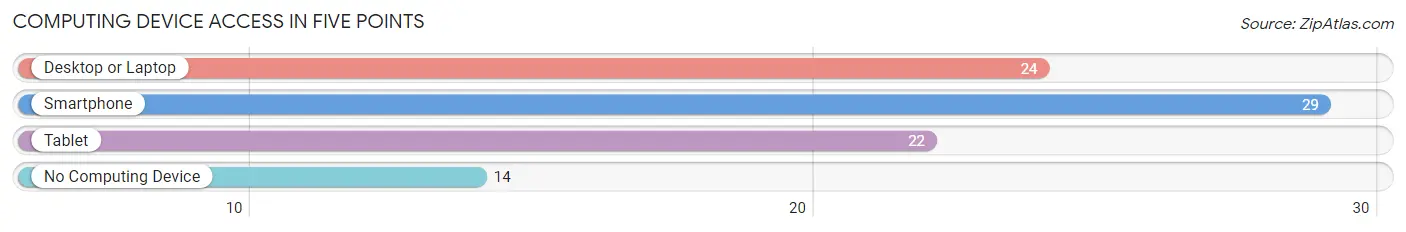
| Device Type | # Households | % Households |
| Desktop or Laptop | 24 | 54.5% |
| Smartphone | 29 | 65.9% |
| Tablet | 22 | 50.0% |
| No Computing Device | 14 | 31.8% |
| Total | 44 | 100.0% |
Internet Access in Five Points
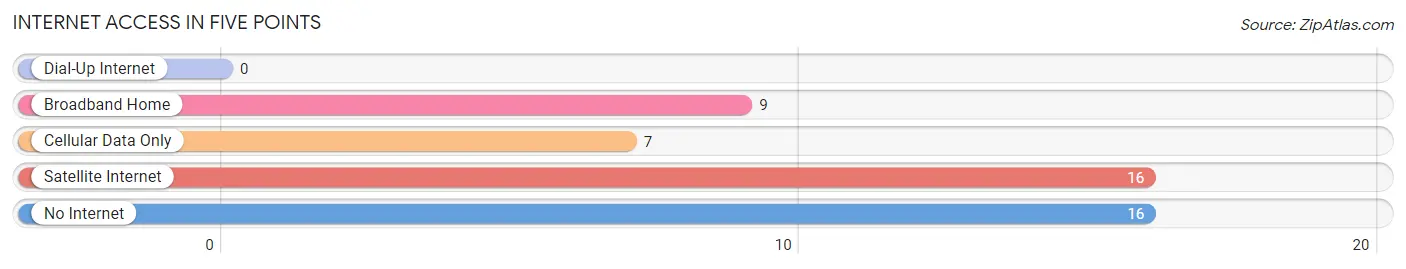
| Internet Type | # Households | % Households |
| Dial-Up Internet | 0 | 0.0% |
| Broadband Home | 9 | 20.4% |
| Cellular Data Only | 7 | 15.9% |
| Satellite Internet | 16 | 36.4% |
| No Internet | 16 | 36.4% |
| Total | 44 | 100.0% |
Five Points Summary
Five Points is a small unincorporated community located in the northwest corner of Limestone County, Alabama. It is situated on the banks of the Tennessee River, approximately 10 miles south of the city of Athens. The community is named for the five points of intersection of the roads that lead to Athens, Huntsville, Decatur, and Florence.
History
Five Points was first settled in the early 1800s by a group of settlers from North Carolina. The settlers were attracted to the area due to its fertile soil and abundant natural resources. The first settlers built a small log cabin and began farming the land. The community grew slowly over the years, and by the mid-1800s, it had become a thriving agricultural center.
The first post office in Five Points was established in 1854, and the community was officially incorporated in 1872. During this time, the town was home to several businesses, including a general store, a blacksmith shop, and a cotton gin.
In the late 1800s, the town began to experience a period of growth and prosperity. The railroad was extended to Five Points in 1887, and the town soon became a major shipping center for the surrounding area. The town also became a popular destination for tourists, who came to enjoy the area’s natural beauty and recreational activities.
Geography
Five Points is located in the northwest corner of Limestone County, Alabama. It is situated on the banks of the Tennessee River, approximately 10 miles south of the city of Athens. The town is surrounded by rolling hills and lush forests, and is home to several small lakes and streams.
The climate in Five Points is mild and humid, with average temperatures ranging from the mid-50s in the winter to the mid-80s in the summer. The area receives an average of 48 inches of rain per year, and is prone to occasional flooding.
Economy
The economy of Five Points is largely based on agriculture. The town is home to several farms, which produce a variety of crops, including corn, soybeans, cotton, and hay. The town is also home to several small businesses, including a general store, a hardware store, and a restaurant.
The town is also home to several manufacturing companies, which produce a variety of products, including furniture, clothing, and automotive parts. The town is also home to several small businesses, including a gas station, a grocery store, and a barber shop.
Demographics
As of the 2010 census, the population of Five Points was 1,845. The racial makeup of the town was 97.3% White, 0.7% African American, 0.3% Native American, 0.2% Asian, and 1.5% from other races. The median household income was $37,917, and the median family income was $45,938.
The town is home to several churches, including the First Baptist Church of Five Points, the Five Points United Methodist Church, and the Five Points Presbyterian Church. The town is also home to several schools, including Five Points Elementary School, Five Points Middle School, and Five Points High School.
Common Questions
What is Per Capita Income in Five Points?
Per Capita income in Five Points is $18,493.
What is the Median Family Income in Five Points?
Median Family Income in Five Points is $81,071.
What is the Median Household income in Five Points?
Median Household Income in Five Points is $76,667.
What is Inequality or Gini Index in Five Points?
Inequality or Gini Index in Five Points is 0.30.
What is the Total Population of Five Points?
Total Population of Five Points is 155.
What is the Total Male Population of Five Points?
Total Male Population of Five Points is 59.
What is the Total Female Population of Five Points?
Total Female Population of Five Points is 96.
What is the Ratio of Males per 100 Females in Five Points?
There are 61.46 Males per 100 Females in Five Points.
What is the Ratio of Females per 100 Males in Five Points?
There are 162.71 Females per 100 Males in Five Points.
What is the Median Population Age in Five Points?
Median Population Age in Five Points is 39.0 Years.
What is the Average Family Size in Five Points
Average Family Size in Five Points is 4.1 People.
What is the Average Household Size in Five Points
Average Household Size in Five Points is 3.5 People.
How Large is the Labor Force in Five Points?
There are 58 People in the Labor Forcein in Five Points.
What is the Percentage of People in the Labor Force in Five Points?
39.2% of People are in the Labor Force in Five Points.
What is the Unemployment Rate in Five Points?
Unemployment Rate in Five Points is 3.4%.