Fayette, AL Map & Demographics
Fayette Map
Fayette Overview
$26,576
PER CAPITA INCOME
$44,808
AVG FAMILY INCOME
$32,375
AVG HOUSEHOLD INCOME
43.5%
WAGE / INCOME GAP [ % ]
56.5¢/ $1
WAGE / INCOME GAP [ $ ]
$11,148
FAMILY INCOME DEFICIT
0.60
INEQUALITY / GINI INDEX
4,266
TOTAL POPULATION
2,079
MALE POPULATION
2,187
FEMALE POPULATION
95.06
MALES / 100 FEMALES
105.19
FEMALES / 100 MALES
44.2
MEDIAN AGE
3.2
AVG FAMILY SIZE
2.5
AVG HOUSEHOLD SIZE
1,659
LABOR FORCE [ PEOPLE ]
47.3%
PERCENT IN LABOR FORCE
16.6%
UNEMPLOYMENT RATE
Fayette Zip Codes
Fayette Area Codes
Income in Fayette
Income Overview in Fayette
Per Capita Income in Fayette is $26,576, while median incomes of families and households are $44,808 and $32,375 respectively.
| Characteristic | Number | Measure |
| Per Capita Income | 4,266 | $26,576 |
| Median Family Income | 926 | $44,808 |
| Mean Family Income | 926 | $65,178 |
| Median Household Income | 1,589 | $32,375 |
| Mean Household Income | 1,589 | $64,638 |
| Income Deficit | 926 | $11,148 |
| Wage / Income Gap (%) | 4,266 | 43.51% |
| Wage / Income Gap ($) | 4,266 | 56.49¢ per $1 |
| Gini / Inequality Index | 4,266 | 0.60 |
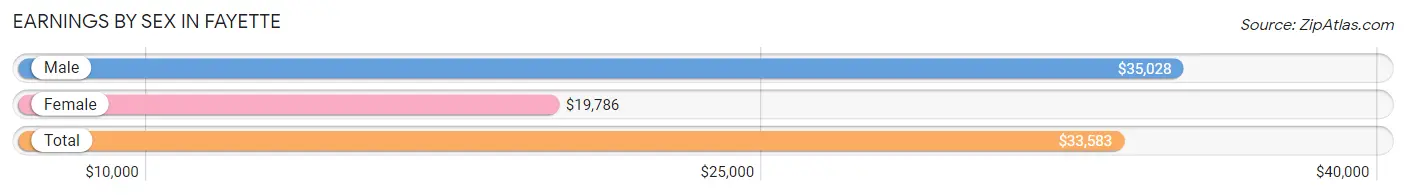
Earnings by Sex in Fayette
Average Earnings in Fayette are $33,583, $35,028 for men and $19,786 for women, a difference of 43.5%.
| Sex | Number | Average Earnings |
| Male | 929 (54.4%) | $35,028 |
| Female | 778 (45.6%) | $19,786 |
| Total | 1,707 (100.0%) | $33,583 |
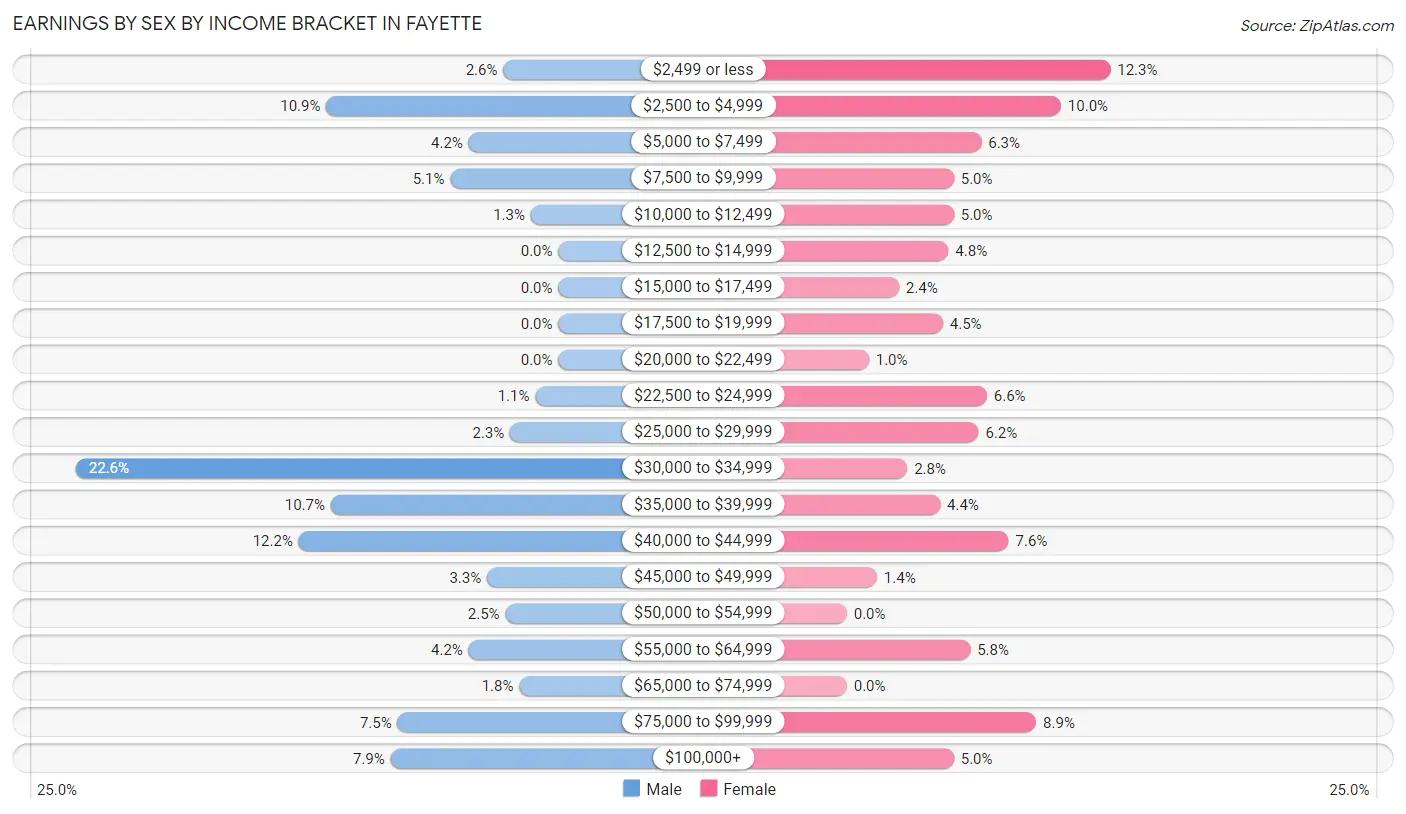
Earnings by Sex by Income Bracket in Fayette
The most common earnings brackets in Fayette are $30,000 to $34,999 for men (210 | 22.6%) and $2,499 or less for women (96 | 12.3%).
| Income | Male | Female |
| $2,499 or less | 24 (2.6%) | 96 (12.3%) |
| $2,500 to $4,999 | 101 (10.9%) | 78 (10.0%) |
| $5,000 to $7,499 | 39 (4.2%) | 49 (6.3%) |
| $7,500 to $9,999 | 47 (5.1%) | 39 (5.0%) |
| $10,000 to $12,499 | 12 (1.3%) | 39 (5.0%) |
| $12,500 to $14,999 | 0 (0.0%) | 37 (4.8%) |
| $15,000 to $17,499 | 0 (0.0%) | 19 (2.4%) |
| $17,500 to $19,999 | 0 (0.0%) | 35 (4.5%) |
| $20,000 to $22,499 | 0 (0.0%) | 8 (1.0%) |
| $22,500 to $24,999 | 10 (1.1%) | 51 (6.6%) |
| $25,000 to $29,999 | 21 (2.3%) | 48 (6.2%) |
| $30,000 to $34,999 | 210 (22.6%) | 22 (2.8%) |
| $35,000 to $39,999 | 99 (10.7%) | 34 (4.4%) |
| $40,000 to $44,999 | 113 (12.2%) | 59 (7.6%) |
| $45,000 to $49,999 | 31 (3.3%) | 11 (1.4%) |
| $50,000 to $54,999 | 23 (2.5%) | 0 (0.0%) |
| $55,000 to $64,999 | 39 (4.2%) | 45 (5.8%) |
| $65,000 to $74,999 | 17 (1.8%) | 0 (0.0%) |
| $75,000 to $99,999 | 70 (7.5%) | 69 (8.9%) |
| $100,000+ | 73 (7.9%) | 39 (5.0%) |
| Total | 929 (100.0%) | 778 (100.0%) |
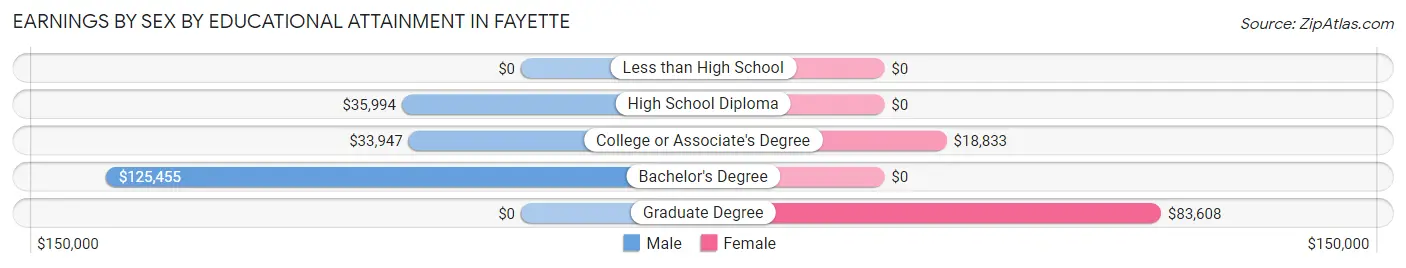
Earnings by Sex by Educational Attainment in Fayette
Average earnings in Fayette are $35,142 for men and $28,099 for women, a difference of 20.0%. Men with an educational attainment of bachelor's degree enjoy the highest average annual earnings of $125,455, while those with college or associate's degree education earn the least with $33,947. Women with an educational attainment of graduate degree earn the most with the average annual earnings of $83,608, while those with college or associate's degree education have the smallest earnings of $18,833.
| Educational Attainment | Male Income | Female Income |
| Less than High School | - | - |
| High School Diploma | $35,994 | $0 |
| College or Associate's Degree | $33,947 | $18,833 |
| Bachelor's Degree | $125,455 | $0 |
| Graduate Degree | - | - |
| Total | $35,142 | $28,099 |
Family Income in Fayette
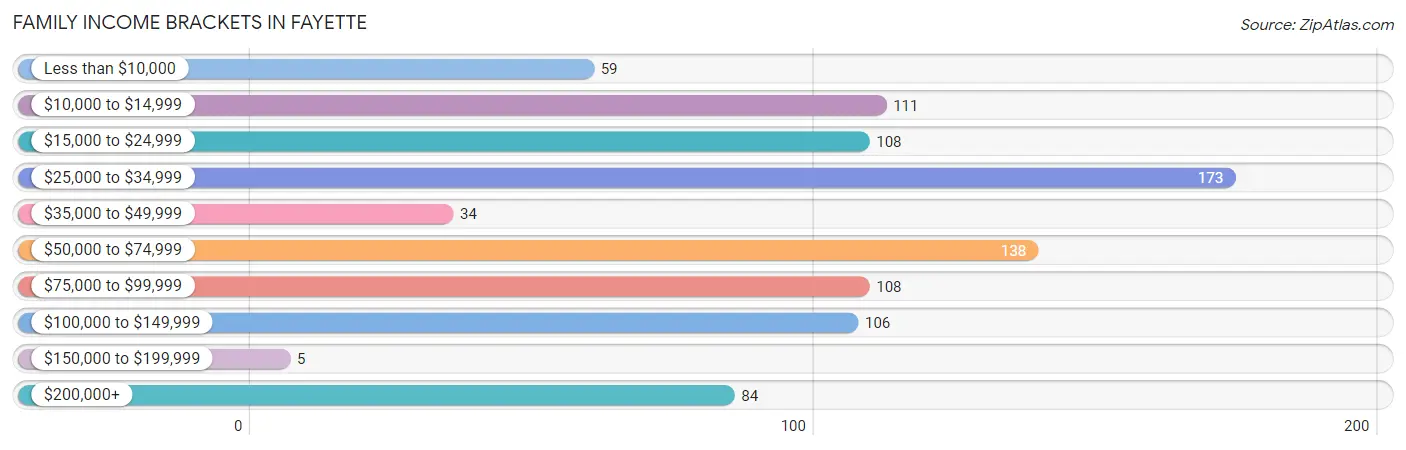
Family Income Brackets in Fayette
According to the Fayette family income data, there are 173 families falling into the $25,000 to $34,999 income range, which is the most common income bracket and makes up 18.7% of all families. Conversely, the $150,000 to $199,999 income bracket is the least frequent group with only 5 families (0.5%) belonging to this category.
| Income Bracket | # Families | % Families |
| Less than $10,000 | 59 | 6.4% |
| $10,000 to $14,999 | 111 | 12.0% |
| $15,000 to $24,999 | 108 | 11.7% |
| $25,000 to $34,999 | 173 | 18.7% |
| $35,000 to $49,999 | 34 | 3.7% |
| $50,000 to $74,999 | 138 | 14.9% |
| $75,000 to $99,999 | 108 | 11.7% |
| $100,000 to $149,999 | 106 | 11.4% |
| $150,000 to $199,999 | 5 | 0.5% |
| $200,000+ | 84 | 9.1% |
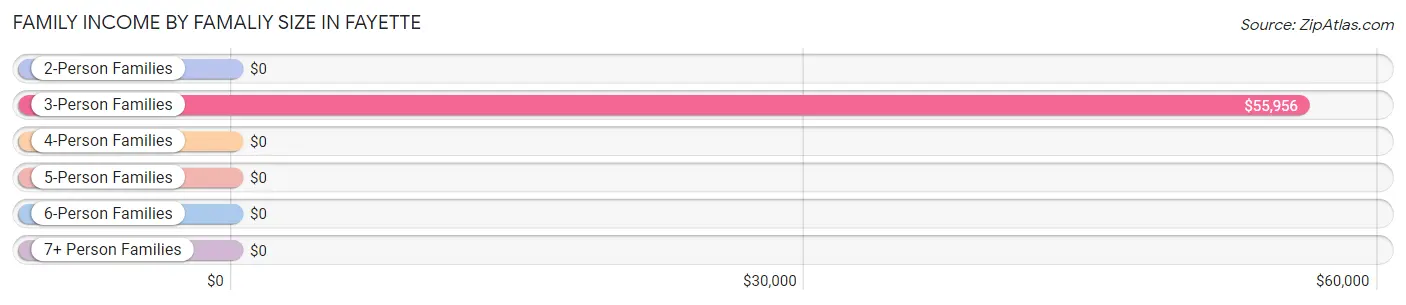
Family Income by Famaliy Size in Fayette
3-person families (149 | 16.1%) account for the highest median family income in Fayette with $55,956 per family, while 3-person families (149 | 16.1%) have the highest median income of $18,652 per family member.
| Income Bracket | # Families | Median Income |
| 2-Person Families | 564 (60.9%) | $0 |
| 3-Person Families | 149 (16.1%) | $55,956 |
| 4-Person Families | 149 (16.1%) | $0 |
| 5-Person Families | 10 (1.1%) | $0 |
| 6-Person Families | 37 (4.0%) | $0 |
| 7+ Person Families | 17 (1.8%) | $0 |
| Total | 926 (100.0%) | $44,808 |
Family Income by Number of Earners in Fayette
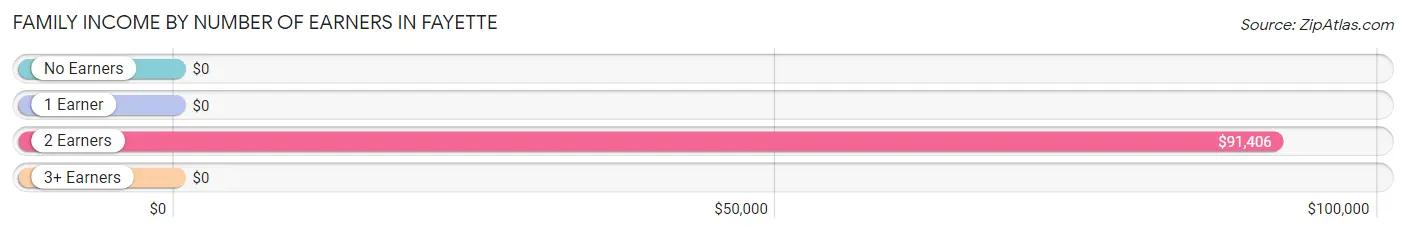
| Number of Earners | # Families | Median Income |
| No Earners | 285 (30.8%) | $0 |
| 1 Earner | 317 (34.2%) | $0 |
| 2 Earners | 324 (35.0%) | $91,406 |
| 3+ Earners | 0 (0.0%) | $0 |
| Total | 926 (100.0%) | $44,808 |
Household Income in Fayette
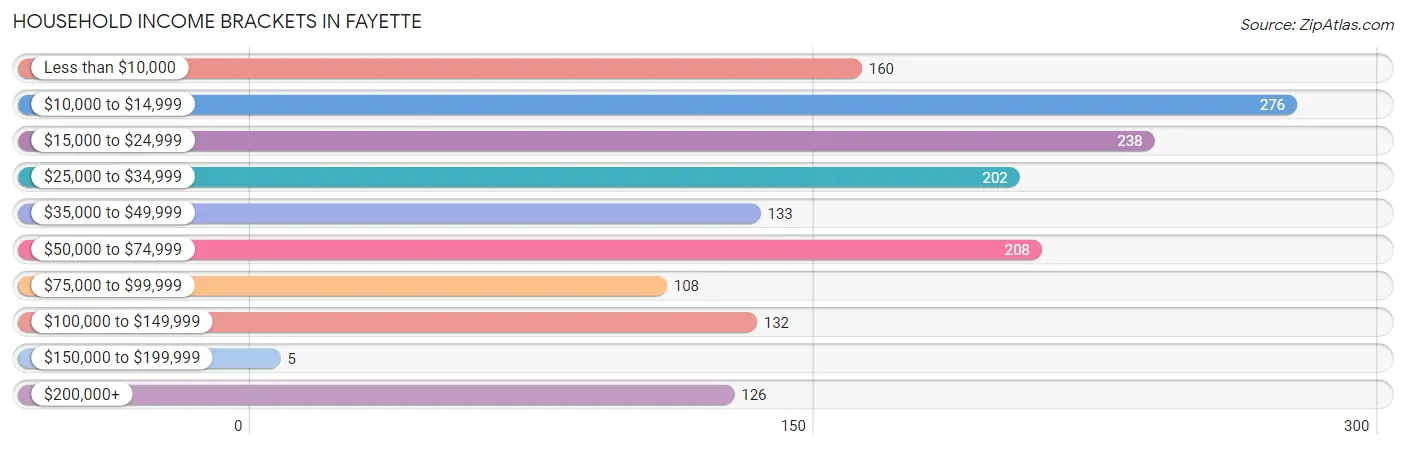
Household Income Brackets in Fayette
With 276 households falling in the category, the $10,000 to $14,999 income range is the most frequent in Fayette, accounting for 17.4% of all households. In contrast, only 5 households (0.3%) fall into the $150,000 to $199,999 income bracket, making it the least populous group.
| Income Bracket | # Households | % Households |
| Less than $10,000 | 160 | 10.1% |
| $10,000 to $14,999 | 276 | 17.4% |
| $15,000 to $24,999 | 238 | 15.0% |
| $25,000 to $34,999 | 202 | 12.7% |
| $35,000 to $49,999 | 133 | 8.4% |
| $50,000 to $74,999 | 208 | 13.1% |
| $75,000 to $99,999 | 108 | 6.8% |
| $100,000 to $149,999 | 132 | 8.3% |
| $150,000 to $199,999 | 5 | 0.3% |
| $200,000+ | 126 | 7.9% |
Household Income by Householder Age in Fayette
The median household income in Fayette is $32,375, with the highest median household income of $55,909 found in the 25 to 44 years age bracket for the primary householder. A total of 382 households (24.0%) fall into this category. Meanwhile, the 15 to 24 years age bracket for the primary householder has the lowest median household income of $0, with 37 households (2.3%) in this group.
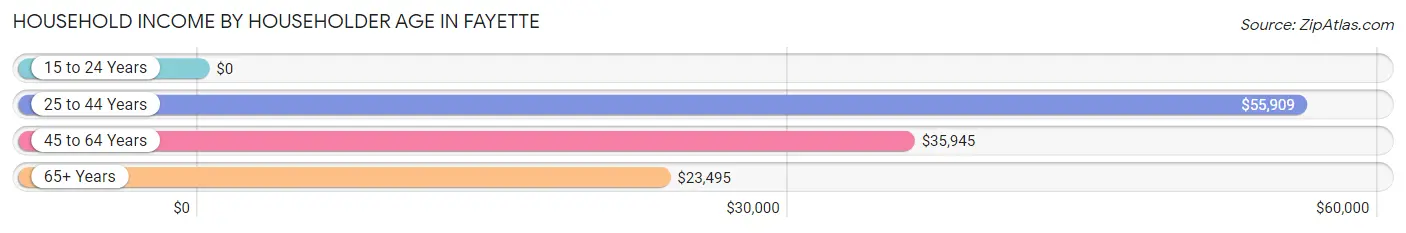
| Income Bracket | # Households | Median Income |
| 15 to 24 Years | 37 (2.3%) | $0 |
| 25 to 44 Years | 382 (24.0%) | $55,909 |
| 45 to 64 Years | 553 (34.8%) | $35,945 |
| 65+ Years | 617 (38.8%) | $23,495 |
| Total | 1,589 (100.0%) | $32,375 |
Poverty in Fayette
Income Below Poverty by Sex and Age in Fayette
With 28.7% poverty level for males and 38.2% for females among the residents of Fayette, 12 to 14 year old males and 6 to 11 year old females are the most vulnerable to poverty, with 50 males (76.9%) and 54 females (100.0%) in their respective age groups living below the poverty level.
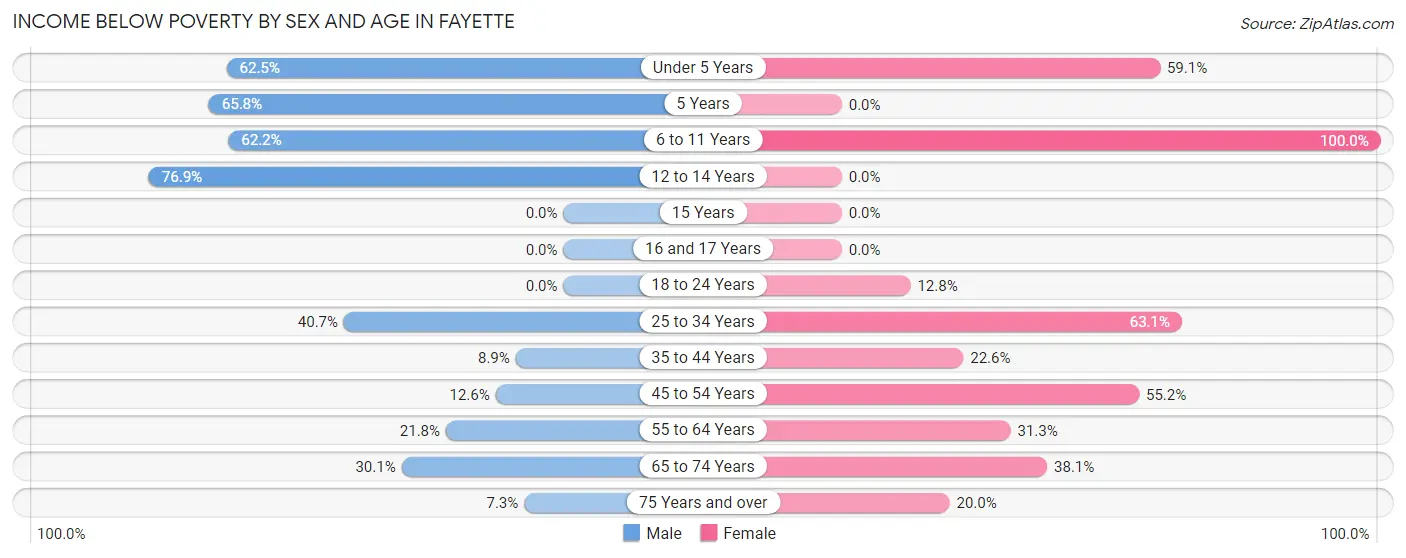
| Age Bracket | Male | Female |
| Under 5 Years | 60 (62.5%) | 101 (59.1%) |
| 5 Years | 25 (65.8%) | 0 (0.0%) |
| 6 to 11 Years | 143 (62.2%) | 54 (100.0%) |
| 12 to 14 Years | 50 (76.9%) | 0 (0.0%) |
| 15 Years | 0 (0.0%) | 0 (0.0%) |
| 16 and 17 Years | 0 (0.0%) | 0 (0.0%) |
| 18 to 24 Years | 0 (0.0%) | 19 (12.8%) |
| 25 to 34 Years | 99 (40.7%) | 183 (63.1%) |
| 35 to 44 Years | 14 (8.9%) | 37 (22.6%) |
| 45 to 54 Years | 35 (12.6%) | 144 (55.2%) |
| 55 to 64 Years | 53 (21.8%) | 88 (31.3%) |
| 65 to 74 Years | 58 (30.0%) | 101 (38.1%) |
| 75 Years and over | 11 (7.3%) | 59 (20.0%) |
| Total | 548 (28.7%) | 786 (38.2%) |
Income Above Poverty by Sex and Age in Fayette
According to the poverty statistics in Fayette, males aged 16 and 17 years and females aged 5 years are the age groups that are most secure financially, with 100.0% of males and 100.0% of females in these age groups living above the poverty line.
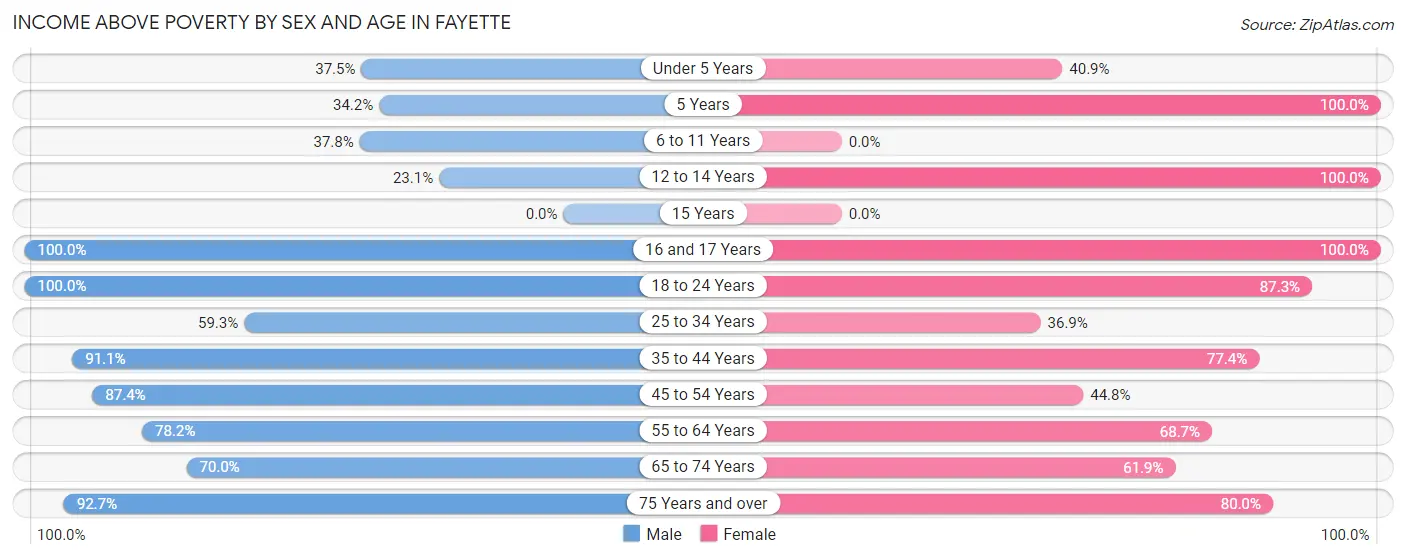
| Age Bracket | Male | Female |
| Under 5 Years | 36 (37.5%) | 70 (40.9%) |
| 5 Years | 13 (34.2%) | 28 (100.0%) |
| 6 to 11 Years | 87 (37.8%) | 0 (0.0%) |
| 12 to 14 Years | 15 (23.1%) | 36 (100.0%) |
| 15 Years | 0 (0.0%) | 0 (0.0%) |
| 16 and 17 Years | 49 (100.0%) | 65 (100.0%) |
| 18 to 24 Years | 166 (100.0%) | 130 (87.3%) |
| 25 to 34 Years | 144 (59.3%) | 107 (36.9%) |
| 35 to 44 Years | 144 (91.1%) | 127 (77.4%) |
| 45 to 54 Years | 243 (87.4%) | 117 (44.8%) |
| 55 to 64 Years | 190 (78.2%) | 193 (68.7%) |
| 65 to 74 Years | 135 (70.0%) | 164 (61.9%) |
| 75 Years and over | 140 (92.7%) | 236 (80.0%) |
| Total | 1,362 (71.3%) | 1,273 (61.8%) |
Income Below Poverty Among Married-Couple Families in Fayette
The poverty statistics for married-couple families in Fayette show that 13.9% or 83 of the total 598 families live below the poverty line. Families with 5 or more children have the highest poverty rate of 100.0%, comprising of 17 families. On the other hand, families with 3 or 4 children have the lowest poverty rate of 0.0%, which includes 0 families.
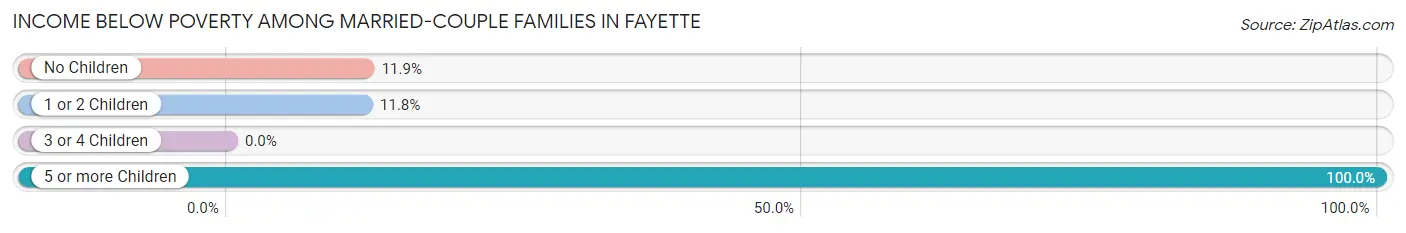
| Children | Above Poverty | Below Poverty |
| No Children | 385 (88.1%) | 52 (11.9%) |
| 1 or 2 Children | 105 (88.2%) | 14 (11.8%) |
| 3 or 4 Children | 25 (100.0%) | 0 (0.0%) |
| 5 or more Children | 0 (0.0%) | 17 (100.0%) |
| Total | 515 (86.1%) | 83 (13.9%) |
Income Below Poverty Among Single-Parent Households in Fayette
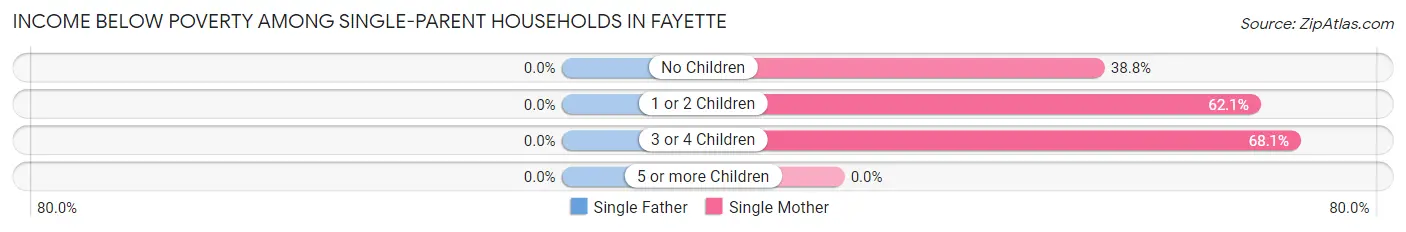
| Children | Single Father | Single Mother |
| No Children | 0 (0.0%) | 38 (38.8%) |
| 1 or 2 Children | 0 (0.0%) | 100 (62.1%) |
| 3 or 4 Children | 0 (0.0%) | 47 (68.1%) |
| 5 or more Children | 0 (0.0%) | 0 (0.0%) |
| Total | 0 (0.0%) | 185 (56.4%) |
Income Below Poverty Among Married-Couple vs Single-Parent Households in Fayette
The poverty data for Fayette shows that 83 of the married-couple family households (13.9%) and 185 of the single-parent households (56.4%) are living below the poverty level. Within the married-couple family households, those with 5 or more children have the highest poverty rate, with 17 households (100.0%) falling below the poverty line. Among the single-parent households, those with 3 or 4 children have the highest poverty rate, with 47 household (68.1%) living below poverty.
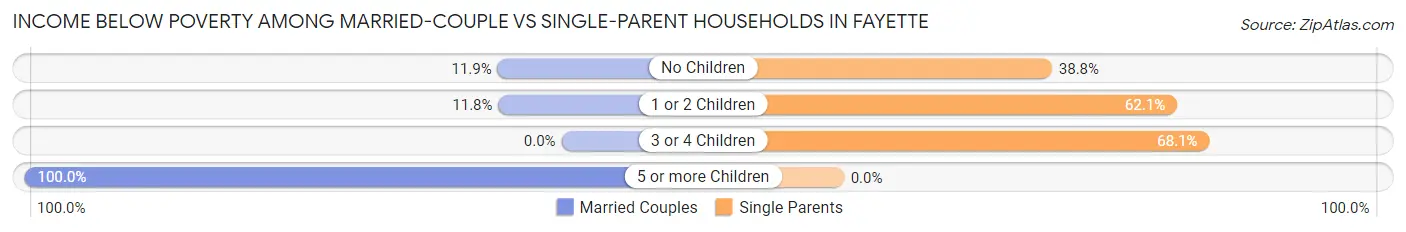
| Children | Married-Couple Families | Single-Parent Households |
| No Children | 52 (11.9%) | 38 (38.8%) |
| 1 or 2 Children | 14 (11.8%) | 100 (62.1%) |
| 3 or 4 Children | 0 (0.0%) | 47 (68.1%) |
| 5 or more Children | 17 (100.0%) | 0 (0.0%) |
| Total | 83 (13.9%) | 185 (56.4%) |
Race in Fayette
The most populous races in Fayette are White / Caucasian (2,812 | 65.9%), Black / African American (1,291 | 30.3%), and Two or more Races (102 | 2.4%).
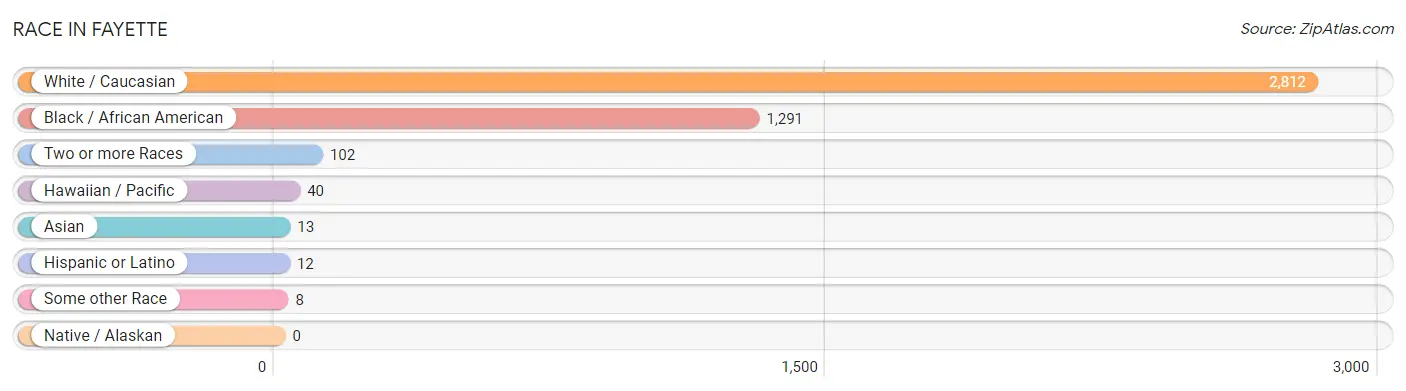
| Race | # Population | % Population |
| Asian | 13 | 0.3% |
| Black / African American | 1,291 | 30.3% |
| Hawaiian / Pacific | 40 | 0.9% |
| Hispanic or Latino | 12 | 0.3% |
| Native / Alaskan | 0 | 0.0% |
| White / Caucasian | 2,812 | 65.9% |
| Two or more Races | 102 | 2.4% |
| Some other Race | 8 | 0.2% |
| Total | 4,266 | 100.0% |
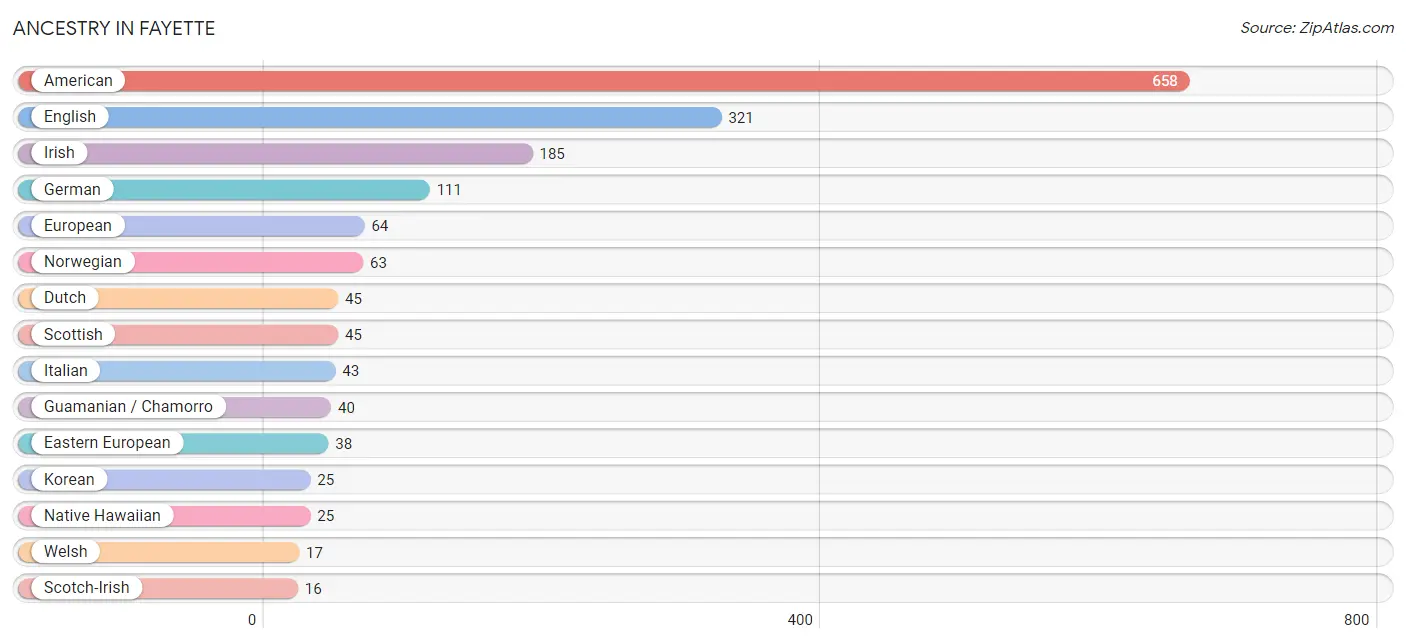
Ancestry in Fayette
The most populous ancestries reported in Fayette are American (658 | 15.4%), English (321 | 7.5%), Irish (185 | 4.3%), German (111 | 2.6%), and European (64 | 1.5%), together accounting for 31.4% of all Fayette residents.
| Ancestry | # Population | % Population |
| American | 658 | 15.4% |
| Argentinean | 12 | 0.3% |
| Cherokee | 8 | 0.2% |
| Creek | 8 | 0.2% |
| Czech | 14 | 0.3% |
| Dutch | 45 | 1.1% |
| Eastern European | 38 | 0.9% |
| English | 321 | 7.5% |
| European | 64 | 1.5% |
| German | 111 | 2.6% |
| Guamanian / Chamorro | 40 | 0.9% |
| Irish | 185 | 4.3% |
| Italian | 43 | 1.0% |
| Korean | 25 | 0.6% |
| Native Hawaiian | 25 | 0.6% |
| Norwegian | 63 | 1.5% |
| Scotch-Irish | 16 | 0.4% |
| Scottish | 45 | 1.1% |
| South American | 12 | 0.3% |
| Swedish | 9 | 0.2% |
| Welsh | 17 | 0.4% | View All 21 Rows |
Immigrants in Fayette
The most numerous immigrant groups reported in Fayette came from Asia (13 | 0.3%), Nepal (13 | 0.3%), and South Central Asia (13 | 0.3%), together accounting for 0.9% of all Fayette residents.
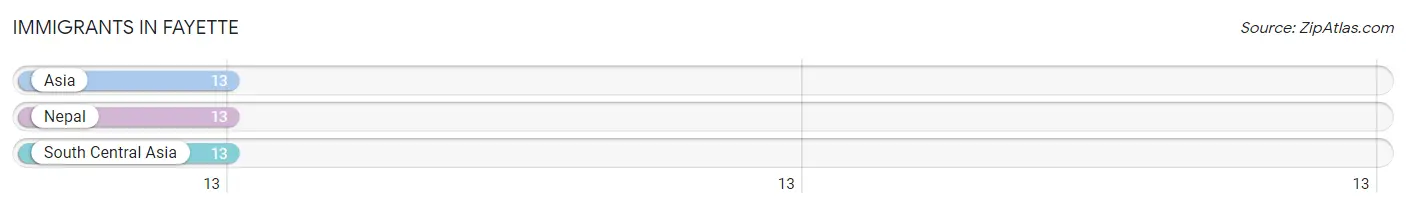
| Immigration Origin | # Population | % Population |
| Asia | 13 | 0.3% |
| Nepal | 13 | 0.3% |
| South Central Asia | 13 | 0.3% | View All 3 Rows |
Sex and Age in Fayette
Sex and Age in Fayette
The most populous age groups in Fayette are 50 to 54 Years (243 | 11.7%) for men and 25 to 29 Years (226 | 10.3%) for women.
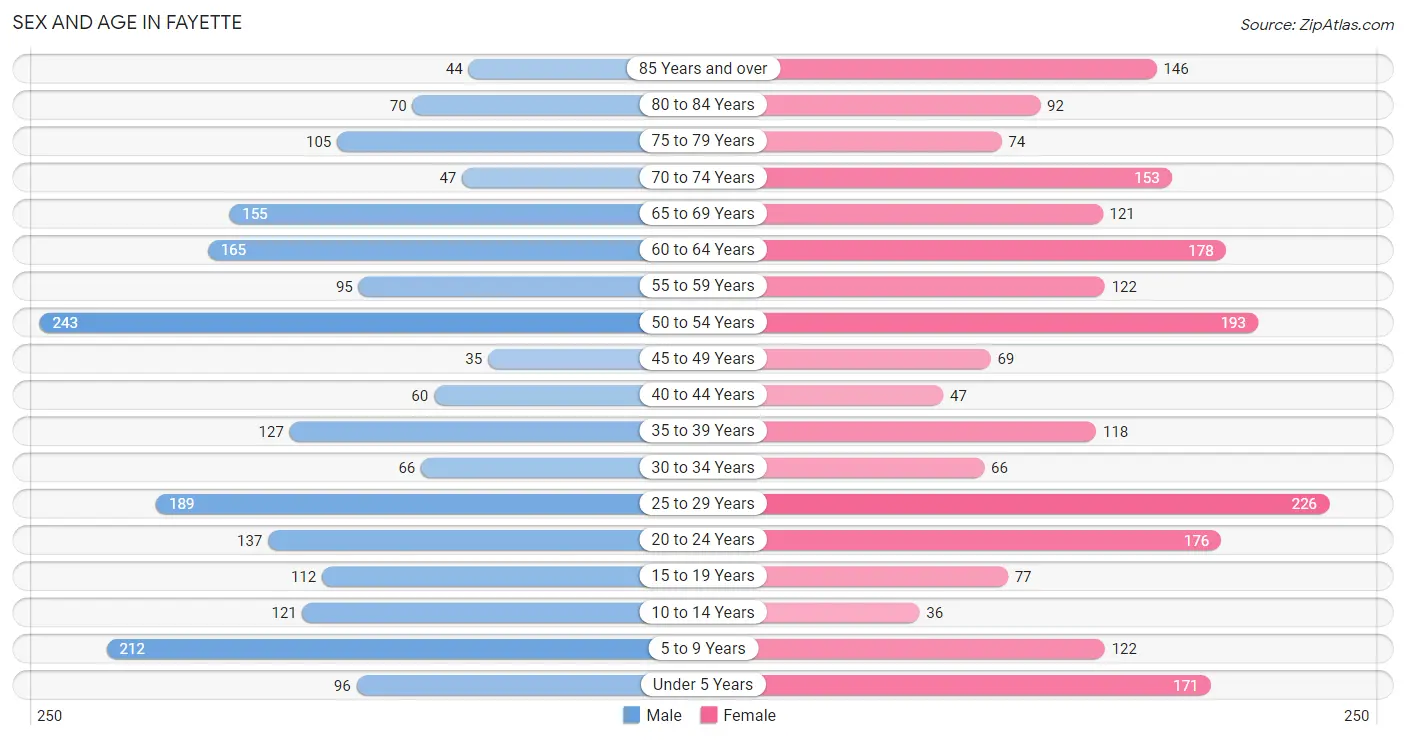
| Age Bracket | Male | Female |
| Under 5 Years | 96 (4.6%) | 171 (7.8%) |
| 5 to 9 Years | 212 (10.2%) | 122 (5.6%) |
| 10 to 14 Years | 121 (5.8%) | 36 (1.7%) |
| 15 to 19 Years | 112 (5.4%) | 77 (3.5%) |
| 20 to 24 Years | 137 (6.6%) | 176 (8.1%) |
| 25 to 29 Years | 189 (9.1%) | 226 (10.3%) |
| 30 to 34 Years | 66 (3.2%) | 66 (3.0%) |
| 35 to 39 Years | 127 (6.1%) | 118 (5.4%) |
| 40 to 44 Years | 60 (2.9%) | 47 (2.1%) |
| 45 to 49 Years | 35 (1.7%) | 69 (3.2%) |
| 50 to 54 Years | 243 (11.7%) | 193 (8.8%) |
| 55 to 59 Years | 95 (4.6%) | 122 (5.6%) |
| 60 to 64 Years | 165 (7.9%) | 178 (8.1%) |
| 65 to 69 Years | 155 (7.5%) | 121 (5.5%) |
| 70 to 74 Years | 47 (2.3%) | 153 (7.0%) |
| 75 to 79 Years | 105 (5.1%) | 74 (3.4%) |
| 80 to 84 Years | 70 (3.4%) | 92 (4.2%) |
| 85 Years and over | 44 (2.1%) | 146 (6.7%) |
| Total | 2,079 (100.0%) | 2,187 (100.0%) |
Families and Households in Fayette
Median Family Size in Fayette
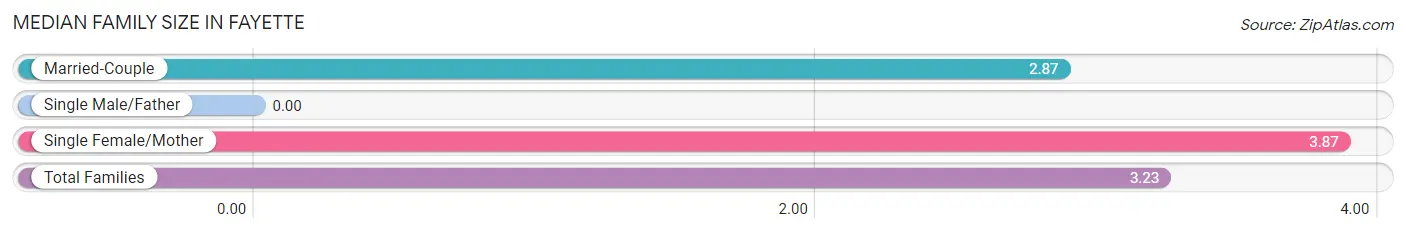
| Family Type | # Families | Family Size |
| Married-Couple | 598 (64.6%) | 2.87 |
| Single Male/Father | 0 (0.0%) | - |
| Single Female/Mother | 328 (35.4%) | 3.87 |
| Total Families | 926 (100.0%) | 3.23 |
Median Household Size in Fayette
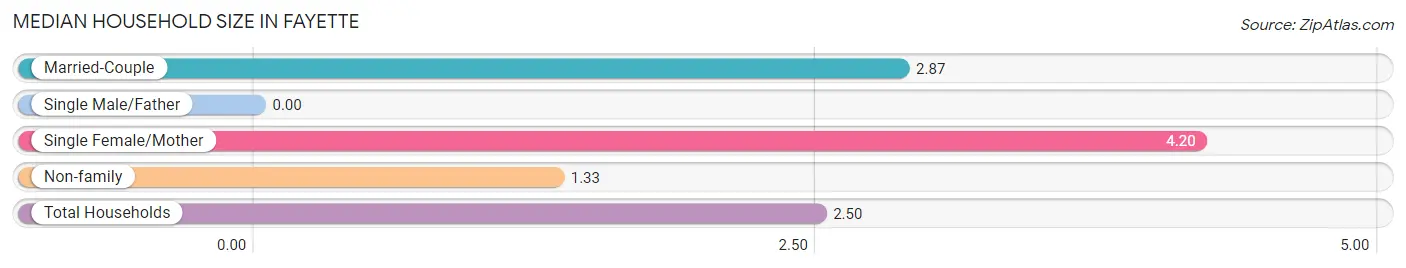
| Household Type | # Households | Household Size |
| Married-Couple | 598 (37.6%) | 2.87 |
| Single Male/Father | 0 (0.0%) | - |
| Single Female/Mother | 328 (20.6%) | 4.20 |
| Non-family | 663 (41.7%) | 1.33 |
| Total Households | 1,589 (100.0%) | 2.50 |
Household Size by Marriage Status in Fayette
Out of a total of 1,589 households in Fayette, 926 (58.3%) are family households, while 663 (41.7%) are nonfamily households. The most numerous type of family households are 2-person households, comprising 506, and the most common type of nonfamily households are 1-person households, comprising 597.
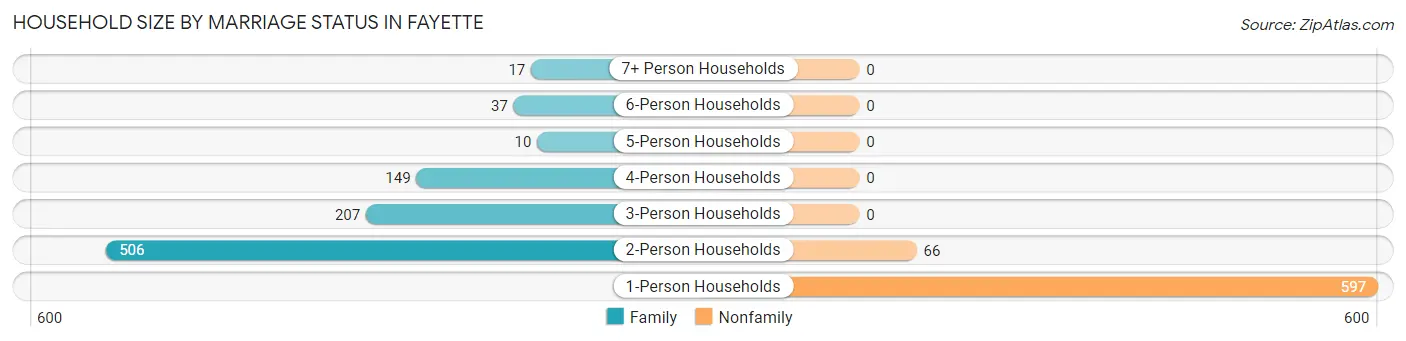
| Household Size | Family Households | Nonfamily Households |
| 1-Person Households | - | 597 (37.6%) |
| 2-Person Households | 506 (31.8%) | 66 (4.2%) |
| 3-Person Households | 207 (13.0%) | 0 (0.0%) |
| 4-Person Households | 149 (9.4%) | 0 (0.0%) |
| 5-Person Households | 10 (0.6%) | 0 (0.0%) |
| 6-Person Households | 37 (2.3%) | 0 (0.0%) |
| 7+ Person Households | 17 (1.1%) | 0 (0.0%) |
| Total | 926 (58.3%) | 663 (41.7%) |
Female Fertility in Fayette
Fertility by Age in Fayette
Average fertility rate in Fayette is 37.0 births per 1,000 women. Women in the age bracket of 20 to 34 years have the highest fertility rate with 62.0 births per 1,000 women. Women in the age bracket of 20 to 34 years acount for 100.0% of all women with births.
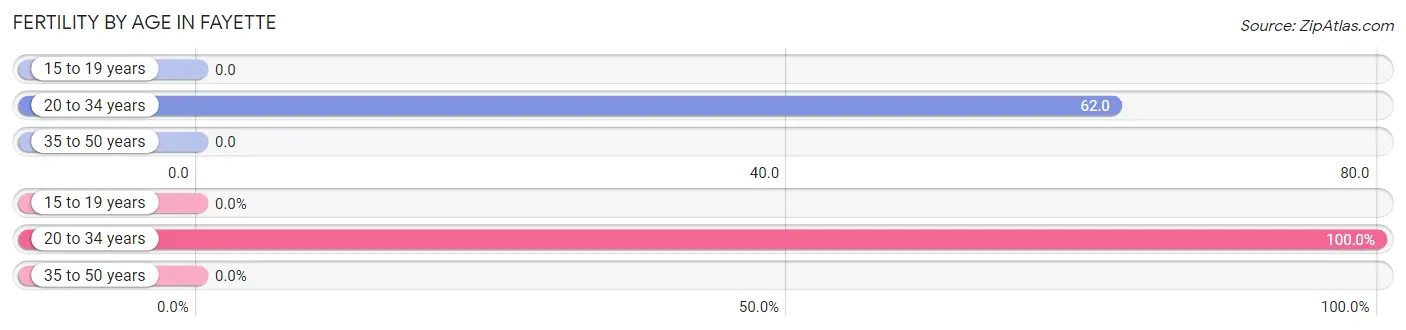
| Age Bracket | Women with Births | Births / 1,000 Women |
| 15 to 19 years | 0 (0.0%) | 0.0 |
| 20 to 34 years | 29 (100.0%) | 62.0 |
| 35 to 50 years | 0 (0.0%) | 0.0 |
| Total | 29 (100.0%) | 37.0 |
Fertility by Age by Marriage Status in Fayette
58.6% of women with births (29) in Fayette are married. The highest percentage of unmarried women with births falls into 20 to 34 years age bracket with 41.4% of them unmarried at the time of birth, while the lowest percentage of unmarried women with births belong to 20 to 34 years age bracket with 41.4% of them unmarried.
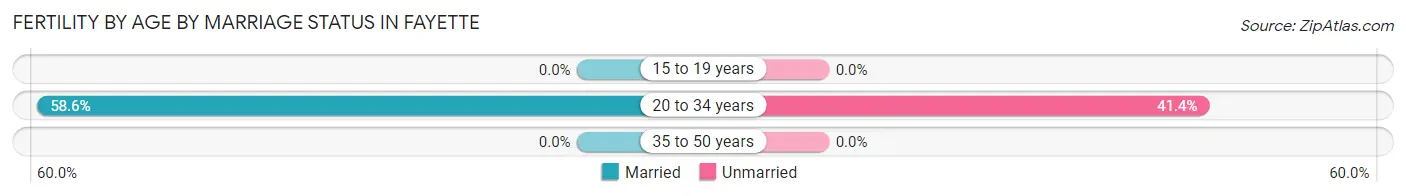
| Age Bracket | Married | Unmarried |
| 15 to 19 years | 0 (0.0%) | 0 (0.0%) |
| 20 to 34 years | 17 (58.6%) | 12 (41.4%) |
| 35 to 50 years | 0 (0.0%) | 0 (0.0%) |
| Total | 17 (58.6%) | 12 (41.4%) |
Fertility by Education in Fayette
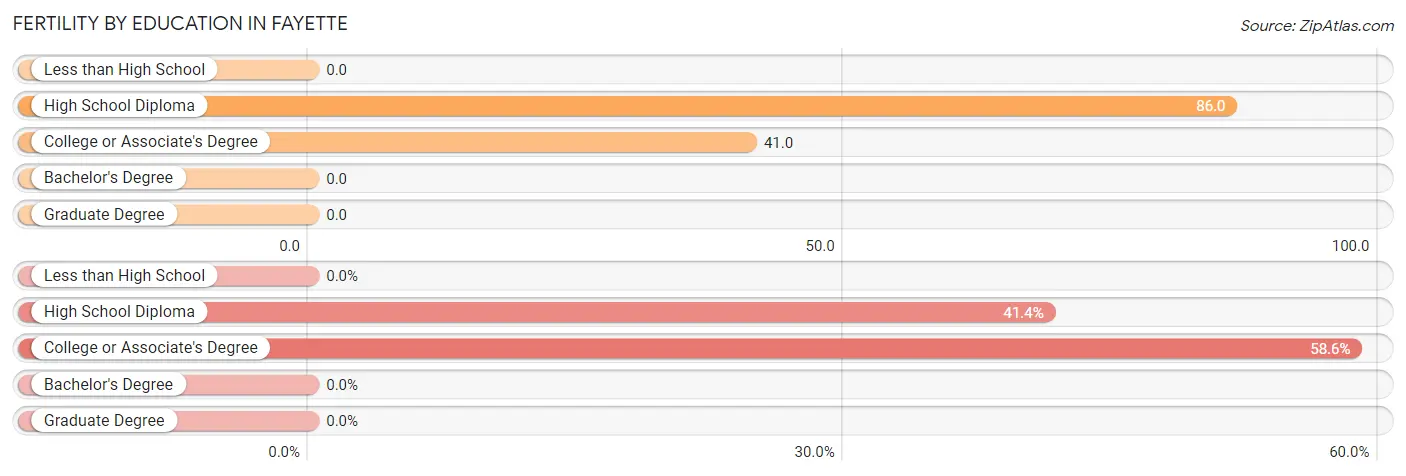
| Educational Attainment | Women with Births | Births / 1,000 Women |
| Less than High School | 0 (0.0%) | 0.0 |
| High School Diploma | 12 (41.4%) | 86.0 |
| College or Associate's Degree | 17 (58.6%) | 41.0 |
| Bachelor's Degree | 0 (0.0%) | 0.0 |
| Graduate Degree | 0 (0.0%) | 0.0 |
| Total | 29 (100.0%) | 37.0 |
Fertility by Education by Marriage Status in Fayette
41.4% of women with births in Fayette are unmarried. Women with the educational attainment of college or associate's degree are most likely to be married with 100.0% of them married at childbirth, while women with the educational attainment of high school diploma are least likely to be married with 100.0% of them unmarried at childbirth.
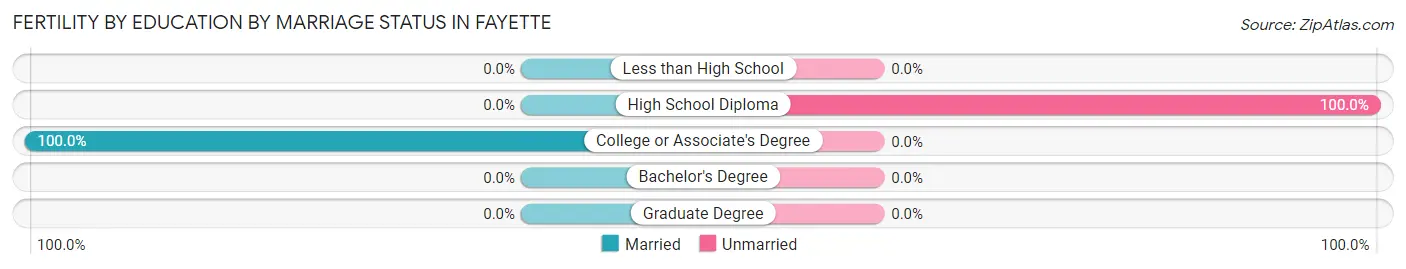
| Educational Attainment | Married | Unmarried |
| Less than High School | 0 (0.0%) | 0 (0.0%) |
| High School Diploma | 0 (0.0%) | 12 (100.0%) |
| College or Associate's Degree | 17 (100.0%) | 0 (0.0%) |
| Bachelor's Degree | 0 (0.0%) | 0 (0.0%) |
| Graduate Degree | 0 (0.0%) | 0 (0.0%) |
| Total | 17 (58.6%) | 12 (41.4%) |
Employment Characteristics in Fayette
Employment by Class of Employer in Fayette
Among the 1,380 employed individuals in Fayette, private company employees (1,074 | 77.8%), not-for-profit organizations (80 | 5.8%), and self-employed (incorporated) (75 | 5.4%) make up the most common classes of employment.
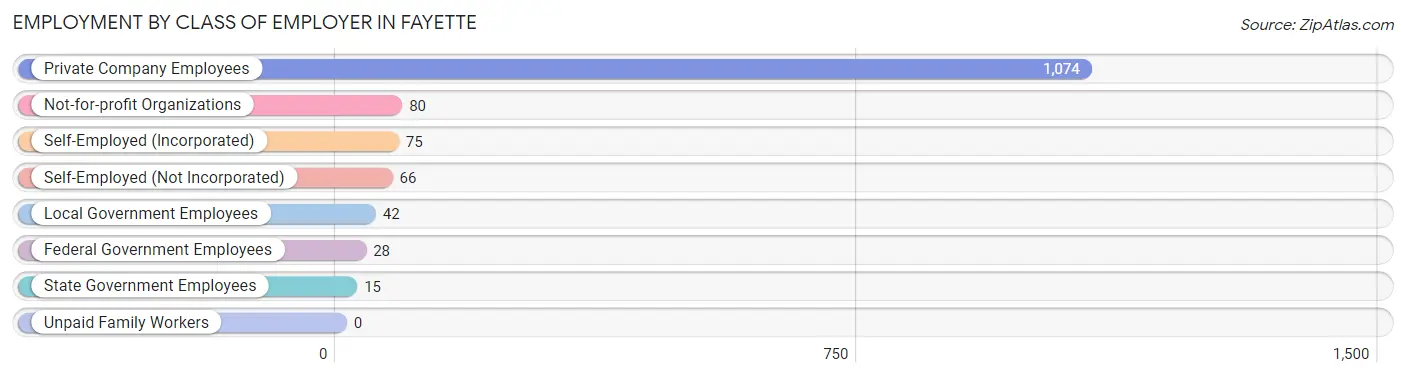
| Employer Class | # Employees | % Employees |
| Private Company Employees | 1,074 | 77.8% |
| Self-Employed (Incorporated) | 75 | 5.4% |
| Self-Employed (Not Incorporated) | 66 | 4.8% |
| Not-for-profit Organizations | 80 | 5.8% |
| Local Government Employees | 42 | 3.0% |
| State Government Employees | 15 | 1.1% |
| Federal Government Employees | 28 | 2.0% |
| Unpaid Family Workers | 0 | 0.0% |
| Total | 1,380 | 100.0% |
Employment Status by Age in Fayette
According to the labor force statistics for Fayette, out of the total population over 16 years of age (3,508), 47.3% or 1,659 individuals are in the labor force, with 16.6% or 275 of them unemployed. The age group with the highest labor force participation rate is 30 to 34 years, with 100.0% or 132 individuals in the labor force. Within the labor force, the 25 to 29 years age range has the highest percentage of unemployed individuals, with 34.4% or 99 of them being unemployed.
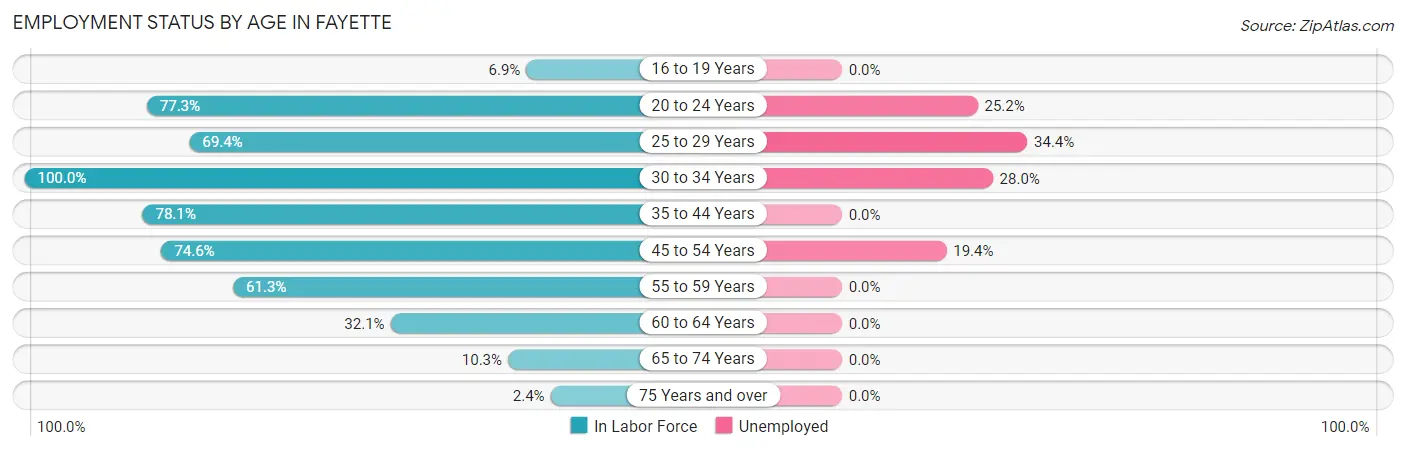
| Age Bracket | In Labor Force | Unemployed |
| 16 to 19 Years | 13 (6.9%) | 0 (0.0%) |
| 20 to 24 Years | 242 (77.3%) | 61 (25.2%) |
| 25 to 29 Years | 288 (69.4%) | 99 (34.4%) |
| 30 to 34 Years | 132 (100.0%) | 37 (28.0%) |
| 35 to 44 Years | 275 (78.1%) | 0 (0.0%) |
| 45 to 54 Years | 403 (74.6%) | 78 (19.4%) |
| 55 to 59 Years | 133 (61.3%) | 0 (0.0%) |
| 60 to 64 Years | 110 (32.1%) | 0 (0.0%) |
| 65 to 74 Years | 49 (10.3%) | 0 (0.0%) |
| 75 Years and over | 13 (2.4%) | 0 (0.0%) |
| Total | 1,659 (47.3%) | 275 (16.6%) |
Employment Status by Educational Attainment in Fayette
According to labor force statistics for Fayette, 67.1% of individuals (1,341) out of the total population between 25 and 64 years of age (1,999) are in the labor force, with 16.0% or 215 of them being unemployed. The group with the highest labor force participation rate are those with the educational attainment of bachelor's degree or higher, with 81.2% or 246 individuals in the labor force. Within the labor force, individuals with less than high school education have the highest percentage of unemployment, with 20.3% or 28 of them being unemployed.
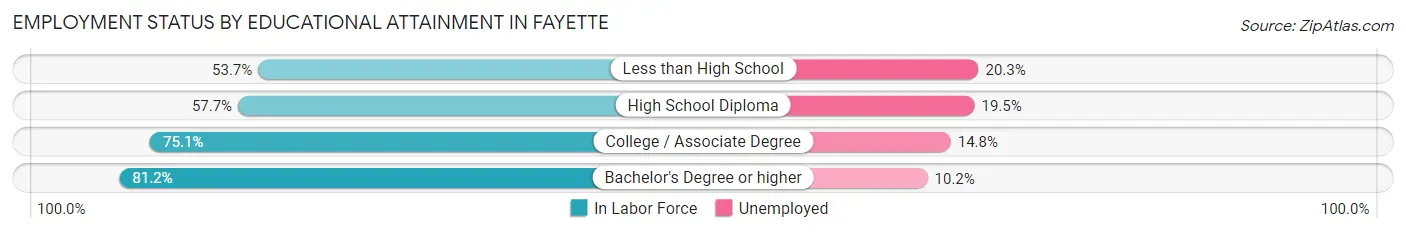
| Educational Attainment | In Labor Force | Unemployed |
| Less than High School | 138 (53.7%) | 52 (20.3%) |
| High School Diploma | 410 (57.7%) | 139 (19.5%) |
| College / Associate Degree | 547 (75.1%) | 108 (14.8%) |
| Bachelor's Degree or higher | 246 (81.2%) | 31 (10.2%) |
| Total | 1,341 (67.1%) | 320 (16.0%) |
Employment Occupations by Sex in Fayette
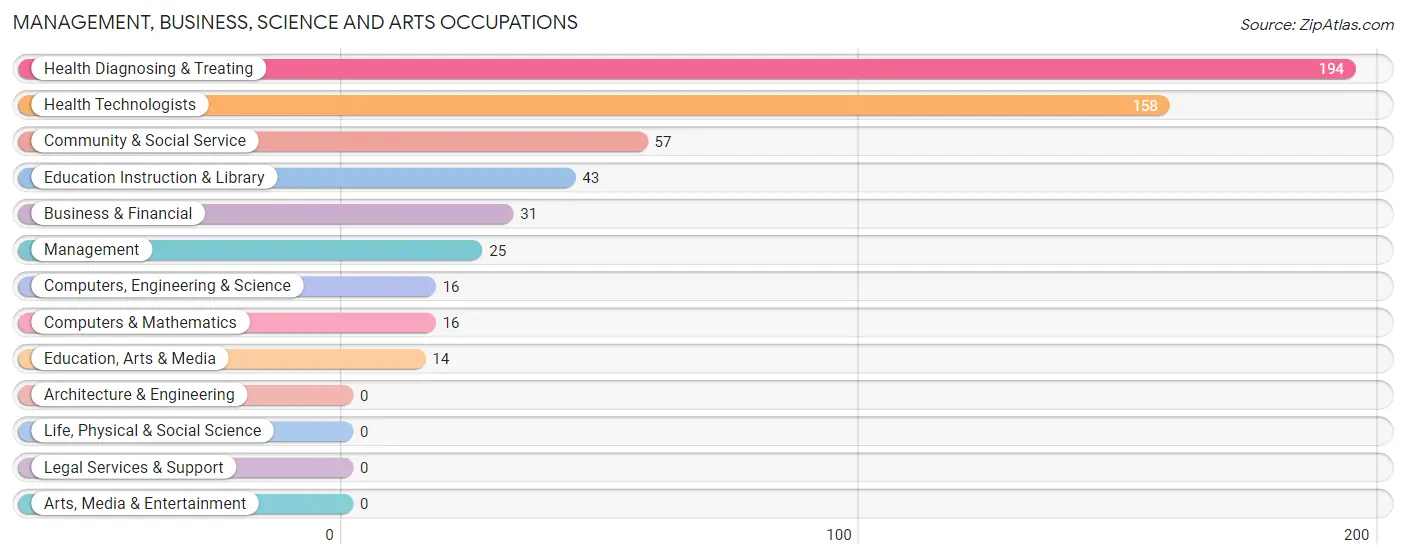
Management, Business, Science and Arts Occupations
The most common Management, Business, Science and Arts occupations in Fayette are Health Diagnosing & Treating (194 | 14.0%), Health Technologists (158 | 11.4%), Community & Social Service (57 | 4.1%), Education Instruction & Library (43 | 3.1%), and Business & Financial (31 | 2.2%).
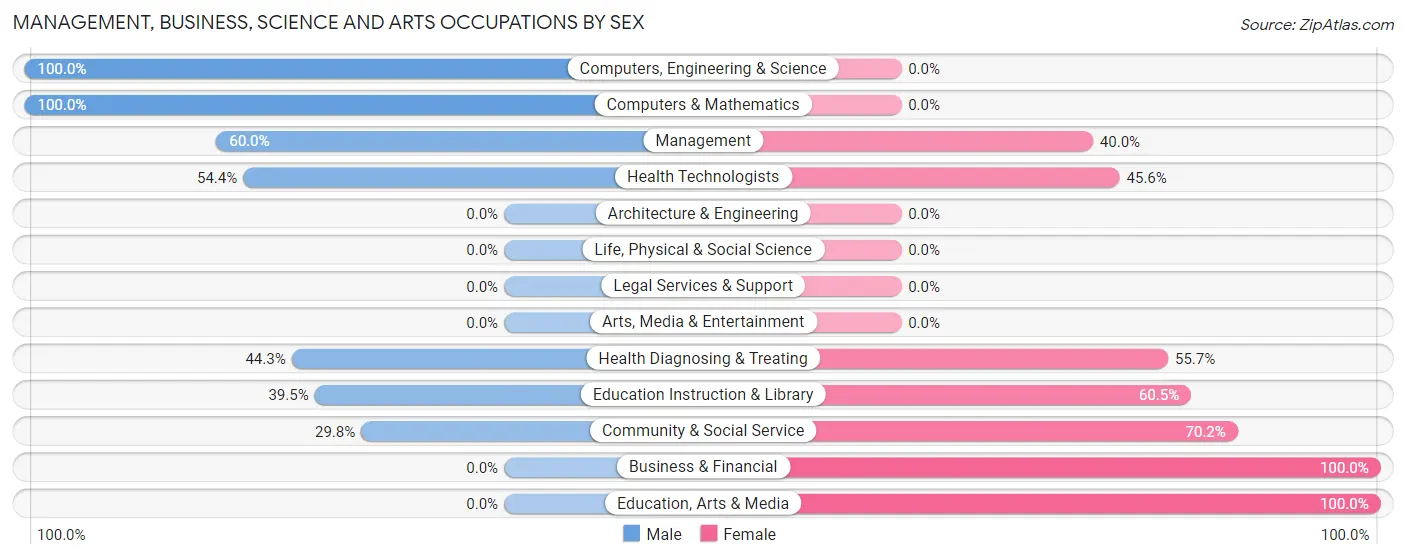
Management, Business, Science and Arts Occupations by Sex
Within the Management, Business, Science and Arts occupations in Fayette, the most male-oriented occupations are Computers, Engineering & Science (100.0%), Computers & Mathematics (100.0%), and Management (60.0%), while the most female-oriented occupations are Business & Financial (100.0%), Education, Arts & Media (100.0%), and Community & Social Service (70.2%).
| Occupation | Male | Female |
| Management | 15 (60.0%) | 10 (40.0%) |
| Business & Financial | 0 (0.0%) | 31 (100.0%) |
| Computers, Engineering & Science | 16 (100.0%) | 0 (0.0%) |
| Computers & Mathematics | 16 (100.0%) | 0 (0.0%) |
| Architecture & Engineering | 0 (0.0%) | 0 (0.0%) |
| Life, Physical & Social Science | 0 (0.0%) | 0 (0.0%) |
| Community & Social Service | 17 (29.8%) | 40 (70.2%) |
| Education, Arts & Media | 0 (0.0%) | 14 (100.0%) |
| Legal Services & Support | 0 (0.0%) | 0 (0.0%) |
| Education Instruction & Library | 17 (39.5%) | 26 (60.5%) |
| Arts, Media & Entertainment | 0 (0.0%) | 0 (0.0%) |
| Health Diagnosing & Treating | 86 (44.3%) | 108 (55.7%) |
| Health Technologists | 86 (54.4%) | 72 (45.6%) |
| Total (Category) | 134 (41.5%) | 189 (58.5%) |
| Total (Overall) | 784 (56.7%) | 599 (43.3%) |
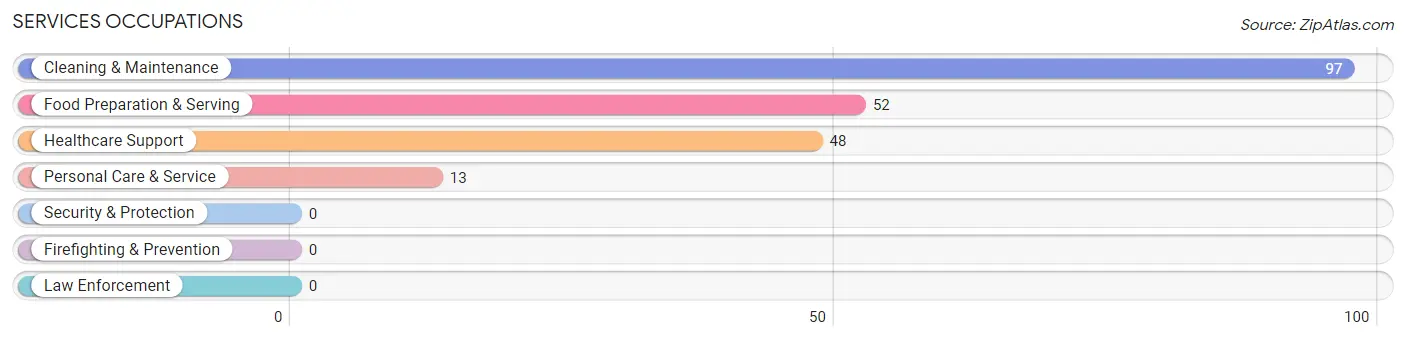
Services Occupations
The most common Services occupations in Fayette are Cleaning & Maintenance (97 | 7.0%), Food Preparation & Serving (52 | 3.8%), Healthcare Support (48 | 3.5%), and Personal Care & Service (13 | 0.9%).
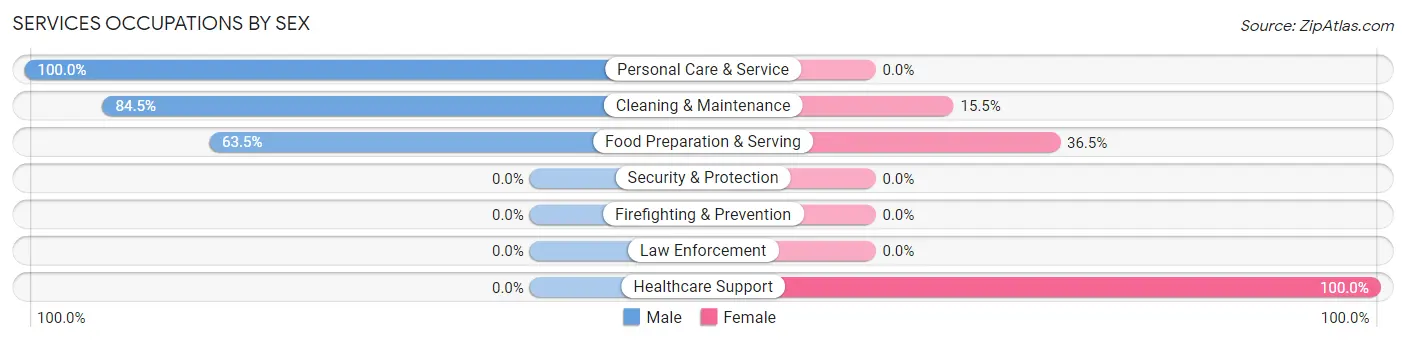
Services Occupations by Sex
Within the Services occupations in Fayette, the most male-oriented occupations are Personal Care & Service (100.0%), Cleaning & Maintenance (84.5%), and Food Preparation & Serving (63.5%), while the most female-oriented occupations are Healthcare Support (100.0%), Food Preparation & Serving (36.5%), and Cleaning & Maintenance (15.5%).
| Occupation | Male | Female |
| Healthcare Support | 0 (0.0%) | 48 (100.0%) |
| Security & Protection | 0 (0.0%) | 0 (0.0%) |
| Firefighting & Prevention | 0 (0.0%) | 0 (0.0%) |
| Law Enforcement | 0 (0.0%) | 0 (0.0%) |
| Food Preparation & Serving | 33 (63.5%) | 19 (36.5%) |
| Cleaning & Maintenance | 82 (84.5%) | 15 (15.5%) |
| Personal Care & Service | 13 (100.0%) | 0 (0.0%) |
| Total (Category) | 128 (61.0%) | 82 (39.1%) |
| Total (Overall) | 784 (56.7%) | 599 (43.3%) |
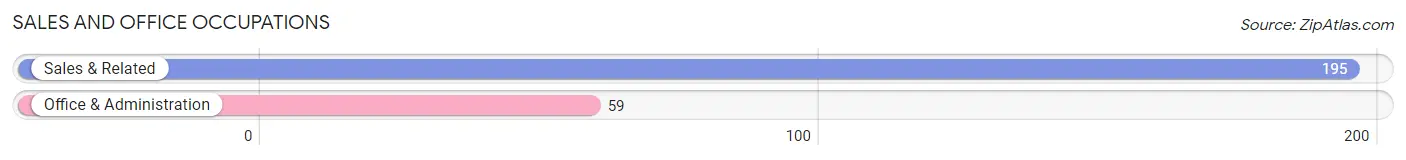
Sales and Office Occupations
The most common Sales and Office occupations in Fayette are Sales & Related (195 | 14.1%), and Office & Administration (59 | 4.3%).
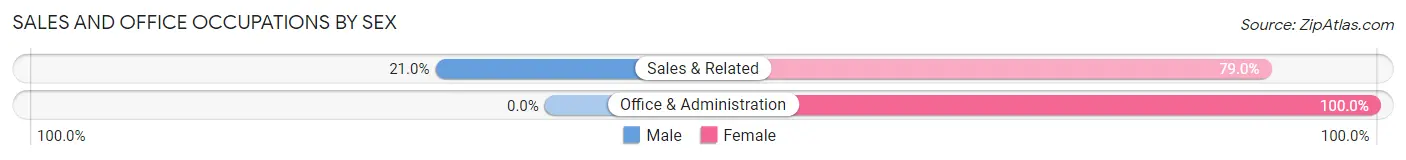
Sales and Office Occupations by Sex
| Occupation | Male | Female |
| Sales & Related | 41 (21.0%) | 154 (79.0%) |
| Office & Administration | 0 (0.0%) | 59 (100.0%) |
| Total (Category) | 41 (16.1%) | 213 (83.9%) |
| Total (Overall) | 784 (56.7%) | 599 (43.3%) |
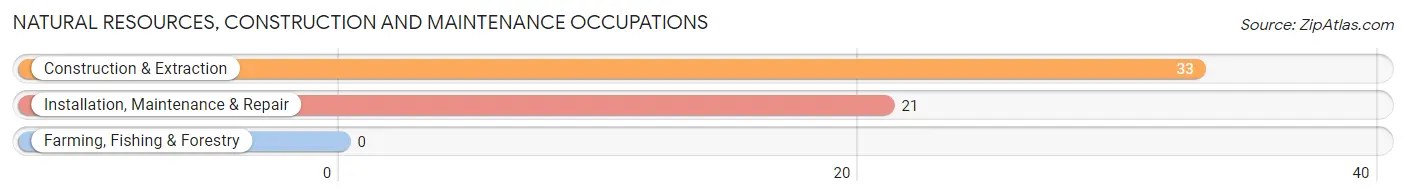
Natural Resources, Construction and Maintenance Occupations
The most common Natural Resources, Construction and Maintenance occupations in Fayette are Construction & Extraction (33 | 2.4%), and Installation, Maintenance & Repair (21 | 1.5%).
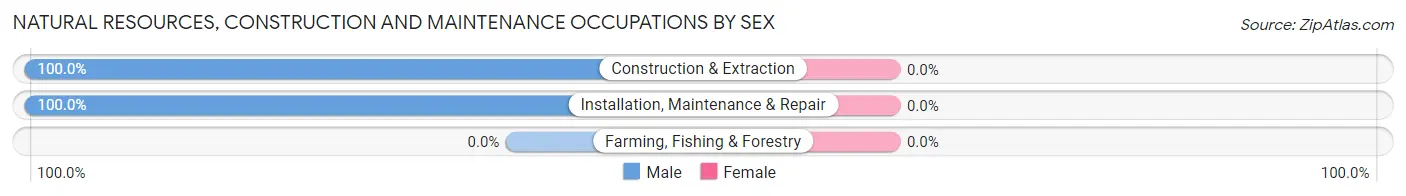
Natural Resources, Construction and Maintenance Occupations by Sex
| Occupation | Male | Female |
| Farming, Fishing & Forestry | 0 (0.0%) | 0 (0.0%) |
| Construction & Extraction | 33 (100.0%) | 0 (0.0%) |
| Installation, Maintenance & Repair | 21 (100.0%) | 0 (0.0%) |
| Total (Category) | 54 (100.0%) | 0 (0.0%) |
| Total (Overall) | 784 (56.7%) | 599 (43.3%) |
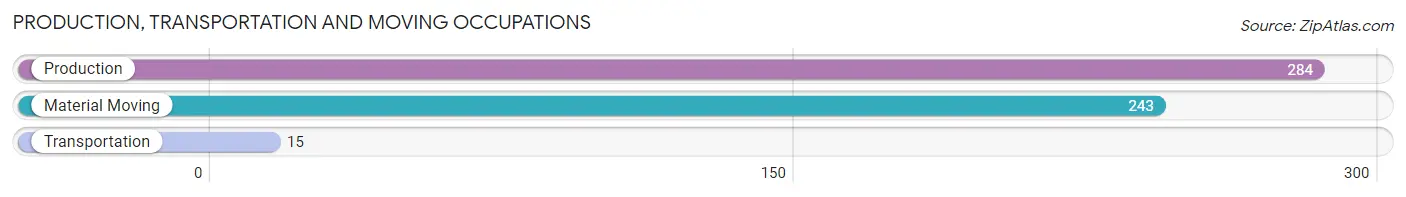
Production, Transportation and Moving Occupations
The most common Production, Transportation and Moving occupations in Fayette are Production (284 | 20.5%), Material Moving (243 | 17.6%), and Transportation (15 | 1.1%).
Production, Transportation and Moving Occupations by Sex
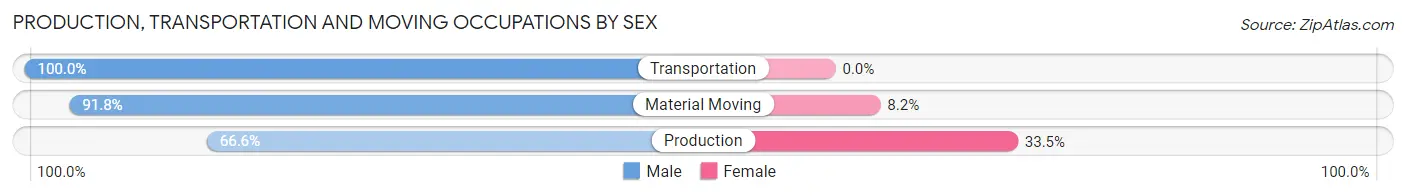
| Occupation | Male | Female |
| Production | 189 (66.5%) | 95 (33.5%) |
| Transportation | 15 (100.0%) | 0 (0.0%) |
| Material Moving | 223 (91.8%) | 20 (8.2%) |
| Total (Category) | 427 (78.8%) | 115 (21.2%) |
| Total (Overall) | 784 (56.7%) | 599 (43.3%) |
Employment Industries by Sex in Fayette
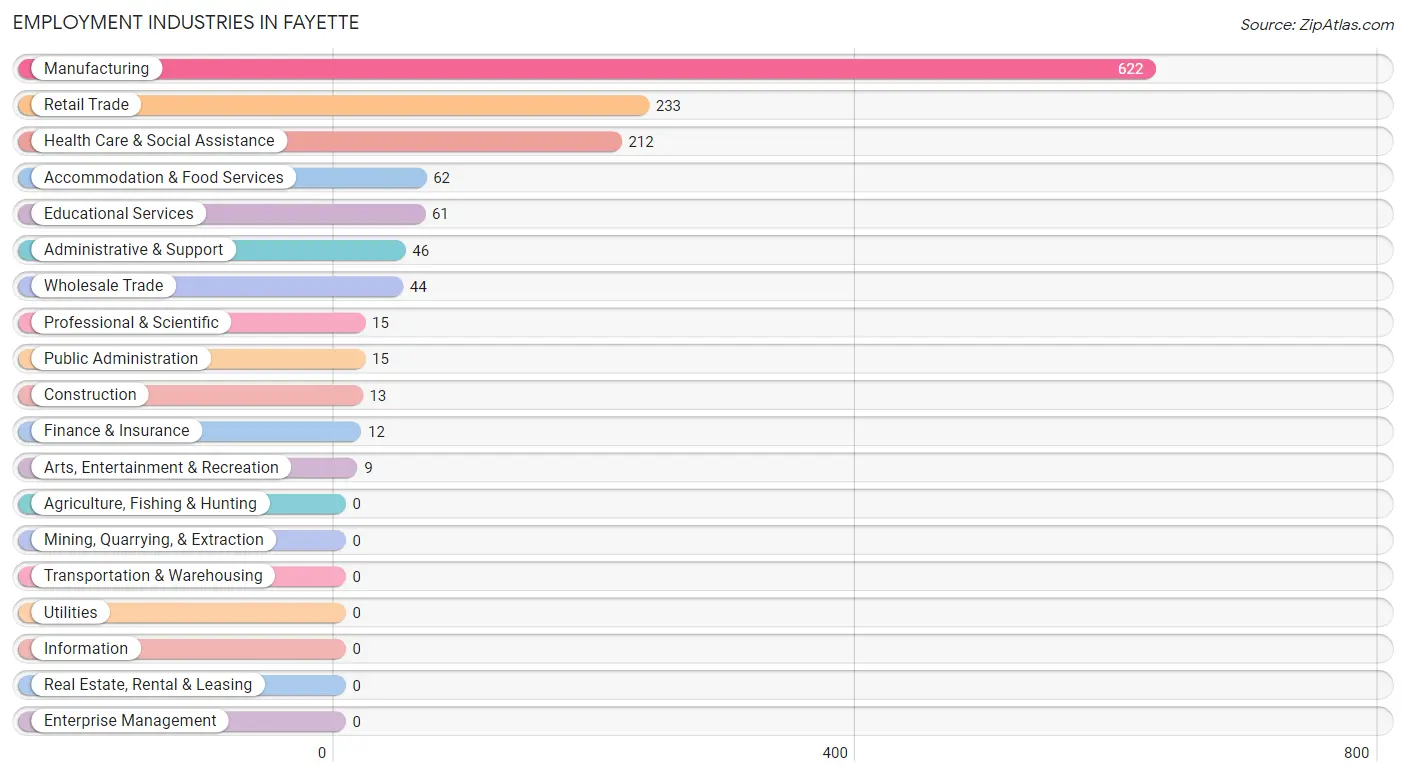
Employment Industries in Fayette
The major employment industries in Fayette include Manufacturing (622 | 45.0%), Retail Trade (233 | 16.9%), Health Care & Social Assistance (212 | 15.3%), Accommodation & Food Services (62 | 4.5%), and Educational Services (61 | 4.4%).
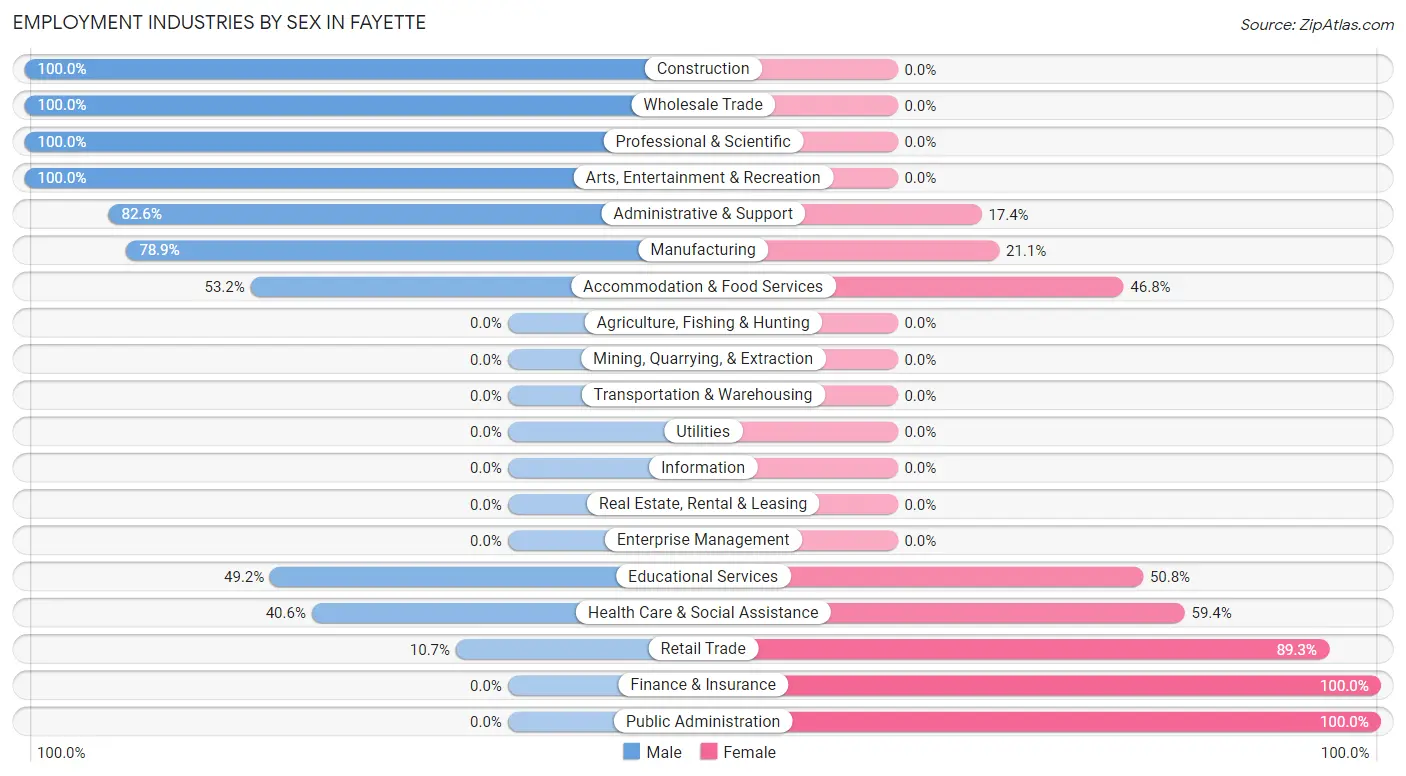
Employment Industries by Sex in Fayette
The Fayette industries that see more men than women are Construction (100.0%), Wholesale Trade (100.0%), and Professional & Scientific (100.0%), whereas the industries that tend to have a higher number of women are Finance & Insurance (100.0%), Public Administration (100.0%), and Retail Trade (89.3%).
| Industry | Male | Female |
| Agriculture, Fishing & Hunting | 0 (0.0%) | 0 (0.0%) |
| Mining, Quarrying, & Extraction | 0 (0.0%) | 0 (0.0%) |
| Construction | 13 (100.0%) | 0 (0.0%) |
| Manufacturing | 491 (78.9%) | 131 (21.1%) |
| Wholesale Trade | 44 (100.0%) | 0 (0.0%) |
| Retail Trade | 25 (10.7%) | 208 (89.3%) |
| Transportation & Warehousing | 0 (0.0%) | 0 (0.0%) |
| Utilities | 0 (0.0%) | 0 (0.0%) |
| Information | 0 (0.0%) | 0 (0.0%) |
| Finance & Insurance | 0 (0.0%) | 12 (100.0%) |
| Real Estate, Rental & Leasing | 0 (0.0%) | 0 (0.0%) |
| Professional & Scientific | 15 (100.0%) | 0 (0.0%) |
| Enterprise Management | 0 (0.0%) | 0 (0.0%) |
| Administrative & Support | 38 (82.6%) | 8 (17.4%) |
| Educational Services | 30 (49.2%) | 31 (50.8%) |
| Health Care & Social Assistance | 86 (40.6%) | 126 (59.4%) |
| Arts, Entertainment & Recreation | 9 (100.0%) | 0 (0.0%) |
| Accommodation & Food Services | 33 (53.2%) | 29 (46.8%) |
| Public Administration | 0 (0.0%) | 15 (100.0%) |
| Total | 784 (56.7%) | 599 (43.3%) |
Education in Fayette
School Enrollment in Fayette
The most common levels of schooling among the 946 students in Fayette are elementary school (308 | 32.6%), college / undergraduate (243 | 25.7%), and nursery / preschool (147 | 15.5%).
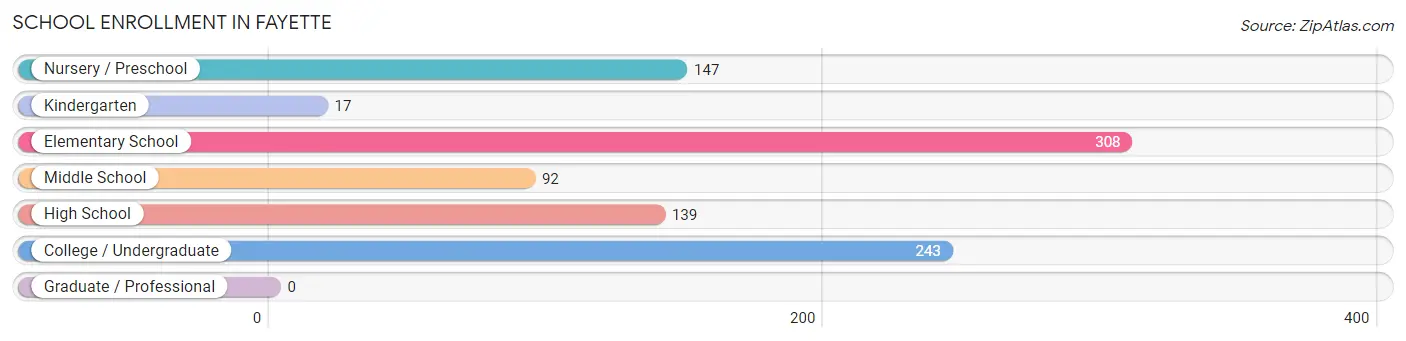
| School Level | # Students | % Students |
| Nursery / Preschool | 147 | 15.5% |
| Kindergarten | 17 | 1.8% |
| Elementary School | 308 | 32.6% |
| Middle School | 92 | 9.7% |
| High School | 139 | 14.7% |
| College / Undergraduate | 243 | 25.7% |
| Graduate / Professional | 0 | 0.0% |
| Total | 946 | 100.0% |
School Enrollment by Age by Funding Source in Fayette
Out of a total of 946 students who are enrolled in schools in Fayette, 117 (12.4%) attend a private institution, while the remaining 829 (87.6%) are enrolled in public schools. The age group of 18 to 19 year olds has the highest likelihood of being enrolled in private schools, with 12 (48.0% in the age bracket) enrolled. Conversely, the age group of 10 to 14 year olds has the lowest likelihood of being enrolled in a private school, with 157 (100.0% in the age bracket) attending a public institution.
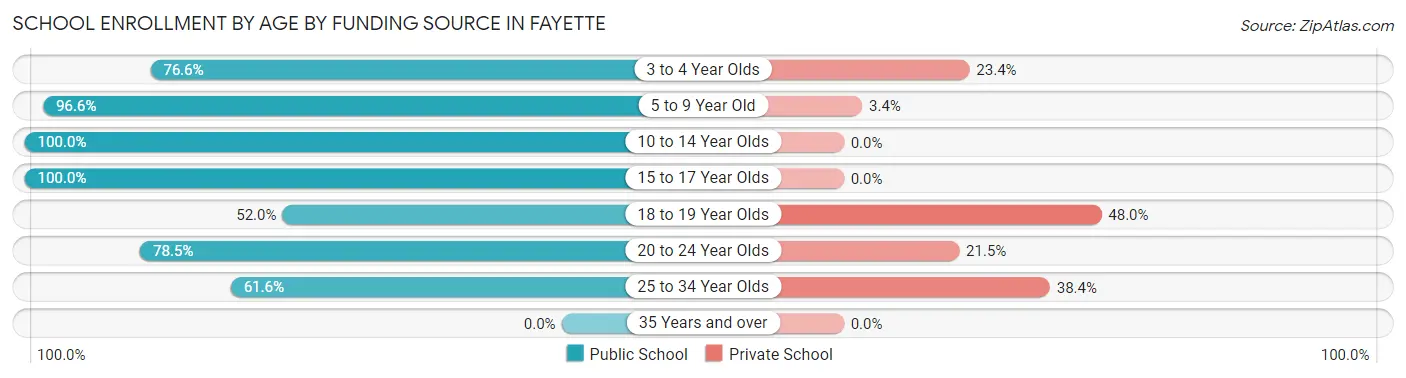
| Age Bracket | Public School | Private School |
| 3 to 4 Year Olds | 85 (76.6%) | 26 (23.4%) |
| 5 to 9 Year Old | 310 (96.6%) | 11 (3.4%) |
| 10 to 14 Year Olds | 157 (100.0%) | 0 (0.0%) |
| 15 to 17 Year Olds | 114 (100.0%) | 0 (0.0%) |
| 18 to 19 Year Olds | 13 (52.0%) | 12 (48.0%) |
| 20 to 24 Year Olds | 73 (78.5%) | 20 (21.5%) |
| 25 to 34 Year Olds | 77 (61.6%) | 48 (38.4%) |
| 35 Years and over | 0 (0.0%) | 0 (0.0%) |
| Total | 829 (87.6%) | 117 (12.4%) |
Educational Attainment by Field of Study in Fayette
Business (87 | 17.4%), physical & health sciences (86 | 17.2%), education (68 | 13.6%), bio, nature & agricultural (60 | 12.0%), and social sciences (53 | 10.6%) are the most common fields of study among 501 individuals in Fayette who have obtained a bachelor's degree or higher.
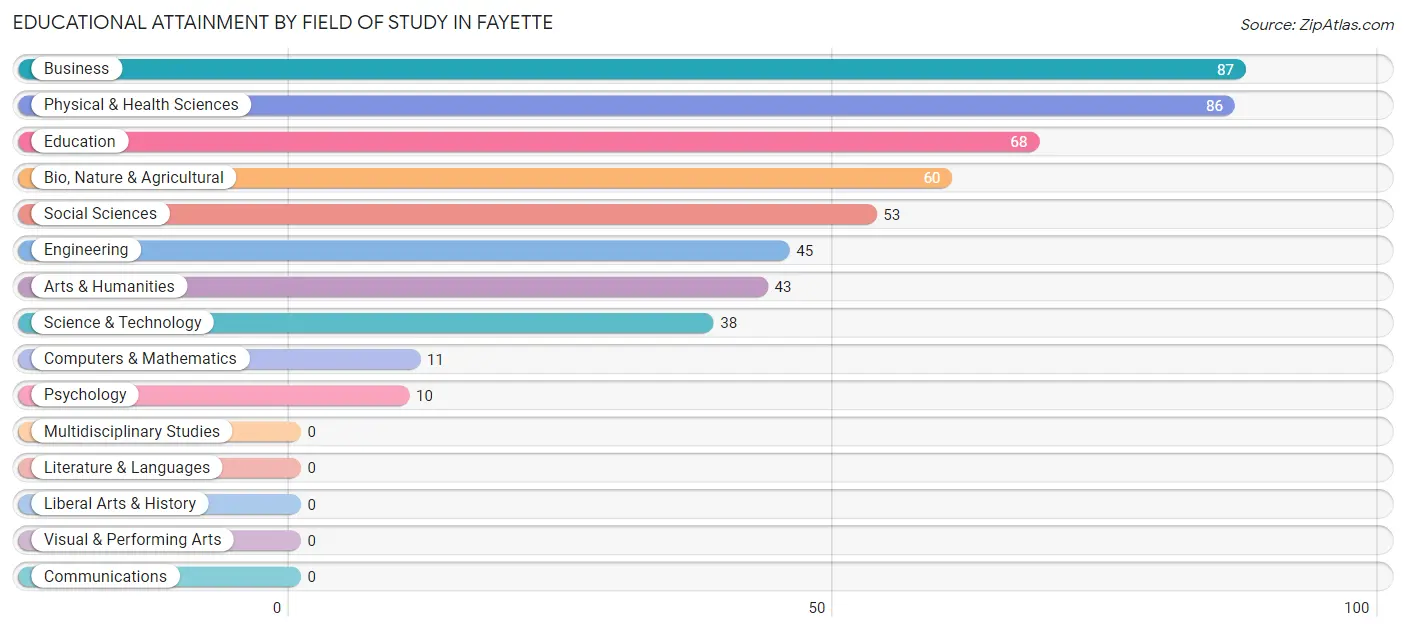
| Field of Study | # Graduates | % Graduates |
| Computers & Mathematics | 11 | 2.2% |
| Bio, Nature & Agricultural | 60 | 12.0% |
| Physical & Health Sciences | 86 | 17.2% |
| Psychology | 10 | 2.0% |
| Social Sciences | 53 | 10.6% |
| Engineering | 45 | 9.0% |
| Multidisciplinary Studies | 0 | 0.0% |
| Science & Technology | 38 | 7.6% |
| Business | 87 | 17.4% |
| Education | 68 | 13.6% |
| Literature & Languages | 0 | 0.0% |
| Liberal Arts & History | 0 | 0.0% |
| Visual & Performing Arts | 0 | 0.0% |
| Communications | 0 | 0.0% |
| Arts & Humanities | 43 | 8.6% |
| Total | 501 | 100.0% |
Transportation & Commute in Fayette
Vehicle Availability by Sex in Fayette
The most prevalent vehicle ownership categories in Fayette are males with 2 vehicles (319, accounting for 41.4%) and females with 2 vehicles (271, making up 54.9%).
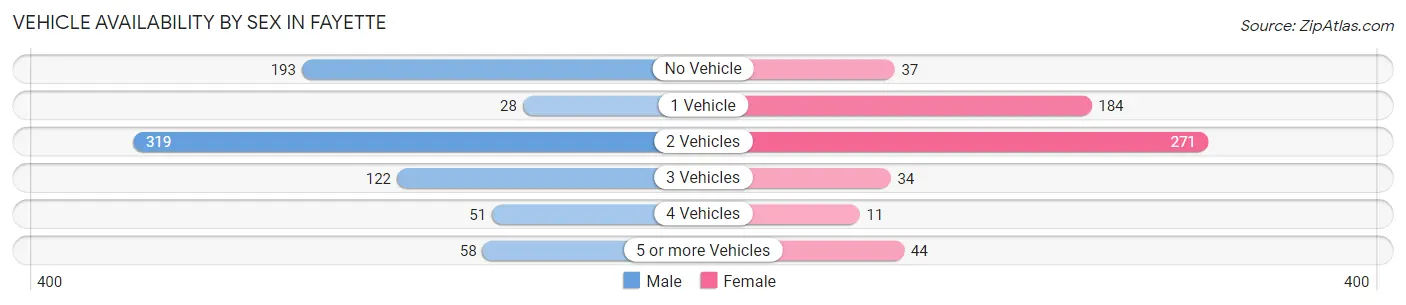
| Vehicles Available | Male | Female |
| No Vehicle | 193 (25.0%) | 37 (6.4%) |
| 1 Vehicle | 28 (3.6%) | 184 (31.7%) |
| 2 Vehicles | 319 (41.4%) | 271 (46.6%) |
| 3 Vehicles | 122 (15.8%) | 34 (5.9%) |
| 4 Vehicles | 51 (6.6%) | 11 (1.9%) |
| 5 or more Vehicles | 58 (7.5%) | 44 (7.6%) |
| Total | 771 (100.0%) | 581 (100.0%) |
Commute Time in Fayette
The most frequently occuring commute durations in Fayette are 10 to 14 minutes (466 commuters, 34.1%), 5 to 9 minutes (304 commuters, 22.2%), and 60 to 89 minutes (165 commuters, 12.1%).
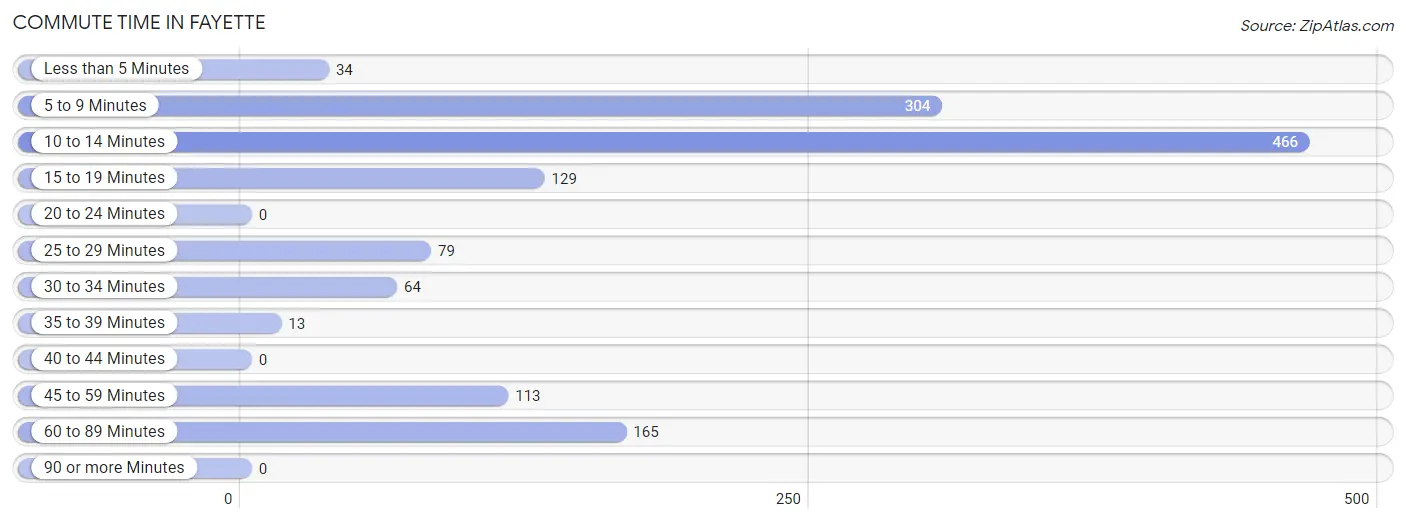
| Commute Time | # Commuters | % Commuters |
| Less than 5 Minutes | 34 | 2.5% |
| 5 to 9 Minutes | 304 | 22.2% |
| 10 to 14 Minutes | 466 | 34.1% |
| 15 to 19 Minutes | 129 | 9.4% |
| 20 to 24 Minutes | 0 | 0.0% |
| 25 to 29 Minutes | 79 | 5.8% |
| 30 to 34 Minutes | 64 | 4.7% |
| 35 to 39 Minutes | 13 | 0.9% |
| 40 to 44 Minutes | 0 | 0.0% |
| 45 to 59 Minutes | 113 | 8.3% |
| 60 to 89 Minutes | 165 | 12.1% |
| 90 or more Minutes | 0 | 0.0% |
Commute Time by Sex in Fayette
The most common commute times in Fayette are 10 to 14 minutes (278 commuters, 36.1%) for males and 10 to 14 minutes (188 commuters, 31.5%) for females.
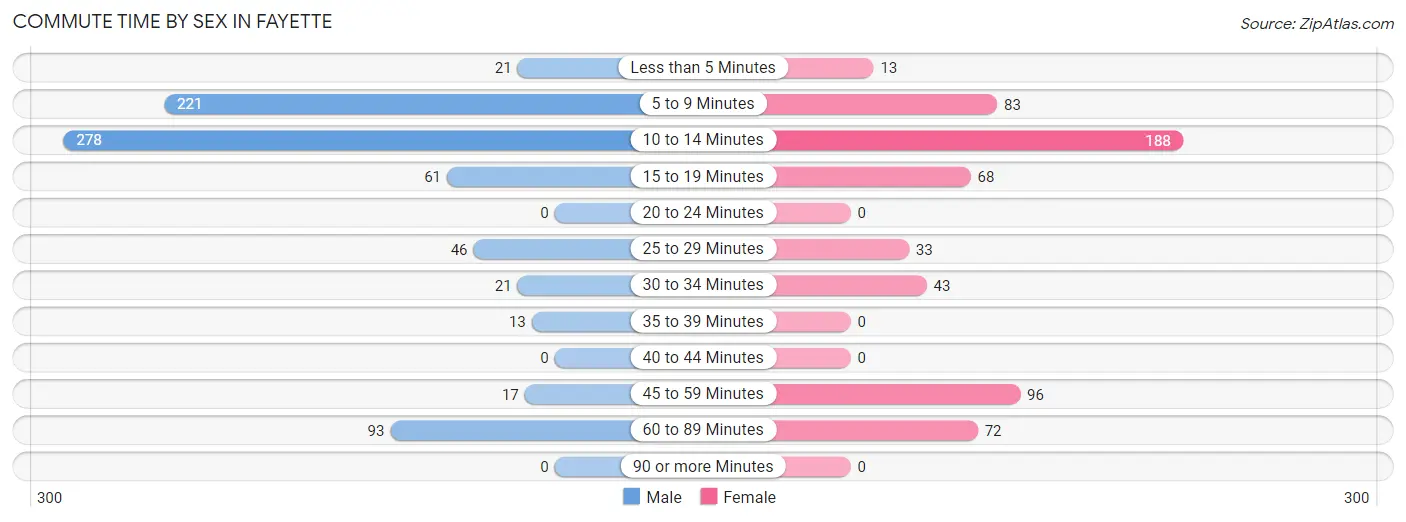
| Commute Time | Male | Female |
| Less than 5 Minutes | 21 (2.7%) | 13 (2.2%) |
| 5 to 9 Minutes | 221 (28.7%) | 83 (13.9%) |
| 10 to 14 Minutes | 278 (36.1%) | 188 (31.5%) |
| 15 to 19 Minutes | 61 (7.9%) | 68 (11.4%) |
| 20 to 24 Minutes | 0 (0.0%) | 0 (0.0%) |
| 25 to 29 Minutes | 46 (6.0%) | 33 (5.5%) |
| 30 to 34 Minutes | 21 (2.7%) | 43 (7.2%) |
| 35 to 39 Minutes | 13 (1.7%) | 0 (0.0%) |
| 40 to 44 Minutes | 0 (0.0%) | 0 (0.0%) |
| 45 to 59 Minutes | 17 (2.2%) | 96 (16.1%) |
| 60 to 89 Minutes | 93 (12.1%) | 72 (12.1%) |
| 90 or more Minutes | 0 (0.0%) | 0 (0.0%) |
Time of Departure to Work by Sex in Fayette
The most frequent times of departure to work in Fayette are 12:00 AM to 4:59 AM (203, 26.3%) for males and 7:00 AM to 7:29 AM (129, 21.6%) for females.
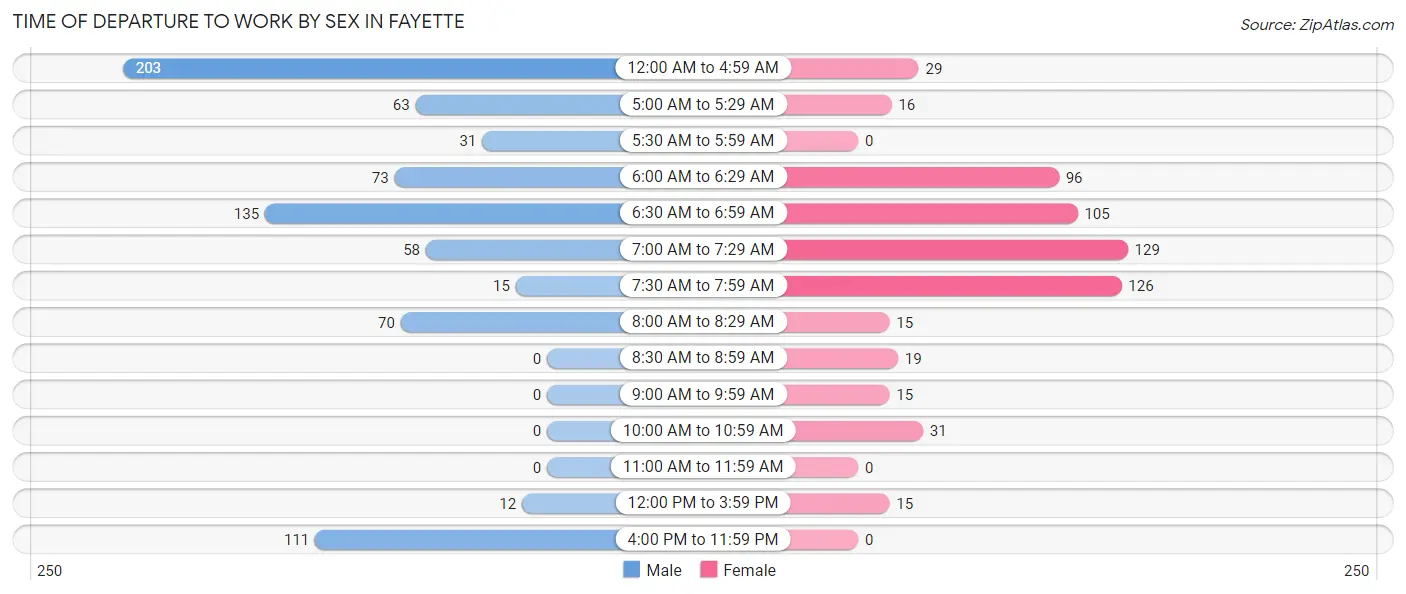
| Time of Departure | Male | Female |
| 12:00 AM to 4:59 AM | 203 (26.3%) | 29 (4.9%) |
| 5:00 AM to 5:29 AM | 63 (8.2%) | 16 (2.7%) |
| 5:30 AM to 5:59 AM | 31 (4.0%) | 0 (0.0%) |
| 6:00 AM to 6:29 AM | 73 (9.5%) | 96 (16.1%) |
| 6:30 AM to 6:59 AM | 135 (17.5%) | 105 (17.6%) |
| 7:00 AM to 7:29 AM | 58 (7.5%) | 129 (21.6%) |
| 7:30 AM to 7:59 AM | 15 (1.9%) | 126 (21.1%) |
| 8:00 AM to 8:29 AM | 70 (9.1%) | 15 (2.5%) |
| 8:30 AM to 8:59 AM | 0 (0.0%) | 19 (3.2%) |
| 9:00 AM to 9:59 AM | 0 (0.0%) | 15 (2.5%) |
| 10:00 AM to 10:59 AM | 0 (0.0%) | 31 (5.2%) |
| 11:00 AM to 11:59 AM | 0 (0.0%) | 0 (0.0%) |
| 12:00 PM to 3:59 PM | 12 (1.6%) | 15 (2.5%) |
| 4:00 PM to 11:59 PM | 111 (14.4%) | 0 (0.0%) |
| Total | 771 (100.0%) | 596 (100.0%) |
Housing Occupancy in Fayette
Occupancy by Ownership in Fayette
Of the total 1,589 dwellings in Fayette, owner-occupied units account for 808 (50.8%), while renter-occupied units make up 781 (49.1%).
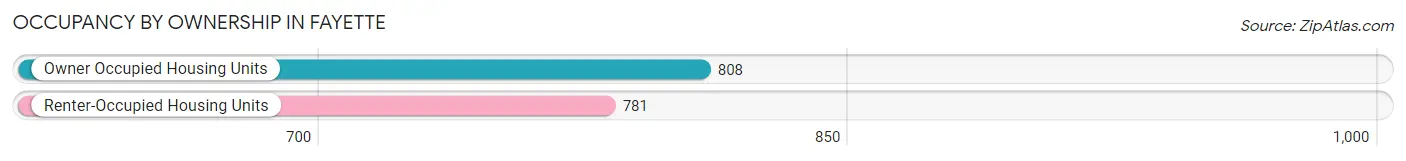
| Occupancy | # Housing Units | % Housing Units |
| Owner Occupied Housing Units | 808 | 50.8% |
| Renter-Occupied Housing Units | 781 | 49.1% |
| Total Occupied Housing Units | 1,589 | 100.0% |
Occupancy by Household Size in Fayette
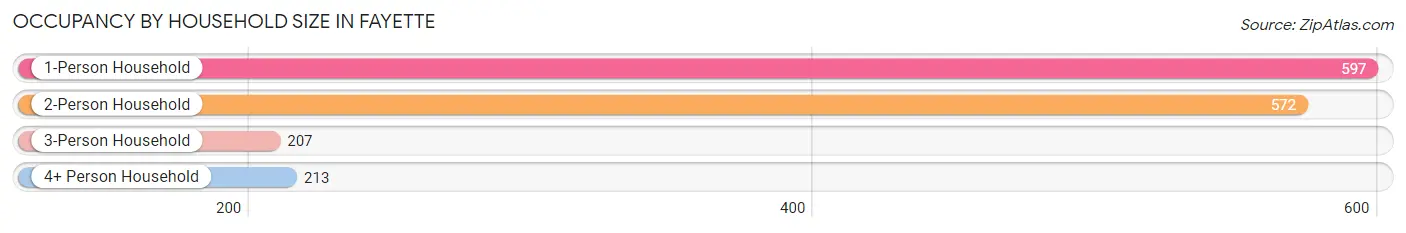
| Household Size | # Housing Units | % Housing Units |
| 1-Person Household | 597 | 37.6% |
| 2-Person Household | 572 | 36.0% |
| 3-Person Household | 207 | 13.0% |
| 4+ Person Household | 213 | 13.4% |
| Total Housing Units | 1,589 | 100.0% |
Occupancy by Ownership by Household Size in Fayette
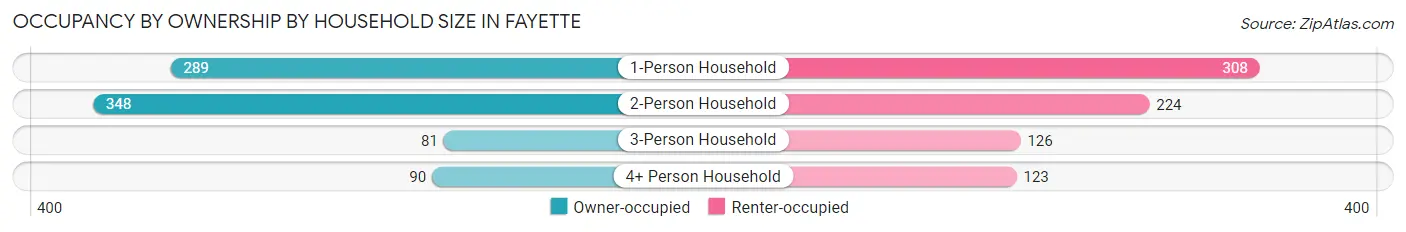
| Household Size | Owner-occupied | Renter-occupied |
| 1-Person Household | 289 (48.4%) | 308 (51.6%) |
| 2-Person Household | 348 (60.8%) | 224 (39.2%) |
| 3-Person Household | 81 (39.1%) | 126 (60.9%) |
| 4+ Person Household | 90 (42.2%) | 123 (57.8%) |
| Total Housing Units | 808 (50.8%) | 781 (49.1%) |
Occupancy by Educational Attainment in Fayette
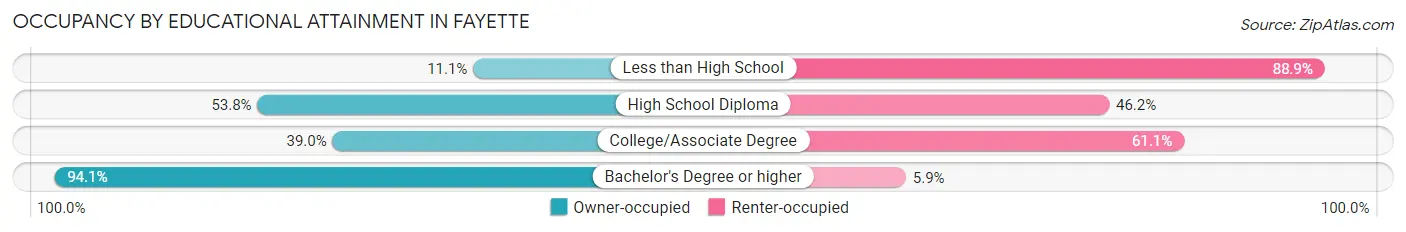
| Household Size | Owner-occupied | Renter-occupied |
| Less than High School | 23 (11.1%) | 185 (88.9%) |
| High School Diploma | 351 (53.8%) | 301 (46.2%) |
| College/Associate Degree | 178 (39.0%) | 279 (61.1%) |
| Bachelor's Degree or higher | 256 (94.1%) | 16 (5.9%) |
Occupancy by Age of Householder in Fayette
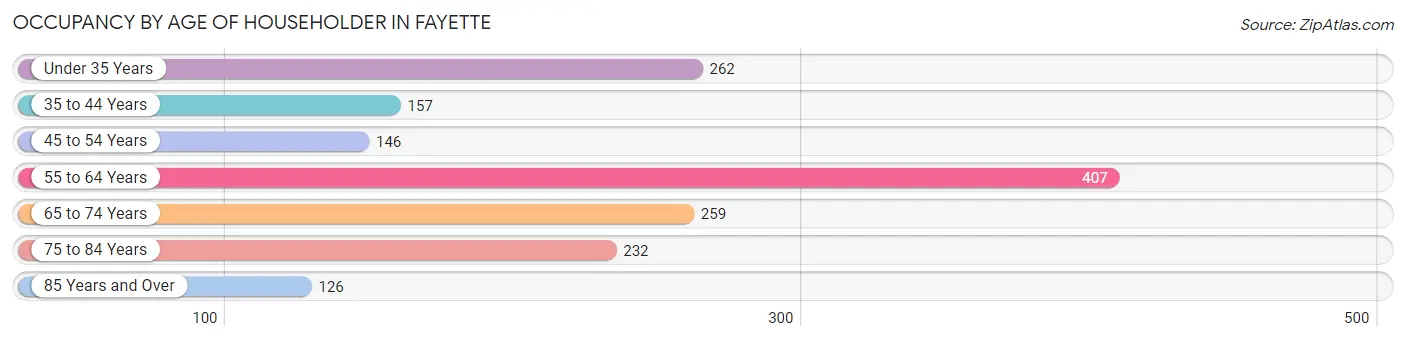
| Age Bracket | # Households | % Households |
| Under 35 Years | 262 | 16.5% |
| 35 to 44 Years | 157 | 9.9% |
| 45 to 54 Years | 146 | 9.2% |
| 55 to 64 Years | 407 | 25.6% |
| 65 to 74 Years | 259 | 16.3% |
| 75 to 84 Years | 232 | 14.6% |
| 85 Years and Over | 126 | 7.9% |
| Total | 1,589 | 100.0% |
Housing Finances in Fayette
Median Income by Occupancy in Fayette
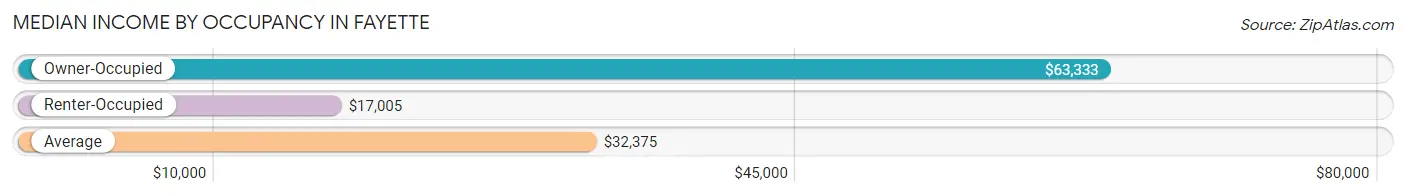
| Occupancy Type | # Households | Median Income |
| Owner-Occupied | 808 (50.8%) | $63,333 |
| Renter-Occupied | 781 (49.1%) | $17,005 |
| Average | 1,589 (100.0%) | $32,375 |
Occupancy by Householder Income Bracket in Fayette
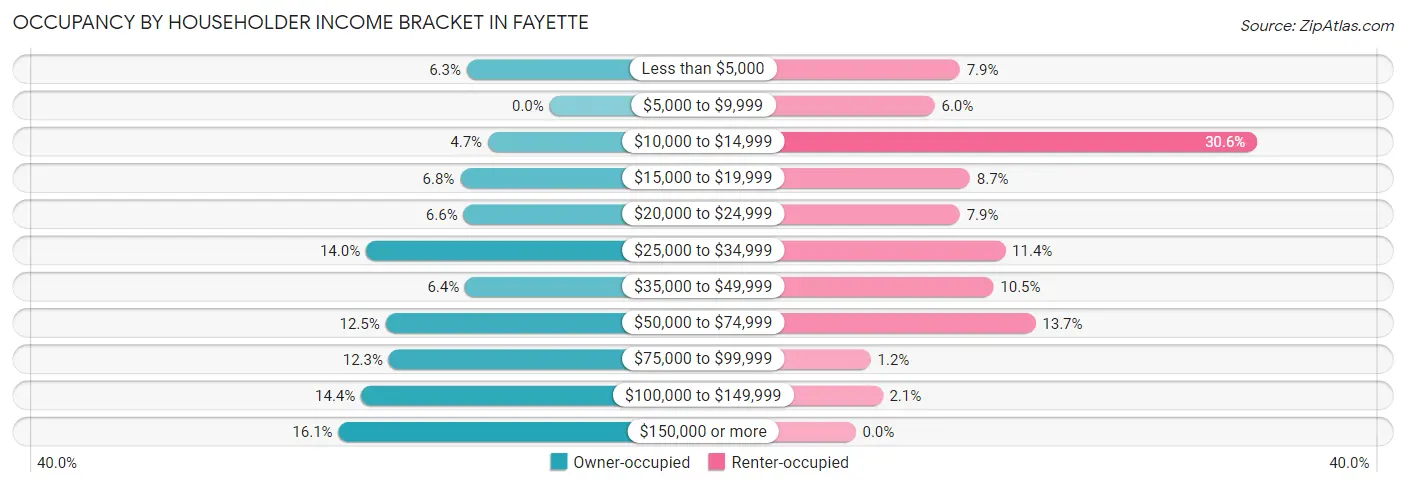
| Income Bracket | Owner-occupied | Renter-occupied |
| Less than $5,000 | 51 (6.3%) | 62 (7.9%) |
| $5,000 to $9,999 | 0 (0.0%) | 47 (6.0%) |
| $10,000 to $14,999 | 38 (4.7%) | 239 (30.6%) |
| $15,000 to $19,999 | 55 (6.8%) | 68 (8.7%) |
| $20,000 to $24,999 | 53 (6.6%) | 62 (7.9%) |
| $25,000 to $34,999 | 113 (14.0%) | 89 (11.4%) |
| $35,000 to $49,999 | 52 (6.4%) | 82 (10.5%) |
| $50,000 to $74,999 | 101 (12.5%) | 107 (13.7%) |
| $75,000 to $99,999 | 99 (12.2%) | 9 (1.1%) |
| $100,000 to $149,999 | 116 (14.4%) | 16 (2.1%) |
| $150,000 or more | 130 (16.1%) | 0 (0.0%) |
| Total | 808 (100.0%) | 781 (100.0%) |
Monthly Housing Cost Tiers in Fayette
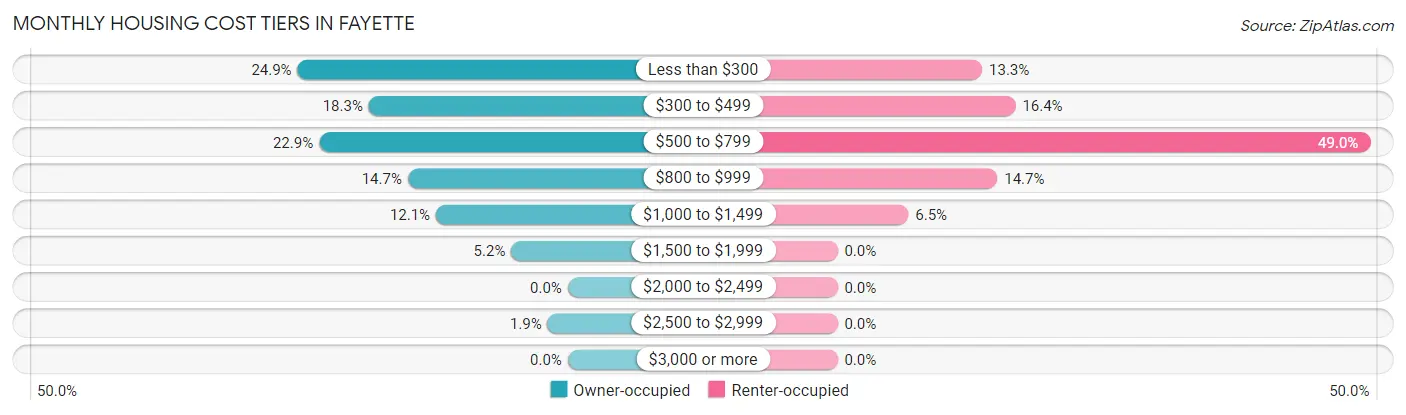
| Monthly Cost | Owner-occupied | Renter-occupied |
| Less than $300 | 201 (24.9%) | 104 (13.3%) |
| $300 to $499 | 148 (18.3%) | 128 (16.4%) |
| $500 to $799 | 185 (22.9%) | 383 (49.0%) |
| $800 to $999 | 119 (14.7%) | 115 (14.7%) |
| $1,000 to $1,499 | 98 (12.1%) | 51 (6.5%) |
| $1,500 to $1,999 | 42 (5.2%) | 0 (0.0%) |
| $2,000 to $2,499 | 0 (0.0%) | 0 (0.0%) |
| $2,500 to $2,999 | 15 (1.9%) | 0 (0.0%) |
| $3,000 or more | 0 (0.0%) | 0 (0.0%) |
| Total | 808 (100.0%) | 781 (100.0%) |
Physical Housing Characteristics in Fayette
Housing Structures in Fayette
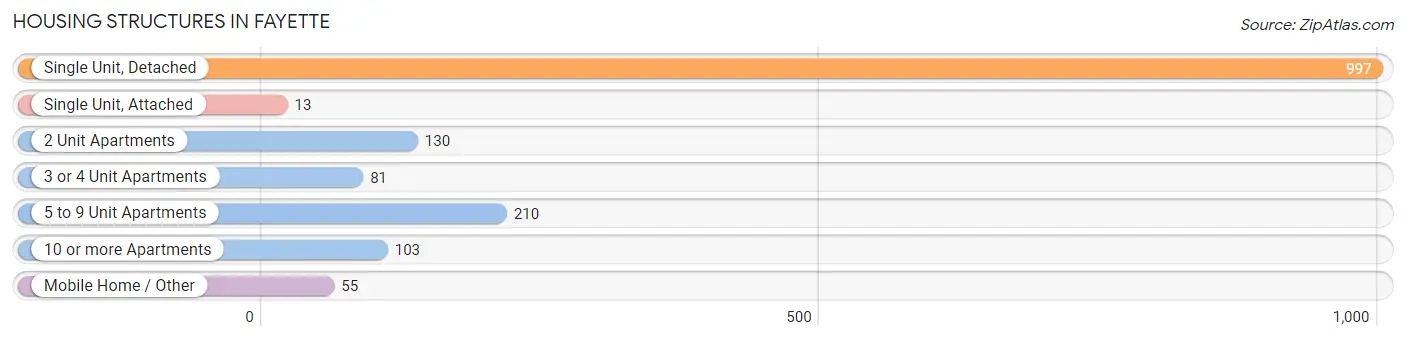
| Structure Type | # Housing Units | % Housing Units |
| Single Unit, Detached | 997 | 62.7% |
| Single Unit, Attached | 13 | 0.8% |
| 2 Unit Apartments | 130 | 8.2% |
| 3 or 4 Unit Apartments | 81 | 5.1% |
| 5 to 9 Unit Apartments | 210 | 13.2% |
| 10 or more Apartments | 103 | 6.5% |
| Mobile Home / Other | 55 | 3.5% |
| Total | 1,589 | 100.0% |
Housing Structures by Occupancy in Fayette
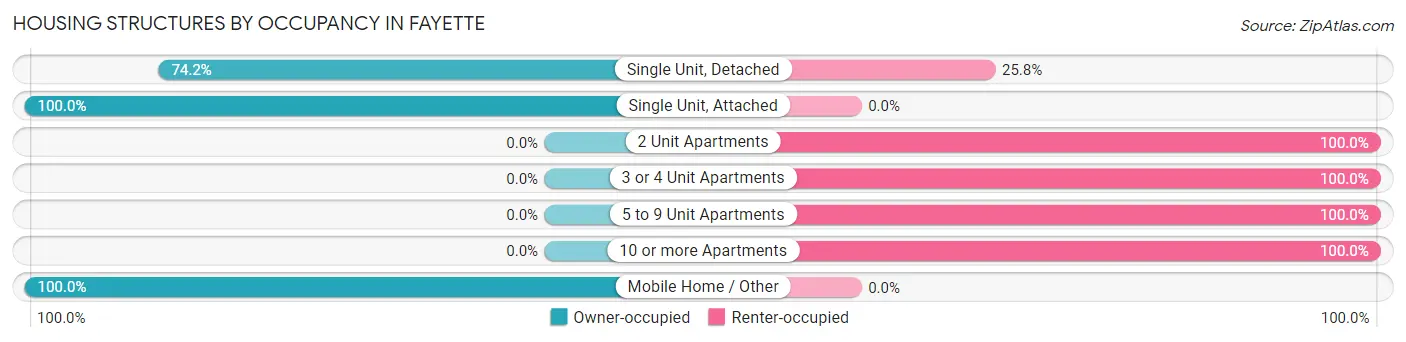
| Structure Type | Owner-occupied | Renter-occupied |
| Single Unit, Detached | 740 (74.2%) | 257 (25.8%) |
| Single Unit, Attached | 13 (100.0%) | 0 (0.0%) |
| 2 Unit Apartments | 0 (0.0%) | 130 (100.0%) |
| 3 or 4 Unit Apartments | 0 (0.0%) | 81 (100.0%) |
| 5 to 9 Unit Apartments | 0 (0.0%) | 210 (100.0%) |
| 10 or more Apartments | 0 (0.0%) | 103 (100.0%) |
| Mobile Home / Other | 55 (100.0%) | 0 (0.0%) |
| Total | 808 (50.8%) | 781 (49.1%) |
Housing Structures by Number of Rooms in Fayette
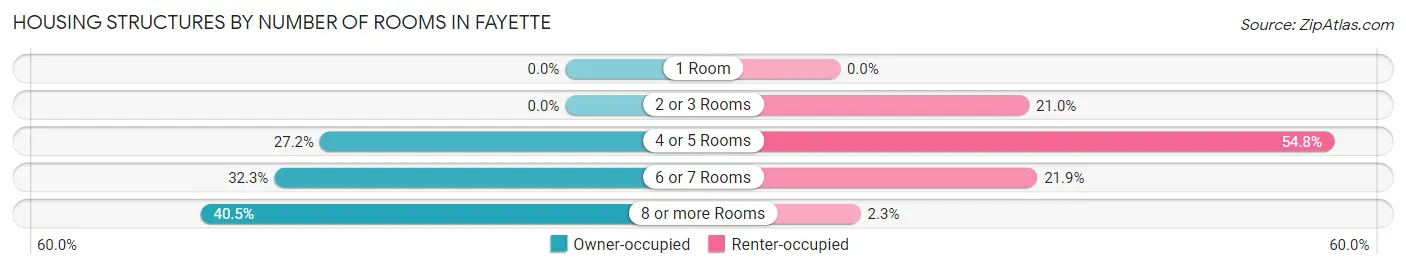
| Number of Rooms | Owner-occupied | Renter-occupied |
| 1 Room | 0 (0.0%) | 0 (0.0%) |
| 2 or 3 Rooms | 0 (0.0%) | 164 (21.0%) |
| 4 or 5 Rooms | 220 (27.2%) | 428 (54.8%) |
| 6 or 7 Rooms | 261 (32.3%) | 171 (21.9%) |
| 8 or more Rooms | 327 (40.5%) | 18 (2.3%) |
| Total | 808 (100.0%) | 781 (100.0%) |
Housing Structure by Heating Type in Fayette
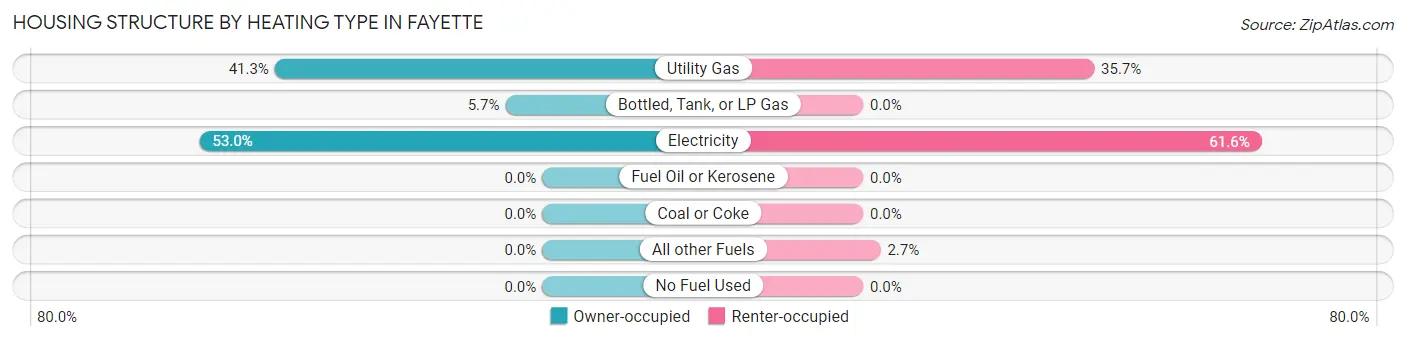
| Heating Type | Owner-occupied | Renter-occupied |
| Utility Gas | 334 (41.3%) | 279 (35.7%) |
| Bottled, Tank, or LP Gas | 46 (5.7%) | 0 (0.0%) |
| Electricity | 428 (53.0%) | 481 (61.6%) |
| Fuel Oil or Kerosene | 0 (0.0%) | 0 (0.0%) |
| Coal or Coke | 0 (0.0%) | 0 (0.0%) |
| All other Fuels | 0 (0.0%) | 21 (2.7%) |
| No Fuel Used | 0 (0.0%) | 0 (0.0%) |
| Total | 808 (100.0%) | 781 (100.0%) |
Household Vehicle Usage in Fayette
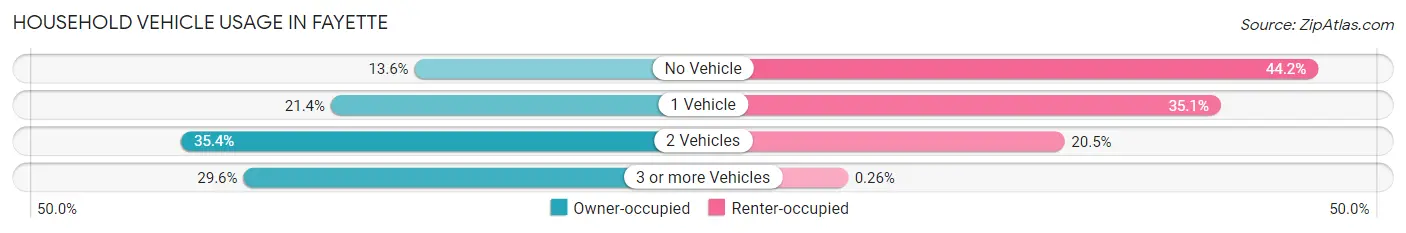
| Vehicles per Household | Owner-occupied | Renter-occupied |
| No Vehicle | 110 (13.6%) | 345 (44.2%) |
| 1 Vehicle | 173 (21.4%) | 274 (35.1%) |
| 2 Vehicles | 286 (35.4%) | 160 (20.5%) |
| 3 or more Vehicles | 239 (29.6%) | 2 (0.3%) |
| Total | 808 (100.0%) | 781 (100.0%) |
Real Estate & Mortgages in Fayette
Real Estate and Mortgage Overview in Fayette
| Characteristic | Without Mortgage | With Mortgage |
| Housing Units | 524 | 284 |
| Median Property Value | $110,000 | $142,400 |
| Median Household Income | $53,750 | $48 |
| Monthly Housing Costs | $373 | $0 |
| Real Estate Taxes | $364 | $68 |
Property Value by Mortgage Status in Fayette
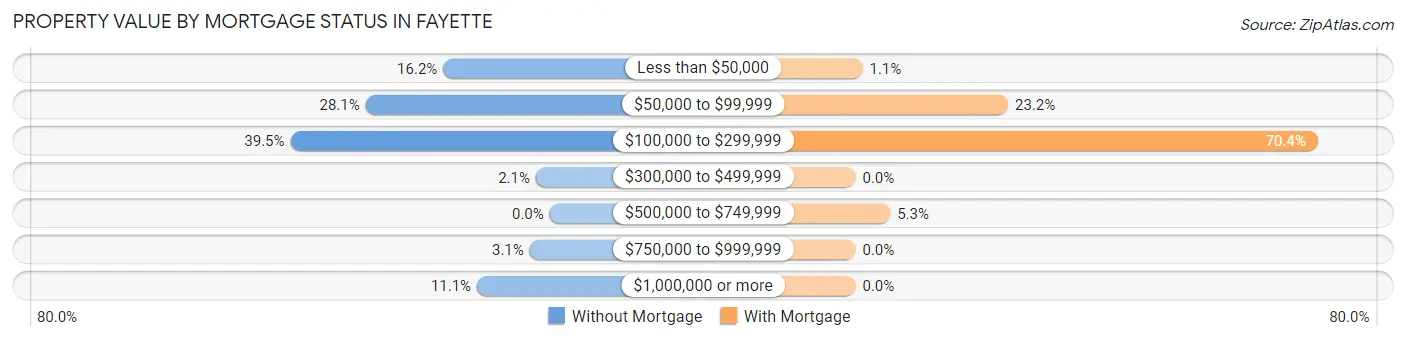
| Property Value | Without Mortgage | With Mortgage |
| Less than $50,000 | 85 (16.2%) | 3 (1.1%) |
| $50,000 to $99,999 | 147 (28.1%) | 66 (23.2%) |
| $100,000 to $299,999 | 207 (39.5%) | 200 (70.4%) |
| $300,000 to $499,999 | 11 (2.1%) | 0 (0.0%) |
| $500,000 to $749,999 | 0 (0.0%) | 15 (5.3%) |
| $750,000 to $999,999 | 16 (3.0%) | 0 (0.0%) |
| $1,000,000 or more | 58 (11.1%) | 0 (0.0%) |
| Total | 524 (100.0%) | 284 (100.0%) |
Household Income by Mortgage Status in Fayette
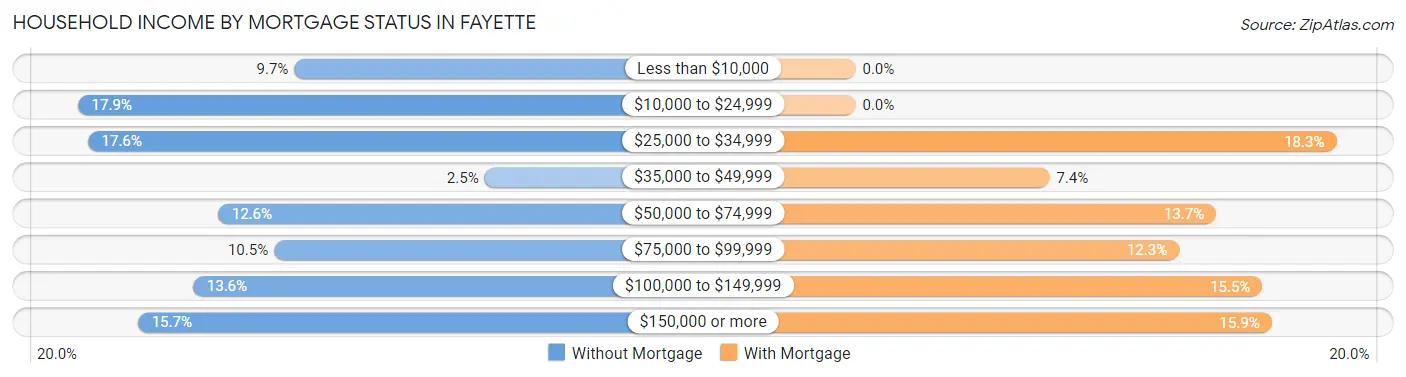
| Household Income | Without Mortgage | With Mortgage |
| Less than $10,000 | 51 (9.7%) | 0 (0.0%) |
| $10,000 to $24,999 | 94 (17.9%) | 0 (0.0%) |
| $25,000 to $34,999 | 92 (17.6%) | 52 (18.3%) |
| $35,000 to $49,999 | 13 (2.5%) | 21 (7.4%) |
| $50,000 to $74,999 | 66 (12.6%) | 39 (13.7%) |
| $75,000 to $99,999 | 55 (10.5%) | 35 (12.3%) |
| $100,000 to $149,999 | 71 (13.6%) | 44 (15.5%) |
| $150,000 or more | 82 (15.7%) | 45 (15.9%) |
| Total | 524 (100.0%) | 284 (100.0%) |
Property Value to Household Income Ratio in Fayette
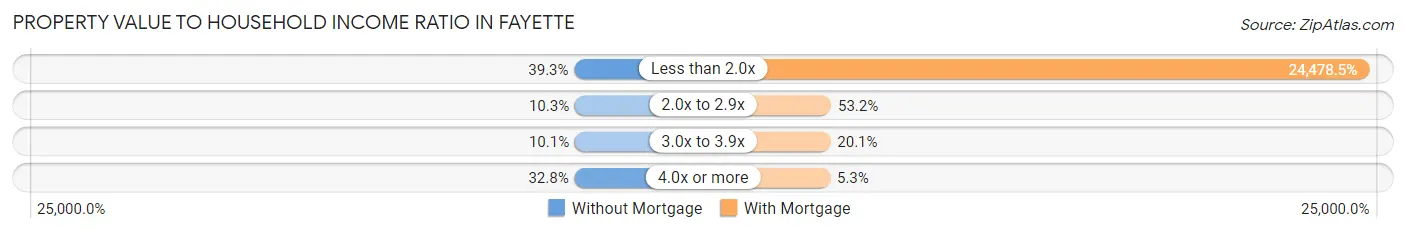
| Value-to-Income Ratio | Without Mortgage | With Mortgage |
| Less than 2.0x | 206 (39.3%) | 69,519 (24,478.5%) |
| 2.0x to 2.9x | 54 (10.3%) | 151 (53.2%) |
| 3.0x to 3.9x | 53 (10.1%) | 57 (20.1%) |
| 4.0x or more | 172 (32.8%) | 15 (5.3%) |
| Total | 524 (100.0%) | 284 (100.0%) |
Real Estate Taxes by Mortgage Status in Fayette
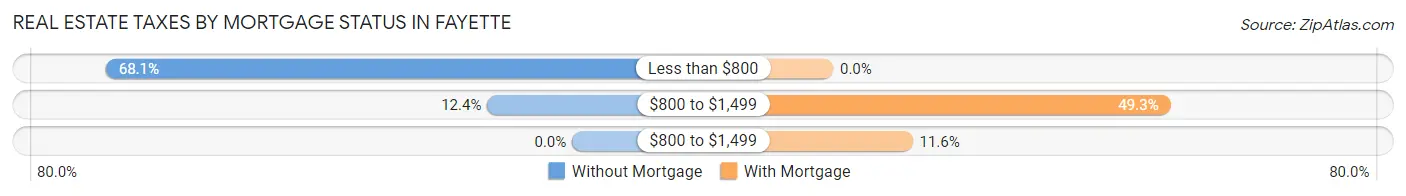
| Property Taxes | Without Mortgage | With Mortgage |
| Less than $800 | 357 (68.1%) | 0 (0.0%) |
| $800 to $1,499 | 65 (12.4%) | 140 (49.3%) |
| $800 to $1,499 | 0 (0.0%) | 33 (11.6%) |
| Total | 524 (100.0%) | 284 (100.0%) |
Health & Disability in Fayette
Health Insurance Coverage by Age in Fayette
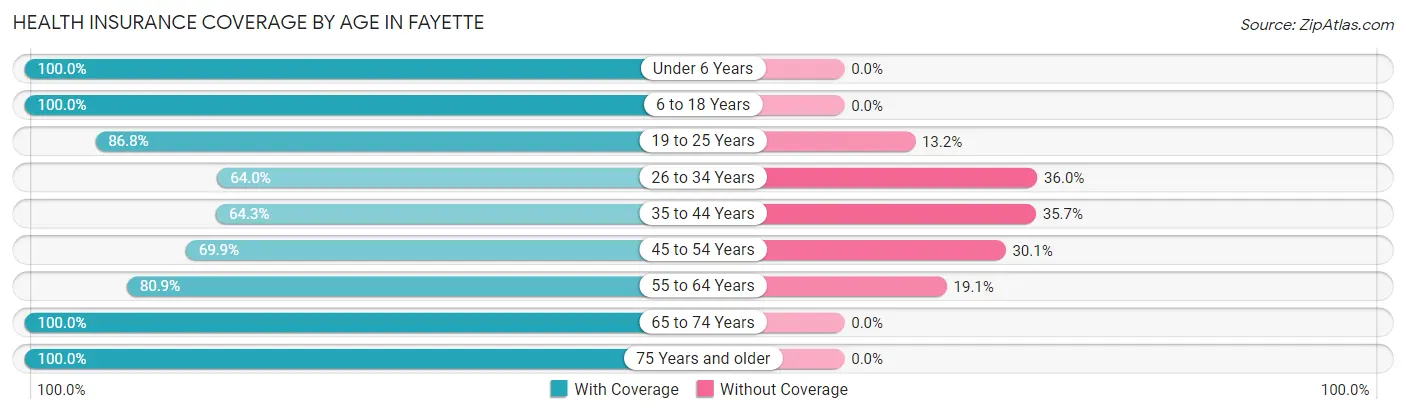
| Age Bracket | With Coverage | Without Coverage |
| Under 6 Years | 333 (100.0%) | 0 (0.0%) |
| 6 to 18 Years | 589 (100.0%) | 0 (0.0%) |
| 19 to 25 Years | 349 (86.8%) | 53 (13.2%) |
| 26 to 34 Years | 292 (64.0%) | 164 (36.0%) |
| 35 to 44 Years | 207 (64.3%) | 115 (35.7%) |
| 45 to 54 Years | 377 (69.9%) | 162 (30.1%) |
| 55 to 64 Years | 424 (80.9%) | 100 (19.1%) |
| 65 to 74 Years | 458 (100.0%) | 0 (0.0%) |
| 75 Years and older | 446 (100.0%) | 0 (0.0%) |
| Total | 3,475 (85.4%) | 594 (14.6%) |
Health Insurance Coverage by Citizenship Status in Fayette
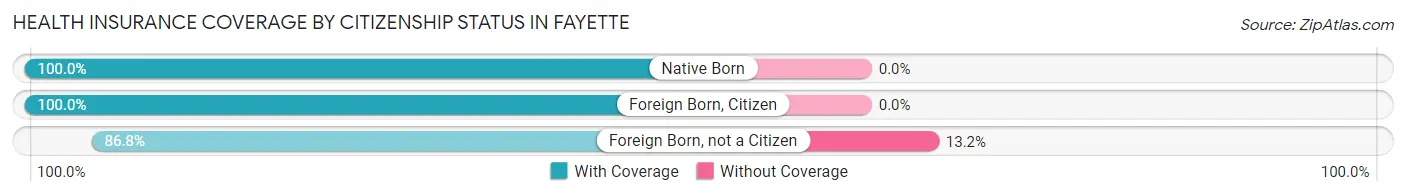
| Citizenship Status | With Coverage | Without Coverage |
| Native Born | 333 (100.0%) | 0 (0.0%) |
| Foreign Born, Citizen | 589 (100.0%) | 0 (0.0%) |
| Foreign Born, not a Citizen | 349 (86.8%) | 53 (13.2%) |
Health Insurance Coverage by Household Income in Fayette
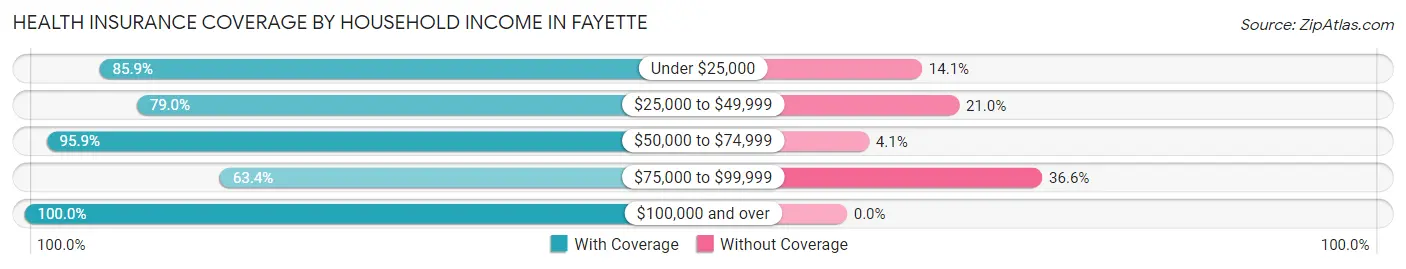
| Household Income | With Coverage | Without Coverage |
| Under $25,000 | 1,081 (85.9%) | 177 (14.1%) |
| $25,000 to $49,999 | 796 (79.0%) | 212 (21.0%) |
| $50,000 to $74,999 | 788 (95.9%) | 34 (4.1%) |
| $75,000 to $99,999 | 220 (63.4%) | 127 (36.6%) |
| $100,000 and over | 543 (100.0%) | 0 (0.0%) |
Public vs Private Health Insurance Coverage by Age in Fayette
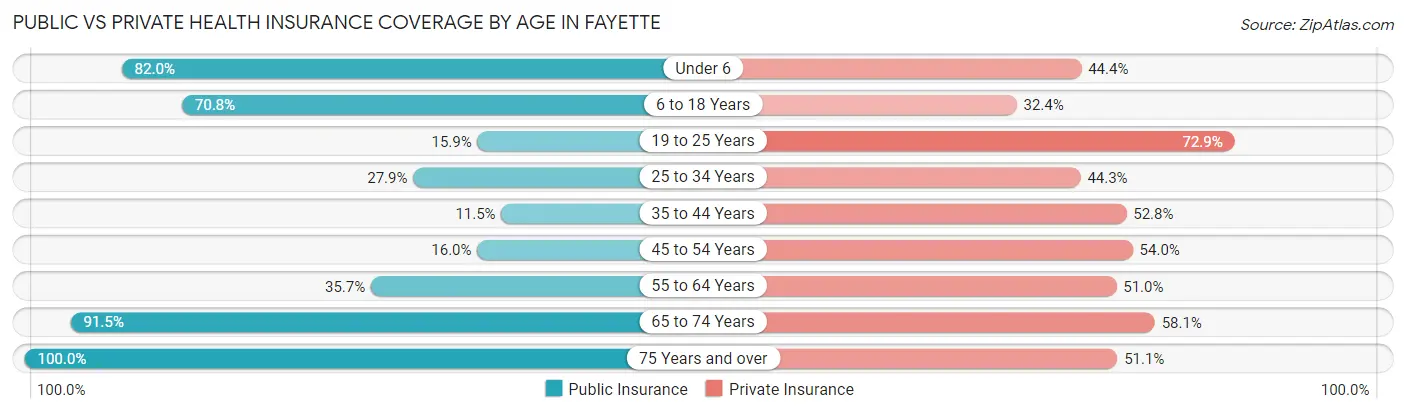
| Age Bracket | Public Insurance | Private Insurance |
| Under 6 | 273 (82.0%) | 148 (44.4%) |
| 6 to 18 Years | 417 (70.8%) | 191 (32.4%) |
| 19 to 25 Years | 64 (15.9%) | 293 (72.9%) |
| 25 to 34 Years | 127 (27.9%) | 202 (44.3%) |
| 35 to 44 Years | 37 (11.5%) | 170 (52.8%) |
| 45 to 54 Years | 86 (16.0%) | 291 (54.0%) |
| 55 to 64 Years | 187 (35.7%) | 267 (50.9%) |
| 65 to 74 Years | 419 (91.5%) | 266 (58.1%) |
| 75 Years and over | 446 (100.0%) | 228 (51.1%) |
| Total | 2,056 (50.5%) | 2,056 (50.5%) |
Disability Status by Sex by Age in Fayette
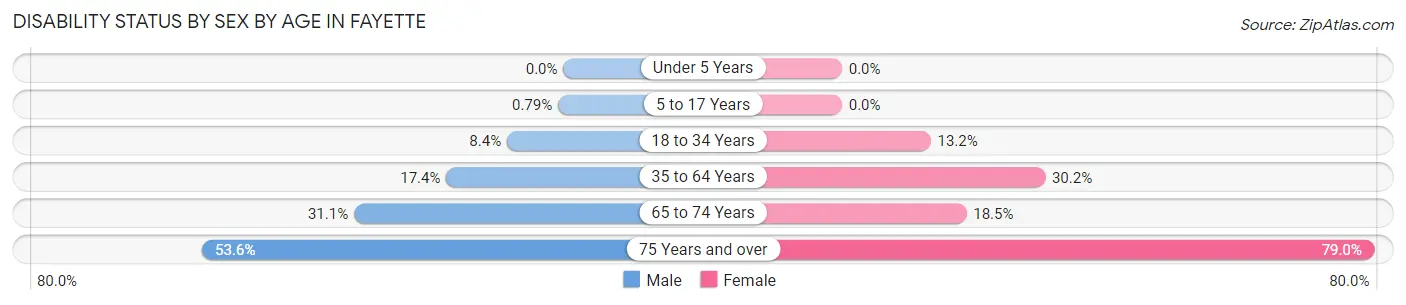
| Age Bracket | Male | Female |
| Under 5 Years | 0 (0.0%) | 0 (0.0%) |
| 5 to 17 Years | 3 (0.8%) | 0 (0.0%) |
| 18 to 34 Years | 36 (8.4%) | 63 (13.2%) |
| 35 to 64 Years | 118 (17.4%) | 213 (30.2%) |
| 65 to 74 Years | 60 (31.1%) | 49 (18.5%) |
| 75 Years and over | 81 (53.6%) | 233 (79.0%) |
Disability Class by Sex by Age in Fayette
Disability Class: Hearing Difficulty
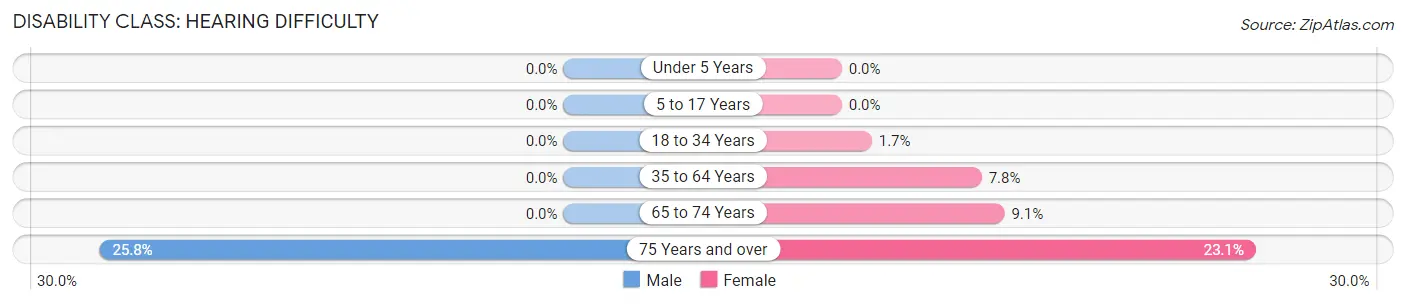
| Age Bracket | Male | Female |
| Under 5 Years | 0 (0.0%) | 0 (0.0%) |
| 5 to 17 Years | 0 (0.0%) | 0 (0.0%) |
| 18 to 34 Years | 0 (0.0%) | 8 (1.7%) |
| 35 to 64 Years | 0 (0.0%) | 55 (7.8%) |
| 65 to 74 Years | 0 (0.0%) | 24 (9.1%) |
| 75 Years and over | 39 (25.8%) | 68 (23.1%) |
Disability Class: Vision Difficulty
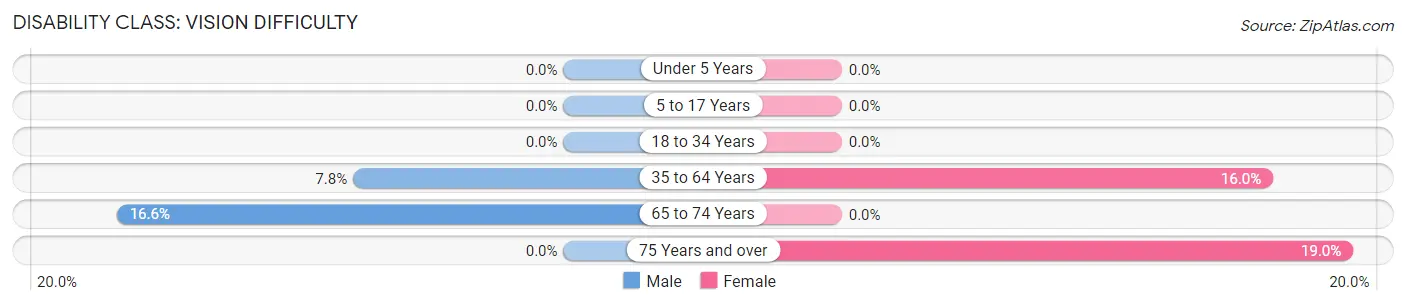
| Age Bracket | Male | Female |
| Under 5 Years | 0 (0.0%) | 0 (0.0%) |
| 5 to 17 Years | 0 (0.0%) | 0 (0.0%) |
| 18 to 34 Years | 0 (0.0%) | 0 (0.0%) |
| 35 to 64 Years | 53 (7.8%) | 113 (16.0%) |
| 65 to 74 Years | 32 (16.6%) | 0 (0.0%) |
| 75 Years and over | 0 (0.0%) | 56 (19.0%) |
Disability Class: Cognitive Difficulty
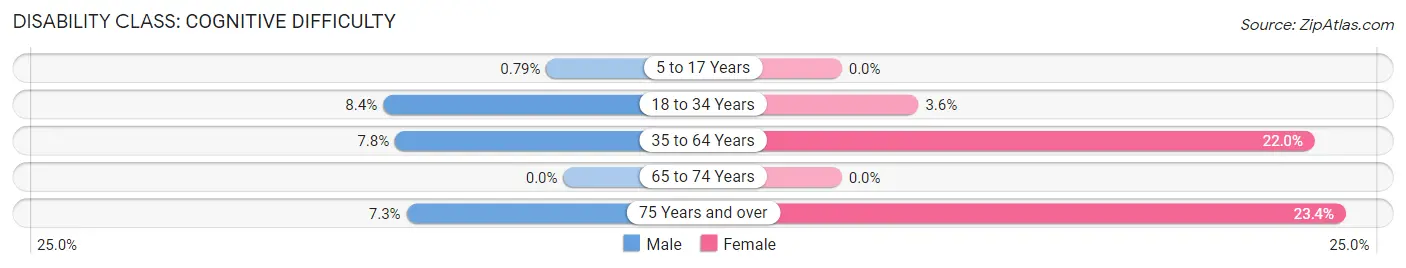
| Age Bracket | Male | Female |
| 5 to 17 Years | 3 (0.8%) | 0 (0.0%) |
| 18 to 34 Years | 36 (8.4%) | 17 (3.6%) |
| 35 to 64 Years | 53 (7.8%) | 155 (22.0%) |
| 65 to 74 Years | 0 (0.0%) | 0 (0.0%) |
| 75 Years and over | 11 (7.3%) | 69 (23.4%) |
Disability Class: Ambulatory Difficulty
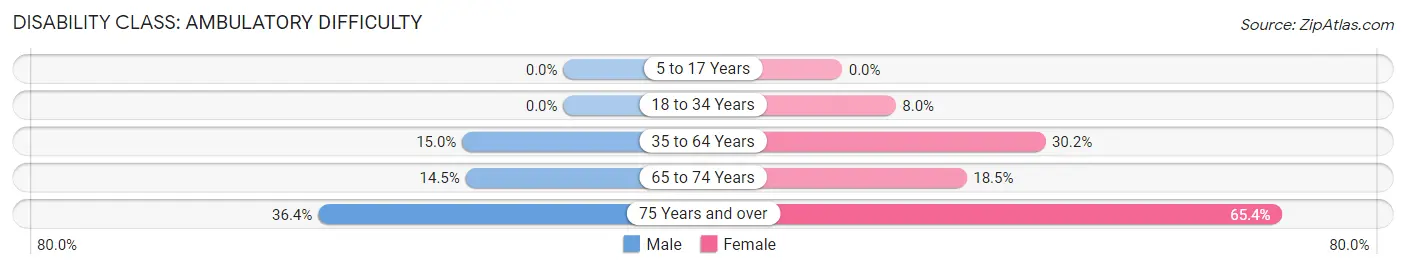
| Age Bracket | Male | Female |
| 5 to 17 Years | 0 (0.0%) | 0 (0.0%) |
| 18 to 34 Years | 0 (0.0%) | 38 (8.0%) |
| 35 to 64 Years | 102 (15.0%) | 213 (30.2%) |
| 65 to 74 Years | 28 (14.5%) | 49 (18.5%) |
| 75 Years and over | 55 (36.4%) | 193 (65.4%) |
Disability Class: Self-Care Difficulty
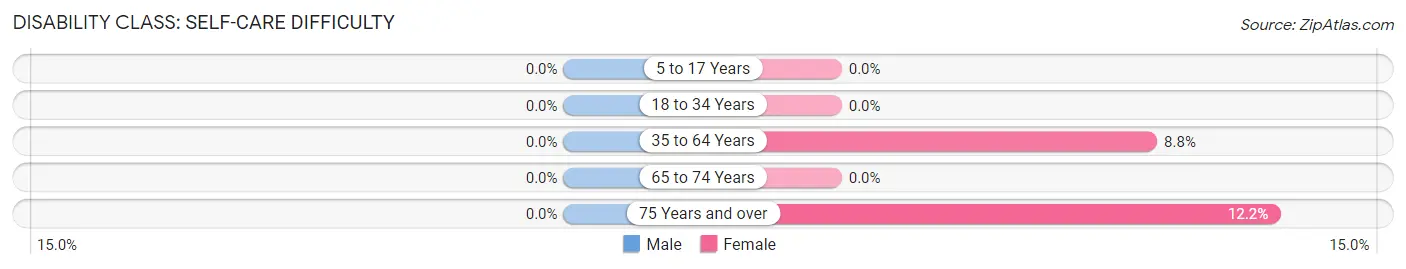
| Age Bracket | Male | Female |
| 5 to 17 Years | 0 (0.0%) | 0 (0.0%) |
| 18 to 34 Years | 0 (0.0%) | 0 (0.0%) |
| 35 to 64 Years | 0 (0.0%) | 62 (8.8%) |
| 65 to 74 Years | 0 (0.0%) | 0 (0.0%) |
| 75 Years and over | 0 (0.0%) | 36 (12.2%) |
Technology Access in Fayette
Computing Device Access in Fayette
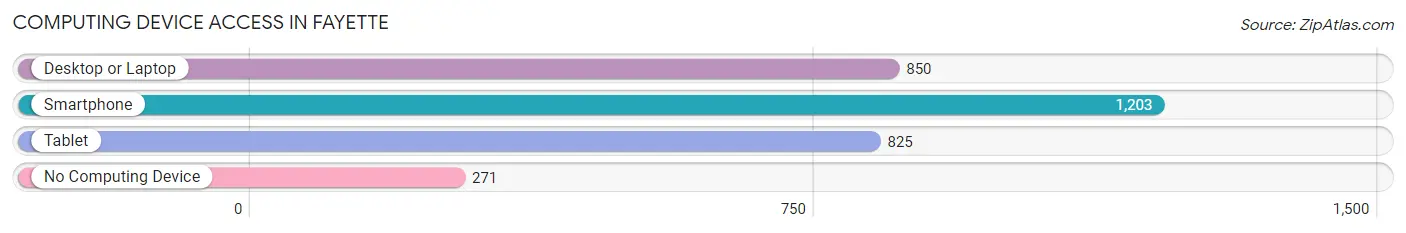
| Device Type | # Households | % Households |
| Desktop or Laptop | 850 | 53.5% |
| Smartphone | 1,203 | 75.7% |
| Tablet | 825 | 51.9% |
| No Computing Device | 271 | 17.1% |
| Total | 1,589 | 100.0% |
Internet Access in Fayette
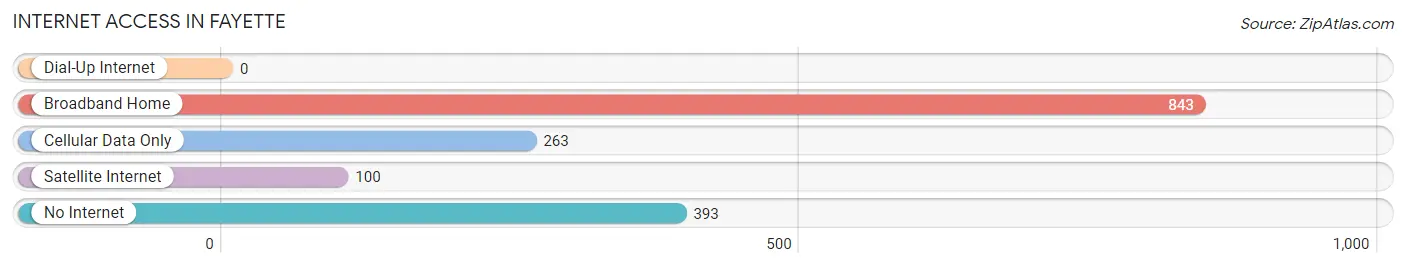
| Internet Type | # Households | % Households |
| Dial-Up Internet | 0 | 0.0% |
| Broadband Home | 843 | 53.0% |
| Cellular Data Only | 263 | 16.6% |
| Satellite Internet | 100 | 6.3% |
| No Internet | 393 | 24.7% |
| Total | 1,589 | 100.0% |
Fayette Summary
Fayette, Alabama is a small city located in the northwest corner of the state, in Fayette County. It is situated on the banks of the Black Warrior River, and is the county seat of Fayette County. The city has a population of 4,845, according to the 2010 census.
Geography
Fayette is located in the northwest corner of Alabama, in Fayette County. It is situated on the banks of the Black Warrior River, and is the county seat of Fayette County. The city has a total area of 8.2 square miles, all of which is land. The city is located in the foothills of the Appalachian Mountains, and is surrounded by rolling hills and forests.
History
Fayette was founded in 1824, and was named after the Marquis de Lafayette, a French military officer who fought in the American Revolutionary War. The city was incorporated in 1837, and was the first county seat of Fayette County. The city was an important trading center during the 19th century, and was home to several cotton mills. The city was also the site of a major Civil War battle in 1865.
Economy
Fayette’s economy is largely based on agriculture and manufacturing. The city is home to several large poultry processing plants, as well as a number of smaller businesses. The city is also home to several large retail stores, including Walmart and Lowe’s. The city is also home to a number of small businesses, including restaurants, cafes, and shops.
Demographics
Fayette has a population of 4,845, according to the 2010 census. The population is predominantly white, with African Americans making up the largest minority group. The median household income is $30,945, and the median age is 38. The city has a poverty rate of 22.3%, and the unemployment rate is 8.2%.
Conclusion
Fayette, Alabama is a small city located in the northwest corner of the state, in Fayette County. It is situated on the banks of the Black Warrior River, and is the county seat of Fayette County. The city has a population of 4,845, according to the 2010 census. The city’s economy is largely based on agriculture and manufacturing, and the city is home to several large poultry processing plants, as well as a number of smaller businesses. The population is predominantly white, with African Americans making up the largest minority group. The median household income is $30,945, and the median age is 38. The city has a poverty rate of 22.3%, and the unemployment rate is 8.2%.
Common Questions
What is Per Capita Income in Fayette?
Per Capita income in Fayette is $26,576.
What is the Median Family Income in Fayette?
Median Family Income in Fayette is $44,808.
What is the Median Household income in Fayette?
Median Household Income in Fayette is $32,375.
What is Income or Wage Gap in Fayette?
Income or Wage Gap in Fayette is 43.5%.
Women in Fayette earn 56.5 cents for every dollar earned by a man.
What is Family Income Deficit in Fayette?
Family Income Deficit in Fayette is $11,148.
Families that are below poverty line in Fayette earn $11,148 less on average than the poverty threshold level.
What is Inequality or Gini Index in Fayette?
Inequality or Gini Index in Fayette is 0.60.
What is the Total Population of Fayette?
Total Population of Fayette is 4,266.
What is the Total Male Population of Fayette?
Total Male Population of Fayette is 2,079.
What is the Total Female Population of Fayette?
Total Female Population of Fayette is 2,187.
What is the Ratio of Males per 100 Females in Fayette?
There are 95.06 Males per 100 Females in Fayette.
What is the Ratio of Females per 100 Males in Fayette?
There are 105.19 Females per 100 Males in Fayette.
What is the Median Population Age in Fayette?
Median Population Age in Fayette is 44.2 Years.
What is the Average Family Size in Fayette
Average Family Size in Fayette is 3.2 People.
What is the Average Household Size in Fayette
Average Household Size in Fayette is 2.5 People.
How Large is the Labor Force in Fayette?
There are 1,659 People in the Labor Forcein in Fayette.
What is the Percentage of People in the Labor Force in Fayette?
47.3% of People are in the Labor Force in Fayette.
What is the Unemployment Rate in Fayette?
Unemployment Rate in Fayette is 16.6%.