Excel, AL Map & Demographics
Excel Map
Excel Overview
$27,698
PER CAPITA INCOME
$73,036
AVG FAMILY INCOME
$64,926
AVG HOUSEHOLD INCOME
32.5%
WAGE / INCOME GAP [ % ]
67.5¢/ $1
WAGE / INCOME GAP [ $ ]
0.38
INEQUALITY / GINI INDEX
473
TOTAL POPULATION
244
MALE POPULATION
229
FEMALE POPULATION
106.55
MALES / 100 FEMALES
93.85
FEMALES / 100 MALES
38.6
MEDIAN AGE
3.3
AVG FAMILY SIZE
2.9
AVG HOUSEHOLD SIZE
174
LABOR FORCE [ PEOPLE ]
49.0%
PERCENT IN LABOR FORCE
Excel Zip Codes
Income in Excel
Income Overview in Excel
Per Capita Income in Excel is $27,698, while median incomes of families and households are $73,036 and $64,926 respectively.
| Characteristic | Number | Measure |
| Per Capita Income | 473 | $27,698 |
| Median Family Income | 113 | $73,036 |
| Mean Family Income | 113 | $86,516 |
| Median Household Income | 161 | $64,926 |
| Mean Household Income | 161 | $80,663 |
| Income Deficit | 113 | $0 |
| Wage / Income Gap (%) | 473 | 32.50% |
| Wage / Income Gap ($) | 473 | 67.50¢ per $1 |
| Gini / Inequality Index | 473 | 0.38 |
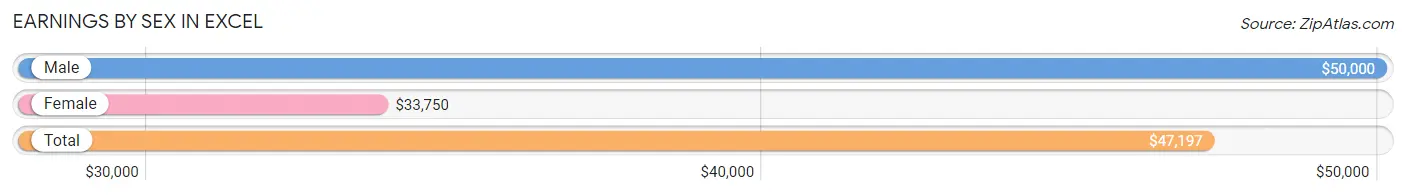
Earnings by Sex in Excel
Average Earnings in Excel are $47,197, $50,000 for men and $33,750 for women, a difference of 32.5%.
| Sex | Number | Average Earnings |
| Male | 108 (60.0%) | $50,000 |
| Female | 72 (40.0%) | $33,750 |
| Total | 180 (100.0%) | $47,197 |
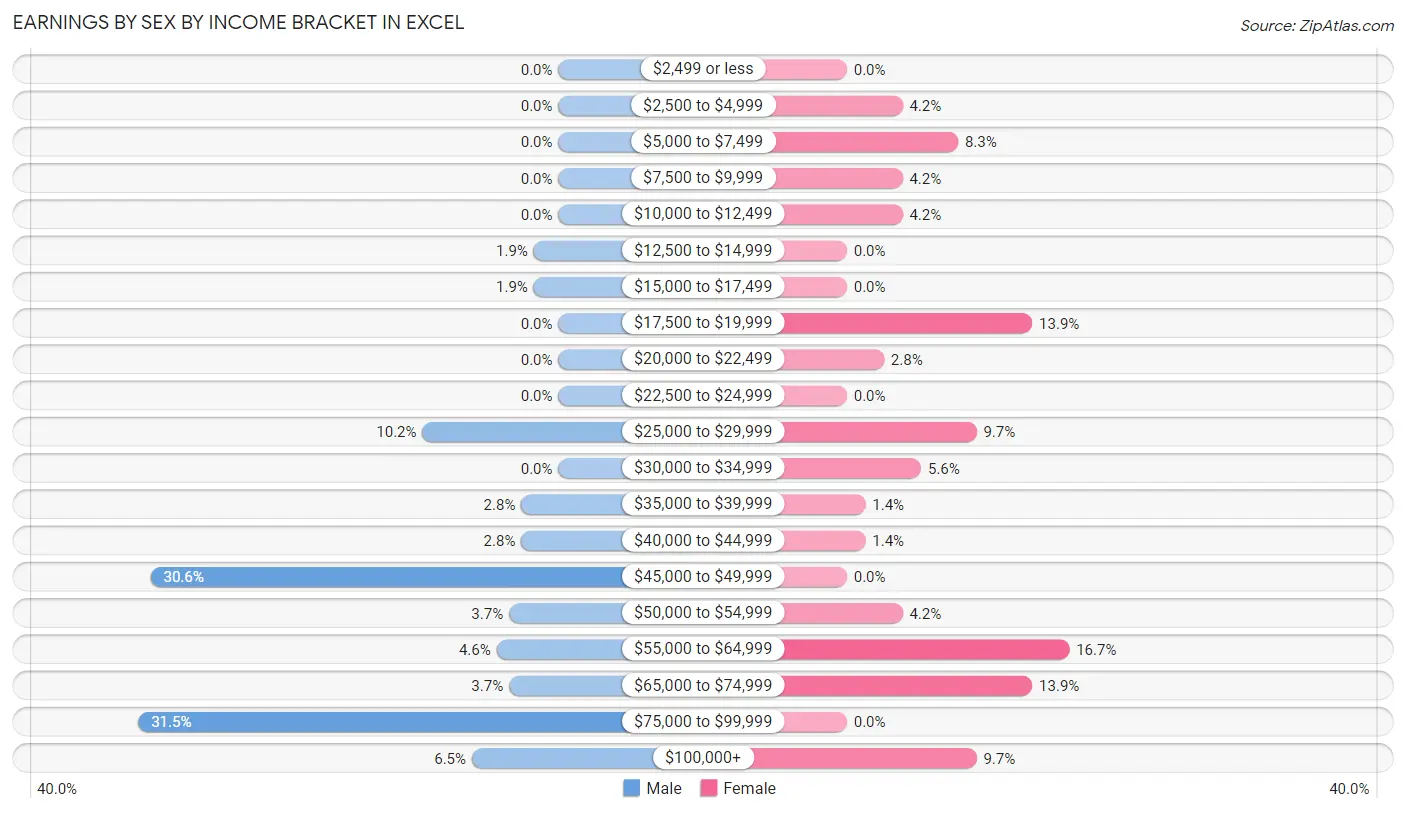
Earnings by Sex by Income Bracket in Excel
The most common earnings brackets in Excel are $75,000 to $99,999 for men (34 | 31.5%) and $55,000 to $64,999 for women (12 | 16.7%).
| Income | Male | Female |
| $2,499 or less | 0 (0.0%) | 0 (0.0%) |
| $2,500 to $4,999 | 0 (0.0%) | 3 (4.2%) |
| $5,000 to $7,499 | 0 (0.0%) | 6 (8.3%) |
| $7,500 to $9,999 | 0 (0.0%) | 3 (4.2%) |
| $10,000 to $12,499 | 0 (0.0%) | 3 (4.2%) |
| $12,500 to $14,999 | 2 (1.8%) | 0 (0.0%) |
| $15,000 to $17,499 | 2 (1.8%) | 0 (0.0%) |
| $17,500 to $19,999 | 0 (0.0%) | 10 (13.9%) |
| $20,000 to $22,499 | 0 (0.0%) | 2 (2.8%) |
| $22,500 to $24,999 | 0 (0.0%) | 0 (0.0%) |
| $25,000 to $29,999 | 11 (10.2%) | 7 (9.7%) |
| $30,000 to $34,999 | 0 (0.0%) | 4 (5.6%) |
| $35,000 to $39,999 | 3 (2.8%) | 1 (1.4%) |
| $40,000 to $44,999 | 3 (2.8%) | 1 (1.4%) |
| $45,000 to $49,999 | 33 (30.6%) | 0 (0.0%) |
| $50,000 to $54,999 | 4 (3.7%) | 3 (4.2%) |
| $55,000 to $64,999 | 5 (4.6%) | 12 (16.7%) |
| $65,000 to $74,999 | 4 (3.7%) | 10 (13.9%) |
| $75,000 to $99,999 | 34 (31.5%) | 0 (0.0%) |
| $100,000+ | 7 (6.5%) | 7 (9.7%) |
| Total | 108 (100.0%) | 72 (100.0%) |
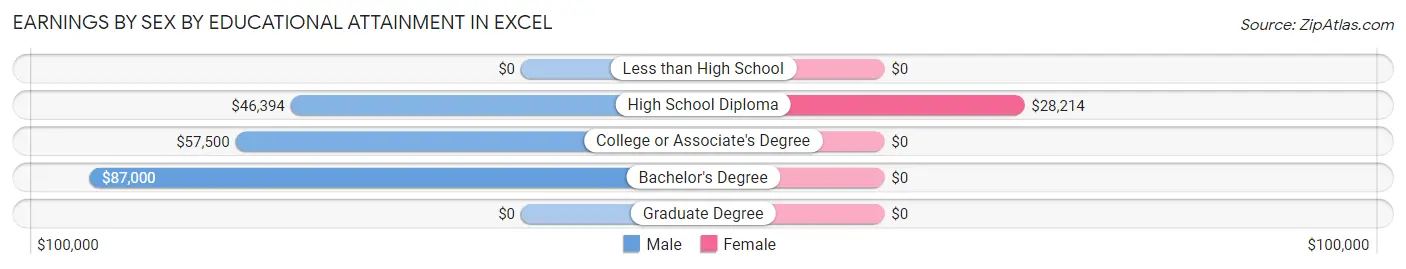
Earnings by Sex by Educational Attainment in Excel
Average earnings in Excel are $50,000 for men and $47,500 for women, a difference of 5.0%. Men with an educational attainment of bachelor's degree enjoy the highest average annual earnings of $87,000, while those with high school diploma education earn the least with $46,394. Women with an educational attainment of high school diploma earn the most with the average annual earnings of $28,214, while those with high school diploma education have the smallest earnings of $28,214.
| Educational Attainment | Male Income | Female Income |
| Less than High School | - | - |
| High School Diploma | $46,394 | $28,214 |
| College or Associate's Degree | $57,500 | $0 |
| Bachelor's Degree | $87,000 | $0 |
| Graduate Degree | - | - |
| Total | $50,000 | $47,500 |
Family Income in Excel
Family Income Brackets in Excel
According to the Excel family income data, there are 43 families falling into the $50,000 to $74,999 income range, which is the most common income bracket and makes up 38.1% of all families.
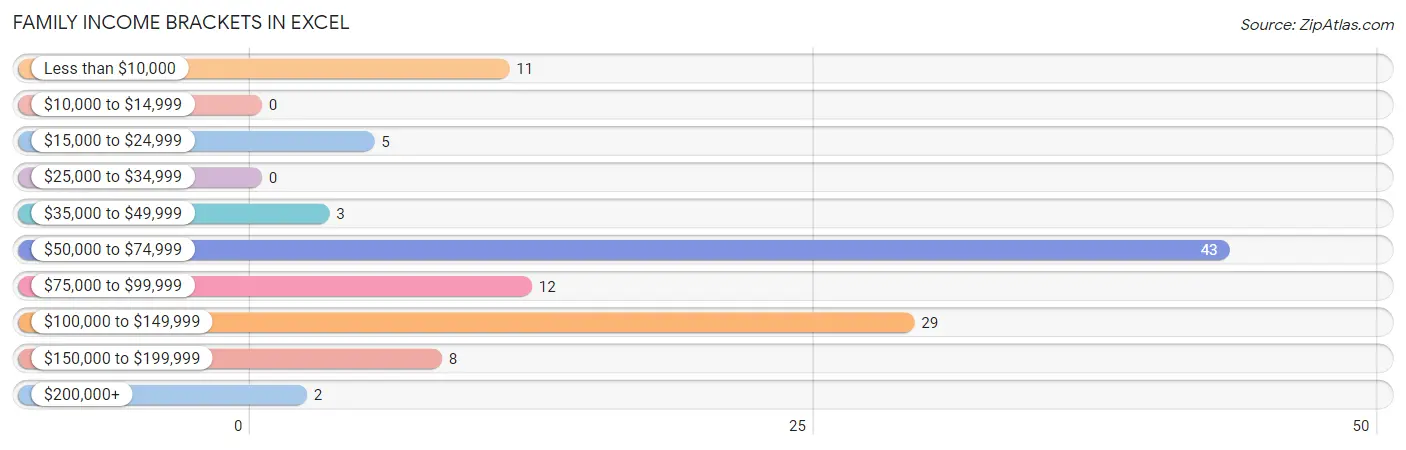
| Income Bracket | # Families | % Families |
| Less than $10,000 | 11 | 9.7% |
| $10,000 to $14,999 | 0 | 0.0% |
| $15,000 to $24,999 | 5 | 4.4% |
| $25,000 to $34,999 | 0 | 0.0% |
| $35,000 to $49,999 | 3 | 2.7% |
| $50,000 to $74,999 | 43 | 38.1% |
| $75,000 to $99,999 | 12 | 10.6% |
| $100,000 to $149,999 | 29 | 25.7% |
| $150,000 to $199,999 | 8 | 7.1% |
| $200,000+ | 2 | 1.8% |
Family Income by Famaliy Size in Excel
3-person families (29 | 25.7%) account for the highest median family income in Excel with $106,875 per family, while 3-person families (29 | 25.7%) have the highest median income of $35,625 per family member.
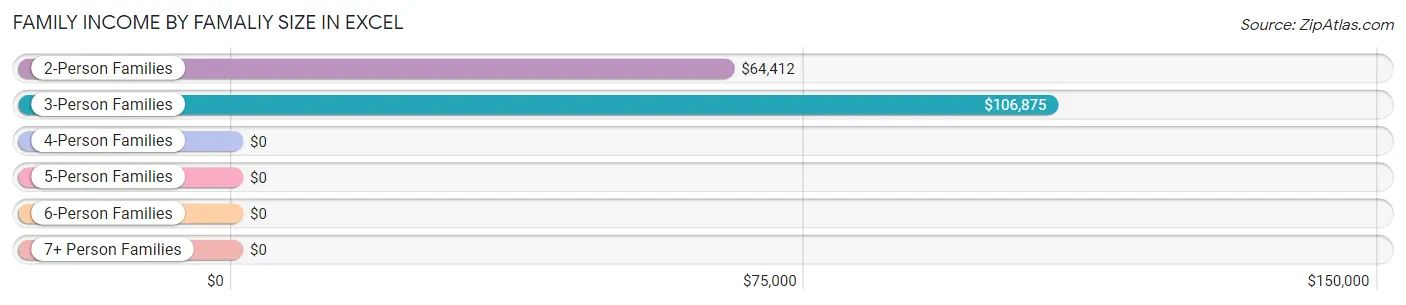
| Income Bracket | # Families | Median Income |
| 2-Person Families | 62 (54.9%) | $64,412 |
| 3-Person Families | 29 (25.7%) | $106,875 |
| 4-Person Families | 17 (15.0%) | $0 |
| 5-Person Families | 5 (4.4%) | $0 |
| 6-Person Families | 0 (0.0%) | $0 |
| 7+ Person Families | 0 (0.0%) | $0 |
| Total | 113 (100.0%) | $73,036 |
Family Income by Number of Earners in Excel
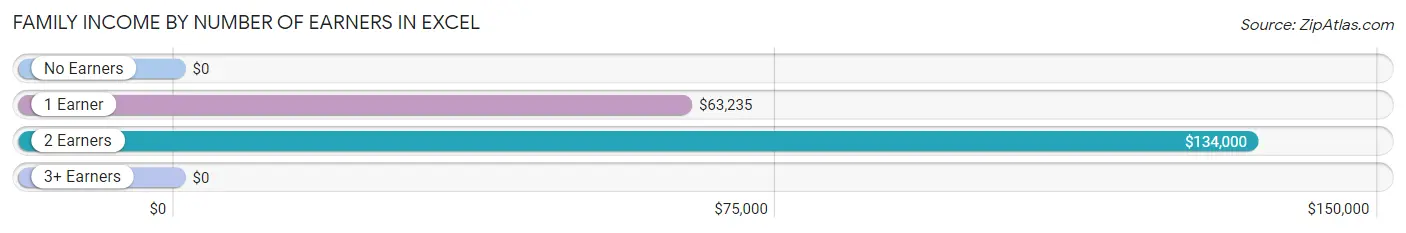
| Number of Earners | # Families | Median Income |
| No Earners | 22 (19.5%) | $0 |
| 1 Earner | 52 (46.0%) | $63,235 |
| 2 Earners | 38 (33.6%) | $134,000 |
| 3+ Earners | 1 (0.9%) | $0 |
| Total | 113 (100.0%) | $73,036 |
Household Income in Excel
Household Income Brackets in Excel
With 42 households falling in the category, the $50,000 to $74,999 income range is the most frequent in Excel, accounting for 26.1% of all households. In contrast, only 2 households (1.2%) fall into the $10,000 to $14,999 income bracket, making it the least populous group.
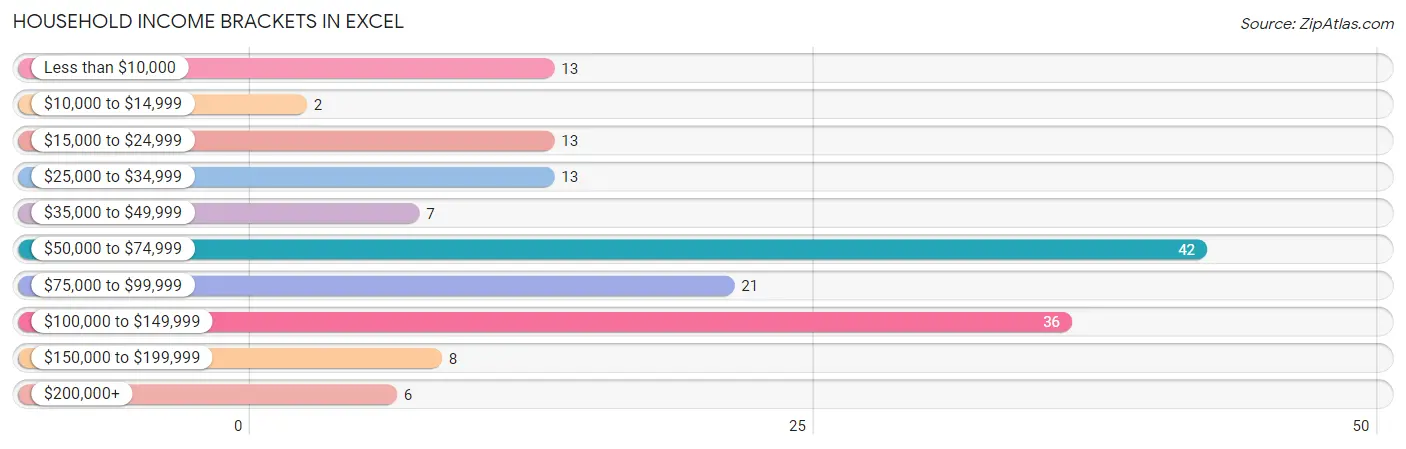
| Income Bracket | # Households | % Households |
| Less than $10,000 | 13 | 8.1% |
| $10,000 to $14,999 | 2 | 1.2% |
| $15,000 to $24,999 | 13 | 8.1% |
| $25,000 to $34,999 | 13 | 8.1% |
| $35,000 to $49,999 | 7 | 4.3% |
| $50,000 to $74,999 | 42 | 26.1% |
| $75,000 to $99,999 | 21 | 13.0% |
| $100,000 to $149,999 | 36 | 22.4% |
| $150,000 to $199,999 | 8 | 5.0% |
| $200,000+ | 6 | 3.7% |
Household Income by Householder Age in Excel
The median household income in Excel is $64,926, with the highest median household income of $146,250 found in the 45 to 64 years age bracket for the primary householder. A total of 42 households (26.1%) fall into this category. Meanwhile, the 15 to 24 years age bracket for the primary householder has the lowest median household income of $0, with 2 households (1.2%) in this group.
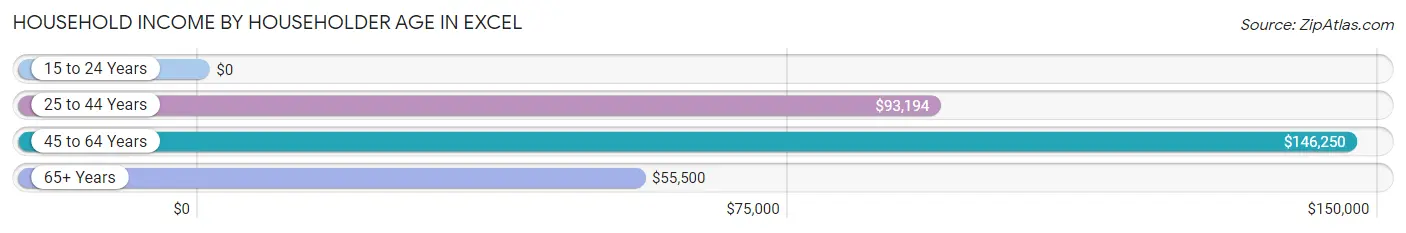
| Income Bracket | # Households | Median Income |
| 15 to 24 Years | 2 (1.2%) | $0 |
| 25 to 44 Years | 57 (35.4%) | $93,194 |
| 45 to 64 Years | 42 (26.1%) | $146,250 |
| 65+ Years | 60 (37.3%) | $55,500 |
| Total | 161 (100.0%) | $64,926 |
Poverty in Excel
Income Below Poverty by Sex and Age in Excel
With 25.0% poverty level for males and 17.9% for females among the residents of Excel, under 5 year old males and 18 to 24 year old females are the most vulnerable to poverty, with 20 males (90.9%) and 16 females (76.2%) in their respective age groups living below the poverty level.
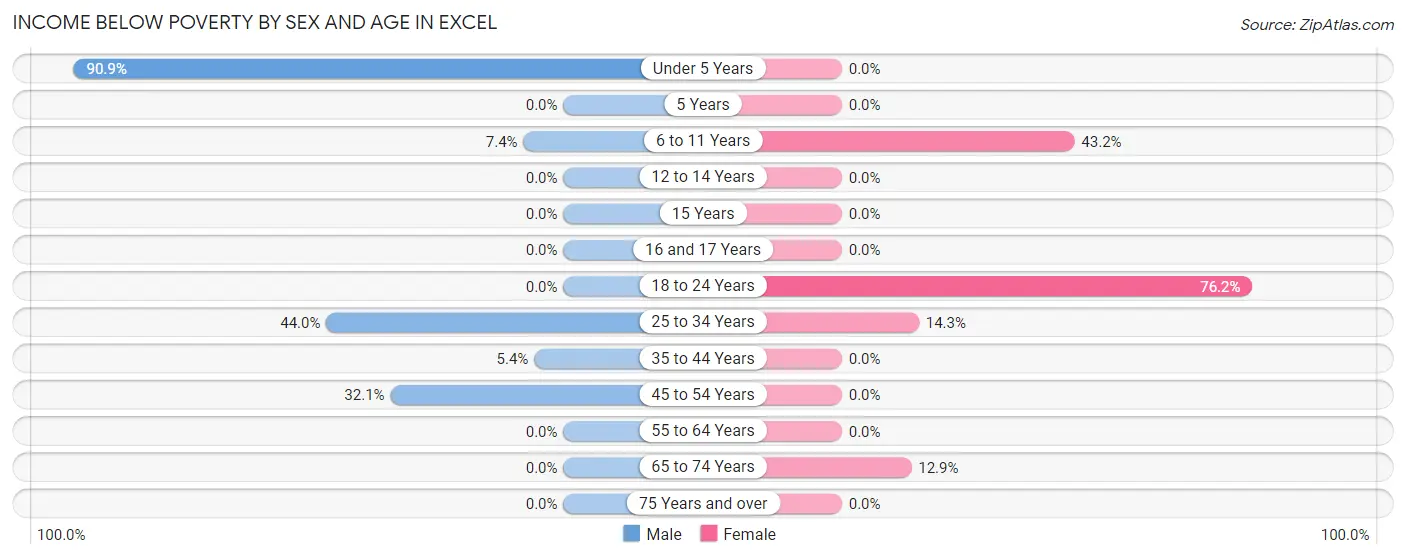
| Age Bracket | Male | Female |
| Under 5 Years | 20 (90.9%) | 0 (0.0%) |
| 5 Years | 0 (0.0%) | 0 (0.0%) |
| 6 to 11 Years | 2 (7.4%) | 19 (43.2%) |
| 12 to 14 Years | 0 (0.0%) | 0 (0.0%) |
| 15 Years | 0 (0.0%) | 0 (0.0%) |
| 16 and 17 Years | 0 (0.0%) | 0 (0.0%) |
| 18 to 24 Years | 0 (0.0%) | 16 (76.2%) |
| 25 to 34 Years | 11 (44.0%) | 2 (14.3%) |
| 35 to 44 Years | 2 (5.4%) | 0 (0.0%) |
| 45 to 54 Years | 26 (32.1%) | 0 (0.0%) |
| 55 to 64 Years | 0 (0.0%) | 0 (0.0%) |
| 65 to 74 Years | 0 (0.0%) | 4 (12.9%) |
| 75 Years and over | 0 (0.0%) | 0 (0.0%) |
| Total | 61 (25.0%) | 41 (17.9%) |
Income Above Poverty by Sex and Age in Excel
According to the poverty statistics in Excel, males aged 5 years and females aged under 5 years are the age groups that are most secure financially, with 100.0% of males and 100.0% of females in these age groups living above the poverty line.
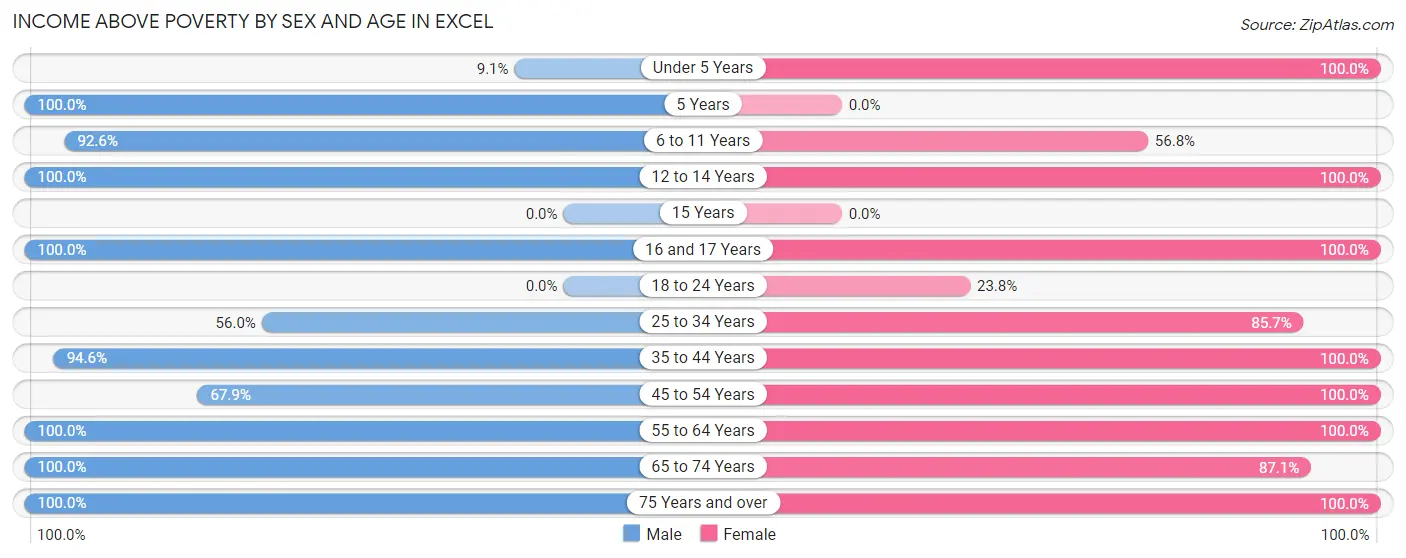
| Age Bracket | Male | Female |
| Under 5 Years | 2 (9.1%) | 8 (100.0%) |
| 5 Years | 3 (100.0%) | 0 (0.0%) |
| 6 to 11 Years | 25 (92.6%) | 25 (56.8%) |
| 12 to 14 Years | 2 (100.0%) | 12 (100.0%) |
| 15 Years | 0 (0.0%) | 0 (0.0%) |
| 16 and 17 Years | 15 (100.0%) | 15 (100.0%) |
| 18 to 24 Years | 0 (0.0%) | 5 (23.8%) |
| 25 to 34 Years | 14 (56.0%) | 12 (85.7%) |
| 35 to 44 Years | 35 (94.6%) | 25 (100.0%) |
| 45 to 54 Years | 55 (67.9%) | 16 (100.0%) |
| 55 to 64 Years | 13 (100.0%) | 16 (100.0%) |
| 65 to 74 Years | 7 (100.0%) | 27 (87.1%) |
| 75 Years and over | 12 (100.0%) | 27 (100.0%) |
| Total | 183 (75.0%) | 188 (82.1%) |
Income Below Poverty Among Married-Couple Families in Excel
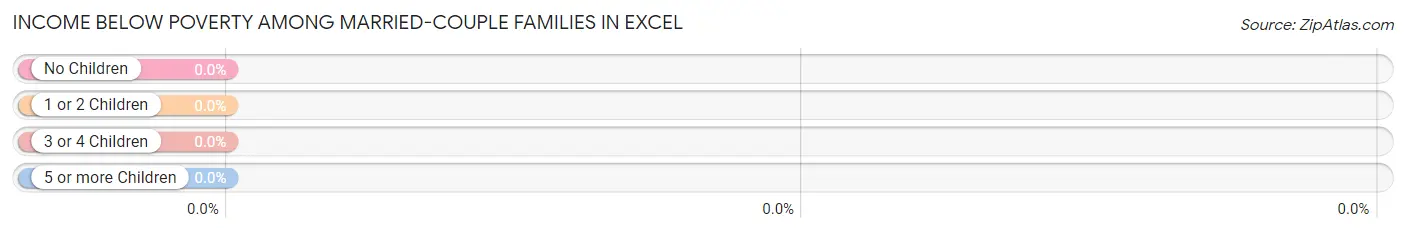
| Children | Above Poverty | Below Poverty |
| No Children | 40 (100.0%) | 0 (0.0%) |
| 1 or 2 Children | 28 (100.0%) | 0 (0.0%) |
| 3 or 4 Children | 3 (100.0%) | 0 (0.0%) |
| 5 or more Children | 0 (0.0%) | 0 (0.0%) |
| Total | 71 (100.0%) | 0 (0.0%) |
Income Below Poverty Among Single-Parent Households in Excel
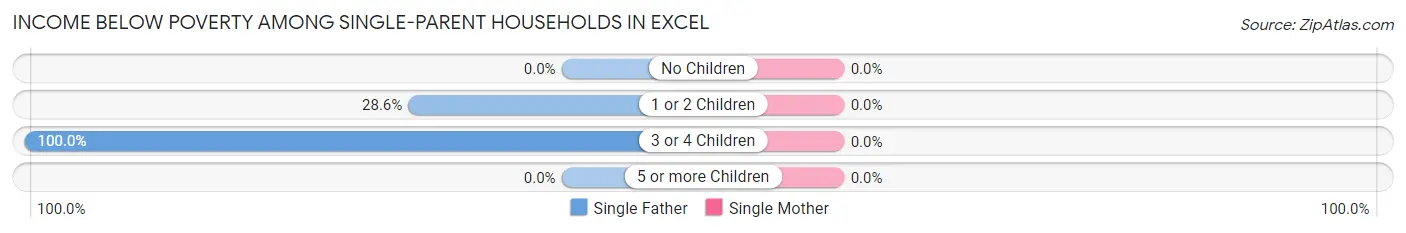
| Children | Single Father | Single Mother |
| No Children | 0 (0.0%) | 0 (0.0%) |
| 1 or 2 Children | 2 (28.6%) | 0 (0.0%) |
| 3 or 4 Children | 11 (100.0%) | 0 (0.0%) |
| 5 or more Children | 0 (0.0%) | 0 (0.0%) |
| Total | 13 (56.5%) | 0 (0.0%) |
Income Below Poverty Among Married-Couple vs Single-Parent Households in Excel
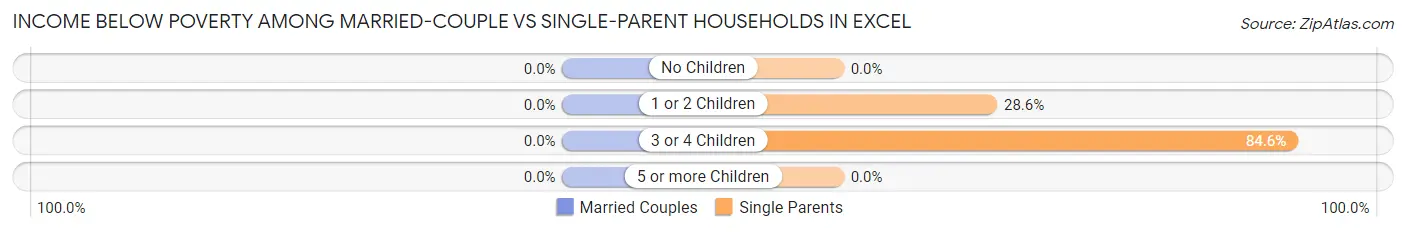
| Children | Married-Couple Families | Single-Parent Households |
| No Children | 0 (0.0%) | 0 (0.0%) |
| 1 or 2 Children | 0 (0.0%) | 2 (28.6%) |
| 3 or 4 Children | 0 (0.0%) | 11 (84.6%) |
| 5 or more Children | 0 (0.0%) | 0 (0.0%) |
| Total | 0 (0.0%) | 13 (30.9%) |
Race in Excel
The most populous races in Excel are White / Caucasian (457 | 96.6%), Black / African American (10 | 2.1%), and Native / Alaskan (4 | 0.9%).
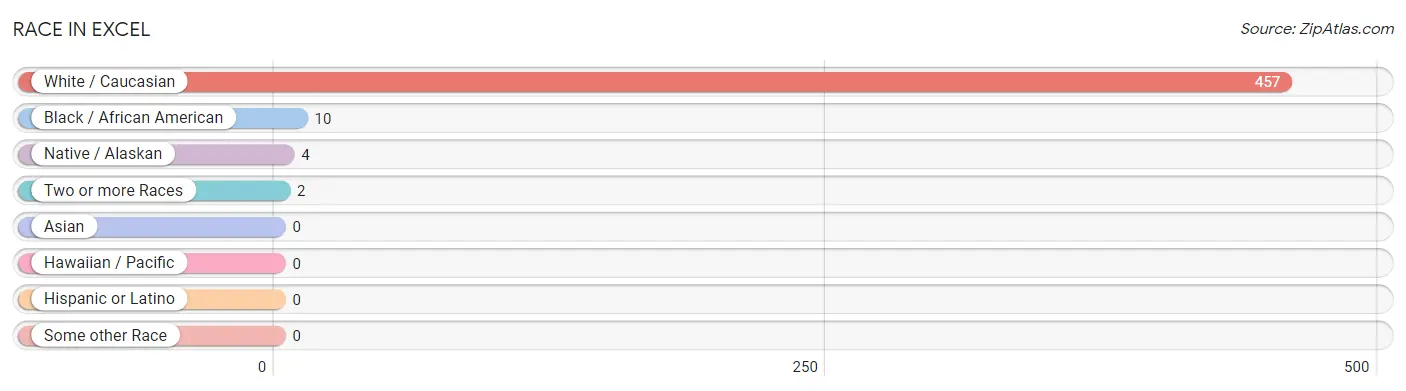
| Race | # Population | % Population |
| Asian | 0 | 0.0% |
| Black / African American | 10 | 2.1% |
| Hawaiian / Pacific | 0 | 0.0% |
| Hispanic or Latino | 0 | 0.0% |
| Native / Alaskan | 4 | 0.9% |
| White / Caucasian | 457 | 96.6% |
| Two or more Races | 2 | 0.4% |
| Some other Race | 0 | 0.0% |
| Total | 473 | 100.0% |
Ancestry in Excel
The most populous ancestries reported in Excel are American (17 | 3.6%), German (15 | 3.2%), English (14 | 3.0%), Irish (13 | 2.8%), and French (6 | 1.3%), together accounting for 13.7% of all Excel residents.
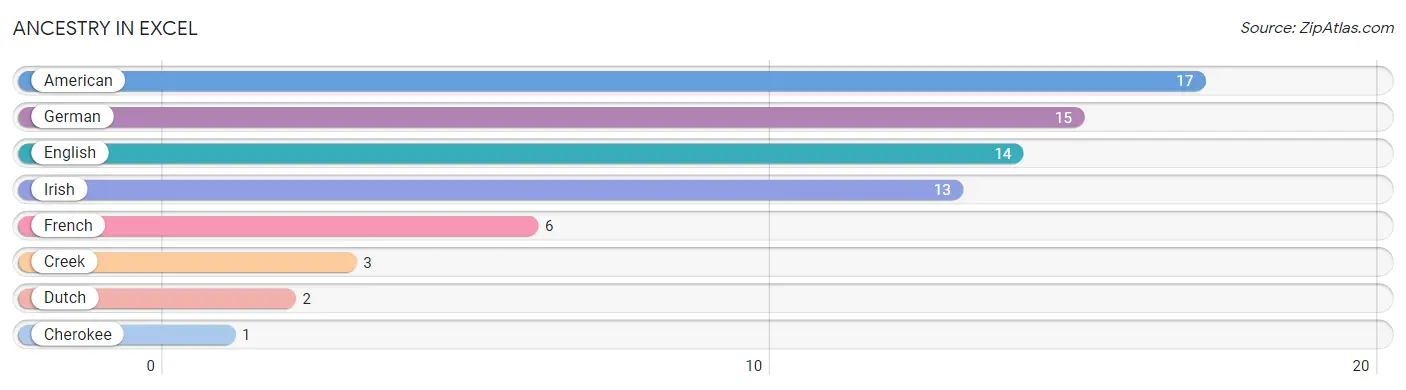
| Ancestry | # Population | % Population |
| American | 17 | 3.6% |
| Cherokee | 1 | 0.2% |
| Creek | 3 | 0.6% |
| Dutch | 2 | 0.4% |
| English | 14 | 3.0% |
| French | 6 | 1.3% |
| German | 15 | 3.2% |
| Irish | 13 | 2.8% | View All 8 Rows |
Immigrants in Excel

| Immigration Origin | # Population | % Population | View All 0 Rows |
Sex and Age in Excel
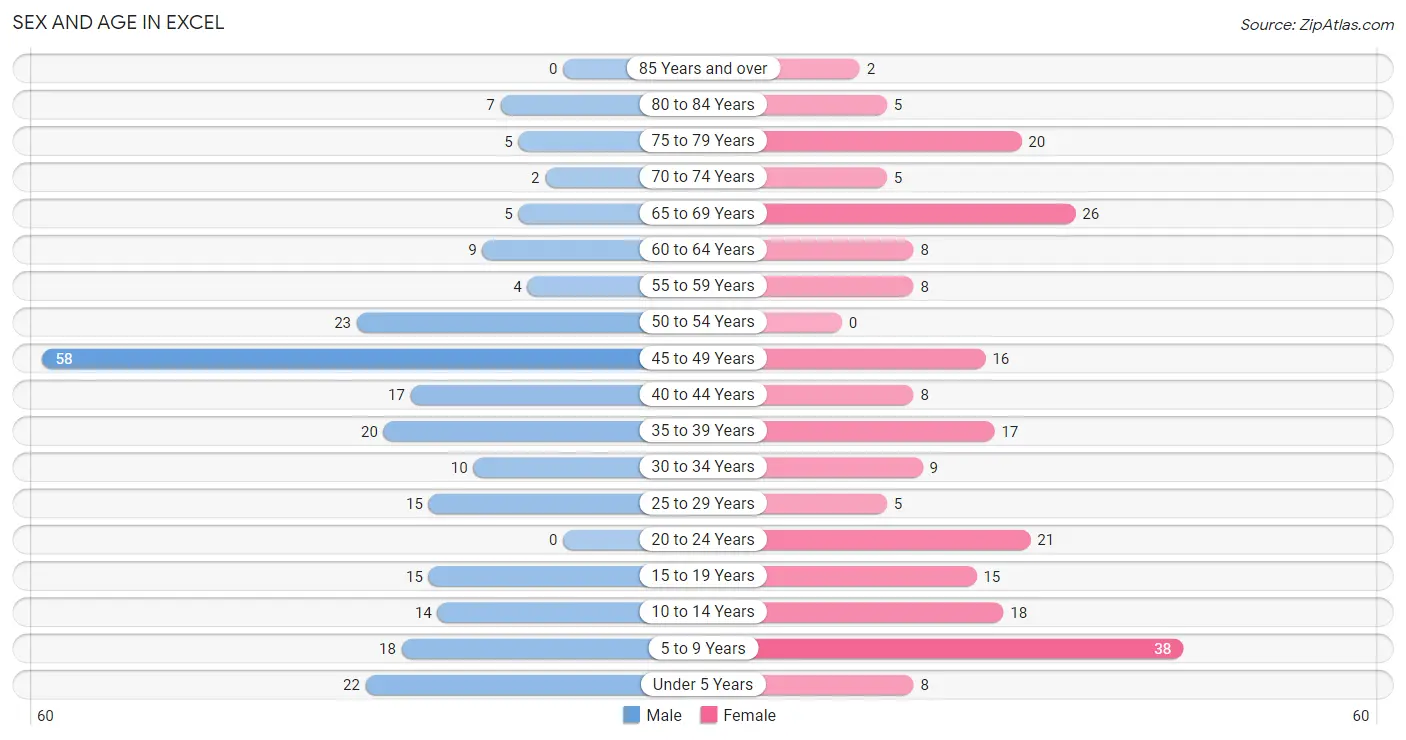
Sex and Age in Excel
The most populous age groups in Excel are 45 to 49 Years (58 | 23.8%) for men and 5 to 9 Years (38 | 16.6%) for women.
| Age Bracket | Male | Female |
| Under 5 Years | 22 (9.0%) | 8 (3.5%) |
| 5 to 9 Years | 18 (7.4%) | 38 (16.6%) |
| 10 to 14 Years | 14 (5.7%) | 18 (7.9%) |
| 15 to 19 Years | 15 (6.1%) | 15 (6.6%) |
| 20 to 24 Years | 0 (0.0%) | 21 (9.2%) |
| 25 to 29 Years | 15 (6.1%) | 5 (2.2%) |
| 30 to 34 Years | 10 (4.1%) | 9 (3.9%) |
| 35 to 39 Years | 20 (8.2%) | 17 (7.4%) |
| 40 to 44 Years | 17 (7.0%) | 8 (3.5%) |
| 45 to 49 Years | 58 (23.8%) | 16 (7.0%) |
| 50 to 54 Years | 23 (9.4%) | 0 (0.0%) |
| 55 to 59 Years | 4 (1.6%) | 8 (3.5%) |
| 60 to 64 Years | 9 (3.7%) | 8 (3.5%) |
| 65 to 69 Years | 5 (2.1%) | 26 (11.4%) |
| 70 to 74 Years | 2 (0.8%) | 5 (2.2%) |
| 75 to 79 Years | 5 (2.1%) | 20 (8.7%) |
| 80 to 84 Years | 7 (2.9%) | 5 (2.2%) |
| 85 Years and over | 0 (0.0%) | 2 (0.9%) |
| Total | 244 (100.0%) | 229 (100.0%) |
Families and Households in Excel
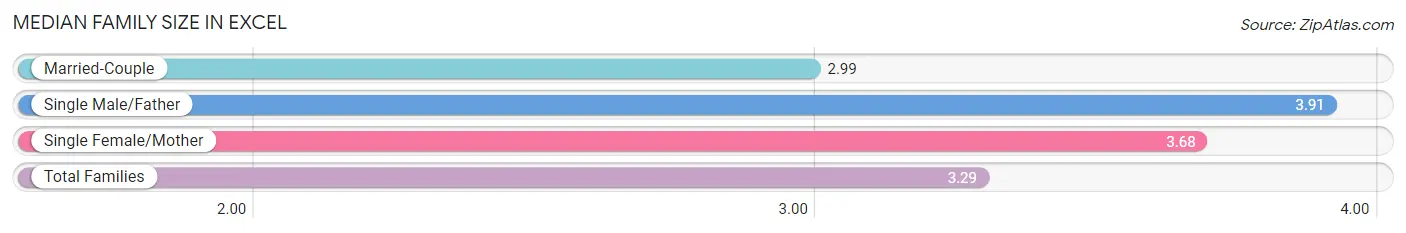
Median Family Size in Excel
The median family size in Excel is 3.29 persons per family, with single male/father families (23 | 20.3%) accounting for the largest median family size of 3.91 persons per family. On the other hand, married-couple families (71 | 62.8%) represent the smallest median family size with 2.99 persons per family.
| Family Type | # Families | Family Size |
| Married-Couple | 71 (62.8%) | 2.99 |
| Single Male/Father | 23 (20.3%) | 3.91 |
| Single Female/Mother | 19 (16.8%) | 3.68 |
| Total Families | 113 (100.0%) | 3.29 |
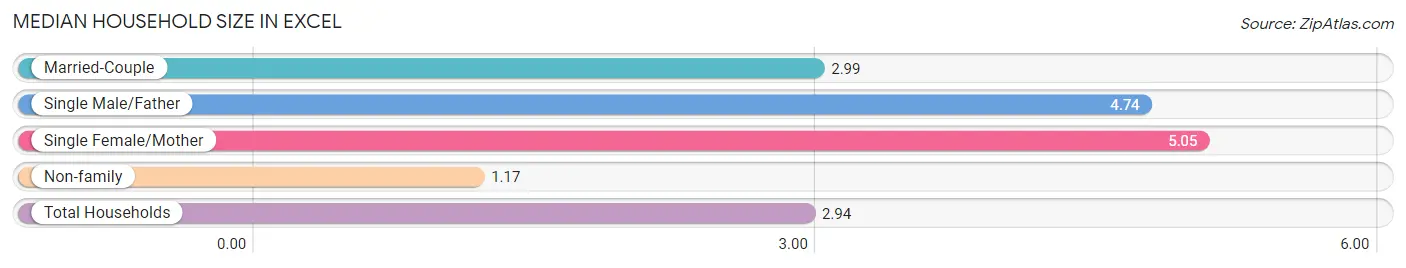
Median Household Size in Excel
The median household size in Excel is 2.94 persons per household, with single female/mother households (19 | 11.8%) accounting for the largest median household size of 5.05 persons per household. non-family households (48 | 29.8%) represent the smallest median household size with 1.17 persons per household.
| Household Type | # Households | Household Size |
| Married-Couple | 71 (44.1%) | 2.99 |
| Single Male/Father | 23 (14.3%) | 4.74 |
| Single Female/Mother | 19 (11.8%) | 5.05 |
| Non-family | 48 (29.8%) | 1.17 |
| Total Households | 161 (100.0%) | 2.94 |
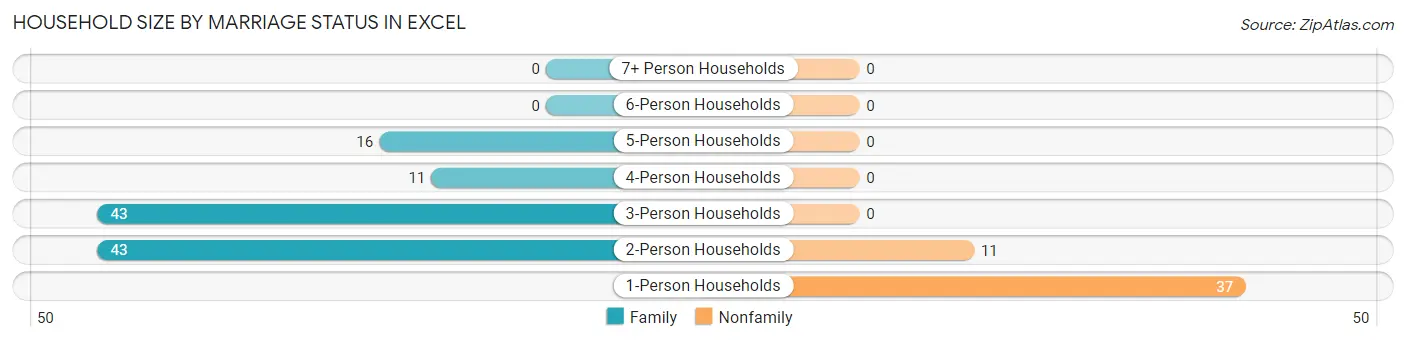
Household Size by Marriage Status in Excel
Out of a total of 161 households in Excel, 113 (70.2%) are family households, while 48 (29.8%) are nonfamily households. The most numerous type of family households are 2-person households, comprising 43, and the most common type of nonfamily households are 1-person households, comprising 37.
| Household Size | Family Households | Nonfamily Households |
| 1-Person Households | - | 37 (23.0%) |
| 2-Person Households | 43 (26.7%) | 11 (6.8%) |
| 3-Person Households | 43 (26.7%) | 0 (0.0%) |
| 4-Person Households | 11 (6.8%) | 0 (0.0%) |
| 5-Person Households | 16 (9.9%) | 0 (0.0%) |
| 6-Person Households | 0 (0.0%) | 0 (0.0%) |
| 7+ Person Households | 0 (0.0%) | 0 (0.0%) |
| Total | 113 (70.2%) | 48 (29.8%) |
Female Fertility in Excel
Fertility by Age in Excel
Average fertility rate in Excel is 209.0 births per 1,000 women. Women in the age bracket of 20 to 34 years have the highest fertility rate with 543.0 births per 1,000 women. Women in the age bracket of 20 to 34 years acount for 100.0% of all women with births.
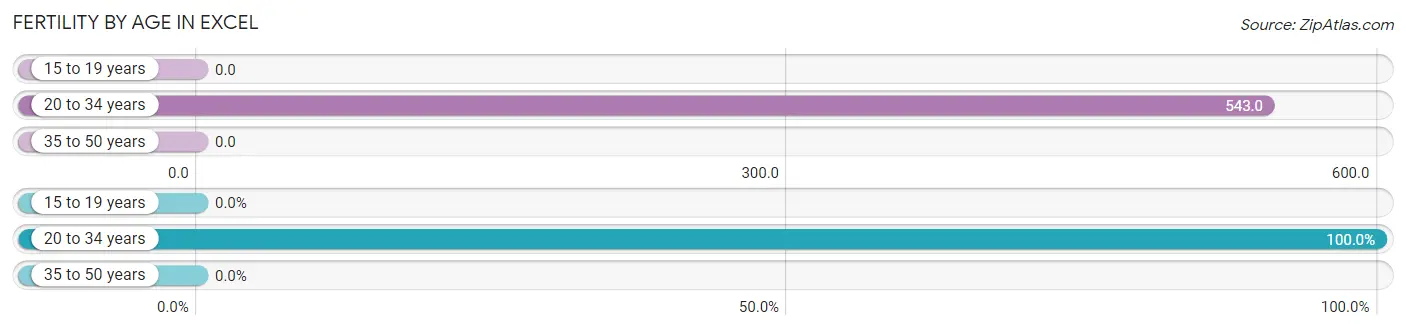
| Age Bracket | Women with Births | Births / 1,000 Women |
| 15 to 19 years | 0 (0.0%) | 0.0 |
| 20 to 34 years | 19 (100.0%) | 543.0 |
| 35 to 50 years | 0 (0.0%) | 0.0 |
| Total | 19 (100.0%) | 209.0 |
Fertility by Age by Marriage Status in Excel
31.6% of women with births (19) in Excel are married. The highest percentage of unmarried women with births falls into 20 to 34 years age bracket with 68.4% of them unmarried at the time of birth, while the lowest percentage of unmarried women with births belong to 20 to 34 years age bracket with 68.4% of them unmarried.
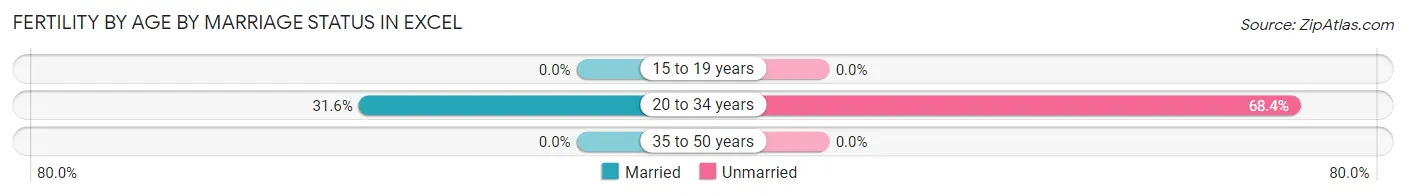
| Age Bracket | Married | Unmarried |
| 15 to 19 years | 0 (0.0%) | 0 (0.0%) |
| 20 to 34 years | 6 (31.6%) | 13 (68.4%) |
| 35 to 50 years | 0 (0.0%) | 0 (0.0%) |
| Total | 6 (31.6%) | 13 (68.4%) |
Fertility by Education in Excel
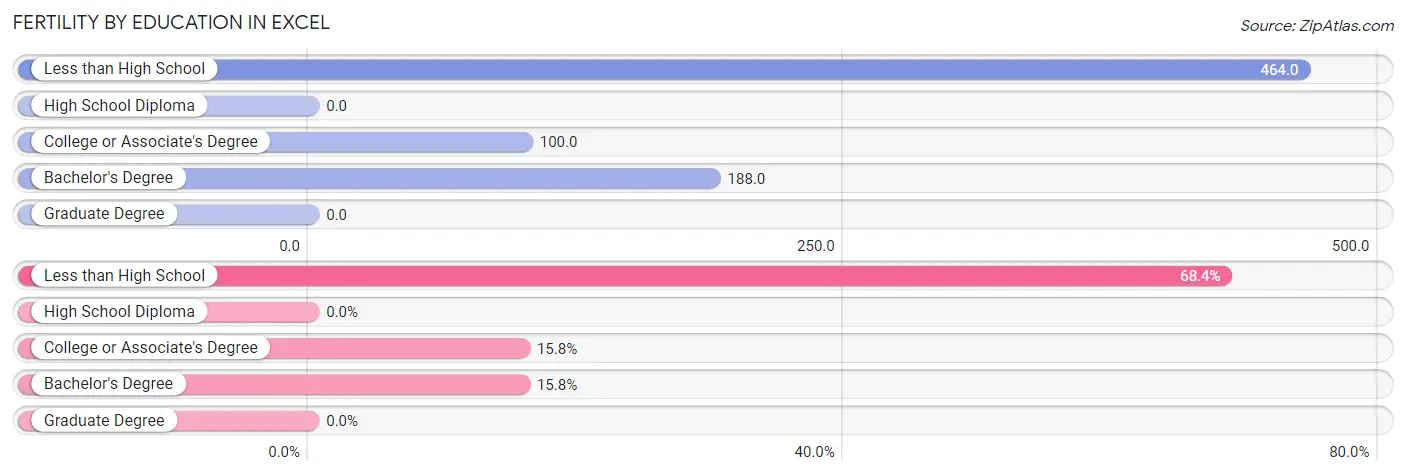
| Educational Attainment | Women with Births | Births / 1,000 Women |
| Less than High School | 13 (68.4%) | 464.0 |
| High School Diploma | 0 (0.0%) | 0.0 |
| College or Associate's Degree | 3 (15.8%) | 100.0 |
| Bachelor's Degree | 3 (15.8%) | 188.0 |
| Graduate Degree | 0 (0.0%) | 0.0 |
| Total | 19 (100.0%) | 209.0 |
Fertility by Education by Marriage Status in Excel
68.4% of women with births in Excel are unmarried. Women with the educational attainment of college or associate's degree are most likely to be married with 100.0% of them married at childbirth, while women with the educational attainment of less than high school are least likely to be married with 100.0% of them unmarried at childbirth.
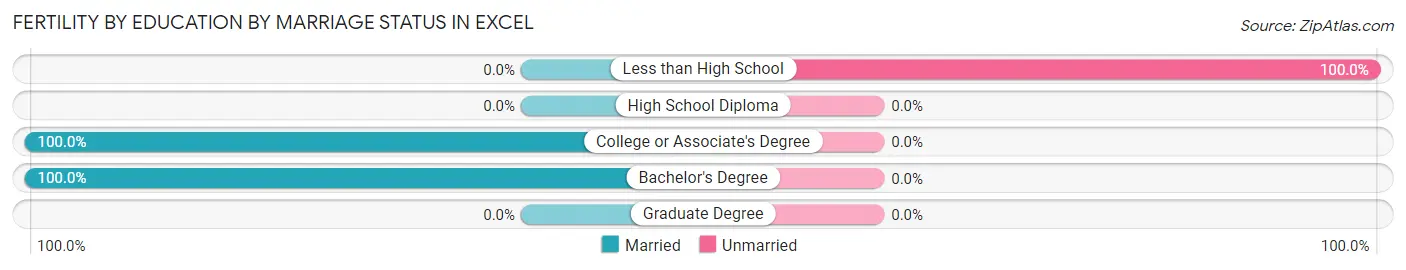
| Educational Attainment | Married | Unmarried |
| Less than High School | 0 (0.0%) | 13 (100.0%) |
| High School Diploma | 0 (0.0%) | 0 (0.0%) |
| College or Associate's Degree | 3 (100.0%) | 0 (0.0%) |
| Bachelor's Degree | 3 (100.0%) | 0 (0.0%) |
| Graduate Degree | 0 (0.0%) | 0 (0.0%) |
| Total | 6 (31.6%) | 13 (68.4%) |
Employment Characteristics in Excel
Employment by Class of Employer in Excel
Among the 174 employed individuals in Excel, private company employees (120 | 69.0%), local government employees (18 | 10.3%), and federal government employees (17 | 9.8%) make up the most common classes of employment.
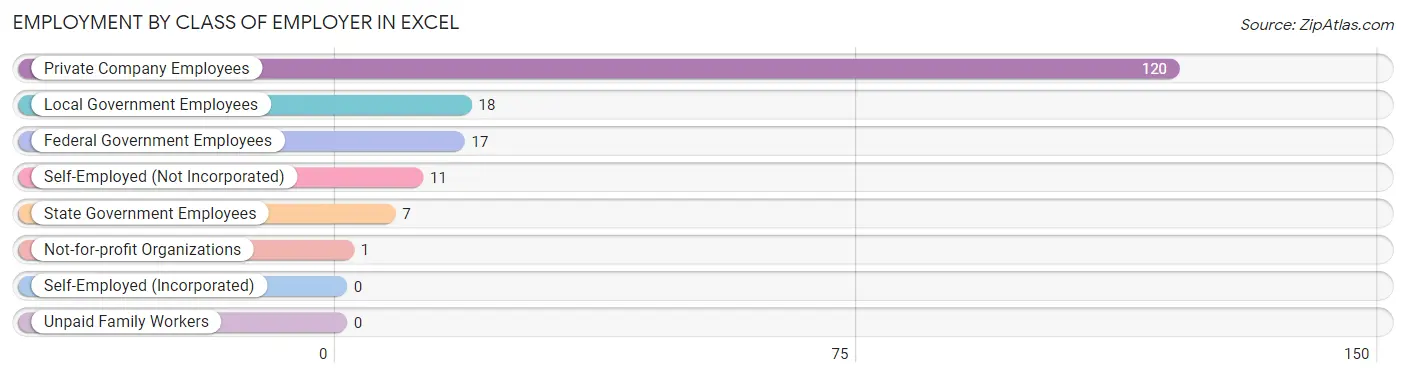
| Employer Class | # Employees | % Employees |
| Private Company Employees | 120 | 69.0% |
| Self-Employed (Incorporated) | 0 | 0.0% |
| Self-Employed (Not Incorporated) | 11 | 6.3% |
| Not-for-profit Organizations | 1 | 0.6% |
| Local Government Employees | 18 | 10.3% |
| State Government Employees | 7 | 4.0% |
| Federal Government Employees | 17 | 9.8% |
| Unpaid Family Workers | 0 | 0.0% |
| Total | 174 | 100.0% |
Employment Status by Age in Excel
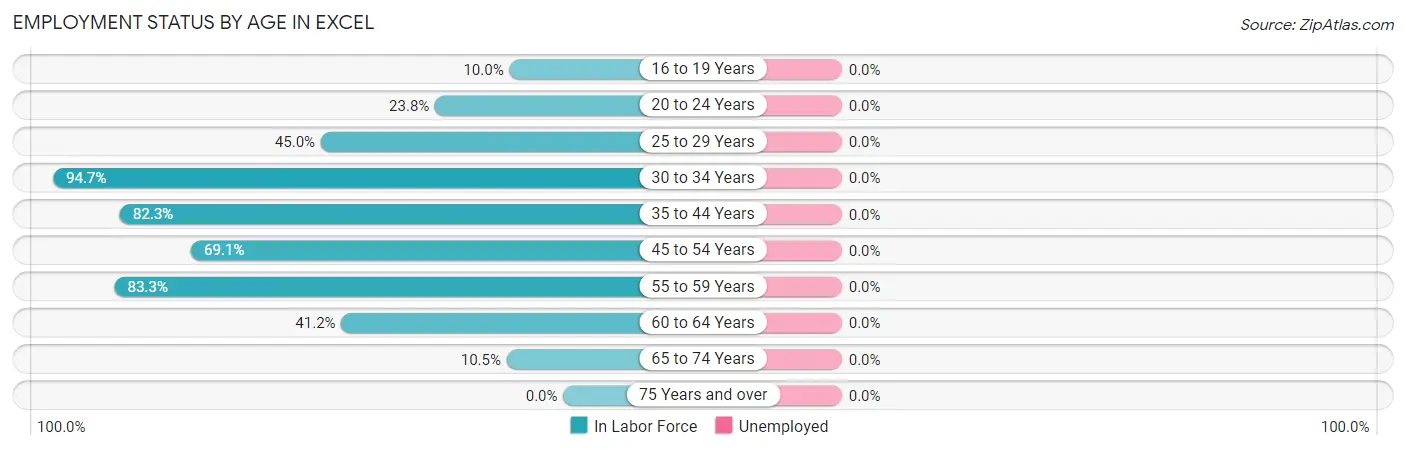
| Age Bracket | In Labor Force | Unemployed |
| 16 to 19 Years | 3 (10.0%) | 0 (0.0%) |
| 20 to 24 Years | 5 (23.8%) | 0 (0.0%) |
| 25 to 29 Years | 9 (45.0%) | 0 (0.0%) |
| 30 to 34 Years | 18 (94.7%) | 0 (0.0%) |
| 35 to 44 Years | 51 (82.3%) | 0 (0.0%) |
| 45 to 54 Years | 67 (69.1%) | 0 (0.0%) |
| 55 to 59 Years | 10 (83.3%) | 0 (0.0%) |
| 60 to 64 Years | 7 (41.2%) | 0 (0.0%) |
| 65 to 74 Years | 4 (10.5%) | 0 (0.0%) |
| 75 Years and over | 0 (0.0%) | 0 (0.0%) |
| Total | 174 (49.0%) | 0 (0.0%) |
Employment Status by Educational Attainment in Excel
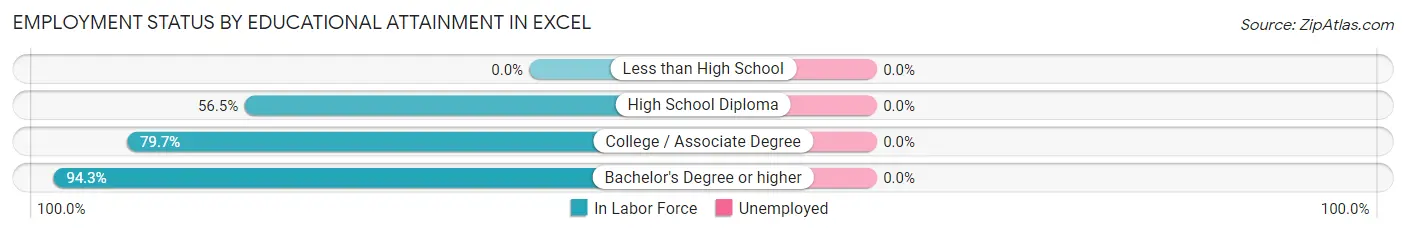
| Educational Attainment | In Labor Force | Unemployed |
| Less than High School | 0 (0.0%) | 0 (0.0%) |
| High School Diploma | 65 (56.5%) | 0 (0.0%) |
| College / Associate Degree | 47 (79.7%) | 0 (0.0%) |
| Bachelor's Degree or higher | 50 (94.3%) | 0 (0.0%) |
| Total | 162 (71.4%) | 0 (0.0%) |
Employment Occupations by Sex in Excel
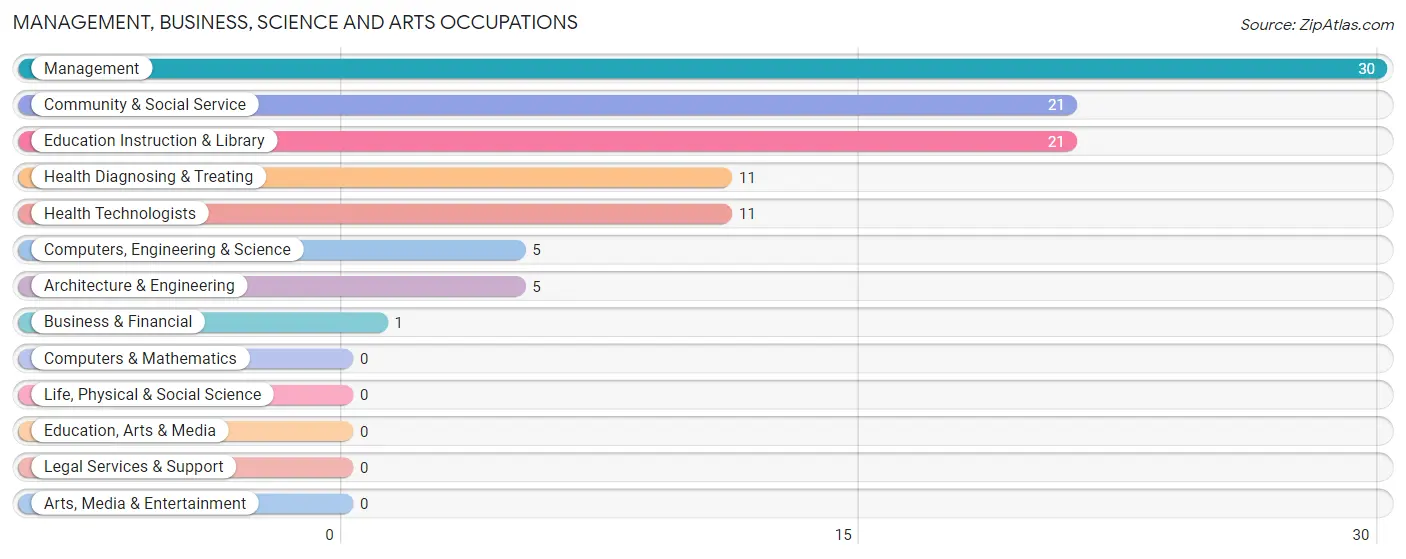
Management, Business, Science and Arts Occupations
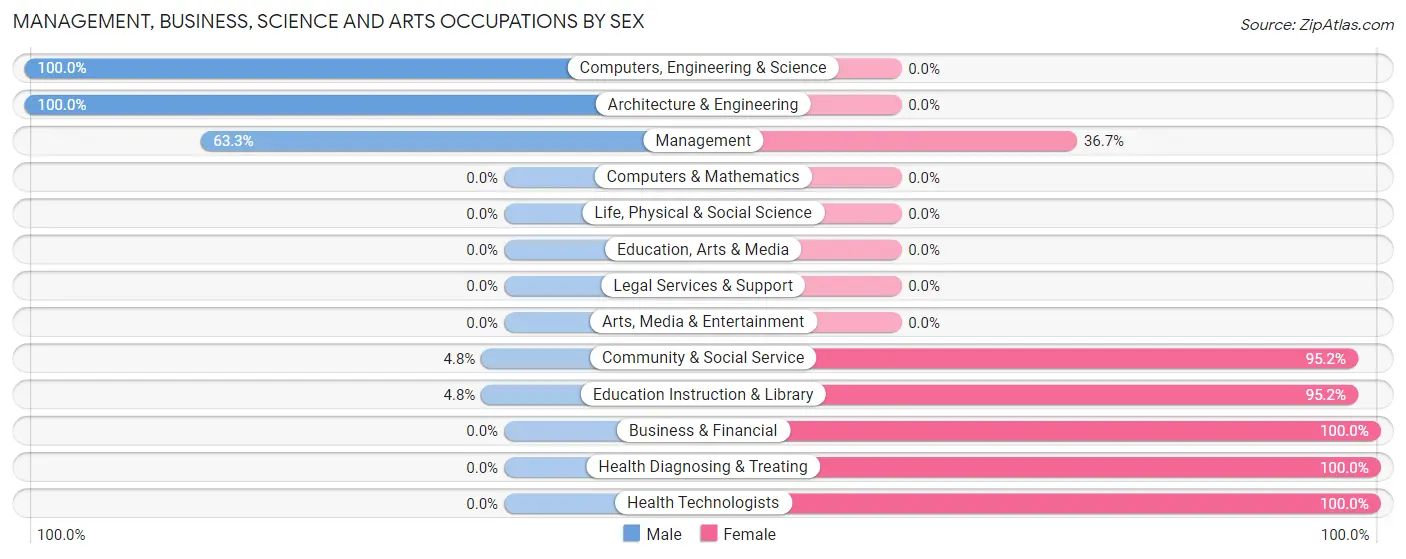
The most common Management, Business, Science and Arts occupations in Excel are Management (30 | 17.2%), Community & Social Service (21 | 12.1%), Education Instruction & Library (21 | 12.1%), Health Diagnosing & Treating (11 | 6.3%), and Health Technologists (11 | 6.3%).
Management, Business, Science and Arts Occupations by Sex
Within the Management, Business, Science and Arts occupations in Excel, the most male-oriented occupations are Computers, Engineering & Science (100.0%), Architecture & Engineering (100.0%), and Management (63.3%), while the most female-oriented occupations are Business & Financial (100.0%), Health Diagnosing & Treating (100.0%), and Health Technologists (100.0%).
| Occupation | Male | Female |
| Management | 19 (63.3%) | 11 (36.7%) |
| Business & Financial | 0 (0.0%) | 1 (100.0%) |
| Computers, Engineering & Science | 5 (100.0%) | 0 (0.0%) |
| Computers & Mathematics | 0 (0.0%) | 0 (0.0%) |
| Architecture & Engineering | 5 (100.0%) | 0 (0.0%) |
| Life, Physical & Social Science | 0 (0.0%) | 0 (0.0%) |
| Community & Social Service | 1 (4.8%) | 20 (95.2%) |
| Education, Arts & Media | 0 (0.0%) | 0 (0.0%) |
| Legal Services & Support | 0 (0.0%) | 0 (0.0%) |
| Education Instruction & Library | 1 (4.8%) | 20 (95.2%) |
| Arts, Media & Entertainment | 0 (0.0%) | 0 (0.0%) |
| Health Diagnosing & Treating | 0 (0.0%) | 11 (100.0%) |
| Health Technologists | 0 (0.0%) | 11 (100.0%) |
| Total (Category) | 25 (36.8%) | 43 (63.2%) |
| Total (Overall) | 106 (60.9%) | 68 (39.1%) |
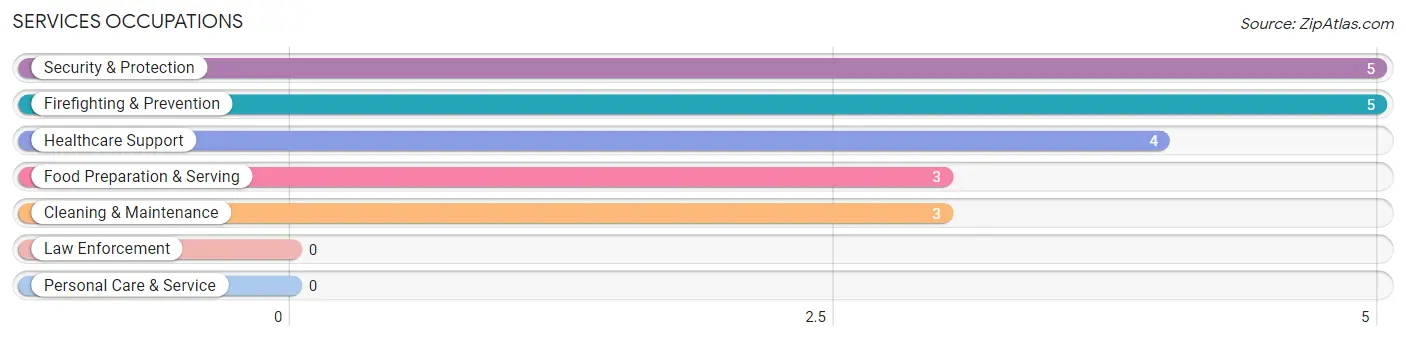
Services Occupations
The most common Services occupations in Excel are Security & Protection (5 | 2.9%), Firefighting & Prevention (5 | 2.9%), Healthcare Support (4 | 2.3%), Food Preparation & Serving (3 | 1.7%), and Cleaning & Maintenance (3 | 1.7%).
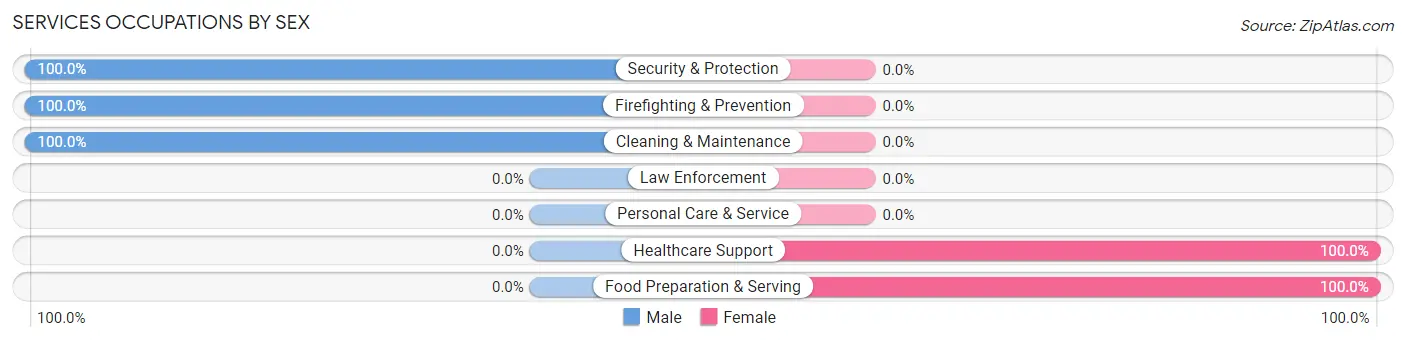
Services Occupations by Sex
Within the Services occupations in Excel, the most male-oriented occupations are Security & Protection (100.0%), Firefighting & Prevention (100.0%), and Cleaning & Maintenance (100.0%), while the most female-oriented occupations are Healthcare Support (100.0%), and Food Preparation & Serving (100.0%).
| Occupation | Male | Female |
| Healthcare Support | 0 (0.0%) | 4 (100.0%) |
| Security & Protection | 5 (100.0%) | 0 (0.0%) |
| Firefighting & Prevention | 5 (100.0%) | 0 (0.0%) |
| Law Enforcement | 0 (0.0%) | 0 (0.0%) |
| Food Preparation & Serving | 0 (0.0%) | 3 (100.0%) |
| Cleaning & Maintenance | 3 (100.0%) | 0 (0.0%) |
| Personal Care & Service | 0 (0.0%) | 0 (0.0%) |
| Total (Category) | 8 (53.3%) | 7 (46.7%) |
| Total (Overall) | 106 (60.9%) | 68 (39.1%) |
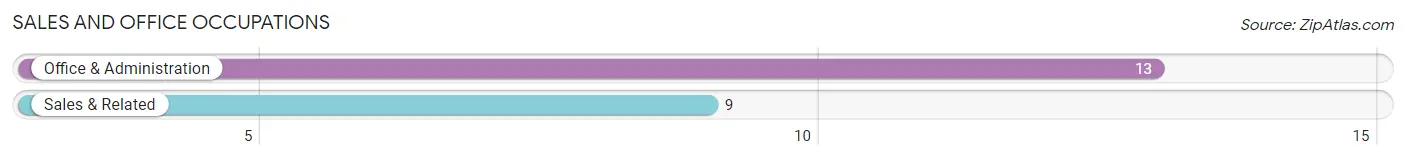
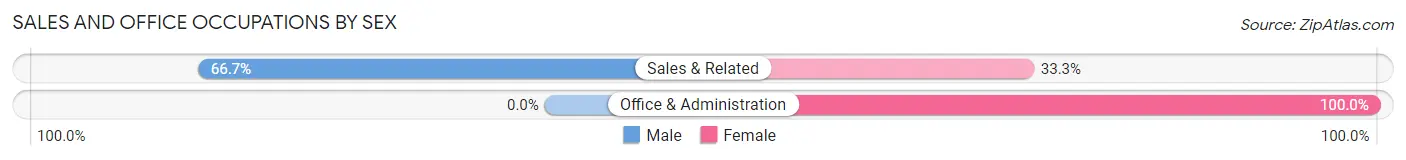
Sales and Office Occupations
The most common Sales and Office occupations in Excel are Office & Administration (13 | 7.5%), and Sales & Related (9 | 5.2%).
Sales and Office Occupations by Sex
| Occupation | Male | Female |
| Sales & Related | 6 (66.7%) | 3 (33.3%) |
| Office & Administration | 0 (0.0%) | 13 (100.0%) |
| Total (Category) | 6 (27.3%) | 16 (72.7%) |
| Total (Overall) | 106 (60.9%) | 68 (39.1%) |
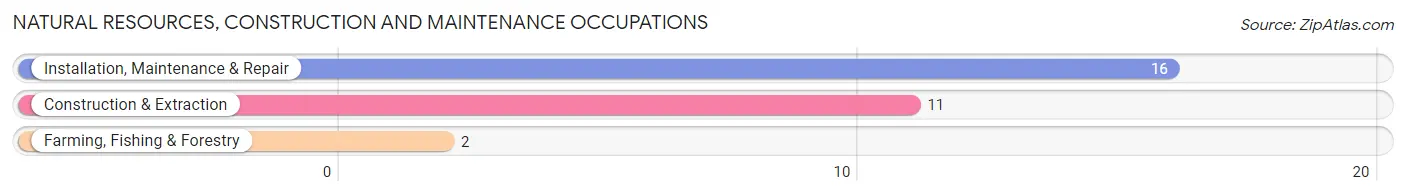
Natural Resources, Construction and Maintenance Occupations
The most common Natural Resources, Construction and Maintenance occupations in Excel are Installation, Maintenance & Repair (16 | 9.2%), Construction & Extraction (11 | 6.3%), and Farming, Fishing & Forestry (2 | 1.1%).
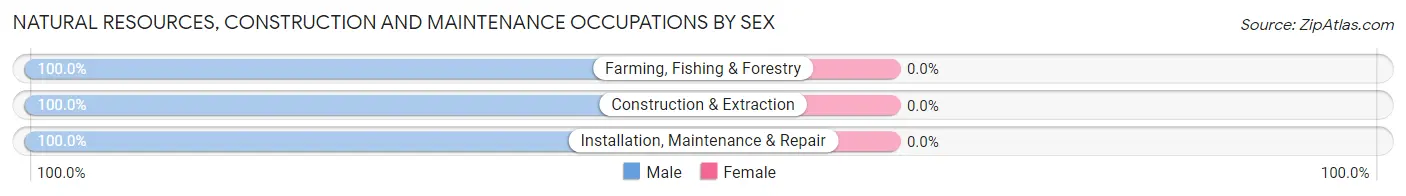
Natural Resources, Construction and Maintenance Occupations by Sex
| Occupation | Male | Female |
| Farming, Fishing & Forestry | 2 (100.0%) | 0 (0.0%) |
| Construction & Extraction | 11 (100.0%) | 0 (0.0%) |
| Installation, Maintenance & Repair | 16 (100.0%) | 0 (0.0%) |
| Total (Category) | 29 (100.0%) | 0 (0.0%) |
| Total (Overall) | 106 (60.9%) | 68 (39.1%) |
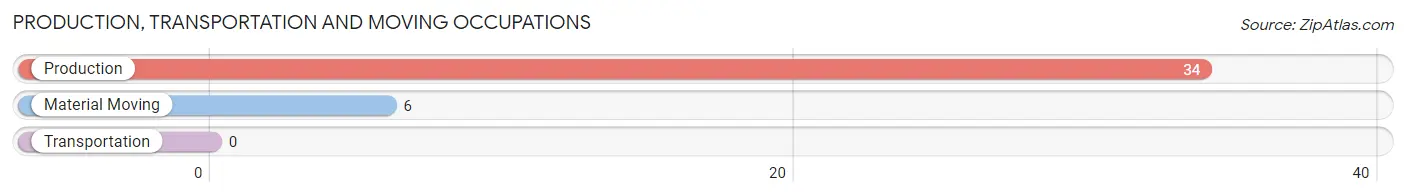
Production, Transportation and Moving Occupations
The most common Production, Transportation and Moving occupations in Excel are Production (34 | 19.5%), and Material Moving (6 | 3.5%).
Production, Transportation and Moving Occupations by Sex
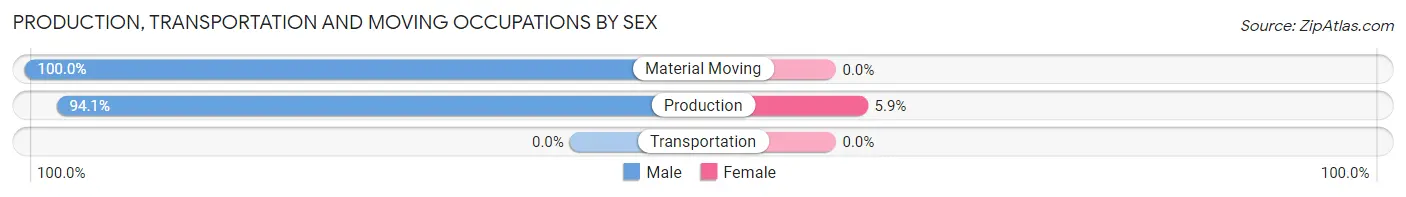
| Occupation | Male | Female |
| Production | 32 (94.1%) | 2 (5.9%) |
| Transportation | 0 (0.0%) | 0 (0.0%) |
| Material Moving | 6 (100.0%) | 0 (0.0%) |
| Total (Category) | 38 (95.0%) | 2 (5.0%) |
| Total (Overall) | 106 (60.9%) | 68 (39.1%) |
Employment Industries by Sex in Excel
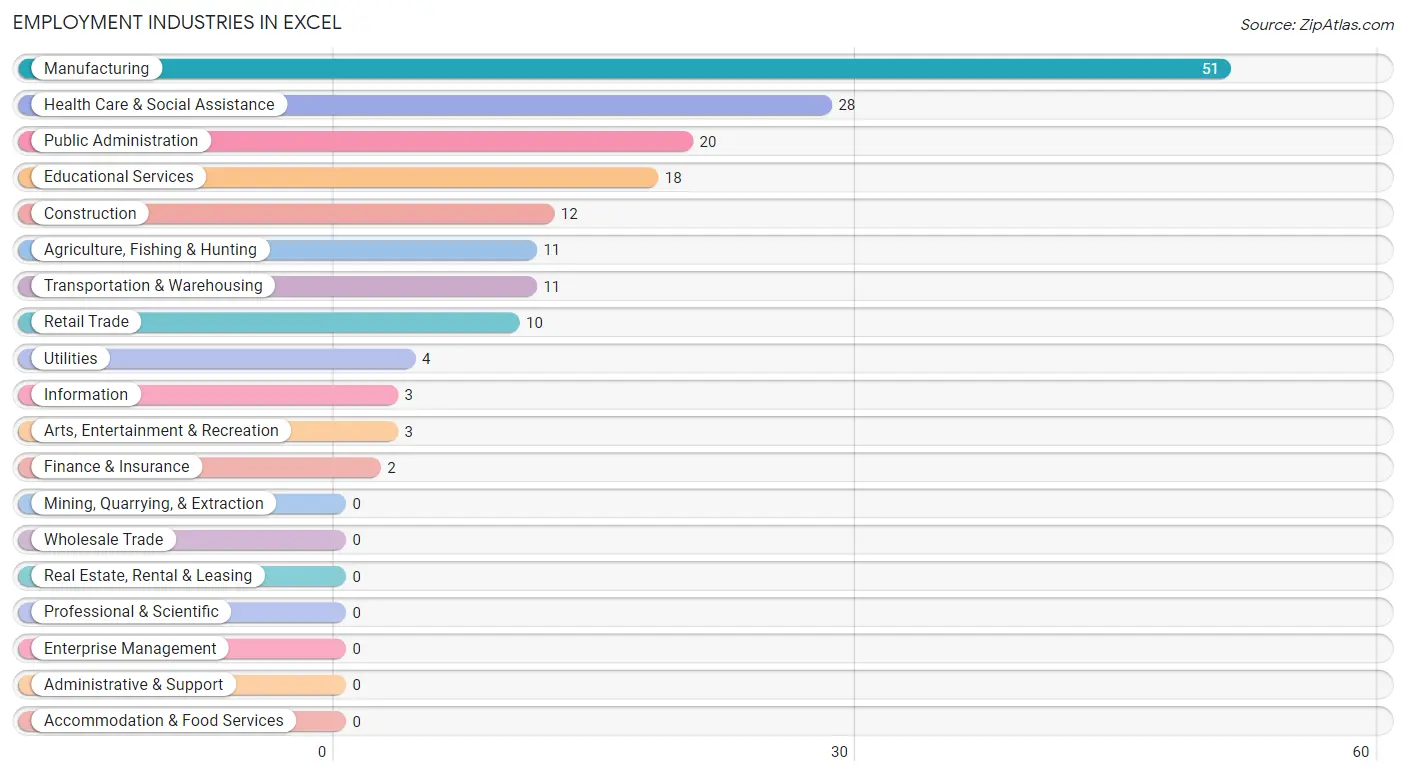
Employment Industries in Excel
The major employment industries in Excel include Manufacturing (51 | 29.3%), Health Care & Social Assistance (28 | 16.1%), Public Administration (20 | 11.5%), Educational Services (18 | 10.3%), and Construction (12 | 6.9%).
Employment Industries by Sex in Excel
The Excel industries that see more men than women are Agriculture, Fishing & Hunting (100.0%), Construction (100.0%), and Information (100.0%), whereas the industries that tend to have a higher number of women are Utilities (100.0%), Health Care & Social Assistance (100.0%), and Arts, Entertainment & Recreation (100.0%).
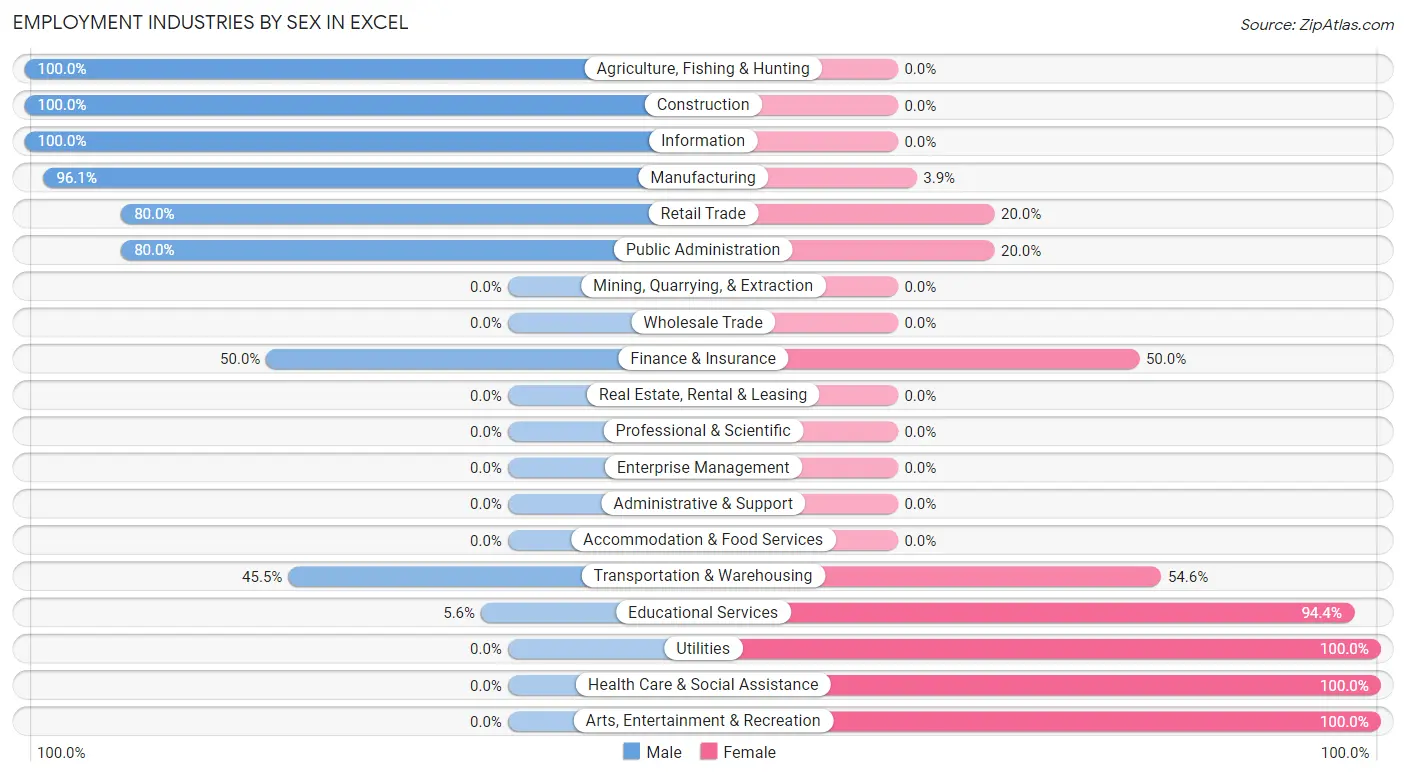
| Industry | Male | Female |
| Agriculture, Fishing & Hunting | 11 (100.0%) | 0 (0.0%) |
| Mining, Quarrying, & Extraction | 0 (0.0%) | 0 (0.0%) |
| Construction | 12 (100.0%) | 0 (0.0%) |
| Manufacturing | 49 (96.1%) | 2 (3.9%) |
| Wholesale Trade | 0 (0.0%) | 0 (0.0%) |
| Retail Trade | 8 (80.0%) | 2 (20.0%) |
| Transportation & Warehousing | 5 (45.5%) | 6 (54.5%) |
| Utilities | 0 (0.0%) | 4 (100.0%) |
| Information | 3 (100.0%) | 0 (0.0%) |
| Finance & Insurance | 1 (50.0%) | 1 (50.0%) |
| Real Estate, Rental & Leasing | 0 (0.0%) | 0 (0.0%) |
| Professional & Scientific | 0 (0.0%) | 0 (0.0%) |
| Enterprise Management | 0 (0.0%) | 0 (0.0%) |
| Administrative & Support | 0 (0.0%) | 0 (0.0%) |
| Educational Services | 1 (5.6%) | 17 (94.4%) |
| Health Care & Social Assistance | 0 (0.0%) | 28 (100.0%) |
| Arts, Entertainment & Recreation | 0 (0.0%) | 3 (100.0%) |
| Accommodation & Food Services | 0 (0.0%) | 0 (0.0%) |
| Public Administration | 16 (80.0%) | 4 (20.0%) |
| Total | 106 (60.9%) | 68 (39.1%) |
Education in Excel
School Enrollment in Excel
The most common levels of schooling among the 119 students in Excel are kindergarten (32 | 26.9%), high school (31 | 26.1%), and middle school (24 | 20.2%).
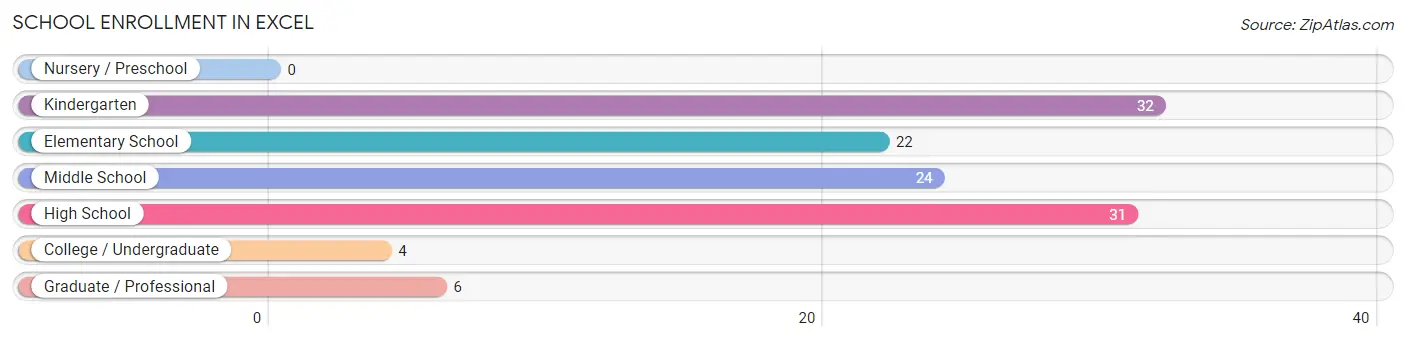
| School Level | # Students | % Students |
| Nursery / Preschool | 0 | 0.0% |
| Kindergarten | 32 | 26.9% |
| Elementary School | 22 | 18.5% |
| Middle School | 24 | 20.2% |
| High School | 31 | 26.1% |
| College / Undergraduate | 4 | 3.4% |
| Graduate / Professional | 6 | 5.0% |
| Total | 119 | 100.0% |
School Enrollment by Age by Funding Source in Excel
Out of a total of 119 students who are enrolled in schools in Excel, 5 (4.2%) attend a private institution, while the remaining 114 (95.8%) are enrolled in public schools. The age group of 35 years and over has the highest likelihood of being enrolled in private schools, with 5 (50.0% in the age bracket) enrolled. Conversely, the age group of 5 to 9 year old has the lowest likelihood of being enrolled in a private school, with 54 (100.0% in the age bracket) attending a public institution.
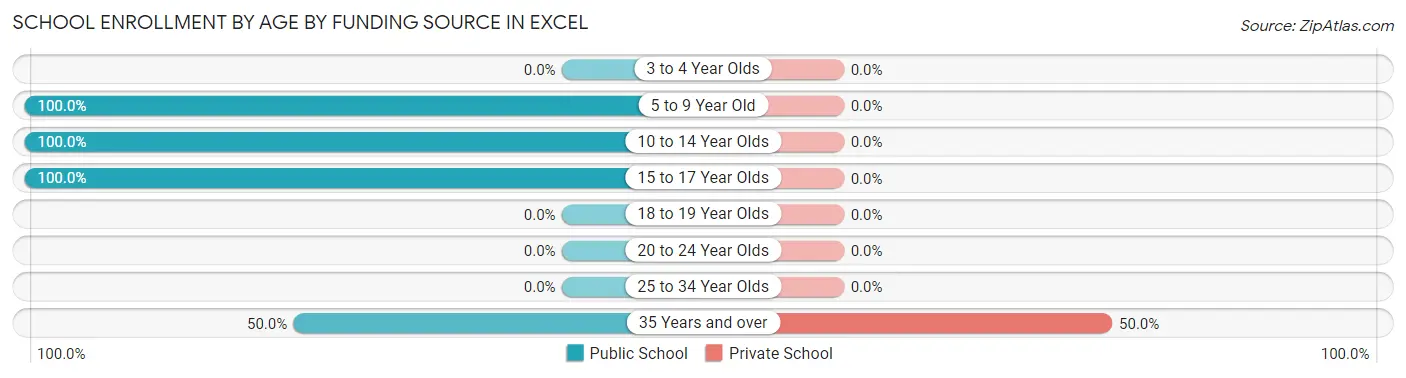
| Age Bracket | Public School | Private School |
| 3 to 4 Year Olds | 0 (0.0%) | 0 (0.0%) |
| 5 to 9 Year Old | 54 (100.0%) | 0 (0.0%) |
| 10 to 14 Year Olds | 25 (100.0%) | 0 (0.0%) |
| 15 to 17 Year Olds | 30 (100.0%) | 0 (0.0%) |
| 18 to 19 Year Olds | 0 (0.0%) | 0 (0.0%) |
| 20 to 24 Year Olds | 0 (0.0%) | 0 (0.0%) |
| 25 to 34 Year Olds | 0 (0.0%) | 0 (0.0%) |
| 35 Years and over | 5 (50.0%) | 5 (50.0%) |
| Total | 114 (95.8%) | 5 (4.2%) |
Educational Attainment by Field of Study in Excel
Science & technology (27 | 47.4%), business (13 | 22.8%), arts & humanities (7 | 12.3%), engineering (6 | 10.5%), and liberal arts & history (3 | 5.3%) are the most common fields of study among 57 individuals in Excel who have obtained a bachelor's degree or higher.
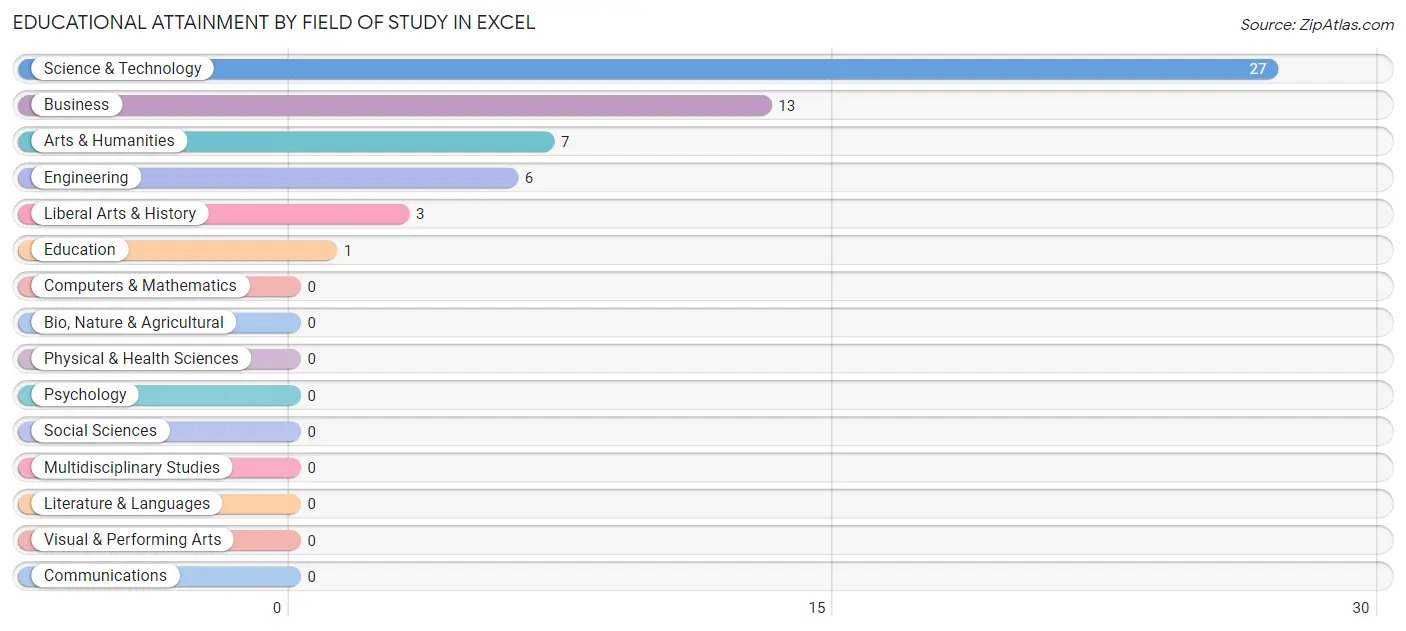
| Field of Study | # Graduates | % Graduates |
| Computers & Mathematics | 0 | 0.0% |
| Bio, Nature & Agricultural | 0 | 0.0% |
| Physical & Health Sciences | 0 | 0.0% |
| Psychology | 0 | 0.0% |
| Social Sciences | 0 | 0.0% |
| Engineering | 6 | 10.5% |
| Multidisciplinary Studies | 0 | 0.0% |
| Science & Technology | 27 | 47.4% |
| Business | 13 | 22.8% |
| Education | 1 | 1.8% |
| Literature & Languages | 0 | 0.0% |
| Liberal Arts & History | 3 | 5.3% |
| Visual & Performing Arts | 0 | 0.0% |
| Communications | 0 | 0.0% |
| Arts & Humanities | 7 | 12.3% |
| Total | 57 | 100.0% |
Transportation & Commute in Excel
Vehicle Availability by Sex in Excel
The most prevalent vehicle ownership categories in Excel are males with 2 vehicles (60, accounting for 56.6%) and females with 2 vehicles (32, making up 88.2%).
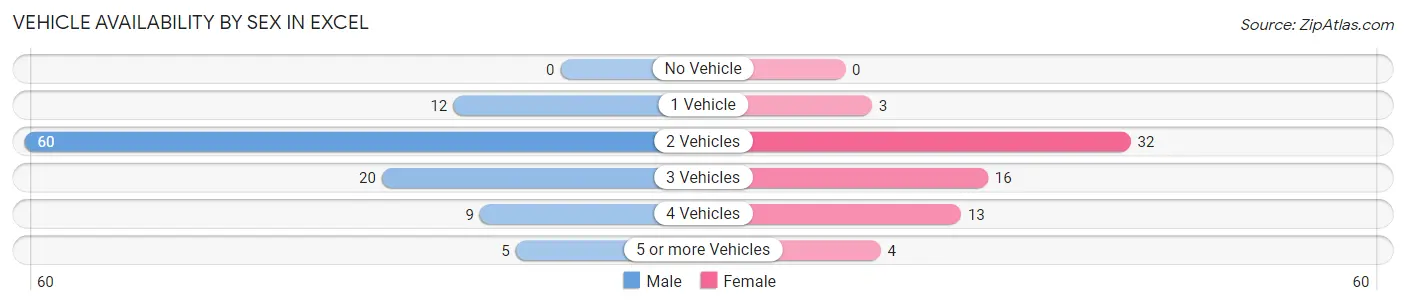
| Vehicles Available | Male | Female |
| No Vehicle | 0 (0.0%) | 0 (0.0%) |
| 1 Vehicle | 12 (11.3%) | 3 (4.4%) |
| 2 Vehicles | 60 (56.6%) | 32 (47.1%) |
| 3 Vehicles | 20 (18.9%) | 16 (23.5%) |
| 4 Vehicles | 9 (8.5%) | 13 (19.1%) |
| 5 or more Vehicles | 5 (4.7%) | 4 (5.9%) |
| Total | 106 (100.0%) | 68 (100.0%) |
Commute Time in Excel
The most frequently occuring commute durations in Excel are 45 to 59 minutes (38 commuters, 22.0%), less than 5 minutes (27 commuters, 15.6%), and 10 to 14 minutes (22 commuters, 12.7%).
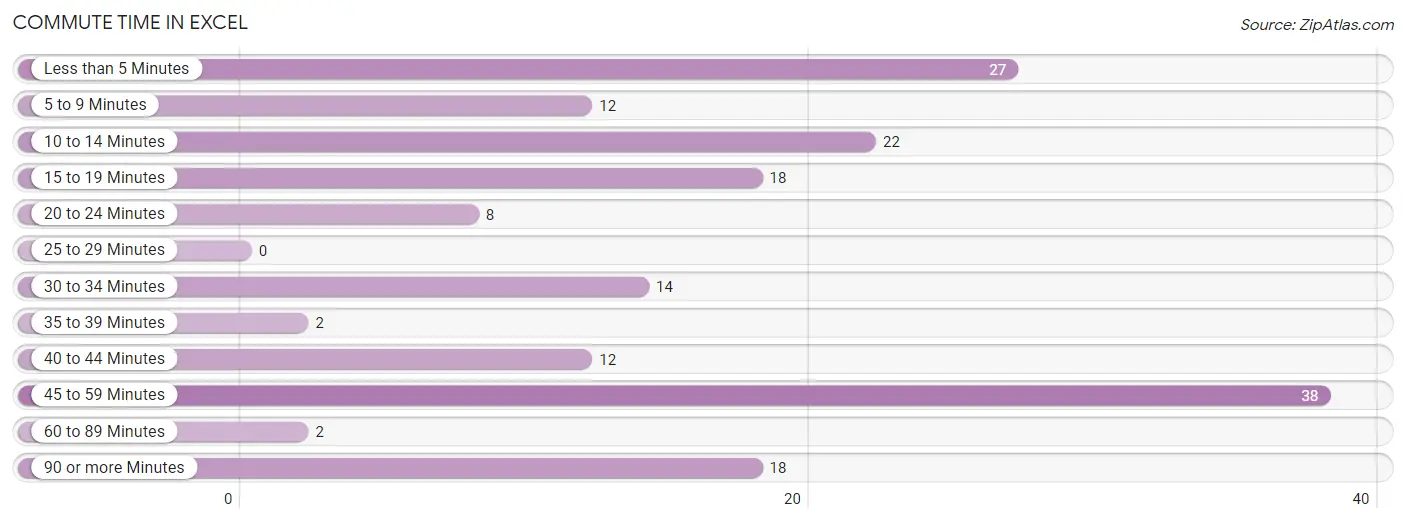
| Commute Time | # Commuters | % Commuters |
| Less than 5 Minutes | 27 | 15.6% |
| 5 to 9 Minutes | 12 | 6.9% |
| 10 to 14 Minutes | 22 | 12.7% |
| 15 to 19 Minutes | 18 | 10.4% |
| 20 to 24 Minutes | 8 | 4.6% |
| 25 to 29 Minutes | 0 | 0.0% |
| 30 to 34 Minutes | 14 | 8.1% |
| 35 to 39 Minutes | 2 | 1.2% |
| 40 to 44 Minutes | 12 | 6.9% |
| 45 to 59 Minutes | 38 | 22.0% |
| 60 to 89 Minutes | 2 | 1.2% |
| 90 or more Minutes | 18 | 10.4% |
Commute Time by Sex in Excel
The most common commute times in Excel are 45 to 59 minutes (38 commuters, 35.8%) for males and less than 5 minutes (19 commuters, 28.4%) for females.
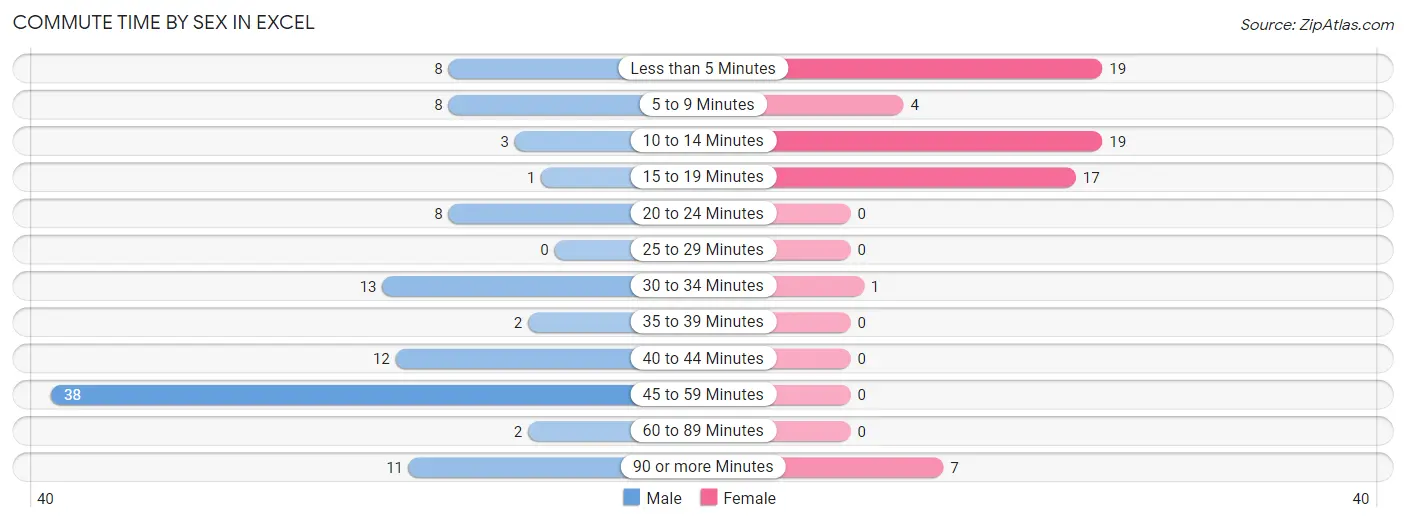
| Commute Time | Male | Female |
| Less than 5 Minutes | 8 (7.5%) | 19 (28.4%) |
| 5 to 9 Minutes | 8 (7.5%) | 4 (6.0%) |
| 10 to 14 Minutes | 3 (2.8%) | 19 (28.4%) |
| 15 to 19 Minutes | 1 (0.9%) | 17 (25.4%) |
| 20 to 24 Minutes | 8 (7.5%) | 0 (0.0%) |
| 25 to 29 Minutes | 0 (0.0%) | 0 (0.0%) |
| 30 to 34 Minutes | 13 (12.3%) | 1 (1.5%) |
| 35 to 39 Minutes | 2 (1.9%) | 0 (0.0%) |
| 40 to 44 Minutes | 12 (11.3%) | 0 (0.0%) |
| 45 to 59 Minutes | 38 (35.8%) | 0 (0.0%) |
| 60 to 89 Minutes | 2 (1.9%) | 0 (0.0%) |
| 90 or more Minutes | 11 (10.4%) | 7 (10.4%) |
Time of Departure to Work by Sex in Excel
The most frequent times of departure to work in Excel are 7:00 AM to 7:29 AM (48, 45.3%) for males and 6:00 AM to 6:29 AM (18, 26.9%) for females.
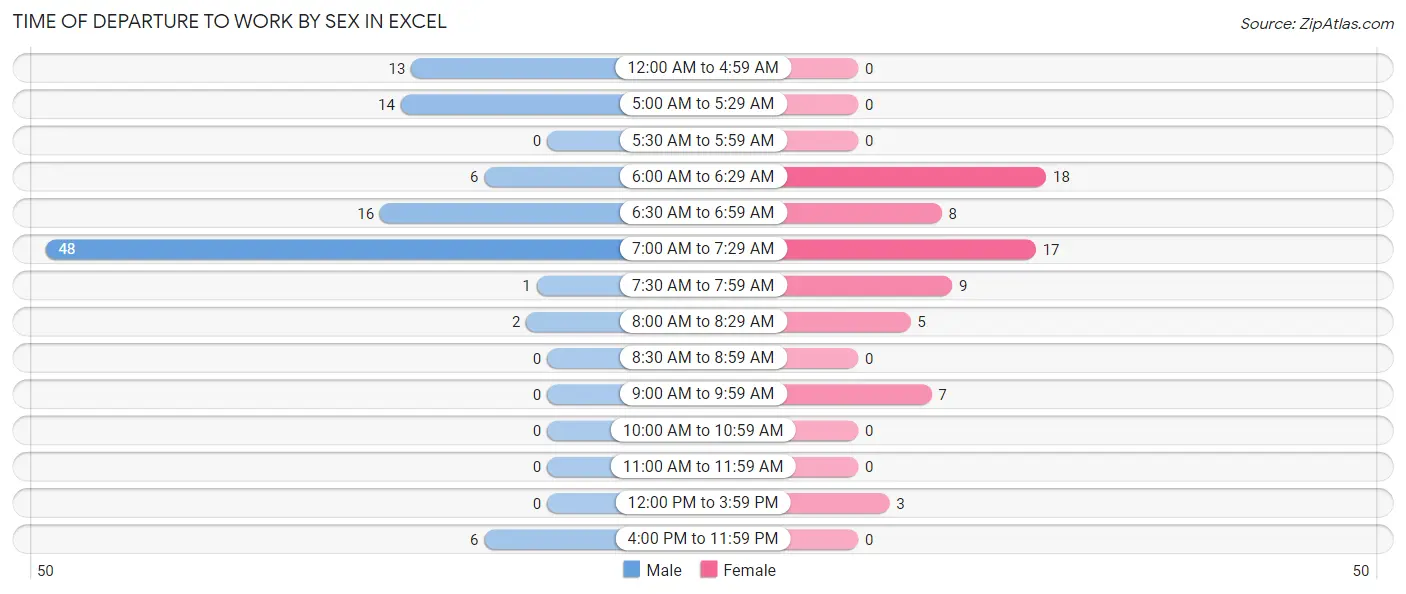
| Time of Departure | Male | Female |
| 12:00 AM to 4:59 AM | 13 (12.3%) | 0 (0.0%) |
| 5:00 AM to 5:29 AM | 14 (13.2%) | 0 (0.0%) |
| 5:30 AM to 5:59 AM | 0 (0.0%) | 0 (0.0%) |
| 6:00 AM to 6:29 AM | 6 (5.7%) | 18 (26.9%) |
| 6:30 AM to 6:59 AM | 16 (15.1%) | 8 (11.9%) |
| 7:00 AM to 7:29 AM | 48 (45.3%) | 17 (25.4%) |
| 7:30 AM to 7:59 AM | 1 (0.9%) | 9 (13.4%) |
| 8:00 AM to 8:29 AM | 2 (1.9%) | 5 (7.5%) |
| 8:30 AM to 8:59 AM | 0 (0.0%) | 0 (0.0%) |
| 9:00 AM to 9:59 AM | 0 (0.0%) | 7 (10.4%) |
| 10:00 AM to 10:59 AM | 0 (0.0%) | 0 (0.0%) |
| 11:00 AM to 11:59 AM | 0 (0.0%) | 0 (0.0%) |
| 12:00 PM to 3:59 PM | 0 (0.0%) | 3 (4.5%) |
| 4:00 PM to 11:59 PM | 6 (5.7%) | 0 (0.0%) |
| Total | 106 (100.0%) | 67 (100.0%) |
Housing Occupancy in Excel
Occupancy by Ownership in Excel
Of the total 161 dwellings in Excel, owner-occupied units account for 126 (78.3%), while renter-occupied units make up 35 (21.7%).
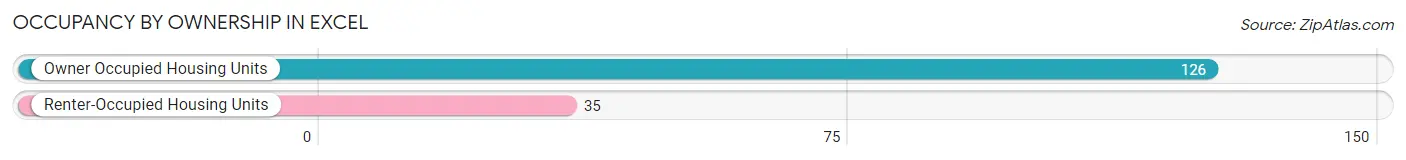
| Occupancy | # Housing Units | % Housing Units |
| Owner Occupied Housing Units | 126 | 78.3% |
| Renter-Occupied Housing Units | 35 | 21.7% |
| Total Occupied Housing Units | 161 | 100.0% |
Occupancy by Household Size in Excel
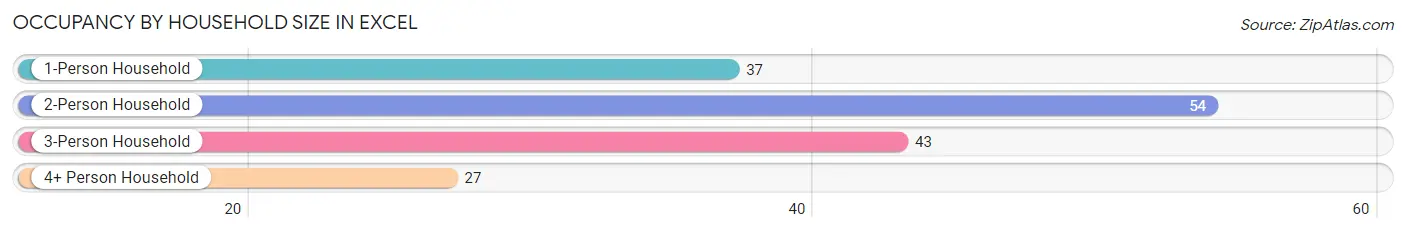
| Household Size | # Housing Units | % Housing Units |
| 1-Person Household | 37 | 23.0% |
| 2-Person Household | 54 | 33.5% |
| 3-Person Household | 43 | 26.7% |
| 4+ Person Household | 27 | 16.8% |
| Total Housing Units | 161 | 100.0% |
Occupancy by Ownership by Household Size in Excel
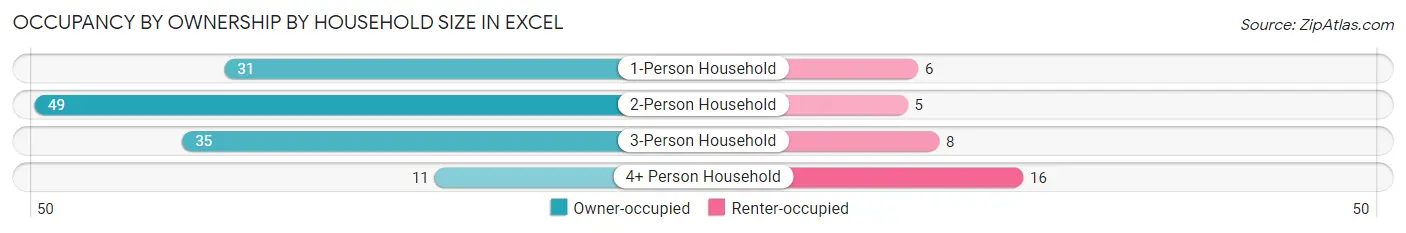
| Household Size | Owner-occupied | Renter-occupied |
| 1-Person Household | 31 (83.8%) | 6 (16.2%) |
| 2-Person Household | 49 (90.7%) | 5 (9.3%) |
| 3-Person Household | 35 (81.4%) | 8 (18.6%) |
| 4+ Person Household | 11 (40.7%) | 16 (59.3%) |
| Total Housing Units | 126 (78.3%) | 35 (21.7%) |
Occupancy by Educational Attainment in Excel
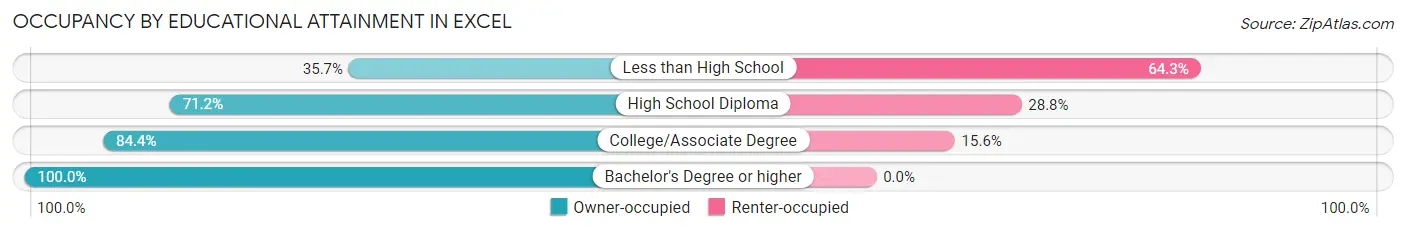
| Household Size | Owner-occupied | Renter-occupied |
| Less than High School | 5 (35.7%) | 9 (64.3%) |
| High School Diploma | 47 (71.2%) | 19 (28.8%) |
| College/Associate Degree | 38 (84.4%) | 7 (15.6%) |
| Bachelor's Degree or higher | 36 (100.0%) | 0 (0.0%) |
Occupancy by Age of Householder in Excel
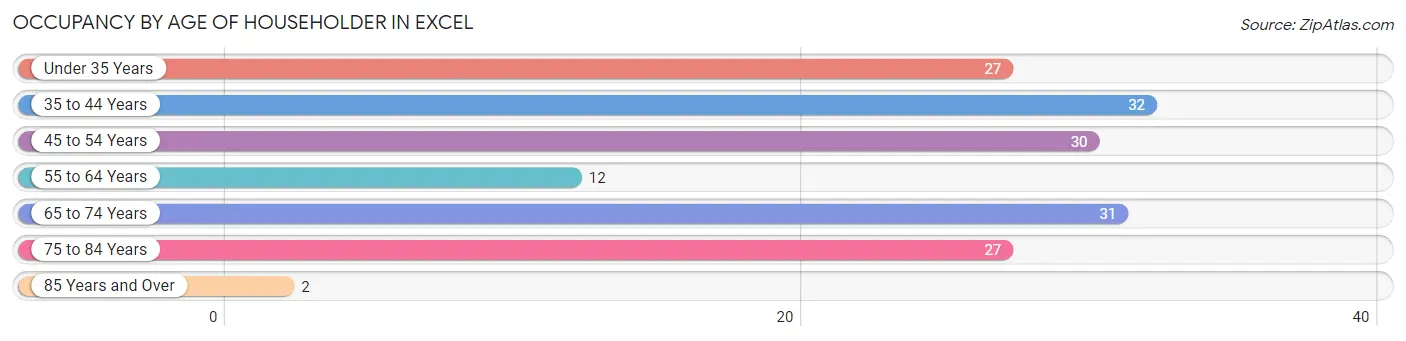
| Age Bracket | # Households | % Households |
| Under 35 Years | 27 | 16.8% |
| 35 to 44 Years | 32 | 19.9% |
| 45 to 54 Years | 30 | 18.6% |
| 55 to 64 Years | 12 | 7.4% |
| 65 to 74 Years | 31 | 19.3% |
| 75 to 84 Years | 27 | 16.8% |
| 85 Years and Over | 2 | 1.2% |
| Total | 161 | 100.0% |
Housing Finances in Excel
Median Income by Occupancy in Excel
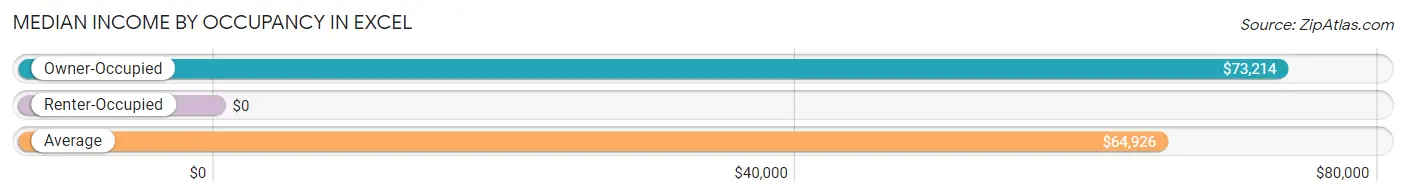
| Occupancy Type | # Households | Median Income |
| Owner-Occupied | 126 (78.3%) | $73,214 |
| Renter-Occupied | 35 (21.7%) | $0 |
| Average | 161 (100.0%) | $64,926 |
Occupancy by Householder Income Bracket in Excel
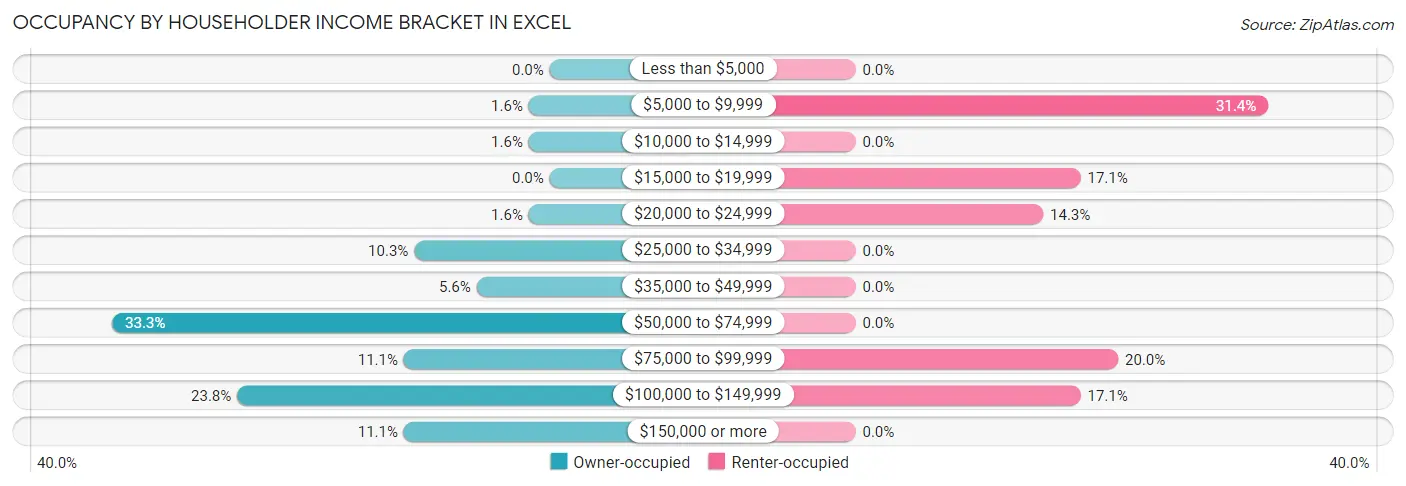
| Income Bracket | Owner-occupied | Renter-occupied |
| Less than $5,000 | 0 (0.0%) | 0 (0.0%) |
| $5,000 to $9,999 | 2 (1.6%) | 11 (31.4%) |
| $10,000 to $14,999 | 2 (1.6%) | 0 (0.0%) |
| $15,000 to $19,999 | 0 (0.0%) | 6 (17.1%) |
| $20,000 to $24,999 | 2 (1.6%) | 5 (14.3%) |
| $25,000 to $34,999 | 13 (10.3%) | 0 (0.0%) |
| $35,000 to $49,999 | 7 (5.6%) | 0 (0.0%) |
| $50,000 to $74,999 | 42 (33.3%) | 0 (0.0%) |
| $75,000 to $99,999 | 14 (11.1%) | 7 (20.0%) |
| $100,000 to $149,999 | 30 (23.8%) | 6 (17.1%) |
| $150,000 or more | 14 (11.1%) | 0 (0.0%) |
| Total | 126 (100.0%) | 35 (100.0%) |
Monthly Housing Cost Tiers in Excel
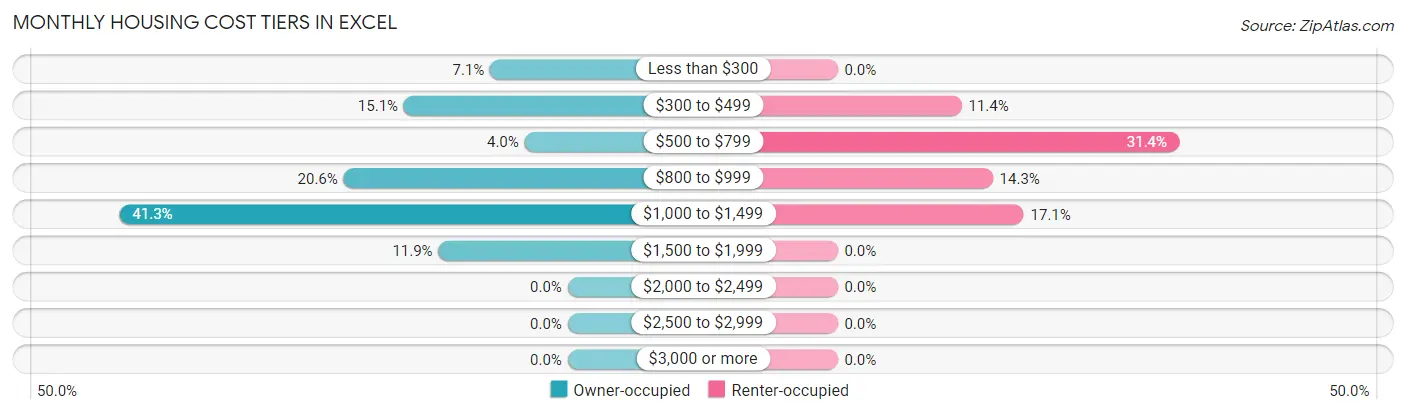
| Monthly Cost | Owner-occupied | Renter-occupied |
| Less than $300 | 9 (7.1%) | 0 (0.0%) |
| $300 to $499 | 19 (15.1%) | 4 (11.4%) |
| $500 to $799 | 5 (4.0%) | 11 (31.4%) |
| $800 to $999 | 26 (20.6%) | 5 (14.3%) |
| $1,000 to $1,499 | 52 (41.3%) | 6 (17.1%) |
| $1,500 to $1,999 | 15 (11.9%) | 0 (0.0%) |
| $2,000 to $2,499 | 0 (0.0%) | 0 (0.0%) |
| $2,500 to $2,999 | 0 (0.0%) | 0 (0.0%) |
| $3,000 or more | 0 (0.0%) | 0 (0.0%) |
| Total | 126 (100.0%) | 35 (100.0%) |
Physical Housing Characteristics in Excel
Housing Structures in Excel
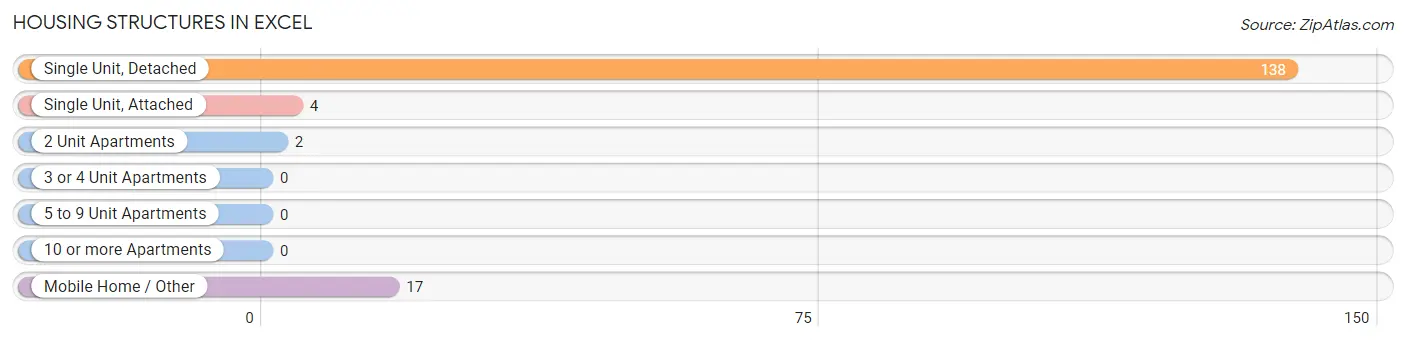
| Structure Type | # Housing Units | % Housing Units |
| Single Unit, Detached | 138 | 85.7% |
| Single Unit, Attached | 4 | 2.5% |
| 2 Unit Apartments | 2 | 1.2% |
| 3 or 4 Unit Apartments | 0 | 0.0% |
| 5 to 9 Unit Apartments | 0 | 0.0% |
| 10 or more Apartments | 0 | 0.0% |
| Mobile Home / Other | 17 | 10.6% |
| Total | 161 | 100.0% |
Housing Structures by Occupancy in Excel
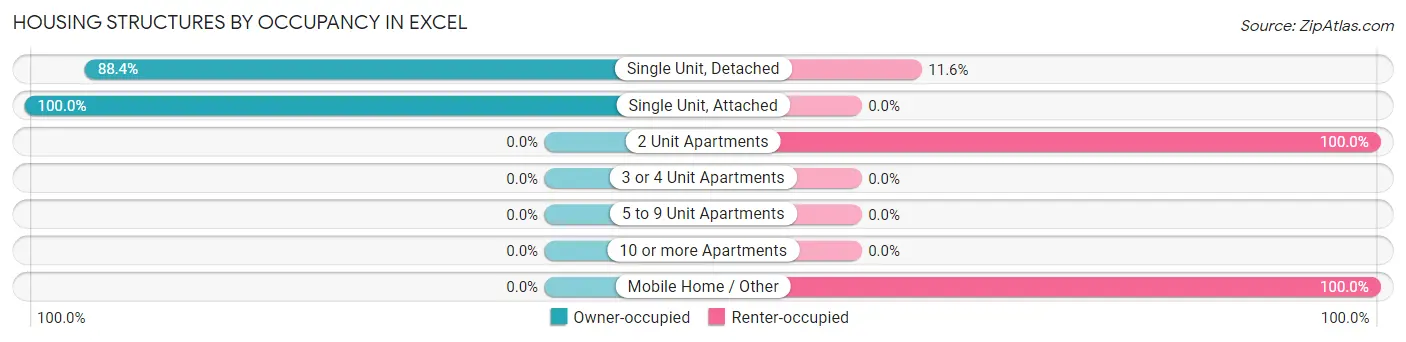
| Structure Type | Owner-occupied | Renter-occupied |
| Single Unit, Detached | 122 (88.4%) | 16 (11.6%) |
| Single Unit, Attached | 4 (100.0%) | 0 (0.0%) |
| 2 Unit Apartments | 0 (0.0%) | 2 (100.0%) |
| 3 or 4 Unit Apartments | 0 (0.0%) | 0 (0.0%) |
| 5 to 9 Unit Apartments | 0 (0.0%) | 0 (0.0%) |
| 10 or more Apartments | 0 (0.0%) | 0 (0.0%) |
| Mobile Home / Other | 0 (0.0%) | 17 (100.0%) |
| Total | 126 (78.3%) | 35 (21.7%) |
Housing Structures by Number of Rooms in Excel
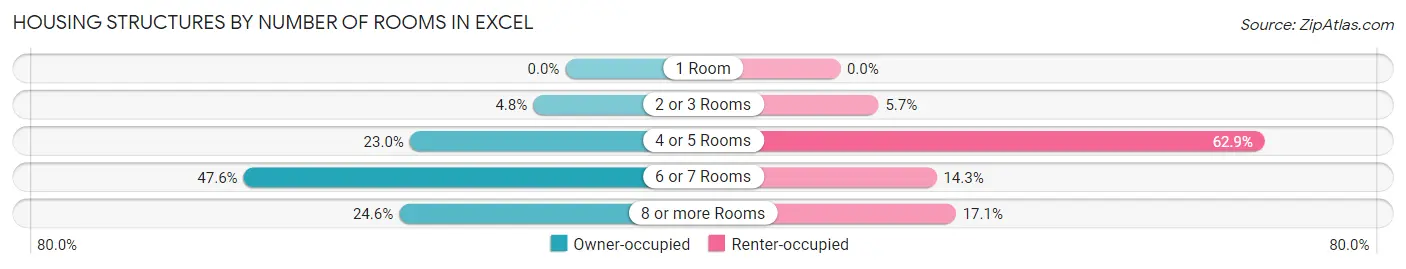
| Number of Rooms | Owner-occupied | Renter-occupied |
| 1 Room | 0 (0.0%) | 0 (0.0%) |
| 2 or 3 Rooms | 6 (4.8%) | 2 (5.7%) |
| 4 or 5 Rooms | 29 (23.0%) | 22 (62.9%) |
| 6 or 7 Rooms | 60 (47.6%) | 5 (14.3%) |
| 8 or more Rooms | 31 (24.6%) | 6 (17.1%) |
| Total | 126 (100.0%) | 35 (100.0%) |
Housing Structure by Heating Type in Excel
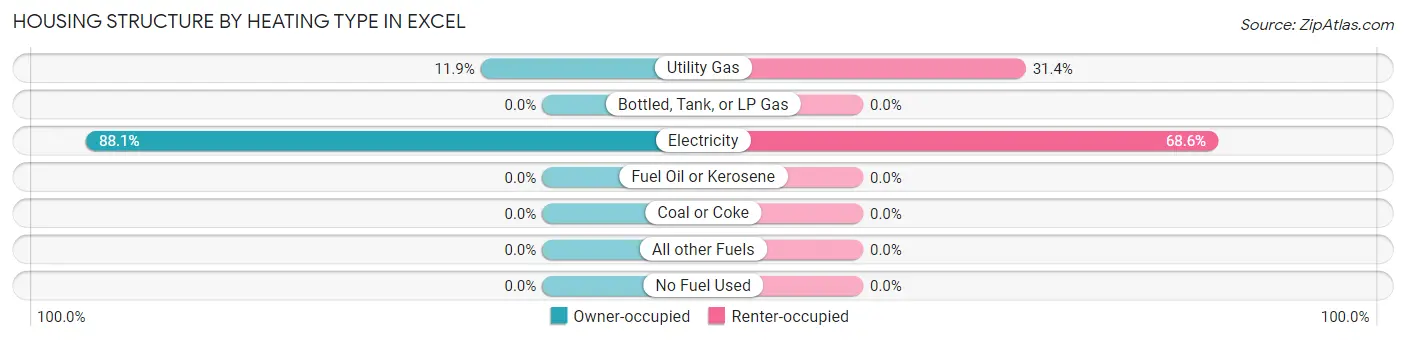
| Heating Type | Owner-occupied | Renter-occupied |
| Utility Gas | 15 (11.9%) | 11 (31.4%) |
| Bottled, Tank, or LP Gas | 0 (0.0%) | 0 (0.0%) |
| Electricity | 111 (88.1%) | 24 (68.6%) |
| Fuel Oil or Kerosene | 0 (0.0%) | 0 (0.0%) |
| Coal or Coke | 0 (0.0%) | 0 (0.0%) |
| All other Fuels | 0 (0.0%) | 0 (0.0%) |
| No Fuel Used | 0 (0.0%) | 0 (0.0%) |
| Total | 126 (100.0%) | 35 (100.0%) |
Household Vehicle Usage in Excel
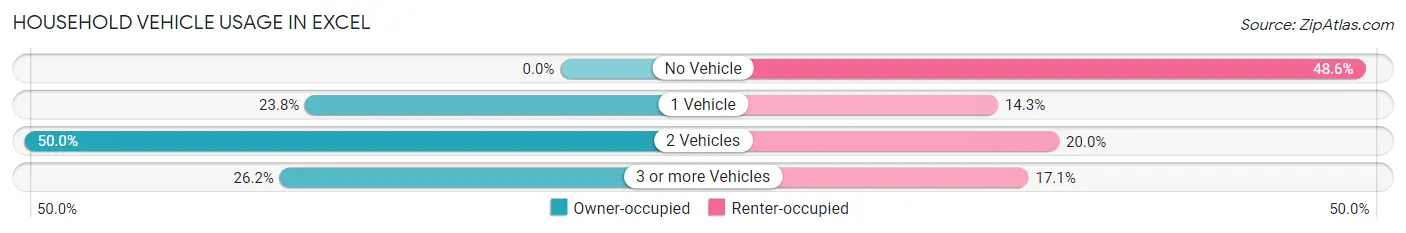
| Vehicles per Household | Owner-occupied | Renter-occupied |
| No Vehicle | 0 (0.0%) | 17 (48.6%) |
| 1 Vehicle | 30 (23.8%) | 5 (14.3%) |
| 2 Vehicles | 63 (50.0%) | 7 (20.0%) |
| 3 or more Vehicles | 33 (26.2%) | 6 (17.1%) |
| Total | 126 (100.0%) | 35 (100.0%) |
Real Estate & Mortgages in Excel
Real Estate and Mortgage Overview in Excel
| Characteristic | Without Mortgage | With Mortgage |
| Housing Units | 36 | 90 |
| Median Property Value | $190,900 | $119,800 |
| Median Household Income | $41,250 | $14 |
| Monthly Housing Costs | $356 | $0 |
| Real Estate Taxes | - | - |
Property Value by Mortgage Status in Excel
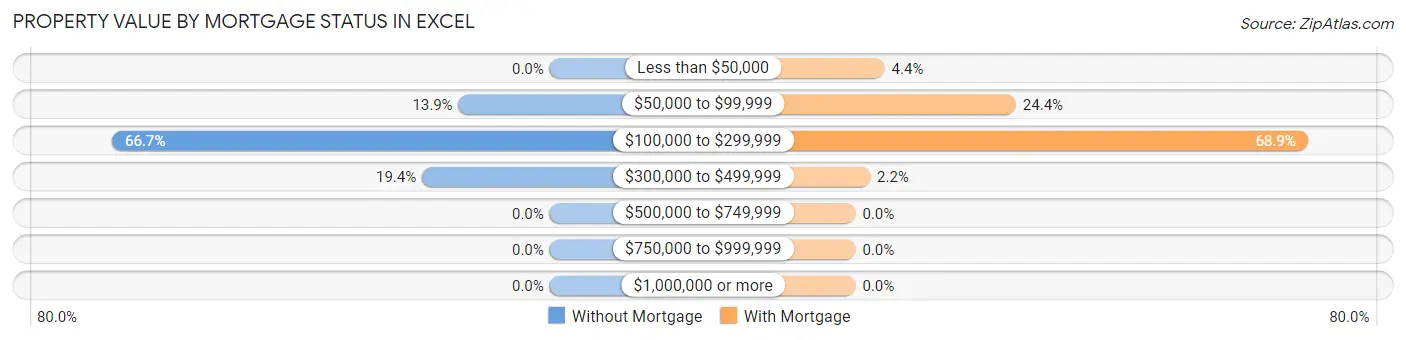
| Property Value | Without Mortgage | With Mortgage |
| Less than $50,000 | 0 (0.0%) | 4 (4.4%) |
| $50,000 to $99,999 | 5 (13.9%) | 22 (24.4%) |
| $100,000 to $299,999 | 24 (66.7%) | 62 (68.9%) |
| $300,000 to $499,999 | 7 (19.4%) | 2 (2.2%) |
| $500,000 to $749,999 | 0 (0.0%) | 0 (0.0%) |
| $750,000 to $999,999 | 0 (0.0%) | 0 (0.0%) |
| $1,000,000 or more | 0 (0.0%) | 0 (0.0%) |
| Total | 36 (100.0%) | 90 (100.0%) |
Household Income by Mortgage Status in Excel
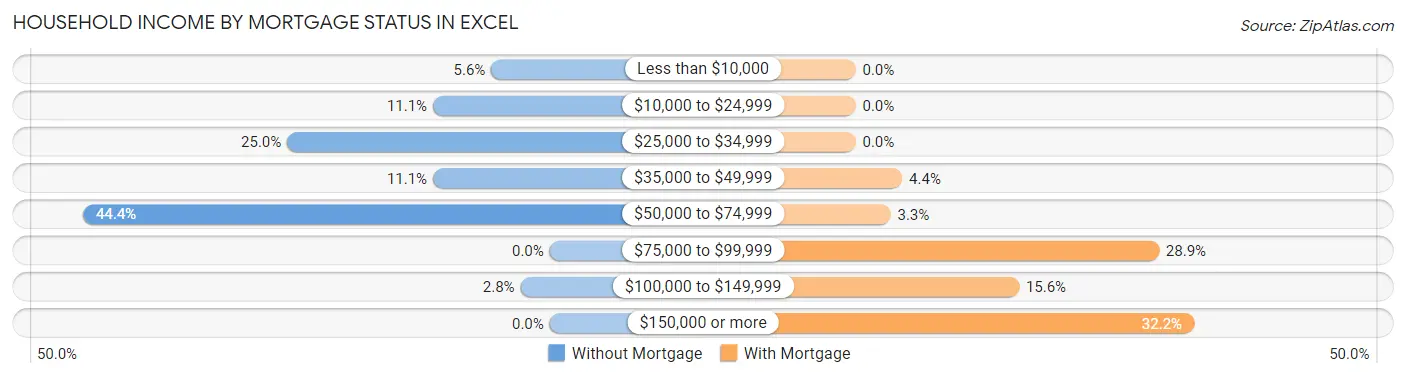
| Household Income | Without Mortgage | With Mortgage |
| Less than $10,000 | 2 (5.6%) | 0 (0.0%) |
| $10,000 to $24,999 | 4 (11.1%) | 0 (0.0%) |
| $25,000 to $34,999 | 9 (25.0%) | 0 (0.0%) |
| $35,000 to $49,999 | 4 (11.1%) | 4 (4.4%) |
| $50,000 to $74,999 | 16 (44.4%) | 3 (3.3%) |
| $75,000 to $99,999 | 0 (0.0%) | 26 (28.9%) |
| $100,000 to $149,999 | 1 (2.8%) | 14 (15.6%) |
| $150,000 or more | 0 (0.0%) | 29 (32.2%) |
| Total | 36 (100.0%) | 90 (100.0%) |
Property Value to Household Income Ratio in Excel
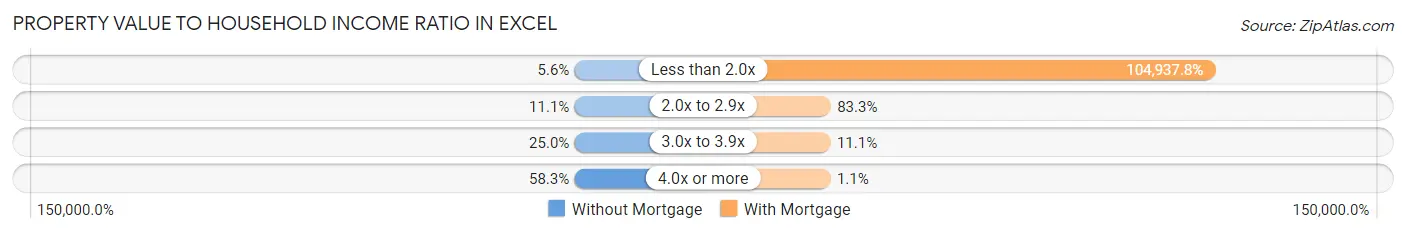
| Value-to-Income Ratio | Without Mortgage | With Mortgage |
| Less than 2.0x | 2 (5.6%) | 94,444 (104,937.8%) |
| 2.0x to 2.9x | 4 (11.1%) | 75 (83.3%) |
| 3.0x to 3.9x | 9 (25.0%) | 10 (11.1%) |
| 4.0x or more | 21 (58.3%) | 1 (1.1%) |
| Total | 36 (100.0%) | 90 (100.0%) |
Real Estate Taxes by Mortgage Status in Excel
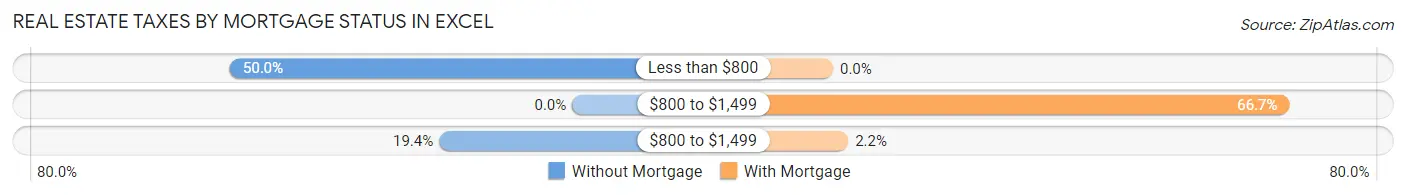
| Property Taxes | Without Mortgage | With Mortgage |
| Less than $800 | 18 (50.0%) | 0 (0.0%) |
| $800 to $1,499 | 0 (0.0%) | 60 (66.7%) |
| $800 to $1,499 | 7 (19.4%) | 2 (2.2%) |
| Total | 36 (100.0%) | 90 (100.0%) |
Health & Disability in Excel
Health Insurance Coverage by Age in Excel
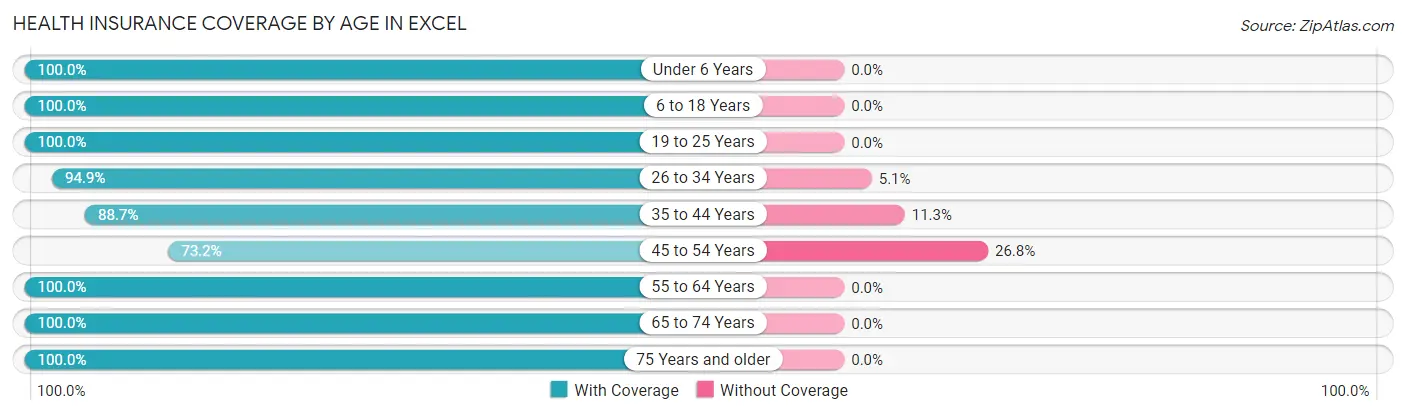
| Age Bracket | With Coverage | Without Coverage |
| Under 6 Years | 33 (100.0%) | 0 (0.0%) |
| 6 to 18 Years | 115 (100.0%) | 0 (0.0%) |
| 19 to 25 Years | 21 (100.0%) | 0 (0.0%) |
| 26 to 34 Years | 37 (94.9%) | 2 (5.1%) |
| 35 to 44 Years | 55 (88.7%) | 7 (11.3%) |
| 45 to 54 Years | 71 (73.2%) | 26 (26.8%) |
| 55 to 64 Years | 29 (100.0%) | 0 (0.0%) |
| 65 to 74 Years | 38 (100.0%) | 0 (0.0%) |
| 75 Years and older | 39 (100.0%) | 0 (0.0%) |
| Total | 438 (92.6%) | 35 (7.4%) |
Health Insurance Coverage by Citizenship Status in Excel
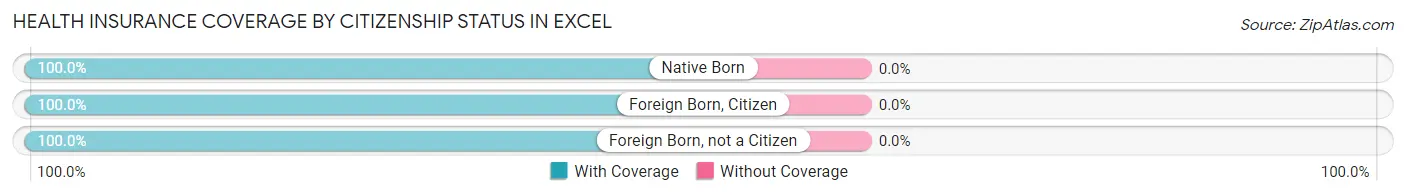
| Citizenship Status | With Coverage | Without Coverage |
| Native Born | 33 (100.0%) | 0 (0.0%) |
| Foreign Born, Citizen | 115 (100.0%) | 0 (0.0%) |
| Foreign Born, not a Citizen | 21 (100.0%) | 0 (0.0%) |
Health Insurance Coverage by Household Income in Excel
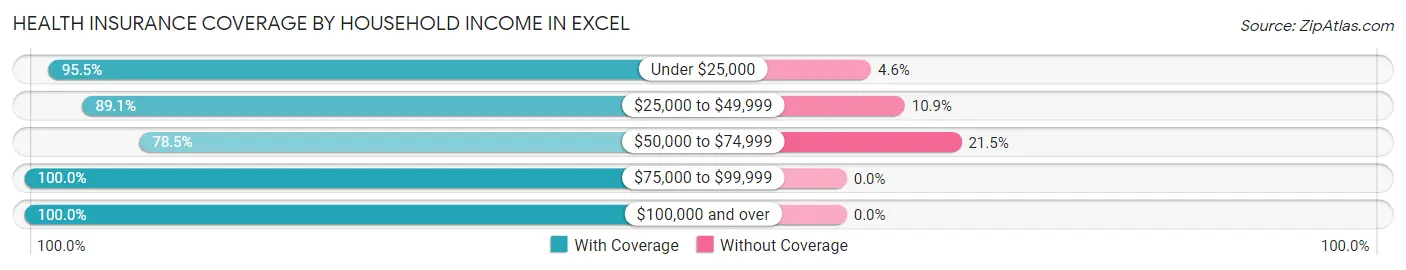
| Household Income | With Coverage | Without Coverage |
| Under $25,000 | 84 (95.5%) | 4 (4.5%) |
| $25,000 to $49,999 | 41 (89.1%) | 5 (10.9%) |
| $50,000 to $74,999 | 95 (78.5%) | 26 (21.5%) |
| $75,000 to $99,999 | 93 (100.0%) | 0 (0.0%) |
| $100,000 and over | 125 (100.0%) | 0 (0.0%) |
Public vs Private Health Insurance Coverage by Age in Excel
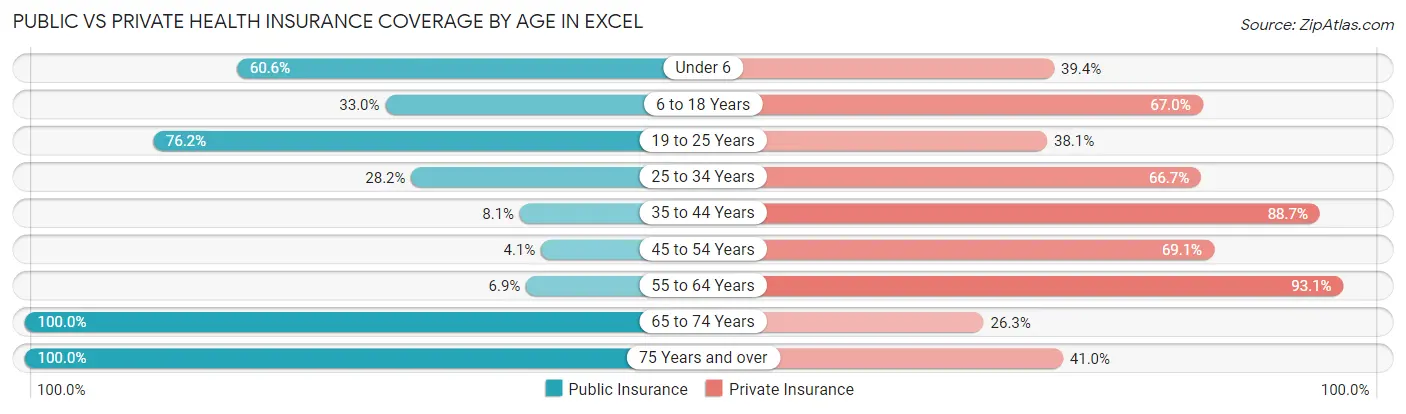
| Age Bracket | Public Insurance | Private Insurance |
| Under 6 | 20 (60.6%) | 13 (39.4%) |
| 6 to 18 Years | 38 (33.0%) | 77 (67.0%) |
| 19 to 25 Years | 16 (76.2%) | 8 (38.1%) |
| 25 to 34 Years | 11 (28.2%) | 26 (66.7%) |
| 35 to 44 Years | 5 (8.1%) | 55 (88.7%) |
| 45 to 54 Years | 4 (4.1%) | 67 (69.1%) |
| 55 to 64 Years | 2 (6.9%) | 27 (93.1%) |
| 65 to 74 Years | 38 (100.0%) | 10 (26.3%) |
| 75 Years and over | 39 (100.0%) | 16 (41.0%) |
| Total | 173 (36.6%) | 299 (63.2%) |
Disability Status by Sex by Age in Excel
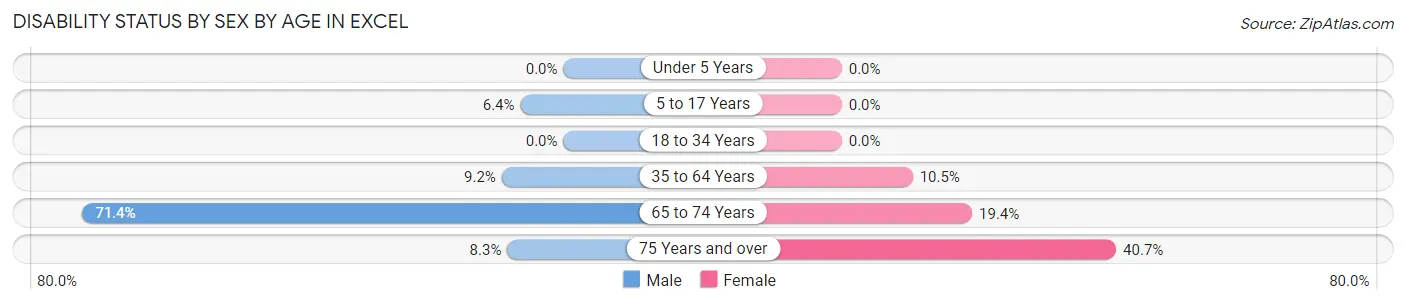
| Age Bracket | Male | Female |
| Under 5 Years | 0 (0.0%) | 0 (0.0%) |
| 5 to 17 Years | 3 (6.4%) | 0 (0.0%) |
| 18 to 34 Years | 0 (0.0%) | 0 (0.0%) |
| 35 to 64 Years | 12 (9.2%) | 6 (10.5%) |
| 65 to 74 Years | 5 (71.4%) | 6 (19.4%) |
| 75 Years and over | 1 (8.3%) | 11 (40.7%) |
Disability Class by Sex by Age in Excel
Disability Class: Hearing Difficulty
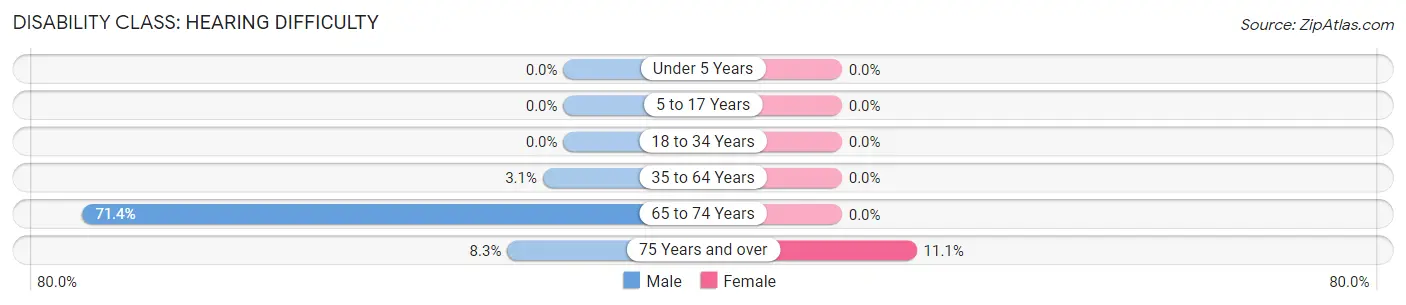
| Age Bracket | Male | Female |
| Under 5 Years | 0 (0.0%) | 0 (0.0%) |
| 5 to 17 Years | 0 (0.0%) | 0 (0.0%) |
| 18 to 34 Years | 0 (0.0%) | 0 (0.0%) |
| 35 to 64 Years | 4 (3.0%) | 0 (0.0%) |
| 65 to 74 Years | 5 (71.4%) | 0 (0.0%) |
| 75 Years and over | 1 (8.3%) | 3 (11.1%) |
Disability Class: Vision Difficulty
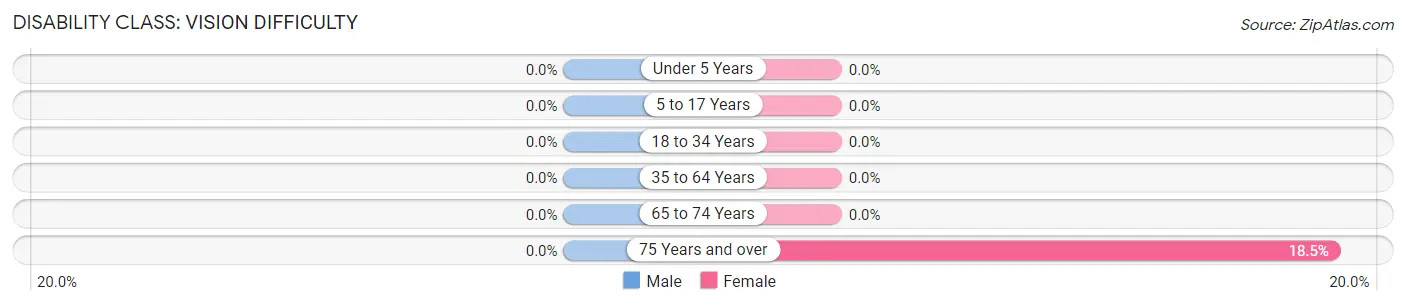
| Age Bracket | Male | Female |
| Under 5 Years | 0 (0.0%) | 0 (0.0%) |
| 5 to 17 Years | 0 (0.0%) | 0 (0.0%) |
| 18 to 34 Years | 0 (0.0%) | 0 (0.0%) |
| 35 to 64 Years | 0 (0.0%) | 0 (0.0%) |
| 65 to 74 Years | 0 (0.0%) | 0 (0.0%) |
| 75 Years and over | 0 (0.0%) | 5 (18.5%) |
Disability Class: Cognitive Difficulty
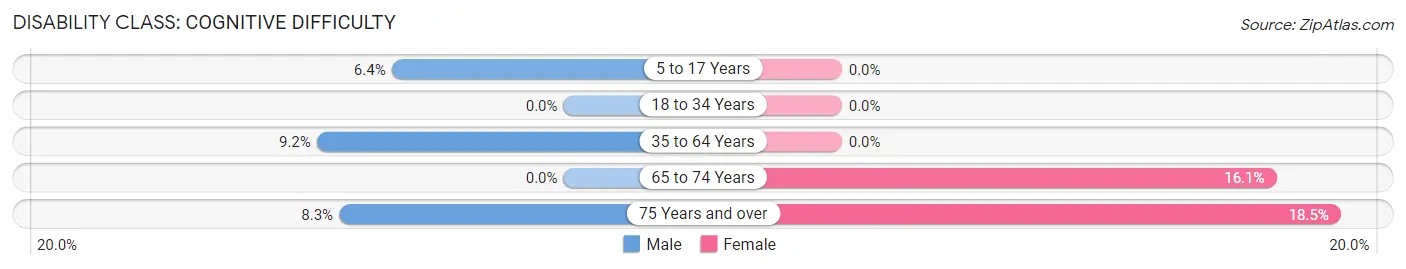
| Age Bracket | Male | Female |
| 5 to 17 Years | 3 (6.4%) | 0 (0.0%) |
| 18 to 34 Years | 0 (0.0%) | 0 (0.0%) |
| 35 to 64 Years | 12 (9.2%) | 0 (0.0%) |
| 65 to 74 Years | 0 (0.0%) | 5 (16.1%) |
| 75 Years and over | 1 (8.3%) | 5 (18.5%) |
Disability Class: Ambulatory Difficulty
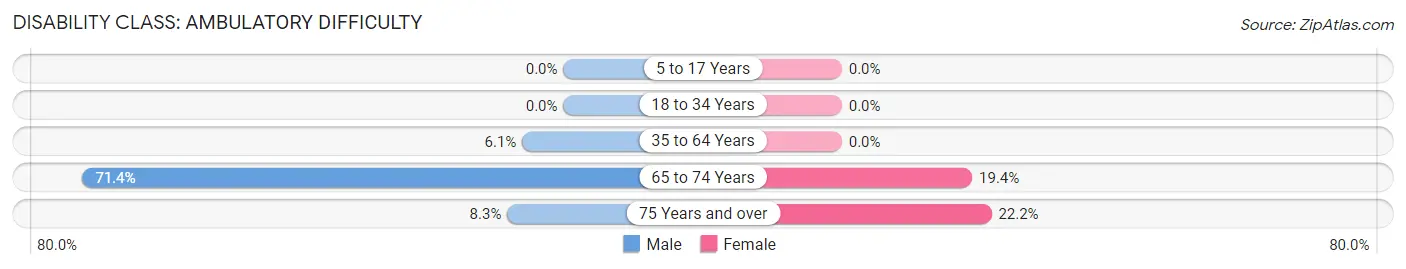
| Age Bracket | Male | Female |
| 5 to 17 Years | 0 (0.0%) | 0 (0.0%) |
| 18 to 34 Years | 0 (0.0%) | 0 (0.0%) |
| 35 to 64 Years | 8 (6.1%) | 0 (0.0%) |
| 65 to 74 Years | 5 (71.4%) | 6 (19.4%) |
| 75 Years and over | 1 (8.3%) | 6 (22.2%) |
Disability Class: Self-Care Difficulty
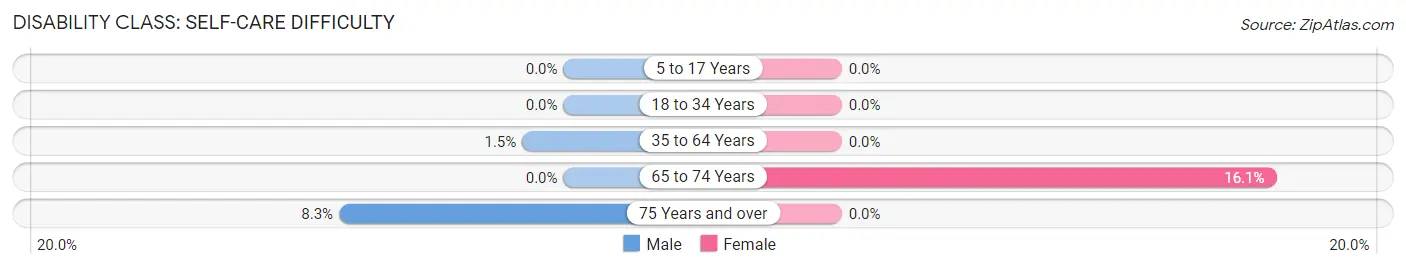
| Age Bracket | Male | Female |
| 5 to 17 Years | 0 (0.0%) | 0 (0.0%) |
| 18 to 34 Years | 0 (0.0%) | 0 (0.0%) |
| 35 to 64 Years | 2 (1.5%) | 0 (0.0%) |
| 65 to 74 Years | 0 (0.0%) | 5 (16.1%) |
| 75 Years and over | 1 (8.3%) | 0 (0.0%) |
Technology Access in Excel
Computing Device Access in Excel
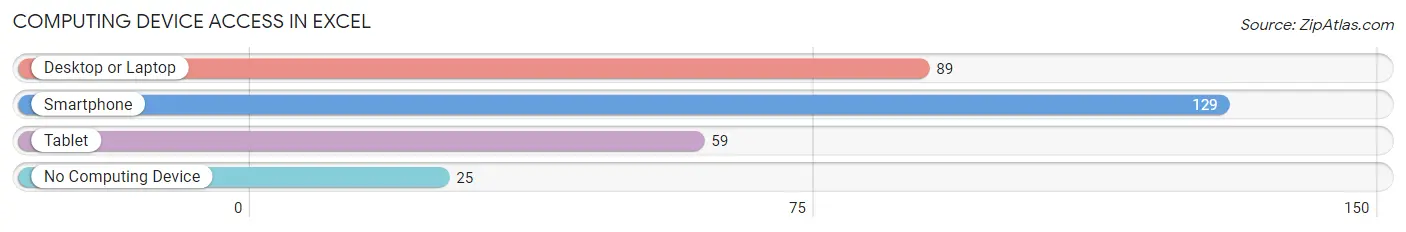
| Device Type | # Households | % Households |
| Desktop or Laptop | 89 | 55.3% |
| Smartphone | 129 | 80.1% |
| Tablet | 59 | 36.6% |
| No Computing Device | 25 | 15.5% |
| Total | 161 | 100.0% |
Internet Access in Excel
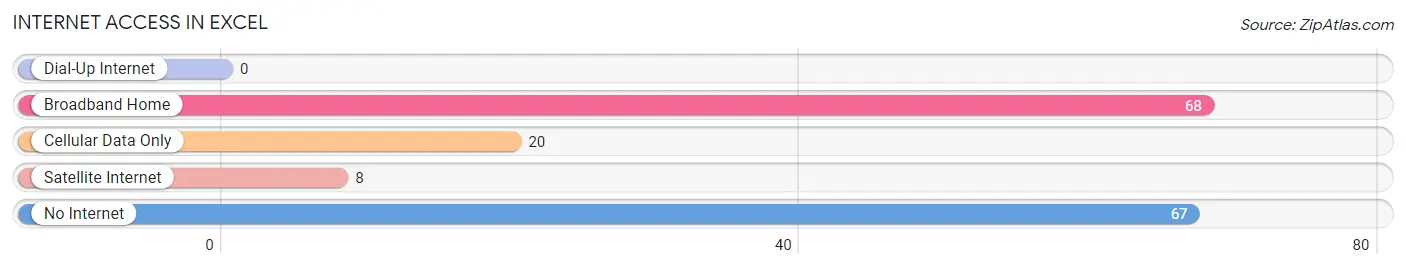
| Internet Type | # Households | % Households |
| Dial-Up Internet | 0 | 0.0% |
| Broadband Home | 68 | 42.2% |
| Cellular Data Only | 20 | 12.4% |
| Satellite Internet | 8 | 5.0% |
| No Internet | 67 | 41.6% |
| Total | 161 | 100.0% |
Excel Summary
Excel, Alabama is a small town located in the southeastern corner of the state, in the county of Clarke. It is situated on the banks of the Tombigbee River, and is home to a population of approximately 1,500 people. The town was founded in 1819 and has a rich history of agriculture, industry, and commerce.
Geography
Excel is located in the southeastern corner of Clarke County, Alabama, and is situated on the banks of the Tombigbee River. The town is located approximately 20 miles north of Mobile, Alabama, and is part of the Mobile-Tuscaloosa-Birmingham Combined Statistical Area. The town is surrounded by a number of small towns and rural communities, including Coffeeville, Thomasville, and Grove Hill. The town is located in a region of rolling hills and forests, and is home to a number of small lakes and rivers.
Economy
Excel has a long history of agriculture and industry. The town was once home to a number of cotton gins, sawmills, and other small businesses. Today, the town is home to a number of small businesses, including a grocery store, a hardware store, and a few restaurants. The town is also home to a number of small manufacturing companies, including a furniture manufacturer and a paper mill. The town is also home to a number of small farms, which produce a variety of crops, including cotton, corn, and soybeans.
Demographics
As of the 2010 census, Excel had a population of 1,500 people. The town is predominantly white, with a small African American population. The median household income in Excel is $30,000, and the median home value is $90,000. The town has a high rate of poverty, with nearly 30% of the population living below the poverty line.
Conclusion
Excel, Alabama is a small town located in the southeastern corner of the state, in the county of Clarke. It is situated on the banks of the Tombigbee River, and is home to a population of approximately 1,500 people. The town has a long history of agriculture and industry, and is home to a number of small businesses and manufacturing companies. The town is predominantly white, with a small African American population, and has a high rate of poverty.
Common Questions
What is Per Capita Income in Excel?
Per Capita income in Excel is $27,698.
What is the Median Family Income in Excel?
Median Family Income in Excel is $73,036.
What is the Median Household income in Excel?
Median Household Income in Excel is $64,926.
What is Income or Wage Gap in Excel?
Income or Wage Gap in Excel is 32.5%.
Women in Excel earn 67.5 cents for every dollar earned by a man.
What is Inequality or Gini Index in Excel?
Inequality or Gini Index in Excel is 0.38.
What is the Total Population of Excel?
Total Population of Excel is 473.
What is the Total Male Population of Excel?
Total Male Population of Excel is 244.
What is the Total Female Population of Excel?
Total Female Population of Excel is 229.
What is the Ratio of Males per 100 Females in Excel?
There are 106.55 Males per 100 Females in Excel.
What is the Ratio of Females per 100 Males in Excel?
There are 93.85 Females per 100 Males in Excel.
What is the Median Population Age in Excel?
Median Population Age in Excel is 38.6 Years.
What is the Average Family Size in Excel
Average Family Size in Excel is 3.3 People.
What is the Average Household Size in Excel
Average Household Size in Excel is 2.9 People.
How Large is the Labor Force in Excel?
There are 174 People in the Labor Forcein in Excel.
What is the Percentage of People in the Labor Force in Excel?
49.0% of People are in the Labor Force in Excel.