Elba, AL Map & Demographics
Elba Map
Elba Overview
$22,960
PER CAPITA INCOME
$54,688
AVG FAMILY INCOME
$41,509
AVG HOUSEHOLD INCOME
8.4%
WAGE / INCOME GAP [ % ]
91.6¢/ $1
WAGE / INCOME GAP [ $ ]
0.39
INEQUALITY / GINI INDEX
3,463
TOTAL POPULATION
1,801
MALE POPULATION
1,662
FEMALE POPULATION
108.36
MALES / 100 FEMALES
92.28
FEMALES / 100 MALES
49.9
MEDIAN AGE
2.9
AVG FAMILY SIZE
2.3
AVG HOUSEHOLD SIZE
1,300
LABOR FORCE [ PEOPLE ]
41.7%
PERCENT IN LABOR FORCE
11.2%
UNEMPLOYMENT RATE
Elba Zip Codes
Elba Area Codes
Income in Elba
Income Overview in Elba
Per Capita Income in Elba is $22,960, while median incomes of families and households are $54,688 and $41,509 respectively.
| Characteristic | Number | Measure |
| Per Capita Income | 3,463 | $22,960 |
| Median Family Income | 845 | $54,688 |
| Mean Family Income | 845 | $68,227 |
| Median Household Income | 1,360 | $41,509 |
| Mean Household Income | 1,360 | $53,664 |
| Income Deficit | 845 | $0 |
| Wage / Income Gap (%) | 3,463 | 8.40% |
| Wage / Income Gap ($) | 3,463 | 91.60¢ per $1 |
| Gini / Inequality Index | 3,463 | 0.39 |
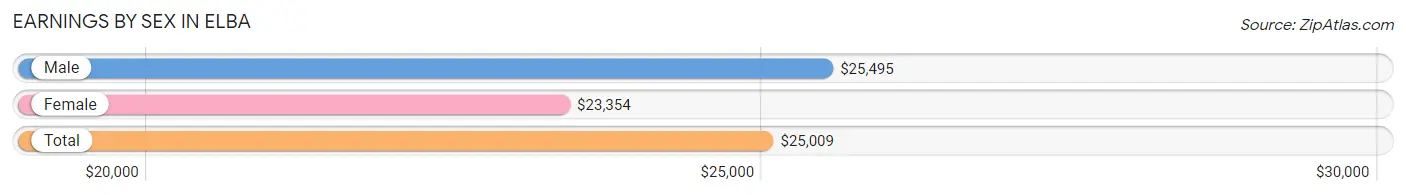
Earnings by Sex in Elba
Average Earnings in Elba are $25,009, $25,495 for men and $23,354 for women, a difference of 8.4%.
| Sex | Number | Average Earnings |
| Male | 943 (63.8%) | $25,495 |
| Female | 534 (36.1%) | $23,354 |
| Total | 1,477 (100.0%) | $25,009 |
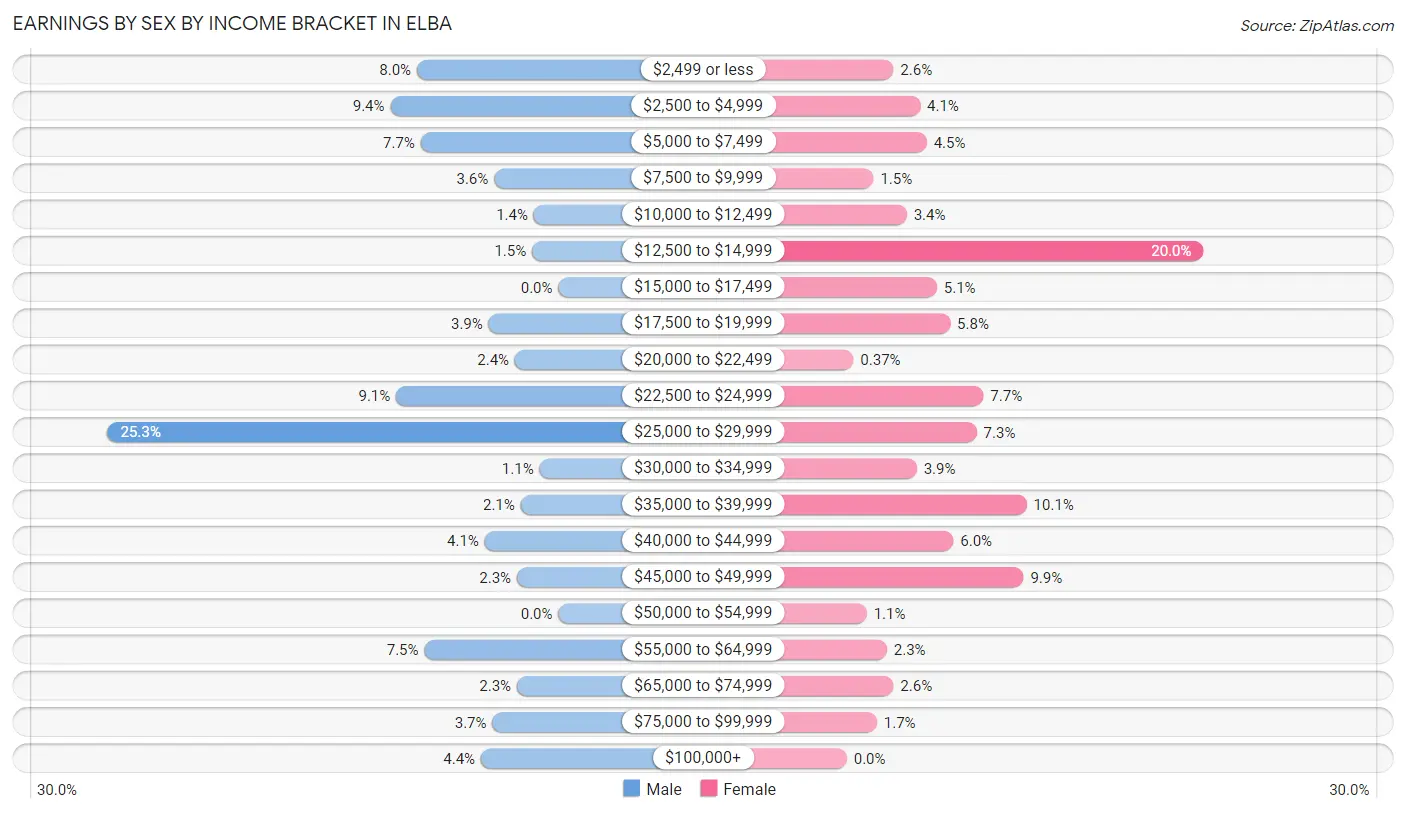
Earnings by Sex by Income Bracket in Elba
The most common earnings brackets in Elba are $25,000 to $29,999 for men (239 | 25.3%) and $12,500 to $14,999 for women (107 | 20.0%).
| Income | Male | Female |
| $2,499 or less | 75 (8.0%) | 14 (2.6%) |
| $2,500 to $4,999 | 89 (9.4%) | 22 (4.1%) |
| $5,000 to $7,499 | 73 (7.7%) | 24 (4.5%) |
| $7,500 to $9,999 | 34 (3.6%) | 8 (1.5%) |
| $10,000 to $12,499 | 13 (1.4%) | 18 (3.4%) |
| $12,500 to $14,999 | 14 (1.5%) | 107 (20.0%) |
| $15,000 to $17,499 | 0 (0.0%) | 27 (5.1%) |
| $17,500 to $19,999 | 37 (3.9%) | 31 (5.8%) |
| $20,000 to $22,499 | 23 (2.4%) | 2 (0.4%) |
| $22,500 to $24,999 | 86 (9.1%) | 41 (7.7%) |
| $25,000 to $29,999 | 239 (25.3%) | 39 (7.3%) |
| $30,000 to $34,999 | 10 (1.1%) | 21 (3.9%) |
| $35,000 to $39,999 | 20 (2.1%) | 54 (10.1%) |
| $40,000 to $44,999 | 39 (4.1%) | 32 (6.0%) |
| $45,000 to $49,999 | 22 (2.3%) | 53 (9.9%) |
| $50,000 to $54,999 | 0 (0.0%) | 6 (1.1%) |
| $55,000 to $64,999 | 71 (7.5%) | 12 (2.2%) |
| $65,000 to $74,999 | 22 (2.3%) | 14 (2.6%) |
| $75,000 to $99,999 | 35 (3.7%) | 9 (1.7%) |
| $100,000+ | 41 (4.3%) | 0 (0.0%) |
| Total | 943 (100.0%) | 534 (100.0%) |
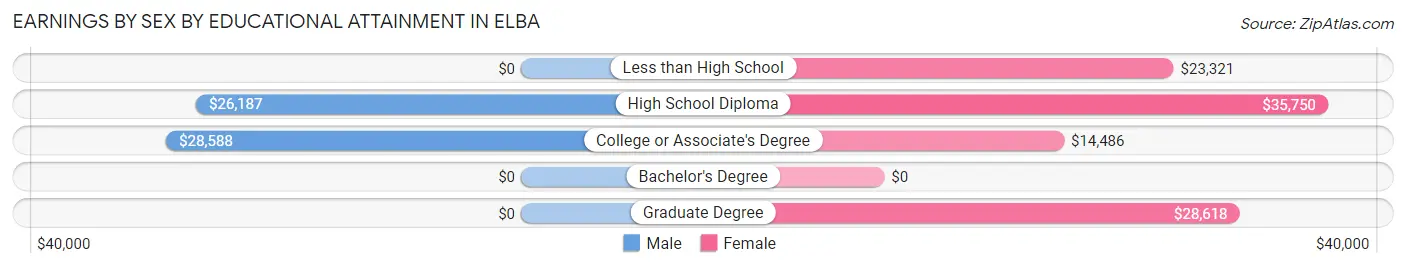
Earnings by Sex by Educational Attainment in Elba
Average earnings in Elba are $26,088 for men and $24,268 for women, a difference of 7.0%. Men with an educational attainment of college or associate's degree enjoy the highest average annual earnings of $28,588, while those with high school diploma education earn the least with $26,187. Women with an educational attainment of high school diploma earn the most with the average annual earnings of $35,750, while those with college or associate's degree education have the smallest earnings of $14,486.
| Educational Attainment | Male Income | Female Income |
| Less than High School | - | - |
| High School Diploma | $26,187 | $35,750 |
| College or Associate's Degree | $28,588 | $14,486 |
| Bachelor's Degree | - | - |
| Graduate Degree | - | - |
| Total | $26,088 | $24,268 |
Family Income in Elba
Family Income Brackets in Elba
According to the Elba family income data, there are 264 families falling into the $35,000 to $49,999 income range, which is the most common income bracket and makes up 31.2% of all families.
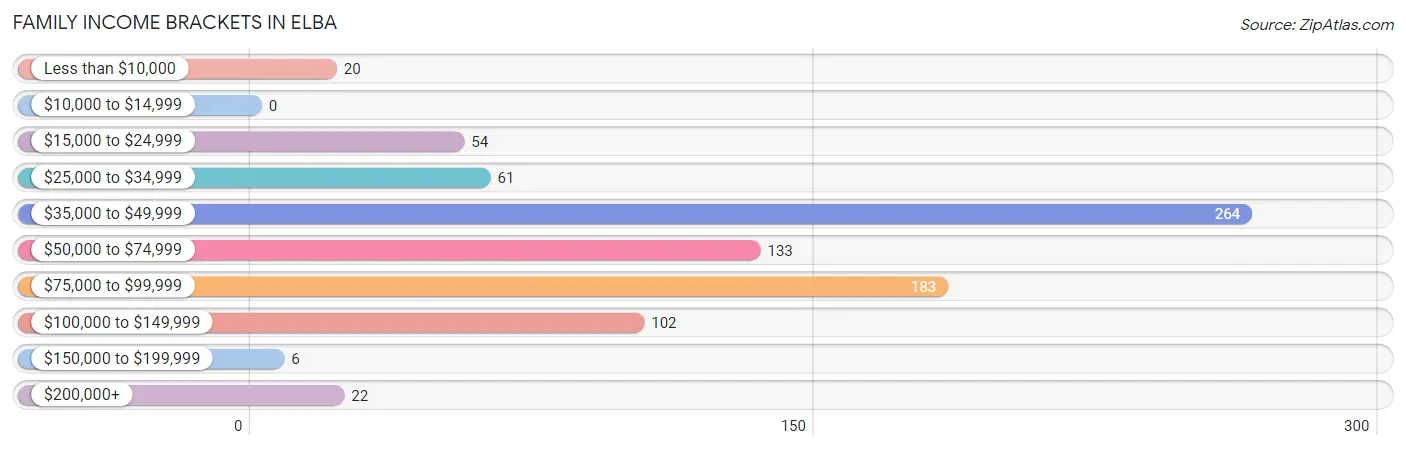
| Income Bracket | # Families | % Families |
| Less than $10,000 | 20 | 2.4% |
| $10,000 to $14,999 | 0 | 0.0% |
| $15,000 to $24,999 | 54 | 6.4% |
| $25,000 to $34,999 | 61 | 7.2% |
| $35,000 to $49,999 | 264 | 31.2% |
| $50,000 to $74,999 | 133 | 15.7% |
| $75,000 to $99,999 | 183 | 21.7% |
| $100,000 to $149,999 | 102 | 12.1% |
| $150,000 to $199,999 | 6 | 0.7% |
| $200,000+ | 22 | 2.6% |
Family Income by Famaliy Size in Elba
3-person families (243 | 28.8%) account for the highest median family income in Elba with $58,906 per family, while 2-person families (441 | 52.2%) have the highest median income of $21,220 per family member.
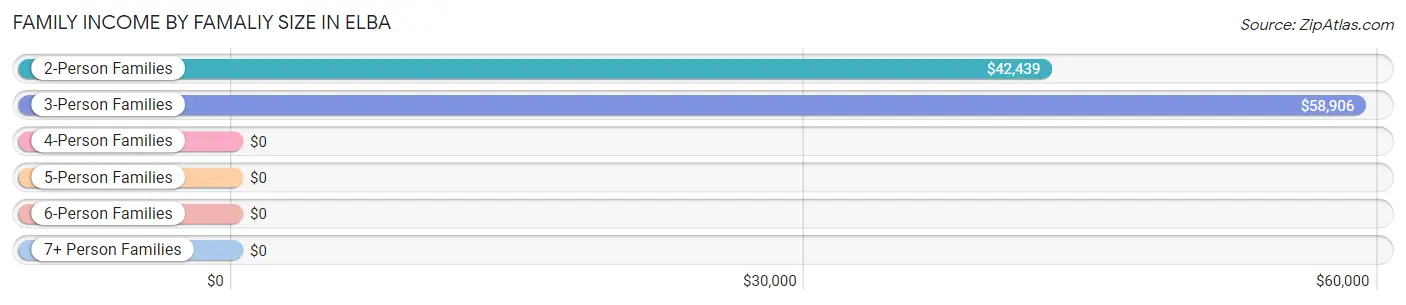
| Income Bracket | # Families | Median Income |
| 2-Person Families | 441 (52.2%) | $42,439 |
| 3-Person Families | 243 (28.8%) | $58,906 |
| 4-Person Families | 115 (13.6%) | $0 |
| 5-Person Families | 26 (3.1%) | $0 |
| 6-Person Families | 20 (2.4%) | $0 |
| 7+ Person Families | 0 (0.0%) | $0 |
| Total | 845 (100.0%) | $54,688 |
Family Income by Number of Earners in Elba
The median family income in Elba is $54,688, with families comprising 3+ earners (68) having the highest median family income of $93,750, while families with 1 earner (376) have the lowest median family income of $41,822, accounting for 8.1% and 44.5% of families, respectively.
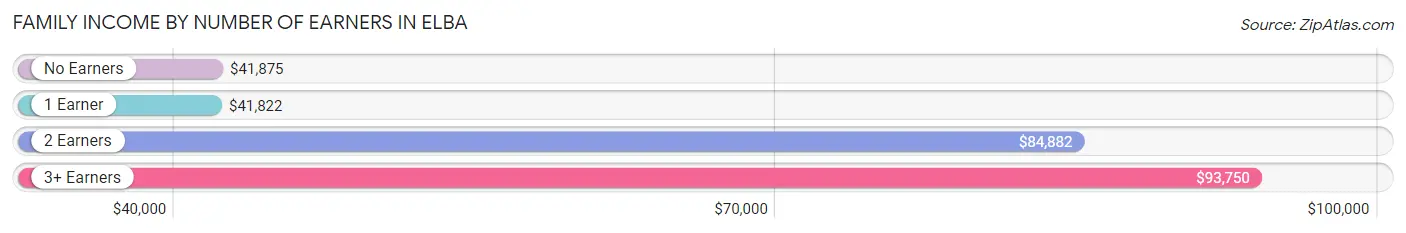
| Number of Earners | # Families | Median Income |
| No Earners | 190 (22.5%) | $41,875 |
| 1 Earner | 376 (44.5%) | $41,822 |
| 2 Earners | 211 (25.0%) | $84,882 |
| 3+ Earners | 68 (8.1%) | $93,750 |
| Total | 845 (100.0%) | $54,688 |
Household Income in Elba
Household Income Brackets in Elba
With 322 households falling in the category, the $35,000 to $49,999 income range is the most frequent in Elba, accounting for 23.7% of all households. In contrast, only 5 households (0.4%) fall into the $150,000 to $199,999 income bracket, making it the least populous group.
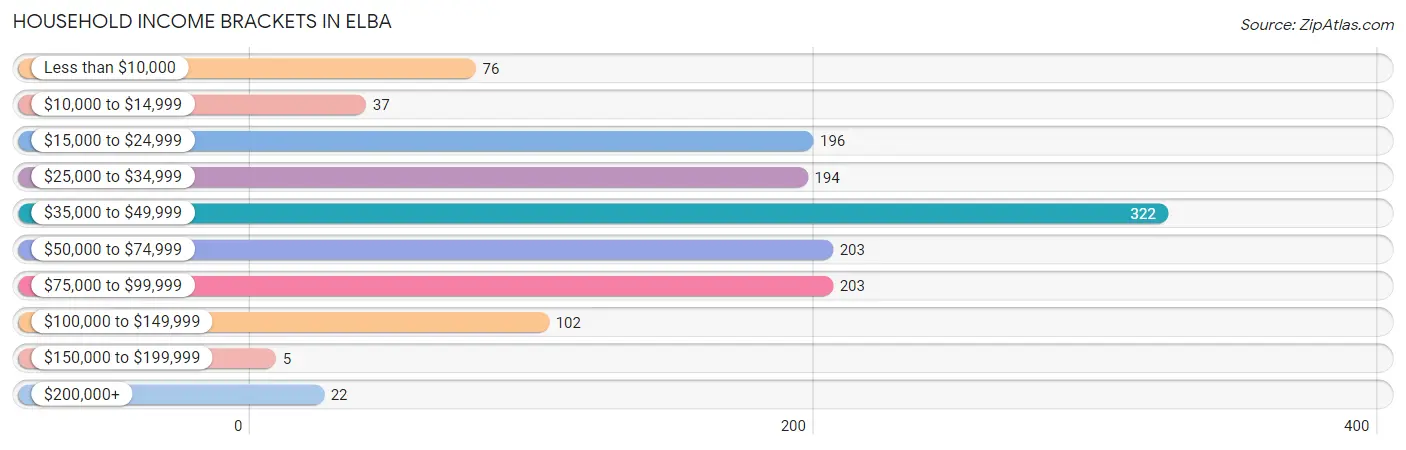
| Income Bracket | # Households | % Households |
| Less than $10,000 | 76 | 5.6% |
| $10,000 to $14,999 | 37 | 2.7% |
| $15,000 to $24,999 | 196 | 14.4% |
| $25,000 to $34,999 | 194 | 14.3% |
| $35,000 to $49,999 | 322 | 23.7% |
| $50,000 to $74,999 | 203 | 14.9% |
| $75,000 to $99,999 | 203 | 14.9% |
| $100,000 to $149,999 | 102 | 7.5% |
| $150,000 to $199,999 | 5 | 0.4% |
| $200,000+ | 22 | 1.6% |
Household Income by Householder Age in Elba
The median household income in Elba is $41,509, with the highest median household income of $83,042 found in the 25 to 44 years age bracket for the primary householder. A total of 215 households (15.8%) fall into this category. Meanwhile, the 15 to 24 years age bracket for the primary householder has the lowest median household income of $0, with 20 households (1.5%) in this group.
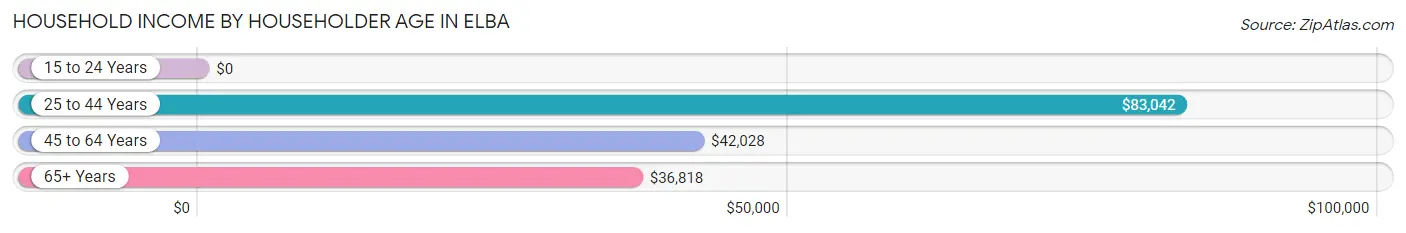
| Income Bracket | # Households | Median Income |
| 15 to 24 Years | 20 (1.5%) | $0 |
| 25 to 44 Years | 215 (15.8%) | $83,042 |
| 45 to 64 Years | 515 (37.9%) | $42,028 |
| 65+ Years | 610 (44.9%) | $36,818 |
| Total | 1,360 (100.0%) | $41,509 |
Poverty in Elba
Income Below Poverty by Sex and Age in Elba
With 14.0% poverty level for males and 5.5% for females among the residents of Elba, 12 to 14 year old males and 18 to 24 year old females are the most vulnerable to poverty, with 23 males (100.0%) and 20 females (24.1%) in their respective age groups living below the poverty level.
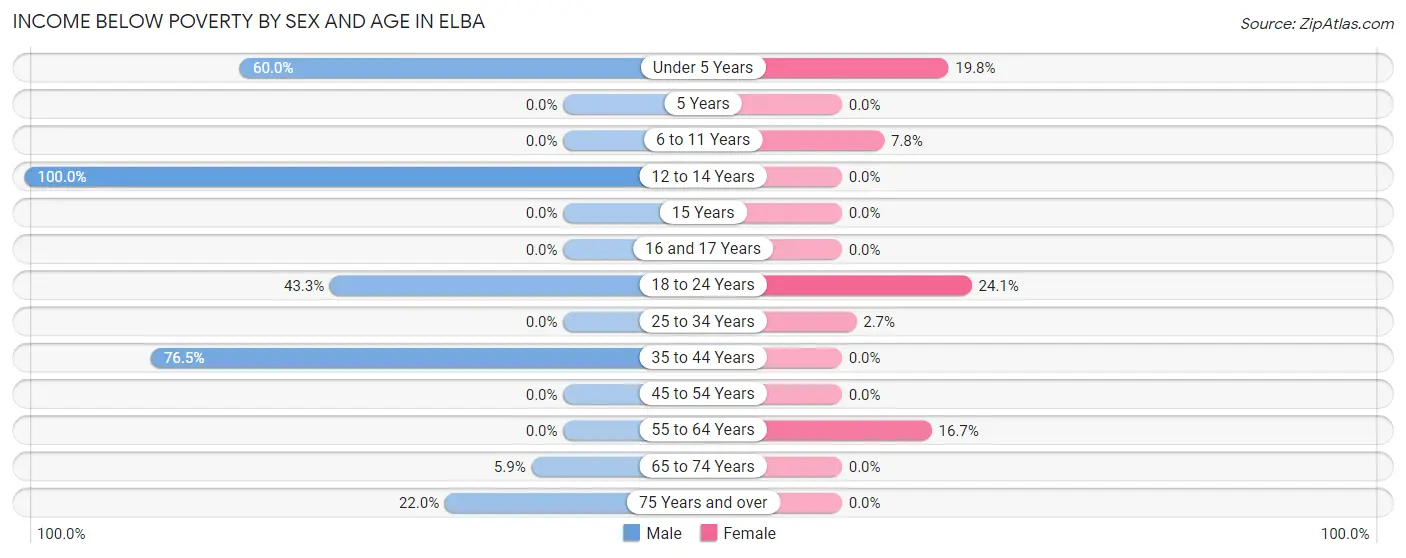
| Age Bracket | Male | Female |
| Under 5 Years | 21 (60.0%) | 18 (19.8%) |
| 5 Years | 0 (0.0%) | 0 (0.0%) |
| 6 to 11 Years | 0 (0.0%) | 4 (7.8%) |
| 12 to 14 Years | 23 (100.0%) | 0 (0.0%) |
| 15 Years | 0 (0.0%) | 0 (0.0%) |
| 16 and 17 Years | 0 (0.0%) | 0 (0.0%) |
| 18 to 24 Years | 42 (43.3%) | 20 (24.1%) |
| 25 to 34 Years | 0 (0.0%) | 5 (2.7%) |
| 35 to 44 Years | 75 (76.5%) | 0 (0.0%) |
| 45 to 54 Years | 0 (0.0%) | 0 (0.0%) |
| 55 to 64 Years | 0 (0.0%) | 38 (16.7%) |
| 65 to 74 Years | 14 (5.9%) | 0 (0.0%) |
| 75 Years and over | 38 (22.0%) | 0 (0.0%) |
| Total | 213 (14.0%) | 85 (5.5%) |
Income Above Poverty by Sex and Age in Elba
According to the poverty statistics in Elba, males aged 5 years and females aged 12 to 14 years are the age groups that are most secure financially, with 100.0% of males and 100.0% of females in these age groups living above the poverty line.
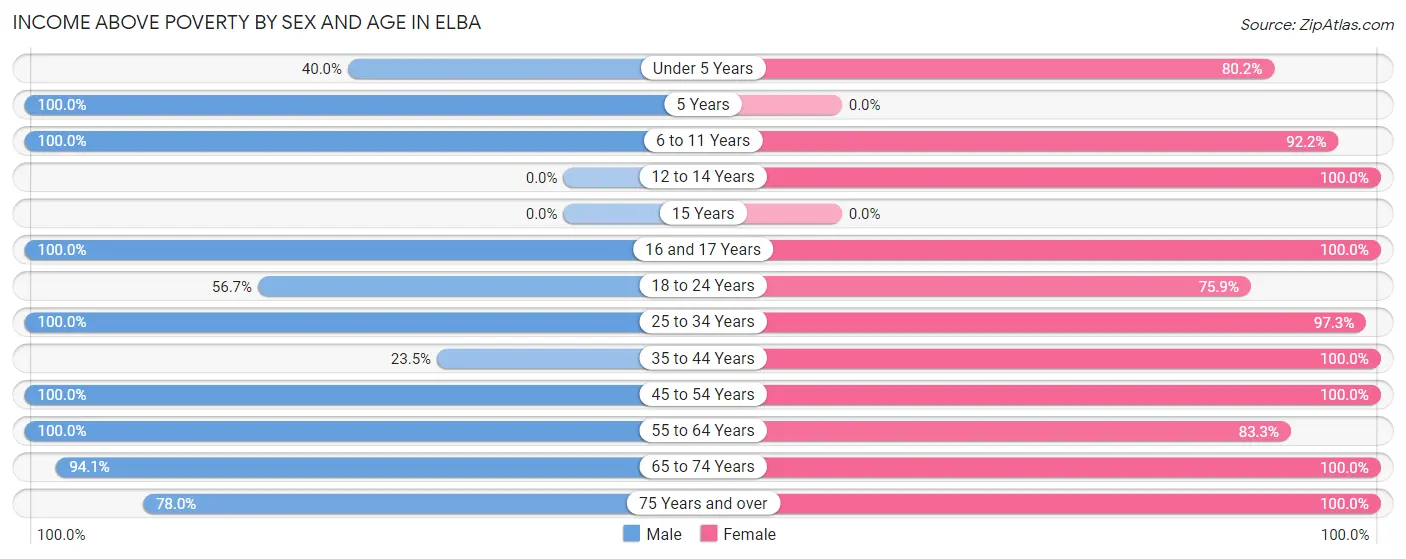
| Age Bracket | Male | Female |
| Under 5 Years | 14 (40.0%) | 73 (80.2%) |
| 5 Years | 31 (100.0%) | 0 (0.0%) |
| 6 to 11 Years | 42 (100.0%) | 47 (92.2%) |
| 12 to 14 Years | 0 (0.0%) | 16 (100.0%) |
| 15 Years | 0 (0.0%) | 0 (0.0%) |
| 16 and 17 Years | 3 (100.0%) | 88 (100.0%) |
| 18 to 24 Years | 55 (56.7%) | 63 (75.9%) |
| 25 to 34 Years | 192 (100.0%) | 181 (97.3%) |
| 35 to 44 Years | 23 (23.5%) | 74 (100.0%) |
| 45 to 54 Years | 370 (100.0%) | 230 (100.0%) |
| 55 to 64 Years | 216 (100.0%) | 190 (83.3%) |
| 65 to 74 Years | 223 (94.1%) | 361 (100.0%) |
| 75 Years and over | 135 (78.0%) | 149 (100.0%) |
| Total | 1,304 (86.0%) | 1,472 (94.5%) |
Income Below Poverty Among Married-Couple Families in Elba
The poverty statistics for married-couple families in Elba show that 0.5% or 3 of the total 608 families live below the poverty line. Families with no children have the highest poverty rate of 0.7%, comprising of 3 families. On the other hand, families with 1 or 2 children have the lowest poverty rate of 0.0%, which includes 0 families.
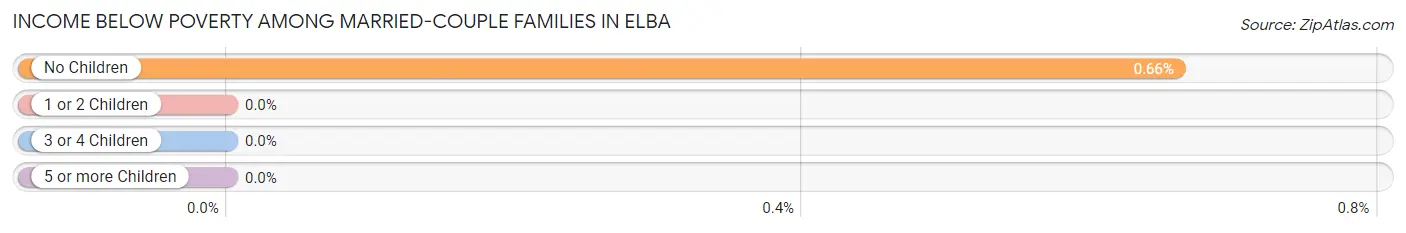
| Children | Above Poverty | Below Poverty |
| No Children | 451 (99.3%) | 3 (0.7%) |
| 1 or 2 Children | 150 (100.0%) | 0 (0.0%) |
| 3 or 4 Children | 4 (100.0%) | 0 (0.0%) |
| 5 or more Children | 0 (0.0%) | 0 (0.0%) |
| Total | 605 (99.5%) | 3 (0.5%) |
Income Below Poverty Among Single-Parent Households in Elba
According to the poverty data in Elba, 34.2% or 26 single-father households and 15.5% or 25 single-mother households are living below the poverty line. Among single-father households, those with 1 or 2 children have the highest poverty rate, with 26 households (56.5%) experiencing poverty. Likewise, among single-mother households, those with 3 or 4 children have the highest poverty rate, with 5 households (100.0%) falling below the poverty line.
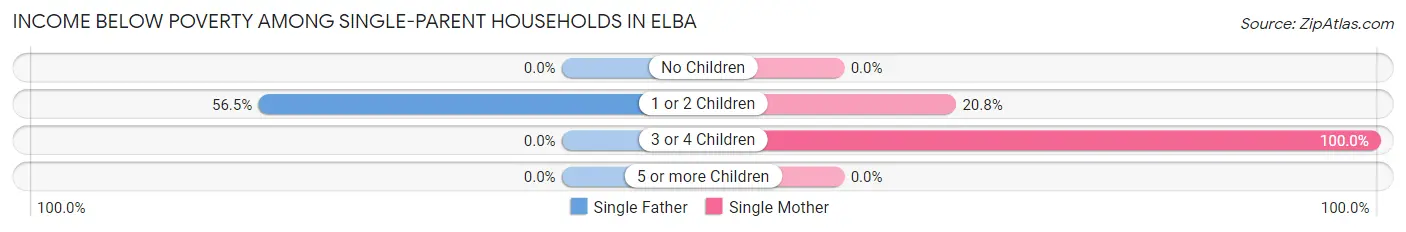
| Children | Single Father | Single Mother |
| No Children | 0 (0.0%) | 0 (0.0%) |
| 1 or 2 Children | 26 (56.5%) | 20 (20.8%) |
| 3 or 4 Children | 0 (0.0%) | 5 (100.0%) |
| 5 or more Children | 0 (0.0%) | 0 (0.0%) |
| Total | 26 (34.2%) | 25 (15.5%) |
Income Below Poverty Among Married-Couple vs Single-Parent Households in Elba
The poverty data for Elba shows that 3 of the married-couple family households (0.5%) and 51 of the single-parent households (21.5%) are living below the poverty level. Within the married-couple family households, those with no children have the highest poverty rate, with 3 households (0.7%) falling below the poverty line. Among the single-parent households, those with 3 or 4 children have the highest poverty rate, with 5 household (100.0%) living below poverty.
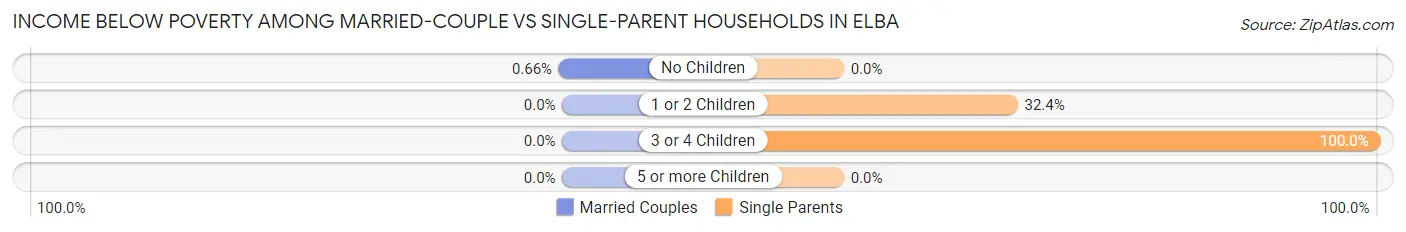
| Children | Married-Couple Families | Single-Parent Households |
| No Children | 3 (0.7%) | 0 (0.0%) |
| 1 or 2 Children | 0 (0.0%) | 46 (32.4%) |
| 3 or 4 Children | 0 (0.0%) | 5 (100.0%) |
| 5 or more Children | 0 (0.0%) | 0 (0.0%) |
| Total | 3 (0.5%) | 51 (21.5%) |
Race in Elba
The most populous races in Elba are White / Caucasian (2,458 | 71.0%), Black / African American (913 | 26.4%), and Two or more Races (64 | 1.8%).
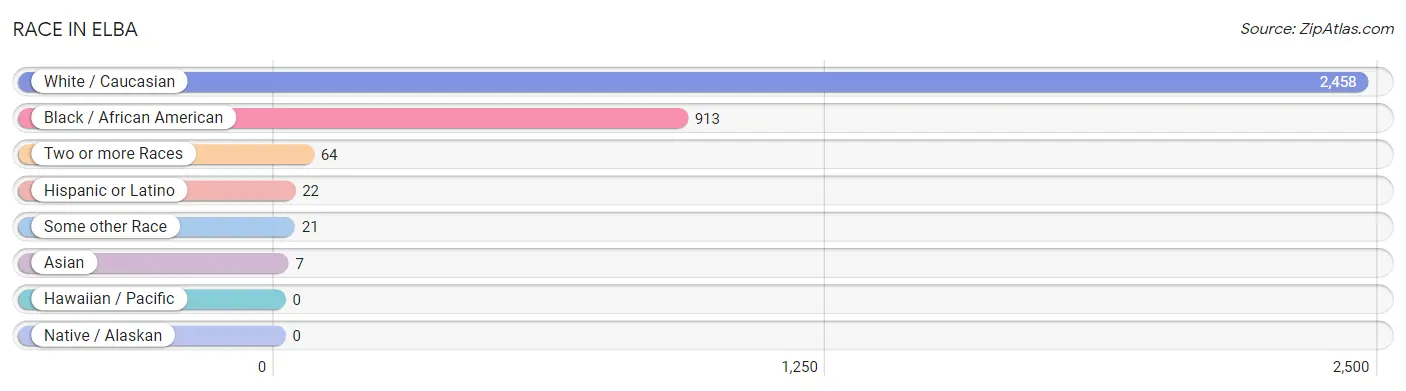
| Race | # Population | % Population |
| Asian | 7 | 0.2% |
| Black / African American | 913 | 26.4% |
| Hawaiian / Pacific | 0 | 0.0% |
| Hispanic or Latino | 22 | 0.6% |
| Native / Alaskan | 0 | 0.0% |
| White / Caucasian | 2,458 | 71.0% |
| Two or more Races | 64 | 1.8% |
| Some other Race | 21 | 0.6% |
| Total | 3,463 | 100.0% |
Ancestry in Elba
The most populous ancestries reported in Elba are American (551 | 15.9%), Irish (359 | 10.4%), English (261 | 7.5%), German (151 | 4.4%), and European (69 | 2.0%), together accounting for 40.2% of all Elba residents.
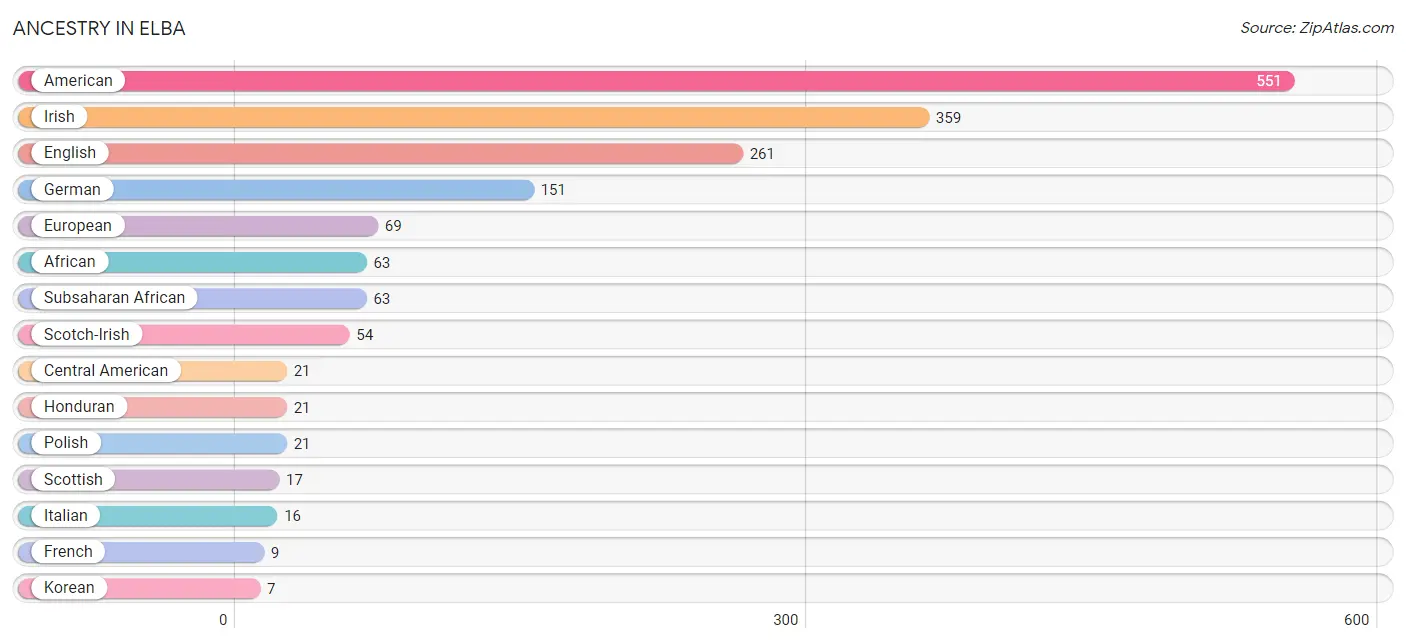
| Ancestry | # Population | % Population |
| African | 63 | 1.8% |
| American | 551 | 15.9% |
| Central American | 21 | 0.6% |
| English | 261 | 7.5% |
| European | 69 | 2.0% |
| French | 9 | 0.3% |
| German | 151 | 4.4% |
| Honduran | 21 | 0.6% |
| Irish | 359 | 10.4% |
| Italian | 16 | 0.5% |
| Korean | 7 | 0.2% |
| Polish | 21 | 0.6% |
| Scotch-Irish | 54 | 1.6% |
| Scottish | 17 | 0.5% |
| Subsaharan African | 63 | 1.8% |
| Welsh | 6 | 0.2% | View All 16 Rows |
Immigrants in Elba
The most numerous immigrant groups reported in Elba came from Asia (33 | 0.9%), India (26 | 0.7%), South Central Asia (26 | 0.7%), Central America (21 | 0.6%), and Honduras (21 | 0.6%), together accounting for 3.7% of all Elba residents.
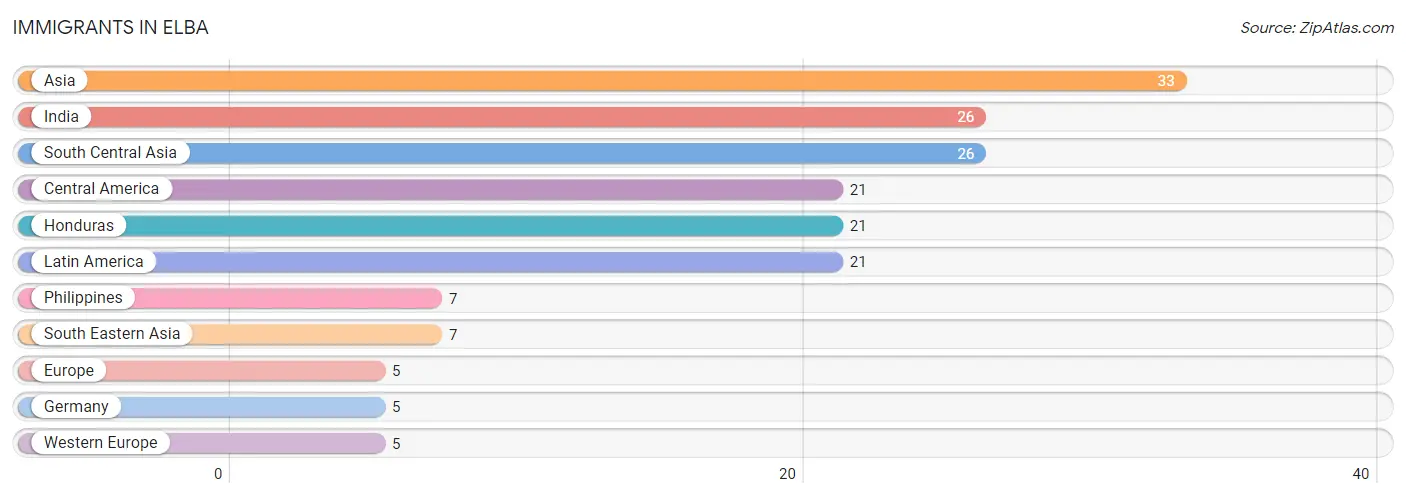
| Immigration Origin | # Population | % Population |
| Asia | 33 | 0.9% |
| Central America | 21 | 0.6% |
| Europe | 5 | 0.1% |
| Germany | 5 | 0.1% |
| Honduras | 21 | 0.6% |
| India | 26 | 0.7% |
| Latin America | 21 | 0.6% |
| Philippines | 7 | 0.2% |
| South Central Asia | 26 | 0.7% |
| South Eastern Asia | 7 | 0.2% |
| Western Europe | 5 | 0.1% | View All 11 Rows |
Sex and Age in Elba
Sex and Age in Elba
The most populous age groups in Elba are 45 to 49 Years (297 | 16.5%) for men and 70 to 74 Years (229 | 13.8%) for women.
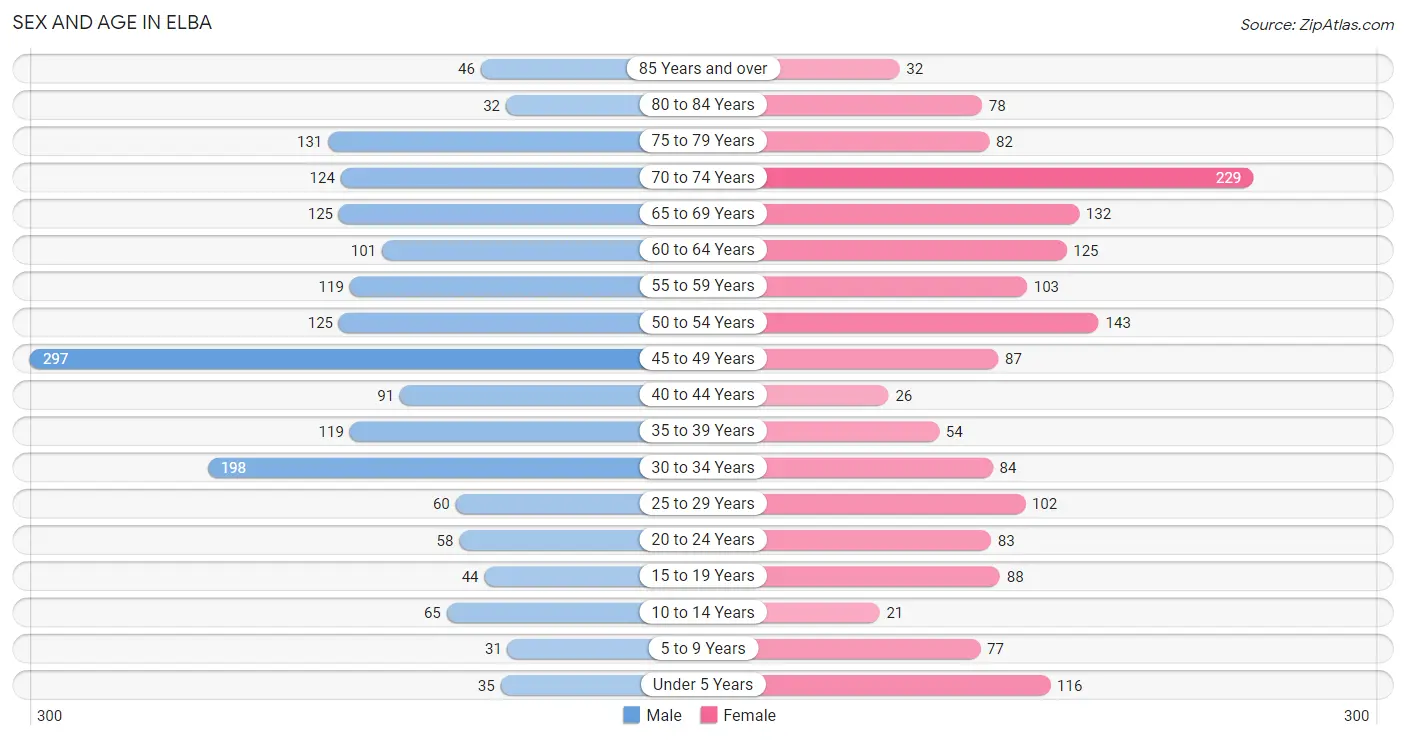
| Age Bracket | Male | Female |
| Under 5 Years | 35 (1.9%) | 116 (7.0%) |
| 5 to 9 Years | 31 (1.7%) | 77 (4.6%) |
| 10 to 14 Years | 65 (3.6%) | 21 (1.3%) |
| 15 to 19 Years | 44 (2.4%) | 88 (5.3%) |
| 20 to 24 Years | 58 (3.2%) | 83 (5.0%) |
| 25 to 29 Years | 60 (3.3%) | 102 (6.1%) |
| 30 to 34 Years | 198 (11.0%) | 84 (5.1%) |
| 35 to 39 Years | 119 (6.6%) | 54 (3.3%) |
| 40 to 44 Years | 91 (5.1%) | 26 (1.6%) |
| 45 to 49 Years | 297 (16.5%) | 87 (5.2%) |
| 50 to 54 Years | 125 (6.9%) | 143 (8.6%) |
| 55 to 59 Years | 119 (6.6%) | 103 (6.2%) |
| 60 to 64 Years | 101 (5.6%) | 125 (7.5%) |
| 65 to 69 Years | 125 (6.9%) | 132 (7.9%) |
| 70 to 74 Years | 124 (6.9%) | 229 (13.8%) |
| 75 to 79 Years | 131 (7.3%) | 82 (4.9%) |
| 80 to 84 Years | 32 (1.8%) | 78 (4.7%) |
| 85 Years and over | 46 (2.5%) | 32 (1.9%) |
| Total | 1,801 (100.0%) | 1,662 (100.0%) |
Families and Households in Elba
Median Family Size in Elba
The median family size in Elba is 2.92 persons per family, with single male/father families (76 | 9.0%) accounting for the largest median family size of 5.59 persons per family. On the other hand, married-couple families (608 | 72.0%) represent the smallest median family size with 2.46 persons per family.
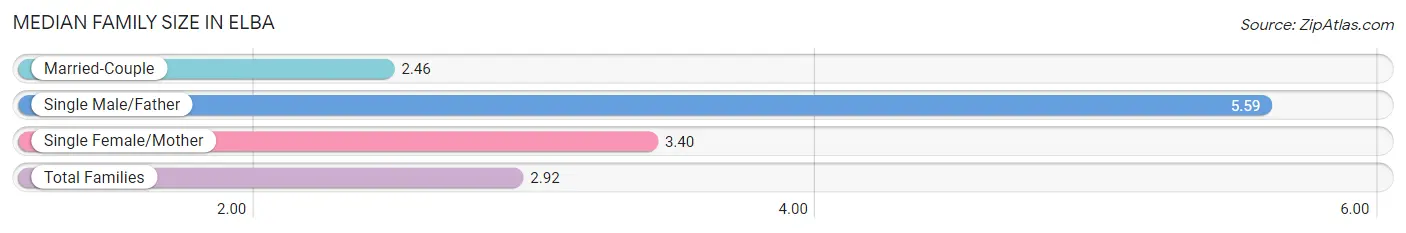
| Family Type | # Families | Family Size |
| Married-Couple | 608 (72.0%) | 2.46 |
| Single Male/Father | 76 (9.0%) | 5.59 |
| Single Female/Mother | 161 (19.1%) | 3.40 |
| Total Families | 845 (100.0%) | 2.92 |
Median Household Size in Elba
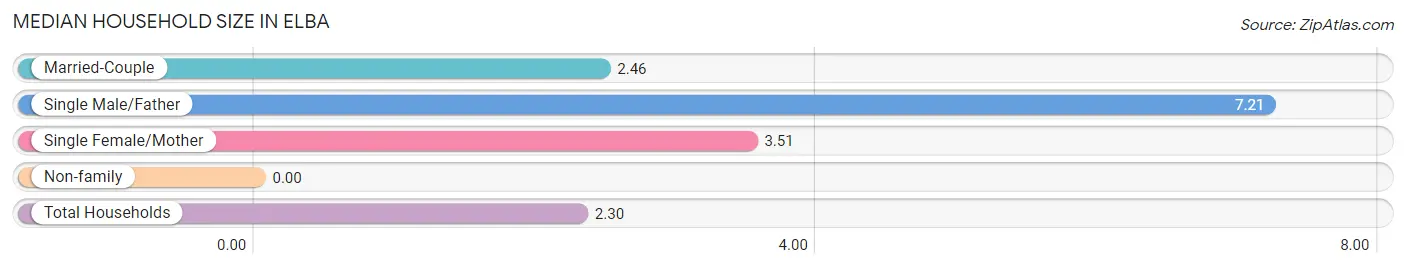
| Household Type | # Households | Household Size |
| Married-Couple | 608 (44.7%) | 2.46 |
| Single Male/Father | 76 (5.6%) | 7.21 |
| Single Female/Mother | 161 (11.8%) | 3.51 |
| Non-family | 515 (37.9%) | - |
| Total Households | 1,360 (100.0%) | 2.30 |
Household Size by Marriage Status in Elba
Out of a total of 1,360 households in Elba, 845 (62.1%) are family households, while 515 (37.9%) are nonfamily households. The most numerous type of family households are 2-person households, comprising 441, and the most common type of nonfamily households are 1-person households, comprising 515.
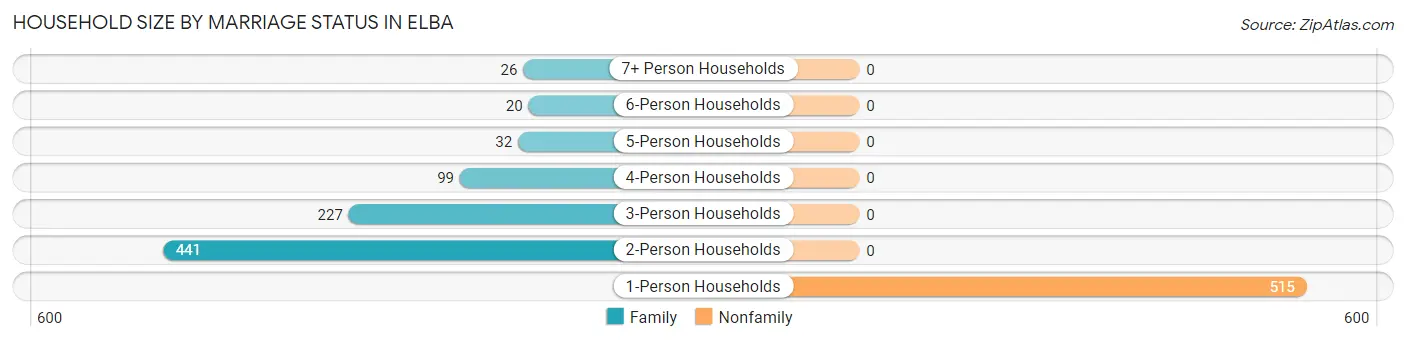
| Household Size | Family Households | Nonfamily Households |
| 1-Person Households | - | 515 (37.9%) |
| 2-Person Households | 441 (32.4%) | 0 (0.0%) |
| 3-Person Households | 227 (16.7%) | 0 (0.0%) |
| 4-Person Households | 99 (7.3%) | 0 (0.0%) |
| 5-Person Households | 32 (2.4%) | 0 (0.0%) |
| 6-Person Households | 20 (1.5%) | 0 (0.0%) |
| 7+ Person Households | 26 (1.9%) | 0 (0.0%) |
| Total | 845 (62.1%) | 515 (37.9%) |
Female Fertility in Elba
Fertility by Age in Elba
Average fertility rate in Elba is 109.0 births per 1,000 women. Women in the age bracket of 35 to 50 years have the highest fertility rate with 210.0 births per 1,000 women. Women in the age bracket of 35 to 50 years acount for 61.4% of all women with births.
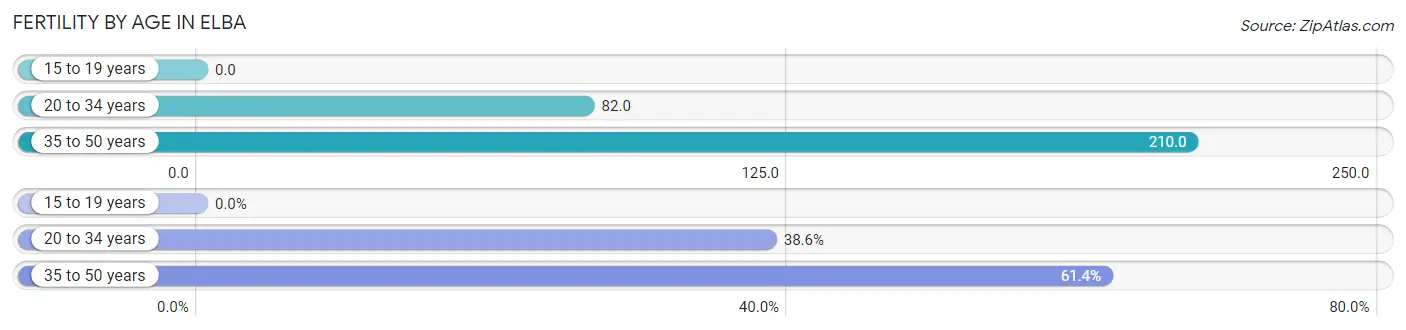
| Age Bracket | Women with Births | Births / 1,000 Women |
| 15 to 19 years | 0 (0.0%) | 0.0 |
| 20 to 34 years | 22 (38.6%) | 82.0 |
| 35 to 50 years | 35 (61.4%) | 210.0 |
| Total | 57 (100.0%) | 109.0 |
Fertility by Age by Marriage Status in Elba
3.5% of women with births (57) in Elba are married. The highest percentage of unmarried women with births falls into 35 to 50 years age bracket with 100.0% of them unmarried at the time of birth, while the lowest percentage of unmarried women with births belong to 20 to 34 years age bracket with 90.9% of them unmarried.
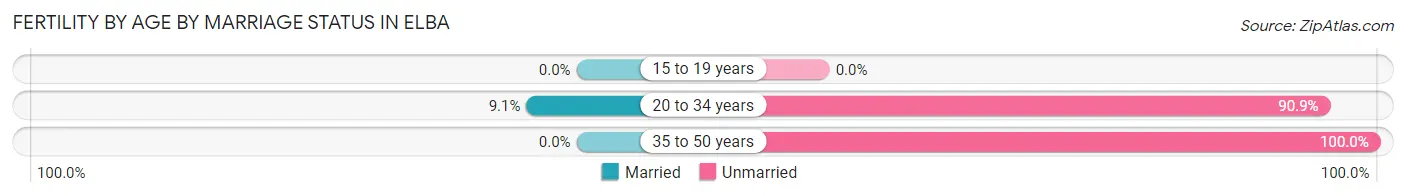
| Age Bracket | Married | Unmarried |
| 15 to 19 years | 0 (0.0%) | 0 (0.0%) |
| 20 to 34 years | 2 (9.1%) | 20 (90.9%) |
| 35 to 50 years | 0 (0.0%) | 35 (100.0%) |
| Total | 2 (3.5%) | 55 (96.5%) |
Fertility by Education in Elba
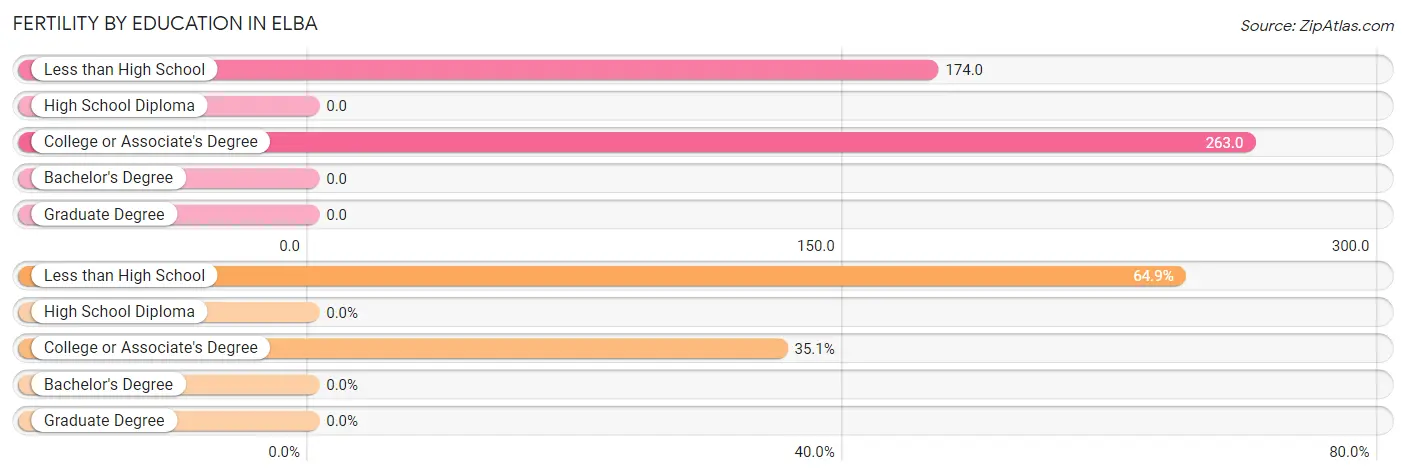
| Educational Attainment | Women with Births | Births / 1,000 Women |
| Less than High School | 37 (64.9%) | 174.0 |
| High School Diploma | 0 (0.0%) | 0.0 |
| College or Associate's Degree | 20 (35.1%) | 263.0 |
| Bachelor's Degree | 0 (0.0%) | 0.0 |
| Graduate Degree | 0 (0.0%) | 0.0 |
| Total | 57 (100.0%) | 109.0 |
Fertility by Education by Marriage Status in Elba
96.5% of women with births in Elba are unmarried. Women with the educational attainment of less than high school are most likely to be married with 5.4% of them married at childbirth, while women with the educational attainment of college or associate's degree are least likely to be married with 100.0% of them unmarried at childbirth.
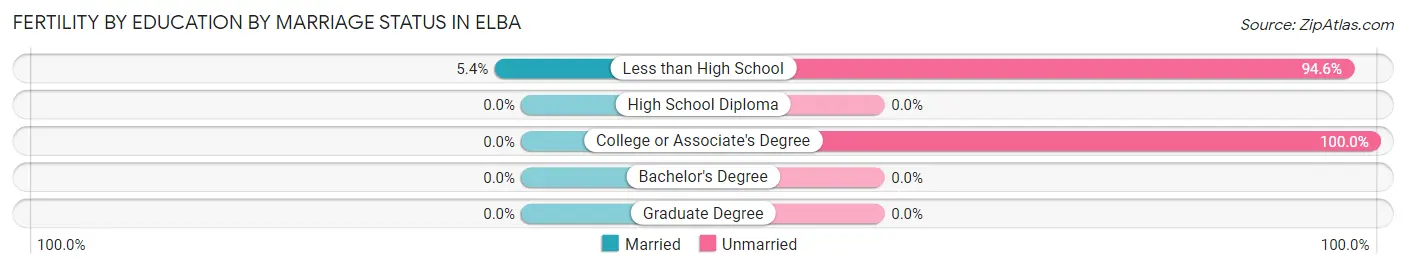
| Educational Attainment | Married | Unmarried |
| Less than High School | 2 (5.4%) | 35 (94.6%) |
| High School Diploma | 0 (0.0%) | 0 (0.0%) |
| College or Associate's Degree | 0 (0.0%) | 20 (100.0%) |
| Bachelor's Degree | 0 (0.0%) | 0 (0.0%) |
| Graduate Degree | 0 (0.0%) | 0 (0.0%) |
| Total | 2 (3.5%) | 55 (96.5%) |
Employment Characteristics in Elba
Employment by Class of Employer in Elba
Among the 1,100 employed individuals in Elba, private company employees (807 | 73.4%), self-employed (not incorporated) (134 | 12.2%), and federal government employees (76 | 6.9%) make up the most common classes of employment.
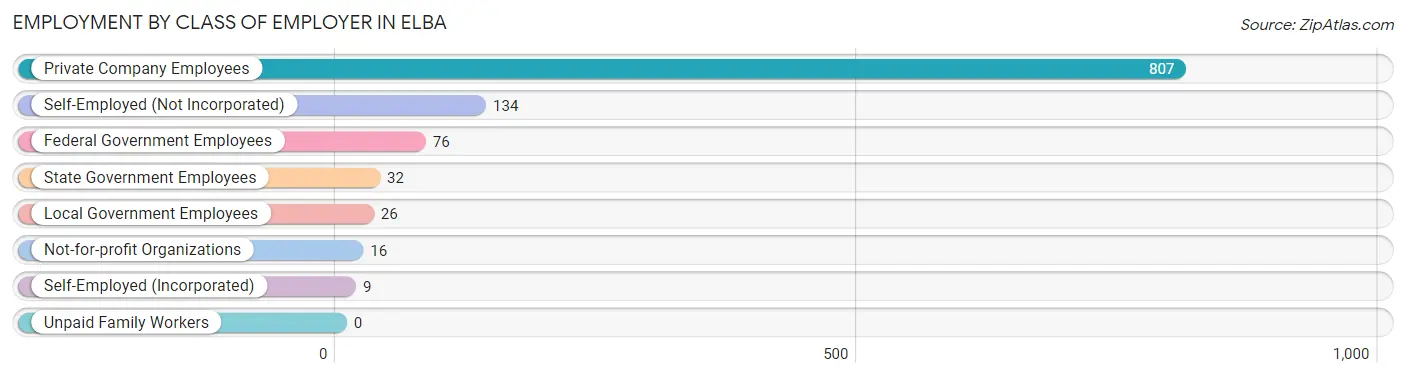
| Employer Class | # Employees | % Employees |
| Private Company Employees | 807 | 73.4% |
| Self-Employed (Incorporated) | 9 | 0.8% |
| Self-Employed (Not Incorporated) | 134 | 12.2% |
| Not-for-profit Organizations | 16 | 1.5% |
| Local Government Employees | 26 | 2.4% |
| State Government Employees | 32 | 2.9% |
| Federal Government Employees | 76 | 6.9% |
| Unpaid Family Workers | 0 | 0.0% |
| Total | 1,100 | 100.0% |
Employment Status by Age in Elba
According to the labor force statistics for Elba, out of the total population over 16 years of age (3,118), 41.7% or 1,300 individuals are in the labor force, with 11.2% or 146 of them unemployed. The age group with the highest labor force participation rate is 45 to 54 years, with 80.7% or 526 individuals in the labor force. Within the labor force, the 35 to 44 years age range has the highest percentage of unemployed individuals, with 38.3% or 49 of them being unemployed.
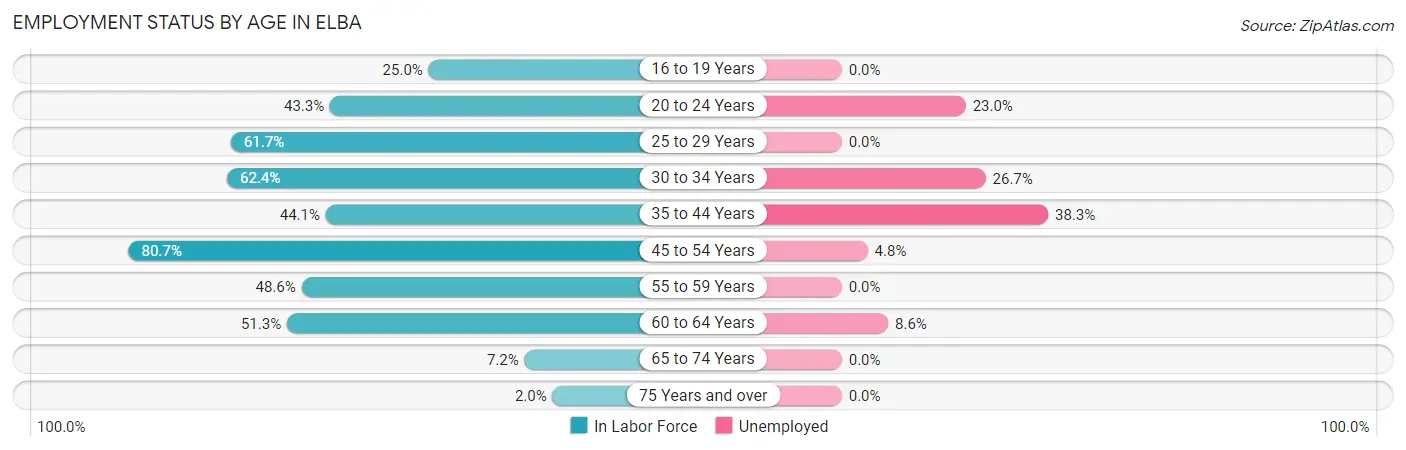
| Age Bracket | In Labor Force | Unemployed |
| 16 to 19 Years | 33 (25.0%) | 0 (0.0%) |
| 20 to 24 Years | 61 (43.3%) | 14 (23.0%) |
| 25 to 29 Years | 100 (61.7%) | 0 (0.0%) |
| 30 to 34 Years | 176 (62.4%) | 47 (26.7%) |
| 35 to 44 Years | 128 (44.1%) | 49 (38.3%) |
| 45 to 54 Years | 526 (80.7%) | 25 (4.8%) |
| 55 to 59 Years | 108 (48.6%) | 0 (0.0%) |
| 60 to 64 Years | 116 (51.3%) | 10 (8.6%) |
| 65 to 74 Years | 44 (7.2%) | 0 (0.0%) |
| 75 Years and over | 8 (2.0%) | 0 (0.0%) |
| Total | 1,300 (41.7%) | 146 (11.2%) |
Employment Status by Educational Attainment in Elba
According to labor force statistics for Elba, 62.9% of individuals (1,154) out of the total population between 25 and 64 years of age (1,834) are in the labor force, with 11.4% or 132 of them being unemployed. The group with the highest labor force participation rate are those with the educational attainment of bachelor's degree or higher, with 82.1% or 110 individuals in the labor force. Within the labor force, individuals with less than high school education have the highest percentage of unemployment, with 32.7% or 74 of them being unemployed.
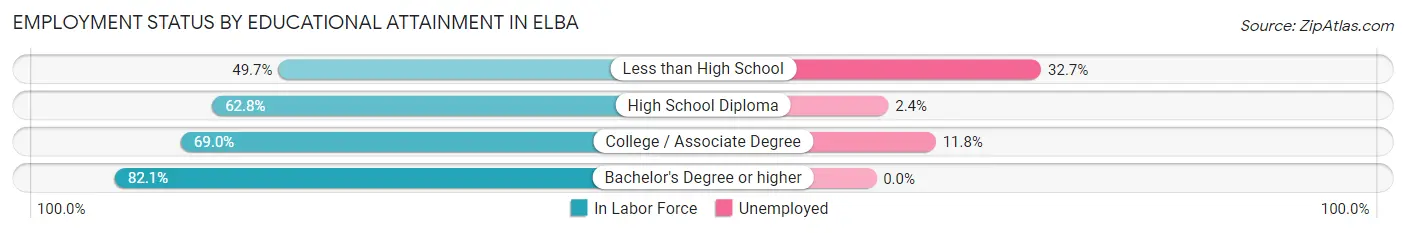
| Educational Attainment | In Labor Force | Unemployed |
| Less than High School | 226 (49.7%) | 149 (32.7%) |
| High School Diploma | 421 (62.8%) | 16 (2.4%) |
| College / Associate Degree | 397 (69.0%) | 68 (11.8%) |
| Bachelor's Degree or higher | 110 (82.1%) | 0 (0.0%) |
| Total | 1,154 (62.9%) | 209 (11.4%) |
Employment Occupations by Sex in Elba
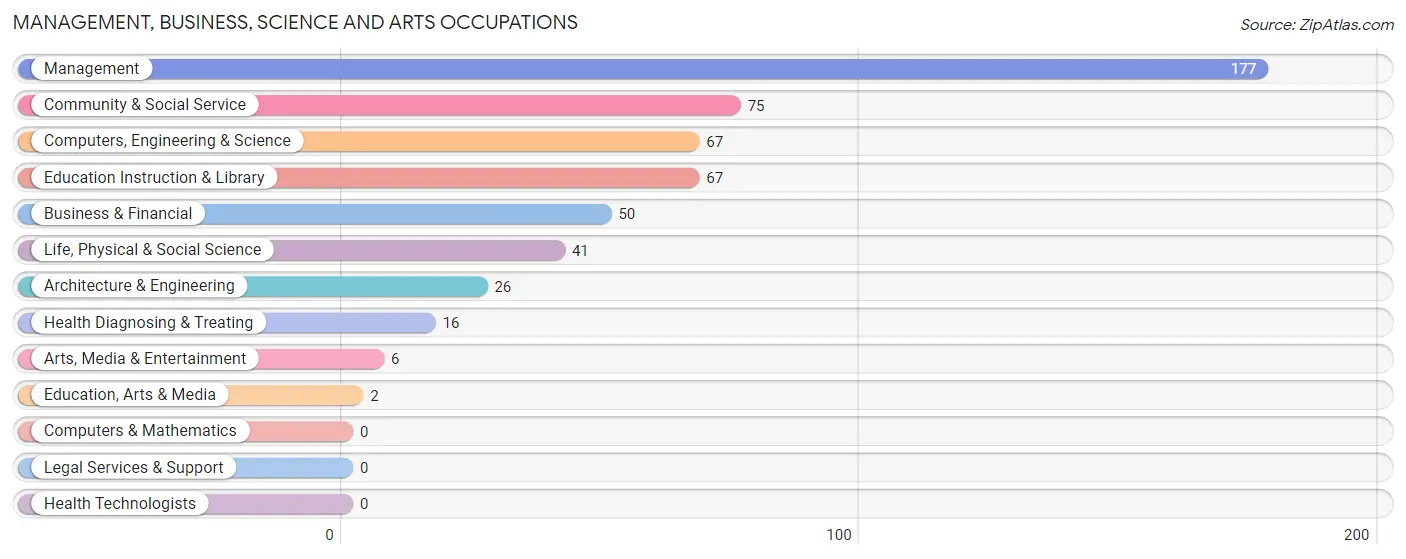
Management, Business, Science and Arts Occupations
The most common Management, Business, Science and Arts occupations in Elba are Management (177 | 15.3%), Community & Social Service (75 | 6.5%), Computers, Engineering & Science (67 | 5.8%), Education Instruction & Library (67 | 5.8%), and Business & Financial (50 | 4.3%).
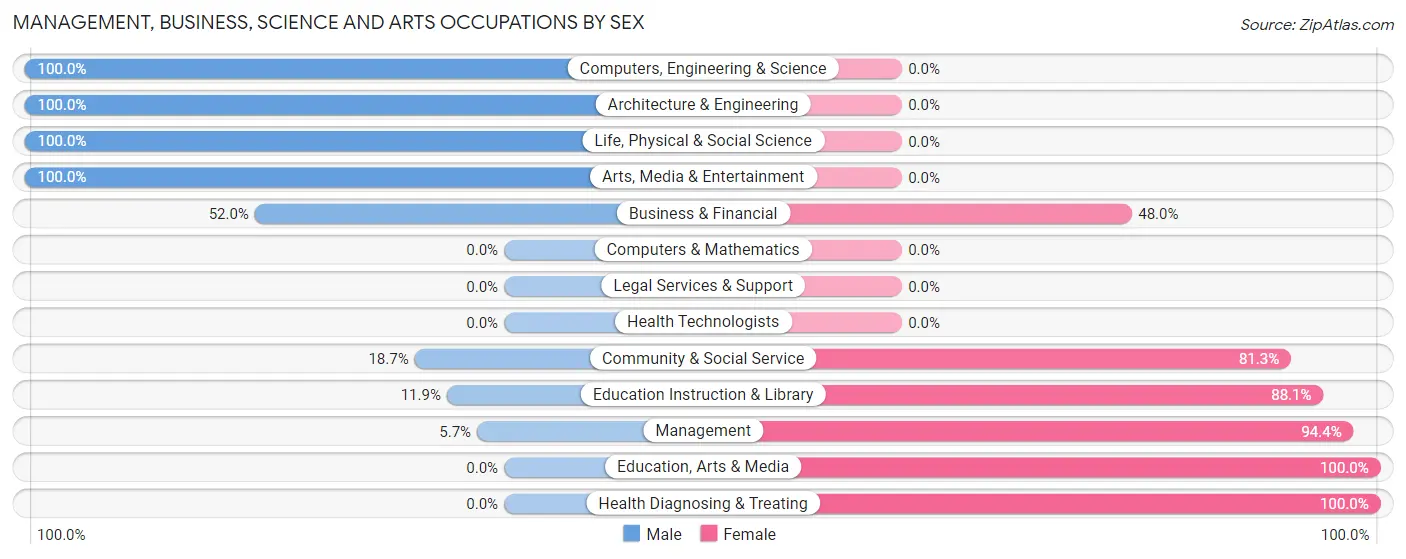
Management, Business, Science and Arts Occupations by Sex
Within the Management, Business, Science and Arts occupations in Elba, the most male-oriented occupations are Computers, Engineering & Science (100.0%), Architecture & Engineering (100.0%), and Life, Physical & Social Science (100.0%), while the most female-oriented occupations are Education, Arts & Media (100.0%), Health Diagnosing & Treating (100.0%), and Management (94.4%).
| Occupation | Male | Female |
| Management | 10 (5.7%) | 167 (94.4%) |
| Business & Financial | 26 (52.0%) | 24 (48.0%) |
| Computers, Engineering & Science | 67 (100.0%) | 0 (0.0%) |
| Computers & Mathematics | 0 (0.0%) | 0 (0.0%) |
| Architecture & Engineering | 26 (100.0%) | 0 (0.0%) |
| Life, Physical & Social Science | 41 (100.0%) | 0 (0.0%) |
| Community & Social Service | 14 (18.7%) | 61 (81.3%) |
| Education, Arts & Media | 0 (0.0%) | 2 (100.0%) |
| Legal Services & Support | 0 (0.0%) | 0 (0.0%) |
| Education Instruction & Library | 8 (11.9%) | 59 (88.1%) |
| Arts, Media & Entertainment | 6 (100.0%) | 0 (0.0%) |
| Health Diagnosing & Treating | 0 (0.0%) | 16 (100.0%) |
| Health Technologists | 0 (0.0%) | 0 (0.0%) |
| Total (Category) | 117 (30.4%) | 268 (69.6%) |
| Total (Overall) | 627 (54.3%) | 528 (45.7%) |
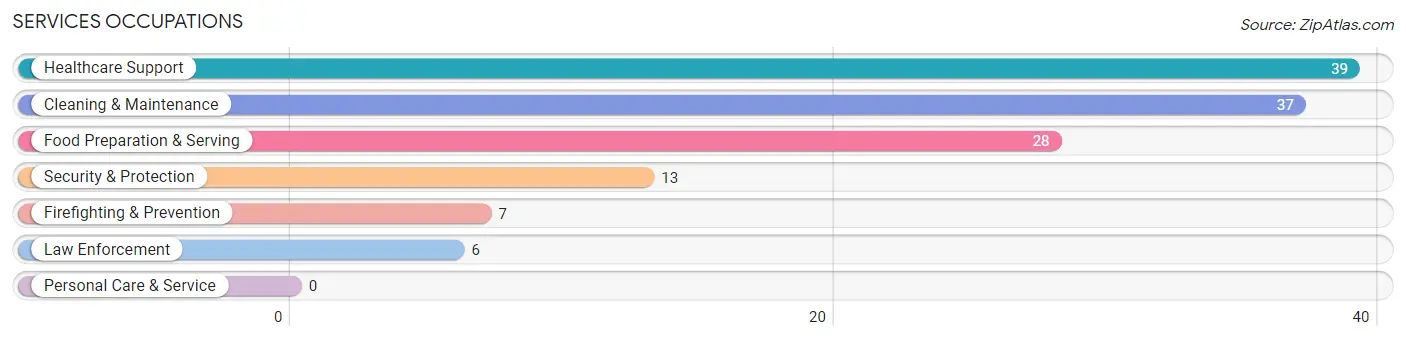
Services Occupations
The most common Services occupations in Elba are Healthcare Support (39 | 3.4%), Cleaning & Maintenance (37 | 3.2%), Food Preparation & Serving (28 | 2.4%), Security & Protection (13 | 1.1%), and Firefighting & Prevention (7 | 0.6%).
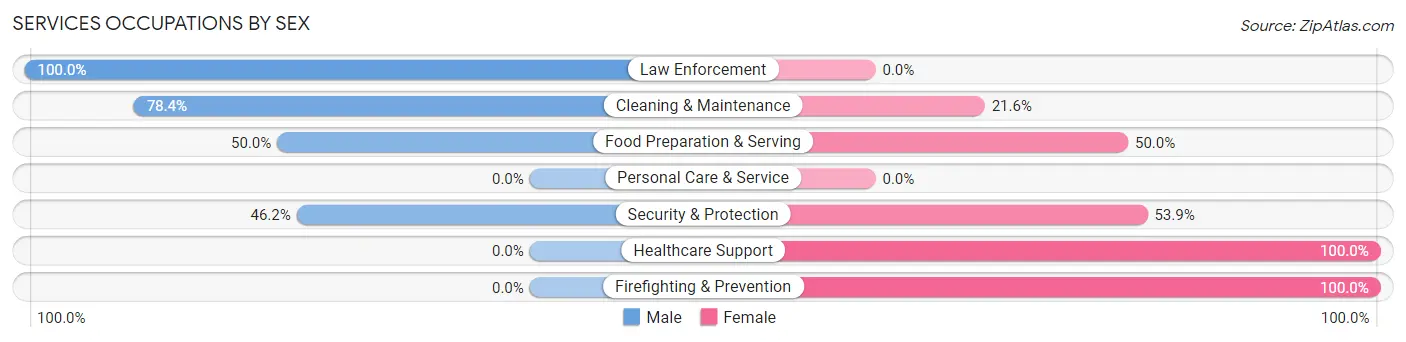
Services Occupations by Sex
Within the Services occupations in Elba, the most male-oriented occupations are Law Enforcement (100.0%), Cleaning & Maintenance (78.4%), and Food Preparation & Serving (50.0%), while the most female-oriented occupations are Healthcare Support (100.0%), Firefighting & Prevention (100.0%), and Security & Protection (53.8%).
| Occupation | Male | Female |
| Healthcare Support | 0 (0.0%) | 39 (100.0%) |
| Security & Protection | 6 (46.2%) | 7 (53.8%) |
| Firefighting & Prevention | 0 (0.0%) | 7 (100.0%) |
| Law Enforcement | 6 (100.0%) | 0 (0.0%) |
| Food Preparation & Serving | 14 (50.0%) | 14 (50.0%) |
| Cleaning & Maintenance | 29 (78.4%) | 8 (21.6%) |
| Personal Care & Service | 0 (0.0%) | 0 (0.0%) |
| Total (Category) | 49 (41.9%) | 68 (58.1%) |
| Total (Overall) | 627 (54.3%) | 528 (45.7%) |
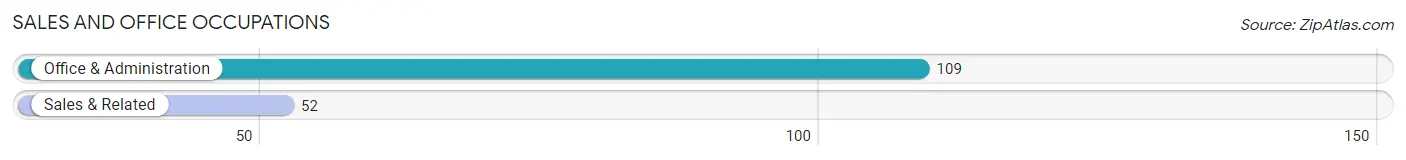
Sales and Office Occupations
The most common Sales and Office occupations in Elba are Office & Administration (109 | 9.4%), and Sales & Related (52 | 4.5%).
Sales and Office Occupations by Sex
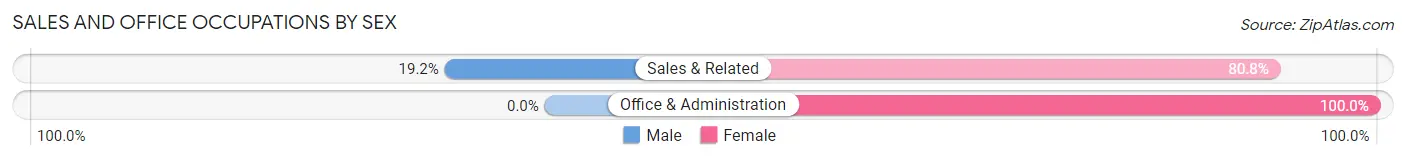
| Occupation | Male | Female |
| Sales & Related | 10 (19.2%) | 42 (80.8%) |
| Office & Administration | 0 (0.0%) | 109 (100.0%) |
| Total (Category) | 10 (6.2%) | 151 (93.8%) |
| Total (Overall) | 627 (54.3%) | 528 (45.7%) |
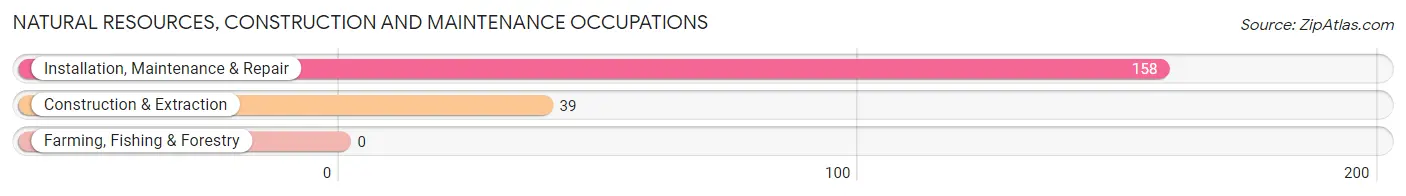
Natural Resources, Construction and Maintenance Occupations
The most common Natural Resources, Construction and Maintenance occupations in Elba are Installation, Maintenance & Repair (158 | 13.7%), and Construction & Extraction (39 | 3.4%).
Natural Resources, Construction and Maintenance Occupations by Sex
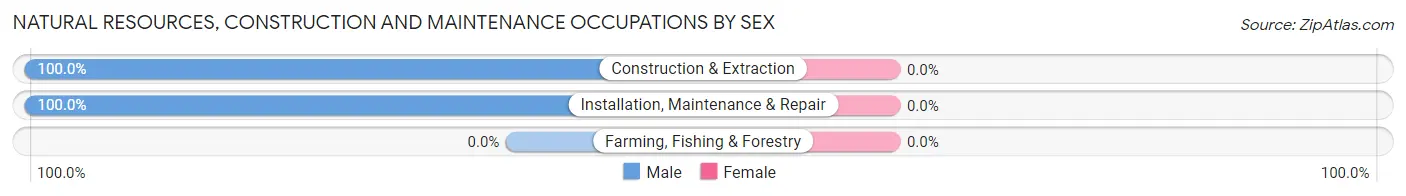
| Occupation | Male | Female |
| Farming, Fishing & Forestry | 0 (0.0%) | 0 (0.0%) |
| Construction & Extraction | 39 (100.0%) | 0 (0.0%) |
| Installation, Maintenance & Repair | 158 (100.0%) | 0 (0.0%) |
| Total (Category) | 197 (100.0%) | 0 (0.0%) |
| Total (Overall) | 627 (54.3%) | 528 (45.7%) |
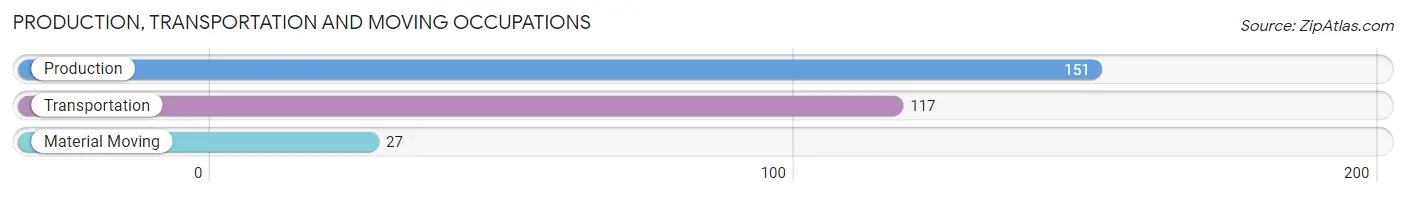
Production, Transportation and Moving Occupations
The most common Production, Transportation and Moving occupations in Elba are Production (151 | 13.1%), Transportation (117 | 10.1%), and Material Moving (27 | 2.3%).
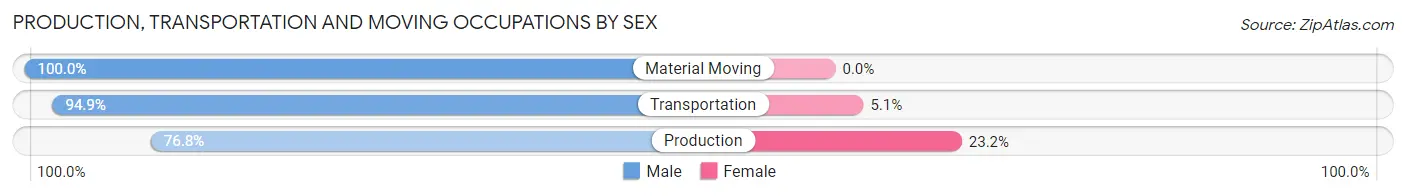
Production, Transportation and Moving Occupations by Sex
| Occupation | Male | Female |
| Production | 116 (76.8%) | 35 (23.2%) |
| Transportation | 111 (94.9%) | 6 (5.1%) |
| Material Moving | 27 (100.0%) | 0 (0.0%) |
| Total (Category) | 254 (86.1%) | 41 (13.9%) |
| Total (Overall) | 627 (54.3%) | 528 (45.7%) |
Employment Industries by Sex in Elba
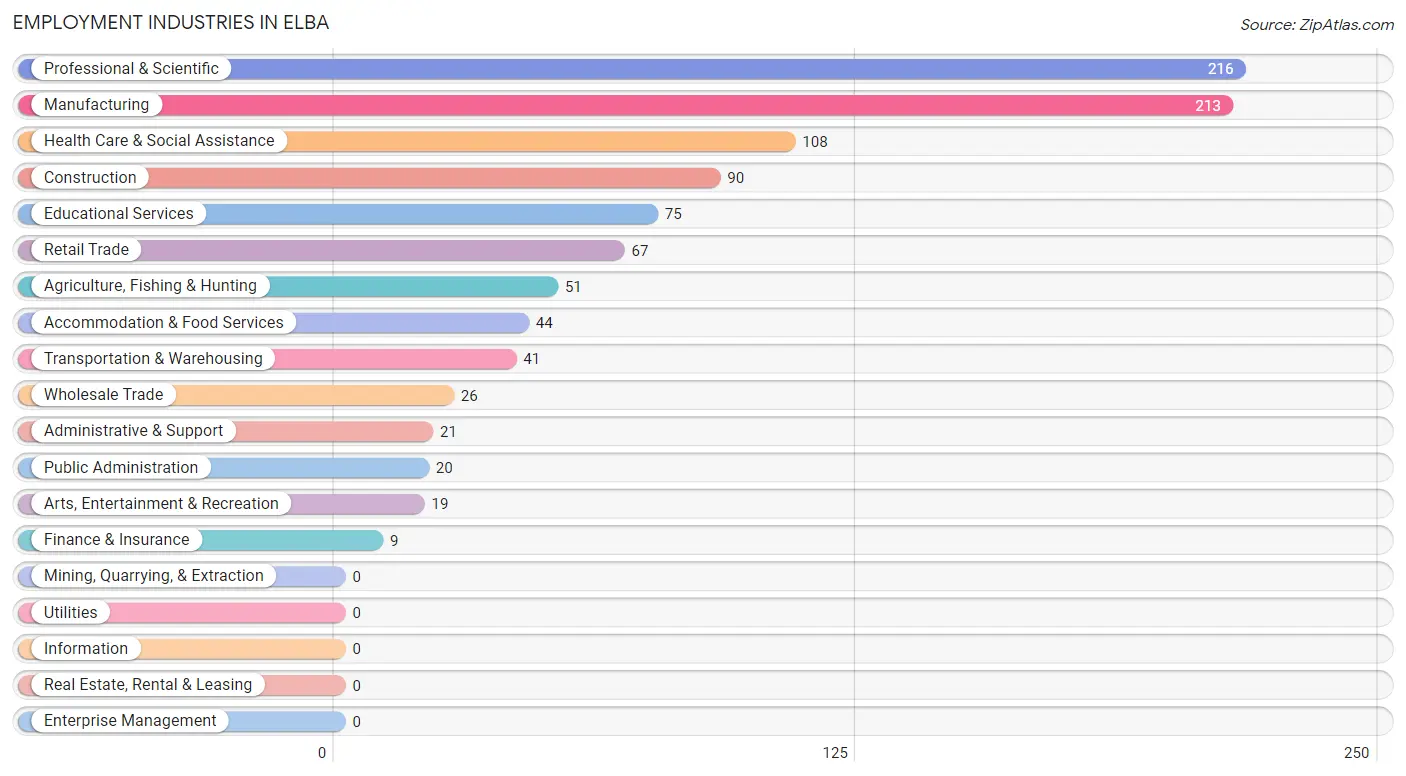
Employment Industries in Elba
The major employment industries in Elba include Professional & Scientific (216 | 18.7%), Manufacturing (213 | 18.4%), Health Care & Social Assistance (108 | 9.3%), Construction (90 | 7.8%), and Educational Services (75 | 6.5%).
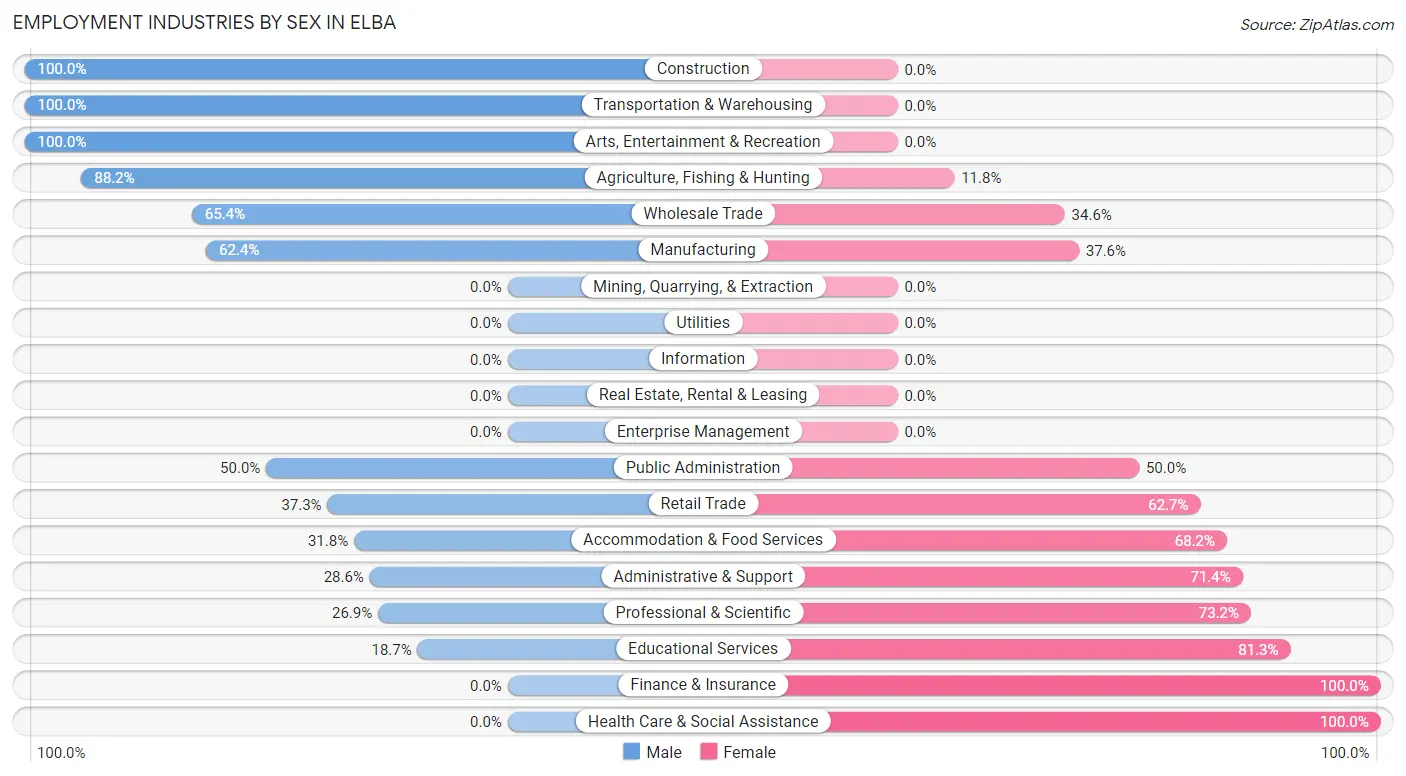
Employment Industries by Sex in Elba
The Elba industries that see more men than women are Construction (100.0%), Transportation & Warehousing (100.0%), and Arts, Entertainment & Recreation (100.0%), whereas the industries that tend to have a higher number of women are Finance & Insurance (100.0%), Health Care & Social Assistance (100.0%), and Educational Services (81.3%).
| Industry | Male | Female |
| Agriculture, Fishing & Hunting | 45 (88.2%) | 6 (11.8%) |
| Mining, Quarrying, & Extraction | 0 (0.0%) | 0 (0.0%) |
| Construction | 90 (100.0%) | 0 (0.0%) |
| Manufacturing | 133 (62.4%) | 80 (37.6%) |
| Wholesale Trade | 17 (65.4%) | 9 (34.6%) |
| Retail Trade | 25 (37.3%) | 42 (62.7%) |
| Transportation & Warehousing | 41 (100.0%) | 0 (0.0%) |
| Utilities | 0 (0.0%) | 0 (0.0%) |
| Information | 0 (0.0%) | 0 (0.0%) |
| Finance & Insurance | 0 (0.0%) | 9 (100.0%) |
| Real Estate, Rental & Leasing | 0 (0.0%) | 0 (0.0%) |
| Professional & Scientific | 58 (26.9%) | 158 (73.2%) |
| Enterprise Management | 0 (0.0%) | 0 (0.0%) |
| Administrative & Support | 6 (28.6%) | 15 (71.4%) |
| Educational Services | 14 (18.7%) | 61 (81.3%) |
| Health Care & Social Assistance | 0 (0.0%) | 108 (100.0%) |
| Arts, Entertainment & Recreation | 19 (100.0%) | 0 (0.0%) |
| Accommodation & Food Services | 14 (31.8%) | 30 (68.2%) |
| Public Administration | 10 (50.0%) | 10 (50.0%) |
| Total | 627 (54.3%) | 528 (45.7%) |
Education in Elba
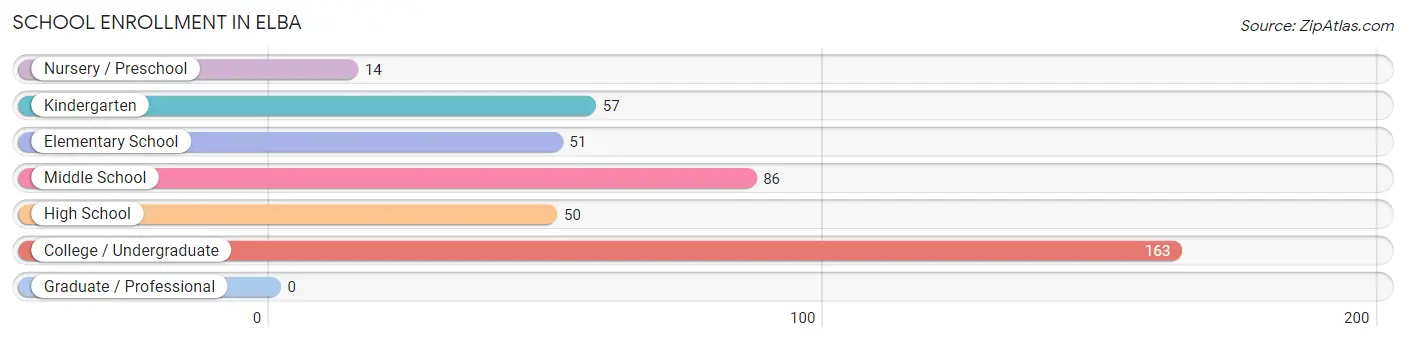
School Enrollment in Elba
The most common levels of schooling among the 421 students in Elba are college / undergraduate (163 | 38.7%), middle school (86 | 20.4%), and kindergarten (57 | 13.5%).
| School Level | # Students | % Students |
| Nursery / Preschool | 14 | 3.3% |
| Kindergarten | 57 | 13.5% |
| Elementary School | 51 | 12.1% |
| Middle School | 86 | 20.4% |
| High School | 50 | 11.9% |
| College / Undergraduate | 163 | 38.7% |
| Graduate / Professional | 0 | 0.0% |
| Total | 421 | 100.0% |
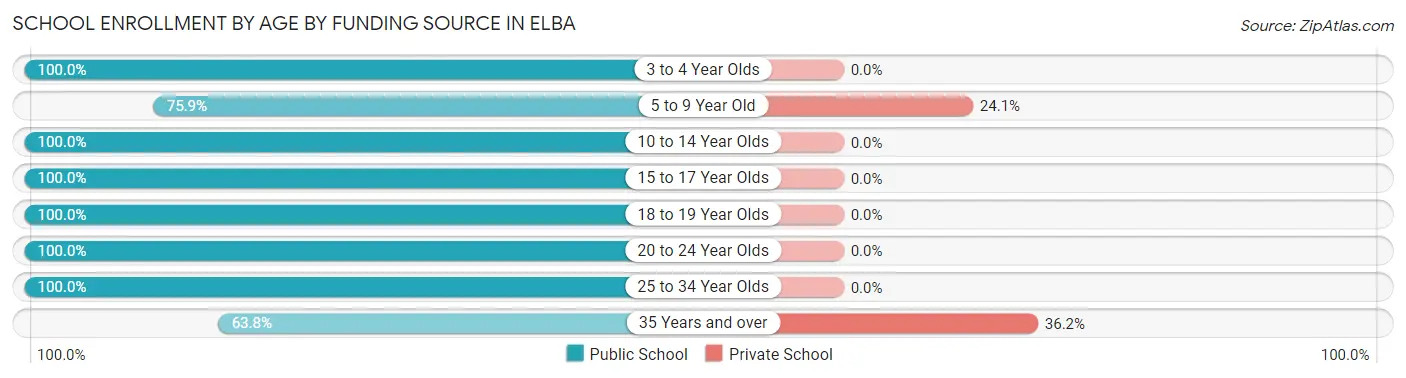
School Enrollment by Age by Funding Source in Elba
Out of a total of 421 students who are enrolled in schools in Elba, 43 (10.2%) attend a private institution, while the remaining 378 (89.8%) are enrolled in public schools. The age group of 35 years and over has the highest likelihood of being enrolled in private schools, with 17 (36.2% in the age bracket) enrolled. Conversely, the age group of 3 to 4 year olds has the lowest likelihood of being enrolled in a private school, with 14 (100.0% in the age bracket) attending a public institution.
| Age Bracket | Public School | Private School |
| 3 to 4 Year Olds | 14 (100.0%) | 0 (0.0%) |
| 5 to 9 Year Old | 82 (75.9%) | 26 (24.1%) |
| 10 to 14 Year Olds | 86 (100.0%) | 0 (0.0%) |
| 15 to 17 Year Olds | 50 (100.0%) | 0 (0.0%) |
| 18 to 19 Year Olds | 16 (100.0%) | 0 (0.0%) |
| 20 to 24 Year Olds | 47 (100.0%) | 0 (0.0%) |
| 25 to 34 Year Olds | 53 (100.0%) | 0 (0.0%) |
| 35 Years and over | 30 (63.8%) | 17 (36.2%) |
| Total | 378 (89.8%) | 43 (10.2%) |
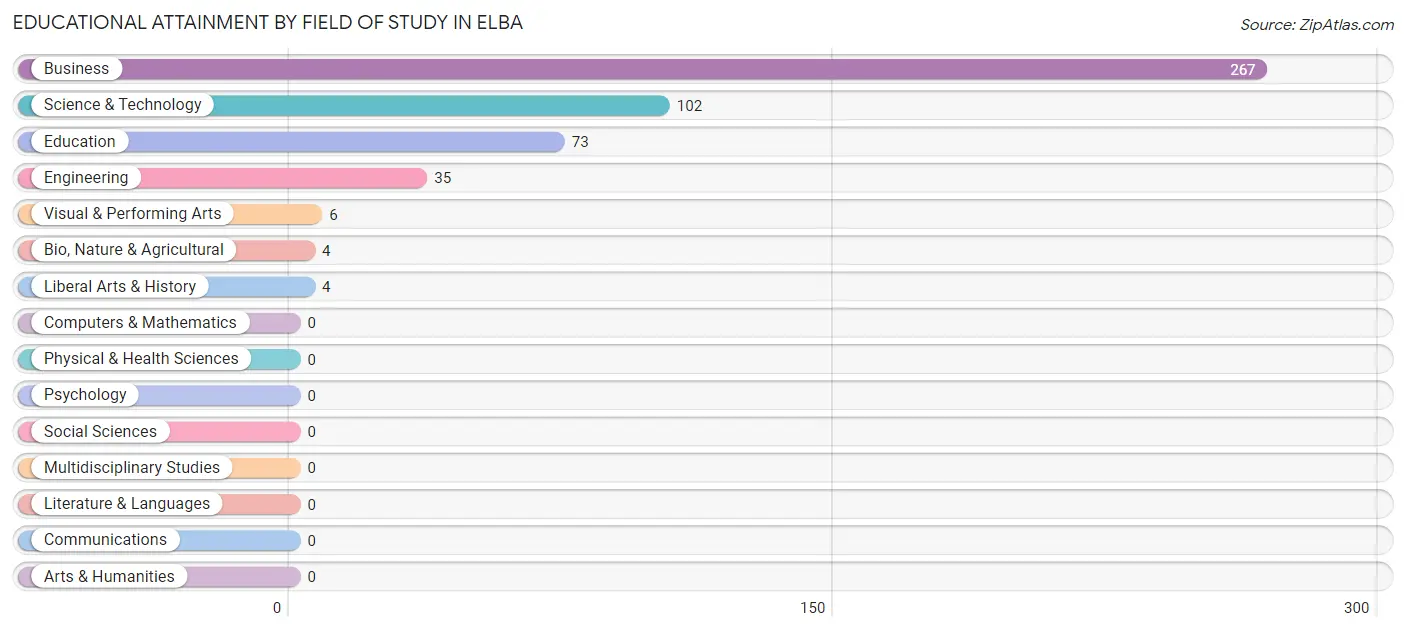
Educational Attainment by Field of Study in Elba
Business (267 | 54.4%), science & technology (102 | 20.8%), education (73 | 14.9%), engineering (35 | 7.1%), and visual & performing arts (6 | 1.2%) are the most common fields of study among 491 individuals in Elba who have obtained a bachelor's degree or higher.
| Field of Study | # Graduates | % Graduates |
| Computers & Mathematics | 0 | 0.0% |
| Bio, Nature & Agricultural | 4 | 0.8% |
| Physical & Health Sciences | 0 | 0.0% |
| Psychology | 0 | 0.0% |
| Social Sciences | 0 | 0.0% |
| Engineering | 35 | 7.1% |
| Multidisciplinary Studies | 0 | 0.0% |
| Science & Technology | 102 | 20.8% |
| Business | 267 | 54.4% |
| Education | 73 | 14.9% |
| Literature & Languages | 0 | 0.0% |
| Liberal Arts & History | 4 | 0.8% |
| Visual & Performing Arts | 6 | 1.2% |
| Communications | 0 | 0.0% |
| Arts & Humanities | 0 | 0.0% |
| Total | 491 | 100.0% |
Transportation & Commute in Elba
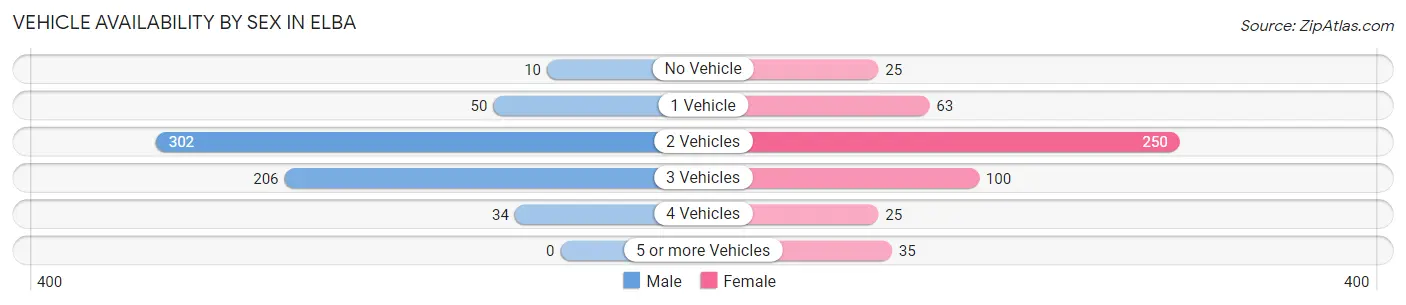
Vehicle Availability by Sex in Elba
The most prevalent vehicle ownership categories in Elba are males with 2 vehicles (302, accounting for 50.2%) and females with 2 vehicles (250, making up 60.6%).
| Vehicles Available | Male | Female |
| No Vehicle | 10 (1.7%) | 25 (5.0%) |
| 1 Vehicle | 50 (8.3%) | 63 (12.7%) |
| 2 Vehicles | 302 (50.2%) | 250 (50.2%) |
| 3 Vehicles | 206 (34.2%) | 100 (20.1%) |
| 4 Vehicles | 34 (5.7%) | 25 (5.0%) |
| 5 or more Vehicles | 0 (0.0%) | 35 (7.0%) |
| Total | 602 (100.0%) | 498 (100.0%) |
Commute Time in Elba
The most frequently occuring commute durations in Elba are 30 to 34 minutes (242 commuters, 22.4%), less than 5 minutes (199 commuters, 18.4%), and 40 to 44 minutes (145 commuters, 13.4%).
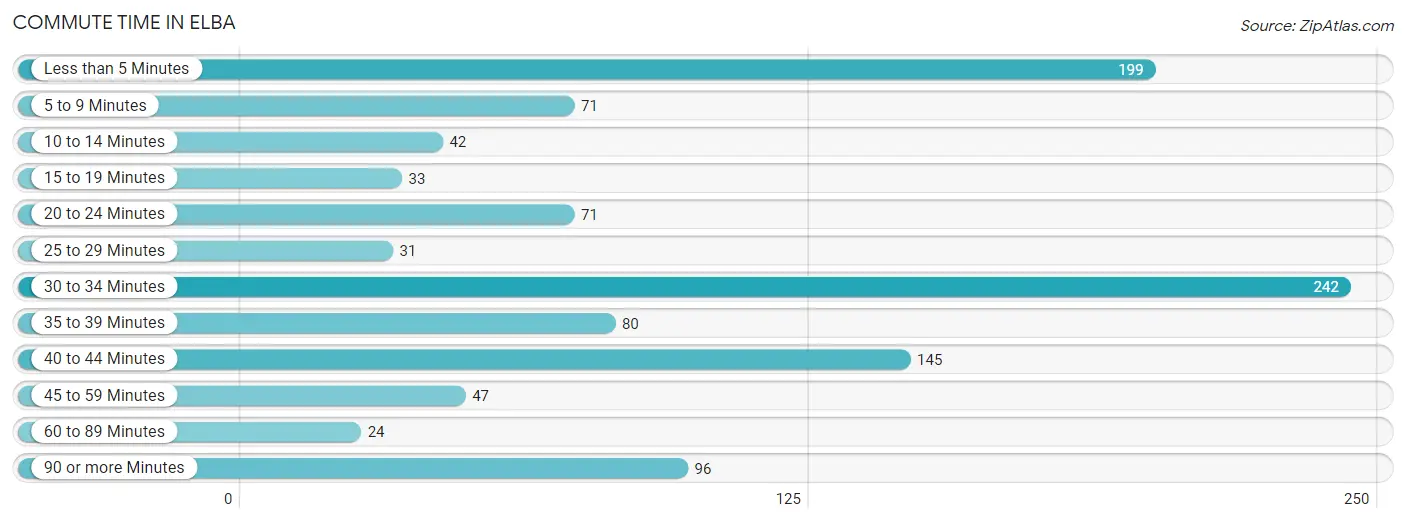
| Commute Time | # Commuters | % Commuters |
| Less than 5 Minutes | 199 | 18.4% |
| 5 to 9 Minutes | 71 | 6.6% |
| 10 to 14 Minutes | 42 | 3.9% |
| 15 to 19 Minutes | 33 | 3.0% |
| 20 to 24 Minutes | 71 | 6.6% |
| 25 to 29 Minutes | 31 | 2.9% |
| 30 to 34 Minutes | 242 | 22.4% |
| 35 to 39 Minutes | 80 | 7.4% |
| 40 to 44 Minutes | 145 | 13.4% |
| 45 to 59 Minutes | 47 | 4.3% |
| 60 to 89 Minutes | 24 | 2.2% |
| 90 or more Minutes | 96 | 8.9% |
Commute Time by Sex in Elba
The most common commute times in Elba are 30 to 34 minutes (181 commuters, 30.1%) for males and less than 5 minutes (135 commuters, 28.2%) for females.
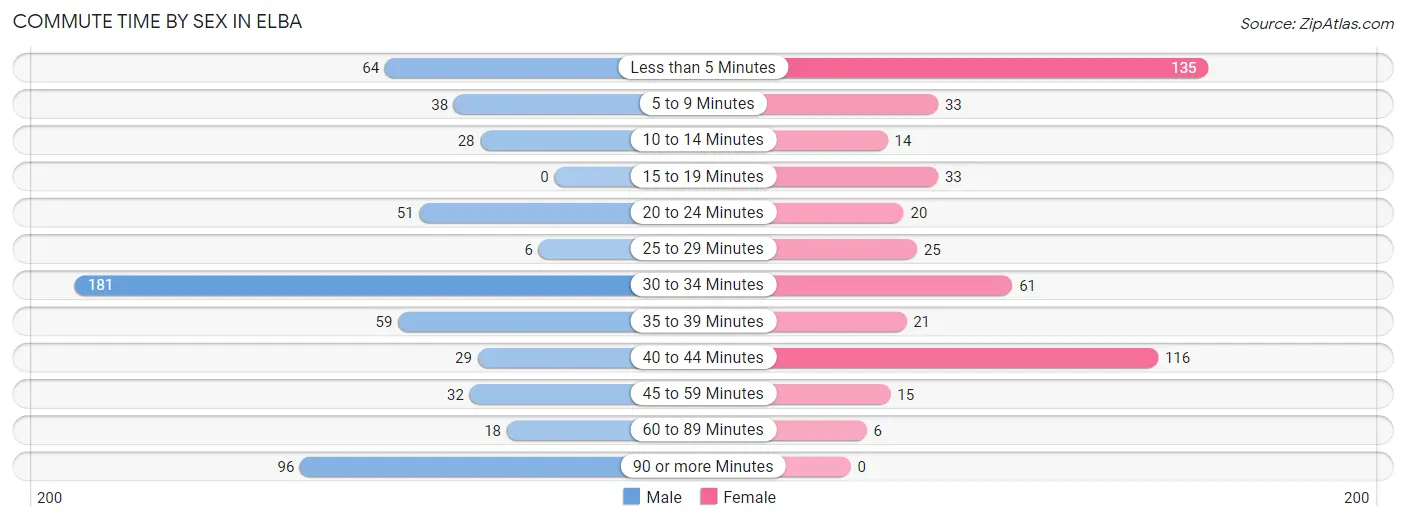
| Commute Time | Male | Female |
| Less than 5 Minutes | 64 (10.6%) | 135 (28.2%) |
| 5 to 9 Minutes | 38 (6.3%) | 33 (6.9%) |
| 10 to 14 Minutes | 28 (4.6%) | 14 (2.9%) |
| 15 to 19 Minutes | 0 (0.0%) | 33 (6.9%) |
| 20 to 24 Minutes | 51 (8.5%) | 20 (4.2%) |
| 25 to 29 Minutes | 6 (1.0%) | 25 (5.2%) |
| 30 to 34 Minutes | 181 (30.1%) | 61 (12.7%) |
| 35 to 39 Minutes | 59 (9.8%) | 21 (4.4%) |
| 40 to 44 Minutes | 29 (4.8%) | 116 (24.2%) |
| 45 to 59 Minutes | 32 (5.3%) | 15 (3.1%) |
| 60 to 89 Minutes | 18 (3.0%) | 6 (1.3%) |
| 90 or more Minutes | 96 (16.0%) | 0 (0.0%) |
Time of Departure to Work by Sex in Elba
The most frequent times of departure to work in Elba are 8:00 AM to 8:29 AM (166, 27.6%) for males and 8:00 AM to 8:29 AM (107, 22.3%) for females.
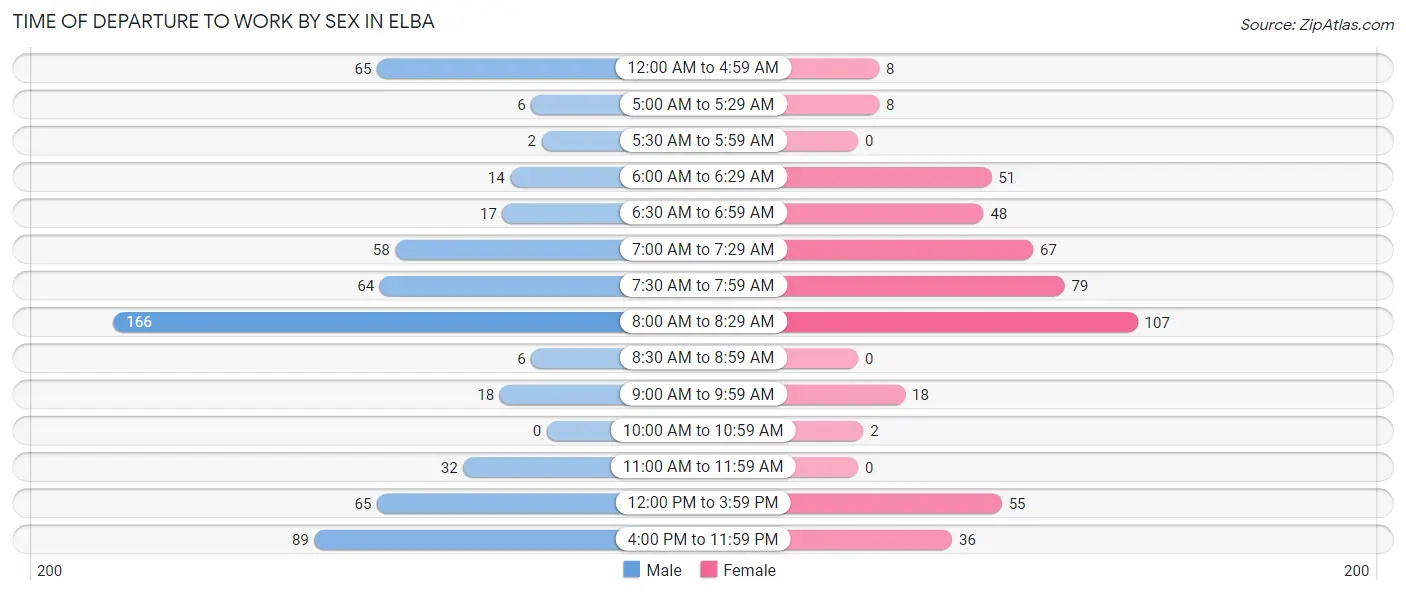
| Time of Departure | Male | Female |
| 12:00 AM to 4:59 AM | 65 (10.8%) | 8 (1.7%) |
| 5:00 AM to 5:29 AM | 6 (1.0%) | 8 (1.7%) |
| 5:30 AM to 5:59 AM | 2 (0.3%) | 0 (0.0%) |
| 6:00 AM to 6:29 AM | 14 (2.3%) | 51 (10.6%) |
| 6:30 AM to 6:59 AM | 17 (2.8%) | 48 (10.0%) |
| 7:00 AM to 7:29 AM | 58 (9.6%) | 67 (14.0%) |
| 7:30 AM to 7:59 AM | 64 (10.6%) | 79 (16.5%) |
| 8:00 AM to 8:29 AM | 166 (27.6%) | 107 (22.3%) |
| 8:30 AM to 8:59 AM | 6 (1.0%) | 0 (0.0%) |
| 9:00 AM to 9:59 AM | 18 (3.0%) | 18 (3.8%) |
| 10:00 AM to 10:59 AM | 0 (0.0%) | 2 (0.4%) |
| 11:00 AM to 11:59 AM | 32 (5.3%) | 0 (0.0%) |
| 12:00 PM to 3:59 PM | 65 (10.8%) | 55 (11.5%) |
| 4:00 PM to 11:59 PM | 89 (14.8%) | 36 (7.5%) |
| Total | 602 (100.0%) | 479 (100.0%) |
Housing Occupancy in Elba
Occupancy by Ownership in Elba
Of the total 1,360 dwellings in Elba, owner-occupied units account for 1,057 (77.7%), while renter-occupied units make up 303 (22.3%).
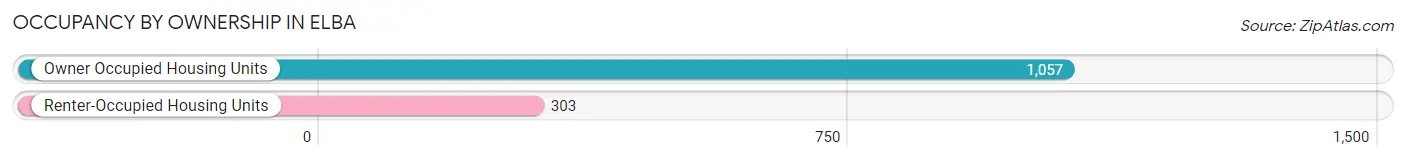
| Occupancy | # Housing Units | % Housing Units |
| Owner Occupied Housing Units | 1,057 | 77.7% |
| Renter-Occupied Housing Units | 303 | 22.3% |
| Total Occupied Housing Units | 1,360 | 100.0% |
Occupancy by Household Size in Elba
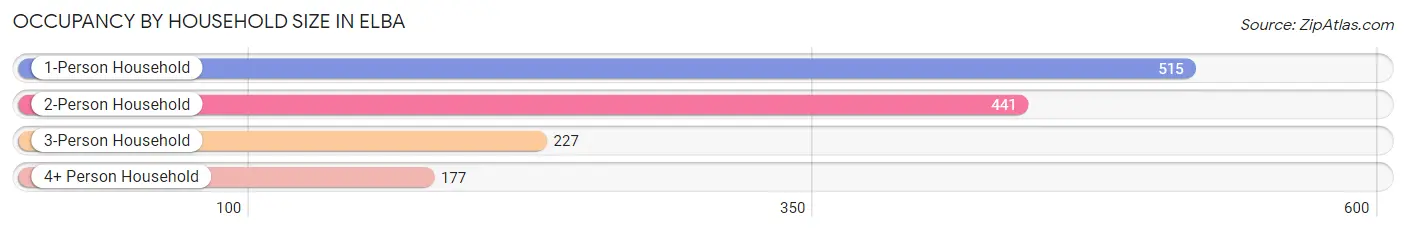
| Household Size | # Housing Units | % Housing Units |
| 1-Person Household | 515 | 37.9% |
| 2-Person Household | 441 | 32.4% |
| 3-Person Household | 227 | 16.7% |
| 4+ Person Household | 177 | 13.0% |
| Total Housing Units | 1,360 | 100.0% |
Occupancy by Ownership by Household Size in Elba
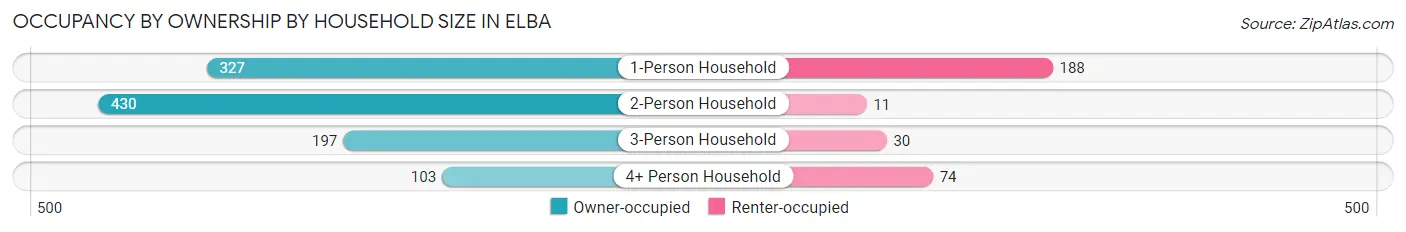
| Household Size | Owner-occupied | Renter-occupied |
| 1-Person Household | 327 (63.5%) | 188 (36.5%) |
| 2-Person Household | 430 (97.5%) | 11 (2.5%) |
| 3-Person Household | 197 (86.8%) | 30 (13.2%) |
| 4+ Person Household | 103 (58.2%) | 74 (41.8%) |
| Total Housing Units | 1,057 (77.7%) | 303 (22.3%) |
Occupancy by Educational Attainment in Elba
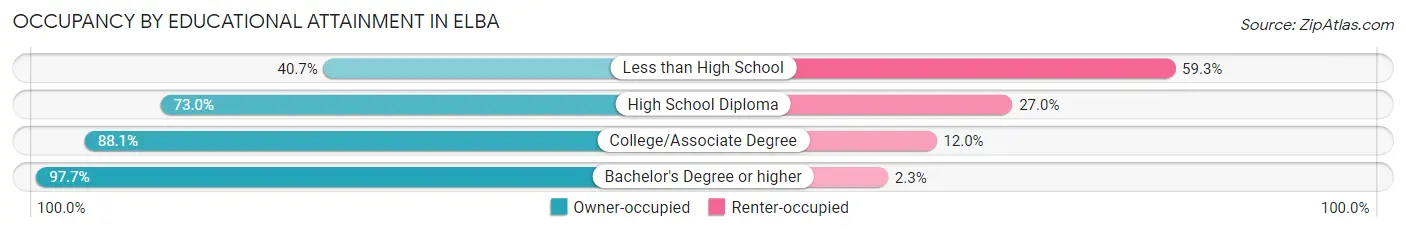
| Household Size | Owner-occupied | Renter-occupied |
| Less than High School | 90 (40.7%) | 131 (59.3%) |
| High School Diploma | 295 (73.0%) | 109 (27.0%) |
| College/Associate Degree | 420 (88.0%) | 57 (11.9%) |
| Bachelor's Degree or higher | 252 (97.7%) | 6 (2.3%) |
Occupancy by Age of Householder in Elba
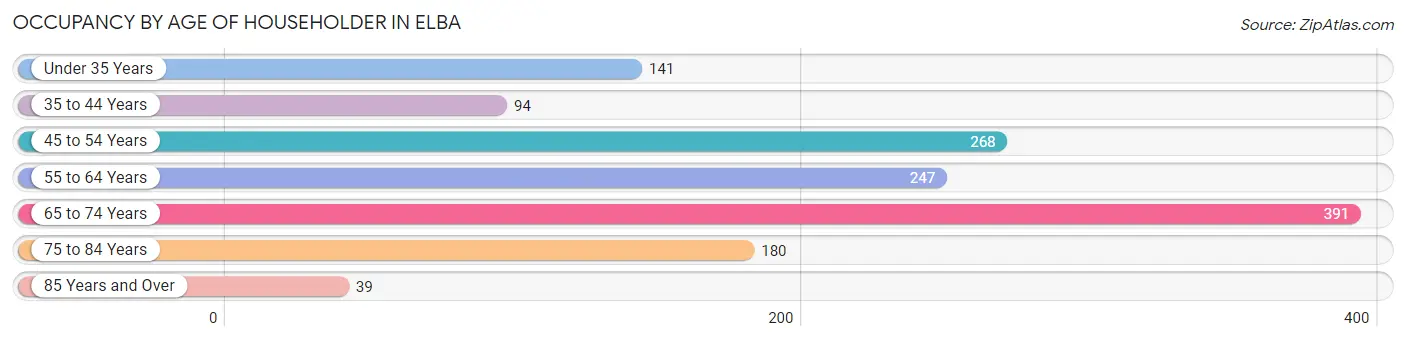
| Age Bracket | # Households | % Households |
| Under 35 Years | 141 | 10.4% |
| 35 to 44 Years | 94 | 6.9% |
| 45 to 54 Years | 268 | 19.7% |
| 55 to 64 Years | 247 | 18.2% |
| 65 to 74 Years | 391 | 28.7% |
| 75 to 84 Years | 180 | 13.2% |
| 85 Years and Over | 39 | 2.9% |
| Total | 1,360 | 100.0% |
Housing Finances in Elba
Median Income by Occupancy in Elba
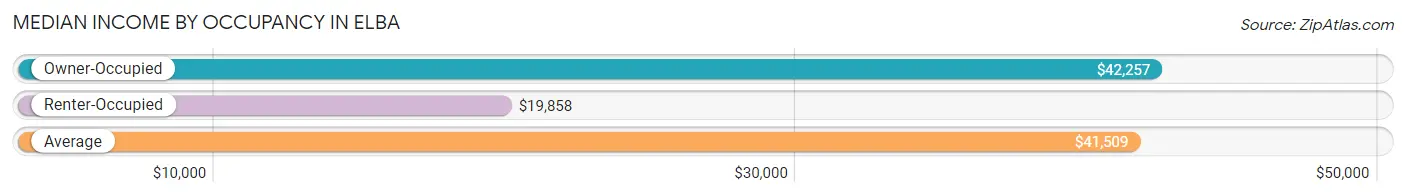
| Occupancy Type | # Households | Median Income |
| Owner-Occupied | 1,057 (77.7%) | $42,257 |
| Renter-Occupied | 303 (22.3%) | $19,858 |
| Average | 1,360 (100.0%) | $41,509 |
Occupancy by Householder Income Bracket in Elba
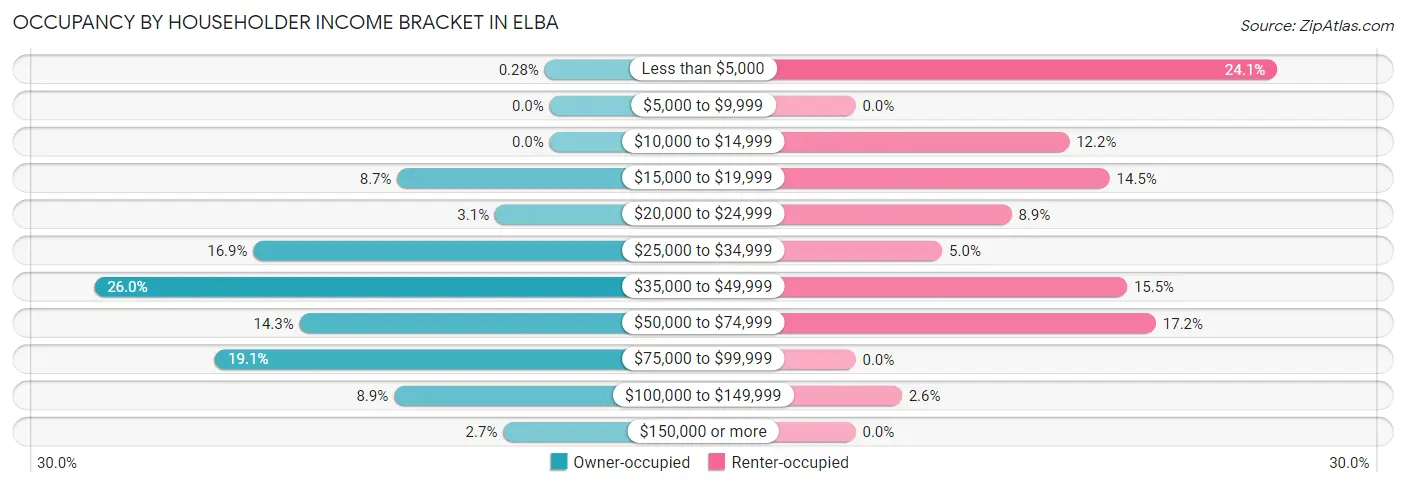
| Income Bracket | Owner-occupied | Renter-occupied |
| Less than $5,000 | 3 (0.3%) | 73 (24.1%) |
| $5,000 to $9,999 | 0 (0.0%) | 0 (0.0%) |
| $10,000 to $14,999 | 0 (0.0%) | 37 (12.2%) |
| $15,000 to $19,999 | 92 (8.7%) | 44 (14.5%) |
| $20,000 to $24,999 | 33 (3.1%) | 27 (8.9%) |
| $25,000 to $34,999 | 179 (16.9%) | 15 (5.0%) |
| $35,000 to $49,999 | 275 (26.0%) | 47 (15.5%) |
| $50,000 to $74,999 | 151 (14.3%) | 52 (17.2%) |
| $75,000 to $99,999 | 202 (19.1%) | 0 (0.0%) |
| $100,000 to $149,999 | 94 (8.9%) | 8 (2.6%) |
| $150,000 or more | 28 (2.6%) | 0 (0.0%) |
| Total | 1,057 (100.0%) | 303 (100.0%) |
Monthly Housing Cost Tiers in Elba
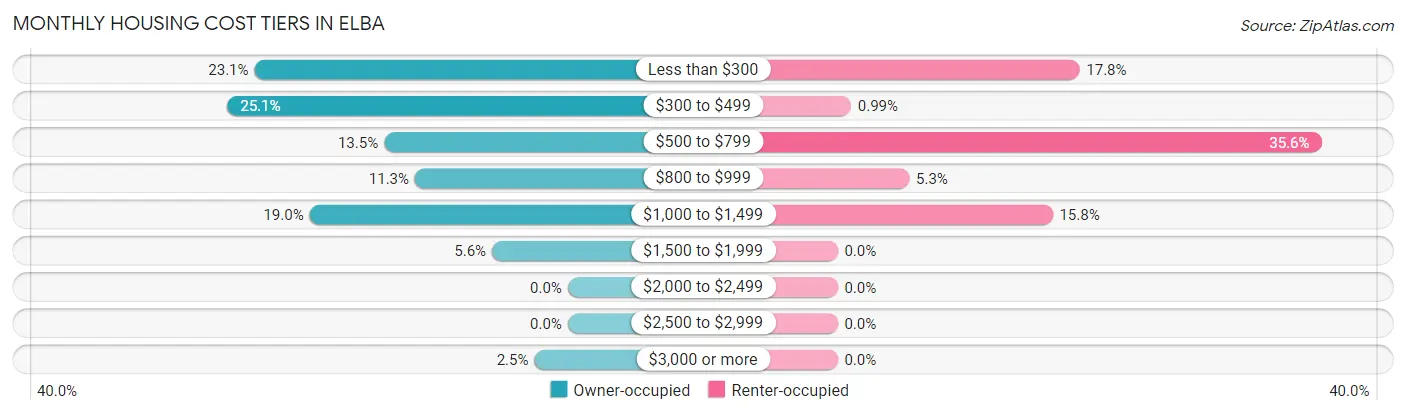
| Monthly Cost | Owner-occupied | Renter-occupied |
| Less than $300 | 244 (23.1%) | 54 (17.8%) |
| $300 to $499 | 265 (25.1%) | 3 (1.0%) |
| $500 to $799 | 143 (13.5%) | 108 (35.6%) |
| $800 to $999 | 119 (11.3%) | 16 (5.3%) |
| $1,000 to $1,499 | 201 (19.0%) | 48 (15.8%) |
| $1,500 to $1,999 | 59 (5.6%) | 0 (0.0%) |
| $2,000 to $2,499 | 0 (0.0%) | 0 (0.0%) |
| $2,500 to $2,999 | 0 (0.0%) | 0 (0.0%) |
| $3,000 or more | 26 (2.5%) | 0 (0.0%) |
| Total | 1,057 (100.0%) | 303 (100.0%) |
Physical Housing Characteristics in Elba
Housing Structures in Elba
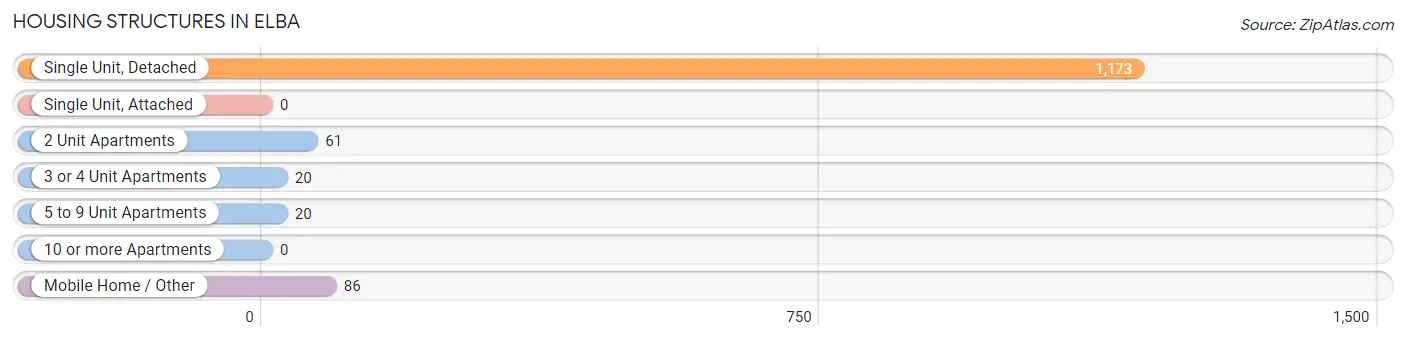
| Structure Type | # Housing Units | % Housing Units |
| Single Unit, Detached | 1,173 | 86.3% |
| Single Unit, Attached | 0 | 0.0% |
| 2 Unit Apartments | 61 | 4.5% |
| 3 or 4 Unit Apartments | 20 | 1.5% |
| 5 to 9 Unit Apartments | 20 | 1.5% |
| 10 or more Apartments | 0 | 0.0% |
| Mobile Home / Other | 86 | 6.3% |
| Total | 1,360 | 100.0% |
Housing Structures by Occupancy in Elba
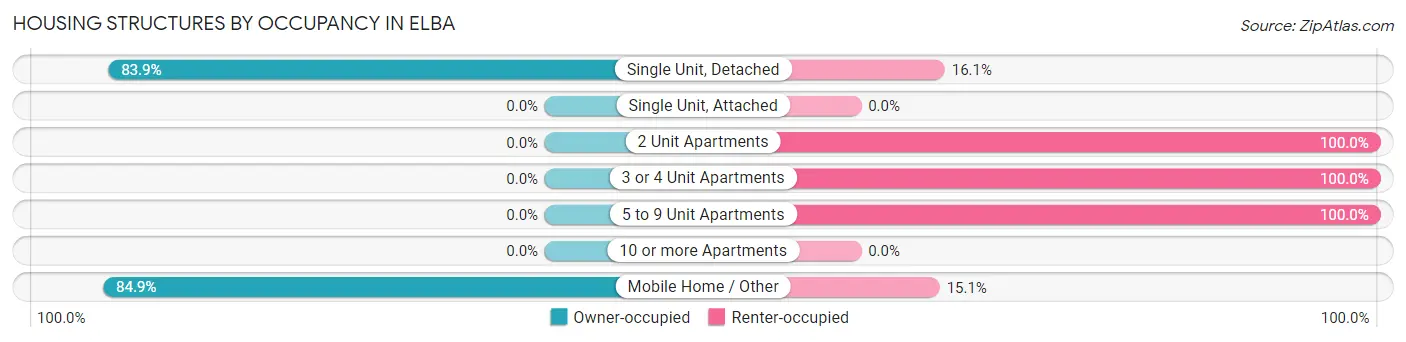
| Structure Type | Owner-occupied | Renter-occupied |
| Single Unit, Detached | 984 (83.9%) | 189 (16.1%) |
| Single Unit, Attached | 0 (0.0%) | 0 (0.0%) |
| 2 Unit Apartments | 0 (0.0%) | 61 (100.0%) |
| 3 or 4 Unit Apartments | 0 (0.0%) | 20 (100.0%) |
| 5 to 9 Unit Apartments | 0 (0.0%) | 20 (100.0%) |
| 10 or more Apartments | 0 (0.0%) | 0 (0.0%) |
| Mobile Home / Other | 73 (84.9%) | 13 (15.1%) |
| Total | 1,057 (77.7%) | 303 (22.3%) |
Housing Structures by Number of Rooms in Elba
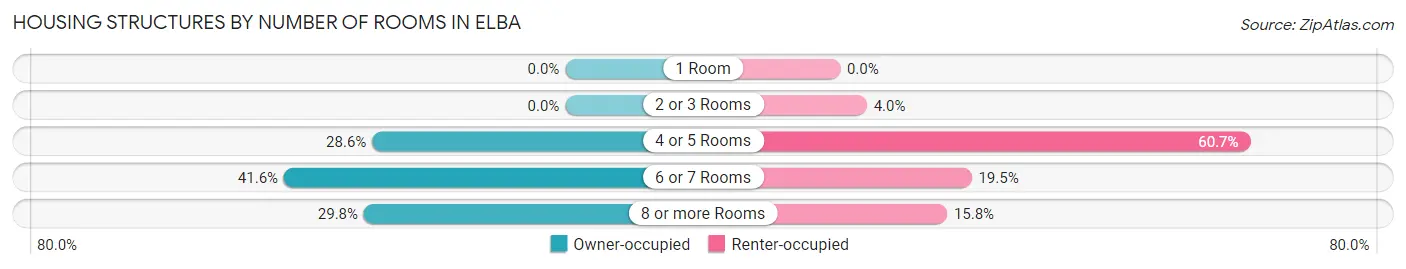
| Number of Rooms | Owner-occupied | Renter-occupied |
| 1 Room | 0 (0.0%) | 0 (0.0%) |
| 2 or 3 Rooms | 0 (0.0%) | 12 (4.0%) |
| 4 or 5 Rooms | 302 (28.6%) | 184 (60.7%) |
| 6 or 7 Rooms | 440 (41.6%) | 59 (19.5%) |
| 8 or more Rooms | 315 (29.8%) | 48 (15.8%) |
| Total | 1,057 (100.0%) | 303 (100.0%) |
Housing Structure by Heating Type in Elba
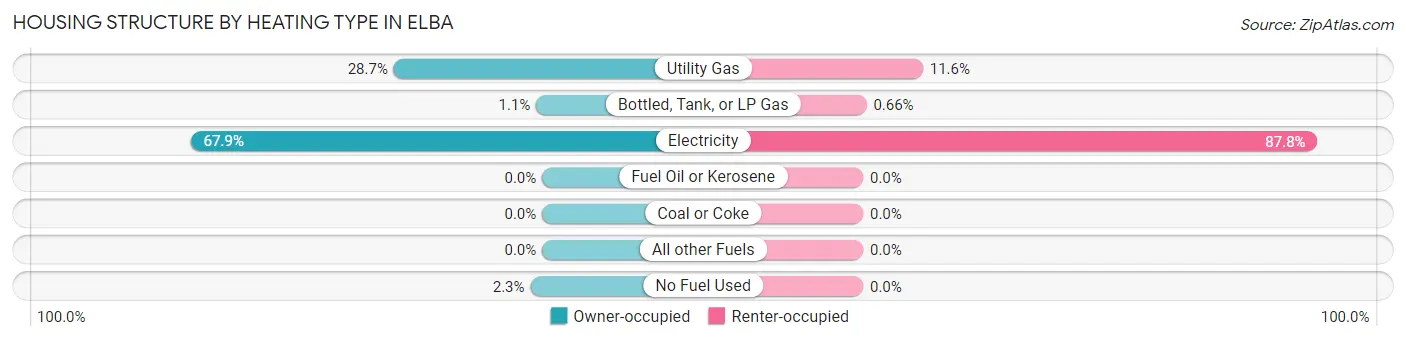
| Heating Type | Owner-occupied | Renter-occupied |
| Utility Gas | 303 (28.7%) | 35 (11.6%) |
| Bottled, Tank, or LP Gas | 12 (1.1%) | 2 (0.7%) |
| Electricity | 718 (67.9%) | 266 (87.8%) |
| Fuel Oil or Kerosene | 0 (0.0%) | 0 (0.0%) |
| Coal or Coke | 0 (0.0%) | 0 (0.0%) |
| All other Fuels | 0 (0.0%) | 0 (0.0%) |
| No Fuel Used | 24 (2.3%) | 0 (0.0%) |
| Total | 1,057 (100.0%) | 303 (100.0%) |
Household Vehicle Usage in Elba
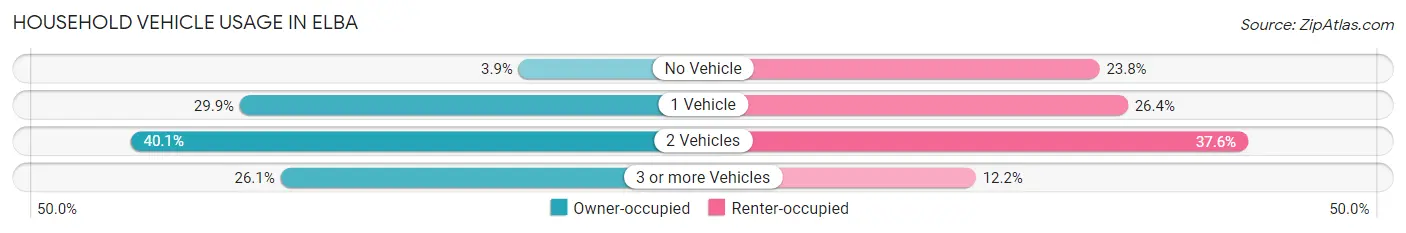
| Vehicles per Household | Owner-occupied | Renter-occupied |
| No Vehicle | 41 (3.9%) | 72 (23.8%) |
| 1 Vehicle | 316 (29.9%) | 80 (26.4%) |
| 2 Vehicles | 424 (40.1%) | 114 (37.6%) |
| 3 or more Vehicles | 276 (26.1%) | 37 (12.2%) |
| Total | 1,057 (100.0%) | 303 (100.0%) |
Real Estate & Mortgages in Elba
Real Estate and Mortgage Overview in Elba
| Characteristic | Without Mortgage | With Mortgage |
| Housing Units | 611 | 446 |
| Median Property Value | $66,400 | $97,900 |
| Median Household Income | $39,013 | $28 |
| Monthly Housing Costs | $325 | $26 |
| Real Estate Taxes | $209 | $49 |
Property Value by Mortgage Status in Elba
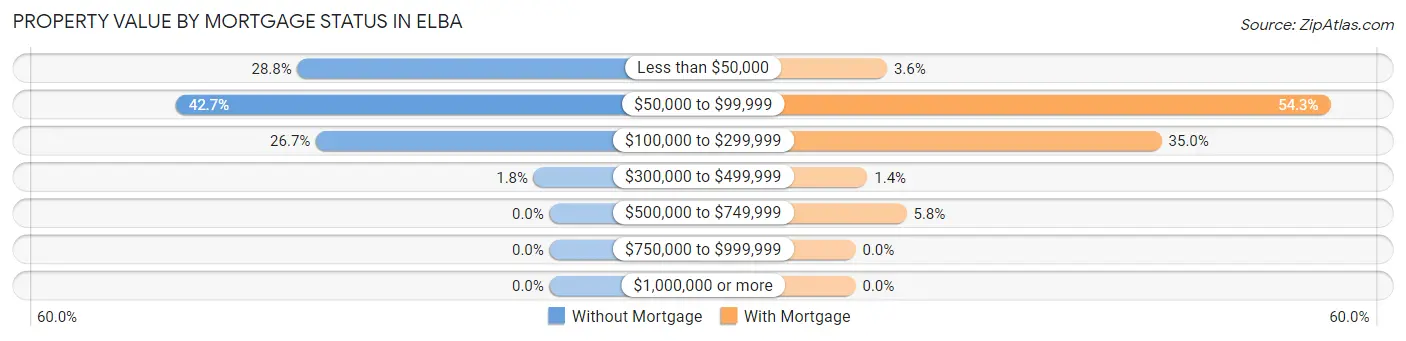
| Property Value | Without Mortgage | With Mortgage |
| Less than $50,000 | 176 (28.8%) | 16 (3.6%) |
| $50,000 to $99,999 | 261 (42.7%) | 242 (54.3%) |
| $100,000 to $299,999 | 163 (26.7%) | 156 (35.0%) |
| $300,000 to $499,999 | 11 (1.8%) | 6 (1.3%) |
| $500,000 to $749,999 | 0 (0.0%) | 26 (5.8%) |
| $750,000 to $999,999 | 0 (0.0%) | 0 (0.0%) |
| $1,000,000 or more | 0 (0.0%) | 0 (0.0%) |
| Total | 611 (100.0%) | 446 (100.0%) |
Household Income by Mortgage Status in Elba
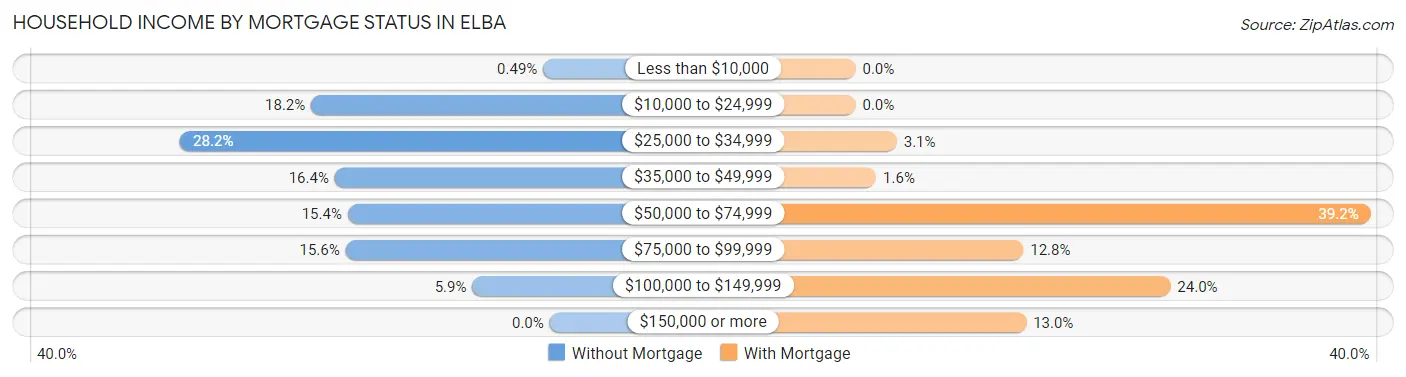
| Household Income | Without Mortgage | With Mortgage |
| Less than $10,000 | 3 (0.5%) | 0 (0.0%) |
| $10,000 to $24,999 | 111 (18.2%) | 0 (0.0%) |
| $25,000 to $34,999 | 172 (28.1%) | 14 (3.1%) |
| $35,000 to $49,999 | 100 (16.4%) | 7 (1.6%) |
| $50,000 to $74,999 | 94 (15.4%) | 175 (39.2%) |
| $75,000 to $99,999 | 95 (15.5%) | 57 (12.8%) |
| $100,000 to $149,999 | 36 (5.9%) | 107 (24.0%) |
| $150,000 or more | 0 (0.0%) | 58 (13.0%) |
| Total | 611 (100.0%) | 446 (100.0%) |
Property Value to Household Income Ratio in Elba
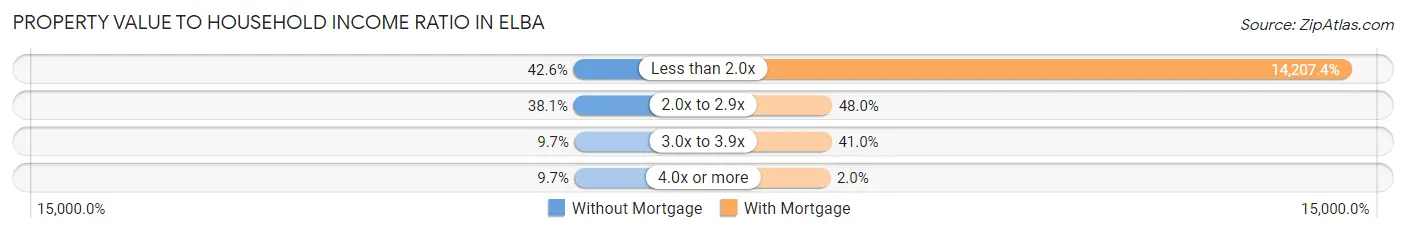
| Value-to-Income Ratio | Without Mortgage | With Mortgage |
| Less than 2.0x | 260 (42.5%) | 63,365 (14,207.4%) |
| 2.0x to 2.9x | 233 (38.1%) | 214 (48.0%) |
| 3.0x to 3.9x | 59 (9.7%) | 183 (41.0%) |
| 4.0x or more | 59 (9.7%) | 9 (2.0%) |
| Total | 611 (100.0%) | 446 (100.0%) |
Real Estate Taxes by Mortgage Status in Elba
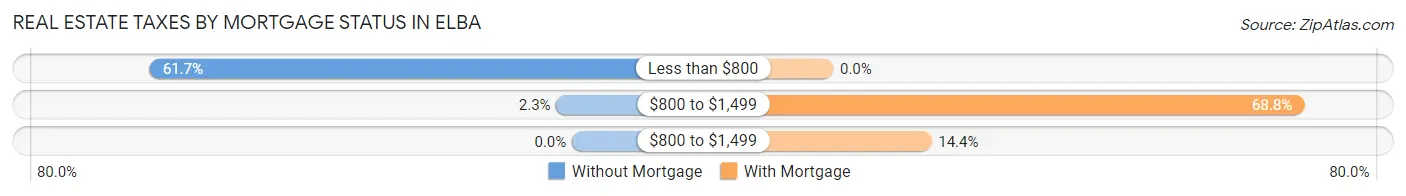
| Property Taxes | Without Mortgage | With Mortgage |
| Less than $800 | 377 (61.7%) | 0 (0.0%) |
| $800 to $1,499 | 14 (2.3%) | 307 (68.8%) |
| $800 to $1,499 | 0 (0.0%) | 64 (14.3%) |
| Total | 611 (100.0%) | 446 (100.0%) |
Health & Disability in Elba
Health Insurance Coverage by Age in Elba
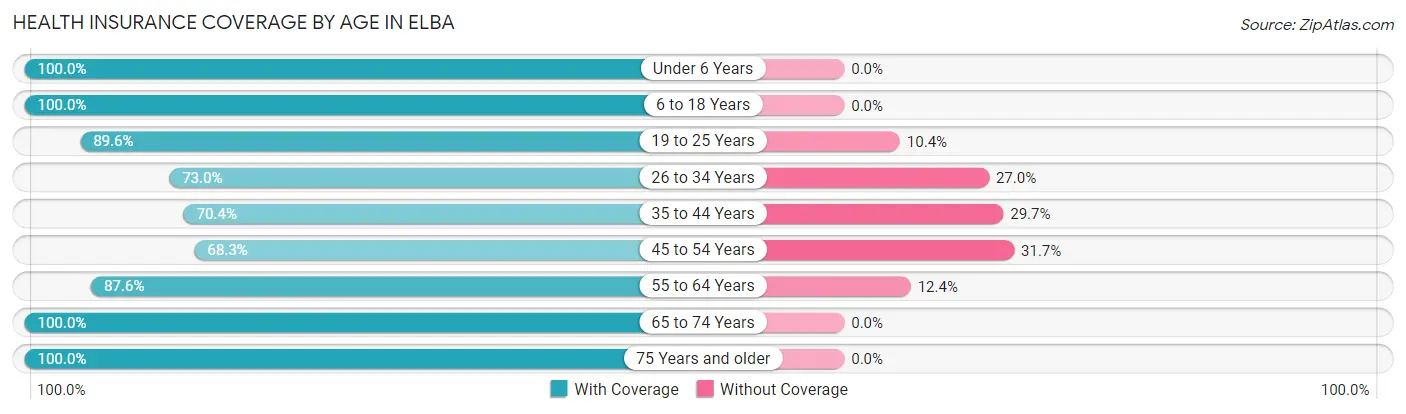
| Age Bracket | With Coverage | Without Coverage |
| Under 6 Years | 208 (100.0%) | 0 (0.0%) |
| 6 to 18 Years | 244 (100.0%) | 0 (0.0%) |
| 19 to 25 Years | 147 (89.6%) | 17 (10.4%) |
| 26 to 34 Years | 276 (73.0%) | 102 (27.0%) |
| 35 to 44 Years | 121 (70.4%) | 51 (29.6%) |
| 45 to 54 Years | 410 (68.3%) | 190 (31.7%) |
| 55 to 64 Years | 389 (87.6%) | 55 (12.4%) |
| 65 to 74 Years | 598 (100.0%) | 0 (0.0%) |
| 75 Years and older | 322 (100.0%) | 0 (0.0%) |
| Total | 2,715 (86.7%) | 415 (13.3%) |
Health Insurance Coverage by Citizenship Status in Elba
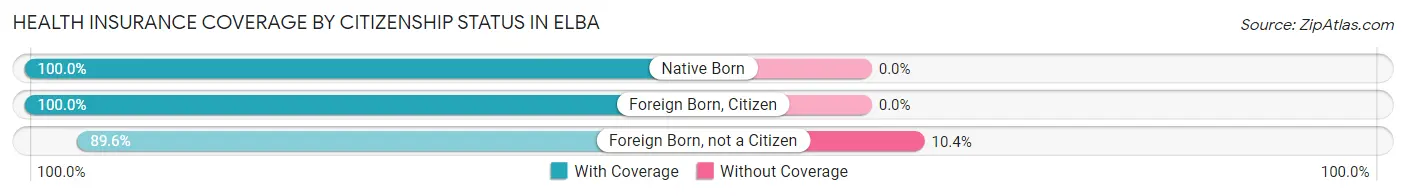
| Citizenship Status | With Coverage | Without Coverage |
| Native Born | 208 (100.0%) | 0 (0.0%) |
| Foreign Born, Citizen | 244 (100.0%) | 0 (0.0%) |
| Foreign Born, not a Citizen | 147 (89.6%) | 17 (10.4%) |
Health Insurance Coverage by Household Income in Elba
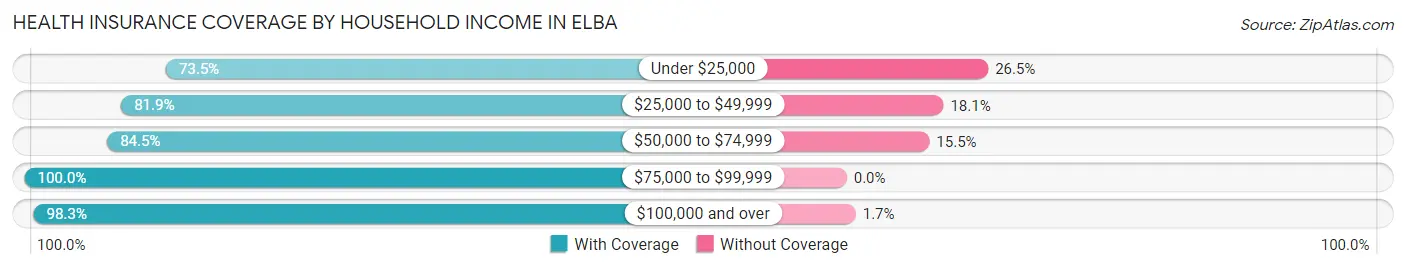
| Household Income | With Coverage | Without Coverage |
| Under $25,000 | 283 (73.5%) | 102 (26.5%) |
| $25,000 to $49,999 | 859 (81.9%) | 190 (18.1%) |
| $50,000 to $74,999 | 639 (84.5%) | 117 (15.5%) |
| $75,000 to $99,999 | 579 (100.0%) | 0 (0.0%) |
| $100,000 and over | 351 (98.3%) | 6 (1.7%) |
Public vs Private Health Insurance Coverage by Age in Elba
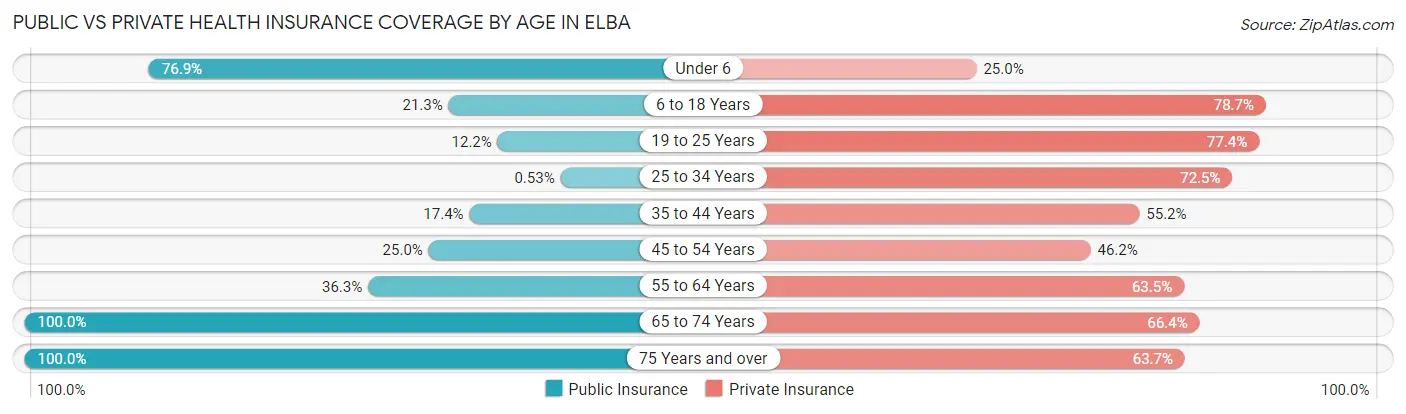
| Age Bracket | Public Insurance | Private Insurance |
| Under 6 | 160 (76.9%) | 52 (25.0%) |
| 6 to 18 Years | 52 (21.3%) | 192 (78.7%) |
| 19 to 25 Years | 20 (12.2%) | 127 (77.4%) |
| 25 to 34 Years | 2 (0.5%) | 274 (72.5%) |
| 35 to 44 Years | 30 (17.4%) | 95 (55.2%) |
| 45 to 54 Years | 150 (25.0%) | 277 (46.2%) |
| 55 to 64 Years | 161 (36.3%) | 282 (63.5%) |
| 65 to 74 Years | 598 (100.0%) | 397 (66.4%) |
| 75 Years and over | 322 (100.0%) | 205 (63.7%) |
| Total | 1,495 (47.8%) | 1,901 (60.7%) |
Disability Status by Sex by Age in Elba
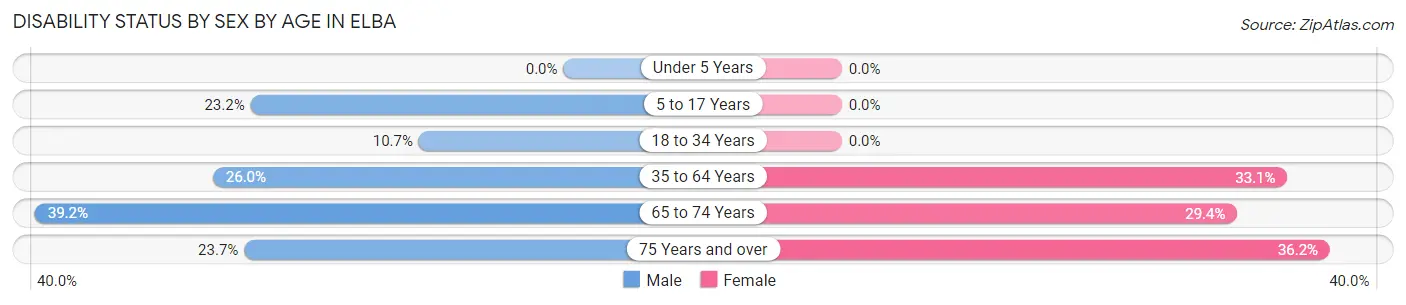
| Age Bracket | Male | Female |
| Under 5 Years | 0 (0.0%) | 0 (0.0%) |
| 5 to 17 Years | 23 (23.2%) | 0 (0.0%) |
| 18 to 34 Years | 31 (10.7%) | 0 (0.0%) |
| 35 to 64 Years | 178 (26.0%) | 176 (33.1%) |
| 65 to 74 Years | 93 (39.2%) | 106 (29.4%) |
| 75 Years and over | 41 (23.7%) | 54 (36.2%) |
Disability Class by Sex by Age in Elba
Disability Class: Hearing Difficulty
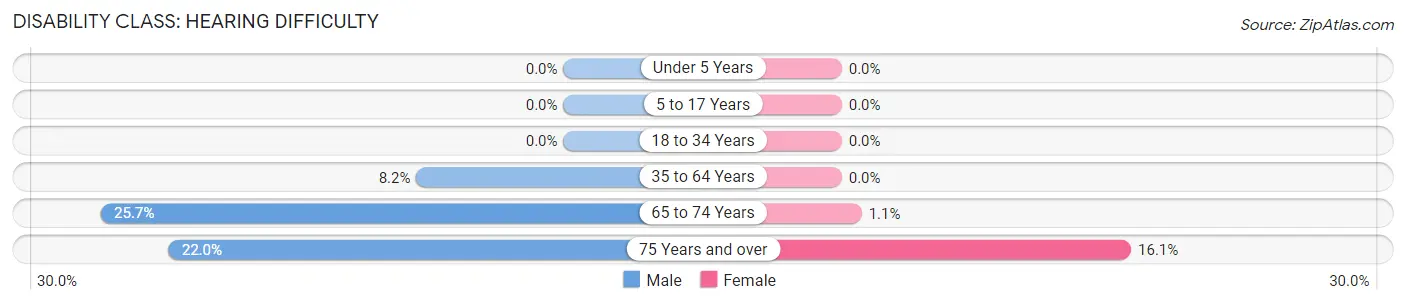
| Age Bracket | Male | Female |
| Under 5 Years | 0 (0.0%) | 0 (0.0%) |
| 5 to 17 Years | 0 (0.0%) | 0 (0.0%) |
| 18 to 34 Years | 0 (0.0%) | 0 (0.0%) |
| 35 to 64 Years | 56 (8.2%) | 0 (0.0%) |
| 65 to 74 Years | 61 (25.7%) | 4 (1.1%) |
| 75 Years and over | 38 (22.0%) | 24 (16.1%) |
Disability Class: Vision Difficulty
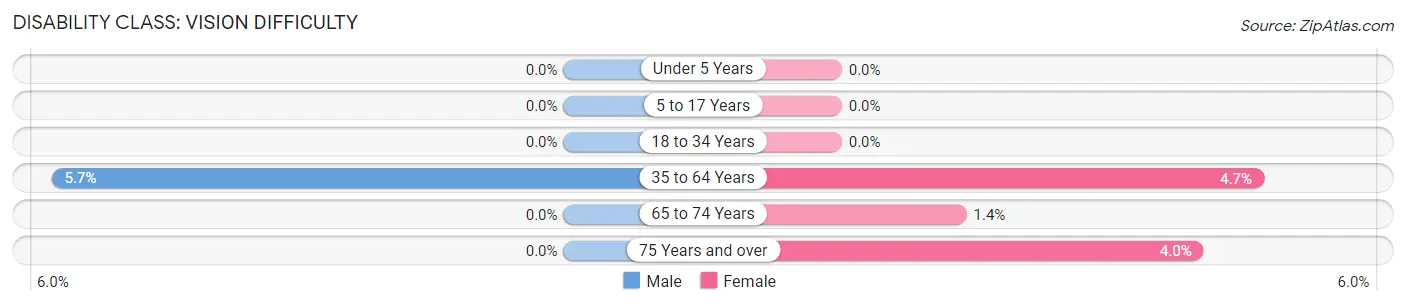
| Age Bracket | Male | Female |
| Under 5 Years | 0 (0.0%) | 0 (0.0%) |
| 5 to 17 Years | 0 (0.0%) | 0 (0.0%) |
| 18 to 34 Years | 0 (0.0%) | 0 (0.0%) |
| 35 to 64 Years | 39 (5.7%) | 25 (4.7%) |
| 65 to 74 Years | 0 (0.0%) | 5 (1.4%) |
| 75 Years and over | 0 (0.0%) | 6 (4.0%) |
Disability Class: Cognitive Difficulty
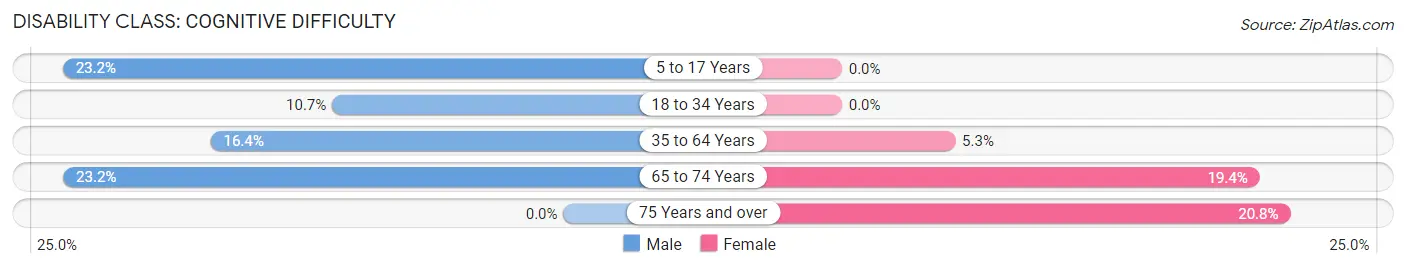
| Age Bracket | Male | Female |
| 5 to 17 Years | 23 (23.2%) | 0 (0.0%) |
| 18 to 34 Years | 31 (10.7%) | 0 (0.0%) |
| 35 to 64 Years | 112 (16.4%) | 28 (5.3%) |
| 65 to 74 Years | 55 (23.2%) | 70 (19.4%) |
| 75 Years and over | 0 (0.0%) | 31 (20.8%) |
Disability Class: Ambulatory Difficulty
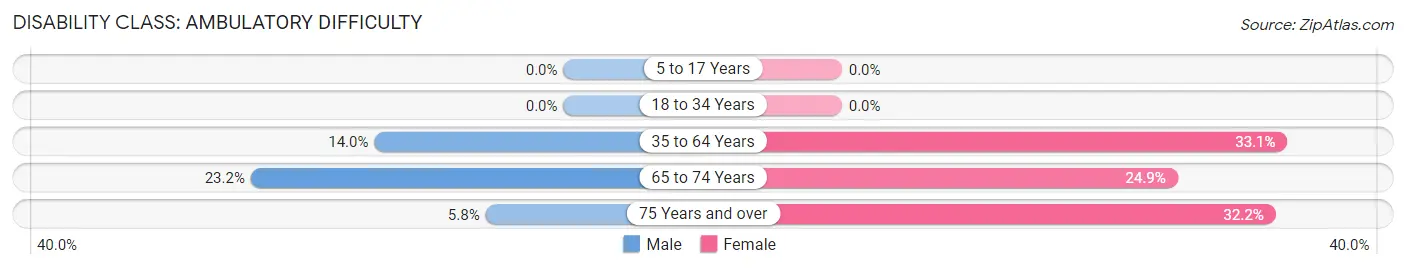
| Age Bracket | Male | Female |
| 5 to 17 Years | 0 (0.0%) | 0 (0.0%) |
| 18 to 34 Years | 0 (0.0%) | 0 (0.0%) |
| 35 to 64 Years | 96 (14.0%) | 176 (33.1%) |
| 65 to 74 Years | 55 (23.2%) | 90 (24.9%) |
| 75 Years and over | 10 (5.8%) | 48 (32.2%) |
Disability Class: Self-Care Difficulty
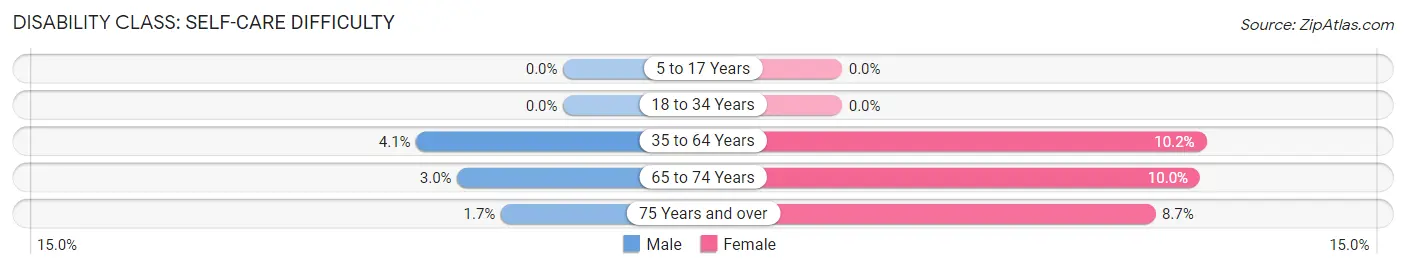
| Age Bracket | Male | Female |
| 5 to 17 Years | 0 (0.0%) | 0 (0.0%) |
| 18 to 34 Years | 0 (0.0%) | 0 (0.0%) |
| 35 to 64 Years | 28 (4.1%) | 54 (10.2%) |
| 65 to 74 Years | 7 (2.9%) | 36 (10.0%) |
| 75 Years and over | 3 (1.7%) | 13 (8.7%) |
Technology Access in Elba
Computing Device Access in Elba
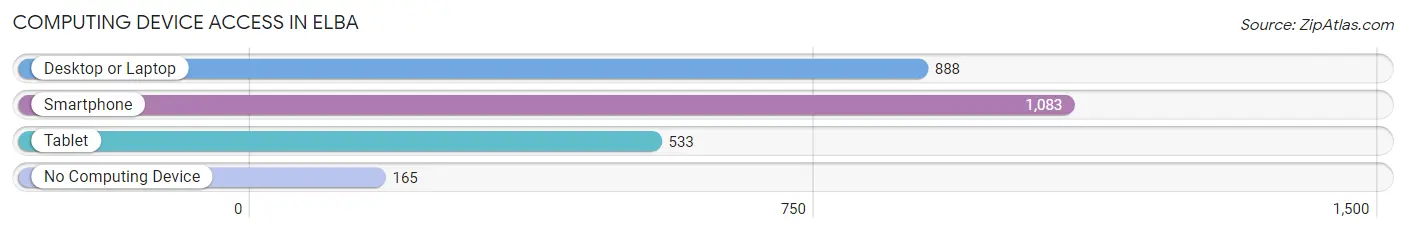
| Device Type | # Households | % Households |
| Desktop or Laptop | 888 | 65.3% |
| Smartphone | 1,083 | 79.6% |
| Tablet | 533 | 39.2% |
| No Computing Device | 165 | 12.1% |
| Total | 1,360 | 100.0% |
Internet Access in Elba
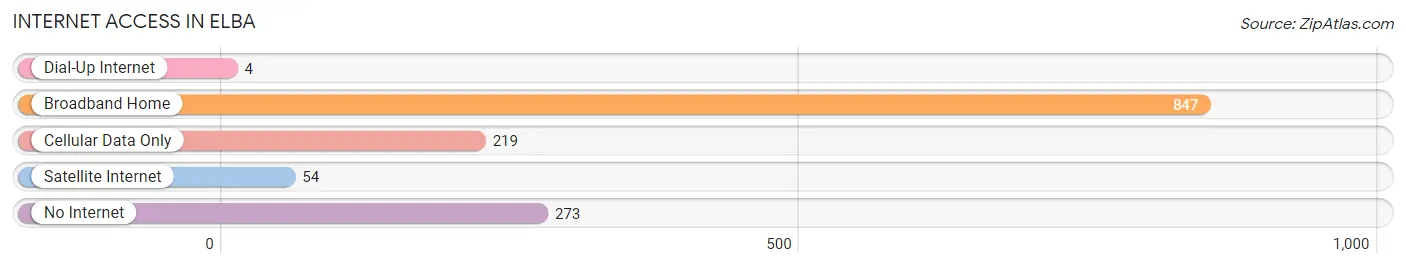
| Internet Type | # Households | % Households |
| Dial-Up Internet | 4 | 0.3% |
| Broadband Home | 847 | 62.3% |
| Cellular Data Only | 219 | 16.1% |
| Satellite Internet | 54 | 4.0% |
| No Internet | 273 | 20.1% |
| Total | 1,360 | 100.0% |
Elba Summary
Elba, Alabama is a small town located in Coffee County, Alabama. It is situated on the banks of the Pea River and is home to approximately 3,000 people. The town was founded in 1881 and was named after the biblical city of Elba, which was the refuge of Napoleon Bonaparte. Elba is known for its rich history, beautiful geography, and diverse economy.
History
Elba was founded in 1881 by a group of settlers from Georgia. The town was named after the biblical city of Elba, which was the refuge of Napoleon Bonaparte. The town was originally a farming community, but it soon developed into a small industrial center. The first industry in Elba was a sawmill, which was built in 1883. This sawmill was the first of many industries that would come to Elba.
In the early 1900s, Elba began to experience a period of growth and prosperity. The town was home to several businesses, including a cotton gin, a grist mill, and a brick factory. The town also had a railroad line that connected it to other towns in the area.
In the 1920s, Elba experienced a period of decline. The Great Depression caused many of the businesses in Elba to close, and the town's population began to decline. However, the town was able to survive this difficult period and eventually began to experience a period of growth and prosperity once again.
Geography
Elba is located in Coffee County, Alabama. The town is situated on the banks of the Pea River and is surrounded by rolling hills and lush forests. The town is located approximately 30 miles from the Gulf of Mexico and is close to several major cities, including Montgomery, Birmingham, and Mobile.
The climate in Elba is mild and humid. The average temperature in the summer is around 80 degrees Fahrenheit, and the average temperature in the winter is around 50 degrees Fahrenheit. The town receives an average of 50 inches of rain per year.
Economy
Elba's economy is largely based on agriculture and manufacturing. The town is home to several large farms, which produce a variety of crops, including cotton, corn, soybeans, and peanuts. The town is also home to several manufacturing companies, which produce a variety of products, including furniture, clothing, and automotive parts.
The town is also home to several small businesses, including restaurants, shops, and service providers. The town is also home to several banks and financial institutions, which provide a variety of services to the local community.
Demographics
As of the 2010 census, Elba had a population of 3,000 people. The town is predominantly white, with approximately 75% of the population being white. The town is also home to a small African American population, which makes up approximately 20% of the population. The town is also home to a small Hispanic population, which makes up approximately 5% of the population.
The median household income in Elba is approximately $35,000 per year. The town has a poverty rate of approximately 20%, which is slightly higher than the national average. The town also has a high rate of unemployment, with approximately 10% of the population being unemployed.
Conclusion
Elba, Alabama is a small town located in Coffee County, Alabama. The town is known for its rich history, beautiful geography, and diverse economy. The town is predominantly white, with a small African American and Hispanic population. The town has a median household income of approximately $35,000 per year and a poverty rate of approximately 20%. The town is home to several large farms and manufacturing companies, as well as several small businesses. Elba is a great place to live and work, and it is a great example of a small town with a rich history and a diverse economy.
Common Questions
What is Per Capita Income in Elba?
Per Capita income in Elba is $22,960.
What is the Median Family Income in Elba?
Median Family Income in Elba is $54,688.
What is the Median Household income in Elba?
Median Household Income in Elba is $41,509.
What is Income or Wage Gap in Elba?
Income or Wage Gap in Elba is 8.4%.
Women in Elba earn 91.6 cents for every dollar earned by a man.
What is Inequality or Gini Index in Elba?
Inequality or Gini Index in Elba is 0.39.
What is the Total Population of Elba?
Total Population of Elba is 3,463.
What is the Total Male Population of Elba?
Total Male Population of Elba is 1,801.
What is the Total Female Population of Elba?
Total Female Population of Elba is 1,662.
What is the Ratio of Males per 100 Females in Elba?
There are 108.36 Males per 100 Females in Elba.
What is the Ratio of Females per 100 Males in Elba?
There are 92.28 Females per 100 Males in Elba.
What is the Median Population Age in Elba?
Median Population Age in Elba is 49.9 Years.
What is the Average Family Size in Elba
Average Family Size in Elba is 2.9 People.
What is the Average Household Size in Elba
Average Household Size in Elba is 2.3 People.
How Large is the Labor Force in Elba?
There are 1,300 People in the Labor Forcein in Elba.
What is the Percentage of People in the Labor Force in Elba?
41.7% of People are in the Labor Force in Elba.
What is the Unemployment Rate in Elba?
Unemployment Rate in Elba is 11.2%.