Detroit, AL Map & Demographics
Detroit Map
Detroit Overview
$13,199
PER CAPITA INCOME
$50,125
AVG FAMILY INCOME
0.55
INEQUALITY / GINI INDEX
300
TOTAL POPULATION
172
MALE POPULATION
128
FEMALE POPULATION
134.38
MALES / 100 FEMALES
74.42
FEMALES / 100 MALES
39.3
MEDIAN AGE
3.8
AVG FAMILY SIZE
3.0
AVG HOUSEHOLD SIZE
106
LABOR FORCE [ PEOPLE ]
43.3%
PERCENT IN LABOR FORCE
12.4%
UNEMPLOYMENT RATE
Detroit Zip Codes
Detroit Area Codes
Income in Detroit
Income Overview in Detroit
| Characteristic | Number | Measure |
| Per Capita Income | 300 | $13,199 |
| Median Family Income | 69 | $50,125 |
| Mean Family Income | 69 | $45,387 |
| Median Household Income | 99 | $0 |
| Mean Household Income | 99 | $33,648 |
| Income Deficit | 69 | $0 |
| Wage / Income Gap (%) | 300 | 0.00% |
| Wage / Income Gap ($) | 300 | 100.00¢ per $1 |
| Gini / Inequality Index | 300 | 0.55 |
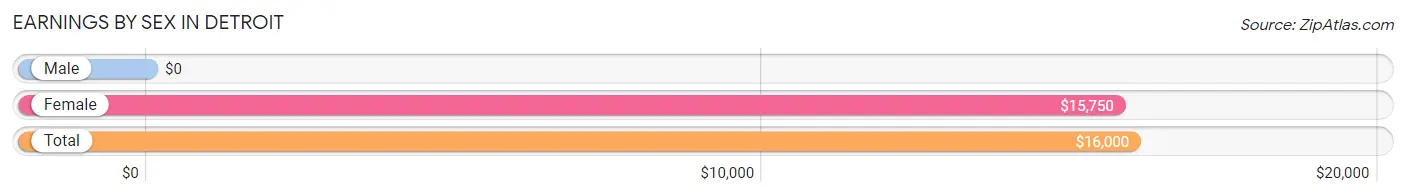
Earnings by Sex in Detroit
| Sex | Number | Average Earnings |
| Male | 55 (50.0%) | $0 |
| Female | 55 (50.0%) | $15,750 |
| Total | 110 (100.0%) | $16,000 |
Earnings by Sex by Income Bracket in Detroit
The most common earnings brackets in Detroit are $2,499 or less for men (12 | 21.8%) and $15,000 to $17,499 for women (15 | 27.3%).

| Income | Male | Female |
| $2,499 or less | 12 (21.8%) | 4 (7.3%) |
| $2,500 to $4,999 | 4 (7.3%) | 7 (12.7%) |
| $5,000 to $7,499 | 0 (0.0%) | 10 (18.2%) |
| $7,500 to $9,999 | 3 (5.4%) | 0 (0.0%) |
| $10,000 to $12,499 | 2 (3.6%) | 2 (3.6%) |
| $12,500 to $14,999 | 5 (9.1%) | 0 (0.0%) |
| $15,000 to $17,499 | 0 (0.0%) | 15 (27.3%) |
| $17,500 to $19,999 | 2 (3.6%) | 2 (3.6%) |
| $20,000 to $22,499 | 1 (1.8%) | 0 (0.0%) |
| $22,500 to $24,999 | 0 (0.0%) | 3 (5.4%) |
| $25,000 to $29,999 | 0 (0.0%) | 2 (3.6%) |
| $30,000 to $34,999 | 2 (3.6%) | 6 (10.9%) |
| $35,000 to $39,999 | 2 (3.6%) | 0 (0.0%) |
| $40,000 to $44,999 | 4 (7.3%) | 0 (0.0%) |
| $45,000 to $49,999 | 8 (14.5%) | 0 (0.0%) |
| $50,000 to $54,999 | 6 (10.9%) | 0 (0.0%) |
| $55,000 to $64,999 | 0 (0.0%) | 3 (5.4%) |
| $65,000 to $74,999 | 0 (0.0%) | 1 (1.8%) |
| $75,000 to $99,999 | 4 (7.3%) | 0 (0.0%) |
| $100,000+ | 0 (0.0%) | 0 (0.0%) |
| Total | 55 (100.0%) | 55 (100.0%) |
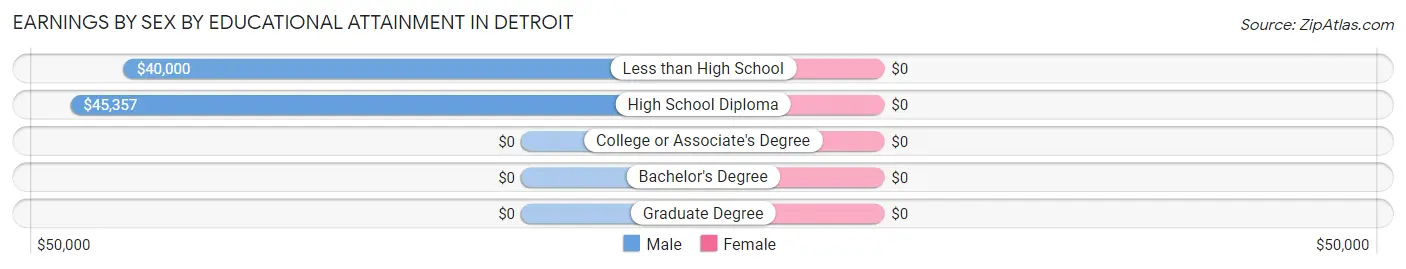
Earnings by Sex by Educational Attainment in Detroit
| Educational Attainment | Male Income | Female Income |
| Less than High School | $40,000 | $0 |
| High School Diploma | $45,357 | $0 |
| College or Associate's Degree | - | - |
| Bachelor's Degree | - | - |
| Graduate Degree | - | - |
| Total | $41,563 | $16,417 |
Family Income in Detroit
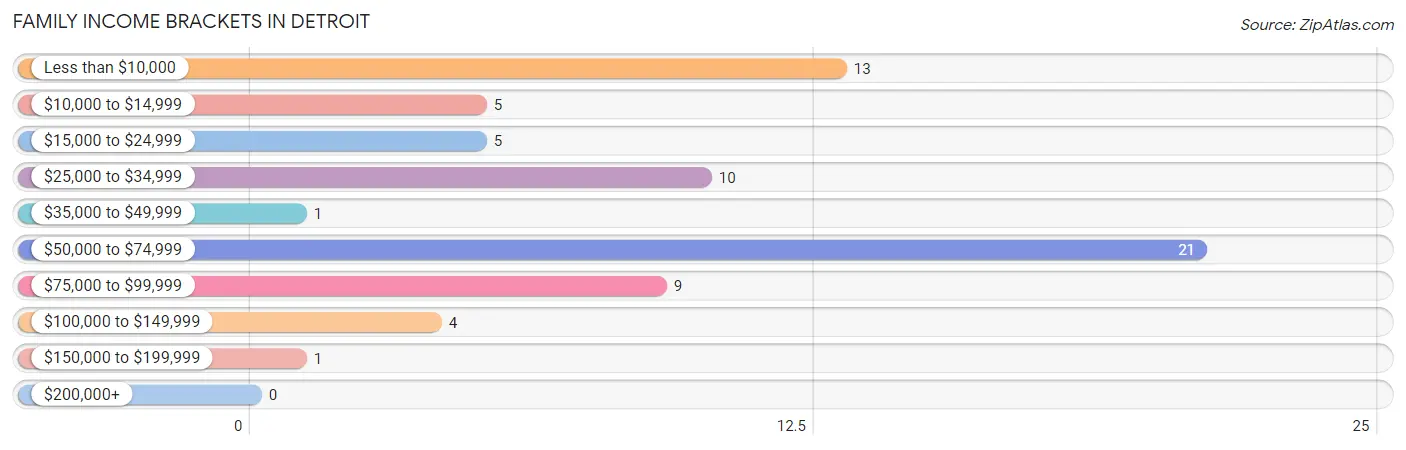
Family Income Brackets in Detroit
According to the Detroit family income data, there are 21 families falling into the $50,000 to $74,999 income range, which is the most common income bracket and makes up 30.4% of all families.
| Income Bracket | # Families | % Families |
| Less than $10,000 | 13 | 18.8% |
| $10,000 to $14,999 | 5 | 7.2% |
| $15,000 to $24,999 | 5 | 7.2% |
| $25,000 to $34,999 | 10 | 14.5% |
| $35,000 to $49,999 | 1 | 1.4% |
| $50,000 to $74,999 | 21 | 30.4% |
| $75,000 to $99,999 | 9 | 13.0% |
| $100,000 to $149,999 | 4 | 5.8% |
| $150,000 to $199,999 | 1 | 1.4% |
| $200,000+ | 0 | 0.0% |
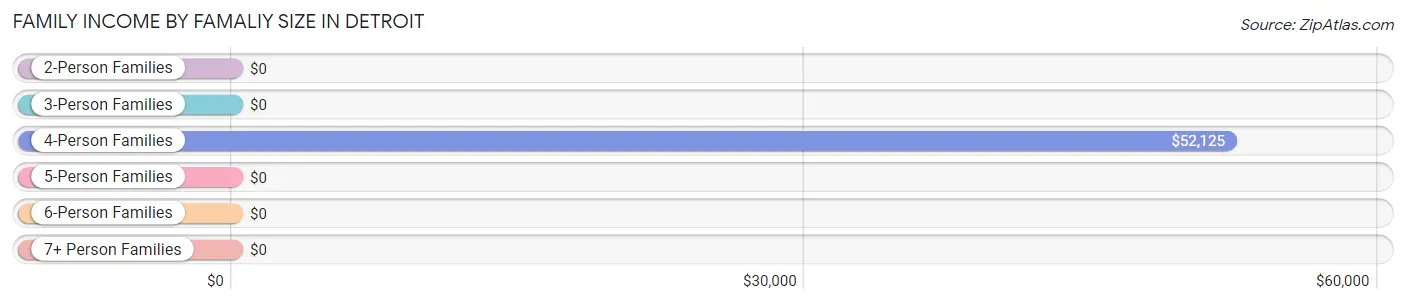
Family Income by Famaliy Size in Detroit
4-person families (29 | 42.0%) account for the highest median family income in Detroit with $52,125 per family, while 4-person families (29 | 42.0%) have the highest median income of $13,031 per family member.
| Income Bracket | # Families | Median Income |
| 2-Person Families | 33 (47.8%) | $0 |
| 3-Person Families | 7 (10.1%) | $0 |
| 4-Person Families | 29 (42.0%) | $52,125 |
| 5-Person Families | 0 (0.0%) | $0 |
| 6-Person Families | 0 (0.0%) | $0 |
| 7+ Person Families | 0 (0.0%) | $0 |
| Total | 69 (100.0%) | $50,125 |
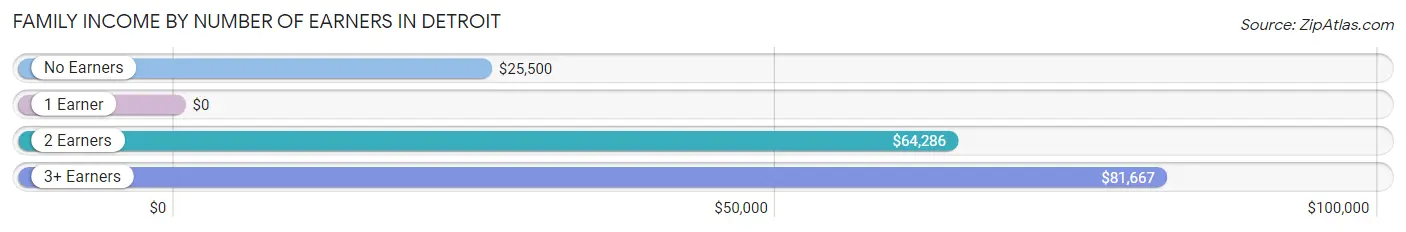
Family Income by Number of Earners in Detroit
| Number of Earners | # Families | Median Income |
| No Earners | 18 (26.1%) | $25,500 |
| 1 Earner | 25 (36.2%) | $0 |
| 2 Earners | 20 (29.0%) | $64,286 |
| 3+ Earners | 6 (8.7%) | $81,667 |
| Total | 69 (100.0%) | $50,125 |
Household Income in Detroit
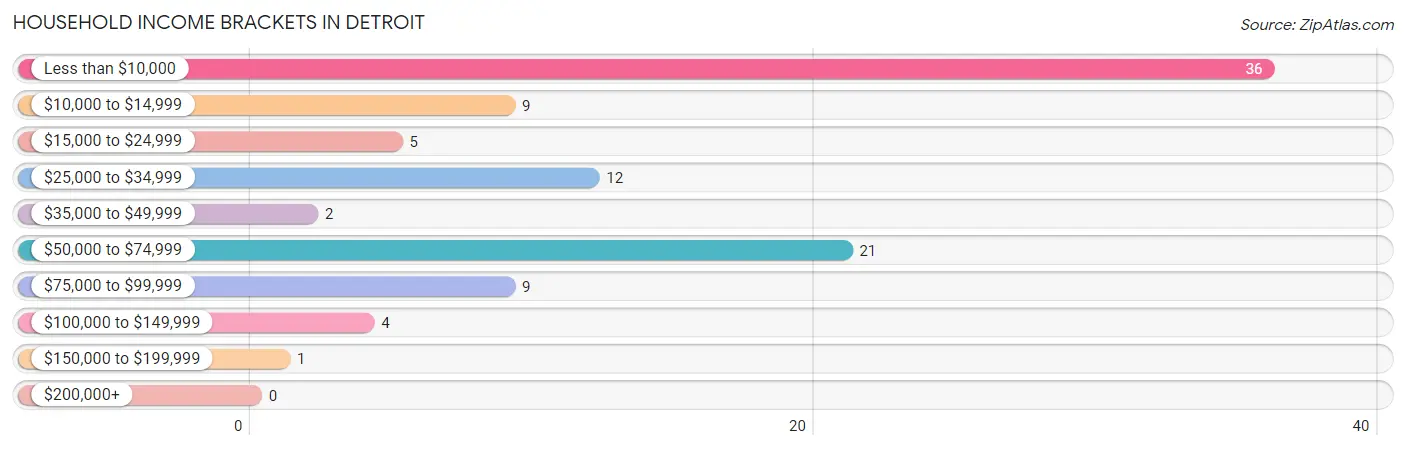
Household Income Brackets in Detroit
With 36 households falling in the category, the less than $10,000 income range is the most frequent in Detroit, accounting for 36.4% of all households.
| Income Bracket | # Households | % Households |
| Less than $10,000 | 36 | 36.4% |
| $10,000 to $14,999 | 9 | 9.1% |
| $15,000 to $24,999 | 5 | 5.1% |
| $25,000 to $34,999 | 12 | 12.1% |
| $35,000 to $49,999 | 2 | 2.0% |
| $50,000 to $74,999 | 21 | 21.2% |
| $75,000 to $99,999 | 9 | 9.1% |
| $100,000 to $149,999 | 4 | 4.0% |
| $150,000 to $199,999 | 1 | 1.0% |
| $200,000+ | 0 | 0.0% |
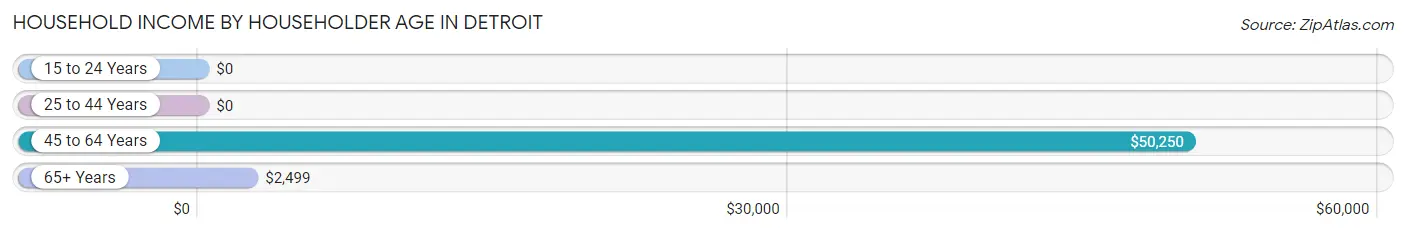
Household Income by Householder Age in Detroit
The median household income in Detroit is $0, with the highest median household income of $50,250 found in the 45 to 64 years age bracket for the primary householder. A total of 38 households (38.4%) fall into this category.
| Income Bracket | # Households | Median Income |
| 15 to 24 Years | 0 (0.0%) | $0 |
| 25 to 44 Years | 30 (30.3%) | $0 |
| 45 to 64 Years | 38 (38.4%) | $50,250 |
| 65+ Years | 31 (31.3%) | $2,499 |
| Total | 99 (100.0%) | $0 |
Poverty in Detroit
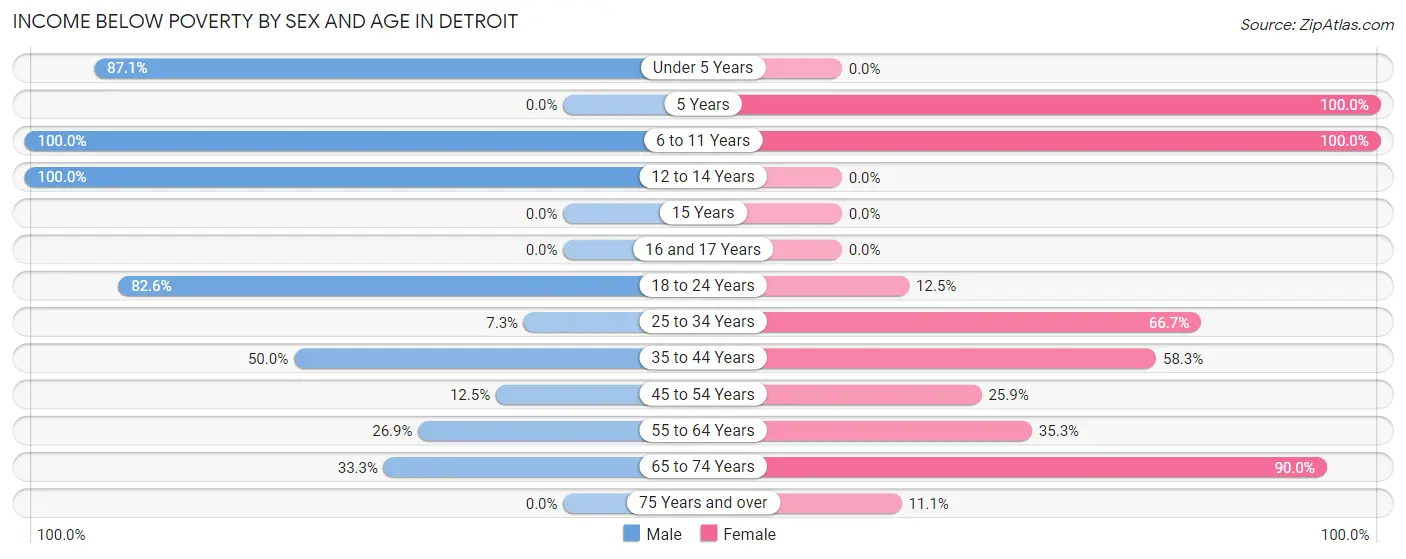
Income Below Poverty by Sex and Age in Detroit
With 40.7% poverty level for males and 49.2% for females among the residents of Detroit, 6 to 11 year old males and 5 year old females are the most vulnerable to poverty, with 1 males (100.0%) and 2 females (100.0%) in their respective age groups living below the poverty level.
| Age Bracket | Male | Female |
| Under 5 Years | 27 (87.1%) | 0 (0.0%) |
| 5 Years | 0 (0.0%) | 2 (100.0%) |
| 6 to 11 Years | 1 (100.0%) | 11 (100.0%) |
| 12 to 14 Years | 4 (100.0%) | 0 (0.0%) |
| 15 Years | 0 (0.0%) | 0 (0.0%) |
| 16 and 17 Years | 0 (0.0%) | 0 (0.0%) |
| 18 to 24 Years | 19 (82.6%) | 1 (12.5%) |
| 25 to 34 Years | 3 (7.3%) | 10 (66.7%) |
| 35 to 44 Years | 5 (50.0%) | 7 (58.3%) |
| 45 to 54 Years | 3 (12.5%) | 7 (25.9%) |
| 55 to 64 Years | 7 (26.9%) | 6 (35.3%) |
| 65 to 74 Years | 1 (33.3%) | 18 (90.0%) |
| 75 Years and over | 0 (0.0%) | 1 (11.1%) |
| Total | 70 (40.7%) | 63 (49.2%) |
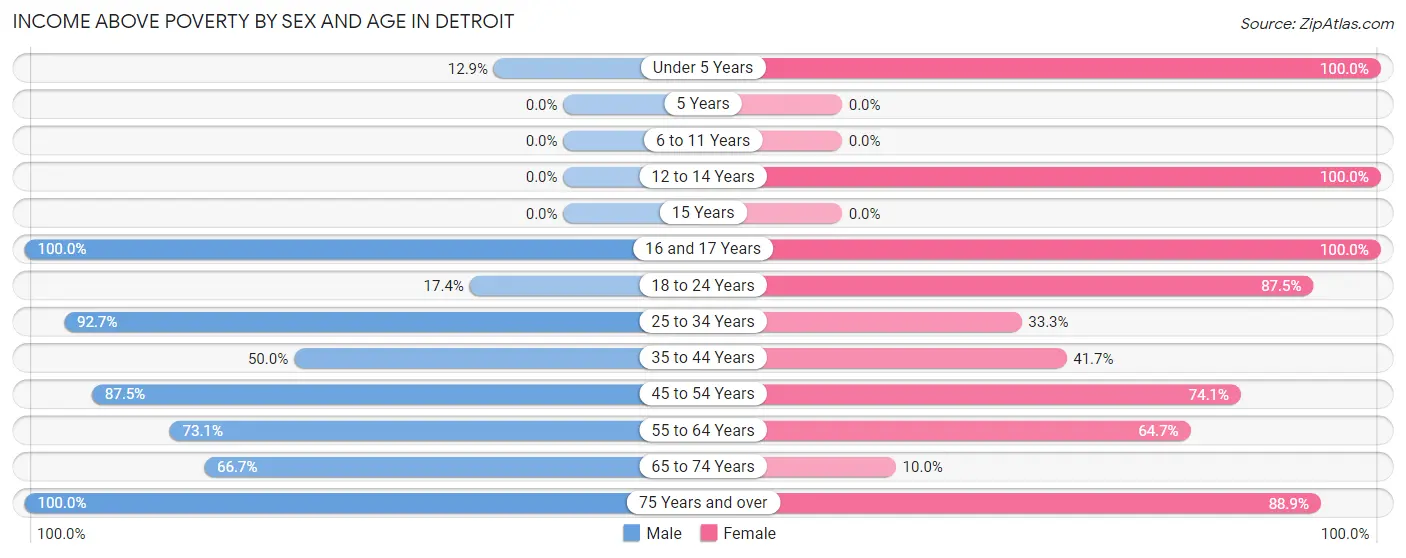
Income Above Poverty by Sex and Age in Detroit
According to the poverty statistics in Detroit, males aged 16 and 17 years and females aged under 5 years are the age groups that are most secure financially, with 100.0% of males and 100.0% of females in these age groups living above the poverty line.
| Age Bracket | Male | Female |
| Under 5 Years | 4 (12.9%) | 4 (100.0%) |
| 5 Years | 0 (0.0%) | 0 (0.0%) |
| 6 to 11 Years | 0 (0.0%) | 0 (0.0%) |
| 12 to 14 Years | 0 (0.0%) | 2 (100.0%) |
| 15 Years | 0 (0.0%) | 0 (0.0%) |
| 16 and 17 Years | 3 (100.0%) | 1 (100.0%) |
| 18 to 24 Years | 4 (17.4%) | 7 (87.5%) |
| 25 to 34 Years | 38 (92.7%) | 5 (33.3%) |
| 35 to 44 Years | 5 (50.0%) | 5 (41.7%) |
| 45 to 54 Years | 21 (87.5%) | 20 (74.1%) |
| 55 to 64 Years | 19 (73.1%) | 11 (64.7%) |
| 65 to 74 Years | 2 (66.7%) | 2 (10.0%) |
| 75 Years and over | 6 (100.0%) | 8 (88.9%) |
| Total | 102 (59.3%) | 65 (50.8%) |
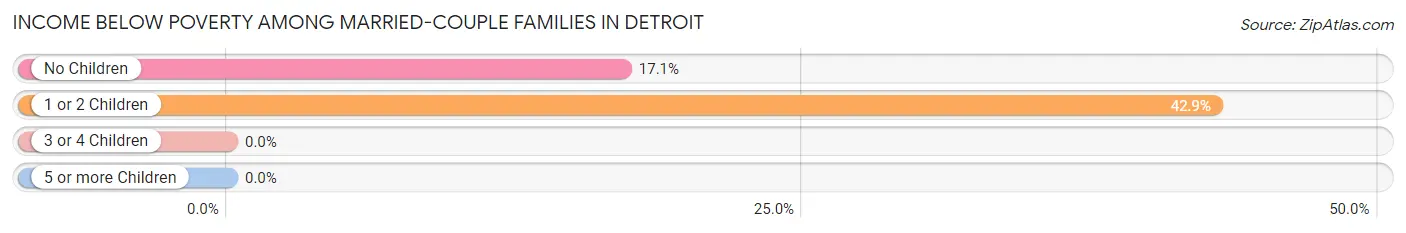
Income Below Poverty Among Married-Couple Families in Detroit
The poverty statistics for married-couple families in Detroit show that 24.5% or 12 of the total 49 families live below the poverty line. Families with 1 or 2 children have the highest poverty rate of 42.9%, comprising of 6 families. On the other hand, families with no children have the lowest poverty rate of 17.1%, which includes 6 families.
| Children | Above Poverty | Below Poverty |
| No Children | 29 (82.9%) | 6 (17.1%) |
| 1 or 2 Children | 8 (57.1%) | 6 (42.9%) |
| 3 or 4 Children | 0 (0.0%) | 0 (0.0%) |
| 5 or more Children | 0 (0.0%) | 0 (0.0%) |
| Total | 37 (75.5%) | 12 (24.5%) |
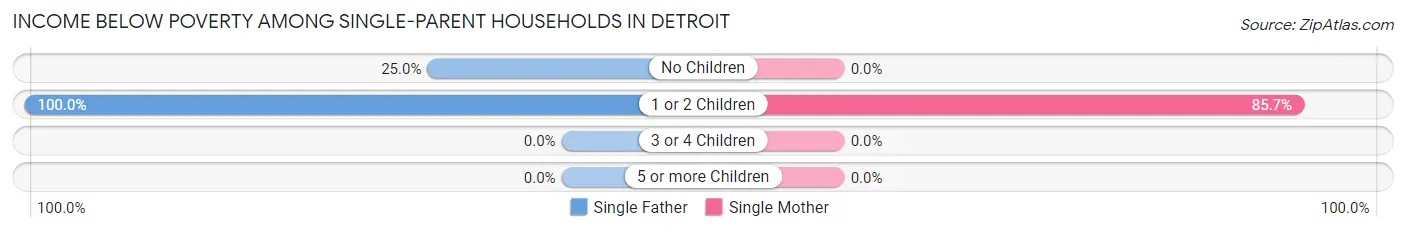
Income Below Poverty Among Single-Parent Households in Detroit
According to the poverty data in Detroit, 50.0% or 3 single-father households and 85.7% or 12 single-mother households are living below the poverty line. Among single-father households, those with 1 or 2 children have the highest poverty rate, with 2 households (100.0%) experiencing poverty. Likewise, among single-mother households, those with 1 or 2 children have the highest poverty rate, with 12 households (85.7%) falling below the poverty line.
| Children | Single Father | Single Mother |
| No Children | 1 (25.0%) | 0 (0.0%) |
| 1 or 2 Children | 2 (100.0%) | 12 (85.7%) |
| 3 or 4 Children | 0 (0.0%) | 0 (0.0%) |
| 5 or more Children | 0 (0.0%) | 0 (0.0%) |
| Total | 3 (50.0%) | 12 (85.7%) |
Income Below Poverty Among Married-Couple vs Single-Parent Households in Detroit
The poverty data for Detroit shows that 12 of the married-couple family households (24.5%) and 15 of the single-parent households (75.0%) are living below the poverty level. Within the married-couple family households, those with 1 or 2 children have the highest poverty rate, with 6 households (42.9%) falling below the poverty line. Among the single-parent households, those with 1 or 2 children have the highest poverty rate, with 14 household (87.5%) living below poverty.
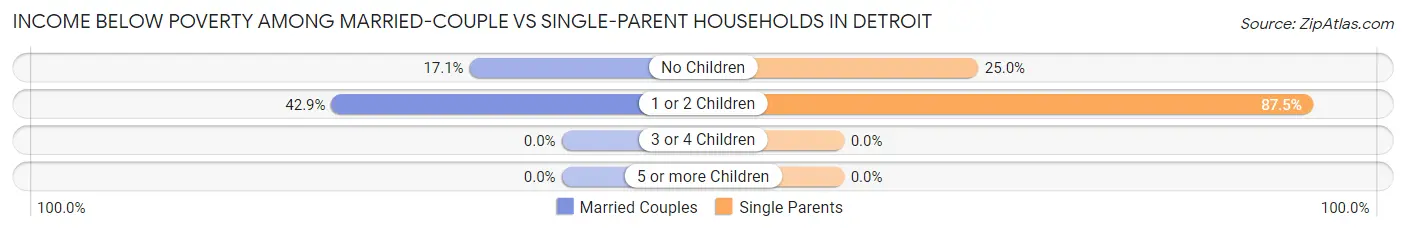
| Children | Married-Couple Families | Single-Parent Households |
| No Children | 6 (17.1%) | 1 (25.0%) |
| 1 or 2 Children | 6 (42.9%) | 14 (87.5%) |
| 3 or 4 Children | 0 (0.0%) | 0 (0.0%) |
| 5 or more Children | 0 (0.0%) | 0 (0.0%) |
| Total | 12 (24.5%) | 15 (75.0%) |
Race in Detroit
The most populous races in Detroit are White / Caucasian (184 | 61.3%), Black / African American (106 | 35.3%), and Two or more Races (8 | 2.7%).
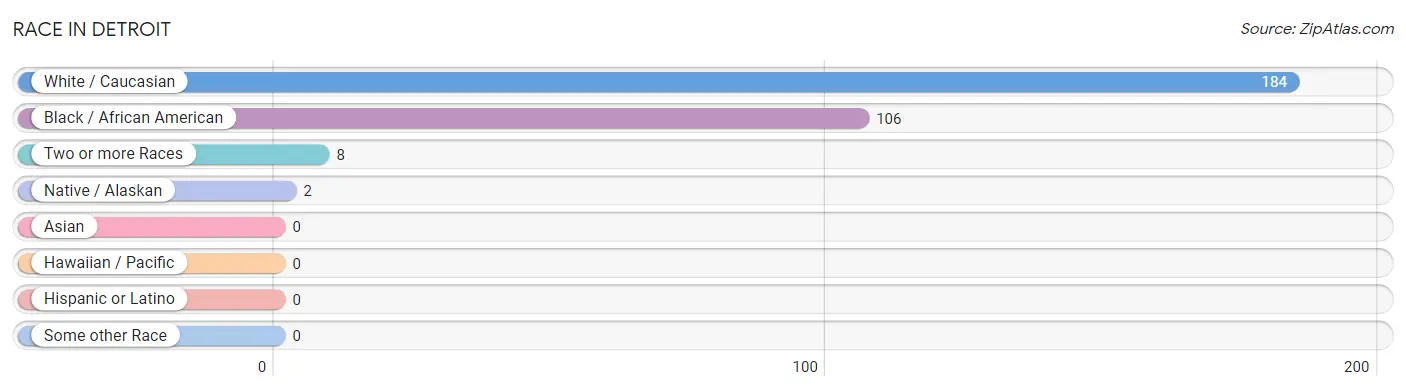
| Race | # Population | % Population |
| Asian | 0 | 0.0% |
| Black / African American | 106 | 35.3% |
| Hawaiian / Pacific | 0 | 0.0% |
| Hispanic or Latino | 0 | 0.0% |
| Native / Alaskan | 2 | 0.7% |
| White / Caucasian | 184 | 61.3% |
| Two or more Races | 8 | 2.7% |
| Some other Race | 0 | 0.0% |
| Total | 300 | 100.0% |
Ancestry in Detroit
The most populous ancestries reported in Detroit are English (31 | 10.3%), American (11 | 3.7%), German (11 | 3.7%), Cherokee (4 | 1.3%), and African (3 | 1.0%), together accounting for 20.0% of all Detroit residents.
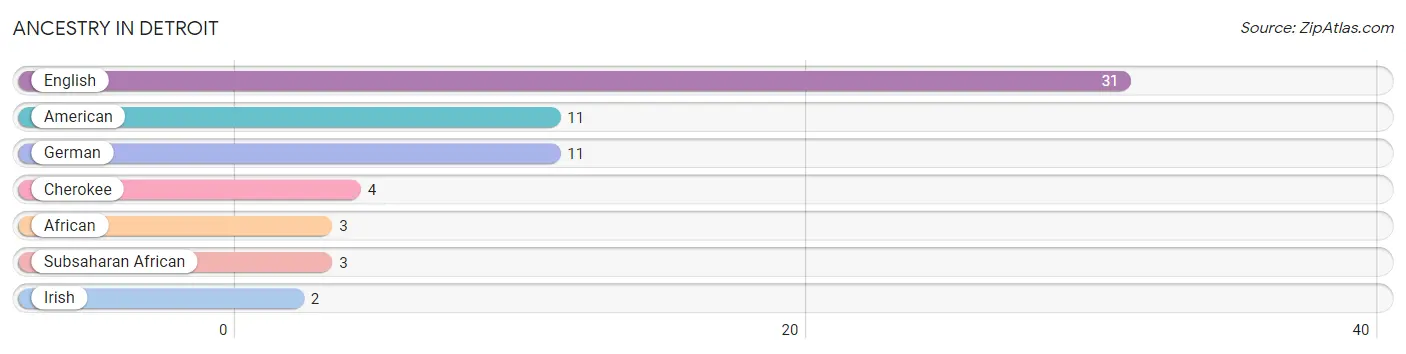
| Ancestry | # Population | % Population |
| African | 3 | 1.0% |
| American | 11 | 3.7% |
| Cherokee | 4 | 1.3% |
| English | 31 | 10.3% |
| German | 11 | 3.7% |
| Irish | 2 | 0.7% |
| Subsaharan African | 3 | 1.0% | View All 7 Rows |
Immigrants in Detroit

| Immigration Origin | # Population | % Population | View All 0 Rows |
Sex and Age in Detroit
Sex and Age in Detroit
The most populous age groups in Detroit are 30 to 34 Years (38 | 22.1%) for men and 50 to 54 Years (25 | 19.5%) for women.
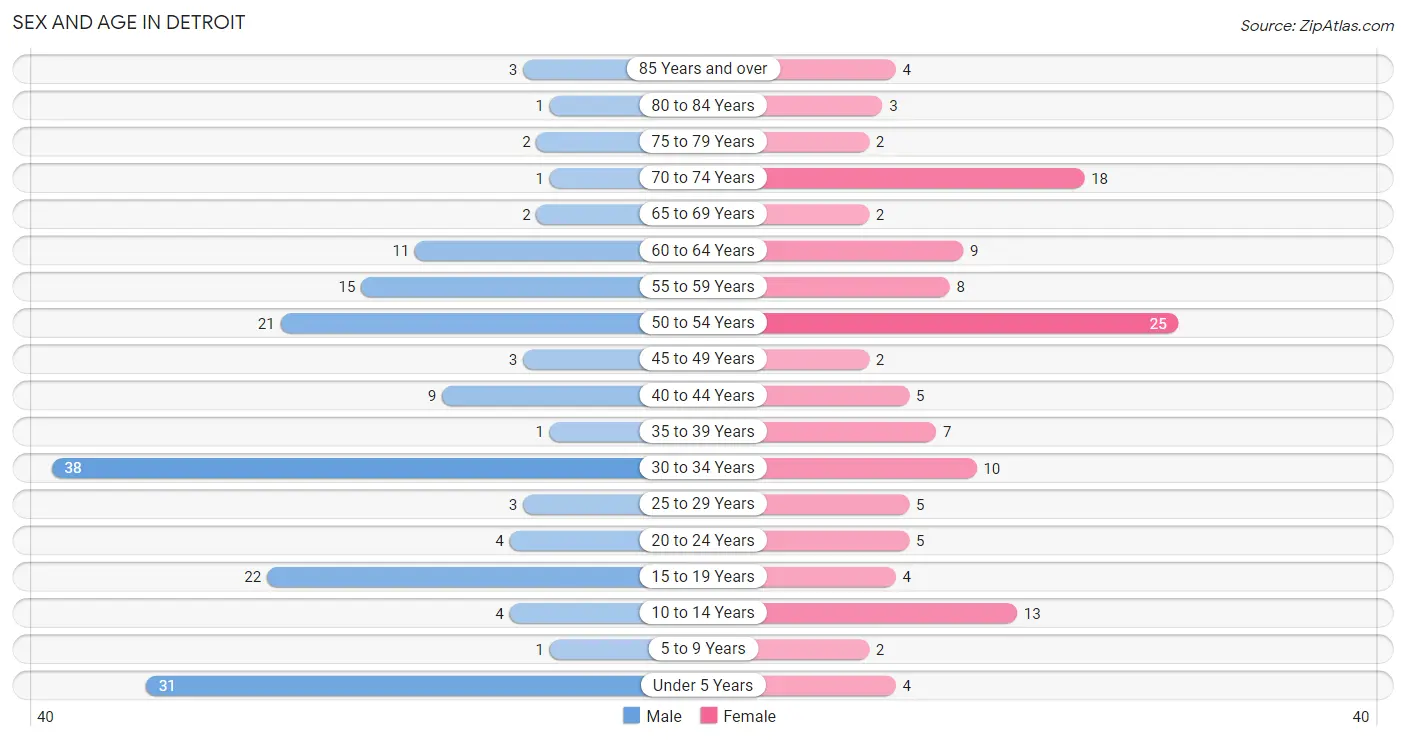
| Age Bracket | Male | Female |
| Under 5 Years | 31 (18.0%) | 4 (3.1%) |
| 5 to 9 Years | 1 (0.6%) | 2 (1.6%) |
| 10 to 14 Years | 4 (2.3%) | 13 (10.2%) |
| 15 to 19 Years | 22 (12.8%) | 4 (3.1%) |
| 20 to 24 Years | 4 (2.3%) | 5 (3.9%) |
| 25 to 29 Years | 3 (1.7%) | 5 (3.9%) |
| 30 to 34 Years | 38 (22.1%) | 10 (7.8%) |
| 35 to 39 Years | 1 (0.6%) | 7 (5.5%) |
| 40 to 44 Years | 9 (5.2%) | 5 (3.9%) |
| 45 to 49 Years | 3 (1.7%) | 2 (1.6%) |
| 50 to 54 Years | 21 (12.2%) | 25 (19.5%) |
| 55 to 59 Years | 15 (8.7%) | 8 (6.2%) |
| 60 to 64 Years | 11 (6.4%) | 9 (7.0%) |
| 65 to 69 Years | 2 (1.2%) | 2 (1.6%) |
| 70 to 74 Years | 1 (0.6%) | 18 (14.1%) |
| 75 to 79 Years | 2 (1.2%) | 2 (1.6%) |
| 80 to 84 Years | 1 (0.6%) | 3 (2.3%) |
| 85 Years and over | 3 (1.7%) | 4 (3.1%) |
| Total | 172 (100.0%) | 128 (100.0%) |
Families and Households in Detroit
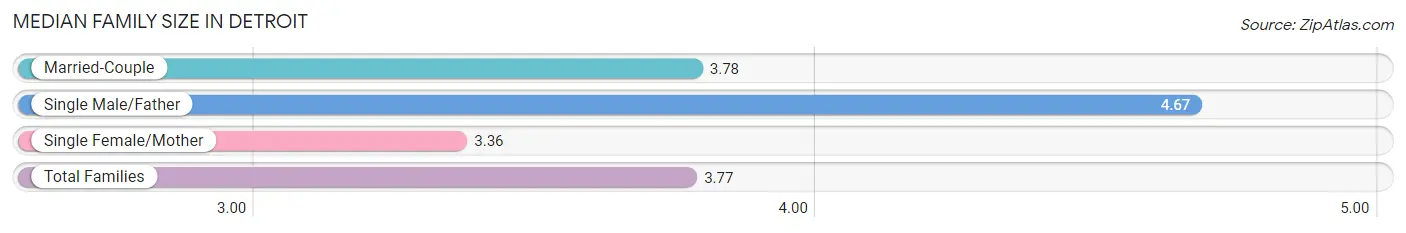
Median Family Size in Detroit
The median family size in Detroit is 3.77 persons per family, with single male/father families (6 | 8.7%) accounting for the largest median family size of 4.67 persons per family. On the other hand, single female/mother families (14 | 20.3%) represent the smallest median family size with 3.36 persons per family.
| Family Type | # Families | Family Size |
| Married-Couple | 49 (71.0%) | 3.78 |
| Single Male/Father | 6 (8.7%) | 4.67 |
| Single Female/Mother | 14 (20.3%) | 3.36 |
| Total Families | 69 (100.0%) | 3.77 |
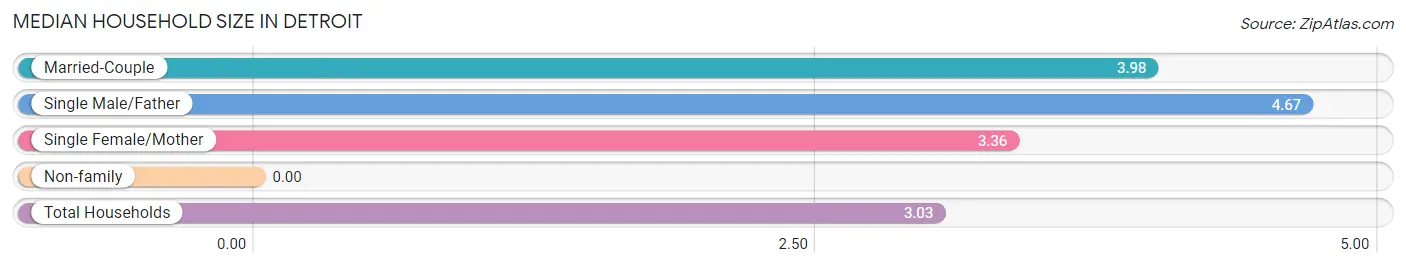
Median Household Size in Detroit
| Household Type | # Households | Household Size |
| Married-Couple | 49 (49.5%) | 3.98 |
| Single Male/Father | 6 (6.1%) | 4.67 |
| Single Female/Mother | 14 (14.1%) | 3.36 |
| Non-family | 30 (30.3%) | - |
| Total Households | 99 (100.0%) | 3.03 |
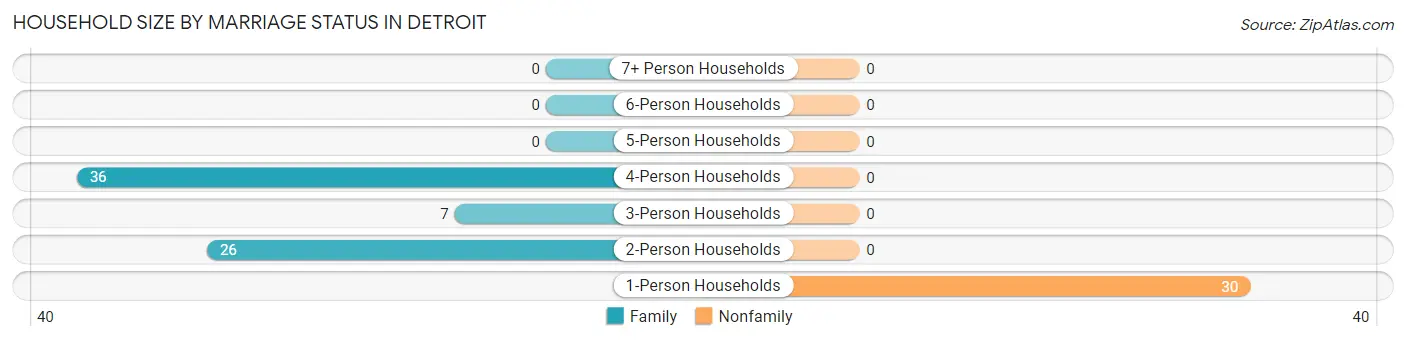
Household Size by Marriage Status in Detroit
Out of a total of 99 households in Detroit, 69 (69.7%) are family households, while 30 (30.3%) are nonfamily households. The most numerous type of family households are 4-person households, comprising 36, and the most common type of nonfamily households are 1-person households, comprising 30.
| Household Size | Family Households | Nonfamily Households |
| 1-Person Households | - | 30 (30.3%) |
| 2-Person Households | 26 (26.3%) | 0 (0.0%) |
| 3-Person Households | 7 (7.1%) | 0 (0.0%) |
| 4-Person Households | 36 (36.4%) | 0 (0.0%) |
| 5-Person Households | 0 (0.0%) | 0 (0.0%) |
| 6-Person Households | 0 (0.0%) | 0 (0.0%) |
| 7+ Person Households | 0 (0.0%) | 0 (0.0%) |
| Total | 69 (69.7%) | 30 (30.3%) |
Female Fertility in Detroit
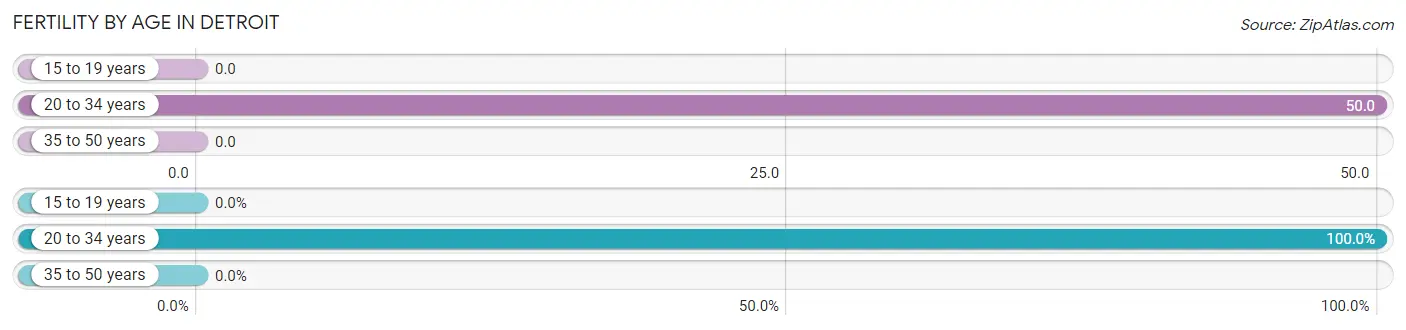
Fertility by Age in Detroit
Average fertility rate in Detroit is 26.0 births per 1,000 women. Women in the age bracket of 20 to 34 years have the highest fertility rate with 50.0 births per 1,000 women. Women in the age bracket of 20 to 34 years acount for 100.0% of all women with births.
| Age Bracket | Women with Births | Births / 1,000 Women |
| 15 to 19 years | 0 (0.0%) | 0.0 |
| 20 to 34 years | 1 (100.0%) | 50.0 |
| 35 to 50 years | 0 (0.0%) | 0.0 |
| Total | 1 (100.0%) | 26.0 |
Fertility by Age by Marriage Status in Detroit
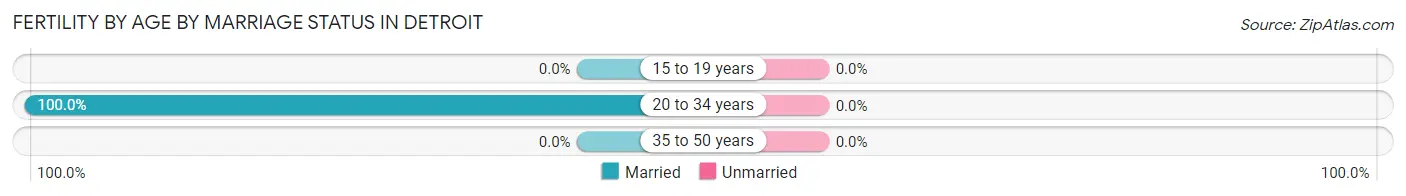
| Age Bracket | Married | Unmarried |
| 15 to 19 years | 0 (0.0%) | 0 (0.0%) |
| 20 to 34 years | 1 (100.0%) | 0 (0.0%) |
| 35 to 50 years | 0 (0.0%) | 0 (0.0%) |
| Total | 1 (100.0%) | 0 (0.0%) |
Fertility by Education in Detroit
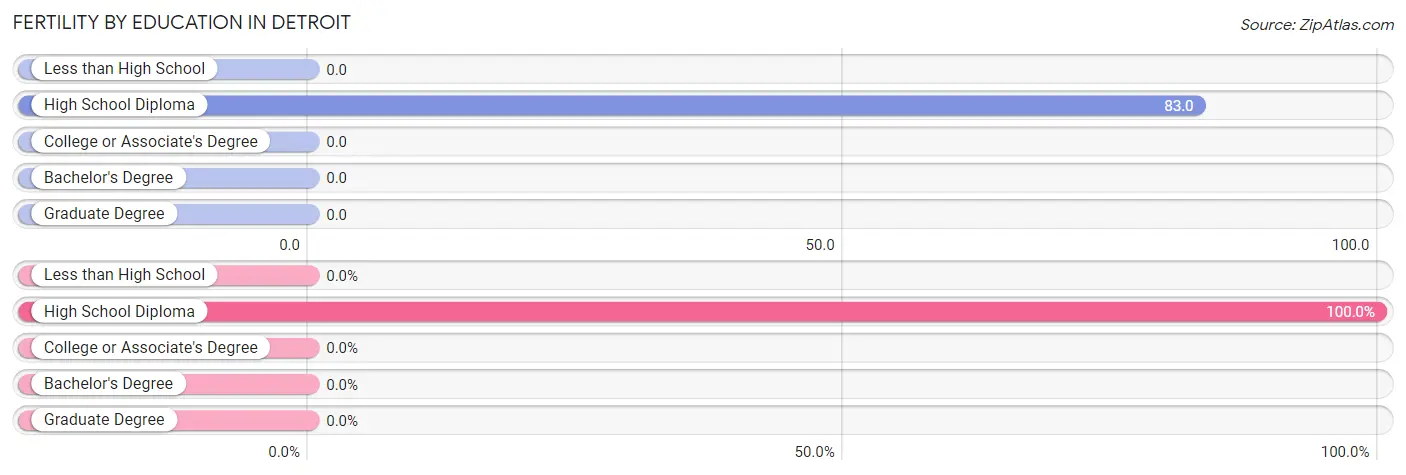
| Educational Attainment | Women with Births | Births / 1,000 Women |
| Less than High School | 0 (0.0%) | 0.0 |
| High School Diploma | 1 (100.0%) | 83.0 |
| College or Associate's Degree | 0 (0.0%) | 0.0 |
| Bachelor's Degree | 0 (0.0%) | 0.0 |
| Graduate Degree | 0 (0.0%) | 0.0 |
| Total | 1 (100.0%) | 26.0 |
Fertility by Education by Marriage Status in Detroit
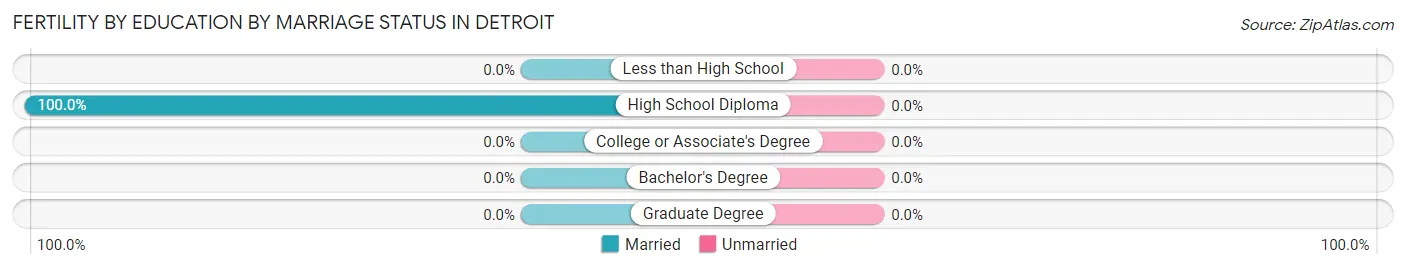
| Educational Attainment | Married | Unmarried |
| Less than High School | 0 (0.0%) | 0 (0.0%) |
| High School Diploma | 1 (100.0%) | 0 (0.0%) |
| College or Associate's Degree | 0 (0.0%) | 0 (0.0%) |
| Bachelor's Degree | 0 (0.0%) | 0 (0.0%) |
| Graduate Degree | 0 (0.0%) | 0 (0.0%) |
| Total | 1 (100.0%) | 0 (0.0%) |
Employment Characteristics in Detroit
Employment by Class of Employer in Detroit
Among the 89 employed individuals in Detroit, private company employees (55 | 61.8%), not-for-profit organizations (22 | 24.7%), and self-employed (not incorporated) (5 | 5.6%) make up the most common classes of employment.
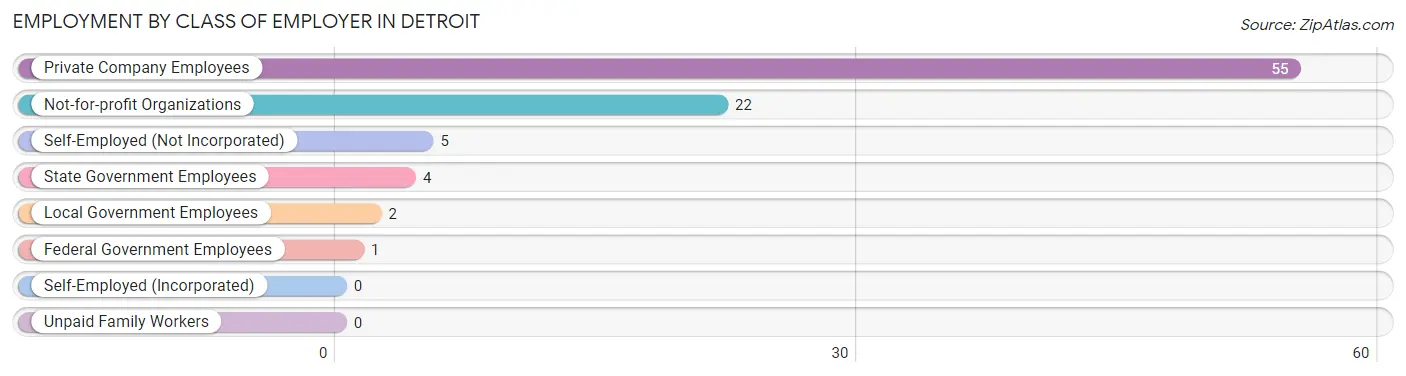
| Employer Class | # Employees | % Employees |
| Private Company Employees | 55 | 61.8% |
| Self-Employed (Incorporated) | 0 | 0.0% |
| Self-Employed (Not Incorporated) | 5 | 5.6% |
| Not-for-profit Organizations | 22 | 24.7% |
| Local Government Employees | 2 | 2.2% |
| State Government Employees | 4 | 4.5% |
| Federal Government Employees | 1 | 1.1% |
| Unpaid Family Workers | 0 | 0.0% |
| Total | 89 | 100.0% |
Employment Status by Age in Detroit
According to the labor force statistics for Detroit, out of the total population over 16 years of age (245), 43.3% or 106 individuals are in the labor force, with 12.4% or 13 of them unemployed. The age group with the highest labor force participation rate is 25 to 29 years, with 100.0% or 8 individuals in the labor force. Within the labor force, the 30 to 34 years age range has the highest percentage of unemployed individuals, with 53.8% or 7 of them being unemployed.
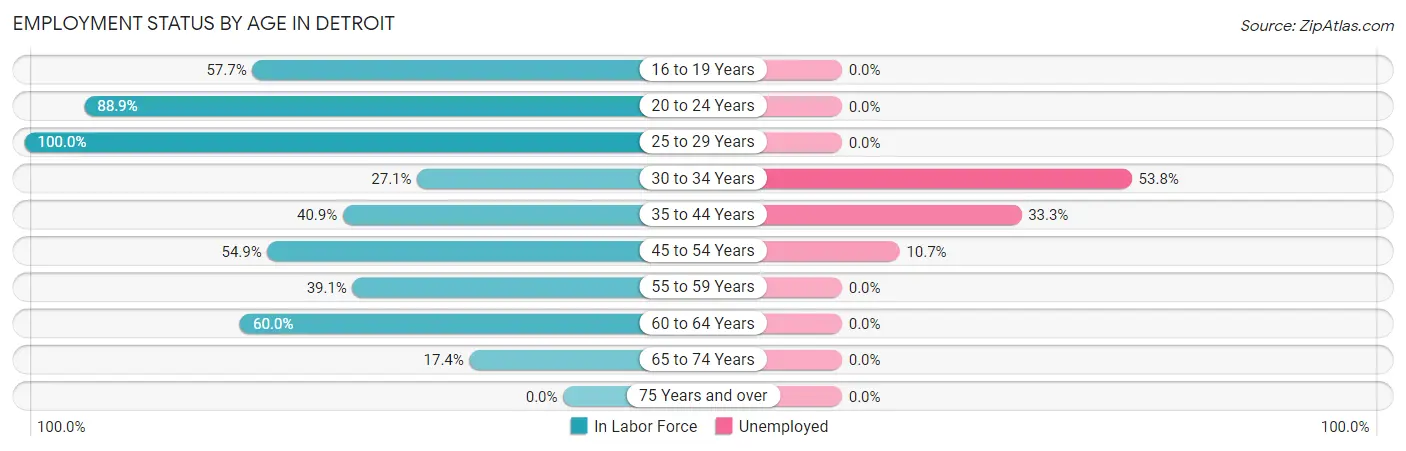
| Age Bracket | In Labor Force | Unemployed |
| 16 to 19 Years | 15 (57.7%) | 0 (0.0%) |
| 20 to 24 Years | 8 (88.9%) | 0 (0.0%) |
| 25 to 29 Years | 8 (100.0%) | 0 (0.0%) |
| 30 to 34 Years | 13 (27.1%) | 7 (53.8%) |
| 35 to 44 Years | 9 (40.9%) | 3 (33.3%) |
| 45 to 54 Years | 28 (54.9%) | 3 (10.7%) |
| 55 to 59 Years | 9 (39.1%) | 0 (0.0%) |
| 60 to 64 Years | 12 (60.0%) | 0 (0.0%) |
| 65 to 74 Years | 4 (17.4%) | 0 (0.0%) |
| 75 Years and over | 0 (0.0%) | 0 (0.0%) |
| Total | 106 (43.3%) | 13 (12.4%) |
Employment Status by Educational Attainment in Detroit
According to labor force statistics for Detroit, 45.9% of individuals (79) out of the total population between 25 and 64 years of age (172) are in the labor force, with 16.7% or 13 of them being unemployed. The group with the highest labor force participation rate are those with the educational attainment of bachelor's degree or higher, with 90.5% or 19 individuals in the labor force. Within the labor force, individuals with less than high school education have the highest percentage of unemployment, with 46.7% or 7 of them being unemployed.
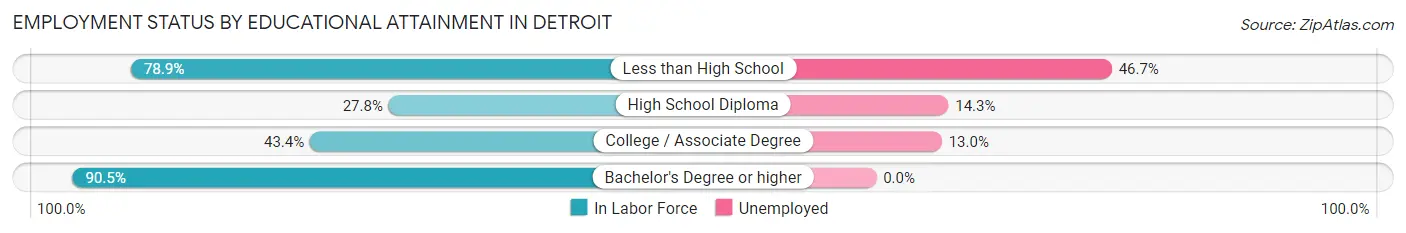
| Educational Attainment | In Labor Force | Unemployed |
| Less than High School | 15 (78.9%) | 9 (46.7%) |
| High School Diploma | 22 (27.8%) | 11 (14.3%) |
| College / Associate Degree | 23 (43.4%) | 7 (13.0%) |
| Bachelor's Degree or higher | 19 (90.5%) | 0 (0.0%) |
| Total | 79 (45.9%) | 29 (16.7%) |
Employment Occupations by Sex in Detroit
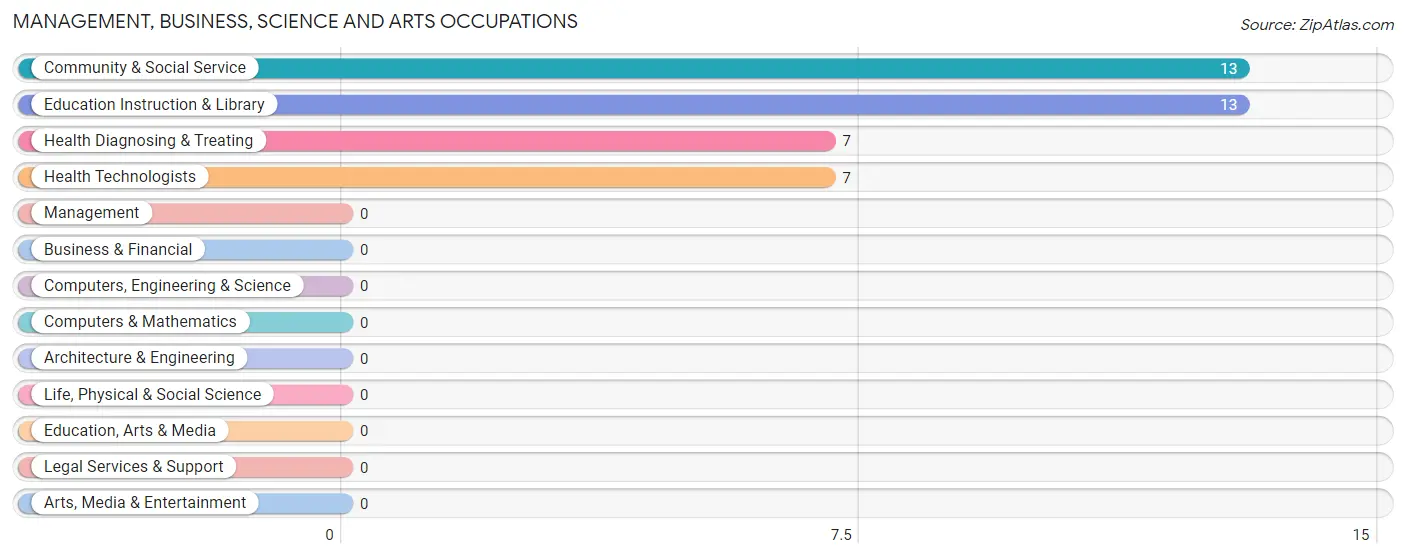
Management, Business, Science and Arts Occupations
The most common Management, Business, Science and Arts occupations in Detroit are Community & Social Service (13 | 14.1%), Education Instruction & Library (13 | 14.1%), Health Diagnosing & Treating (7 | 7.6%), and Health Technologists (7 | 7.6%).
Management, Business, Science and Arts Occupations by Sex
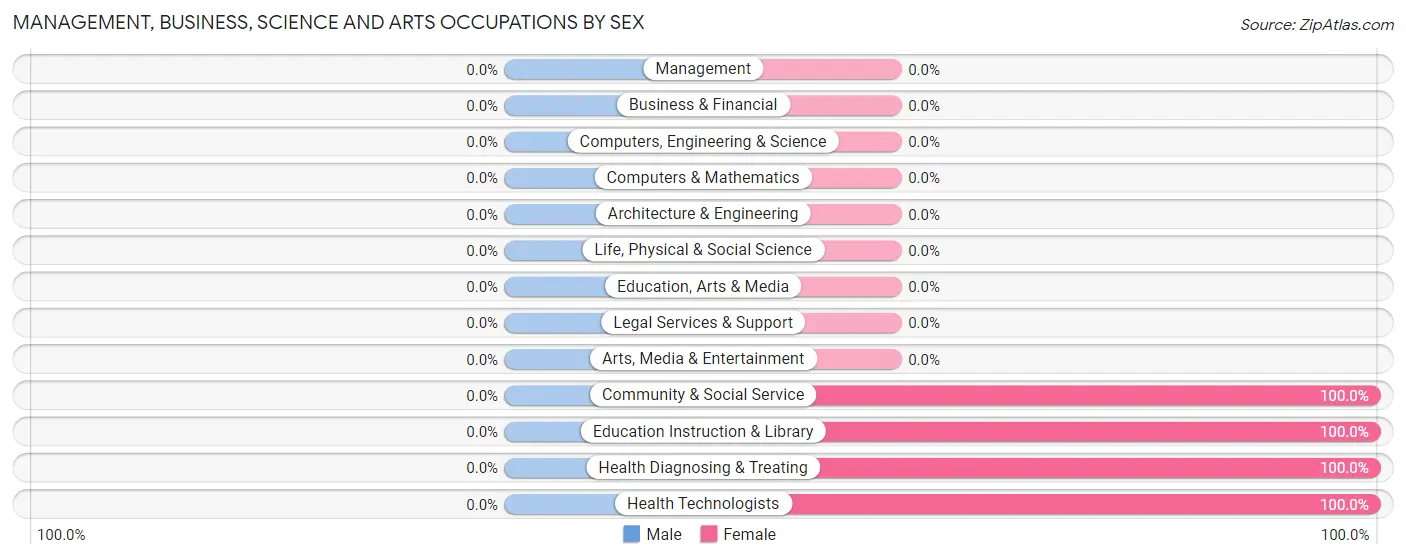
| Occupation | Male | Female |
| Management | 0 (0.0%) | 0 (0.0%) |
| Business & Financial | 0 (0.0%) | 0 (0.0%) |
| Computers, Engineering & Science | 0 (0.0%) | 0 (0.0%) |
| Computers & Mathematics | 0 (0.0%) | 0 (0.0%) |
| Architecture & Engineering | 0 (0.0%) | 0 (0.0%) |
| Life, Physical & Social Science | 0 (0.0%) | 0 (0.0%) |
| Community & Social Service | 0 (0.0%) | 13 (100.0%) |
| Education, Arts & Media | 0 (0.0%) | 0 (0.0%) |
| Legal Services & Support | 0 (0.0%) | 0 (0.0%) |
| Education Instruction & Library | 0 (0.0%) | 13 (100.0%) |
| Arts, Media & Entertainment | 0 (0.0%) | 0 (0.0%) |
| Health Diagnosing & Treating | 0 (0.0%) | 7 (100.0%) |
| Health Technologists | 0 (0.0%) | 7 (100.0%) |
| Total (Category) | 0 (0.0%) | 20 (100.0%) |
| Total (Overall) | 51 (55.4%) | 41 (44.6%) |
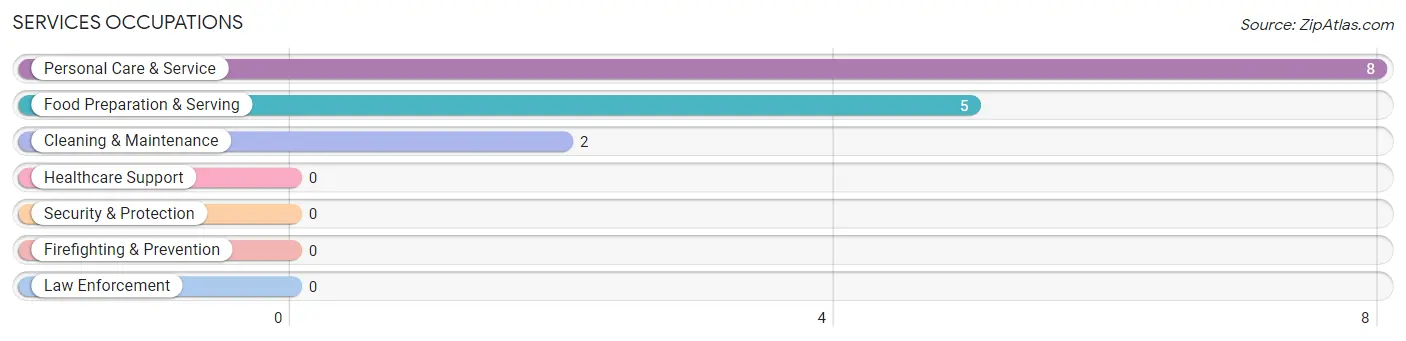
Services Occupations
The most common Services occupations in Detroit are Personal Care & Service (8 | 8.7%), Food Preparation & Serving (5 | 5.4%), and Cleaning & Maintenance (2 | 2.2%).
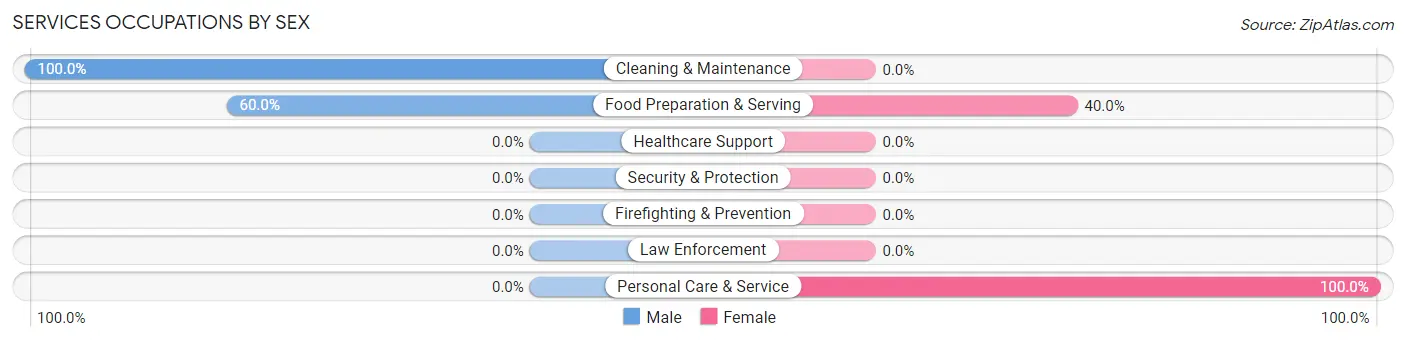
Services Occupations by Sex
Within the Services occupations in Detroit, the most male-oriented occupations are Cleaning & Maintenance (100.0%), and Food Preparation & Serving (60.0%), while the most female-oriented occupations are Personal Care & Service (100.0%), and Food Preparation & Serving (40.0%).
| Occupation | Male | Female |
| Healthcare Support | 0 (0.0%) | 0 (0.0%) |
| Security & Protection | 0 (0.0%) | 0 (0.0%) |
| Firefighting & Prevention | 0 (0.0%) | 0 (0.0%) |
| Law Enforcement | 0 (0.0%) | 0 (0.0%) |
| Food Preparation & Serving | 3 (60.0%) | 2 (40.0%) |
| Cleaning & Maintenance | 2 (100.0%) | 0 (0.0%) |
| Personal Care & Service | 0 (0.0%) | 8 (100.0%) |
| Total (Category) | 5 (33.3%) | 10 (66.7%) |
| Total (Overall) | 51 (55.4%) | 41 (44.6%) |
Sales and Office Occupations
The most common Sales and Office occupations in Detroit are , and Office & Administration (8 | 8.7%).

Sales and Office Occupations by Sex

| Occupation | Male | Female |
| Sales & Related | 0 (0.0%) | 0 (0.0%) |
| Office & Administration | 5 (62.5%) | 3 (37.5%) |
| Total (Category) | 5 (62.5%) | 3 (37.5%) |
| Total (Overall) | 51 (55.4%) | 41 (44.6%) |
Natural Resources, Construction and Maintenance Occupations
The most common Natural Resources, Construction and Maintenance occupations in Detroit are , and Farming, Fishing & Forestry (2 | 2.2%).

Natural Resources, Construction and Maintenance Occupations by Sex

| Occupation | Male | Female |
| Farming, Fishing & Forestry | 2 (100.0%) | 0 (0.0%) |
| Construction & Extraction | 0 (0.0%) | 0 (0.0%) |
| Installation, Maintenance & Repair | 0 (0.0%) | 0 (0.0%) |
| Total (Category) | 2 (100.0%) | 0 (0.0%) |
| Total (Overall) | 51 (55.4%) | 41 (44.6%) |
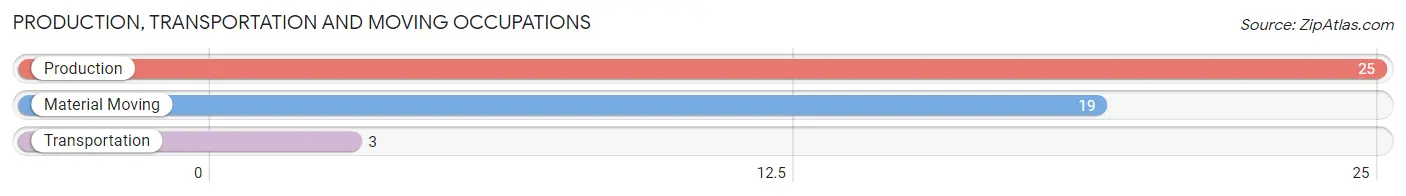
Production, Transportation and Moving Occupations
The most common Production, Transportation and Moving occupations in Detroit are Production (25 | 27.2%), Material Moving (19 | 20.6%), and Transportation (3 | 3.3%).
Production, Transportation and Moving Occupations by Sex
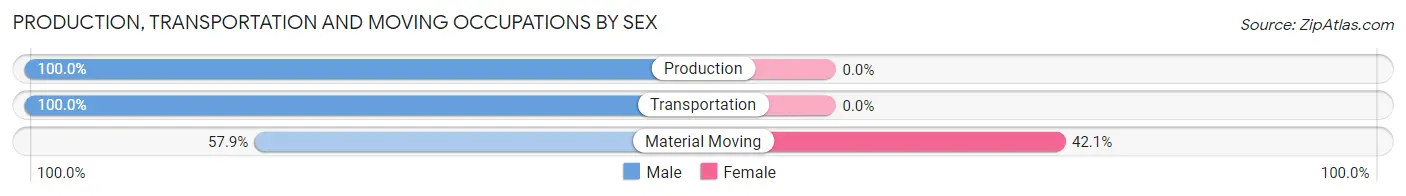
| Occupation | Male | Female |
| Production | 25 (100.0%) | 0 (0.0%) |
| Transportation | 3 (100.0%) | 0 (0.0%) |
| Material Moving | 11 (57.9%) | 8 (42.1%) |
| Total (Category) | 39 (83.0%) | 8 (17.0%) |
| Total (Overall) | 51 (55.4%) | 41 (44.6%) |
Employment Industries by Sex in Detroit
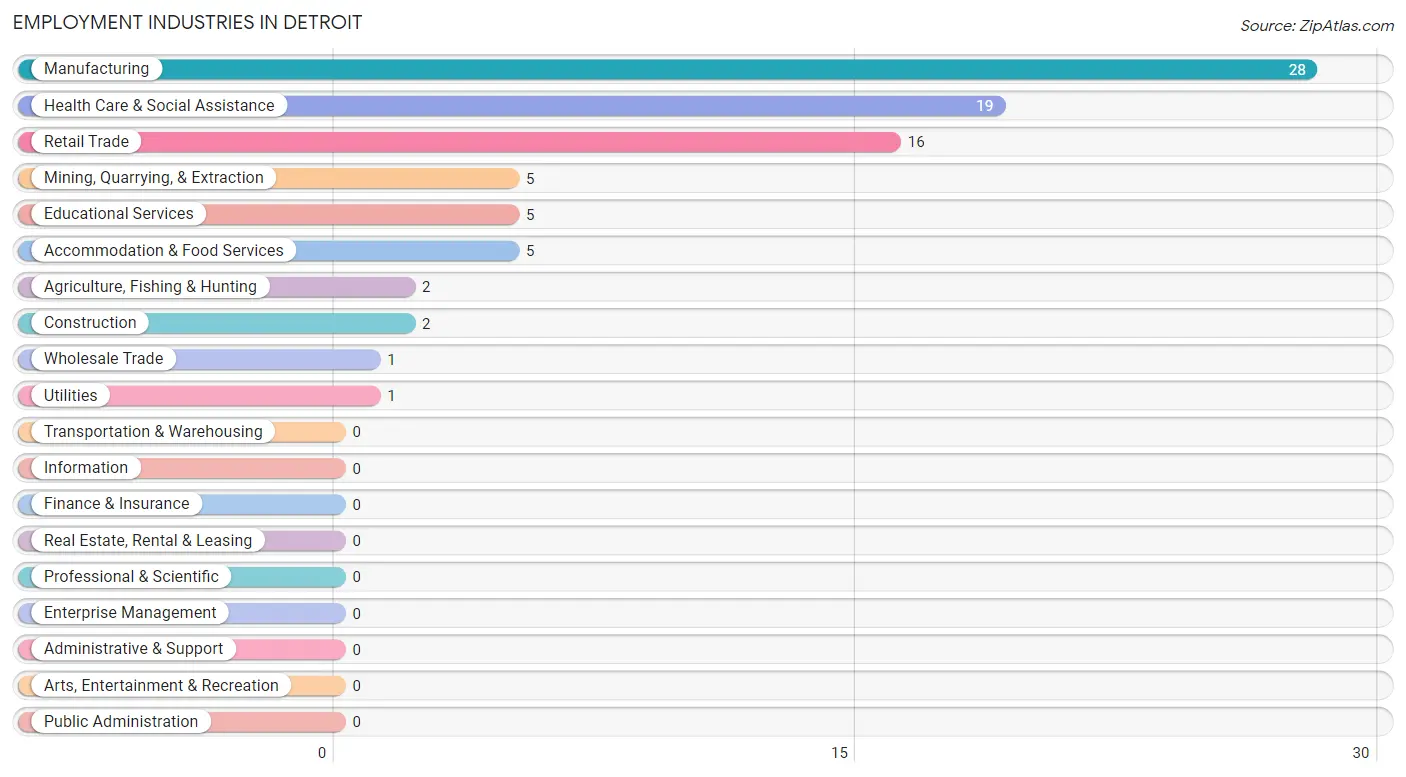
Employment Industries in Detroit
The major employment industries in Detroit include Manufacturing (28 | 30.4%), Health Care & Social Assistance (19 | 20.6%), Retail Trade (16 | 17.4%), Mining, Quarrying, & Extraction (5 | 5.4%), and Educational Services (5 | 5.4%).
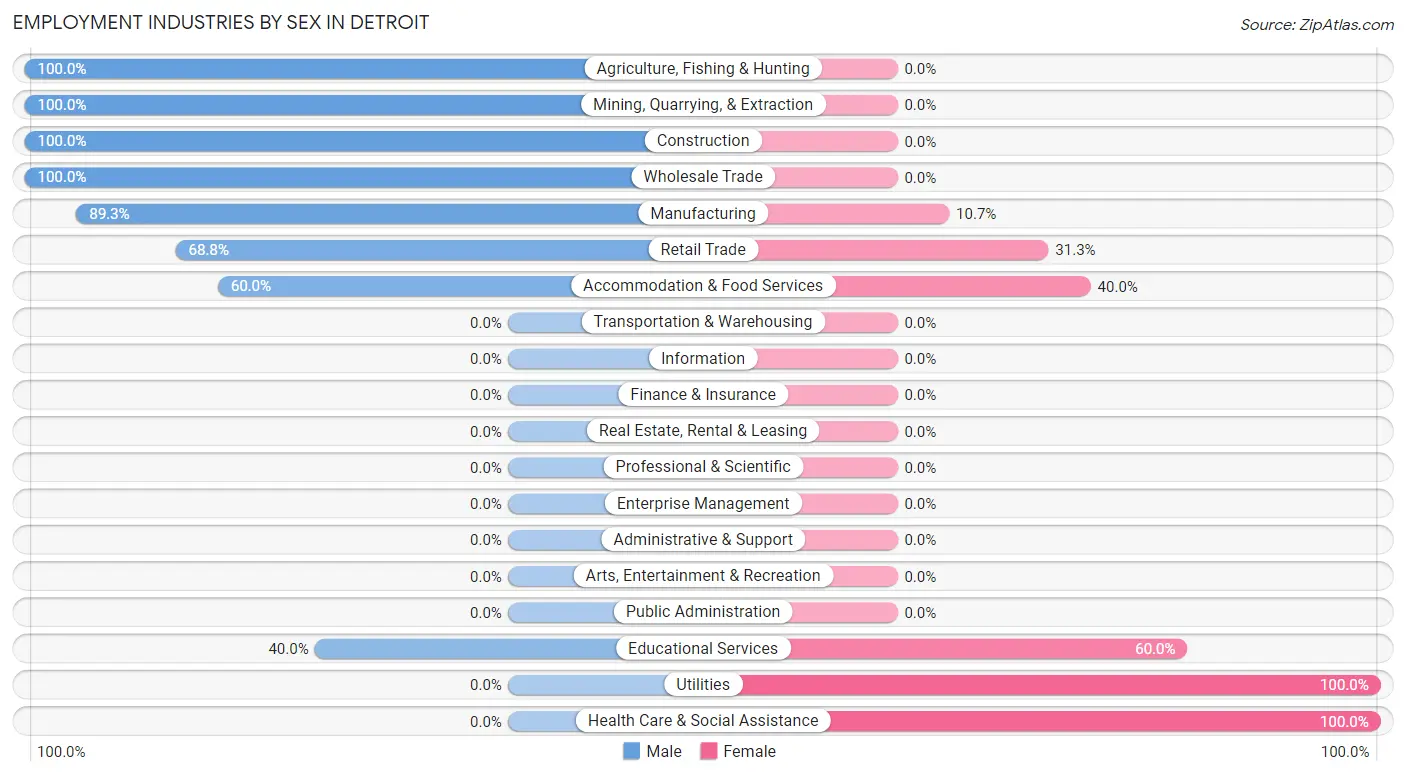
Employment Industries by Sex in Detroit
The Detroit industries that see more men than women are Agriculture, Fishing & Hunting (100.0%), Mining, Quarrying, & Extraction (100.0%), and Construction (100.0%), whereas the industries that tend to have a higher number of women are Utilities (100.0%), Health Care & Social Assistance (100.0%), and Educational Services (60.0%).
| Industry | Male | Female |
| Agriculture, Fishing & Hunting | 2 (100.0%) | 0 (0.0%) |
| Mining, Quarrying, & Extraction | 5 (100.0%) | 0 (0.0%) |
| Construction | 2 (100.0%) | 0 (0.0%) |
| Manufacturing | 25 (89.3%) | 3 (10.7%) |
| Wholesale Trade | 1 (100.0%) | 0 (0.0%) |
| Retail Trade | 11 (68.8%) | 5 (31.2%) |
| Transportation & Warehousing | 0 (0.0%) | 0 (0.0%) |
| Utilities | 0 (0.0%) | 1 (100.0%) |
| Information | 0 (0.0%) | 0 (0.0%) |
| Finance & Insurance | 0 (0.0%) | 0 (0.0%) |
| Real Estate, Rental & Leasing | 0 (0.0%) | 0 (0.0%) |
| Professional & Scientific | 0 (0.0%) | 0 (0.0%) |
| Enterprise Management | 0 (0.0%) | 0 (0.0%) |
| Administrative & Support | 0 (0.0%) | 0 (0.0%) |
| Educational Services | 2 (40.0%) | 3 (60.0%) |
| Health Care & Social Assistance | 0 (0.0%) | 19 (100.0%) |
| Arts, Entertainment & Recreation | 0 (0.0%) | 0 (0.0%) |
| Accommodation & Food Services | 3 (60.0%) | 2 (40.0%) |
| Public Administration | 0 (0.0%) | 0 (0.0%) |
| Total | 51 (55.4%) | 41 (44.6%) |
Education in Detroit
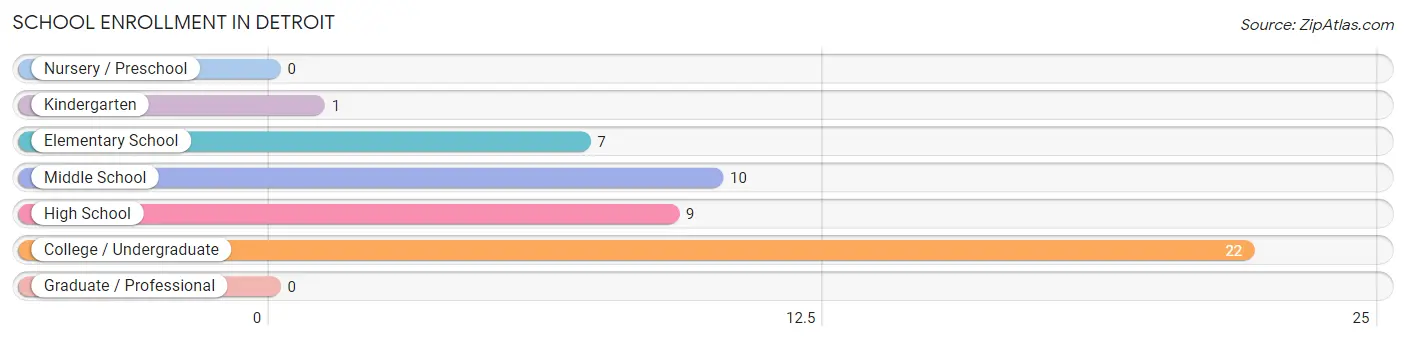
School Enrollment in Detroit
The most common levels of schooling among the 49 students in Detroit are college / undergraduate (22 | 44.9%), middle school (10 | 20.4%), and high school (9 | 18.4%).
| School Level | # Students | % Students |
| Nursery / Preschool | 0 | 0.0% |
| Kindergarten | 1 | 2.0% |
| Elementary School | 7 | 14.3% |
| Middle School | 10 | 20.4% |
| High School | 9 | 18.4% |
| College / Undergraduate | 22 | 44.9% |
| Graduate / Professional | 0 | 0.0% |
| Total | 49 | 100.0% |
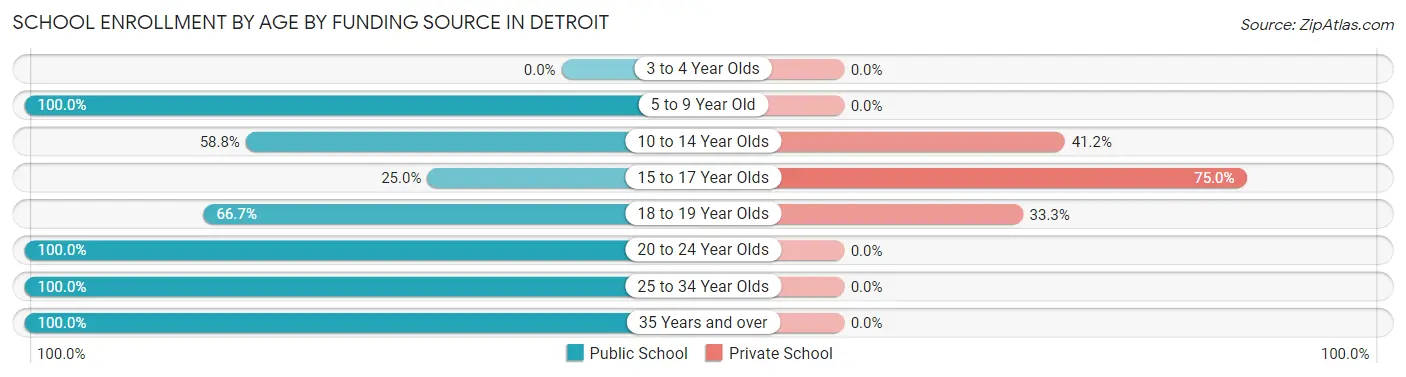
School Enrollment by Age by Funding Source in Detroit
Out of a total of 49 students who are enrolled in schools in Detroit, 15 (30.6%) attend a private institution, while the remaining 34 (69.4%) are enrolled in public schools. The age group of 15 to 17 year olds has the highest likelihood of being enrolled in private schools, with 3 (75.0% in the age bracket) enrolled. Conversely, the age group of 5 to 9 year old has the lowest likelihood of being enrolled in a private school, with 1 (100.0% in the age bracket) attending a public institution.
| Age Bracket | Public School | Private School |
| 3 to 4 Year Olds | 0 (0.0%) | 0 (0.0%) |
| 5 to 9 Year Old | 1 (100.0%) | 0 (0.0%) |
| 10 to 14 Year Olds | 10 (58.8%) | 7 (41.2%) |
| 15 to 17 Year Olds | 1 (25.0%) | 3 (75.0%) |
| 18 to 19 Year Olds | 10 (66.7%) | 5 (33.3%) |
| 20 to 24 Year Olds | 4 (100.0%) | 0 (0.0%) |
| 25 to 34 Year Olds | 5 (100.0%) | 0 (0.0%) |
| 35 Years and over | 3 (100.0%) | 0 (0.0%) |
| Total | 34 (69.4%) | 15 (30.6%) |
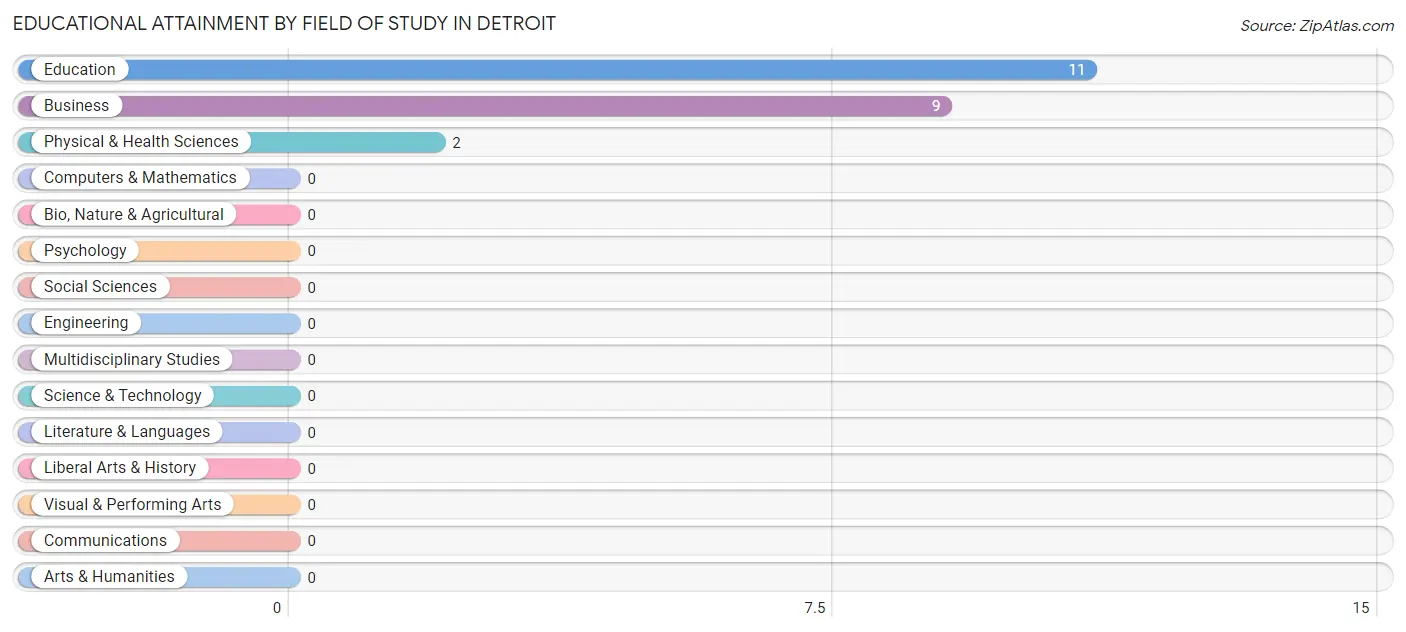
Educational Attainment by Field of Study in Detroit
Education (11 | 50.0%), business (9 | 40.9%), and physical & health sciences (2 | 9.1%) are the most common fields of study among 22 individuals in Detroit who have obtained a bachelor's degree or higher.
| Field of Study | # Graduates | % Graduates |
| Computers & Mathematics | 0 | 0.0% |
| Bio, Nature & Agricultural | 0 | 0.0% |
| Physical & Health Sciences | 2 | 9.1% |
| Psychology | 0 | 0.0% |
| Social Sciences | 0 | 0.0% |
| Engineering | 0 | 0.0% |
| Multidisciplinary Studies | 0 | 0.0% |
| Science & Technology | 0 | 0.0% |
| Business | 9 | 40.9% |
| Education | 11 | 50.0% |
| Literature & Languages | 0 | 0.0% |
| Liberal Arts & History | 0 | 0.0% |
| Visual & Performing Arts | 0 | 0.0% |
| Communications | 0 | 0.0% |
| Arts & Humanities | 0 | 0.0% |
| Total | 22 | 100.0% |
Transportation & Commute in Detroit
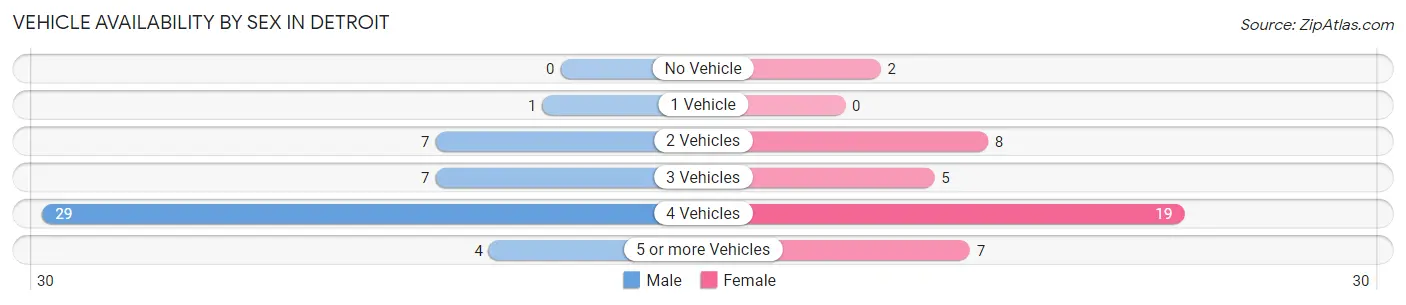
Vehicle Availability by Sex in Detroit
The most prevalent vehicle ownership categories in Detroit are males with 4 vehicles (29, accounting for 60.4%) and females with 4 vehicles (19, making up 70.7%).
| Vehicles Available | Male | Female |
| No Vehicle | 0 (0.0%) | 2 (4.9%) |
| 1 Vehicle | 1 (2.1%) | 0 (0.0%) |
| 2 Vehicles | 7 (14.6%) | 8 (19.5%) |
| 3 Vehicles | 7 (14.6%) | 5 (12.2%) |
| 4 Vehicles | 29 (60.4%) | 19 (46.3%) |
| 5 or more Vehicles | 4 (8.3%) | 7 (17.1%) |
| Total | 48 (100.0%) | 41 (100.0%) |
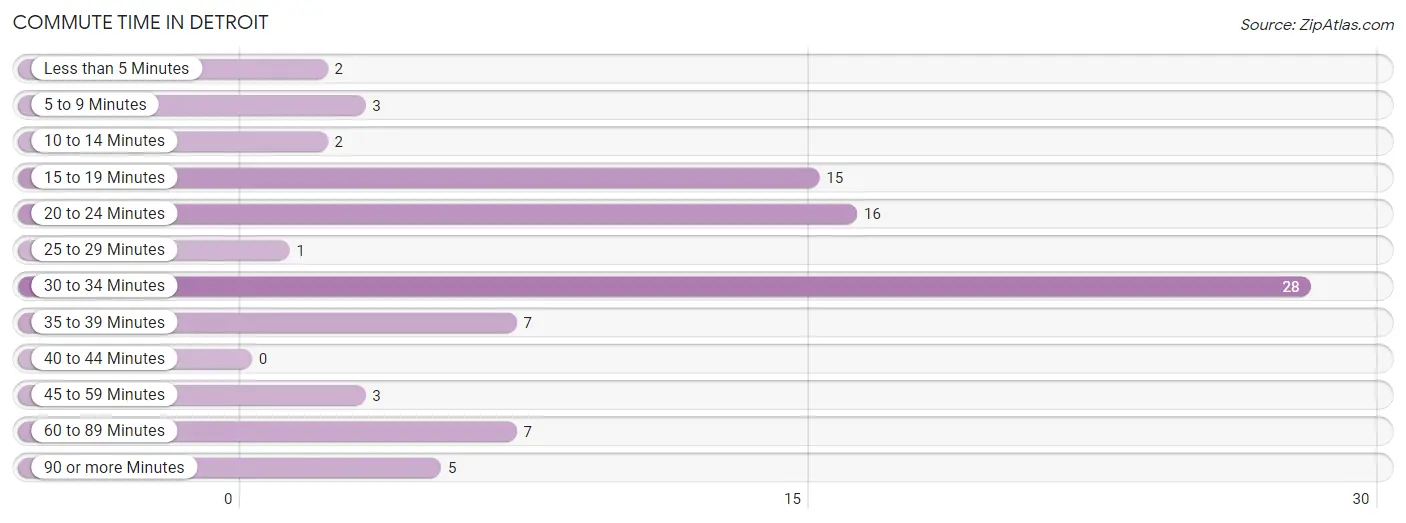
Commute Time in Detroit
The most frequently occuring commute durations in Detroit are 30 to 34 minutes (28 commuters, 31.5%), 20 to 24 minutes (16 commuters, 18.0%), and 15 to 19 minutes (15 commuters, 16.9%).
| Commute Time | # Commuters | % Commuters |
| Less than 5 Minutes | 2 | 2.2% |
| 5 to 9 Minutes | 3 | 3.4% |
| 10 to 14 Minutes | 2 | 2.2% |
| 15 to 19 Minutes | 15 | 16.9% |
| 20 to 24 Minutes | 16 | 18.0% |
| 25 to 29 Minutes | 1 | 1.1% |
| 30 to 34 Minutes | 28 | 31.5% |
| 35 to 39 Minutes | 7 | 7.9% |
| 40 to 44 Minutes | 0 | 0.0% |
| 45 to 59 Minutes | 3 | 3.4% |
| 60 to 89 Minutes | 7 | 7.9% |
| 90 or more Minutes | 5 | 5.6% |
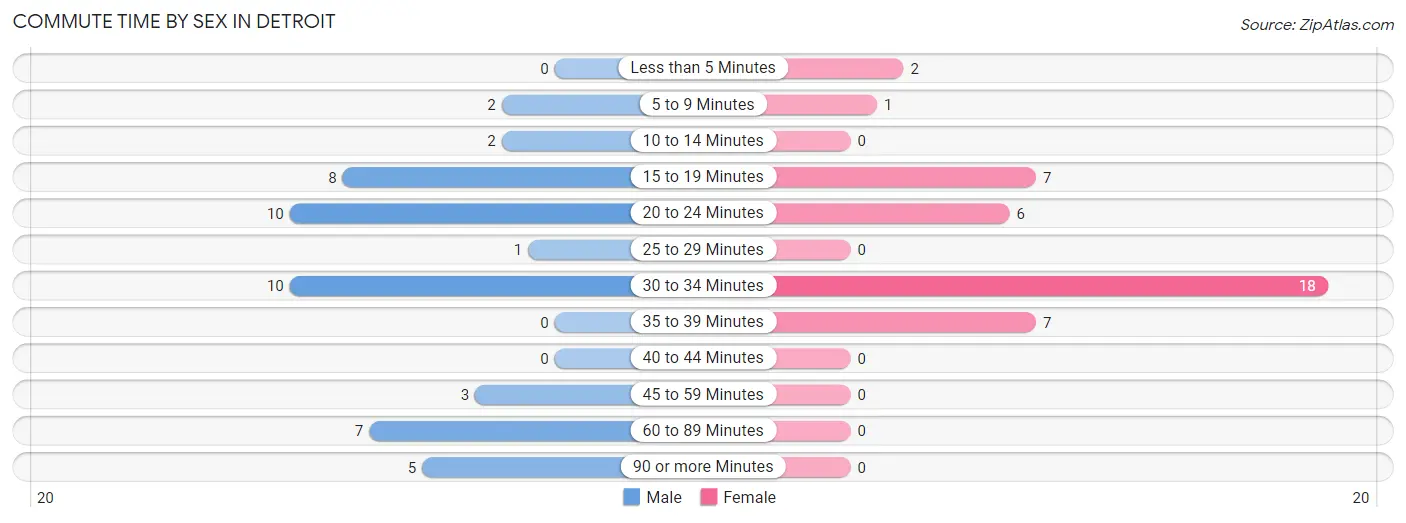
Commute Time by Sex in Detroit
The most common commute times in Detroit are 20 to 24 minutes (10 commuters, 20.8%) for males and 30 to 34 minutes (18 commuters, 43.9%) for females.
| Commute Time | Male | Female |
| Less than 5 Minutes | 0 (0.0%) | 2 (4.9%) |
| 5 to 9 Minutes | 2 (4.2%) | 1 (2.4%) |
| 10 to 14 Minutes | 2 (4.2%) | 0 (0.0%) |
| 15 to 19 Minutes | 8 (16.7%) | 7 (17.1%) |
| 20 to 24 Minutes | 10 (20.8%) | 6 (14.6%) |
| 25 to 29 Minutes | 1 (2.1%) | 0 (0.0%) |
| 30 to 34 Minutes | 10 (20.8%) | 18 (43.9%) |
| 35 to 39 Minutes | 0 (0.0%) | 7 (17.1%) |
| 40 to 44 Minutes | 0 (0.0%) | 0 (0.0%) |
| 45 to 59 Minutes | 3 (6.2%) | 0 (0.0%) |
| 60 to 89 Minutes | 7 (14.6%) | 0 (0.0%) |
| 90 or more Minutes | 5 (10.4%) | 0 (0.0%) |
Time of Departure to Work by Sex in Detroit
The most frequent times of departure to work in Detroit are 5:00 AM to 5:29 AM (22, 45.8%) for males and 7:00 AM to 7:29 AM (16, 39.0%) for females.
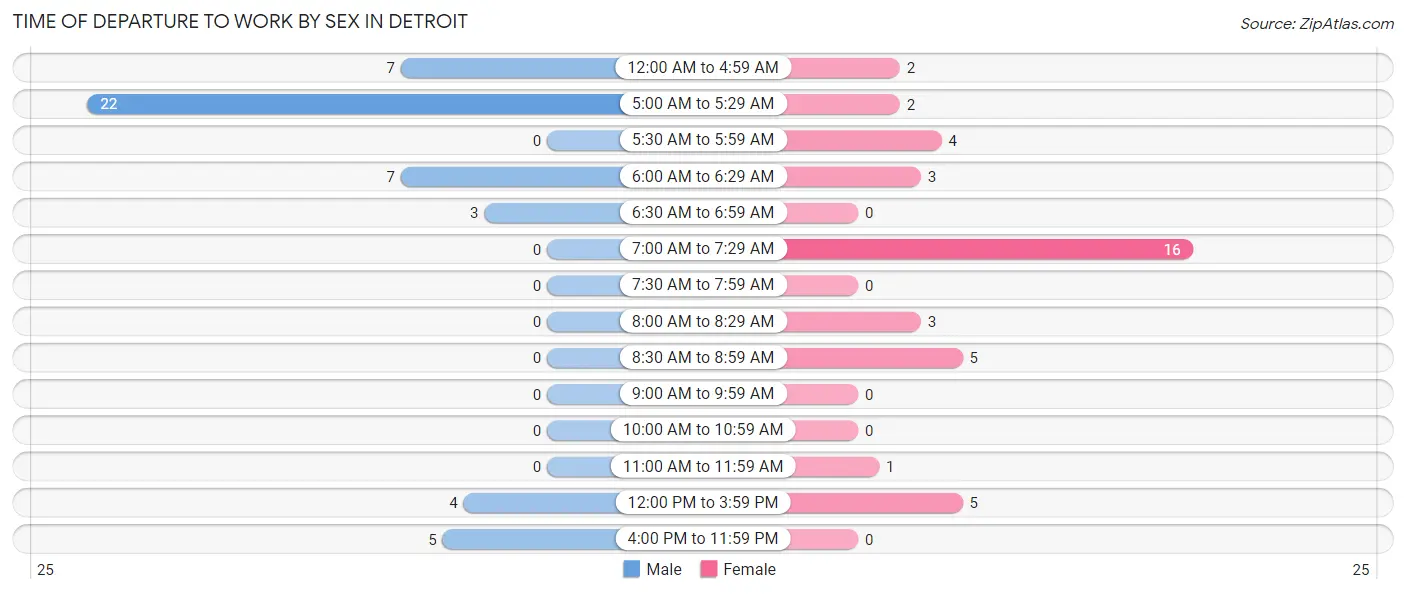
| Time of Departure | Male | Female |
| 12:00 AM to 4:59 AM | 7 (14.6%) | 2 (4.9%) |
| 5:00 AM to 5:29 AM | 22 (45.8%) | 2 (4.9%) |
| 5:30 AM to 5:59 AM | 0 (0.0%) | 4 (9.8%) |
| 6:00 AM to 6:29 AM | 7 (14.6%) | 3 (7.3%) |
| 6:30 AM to 6:59 AM | 3 (6.2%) | 0 (0.0%) |
| 7:00 AM to 7:29 AM | 0 (0.0%) | 16 (39.0%) |
| 7:30 AM to 7:59 AM | 0 (0.0%) | 0 (0.0%) |
| 8:00 AM to 8:29 AM | 0 (0.0%) | 3 (7.3%) |
| 8:30 AM to 8:59 AM | 0 (0.0%) | 5 (12.2%) |
| 9:00 AM to 9:59 AM | 0 (0.0%) | 0 (0.0%) |
| 10:00 AM to 10:59 AM | 0 (0.0%) | 0 (0.0%) |
| 11:00 AM to 11:59 AM | 0 (0.0%) | 1 (2.4%) |
| 12:00 PM to 3:59 PM | 4 (8.3%) | 5 (12.2%) |
| 4:00 PM to 11:59 PM | 5 (10.4%) | 0 (0.0%) |
| Total | 48 (100.0%) | 41 (100.0%) |
Housing Occupancy in Detroit
Occupancy by Ownership in Detroit
Of the total 99 dwellings in Detroit, owner-occupied units account for 54 (54.5%), while renter-occupied units make up 45 (45.5%).
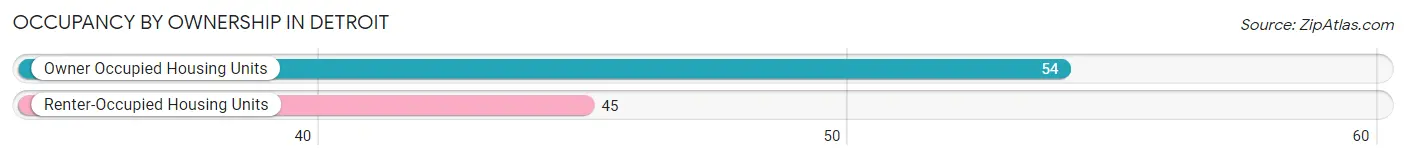
| Occupancy | # Housing Units | % Housing Units |
| Owner Occupied Housing Units | 54 | 54.5% |
| Renter-Occupied Housing Units | 45 | 45.5% |
| Total Occupied Housing Units | 99 | 100.0% |
Occupancy by Household Size in Detroit
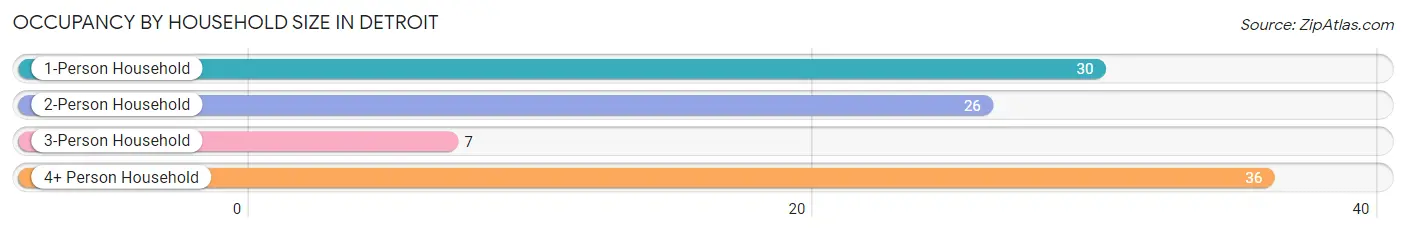
| Household Size | # Housing Units | % Housing Units |
| 1-Person Household | 30 | 30.3% |
| 2-Person Household | 26 | 26.3% |
| 3-Person Household | 7 | 7.1% |
| 4+ Person Household | 36 | 36.4% |
| Total Housing Units | 99 | 100.0% |
Occupancy by Ownership by Household Size in Detroit
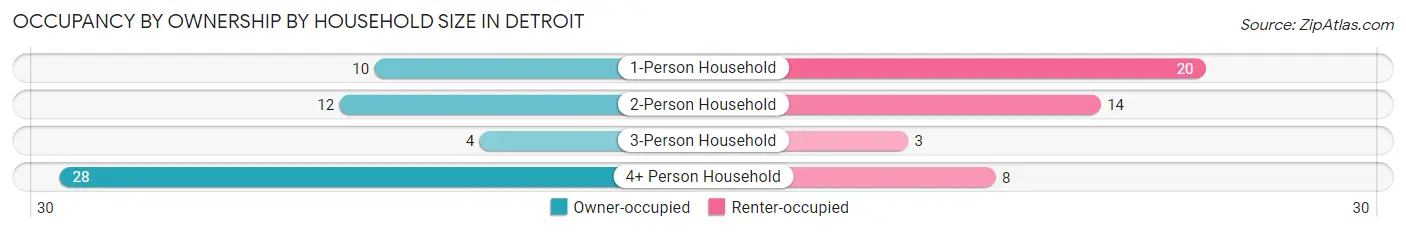
| Household Size | Owner-occupied | Renter-occupied |
| 1-Person Household | 10 (33.3%) | 20 (66.7%) |
| 2-Person Household | 12 (46.2%) | 14 (53.8%) |
| 3-Person Household | 4 (57.1%) | 3 (42.9%) |
| 4+ Person Household | 28 (77.8%) | 8 (22.2%) |
| Total Housing Units | 54 (54.5%) | 45 (45.5%) |
Occupancy by Educational Attainment in Detroit
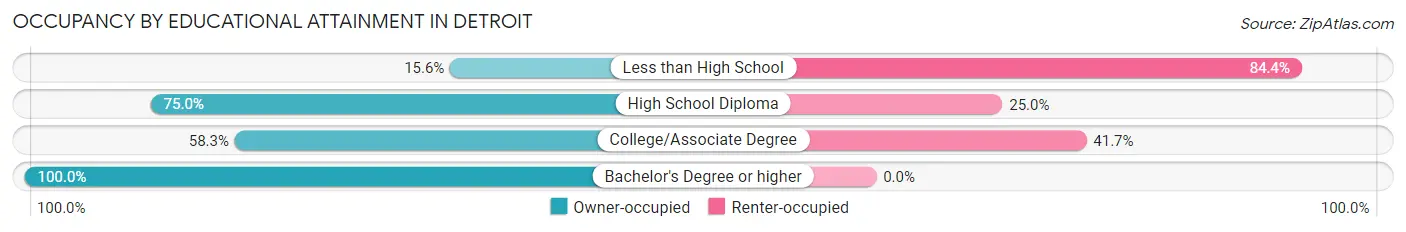
| Household Size | Owner-occupied | Renter-occupied |
| Less than High School | 5 (15.6%) | 27 (84.4%) |
| High School Diploma | 24 (75.0%) | 8 (25.0%) |
| College/Associate Degree | 14 (58.3%) | 10 (41.7%) |
| Bachelor's Degree or higher | 11 (100.0%) | 0 (0.0%) |
Occupancy by Age of Householder in Detroit
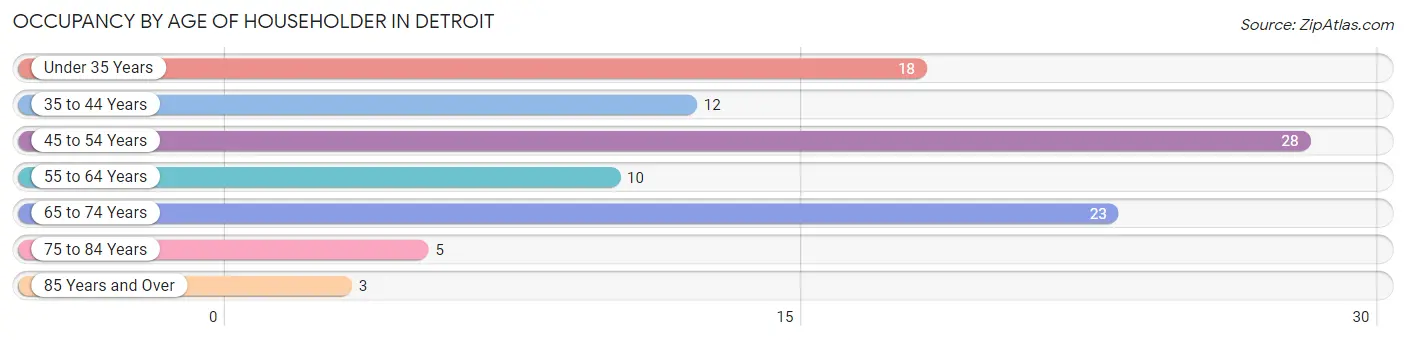
| Age Bracket | # Households | % Households |
| Under 35 Years | 18 | 18.2% |
| 35 to 44 Years | 12 | 12.1% |
| 45 to 54 Years | 28 | 28.3% |
| 55 to 64 Years | 10 | 10.1% |
| 65 to 74 Years | 23 | 23.2% |
| 75 to 84 Years | 5 | 5.1% |
| 85 Years and Over | 3 | 3.0% |
| Total | 99 | 100.0% |
Housing Finances in Detroit
Median Income by Occupancy in Detroit
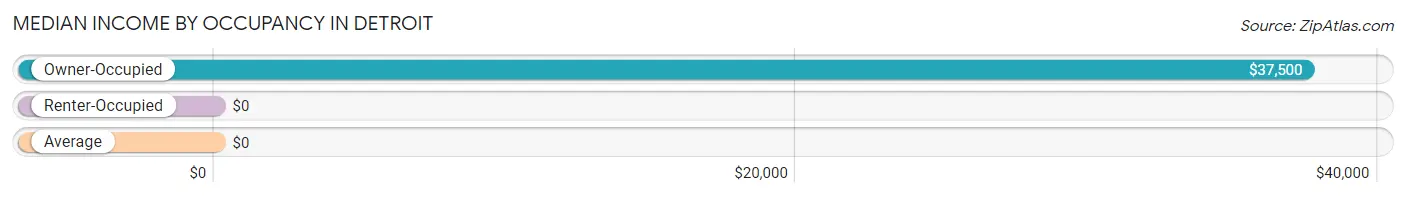
| Occupancy Type | # Households | Median Income |
| Owner-Occupied | 54 (54.5%) | $37,500 |
| Renter-Occupied | 45 (45.5%) | $0 |
| Average | 99 (100.0%) | $0 |
Occupancy by Householder Income Bracket in Detroit
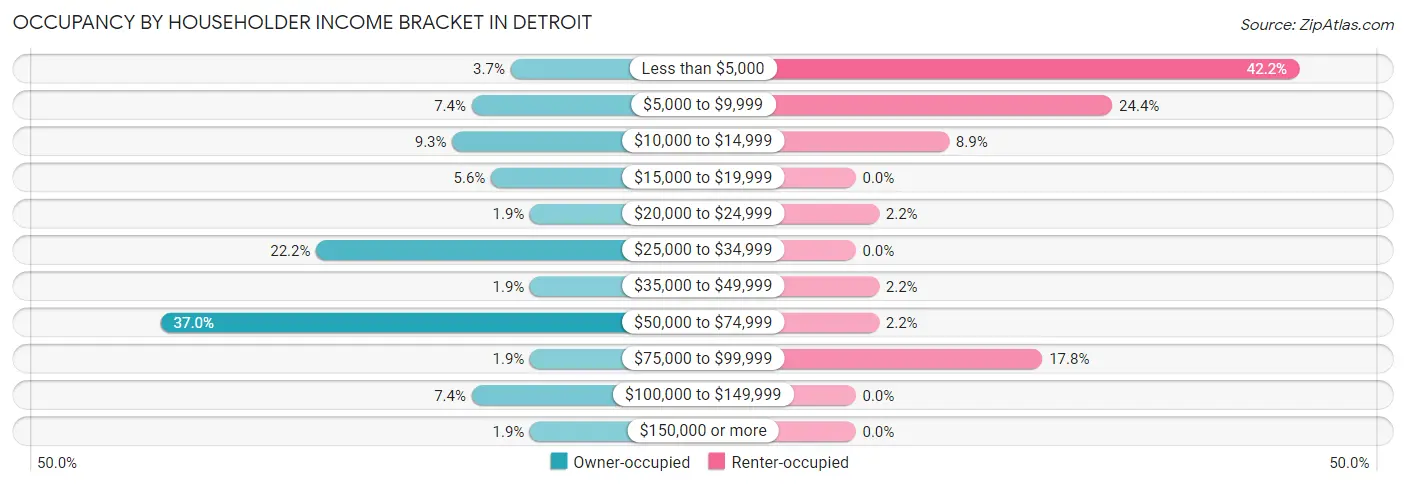
| Income Bracket | Owner-occupied | Renter-occupied |
| Less than $5,000 | 2 (3.7%) | 19 (42.2%) |
| $5,000 to $9,999 | 4 (7.4%) | 11 (24.4%) |
| $10,000 to $14,999 | 5 (9.3%) | 4 (8.9%) |
| $15,000 to $19,999 | 3 (5.6%) | 0 (0.0%) |
| $20,000 to $24,999 | 1 (1.8%) | 1 (2.2%) |
| $25,000 to $34,999 | 12 (22.2%) | 0 (0.0%) |
| $35,000 to $49,999 | 1 (1.8%) | 1 (2.2%) |
| $50,000 to $74,999 | 20 (37.0%) | 1 (2.2%) |
| $75,000 to $99,999 | 1 (1.8%) | 8 (17.8%) |
| $100,000 to $149,999 | 4 (7.4%) | 0 (0.0%) |
| $150,000 or more | 1 (1.8%) | 0 (0.0%) |
| Total | 54 (100.0%) | 45 (100.0%) |
Monthly Housing Cost Tiers in Detroit
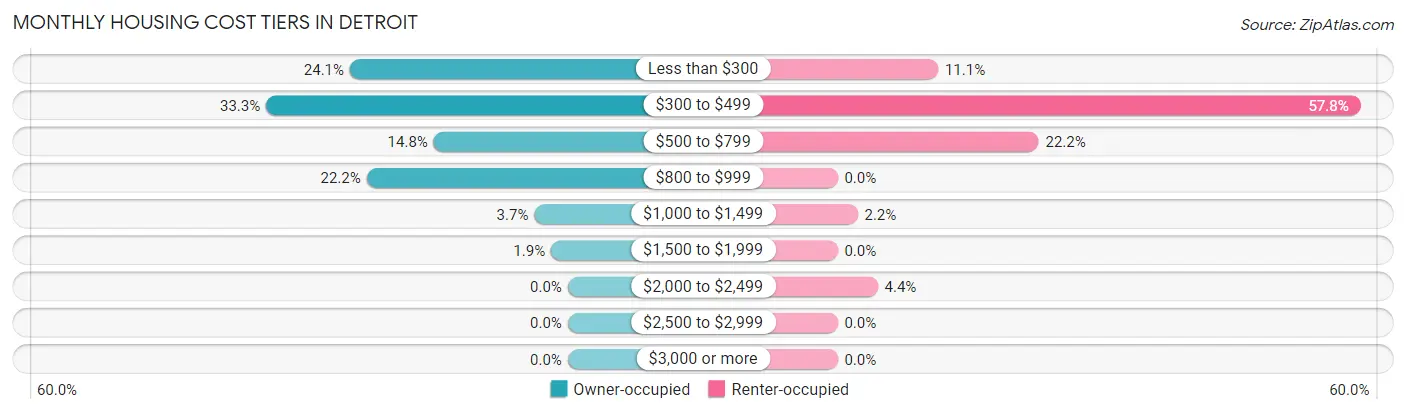
| Monthly Cost | Owner-occupied | Renter-occupied |
| Less than $300 | 13 (24.1%) | 5 (11.1%) |
| $300 to $499 | 18 (33.3%) | 26 (57.8%) |
| $500 to $799 | 8 (14.8%) | 10 (22.2%) |
| $800 to $999 | 12 (22.2%) | 0 (0.0%) |
| $1,000 to $1,499 | 2 (3.7%) | 1 (2.2%) |
| $1,500 to $1,999 | 1 (1.8%) | 0 (0.0%) |
| $2,000 to $2,499 | 0 (0.0%) | 2 (4.4%) |
| $2,500 to $2,999 | 0 (0.0%) | 0 (0.0%) |
| $3,000 or more | 0 (0.0%) | 0 (0.0%) |
| Total | 54 (100.0%) | 45 (100.0%) |
Physical Housing Characteristics in Detroit
Housing Structures in Detroit
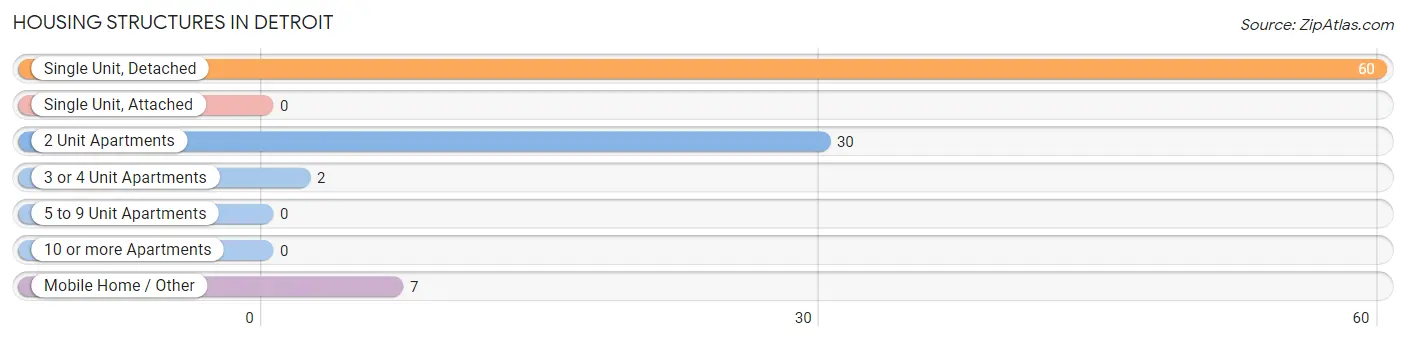
| Structure Type | # Housing Units | % Housing Units |
| Single Unit, Detached | 60 | 60.6% |
| Single Unit, Attached | 0 | 0.0% |
| 2 Unit Apartments | 30 | 30.3% |
| 3 or 4 Unit Apartments | 2 | 2.0% |
| 5 to 9 Unit Apartments | 0 | 0.0% |
| 10 or more Apartments | 0 | 0.0% |
| Mobile Home / Other | 7 | 7.1% |
| Total | 99 | 100.0% |
Housing Structures by Occupancy in Detroit
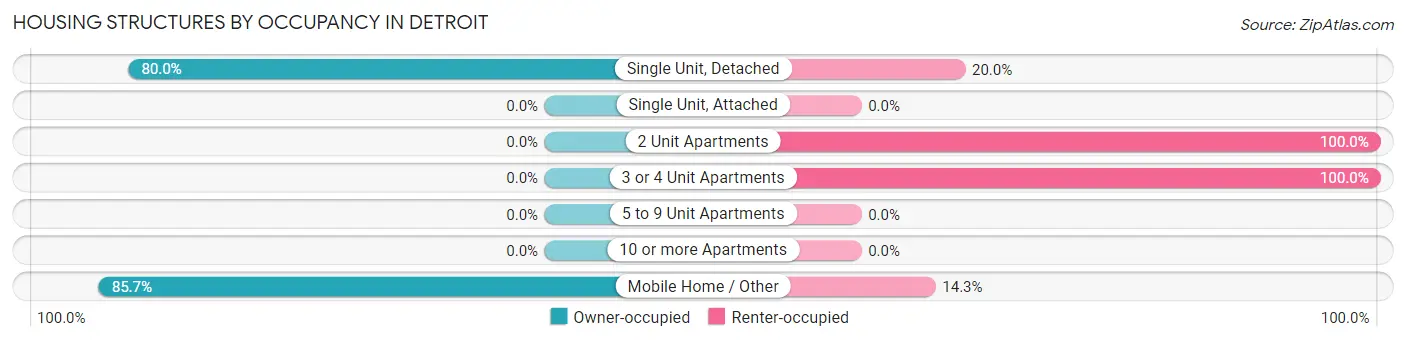
| Structure Type | Owner-occupied | Renter-occupied |
| Single Unit, Detached | 48 (80.0%) | 12 (20.0%) |
| Single Unit, Attached | 0 (0.0%) | 0 (0.0%) |
| 2 Unit Apartments | 0 (0.0%) | 30 (100.0%) |
| 3 or 4 Unit Apartments | 0 (0.0%) | 2 (100.0%) |
| 5 to 9 Unit Apartments | 0 (0.0%) | 0 (0.0%) |
| 10 or more Apartments | 0 (0.0%) | 0 (0.0%) |
| Mobile Home / Other | 6 (85.7%) | 1 (14.3%) |
| Total | 54 (54.5%) | 45 (45.5%) |
Housing Structures by Number of Rooms in Detroit
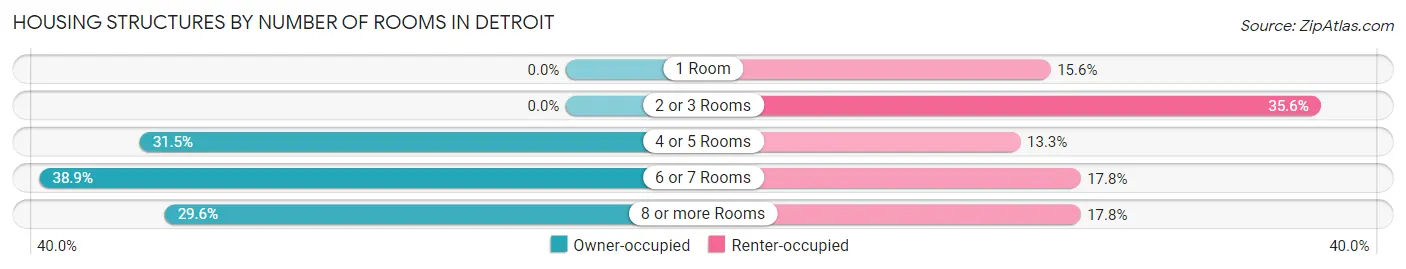
| Number of Rooms | Owner-occupied | Renter-occupied |
| 1 Room | 0 (0.0%) | 7 (15.6%) |
| 2 or 3 Rooms | 0 (0.0%) | 16 (35.6%) |
| 4 or 5 Rooms | 17 (31.5%) | 6 (13.3%) |
| 6 or 7 Rooms | 21 (38.9%) | 8 (17.8%) |
| 8 or more Rooms | 16 (29.6%) | 8 (17.8%) |
| Total | 54 (100.0%) | 45 (100.0%) |
Housing Structure by Heating Type in Detroit
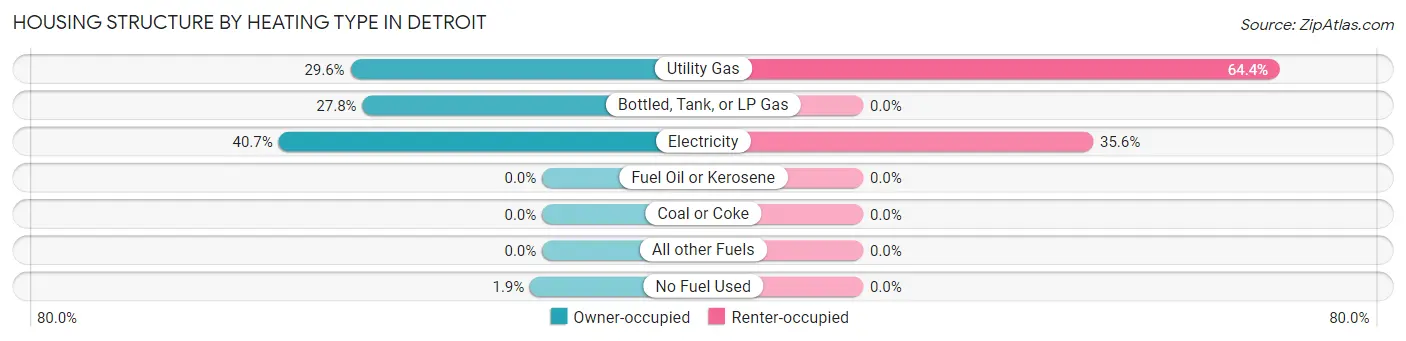
| Heating Type | Owner-occupied | Renter-occupied |
| Utility Gas | 16 (29.6%) | 29 (64.4%) |
| Bottled, Tank, or LP Gas | 15 (27.8%) | 0 (0.0%) |
| Electricity | 22 (40.7%) | 16 (35.6%) |
| Fuel Oil or Kerosene | 0 (0.0%) | 0 (0.0%) |
| Coal or Coke | 0 (0.0%) | 0 (0.0%) |
| All other Fuels | 0 (0.0%) | 0 (0.0%) |
| No Fuel Used | 1 (1.8%) | 0 (0.0%) |
| Total | 54 (100.0%) | 45 (100.0%) |
Household Vehicle Usage in Detroit
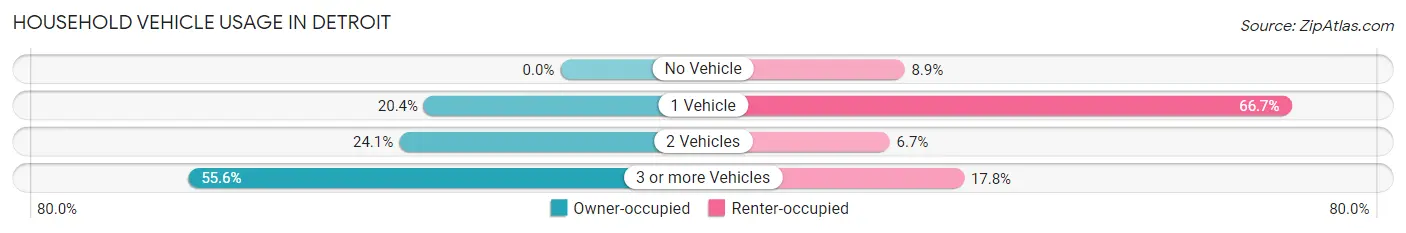
| Vehicles per Household | Owner-occupied | Renter-occupied |
| No Vehicle | 0 (0.0%) | 4 (8.9%) |
| 1 Vehicle | 11 (20.4%) | 30 (66.7%) |
| 2 Vehicles | 13 (24.1%) | 3 (6.7%) |
| 3 or more Vehicles | 30 (55.6%) | 8 (17.8%) |
| Total | 54 (100.0%) | 45 (100.0%) |
Real Estate & Mortgages in Detroit
Real Estate and Mortgage Overview in Detroit
| Characteristic | Without Mortgage | With Mortgage |
| Housing Units | 38 | 16 |
| Median Property Value | $75,000 | $0 |
| Median Household Income | $31,667 | $1 |
| Monthly Housing Costs | $327 | $0 |
| Real Estate Taxes | $199 | $0 |
Property Value by Mortgage Status in Detroit
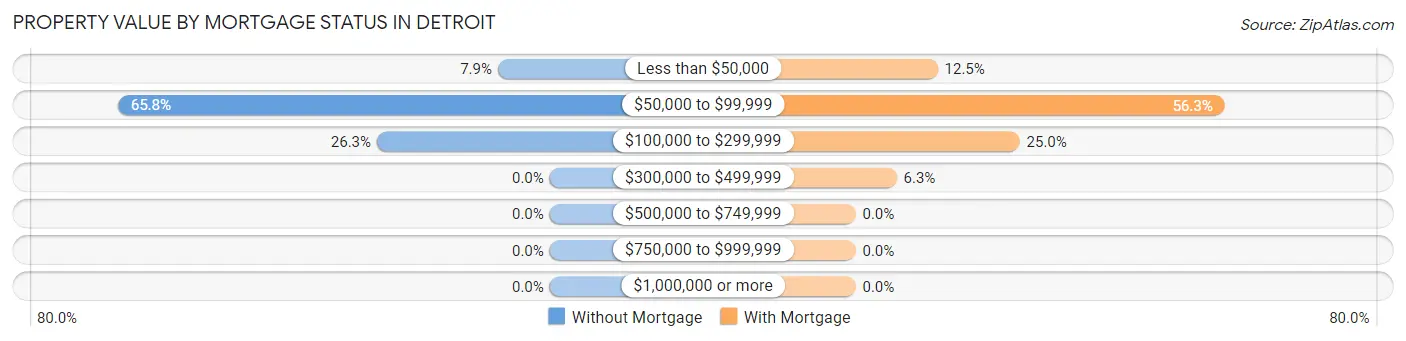
| Property Value | Without Mortgage | With Mortgage |
| Less than $50,000 | 3 (7.9%) | 2 (12.5%) |
| $50,000 to $99,999 | 25 (65.8%) | 9 (56.2%) |
| $100,000 to $299,999 | 10 (26.3%) | 4 (25.0%) |
| $300,000 to $499,999 | 0 (0.0%) | 1 (6.2%) |
| $500,000 to $749,999 | 0 (0.0%) | 0 (0.0%) |
| $750,000 to $999,999 | 0 (0.0%) | 0 (0.0%) |
| $1,000,000 or more | 0 (0.0%) | 0 (0.0%) |
| Total | 38 (100.0%) | 16 (100.0%) |
Household Income by Mortgage Status in Detroit
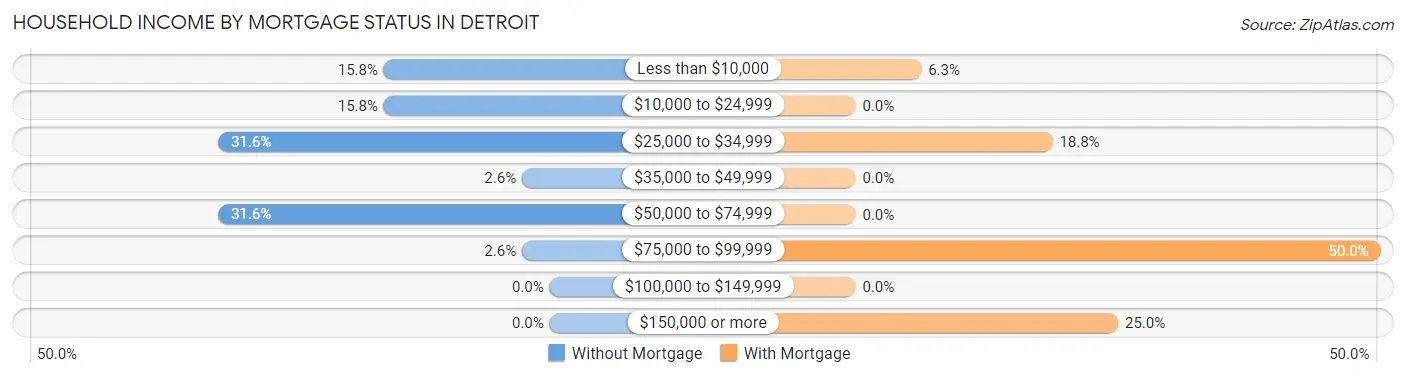
| Household Income | Without Mortgage | With Mortgage |
| Less than $10,000 | 6 (15.8%) | 1 (6.2%) |
| $10,000 to $24,999 | 6 (15.8%) | 0 (0.0%) |
| $25,000 to $34,999 | 12 (31.6%) | 3 (18.8%) |
| $35,000 to $49,999 | 1 (2.6%) | 0 (0.0%) |
| $50,000 to $74,999 | 12 (31.6%) | 0 (0.0%) |
| $75,000 to $99,999 | 1 (2.6%) | 8 (50.0%) |
| $100,000 to $149,999 | 0 (0.0%) | 0 (0.0%) |
| $150,000 or more | 0 (0.0%) | 4 (25.0%) |
| Total | 38 (100.0%) | 16 (100.0%) |
Property Value to Household Income Ratio in Detroit
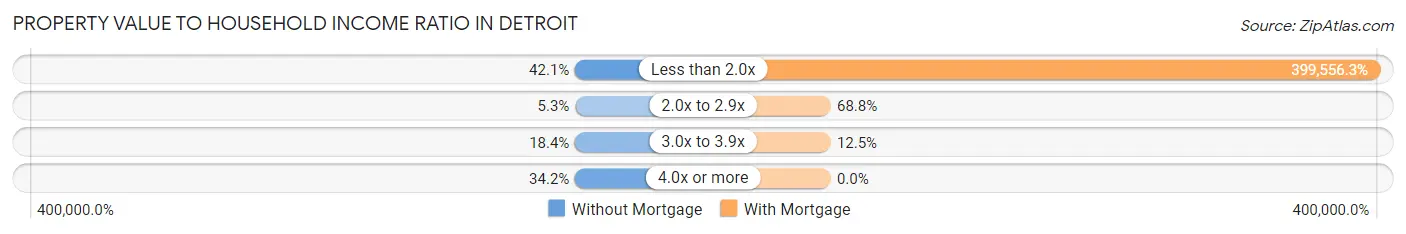
| Value-to-Income Ratio | Without Mortgage | With Mortgage |
| Less than 2.0x | 16 (42.1%) | 63,929 (399,556.2%) |
| 2.0x to 2.9x | 2 (5.3%) | 11 (68.8%) |
| 3.0x to 3.9x | 7 (18.4%) | 2 (12.5%) |
| 4.0x or more | 13 (34.2%) | 0 (0.0%) |
| Total | 38 (100.0%) | 16 (100.0%) |
Real Estate Taxes by Mortgage Status in Detroit
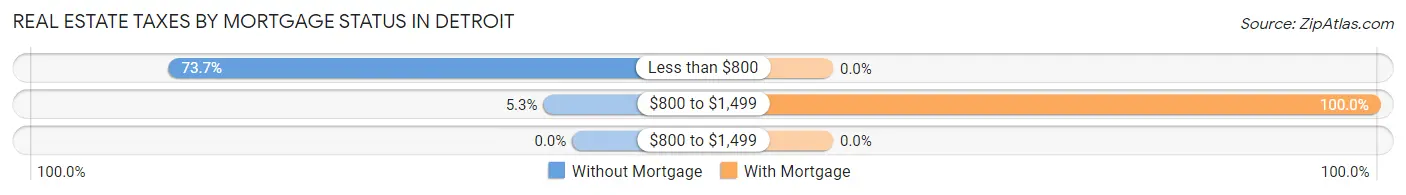
| Property Taxes | Without Mortgage | With Mortgage |
| Less than $800 | 28 (73.7%) | 0 (0.0%) |
| $800 to $1,499 | 2 (5.3%) | 16 (100.0%) |
| $800 to $1,499 | 0 (0.0%) | 0 (0.0%) |
| Total | 38 (100.0%) | 16 (100.0%) |
Health & Disability in Detroit
Health Insurance Coverage by Age in Detroit
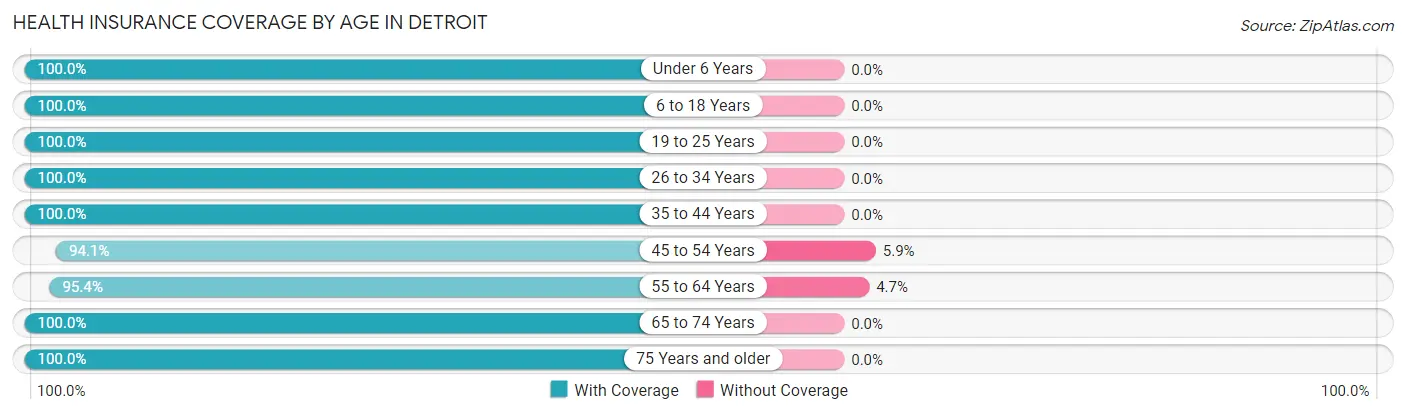
| Age Bracket | With Coverage | Without Coverage |
| Under 6 Years | 37 (100.0%) | 0 (0.0%) |
| 6 to 18 Years | 32 (100.0%) | 0 (0.0%) |
| 19 to 25 Years | 23 (100.0%) | 0 (0.0%) |
| 26 to 34 Years | 53 (100.0%) | 0 (0.0%) |
| 35 to 44 Years | 22 (100.0%) | 0 (0.0%) |
| 45 to 54 Years | 48 (94.1%) | 3 (5.9%) |
| 55 to 64 Years | 41 (95.4%) | 2 (4.6%) |
| 65 to 74 Years | 23 (100.0%) | 0 (0.0%) |
| 75 Years and older | 15 (100.0%) | 0 (0.0%) |
| Total | 294 (98.3%) | 5 (1.7%) |
Health Insurance Coverage by Citizenship Status in Detroit
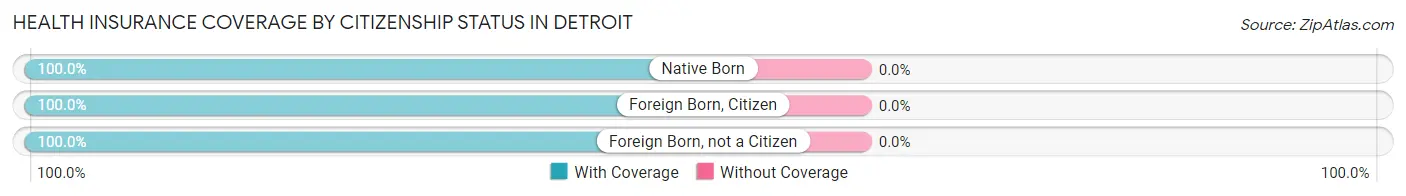
| Citizenship Status | With Coverage | Without Coverage |
| Native Born | 37 (100.0%) | 0 (0.0%) |
| Foreign Born, Citizen | 32 (100.0%) | 0 (0.0%) |
| Foreign Born, not a Citizen | 23 (100.0%) | 0 (0.0%) |
Health Insurance Coverage by Household Income in Detroit
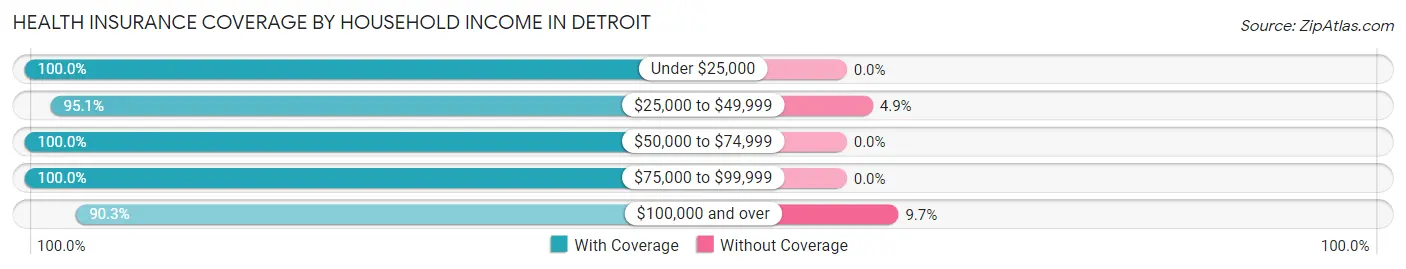
| Household Income | With Coverage | Without Coverage |
| Under $25,000 | 104 (100.0%) | 0 (0.0%) |
| $25,000 to $49,999 | 39 (95.1%) | 2 (4.9%) |
| $50,000 to $74,999 | 88 (100.0%) | 0 (0.0%) |
| $75,000 to $99,999 | 35 (100.0%) | 0 (0.0%) |
| $100,000 and over | 28 (90.3%) | 3 (9.7%) |
Public vs Private Health Insurance Coverage by Age in Detroit
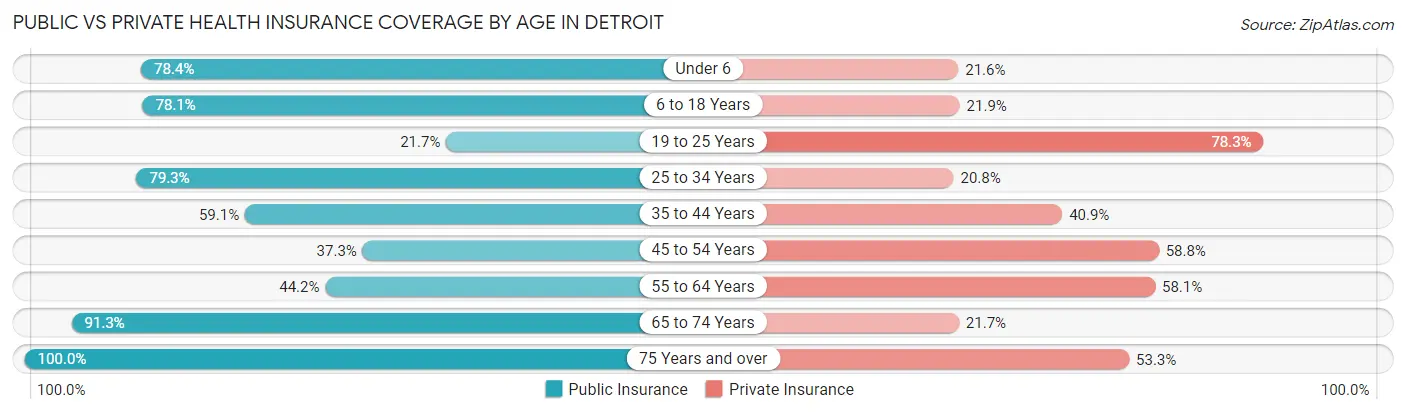
| Age Bracket | Public Insurance | Private Insurance |
| Under 6 | 29 (78.4%) | 8 (21.6%) |
| 6 to 18 Years | 25 (78.1%) | 7 (21.9%) |
| 19 to 25 Years | 5 (21.7%) | 18 (78.3%) |
| 25 to 34 Years | 42 (79.2%) | 11 (20.7%) |
| 35 to 44 Years | 13 (59.1%) | 9 (40.9%) |
| 45 to 54 Years | 19 (37.2%) | 30 (58.8%) |
| 55 to 64 Years | 19 (44.2%) | 25 (58.1%) |
| 65 to 74 Years | 21 (91.3%) | 5 (21.7%) |
| 75 Years and over | 15 (100.0%) | 8 (53.3%) |
| Total | 188 (62.9%) | 121 (40.5%) |
Disability Status by Sex by Age in Detroit
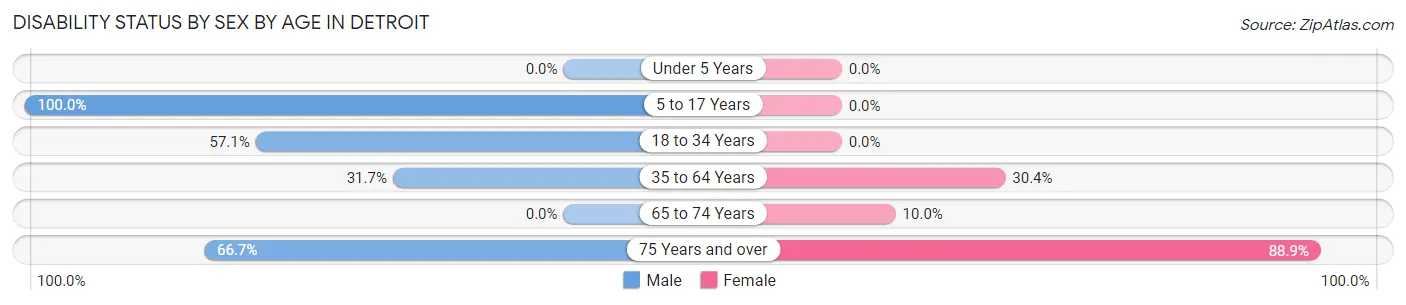
| Age Bracket | Male | Female |
| Under 5 Years | 0 (0.0%) | 0 (0.0%) |
| 5 to 17 Years | 8 (100.0%) | 0 (0.0%) |
| 18 to 34 Years | 36 (57.1%) | 0 (0.0%) |
| 35 to 64 Years | 19 (31.7%) | 17 (30.4%) |
| 65 to 74 Years | 0 (0.0%) | 2 (10.0%) |
| 75 Years and over | 4 (66.7%) | 8 (88.9%) |
Disability Class by Sex by Age in Detroit
Disability Class: Hearing Difficulty
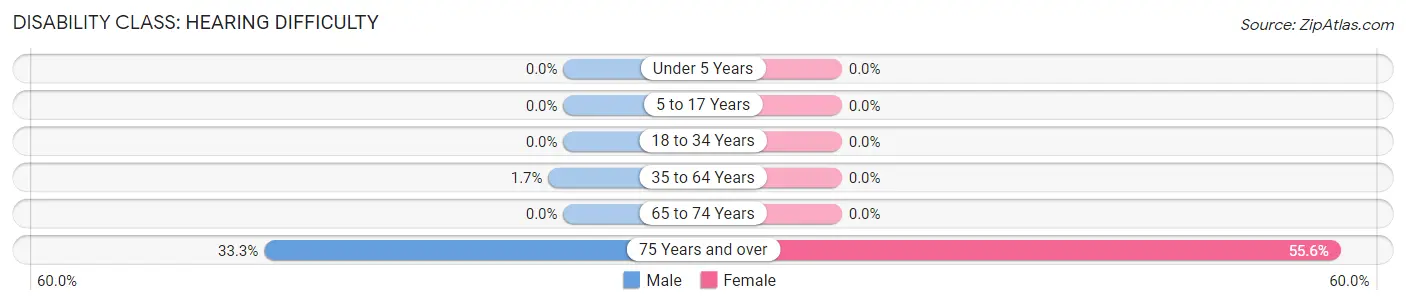
| Age Bracket | Male | Female |
| Under 5 Years | 0 (0.0%) | 0 (0.0%) |
| 5 to 17 Years | 0 (0.0%) | 0 (0.0%) |
| 18 to 34 Years | 0 (0.0%) | 0 (0.0%) |
| 35 to 64 Years | 1 (1.7%) | 0 (0.0%) |
| 65 to 74 Years | 0 (0.0%) | 0 (0.0%) |
| 75 Years and over | 2 (33.3%) | 5 (55.6%) |
Disability Class: Vision Difficulty
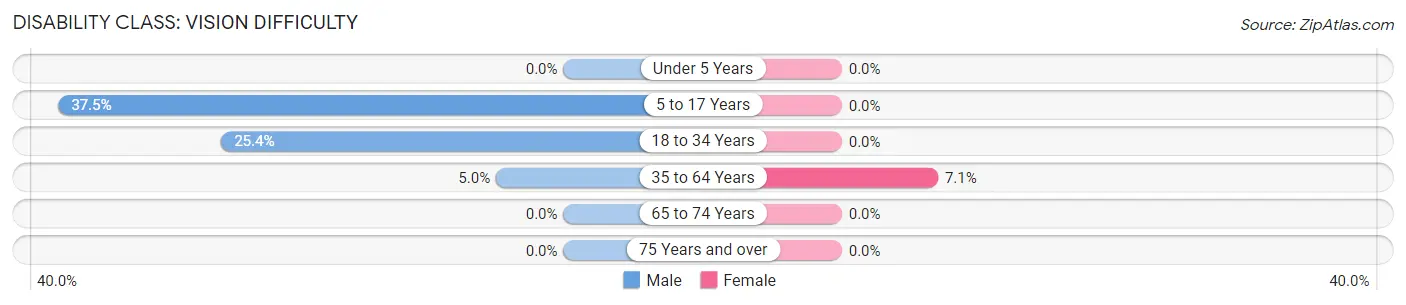
| Age Bracket | Male | Female |
| Under 5 Years | 0 (0.0%) | 0 (0.0%) |
| 5 to 17 Years | 3 (37.5%) | 0 (0.0%) |
| 18 to 34 Years | 16 (25.4%) | 0 (0.0%) |
| 35 to 64 Years | 3 (5.0%) | 4 (7.1%) |
| 65 to 74 Years | 0 (0.0%) | 0 (0.0%) |
| 75 Years and over | 0 (0.0%) | 0 (0.0%) |
Disability Class: Cognitive Difficulty
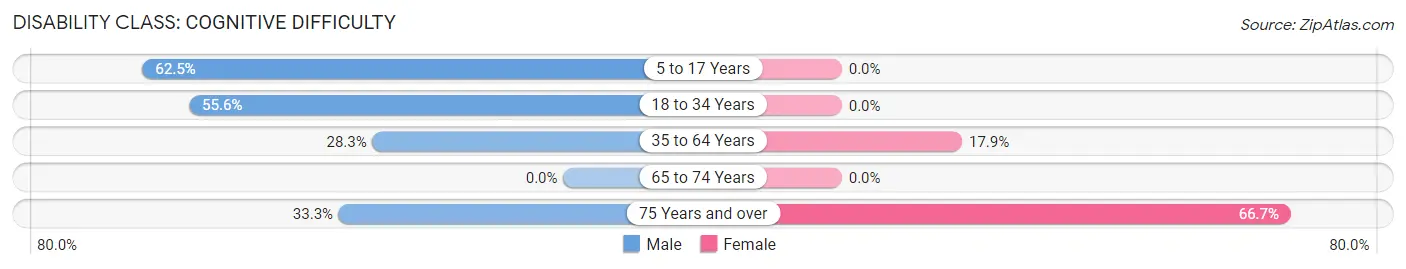
| Age Bracket | Male | Female |
| 5 to 17 Years | 5 (62.5%) | 0 (0.0%) |
| 18 to 34 Years | 35 (55.6%) | 0 (0.0%) |
| 35 to 64 Years | 17 (28.3%) | 10 (17.9%) |
| 65 to 74 Years | 0 (0.0%) | 0 (0.0%) |
| 75 Years and over | 2 (33.3%) | 6 (66.7%) |
Disability Class: Ambulatory Difficulty
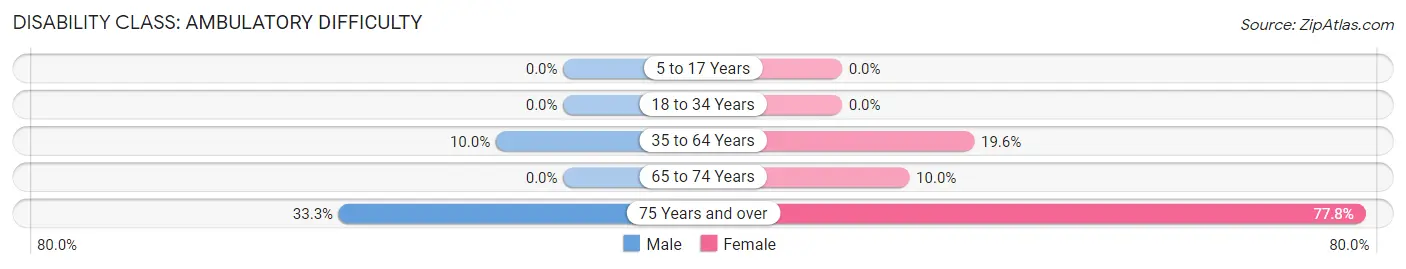
| Age Bracket | Male | Female |
| 5 to 17 Years | 0 (0.0%) | 0 (0.0%) |
| 18 to 34 Years | 0 (0.0%) | 0 (0.0%) |
| 35 to 64 Years | 6 (10.0%) | 11 (19.6%) |
| 65 to 74 Years | 0 (0.0%) | 2 (10.0%) |
| 75 Years and over | 2 (33.3%) | 7 (77.8%) |
Disability Class: Self-Care Difficulty
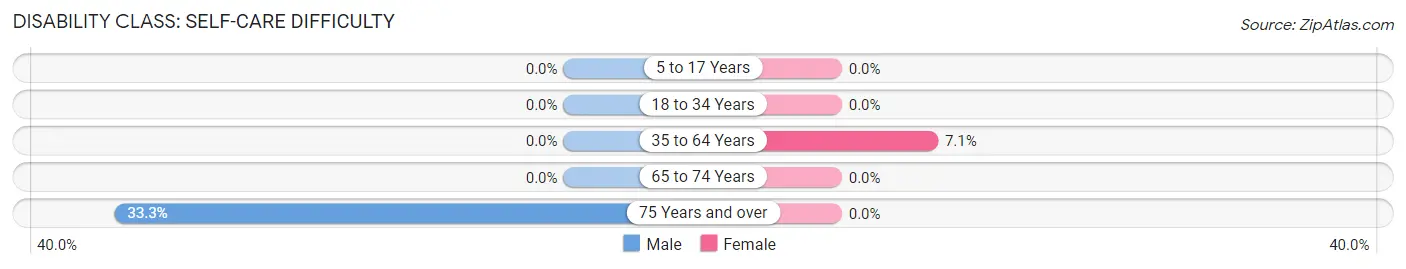
| Age Bracket | Male | Female |
| 5 to 17 Years | 0 (0.0%) | 0 (0.0%) |
| 18 to 34 Years | 0 (0.0%) | 0 (0.0%) |
| 35 to 64 Years | 0 (0.0%) | 4 (7.1%) |
| 65 to 74 Years | 0 (0.0%) | 0 (0.0%) |
| 75 Years and over | 2 (33.3%) | 0 (0.0%) |
Technology Access in Detroit
Computing Device Access in Detroit
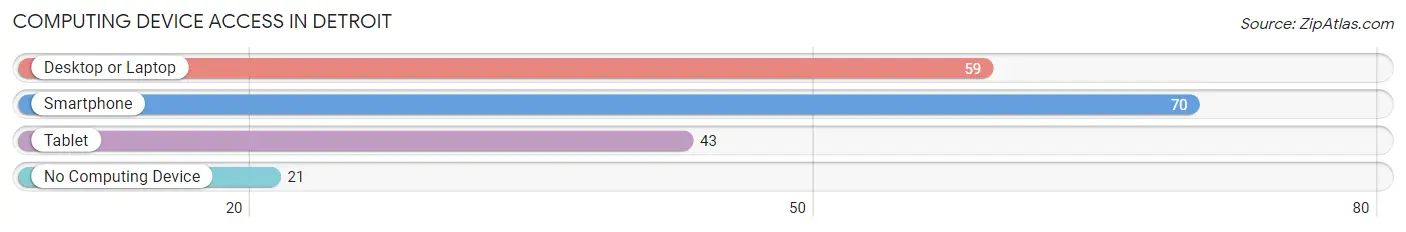
| Device Type | # Households | % Households |
| Desktop or Laptop | 59 | 59.6% |
| Smartphone | 70 | 70.7% |
| Tablet | 43 | 43.4% |
| No Computing Device | 21 | 21.2% |
| Total | 99 | 100.0% |
Internet Access in Detroit
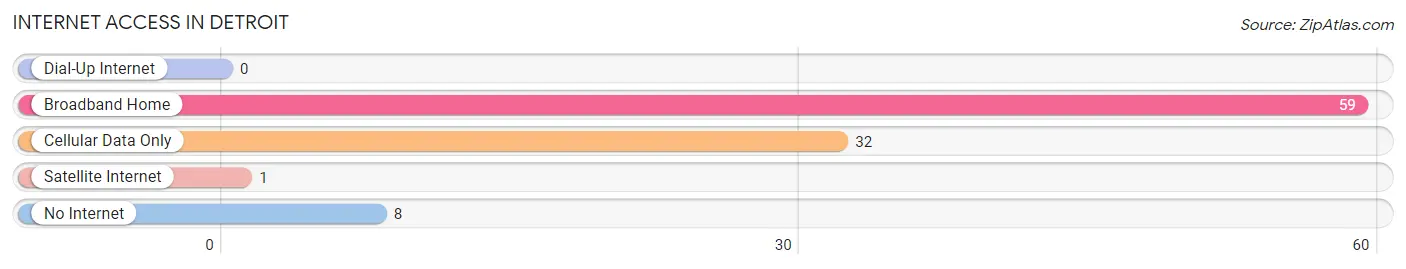
| Internet Type | # Households | % Households |
| Dial-Up Internet | 0 | 0.0% |
| Broadband Home | 59 | 59.6% |
| Cellular Data Only | 32 | 32.3% |
| Satellite Internet | 1 | 1.0% |
| No Internet | 8 | 8.1% |
| Total | 99 | 100.0% |
Detroit Summary
Detroit is the largest city in the state of Michigan and the largest city in the United States by population. It is located on the Detroit River, which connects Lake Erie to Lake St. Clair. Detroit is the seat of Wayne County and is the most populous city in the metropolitan area of Detroit-Warren-Dearborn. The city has a long and rich history, and has been a major center of industry and commerce since the early 19th century.
Geography
Detroit is located in southeastern Michigan, on the Detroit River, which connects Lake Erie to Lake St. Clair. The city is situated on the Detroit Plateau, a flat area of land that rises from the river and is surrounded by hills and bluffs. The city is divided into several distinct neighborhoods, including Downtown, Midtown, Corktown, and the East Side. The city is also home to several parks, including Belle Isle Park, which is located on an island in the Detroit River.
Economy
Detroit has long been a major center of industry and commerce. The city was once home to the world's largest automobile manufacturing industry, and was the birthplace of the modern assembly line. The city is still home to several major automotive companies, including General Motors, Ford, and Chrysler. Detroit is also home to several other major industries, including steel, chemicals, and pharmaceuticals.
The city has also become a major center for technology and innovation. Several major tech companies, including Google, Microsoft, and Amazon, have opened offices in the city. Detroit is also home to several major universities, including the University of Michigan, Wayne State University, and Michigan State University.
Demographics
As of the 2010 census, Detroit had a population of 713,777. The city is racially diverse, with a majority of African Americans (82.7%), followed by whites (10.6%), Hispanics (3.7%), and Asians (2.3%). The median household income in Detroit is $26,098, and the median age is 34.
The city is home to several major cultural institutions, including the Detroit Institute of Arts, the Detroit Symphony Orchestra, and the Detroit Opera House. The city is also home to several professional sports teams, including the Detroit Tigers (baseball), the Detroit Lions (football), and the Detroit Red Wings (hockey).
Conclusion
Detroit is a major city in the United States with a long and rich history. It is a major center of industry and commerce, and is home to several major automotive companies, tech companies, and universities. The city is racially diverse, with a majority of African Americans, and is home to several major cultural institutions and professional sports teams. Detroit is an important city in the United States, and its economy, geography, history, and demographics are all important aspects of its identity.
Common Questions
What is Per Capita Income in Detroit?
Per Capita income in Detroit is $13,199.
What is the Median Family Income in Detroit?
Median Family Income in Detroit is $50,125.
What is Inequality or Gini Index in Detroit?
Inequality or Gini Index in Detroit is 0.55.
What is the Total Population of Detroit?
Total Population of Detroit is 300.
What is the Total Male Population of Detroit?
Total Male Population of Detroit is 172.
What is the Total Female Population of Detroit?
Total Female Population of Detroit is 128.
What is the Ratio of Males per 100 Females in Detroit?
There are 134.38 Males per 100 Females in Detroit.
What is the Ratio of Females per 100 Males in Detroit?
There are 74.42 Females per 100 Males in Detroit.
What is the Median Population Age in Detroit?
Median Population Age in Detroit is 39.3 Years.
What is the Average Family Size in Detroit
Average Family Size in Detroit is 3.8 People.
What is the Average Household Size in Detroit
Average Household Size in Detroit is 3.0 People.
How Large is the Labor Force in Detroit?
There are 106 People in the Labor Forcein in Detroit.
What is the Percentage of People in the Labor Force in Detroit?
43.3% of People are in the Labor Force in Detroit.
What is the Unemployment Rate in Detroit?
Unemployment Rate in Detroit is 12.4%.